Embed Size (px)
Citation preview
Anna Zhygalova
Managerial Aspects of Business Intelligence Implementation
Helsinki Metropolia University of Applied Sciences Bachelor of Business Administration
International Business and Logistics Bachelor’s Thesis
May 19, 2012

Author
Title
Number of pages
Date
Anna Zhygalova
Business intelligence: Managerial aspects of business intelligence implementation
86
May 19, 2012
Degree Bachelor of Business Administration (BBA)
Degree programme International Business and Logistics
Specialization International Business and Logistics
Instructor Senior Lecturer, Kaija Haapasalo
In the modern conditions of the dynamic and rapidly changing business environment organizations pursue goals to improve their adaptation capabilities and increase the efficiency of their decision-making process. Due to this organizations implement the
Business Intelligence (BI) solutions (reporting, analyzing and forecasting information systems) into their operations. However, the implementation of the BI differs from implementation of a typical IT project due to the fact that business benefits that BI
systems provide are intangible and difficult to quantify, companies may face significant problems related to the project planning, cost-benefit analysis, vendor selection, data
preparation, employees training and ethical and legal aspects of the implementation. Current research addresses the managerial aspects of the BI and outlines the
importance of the efficient cross-departmental information flow between all parties involved in the project, emphasis on the key business benefits when preparing the
cost-benefit analysis of the project and communicating it to the stakeholders, developing long-term partnership relations with the BI vendors, developing continuous and efficient BI employees’ training in the context of the daily business tasks of the
end-users, ensuring that the corporate IT support staff is involved in the implementation process and understands first and foremost the business needs behind the functionality of the BI solution and emphasizing the importance of the ethical and
legal problems such as personal data privacy and consequences of the automation of the decision-making during implementation of the BI systems.
As a result of the current research, managerial aspects of the BI implementation are analyzed based on the secondary research and interviews at the case company. The BI
implementation in the case company is assessed and recommendations for improvements are provided. Additionally, based on the secondary research and
experience of the case company corrections to the BI implementation process models are suggested and general recommendations for BI implementation are outlined for future references of the organizations.
Keywords Business Intelligence (BI), vendor, project plan, planning, cost-benefit analysis, employees training, BI justification, IT infrastructure, ethical and legal aspects, BI architecture,
business analytics, data mining, OLAP analysis, BI implementation process model, sensitivity analysis,
information flow
Table of Contents
1 Introduction 7
1.1 Objectives, scope and limitations of the research 9
1.2 Research methodology 11
1.3 Background of the case company and interviewees 14
1.4 Literature review 15
2 Background of business intelligence 17
2.1 Business intelligence concept 17
2.2 Evolution of the business intelligence tools 18
2.3 Business intelligence tools functionality 22
2.4 Architecture of the business intelligence systems 26
2.5 Business intelligence vendors 30
2.5.1 Teradata 30
2.5.2 Micro Strategy 31
2.5.3 Microsoft 34
2.5.4 IBM Cognos 34
2.5.5 SAP Business Objects 35
2.5.6 Oracle solutions 36
2.5.7 Comparison of the vendors 37
2.6 Benefits of the business intelligence implementation 38
3 Managerial aspects of the business intelligence implementation 43
3.1 BI project planning activities 43
3.2 Justification of the BI implementation 49
3.2.1 Types of the costs and benefits 49
3.2.2 Financial analysis for project justification 52
3.3 Vendor selection and data preparation 53
3.3.1 Platform and vendor selection 53
3.3.2 Data preparation 55
3.4 Employees training 56

3.5 Ethical and legal issues 58
4 BI implementation at the case company 61
4.1 BI solutions at the case company 61
4.2 Results of the interviews 63
4.3 Assessment of BI implementation at the case company 66
5 General recommendations for BI implementation 72
5.1 Suggested implementation process model 72
5.2 Other recommendations and guidelines for BI implementation 75
6 Conclusion and analysis of the research results 78

List of appendices
Appendix 1. Typical BI project outline 1
Appendix 2. Case study questions 2
Appendix 3. BI implementation process 4
List of tables and figures
Table 1. General advantages and disadvantages of the structured interview as the
research method (Sociology, 2011)
Table 2. BI project outline (Biere, 2003: 128)
Figure 1. Business Pressures-Responses-Support Model (Turban et al., 2011: 26)
Figure 2. Evolution of BI (Turban et al., 2011: 29)
Figure 3. Functions and features of the BI systems (Turban, Volonino, 2010: 450)
Figure 4. Enterprise search architecture (integrated model) (Chaudhuri et al., 2011)
Figure 5. High-level BI systems architecture (Turban, Volonino, 2010: 459)
Figure 6. Typical BI system architecture (Chaudhuri et al., 2011)
Figure 7. MicroStrategy 9 architecture and modules (MicroStrategy, 2012)
Figure 8. Top five business pressures driving adoption of predictive analytics (Turban,
Volonino, 2010: 451)
Figure 9. End-user segmentation by technical skills (Biere, 2003: 50)
Figure 10. End-user segmentation by products used (Biere, 2003: 74.)
Figure 11. Percentage who consider each software tool part of their BI solution
(Computerworld, 2006)
Figure 12. BI project planning and implementation activities (Groh, 2004)
Figure 13. Requirements gathering process (Groh, 2004)
Figure 14. Three phases of the BI implementation (Martin et al., 2011)
Figure 15. The first phase of the implementation (Martin et al., 2011)
Figure 16. The second phase of the implementation (Martin et al., 2011)
Figure 17. Project planning components and total costs (Groh 2004)
Figure 18. Calculation of external and internal labor costs (Groh, 2004)
Figure19. Vendors’ comparison (Martin et al., 2011)
Figure 20. Customer application per BI tool (Company A, 2011)
Figure 21. Evaluation of BI solutions’ capabilities (Company A, 2011)
List of abbreviations
ANN – Artificial Neural Networks
BI – Business Intelligence
BPM – Business Performance Management
CFO – Chief Finance Officer
CIO – Chief Information Officer
EIS – Executive Information Systems
ETL – Extract, Transform, Load
GPS - Global Positioning System
IC – Information Center
KPIs – Key Performance Indicators
OLAP – Online Analytical Processing
ROI – Return on Investment
SQL – Structured Query Language
SME – Small and Medium Enterprises
PC – Personal Computer
PDA – Personal Digital Assistant

7
1 Introduction
Dynamic nature of the present business environment requires organizations to quickly
respond to external changes (pressures and opportunities) and efficiently adapt their
corporate strategies. An efficient decision-making process in business requires a large
amount of data, information and knowledge for evaluation and analysis of the possible
courses of actions (Turban et al., 2011: 23). Rapid technological development in the
database management field during the past decades has allowed businesses to store
large amount of historical data which can be used to support the decision-making
process by application of the computerized analytical and data processing tools, which
are nowadays referred to as business intelligence (BI).
Figure 1 represents a Pressures-Responses-Support (Turban et al., 2011: 26) model
which illustrates interconnection between the external factors influencing on the
organizations, companies’ responses to these factors and tools which support the
decision-making process.
Globalization
Customer demand
Government regulations
Market conditions
Competition
Etc.
Strategy
Partners’ collaboration
Real-time response
Agility
Increased productivity
New vendors
New business models
Etc.
Analyses
Predictions
Decisions
Integrated
computerized
decision
support
Business
support
Business
Environmental Factors
Organization
Responses
Decisions and
Support
Pressures
Opportunities
Figure 1. Business Pressures-Responses-Support Model (Turban et al., 2011: 26)
Thus, as a response to the changing business environment organizations adapt their
strategy, implement new business models, choose suppliers or vendors, adjust
productivity levels etc. However, these decisions require correctly structured and
analyzed information in order to increase their effectiveness.

8
Therefore, in order to be “reactive, anticipative, adaptive and proactive” (Turban et al.,
2011: 27) in their responses to the changing business environment, companies often
turn to BI tools, the main goal of which is to support the decision-making process
based on the relevant analytical data and close in this way the gap between the
current and desired performance of the organization (Turban et al., 2011: 28). BI tools
can be divided into several groups, such as predictive analytics (data mining tools
focusing on forecasting trends), event-driven analytics (provide real-time alerts or
warning when the pre-defined event occurs) and operational decision support (support
operational, tactical and strategic decisions through, for example, performance
dashboards, cockpits, charts, scorecards with key performance indicators, reporting
etc.). Relevant types of the BI tools are defined depending on the information needs of
the company, complexity of the decision-making process and time-sensitivity of the
decisions (from daily operational to quarterly or yearly decisions) (Turban, Volonino,
2010: 453-454).
Thus, the main benefit of BI tools is the fast processing of large amounts of data and
transforming the data into the information which facilitates the decision-making
process. However, implementation of BI tools is a complex process, during which
unexpected issues and problems may arise. Often organizations face problems that
refer to the choice of the BI systems of the correct scale and functionality, which arise
from poor pre-project research and gaps in understanding of the organization’s
information needs as well as inefficient information flow between parties involved in
the BI project. Data consolidation and standardization, loading to the data warehouse
or data mart, which will serve as the repositories of the historical data required for
analytical processing, employees’ training and involvement in the implementation
process, choice of vendor and justification of the BI tools’ acquisition are some of many
issues which can arise during BI integration and implementation stage.
Thus, current research provides the overview of the modern BI solutions, their
evolution and increasing impact on the business processes in the organizations as well
as analysis of the managerial aspects related to BI implementation based on already
available information and results of the interview at the case company and generates
the set of guidelines and recommendations for the BI implementation process.

9
1.1 Objectives, scope and limitations of the research
The objectives of the current research are, based on the published information sources
and interviews at the case company, to: 1) study the evolution and current situation in
the field of BI solutions, 2) analyze managerial issues related to the BI implementation
stage and 3) apply theoretical models of BI implementation to the case study, evaluate
their efficiency and suggest corrections to the existing models as well as generate
guidelines and best practices for BI implementation. The current research addresses
the following managerial aspects, such as: justification of the business intelligence
tool’s acquisition, data consolidation and standardization, vendor selection, possible
business process reengineering needs, employees’ training and empowerment, legal
and ethical issues associated with the business intelligence implementation analyzed
based on the secondary and primary research (case company interviews).
The research is justified by the fact that various published sources contain disparate
information about the BI implementation process and do not provide detailed
description of the problems which organizations might face during the integration as
well as do not suggest recommendations or guidelines regarding solutions of the
possible implementation problems. Therefore, current research aimed to eliminate this
gap, consolidate the information related to BI implementation aspects based on the
published sources, apply BI implementation theory to the case study, analyze the
efficiency of the implementation process at the case company, suggest improvements
to the process and based on the theoretical analysis of the managerial aspects and
experience of the case company provide general guidelines and recommendations for
the BI implementation at large organizations.
In terms of the scope, current research contains four parts: 1) introduction to the field
of the business intelligence, analysis of the evolution of the BI tools, their main
functionality and role in the decision-making process, 2) secondary analysis of the
managerial aspects related to BI implementation, 3) analysis of the efficiency of the BI
implementation process at the case company based on two interviews with
representatives of the company and 4) as a conclusion overview of the improvements
for implementation process at the case company and possible corrections to the
existing implementation practices as well as generalized guidelines for more efficient BI

10
integration in large organizations. The secondary research covered managerial aspects
of the BI implementation from various published sources and the primary research
(two interviews) aimed to provide an example of how the real company organizes its
BI implementation process and how theoretical models discussed in the secondary
research can be applied in order to improve the efficiency of this process. Due to the
fact that the interviews covered BI implementation at one company, the generalization
of the practices of the BI implementation might have not been accurate enough since
more case studies are required for this purpose. Thus, the research was limited
towards providing the recommendations and improvements for the BI implementation
process for the particular company discussed in the case study and generating of the
general recommendations and guidelines for improvements of the existing
implementation practices based on the experience of the case company.
Possible limitations of the research concerned the validity of the data sources used for
the secondary research which included published books, articles and online resources.
The main limitation of the secondary research in this case was the difficulty to ensure
the quality and relevance of the used sources since they were collected for other
purposes than the current research. Besides this, the fact that some of the sources
used for the secondary research were published several years ago might have lead to
the timeliness problem or irrelevance of the information due to the gap between the
period of publication and the date of the current research.
Limitations of the primary research which was based on the structured interview
method related to the quality of answers received which were directly dependent on
the quality of the questions prepared for the interview. Moreover, the substantial
preparation phase was required in order to identify the list of questions for the
discussion. Taking into account that the questions were prepared before the interview,
there was a high possibility of the “interview effect” occurrence, which means that
questions might have not given enough flexibility in the replies of the interviewees
creating the interviewer’s bias. The research was also limited to the information which
was available for analysis during the interview due to the confidentiality issues. Thus,
due to the fact that some information about the specific details of the case was not
available for retrieving or publishing, it might have also influenced on the accuracy and
completeness of the research.

11
1.2 Research methodology
Current research relates to the qualitative research and includes secondary research
(based on the literature review) and the primary research (case company interviews).
Based on the information acquired during research of the published works on business
intelligence implementation and a case study of a BI implementation project at the
large organization, managerial aspects of the business intelligence implementation
were identified and recommendations for the case company and general guidelines
concerning factors which are needed to take into account when making a decision to
integrate such systems were generated.
Secondary sources used for secondary research included published books and scientific
articles in the field of business intelligence. Secondary sources were used to define a
concept of business intelligence, present the evolution of the business intelligence
systems, list most popular business intelligence vendors in order to give the reader a
better understanding of the background of such systems as well as of the current state
of the industry and outline and analyze the main managerial aspects of the BI
implementations. The secondary research represented the initial stage of the research
and aimed to provide the background information about the BI field, analyze the
current situation in the field and consolidate and analyze the information from the
disparate secondary data sources concerning the managerial problems that companies
face during the BI implementation stage.
The secondary research was followed by the primary research, which served to provide
practical examples of the typical managerial problems of the BI implementation based
on the experience of the case company. The case company used for the research
represents a large telecommunication organization based in Finland. Company’s main
field of operation is development and manufacturing of the mobile devices. Due to the
confidentially issues, detailed information about the company should not be revealed.
The research method used for data collection during primary research was represented
by the structured interview. The structured interview is a fixed-format interview in
which all questions are prepared beforehand and are put in the same order for each
interviewee. Although this method lacks the free-flow discussion features due to pre-
12
determined questions, some clarifications in the process of the interview are allowed if
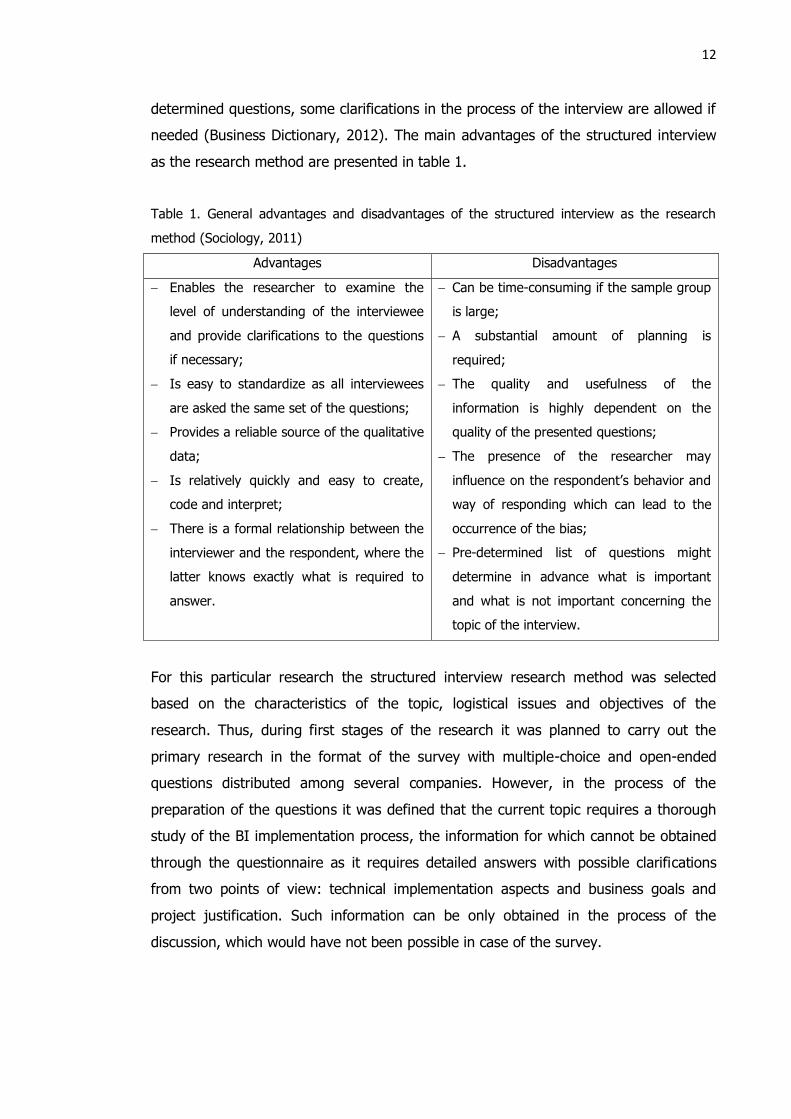
needed (Business Dictionary, 2012). The main advantages of the structured interview
as the research method are presented in table 1.
Table 1. General advantages and disadvantages of the structured interview as the research
method (Sociology, 2011)
Advantages Disadvantages
Enables the researcher to examine the
level of understanding of the interviewee
and provide clarifications to the questions
if necessary;
Is easy to standardize as all interviewees
are asked the same set of the questions;
Provides a reliable source of the qualitative
data;
Is relatively quickly and easy to create,
code and interpret;
There is a formal relationship between the
interviewer and the respondent, where the
latter knows exactly what is required to
answer.
Can be time-consuming if the sample group
is large;
A substantial amount of planning is
required;
The quality and usefulness of the
information is highly dependent on the
quality of the presented questions;
The presence of the researcher may
influence on the respondent’s behavior and
way of responding which can lead to the
occurrence of the bias;
Pre-determined list of questions might
determine in advance what is important
and what is not important concerning the
topic of the interview.
For this particular research the structured interview research method was selected
based on the characteristics of the topic, logistical issues and objectives of the
research. Thus, during first stages of the research it was planned to carry out the
primary research in the format of the survey with multiple-choice and open-ended
questions distributed among several companies. However, in the process of the
preparation of the questions it was defined that the current topic requires a thorough
study of the BI implementation process, the information for which cannot be obtained
through the questionnaire as it requires detailed answers with possible clarifications
from two points of view: technical implementation aspects and business goals and
project justification. Such information can be only obtained in the process of the
discussion, which would have not been possible in case of the survey.
13
Due to the logistical issues and possibility to perform the face-to-face interview, the
case company was chosen among the local businesses present in the Helsinki
Metropolitan Area. The choice of the case company was also influenced by the
objectives of the research, namely, a possibility to consider larger organizations which
have more experience in the BI implementation and which face considerable
implementation problems due to the complexity of the organizational structure that
influences significantly on the project management issues and information flow.
The structured interviews were conducted based on the questions prepared
beforehand, which can be found in the Appendix 2. Questions included in the survey
concerned the implementation stage of the business intelligence integration and
company’s own evaluation of the managerial problems and impacts that were identified
during the implementation.
The interviews were carried out with two interviewees involved in one of the BI
implementation projects at the case company. The first interviewee represented a head
of the BI and reporting integration team at the Corporate Information and Data
department of the case company and had the title of the senior reporting manager.
The first phase of the interview was conducted as the face-to-face discussion in the
company’s headquarters office and lasted for 2 hours, followed by the e-mails
exchange and phone calls to approve the written results of the interview. Questions
covered in the first interview concerned the technical aspects of the implementation
and managerial problems associated with these aspects.
The second interviewee represented an employee from the customer care logistics IT
department of the company, who was involved in the studied BI implementation
project as the process owner from the customer side. The second interview was
conducted in the form of the e-mail, in which the interviewee provided detailed
answers to the presented open-ended questions. The feedback from the interviewee
was received one week later after questions were sent. Aspects covered in the second
interview were related to the BI project initiation phase, project justification,
organizational changes required, employees’ training, project planning and monitoring
etc.

14
The data obtained from two interviews was analyzed and conclusions about the
interview results with comparison to the results of the secondary research were
presented to the senior reporting manager for approval. As soon as the analysis was
approved, suggestions for improvement of the BI implementation at the case company
were produced along with the generalized guidelines and recommendations of the BI
implementation for large organizations.
As mentioned in the previous chapters, the validity of the data is affected by the fact
that not all information about the project could have been revealed due to the
confidentiality issues. Besides this, the generalized guidelines and recommendations for
the BI implementation that are currently based on the secondary research and a case
study with one company might have been more accurate if more case studies /
interviews were used for the research.
1.3 Background of the case company and interviewees
The company used for the case study represents a large telecommunications company
(further referred as Company A) based in Finland, Helsinki Metropolitan Area, which
main field of operations is manufacturing of the mobile devices. More detailed
information about the company is limited due to the confidentiality issues related to
the public availability of the certain information.
As mentioned in the previous chapter, the interviews were conducted with the 1)
senior reporting manager and 2) customer care / logistics manager, a process owner.
A senior reporting manager is the team leader of the business intelligence and
reporting implementation team at the Corporate Information and Data (CID)
department. The team deals with implementation and support of the business
intelligence systems and business warehouses throughout the Company A and is
formed by the 14 reporting specialists, which are located at the headquarters of the
company in Finland, and Indian subcontractors. The customer care / logistics manager
is the process owner of one of the BI implementation projects at Company A from the
customer side. The customer case / logistics manager belongs to the Logistics IT
department which is dealing with the information systems and IT support for the
Logistics and Supply Chain Management units of the Company A.

15
Due to the complex structure and large scale of the organization, the BI
implementation projects at Company A involves several parties, which are represented
by the 1) end-users or internal customers, 2) intermediate IT support department for
the specific business unit and 3) BI and reporting team of the Corporate Data and
Information department. Due to this, two interviews were performed with two latter
parties involved in the project in order to obtain the full information regarding the BI
implementation issues. Detailed description of the case is provided in chapter 4 of the
thesis.
1.4 Literature review
The literature used for the purpose of the current research includes published books in
the field of business intelligence and information technology for management as well
as scientific articles in the same field.
An insightful introduction to the business intelligence concept, which gives the
possibility to get acquainted with the topic is provided by Turban et al. (2011), Turban,
Voloniono (2010) and Taylor (2007). These books explain the emerging need for
business intelligence solutions from the business point of view and give the relevant
examples which help to apply the theory to practice. More technical introduction,
monologue-like introduction is given by Biere (2003). The disadvantage of this book is
that it is oriented more towards IT professionals rather than business readers.
However, Biere (2003) provides a very thorough and logical explanation of the
evolution of the business intelligence tools and grounds for their emergence due to the
technological development. This overview is highly important for the research since it
gives a possibility to understand the complexity of such systems and business needs
which led to their development and, therefore, can be translated to the modern
pressures which are driving companies to implement business intelligence solutions as
well.
Research topic and, namely, managerial aspects of the business intelligence
implementation requires detailed description of the actual architecture of the business
intelligence systems since clear understanding of the system’s architecture is essential
in order to define what kind of problems may arise during the implementation stage.

16
Well-written and also schematically illustrated high-level architecture is provided by
Turban, Volonino (2010), while a more technical but well-explained and logically
structured description is given in an article prepared by Chaudhuri et al. (2011).
The major disadvantage of the books and article mentioned above is that these
resources do not provide detailed overview of the modern business intelligence
vendors which is a significant omission since without it a full understanding of what
solutions are currently available for companies cannot be gained. Therefore, in order to
obtain the overview of the modern BI tools official websites of such vendors as
Teradata, MicroStrategy, Oracle, IBM, Microsoft and SAP were studied and main
solutions provided by these companies were assessed and compared.
Justification of the business intelligence implementation is one of the major managerial
issue which occurs when organizations decide to implement these systems. Therefore,
in order to be able to justify the solutions, understanding of the real benefits which
business intelligence provide should be explained. This information is well presented by
Turban, Volonino (2010), Biere (2003) as well as an article prepared by Computerworld
(2006). These sources provide a good overview of the main benefits of the business
intelligence, explain the driving forces to implement these systems as well as define
which types of the end-users bring the most benefit to the organization through
utilization of the reporting and analysis.
Finally, the managerial aspects of the business intelligence implementation are
discussed in Biere (2003) and Turban et al. (2011). However, these sources provide
only brief information about possible problems and do not suggest any
recommendations which companies can use in order to avoid or solve such issues.
Therefore, additional secondary and primary research on this particular topic aimed to
fill the gaps which exist in this area by detailed studying of the published sources and
conduction of the interviews with the company which implemented business
intelligence solution. As an output of the research recommendations and guidance for
the companies concerning implementation stage were produced.

17
2 Background of business intelligence
2.1 Business intelligence concept
According to Turban et al. (2011: 28), business intelligence (BI) is “an umbrella term
that combines architectures, tools, databases, analytical tools, applications, and
methodologies”. However, as mentioned further by the author, such broad definition
might be interpreted differently by different people. Turban further explains that the
main goal of the BI is to enable interactive access to the data, manipulate with the
data, process and analyze it in order to provide the insightful information for the
decision-makers. Chaudhuri et al. (2011) define business intelligence as “a collection of
decision support technologies for the enterprise aimed at enabling knowledge workers
such as executives, managers, and analysts to make better and faster decisions.”
These definitions are supported as well by Taylor et al., (2007: 110), who relates
business intelligence to such statements as “better data for improved decision making”,
“getting the right information to the right person at the right time”, “the single version
of the truth” etc. All these descriptions can be expressed in the main function of the
business intelligence - transform the data to the information which can be evaluated
from different prospective by the decision-makers and consequently utilized to support
the decision-making process.
The main difference between the traditional databases, which are used in the
operational systems, and business intelligence data repositories which are called data
warehouses, is that the latter are optimized primarily for the reporting processes
besides data storage (Turban, Volonino, 2010: 448). Thus, the implementation of
business intelligence systems allows organizations to standardize disparate data, bring
it to the single format and by running reporting tools retrieve the real-time information
concerning key performance indicators based on which the decisions concerning
acquisition, sales, marketing, financing, logistics etc. are made.
As mentioned by Turban, Volonino (2010: 449), the efficiency of the organization’s
responsiveness to the changing environment depends on two main pillars: trusted view
of the information and reporting systems. Thus, traditional operational systems and

18
databases are not able to provide the decision-makers with the trusted information due
to the fact that organizations often use several systems for different departments and,
therefore, the data in such systems is scattered and disparate. Moreover, the purpose
of such systems is first of all to store the information without providing the users tools
to understand and analyze it.
The main problems that users of the traditional information systems face due to the
disparate data include the following (Turban, Volonino, 2010: 449):
receiving the information too late;
presenting the data on the wrong detail level (greater or fewer detail);
retrieving of the excess data which is not necessary for the decision-making
and which can to some extent even negatively affect the analyzing process;
inability to coordinate and share the data with other departments of the
organization.
Successfully implemented business intelligence systems are able to solve the problems
of the data standardization and consolidation and, therefore, provide the trusted view
of the information for the decision-makers.
2.2 Evolution of the business intelligence tools
Development of the business intelligence is tightly related to the innovations in the
information technology field in general. As mentioned by Biere (2003: 30-41), before
1970s, managers were struggling to access the information they needed for the
decision-making process since they were forced to wait for the programming changes
and reports. Moreover, it was not possible to access a computer outside of the
organization. Thus, all tools for reporting and query were sold to the organizations to
be personalized by the IT departments and, thus, required a significant amount of the
time and versatile programming skills. However, in the early 1970s some of the
vendors started to offer tools which allowed also non-programming users to access and
analyze the data. The main disadvantage of those solutions referred to the fact that
vendors loaded proprietary data solutions (i.e. data was embedded into the system
after the sale and there was no possibility to implement end-user data afterwards) as
the relational databases and, hence, standardized formats to store data have not yet
been developed. Such data sources were closed and worked only with that particular

19
vendor’s tool; extractions of the data sets were often not synchronized with the
customer’s actual data; most tools were not able to contain the required data volume;
IT specialists were usually required to pull the information from the original data
source; these tools required significant investment; consequently the customer could
be trapped with the non-efficient tool. However, development of first query-based tools
resulted in the learning outcomes (e.g. understanding of how the data should be
stored and accessed) and positively influenced on the further development in the field.
The next development milestone was the emergence of so called Information Center
(IC) concept in the early 1980s. The idea of such centers was to decrease the lengths
of the learning process for query-based reporting systems users (end-users who were
standing in between the non-technical users and IT staff) by providing them with the
online assistance concerning system’s issues. Moreover, ICs also became personal
computer (PC) competency centers as the personal computer has just emerged at that
time. However, with the development of the spreadsheets, the role of the ICs declined
and they have disappeared with time, ruining the settled knowledge centralization in
the organizations. The most significant value of these centers was “setting the
corporate standards for analysis tools” (Biere, 2003: 40)
Due to the fact that IT cost decreased significantly during this period, the impact of the
IT systems on the company’s performance started to be more visible. In order to make
users being more responsible while utilizing the IT systems (especially those which has
a significant impact on the organizations’ business processes) end-users were charged
with users fees when they were processing data, using reporting or maintenance.
However, this practice was not eventually successful since the end-users were not
willing to pay for utilization of the tools when they are not able to estimate the real
impact of their actions towards the performance of the organization.
Further spread of PC utilization offered a possibility for end-users to analyze the data
without possessing outstanding technical skills. However, the problem of efficient data
access and data standardization still remained as companies were using electric
mixture of mainframes, distributed systems, fixed function terminals, several databases
and personal computers for storage and processing of the data which lead to the
situation where data was disparate. This issue was solved by development of the

20
client/server systems. It became clear that keeping the data as it was is creating
difficulties for its analysis and, therefore, the reengineering of data into BI-friendly
forms was required. Due to this fact relational (entity-relationship model) databases
emerged along with the SQL (Structured Query Language) – a query language which
allows construction of the queries to retrieve the necessary information. Common
standards for SQL for all vendors of the relational databases were created. This made
the format in which data was stored and accessed more unified.
The next significant milestone in development of the modern business intelligence
systems is related to emergence of the information warehouse – a central repository
for data storage.
During late 1980s and early 1990s data processing and manipulation was performed
directly in the data warehouse, the access to which was provided to any users. This
approach had many negative aspects such as: excess of errors and anomalies in the
data which users had to deal with, high complexity and volume of the data since it was
pulled from various disparate sources, problem of validating and qualifying of the
results, lack of performance etc. However, such practice also brought a positive
development and, namely, understanding the need for the metadata. Metadata is the
data which is represented by the attributes that describe this data (Turban, 2011: 55)
(e.g. metadata for the file can be represented by such attributes as: creation date,
author, size of the document etc.). Thus, such development led to several conclusions,
such as: all data sources and metadata should be defined, there should be a central
repository for users to access the data such as data warehouse or data mart (a more
specific repository which is derived from the warehouse to suit end-users needs more
specifically (Turban, 2011: 53)).
Thus, a cornerstone in business intelligence development was introduction of the data
warehouse concept. According to Biere (2003: 14), the goal of the data warehouse is
to create by means of it “a unified, single version of the truth for the data being used
for analysis and business decision-making throughout the enterprise”. The data
warehouse concept is tightly related to the ETL process (Extract, Transform/Cleanse,
Load). Due to the fact that data loaded to the warehouse was pulled from different
systems and files, it was stored in the disparate formats. Thus, by means of the ETL

21
techniques, data was extracted from these sources, transformed to the unified format
and loaded to the warehouse.
From the terminological point of view, the actual term of “Business Intelligence” was
introduced by the Gartner Group in the mid-1990s as mentioned by Turban et al.
(2011: 29). However, based on the above presented information, the idea of the
reporting systems already existed in the early 1970s being represented by the static
two-dimensional reporting systems grouped as the Management Information Systems
(MIS). Later in 1980s another concept named Executive Information Systems (EIS)
emerged. These systems were meant as the decision-making support for the top-level
managers and executives. Some of the functions these systems performed include the
following: dynamic multidimensional ad hoc or on-demand reporting, forecasting and
predictions, drill down to details, trend analysis, status access, critical success factors
(CSFs). After mid-1990s, with addition of some new features, commercial products
which offered functions mentioned above appear under a common name of business
intelligence. Thus, from the conceptual prospective, EIS transformed into BI. As
pointed out further by the author, by 2005, BI started to include also artificial
intelligence capabilities meant to facilitate the decision-making process as well as
powerful analytical features.
Figure 2 illustrates the evolution of the business intelligence tools starting from the
basic querying and reporting, ETL process, introduction of the metadata and data
warehouse and data marts concept and more complex decision support systems (DSS)
and common spreadsheets (e.g. MS Excel) which all are grouped under the business
intelligence concept nowadays.

22
Figure 2. Evolution of BI (Turban et al., 2011: 29)
The diagram also contains the most common features and functions of BI systems
such as executive information systems, financial reporting, online analytical processing
(OLAP), digital cockpits and dashboards, alerts and notifications, data mining etc.
Some of the most commonly used functions will be discussed in the next sub-chapter
2.3.
2.3 Business intelligence tools functionality
The most commonly used functions and features of the modern business intelligence
systems are represented in the figure 3.

23
BI tools functions and features
Reporting and Analysis Analytics Data Integration
Enterprise reporting and analysis
Enterprise search
Scorecards
Dashboards
Visualization tools
Predictive analytics
Data, text and Web mining
OLAP (online analytic processing)
ETL (extract, transformation, load)
EII (enterprise information integration)
Figure 3. Functions and features of the BI systems (Turban, Volonino, 2010: 450)
As shown in figure 3, BI reporting and analysis consists of the following most
commonly used functions, such as: 1) enterprise reporting and analysis, 2) enterprise
search, 3) dashboards and scorecards, 4) visualization tools.
According to Turban, Volonino (2010: 456), enterprise reporting and analysis function
is realized by the enterprise reporting systems, which provide “standard, ad hoc, or
custom reports that are populated with data from a single trusted source to get a
single version of the truth”. In other words, these systems provide users with the
access to the standardized data in the warehouse as well as tools for analyzing this
data.
As mentioned by Chaudhuri et al. (2011), at the present moment organizations often
require to search for both structured and unstructured enterprise data – perform the
enterprise search. Examples of such complex search requests can be search for all
information related to specific customers including data in the data warehouse or ERP
systems, e-mails, documents, chats etc. Usually such searches are performed based on

24
the key-word search paradigm. In the figure 4 the most common integrated model of
the enterprise search function is represented.
Figure 4. Enterprise search architecture (integrated model) (Chaudhuri et al., 2011)
As pointed out by Turban, Volonino (2010: 457), dashboards and scorecards represent
active user interfaces and at the same time reporting tools. Dashboards are mostly
used by the top-managers and CEOs as they provide a quick and easy access to the
company’s main performance indicators. Scorecards (often based on the balanced
scorecard methodology) provide access to more specific key performance indicators
and are mostly utilized by the middle-level managers for operational or tactical
decisions.
Finally, as mentioned by Turban, Volonino (2011: 42), visualization tools often include
Geographical information systems (GIS) – systems which are using cartographical data
for analysis, dashboards, scorecards, charts as well as multidimensional presentation of
the data.
BI analytics is represented by the following features: 1) data, text and web mining, 2)
predictive analytics and 3) OLAP (online analytical processing).
Data mining is referred to the process which reveals previously unknown patters in
data (Turban, 2011: 155). Structured data is not the only content which can be mined

25
for patters. Often organizations need to mine the textual data from documents,
electronic communications, e-commerce transactions, logs from Internet browsing
history etc. It is believed that the main information value organization gets from their
unstructured data (Turban, Volonino, 2010: 461). As mentioned by Turban et al.
(2011: 161), data mining’s goal is to identify four major patterns, such as: associations
(co-occurring grouping of things), predictions (based on the past historical data),
clusters (grouping of data based on its known characteristics – e.g. grouping the
customers based on the demographics, purchasing behavior etc.) and sequential
relationships (predicting future events based on similar events in the past, e.g.
customers who bought a professional camera might need in future a new spare lens
etc.). Besides many of the data mining methods and techniques it is worth to mention
the artificial neural networks (ANN), which represent a pattern recognition
methodology for machine learning (Turban et al., 2011: 189) and are used in many
forecasting and business classification applications in finance, marketing,
manufacturing, operations management, information systems, social behavior analysis
etc.
Predictive analytics is “the branch of the data mining which is focused on forecasting
trends (e.g. regression analysis) and estimating probabilities of future events” (Turban,
Volonino, 2010: 451.). Predictive analytics is often used by managers to estimate what
can happen in future based on the past historical data. Predictive analytics is based on
complex mathematical models and requires a high level of expertise to be created.
OLAP systems are designed to provide end-users with the possibility to perform “ad
hoc analysis of organizational data more effectively and efficiently” (Turban et al.,
2011: 77). As pointed out further by Turban et al. (2011: 77), “the main operational
structure in OLAP is based on a cube concept – a multidimensional data structure
(actual or virtual) that allows fast analysis of data”. Such structure of the data allows
fast and efficient manipulation and analysis of the data from the multidimensional
prospective and, therefore, due to this the problem of the slow two-dimensional
analysis in relational databases is overcome. Data warehouse or data marts represent
the sources of data for OLAP processing. The main operations of the OLAP systems can
be defined as following: slice (specification of slices of data via rotation of the cube the
result of which is the two-dimensional table) and dice (slice on more than two
26
dimensions of the data cube), drill down/up (navigation between levels of data from
most summarized to most detailed correspondingly), roll up (computing all of the data
relationship for one or more dimensions) and pivot (change of the dimensional
orientation of a report or ad hoc query page display) (Turban et al., 2011: 78). OLAP
servers are implemented using either a multidimensional storage engine (MOLAP); a
relational DBMS engine (ROLAP) as the backend; or a hybrid combination called HOLAP
(Chaudhuri et al., 2011).
Finally, the last and the most important feature of the business intelligence tools
concern data extraction and integration (ETL- Extract, Transformation, Load; EII -
Enterprise Information Integration). As discussed in chapter 2.2, data integration is
performed through three phases process – ETL, due to which the data is moved from
the various sources, disparate data is transformed into structured form and is loaded to
the data repository (a data warehouse, data mart or another type of the database).
2.4 Architecture of the business intelligence systems
According to Turban et al. (2011: 30), a typical business intelligence system consists of
four major elements, such as:
data warehouse (used as a repository for data storage);
business analytics (“a collection of tools for manipulating, mining and analyzing
the data in the data warehouse”);
business performance management – BPM (used for monitoring and analyzing
organization’s performance);
user interface (e.g. dashboards, scorecards etc.).
As discussed already in the previous chapters, data warehouse is the cornerstone in
the business intelligence systems since it serves as the repository of the structured
standardized data, suitable for analysis purposes. As pointed out by Turban (2011:
30.), previously data warehouses contained only historical data while nowadays they
also store the current data which gives a possibility to provide “real-time decision
support”.

27
As discussed in chapter 2.3 business analytics consists of two main types: 1) reports
and queries and 2) data, text and Web mining as well as other more complex
mathematical and statistical tools (Turban et al., 2011: 30.). Data mining and
predictive analytics was described more specifically in chapter 2.3.
Business performance management, which is also referred to as the corporate
performance management (CPM), enterprise performance management (EPM) – a
term associated with Oracle’s PeopleSoft, strategic performance management (SPM) –
term which is used in SAP’s software, “refers to the business processes,
methodologies, metrics, and technologies used by enterprises to measure, monitor,
and manage business performance” (Turban et al., 2011: 105). According to Turban et
al. (2011: 105) BPM is a concept which evolved from BI and incorporates many of the
BI tools. Often BPM is called as “BI + Planning”, which means that it includes the
whole cycle of organization’s management – plan, monitor and analyze – in one
package, while BI refers only to analysis of data and predictions.
As mentioned by Turban et al. (2011: 105.), BPM includes three main components:
Integrated analytical and management processes that address financial and
operation activities;
Tools which allow organizations to define strategic goals, set measuring
characteristics for them and then manage performance based on the set goals;
Core set of processes, such as: financial and operational planning, consolidation
and reporting, modeling, analysis and KPIs monitoring which are linked to
organization’s strategic goals. Often BPM is combined with the balanced
scorecard methodology which allows companies to link their strategic goals with
the specifically measured key performance indicators in different areas or
departments and consequently monitor company’s performance according to
the set values of the indicators.
Finally, the last basic part of the business intelligence system is the user interface –
dashboards or other information broadcasting tools (Turban et al., 2011: 32). As
already discussed in sub-chapter 2.3, dashboards provide an overview of the key
performance indicators of the company, trends, errors or exceptions by integrating the
information from different business areas. They often present the graphs which

28
compare the actual performance of the company with the planned one providing an
overview of the “health” of the organization. Besides dashboards some of the other
broadcasting tools may be referred to the cockpits, charts, corporate portals,
multidimensional cubes etc. Geographical information systems also start to play a
significant role in the decision support (Turban et al., 2011: 32).
Figure 5 presents a high-level architecture of the BI systems with the emphasis on the
business performance management and explanation of the end-users roles.
Figure 5. High-level BI systems architecture (Turban, Volonino, 2010: 459)
Thus, data warehouse environment is first of all intended for the utilization of the
technical users, such as organization’s IT staff, business analytics environment is
accessed by the business users who can be represented by the middle managers or
operational managers and whose main task is to perform data analysis, run reports
and predictive analytics. Performance and strategy area of the business intelligence is
represented by the business performance management process which is designed to
facilitate the planning and monitoring process of the company’s strategy for the top-
level managers and executives. Business users access both the data warehouse and
analytics tools through the user-friendly interface which may be represented by the
dashboards, portals etc.
The actual physical architecture of the business intelligence systems is provided in the
figure 6.

29
Figure 6. Typical BI system architecture (Chaudhuri et al., 2011)
Most physical components of the BI systems shown in the figure 6 were discussed in
the previous chapters. In addition, it is worth to mention that data warehouses besides
more traditional options such as relational database management systems (DBMS) can
also be represented by MapReduce engine. According to Chaudhuri et al. (2011),
emergence of the MapReduce paradigm was triggered by necessity to process large
amounts of data with low latency. Originally such engines were used for analyzing of
the Web documents and Web query logs; however, nowadays they are also widely
implemented for enterprise analytics.
Another component which was not introduced in the previous chapters refers to the
Complex event processing (CEP) engines which are designed to support the BI tasks in
the real time in order to allow making decisions based only on the operational data
(Chaudhuri et al., 2011).
Thus, according to the figure 6, BI systems operation can be described as the following
sequence. Data from the external data sources or operational databases is transformed
to the unified format and loaded to the data warehouse; alternatively data can be
processed by the CEPs in the real time. When the data is processed, it is loaded either
into the data warehouse which can be represented by the relational database or
MapReduce engine depending on the volume and requirements for data processing.
After that on the mid-tier server levels the actual business intelligence analytics is
performed, which can include OLAP processing, enterprise search, reporting or data
mining. As an output the end-users receive information for the decision-making
process in the front-end applications with the friendly user interface. Such applications,

30
as discussed earlier, can be represented by search tools, dashboards, ad hoc query
tools, spreadsheets, digital cockpits, charts etc.
2.5 Business intelligence vendors
At the present moment in the market there are many business intelligence and
business performance management solutions offered by various vendors. As defined by
Turban et al. (2011: 41), some of the major software corporations which provide BI
solutions include Teradata, MicroStrategy, Microsoft, IBM+Cognos+SPSS,
SAP+Business Objects, Oracle+Hyperion, SAS etc. As pointed out further by the
author, recently there has been a major consolidation due to the fact that larger
software companies acquired others in order to complete their product portfolio. Thus,
SAP acquired Business Objects, IBM acquired in 2008 Cognos and in 2009 SPSS, Oracle
acquired Hyperion. Some of business intelligence solutions provided by each of these
vendors are discussed below.
2.5.1 Teradata
According to company’s website, Teradata position itself as the world’s largest
company which is focused “on analytic data solutions through integrated data
warehousing, big data analytics, and business applications” (Teradata, 2012).
Company provides various solutions to satisfy most common business needs, such as:
big data analytics, data governance, data warehouse migration, financial management,
tax and revenue management, business intelligence, data mart consolidation, demand
planning, SAP integration, Master data management, customer relationship
management, data mining and analytics, enterprise risk management etc.
In terms of the business intelligence solutions, Teradata offers an Active Enterprise
Intelligence platform which combines two types of business intelligence – strategic and
operational business intelligence. Strategic business intelligence solutions provided by
the company are designed for planners, financial analysts and marketing managers so
that they would have a possibility to “use historical trends and insights to make
informed decisions concerning customers, inventory, suppliers, products, and partners”
(Teradata, 2012). Operational business intelligence module is designed for utilization

31
by front-line workers and systems which are involved in making of day-to-day business
decisions (e.g. cashiers, customer representatives, call-center agents etc.). Active
Enterprise Intelligence platform is delivered through Active Data Warehousing services
provided by the company as well as business intelligence solutions of company’s
partners.
Besides Active Enterprise Intelligence, Teradata also provide Integrated Analytics
solutions which include such business intelligence features as (Teradata, 2012):
Data Exploration - visual data exploration to quickly understand and analyze
data within the database;
OLAP Optimization - built-in multidimensional analytics optimization;
Geospatial - native in-database geospatial data types and analytics;
Temporal - native in-database temporal support to manage and update time
data and analytics;
Advanced Analytics- optimized in-database data mining technology from leading
vendors, open source, and Teradata;
Agile Analytics - in-database data labs to accelerate exploration of new data
and ideas;
Big Data Integration - partner tools to analyze unstructured and structured
data;
Application Development - tools and techniques to accelerate development of
in-database analytics.
Thus, as it can be seen from the information mentioned above, Teradata’s most
business intelligence technologies are based on their main product Active Data
Warehousing. Therefore, for organizations who decide to choose this vendor for
business intelligence implementation, it is essential to use also vendor’s warehouse.
The main disadvantage of this vendor is lack of the specific information and examples
of the tools which can be used for business intelligence.
2.5.2 Micro Strategy
As mentioned at company’s website, MicroStrategy is one of the global leaders in
business intelligence technology, which provides “integrated reporting, analysis, and

32
monitoring software that enables companies to analyze the data stored across their
enterprise to make better business decisions” (MicroStrategy, 2012).
The company claims that its business intelligence software allows transformation of the
organizational data into more structured and understandable information which gives
the possibility to increase the productivity, achieve cost-efficiency, increase customers
satisfaction, set revenue-optimizing goals and define efficient strategies, monitor
trends and detect anomalies as well as forecast opportunities. MicroStrategy’s
business intelligence software can be run based on the data stored in data
warehouses, operational databases, enterprise resource planning (ERP) systems (e.g.
SAP, Oracle) and MDX cubes Microsoft Analysis Services, SAP BW, Essbase, and TM1
(MicroStrategy, 2012).
The main business intelligence software offered by the company is MicroStrategy 9,
which represents a fully integrated business intelligence platform. Some of most
important modules of the MicroStrategy 9 are the following:
MicroStrategy Intelligence Server which allows grouping all types of the
business intelligence applications and running them efficiently on one server;
MicroStrategy Report Services – a dashboard and enterprise reporting engine
which allows running most robust and detailed reports;
Business Dashboards – provide executive and complete views on organization’s
key performance indicators;
OLAP Services – extension of MicroStrategy Intelligence Server that allows
faster data analytical processing;
MicroStrategy Desktop – premier business intelligence development
environment for reporting and analytics purposes;
MicroStrategy Web – web-based reporting and analytical platrofm.
A comprehensive overview of the development, deployment/management and
reporting modules of MicroStartegy 9 is represented in the figure 7. MicroStrategy 9
includes three main groups of the solutions, such as: development tools (e.g. Rich
Design Environment) required for the developers or IT support staff to implement and
manage a BI solution, deployment / management tools (e.g. Unified BI architecture)

33
for management of the BI solution in the organization and reporting tools (e.g.
Dashboards & Scorecards) for reporting and analysis performed by the end-users.
Figure 7. MicroStrategy 9 architecture and modules (MicroStrategy, 2012)

34
2.5.3 Microsoft
Microsoft uses familiar applications to deliver business intelligence solutions such as
Microsoft Office in a combination with MicrosoftPivot and Microsoft SharePoint built on
the SQL Server 2012 platform (Microsoft, 2012).
Some of Microsoft business intelligence solutions include the following:
Self-Service BI – by means of the PowerPivot application it is possible to access
data from any source and run reports via Microsoft Excel 2010 or Microsoft
SharePoint 2010;
Managed Self-Service BI – designed to efficiently manage user-created content
through PowerPivot IT Dashboards in SharePoint;
Dashboards and Scorecards – via Microsoft SharePoint Server 2010, it is
possible to use dashboards and scorecards with advanced filtering, interactive
navigation, advanced analytics, visualization etc. Integration with Microsoft
Visio allows display of the live data in the diagrams while integration with Bing
Maps gives a possibility to view the data in the geospatial format;
Reporting – performed through Microsoft SQL Server; Microsoft SQL Azure
Reporting also allows to access the data through the cloud;
Semantic modeling – an integrated business intelligence solutions consisting
several BI possibilities, such as reporting, analytics, scorecards, dashboards
etc.;
Advanced analytics – data mining techniques used to define trends, anomalies,
perform forecasts and predictions;
Enterprise Information Management – an integrated tool for improvement of
data’s quality and master data management;
Data Warehouse – depending on organization’s needs from pre-configured
solutions to complex systems based on the massive parallel processing
performed by SQL Server Parallel Data Warehouse.
2.5.4 IBM Cognos
One of the main peculiarities of IBM Cognos Business Intelligence is that besides usual
BI techniques it also includes planning, scenario modeling, real-time monitoring as well

35
as predictive analytics in a single platform. The platform can be accessed through the
desktop computer, notebook, tablet and smart phone.
Among numerous features of the system it is worth to mention the following ones
(IBM, 2012):
Query and reporting – this feature fits to all user roles in the organizations,
from professional users who design one-to-many reports to ad-hoc personalized
reporting;
Analysis – function allows performing basic analysis for day-to-day decisions
along with the more advanced predictive or what-if analysis;
Scorecarding – links strategy to the operational implementation by providing
information concerning key performance indicators across the organization;
Dashboarding – summarizes most important information throughout all
departments of the organization;
Mobile BI – provides secure access to the organizational data from any mobile
device enabling users to perform quick decisions;
Real-time monitoring – allows facilitation of the operational decision-making by
providing almost real-time values of the KPIs;
Extending BI – integrated solutions for Microsoft Office and Cognos Mashup
Service;
Collaborative BI – facilitation of the decision-making for groups and teams
through collaborative analysis;
Statistics – powered by IBM SPSS Statistics Engine allows incorporation of the
statistical analysis into decision-making.
Company’s website provides insightful information concerning capabilities of the
system as well as full documentation and demo versions of every available tool which
facilitates system’s evaluation for potential customers.
2.5.5 SAP Business Objects
SAP provides both business intelligence as well as data warehouse solutions
represented by the SAP Business Objects business intelligence (BI) and SAP NetWeaver
Business Warehouse (SAP, 2012) correspondingly.

36
SAP Business Objects BI provides the following functionality:
Reporting and analysis – represented by SAP Crystal reports (provides the
possibility to build interactive reports based on any data source), SAP Business
Objects Analysis, edition for OLAP (analysis of the multi-dimensional data sets),
SAP BusinessObjects Analysis, edition for Microsoft (perfoms data analysis via
intuitive user interface within Microsoft Office), SAP BusinessObjects Web
Intelligence (ad hoc analysis across heterogeneous data online and offline), SAP
BusinessObjects Predictive Workbench (prediction of future trends);
Dashboards – represented by SAP BusinessObjects Dashboards and serves for
quick visualization of complex data;
Data exploration – represented by SAP BusinessObjects Explorer and is used for
the efficient search and exploration of the data;
Mobile – includes SAP BusinessObjects Mobile (provides access to reports, data
and analysis from a mobile device), SAP BusinessObjects Explorer (possibility to
connect data to maps with the location-based analytics), SAP Event Insight
(allows receiving alerts to a mobile device based on real-time data processing);
BI Platform – represented by SAP BusinessObjects BI Platform (a single
platform which integrates available business intelligence tools), SAP
BusinessObjects Integration (integrates business intelligence with organization’s
applications) and SAP BusinessObjects Live Office (integrates business
intelligence with Microsoft Office solutions).
SAP NetWeaver Business Warehouse serves as a data repository and improves the
data querying and analytics performance if used along with own SAP business
intelligence solution.
2.5.6 Oracle solutions
Oracle provides various data warehousing, business intelligence and business
performance management solutions, among which it is worth to mention the Oracle
Business Intelligence (BI) Foundation Suite and Oracle Hyperion Performance
Management Applications (Oracle, 2012).

37
Some of the main functionality, provided by Oracle Business Intelligence (BI)
Foundation Suite, includes the following:
Enterprise Reporting – delivered by Oracle Business Intelligence (BI) Publisher
which allows preparation of the highly formatted reporting documents,
including in PDF format;
Ad hoc query and Reporting – combines both relational and OLAP style analysis
and suits for processing data from multiple sources in a pure Web environment;
Interactive Dashboards – represented by rich interactive dashboards available
from Web;
Scorecard and Strategy Management – allows communicating of the
organization’s strategic goals across the organization and their monitoring over
time;
Actionable Intelligence – allows exception based decision-making which is
achieved through an alerting engine which captures exceptions and provides
notifications;
Integrated Search – performs system-wide search throughout dashboards,
Analyses, views, prompts, KPIs, scorecards, publisher reports, agents, actions,
catalogs and folders;
BI on the go – provides a quick access to the business intelligence content if
the user is not directly connected to the organization’s network.
As mentioned before, business performance management is a concept which evolved
from the business intelligence and is an essential part of the enterprise’s IT
infrastructure nowadays. Thus, Oracle Hyperion Performance Management Applications
concentrates mainly on the strategy management, planning, budgeting and forecasting
for different departments, financial close and reporting (Oracle, 2012).
2.5.7 Comparison of the vendors
Based on the analysis of the vendors provided above, comparison between the
functionality of the presented vendors can be performed in order to identify the
difference between offered solutions.

38
Thus, vendors which were considered in the previous chapters provide in most cases
similar functionality with minor differences depending on how the vendor positions
itself in the field of the business intelligence. Enterprise reporting and analysis is
provided by all vendors and is represented as Data Exploration by Teradata; Micro
Strategy Report Services and Micro Strategy Web by Microstrategy; Semantic
modeling, reporting and Self-service BI by Microsoft; Query and Reporting by IBM; SAP
Crystal Reports by SAP; and Oracle Business Intelligence Publisher by Oracle.
Enterprise search is also realized by all vendors and is represented, for example, as
Data Exploration by Teradata, SAP Business Objects Explorer in SAP solution or
Integrated Search by Oracle. The same concerns the scorecards, dashboards and data
visualization tools – all analyzed vendors provide similar solutions in this field.
Predictive analytics is represented by most vendors as Advanced Analytics, OLAP
Services or Ad Hoc Query and Reporting modules.
Therefore, the functionality of the BI solutions provided nowadays by most vendors is
similar except for the insignificant differences or some additional modules, such as, for
example, cross-platform integration (access to the BI solution through any device)
which is offered strongly by some vendors compared to others (e.g. Microsoft, SAP,
Oracle). Taking into account this fact, organizations should define the criteria for
choosing a specific BI solution as well as company who will be implementing this
solution not based on the functionality or price of the system, but rather based on the
specific offer of the implementation company and needs of the organization. More
detailed process of the vendor selection is described in the chapter 3.3.
2.6 Benefits of the business intelligence implementation
The main benefit of the business intelligence implementation concerns the fact that
organizations are able by implementation of such tools to provide users with the right
information to the right people at the right time, which significantly facilitates the
decision-making process both on the strategic and operational levels (Turban et al.,
2011: 32).

39
Among top pressures which are driving companies to implement business intelligence
solutions it is worth to mention the intentions to increase the customer satisfaction,
improve growth strategies, identify process inefficiencies, define the adverse situations
in advance and response to them quickly and efficiently, optimize resource allocation.
In fig. 8 the percentage distribution between top five business pressures driving
companies to implement business intelligence technologies is represented.
Figure 8. Top five business pressures driving adoption of predictive analytics (Turban, Volonino,
2010: 451)
As mentioned by Martin et al. (2011), successfully implemented business intelligence
solutions are able to increase the overall decision-making process as well as increase
the efficiency of the business reporting and analysis. The prerequisites for achievement
of these benefits are the following:
the information becomes available;
data is consistent across the organizational units and stored in the same
format;
data can be easily analyzed through the built-in analytic tools;
reports are presented in well-structured and user-friendly format.
Another important aspect of the business intelligence systems is that the information
can be easily shared and compared between different departments as there are
common data formats and standards throughout the whole organization.
0%
5%
10%
15%
20%
25%
30%
35%
Increase customer loyalty and satisfaction
Improve growth strategies
Discover process inefficiences
Identify and respond to
adverse situations before they affect
performance
Optimize resource allocation

40
Business intelligence solutions benefit not only the business environment of the
organization but also improve the IT infrastructure of the company (Martin et al.,
2011). This is achieved due to the fact that all organization’s applications are being
integrated into the common system which makes the IT structure of the company
more logical and easier to manage. Moreover, business intelligence end-users self-
service empowers the employees who become able to run their own reports at any
point in time. Due to this the IT staff is no longer involved into reports’ preparation and
changing which reduces organization’s costs and leads to more efficient utilization of
the organizational human resources.
As it is shown in the figure 9, users of the business intelligence solutions can be
roughly divided into three categories: heavy analysts, casual and ad-hoc users and
consumers.
Figure 9. End-user segmentation by technical skills (Biere, 2003: 50)
Thus, heavy analysts are users with the IT background who are able to perform highly
technical analysis and, therefore, deliver creative information which will benefit the
organization the most. Usually, amount of these users does not exceed about 2%.
Casual and ad-hoc users usually include those who can run reporting or create
templates and make modifications according to their own requirements. These users
are not usually decision-makers, but department’s employees who are preparing the
information for the employees of the higher hierarchy (refer to about 5 to 10% of the
organizational employees). The biggest benefit business intelligence solutions provide
to top-level managers, senior department managers or CEOs who account for about
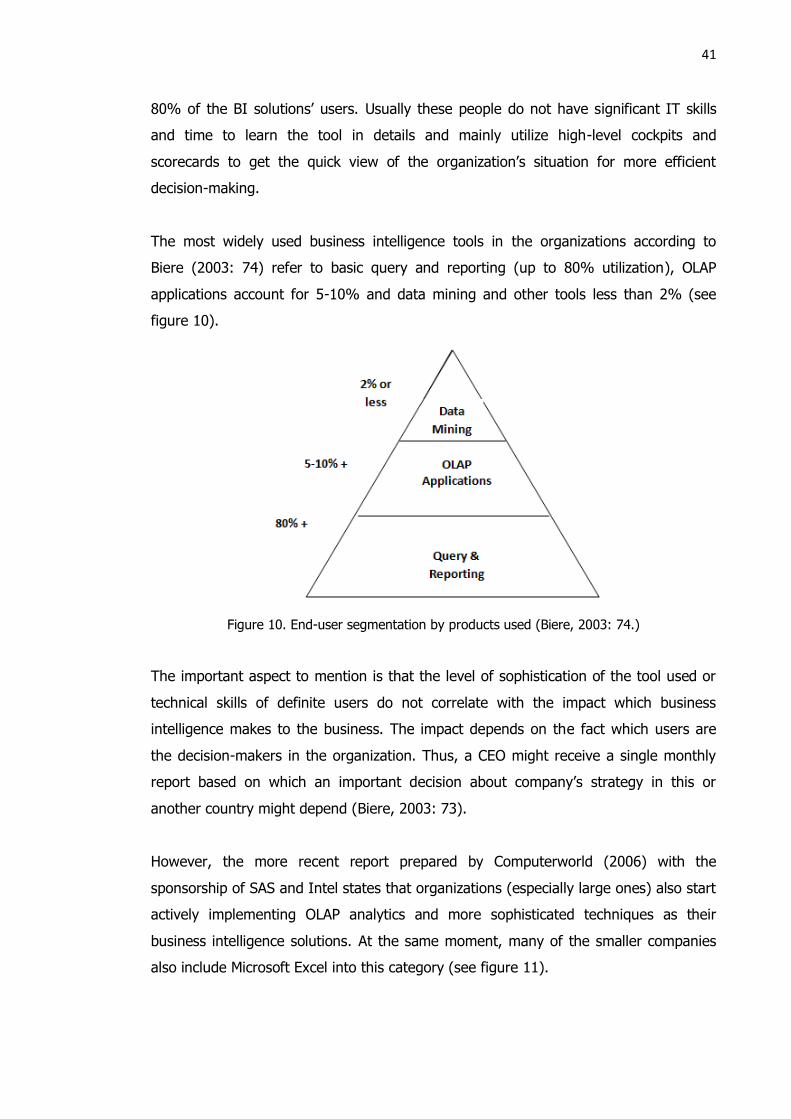
41
80% of the BI solutions’ users. Usually these people do not have significant IT skills
and time to learn the tool in details and mainly utilize high-level cockpits and
scorecards to get the quick view of the organization’s situation for more efficient
decision-making.
The most widely used business intelligence tools in the organizations according to
Biere (2003: 74) refer to basic query and reporting (up to 80% utilization), OLAP
applications account for 5-10% and data mining and other tools less than 2% (see
figure 10).
Figure 10. End-user segmentation by products used (Biere, 2003: 74.)
The important aspect to mention is that the level of sophistication of the tool used or
technical skills of definite users do not correlate with the impact which business
intelligence makes to the business. The impact depends on the fact which users are
the decision-makers in the organization. Thus, a CEO might receive a single monthly
report based on which an important decision about company’s strategy in this or
another country might depend (Biere, 2003: 73).
However, the more recent report prepared by Computerworld (2006) with the
sponsorship of SAS and Intel states that organizations (especially large ones) also start
actively implementing OLAP analytics and more sophisticated techniques as their
business intelligence solutions. At the same moment, many of the smaller companies
also include Microsoft Excel into this category (see figure 11).

42
Figure 11. Percentage who consider each software tool part of their BI solution
(Computerworld, 2006)
Thus, based on the above mentioned, business intelligence is believed to deliver
various benefits to the organizations and most importantly in the way of facilitation of
the decision-making processes and increasing the speed of the organizational
responses to the changing environment. However, organizations who make a decision
to implement such often costly and sophisticated tools might not always understand
how exactly this will impact their business since there are no exact ways to measure
business intelligence’s influence on the decision-making process. Moreover,
organizations do not always realize what kind of problems and difficulties might arise
during the implementation stage since integration of such complex solutions changes
not only the IT infrastructure of the companies, but also their overall business
processes.
43
3 Managerial aspects of the business intelligence implementation
3.1 BI project planning activities
Implementation aspects of business intelligence systems vary significantly depending
on the size of the organization and project’s constraints such as budget (costs), time
and company’s internal expertise in the field of business intelligence. Thus, larger
organizations, as a rule, make the investments in purchasing of one or several business
intelligence solutions and creating dedicated experts to support and manage purchased
systems. In the modern conditions the “green field” situation (absence of any similar
systems in the IT environment of the organization) is not common. Small and medium
enterprises do not tend to use sophisticated BI, considering e.g. Excel (see figure 11)
as one of the BI solutions. Therefore, in case of the company’s growth and the
emergence of the need to implement more advanced business intelligence, the “green
field” situation may arise. Such projects are easier to manage since often re-
engineering of the whole organization’s IT environment is performed and vendor’s
involvement is significant.
According to Groh (2004), BI project planning and management should correspond to
the steps which are presented in the figure 12. Steps from 1 to 7 in the project refer to
the responsibility of the organization as they are describing the business needs of the
company and goals for the BI solution along with organization’s current capabilities
and condition to implement BI. Steps 8 and 9 can be performed with the assistance of
the vendor or consulting company if the organization does not possess enough
technical expertise in the field of the BI, while steps 10 and 11 are related to the cost-
benefit analysis which is discussed further in the sub-chapter 3.2.

44
Figure 12. BI project planning and implementation activities (Groh, 2004)
Assessment of the business environment, IT environment, collecting of the
requirements and objectives, identification of the potential benefits and prioritization of
the requirements highly depends on the feedback from the top-management and
experts in the business units where the BI solution is intended to be implemented.
Figure 13 provides an overview of the requirements gathering process which are
transferred into specific business needs and goals to implement BI solutions.
1. Assess the business environment
2. Assess the IT environment
3. Gather business requirements and objectives
4. Identify and quantify potential benefits
5. Prioritize the requirements
6. Identify gaps (process, people / skill, technology)
7. Create high-level data model and validate
requirements
8. Define solution architecture
9. Develop a phased implementation plan
10. Identify the cost
11. Develop business justification and calculate ROI

45
Figure 13. Requirements gathering process (Groh, 2004)
As mentioned by Biere (2003: 124) and supported by the BI project planning flow
above, correct formulation of the BI implementation’s mission and goals is one of the
most crucial aspects of the justification process and it should provide a clear
understanding of the reasons to implement BI and its specific benefits to the business
processes of the organization. Due to the fact that the value of the BI and its impact
on the real decision-making process is elusive and intangible, it is highly important to
provide as specific formulation of the goals as possible. Below, two examples of the
goals’ formulation for the BI project are provided.
The first goal’s formulation lacks specific details, realistic estimations and description of
how exactly the BI tool will be used to solve organization’s tasks.
Our goal is to produce a series of new reports for the sales and marketing organizations to increase sales and develop more pinpointed and focused efforts
to reach new customers. We plan to organize a series of presentations for leading query/reporting vendors to introduce us to their technology. We will award the business to the one that we feel most closely suits our users believe
they want (Biere, 2003: 124).
The second example of the goal’s formulation and description of the project’s flow
contains more specific details and is written in a more clear and understandable way.
Our goal is to produce five new reports that have been agreed to by our sales
and marketing organizations for joint use. The source data has been identified and loaded. We have scheduled a proof of concept (POC) for the query/reporting vendors that we have researched and have an interest in pursuing. We intend to

46
award the business to the one delivering the critical reports in the most understandable and timely manner during the POC (Biere, 2003: 124).
In order to correctly formulate the goals of the BI project and assess the IT and
business environment of the organization managers and initiators of the BI
implementation in cooperation with the end-users are recommended to consider the
following questions (Biere, 2003: 125-126):
What new analyses will be provided? Can quantitative or qualitative benefits be
assigned to it?
What is the primary benefit for the BI implementation (productivity, better
data, greater sales, fewer expenses)?
What significant new business function or capability will BI solution provide?
What is the risk if the BI solution is not implemented? What will happen if the
project is not completed?
Is it a corporate necessity to implement BI solution or is it based on other
reasons (e.g. resemblance to the competitor’s practices)?
What is the scope of the project and what is a quantifiable business value that
will be delivered?
Does the company have historical data to be used with the BI tool?
If the company does not have any historical data at the moment, does it intend
to provide a structure and database to serve as the data pool?
Does the data that the company possesses span into several business areas so
that in case of implementing the BI tool for the tasks in one area, it can also
benefit across the organization?
The model presented by Groh (2004) is based on the identification of the benefits and
requirements for the BI solution which is being implemented. An alternative approach
for the implementation’s planning is provided by Martin et al. (2011). This approach in
the contrast to the BI implementation planning phases provided by Groh (2004) starts
the implementation planning process from definition not of the requirements for the BI
solution, but key performance indicators (KPIs) for the business processes which are
supposed to be covered by the BI solution. This approach also differs from the Groh’s
model as it emphasized the vendor selection stage and explains how vendor
comparison should be carried out in order to choose the vendor that suggests the
functionality which suits the company the most. Instead of approval of the BI solution

47
architecture as described by Groh, Martin also suggests using prototyping which makes
the implementation an iterative process aimed for continues monitoring and improving
of the BI solution.
Thus, according to Martin (2011), three phases of the implementation are identified
(see figure 14).
Figure 14. Three phases of the BI implementation (Martin et al., 2011)
It is mentioned by Martin that the BI project should always start with identification of
the business requirements, as projects which are based only on the technical
requirements often fail.
Thus, during the first phase an organization should identify the key performance
indicators (KPIs) expressing the current situation of the company in order to define the
reporting needs (see figure 15). The next step is related to assessment of the data
availability in order to perform the calculation of required KPIs. As it is mentioned by
Martin et al. (2011), condition and availability of the data for the KPIs is one of the
major aspects leading to successful implementation of the system.
Figure 15. The first phase of the implementation (Martin et al., 2011)
During the first phase organization also needs to define which areas or business units
the BI solution will cover – financial, supply chain and logistics, marketing and sales
etc. Besides that, the risk assessment should be performed in order to compare the
chosen KPIs and define the potential risk associated with the choice of wrong KPIs.

48
As soon as the first phase is completed, organization is able to proceed to the second
phase, the end result of which is approving of the future BI system’s prototype (see
figure 16).
Figure 16. The second phase of the implementation (Martin et al., 2011)
During this stage the justification of the BI implementation is carried out through
performance of the cost-benefit analysis of the implementation in a specific area /
business unit. According to Martin et al. (2011), vendor selection is free from any
specific functional requirements for BI system and is based mostly on the company’s IT
policies and IT infrastructure. Thus, based on the IT architecture rules, a specific BI
solution that fits into company’s general requirements, IT strategy and IT landscape
can be chosen. When this is completed, requirements gathering task begins, during
which the company provides not only the functional requirements but also design and
look-and-feel mock-ups of the future reports design and cockpit to the vendor. Based
on further suggestions and recommendations of the vendor, the concept of the future
BI solution is proved and a third phase related to the technical implementation begins.
As mentioned by Martin et al. (2011) the third phase usually represents a typical IT
project. The implementation and results should be achieved fast due to the higher
management awareness. Thus, the set of the reporting tools and a cockpit should be
provided already during the initial stages of the implementation operating on the
limited data set. One of the main aspects in BI projects is preparation of the data
which includes not only cleansing and transforming existing data into the unified
format, but also establishing organization wide rules for data storage which often
includes development of the data architecture, hierarchies, dimensions and formulas.
Another important aspect of the successful BI project is close cooperation between the
development team and end-users in the business units.

49
3.2 Justification of the BI implementation
3.2.1 Types of the costs and benefits
Turban (2011: 256) mentions that the cost-benefit analysis is one of the most critical
parts in the implementation stage of a business intelligence solution. Nonetheless that
some BI solutions are expensive and justifiable only in large corporations, the cost-
benefit analysis should be made also in SMEs before committing to any of the BI
systems. According to Groh (2004), business intelligence solutions refer to the IT
investments which yield the highest returns and require only about two years or less of
the total payback time (for 63% of the companies). However, it is also mentioned
further by the author that it is more difficult to develop a business case (project plan)
for BI initiatives than for other IT investments due to intangible benefits of the BI
solutions.
Biere (2003: 125) identifies the following key elements that should be taken into
account while calculating return on investment for BI solutions:
the cost of the software proposed and annual maintenance;
the cost of the hardware required (new servers, PC upgrades etc.);
the cost to train the IT staff and end-users (including deployment costs);
support costs for IT and additional costs;
the cost to the enterprise while little or no productivity occurring (during the BI
testing and deployment phases).
As mentioned by Biere (2003: 127-128.), in the end of the project planning process,
organization should document the findings and create a project outline that should
cover the following areas (a layout of the BI project outline is attached in the Appendix
1):
Project information (project name, description, executives and responsible
persons, budget and cost owners, scope of the project, key business benefits,
total estimated return on investment);
Vendor and technology cost information (vendor solution proposed, cost and
type of the software, maintenance, cost and type of the hardware, total
estimated vendor costs);

50
IT and support cost information (description of the implementation team,
budget, time estimated to implement, estimated cost to implement, estimated
ongoing support cost, total estimated IT costs);
End-user cost information (implementation team, estimated cost of training per
user, number of users, total cost of user training, support costs, total estimated
user costs);
Total ROI;
Total costs;
Net business benefit.
Groh (2004) suggests an alternative approach to justification of the BI solutions’
implementation – dividing BI benefits into quantitative and qualitative. Thus, the
author claims that there are two major quantifiable benefits of the BI systems, which
are related to decrease of the costs and increase of the revenue. Decrease in the costs
can be achieved by increasing efficiency of the business operations. For example,
improvement of the marketing campaigns based on the reporting provided by the BI
tool – when a roughly estimated cost of acquiring a new customers can be decreased.
Increase in revenues is an area with most likely payback of the BI initiatives. This can
be achieved through, for example, converting one-time buyers into repeated
purchasers due to the detailed reporting and analysis provided by the BI systems.
The author mentions further that some benefits are difficult to quantify, however,
despite of this, they should be still included into the business case as they clearly
demonstrate how the processes in the organizations can be improved. Thus, some of
these benefits may be represented by the following: improved information
dissemination, improved information access, improved data quality and feedback from
operational systems, improved collaboration between business units.
According to Groh (2004), the cost analysis of the BI project is always more
straightforward than the benefit analysis as it is usually associated more with the
selected solutions architecture (hardware and software) and the implementation plan,
which defines resource and time requirements.

51
In figure 17 it is described how the cost identification is performed based on the set
requirements, priorities, budget constraints, current IT architecture and chosen BI
solution architecture as well as based on the phased implementation plan.
Figure 17. Project planning components and total costs (Groh 2004)
Groh (2004) identifies two cost components – initial and recurring. Initial cost
components refer to the cost of the software, hardware, internal and external labor
costs and training, while recurring cost components are related to support and
maintenance of the BI solutions. Figure 18 shows an example of the format to identify
external and internal labor costs based on the roles of the employees involved in the
implementation.
Figure 18. Calculation of external and internal labor costs (Groh, 2004)

52
Training costs should include training for the BI solution’s administrative staff as well
as training for the end-users.
3.2.2 Financial analysis for project justification
Hopkins (2007) mentions that calculating the value of the BI solution to be
implemented is difficult due to the fact that it equals to calculating of the value of the
potential information which is unknown – there is some value of the investment, the
company has a rough idea of what it is looking for, but the real value of the
information and its amount will be determined only after the investment is made. Thus,
in the case study that the author is describing, the BI implementation project was
divided into smaller cascading stages where every next stage depended on the
successful implementation and valuable payback of the previous stage. In this way the
investment is easier to justify since the organizations gain their results from the very
first successfully implemented stage.
As mentioned by Groh (2004), one of the most common financial tools to calculate the
payback of the project is return on investment (ROI). It allows assessing the benefit of
the project and comparing its initial cost with the net present value (NPV) of the future
gains or savings achieved as a result of the investment. NPV allows determining the
value of 1€ one or several years from the date when the calculation is made taking into
account the discount rate or investment yield rate for the organization (Groh, 2004).
Besides ROI, the payback period is also widely used to calculate the number of years
which are required for the project to compensate the investment. The payback period
takes into account the initial investment divided by the NPV of gains and total number
of years in the planning horizon (Groh, 2004).
In order to assess different scenarios of project’s implementation, the sensitivity
analysis can be used. This analysis with the application to ROI allows identification of
the gains and risks associated with the project as well as the weighted outcome which
should be significantly greater than zero for the project to be worthwhile. The
sensitivity analysis usually assesses the probability of the best, medium and the worst
cases for the investment and gains or losses associated with these cases (Groh, 2004).

53
3.3 Vendor selection and data preparation
3.3.1 Platform and vendor selection
According to Howson (2008), tactics for BI implementation and organization – BI
vendor cooperation have been significantly changing from the beginning of BI
introduction. Previously BI sales of the solution were mostly made directly to the
business eliminating a corporate IT department from the interaction. However,
nowadays investment in the BI is considered to be more an organization wide
investment and, therefore, corporate IT unit is involved in the process due to the
expertise and knowledge of the organization’s IT architecture and infrastructure.
Howson (2008) mentions that due to the fact that at the moment BI solutions are
similar at the surface (in terms of the functionality offered), the key difference between
the vendors are represented by their approaches to account management and
establishment of the relationships with the organizations. The winning vendor should
be “responsive, diligent and should want to understand the customer’s challenges,
both business and technical – a partner” (Howson, 2008), while the losing vendor can
often be “arrogant, unresponsive and disinterested in the project’s vision – a problem”
(Howson 2008). Thus, a winning vendor should be able to develop partner relationship
not only with the business representatives, but also with the corporate IT structure to
ensure that both business and technical requirements of the company are taken into
account. Howson (2008) suggests some practical recommendations which
organizations might follow before and after the purchase of the BI solution.
Thus, before the purchase of BI tools organizations are recommended to (Howson,
2008):
ask the BI sales person about his experience in the BI field and the industry the
organization is in (it is more efficient to cooperate with sales people who have
an industry specific knowledge and extensive experience in BI);
find out how the sales person is remunerated (often sales people are paid on
the commission based level after the sale is made which might influence on the
quality of the cooperation);

54
make clear to the sales person who in the organization makes the investment
decision and challenge the expertise of the sales person through cooperation
with the business users.
After the purchase of the BI solutions organizations are recommended to:
schedule the conference calls or site visits in order to discuss the product
development, progress and potential problems;
involve the sales person into internal discussions concerning the impact of the
BI solution on the business;
utilize informal social interaction in order to facilitate the communication and
ensure sales person’s better understanding of the company’s business needs.
As mentioned by Martin et al. (2011) during the BI implementation there is rarely a
“green field” situation in terms of the architecture of the BI solution due to fact that it
is highly dependent on the organization’s general IT infrastructure and landscape.
Therefore, choice of the vendor and specific BI solution should take into account these
aspects as well. As a rule a software vendor and actual implementer of the BI solution
is often the same as only larger companies are able to provide a full business
intelligence suite.
Martin et al. (2011) suggests that the best approach to choose the suitable vendor
from the short-listed ones based on the market analysis and external reports is to
prepare a presentation with the general functional requirements for the BI solution as
well as general level architecture of the system. In this way vendors would be able to
analyze the requirements, complete them with their suggestions and corrections and
provide a proposal with the description of the BI solution.
Figure 19 contains an example of the comparison of current BI solution implemented in
the organization and two solutions suggested by vendor based on the following
characteristics: implementation design, implementation comments, implementation
simulation, transition to the prototype to release I to II, connectivity to data, hardware
costs. A circle beside every evaluation describes how fully every aspect is implemented
in the current solution and those which are provided by the vendors.

55
Figure19. Vendors’ comparison (Martin et al., 2011)
3.3.2 Data preparation
According to Olszak (2007), the data preparation stage usually follows the vendor
selection and precedes the actual implementation and relates to identification and
evaluation of the internal and external data sources that will be utilized by the BI
systems. Internal resources may refer to the intellectual resources, information
technology resources, paper files etc., while external resources may be represented by
information provided by customers, suppliers, shareholders etc. During this stage it is
important to evaluate the condition of this data and possibilities and approached for its
transformation. It is also important to diagnose all information systems that are used
at the enterprise from application data to databases and ERP systems.
During the diagnosis it is recommended to take into account the following instructions
(Olszak, 2007):
identify the data in the information systems which is not necessary for the
analyses performed by potential BI tools;
identify relations between data across organization’s information systems;
describe the logical structure of the data taking into account the business
processes related to it;

56
find data where the errors might be generated due to its inconsistency.
During this stage it may be possible to identify large amount of the useful data that is
hidden, e.g. in the Internet resources. This data can be revealed through following
manipulations:
manual searching (when documents are downloaded directly from the sources);
automatic searching (downloading html documents through specific software);
querying (using index-based browser search).
After identification and filtering of the data, it is transformed to the homogenous
format through ETL technique and downloaded to the data warehouse or a database
(Olszak, 2007). However, in some cases BI tool may be only used in the bounds of one
department and built based on one specific application. In such situation a BI tool may
use the data directly from the application without its transformation or additional
processing.
3.4 Employees training
As mentioned by Biere (2003: 47-50.) one of the most important aspects of the BI
implementation is related towards employees’ training and changing end-users’
mindset in terms of the approach towards decision-making process. As the author
points out end-users’ main goal is to solve data-related business problems by
preserving a definite degree of the self-sufficiency during the decision-making process.
The main problem with integration of the BI tools to the daily routine of many end-
users is related to the fact that not all of them are technically inclined or have time to
learn a tool to the level they need in order to yield a business benefit. Therefore, one
of the first aspects that must be defined is the level of commitment, which the end-
users are ready to devote towards learning of the tool and completing of the necessary
tasks.
As Gibbons Paul (2012) points out that companies often skip the employees’ training
part – the final step of the BI implementation process. As it is mentioned by the author
further companies often ask their vendors to provide training for the BI tools, however,

57
the main mistake is that the training is performed too early – several months before
employees are actually starting to use the tool. Therefore, by the time the staff starts
using the tool, they might forget technical details and guidelines.
Moreover, before performing actual training companies need to change employees’
attitude towards data sharing and trusting the data generated by the BI tool. This
perception should be changed based on the initiatives from the top and encouraging
the employees to become more open with the data (Gibbons Paul, 2012).
Another problem related to BI employees training is that often companies fail to set
the BI solution in the context of the employees’ daily tasks. Thus, employees may be
able to understand the functionality and technical characteristics of the tool without
having a clear idea how results generated by the tool might impact on the company’s
performance and efficiency of their job. The same problem is related to the corporate
IT support department – while having technical and functional excellence of the
implemented BI solution, IT staff might not be able to help the business user to use BI
tool in the context of his duties (Gibbons Paul, 2012). Thus, Gibbons Paul (2012)
mentions that the most efficient training is two-hours training sessions for groups of
business users from the same area during which company’s own data is used and
graphical representations of the data are explained. Such training sessions must be
distributed among the certain period of time during initial stages of the implementation
of the BI solution are business users must be given an opportunity to ask questions
throughout this period.
Biere (2003) mentions that during the implementation and employees’ training stage,
organization must take into account several end-user provisions in order to facilitate
integration and training processes. Thus, among these provisions it is worth to mention
the following:
Training schedule (it is not recommended to involve “novice” users into initial
training stage);
Users’ documentation and sharing strategies (it is important to know how end-
users will manage their work with BI tool and ensure that the rest of the
involved employees in the enterprise are able to understand that);

58
A list of the specific, initial output (it is important to have a specific list of the
required output (e.g. outlines of the reports) for every business end-user of the
BI tool);
The support structure and the processes in place (ensure that users understand
the process if an issue about support arises and are strictly following the
process steps);
The plan for possible failure (assess alternatives that should take place in case
users do not follow the steps related to fixing of the support problems).
3.5 Ethical and legal issues
As mentioned by Turban et al. (2011: 265), business intelligence and predictive
analytics can lead to serious issues related to ethics, accountability and privacy. Based
on the results generated by the BI tools incorrect decisions may be made which may
lead to considerable damage of the company’s reputation and business performance.
For example, an advice of the expert system may concern unethical or even illegal
actions. Besides that, automation of the managers’ jobs may lead to massive layoffs.
One of the major legal issues is related to the liability of the results generated by BI
tools. Thus, Turban et al. (2011: 265) provides an example of who should be liable if
an enterprise goes bankrupt as a result of using BI software:
The enterprise itself for not testing the BI solution properly?
Auditing and accounting firms for failing to apply adequate auditing tests?
Developers who have been preparing and implementing the BI project?
Among other questions referring to the consequences of the BI systems, companies
should consider the following before implementing a business intelligence solution
(Turban et al., 2011: 265):
Who is liable for the wrong advice or information provided by an automated BI
system if the manager accepts an incorrect diagnosis made by BI and makes a
decision which has a negative impact on the employees?
What happens if a manager enters an incorrect judgment value into a BI
system and the result is a large damage to people and/or companies?
Who owns the knowledge in a BI knowledge base?

59
Can management force manager to use a BI system?
As pointed out further by Turban et al. (2011: 265-266), privacy is also one of the
important ethical aspects related to BI. “Privacy is the right to be left alone and the
right to be free from unreasonable personal intrusions” (Turban et al., 2011: 265). In
relation to business intelligence, privacy may be jeopardized in cases of collecting the
information about individuals, the web and information collection and in case of mobile
networks.
Thus, implementation of the BI solutions may require collecting of the data about
individual employees or customers. The Internet in a combination with large-scale
databases, data warehouses and social networks has created a totally new dimension
for accessing of the individuals’ data. In general due collecting of the private data with
its matching to the computer information can help organizations to fight the fraud,
crime, corporate mismanagement etc. However, on the other hand it can be argued
whether it is ethical or legal to collect the private information about the employees or
customers.
Nowadays the Internet offers various ways to collect the personal data (Turban et al.,
2011: 266):
by reading individual’s social network profile and postings;
by looking up individual’s name and identity in an Internet directory;
by reading an individual’s e-mails, blogs or discussion boards postings;
by asking an individual to complete Web site registration;
by recording an individual’s actions as he or she navigates the Web with a
browser, using cookies or spyware.
Single-sign-on facilities let users enter their account information and passwords once
and use it in order to sign in to multiple services. Some experts claim that such
services may work in the same way as cookies and impact individual’s privacy. Thus,
implementation of the business intelligence solutions may also increase employees’
concern in terms of privacy of the information. These fears need to be addressed by
the organizations during the implementation of any BI project (Turban et al., 2011:
266).

60
Turban et al. (2011: 266) mentions that many users are unaware that their private
information is being tracked through mobile personal digital assistants (PDAs) or cell
phone use. For example, some companies are tracking locations of the cell phones via
GPS-enabling devices or via transmitting of the information at Wi-Fi hotspots. This data
can be used in BI analysis, which is also the violation of the individuals’ privacy rights.
Thus, the main ethical issues that should be taken into account while implementing the
BI project should include the following (Turban et al., 2011: 267):
electronic surveillance or tracking;
ethics in BI design (code of ethics for developers);
invasion of individuals’ privacy;
use of proprietary databases;
use of intellectual property such as knowledge and expertise;
accuracy of data, information and knowledge;
accessibility to information;
use of corporate computers for non-related purposes (employees’ personal
information may be tracked through the Internet and, thus, may have a
negative impact to private data of the company);
how much decision-making should be delegated to computers.

61
4 BI implementation at the case company
4.1 BI solutions at the case company
At the moment Company A has implemented the following solutions related to the
business intelligence:
Company A Data Warehouse (created based on the solution provided by
Teradata);
SAP Business Warehouse;
SAP Business Objects (standard, ad-hoc query and analytical tools);
QlikView (BI tool for in-memory analysis and reporting solutions);
Cognos (BI tools for reporting, analysis and dashboards based on OLAP
technology);
Tableau (BI tools for reporting, analysis and dashboards, data visualization,
interactive dashboard capabilities and BI self-service capabilities).
The figure 20 represents a distribution (intensity of utilization) of the BI tools
mentioned at the company. All together the BI tools serve more than 5000 end-users
and more than 325 customer applications across different organization’s departments.
Figure 20. Customer application per BI tool (Company A, 2011)
The reason of utilization of several various BI tools instead of one generic tool is that
they all have different functionality and characteristics and, therefore, serve various
needs of the organization. In figure 21 the evaluation of the tools based on three

62
characteristics (enterprise reporting, dashboards, interactive analysis, data exploration
and visual discovery) are shown (2 – less developed functionality, 5 – most developed
functionality).
Figure 21. Evaluation of BI solutions’ capabilities (Company A, 2011)
Thus, according to the figure 21, enterprise query and reporting is performed to the
higher extent by means of Cognos, SAP Business Objects and Oracle solutions (OBIEE,
used only in the financial department), dashboards are implemented for most users by
means of Qlikview, interactive analysis is mostly performed by Cognos, Qlikview and
Oracle solutions, data exploration and search is realized by Tableau and Qlikview and
visual discovery is implemented based on the Qlikview as well.
Company A made considerable investments throughout its operation and at the
present moment owns solutions listed (including support plans from vendors according
to which updates to the solutions are provided automatically). Company A
contentiously develops and implements business intelligence projects which are built
based on the existing software. Thus, at the present moment there are up to 20
business intelligence projects which belong to the responsibilities of the Corporate

63
Information and Data department and up to 20 other projects which are run separately
in various departments managed by internal IT support staff of the specific
department. Financing of the business intelligence projects is performed either in the
centralized way or by separate departments which have their own budgets.
4.2 Results of the interviews
During the interview one of the business intelligence projects of the company was
analyzed. The project “Point of sale” is related towards development and
implementation of the business intelligence solution for the sales and marketing
department of the company. The business need behind the project is to develop
methods to retrieve the information about sales of the specific product model in
various points of sales of re-seller, process this information and apply a BI tool which
will help to identify sales patterns dependent on the store’s geographical and socio-
environmental location. This information will be the basis for the local marketing team
to identify the effectiveness of the marketing campaigns performed in this area and
modify them in case of lower sales level or other aspects identified by the BI system.
The project is carried out in the customer logistics department and capability
management department, which serves as the intermediary between the end-users
and the implementation team.
Further analysis of the results follows the list of questions which were prepared for the
interview and which can be found in the Appendix 2.
At the beginning of the implementation process Company A assessed the business
environment and identified the need for the implementation of the new BI solution.
Company A collected business requirements and defined the goal for the
implementation which represented the aim to establish visibility to inventory and
product flows (sell through and sell out) within sales channel. Assessment of the IT
environment was not performed beforehand which led to definite complications with
the data integration process described further in this chapter.
During the next step, the business justification of the project was made by performing
business value estimation based on business owners’ (multiple stakeholders) view.

64
Identification and verification of the qualitative and quantitative benefits was
performed during the project’s business justification stage. The main impact on the
decision-making process and value for the company resulted from the implementation
of the BI solutions is improved speed of the decision making and increase of the
information transparency access function. The next steps in the implementation
planning were related to identification of possible gaps in terms of the people and
skills. Thus, project implementation did not require any organizational changes or
business processes’ re-engineering; changes were related only to the roles and tasks of
the involved persons.
The project planning activities included the steering group meetings and discussions
where project governance, scope and communication practices were defined as a part
of approval of the project’s milestones. As soon as the cost calculation was performed,
the operational owner/business owner was identified and business benefits (value)
were documented. Exception management and reporting and escalation procedures
were defined and agreed.
Due to the fact that the BI systems have been already implemented at the company
(see chapter 4.1), current project is being built based on one of the already
implemented solutions. Thus, the actual data will be processed by one of the systems
called Informatica and stored in Conmpany A data warehouse. The business
intelligence solution will be developed internally by the employees of the Corporate
Information and Data department (BI and reporting team) and built on the basis of the
QlikView BI tool.
As mentioned above, the main business need and goal, which were driving a company
to implement this business intelligence solution is to be able to generate the
information about sales of the specific mobile phone model in order to analyze and
adjust marketing campaigns in the local area of the re-seller. Selection of the vendor
and specific BI software for the project was performed based on the most commonly
used software in the current business unit which is QlikView.
Due to the complex organizational structure of the Company A, there are three parties
which are involved in the planning and implementation of the project:

65
End-users: business unit’s users in another location.
Customer logistics department: since the project is related towards location
information it is labeled as logistics project. Company A has a separate IT
department for every business unit (e.g. logistics, marketing and sales, finance
etc.), which deals with IT support and projects for these business units. Thus,
when there is any need in new IT solution to be implemented, users of the
business unit address the IT department of this business unit.
Corporate information and data department (reporting and business intelligence
team): due to the fact that current project is related to business intelligence,
customer logistics department is cooperating with corporate information and
data department for development and implementing of the project and serves
as the intermediary between the end-users of the business unit and actual
implementation of the BI solution.
Requirements for the project were collected in the form of the workshop, which was
organized with the participation of the customer logistics department which collected
business needs and functional requirements from the end-users and a business
intelligence implementation team. Customer logistics department introduced the
functional requirements and mock-ups (layouts) of the future reporting system to the
Corporate information and data department for its consideration and commenting.
Definition of the final functional requirements is performed as the teamwork and
approved by all parties.
One of the main challenges of the project is to organize the proper data integration
since the data which is required for the BI solution is provided by the re-seller. Thus,
as it was defined during the working processes of the project, the data will be
transferred to the Company A via EDI (electronic data interchange), transformed by
the Informatica system and loaded into Company A’s data warehouse. The interviewee
mentioned that every new BI or reporting project should follow company’s guidelines
or best practices in order to ensure consistency of the information and the common
structure of the reports.
Employees training for the project will be carried out by utilization of the “key-user”
method. Thus, one of the users of the business unit (business analyst) where the

66
project is being implemented will be trained for the developed business intelligence
solution. This user will be responsible for the training of other employees in the
business unit. Training plan created including training scope, material and target group
and other aspects. The issue that the company might face is the ability of business
users to participate in trainings due to other, multiple or parallel tasks.
One of the main ethical issues related to the current project, which were mentioned
during the interviews, concerns the privacy problem – collecting of the information due
to which the identity of the person who purchased a mobile phone can be identified. In
order to avoid violation of the privacy, Company A is making a public promise that no
personal information will be utilized by the company for any purposes.
Among main reasons of failures of the business intelligence projects the interviewee
mentioned as the most important ones cost and time constraints as well as lack of
cooperation between the departments. For example, it is important for all parties to
understand who exactly is the responsible person for the current project and who
possesses enough business related information to give justification to the project, who
understands the business goals and impact on the decision-making process as well as
the architecture of the BI solutions.
4.3 Assessment of BI implementation at the case company
Current chapter addresses aspects of the efficiency of the BI implementation process
at Company A and compares company’s practices and problems faced with the
common theoretical frameworks of BI implementation planning process and typical
managerial aspects of implementation described in chapter 3. The implementation
planning process of the BI project at Company A can be best related to the BI
implementation framework suggested by Groh (2004), which was described in chapter
3.1. During the first step of assessment of the business environment, the internal
customers in cooperation with the customer logistics IT department evaluated the
business environment and defined the need for development and implementation of
the new BI solution which would help the marketing department to analyze the “point
of sale” information related to specific product. However, according to the information
provided during the interview, the company skipped the second stage of Groh’s model,

67
which refers to the assessment of the IT environment of the organization. Due to this,
during the process of the implementation, company faced problems with
transformation of the data from the format provided by re-seller to the standards of
the company. The fact that another intermediate system (in particularly, “Informatica”)
was required to perform the data transformation lead to additional project’s costs and
increased the time of the implementation. If the company were able to assess own and
re-seller’s IT environment in the beginning of the project as suggested by Groh (2004),
the time of the implementation could have been optimized.
As suggested by Groh, the third step in the BI implementation process should concern
collecting of the business requirements and objectives. In case of Company A, the
goals for development of the new BI system were set by the top-management, not by
the need of the actual end-users of the system. In this situation the decision to
implement a BI system for the business function in question (“point of sales”) did not
take into account a critical analysis of the need for this system by the end-users, who
represent the field experts. As a recommendation for further projects it is suggested
for the company to implement workshops between management initiating the BI
implementation process and end-users as proposed by Groh (2004) in chapter 3.1.
This practice will allow determining realistic objectives for the BI system to be
implemented and align them with the corporate goals clearly identifying in this way the
impact of the implementation of the BI project for current business unit on the whole
organization.
Functional requirements for the BI system were collected in cooperation with all three
parties involved in the project – end-users, intermediate customer logistics IT
department and the BI implementation team, which can be described as an efficient
way of collecting the requirements due to the fact that it allows two-way
communication between parties. Thus, while representatives of the end-users provide
clear set of requirements concerning functionality of the system, the implementation
team possesses technical knowledge about feasibility of the BI solution and can advise
business users whether their requirements can be implemented. Moreover, the benefit
of the implementation team being completely aware of the business requirements (not
just of the set of the functionality), allows the team to evaluate the business needs
from another prospective and suggest improvements or recommendations.

68
The main divergence of the BI implementation process at Company A from the model
of the implementation process suggested by Groh (2004) refers to the position of the
BI project’s justification step in the implementation process as well as to the
characteristics of this justification. Thus, assessment of the quantitative and qualitative
benefits from the BI system to be developed has been performed at the beginning of
the implementation which also corresponds to Groh’s model. However, Company A
completely skipped the process of the cost identification that represents two last steps
of the model.
A common practice at Company A is that projects are financed either by the
department itself or centrally by the decision of the top-management as it was in this
particular case. Thus, department of the end-users possessed a limited budget for the
implementation, but did not initiate any cost analysis (as described in chapter 3.2) in
addition to the analysis of the benefits. Initiation of the cost analysis could have helped
the Company A to identify expected costs of the project and optimize the model of the
BI system in order to achieve the most optimal result for efficient return on
investment. A possible explanation for skipping of the cost analysis can be referred to
the fact that Company A represents a large organization and if the project is financed
centrally, it is not trivial to show the clear impact of the particular project on the whole
organization. Thus, as a recommendation for further BI projects it can be suggested
that the financing of the project could be preferably made on the department level
rather than centrally as in this case it gives the possibility to clearly assess the
necessity of the BI implementation and define the benefits and investment justification
of the BI project. The cost analysis can be performed based on the project outline
provided in appendix 1. Application of the sensitivity analysis (mentioned in chapter
3.2.2) could have provided a clear understanding of how critical implementation of this
BI solution is and what could happen if the solution is not implemented.
During the planning phase of the current BI project Company A assessed the
architecture of the future BI solution by identification of the data transformation needs
and choosing of the BI software. The choice of the software as mentioned in chapter
4.1 was made in favor of the most commonly used BI software in the department -
Qlikview, one of the multiple systems that the company runs also for legacy reasons.

69
The fact that company owns BI packages gives it among other advantages also more
flexibility and independence from vendors during the implementation. The company
should have complemented this process with suggestions provided by Martin et al.
(2011), who introduced the vendor selection approach explained in chapter 3.2.1. At
the moment Company A is using four BI vendors for its internal operations and the
vendor for this particular project could have been chosen based on the assessment
framework provided by Martin, rather than based on the fact which vendor is more
commonly used in the department. As mentioned in chapter 2.5.7, even though most
vendors have similar functionality for their BI solutions, specific functions might be
represented better by some vendors and worse by others. A detailed per function
analysis could possible allow the company to identify which vendors are more suitable
for the project and possibly also re-assess reasons for utilization of the some vendors
for other business functions in the same department.
One of the main challenges of the BI projects including the current one refers to the
efficient organization of the employees’ training process. Thus, as discussed in chapter
3.4, not all of the employees are technically inclined, which might lead to complications
related to utilization of the BI tools. As pointed out in the description of the case study,
the main approach for the employees’ training which are used by the Company A
includes assigning a “key” user for a BI system, who is acting as the intermediary
between the technical team and the end-users and is able to solve problems related to
the usability and technical aspects of the tool. Besides this, Company A also will
develop the training material and instructions for the BI system for the current project
which will also facilitate the training process. However, it could be recommended for
the customer logistics IT department that is responsible for management of the current
project to organize seminars or presentations for end-users explaining the need for the
new BI solution to be implemented or its general functionality. In this way the end-
users will be more prepared to apply the BI solution in their daily work and understand
how the efficiency of their tasks could increase with this implementation.
As a conclusion, it is also worth to mention that the company might have used a
different approach for the BI implementation and suggested a prototype of the system
(a working solution with limited functionality) for the end-users during the early stage
of development. This practice could have given the users a possibility to integrate the

70
system in their daily tasks as soon as possible and for the implementation team to
evaluate the reaction of users to the system and address possible problems gradually.
Some of the most significant problems the Company A faced during the
implementation is the lack of cooperation, inefficient information flow between parties
involved in the implementation process and neglecting of the implementations
schedule. Thus, Company A has approved the project planning documentation as well
as the milestones of the implementation during steering group meetings. However,
during the interview it was not completely clear who is the project manager of the
current BI implementation project and who should monitor the process and ensure that
the implementation is done according to the schedule. Even though the functional
requirements for the BI system have been collected and discussed during team
meetings, the technical implementation team did not possess enough information
about the business reasons which were leading the company to integrate the new BI
solution. As discussed earlier, such unawareness might influence significantly on the
quality of the communication between the parties as well as on the choice of the
optimal solution.
Another problem refers to the fact that Company A does not have a standard
procedure for execution of the BI projects. For example, as mentioned during the
interview, cost justification of the project is a selective process and can be skipped
depending on the project. However, the main issue with such flexibility is that the
company needs to have a concrete algorithm, which would determine what kind of
projects require the cost justification and which do not. It could be recommended to
set official rules which clearly explain the procedures and actions during the
implementation process concerning the cost analysis. For example, it can be defined
that only those BI projects, which require significant investment or the implementation
of which influences significantly on the decision-making process require cost
justification.
Finally, it was mentioned during the interview that the company possesses the set of
“best practices” of BI implementation based on the earlier cases, which contain
standards for reports and guidelines for implementation. However, for this particular BI
project no guidelines or standards were applied. For further projects it could be

71
recommended to prepare case studies which would contain critical analysis of the
“lessons learned” for every BI project implemented.

72
5 General recommendations for BI implementation
Current chapter suggests general recommendations for the BI implementation based
on the published practices and analysis of the experience of the case company. Thus,
based on the analysis in chapter 2 it is possible to conclude that the field of BI
solutions is not a young industry, but it has developed and transformed considerably
over the past decades and had technological advances; this is perceived to continue
and will keep on challenging both customers as well as the vendors. There is limited
amount of literature concerning the managerial aspects of BI implementation which
leaves a considerable room for consulting companies and independent researchers.
Managers should systematically track the results from all stakeholders and lessons
learned of past projects as well as any industry case studies. The mainstream vendors
have been consolidating into large corporations - raising the supplier power especially
with regards to SMEs which may find it difficult or costly to implement any BI solutions
(i.e. key customizations) that is not part of the standard product offering. These BI
tools should however be adapted to business processes of the organization or needs
and not vice versa (when due to implementation of the BI solution the re-organization
of the business processes of the company is performed). While the “green field”
situations of the BI implementation are exceedingly rare and companies implement BI
solutions based on the existing IT infrastructure (for example, the Company A),
managers should keep an open mind with the business needs versus current
capabilities.
5.1 Suggested implementation process model
As mentioned in previous chapters, one of the crucial stages during implementation of
the BI solution is the project planning stage. During this stage it is important not only
to assess the IT environment as suggested by Groh (2004), but also identify intangible
business benefits for the organization and communicate the findings to the
management in order to ensure thorough understanding that considerable investments
will gradually pay off. In general, the BI implementation process suggested by Groh
(2004), which is discussed in chapter 3.1, can be criticized in terms of the sequence of
the stages and too general description of the actions, which are supposed to be
performed during every stage. For example, Groh (2004) suggests that the justification

73
of the BI implementation in the 11-staged planning process provided by the author
should be done as a last step. However, placing the justification to the last position in
the planning process may impact negatively the perception of the top-management
concerning the relevancy of the whole project. Management needs to have a clear
understanding before proceeding to the technical requirements and details what kind
of business benefits the BI tool may bring to the organization, how it can facilitate
business operations of the company, how much this could cost to the organization and
what is the length of the payback period. Thus, even though cost-benefit analysis is
impossible to perform without having at least the rough architecture of the BI solution
and expertise required for implementation and vendors’ assessment, business benefits
and costs of the investments should be addressed first when communicating the
results of the project planning to the management. However, it is important to
remember that stakeholders, for whom the project planning paper is prepared, may be
different. For example, in case if the project plan is presented to the CFO (Chief
Financial Officer), costs justification is one of the highest priorities, while if the
stakeholder is the CIO (Chief Information Officer), the architecture and implementation
aspects are more important.
The implementation planning process suggested by Martin et al. (2001) does not pay
enough attention to the division of roles of the parties involved in the implementation
process and does not point out on which stage the employees training for the
prototype should be carried out. Therefore, in order to combine the benefits of two
models, a corrected implementation process is suggested. Users which are involved in
the implementation process in the current model are identified as end-users, higher
level management and implementation team (internal BI implementation department
or vendor). The chart of the implementation algorithm is represented in appendix 3.
Thus, it is suggested that the implementation process is a sequence of 14 steps
performed one after another with two possibilities for reiteration on the stage 5 and
12. Besides the sequence of the implementation steps, the model also contains the
distribution of the roles among parties involved in the BI implementation process.
During the first stage the end-users or field experts in cooperation with the higher level
of management define the need for the BI implementation and set clear goals, which

74
the BI system is expected to achieve. Further, the end-users as they are most familiar
with the business functions of the respective group define the benefits, which the
implementation of the BI system will bring to the organization as the whole and to the
business unit, where it is implemented in particular. Besides benefits, the field experts
also evaluate needs for business process re-engineering (performance of the
organizational changes, distribution of the user roles etc.) and assess the risks
associated with the implementation of the BI system. The risks can be assessed by
means of the sensitivity analysis introduced in the previous chapters.
As soon as the benefits and risks are outlined, end-users / field experts in cooperation
with the actual BI implementation team (business analysts, technical staff) collect the
functional requirements for the system. In the best scenario requirements should be
collected during team sessions organized as the free-flow discussion with the
substantial amount of the advanced preparation. As soon as the functional
requirements are collected, the BI implementation team chooses the BI system’s
architecture and evaluates the feasibility of the technical implementation of the
system. If the BI system’s model based on the current functional requirements and
with the chosen vendor / architecture cannot be implemented, the team should return
to the stage of the identification of the functional requirements and repeat the same
steps. When it is defined that it is possible to implement the system based on the
chosen characteristics, field experts and the BI implementation team prepare BI
solution proposal, which includes description of the system’s functionality, technical
characteristics, analysis of the choice of the vendor, action plan of the implementation
and milestones. As soon as the proposal is ready, the cost-benefit analysis is
performed and return on investment (ROI) for the project is calculated and compared
with the disposable budget. For the cost-benefit analysis it is suggested to use the
template recommended by Biere (2003), which can be found in appendix 2. Results of
the financial analysis are added to the BI solution proposal, which is further being
approved by the involved parties and the higher level of management.
Upon approval of the proposal, work on the project is initiated according to the action
plan and the prototype of the system is created. Further, the prototype is being
integrated into the respective business unit and the employees training is being carried
out. It is recommended to use the “key” user approach for training as well as provide

75
constant support for the end-users by the implementation team. After implementation
of the prototype and in the process of the utilization of the prototype by the end-users,
the feedback regarding the functionality, technical features, usability of the system and
other aspects is being collected by the implementation team. The initial period of the
first prototype’s utilization is defined by the implementation team. In the end of this
period the prototype is being improved based on the feedback of the end-users and
technical analysis of the system’s work. This stage can be repeated several times until
the BI solution is improved to the extent which meets the initial requirements set in the
BI solution proposal. When the prototyping stage is completed and BI solution is fully
integrated, the permanent “key” user is assigned to the system along with the
permanent technical support team.
The final stage of the implementation process should be associated with preparation of
the critical analysis of the implementation and creation of the so-called “business case”
based on the project. This practice is necessary in order to analyze the problems and
issues the implementation team and the end-users faced during the project and file the
“lessons learnt” for the future reference. The complete algorithm of the
implementation process is provided in appendix 3.
5.2 Other recommendations and guidelines for BI implementation
As was mentioned earlier, in large organizations one of the main problems is to ensure
the efficient communication between all parties involved in the business intelligence
project across business units. The lack of communication and understanding of the
business needs by the IT support department may lead to increased project time as
well as to inefficient or not optimal architecture of BI solution or other implementation
problems. For example, if the IT support department is informed about the business
needs behind the project beyond the functional requirements provided by the end
users, it may help to identify bottlenecks or areas for improvement related to
functionality, design or layout of the reports. This can positively influence on the cost
and time variables of the project as well as increase the efficiency, with which a
business unit will be solving tasks with the help of the BI tool.

76
Cross-departmental expertise is also crucial in the definition and implementation
process (to avoid a common problem of poor pre-project research and lack of
understanding of the organization’s information needs), as demonstrated also by
company A emphasizing both the role and the need for close interaction of the
corporate IT function as well as business unit-specific experts for data identification,
selection and preparation. Thus, from project implementation point of view, managers
need to ensure that the gathered requirements and roles of various stakeholders
should be made explicitly transparent. For example, Company A runs the risk of much
confusion in the case project as such knowledge is not successfully communicated.
Therefore, it is recommended for the organizations (especially, for organizations of the
large scale) to implement efficient rules of the information flow and in-project
communication for all parties involved in the implementation.
All parties involved in the project should carry out detailed project scoping, planning
and multidimensional (matrix) vendor analysis. It is suggested that the best vendor
should be considered as the one not with the lowest cost, but rather the partner who is
most responsive, able and willing to support the project (however, with reasonable
costs). Therefore, development of the partner relationships with the vendor should be
the priority for the BI implementation as it is one of the most crucial factors in success
of the implementation process.
As mentioned earlier the costs for BI implementation is not always trivial to estimate as
BI provides intangible benefits. Therefore, managers should keep in mind the benefits
as the primary starting point and need to carry out detailed analysis in order to
quantify the benefits to the extent that the project can be justified. Even though there
are both quantitative and qualitative aspects of the benefits which BI solutions bring to
the companies, sensitivity analysis and implementation in cascading steps are good
practical tools to help define and verify benefits while managing the risk and cost
associated. It is also important to communicate the costs to all parties involved in the
implementation process including the corporate IT department if the company owns its
BI platforms. Thus, if the internal IT department (BI implementation team) is provided
with the cost-benefit analysis (even though the department does not make financing
decisions), if this information is processed by them, some more optimal options for the
BI system may be found.

77
No matter how good the system is, it is worthless unless the users know how to use it
and actually understand why and how it works to support the business decisions in the
context of their daily business tasks. The emphasis on training must not be ignored
due to perceived time or skills conflicts. Managers should make it be an ongoing and
timely process instead of one-time vendor organized training several months before
the BI solution is integrated into daily business utilization. A good practice of assigning
a key user that maintains the training process and user involvement is suggested to be
implemented by the organizations.
Ethical and legal issues are challenges that managers need to be aware of and track
closely especially in global companies, where the operating environments, rules and
regulations vary considerably. In current conditions of the global Internet access there
is more data available than during past years, which is both a challenge as well as an
opportunity depending how this data is retrieved and used by the companies. Ethical
and legal aspects concerning automation of the decision-making process and utilization
of the automatically generated recommendations and suggestions should be also
closely considered by the companies in order to avoid any legal problems in the future.
Therefore, it is suggested for the companies to evaluate the consequences of
automation of the decision-making which might influence on the business operations.
Such evaluation may be performed by means of identification of the benefits and risks
of the automation and considering “what if” scenarios (defining critical situations,
which might arise from the automation of the decision-making process).

78
6 Conclusion and analysis of the research results
The main objectives of the current research were related towards performing a
detailed overview of the evolution and current situation in the field of BI solutions (in
correspondence with the business benefits that these solutions are expected to
provide), analyzing most demanding aspects that companies face during the
implementation of the BI based on the secondary and primary research (interviews
with the senior reporting manager and customer logistics manager at a large
telecommunications company) and based on the results of the secondary research and
outcomes of the interviews, generate best practices and guidelines that can be used by
managers responsible for BI implementation in order to avoid problematic situations
during implementation.
As a result of the research process main managerial aspects of BI implementation were
identified based on the published theoretical sources. In order to illustrate the
implementation process on the real example, a case study with a large
telecommunications company was performed and the implementation process was
analyzed and assessed in terms of the planning, execution, end-users training and
problematic aspects, which occurred during implementation and recommendations for
the company were provided. Based on the theoretical overview and the case study, a
corrected BI implementation model, a combination of presented by Groh (2004) and
Martin et al. (2011), was developed (see appendix 3). Additionally, recommendations
concerning organization of the information flow, employees training, identification and
prevention of legal and ethical issues were generated.
As mentioned in chapter 1.1, main limitations of the current research refer to the data
accuracy problems of the second data sources used for the theoretical overview as well
as to the scope of the research. Thus, information collected during the case study
limits the possibility to outline general recommendations for the large organizations
regarding implementation process due to the fact that only two interviews in one case
company were performed. In order to increase the accuracy of the general
recommendations, further research can be undertaken and several case studies should
be considered. This will give the possibility to compare practices in different
organizations between each other as well as with already published cases and make

79
conclusions concerning similarities and differences of their BI implementation process.
Moreover, for further research it is suggested to compare companies operating in
different industries and knowledge domains in order to identify whether there are any
specifics, which can be attributed to various industries. Moreover, it is suggested to
consider organizations of different scale – SMEs in addition to the large companies in
order to compare the implementation process and define what kind of aspects in BI
implementation are more important for organizations depending on their size. For
example, as mentioned in the previous chapters of the current work, smaller
companies are more likely to have “green field” situations of the BI implementation
and tend to cooperate with the BI vendors more (as opposed to the larger
organizations), since they do not possess enough skills and resources in order to carry
out the BI implementation process internally.
For possible further research it is suggested to use an unstructured interview as the
research method in order to achieve the free-flow discussion, as a result of which
additional information can be revealed and managerial aspects of the BI
implementation that were not addressed in the current work can be identified.
Additionally, for the further research it is suggested to involve BI vendor companies in
order to obtain a different perspective of the implementation process and confront it
with the perspective of the organizations, which implement the BI solutions in their
operations. In this way a complete picture of the implementation process can be
achieved. Moreover, further research might consider in more details all managerial
aspects mentioned in the current work.

80
Bibliography and references
Biere, M. 2003. Business Intelligence for the Enterprise. New Jersey: Pearson
Education Ltd.
Taylor, J., Raden, N., 2007. Smart (Enough) Systems. How to Deliver Competitive
Advantage by Automating Hidden Decisions. Boston: Pearson Education Ltd.
Turban, E., Shadra, D.D., King D., 2011. Business Intelligence. A managerial approach.
2d Ed. New Jersey: Pearson Education Ltd.
Turban, E., Volonino, L., 2010. Information Technology for Management. Transforming
Organizations in the Digital Economy. 7th Ed. John Wiley & Sons (Asia) Pte Ltd.
Business Dictionary, 2012. Structured interview [Online] Available at
< http://www.businessdictionary.com/definition/structured-interview.html> Accessed
21.04.2012
Business Intelligence Toolbox, 2011. Reporting tools [Online] Available at
<http://www.businessintelligencetoolbox.com/reporting-tools.htm> Accessed
15.01.2012
Chaudhuri, S.m Dayal, U., 2011. An Overview of the BI Technology [Online]
Communications of the ACM, Vol. 54, # 8. Available at
<http://cacm.acm.org/magazines/2011/8/114953-an-overview-of-business-
intelligence-technology/fulltext> Accessed 12.01.2012
Computerworld, 2006. How Companies are Implementing Business Intelligence
Competency Centers (BICCs) [PDF]
Available at <http://www.computerworld.com/pdfs/SAS_Intel_BICC.pdf> Accessed
12.01.2012
Gibbons Paul, l., 2012. BI training too important to skip, experts say [Online]

81
Available at: <http://searchmanufacturingerp.techtarget.com/news/2240147803/BI-
training-too-important-to-skip-experts-say> Accessed 03.04.2012
Groh, T., 2004. Beyond ROI ... Justifying a Business Intelligence Initiative [Online]
Available at: <http://www.information-management.com/issues/20040101/7921-
1.html> Accessed 4.03.2012
Hopkins, M., J., 2007. How to Justify an IT Project With Uncertain Returns (And Still
Make Your CFO Happy) [Online] Available at: <http://www.cio.com/article/132452/
How_to_Justify_an_IT_Project_With_Uncertain_Returns_And_Still_Make_Your_CFO_H
appy_> Accessed 29.03.2012
Howson, C., 2008. Your Business Intelligence Vendor – A Partner or Problem? [Online]
Available at: <http://www.b-eye-network.com/view/7954> Accessed 02.04.2012
IBM, 2012. Cognos Business Intelligence [Online] Available at < http://www-
01.ibm.com/software/analytics/cognos/business-intelligence/capabilities.html>
Accessed 20.02.2012
Martin A., Jekel, R., 2011. Better Decision Making with Proper Business Intelligence
[PDF] Available at <http://www.atkearney.com/images/global/pdf/Better_Decision
_Making_with_Proper_Business_Intelligence.pdf> Accessed 13.01.2012
Microsoft, 2012. Business Intelligence [Online] Available at
<http://www.microsoft.com/en-us/bi/default.aspx> Accessed 20.02.2012
MicroStrategy, 2012. Business intelligence Software [Online] Available at
<http://www.microstrategy.com/Software/businessintelligence/index.asp> Accessed
17.02.2012
Olszak, C., Ziemba, E., 2007. Approach to Building and Implementing Business
Intelligence Systems [Online] Available at: <http://www.ijikm.org/Volume2/
IJIKMv2p135-148Olszak184.pdf> Accessed 27.02.2012

82
Oracle, 2012. Oracle Business Intelligence Solutions [Online] Available at
<http://www.oracle.com/us/solutions/ent-performance-bi/business-
intelligence/index.html> Accessed 20.02.2012
SAP, 2012. Business Intelligence – BI [Online] Available at
<http://www.sap.com/solutions/business-analytics/business-intelligence.epx>
Accessed 20.02.2012
Sociology, 2011. Structured Interviews [PDF] Available at
< http://www.sociology.org.uk/methsi.pdf > Accessed 15.04.2012
Teradata, 2012. Active Enterprise Intelligence [Online] Available at
<http://www.teradata.com/active-enterprise-intelligence/> Accessed 19.02.2012

1 (4)
Appendix 1. Typical BI project outline
Table 2. BI project outline (Biere, 2003: 128)

2 (4)
Appendix 2. Case study questions
Company’s information
1. Brief information about the company:
a. name and field of operations;
b. size of the company/department/number of users utilizing BI solution;
c. interviewee’s title and role in the organization.
2. Information systems used in the organization (before and after BI implementation).
BI system’s justification and reasons to implement
3. Information about the BI solution implemented in the organization.
a. vendor and type of the system;
b. BI system’s functionality;
c. organization’s departments covered;
d. data sources used (data warehouse, ERP system etc.).
4. Which reasons lead the company in the decision to implement BI?
5. How the justification of the BI system integration was performed (cost-benefit analysis,
assessment of the intangible benefits, balanced score card with metrics for indicators
development)?
6. How the vendor selection was performed (several vendors considered)?
7. Was the implementation of the BI solution related to any changes in business
processes in the organization (e.g. less employees required for reporting tasks)?
Issues of the BI implementation stage
8. What kind of project planning activities were carried out for BI implementation?
9. Was the prototype of the system prepared?
10. In which way were the information needs for the BI system identified and data sources
evaluated?
11. How integration of the data sources was performed? Was the data warehouse
implemented in the organization? If not, then why and how the data sources were
standardized?
12. Was the data cleaning realized?
13. Was the meta data project carried out? In which way?
14. Were the corporate report standards changed before the BI implementation?

3 (4)
15. What kind of impact on the decision-making process did the implemented BI solution
make?
16. How was the employees’ training carried out? What are the most active users of the
system?
17. Are there any legal issues associated with the work of the BI system in the
organization (e.g. promotions are sent to the customers based on the age or gender
which may lead to some extent of the discrimination)?
18. What kind of ethical issues are associated with the decision-making process which is
based on the information and suggestions provided by the BI system?
19. Based on your experience, please, identify main reasons of the failure of the BI
projects:
a. failure to recognize BI projects as organization-wide projects;
b. lack of business sponsors with the ability to ensure funding;
c. lack of cooperation by business representatives from functional areas;
d. lack of qualified and available staff;
e. no appreciation of the negative impact of the “dirty data” on business
profitability;
f. too much reliance on vendors (Turban et al., 2011).

4 (4)
Appedix 3. BI implementation process
Identify the need for BI
implementation / set goals
Collect functional
requirements
Create a BI solution
proposal (including
implement. action plan)
Perform cost / benefit
analysis and calculate ROI
Feasible?
Define technical feasibility
Define benefits vs.
changes to business
processes
Choose BI architecture
Approve a BI solution,
develop an implementation
plan and assign a team
Create a prototype
1
1
Initiate end-users training
for the prototype
Collect the feedback about
prototype from end-users
Problems?
Additional functionality?
Yes
No
Yes
No
Create & present a case
study / “lessons learnt”
Assign a key-user
Start the project
File the project
Assign a permanent
support team
No
1) End-users / field experts
2) High level management
End-users / field experts
1) End-users / field experts
2) BI implementation team
BI implementation team
BI implementation team
1) End-users / field experts
2) BI implementation team
1) End-users / field experts
2) BI implementation team
1) End-users / field experts
2) BI implementation team
3) High level management
1) End-users / field experts
2) BI implementation team
1) End-users / field experts
2) BI implementation team
1) End-users / field experts
2) BI implementation team
BI implementation team
1) End-users / field experts
2) BI implementation team
3) High level management