Embed Size (px)
Citation preview
Book Information Page
Highlights of 9e:
Former Irwin/McGraw Hill title recently revised
Updated by Jeff Williams, U of Michigan
Williams builds on the book’s popular business orientation
Tightly integrated pedagogy and supplements
Student prices start at $27
Students select one of 4 textbook options | prices
For the Instructor: Instructor’s Resource Guide Large Bank of Test Items Computerized Test Bank Numerous PowerPoint Slides Solutions Manual Choice of review copy format
For Students: Price options and media options Study Guide Lecture Guide Practice Tests (self-scoring) e-Flash Cards Working papers
Background: The Hermanson Series went through many editions with Business Publications, Inc. an imprint of Richard D. Irwin Publishers and was among the companies best sellers, reaching sales of 60,000 units at its peak. After Irwin’s titles were sold to McGraw, the new owner dropped the project to avoid cannibalizing their native product. The authors brought the book to Text-book Media and then we published 8e back in 2007. (See list of adopting schools on page 3.) With 9e, we’re excited to bring Jeff Williams on to the project as a new co-author. And we’re proud to offer the market a worthy alternative to traditional (and overpriced) accounting textbooks from the oligopoly.
Brief Description: Thoroughly updated in 2011, 10e builds on the strengths of previous editions written by these well-known au-thors and continues to provide a thorough understanding of how to use accounting information to analyze business performance and make business decisions. Uses real companies to illustrate many of the accounting concepts, and covers a variety of issues as-sociated with these actual businesses to provide a real-world perspective. Combines solid coverage of managerial accounting for business students, regardless of the selected major, and provides non-accounting majors a solid foundation for making effective use of accounting information.
Student prices
start at $27!
Managerial Accounting: A Business Perspective 9e
Roger H. Hermanson
Georgia State University (Emeritus)
James Don Edwards
University of Georgia (Emeritus)
Susan D. Hermanson
U of North Carolina at Wilmington
Jefferson Williams
University of Michigan
Brief Table of Contents:
About the Authors:
Roger H. Hermanson is Regents Professor Emeritus of Accounting and Ernst & Young–J. W. Holloway Memorial Professor Emeritus at Georgia State Uni-versity. Roger’s Ph.D. is from Michigan State University. Professor Hermanson has authored or coauthored approximately 100 articles for professional and scholarly journals and has coauthored numerous editions of several textbooks, including Accounting Principles, Financial Accounting, Survey of Finan-cial and Managerial Accounting, Auditing Theory and Practice, and Principles of Financial and Managerial Accounting. He has served on the editorial boards of four journals in the field of accounting. Professor Hermanson has received numerous awards, including Accounting Educator of the Year by the Georgia Society of CPAs in 1990.
James Don Edwards is the J. M. Tull Professor Emeritus of Accounting in the Terry College of Business at the University of Georgia; M.B.A. University of Denver, Ph.D. University of Texas. Professor Edwards is a past president of the American Accounting Association. He has served as a professor and chair-man of the Department of Accounting and Financial Administration at Michigan State University, a professor and dean of the Graduate School of Business Administration at the University of Minnesota, and a Visiting Scholar at Oxford University. The Academy of Accounting Historians awarded him the 1994 Hourglass Award, the highest international honor in the field of Accounting History. He was inducted into the Ohio State University Accounting Hall of Fame in 2001. He has coauthored numerous editions of several textbooks including Accounting Principles, Financial Accounting, and Managerial Ac-counting.
Jefferson Williams has taught accounting courses at the Ross School of Business, University of Michigan, since 1994. He teaches financial accounting at the undergraduate and at the graduate levels. Mr. Williams also teaches federal taxation at the graduate level. Prior to his teaching career, Mr. Williams worked as a CPA in the states of Tennessee and South Carolina. His practice focused on audit and assurance services and valuation services. At present, he is licensed as CPA in Tennessee.
Brief Table of Contents:
About the Authors:
Roger H. Hermanson is Regents Professor Emeritus of Accounting and Ernst & Young–J. W. Holloway Memorial Professor Emeritus at Georgia State University. Roger’s Ph.D. is from Michigan State University. Professor Hermanson has authored or coauthored approximately 100 articles for professional and scholarly journals and has coauthored numerous editions of several textbooks, including Accounting Principles, Financial Accounting, Survey of Financial and Managerial Accounting, Auditing Theory and Practice, and Principles of Financial and Managerial Ac-counting. He has served on the editorial boards of four journals in the field of accounting. Professor Hermanson has received numerous awards, including Accounting Educator of the Year by the Georgia Society of CPAs in 1990.
James Don Edwards is the J. M. Tull Professor Emeritus of Accounting in the Terry College of Business at the University of Georgia; M.B.A. Uni-versity of Denver, Ph.D. University of Texas. Professor Edwards is a past president of the American Accounting Association. He has served as a professor and chairman of the Department of Accounting and Financial Administration at Michigan State University, a professor and dean of the Graduate School of Business Administration at the University of Minnesota, and a Visiting Scholar at Oxford University. The Academy of Ac-counting Historians awarded him the 1994 Hourglass Award, the highest international honor in the field of Accounting History. He was inducted into the Ohio State University Accounting Hall of Fame in 2001. He has coauthored numerous editions of several textbooks including Accounting Principles, Financial Accounting, and Managerial Accounting.
Susan Hermanson received her BBA in Accounting from the University of Georgia (1988) and her PhD in Accounting from Texas A&M University (1994). Prior to joining the CSB faculty, Dr. Hermanson was a faculty member at the University of Tampa, and the University of Nevada – Las Vegas. Dr. Hermanson worked in the field of public accounting for the firms of Deloitte Haskins and Sells and Arthur Andersen prior to pursuing her PhD. Her teaching/research interests are in the areas of Financial Accounting and Auditing. She holds the rank of Professor of Accounting, and is a Dixon Hughes Faculty Fellow in Accounting at UNCW.
Jefferson Williams has taught accounting courses at the Ross School of Business, University of Michigan, since 1994. He teaches financial ac-counting at the undergraduate and at the graduate levels. Mr. Williams also teaches federal taxation at the graduate level. Prior to his teaching career, Mr. Williams worked as a CPA in the states of Tennessee and South Carolina. His practice focused on audit and assurance services and valuation services. At present, he is licensed as CPA in Tennessee.
Part I The Managerial Environment
1 An Introduction to Managerial Accounting
PART II Product Costing
2 Managerial Accounting Concepts/Job Costing
3 Process Cost Systems
4 Using Accounting for Quality and Cost- Management
PART III Using Cost
Information for Decision-Making
5 Cost-Volume-Profit Analysis
6 Short-Term Decision Making: Differential Analysis
PART IV Planning and Control
7 Budgeting for Planning and Control
8 Control Through Standard Costs
9 Responsibility Accounting: Segmental Analysis
10 Capital Budgeting: Long-Range Planning
PART V Analysis of Financial Statements: Using the
Statement of Cash Flows
11 Analysis Using the Statement of Cash Flows
12 Analysis and Interpretation of Financial Statements
Check Figures
Annual Report Appendix: The Limited, Inc.
Appendix: Compound Interest and Annuity Tables
New Terms Index
Subject Matter Index
Review Copies:
We’ll send PDF review copy.* Then, if you like what you see and want to seriously consider Williams et al
for adoption, and need to see print version, we’ll be happy
to provide a printed desk copy.
3 FAQ’s
I’ve never heard of Textbook Media...who are you guys?
We’re a Midwest –based publisher who’s been in business since 2004. The publishers who founded the business have been in
college publishing since 1980 and have published textbooks for Irwin, McGraw Hill, Houghton Mifflin and Cengage Publishing. Our
Textbook Media titles are in use in over 200 colleges (2 and 4 YR) and universities.
What media options do students typically choose?
In 2015, 60% selected one of the print/online options. 40% selected a digital version only. We provide the online version with all
our textbook options for two reasons: students always have the option of getting online to study, and to provide access for all in
case they want to opt for interactive quizzing/e-flash card upgrade.
Do I have to do anything differently to assign your textbook?
Yes. One thing: direct students to our URL (preferably in your syllabus). We’ll take it from there. Actually, the web site takes it
from there: over 97% of students order without needing customer service. Those that do need help get it within 24 hours, and
most of those inquiries are about corrections they want to make to their order. BTW, we deliver the paperbacks via Fed-Ex, so stu-
dent orders are easily tracked. And we will work with bookstores if need be. Regarding the online book: It is served up using Sil-
verlight, a Microsoft product that’s a commonly-used rich media application used by companies like Netflix. Most of your students
may already have it. If not, it’s a free and fast download from Microsoft. The software behind the book is supported by Microsoft;
the online book experience is supported by our customer service staff. Pretty straightforward and easy for all concerned.
Recent (Textbook Media) Adoptions of Hermanson-Edwards Series:
American Public University Assumption College Austin Community College Bates Technical College Boston University Brigham Young University-Provo Cabrillo College Clemson University Coker College College of San Mateo Colorado State University Dominican College of Blauvelt Florida Gulf Coast University Florida Memorial University Frostburg State University Georgia Institute of Technology
Graceland University Johnson State College Kenai Peninsula College Kent State U Keystone College La Roche College Lakeshore Tech College Lord Fairfax Community College Michigan State University Mount St. Mary's College Mount St. Mary's College North Carolina State Univ at Raleigh Northern Michigan University Ohio University – Lancaster Principia College Purdue University
St. Gregory's University St. Lawrence University SUNY-Albany Syracuse University Tarrant County Community College Texas A & M University-Texarkana The Citadel University of Colorado - Denver University of Colorado – Denver University of Michigan University of North Carolina-Pembroke University of the Pacific University of Wisconsin – Stout William Jessup University Worcester Polytechnic Institute Wright Career College, Tulsa
www.textbookmediapress.com
Instructor Supplements
Instructor’s Resource Guide
1300+ Test Items
Computerized Test Bank
300+ PowerPoint Slides
Solutions Manual
Choice of review copy format
Student Supplements Price options and media options
Study Guide
Lecture Guide
Working papers
Made in the USA
www.textbookmedia.com
ISBN: 1930789033
6767676767
This chapter continues the discussion of cost accumulation systems. In Chapter 2,we explained and illustrated job costing. The job cost system (job costing)accumulates costs incurred to produce a product according to individual jobs. Forexample, construction companies use job costing to keep track of the costs of eachconstruction job.
This chapter discusses another cost accumulation system, process costing.The chapter begins with a discussion of the nature of a process cost system. Wereview the similarities and differences between job costing and process costing.We also present an extended illustration of process costing that includes adiscussion of equivalent units of production and the production cost report. In thechapter appendixes, we discuss and illustrate FIFO process costing and theallocation of joint product costs.
Nature of a Process Cost System
Many businesses produce large quantities of a single product or similar products.Pepsi-Cola makes soft drinks, Exxon Mobil produces oil, and Kellogg Companyproduces breakfast cereals on a continuous basis over long periods. For thesekinds of products, companies do not have separate jobs. Instead, production is anongoing process.
A process cost system (process costing) accumulates costs incurred toproduce a product according to the processes or departments a product goes throughon its way to completion. Companies making paint, gasoline, steel, rubber, plastic,and similar products use process costing. In these types of operations, accountantsmust accumulate costs for each process or department involved in making theproduct. Accountants compute the cost per unit by first accumulating costs for the
ProcessProcessProcessProcessProcessCost SystemsCost SystemsCost SystemsCost SystemsCost Systems
Learning Objectives
After studying this chapter,you should be able to:
1.1.1.1.1. Describe the types ofoperations that requirea process cost system.
2.2.2.2.2. Distinguish betweenprocess and jobcosting systems.
3.3.3.3.3. Discuss the concept ofequivalent units in aprocess cost system.
4.4.4.4.4. Compute equivalentunits of production andunit costs under theaverage costprocedure.
5.5.5.5.5. Prepare a productioncost report for aprocess cost systemand discuss itsrelationship to theWork in ProcessInventory account.
(continued)
6868686868 PART II Product Costing
Objectives
6.6.6.6.6. Distinguishbetween normaland abnormalspoilage.
7.7.7.7.7. Compute equivalentunits of productionand unit costsunder the first-infirst-out (FIFO)system(Appendix 3–A).
8.8.8.8.8. Discuss how jointcosts are allocatedto joint products(Appendix 3–B).
entire period (usually a month) for each process or department. Second, they divide theaccumulated costs by the number of units produced (tons, pounds, gallons, or feet) inthat process or department.
In “A Broader Perspective” on page 71, we describe production in bottling andcanning plants that use a process cost system.Job costing and process costing have important similarities:
1. Both job and process cost systems have the same goal: to determine the cost ofproducts.
2. Both job and process cost systems have the same cost flows. Accountants recordproduction in separate accounts for materials inventory, labor, and overhead. Then,they transfer the costs to a Work in Process Inventory account.
3. Both job and process cost systems use predetermined overhead rates (defined inChapter 2) to apply overhead.
Job costing and process costing systems also have their significant differences:
1. Types of products produced. Companies that use job costing work on manydifferent jobs with different production requirements during each period.Companies that use process costing produce a single product, either on acontinuous basis or for long periods. All the products that the companyproduces under process costing are the same.
2. Cost accumulation procedures. Job costing accumulates costs by individual jobs.Process costing accumulates costs by process or department.
3. Work in Process Inventory accounts. Job cost systems have one Work in ProcessInventory account for each job. Process cost systems have a Work in ProcessInventory account for each department or process.
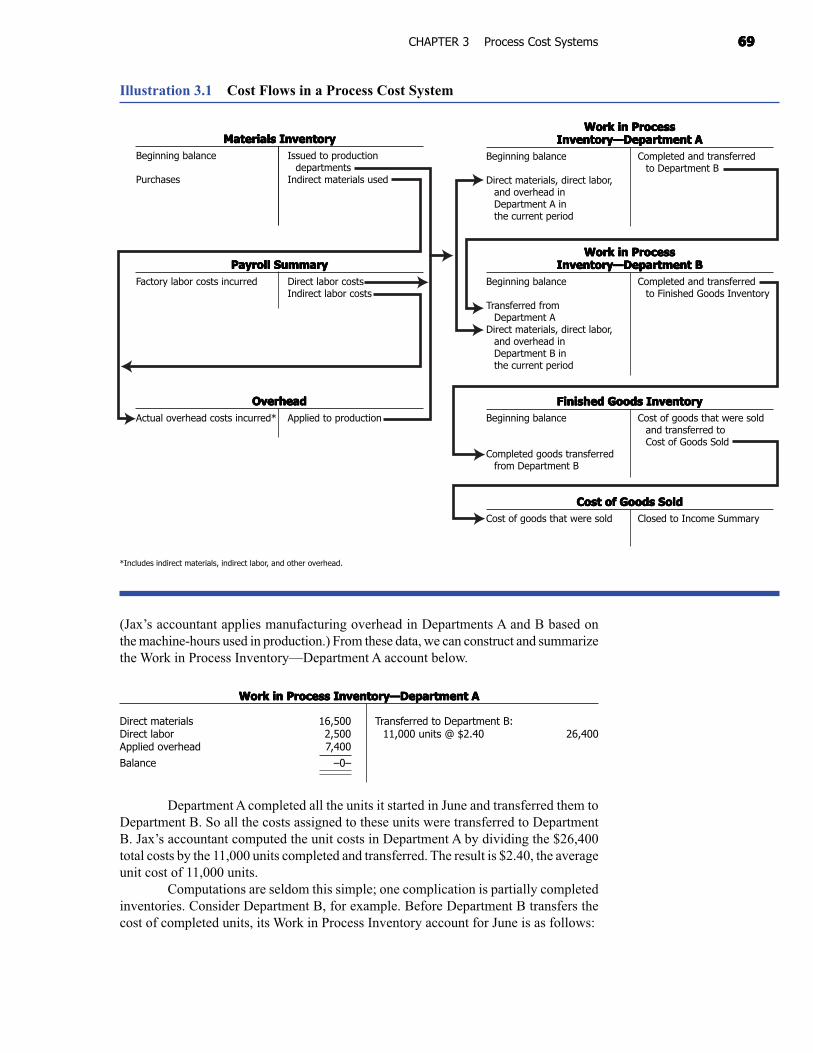
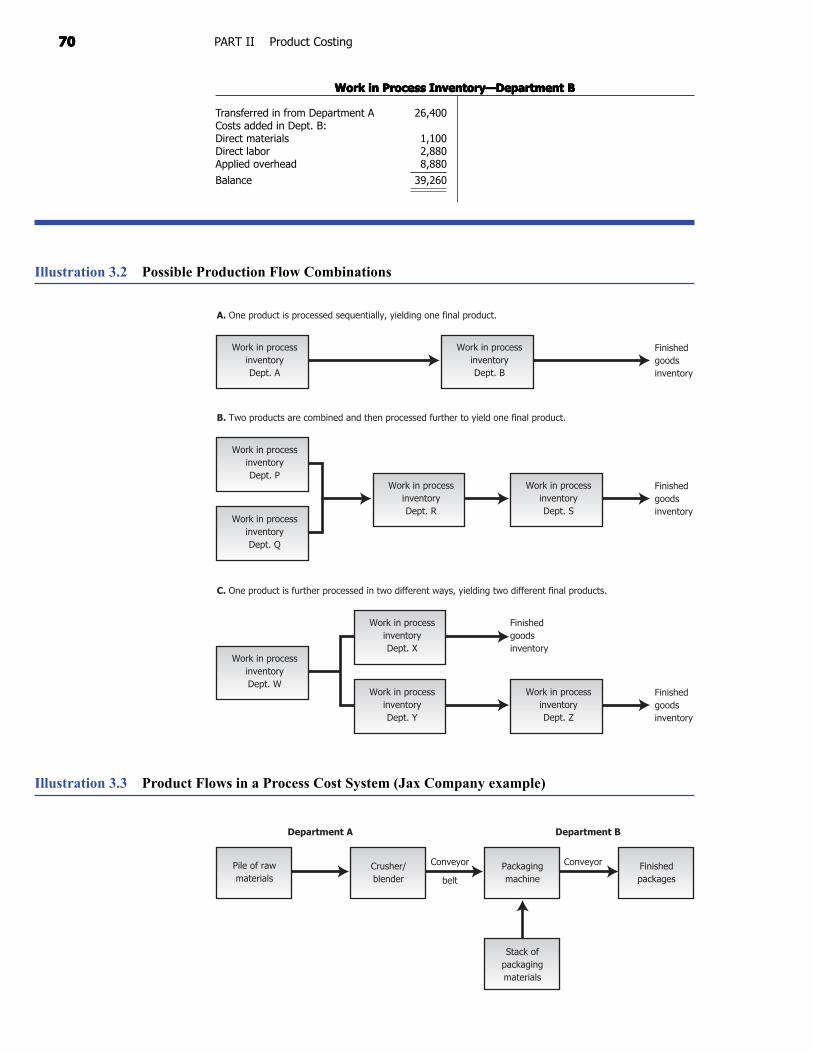
Illustration 3.1 shows the cost flows in a process cost system that processes theproducts in a specified sequential order. That is, the production and processing of productsbegin in Department A. From Department A, products go to Department B. DepartmentB inputs direct materials and further processes the products. Then Department B transfersthe products to Finished Goods Inventory. For illustration purposes, we assume that allthe process cost systems in this chapter are sequential. There are many production flowcombinations; Illustration 3.2 on page 70 represents three possible production flowcombinations.
Process Costing Illustration
Assume that Jax Company manufactures and sells a chemical product used to cleankitchen counters and sinks. The company processes the product in two departments.Department A crushes powders and blends the basic materials. Department B packagesthe product and transfers it to finished goods. Illustration 3.3 on page 70 shows thismanufacturing process.
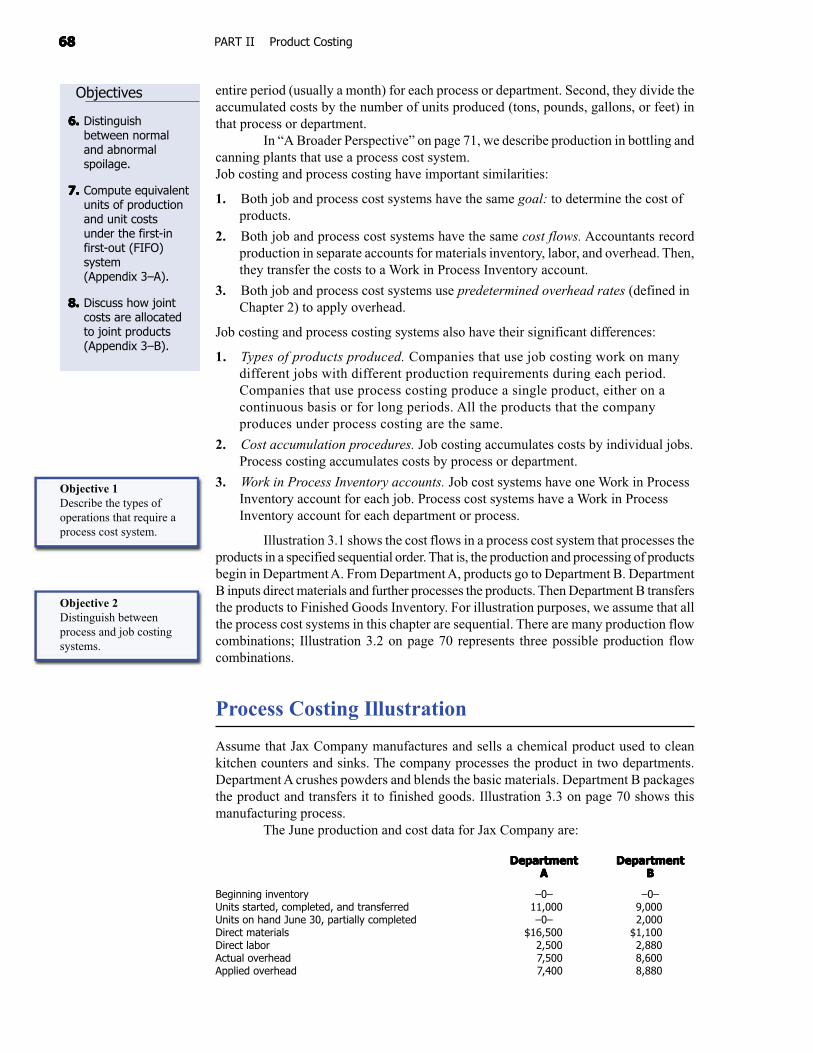
The June production and cost data for Jax Company are:
DepartmentDepartmentDepartmentDepartmentDepartment DepartmentDepartmentDepartmentDepartmentDepartmentAAAAA BBBBB
Beginning inventory –0– –0–Units started, completed, and transferred 11,000 9,000Units on hand June 30, partially completed –0– 2,000Direct materials $16,500 $1,100Direct labor 2,500 2,880Actual overhead 7,500 8,600Applied overhead 7,400 8,880
Objective 1Describe the types ofoperations that require aprocess cost system.
Objective 2Distinguish betweenprocess and job costingsystems.
6969696969CHAPTER 3 Process Cost Systems
Illustration 3.1 Cost Flows in a Process Cost System
*Includes indirect materials, indirect labor, and other overhead.
(Jax’s accountant applies manufacturing overhead in Departments A and B based onthe machine-hours used in production.) From these data, we can construct and summarizethe Work in Process Inventory—Department A account below.
Work in Process Inventory—Department AWork in Process Inventory—Department AWork in Process Inventory—Department AWork in Process Inventory—Department AWork in Process Inventory—Department A
Direct materials 16,500 Transferred to Department B:Direct labor 2,500 11,000 units @ $2.40 26,400Applied overhead 7,400
Balance –0–
Department A completed all the units it started in June and transferred them toDepartment B. So all the costs assigned to these units were transferred to DepartmentB. Jax’s accountant computed the unit costs in Department A by dividing the $26,400total costs by the 11,000 units completed and transferred. The result is $2.40, the averageunit cost of 11,000 units.
Computations are seldom this simple; one complication is partially completedinventories. Consider Department B, for example. Before Department B transfers thecost of completed units, its Work in Process Inventory account for June is as follows:
Materials InventoryMaterials InventoryMaterials InventoryMaterials InventoryMaterials InventoryBeginning balance Issued to production
departmentsPurchases Indirect materials used
Payroll SummaryPayroll SummaryPayroll SummaryPayroll SummaryPayroll SummaryFactory labor costs incurred Direct labor costs
Indirect labor costs
OverheadOverheadOverheadOverheadOverheadActual overhead costs incurred* Applied to production
Work in ProcessWork in ProcessWork in ProcessWork in ProcessWork in ProcessInventory—Department AInventory—Department AInventory—Department AInventory—Department AInventory—Department A
Beginning balance Completed and transferredto Department B
Direct materials, direct labor,and overhead inDepartment A inthe current period
Work in ProcessWork in ProcessWork in ProcessWork in ProcessWork in ProcessInventory—Department BInventory—Department BInventory—Department BInventory—Department BInventory—Department B
Beginning balance Completed and transferredto Finished Goods Inventory
Transferred fromDepartment A
Direct materials, direct labor,and overhead inDepartment B inthe current period
Finished Goods InventoryFinished Goods InventoryFinished Goods InventoryFinished Goods InventoryFinished Goods InventoryBeginning balance Cost of goods that were sold
and transferred toCost of Goods Sold
Completed goods transferredfrom Department B
Cost of Goods SoldCost of Goods SoldCost of Goods SoldCost of Goods SoldCost of Goods SoldCost of goods that were sold Closed to Income Summary
7070707070 PART II Product Costing
Illustration 3.2 Possible Production Flow Combinations
Illustration 3.3 Product Flows in a Process Cost System (Jax Company example)
Department A Department B
Finishedpackages
Packagingmachine
Crusher/blender
Pile of rawmaterials
Stack ofpackagingmaterials
Conveyor
belt
Conveyor
A. One product is processed sequentially, yielding one final product.
Work in processinventoryDept. A
Work in processinventoryDept. B
Finishedgoodsinventory
B. Two products are combined and then processed further to yield one final product.
Work in processinventoryDept. P
Work in processinventoryDept. Q
Work in processinventoryDept. R
Work in processinventoryDept. S
Finishedgoodsinventory
C. One product is further processed in two different ways, yielding two different final products.
Work in processinventoryDept. X
Work in processinventoryDept. Y
Work in processinventoryDept. W
Work in processinventoryDept. Z
Finishedgoodsinventory
Finishedgoodsinventory
Work in Process Inventory—Department BWork in Process Inventory—Department BWork in Process Inventory—Department BWork in Process Inventory—Department BWork in Process Inventory—Department B
Transferred in from Department A 26,400Costs added in Dept. B:Direct materials 1,100Direct labor 2,880Applied overhead 8,880
Balance 39,260
7171717171CHAPTER 3 Process Cost Systems
How was the Diet Coke® I just finished drinking produced? A Coca-Cola bottling plantpurchased cola syrup or a concentrate from The Coca-Cola Company, combined it withcarbonated water, put it in cans, and sealed the cans. (Although these plants are usuallycalled bottling plants, they also produce cans of Coke®.)
In a bottling plant, the first process combines the syrup or concentrate withcarbonated water to make cola. In a second process, empty cans are rinsed and inspected.A third process combines these two materials by pouring the cola into the cans. Next,tops are placed on the cans. Finally, the cans are combined into packages. This completesthe work in process stage.
The product enters finished goods inventory when it is sent to the warehouse.The product becomes cost of goods sold to the bottling plants when it is shipped todistributors or retail outlets.Source: Based on the authors’ research and documents provided by The Coca-Cola Company. Coca-Cola,Diet Coke, and Coke are registered trademarks of The Coca-Cola Company.
A BroaderA BroaderA BroaderA BroaderA BroaderPerspectivePerspectivePerspectivePerspectivePerspective
Producing CansProducing CansProducing CansProducing CansProducing Cansof Coca-Colaof Coca-Colaof Coca-Colaof Coca-Colaof Coca-Cola®®®®®
Recall that direct materials, direct labor, and applied overhead are productcosts; that is, the costs attach to the product. Thus, Transferred in from Department A inthe T-account represents the direct materials, direct labor, and applied overhead costsassigned to products in Department A. These costs have followed the physical units toDepartment B.
Now, Jax’s accountant must divide the $39,260 total costs charged to DepartmentB in June between the units transferred out and those remaining on hand in the department.The accountant cannot divide $39,260 by 11,000 units to get an average unit cost becausethe 11,000 units are not alike. Department B has 9,000 finished units and has 2,000 partiallyfinished units. To solve this problem, the accountant uses the concept of equivalent units ofproduction, which we discuss next.
Essentially, the concept of equivalent units involves expressing a given number ofpartially completed units as a smaller number of fully completed units. For example, ifwe bring 1,000 units to a 40% state of completion, this is equivalent to 400 units thatare 100% complete. Accountants base this concept on the supposition that a companymust incur approximately the same amount of costs to bring 1,000 units to a 40% levelof completion as it would to complete 400 units.
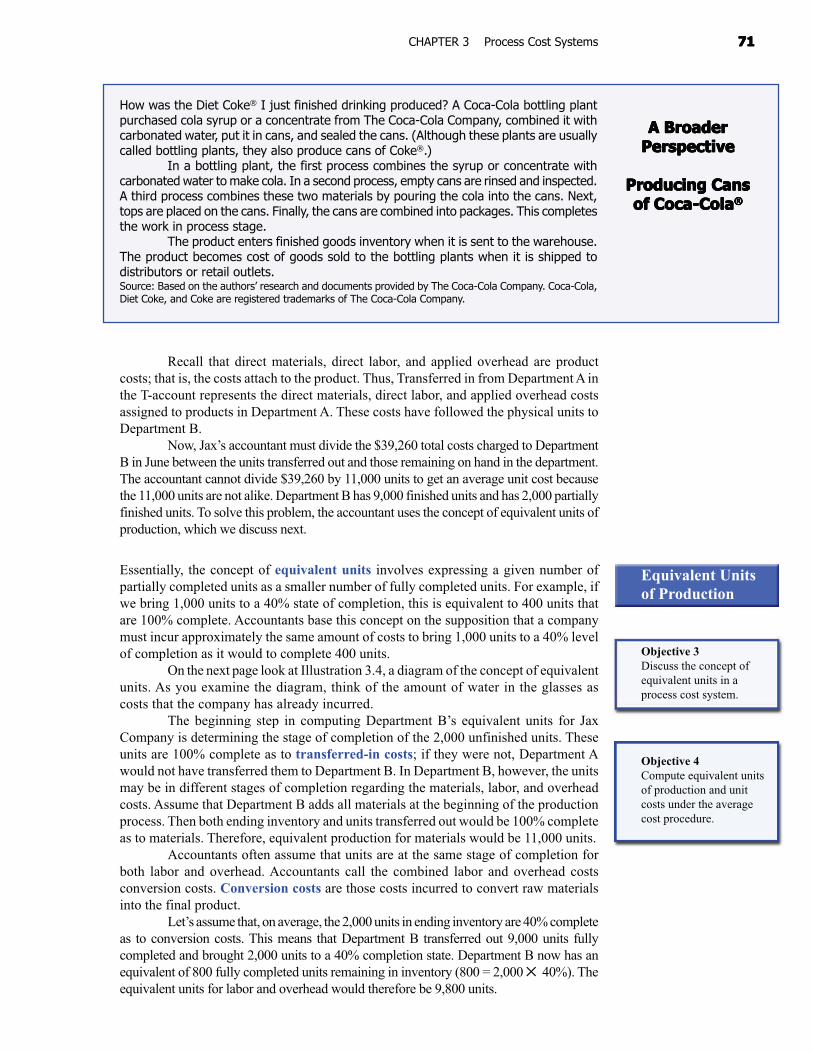
On the next page look at Illustration 3.4, a diagram of the concept of equivalentunits. As you examine the diagram, think of the amount of water in the glasses ascosts that the company has already incurred.
The beginning step in computing Department B’s equivalent units for JaxCompany is determining the stage of completion of the 2,000 unfinished units. Theseunits are 100% complete as to transferred-in costs; if they were not, Department Awould not have transferred them to Department B. In Department B, however, the unitsmay be in different stages of completion regarding the materials, labor, and overheadcosts. Assume that Department B adds all materials at the beginning of the productionprocess. Then both ending inventory and units transferred out would be 100% completeas to materials. Therefore, equivalent production for materials would be 11,000 units.
Accountants often assume that units are at the same stage of completion forboth labor and overhead. Accountants call the combined labor and overhead costsconversion costs. Conversion costs are those costs incurred to convert raw materialsinto the final product.
Let’s assume that, on average, the 2,000 units in ending inventory are 40% completeas to conversion costs. This means that Department B transferred out 9,000 units fullycompleted and brought 2,000 units to a 40% completion state. Department B now has anequivalent of 800 fully completed units remaining in inventory (800 = 2,000 ✕ 40%). Theequivalent units for labor and overhead would therefore be 9,800 units.
Equivalent Unitsof Production
Objective 3Discuss the concept ofequivalent units in aprocess cost system.
Objective 4Compute equivalent unitsof production and unitcosts under the averagecost procedure.
7272727272 PART II Product Costing
8 glasses of water 50% full
are equivalent to 4 glasses of water 100% full
Illustration 3.4 The Concept of Equivalent Units
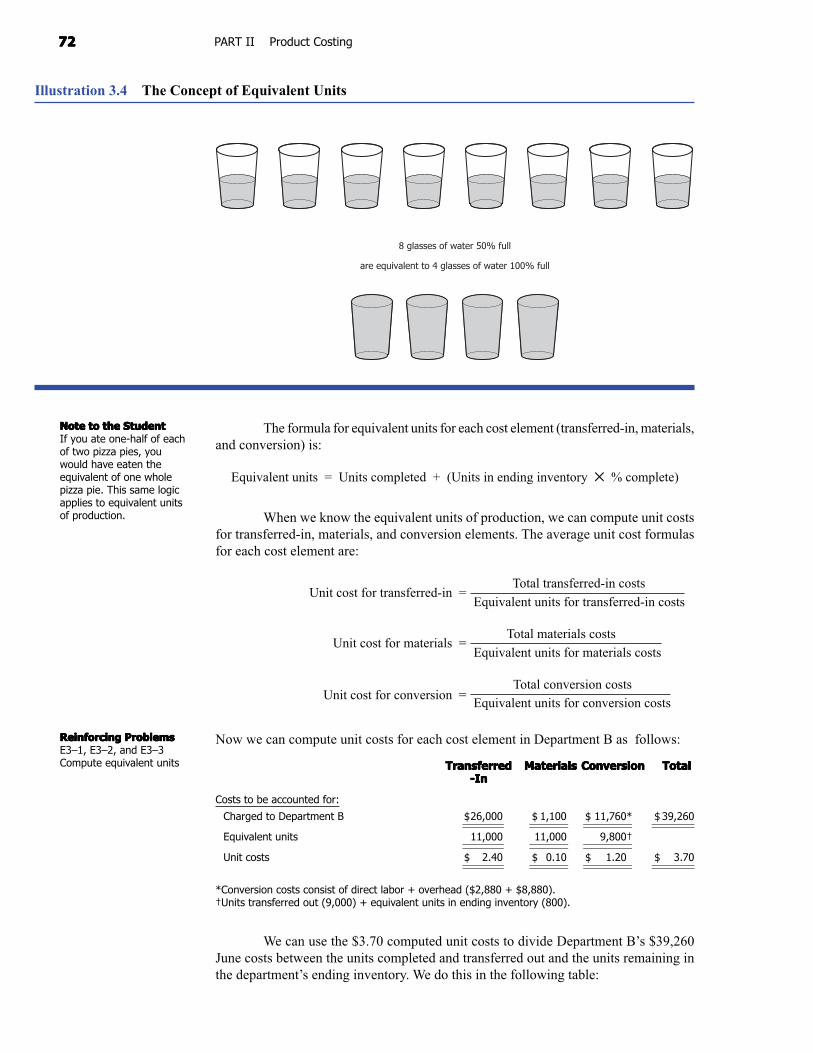
The formula for equivalent units for each cost element (transferred-in, materials,and conversion) is:
Equivalent units = Units completed + (Units in ending inventory ✕ % complete)
When we know the equivalent units of production, we can compute unit costsfor transferred-in, materials, and conversion elements. The average unit cost formulasfor each cost element are:
Unit cost for transferred-in = Total transferred-in costs
Equivalent units for transferred-in costs
Unit cost for materials = Total materials costsEquivalent units for materials costs
Unit cost for conversion = Total conversion costsEquivalent units for conversion costs
Now we can compute unit costs for each cost element in Department B as follows:
TransferredTransferredTransferredTransferredTransferred MaterialsMaterialsMaterialsMaterialsMaterials ConversionConversionConversionConversionConversion TotalTotalTotalTotalTotal-In-In-In-In-In
Costs to be accounted for:
Charged to Department B $26,000 $ 1,100 $ 11,760* $ 39,260
Equivalent units 11,000 11,000 9,800†
Unit costs $ 2.40 $ 0.10 $ 1.20 $ 3.70
*Conversion costs consist of direct labor + overhead ($2,880 + $8,880).†Units transferred out (9,000) + equivalent units in ending inventory (800).
We can use the $3.70 computed unit costs to divide Department B’s $39,260June costs between the units completed and transferred out and the units remaining inthe department’s ending inventory. We do this in the following table:
Note to the StudentNote to the StudentNote to the StudentNote to the StudentNote to the StudentIf you ate one-half of eachof two pizza pies, youwould have eaten theequivalent of one wholepizza pie. This same logicapplies to equivalent unitsof production.
Reinforcing ProblemsReinforcing ProblemsReinforcing ProblemsReinforcing ProblemsReinforcing ProblemsE3–1, E3–2, and E3–3Compute equivalent units
7373737373CHAPTER 3 Process Cost Systems
Reinforcing ProblemsReinforcing ProblemsReinforcing ProblemsReinforcing ProblemsReinforcing ProblemsE3–4 Compute costs ofthe units completed andtransferred outE3–5 Calculate cost perequivalent unit; determinecost of units transferred out
Journal EntryAnalysis
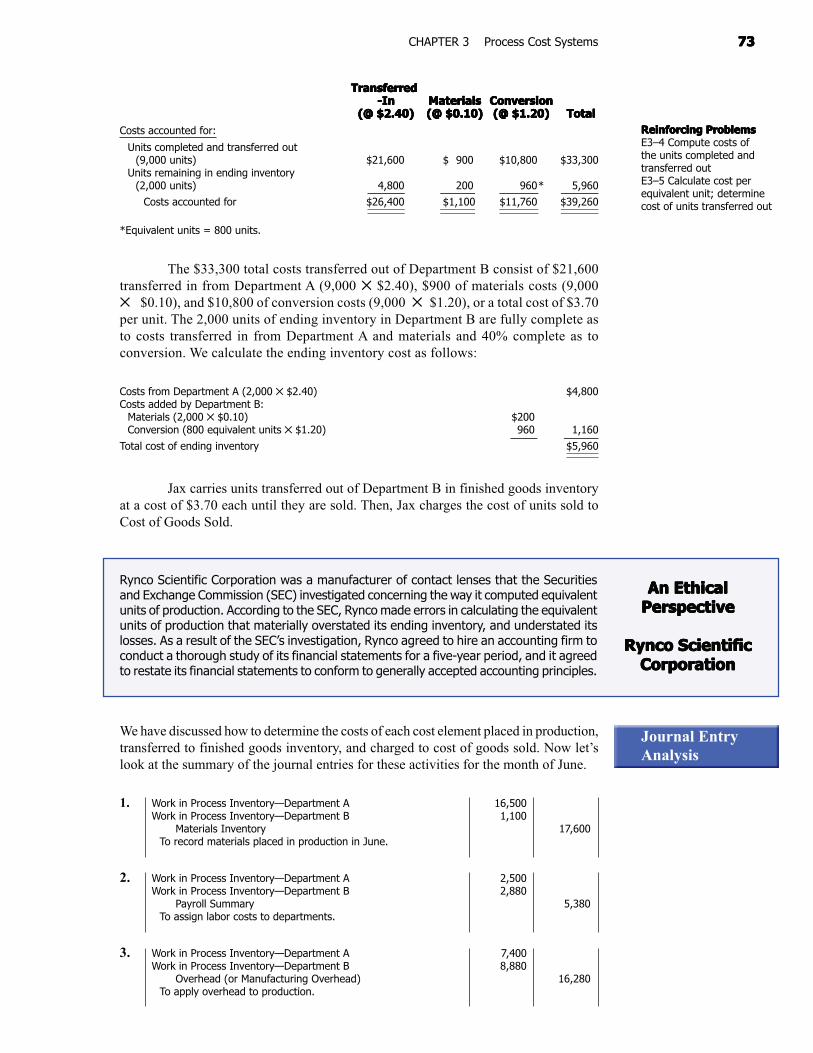
Rynco Scientific Corporation was a manufacturer of contact lenses that the Securitiesand Exchange Commission (SEC) investigated concerning the way it computed equivalentunits of production. According to the SEC, Rynco made errors in calculating the equivalentunits of production that materially overstated its ending inventory, and understated itslosses. As a result of the SEC’s investigation, Rynco agreed to hire an accounting firm toconduct a thorough study of its financial statements for a five-year period, and it agreedto restate its financial statements to conform to generally accepted accounting principles.
An EthicalAn EthicalAn EthicalAn EthicalAn EthicalPerspectivePerspectivePerspectivePerspectivePerspective
Rynco ScientificRynco ScientificRynco ScientificRynco ScientificRynco ScientificCorporationCorporationCorporationCorporationCorporation
TransferredTransferredTransferredTransferredTransferred -In -In -In -In -In MaterialsMaterialsMaterialsMaterialsMaterials ConversionConversionConversionConversionConversion
(@ $2.40) (@ $2.40) (@ $2.40) (@ $2.40) (@ $2.40) (@ $0.10)(@ $0.10)(@ $0.10)(@ $0.10)(@ $0.10) (@ $1.20)(@ $1.20)(@ $1.20)(@ $1.20)(@ $1.20) TotalTotalTotalTotalTotalCosts accounted for:
Units completed and transferred out(9,000 units) $21,600 $ 900 $10,800 $33,300
Units remaining in ending inventory(2,000 units) 4,800 200 960* 5,960
Costs accounted for $26,400 $1,100 $11,760 $39,260
*Equivalent units = 800 units.
The $33,300 total costs transferred out of Department B consist of $21,600transferred in from Department A (9,000 ✕ $2.40), $900 of materials costs (9,000✕ $0.10), and $10,800 of conversion costs (9,000 ✕ $1.20), or a total cost of $3.70per unit. The 2,000 units of ending inventory in Department B are fully complete asto costs transferred in from Department A and materials and 40% complete as toconversion. We calculate the ending inventory cost as follows:
Costs from Department A (2,000 ✕ $2.40) $4,800Costs added by Department B:
Materials (2,000 ✕ $0.10) $200Conversion (800 equivalent units ✕ $1.20) 960 1,160
Total cost of ending inventory $5,960
Jax carries units transferred out of Department B in finished goods inventoryat a cost of $3.70 each until they are sold. Then, Jax charges the cost of units sold toCost of Goods Sold.
We have discussed how to determine the costs of each cost element placed in production,transferred to finished goods inventory, and charged to cost of goods sold. Now let’slook at the summary of the journal entries for these activities for the month of June.
1. Work in Process Inventory—Department A 16,500Work in Process Inventory—Department B 1,100
Materials Inventory 17,600To record materials placed in production in June.
2. Work in Process Inventory—Department A 2,500Work in Process Inventory—Department B 2,880
Payroll Summary 5,380To assign labor costs to departments.
3. Work in Process Inventory—Department A 7,400Work in Process Inventory—Department B 8,880
Overhead (or Manufacturing Overhead) 16,280To apply overhead to production.
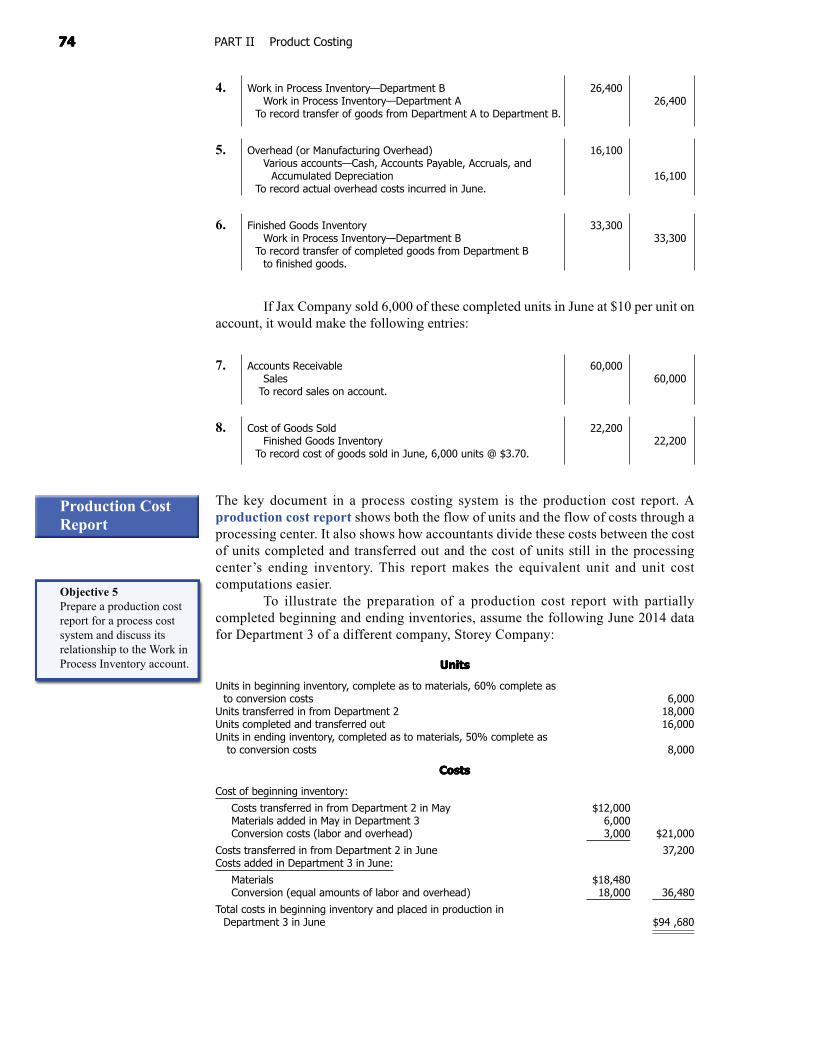
7474747474 PART II Product Costing
4. Work in Process Inventory—Department B 26,400Work in Process Inventory—Department A 26,400
To record transfer of goods from Department A to Department B.
5. Overhead (or Manufacturing Overhead) 16,100Various accounts—Cash, Accounts Payable, Accruals, and
Accumulated Depreciation 16,100To record actual overhead costs incurred in June.
6. Finished Goods Inventory 33,300Work in Process Inventory—Department B 33,300
To record transfer of completed goods from Department Bto finished goods.
If Jax Company sold 6,000 of these completed units in June at $10 per unit onaccount, it would make the following entries:
7. Accounts Receivable 60,000Sales 60,000
To record sales on account.
8. Cost of Goods Sold 22,200Finished Goods Inventory 22,200
To record cost of goods sold in June, 6,000 units @ $3.70.
The key document in a process costing system is the production cost report. Aproduction cost report shows both the flow of units and the flow of costs through aprocessing center. It also shows how accountants divide these costs between the costof units completed and transferred out and the cost of units still in the processingcenter’s ending inventory. This report makes the equivalent unit and unit costcomputations easier.
To illustrate the preparation of a production cost report with partiallycompleted beginning and ending inventories, assume the following June 2014 datafor Department 3 of a different company, Storey Company:
UnitsUnitsUnitsUnitsUnits
Units in beginning inventory, complete as to materials, 60% complete asto conversion costs 6,000
Units transferred in from Department 2 18,000Units completed and transferred out 16,000Units in ending inventory, completed as to materials, 50% complete as
to conversion costs 8,000
CostsCostsCostsCostsCosts
Cost of beginning inventory:
Costs transferred in from Department 2 in May $12,000Materials added in May in Department 3 6,000Conversion costs (labor and overhead) 3,000 $21,000
Costs transferred in from Department 2 in June 37,200Costs added in Department 3 in June:
Materials $18,480Conversion (equal amounts of labor and overhead) 18,000 36,480
Total costs in beginning inventory and placed in production inDepartment 3 in June $94 ,680
Production CostReport
Objective 5Prepare a production costreport for a process costsystem and discuss itsrelationship to the Work inProcess Inventory account.
7575757575CHAPTER 3 Process Cost Systems
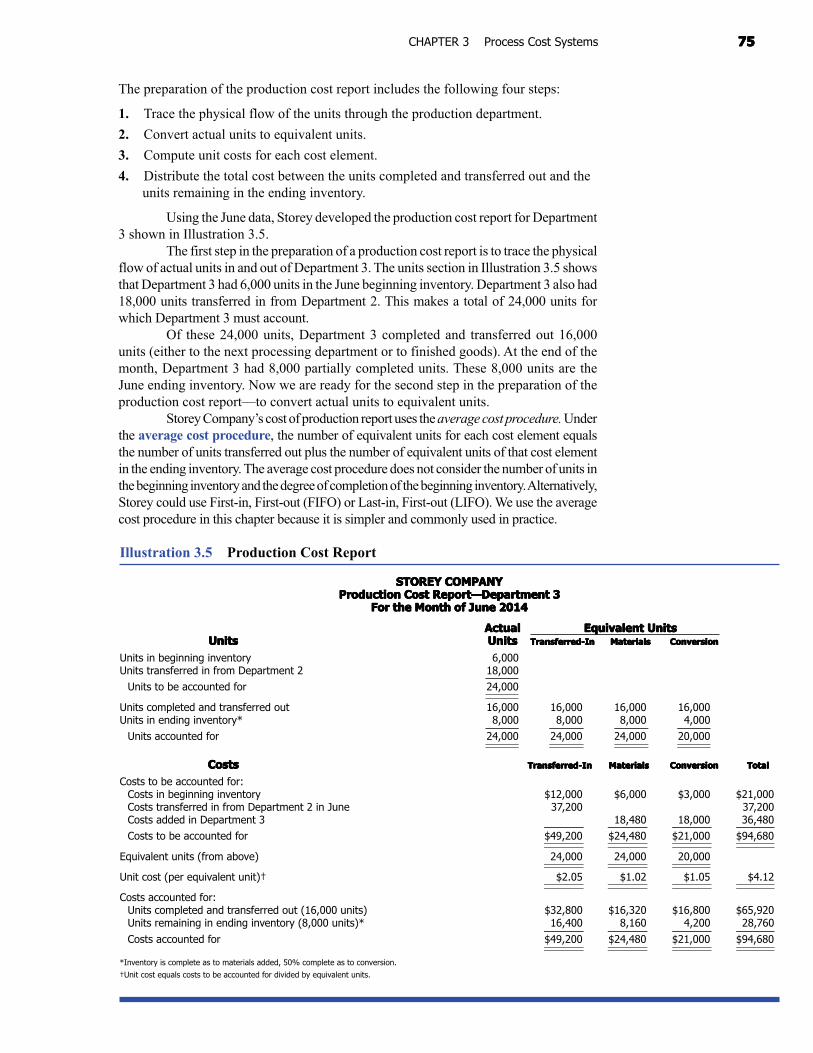
Illustration 3.5 Production Cost Report
STOREY COMPANYSTOREY COMPANYSTOREY COMPANYSTOREY COMPANYSTOREY COMPANYProduction Cost Report—Department 3Production Cost Report—Department 3Production Cost Report—Department 3Production Cost Report—Department 3Production Cost Report—Department 3
For the Month of June 2014For the Month of June 2014For the Month of June 2014For the Month of June 2014For the Month of June 2014
ActualActualActualActualActual Equivalent UnitsEquivalent UnitsEquivalent UnitsEquivalent UnitsEquivalent UnitsUnitsUnitsUnitsUnitsUnits UnitsUnitsUnitsUnitsUnits Transferred-InTransferred-InTransferred-InTransferred-InTransferred-In MaterialsMaterialsMaterialsMaterialsMaterials ConversionConversionConversionConversionConversion
Units in beginning inventory 6,000Units transferred in from Department 2 18,000
Units to be accounted for 24,000
Units completed and transferred out 16,000 16,000 16,000 16,000Units in ending inventory* 8,000 8,000 8,000 4,000
Units accounted for 24,000 24,000 24,000 20,000
CostsCostsCostsCostsCosts Transferred-InTransferred-InTransferred-InTransferred-InTransferred-In MaterialsMaterialsMaterialsMaterialsMaterials ConversionConversionConversionConversionConversion TotalTotalTotalTotalTotal
Costs to be accounted for:Costs in beginning inventory $12,000 $6,000 $3,000 $21,000Costs transferred in from Department 2 in June 37,200 37,200Costs added in Department 3 18,480 18,000 36,480
Costs to be accounted for $49,200 $24,480 $21,000 $94,680
Equivalent units (from above) 24,000 24,000 20,000
Unit cost (per equivalent unit)† $2.05 $1.02 $1.05 $4.12
Costs accounted for:Units completed and transferred out (16,000 units) $32,800 $16,320 $16,800 $65,920Units remaining in ending inventory (8,000 units)* 16,400 8,160 4,200 28,760
Costs accounted for $49,200 $24,480 $21,000 $94,680
*Inventory is complete as to materials added, 50% complete as to conversion.
†Unit cost equals costs to be accounted for divided by equivalent units.
The preparation of the production cost report includes the following four steps:
1. Trace the physical flow of the units through the production department.
2. Convert actual units to equivalent units.
3. Compute unit costs for each cost element.
4. Distribute the total cost between the units completed and transferred out and theunits remaining in the ending inventory.
Using the June data, Storey developed the production cost report for Department3 shown in Illustration 3.5.
The first step in the preparation of a production cost report is to trace the physicalflow of actual units in and out of Department 3. The units section in Illustration 3.5 showsthat Department 3 had 6,000 units in the June beginning inventory. Department 3 also had18,000 units transferred in from Department 2. This makes a total of 24,000 units forwhich Department 3 must account.
Of these 24,000 units, Department 3 completed and transferred out 16,000units (either to the next processing department or to finished goods). At the end of themonth, Department 3 had 8,000 partially completed units. These 8,000 units are theJune ending inventory. Now we are ready for the second step in the preparation of theproduction cost report—to convert actual units to equivalent units.
Storey Company’s cost of production report uses the average cost procedure. Underthe average cost procedure, the number of equivalent units for each cost element equalsthe number of units transferred out plus the number of equivalent units of that cost elementin the ending inventory. The average cost procedure does not consider the number of units inthe beginning inventory and the degree of completion of the beginning inventory. Alternatively,Storey could use First-in, First-out (FIFO) or Last-in, First-out (LIFO). We use the averagecost procedure in this chapter because it is simpler and commonly used in practice.
7676767676 PART II Product Costing
Storey’s units in the ending inventory are fully complete as to costs transferredin and materials cost. Therefore, the number of equivalent units for each of these costelements is 24,000 (16,000 units completed and transferred out + [8,000 units in theending inventory ✕ 100% complete for transferred-in costs and materials costs]). The8,000 units remaining in ending inventory are 50% complete as to conversion. Therefore,there are 20,000 equivalent units with regards to conversion—16,000 units transferredout plus 8,000 units in ending inventory that were 50% complete.
Once a company has computed its equivalent units, it must calculate the unitcosts. This is the third step in preparing the production cost report. Each cost element ofproduction—costs transferred in, materials, and conversion—has accumulated costs.Notice in Illustration 3.5 that for each cost element, we total the costs of beginninginventory and costs of the current month. We refer to the total costs charged to adepartment as costs to be accounted for. These costs must either be transferred out orappear in the ending inventory of Department 3.
To determine the cost per equivalent unit for each cost element, divide the totalcost for each cost element by the equivalent units of production related to that costelement. (Since we totaled all costs for each cost element before the division, we canaverage the computed unit costs across the current and prior period.) Illustration 3.5shows the average per unit costs for June as transferred-in costs, $2.05; materials costs,$1.02; and conversion costs, $1.05. In monitoring these costs closely for cost controlpurposes, management watches for extreme fluctuations from one month to the next.
The last step in preparing the production cost report is to allocate costs betweenthe units completed and transferred out and the units remaining in ending inventory.The units transferred out were fully complete as to all elements of production. Therefore,we can multiply the 16,000 units by $4.12, the total cost per unit. The result, $65,920,is the amount Storey assigns to the next department as cost transferred in or to finishedgoods as the cost of completed current period production. We now compute the cost ofending inventory as follows:
8,000 equivalent units transferred in @ $2.05 $16,4008,000 equivalent units of materials costs @ $1.02 8,1604,000 equivalent units of conversion costs @ $1.05 4,200
Total cost of ending inventory $28,760
The sum of the ending inventory cost and the cost of the units transferred outmust equal the total costs to be accounted for. This built-in check determines whetherthe company has properly followed the procedures of cost allocation. As shown in theproduction cost report, Department 3 adds the $65,920 costs transferred out to the $28,760ending inventory cost. The total equals the $94,680 for which Department 3 must account.
Some companies replace the production cost report with three schedules. Thefirst schedule is the schedule of equivalent production. This schedule computes theequivalent units of production for the period for transferred-in, materials, and conversioncosts. The second schedule is the unit cost analysis schedule. This schedule sums all thecosts charged to the Work in Process Inventory account of each production processdepartment. Then it calculates the cost per equivalent unit for transferred-in, materials,and conversion costs. The third schedule is the cost summary schedule. This scheduleuses the results of the preceding two schedules to distribute the total costs accumulatedduring the period among all the units of output. Companies generally show these threeschedules in a process cost analysis report.
Companies that use a process cost system may use the first-in, first-out (FIFO) methodinstead of the average cost procedure. Generally, under FIFO, the equivalent number ofunits for each cost element consists of:
Note to the StudentNote to the StudentNote to the StudentNote to the StudentNote to the StudentThe production cost reportsummarizes all the units andcosts for a department for aperiod of time, usually onemonth.
FIFO Method
7777777777CHAPTER 3 Process Cost Systems
1. Work needed to complete the units in beginning inventory.
2. Work done on units started and completed during the period.
3. Work done on partially completed units in ending inventory.
Appendix 3–A, at the end of this chapter, illustrates this method.Now that you have studied both job costing in Chapter 2 and process costing in
this chapter, you can appreciate why manufacturing companies must accurately accountfor product unit costs. Without accurate cost accounting information, a manufacturingcompany cannot determine the cost of its products for managerial decision making orprepare accurate financial statements.
Process Costing in Service Organizations
Service organizations that provide similar services to a variety of customers are potentialusers of process costing. For example, a clinic dispensing flu shots, a delicatessen sellingonly pastrami sandwiches, and a photo shop that processes pictures could use processcosting. In manufacturing, the difficult task is to match period costs with the unitsproduced that period, which is why companies compute equivalent units of production.(And that is what most people find difficult about process costing.)
Generally, service companies complete the service by the end of the periodand have no work in process at the end of the period. Nurses do not leave for homehalfway through giving a flu shot, and the delicatessen does not partially serve a sandwichone month and complete it the next. Consequently, there is no need to compute equivalentunits, which simplifies process costing.
Note that some service companies do have partially completed work at the endof the period. Certain types of dry cleaning and photo processing may still be in processat the end of a period. You could apply the methods described in this chapter formanufacturing to those service companies. For materials, you could substitute anysignificant supplies, and for conversion costs, service labor and overhead.
Spoilage
If you have ever tried to make something that did not work out, you know the conceptof spoilage. Spoilage refers to the loss of goods during production. For example, supposesome of the cans are dented during the canning of tuna fish. Accountants would treatthe cost of the dented cans of tuna fish as spoilage.
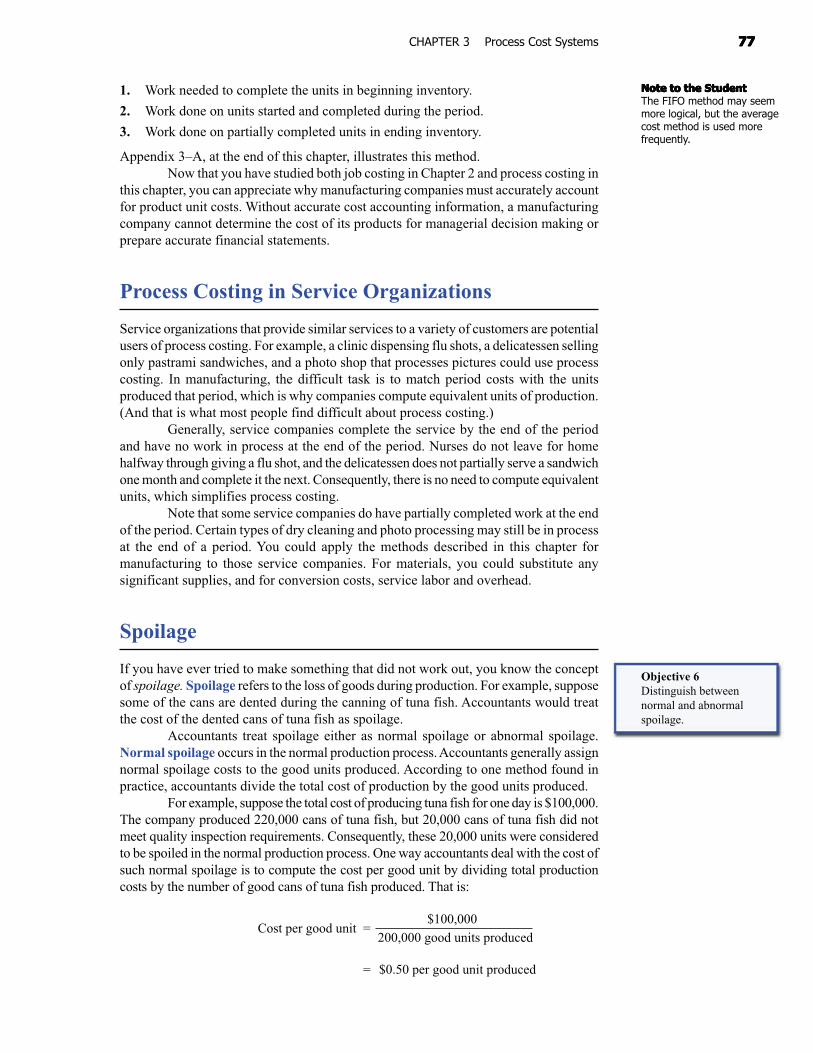
Accountants treat spoilage either as normal spoilage or abnormal spoilage.Normal spoilage occurs in the normal production process. Accountants generally assignnormal spoilage costs to the good units produced. According to one method found inpractice, accountants divide the total cost of production by the good units produced.
For example, suppose the total cost of producing tuna fish for one day is $100,000.The company produced 220,000 cans of tuna fish, but 20,000 cans of tuna fish did notmeet quality inspection requirements. Consequently, these 20,000 units were consideredto be spoiled in the normal production process. One way accountants deal with the cost ofsuch normal spoilage is to compute the cost per good unit by dividing total productioncosts by the number of good cans of tuna fish produced. That is:
Cost per good unit =$100,000
200,000 good units produced
= $0.50 per good unit produced
Note to the StudentNote to the StudentNote to the StudentNote to the StudentNote to the StudentThe FIFO method may seemmore logical, but the averagecost method is used morefrequently.
Objective 6Distinguish betweennormal and abnormalspoilage.
7878787878 PART II Product Costing
Abnormal spoilage refers to spoilage that exceeds the amount expected undernormal operating conditions. For example, if denting the tuna fish cans is unusual,accountants would treat the cost of those dented cans of tuna fish as abnormal spoilage.Whereas normal spoilage costs are assigned to good products, abnormal spoilage costsare typically expensed. Thus, accountants treat normal spoilage as a product cost andabnormal spoilage as a period cost.
Advocates of total quality management may prefer to classify all spoilage as abnormal.Normal spoilage costs are buried in the costs of the good products. Unless managementpersonnel ask for a special analysis of spoilage costs, they will not know whether thespoilage costs are a small percent or a large percent of product costs. For example,management could see a report on tuna fish production costs stating the cost is $0.50per can, but they do not know how much of the $0.50 was the cost of spoilage.
We recommend that accountants report spoilage costs to management, whethernormal spoilage or abnormal spoilage, so management can make informed decisions toreduce spoilage.
Understanding the Learning Objectives
• Process cost systems are used for businesses that produce products on acontinuous basis over long periods.
• Paint, paper, chemicals, gasoline, beverages, and food products should beaccounted for under a process cost system.
• Types of products produced under each system: Companies that use job costingwork on many different jobs with different production requirements during eachperiod. Companies that use process costing produce a single product, either on acontinuous basis or for long periods.
• Cost accumulation procedures used under each system: Job costing accumulatescosts by individual jobs. Process costing accumulates costs by process ordepartment.
• Work in Process accounts: Job cost systems have a Work in Process Inventoryaccount for each job. Process cost systems have a Work in Process Inventoryaccount for each department or process.
• Whenever partially completed inventories are present, the number of equivalentunits of production must be computed. Basically, the concept of equivalent unitsinvolves expressing a given number of partially completed units as a smallernumber of fully completed units.
• As a simple example of equivalent units, two apples that are half eaten areequivalent to one whole apple eaten. In manufacturing, we estimate the degreeof completion for a group of products with respect to transferred-in, materials,and conversion (direct labor and overhead). Accountants base the concept ofequivalent units on the supposition that a company must incur approximatelythe same costs to partially complete a large number of units as to totallycomplete a smaller number of units.
• Accountants compute equivalent units of production for transferred-in units,materials, and conversion. For each of these categories, the number of unitstransferred out is added to the equivalent units remaining in ending work inprocess in the department.
Spoilage andTotal QualityManagement
Objective 1Describe the types ofoperations that requirea process cost system.
Objective 2Distinguish betweenprocess and jobcosting systems.
Objective 3Discuss the concept ofequivalent units in aprocess cost system.
Objective 4Compute equivalent unitsof production and unitcosts under the averagecost procedure.
7979797979CHAPTER 3 Process Cost Systems
The FIFO Process Cost Method Appendix 3A
In this chapter, the discussion assumed the use of the average cost method for determiningunit costs under process costing. Another acceptable method for determining unit costunder process costing is the first-in, first-out (FIFO) cost method. This appendix presentsa detailed illustration of the FIFO process costing system.
The following table shows how the computation of equivalent units differsbetween the average cost method and the FIFO cost method:
• Unit costs for the three categories—transferred-in units, materials, andconversion—are determined by dividing the equivalent units into the cost inbeginning inventory plus the costs transferred in or added in the departmentduring this period.
• A production cost report shows both the flow of units and the flow of coststhrough a processing center. The report is divided into two parts. The first parttraces the physical flow of the units through the production department andconverts actual units to equivalent units. The second part shows the costs to beaccounted for, computes unit costs based on equivalent units as determined inthe first part, and shows how the costs were accounted for by adding the costscompleted and transferred out with the costs remaining in ending inventory.The costs to be accounted for and the costs accounted for must balance.
• The production cost report provides a check on the Work in Process Inventoryaccount. Each processing department normally has its own Work in ProcessInventory account and related production cost report. The separate items thatmake up work in process inventory—direct labor, direct materials, appliedoverhead, and cost of units transferred in and out—can be traced from theproduction cost report to the Work in Process Inventory account (and vice versa)during a given period.
• Normal spoilage occurs in the normal course of production and is treated as aproduct cost. Abnormal spoilage exceeds the spoilage that occurs in the normalcourse of production and is treated as a period cost.
• Under FIFO equivalent units of production are computed by taking theequivalent units of work done to complete the beginning inventory, plus unitsstarted and completed during the current period, plus equivalent units of workdone on the ending inventory. As is true under the average cost method, theequivalent units usually differ between materials and conversion.
• Unit costs for the three categories—transferred-in units, materials, andconversion—are determined by dividing cost to be accounted for during theperiod by units produced during the period.
• The physical measures method allocates joint product costs based on physicalmeasures, such as units, pounds, or liters.
• The relative sales value method is the most commonly used method to allocatejoint product costs. It is based on the relative sales values of the products at thesplit-off point.
Objective 5Prepare a production costreport for a process costsystem and discuss itsrelationship to the Work inProcess Inventory account.
Objective 6Distinguish betweennormal and abnormalspoilage.
Objective 7Compute equivalentunits of production andunit costs under thefirst-in, first-out(FIFO) system(Appendix 3–A).
Objective 8Discuss how joint costs areallocated to joint products(Appendix 3–B).
Objective 7Compute equivalent unitsof production and unitcosts under the first-in,first-out (FIFO) system.
8080808080 PART II Product Costing
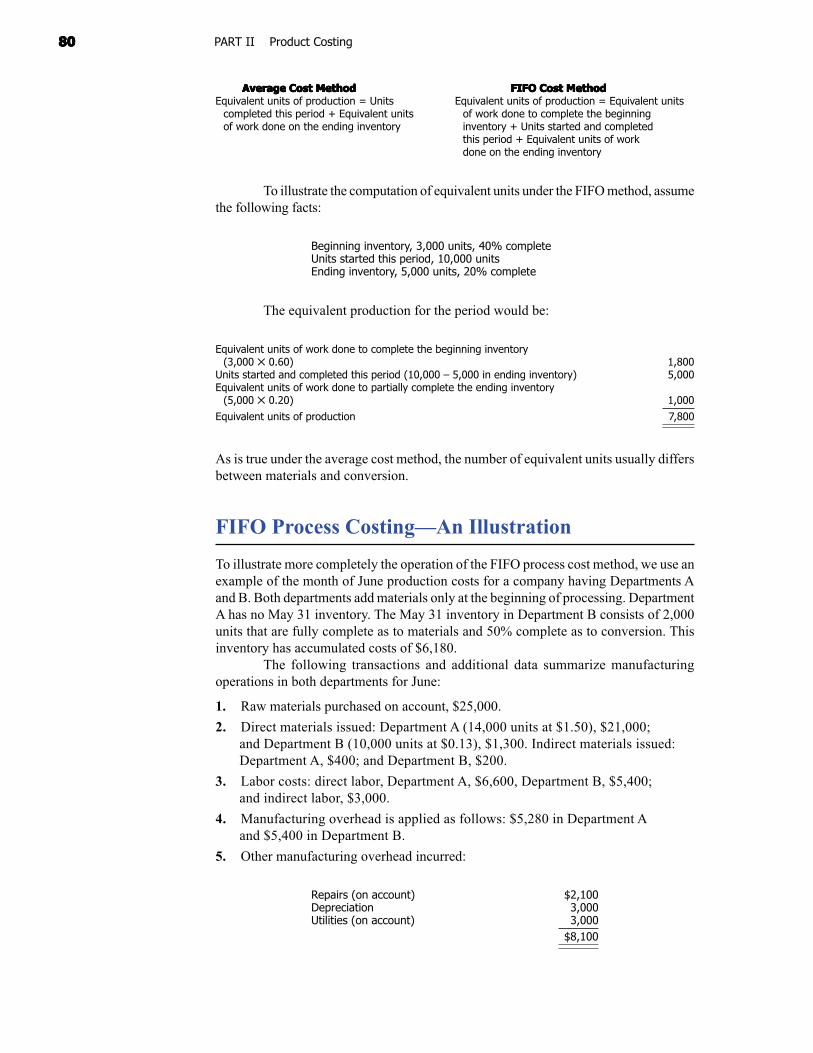
Average Cost MethodAverage Cost MethodAverage Cost MethodAverage Cost MethodAverage Cost Method FIFO Cost MethodFIFO Cost MethodFIFO Cost MethodFIFO Cost MethodFIFO Cost MethodEquivalent units of production = Units Equivalent units of production = Equivalent units
completed this period + Equivalent units of work done to complete the beginningof work done on the ending inventory inventory + Units started and completed
this period + Equivalent units of workdone on the ending inventory
To illustrate the computation of equivalent units under the FIFO method, assumethe following facts:
Beginning inventory, 3,000 units, 40% completeUnits started this period, 10,000 unitsEnding inventory, 5,000 units, 20% complete
The equivalent production for the period would be:
Equivalent units of work done to complete the beginning inventory(3,000 ✕ 0.60) 1,800
Units started and completed this period (10,000 – 5,000 in ending inventory) 5,000Equivalent units of work done to partially complete the ending inventory
(5,000 ✕ 0.20) 1,000
Equivalent units of production 7,800
As is true under the average cost method, the number of equivalent units usually differsbetween materials and conversion.
FIFO Process Costing—An Illustration
To illustrate more completely the operation of the FIFO process cost method, we use anexample of the month of June production costs for a company having Departments Aand B. Both departments add materials only at the beginning of processing. DepartmentA has no May 31 inventory. The May 31 inventory in Department B consists of 2,000units that are fully complete as to materials and 50% complete as to conversion. Thisinventory has accumulated costs of $6,180.
The following transactions and additional data summarize manufacturingoperations in both departments for June:
1. Raw materials purchased on account, $25,000.
2. Direct materials issued: Department A (14,000 units at $1.50), $21,000;and Department B (10,000 units at $0.13), $1,300. Indirect materials issued:Department A, $400; and Department B, $200.
3. Labor costs: direct labor, Department A, $6,600, Department B, $5,400;and indirect labor, $3,000.
4. Manufacturing overhead is applied as follows: $5,280 in Department Aand $5,400 in Department B.
5. Other manufacturing overhead incurred:
Repairs (on account) $2,100Depreciation 3,000Utilities (on account) 3,000
$8,100
8181818181CHAPTER 3 Process Cost Systems
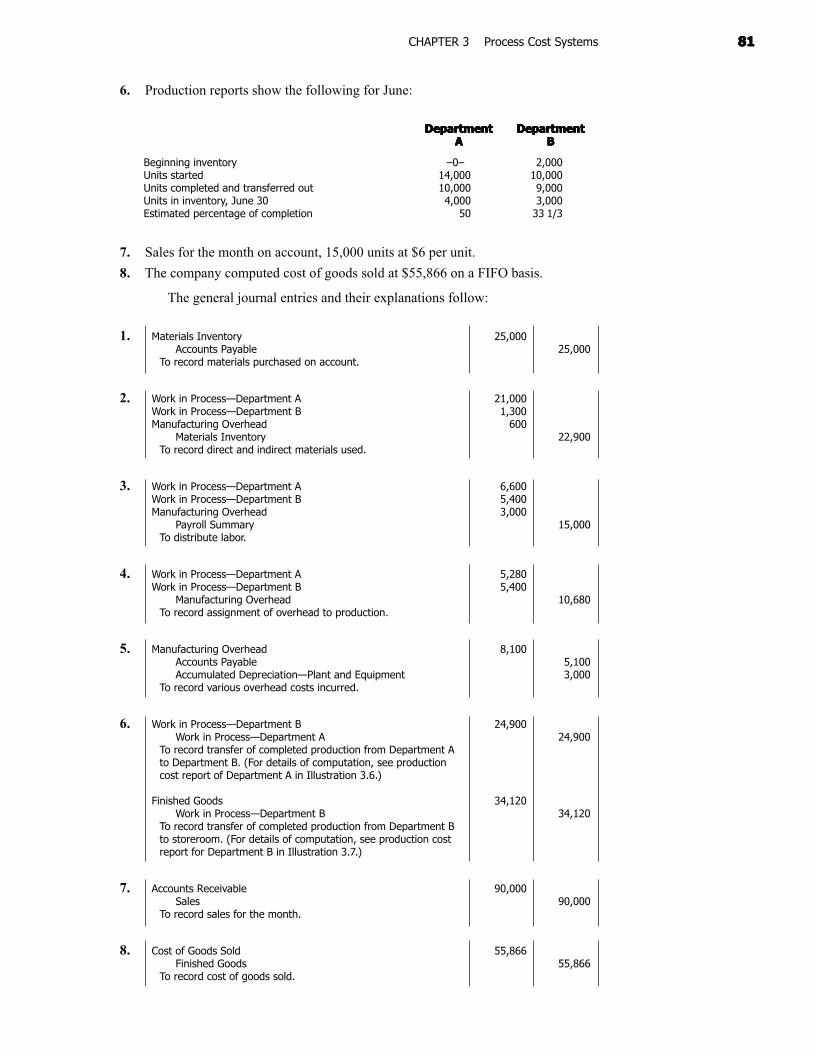
6. Production reports show the following for June:
DepartmentDepartmentDepartmentDepartmentDepartment DepartmentDepartmentDepartmentDepartmentDepartmentAAAAA BBBBB
Beginning inventory –0– 2,000Units started 14,000 10,000Units completed and transferred out 10,000 9,000Units in inventory, June 30 4,000 3,000Estimated percentage of completion 50 33 1/3
7. Sales for the month on account, 15,000 units at $6 per unit.
8. The company computed cost of goods sold at $55,866 on a FIFO basis.
The general journal entries and their explanations follow:
1. Materials Inventory 25,000Accounts Payable 25,000
To record materials purchased on account.
2. Work in Process—Department A 21,000Work in Process—Department B 1,300Manufacturing Overhead 600
Materials Inventory 22,900To record direct and indirect materials used.
3. Work in Process—Department A 6,600Work in Process—Department B 5,400Manufacturing Overhead 3,000
Payroll Summary 15,000To distribute labor.
4. Work in Process—Department A 5,280Work in Process—Department B 5,400
Manufacturing Overhead 10,680To record assignment of overhead to production.
5. Manufacturing Overhead 8,100Accounts Payable 5,100Accumulated Depreciation—Plant and Equipment 3,000
To record various overhead costs incurred.
6. Work in Process—Department B 24,900Work in Process—Department A 24,900
To record transfer of completed production from Department Ato Department B. (For details of computation, see productioncost report of Department A in Illustration 3.6.)
Finished Goods 34,120Work in Process—Department B 34,120
To record transfer of completed production from Department Bto storeroom. (For details of computation, see production costreport for Department B in Illustration 3.7.)
7. Accounts Receivable 90,000Sales 90,000
To record sales for the month.
8. Cost of Goods Sold 55,866Finished Goods 55,866
To record cost of goods sold.
8282828282 PART II Product Costing
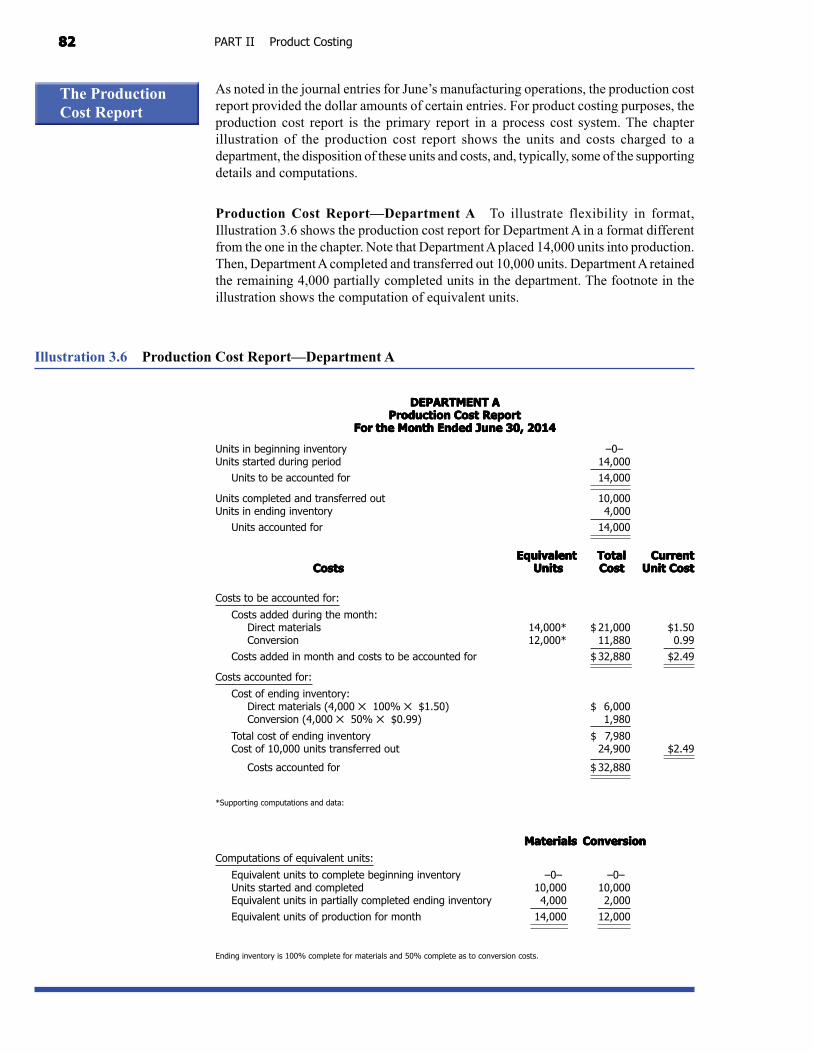
Illustration 3.6 Production Cost Report—Department A
As noted in the journal entries for June’s manufacturing operations, the production costreport provided the dollar amounts of certain entries. For product costing purposes, theproduction cost report is the primary report in a process cost system. The chapterillustration of the production cost report shows the units and costs charged to adepartment, the disposition of these units and costs, and, typically, some of the supportingdetails and computations.
Production Cost Report—Department A To illustrate flexibility in format,Illustration 3.6 shows the production cost report for Department A in a format differentfrom the one in the chapter. Note that Department A placed 14,000 units into production.Then, Department A completed and transferred out 10,000 units. Department A retainedthe remaining 4,000 partially completed units in the department. The footnote in theillustration shows the computation of equivalent units.
The ProductionCost Report
DEPARTMENT ADEPARTMENT ADEPARTMENT ADEPARTMENT ADEPARTMENT AProduction Cost ReportProduction Cost ReportProduction Cost ReportProduction Cost ReportProduction Cost Report
For the Month Ended June 30, 2014For the Month Ended June 30, 2014For the Month Ended June 30, 2014For the Month Ended June 30, 2014For the Month Ended June 30, 2014
Units in beginning inventory –0–Units started during period 14,000
Units to be accounted for 14,000
Units completed and transferred out 10,000Units in ending inventory 4,000
Units accounted for 14,000
EquivalentEquivalentEquivalentEquivalentEquivalent TotalTotalTotalTotalTotal CurrentCurrentCurrentCurrentCurrentCostsCostsCostsCostsCosts Units Units Units Units Units CostCostCostCostCost Unit CostUnit CostUnit CostUnit CostUnit Cost
Costs to be accounted for:
Costs added during the month:Direct materials 14,000* $ 21,000 $1.50Conversion 12,000* 11,880 0.99
Costs added in month and costs to be accounted for $ 32,880 $2.49
Costs accounted for:
Cost of ending inventory:Direct materials (4,000 ✕ 100% ✕ $1.50) $ 6,000Conversion (4,000 ✕ 50% ✕ $0.99) 1,980
Total cost of ending inventory $ 7,980Cost of 10,000 units transferred out 24,900 $2.49
Costs accounted for $ 32,880
*Supporting computations and data:
MaterialsMaterialsMaterialsMaterialsMaterials ConversionConversionConversionConversionConversionComputations of equivalent units:
Equivalent units to complete beginning inventory –0– –0–Units started and completed 10,000 10,000Equivalent units in partially completed ending inventory 4,000 2,000
Equivalent units of production for month 14,000 12,000
Ending inventory is 100% complete for materials and 50% complete as to conversion costs.
8383838383CHAPTER 3 Process Cost Systems
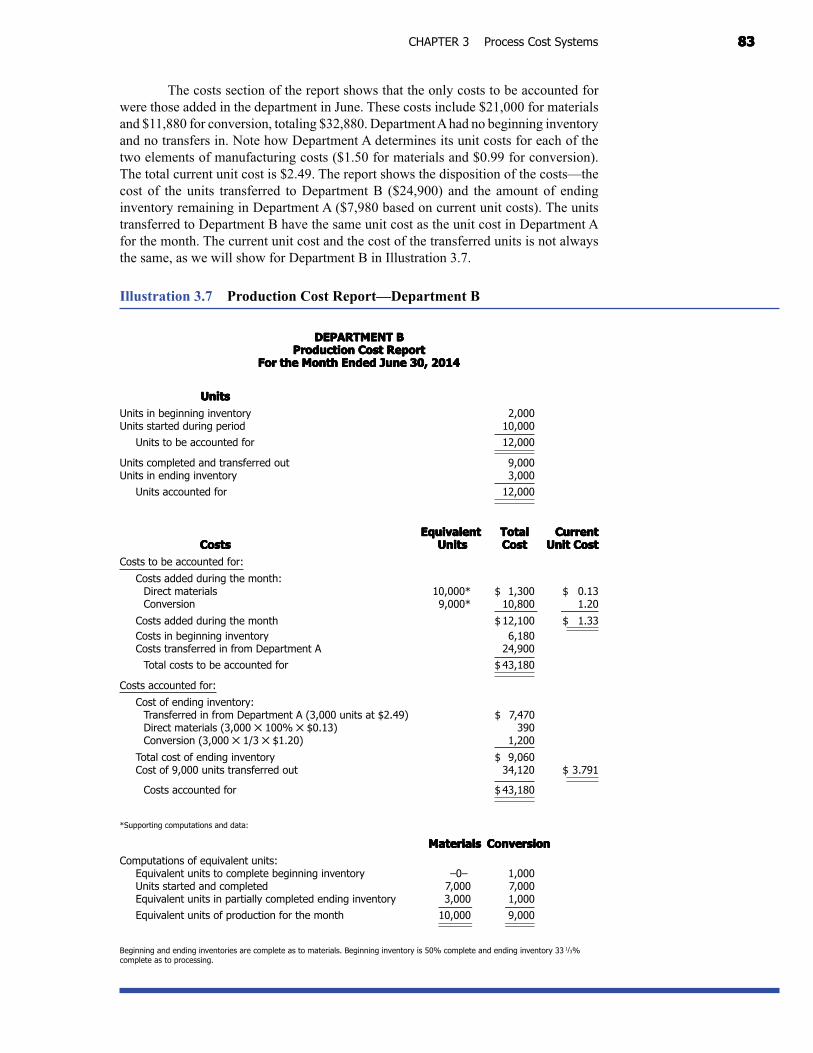
Illustration 3.7 Production Cost Report—Department B
DEPARTMENT BDEPARTMENT BDEPARTMENT BDEPARTMENT BDEPARTMENT BProduction Cost ReportProduction Cost ReportProduction Cost ReportProduction Cost ReportProduction Cost Report
For the Month Ended June 30, 2014For the Month Ended June 30, 2014For the Month Ended June 30, 2014For the Month Ended June 30, 2014For the Month Ended June 30, 2014
UnitsUnitsUnitsUnitsUnitsUnits in beginning inventory 2,000Units started during period 10,000
Units to be accounted for 12,000
Units completed and transferred out 9,000Units in ending inventory 3,000
Units accounted for 12,000
EquivalentEquivalentEquivalentEquivalentEquivalent TotalTotalTotalTotalTotal CurrentCurrentCurrentCurrentCurrentCostsCostsCostsCostsCosts Units Units Units Units Units CostCostCostCostCost Unit CostUnit CostUnit CostUnit CostUnit Cost
Costs to be accounted for:
Costs added during the month:Direct materials 10,000* $ 1,300 $ 0.13Conversion 9,000* 10,800 1.20
Costs added during the month $ 12,100 $ 1.33Costs in beginning inventory 6,180Costs transferred in from Department A 24,900
Total costs to be accounted for $ 43,180
Costs accounted for:
Cost of ending inventory:Transferred in from Department A (3,000 units at $2.49) $ 7,470Direct materials (3,000 ✕ 100% ✕ $0.13) 390Conversion (3,000 ✕ 1/3 ✕ $1.20) 1,200
Total cost of ending inventory $ 9,060Cost of 9,000 units transferred out 34,120 $ 3.791
Costs accounted for $ 43,180
*Supporting computations and data:
MaterialsMaterialsMaterialsMaterialsMaterials ConversionConversionConversionConversionConversionComputations of equivalent units:
Equivalent units to complete beginning inventory –0– 1,000Units started and completed 7,000 7,000Equivalent units in partially completed ending inventory 3,000 1,000
Equivalent units of production for the month 10,000 9,000
Beginning and ending inventories are complete as to materials. Beginning inventory is 50% complete and ending inventory 33 1/3%complete as to processing.
The costs section of the report shows that the only costs to be accounted forwere those added in the department in June. These costs include $21,000 for materialsand $11,880 for conversion, totaling $32,880. Department A had no beginning inventoryand no transfers in. Note how Department A determines its unit costs for each of thetwo elements of manufacturing costs ($1.50 for materials and $0.99 for conversion).The total current unit cost is $2.49. The report shows the disposition of the costs—thecost of the units transferred to Department B ($24,900) and the amount of endinginventory remaining in Department A ($7,980 based on current unit costs). The unitstransferred to Department B have the same unit cost as the unit cost in Department Afor the month. The current unit cost and the cost of the transferred units is not alwaysthe same, as we will show for Department B in Illustration 3.7.
8484848484 PART II Product Costing
Production Cost Report—Department B The production cost report for DepartmentB (Illustration 3.7) is similar to that of Department A. Note how the report highlightsthe current unit cost of the operations performed in the department. Note also thatDepartment B must account for the costs in the beginning inventory and the cost of theunits transferred in from Department A. Department B determines the cost of the endinginventory through the use of the current month’s unit cost ($1.33). All of DepartmentB’s other costs are included in the costs of the 9,000 units transferred to Finished Goods.
In the production cost report in Illustration 3.7, we determine the cost of unitstransferred out by subtracting the cost of the ending inventory from the total costs to beaccounted for ($43,180 – $9,060 = $34,120). We can compute average unit cost of$3.791 by dividing $34,120 by the 9,000 units transferred out.
Objective 8Discuss how joint costsare allocated to jointproducts.
Physical MeasuresMethod
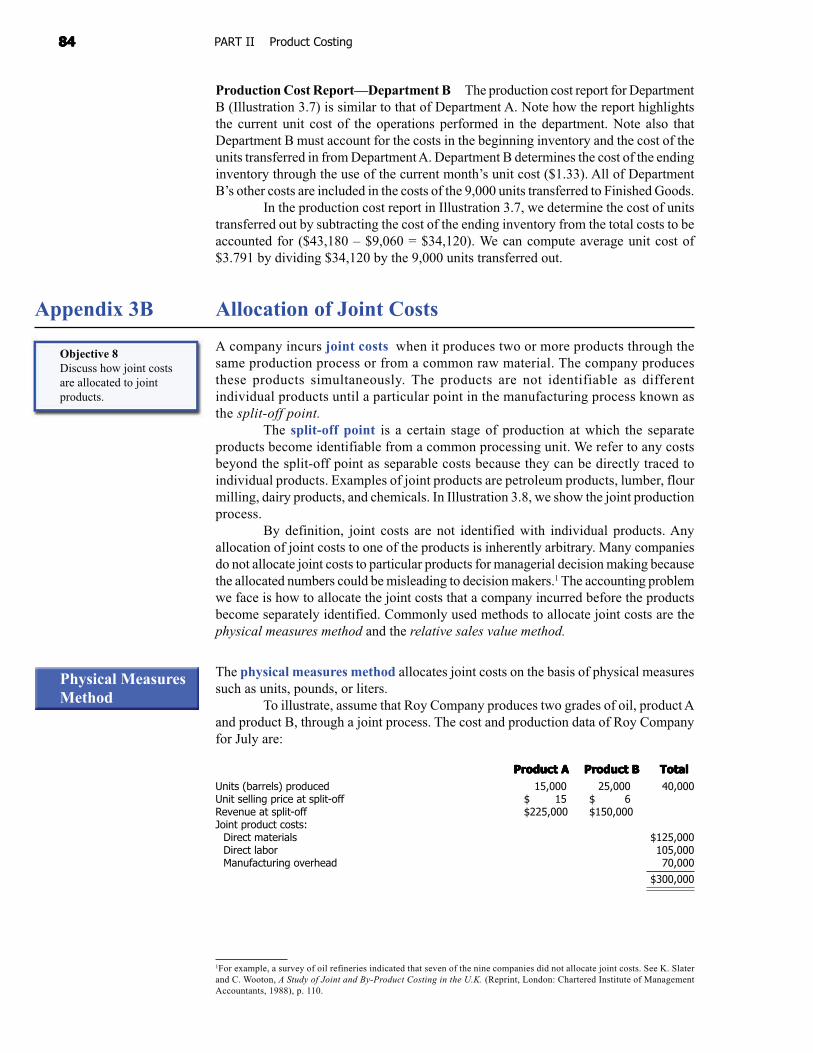
Appendix 3B Allocation of Joint Costs
A company incurs joint costs when it produces two or more products through thesame production process or from a common raw material. The company producesthese products simultaneously. The products are not identifiable as differentindividual products until a particular point in the manufacturing process known asthe split-off point.
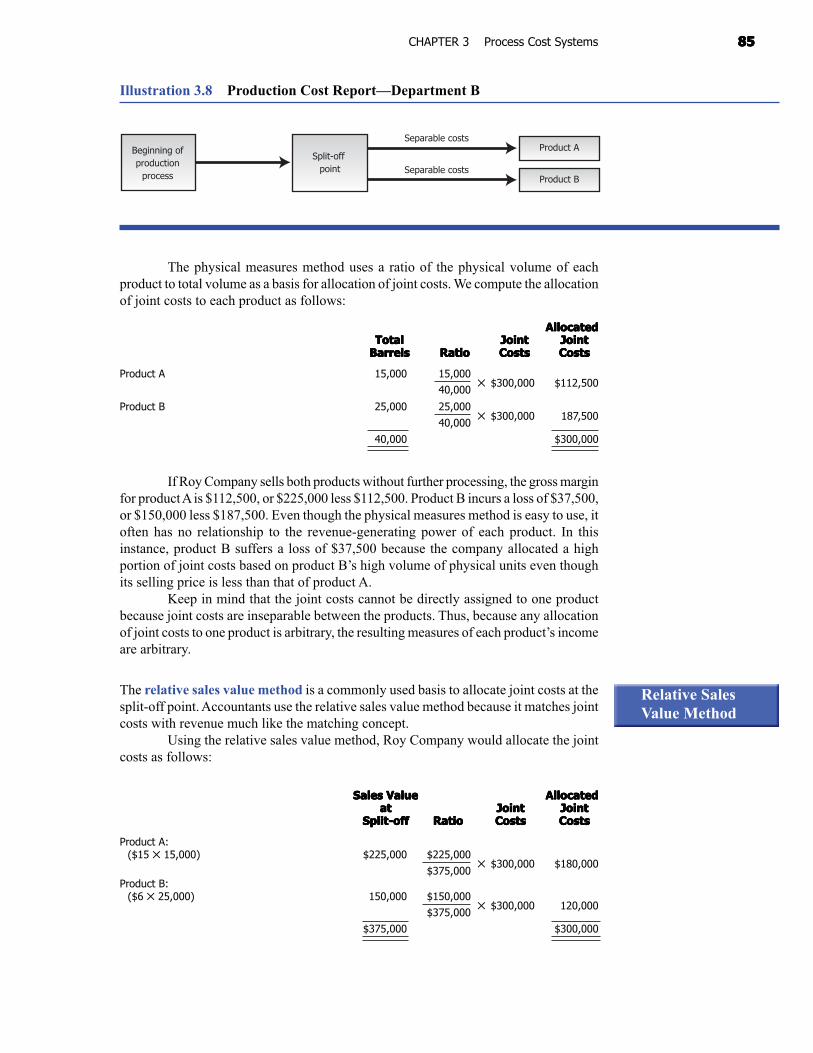
The split-off point is a certain stage of production at which the separateproducts become identifiable from a common processing unit. We refer to any costsbeyond the split-off point as separable costs because they can be directly traced toindividual products. Examples of joint products are petroleum products, lumber, flourmilling, dairy products, and chemicals. In Illustration 3.8, we show the joint productionprocess.
By definition, joint costs are not identified with individual products. Anyallocation of joint costs to one of the products is inherently arbitrary. Many companiesdo not allocate joint costs to particular products for managerial decision making becausethe allocated numbers could be misleading to decision makers.1 The accounting problemwe face is how to allocate the joint costs that a company incurred before the productsbecome separately identified. Commonly used methods to allocate joint costs are thephysical measures method and the relative sales value method.
The physical measures method allocates joint costs on the basis of physical measuressuch as units, pounds, or liters.
To illustrate, assume that Roy Company produces two grades of oil, product Aand product B, through a joint process. The cost and production data of Roy Companyfor July are:
Product AProduct AProduct AProduct AProduct A Product BProduct BProduct BProduct BProduct B TotalTotalTotalTotalTotalUnits (barrels) produced 15,000 25,000 40,000Unit selling price at split-off $ 15 $ 6Revenue at split-off $225,000 $150,000Joint product costs:
Direct materials $125,000Direct labor 105,000Manufacturing overhead 70,000
$300,000
1For example, a survey of oil refineries indicated that seven of the nine companies did not allocate joint costs. See K. Slaterand C. Wooton, A Study of Joint and By-Product Costing in the U.K. (Reprint, London: Chartered Institute of ManagementAccountants, 1988), p. 110.
8585858585CHAPTER 3 Process Cost Systems
Illustration 3.8 Production Cost Report—Department B
Separable costsProduct B
Split-off point
Separable costsProduct ABeginning of
productionprocess
The physical measures method uses a ratio of the physical volume of eachproduct to total volume as a basis for allocation of joint costs. We compute the allocationof joint costs to each product as follows:
AllocatedAllocatedAllocatedAllocatedAllocatedTotalTotalTotalTotalTotal JointJointJointJointJoint JointJointJointJointJoint
BarrelsBarrelsBarrelsBarrelsBarrels RatioRatioRatioRatioRatio CostsCostsCostsCostsCosts CostsCostsCostsCostsCosts
Product A 15,000 15,000✕ $300,000 $112,500
40,000
Product B 25,000 25,000✕ $300,000 187,500
40,000
40,000 $300,000
If Roy Company sells both products without further processing, the gross marginfor product A is $112,500, or $225,000 less $112,500. Product B incurs a loss of $37,500,or $150,000 less $187,500. Even though the physical measures method is easy to use, itoften has no relationship to the revenue-generating power of each product. In thisinstance, product B suffers a loss of $37,500 because the company allocated a highportion of joint costs based on product B’s high volume of physical units even thoughits selling price is less than that of product A.
Keep in mind that the joint costs cannot be directly assigned to one productbecause joint costs are inseparable between the products. Thus, because any allocationof joint costs to one product is arbitrary, the resulting measures of each product’s incomeare arbitrary.
The relative sales value method is a commonly used basis to allocate joint costs at thesplit-off point. Accountants use the relative sales value method because it matches jointcosts with revenue much like the matching concept.
Using the relative sales value method, Roy Company would allocate the jointcosts as follows:
Sales ValueSales ValueSales ValueSales ValueSales Value AllocatedAllocatedAllocatedAllocatedAllocatedatatatatat JointJointJointJointJoint JointJointJointJointJoint
Split-offSplit-offSplit-offSplit-offSplit-off RatioRatioRatioRatioRatio CostsCostsCostsCostsCosts CostsCostsCostsCostsCosts
Product A:($15 ✕ 15,000) $225,000 $225,000
✕ $300,000 $180,000$375,000
Product B:($6 ✕ 25,000) 150,000 $150,000
✕ $300,000 120,000$375,000
$375,000 $300,000
Relative SalesValue Method
8686868686 PART II Product Costing
Required �
The allocation ratios of 60% and 40%, respectively, for product A and productB result in allocated joint costs of $180,000 to product A, and $120,000 to product B.
To compare the physical measures method and the relative sales value method,assume Roy Company has no inventory at the end of July. A partial July income statementwould appear as shown:
Product AProduct AProduct AProduct AProduct A Product BProduct BProduct BProduct BProduct B
PhysicalPhysicalPhysicalPhysicalPhysical RelativeRelativeRelativeRelativeRelative PhysicalPhysicalPhysicalPhysicalPhysical RelativeRelativeRelativeRelativeRelativeMeasuresMeasuresMeasuresMeasuresMeasures Sales Value Sales Value Sales Value Sales Value Sales Value MeasuresMeasuresMeasuresMeasuresMeasures Sales Value Sales Value Sales Value Sales Value Sales ValueMethodMethodMethodMethodMethod MethodMethodMethodMethodMethod MethodMethodMethodMethodMethod MethodMethodMethodMethodMethod
Sales $225,000 $225,000 $150,000 $150,000Cost of goods sold 112,500 180,000 187,500 120,000
Gross margin $112,500 $ 45,000 $(37,500) $ 30,000
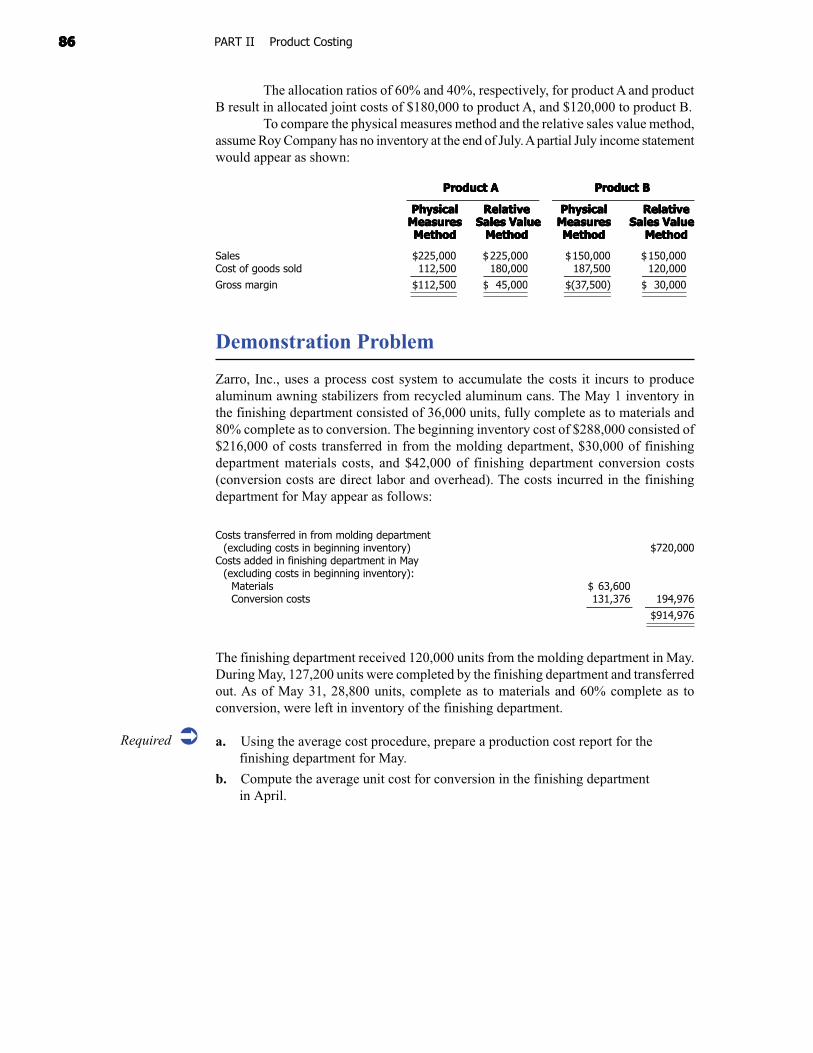
Demonstration Problem
Zarro, Inc., uses a process cost system to accumulate the costs it incurs to producealuminum awning stabilizers from recycled aluminum cans. The May 1 inventory inthe finishing department consisted of 36,000 units, fully complete as to materials and80% complete as to conversion. The beginning inventory cost of $288,000 consisted of$216,000 of costs transferred in from the molding department, $30,000 of finishingdepartment materials costs, and $42,000 of finishing department conversion costs(conversion costs are direct labor and overhead). The costs incurred in the finishingdepartment for May appear as follows:
Costs transferred in from molding department(excluding costs in beginning inventory) $720,000
Costs added in finishing department in May(excluding costs in beginning inventory):
Materials $ 63,600Conversion costs 131,376 194,976
$914,976
The finishing department received 120,000 units from the molding department in May.During May, 127,200 units were completed by the finishing department and transferredout. As of May 31, 28,800 units, complete as to materials and 60% complete as toconversion, were left in inventory of the finishing department.
a. Using the average cost procedure, prepare a production cost report for thefinishing department for May.
b. Compute the average unit cost for conversion in the finishing departmentin April.
8787878787CHAPTER 3 Process Cost Systems
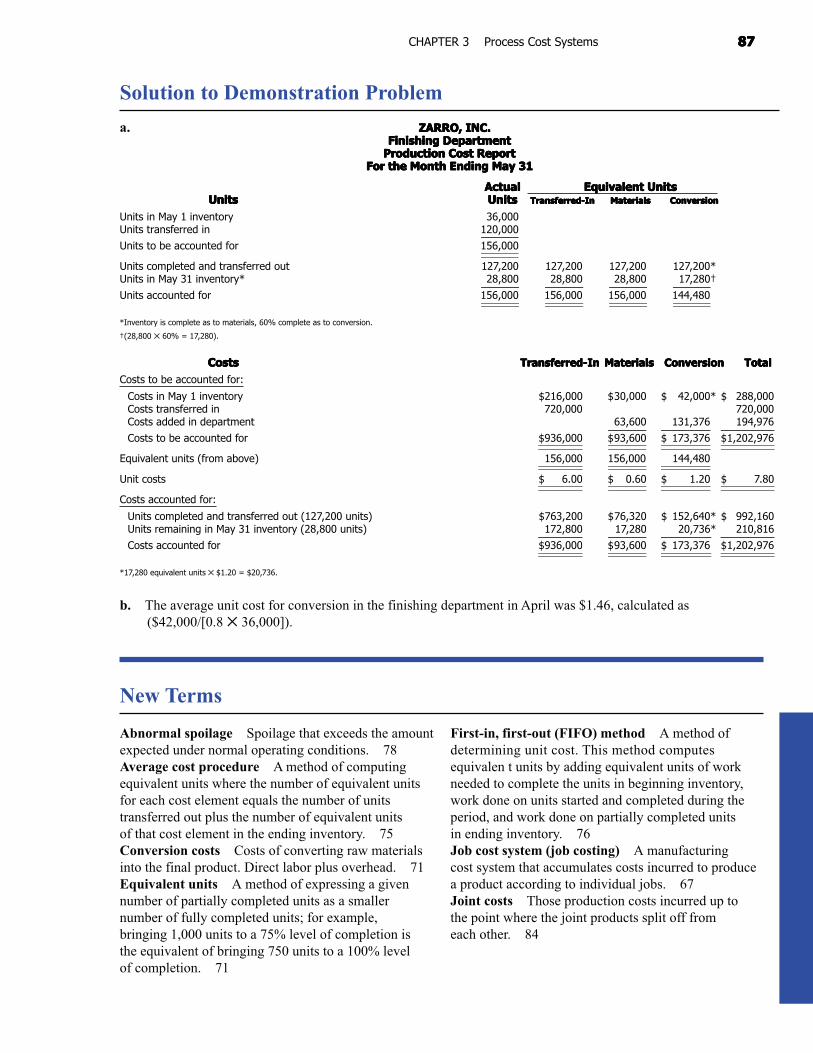
Solution to Demonstration Problem
a. ZARRO, INC.ZARRO, INC.ZARRO, INC.ZARRO, INC.ZARRO, INC.Finishing DepartmentFinishing DepartmentFinishing DepartmentFinishing DepartmentFinishing Department
Production Cost ReportProduction Cost ReportProduction Cost ReportProduction Cost ReportProduction Cost ReportFor the Month Ending May 31For the Month Ending May 31For the Month Ending May 31For the Month Ending May 31For the Month Ending May 31
ActualActualActualActualActual Equivalent UnitsEquivalent UnitsEquivalent UnitsEquivalent UnitsEquivalent UnitsUnitsUnitsUnitsUnitsUnits UnitsUnitsUnitsUnitsUnits Transferred-InTransferred-InTransferred-InTransferred-InTransferred-In MaterialsMaterialsMaterialsMaterialsMaterials ConversionConversionConversionConversionConversion
Units in May 1 inventory 36,000Units transferred in 120,000
Units to be accounted for 156,000
Units completed and transferred out 127,200 127,200 127,200 127,200*Units in May 31 inventory* 28,800 28,800 28,800 17,280†
Units accounted for 156,000 156,000 156,000 144,480
*Inventory is complete as to materials, 60% complete as to conversion.
†(28,800 ✕ 60% = 17,280).
CostsCostsCostsCostsCosts Transferred-InTransferred-InTransferred-InTransferred-InTransferred-In MaterialsMaterialsMaterialsMaterialsMaterials ConversionConversionConversionConversionConversion TotalTotalTotalTotalTotal
Costs to be accounted for:
Costs in May 1 inventory $216,000 $30,000 $ 42,000* $ 288,000Costs transferred in 720,000 720,000Costs added in department 63,600 131,376 194,976
Costs to be accounted for $936,000 $93,600 $ 173,376 $1,202,976
Equivalent units (from above) 156,000 156,000 144,480
Unit costs $ 6.00 $ 0.60 $ 1.20 $ 7.80
Costs accounted for:
Units completed and transferred out (127,200 units) $763,200 $76,320 $ 152,640* $ 992,160Units remaining in May 31 inventory (28,800 units) 172,800 17,280 20,736* 210,816
Costs accounted for $936,000 $93,600 $ 173,376 $1,202,976
*17,280 equivalent units ✕ $1.20 = $20,736.
b. The average unit cost for conversion in the finishing department in April was $1.46, calculated as ($42,000/[0.8 ✕ 36,000]).
Abnormal spoilage Spoilage that exceeds the amountexpected under normal operating conditions. 78Average cost procedure A method of computingequivalent units where the number of equivalent unitsfor each cost element equals the number of unitstransferred out plus the number of equivalent unitsof that cost element in the ending inventory. 75Conversion costs Costs of converting raw materialsinto the final product. Direct labor plus overhead. 71Equivalent units A method of expressing a givennumber of partially completed units as a smallernumber of fully completed units; for example,bringing 1,000 units to a 75% level of completion isthe equivalent of bringing 750 units to a 100% levelof completion. 71
First-in, first-out (FIFO) method A method ofdetermining unit cost. This method computesequivalen t units by adding equivalent units of workneeded to complete the units in beginning inventory,work done on units started and completed during theperiod, and work done on partially completed unitsin ending inventory. 76Job cost system (job costing) A manufacturingcost system that accumulates costs incurred to producea product according to individual jobs. 67Joint costs Those production costs incurred up tothe point where the joint products split off fromeach other. 84
New Terms
8888888888 PART II Product Costing
Normal spoilage Spoilage that occurs in the normalproduction process. 77Physical measures method A method of allocatingjoint product costs on the basis of physical measuressuch as units, pounds, or liters. 84Process cost system (process costing) Amanufacturing cost system that accumulates costsincurred to produce a product according to theprocesses or departments a product goes through on itsway to completion. 67Production cost report A report that shows both theflow of units and the flow of costs through a processingcenter. It also shows how accountants divide these costsbetween the cost of units completed and transferred outand the cost of units still in the processing center’sending inventory. 74
Relative sales value method A method of allocatingjoint product costs on the basis of the relative marketvalue at the split-off point. 85Split-off point A certain stage of production at whichthe separate products become identifiable from acommon processing unit. 84Spoilage The loss of goods during production. 77Transferred-in costs Costs associated with physicalunits that were accumulated in previous processingcenters. 71
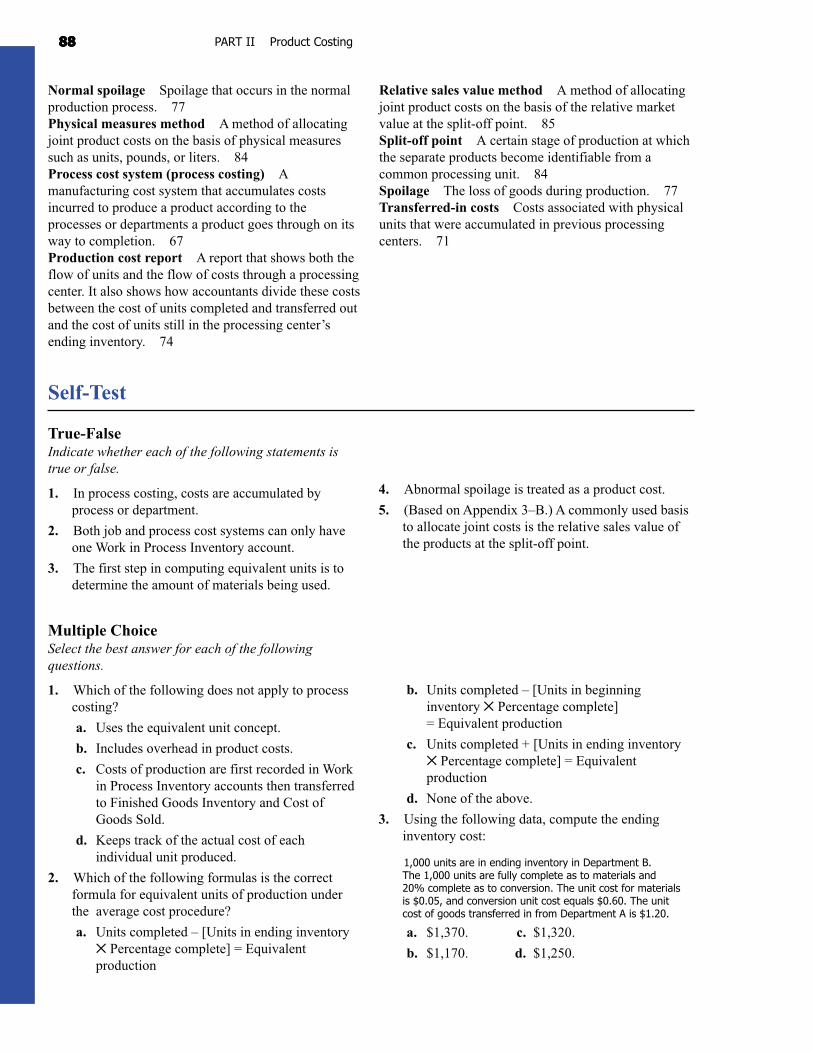
Multiple ChoiceSelect the best answer for each of the followingquestions.
1. Which of the following does not apply to processcosting?
a. Uses the equivalent unit concept.
b. Includes overhead in product costs.
c. Costs of production are first recorded in Workin Process Inventory accounts then transferredto Finished Goods Inventory and Cost ofGoods Sold.
d. Keeps track of the actual cost of eachindividual unit produced.
2. Which of the following formulas is the correctformula for equivalent units of production underthe average cost procedure?
a. Units completed – [Units in ending inventory✕ Percentage complete] = Equivalentproduction
b. Units completed – [Units in beginninginventory ✕ Percentage complete]= Equivalent production
c. Units completed + [Units in ending inventory✕ Percentage complete] = Equivalentproduction
d. None of the above.
3. Using the following data, compute the endinginventory cost:
1,000 units are in ending inventory in Department B.The 1,000 units are fully complete as to materials and20% complete as to conversion. The unit cost for materialsis $0.05, and conversion unit cost equals $0.60. The unitcost of goods transferred in from Department A is $1.20.
a. $1,370. c. $1,320.
b. $1,170. d. $1,250.
Self-Test
True-FalseIndicate whether each of the following statements istrue or false.
1. In process costing, costs are accumulated byprocess or department.
2. Both job and process cost systems can only haveone Work in Process Inventory account.
3. The first step in computing equivalent units is todetermine the amount of materials being used.
4. Abnormal spoilage is treated as a product cost.
5. (Based on Appendix 3–B.) A commonly used basisto allocate joint costs is the relative sales value ofthe products at the split-off point.
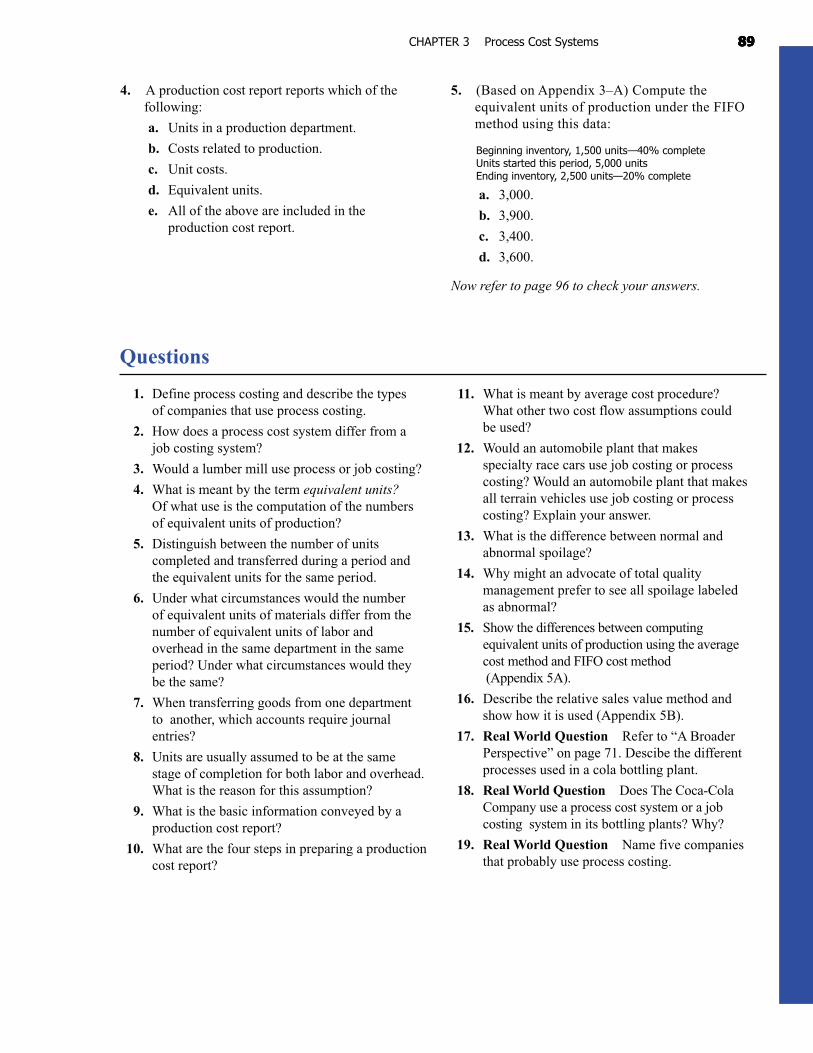
8989898989CHAPTER 3 Process Cost Systems
4. A production cost report reports which of thefollowing:
a. Units in a production department.
b. Costs related to production.
c. Unit costs.
d. Equivalent units.
e. All of the above are included in theproduction cost report.
5. (Based on Appendix 3–A) Compute theequivalent units of production under the FIFOmethod using this data:
Beginning inventory, 1,500 units—40% completeUnits started this period, 5,000 unitsEnding inventory, 2,500 units—20% complete
a. 3,000.
b. 3,900.
c. 3,400.
d. 3,600.
Now refer to page 96 to check your answers.
1. Define process costing and describe the typesof companies that use process costing.
2. How does a process cost system differ from ajob costing system?
3. Would a lumber mill use process or job costing?
4. What is meant by the term equivalent units?Of what use is the computation of the numbersof equivalent units of production?
5. Distinguish between the number of unitscompleted and transferred during a period andthe equivalent units for the same period.
6. Under what circumstances would the numberof equivalent units of materials differ from thenumber of equivalent units of labor andoverhead in the same department in the sameperiod? Under what circumstances would theybe the same?
7. When transferring goods from one departmentto another, which accounts require journalentries?
8. Units are usually assumed to be at the samestage of completion for both labor and overhead.What is the reason for this assumption?
9. What is the basic information conveyed by aproduction cost report?
10. What are the four steps in preparing a productioncost report?
11. What is meant by average cost procedure?What other two cost flow assumptions couldbe used?
12. Would an automobile plant that makesspecialty race cars use job costing or processcosting? Would an automobile plant that makesall terrain vehicles use job costing or processcosting? Explain your answer.
13. What is the difference between normal andabnormal spoilage?
14. Why might an advocate of total qualitymanagement prefer to see all spoilage labeledas abnormal?
15. Show the differences between computingequivalent units of production using the averagecost method and FIFO cost method (Appendix 5A).
16. Describe the relative sales value method andshow how it is used (Appendix 5B).
17. Real World Question Refer to “A BroaderPerspective” on page 71. Descibe the differentprocesses used in a cola bottling plant.
18. Real World Question Does The Coca-ColaCompany use a process cost system or a jobcosting system in its bottling plants? Why?
19. Real World Question Name five companiesthat probably use process costing.
Questions
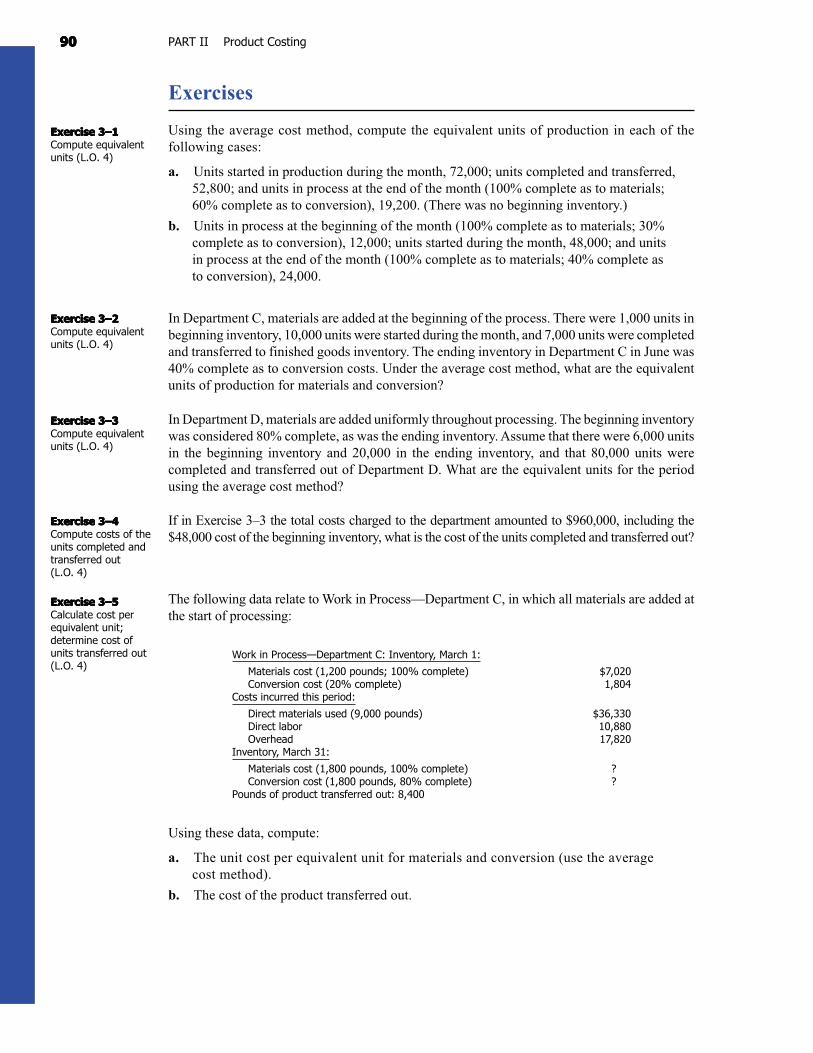
9090909090 PART II Product Costing
Exercises
Using the average cost method, compute the equivalent units of production in each of thefollowing cases:
a. Units started in production during the month, 72,000; units completed and transferred,52,800; and units in process at the end of the month (100% complete as to materials;60% complete as to conversion), 19,200. (There was no beginning inventory.)
b. Units in process at the beginning of the month (100% complete as to materials; 30%complete as to conversion), 12,000; units started during the month, 48,000; and unitsin process at the end of the month (100% complete as to materials; 40% complete asto conversion), 24,000.
In Department C, materials are added at the beginning of the process. There were 1,000 units inbeginning inventory, 10,000 units were started during the month, and 7,000 units were completedand transferred to finished goods inventory. The ending inventory in Department C in June was40% complete as to conversion costs. Under the average cost method, what are the equivalentunits of production for materials and conversion?
In Department D, materials are added uniformly throughout processing. The beginning inventorywas considered 80% complete, as was the ending inventory. Assume that there were 6,000 unitsin the beginning inventory and 20,000 in the ending inventory, and that 80,000 units werecompleted and transferred out of Department D. What are the equivalent units for the periodusing the average cost method?
If in Exercise 3–3 the total costs charged to the department amounted to $960,000, including the$48,000 cost of the beginning inventory, what is the cost of the units completed and transferred out?
The following data relate to Work in Process—Department C, in which all materials are added atthe start of processing:
Work in Process—Department C: Inventory, March 1:
Materials cost (1,200 pounds; 100% complete) $7,020Conversion cost (20% complete) 1,804
Costs incurred this period:
Direct materials used (9,000 pounds) $36,330Direct labor 10,880Overhead 17,820
Inventory, March 31:
Materials cost (1,800 pounds, 100% complete) ?Conversion cost (1,800 pounds, 80% complete) ?
Pounds of product transferred out: 8,400
Using these data, compute:
a. The unit cost per equivalent unit for materials and conversion (use the averagecost method).
b. The cost of the product transferred out.
Exercise 3–1Exercise 3–1Exercise 3–1Exercise 3–1Exercise 3–1Compute equivalentunits (L.O. 4)
Exercise 3–2Exercise 3–2Exercise 3–2Exercise 3–2Exercise 3–2Compute equivalentunits (L.O. 4)
Exercise 3–3Exercise 3–3Exercise 3–3Exercise 3–3Exercise 3–3Compute equivalentunits (L.O. 4)
Exercise 3–4Exercise 3–4Exercise 3–4Exercise 3–4Exercise 3–4Compute costs of theunits completed andtransferred out(L.O. 4)
Exercise 3–5Exercise 3–5Exercise 3–5Exercise 3–5Exercise 3–5Calculate cost perequivalent unit;determine cost ofunits transferred out(L.O. 4)
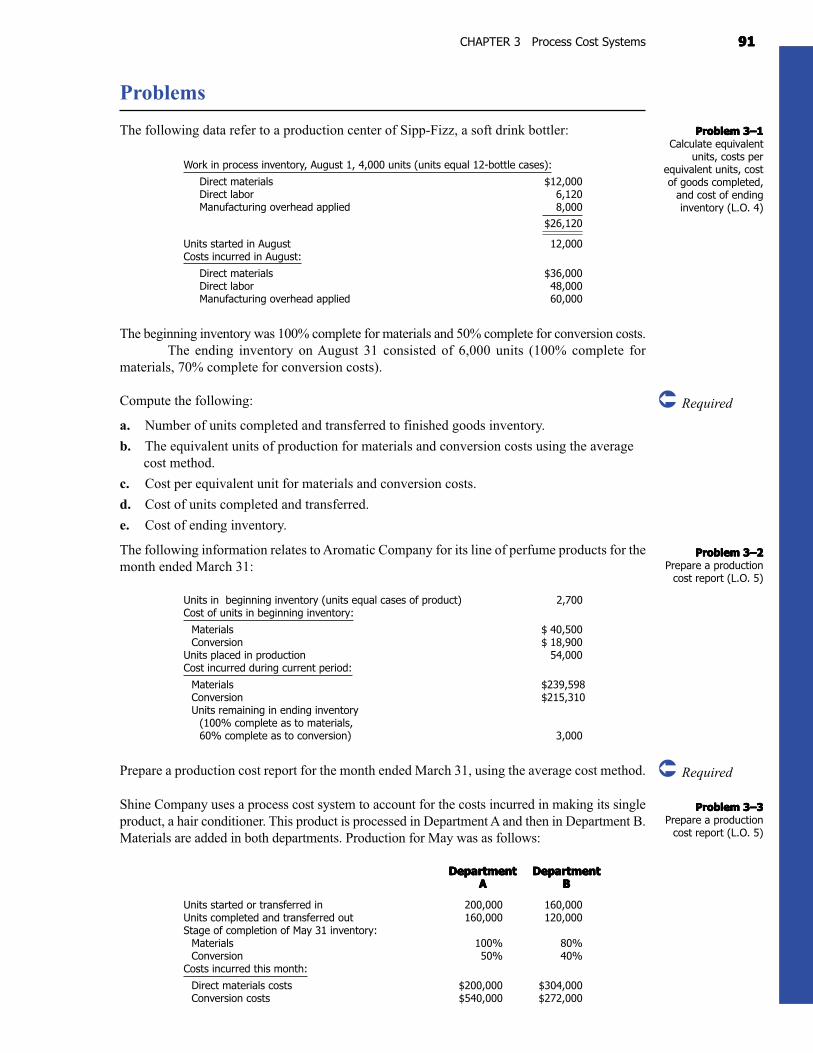
9191919191CHAPTER 3 Process Cost Systems
Problem 3–1Problem 3–1Problem 3–1Problem 3–1Problem 3–1Calculate equivalent
units, costs perequivalent units, costof goods completed,
and cost of endinginventory (L.O. 4)
� Required
Problem 3–2Problem 3–2Problem 3–2Problem 3–2Problem 3–2Prepare a production
cost report (L.O. 5)
� Required
Problem 3–3Problem 3–3Problem 3–3Problem 3–3Problem 3–3Prepare a production
cost report (L.O. 5)
Problems
The following data refer to a production center of Sipp-Fizz, a soft drink bottler:
Work in process inventory, August 1, 4,000 units (units equal 12-bottle cases):
Direct materials $12,000Direct labor 6,120Manufacturing overhead applied 8,000
$26,120
Units started in August 12,000Costs incurred in August:
Direct materials $36,000Direct labor 48,000Manufacturing overhead applied 60,000
The beginning inventory was 100% complete for materials and 50% complete for conversion costs.The ending inventory on August 31 consisted of 6,000 units (100% complete for
materials, 70% complete for conversion costs).
Compute the following:
a. Number of units completed and transferred to finished goods inventory.
b. The equivalent units of production for materials and conversion costs using the averagecost method.
c. Cost per equivalent unit for materials and conversion costs.
d. Cost of units completed and transferred.
e. Cost of ending inventory.
The following information relates to Aromatic Company for its line of perfume products for themonth ended March 31:
Units in beginning inventory (units equal cases of product) 2,700Cost of units in beginning inventory:
Materials $ 40,500Conversion $ 18,900
Units placed in production 54,000Cost incurred during current period:
Materials $239,598Conversion $215,310Units remaining in ending inventory
(100% complete as to materials,60% complete as to conversion) 3,000
Prepare a production cost report for the month ended March 31, using the average cost method.
Shine Company uses a process cost system to account for the costs incurred in making its singleproduct, a hair conditioner. This product is processed in Department A and then in Department B.Materials are added in both departments. Production for May was as follows:
DepartmentDepartmentDepartmentDepartmentDepartment DepartmentDepartmentDepartmentDepartmentDepartmentAAAAA BBBBB
Units started or transferred in 200,000 160,000Units completed and transferred out 160,000 120,000Stage of completion of May 31 inventory:
Materials 100% 80%Conversion 50% 40%
Costs incurred this month:
Direct materials costs $200,000 $304,000Conversion costs $540,000 $272,000
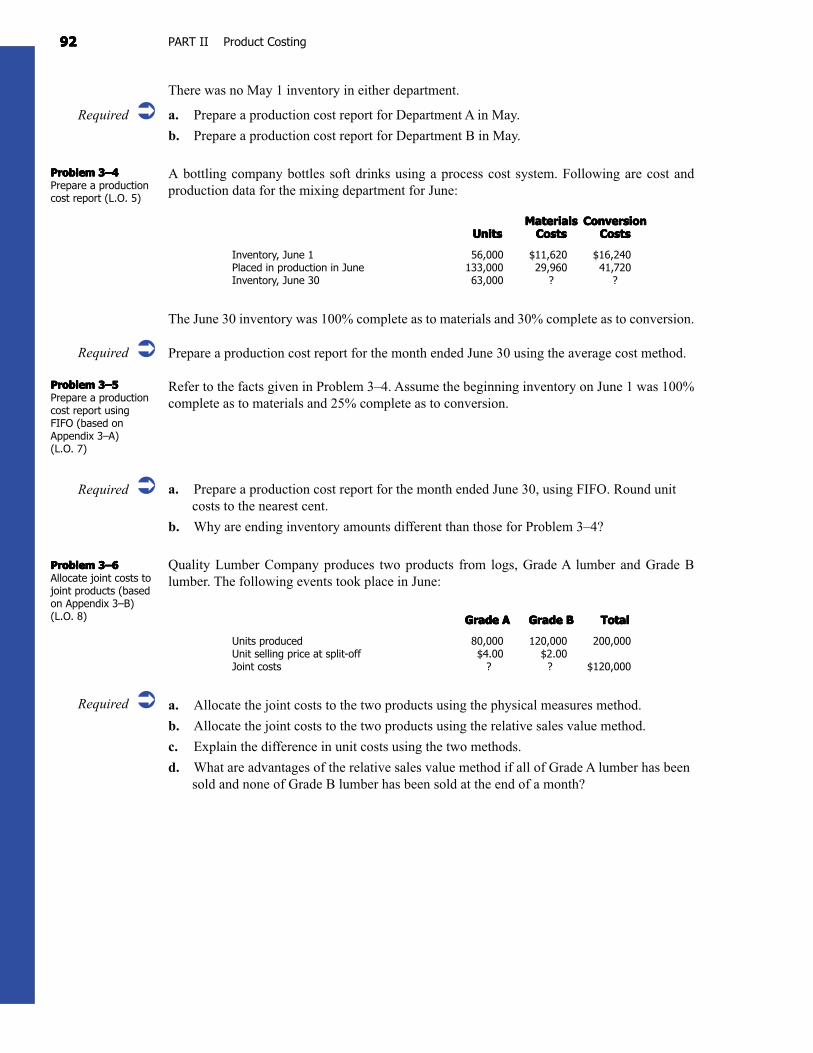
9292929292 PART II Product Costing
There was no May 1 inventory in either department.
a. Prepare a production cost report for Department A in May.
b. Prepare a production cost report for Department B in May.
A bottling company bottles soft drinks using a process cost system. Following are cost andproduction data for the mixing department for June:
MaterialsMaterialsMaterialsMaterialsMaterials ConversionConversionConversionConversionConversionUnitsUnitsUnitsUnitsUnits CostsCostsCostsCostsCosts CostsCostsCostsCostsCosts
Inventory, June 1 56,000 $11,620 $16,240Placed in production in June 133,000 29,960 41,720Inventory, June 30 63,000 ? ?
The June 30 inventory was 100% complete as to materials and 30% complete as to conversion.
Prepare a production cost report for the month ended June 30 using the average cost method.
Refer to the facts given in Problem 3–4. Assume the beginning inventory on June 1 was 100%complete as to materials and 25% complete as to conversion.
a. Prepare a production cost report for the month ended June 30, using FIFO. Round unitcosts to the nearest cent.
b. Why are ending inventory amounts different than those for Problem 3–4?
Quality Lumber Company produces two products from logs, Grade A lumber and Grade Blumber. The following events took place in June:
Grade AGrade AGrade AGrade AGrade A Grade BGrade BGrade BGrade BGrade B TotalTotalTotalTotalTotal
Units produced 80,000 120,000 200,000Unit selling price at split-off $4.00 $2.00Joint costs ? ? $120,000
a. Allocate the joint costs to the two products using the physical measures method.
b. Allocate the joint costs to the two products using the relative sales value method.
c. Explain the difference in unit costs using the two methods.
d. What are advantages of the relative sales value method if all of Grade A lumber has beensold and none of Grade B lumber has been sold at the end of a month?
Required �
Problem 3–4Problem 3–4Problem 3–4Problem 3–4Problem 3–4Prepare a productioncost report (L.O. 5)
Required �Problem 3–5Problem 3–5Problem 3–5Problem 3–5Problem 3–5Prepare a productioncost report usingFIFO (based onAppendix 3–A)(L.O. 7)
Required �
Problem 3–6Problem 3–6Problem 3–6Problem 3–6Problem 3–6Allocate joint costs tojoint products (basedon Appendix 3–B)(L.O. 8)
Required �
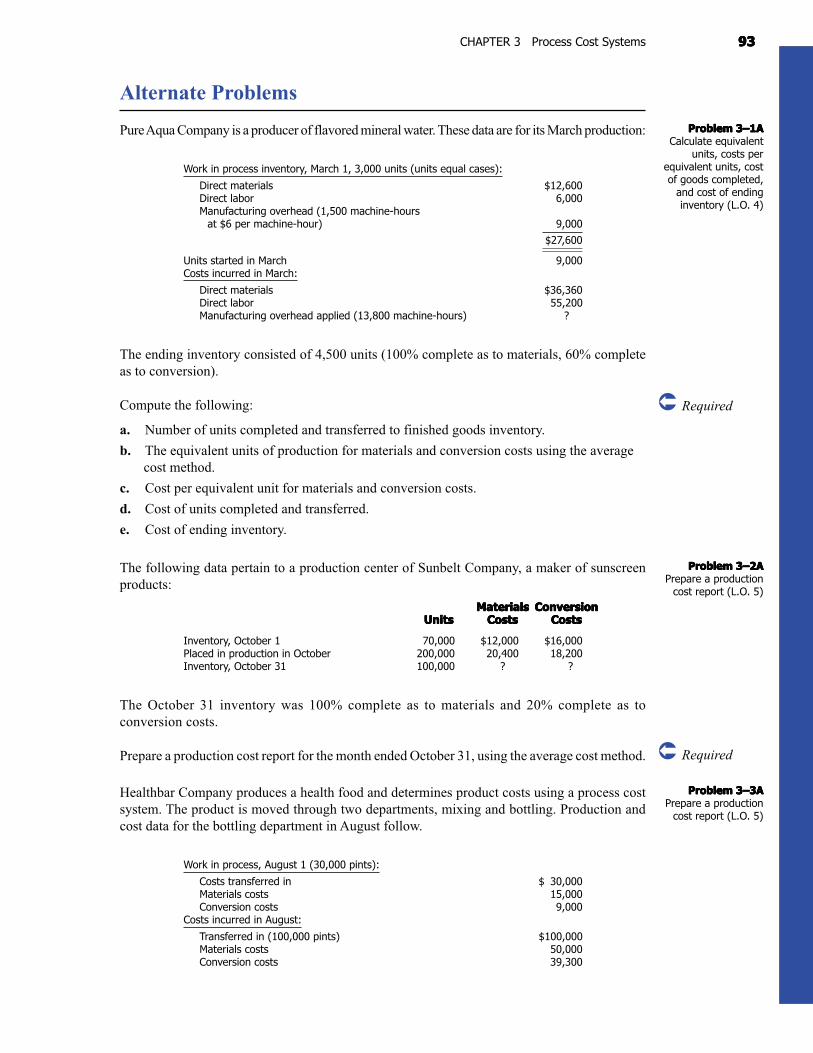
9393939393CHAPTER 3 Process Cost Systems
Problem 3–1AProblem 3–1AProblem 3–1AProblem 3–1AProblem 3–1ACalculate equivalent
units, costs perequivalent units, costof goods completed,
and cost of endinginventory (L.O. 4)
� Required
Problem 3–2AProblem 3–2AProblem 3–2AProblem 3–2AProblem 3–2APrepare a production
cost report (L.O. 5)
� Required
Problem 3–3AProblem 3–3AProblem 3–3AProblem 3–3AProblem 3–3APrepare a production
cost report (L.O. 5)
Alternate Problems
Pure Aqua Company is a producer of flavored mineral water. These data are for its March production:
Work in process inventory, March 1, 3,000 units (units equal cases):
Direct materials $12,600Direct labor 6,000Manufacturing overhead (1,500 machine-hours
at $6 per machine-hour) 9,000
$27,600
Units started in March 9,000Costs incurred in March:
Direct materials $36,360Direct labor 55,200Manufacturing overhead applied (13,800 machine-hours) ?
The ending inventory consisted of 4,500 units (100% complete as to materials, 60% completeas to conversion).
Compute the following:
a. Number of units completed and transferred to finished goods inventory.
b. The equivalent units of production for materials and conversion costs using the averagecost method.
c. Cost per equivalent unit for materials and conversion costs.
d. Cost of units completed and transferred.
e. Cost of ending inventory.
The following data pertain to a production center of Sunbelt Company, a maker of sunscreenproducts:
MaterialsMaterialsMaterialsMaterialsMaterials ConversionConversionConversionConversionConversionUnitsUnitsUnitsUnitsUnits CostsCostsCostsCostsCosts CostsCostsCostsCostsCosts
Inventory, October 1 70,000 $12,000 $16,000Placed in production in October 200,000 20,400 18,200Inventory, October 31 100,000 ? ?
The October 31 inventory was 100% complete as to materials and 20% complete as toconversion costs.
Prepare a production cost report for the month ended October 31, using the average cost method.
Healthbar Company produces a health food and determines product costs using a process costsystem. The product is moved through two departments, mixing and bottling. Production andcost data for the bottling department in August follow.
Work in process, August 1 (30,000 pints):
Costs transferred in $ 30,000Materials costs 15,000Conversion costs 9,000
Costs incurred in August:
Transferred in (100,000 pints) $100,000Materials costs 50,000Conversion costs 39,300
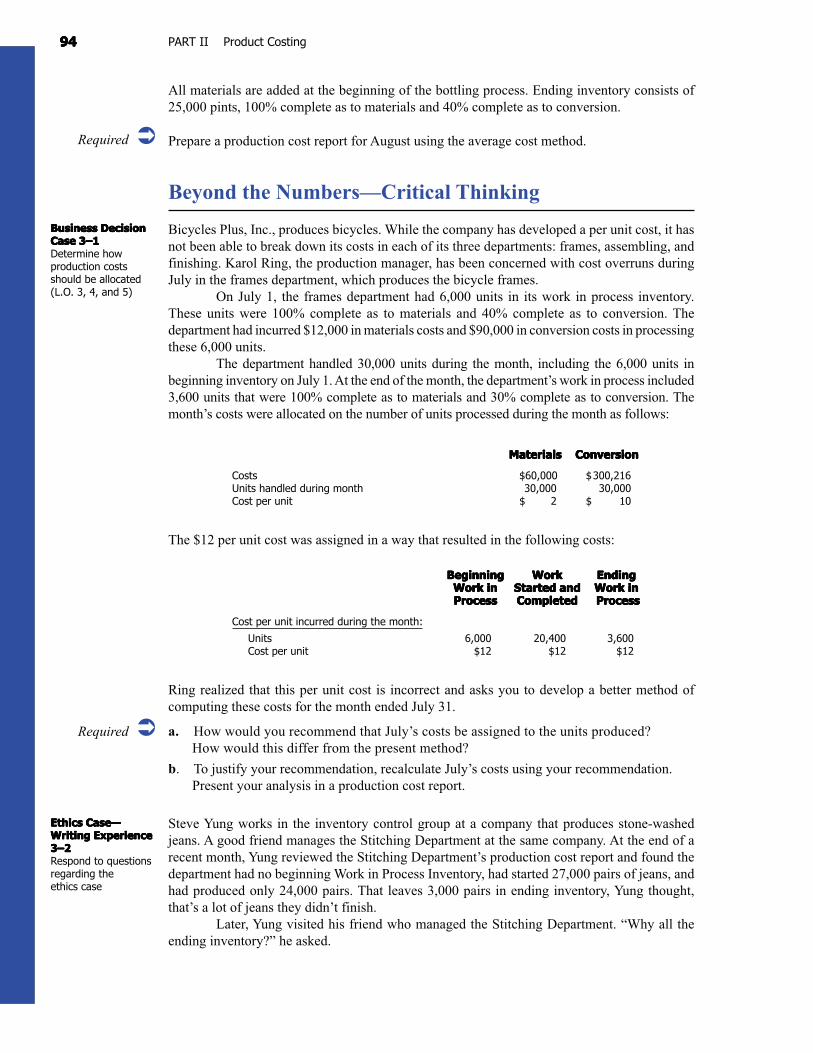
9494949494 PART II Product Costing
All materials are added at the beginning of the bottling process. Ending inventory consists of25,000 pints, 100% complete as to materials and 40% complete as to conversion.
Prepare a production cost report for August using the average cost method.
Beyond the Numbers—Critical Thinking
Bicycles Plus, Inc., produces bicycles. While the company has developed a per unit cost, it hasnot been able to break down its costs in each of its three departments: frames, assembling, andfinishing. Karol Ring, the production manager, has been concerned with cost overruns duringJuly in the frames department, which produces the bicycle frames.
On July 1, the frames department had 6,000 units in its work in process inventory.These units were 100% complete as to materials and 40% complete as to conversion. Thedepartment had incurred $12,000 in materials costs and $90,000 in conversion costs in processingthese 6,000 units.
The department handled 30,000 units during the month, including the 6,000 units inbeginning inventory on July 1. At the end of the month, the department’s work in process included3,600 units that were 100% complete as to materials and 30% complete as to conversion. Themonth’s costs were allocated on the number of units processed during the month as follows:
MaterialsMaterialsMaterialsMaterialsMaterials ConversionConversionConversionConversionConversion
Costs $60,000 $300,216Units handled during month 30,000 30,000Cost per unit $ 2 $ 10
The $12 per unit cost was assigned in a way that resulted in the following costs:
BeginningBeginningBeginningBeginningBeginning WorkWorkWorkWorkWork EndingEndingEndingEndingEndingWork inWork inWork inWork inWork in Started andStarted andStarted andStarted andStarted and Work inWork inWork inWork inWork inProcessProcessProcessProcessProcess CompletedCompletedCompletedCompletedCompleted Process Process Process Process Process
Cost per unit incurred during the month:
Units 6,000 20,400 3,600Cost per unit $12 $12 $12
Ring realized that this per unit cost is incorrect and asks you to develop a better method ofcomputing these costs for the month ended July 31.
a. How would you recommend that July’s costs be assigned to the units produced?How would this differ from the present method?
b. To justify your recommendation, recalculate July’s costs using your recommendation.Present your analysis in a production cost report.
Steve Yung works in the inventory control group at a company that produces stone-washedjeans. A good friend manages the Stitching Department at the same company. At the end of arecent month, Yung reviewed the Stitching Department’s production cost report and found thedepartment had no beginning Work in Process Inventory, had started 27,000 pairs of jeans, andhad produced only 24,000 pairs. That leaves 3,000 pairs in ending inventory, Yung thought,that’s a lot of jeans they didn’t finish.
Later, Yung visited his friend who managed the Stitching Department. “Why all theending inventory?” he asked.
Required �
Business DecisionBusiness DecisionBusiness DecisionBusiness DecisionBusiness DecisionCase 3–1Case 3–1Case 3–1Case 3–1Case 3–1Determine howproduction costsshould be allocated(L.O. 3, 4, and 5)
Required �
Ethics Case—Ethics Case—Ethics Case—Ethics Case—Ethics Case—Writing ExperienceWriting ExperienceWriting ExperienceWriting ExperienceWriting Experience3–23–23–23–23–2Respond to questionsregarding theethics case
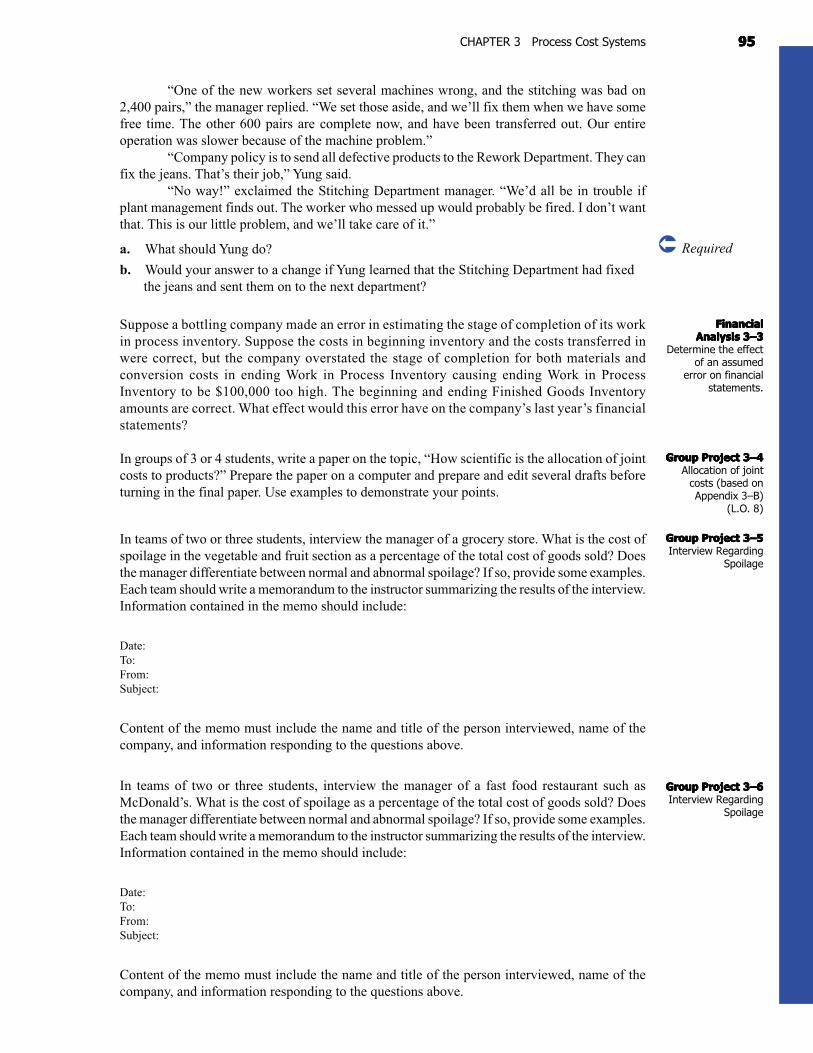
9595959595CHAPTER 3 Process Cost Systems
� Required
FinancialFinancialFinancialFinancialFinancialAnalysis 3–3Analysis 3–3Analysis 3–3Analysis 3–3Analysis 3–3
Determine the effectof an assumed
error on financialstatements.
Group Project 3–4Group Project 3–4Group Project 3–4Group Project 3–4Group Project 3–4Allocation of joint
costs (based onAppendix 3–B)
(L.O. 8)
Group Project 3–5Group Project 3–5Group Project 3–5Group Project 3–5Group Project 3–5Interview Regarding
Spoilage
Group Project 3–6Group Project 3–6Group Project 3–6Group Project 3–6Group Project 3–6Interview Regarding
Spoilage
“One of the new workers set several machines wrong, and the stitching was bad on2,400 pairs,” the manager replied. “We set those aside, and we’ll fix them when we have somefree time. The other 600 pairs are complete now, and have been transferred out. Our entireoperation was slower because of the machine problem.”
“Company policy is to send all defective products to the Rework Department. They canfix the jeans. That’s their job,” Yung said.
“No way!” exclaimed the Stitching Department manager. “We’d all be in trouble ifplant management finds out. The worker who messed up would probably be fired. I don’t wantthat. This is our little problem, and we’ll take care of it.”
a. What should Yung do?
b. Would your answer to a change if Yung learned that the Stitching Department had fixedthe jeans and sent them on to the next department?
Suppose a bottling company made an error in estimating the stage of completion of its workin process inventory. Suppose the costs in beginning inventory and the costs transferred inwere correct, but the company overstated the stage of completion for both materials andconversion costs in ending Work in Process Inventory causing ending Work in ProcessInventory to be $100,000 too high. The beginning and ending Finished Goods Inventoryamounts are correct. What effect would this error have on the company’s last year’s financialstatements?
In groups of 3 or 4 students, write a paper on the topic, “How scientific is the allocation of jointcosts to products?” Prepare the paper on a computer and prepare and edit several drafts beforeturning in the final paper. Use examples to demonstrate your points.
In teams of two or three students, interview the manager of a grocery store. What is the cost ofspoilage in the vegetable and fruit section as a percentage of the total cost of goods sold? Doesthe manager differentiate between normal and abnormal spoilage? If so, provide some examples.Each team should write a memorandum to the instructor summarizing the results of the interview.Information contained in the memo should include:
Date:To:From:Subject:
Content of the memo must include the name and title of the person interviewed, name of thecompany, and information responding to the questions above.
In teams of two or three students, interview the manager of a fast food restaurant such asMcDonald’s. What is the cost of spoilage as a percentage of the total cost of goods sold? Doesthe manager differentiate between normal and abnormal spoilage? If so, provide some examples.Each team should write a memorandum to the instructor summarizing the results of the interview.Information contained in the memo should include:
Date:To:From:Subject:
Content of the memo must include the name and title of the person interviewed, name of thecompany, and information responding to the questions above.
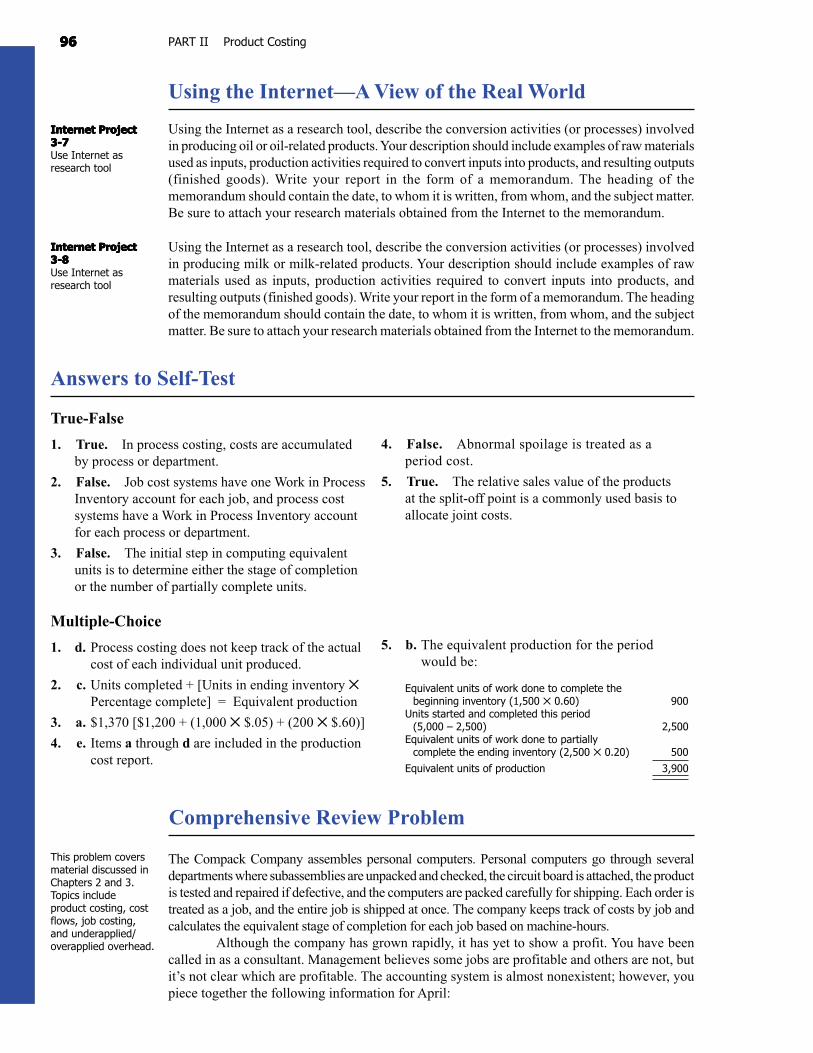
9696969696 PART II Product Costing
Using the Internet—A View of the Real World
Using the Internet as a research tool, describe the conversion activities (or processes) involvedin producing oil or oil-related products. Your description should include examples of raw materialsused as inputs, production activities required to convert inputs into products, and resulting outputs(finished goods). Write your report in the form of a memorandum. The heading of thememorandum should contain the date, to whom it is written, from whom, and the subject matter.Be sure to attach your research materials obtained from the Internet to the memorandum.
Using the Internet as a research tool, describe the conversion activities (or processes) involvedin producing milk or milk-related products. Your description should include examples of rawmaterials used as inputs, production activities required to convert inputs into products, andresulting outputs (finished goods). Write your report in the form of a memorandum. The headingof the memorandum should contain the date, to whom it is written, from whom, and the subjectmatter. Be sure to attach your research materials obtained from the Internet to the memorandum.
Internet ProjectInternet ProjectInternet ProjectInternet ProjectInternet Project3-73-73-73-73-7Use Internet asresearch tool
Internet ProjectInternet ProjectInternet ProjectInternet ProjectInternet Project3-83-83-83-83-8Use Internet asresearch tool
This problem coversmaterial discussed inChapters 2 and 3.Topics includeproduct costing, costflows, job costing,and underapplied/overapplied overhead.
The Compack Company assembles personal computers. Personal computers go through severaldepartments where subassemblies are unpacked and checked, the circuit board is attached, the productis tested and repaired if defective, and the computers are packed carefully for shipping. Each order istreated as a job, and the entire job is shipped at once. The company keeps track of costs by job andcalculates the equivalent stage of completion for each job based on machine-hours.
Although the company has grown rapidly, it has yet to show a profit. You have beencalled in as a consultant. Management believes some jobs are profitable and others are not, butit’s not clear which are profitable. The accounting system is almost nonexistent; however, youpiece together the following information for April:
Answers to Self-Test
True-False
1. True. In process costing, costs are accumulatedby process or department.
2. False. Job cost systems have one Work in ProcessInventory account for each job, and process costsystems have a Work in Process Inventory accountfor each process or department.
3. False. The initial step in computing equivalentunits is to determine either the stage of completionor the number of partially complete units.
4. False. Abnormal spoilage is treated as aperiod cost.
5. True. The relative sales value of the productsat the split-off point is a commonly used basis toallocate joint costs.
Multiple-Choice
1. d. Process costing does not keep track of the actualcost of each individual unit produced.
2. c. Units completed + [Units in ending inventory ✕Percentage complete] = Equivalent production
3. a. $1,370 [$1,200 + (1,000 ✕ $.05) + (200 ✕ $.60)]
4. e. Items a through d are included in the productioncost report.
5. b. The equivalent production for the periodwould be:
Equivalent units of work done to complete thebeginning inventory (1,500 ✕ 0.60) 900
Units started and completed this period(5,000 – 2,500) 2,500
Equivalent units of work done to partiallycomplete the ending inventory (2,500 ✕ 0.20) 500
Equivalent units of production 3,900
Comprehensive Review Problem
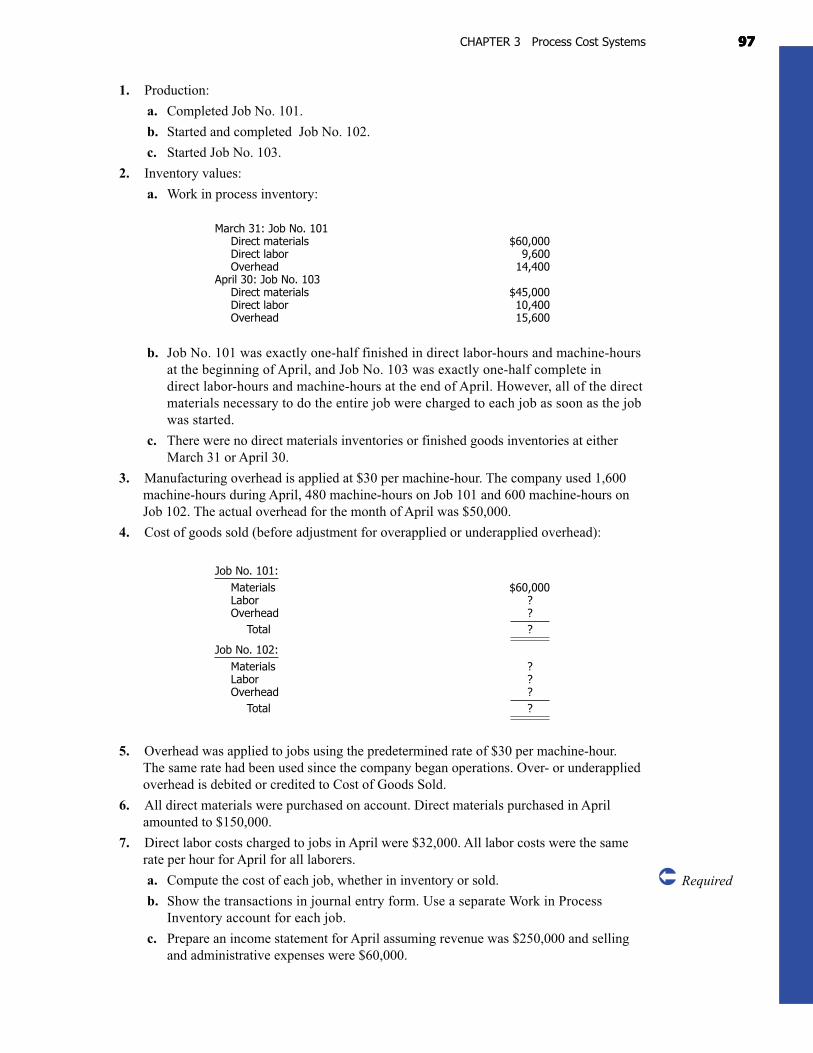
9797979797CHAPTER 3 Process Cost Systems
1. Production:
a. Completed Job No. 101.
b. Started and completed Job No. 102.
c. Started Job No. 103.
2. Inventory values:
a. Work in process inventory:
March 31: Job No. 101Direct materials $60,000Direct labor 9,600Overhead 14,400
April 30: Job No. 103Direct materials $45,000Direct labor 10,400Overhead 15,600
b. Job No. 101 was exactly one-half finished in direct labor-hours and machine-hoursat the beginning of April, and Job No. 103 was exactly one-half complete indirect labor-hours and machine-hours at the end of April. However, all of the directmaterials necessary to do the entire job were charged to each job as soon as the jobwas started.
c. There were no direct materials inventories or finished goods inventories at eitherMarch 31 or April 30.
3. Manufacturing overhead is applied at $30 per machine-hour. The company used 1,600machine-hours during April, 480 machine-hours on Job 101 and 600 machine-hours onJob 102. The actual overhead for the month of April was $50,000.
4. Cost of goods sold (before adjustment for overapplied or underapplied overhead):
Job No. 101:Materials $60,000Labor ?Overhead ?
Total ?
Job No. 102:Materials ?Labor ?Overhead ?
Total ?
5. Overhead was applied to jobs using the predetermined rate of $30 per machine-hour.The same rate had been used since the company began operations. Over- or underappliedoverhead is debited or credited to Cost of Goods Sold.
6. All direct materials were purchased on account. Direct materials purchased in Aprilamounted to $150,000.
7. Direct labor costs charged to jobs in April were $32,000. All labor costs were the samerate per hour for April for all laborers.
a. Compute the cost of each job, whether in inventory or sold.
b. Show the transactions in journal entry form. Use a separate Work in ProcessInventory account for each job.
c. Prepare an income statement for April assuming revenue was $250,000 and sellingand administrative expenses were $60,000.
� Required