Embed Size (px)
Citation preview
MANAGEMENT’S RESPONSIBILITY FOR FINANCIAL REPORTING
The accompanying financial statements have been prepared by the management of Encasa Financial Inc. as the manager (the “Manager”)
of the Social Housing Investment Funds (the “Funds”) and approved by the Board of Directors of Encasa Financial Inc. The management
is responsible for the information and representations contained in these financial statements. The Board of Directors is responsible for
reviewing and approving the financial statements and overseeing management’s performance of its financial reporting responsibilities.
Encasa Financial Inc. maintains appropriate processes to ensure that relevant and reliable financial information is produced. The financial
statements have been prepared in compliance with International Financial Reporting Standards (“IFRS”) and include certain amounts that are
based on estimates and judgments. The significant accounting policies which management believes are appropriate for the Funds are described
in Note 3 to the financial statements.
Howie Wong Derek BallantyneChair, Audit Committee CEOEncasa Financial Inc. Encasa Financial Inc.
March 19, 2018

We have audited the accompanying financial statements of each of the Funds, which comprise the statements of financial position, comprehensive
income, cash flows and changes in net assets attributable to holders of redeemable units as at and for the periods indicated in note 2, and the
related notes, which comprise a summary of significant accounting policies and other explanatory information.
Management’s responsibility for the financial statementsManagement is responsible for the preparation and fair presentation of the financial statements of each of the Funds in accordance with International
Financial Reporting Standards, and for such internal control as management determines is necessary to enable the preparation of financial statements
that are free from material misstatement, whether due to fraud or error.
Auditor’s responsibilityOur responsibility is to express an opinion on the financial statements of each of the Funds based on our audits. We conducted our audits in
accordance with Canadian generally accepted auditing standards. Those standards require that we comply with ethical requirements and plan and
perform the audits to obtain reasonable assurance about whether the financial statements are free from material misstatement.
An audit involves performing procedures to obtain audit evidence about the amounts and disclosures in the financial statements. The procedures
selected depend on the auditor’s judgment, including the assessment of the risks of material misstatement of the financial statements, whether due
to fraud or error. In making those risk assessments, the auditor considers internal control relevant to the entity’s preparation and fair presentation
of the financial statements in order to design audit procedures that are appropriate in the circumstances, but not for the purpose of expressing an
opinion on the effectiveness of the entity’s internal control. An audit also includes evaluating the appropriateness of accounting policies used and the
reasonableness of accounting estimates made by management, as well as evaluating the overall presentation of the financial statements.
We believe that the audit evidence we have obtained in each of our audits is sufficient and appropriate to provide a basis for our audit opinion.
OpinionIn our opinion, the financial statements of each of the Funds present fairly, in all material respects, the financial position, financial performance and
cash flows of each of the Funds as at and for the periods indicated in note 2, in accordance with International Financial Reporting Standards.
Chartered Professional Accountants, Licensed Public Accountants
Toronto, OntarioMarch 19, 2018
To the Unitholders of:
Social Housing Canadian Short-Term Bond FundSocial Housing Canadian Bond FundSocial Housing Canadian Equity Fund(collectively referred to as the “Funds”)
INDEPENDENT AUDITOR’S REPORT

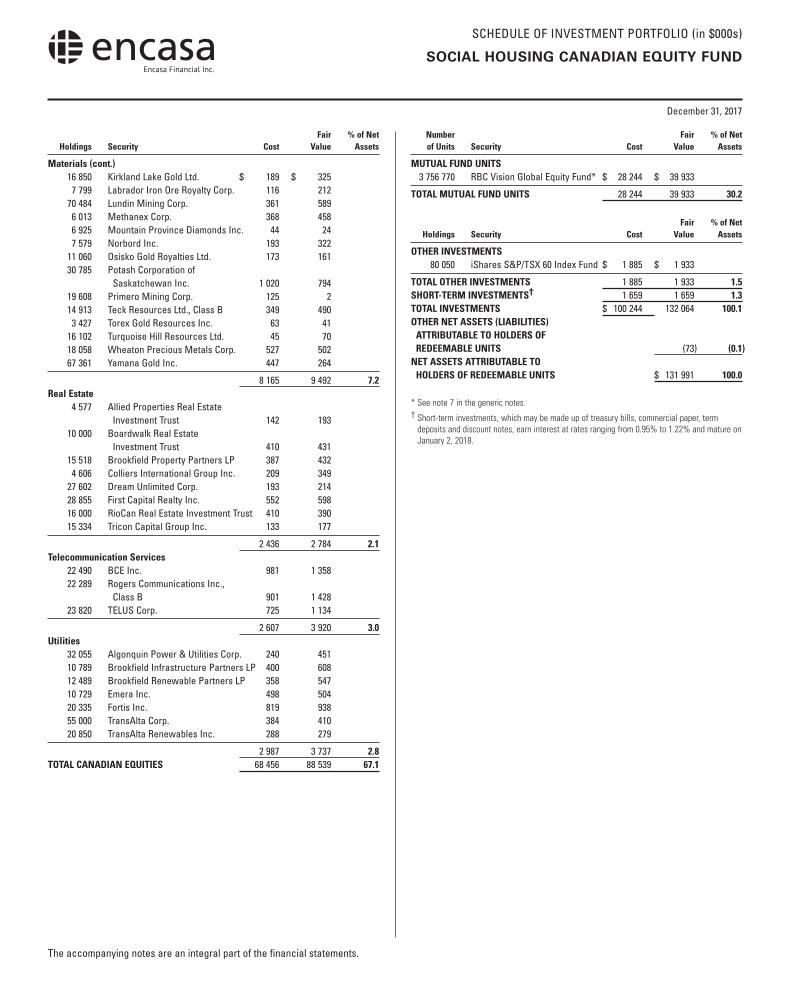
SCHEDULE OF INVESTMENT PORTFOLIO (in $000s)
2017 ANNUAL FINANCIAL STATEMENTS
December 31, 2017
The accompanying notes are an integral part of the financial statements.
SOCIAL HOUSING CANADIAN EQUITY FUND
Fair % of Net Holdings Security Cost Value Assets
CANADIAN EQUITIESConsumer Discretionary 7 000 Cineplex Inc. $ 353 $ 261 36 500 Freshii Inc. 290 268 22 823 Gildan Activewear Inc., Class A 527 927 1 908 Linamar Corp. 83 140 11 111 Magna International Inc., Class A 499 792 23 300 Quebecor Inc., Class B 298 552 11 264 Restaurant Brands International Inc. 562 870 28 197 Shaw Communications Inc., Class B 658 809
3 270 4 619 3.5Consumer Staples 23 579 Cott Corporation 321 495 8 700 Jamieson Wellness Inc. 137 194 16 973 Loblaw Companies Ltd. 806 1 158 13 547 Maple Leaf Foods Inc. 259 485 9 300 Metro Inc., Class A 373 374 14 675 Saputo Group Inc. 620 663
2 516 3 369 2.5Energy 6 670 AltaGas Ltd. 218 191 23 838 ARC Resources Ltd. 531 352 47 100 Bonavista Energy Corp. 311 105 28 142 Cameco Corp. 506 326 50 443 Canadian Natural Resources Ltd. 1 806 2 265 21 881 Crescent Point Energy Corp. 610 209 43 630 Crew Energy Inc. 303 137 64 232 Enbridge Inc. 3 592 3 158 59 544 Encana Corp. 958 999 4 711 Gibson Energy Inc. 76 86 16 699 Husky Energy Inc. 437 296 12 219 Imperial Oil Ltd. 540 479 23 319 Kelt Exploration Ltd. 152 168 11 727 Keyera Corp. 314 415 69 653 Nuvista Energy Ltd. 534 559 28 000 Pembina Pipeline Corp. 997 1 274 28 002 PrairieSky Royalty Ltd. 838 898 19 662 Precision Drilling Corp. 190 75 30 262 Raging River Exploration Inc. 248 242 10 729 Seven Generations Energy Ltd. 306 191 8 172 ShawCor Ltd. 260 224 23 731 Spartan Energy Corp. 229 171 66 621 Suncor Energy Inc. 2 254 3 075 14 614 Tourmaline Oil Corp. 526 333 38 931 TransCanada Corp. 1 799 2 382 16 967 Trinidad Drilling Ltd. 112 29
18 647 18 639 14.1
Fair % of Net Holdings Security Cost Value Assets
Financials 25 993 Bank of Montreal $ 1 861 $ 2 615 50 953 Bank of Nova Scotia 2 934 4 133 48 737 Brookfield Asset Management Inc., Class A 1 558 2 667 11 745 Canaccord Genuity Group Inc. 120 68 14 744 Canadian Imperial Bank of Commerce 1 347 1 807 58 000 ECN Capital Corp. 210 228 29 070 Element Fleet Management Corp. 386 276 25 332 Fiera Capital Corp. 328 329 5 191 Intact Financial Corp. 416 545 79 861 Manulife Financial Corporation 1 679 2 094 13 740 National Bank of Canada 651 862 6 026 Onex Corporation 372 556 36 082 Power Corporation of Canada 1 103 1 168 59 872 Royal Bank of Canada* 3 835 6 146 21 418 Sun Life Financial Inc. 788 1 111 13 427 Thomson Corp. 557 736 72 688 Toronto-Dominion Bank 2 936 5 353
21 081 30 694 23.3Health Care 30 229 Chartwell Retirement Residences Real Estate Investment Trust 367 492
367 492 0.4Industrials 17 574 Air Canada 145 455 11 809 Brookfield Business Partners LP 379 511 30 470 Canadian National Railway Co. 1 294 3 158 9 506 Canadian Pacific Railway Ltd. 1 482 2 183 15 500 Finning International Inc. 461 492 7 728 Russel Metals Inc. 180 225 13 984 Waste Connections Inc. 802 1 247
4 743 8 271 6.3Information Technology 10 890 CGI Group Inc., Class A 342 744 3 111 Descartes Systems Group Inc. 77 111 5 000 Kinaxis Inc. 359 384 10 578 Open Text Corp. 243 473 30 000 Real Matters Inc. 267 302 4 000 Shopify Inc., Class A 349 508
1 637 2 522 1.9Materials 19 593 Agnico Eagle Mines Ltd. 689 1 137 5 775 Agrium Inc. 647 835 16 663 Detour Gold Corp. 225 246 48 225 Eldorado Gold Corp. 336 88 10 440 Franco-Nevada Corp. 569 1 049 29 225 Goldcorp Inc. 606 468 29 650 Hudbay Minerals Inc. 238 330 27 986 Interfor Corp. 330 591 91 183 Kinross Gold Corp. 505 494
SCHEDULE OF INVESTMENT PORTFOLIO (in $000s)
December 31, 2017
The accompanying notes are an integral part of the financial statements.
SOCIAL HOUSING CANADIAN EQUITY FUND
Fair % of Net Holdings Security Cost Value Assets
Materials (cont.) 16 850 Kirkland Lake Gold Ltd. $ 189 $ 325 7 799 Labrador Iron Ore Royalty Corp. 116 212 70 484 Lundin Mining Corp. 361 589 6 013 Methanex Corp. 368 458 6 925 Mountain Province Diamonds Inc. 44 24 7 579 Norbord Inc. 193 322 11 060 Osisko Gold Royalties Ltd. 173 161 30 785 Potash Corporation of Saskatchewan Inc. 1 020 794 19 608 Primero Mining Corp. 125 2 14 913 Teck Resources Ltd., Class B 349 490 3 427 Torex Gold Resources Inc. 63 41 16 102 Turquoise Hill Resources Ltd. 45 70 18 058 Wheaton Precious Metals Corp. 527 502 67 361 Yamana Gold Inc. 447 264
8 165 9 492 7.2Real Estate 4 577 Allied Properties Real Estate Investment Trust 142 193 10 000 Boardwalk Real Estate Investment Trust 410 431 15 518 Brookfield Property Partners LP 387 432 4 606 Colliers International Group Inc. 209 349 27 602 Dream Unlimited Corp. 193 214 28 855 First Capital Realty Inc. 552 598 16 000 RioCan Real Estate Investment Trust 410 390 15 334 Tricon Capital Group Inc. 133 177
2 436 2 784 2.1Telecommunication Services 22 490 BCE Inc. 981 1 358 22 289 Rogers Communications Inc., Class B 901 1 428 23 820 TELUS Corp. 725 1 134
2 607 3 920 3.0Utilities 32 055 Algonquin Power & Utilities Corp. 240 451 10 789 Brookfield Infrastructure Partners LP 400 608 12 489 Brookfield Renewable Partners LP 358 547 10 729 Emera Inc. 498 504 20 335 Fortis Inc. 819 938 55 000 TransAlta Corp. 384 410 20 850 TransAlta Renewables Inc. 288 279
2 987 3 737 2.8TOTAL CANADIAN EQUITIES 68 456 88 539 67.1
Number Fair % of Net of Units Security Cost Value Assets
MUTUAL FUND UNITS 3 756 770 RBC Vision Global Equity Fund* $ 28 244 $ 39 933
TOTAL MUTUAL FUND UNITS 28 244 39 933 30.2
Fair % of Net Holdings Security Cost Value Assets
OTHER INVESTMENTS 80 050 iShares S&P/TSX 60 Index Fund $ 1 885 $ 1 933
TOTAL OTHER INVESTMENTS 1 885 1 933 1.5SHORT-TERM INVESTMENTS† 1 659 1 659 1.3TOTAL INVESTMENTS $ 100 244 132 064 100.1OTHER NET ASSETS (LIABILITIES) ATTRIBUTABLE TO HOLDERS OF REDEEMABLE UNITS (73) (0.1)NET ASSETS ATTRIBUTABLE TO HOLDERS OF REDEEMABLE UNITS $ 131 991 100.0
* See note 7 in the generic notes.† Short-term investments, which may be made up of treasury bills, commercial paper, term
deposits and discount notes, earn interest at rates ranging from 0.95% to 1.22% and mature on January 2, 2018.

FINANCIAL STATEMENTS
The accompanying notes are an integral part of these financial statements.
SOCIAL HOUSING CANADIAN EQUITY FUND
Statements of Financial Position (in $000s except per unit amounts)
(see note 2 in the generic notes)December 31
2017December 31
2016
ASSETSInvestments at fair value $ 132 064 $ 119 138 Cash 71 74 Due from investment dealers 118 –Subscriptions receivable 131 43 Dividends receivable, interest accrued and other assets 214 188 TOTAL ASSETS 132 598 119 443 LIABILITIESDue to investment dealers 472 – Accounts payable and accrued expenses 135 123 TOTAL LIABILITIES EXCLUDING NET ASSETS ATTRIBUTABLE TO HOLDERS OF REDEEMABLE UNITS 607 123 NET ASSETS ATTRIBUTABLE TO HOLDERS OF REDEEMABLE UNITS (“NAV”) $ 131 991 $ 119 320
Investments at cost $ 100 244 $ 97 687
NAV SERIES A $ 128 917 $ 117 291 SERIES B $ 3 074 $ 2 029 NAV PER UNIT SERIES A $ 21.67 $ 19.42 SERIES B $ 10.47 $ 9.38
Statements of Comprehensive Income (in $000s except per unit amounts)
For the periods ended December 31 (see note 2 in the generic notes) 2017 2016
INCOME (see note 3 in the generic notes)Dividends $ 2 332 $ 2 240 Interest for distribution purposes 9 7 Other income (loss) 13 38 Other income received from underlying funds 582 625 Capital gains received from underlying funds 873 1 518 Net realized gain (loss) on investments 3 793 1 011 Net gain (loss) on foreign currencies and other net assets – 3 Change in unrealized gain (loss) on investments 10 369 10 258 TOTAL INCOME (LOSS) 17 971 15 700 EXPENSES (see notes – Fund Specific Information)Management fees 1 175 1 055 Filing fees 9 7 Legal fees 6 14 Audit fees 20 13 IRC fees 14 19 GST/HST 158 143 Transaction costs 35 52 Expenses reimbursed by Manager (6) (5)TOTAL EXPENSES 1 411 1 298 INCREASE (DECREASE) IN NAV $ 16 560 $ 14 402 INCREASE (DECREASE) IN NAV SERIES A $ 16 230 $ 14 201 SERIES B $ 330 $ 201 INCREASE (DECREASE) IN NAV PER UNIT SERIES A $ 2.78 $ 2.37 SERIES B $ 1.37 $ 1.20
FINANCIAL STATEMENTS
The accompanying notes are an integral part of these financial statements.
SOCIAL HOUSING CANADIAN EQUITY FUND
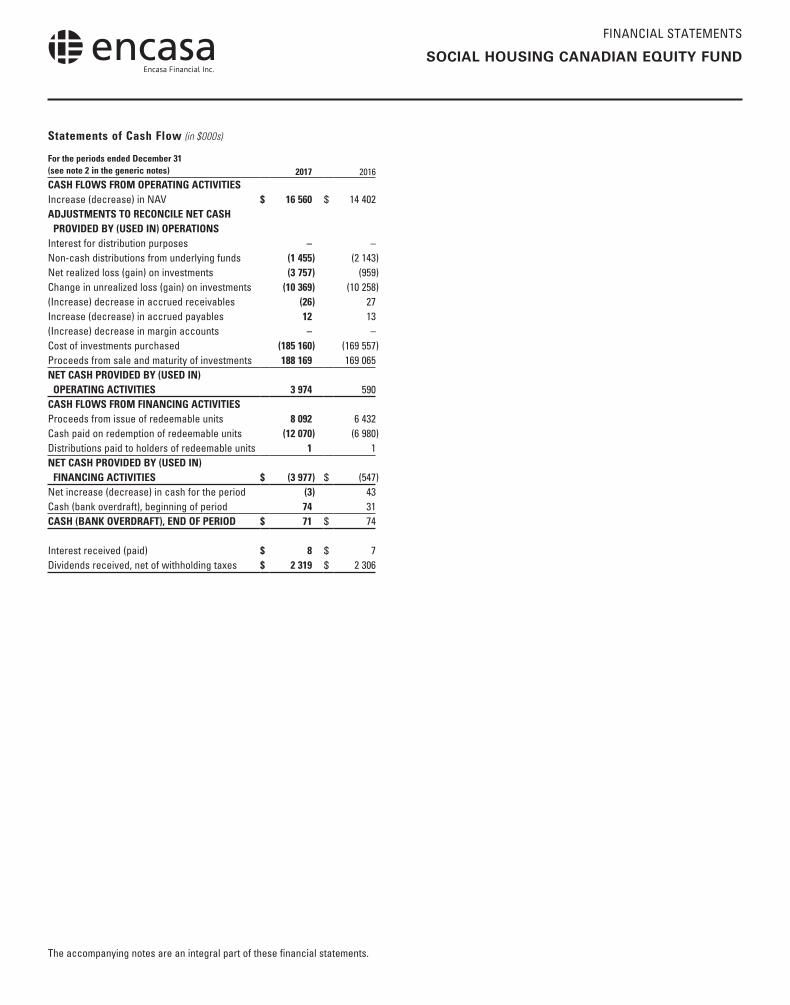
Statements of Cash Flow (in $000s)
For the periods ended December 31 (see note 2 in the generic notes) 2017 2016CASH FLOWS FROM OPERATING ACTIVITIESIncrease (decrease) in NAV $ 16 560 $ 14 402 ADJUSTMENTS TO RECONCILE NET CASH PROVIDED BY (USED IN) OPERATIONS Interest for distribution purposes – – Non-cash distributions from underlying funds (1 455) (2 143)Net realized loss (gain) on investments (3 757) (959)Change in unrealized loss (gain) on investments (10 369) (10 258)(Increase) decrease in accrued receivables (26) 27 Increase (decrease) in accrued payables 12 13 (Increase) decrease in margin accounts – – Cost of investments purchased (185 160) (169 557)Proceeds from sale and maturity of investments 188 169 169 065 NET CASH PROVIDED BY (USED IN) OPERATING ACTIVITIES 3 974 590 CASH FLOWS FROM FINANCING ACTIVITIESProceeds from issue of redeemable units 8 092 6 432 Cash paid on redemption of redeemable units (12 070) (6 980)Distributions paid to holders of redeemable units 1 1 NET CASH PROVIDED BY (USED IN) FINANCING ACTIVITIES $ (3 977) $ (547)Net increase (decrease) in cash for the period (3) 43 Cash (bank overdraft), beginning of period 74 31 CASH (BANK OVERDRAFT), END OF PERIOD $ 71 $ 74
Interest received (paid) $ 8 $ 7 Dividends received, net of withholding taxes $ 2 319 $ 2 306
FINANCIAL STATEMENTS
The accompanying notes are an integral part of these financial statements.
SOCIAL HOUSING CANADIAN EQUITY FUND
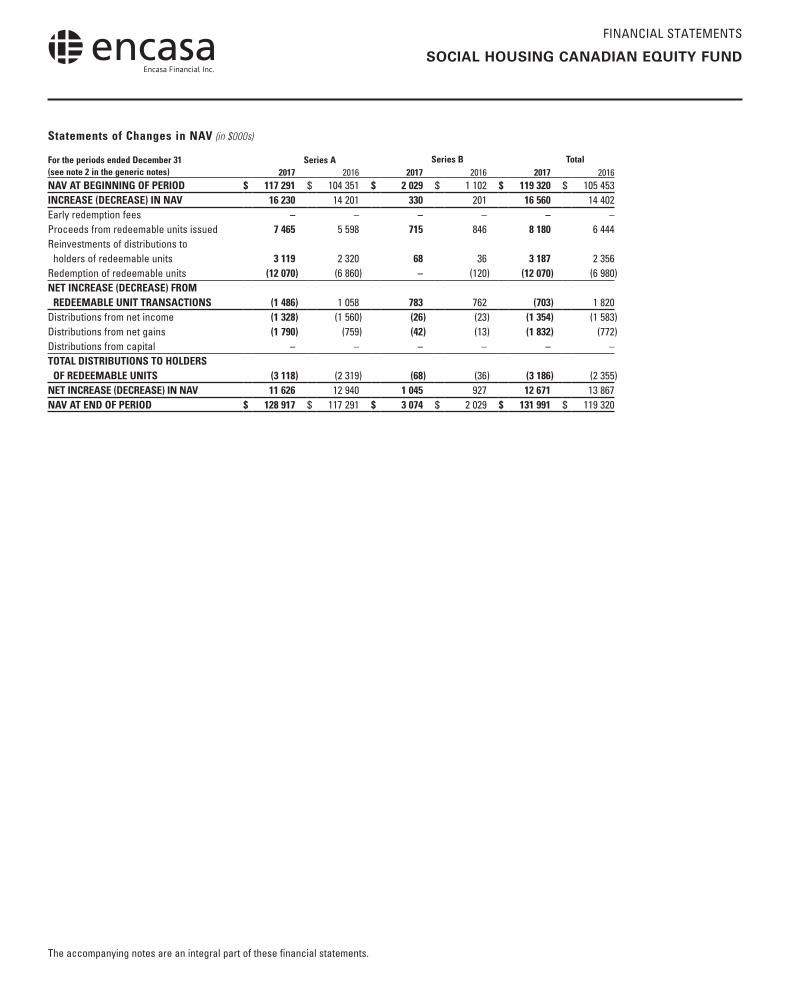
Statements of Changes in NAV (in $000s)
For the periods ended December 31 (see note 2 in the generic notes)
Series A Series B Total2017 2016 2017 2016 2017 2016
NAV AT BEGINNING OF PERIOD $ 117 291 $ 104 351 $ 2 029 $ 1 102 $ 119 320 $ 105 453 INCREASE (DECREASE) IN NAV 16 230 14 201 330 201 16 560 14 402 Early redemption fees – – – – – – Proceeds from redeemable units issued 7 465 5 598 715 846 8 180 6 444 Reinvestments of distributions to holders of redeemable units 3 119 2 320 68 36 3 187 2 356 Redemption of redeemable units (12 070) (6 860) – (120) (12 070) (6 980)NET INCREASE (DECREASE) FROM REDEEMABLE UNIT TRANSACTIONS (1 486) 1 058 783 762 (703) 1 820 Distributions from net income (1 328) (1 560) (26) (23) (1 354) (1 583)Distributions from net gains (1 790) (759) (42) (13) (1 832) (772)Distributions from capital – – – – – – TOTAL DISTRIBUTIONS TO HOLDERS OF REDEEMABLE UNITS (3 118) (2 319) (68) (36) (3 186) (2 355)NET INCREASE (DECREASE) IN NAV 11 626 12 940 1 045 927 12 671 13 867 NAV AT END OF PERIOD $ 128 917 $ 117 291 $ 3 074 $ 2 029 $ 131 991 $ 119 320

NOTES TO FINANCIAL STATEMENTS – FUND SPECIFIC INFORMATION
Please see the generic notes at the back of the financial statements.
December 31, 2017
SOCIAL HOUSING CANADIAN EQUITY FUND
General Information (see note 1 in the generic notes)
The investment objective of the Fund is to provide investors
with long-term capital growth by investing primarily in
a diversified portfolio of common shares of Canadian
companies, which are chosen primarily for their growth
potential and because they conduct themselves in a socially
responsible manner.
Financial Instrument Risk and Capital Management (see note 5 in the generic notes)
Concentration Risk (%)
The table below summarizes the Fund’s investment portfolio
(after consideration of derivative products, if any) as at:
Investment mixDecember 31
2017December 31
2016
Canadian Equities 68.6 68.7 United States Equities 17.3 16.7 Overseas Equities 12.3 13.2 Cash/Other 1.8 1.4 Total 100.0 100.0
Currency Risk (% of NAV)
The table below summarizes the Fund’s net exposure (after
hedging, if any) to currency risk as at:
CurrencyDecember 31
2017December 31
2016
United States dollar 19.6 18.5Euro 2.5 3.4Pound sterling 2.4 2.1Japanese yen 1.9 2.3Swiss franc 1.2 1.0South African rand 1.1 0.9Hong Kong dollar 1.0 0.7Danish krone – 0.7Philippine peso – 0.5Total 29.7 30.1
As at December 31, 2017, if the Canadian dollar had
strengthened or weakened by 5% in relation to the above
currencies, with all other factors kept constant, the Fund’s
NAV may have decreased or increased, respectively, by
approximately 1.5% (December 31, 2016 – 1.5%). In practice,
actual results could differ from this sensitivity analysis and
the difference could be material.
Other Price Risk (% impact on NAV)
The table below shows the impact of a 1% change in the broad-based index (noted below) on the Fund’s NAV, using a 36-month historical correlation of data of the Fund’s return and the index, with all other factors kept constant, as at:
December 31 2017
December 31 2016
S&P/TSX Capped Composite Total Return Index + or - 0.9 + or - 0.9
Since historical correlation may not be representative of future correlation, actual results could differ from this sensitivity analysis and the difference could be material.
Fair Value Hierarchy ($000s except % amounts) (see note 3 in the generic notes)
The following is a summary of the inputs used as of December 31, 2017 and 2016.
December 31, 2017 Level 1 Level 2 Level 3 Total
Equities 90 472 – – 90 472Mutual fund units 39 933 – – 39 933Fixed-income and debt securities – – – –Short-term investments – 1 659 – 1 659Derivatives – assets – – – –Derivatives – liabilities – – – –Total financial instruments 130 405 1 659 – 132 064% of total portfolio 98.7 1.3 – 100.0
December 31, 2016 Level 1 Level 2 Level 3 Total
Equities 82 004 – – 82 004Mutual fund units 35 827 – – 35 827Fixed-income and debt securities – – – –Short-term investments – 1 307 – 1 307Derivatives – assets – – – –Derivatives – liabilities – – – –Total financial instruments 117 831 1 307 – 119 138% of total portfolio 98.9 1.1 – 100.0
For the periods ended December 31, 2017 and 2016, there were no transfers of financial instruments between Level 1, Level 2 and Level 3.

NOTES TO FINANCIAL STATEMENTS – FUND SPECIFIC INFORMATION
Please see the generic notes at the back of the financial statements.
December 31, 2017
SOCIAL HOUSING CANADIAN EQUITY FUND
Management Fees
Encasa Financial Inc. is the Manager of the Fund and
manages the overall business affairs of the Fund, including
providing or arranging for administrative services and the
sale of units of the Fund. Management fees are paid monthly
in consideration for management, distribution, portfolio
management and other services.
Management fees for each series are calculated at the
following annual percentages, before GST/HST, of the daily
NAV of each series of the Fund.
Series A 1.00%Series B 1.20%
Investments by Related Parties ($000s except unit amounts)
Encasa Financial Inc., or its shareholders, held the following
investments in the Fund as at:
December 31 2017
December 31 2016
Units held Series A 43 433 27 875 Series B 33 862 33 088Value of all units 1 296 852
Unconsolidated Structured Entities (%) (see note 3 in the generic notes)
The table below summarizes the Fund’s interest in the
sponsored funds as a percentage of NAV, and the Fund’s
ownership interest as a percentage of NAV of the sponsored
funds (“Ownership”). All sponsored funds are established and
conduct business in Canada.
December 31 2017
December 31 2016
NAV Ownership NAV Ownership
Phillips, Hager & North Community Values Global Equity Fund – – 30.0 26.6RBC Vision Global Equity Fund 30.2 10.5 – –
The table below summarizes the Fund’s interest in the
unsponsored funds as a percentage of NAV, and the
Fund’s ownership interest as a percentage of NAV of the
unsponsored funds (“Ownership”).
December 31 2017
December 31 2016
NAV Ownership NAV Ownership
iShares S&P/TSX 60 Index Fund 1.5 – 0.1 –
Taxes ($000s) (see note 6 in the generic notes)
The Fund had no capital or non-capital losses as at
December 31, 2017.
Redeemable Units (000s)
There is no limitation on the number of units available for
issue. Units are purchased and redeemed at the NAV per unit.
For the periods ended December 31 (see note 2 in the generic notes) 2017 2016
Series A Opening units 6 040 5 984Issued number of units 358 309Reinvested number of units 144 119Redeemed number of units (594) (372)Ending number of units 5 948 6 040
Series B Opening units 216 131Issued number of units 72 96Reinvested number of units 6 4Redeemed number of units – (15)Ending number of units 294 216
Transaction Costs ($000s except %)
Transaction costs, including brokerage commissions, in
consideration of portfolio transactions for the periods ended:
December 31 2017
December 31 2016
$ % $ %
Total transaction costs 35 100 52 100Related-party brokerage commissions* 5 14 2 4Commission arrangements† 8 23 3 6* See note 7 in the generic notes.† Commission arrangements are part of commission amounts paid to dealers. The Fund uses
commission arrangements (formerly known as “soft dollars”) for research and/or order execution goods and services.

GENERIC NOTES TO FINANCIAL STATEMENTS
December 31, 2017
(also see Fund Specific Information)
1. The Funds
The Funds are open-ended mutual fund trusts established
under the laws of the Province of Ontario and governed
by a Master Trust Agreement. Encasa Financial Inc. (the
“Manager”) is the Manager of the Funds and its head office is
located at 119 Spadina Avenue, Suite 400, Toronto, Ontario.
The Funds may issue an unlimited number of units in some or
all of Series A and Series B.
Series A Units may be purchased by certain non-profit,
tax-exempt, prescribed housing providers under the
Housing Services Act, 2011 (Ontario) and other tax-exempt
housing-related organizations with the consent of the Manager.
Series B Units may be purchased by co-operative and non-profit
organizations, and also by taxable corporations engaged in a
social purpose in Canada with the consent of the Manager.
2. Financial Year/Period
The information provided in these financial statements
and notes thereto is for the 12-month periods ended or as
at December 31, 2017 and 2016, as applicable. In the year a
Fund or series is established, “period” represents the period
from inception to December 31 of that fiscal year.
3. Summary of Significant Accounting Policies
These financial statements have been prepared in compliance
with International Financial Reporting Standards (“IFRS”).
The significant accounting policies of the Funds, which are
investment entities, are as follows:
Classification of Financial Assets and Liabilities The
Funds’ financial assets and financial liabilities, other than
derivatives, are designated at fair value through profit or
loss at inception, as those financial assets and liabilities are
managed together and their performance evaluated on a
fair value basis in accordance with the Funds’ documented
investment strategy. Derivatives are classified as held
for trading and measured at fair value through profit or
loss. Redemption units are measured at their respective
redemption values. All other assets and liabilities are
measured at amortized cost. Realized gains arising on
derivatives during a period are included in the Statements
of Comprehensive Income in “Net gain (loss) from futures
contracts,” “Other derivatives” and “Net gain (loss) on
foreign currencies and other net assets,” where applicable.
Classification of Redeemable Units The Funds have
multiple features across the different series of the Funds.
Consequently, the Funds’ outstanding redeemable units
are classified as financial liabilities in accordance with the
requirements of IAS 32 Financial Instruments: Presentation.
Unconsolidated Structured Entities The Funds may invest
in other Funds and exchange-traded funds (“ETFs”) managed
by the Portfolio Manager or an affiliate of the Portfolio
Manager (“sponsored funds”) and may invest in other funds
and ETFs managed by unaffiliated entities (“unsponsored
funds”); collectively, “underlying funds.” The underlying
funds are determined to be unconsolidated structured
entities, as decision making in the underlying fund is not
governed by the voting rights or other similar rights held by
the Fund. The investments in underlying funds are subject
to the terms and conditions of the offering documents of the
respective underlying funds and are susceptible to market
price risk arising from uncertainties about future values of
those underlying funds. The underlying funds’ objectives are
generally to achieve long-term capital appreciation and/or
current income by investing in a portfolio of securities and
other funds in line with each of their documented investment
strategies. The underlying funds apply various investment
strategies to accomplish their respective investment objectives.
The underlying funds finance their operations by issuing
redeemable units which are puttable at the unitholder’s
option, and entitle the unitholder to a proportional stake in the
respective underlying funds’ NAV.
The Funds do not consolidate their investment in underlying
funds but account for these investments at fair value. The
Manager has determined that the Funds are investment
entities in accordance with IFRS 10 Consolidated Financial
Statements, since the Funds meet the following criteria:
(i) The Funds obtain capital from one or more investors for
the purpose of providing those investors with investment
management services,
(ii) The Funds commit to their investors that their business
purpose is to invest funds solely for the returns from
capital appreciation, investment income or both, and
(iii) The Funds measure and evaluate the performance of
substantially all of their investments on a fair value basis.
Therefore, the fair value of investments in the underlying
funds is included in the Schedule of Investment Portfolio
and included in “Investments at fair value” in the Funds’
Statements of Financial Position. The change in fair value

GENERIC NOTES TO FINANCIAL STATEMENTS
December 31, 2017
(also see Fund Specific Information)
of the investment held in the underlying funds is included
in “Change in unrealized gain (loss) on investments” in the
Statements of Comprehensive Income.
Certain Funds may invest in mortgage-related or other
asset-backed securities. These securities include commercial
mortgage-backed securities, asset-backed securities,
collateralized debt obligations and other securities that directly
or indirectly represent a participation in, or are securitized by
and payable from, mortgage loans on real property. Mortgage-
related securities are created from pools of residential or
commercial mortgage loans while asset-backed securities
are created from many types of assets, including auto loans,
credit card receivables, home equity loans and student loans.
The Funds account for these investments at fair value. The
fair value of such securities, as disclosed in the Schedule of
Investment Portfolio, represents the maximum exposure to
losses at that date.
Determination of Fair Value The fair value of a financial
instrument is the amount at which the financial instrument
could be exchanged in an arm’s-length transaction between
knowledgeable and willing parties under no compulsion to
act. In determining fair value, a three-tier hierarchy based on
inputs is used to value the Funds’ financial instruments. The
hierarchy of inputs is summarized below:
Level 1 – quoted prices (unadjusted) in active markets for
identical assets or liabilities;
Level 2 – inputs other than quoted prices included in Level 1
that are observable for the asset or liability, either directly
(i.e., as prices) or indirectly (i.e., derived from prices),
including broker quotes, vendor prices and vendor fair value
factors; and
Level 3 – inputs for the asset or liability that are not based on
observable market data (unobservable inputs).
Changes in valuation methods may result in transfers into or
out of an investment’s assigned level.
The three-tier hierarchy of investments and derivatives
is included in “Notes to Financial Statements – Fund
Specific Information.”
Investments and derivatives are recorded at fair value, which
is determined as follows:
Equities – Common shares, preferred shares and exchange-
traded funds are valued at the closing price recorded by
the security exchange on which the security is principally
traded. In circumstances where the closing price is not within
the bid-ask spread, management will determine the points
within the bid-ask spread that are most representative of the
fair value.
Fixed-Income and Debt Securities – Bonds, mortgage-backed
securities and debentures are valued at the closing price
quoted by major dealers or independent pricing vendors in
such securities.
NHA-approved mortgages are valued at an amount which
produces a yield equivalent to the prevailing rate of return on
mortgages of similar type and term.
Short-Term Investments – Short-term investments are valued at
fair value, which is approximated at cost plus accrued interest.
Warrants – Warrants are valued using a recognized option
pricing model, which includes factors such as the terms of
the warrant, time value of money and volatility inputs that
are significant to such valuation.
Forward Contracts – Forward contracts are valued at the gain
or loss that would arise as a result of closing the position at
the valuation date. Any unrealized gain or loss at the close of
business on each valuation date is recorded as “Change in
unrealized gain (loss) on investments” in the Statements of
Comprehensive Income. The receivable/payable on forward
contracts is recorded separately in the Statements of Financial
Position. Realized gain (loss) on foreign exchange contracts is
included in “Net gain (loss) on foreign currencies and other net
assets” in the Statements of Comprehensive Income.
Mutual Fund Unit Valuation – Units of funds are valued at their
respective NAV per unit from fund companies on the relevant
valuation dates.
Fair Valuation of Investments – The Funds have procedures to
determine the fair value of securities and other financial
instruments for which market prices are not readily available
or which may not be reliably priced. Under these fair valuation
procedures, the Funds primarily employ a market-based
approach, which may use related or comparable assets or
liabilities, NAV per unit (for exchange-traded funds), recent
transactions, market multiples, book values and other relevant
information for the investment to determine its fair value.
Management also has procedures in place to determine the
fair value of foreign securities traded in countries outside
of North America daily to avoid stale prices and to take
into account, among other things, any significant events
occurring after the close of a foreign market.

GENERIC NOTES TO FINANCIAL STATEMENTS
December 31, 2017
(also see Fund Specific Information)
The Funds may also use an income-based valuation
approach in which the anticipated future cash flows of the
investment are discounted to calculate fair value. Discounts
may also be applied due to the nature or duration of any
restrictions on the disposition of the investments, but only
if they arise as a feature of the instrument itself. Due to the
inherent uncertainty of valuations of such investments, the
fair values may differ significantly from the values that would
have been used had an active market existed.
All security valuation techniques are periodically reviewed
by the Valuation Committee (“VC”) of the Fund Accounting
Agent. The VC provides oversight of the Funds’ valuation
policies and procedures.
Cash Cash is comprised of cash and deposits with banks
and is recorded at fair value. The carrying amount of cash
approximates its fair value because it is short-term in nature.
Foreign Exchange The value of investments and other
assets and liabilities in foreign currencies is translated into
Canadian dollars at the rate of exchange on each valuation
date. Purchases and sales of investments, income and
expenses are translated at the rate of exchange prevailing on
the respective dates of such transactions. Realized foreign
exchange gains/losses are included in “Net gain (loss) on
foreign currencies and other net assets” in the Statements of
Comprehensive Income.
Functional Currency The Funds have their subscriptions,
redemptions and performance denominated in Canadian
dollars and, consequently, the Canadian dollar is the
functional currency for the Funds.
Valuation of Series A different NAV is calculated for each
series of units of a Fund. The NAV of a particular series of
units is computed by calculating the value of the series’
proportionate share of the assets and liabilities of the
Fund common to all series less the liabilities of the Fund
attributable only to that series. Expenses directly attributable
to a series are charged to that series. Other expenses are
allocated proportionately to each series based upon the
relative NAV of each series. Expenses are accrued daily.
Investment Transactions Investment transactions are
accounted for as of the trade date. Transaction costs, such as
brokerage commissions, incurred by the Funds are recorded
in the Statements of Comprehensive Income for the period.
The unrealized gain and loss on investments is the difference
between fair value and average cost for the period. The basis
of determining the cost of portfolio assets, and realized
and unrealized gains and losses on investments, is average
cost which does not include amortization of premiums
or discounts on fixed income and debt securities with the
exception of zero coupon bonds.
Income Recognition Dividend income is recognized on
the ex-dividend date and interest for distribution purposes
is coupon interest recognized on an accrual basis and/or
imputed interest on zero coupon bonds. “Other income (loss)”
includes income from income trusts. Distributions received
from income trusts are recognized based on the nature of the
underlying components, such as income, capital gains and
return of capital. “Other income received from underlying
funds” includes income earned by a Fund from investments in
underlying funds. Any premiums paid or discounts received on
the purchase of zero coupon bonds are amortized.
Expenses Each series of units of a Fund is responsible for the
certain operating expenses, exclusive of the services included
in the management fee, that relate specifically to that series
and for its proportionate share of the operating expenses that
are common to all series. These expenses include audit, taxes,
legal and filing fees, mortgage service fees and transaction
costs, as applicable, and fees and expenses payable in
connection with the Independent Review Committee (“IRC”).
Increase (Decrease) in NAV Per Unit Increase (decrease) in
NAV per unit in the Statements of Comprehensive Income
represents the increase (decrease) in net assets attributable to
holders of redeemable units by series divided by the average
units outstanding per series during the period.
4. Critical Accounting Judgments and Estimates
The preparation of financial statements requires the use
of judgment in applying the Funds’ accounting policies
and making estimates and assumptions about the future.
The following discusses the most significant accounting
judgments and estimates that management has made in
preparing the financial statements.
Classification and Measurement of Financial Instruments and Application of Fair Value Option
In classifying and measuring financial instruments held
by the Funds, the Manager is required to make significant
judgments about whether or not the business of the Funds is
to invest on a total return basis for the purpose of applying
the fair value option for financial assets.

GENERIC NOTES TO FINANCIAL STATEMENTS
December 31, 2017
(also see Fund Specific Information)
Fair Value Measurement of Securities Not Quoted in an Active Market
The Funds have established policies and control procedures
that are intended to ensure these estimates are well
controlled, independently reviewed and consistently applied
from period to period. The estimates of the value of the
Funds’ assets and liabilities are believed to be appropriate as
at the reporting date.
The Funds may hold financial instruments that are not quoted
in active markets. Note 3 discusses the policies used by
management for the estimates used in determining fair value.
5. Financial Instrument Risk and Capital Management
The Manager is responsible for managing each Fund’s
capital, which is its NAV and consists primarily of its
financial instruments.
A Fund’s investment activities expose it to a variety of
financial risks. The Manager seeks to minimize potential
adverse effects of these risks on a Fund’s performance by
employing professional, experienced portfolio managers,
daily monitoring of the Fund’s holdings and market events,
diversifying its investment portfolio within the constraints
of its investment objectives, and, in some cases, periodically
hedging certain risk exposures through the use of derivatives.
To assist in managing risks, the Manager also uses internal
guidelines, maintains a governance structure that oversees
each Fund’s investment activities and monitors compliance
with the Fund’s investment strategies, internal guidelines and
securities regulations.
Financial instrument risk, as applicable to a Fund, is
disclosed in its Notes to Financial Statements – Fund
Specific Information. These risks include a Fund’s direct
risks and pro rata exposure to the risks of underlying funds,
as applicable.
Liquidity Risk
Liquidity risk is the possibility that investments in a Fund
cannot be readily converted into cash when required. A Fund
is exposed to daily cash redemptions of units. Liquidity risk
is managed by investing the majority of a Fund’s assets in
investments that are traded in an active market and that can
be readily disposed. In accordance with securities regulations,
a Fund must maintain at least 90% of its assets in liquid
investments. In addition, a Fund aims to retain sufficient cash
and cash equivalent positions to maintain liquidity, and has
the ability to borrow up to 5% of its NAV for the purpose of
funding redemptions. All non-derivative financial liabilities,
other than units, are due within 90 days.
Credit Risk
Credit risk is the risk that a loss could arise from a security
issuer or counterparty not being able to meet its financial
obligations. The carrying amount of investments and other
assets represents the maximum credit risk exposure as
disclosed in a Fund’s Statements of Financial Position. The
fair value of fixed-income and debt securities includes a
consideration of the creditworthiness of the debt issuer.
Credit risk exposure to over-the-counter derivative
instruments is based on a Fund’s unrealized gain on the
contractual obligations with the counterparty. The portfolio
manager monitors each Fund’s credit exposure and
counterparty ratings daily.
Concentration Risk
Concentration risk arises as a result of net financial
instrument exposures to the same category, such as
geographical region, asset type, industry sector or market
segment. Financial instruments in the same category have
similar characteristics and may be affected similarly by
changes in economic or other conditions.
Interest Rate Risk
Interest rate risk is the risk that the fair value of a Fund’s
interest-bearing investments will fluctuate due to changes
in market interest rates. The value of fixed-income and debt
securities, such as bonds, debentures, mortgages or other
income-producing securities, is affected by interest rates.
Generally, the value of these securities increases if interest
rates fall and decreases if interest rates rise.
Currency Risk
Currency risk is the risk that the value of investments
denominated in currencies, other than the functional
currency of a Fund, will fluctuate due to changes in foreign
exchange rates. The value of investments denominated in a
currency other than the functional currency is affected by
changes in the value of the functional currency in relation
to the value of the currency in which the investment is
denominated. When the value of the functional currency falls
in relation to foreign currencies, then the value of the foreign
investments rises. When the value of the functional currency
rises, the value of the foreign investments falls.

GENERIC NOTES TO FINANCIAL STATEMENTS
December 31, 2017
(also see Fund Specific Information)
Other Price Risk
Other price risk is the risk that the value of financial
instruments will fluctuate as a result of changes in market
prices (other than those arising from interest rate or currency
risk), whether caused by factors specific to an individual
investment, its issuer, or all factors affecting all instruments
traded in a market or market segment.
6. Taxes
The Funds qualify as open-ended mutual fund trusts under
the Income Tax Act (Canada). In general, the Funds are subject
to income tax; however, no income tax is payable on net
income and/or net realized capital gains which are distributed
to unitholders. Since the Funds do not record income taxes,
the tax benefit of capital and non-capital losses has not been
reflected in the Statements of Financial Position as a deferred
income tax asset. In addition, for mutual fund trusts, income
taxes payable on net realized capital gains are refundable on a
formula basis when units of the Funds are redeemed.
Capital losses are available to be carried forward indefinitely
and applied against future capital gains. Non-capital losses
may be carried forward to reduce future taxable income for
up to 20 years.
7. Administrative and Other Related-Party Transactions
Portfolio Manager, Registrar and Fund Accounting Agent
RBC Global Asset Management Inc. (“RBC GAM”), a
wholly-owned subsidiary of Royal Bank of Canada (“Royal
Bank”), is the portfolio manager, registrar and fund
accounting agent of the Funds and provides or arranges
for certain other services for the Funds. The fees paid to
RBC GAM are paid by the Manager and not the Funds.
Certain Funds may invest in units of other Funds managed by
RBC GAM or its affiliates (“underlying mutual funds”). A Fund
will not invest in units of an underlying mutual fund if the
Fund would be required to pay any management or incentive
fees in respect of that investment that a reasonable person
would believe duplicates a fee payable by the underlying
mutual fund for the same service. The Fund’s ownership
interest in underlying mutual funds is disclosed in the Notes
to Financial Statements – Fund Specific Information.
RBC GAM or its affiliates may earn fees and spreads in
connection with various services provided to, or transactions
with, the Funds, such as banking and brokerage. Affiliates of
RBC GAM that provide services to the Funds in the course
of their normal business, all of which are wholly owned
subsidiaries of Royal Bank of Canada, are discussed below.
Distributor
Phillips, Hager & North Investment Funds Ltd. is the principal
distributor of the Funds and a wholly-owned subsidiary of
RBC GAM. The fees paid to Phillips, Hager & North Investment
Funds Ltd. are paid by RBC GAM and not the Funds.
Trustee and Custodian
RBC Investor Services Trust (“RBC IS”) is the trustee and
custodian of the Funds. RBC IS holds title to the Funds’
property on behalf of unitholders and also holds the assets of
the Funds. The fees paid to RBC IS are paid by RBC GAM and
not the Funds.
Brokers and Dealers
The Funds have established or may establish standard
brokerage agreements and dealing agreements at market rates
with related parties such as RBC Dominion Securities Inc.,
RBC Capital Markets, LLC, RBC Europe Limited, NBC
Securities Inc. and Royal Bank of Canada. The Funds have
relied on the standing instructions (“Standing Instructions”)
from their IRC with respect to the allocation of brokerage to
related-party dealers and require RBC GAM to develop criteria
for brokers and to allocate brokerage on the basis of best
execution in the particular circumstances of a trade and that
trades allocated to related-party dealers be on competitive
terms and conditions, including as to brokerage commissions.
Other Related-Party Transactions
Pursuant to applicable securities legislation, the Funds relied,
or may have relied, on the Standing Instructions from the IRC
with respect to one or more of the following transactions:
Related-Party Trading Activities
(a) trades in securities of Royal Bank;
(b) investments in the securities of issuers for which a
related-party dealer acted as an underwriter during the
distribution of such securities and the 60-day period
following the conclusion of such distribution of the
underwritten securities to the public;
(c) purchases of equity and debt securities from or sales of
equity or debt securities to a related-party dealer, where it
acted as principal; and

GENERIC NOTES TO FINANCIAL STATEMENTS
December 31, 2017
(also see Fund Specific Information)
(d) inter-fund trading. These Standing Instructions impose
terms and conditions on inter-fund trades, including that
an investment decision in respect of inter-fund trading
is influenced solely by the best interests of each Fund,
the trade is made in compliance with the requirements
of National Instrument 81-107 Independent Review
Committee for Investment Funds, and that the terms of the
purchase and sale are no less beneficial to the Funds than
those generally available to other market participants in
an arm’s-length transaction.
The applicable Standing Instructions require that Related-
Party Trading Activities be conducted in accordance with
applicable RBC GAM policies and that RBC GAM reports to
the Manager who reports to the IRC on a quarterly basis.
The Standing Instructions related to the transactions
described in (a), (b) and (c) listed above, impose terms and
conditions on Related-Party Trading Activities, including
that the investment be in accordance with the investment
objectives of each Fund and in the best interests of each Fund
and that an investment decision in respect of Related-Party
Trading Activities:
(i) is free from any influence of Royal Bank or its associates
or affiliates and without taking into account any
consideration relevant to Royal Bank or its affiliates
or associates;
(ii) represents the business judgment of RBC GAM,
uninfluenced by considerations other than the best
interests of the Funds;
(iii) is in compliance with RBC GAM policies and
procedures; and
(iv) achieves a fair and reasonable result for the Funds.
8. Revision of Comparative Information
Where applicable, certain comparative figures on the
Statements of Cash Flow have been revised.
Amounts reclassified to “Non-‐cash distributions from
underlying funds” have been presented separately from
amounts related to “Cost of investments purchased”
to appropriately reflect the non‐-cash components of
investments purchased. The impact on the “Net cash
provided by (used in) operating activities” is nil.
Comparative figures on the Statements of Cash Flow have
been revised for the Social Housing Canadian Equity Fund.
9. Future Accounting Changes
The following IFRS standard has been issued, but is not yet
in effect:
IFRS 9 Financial Instruments addresses the classification,
measurement and derecognition of financial assets and
liabilities. It replaces the multiple classifications and
measurement models in IAS 39 and is effective for reporting
periods beginning on or after January 1, 2018. Classification
and measurement of debt assets will be driven by an entity’s
business model for managing the financial assets and the
contractual cash flow characteristics of the financial assets.
Derivative and equity instruments are measured at fair value
through profit or loss unless, for equity instruments not held
for trading, an irrevocable option is taken to measure at fair
value through other comprehensive income.
On adoption of IFRS 9, the Funds’ investment portfolios
will continue to be classified at fair value through profit or
loss. Other financial assets which are held for collection will
continue to be measured at amortized cost with no material
impact expected from application of the new impairment
model introduced in IFRS 9. As a result, the adoption of
IFRS 9 is not expected to have a material impact on the Funds’
financial statements.