Embed Size (px)
Citation preview
MANAGEMENT’S DISCUSSION & ANALYSIS For the Three and Six Months Ended December 31, 2015
1
The following Management’s Discussion and Analysis of Financial Condition and Results of Operations (“MD&A”) of Era Resources Inc.,(“Era” or the “Company”) provides a discussion and analysis of the financial condition and results of operations to enable a reader to assess material changes in the financial condition of the Company between December 31, 2015 and June 30, 2015, and results of operations for the three and six months ended December 31, 2015, ("Q2 2016" and "YTD 2016", respectively) and for the three and six months ended December 31, 2014, ("Q2 2015" and "YTD 2015", respectively). The MD&A should be read in conjunction with the unaudited condensed interim consolidated financial statements for the three and six months ended December 31, 2015, and with the audited consolidated financial statements and notes thereto of Era for the fiscal year ended June 30, 2015 ("FY 2015"). In this MD&A, references to “Company” or “Era” are references to Era Resources Inc. and its wholly-owned subsidiaries. The financial statements (and the financial information contained in this MD&A) were prepared in accordance with International Financial Reporting Standards (“IFRS”) including International Accounting Standard, Interim Financial Reporting ("IAS 34"). All amounts in this discussion are expressed in millions of United States dollars (“USD”) except per share data and unless otherwise indicated. All amounts in tables are expressed in thousands of USD, unless otherwise indicated. This MD&A contains forward-looking information within the meaning of Canadian securities legislation (see “Forward-looking Information” below for a full discussion on the nature of forward-looking information). Information regarding the adequacy of cash resources to carry out the Company's exploration and development programs or the need for future financing is forward-looking information. All forward-looking information, including information not specifically identified herein, is made subject to cautionary language at the end of this document. Readers are advised to refer to the cautionary language included at the end of this MD&A under the heading "Forward-looking Information" when reading any forward-looking information. This MD&A is prepared in accordance with Form 51-102F1 and has been approved by the Company’s board of directors (the “Board of Directors” or the “Board”) prior to its release. This report is dated as of February 10, 2016. Readers are encouraged to read the Company’s other public filings, which can be viewed on the SEDAR website (www.sedar.com). Company Overview
Era is an international mineral exploration and development company listed on the Toronto Stock Exchange (the “TSX”) (Symbol: ERX). The Company’s principal asset is its Yandera copper project (the “Yandera Project”) in Papua New Guinea (“PNG”). The Company is currently focused on advancing the development of the Yandera Project into a commercially viable copper mining operation, with the objective to maximize shareholder value. Between 2006 and 2014, the Company drilled 471 exploration, resource and geotechnical drill-holes and drove two adits (50 metres and 71 metres long) to test various mineralized zones across the Yandera Project. In December 2006 the Company commissioned a conceptual mining study (the “CMS”) for the Yandera Project to include a preliminary mine design and open pit optimization, metallurgical testwork, plant flowsheet design and throughput options and capital and operating cost estimates. In July 2007 the CMS was completed and, based on the positive results thereof, the Company determined to proceed with a feasibility study. Phase 1 of the work to support a feasibility study was completed in April 2008 and comprised a comparative development options analysis study that delivered positive results.
Era commenced work on a feasibility study for the development of Yandera in 2008, based on its published copper resource, the prevailing copper price and the state of global financial markets at the time. Since then, global resource markets have become increasingly competitive, with, among other things, the copper price falling, funding for exploration and development decreasing and capital and operating costs escalating, bringing into question the economic viability of the development of the 2012 Yandera resource.
During the latter part of fiscal year 2014, the new management team conducted a comprehensive evaluation and review of all aspects of the prior work conducted towards a feasibility study of the Yandera Project and concluded that, although progress had been made, further exploration and development work was required in order to finalize the feasibility study and, as a result of this review, the feasibility study has been deferred until further work is completed (see “Outlook” section).
MANAGEMENT’S DISCUSSION & ANALYSIS For the Three and Six Months Ended December 31, 2015
2
Taking into account the 2015 updated resource estimate, the review of the 2012 resource, as well as further drilling, mapping and survey programs completed subsequent to the review that have yielded new mineralization, the Company has renewed enthusiasm about the potential of Yandera. Overall Performance
Highlights of YTD 2016 and as of the Date of this Report
During YTD 2016 and to the date of this MD&A, the following highlights the Company’s significant events:
• Financing Activities – The Company entered into a financing agreement with its major shareholder, which consists of three entities controlled by The Sentient Group, (collectively, “Sentient”), as follows:
o On October 13, 2015, the Company entered into an agreement (the "Letter Agreement") with Sentient in connection with the proposed issuance of $14.0 million principal amount of convertible unsecured debentures (the "Investment Debentures"). The proposed Debentures were to be issued in two tranches, with the first tranche of $7.0 million to be completed following the approval of the Company's shareholders at the annual general and special meeting held on November 13, 2015, and the second tranche of $7.0 million to be completed five months after the shareholders' approval is obtained.
o On November 13, 2015, the requisite shareholder approval was obtained and the Company completed the
issuance of the first tranche of $7.0 million of the Investment Debentures to Sentient.
• Corporate Restructuring – The Company made the following changes during the fiscal year and to date of this MD&A:
o On July 1, 2015, Mr. Andre Wessels joined the Company's management team as VP Projects. Mr. Wessels, BEng, MBA, GAICD, has over 23 years of experience in mining and related services, steel, financial services, and information and communication technology industries.
o On August 11, 2015, the Company announced that it had requested approval to delist from the Port Moresby Stock Exchange ("POMSoX").
o On October 13, 2015, the Company announced that subject to obtaining the necessary shareholder approval, Era would be completing a share consolidation whereby for every 100 Era common shares, one post-consolidation Era common share will exist.
o On October 27, 2015, the Company officially delisted from the POMSoX. Era's Port Moresby Stock Exchange Electronic Trading System Depository Interests (“PDI’s”) were suspended on October 19, 2015.
o On November 16, 2015, the Company officially changed its name from Marengo Mining Limited to Era Resources Inc. The trading symbol on the TSX changed from MRN to ERX.
o On November 16, 2015, the Company completed consolidation of common share on the basis of one post-consolidation common share for every 100 pre-consolidation common shares issued and outstanding.
• Exploration & Development Activities – In keeping with the Company’s objective of advancing and optimizing the Yandera Project economics and building on its existing resource and future potential and consistent with the Company's global growth strategy, the following progress at the Company's operations has been made:
o On February 10, 2016, the Company announced diamond drilling results from the La Cobota copper project in Mexico.
o On September 29, 2015, the Company announced that it acquired an option for the mineral concessions and purchased the related surface property rights for the La Cobota copper project in northern Mexico ("La Cobota").
MANAGEMENT’S DISCUSSION & ANALYSIS For the Three and Six Months Ended December 31, 2015
3
o During the period from mid-December 2015 to mid-January 2016, Era completed eight diamond drill holes totalling 955.6 metres at the La Cobota project.
o On May 5, 2015, the Company announced an updated resource estimate for its Yandera Project resulting in additional and improved resources. Refer to Table 1 for details.
o The Company completed four holes (totalling 1,004.6 metres) at the Yandera Project at its newly identified Rima prospect ("Rima").
o The Company has previously described efforts to increase geological knowledge of the site and is pleased to report that this work has resulted in the identification of drilling targets that the Company is currently pursuing. Era’s geologists have been equipped with advanced tools to analyse, model, interpret and assess the complex geology and mineralization. Training for geology and environmental staff continued during 2015, with more advanced tools expected to be added during the year. Transformation and development of both technical and operational teams is expected to continue throughout 2016.
o Further to the comprehensive review completed during the latter part of fiscal year 2014, as described in the "Company Overview" section above, work on the 2015 updated resource has resulted in recognition of significant structural trends that are important controls for mineralization. Understanding these trends and the associated host lithologies has improved the geological model and lead to improved understanding of the copper mineralization. These models are being used to target areas that will improve and expand the existing resource, as well as generate prospective exploration targets well beyond the footprint of the resource.
Yandera Project, Papua New Guinea
The Company’s wholly-owned Yandera Project is located 95 kilometres southwest of the northern seaport of Madang in Papua New Guinea and situated within the highly prolific New Guinea Copper-Gold Belt that is host to many major producing mines. The Yandera porphyry system is located within the central portion of the granted 624-square kilometre exploration licences that cover over 100 kilometres of strike over the highly prospective Bundi Fault zone. On May 5, 2015, the Company announced an updated resource estimate for its Yandera Project. This resource estimate has been prepared pursuant to the requirements of National Instrument 43-101 - Standards of Disclosure for Mining Projects ("NI 43-101") and the Australian Code for Reporting of Exploration Results, Mineral Resources and Ore Reserves, 2012 Edition ("JORC"). Highlights of the Yandera Resource Estimate:
• Measured and Indicated Resources total 630 million tonnes grading 0.33% copper, 0.01% molybdenum and 0.07 ppm gold; or 0.41% copper equivalent (full breakdown by category is shown below);
• Inferred Resources total 117 million tonnes grading 0.30% copper, 0.005% molybdenum and 0.05 ppm gold; or 0.34% copper equivalent.
This 2015 Measured and Indicated copper-equivalent (CuEq) resource estimate for Yandera represents an update of the 2012 resource estimate, which was evaluated on a copper-only basis without the contributing value of ancillary molybdenum (Mo) and gold (Au) that would be produced with the copper (Cu). Other enhancements of the 2015 resource estimate include:
1) Incorporation of positive infill/upgrade drilling results from the principal resource areas (Gremi, Imbruminda and Omora) and also at the Dimbi and Rima advanced exploration prospects;
2) Refinement of the resource tonnage from the addition of nearly 4,000 new density measurements; 3) A reconstruction of the geologic framework focused on host rock and structural controls from the first-time application
of oriented drill core data. Yandera is an igneous-hosted, structurally-controlled Cu-Mo-Au porphyry system comprised of a series of adjacent deposits along recognized structural trends. Mineralization is related to multiple pulses of intrusive rock and hydrothermal alteration. Grade has spatial correlation with late dacite intrusions and polymicticbreccias with over-printing phyllic alteration. Broad tabular zones of copper mineralization extend from surface to depths of over 500 metres and have been drill-defined to a strike length of over 5 kilometres.
MANAGEMENT’S DISCUSSION & ANALYSIS For the Three and Six Months Ended December 31, 2015
4
The resource block model was informed by 35,250 samples from 553 drill holes at an average drill hole spacing of less than 30 metres in the principal resource areas (Gremi, Imbruminda and Omora) and less than 100 metres in other deposits within the model space. Mineral resources were estimated by Ordinary Kriging using MineSight® software in 25 by 25 by 10 metre blocks (XYZ), constrained by grade shells based on a 0.15% Cu cut-off. Grade estimates within the grade shells were based on capped, five-metre composited assay data. Capping was conducted prior to compositing. The resource model was validated by visual inspection, statistical comparisons of block values to source data and comparison of Kriged results to other interpolation methods and swath plots. Resources were classified into Measured, Indicated and Inferred categories based on Canadian Institute of Mining, Metallurgy and Petroleum ("CIM") definition standards sufficient for NI 43-101 and JORC reporting. In order to establish a reasonable prospect of eventual extraction in an open pit/sulfide-flotation and oxide-leach context, the mineral resources presented above are reported within a potentially mineable pit configuration at a copper price of US$3.50/lb Cu, a molybdenum price of US$15/lb Mo and a gold price of US$1500/oz Au; metallurgical recoveries of 90% for Cu, 85% for Mo and 65% for Au; mining cost of US$2.50/tonne of material mined; and process and general and administrative costs of US$10.00/tonne of material processed. Additional factors include a 2% royalty to the PNG government and a pit slope of 45 degrees. The resources are reported within the pit configuration above using an internal copper-equivalent cut-off grade of 0.15% CuEq. The metal prices, recoveries and costs listed above were used to define copper-equivalent cut-off. The metal ratios for reporting copper equivalent are: CuEq = Cu% + (Mo%*4.05) + (Au ppm*0.45) These metal ratios were developed using the metal prices and recovery assumptions listed above. Recoveries are based on metallurgical test work carried out by Era in 2011. The Mineral Resource Statement, with an effective date of May 1, 2015, is presented in Table 1. The resource estimate has been reported as a total, and as oxide and non-oxide components, as these material types will have different metallurgy and will have different recovery characteristics and costs. The estimate of mineral resources may be materially affected by environmental, permitting, legal, title, taxation, socio-political, marketing or other relevant issues. The quantity and grade of reported Inferred resources in this estimation are uncertain in nature and there has been insufficient exploration to define these Inferred resources as an Indicated or Measured mineral resource and it is uncertain if further exploration will result in upgrading them to an Indicated or Measured mineral resource category. The Yandera Mineral Resource Statement was prepared by J.B. Pennington, MSc., C.P.G., and Justin Smith, BSc., P.E., both of SRK Consulting (U.S.), Inc., Reno, Nevada, and provides a classification of resources in accordance with CIM Standards on Mineral Resources and Mineral Reserves: Definitions and Guidelines, November 27, 2010. For further information on the Yandera Project, please refer to the technical reports titled “Technical Report Updated Resource Estimate Yandera Copper Project Papua New Guinea” dated June 19, 2015, and “Yandera Copper Project, Madang Province, Papua New Guinea” dated April 2012, available on the Company's website and on SEDAR.
MANAGEMENT’S DISCUSSION & ANALYSIS For the Three and Six Months Ended December 31, 2015
5
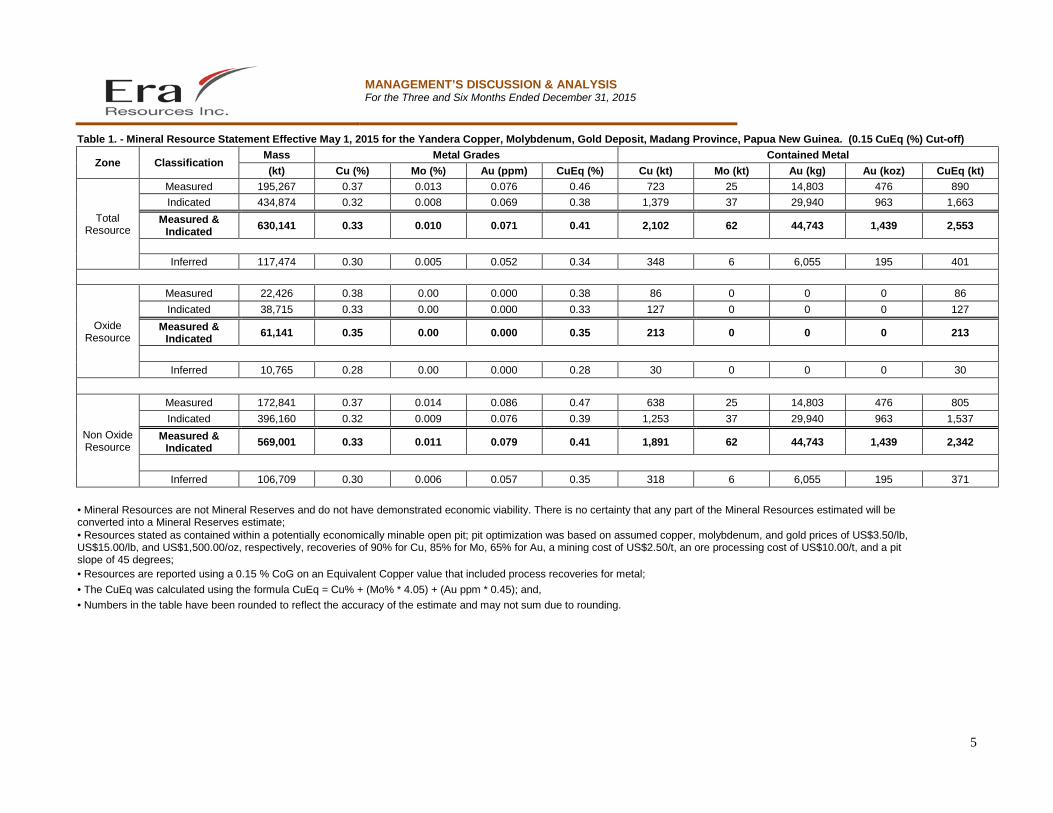
Table 1. - Mineral Resource Statement Effective May 1, 2015 for the Yandera Copper, Molybdenum, Gold Deposit, Madang Province, Papua New Guinea. (0.15 CuEq (%) Cut-off)
Zone Classification Mass Metal Grades Contained Metal (kt) Cu (%) Mo (%) Au (ppm) CuEq (%) Cu (kt) Mo (kt) Au (kg) Au (koz) CuEq (kt)
Total Resource
Measured 195,267 0.37 0.013 0.076 0.46 723 25 14,803 476 890 Indicated 434,874 0.32 0.008 0.069 0.38 1,379 37 29,940 963 1,663
Measured & Indicated 630,141 0.33 0.010 0.071 0.41 2,102 62 44,743 1,439 2,553
Inferred 117,474 0.30 0.005 0.052 0.34 348 6 6,055 195 401
Oxide Resource
Measured 22,426 0.38 0.00 0.000 0.38 86 0 0 0 86 Indicated 38,715 0.33 0.00 0.000 0.33 127 0 0 0 127
Measured & Indicated 61,141 0.35 0.00 0.000 0.35 213 0 0 0 213
Inferred 10,765 0.28 0.00 0.000 0.28 30 0 0 0 30
Non Oxide Resource
Measured 172,841 0.37 0.014 0.086 0.47 638 25 14,803 476 805 Indicated 396,160 0.32 0.009 0.076 0.39 1,253 37 29,940 963 1,537
Measured & Indicated 569,001 0.33 0.011 0.079 0.41 1,891 62 44,743 1,439 2,342
Inferred 106,709 0.30 0.006 0.057 0.35 318 6 6,055 195 371
• Mineral Resources are not Mineral Reserves and do not have demonstrated economic viability. There is no certainty that any part of the Mineral Resources estimated will be converted into a Mineral Reserves estimate;
• Resources stated as contained within a potentially economically minable open pit; pit optimization was based on assumed copper, molybdenum, and gold prices of US$3.50/lb, US$15.00/lb, and US$1,500.00/oz, respectively, recoveries of 90% for Cu, 85% for Mo, 65% for Au, a mining cost of US$2.50/t, an ore processing cost of US$10.00/t, and a pit slope of 45 degrees;
• Resources are reported using a 0.15 % CoG on an Equivalent Copper value that included process recoveries for metal; • The CuEq was calculated using the formula CuEq = Cu% + (Mo% * 4.05) + (Au ppm * 0.45); and, • Numbers in the table have been rounded to reflect the accuracy of the estimate and may not sum due to rounding.
MANAGEMENT’S DISCUSSION & ANALYSIS For the Three and Six Months Ended December 31, 2015
6
Exploration and Development Activities for the Three and Six Months Ended December 31, 2015
In the second quarter of fiscal year 2014, following a review of the technical work conducted to date in support of a feasibility study for the Yandera Project, the board of directors of the Company decided that additional work was required in a number of specific areas before a feasibility study could be completed, including further optimization opportunities to enhance project economics, namely:
• As initial starter pit grades are insufficient to cover increased capex, revert to exploration in order to locate and improve existing grades;
• As waste to mineralized material strip ratios over inferred resource cause pit slopes to be steepened beyond design parameters with a loss of resources as a result, additional work was begun to identify new resources that may improve the waste to mineralized material ratios;
• New conceptual models are being developed that will in turn allow for the creation of new resource models. This may allow the identification of better or new high grade zones that may form the basis for a new mine plan;
• Identifying an alternative cost-competitive source of power for the Yandera Project after Era’s preferred third party power provider withdrew from the proposed power supply arrangements;
• A review of processing plant throughput rates;
• Reviewing the option of Deep Sea Tailings Placement (DSTP) versus a land-based Tailings Management Facility (TMF); and
• Further optimization of the mine plan.
During the YTD 2016 period and through the date of this MD&A, the Company is continuing the activities outlined above.
Q2 2016 Exploration Program
Proximal Exploration Program at Yandera In November and December of 2015, field crews completed rock and soil sampling and surface mapping in selected areas proximal to the 2015 resource, specifically at the north-western, north-eastern, and south-eastern edges. This work is designed to identify drill targets beyond the limits of the known resource and explore for copper mineralization that may be contiguous with the 2015 resource estimate. Results from this program are pending. Regional Exploration at Yandera In November and December of 2015, a field crew completed rock and soil sampling and surface mapping at a poorly understood copper prospect about 6 km to the southeast of the 2015 resource at Yandera. This program examined occurrences of narrow, high-grade copper mineralization observed by previous workers and some local prospectors in the Pomieai area. Results from this program are pending. Diamond Drilling Results at La Cobota Pursuant to a purchase of the La Cobota property in Mexico, an inaugural drill program commenced in mid-December 2015, aiming to test the known copper-silver sulphide mineralisation associated with a major iron-oxide vein at the old La Cobota mine, and then will be gradually stepped-out to determine continuation of mineralization along strike and down dip. A detailed program of structural and alteration mapping will be conducted simultaneously with the drilling to assess the broader prospectivity of the mineral concessions.
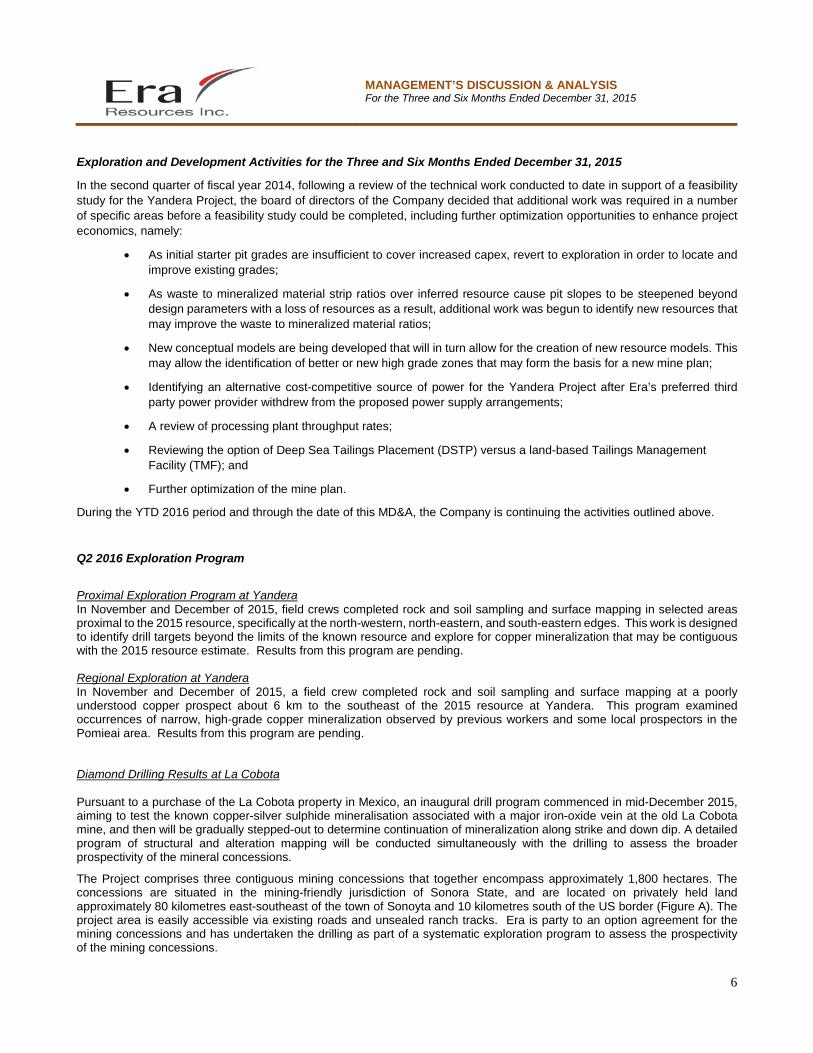
The Project comprises three contiguous mining concessions that together encompass approximately 1,800 hectares. The concessions are situated in the mining-friendly jurisdiction of Sonora State, and are located on privately held land approximately 80 kilometres east-southeast of the town of Sonoyta and 10 kilometres south of the US border (Figure A). The project area is easily accessible via existing roads and unsealed ranch tracks. Era is party to an option agreement for the mining concessions and has undertaken the drilling as part of a systematic exploration program to assess the prospectivity of the mining concessions.
MANAGEMENT’S DISCUSSION & ANALYSIS For the Three and Six Months Ended December 31, 2015
7
During the period from mid-December 2015 to mid-January, Era completed eight diamond drill totalling 955.6 metres at the La Cobota project (Table A and Figure A). Drilling was designed to test the continuity and grade of an outcropping mineralized structure that was the focus of historical underground mining operations. Assay results from the drilling (Table B) confirm the presence of high grade copper-silver mineralization and suggest that the mineralization occurs within a north- east plunging shoot.
Mineralization at La Cobota is hosted within a complex iron-oxide vein system which transects an equigranular to porphyritic quartz monzonite intrusion. The main vein (Vein #1, Figure B) targeted by drilling is heavily oxidized and composed of massive to semi-massive magnetite and hematite. Copper mineralization principally occurs as fine-grained chalcocite, with some native copper and other copper oxides. Minor remnant chalcopyrite and pyrite is also observed. The vein is faulted and brecciated to a variable degree; and is locally intruded by mafic dykes that appear to stope-out the mineralization. Drilling intersected a major fault beneath the historical mine workings that juxtaposes the quartz monzonite against a polymictic meta-conglomerate unit. This fault is interpreted to be a thrust structure which may truncate the mineralized vein at depth.
Under the terms of the option agreement for the La Cobota mining concessions, Era has an exclusive right to conduct exploration and is responsible for all land taxes and annual concession or permit fees during the option period, which ends on 01 July 2016. The Company has the right to acquire 100% of the concessions for a fixed amount of US$275,000, subject to a 2.5% Net Smelter Return royalty interest granted to the vendor of the mineral concessions, once it elects to proceed with the acquisition.
The assay results from the diamond drilling at La Cobota suggest that the mineralized iron oxide vein has significantly more structural complexity and grade variability than was originally anticipated from surface mapping and the available historical mining records. Work is continuing to assess the viability of the mineralized structure to host a resource and the Company will make a decision on the La Cobota option in due course.
The scientific and technical information was authorized by Mr Lachlan Reynolds, BSc, MAusIMM, MAIG.
Mr. Reynolds is a full-time employee of Era Resources Inc. and is a Qualified Person for the purposes of NI 43-101.
MANAGEMENT’S DISCUSSION & ANALYSIS For the Three and Six Months Ended December 31, 2015
8
Figure A: Location of the La Cobota project, Sonora, Mexico
Diamond Drilling Program
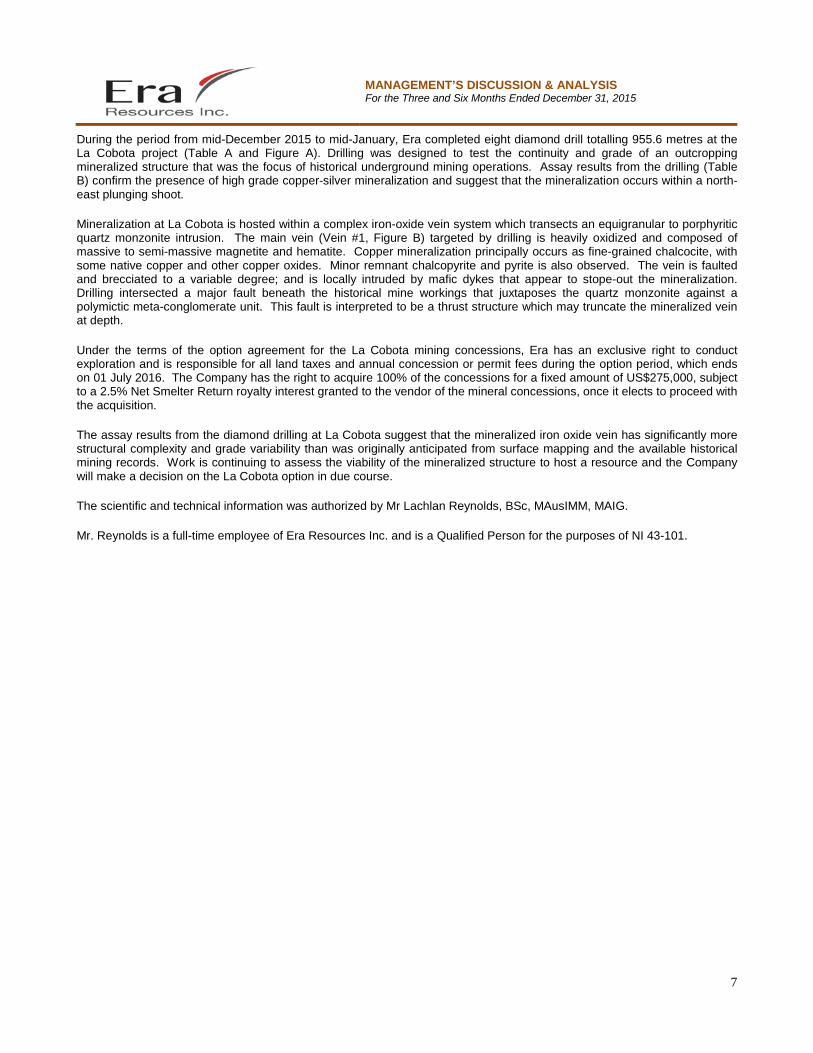
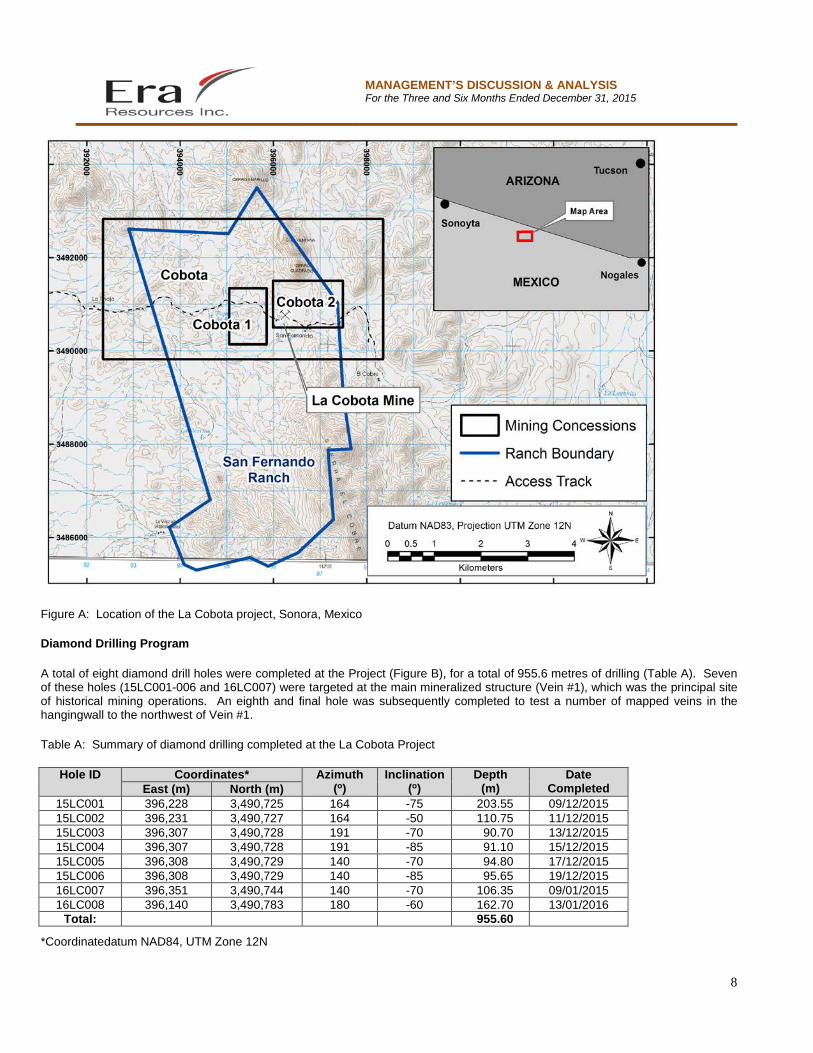
A total of eight diamond drill holes were completed at the Project (Figure B), for a total of 955.6 metres of drilling (Table A). Seven of these holes (15LC001-006 and 16LC007) were targeted at the main mineralized structure (Vein #1), which was the principal site of historical mining operations. An eighth and final hole was subsequently completed to test a number of mapped veins in the hangingwall to the northwest of Vein #1.
Table A: Summary of diamond drilling completed at the La Cobota Project
Hole ID Coordinates* Azimuth (o)
Inclination (o)
Depth (m)
Date Completed East (m) North (m)
15LC001 396,228 3,490,725 164 -75 203.55 09/12/2015 15LC002 396,231 3,490,727 164 -50 110.75 11/12/2015 15LC003 396,307 3,490,728 191 -70 90.70 13/12/2015 15LC004 396,307 3,490,728 191 -85 91.10 15/12/2015 15LC005 396,308 3,490,729 140 -70 94.80 17/12/2015 15LC006 396,308 3,490,729 140 -85 95.65 19/12/2015 16LC007 396,351 3,490,744 140 -70 106.35 09/01/2015 16LC008 396,140 3,490,783 180 -60 162.70 13/01/2016
Total: 955.60
*Coordinatedatum NAD84, UTM Zone 12N
MANAGEMENT’S DISCUSSION & ANALYSIS For the Three and Six Months Ended December 31, 2015
9
NAD84, UTM Zone 12N
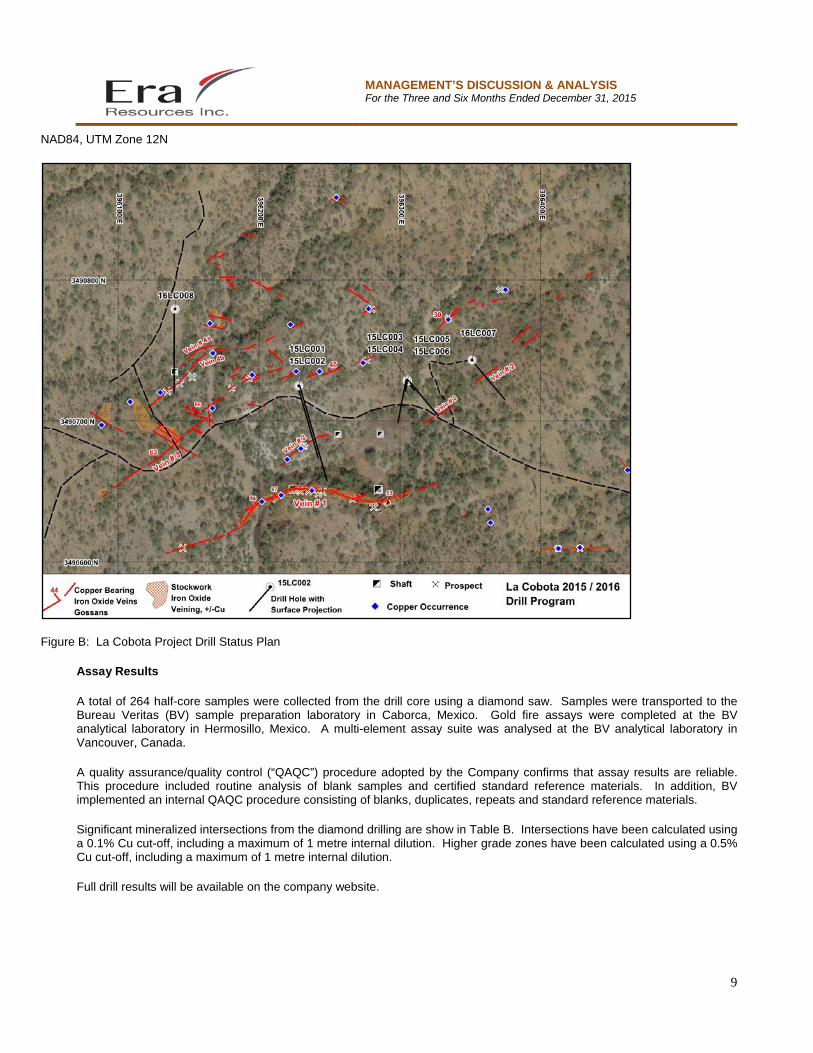
Figure B: La Cobota Project Drill Status Plan
Assay Results
A total of 264 half-core samples were collected from the drill core using a diamond saw. Samples were transported to the Bureau Veritas (BV) sample preparation laboratory in Caborca, Mexico. Gold fire assays were completed at the BV analytical laboratory in Hermosillo, Mexico. A multi-element assay suite was analysed at the BV analytical laboratory in Vancouver, Canada.
A quality assurance/quality control (“QAQC”) procedure adopted by the Company confirms that assay results are reliable. This procedure included routine analysis of blank samples and certified standard reference materials. In addition, BV implemented an internal QAQC procedure consisting of blanks, duplicates, repeats and standard reference materials.
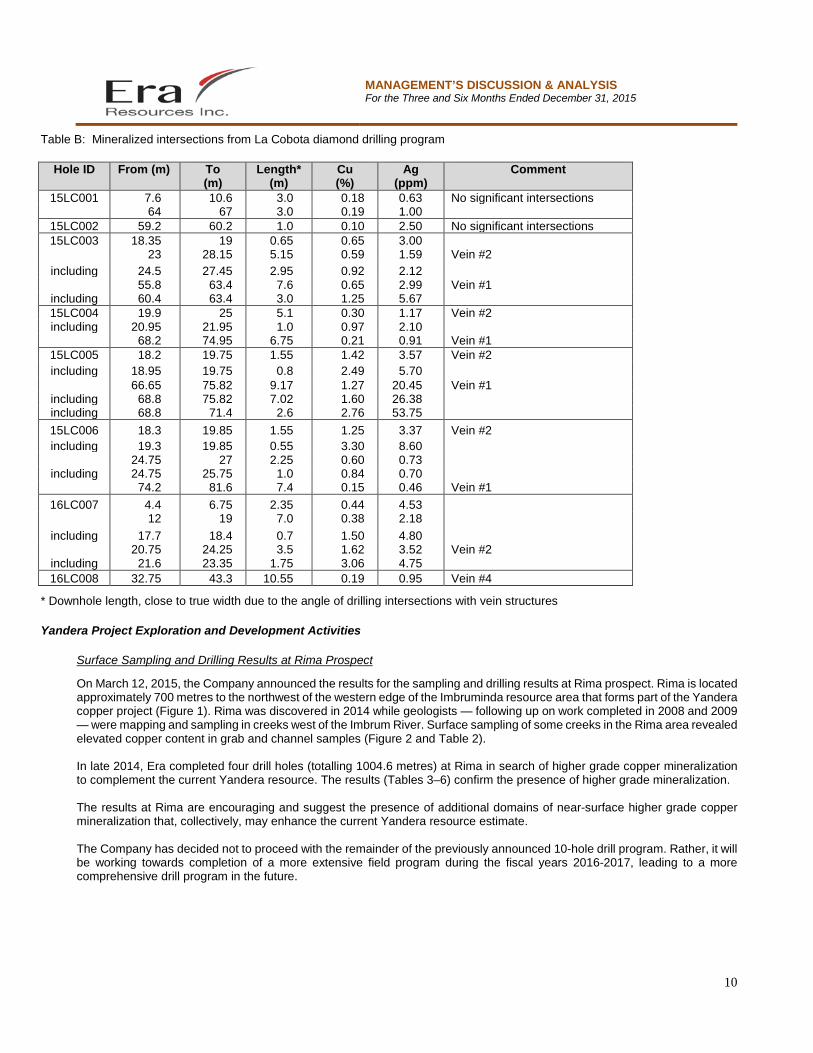
Significant mineralized intersections from the diamond drilling are show in Table B. Intersections have been calculated using a 0.1% Cu cut-off, including a maximum of 1 metre internal dilution. Higher grade zones have been calculated using a 0.5% Cu cut-off, including a maximum of 1 metre internal dilution.
Full drill results will be available on the company website.
MANAGEMENT’S DISCUSSION & ANALYSIS For the Three and Six Months Ended December 31, 2015
10
Table B: Mineralized intersections from La Cobota diamond drilling program
Hole ID From (m) To (m)
Length* (m)
Cu (%)
Ag (ppm)
Comment
15LC001 7.6 10.6 3.0 0.18 0.63 No significant intersections 64 67 3.0 0.19 1.00
15LC002 59.2 60.2 1.0 0.10 2.50 No significant intersections 15LC003 18.35 19 0.65 0.65 3.00
23 28.15 5.15 0.59 1.59 Vein #2 including 24.5 27.45 2.95 0.92 2.12
55.8 63.4 7.6 0.65 2.99 Vein #1 including 60.4 63.4 3.0 1.25 5.67 15LC004 19.9 25 5.1 0.30 1.17 Vein #2 including 20.95 21.95 1.0 0.97 2.10
68.2 74.95 6.75 0.21 0.91 Vein #1 15LC005 18.2 19.75 1.55 1.42 3.57 Vein #2 including 18.95 19.75 0.8 2.49 5.70
66.65 75.82 9.17 1.27 20.45 Vein #1 including 68.8 75.82 7.02 1.60 26.38 including 68.8 71.4 2.6 2.76 53.75 15LC006 18.3 19.85 1.55 1.25 3.37 Vein #2 including 19.3 19.85 0.55 3.30 8.60
24.75 27 2.25 0.60 0.73 including 24.75 25.75 1.0 0.84 0.70
74.2 81.6 7.4 0.15 0.46 Vein #1 16LC007 4.4 6.75 2.35 0.44 4.53
12 19 7.0 0.38 2.18 including 17.7 18.4 0.7 1.50 4.80
20.75 24.25 3.5 1.62 3.52 Vein #2 including 21.6 23.35 1.75 3.06 4.75 16LC008 32.75 43.3 10.55 0.19 0.95 Vein #4
* Downhole length, close to true width due to the angle of drilling intersections with vein structures
Yandera Project Exploration and Development Activities
Surface Sampling and Drilling Results at Rima Prospect
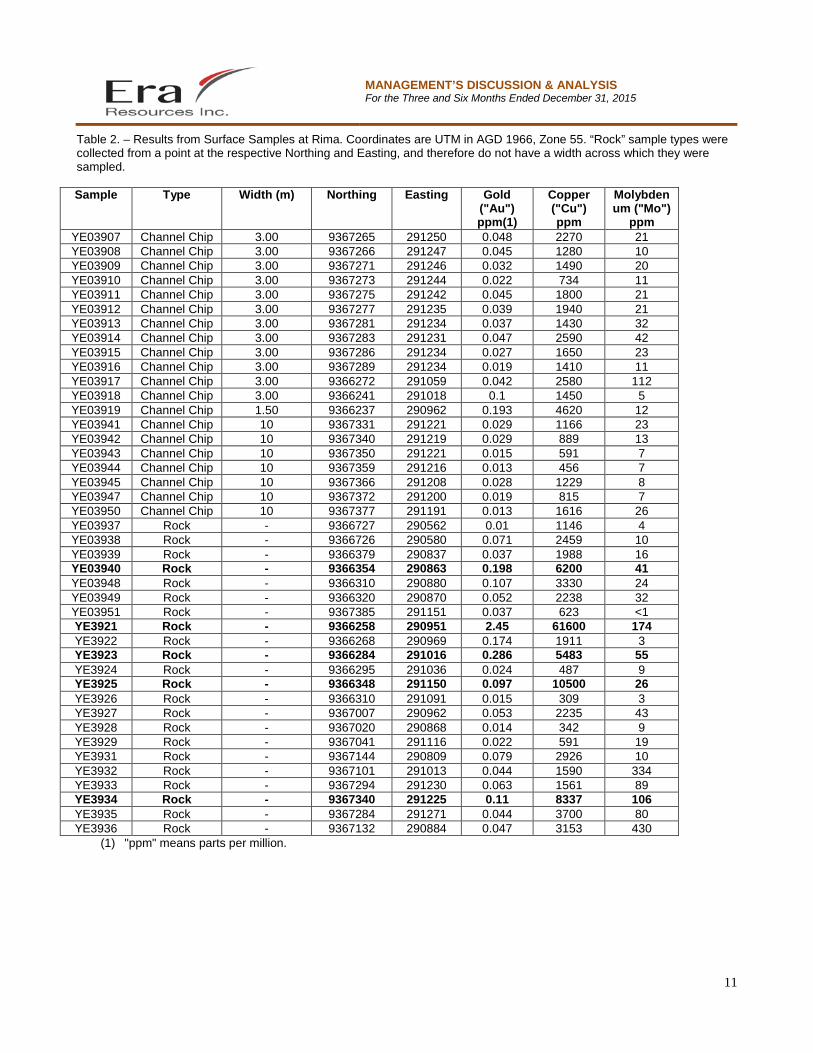
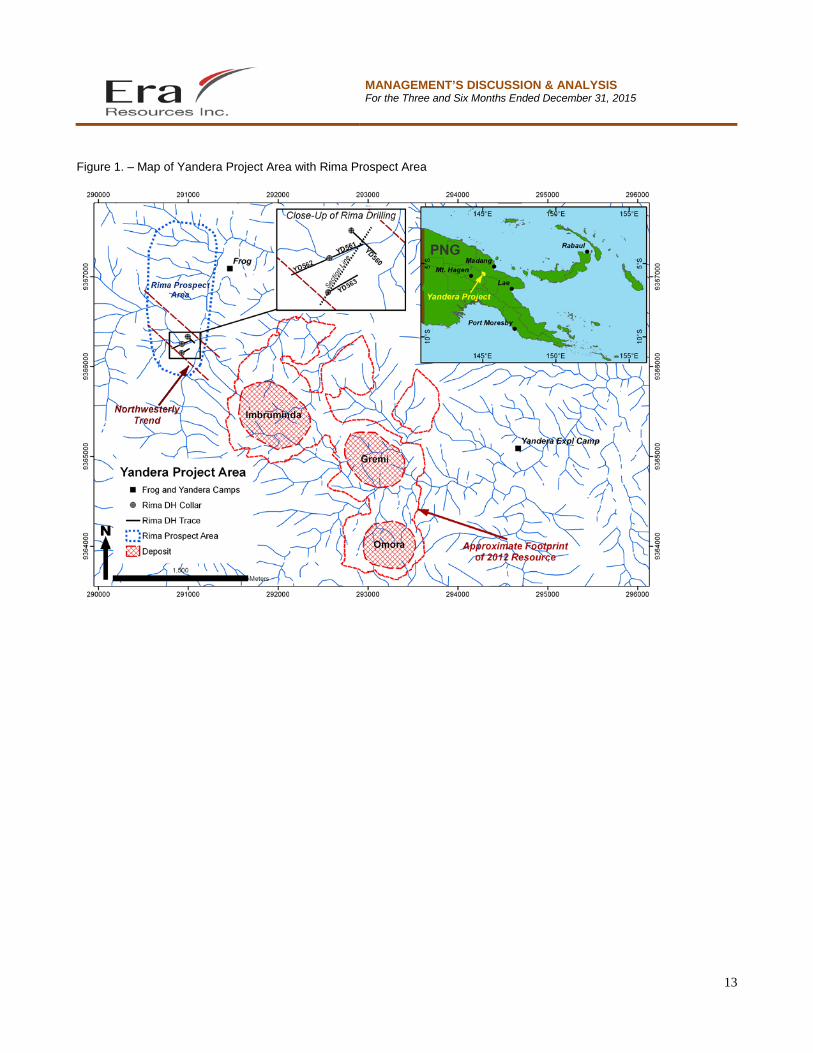
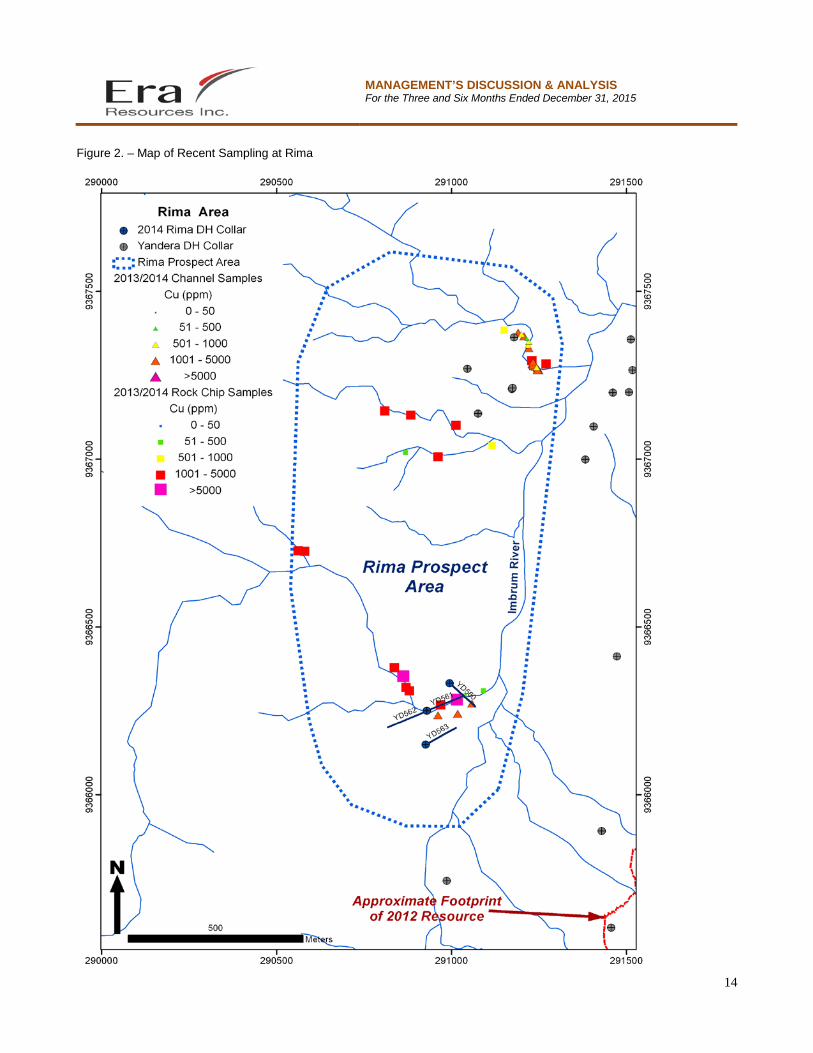
On March 12, 2015, the Company announced the results for the sampling and drilling results at Rima prospect. Rima is located approximately 700 metres to the northwest of the western edge of the Imbruminda resource area that forms part of the Yandera copper project (Figure 1). Rima was discovered in 2014 while geologists — following up on work completed in 2008 and 2009 — were mapping and sampling in creeks west of the Imbrum River. Surface sampling of some creeks in the Rima area revealed elevated copper content in grab and channel samples (Figure 2 and Table 2).
In late 2014, Era completed four drill holes (totalling 1004.6 metres) at Rima in search of higher grade copper mineralization to complement the current Yandera resource. The results (Tables 3–6) confirm the presence of higher grade mineralization.
The results at Rima are encouraging and suggest the presence of additional domains of near-surface higher grade copper mineralization that, collectively, may enhance the current Yandera resource estimate.
The Company has decided not to proceed with the remainder of the previously announced 10-hole drill program. Rather, it will be working towards completion of a more extensive field program during the fiscal years 2016-2017, leading to a more comprehensive drill program in the future.
MANAGEMENT’S DISCUSSION & ANALYSIS For the Three and Six Months Ended December 31, 2015
11
Table 2. – Results from Surface Samples at Rima. Coordinates are UTM in AGD 1966, Zone 55. “Rock” sample types were collected from a point at the respective Northing and Easting, and therefore do not have a width across which they were sampled. Sample Type Width (m) Northing Easting Gold
("Au") ppm(1)
Copper ("Cu") ppm
Molybdenum ("Mo")
ppm YE03907 Channel Chip 3.00 9367265 291250 0.048 2270 21 YE03908 Channel Chip 3.00 9367266 291247 0.045 1280 10 YE03909 Channel Chip 3.00 9367271 291246 0.032 1490 20 YE03910 Channel Chip 3.00 9367273 291244 0.022 734 11 YE03911 Channel Chip 3.00 9367275 291242 0.045 1800 21 YE03912 Channel Chip 3.00 9367277 291235 0.039 1940 21 YE03913 Channel Chip 3.00 9367281 291234 0.037 1430 32 YE03914 Channel Chip 3.00 9367283 291231 0.047 2590 42 YE03915 Channel Chip 3.00 9367286 291234 0.027 1650 23 YE03916 Channel Chip 3.00 9367289 291234 0.019 1410 11 YE03917 Channel Chip 3.00 9366272 291059 0.042 2580 112 YE03918 Channel Chip 3.00 9366241 291018 0.1 1450 5 YE03919 Channel Chip 1.50 9366237 290962 0.193 4620 12 YE03941 Channel Chip 10 9367331 291221 0.029 1166 23 YE03942 Channel Chip 10 9367340 291219 0.029 889 13 YE03943 Channel Chip 10 9367350 291221 0.015 591 7 YE03944 Channel Chip 10 9367359 291216 0.013 456 7 YE03945 Channel Chip 10 9367366 291208 0.028 1229 8 YE03947 Channel Chip 10 9367372 291200 0.019 815 7 YE03950 Channel Chip 10 9367377 291191 0.013 1616 26 YE03937 Rock - 9366727 290562 0.01 1146 4 YE03938 Rock - 9366726 290580 0.071 2459 10 YE03939 Rock - 9366379 290837 0.037 1988 16 YE03940 Rock - 9366354 290863 0.198 6200 41 YE03948 Rock - 9366310 290880 0.107 3330 24 YE03949 Rock - 9366320 290870 0.052 2238 32 YE03951 Rock - 9367385 291151 0.037 623 <1 YE3921 Rock - 9366258 290951 2.45 61600 174 YE3922 Rock - 9366268 290969 0.174 1911 3 YE3923 Rock - 9366284 291016 0.286 5483 55 YE3924 Rock - 9366295 291036 0.024 487 9 YE3925 Rock - 9366348 291150 0.097 10500 26 YE3926 Rock - 9366310 291091 0.015 309 3 YE3927 Rock - 9367007 290962 0.053 2235 43 YE3928 Rock - 9367020 290868 0.014 342 9 YE3929 Rock - 9367041 291116 0.022 591 19 YE3931 Rock - 9367144 290809 0.079 2926 10 YE3932 Rock - 9367101 291013 0.044 1590 334 YE3933 Rock - 9367294 291230 0.063 1561 89 YE3934 Rock - 9367340 291225 0.11 8337 106 YE3935 Rock - 9367284 291271 0.044 3700 80 YE3936 Rock - 9367132 290884 0.047 3153 430
(1) "ppm" means parts per million.
MANAGEMENT’S DISCUSSION & ANALYSIS For the Three and Six Months Ended December 31, 2015
12
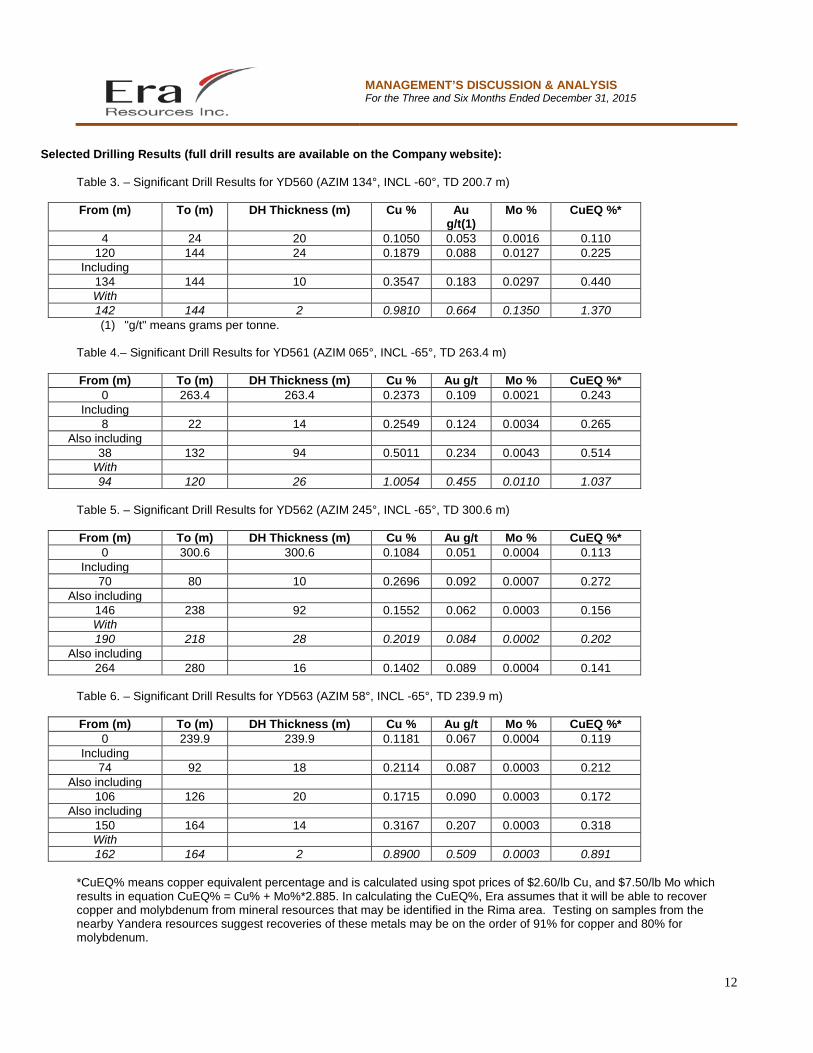
Selected Drilling Results (full drill results are available on the Company website):
Table 3. – Significant Drill Results for YD560 (AZIM 134°, INCL -60°, TD 200.7 m) From (m) To (m) DH Thickness (m) Cu % Au
g/t(1) Mo % CuEQ %*
4 24 20 0.1050 0.053 0.0016 0.110 120 144 24 0.1879 0.088 0.0127 0.225
Including 134 144 10 0.3547 0.183 0.0297 0.440 With 142 144 2 0.9810 0.664 0.1350 1.370 (1) "g/t" means grams per tonne.
Table 4.– Significant Drill Results for YD561 (AZIM 065°, INCL -65°, TD 263.4 m) From (m) To (m) DH Thickness (m) Cu % Au g/t Mo % CuEQ %*
0 263.4 263.4 0.2373 0.109 0.0021 0.243 Including
8 22 14 0.2549 0.124 0.0034 0.265 Also including
38 132 94 0.5011 0.234 0.0043 0.514 With 94 120 26 1.0054 0.455 0.0110 1.037
Table 5. – Significant Drill Results for YD562 (AZIM 245°, INCL -65°, TD 300.6 m) From (m) To (m) DH Thickness (m) Cu % Au g/t Mo % CuEQ %*
0 300.6 300.6 0.1084 0.051 0.0004 0.113 Including
70 80 10 0.2696 0.092 0.0007 0.272 Also including
146 238 92 0.1552 0.062 0.0003 0.156 With 190 218 28 0.2019 0.084 0.0002 0.202
Also including 264 280 16 0.1402 0.089 0.0004 0.141
Table 6. – Significant Drill Results for YD563 (AZIM 58°, INCL -65°, TD 239.9 m) From (m) To (m) DH Thickness (m) Cu % Au g/t Mo % CuEQ %*
0 239.9 239.9 0.1181 0.067 0.0004 0.119 Including
74 92 18 0.2114 0.087 0.0003 0.212 Also including
106 126 20 0.1715 0.090 0.0003 0.172 Also including
150 164 14 0.3167 0.207 0.0003 0.318 With 162 164 2 0.8900 0.509 0.0003 0.891
*CuEQ% means copper equivalent percentage and is calculated using spot prices of $2.60/lb Cu, and $7.50/lb Mo which results in equation CuEQ% = Cu% + Mo%*2.885. In calculating the CuEQ%, Era assumes that it will be able to recover copper and molybdenum from mineral resources that may be identified in the Rima area. Testing on samples from the nearby Yandera resources suggest recoveries of these metals may be on the order of 91% for copper and 80% for molybdenum.
MANAGEMENT’S DISCUSSION & ANALYSIS For the Three and Six Months Ended December 31, 2015
13
Figure 1. – Map of Yandera Project Area with Rima Prospect Area
MANAGEMENT’S DISCUSSION & ANALYSIS For the Three and Six Months Ended December 31, 2015
14
Figure 2. – Map of Recent Sampling at Rima
MANAGEMENT’S DISCUSSION & ANALYSIS For the Three and Six Months Ended December 31, 2015
15
La Cobota Project - Mexico On September 29, 2015, the Company acquired an option for the mineral concessions and purchased the related surface property rights for the La Cobota copper project in northern Mexico. The La Cobota Project comprises three contiguous mining concessions that together encompass approximately 1,800 hectares. The concessions are situated in the mining-friendly jurisdiction of Sonora State, and are located on privately held land approximately 80 kilometres east-southeast of the town of Sonoyta and 10 kilometres south of the US border. The project area is easily accessible via existing roads and unsealed ranch tracks. The La Cobota Project is strategically located in the Laramide Metallogenic Belt of southwest North America, which hosts numerous world class porphyry deposits and contains widespread occurrences of iron-oxide mineralization. The project area is characterized by copper-silver mineralization that is observed at surface in the form of copper carbonate staining and fracture coatings associated with zones of intense iron oxide alteration and veins. The project also incorporates the historical La Cobota underground mine where gossanous copper-silver mineralisation up to 60 feet (18 metres) wide, associated with a number of northeast trending massive iron oxide veins, are exposed at surface. Historical reports and maps of the mine workings indicate that the mineralization was exploited up to a maximum depth of approximately 200 feet (60 metres) below surface and that approximately 1,500 feet (460 metres) of development work had been completed on a number of levels. Underground workings are currently inaccessible due to localised groundwater flooding. Historical assays, recent rock chip sampling and extensive smelter slag at the site indicate that both high-grade oxidised and primary copper-silver mineralization was selectively exploited from the mine. This information is purely historic and is relevant only to understanding that there are historic indications of mineralization and a history of exploitation. No resource or reserves have been estimated at the La Cobota Project. Era acquired the surface property rights for an approximate amount of $0.3 million to ensure unrestricted access to the mineral concessions. Under the terms of the option agreement for the mineral concessions, Era has:
• The exclusive right to conduct exploration and spending $0.5 million prior to July 1, 2016; and • The exclusive and irrevocable right to acquire 100% of the mineral concessions for a fixed amount of $0.3 million,
subject to a 2.5% Net Smelter Return royalty interest to be granted to the vendor of the mineral concessions.
During the three and six-month period ended December 31, 2015, the Company recorded a write down of the property in the amount of $0.4 million due to the uncertainty of pursuing the acquisition of the mineral concessions under the option agreement.
Work Program Outlook
Management recognizes that additional and improved resources are required to elevate the Yandera deposit to one that is economically robust and to justify proceeding with the feasibility study. To realize that objective, the Company's planned work program going forward will comprise the following activities:
• Complete the metallurgical test work to confirm copper recovery from the oxide mineralization;
• Update the scoping study to incorporate processing of oxide mineralization as well as the expanded sulphide resource;
• Complete a two-staged exploration program aimed at further expansion of the resource through targeted infill and peripheral drilling; and
• Actively evaluate development options, including a combined oxide and flotation, deep sea tailings placement, power supply, transport road to Madang city and export facilities at Madang Port.
MANAGEMENT’S DISCUSSION & ANALYSIS For the Three and Six Months Ended December 31, 2015
16
Beyond the Yandera Project, Era expects to complete the work program at La Cobota to evaluate potential for near-surface economic high-grade copper mineralization. Financial Capability The Company is an exploration and development stage entity and has not yet achieved profitable operations. It is subject to risks and challenges similar to companies in a comparable stage of development. These risks include, but are not limited to, the challenges of securing adequate capital to fund its activities, operational risks inherent in the mining industry and global economic and commodity price volatility. The underlying value of the Yandera Project and the recoverability of the related capitalized costs are dependent on the Company's ability to successfully develop the Yandera Project by, among other things, securing necessary permits, obtaining the required financing to complete the development and construction and upon future profitable production from, or the proceeds from the disposition of, its mineral property. For Q2 2016, the Company incurred a comprehensive income of $12.2 million (Q2 2015— $1.0 million) and reported accumulated comprehensive losses of $90.1 million (Q2 2015— $76.6 million). As at December 31, 2015, the Company had a working capital deficiency of $26.0 million (Q2 2015— $4.1 million). The Company's sole source of funding during Q2 2016 has been available cash from the issuances of convertible debt instruments to Sentient during FY 2015 and YTD 2016. As at December 31, 2015, the Company had $7.5 million in available cash and cash equivalents (June 30, 2015— $4.8 million) and less than $0.1 million in short term investments held as restricted cash on December 31, 2015 and June 30, 2015 respectively. There are no sources of operating cash flows. Given the Company’s current financial position and the ongoing exploration and evaluation expenditures on the Yandera Project, Era’s major shareholder, Sentient has to date provided financial assistance to the Company. The section below under the header "Liquidity and Capital Resources – Financing Activities" sets out the details of the restructuring of the Company’s financial commitments and financing transactions with Sentient. The Company will need to raise additional capital through the issuance of equity or other available financing alternatives in parallel with financial support provided by Sentient in order to continue funding its operating, exploration and evaluation activities, and eventual development of the Yandera Project. Although the Company has been successful in its past fund-raising activities, there is no assurance as to the success of future fundraising efforts or as to the sufficiency of funds raised in the future. These circumstances, along with other risks relevant to exploration companies, such as continuing losses, result in material uncertainty that lends significant doubt as to the ability of the Company to fulfil its exploration and development activities and, accordingly, the appropriateness ultimately of the use of the accounting principles applicable to a going concern. Management expects that additional funding will be provided from Sentient or other sources, and therefore the Financial Statements have been prepared on the basis that the Company will continue as a going concern. The going concern basis of presentation assumes continuity of operations and realization of assets and settlement of liabilities in the normal course of business for the foreseeable future, which is at least, but not limited to, one year from December 31, 2015. Different bases of measurement may be appropriate when a Company is not expected to continue operations for the foreseeable future. Selected Financial Information The amounts are derived from the unaudited condensed interim consolidated financial statements prepared under IFRS.
In thousands of US dollars, except per share amounts
Three months ended December 31,
Six months ended December 31,
2015 2014 2015 2014 Interest income 1 1 3 1 Other income 24,848 12,956 27,043 10,457 Income from continuing operations 19,039 8,064 16,322 746 Income per share basic 1.67 0.71 1.43 0.07 Loss per share diluted (0.01) (0.03) (0.02) (0.06)
Results of Operations
MANAGEMENT’S DISCUSSION & ANALYSIS For the Three and Six Months Ended December 31, 2015
17
Other income is comprised of income due to the movement in fair value of the derivative liability in relation to the conversion option feature contained in the convertible debentures and income from an interest reversal resulting from the extinguishment of debt pursuant to the new terms following the financing transaction completed in November 2015. Net income in Q2 2016 was $10.9 million higher than net income in Q2 2015. The increase is mainly driven by other income of $24.8 million compared to income of $13.0 million in Q2 2015 resulting in an $11.8 million increase (quarter-over-quarter) offset by higher financing costs in Q2 2016. The financing costs comprised of the interest / accretion expense on the convertible debentures were $4.3 million in Q2 2016 compared to $3.4 million in Q2 2015 ($0.9 million increase quarter-over-quarter). The higher financing costs in Q2 2016 resulted from higher debt loads compared to the prior year's quarter. The exploration and evaluation assets write-offs in Q2 2016 were $0.1 million lower compared to Q2 2015 and were offset by $0.1 million higher general and administrative expenses in Q2 2016 compared to Q2 2015.
In thousands of US dollars, except per share amounts
December 31,
2015 June 30,
2015 Total assets 142,937 149,900 Non-current financial liabilities 6,229 5,997 Investment in exploration and evaluation assets 1,858 4,669 Cash flows from financing activities, net of direct costs 6,908 14,161
Total Assets Total assets at the end of the Q2 2016 period decreased by a net of $7.0 million from the end of FY 2015. The change is largely attributed to a net increase of negative currency translation adjustments of $11.9 million arising from the translation of foreign denominated assets, mainly attributed to exploration and evaluation assets of $11.9 million offset by an increase to cash and cash equivalents position of $2.7 million, and net increase to exploration and evaluation assets of $2.1 million and increase to property, plant and equipment additions of $0.1 million. Non-Current Liabilities Non-current liabilities are comprised of the debt component of the convertible unsecured debentures issued in December 2014 and in November 2015, respectively. Non-current liabilities increased by $0.3 million in Q2 2016 compared to FY 2015 due to the new debt issuance in November 2015 and reduction of existing debt resulting from revaluation pursuant to the financing transaction completed during Q2 2016. Investment in Exploration and Evaluation Assets Investment in exploration and evaluation assets relates primarily to the Yandera Project. During the period of YTD 2016, the Company also acquired surface property rights for the La Cobota copper Project in Mexico. In Q2 2016, the Company spent a total of $1.0 million in additions to exploration and evaluation assets. In aggregate, exploration and evaluation assets decreased by $9.8 million in Q2 2016 due to an increase of $11.9 million in negative translation adjustments arising from the translation of foreign denominated currency balance and a write down of $0.4 million offset by additions of $2.5 million. Cash Flows from Financing Activities As a result of the financing transaction with Sentient completed in November 2015, the Company received net proceeds from borrowings of $6.9 million. During Q2 2015, as a result of financing transactions with Sentient in December 2014, the Company received net proceeds from borrowings of $6.8 million and total of $14.2 million during YTD 2015.
MANAGEMENT’S DISCUSSION & ANALYSIS For the Three and Six Months Ended December 31, 2015
18
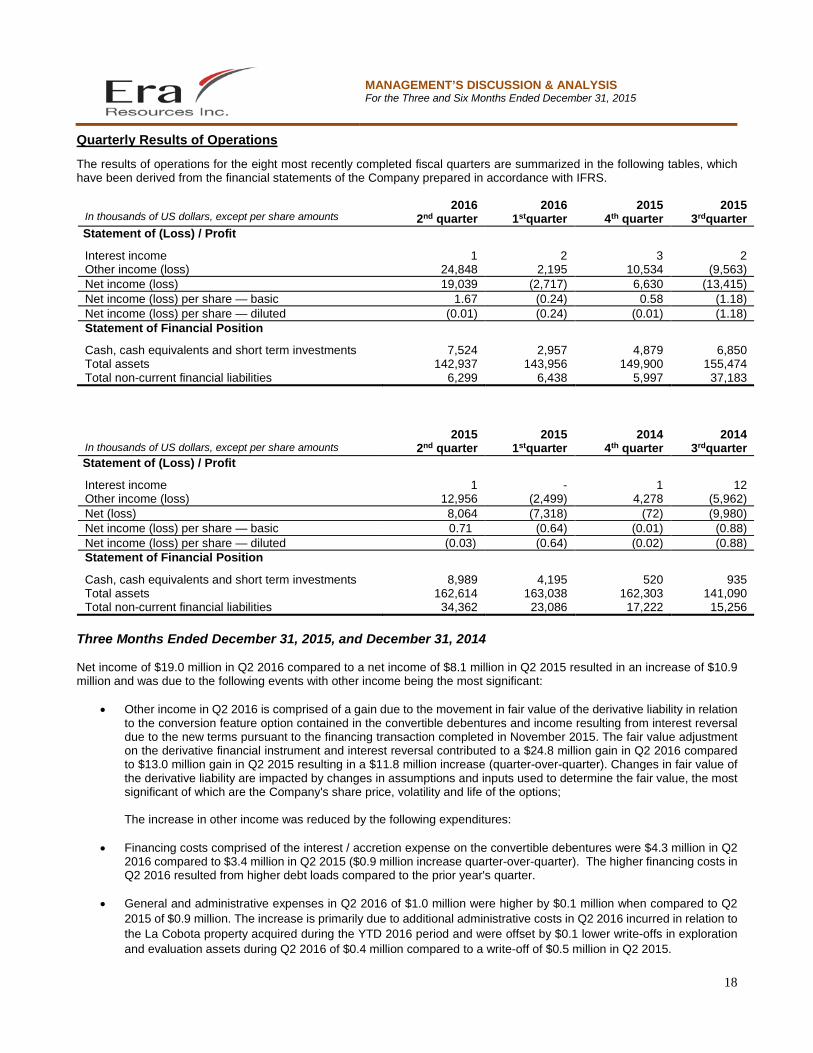
Quarterly Results of Operations
The results of operations for the eight most recently completed fiscal quarters are summarized in the following tables, which have been derived from the financial statements of the Company prepared in accordance with IFRS.
In thousands of US dollars, except per share amounts 2016 2016 2015 2015
2nd quarter 1stquarter 4th quarter 3rdquarter Statement of (Loss) / Profit
Interest income 1 2 3 2 Other income (loss) 24,848 2,195 10,534 (9,563) Net income (loss) 19,039 (2,717) 6,630 (13,415) Net income (loss) per share — basic 1.67 (0.24) 0.58 (1.18) Net income (loss) per share — diluted (0.01) (0.24) (0.01) (1.18) Statement of Financial Position
Cash, cash equivalents and short term investments 7,524 2,957 4,879 6,850 Total assets 142,937 143,956 149,900 155,474 Total non-current financial liabilities 6,299 6,438 5,997 37,183
In thousands of US dollars, except per share amounts
2015 2015 2014 2014 2nd quarter 1stquarter 4th quarter 3rdquarter
Statement of (Loss) / Profit
Interest income 1 - 1 12 Other income (loss) 12,956 (2,499) 4,278 (5,962) Net (loss) 8,064 (7,318) (72) (9,980) Net income (loss) per share — basic 0.71 (0.64) (0.01) (0.88) Net income (loss) per share — diluted (0.03) (0.64) (0.02) (0.88) Statement of Financial Position
Cash, cash equivalents and short term investments 8,989 4,195 520 935 Total assets 162,614 163,038 162,303 141,090 Total non-current financial liabilities 34,362 23,086 17,222 15,256
Three Months Ended December 31, 2015, and December 31, 2014 Net income of $19.0 million in Q2 2016 compared to a net income of $8.1 million in Q2 2015 resulted in an increase of $10.9 million and was due to the following events with other income being the most significant:
• Other income in Q2 2016 is comprised of a gain due to the movement in fair value of the derivative liability in relation
to the conversion feature option contained in the convertible debentures and income resulting from interest reversal due to the new terms pursuant to the financing transaction completed in November 2015. The fair value adjustment on the derivative financial instrument and interest reversal contributed to a $24.8 million gain in Q2 2016 compared to $13.0 million gain in Q2 2015 resulting in a $11.8 million increase (quarter-over-quarter). Changes in fair value of the derivative liability are impacted by changes in assumptions and inputs used to determine the fair value, the most significant of which are the Company's share price, volatility and life of the options; The increase in other income was reduced by the following expenditures:
• Financing costs comprised of the interest / accretion expense on the convertible debentures were $4.3 million in Q2 2016 compared to $3.4 million in Q2 2015 ($0.9 million increase quarter-over-quarter). The higher financing costs in Q2 2016 resulted from higher debt loads compared to the prior year's quarter.
• General and administrative expenses in Q2 2016 of $1.0 million were higher by $0.1 million when compared to Q2 2015 of $0.9 million. The increase is primarily due to additional administrative costs in Q2 2016 incurred in relation to the La Cobota property acquired during the YTD 2016 period and were offset by $0.1 lower write-offs in exploration and evaluation assets during Q2 2016 of $0.4 million compared to a write-off of $0.5 million in Q2 2015.
MANAGEMENT’S DISCUSSION & ANALYSIS For the Three and Six Months Ended December 31, 2015
19
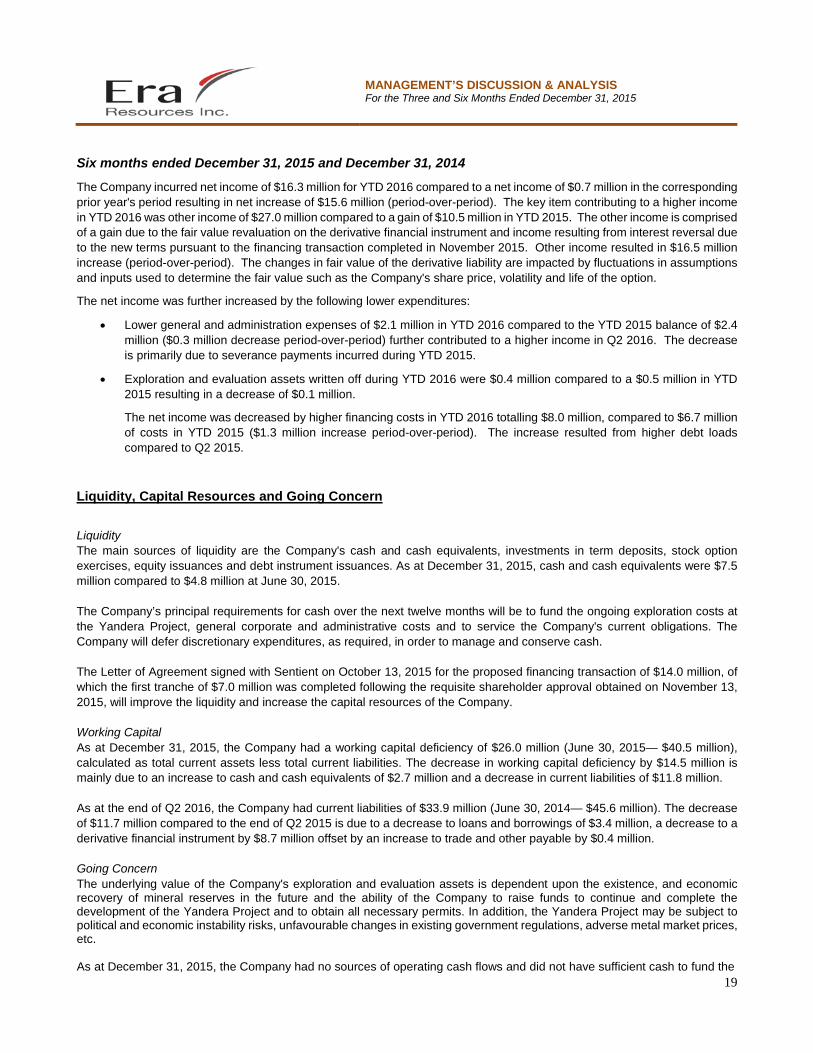
Six months ended December 31, 2015 and December 31, 2014
The Company incurred net income of $16.3 million for YTD 2016 compared to a net income of $0.7 million in the corresponding prior year's period resulting in net increase of $15.6 million (period-over-period). The key item contributing to a higher income in YTD 2016 was other income of $27.0 million compared to a gain of $10.5 million in YTD 2015. The other income is comprised of a gain due to the fair value revaluation on the derivative financial instrument and income resulting from interest reversal due to the new terms pursuant to the financing transaction completed in November 2015. Other income resulted in $16.5 million increase (period-over-period). The changes in fair value of the derivative liability are impacted by fluctuations in assumptions and inputs used to determine the fair value such as the Company's share price, volatility and life of the option.
The net income was further increased by the following lower expenditures:
• Lower general and administration expenses of $2.1 million in YTD 2016 compared to the YTD 2015 balance of $2.4 million ($0.3 million decrease period-over-period) further contributed to a higher income in Q2 2016. The decrease is primarily due to severance payments incurred during YTD 2015.
• Exploration and evaluation assets written off during YTD 2016 were $0.4 million compared to a $0.5 million in YTD 2015 resulting in a decrease of $0.1 million.
The net income was decreased by higher financing costs in YTD 2016 totalling $8.0 million, compared to $6.7 million of costs in YTD 2015 ($1.3 million increase period-over-period). The increase resulted from higher debt loads compared to Q2 2015.
Liquidity, Capital Resources and Going Concern
Liquidity The main sources of liquidity are the Company's cash and cash equivalents, investments in term deposits, stock option exercises, equity issuances and debt instrument issuances. As at December 31, 2015, cash and cash equivalents were $7.5 million compared to $4.8 million at June 30, 2015. The Company’s principal requirements for cash over the next twelve months will be to fund the ongoing exploration costs at the Yandera Project, general corporate and administrative costs and to service the Company's current obligations. The Company will defer discretionary expenditures, as required, in order to manage and conserve cash. The Letter of Agreement signed with Sentient on October 13, 2015 for the proposed financing transaction of $14.0 million, of which the first tranche of $7.0 million was completed following the requisite shareholder approval obtained on November 13, 2015, will improve the liquidity and increase the capital resources of the Company. Working Capital As at December 31, 2015, the Company had a working capital deficiency of $26.0 million (June 30, 2015— $40.5 million), calculated as total current assets less total current liabilities. The decrease in working capital deficiency by $14.5 million is mainly due to an increase to cash and cash equivalents of $2.7 million and a decrease in current liabilities of $11.8 million. As at the end of Q2 2016, the Company had current liabilities of $33.9 million (June 30, 2014— $45.6 million). The decrease of $11.7 million compared to the end of Q2 2015 is due to a decrease to loans and borrowings of $3.4 million, a decrease to a derivative financial instrument by $8.7 million offset by an increase to trade and other payable by $0.4 million. Going Concern The underlying value of the Company's exploration and evaluation assets is dependent upon the existence, and economic recovery of mineral reserves in the future and the ability of the Company to raise funds to continue and complete the development of the Yandera Project and to obtain all necessary permits. In addition, the Yandera Project may be subject to political and economic instability risks, unfavourable changes in existing government regulations, adverse metal market prices, etc. As at December 31, 2015, the Company had no sources of operating cash flows and did not have sufficient cash to fund the
MANAGEMENT’S DISCUSSION & ANALYSIS For the Three and Six Months Ended December 31, 2015
20
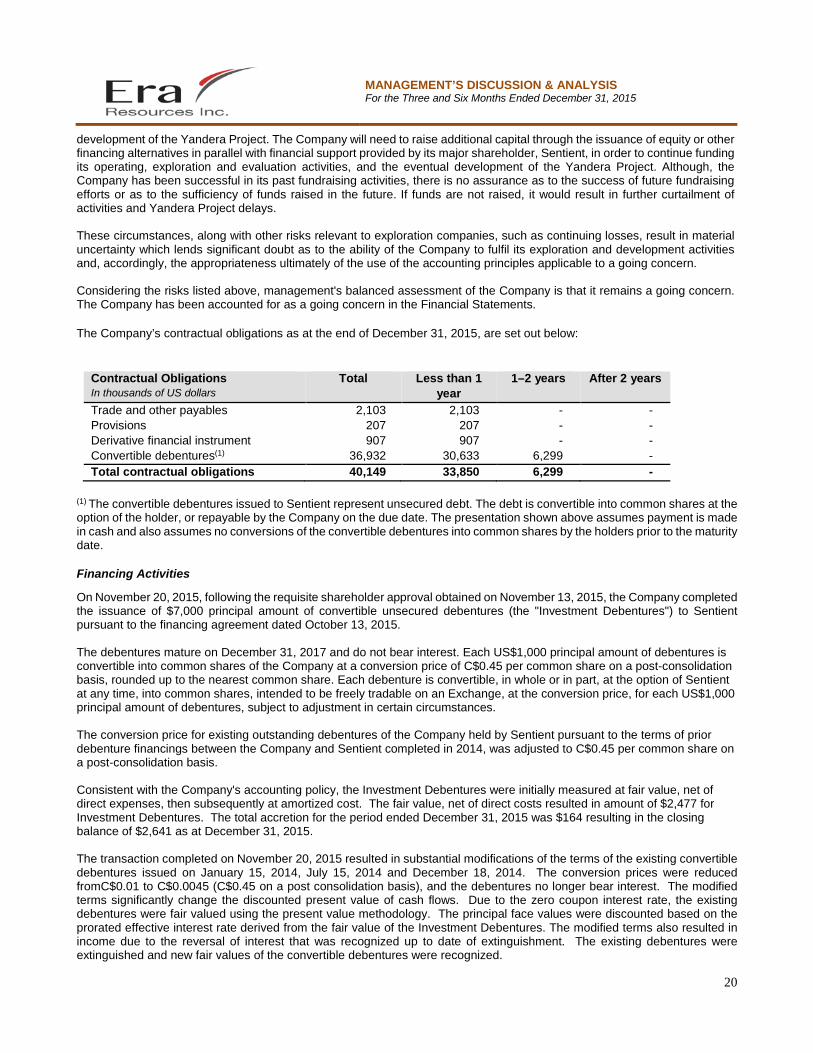
development of the Yandera Project. The Company will need to raise additional capital through the issuance of equity or other financing alternatives in parallel with financial support provided by its major shareholder, Sentient, in order to continue funding its operating, exploration and evaluation activities, and the eventual development of the Yandera Project. Although, the Company has been successful in its past fundraising activities, there is no assurance as to the success of future fundraising efforts or as to the sufficiency of funds raised in the future. If funds are not raised, it would result in further curtailment of activities and Yandera Project delays. These circumstances, along with other risks relevant to exploration companies, such as continuing losses, result in material uncertainty which lends significant doubt as to the ability of the Company to fulfil its exploration and development activities and, accordingly, the appropriateness ultimately of the use of the accounting principles applicable to a going concern. Considering the risks listed above, management's balanced assessment of the Company is that it remains a going concern. The Company has been accounted for as a going concern in the Financial Statements. The Company’s contractual obligations as at the end of December 31, 2015, are set out below:
Contractual Obligations In thousands of US dollars
Total Less than 1 year
1–2 years After 2 years
Trade and other payables 2,103 2,103 - - Provisions 207 207 - - Derivative financial instrument 907 907 - - Convertible debentures(1) 36,932 30,633 6,299 - Total contractual obligations 40,149 33,850 6,299 -
(1) The convertible debentures issued to Sentient represent unsecured debt. The debt is convertible into common shares at the option of the holder, or repayable by the Company on the due date. The presentation shown above assumes payment is made in cash and also assumes no conversions of the convertible debentures into common shares by the holders prior to the maturity date. Financing Activities
On November 20, 2015, following the requisite shareholder approval obtained on November 13, 2015, the Company completed the issuance of $7,000 principal amount of convertible unsecured debentures (the "Investment Debentures") to Sentient pursuant to the financing agreement dated October 13, 2015. The debentures mature on December 31, 2017 and do not bear interest. Each US$1,000 principal amount of debentures is convertible into common shares of the Company at a conversion price of C$0.45 per common share on a post-consolidation basis, rounded up to the nearest common share. Each debenture is convertible, in whole or in part, at the option of Sentient at any time, into common shares, intended to be freely tradable on an Exchange, at the conversion price, for each US$1,000 principal amount of debentures, subject to adjustment in certain circumstances. The conversion price for existing outstanding debentures of the Company held by Sentient pursuant to the terms of prior debenture financings between the Company and Sentient completed in 2014, was adjusted to C$0.45 per common share on a post-consolidation basis. Consistent with the Company's accounting policy, the Investment Debentures were initially measured at fair value, net of direct expenses, then subsequently at amortized cost. The fair value, net of direct costs resulted in amount of $2,477 for Investment Debentures. The total accretion for the period ended December 31, 2015 was $164 resulting in the closing balance of $2,641 as at December 31, 2015. The transaction completed on November 20, 2015 resulted in substantial modifications of the terms of the existing convertible debentures issued on January 15, 2014, July 15, 2014 and December 18, 2014. The conversion prices were reduced fromC$0.01 to C$0.0045 (C$0.45 on a post consolidation basis), and the debentures no longer bear interest. The modified terms significantly change the discounted present value of cash flows. Due to the zero coupon interest rate, the existing debentures were fair valued using the present value methodology. The principal face values were discounted based on the prorated effective interest rate derived from the fair value of the Investment Debentures. The modified terms also resulted in income due to the reversal of interest that was recognized up to date of extinguishment. The existing debentures were extinguished and new fair values of the convertible debentures were recognized.
MANAGEMENT’S DISCUSSION & ANALYSIS For the Three and Six Months Ended December 31, 2015
21
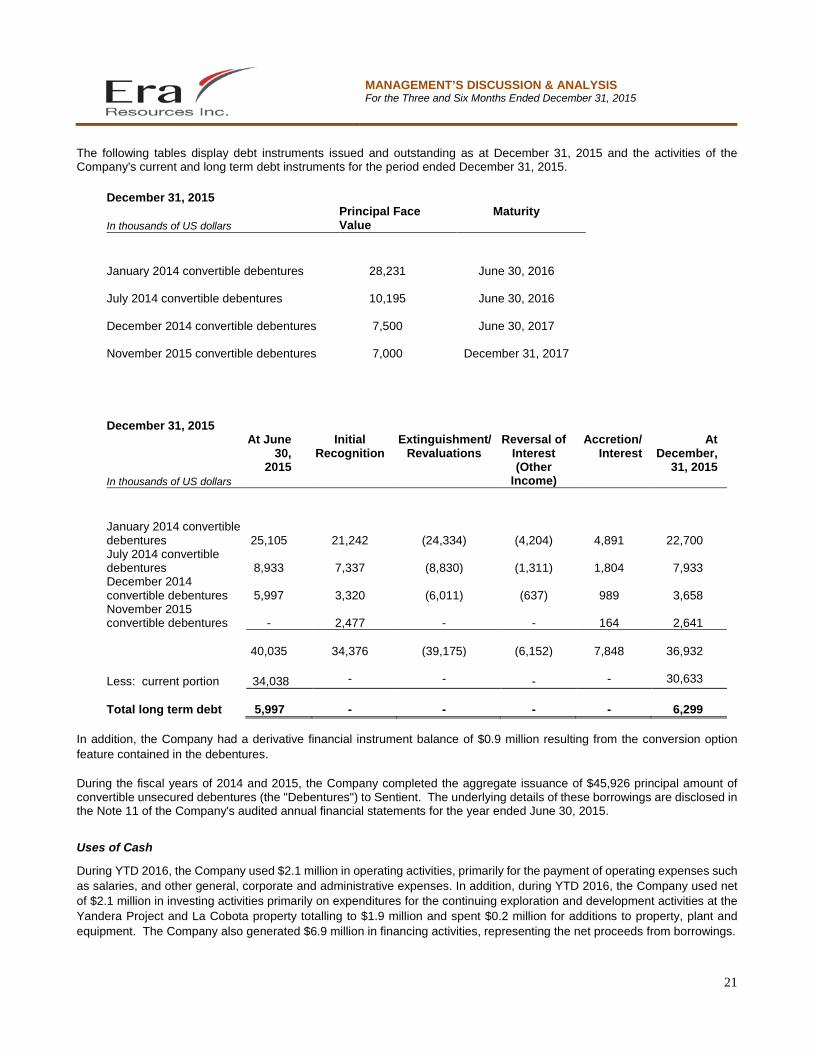
The following tables display debt instruments issued and outstanding as at December 31, 2015 and the activities of the Company's current and long term debt instruments for the period ended December 31, 2015.
December 31, 2015
In thousands of US dollars Principal Face Value
Maturity
January 2014 convertible debentures 28,231
June 30, 2016
July 2014 convertible debentures 10,195
June 30, 2016
December 2014 convertible debentures 7,500
June 30, 2017
November 2015 convertible debentures 7,000
December 31, 2017
December 31, 2015
In thousands of US dollars
At June 30,
2015
Initial Recognition
Extinguishment/ Revaluations
Reversal of Interest (Other
Income)
Accretion/ Interest
At December,
31, 2015
January 2014 convertible debentures 25,105
21,242
(24,334) (4,204)
4,891
22,700 July 2014 convertible debentures 8,933
7,337
(8,830) (1,311)
1,804
7,933
December 2014 convertible debentures 5,997
3,320
(6,011) (637)
989
3,658
November 2015 convertible debentures -
2,477
- -
164
2,641
40,035
34,376
(39,175) (6,152)
7,848
36,932 Less: current portion 34,038
-
-
-
-
30,633
Total long term debt 5,997
-
- -
-
6,299
In addition, the Company had a derivative financial instrument balance of $0.9 million resulting from the conversion option feature contained in the debentures. During the fiscal years of 2014 and 2015, the Company completed the aggregate issuance of $45,926 principal amount of convertible unsecured debentures (the "Debentures") to Sentient. The underlying details of these borrowings are disclosed in the Note 11 of the Company's audited annual financial statements for the year ended June 30, 2015.
Uses of Cash
During YTD 2016, the Company used $2.1 million in operating activities, primarily for the payment of operating expenses such as salaries, and other general, corporate and administrative expenses. In addition, during YTD 2016, the Company used net of $2.1 million in investing activities primarily on expenditures for the continuing exploration and development activities at the Yandera Project and La Cobota property totalling to $1.9 million and spent $0.2 million for additions to property, plant and equipment. The Company also generated $6.9 million in financing activities, representing the net proceeds from borrowings.
MANAGEMENT’S DISCUSSION & ANALYSIS For the Three and Six Months Ended December 31, 2015
22
During YTD 2015, the Company used $2.9 million in operating activities and $2.5 million in net investing activities, of which $2.6 million was for exploration and development expenditures at the Yandera Project. The Company utilized $0.1 million cash from the maturity of term deposits. The Company also generated $14.2 million in financing activities, representing the net proceeds from borrowings.
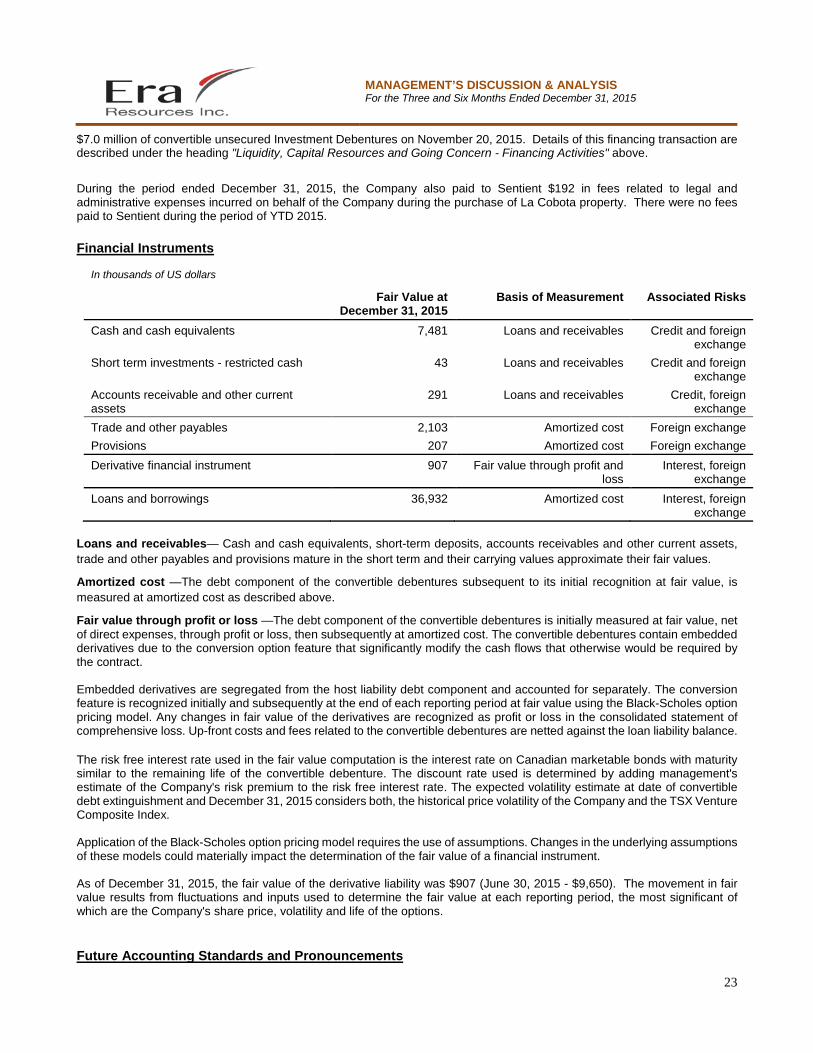
Commitments and Contingencies
The Company has certain commitments to meet the minimum expenditure requirements on the mineral exploration assets in PNG in which it has an interest. The Company had no contingent liabilities as at December 31, 2015. Future minimum payments as at December 31, 2015, under agreements to which the Company is a party are as follows:
In thousands of US dollars Less than 1 year 1–5 years Total
Lease commitments 4 - 4 Exploration commitments 70 122 192 Total 74 122 196
Off-Balance Sheet Arrangements
There are no off-balance sheet arrangements as at December 31, 2015. Transactions with Related Parties
The Company's related parties as defined by International Accounting Standard 24 "Related Party Disclosures" (IAS 24), include the Company's subsidiaries, executive and non-executive directors, senior officers and key management personnel. Transactions with related parties are measured at fair value, which is the amount of consideration established and agreed upon by the related parties. All related party transactions entered into by the Company have been approved by the Board of Directors of the Company and/or shareholders of the Company as required. Key management personnel are defined as directors and senior officers of the Company. Transactions with related parties during YTD 2016 and YTD 2015 were as follows: (a) Compensation of Key Management Personnel:
In thousands of US dollars Six months ended December31,
2015 2014 Salaries, fees, wages and other benefits 597 671 Severances - 654 Share-based compensation 31 62 Total 628 1,387
The severances in the prior year resulted from changes in executive management. (b) Transactions with Sentient Pursuant to a Financing Letter agreement with Sentient dated October 13, 2015 in connection with the proposed issuance of $14.0 million principal amount of the convertible unsecured debentures, the Company completed the first tranche and issued
MANAGEMENT’S DISCUSSION & ANALYSIS For the Three and Six Months Ended December 31, 2015
23
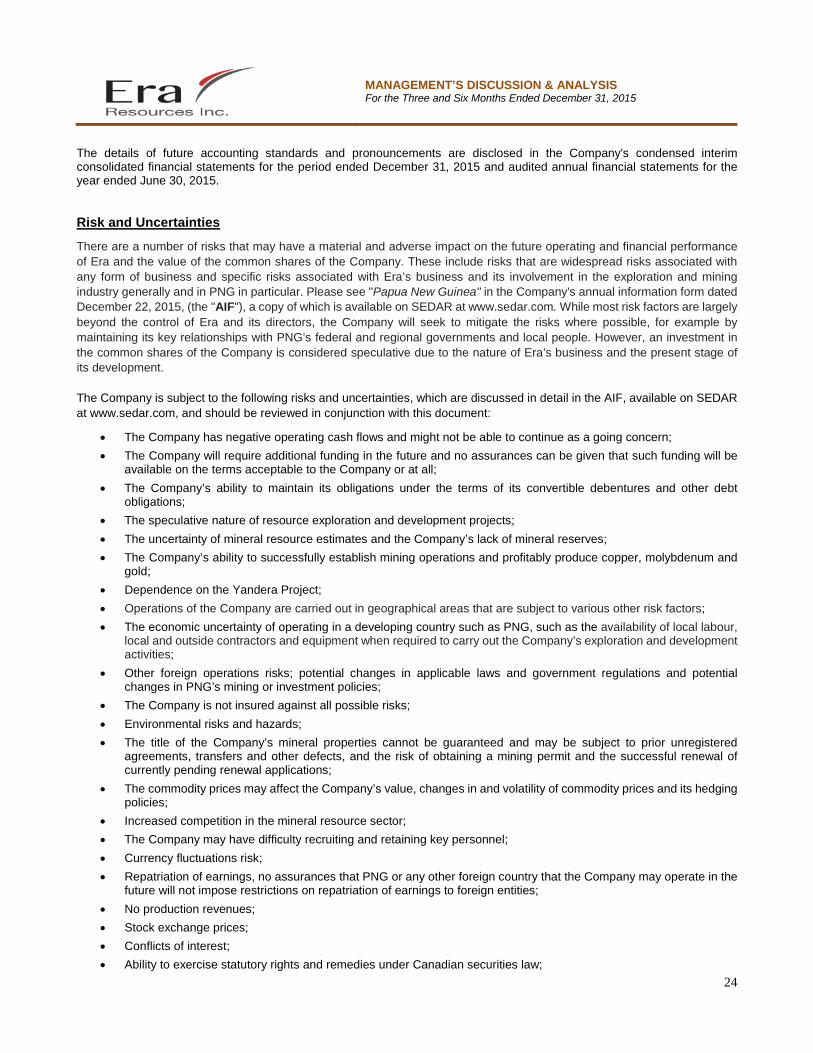
$7.0 million of convertible unsecured Investment Debentures on November 20, 2015. Details of this financing transaction are described under the heading "Liquidity, Capital Resources and Going Concern - Financing Activities" above. During the period ended December 31, 2015, the Company also paid to Sentient $192 in fees related to legal and administrative expenses incurred on behalf of the Company during the purchase of La Cobota property. There were no fees paid to Sentient during the period of YTD 2015. Financial Instruments
In thousands of US dollars
Fair Value at December 31, 2015
Basis of Measurement Associated Risks
Cash and cash equivalents 7,481 Loans and receivables Credit and foreign exchange
Short term investments - restricted cash 43 Loans and receivables Credit and foreign exchange
Accounts receivable and other current assets
291 Loans and receivables Credit, foreign exchange
Trade and other payables 2,103 Amortized cost Foreign exchange Provisions 207 Amortized cost Foreign exchange Derivative financial instrument 907 Fair value through profit and
loss Interest, foreign
exchange Loans and borrowings 36,932 Amortized cost Interest, foreign
exchange Loans and receivables— Cash and cash equivalents, short-term deposits, accounts receivables and other current assets, trade and other payables and provisions mature in the short term and their carrying values approximate their fair values.
Amortized cost —The debt component of the convertible debentures subsequent to its initial recognition at fair value, is measured at amortized cost as described above.
Fair value through profit or loss —The debt component of the convertible debentures is initially measured at fair value, net of direct expenses, through profit or loss, then subsequently at amortized cost. The convertible debentures contain embedded derivatives due to the conversion option feature that significantly modify the cash flows that otherwise would be required by the contract. Embedded derivatives are segregated from the host liability debt component and accounted for separately. The conversion feature is recognized initially and subsequently at the end of each reporting period at fair value using the Black-Scholes option pricing model. Any changes in fair value of the derivatives are recognized as profit or loss in the consolidated statement of comprehensive loss. Up-front costs and fees related to the convertible debentures are netted against the loan liability balance. The risk free interest rate used in the fair value computation is the interest rate on Canadian marketable bonds with maturity similar to the remaining life of the convertible debenture. The discount rate used is determined by adding management's estimate of the Company's risk premium to the risk free interest rate. The expected volatility estimate at date of convertible debt extinguishment and December 31, 2015 considers both, the historical price volatility of the Company and the TSX Venture Composite Index. Application of the Black-Scholes option pricing model requires the use of assumptions. Changes in the underlying assumptions of these models could materially impact the determination of the fair value of a financial instrument. As of December 31, 2015, the fair value of the derivative liability was $907 (June 30, 2015 - $9,650). The movement in fair value results from fluctuations and inputs used to determine the fair value at each reporting period, the most significant of which are the Company's share price, volatility and life of the options. Future Accounting Standards and Pronouncements
MANAGEMENT’S DISCUSSION & ANALYSIS For the Three and Six Months Ended December 31, 2015
24
The details of future accounting standards and pronouncements are disclosed in the Company's condensed interim consolidated financial statements for the period ended December 31, 2015 and audited annual financial statements for the year ended June 30, 2015. Risk and Uncertainties
There are a number of risks that may have a material and adverse impact on the future operating and financial performance of Era and the value of the common shares of the Company. These include risks that are widespread risks associated with any form of business and specific risks associated with Era’s business and its involvement in the exploration and mining industry generally and in PNG in particular. Please see "Papua New Guinea" in the Company's annual information form dated December 22, 2015, (the "AIF"), a copy of which is available on SEDAR at www.sedar.com. While most risk factors are largely beyond the control of Era and its directors, the Company will seek to mitigate the risks where possible, for example by maintaining its key relationships with PNG’s federal and regional governments and local people. However, an investment in the common shares of the Company is considered speculative due to the nature of Era’s business and the present stage of its development. The Company is subject to the following risks and uncertainties, which are discussed in detail in the AIF, available on SEDAR at www.sedar.com, and should be reviewed in conjunction with this document:
• The Company has negative operating cash flows and might not be able to continue as a going concern; • The Company will require additional funding in the future and no assurances can be given that such funding will be
available on the terms acceptable to the Company or at all; • The Company’s ability to maintain its obligations under the terms of its convertible debentures and other debt
obligations; • The speculative nature of resource exploration and development projects; • The uncertainty of mineral resource estimates and the Company’s lack of mineral reserves; • The Company’s ability to successfully establish mining operations and profitably produce copper, molybdenum and
gold; • Dependence on the Yandera Project; • Operations of the Company are carried out in geographical areas that are subject to various other risk factors; • The economic uncertainty of operating in a developing country such as PNG, such as the availability of local labour,
local and outside contractors and equipment when required to carry out the Company’s exploration and development activities;
• Other foreign operations risks; potential changes in applicable laws and government regulations and potential changes in PNG’s mining or investment policies;
• The Company is not insured against all possible risks; • Environmental risks and hazards; • The title of the Company’s mineral properties cannot be guaranteed and may be subject to prior unregistered
agreements, transfers and other defects, and the risk of obtaining a mining permit and the successful renewal of currently pending renewal applications;
• The commodity prices may affect the Company’s value, changes in and volatility of commodity prices and its hedging policies;
• Increased competition in the mineral resource sector; • The Company may have difficulty recruiting and retaining key personnel; • Currency fluctuations risk; • Repatriation of earnings, no assurances that PNG or any other foreign country that the Company may operate in the
future will not impose restrictions on repatriation of earnings to foreign entities; • No production revenues; • Stock exchange prices; • Conflicts of interest; • Ability to exercise statutory rights and remedies under Canadian securities law;
MANAGEMENT’S DISCUSSION & ANALYSIS For the Three and Six Months Ended December 31, 2015
25
• Enforceability of foreign judgements; • Unforeseen litigation; • Structural subordination of the Company’s common shares; • The Company’s future sales or issuance of common shares; • Risk of suspension of public listing due to failure to comply with local securities regulations; • Risk of fines and penalties; and • Risk of improper use of funds in local entity.
Share Capital Information
As at the date of this MD&A, the following number of common shares of the Company and other securities of the Company exercisable for common shares of the Company are outstanding (on a post-consolidation basis):
Securities Common shares on exercise Common shares 11,377,792 Stock options 114,250 Convertible debentures 130,316,459 Fully diluted share capital 141,808,501
Corporate Responsibility for Financial Reports
Disclosure Controls
Disclosure controls and procedures have been designed to ensure that information required to be disclosed by the Company is accumulated and communicated to Management as appropriate to allow timely decision-making regarding required disclosures. The Company’s CEO and CFO have concluded, based on their evaluation of the effectiveness of the Company’s disclosure controls and procedures, that these controls and procedures provide reasonable assurance that material information is made known to them by others within the Company. However, a control system, no matter how well conceived, can provide only reasonable, not absolute, assurance that the objectives of the control system are met.
Internal Control over Financial Reporting
The Company’s CEO and CFO are responsible for establishing and maintaining adequate internal control over financial reporting (“ICFR"). The Company’s ICFR is intended to provide reasonable assurance regarding the reliability of financial reporting and the preparation of financial statements for external purposes in accordance with applicable IFRS. The Company's ICFR includes policies and procedures that:
• Pertain to the maintenance of records that in reasonable detail accurately and fairly reflect the transactions and dispositions of assets;
• Provide reasonable assurance that transactions are recorded as necessary to permit preparation of financial statements in accordance with IFRS, and that receipts and expenditures are being made only in accordance with authorizations of the Company’s Management and Board; and
• Provide reasonable assurance regarding prevention or timely detection of unauthorized acquisition, use, or disposition of assets that could have a material effect on the financial statements.
Any disclosure control and procedures or ICFR, no matter how well conceived and operated, can provide only reasonable, not absolute, assurance that the objectives of the control system are met. Further, the design of a control must reflect the fact that there are resource constraints, and the benefits of controls must be considered relative to their costs. Internal control over financial reporting is a process that involves human diligence and compliance and is subject to error, collusion, or improper override. Because of the inherent limitations in all control systems, there is a risk that misstatements due to error or fraud may occur and not detected on a timely basis.
Changes in Internal Control over Financial Reporting
MANAGEMENT’S DISCUSSION & ANALYSIS For the Three and Six Months Ended December 31, 2015
26
There have been no changes in the Company's design of internal controls and procedures over financial reporting that have materially affected, or are reasonably likely to materially affect, the Company's internal control over financial reporting during the period covered by this MD&A. Forward-looking Information
Certain information in this MD&A, including all statements that are not historical facts, constitutes forward-looking information within the meaning of applicable Canadian securities laws. Such forward-looking information includes, but is not limited to, information that reflects management’s expectations regarding Era’s future growth, results of operations (including, without limitation, future production and capital expenditures), performance (both operational and financial) and business prospects (including the timing and development of new deposits and the success of exploration activities) and opportunities. Often, this information includes words such as “plans”, “expects” or “does not expect”, “is expected”, “budget”, “scheduled”, “estimates”, “forecasts”, “intends”, “anticipates” or “does not anticipate” or “believes” or variations of such words and phrases or statements that certain actions, events or results “may”, “could”, “would”, “might” or “will” be taken, occur or be achieved. In making and providing the forward-looking information included in this MD&A, the Company has made numerous assumptions. The assumptions include, among other things, assumptions regarding: (i) the accuracy of exploration results received to date; (ii) anticipated costs and expenses; (iii) the accuracy of the Company’s mineral resource estimate; (iv) the future price of copper, molybdenum and gold; and (v) that the supply and demand for copper, gold, molybdenum, and other metals develop as expected. Although management believes that the assumptions made and the expectations represented by such information are reasonable, there can be no assurance that the forward-looking information will prove to be accurate. By its nature, forward-looking information is based on assumptions and involves known and unknown risks, uncertainties and other factors that may cause the Company’s actual results, performance or achievements, or industry results, to be materially different from future results, performance or achievements expressed or implied by such forward-looking information. Such risks, uncertainties and other factors include, among other things, the following: (i) need for additional financing to develop the Yandera Project; (ii) decreases in the price of copper and molybdenum; (iii) exploration risk; (iv) the risk that the Company will not be able to obtain or renew the requisite permits and licenses to carry out its planned exploration activities; (v) dependence on the Yandera Project; (vi) PNG State equity interest; and (vii) the ability of the Company to satisfy its debt obligations. The Company’s AIF dated September 22, 2015, contains additional information on risks, uncertainties and other factors relating to the forward-looking information. Although the Company has attempted to identify factors that would cause actual actions, events or results to differ materially from those disclosed in the forward-looking information, there may be other factors that cause actual results, performances, achievements or events not to be as anticipated, estimated or intended. Also, many of the factors are beyond the Company’s control. Accordingly, readers should not place undue reliance on forward-looking information. The Company undertakes no obligation to reissue or update forward-looking information as a result of new information or events after the date of this MD&A except as may be required by law. All forward-looking information disclosed in this MD&A is qualified by this cautionary statement. Additional Information
Additional information about the Company and its business activities is available under the Company’s profile on the Canadian SEDAR website at www.sedar.com. Qualified Person and Technical Information
The scientific and technical information contained in this MD&A was prepared by or under the supervision of and reviewed and approved by Dr. Nathan Chutas. Dr. Chutas is a Certified Professional Geologist with the American Institute of Professional Geologists in the US and he provides technical advisory consultancy services to Era. Dr. Chutas is a “Qualified Person” as defined by NI 43-101. Dr. Chutas verified the data underlying the information in this MD&A. For further information relating to the Yandera Project, please see the technical report titled “Technical Report Updated Resource Estimate Yandera Copper Project Papua New Guinea” dated June 19, 2015 prepared by SRK Consulting (U.S.) Inc. which is available under the Company's issuer profile on SEDAR at sedar.com.