Embed Size (px)
Citation preview

MANAGEMENT PERSPECTIVE
Suspended sediment concentrations are an important indicator of water qual-
ity in rivers. To ensure that reliable data are obtained, the Monitoring and Surveys
Division (MSD) of the Surveys and Information Systems Branch (SISB) of Environ-
ment Canada, is in the process of developing a quality assurance program for the 500
samplers of various types currently in use by the Department. The National Water Re-
search Institute (NWRI) is assisting SISB in the development of a calibration strategy
for suspended sediment samplers used in the national program.
In this report the calibration of the DH-59 suspended sediment sampler is
examined. It was found that individual samplers can be calibrated with a high degree
of repeatability, but that there is a large variability from sampler to sampler at lower
velocities, partly as a function of the operating mode of the sampler, either nozzle
control or vent control.

PERSPECTIVES DE LA DIRECTION
La concentration de skdiments en suspension est un indice important de la qualit6 de I'eau
dans 1es cours d'eau. La Division du contr8le et des relevis (DCR) de la Direction des relevis
et syst&mes d'information (DRSI) d'Environnement Canada est en train de mettre sur pied un
programme d'assurance de la qualit6 pour verifier la fiabilitk des donnies fournies par Ies 500
6chantillonneurs appartenant h divers types utilis6s actuellement au minist6re. L'Institut national
de recherche sur les eaux (INRE) collabore avec la DRSI pour Claborer une stratCgie d'ktalonnage
des ichantillonneurs de sidiments en suspension utilisks dans le cadre du programme national.
Dans le prksent rapport, on s'est penchi sur IyCtalonnage de I'Cchantillonneur de sidiments
en suspension DH-59. On a observC que chaque Cchantillonneur peut etre CtalonnC avec un taux
devil de rkpetabiliti, mais qu'il existe une grande variabilite d'un echantillonneur j. l'autre h de
faibles vitesses, en partie h cause du mode de fonctionnement de 1'6chantillonneur, B gicleur ou
i ivent.

ABSTRACT
Tests were conducted in the towing tank a t NWRI on the DH-59 sediment
sampler with carefully selected nozzles. Statistical analysis of the test data were con-
ducted. It has been shoxn that individual samplers can be calibrated with a high
degree of repeatability but that the variability of calibrations from sampler to sampler
was quite high at the lower velocities. It was further shown that the performance of
the sampler was sensitive to changes in the velocity coefficient of the 3.2 mm nozzle.
Similar variabilities in the velocity coefficient for the 4.8 rnrn and 6.4 mm nozzles did
not affect the performance of the sampler. Similar tests on other types of samplers are
proceeding.

Des essais ont CtC effectuis sur I'Cchantillonneur de sidiments DH-59 B I'aide de gicleurs
soigneusement choisis dans le bassin h chariot mobile de I'INRE. Une analyse statistique des
donn6es a CtC effectuie. On a observC que chaque Cchantillonneur pouvait &re CtalonnC avec un
taux ClevC de rCpktabilitC, mais que la variabilitk de I'Ctalonnage Ctait assez CIevC d'un
6chantillonneur i l'autre aux vitesses les plus faibles. On a en outre montr6 que Ie rendement
de 1'6chantillonneur Ctait sensible au changement du coefficient de vitesse du gicleur de 3,2 mm.
Une variation semblable du coefficient de vitesse des gicleurs de 4,8 mm et de 6'4 mm n'avait
pas d'effet sur le rendement de 1'Cchantillonneur. Des essais semblables sur d'autres types
d'6chantillonneurs sont en cours.

TABLE O F CONTENTS
Page
RlIANAGEiLIENT PERSPECTIVE
SOMMAIRE A L'INTENTION D E LA DIRECTION
ABSTRACT
RESUME
1. INTRODUCTION
2. PRELIMINARY CONSIDERATIONS
3. EXPERIMENTAL EQUIPMENT AND PROCEDURE
3.1 Towing Tank
3.2 Touring Carriage
3.3 T h e DH-59 Sampler and Appurtenances
3.4 Selection of Test Nozzles
3.5 General Test Procedure
4. DATA ANALYSIS
4.1 Performance Coefficient of DH-59 Sampler
4.2 Uncertainty in the Value of I< for a Particular Sampler
4.3 Uncertainty in the Value of K for a Group of Samplers
4.4 Effect of Changing Nozzles
5. CONCLUSIONS
ACKNOWLEDGEklENT
REFERENCES
TABLES
FIGURES

1
1. INTRODUCTION
Data of suspended sediment concentration in rivers have become increasingly
important because the fine fractions of the sediment load are known to be carriers of
toxic substances. As a result, suspended sediment concentrations are an important
indicator of water quality in rivers. The accuracy of all suspended sediment samplers
must be checked to ensure that reliable data are obtained throughout the data col-
lection program conducted by the federal Department of the Environment. At the
present time, the Monitoring and Surveys Division (h4SD) of the Surveys and Lnfor-
mation Systems Branch (SISB), with the assistance of the National Water Research
Institute (NIVRI); is in the process of developing a calibration strategy for all sus-
pended sediment samplers used in the national data gathering program. This report
presents the results of tests conducted on the DH-59 sampler in the towing tank of the
NFITRI Hydraulics Laboratory at Burlington, Ontario.
2. PRELIMINARY CONSIDERATIONS
The purpose of the suspended sediment sampler is to obtain a sample that
is representative of the water-sediment mixture moving in the vicinity of the sampler.
During the sampling, a volume of the water-sediment mixture is collected in the sampler
over a measured interval of time, using predetermined transit rates (Guy and Norman
1970, Beverage 1979). From the measured volume and the transit time, the flow rate
into the sampler is determined. The velocity of the flow through the nozzle is computed
by dividing the flow rate by the cross-sectional area of the nozzle flow passage entrance.
The sediment flux is the product of the sediment concentration of the collected sample
and the nozzle velocity.
Suspended sediment samplers are operated on the premise that the velocity
of flow through the nozzle is equal to the velocity of the stream flow surrounding the
nozzle (Beverage 1979). This condition is known as iso-kinetic sampling. For sediment
sampling quality control, the nozzle velocity I/, and the stream flow velocity V , are

expressed as a ratio given by
where K is the sampler performance coefficient. For iso-kinetic conditions, I< = 1 and
it is assumed that the flow entering through the nozzle contains the same sediment-
water mixture as the stream flow being sampled. When the suspended sediment is
sand and K > 1, the sampler will under-sample the suspended sediment concentra-
tion, whereas when I( < 1, the sampler will over-sample (Beverage 1979, Beverage
and Futrell 1986). For a given flow velocity, errors in sample concentration become
increasingly sensitive to the value of I< as the particle size increases. For silts and
clays, the sample concentration is less sensitive to Isl because the particles are more
sensitive to the acceleration of the fluid and thus follow the fluid more closely.
The performance of the DH-59 sampler can be evaluated by examining the
variation of li with towing velocity. The accuracy of a given sampler calibration is
reflected by the uncertainty in the value of K at different towing velocities over its
operating range. The sampler to sampler variability can be determined by comparing
values of I< for different DH-59 samplers for the same towing velocity. Finally, the effect
of using different nozzles of a given size and type, can be determined by examining the
change in the sampler performance coefficient.
3. EXPERIMENTAL EQUIPMENT AND PROCEDURE
3.1 Towing Tank
The towing tank used to test the sampler is 122 m long by 5 m wide and
is constructed of reinforced concrete founded on piles. The full depth of the tank is
3 metres, of which 1.5 metres are below ground level. Normally the water depth is
maintained a t 2.7 metres. Concrete was chosen for its stability and to reduce possible
vibrations and convection currents.
At one end of the tank is an overflow weir. \Vaves arising from towed objects
and their suspensions are washed over the crest, thereby reducing wave reflections.

3
Parallel to the sides of the tank perforated beaches serve to dampen lateral surface
wave disturbances.
3.2 Towing Carriage
The carriage is 3 metres long, 5 metres wide, weighs 6 tonnes and travels on
four precision machined steel wheels. The carriage is operated in three overlapping
speed ranges:
The maximum speed of 6.00 m/s can be maintained for 12 seconds. Tachometer gen-
erators connected to the drive shafts emit a voltage signal proportional to the speed of
the carriage. A feedback control system uses these signals as input to maintain con-
stant speed during tests. The average speed data for the towing carriage is obtained by
recording the voltage pulses emitted from a measuring wheel. This wheel is attached
to the frame of the towing carriage and travels on one of the towing tank rails, emitting
a pulse for each millimeter of travel. The pulses and measured time are collected and
processed to produce an average towing speed with a micro computer data acquisi-
tion system. Analysis of the towing speed variability by Engel (1989)) showed that
for speeds between 0.20 m/s and 3.00 m/s, the error in the mean speed was less than
0.15% at the 99% confidence level. Occasionally, these tolerances are exceeded as a
result of irregular occurrences such as "spikes" in the data transmission system of the
towing carriage. Tests with such anomalies are recognized by the computer and are
automatically abandoned.
3.3 The DH-59 Sampler
The sampler consists of a cast bronze housing, a 0.6 l (pint) "milk bottle",
and three teflon nozzles. The nozzles have an inside diameter of 6.4 mm (1/4"), 4.8
mm (3/16") and 3.2 mm (1/8"), each having geometric properties most suitable to the
particular range of velocities shown in Table 1. The sampler and its appurtenances are

shown in Figure 1.
The DH-59 sampler is designed to sample a t velocity less than 2.5 m/s, sus-
pended by a hand line in streams too deep to be waded. When the sampler is lowered
into the flow, air is expelled through a 3.0 mrn diameter air vent at the side of the
sampler casing. The air vent outlet is located about 5 mm above the entrance of the
nozzle flow passage. This creates a small, positive, net hydro-static pressure which is
constant regardless of the depth of submergence of the sampler,
3.4 Selection of Test Nozzles
The nozzles were selected from samples tested by Engel (1991) using a new
static test chamber, developed to determine the variability in the coefficient of velocity
for suspended sediment sampler nozzles. Prior to testing, a nozzle was selected and
fastened to the nozzle mount which was then secured in the base of the test chamber.
The measurements consisted of the nTater level elevation above the nozzle entrance in
the test chamber stilling well, the volume of water passing through the nozzle and the
time required to pass that volume of water. For each value of static head, the discharge
was measured by intercepting the outflow jet from the nozzle with a graduated cylinder
and measuring the time to collect the water. The data were used to compute the
velocity coefficient for each nozzle from the relationship
where C, = the nozzle velocity coefficient, V, = the flow velocity through the nozzle
and Vt = the theoretical velocity of flow through the nozzle. The uncertainty in the
velocity coefficients obtained with this method is less than 0.3% at the 95% confidence
level (Engel 1990). Tests were conducted for each of the 25 nozzles of the three sizes
of nozzles used with the DH-59 sampler, for a total of 75 tests.
To determine the uncertainty in the sampler calibrations, the nozzle having a
velocity coefficient closest to the mean value for each sample of 25 nozzles was selected.
This nozzle was designated as the "standard nozzle" because it was deemed to have
the most representative properties of the nozzles used with the DH-59 sampler. These

5
nozzles, were numbered S59- 10 for the 3.2 mm diameter, S59-3 for the 4.8 mrn diameter
and S59-1 for the 6.4 mrn diameter. Each nozzle was used with each of the 5 samplers
tested.
To determine the effect of changing nozzles on the sampler performance coeffi-
cient K, the nozzle, for which the difference between its value of C, and the mean value
for the sample was the greatest, was selected. These nozzles were numbered 559-22
for the 3.2 mm diameter, S59-21 for the 4.8 mm diameter and S59-7 for the 6.4 mm
diameter with deviations in the velocity coefficient C, from the standard nozzles of
11.8 %, 12.4% and 8.7% respectively. Each of these nozzles was used only with one of
five samplers.
3.5 General Test Procedure
For a given nozzle, the volume of water that can enter the sampler bottle in a
given period of time should primarily depend on the physical properties of the nozzle
and the air vent (Engel and Droppo 1990, Engel 1991 and Engel and Droppo 1992).
In order to determine the uncertainty in the sampler performance coefficient: a series
of tests, each repeated 10 times over the range of velocities specified in Table 1, was
conducted. At the beginning of each series of tests, the nozzle was inserted into the
sampler nose and the sampler assembled in its standard configuration.
Once the sampler was prepared, the towing carriage was set in motion. When
the carriage had reached its preset constant velocity, the sampler was submerged and
held at 0.2 m below the surface of the water for the set period of time given in Table 1.
The filling times in Table I are the maximum allowable without over-filling the bottle,
thereby ensuring that there is no interference in the air flow through the vent. The
tests were conducted in a towing tank because this afforded better control over the
reference velocity than can be obtained in a flume. It has been shown that there is
little difference between sampler calibrations obtained in a flume and in a towing tank
(Beverage and Futrell 1986). Although, this procedure does not simulate actual stream
sampling methods, it does, however, allow the operation of a sampler at a constant

6
velocity. When the set period of sampling time had expired, the sampler was removed
from the water and the volume of water determined with a 1000 rnl graduated cylinder.
The velocity of flow through the sampler nozzle was then computed from the equation
where d = the diameter of the flow passage through the nozzle in mm, I.', = the
volume of water collected in c.c., t , = the time over which the sampler was submerged
in seconds. Each test was repeated 10 times to obtain a sufficiently large sample to
determine the mean values and the uncertainties in the sampler performance coefficient
K. Each series of tests was begun at the lowest towing velocity given in Table 1 and
continued at each subsequent velocity until the maximum was reached. The data for
the five samplers are given in Table 2, 3 and 4 for the 3.2 mm: 4.8 rnrn and 6.4 mm
nozzles respectively.
4. DATA ANALYSIS
4.1 Performance Coefficient of DH-59 Sampler
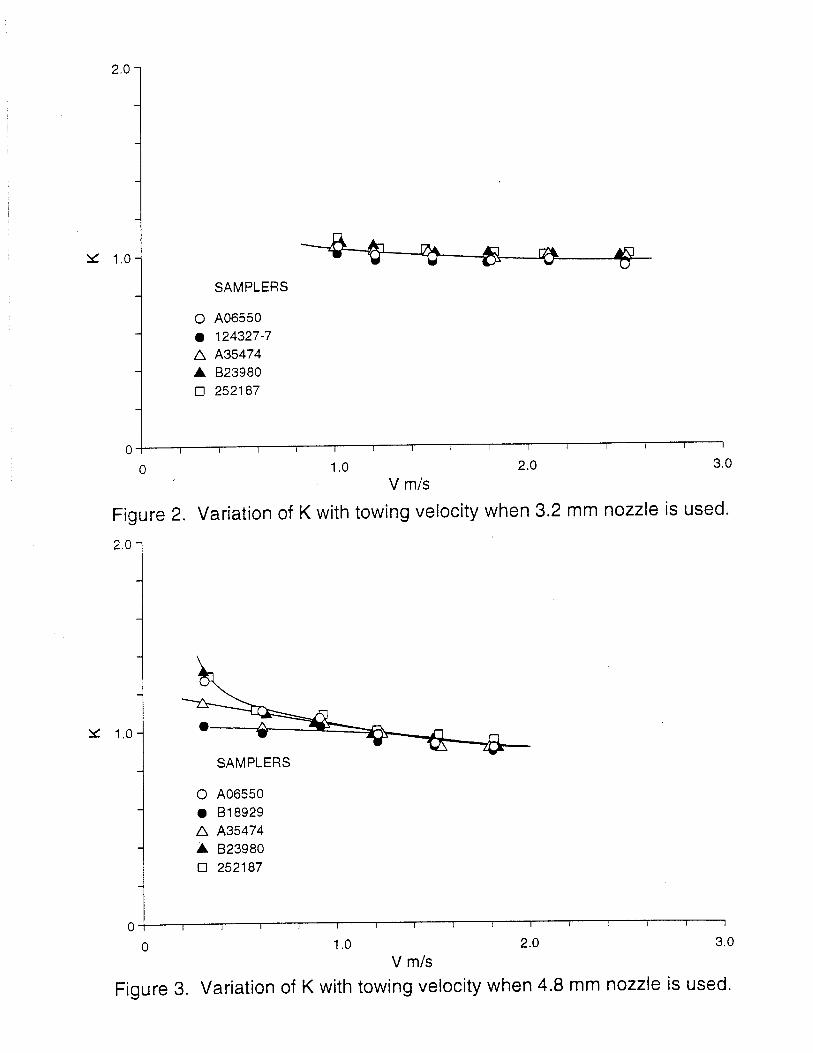
Values of the performance coefficient K from Table 2 , 3 and 4 were plotted
as li: versus V for the five samplers, with the 3.2 mrn, 4.8 mm and 6.4 rnm standard
nozzles in Figure 2, 3 and 4. Average curves were fitted to the plotted data to facilitate
the analysis. Each of the three nozzles is used for a different velocity range as shown
in Table 1, In the case of the 3.2 mm nozzle, the behaviour of the samplers is most
consistent with values of K decreasing gradually from about 1.04 when V = 1.0 m/s to
0.96 when V = 2.5 m/s. This behaviour suggests that the sampler is operating under
nozzle control when the 3.2 rnm nozzles are used.
In contrast to this, the performance coefficients of the five samplers are less
consistent when the 4.8 rnm nozzle is used. This may be partly due to the fact that
this nozzle is used for velocities as low as 0.30 m/s. The greatest scatter in the values
of I< occurs a t this velocity. As velocities increase to 1.0 m/s, the values of K become
more consistent and are very similar, decreasing from a value near 1.0 at If = 1.2 m/s
to about 0.93 when V = 1.8 m/s. For values of V _< 1.0 m/s, the sensitivity of K is
dependent on the sampler used. This indicates that when the 4.8 rnm nozzle is used,
it may be necessary to identify each sampler to ensure that sampling errors are kept
as small as possible.
'IVhen the 6.4 rnm nozzle is used, the performance coefficients are the most
sampler dependent. This is most significant for this nozzle because the sampling ve-
locities are less than 1.0 m/s over its full operating range. Once again, values of I(
are most inconsistent at the minimum velocity of 0.30 m/s, with the variability de-
creasing as the velocity increases. When V = 1.0 m/s, all samplers are approximately
iso-kinetic.
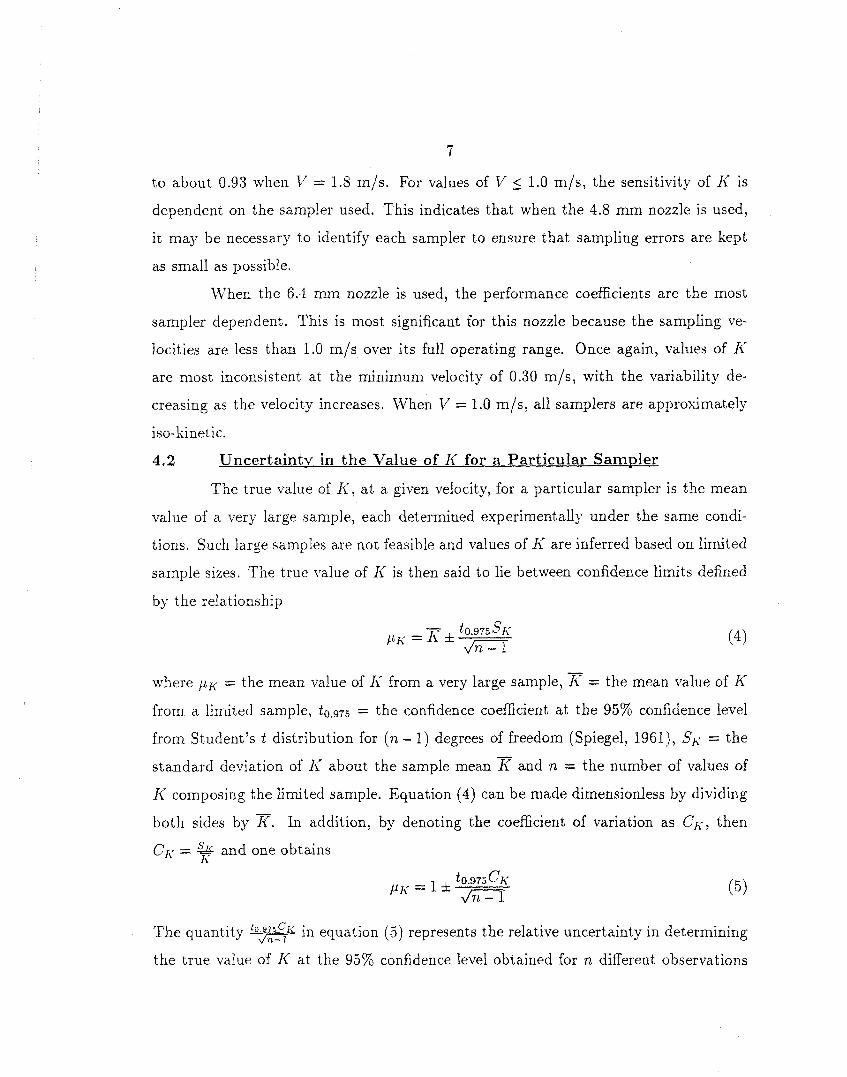
4.2 Uncertainty in the Value of Ii' for a Particular Sampler
The true value of Ii, a t a given velocity, for a particular sampler is the mean
value of a very large sample, each determined experimentally under the same condi-
tions. Such large samples are not feasible and values of li' are inferred based on limited
sample sizes. The true value of I{ is then said to lie between confidence limits defined
by the relationship
where p~ = the mean value of 11' from a very large sample, = the mean value of I(
from a limited sample, = the confidence coefficient at the 95% confidence level
from Student's t distribution for (n - 1) degrees of freedom (Spiegel, 1961)) SK = the
standard deviation of I< about the sample mean and n = the number of values of
If composing the limited sample. Equation (4) can be made dimensionless by dividing
both sides by I(. In addition, by denoting the coefficient of variation as CK, then
CIc = 9 and one obtains
The quantity in equation (5) represents the relative uncertainty in determining
the true value of K at the 95% confidence level obtained for n different observations

of K and may be expressed as
where Ejy = the relative uncertainty in percent. Values of EK u7ere computed from
the test data for n = 10 and these are also given in Table 2, 3 and 4.
The values of EK are presented in the form of bar graphs for the five samplers
at the towing velocities used for the present tests in Figures 5, 6 and 7 for the 3.2 mrn,
4.8 rnrn and 6.4 mm nozzles respectively. Results for the three sizes of nozzles used,
at equal velocities, indicate that uncertainties are only marginally affected by nozzle
size. Uncertainties are mainly affected by the towing velocity. Generally, the largest
uncertainties occur at the lo\vest velocities and decrease as velocity increases. These
characteristics vary from sampler to sampler, however, it is quite clear from the bar
graphs, that the uncertainty in determining I<, for a given sampler, is always less than
3% which can be considered to be quite low.
4.3 Uncertaintv in the Value of I< for a Group of Samplers
Average values of Ii' for the five samplers tested, given as I(s and the uncer-
tainties in determining these average values given as E, were computed for each of the
three sizes of nozzles and the corresponding towing velocities and are given in Table 5.
These values of Es are superimposed on the bar graphs in Figures 5, 6 and 7. It can
be seen that , in all cases, E, > Ejy and that E, < 5% when V 2 0.90 m/s. For small
values of velocity, Es was largest, having values of 13.2% and 17.7% for the 4.8 mm
and 6.4 mm nozzles respectively when the velocity is 0.30 m/s. Generally, values of E,
tend to decrease as velocities increase from 0.30 m/s to 0.90 m/s.
When the 3.2 mm nozzle is used, values of E, are always less than 5% and
therefore, a calibration of any given sampler is valid for any other sampler with an
uncertainty of less than 5% at the 95% confidence level. When the 4.8 mm and 6.4 mm
nozzles are used, values of E, are in excess of 5% for velocities at least up to 0.75 m/s
as shown in Figures 6 and 7. These high values of E, can be attributed to differences
in the sampler air vent system because the flow rate into the sampler is controlled by

the air vent. These problems can be reduced by adjusting the air vent size to increase
or decrease the air flow resistance @gel, 1991). Samplers should be checked to ensure
that each has an acceptable value of performance coefficient when the 4.8 rnm and 6.4
rnrn nozzles are used.
4.4 Effect of Changing Nozzles
An important consideration is the effect that different nozzles of the same
type and size may have on the performance coefficient of the DH-59 sampler because
of small differences as a result of fabrication variances. It would be of great operational
advantage, if small variations in the geometric properties of nozzles do not significantly
alter the value of the performance coefficient. If this is the case, then individual
calibrations with a particular nozzle will not be necessary. In addition, it will be
possible to exchange nozzles in the field without compromising the performance of a
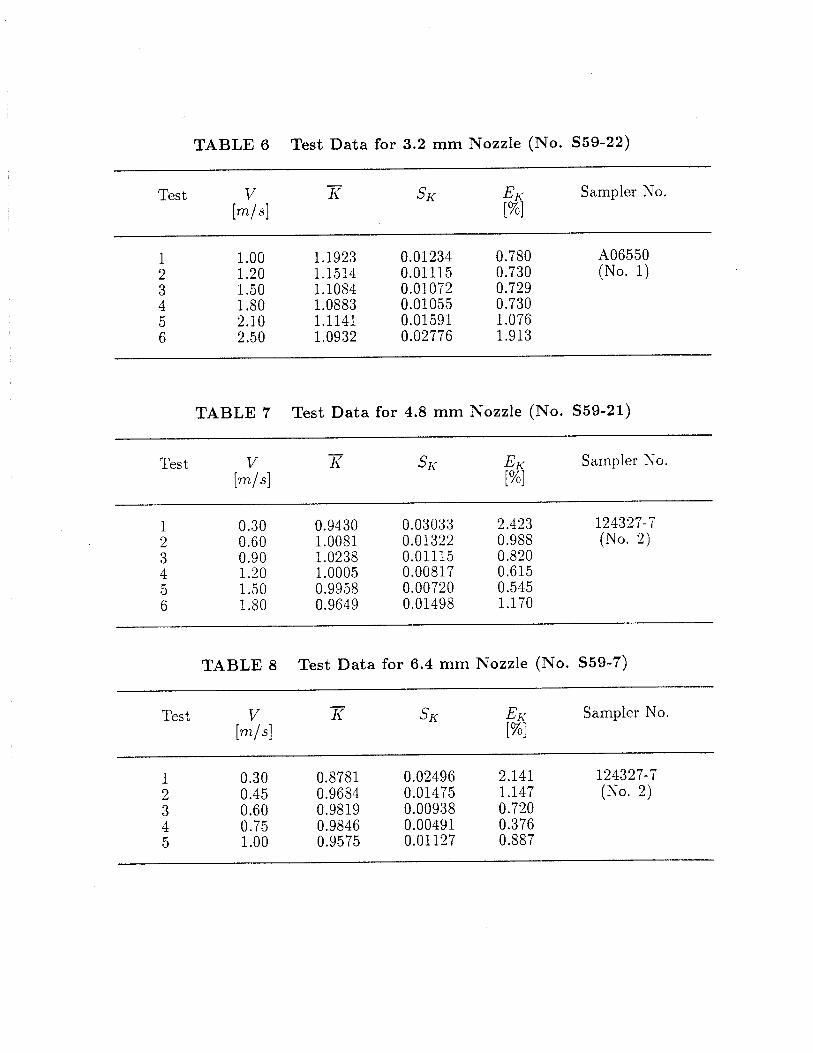
given sampler. Data on the effects of changing nozzles are given in Tables 6, 7 and 8
for the 3.2 mrn, 4.8 rnni and 6.4 rnrn nozzles respectively.
The mean values of I< obtained with sampler No. A06550 (No.1) and the
3.2 mm nozzle No. S59-22 from Table 6 were plotted in Figure 8 with the results for
the same sampler, used with the standard nozzle No. S59-10 from Table 2. Smooth
curves \Irere drawn through the plotted points to facilitate the analysis. The curves
show that differences in values of K for the two nozzles are virtually constant over the
full operating range. This means that the sampler is operating under nozzle control
and therefore, the differences in the performance coefficient are due to differences in
the nozzle geometry. The differences in li' for the two nozzles is of the order of 20%
and therefore is quite significant. Nozzle No. S59-22 has a velocity coefficient C,
which deviates from that for the standard nozzle No. S59-10, by 11.8%. This effect
of the velocity coefficient confirms that the sampler is operating under nozzle control
when the 3.2 rnm nozzle is used. Therefore, for best sampling results, care should be
taken that 3.2 mm nozzles, with velocity coefficient values close to that of the standard
nozzle. are used.

Values 3f Ii' obtained with sampler No. 124327-7 (No.2) and the 4.8 rnm nozzle
No. S59-21 from Table 7 were plotted in Figure 9 with the results for the same sampler,
used with the standard nozzle No. S59-3 from Table 3. The plot shows virtually no
difference in I< for the two nozzles. The fact that these results were obtained with two
nozzles, having velocity coefficients which differed by 12.4%, suggests that the sampler
is operating under vent control. Under such conditions, minor differences in nozzle
geometry do not affect the sampler performance. Therefore, different 4.8 mm nozzles
can be used with a given sampler without significant loss in sampling accuracy a t the
95% confidence level.
Finally, values of K obtained with sampler No. 124327-7 (No.2) and the 6.4
rnm nozzle No. S59-7 from Table 8 were plotted in Figure 10 with the results for the
same sampler, used with the standard nozzle No. S59-1 from Table 4. The difference
in the velocity coefficient was 8.7%. The plot shows even less difference in K for the
two nozzles than was observed with the 4.8 mm nozzles. This is again indicative of
the sampler operating under vent control and therefore, minor differences in nozzle
geometry do not affect the sampler performance. As a result, different 6.4 mm nozzIes
can be used with a given sampler without significant loss in sampling accuracy at
the 95% confidence level as long as good quality control on the nozzle fabrication is
maintained.
5 . CONCLUSIONS
Tests, conducted in a towing tank, on the DH-59 suspended sediment sampler
with selected 3.2 mm, 4.8 mm and 6.4 mm nozzles have resulted in the following
conclusions:
The performance of the DH-59 sampler was closest to being iso-kinetic when
the 3.2 rnm nozzle was used. For the five samplers tested, values of Ii' varied between
1.04 and 0.93 for velocities between 1.0 m/s and 2.5 m/s. When the 4.8 mm nozzle
was used, values of Ii' were positive for velocities less than 1.10 m/s and negative

11
for velocities greater than 7.10 m/s. When the 6.4 mm nozzle is used, values of Ii'
were greater than 1.0 for all velocities over the normal operating range. Values of Ii'
decreased as velocities increased.
The calibration of a given DH-59 sampler was repeatable within 3% at the
95% confidence level when the 3.2 rnrn, 4.8 mm and 6.4 mm nozzles were used.
The variability in performance coefficient from sampler to sampler, for a given
nozzle size, was greater than the uncertainty in the calibration of any single sampler.
The difference was least when the 3.2 mm nozzle was used and increased as the nozzle
size was increased to 4.8 rnm and 6.4 mm.
The uncertainty in the performance coefficient from sampler to sampler was
less than 5% at the 95% confidence level when the 3.2 rnrn nozzle was used. When the
4.8 mrn and 6.4 mm nozzles were used, the uncertainty increased above 5% for velocities
less than about 0.9 m/s. The largest uncertainty of 18% was obtained with the 6.4
mrn nozzle at its lowest operating velocity of 0.3 m/s. Therefore, each sampler should
be checked for use with the 4.8 mrn and 6.4 mm nozzles to ensure that satisfactory
performance coefficients are obtained.
The use of different nozzles of the same type and size significantly affected
the performance of the DH-59 sediment sampler when the 3.2 mm nozzles were used.
Therefore, 3.2 mm nozzles of the type prescribed for use with the DH-59 sampler should
be checked to ensure that their velocity coefficients are, sufficiently similar to that of
the standard 3.2 mm nozzle.
The use of different nozzles of the same type and size did not significantly affect
the sampler performance when the 4.8 mm and 6.4 mm nozzles were used. Therefore,
such nozzle sizes of the type prescribed for use with the DH-59 sampler, can be inter-
changed without further calibration.

12
ACKNOWLEDGEMENT
The towing carriage was operated by B. Near and the sampling tests were
conducted by C. Bil. The writer is very grateful for their support.

13
REFERENCES
Beverage, J.P., 1979: Suspended Sediment Sampler Limitations. Work-
shop on Measuring the Hydrological Properties of Large Rivers, New
Orleans: Louisiana, January, 31.
Beverage, J.P. and J.C. Futrell, 1986: Comparison of Flume and Tow-
ing Methods for Verifying the Calibration of a Suspended Sediment
Sampler. Water Resources Investigation Report 86-4193, USGS.
Cashman, M.A., 1988: Sediment Survey Equipment Catalogue. Sediment
Survey Section, Water Survey of Canada Division, l a t e r Resources
Branch, Environment Canada.
Engel, P., 1989: Preliminary Observation of the Variability in the Towing
Carriage Speed. NWRI Contribution 89-89, National Water Research
Institute, Canada Centre for Inland Waters, Burlington, Ontario.
Engel, P., 1990: A New Facility for the 'Testing of Suspended Sediment Sam-
pler Nozzles. NIVRI Contribution 90-116, National Water Research
Institute, Canada Centre for Inland Waters, Burlington, Ontario.
Engel, P. and I.G. Droppo, 1990: Preliminary Tests for the Iso-Kinetic
Calibration of the DH-81 Suspended Sediment Sampler. NJVRI Con-
tribution 90-143, National Water Research Institute, Canada Centre
for Inland Waters, Burlington, Ontario.
Engel, P., 1991: Variability in the Velocity Coefficient of Suspended Sedi-
ment Sampler Nozzles. NPVRI Contribution 91-109, National Water
Research Institute, Canada Centre for Inland Waters, Burlington, On-
tario.
Engel, P. and I.G. Droppo, 1992: Effects of Nozzle and Air Vent Size
on Sediment Sampler Performance. NWRI Contribution 92-06, Na-
tional Water Research Institute, Canada Centre for Inland IVaters,
Burlington, Ontario.

14
Guy, H.P. and V.W. Norman, 1970 Field Methods for Measurement of
Fluvial Sediment. Techniques of Water Resources Investigations of the
United States Geological Survey, United States Government Printing
Office, Washington, D.C.
Spiegel, M.S., 1961: Theory and Problems of Statistics, Schaum Outline,
Schaum Publishing Company, New York, U.S.A.