Embed Size (px)
Citation preview
SAMS 3.0 User Manual 2018
SERVICE ASSURANCE MANAGEMENT SYSTEM (SAMS 3.0) USER MANUAL V1
1
SAMS 3.0 User Manual 2018
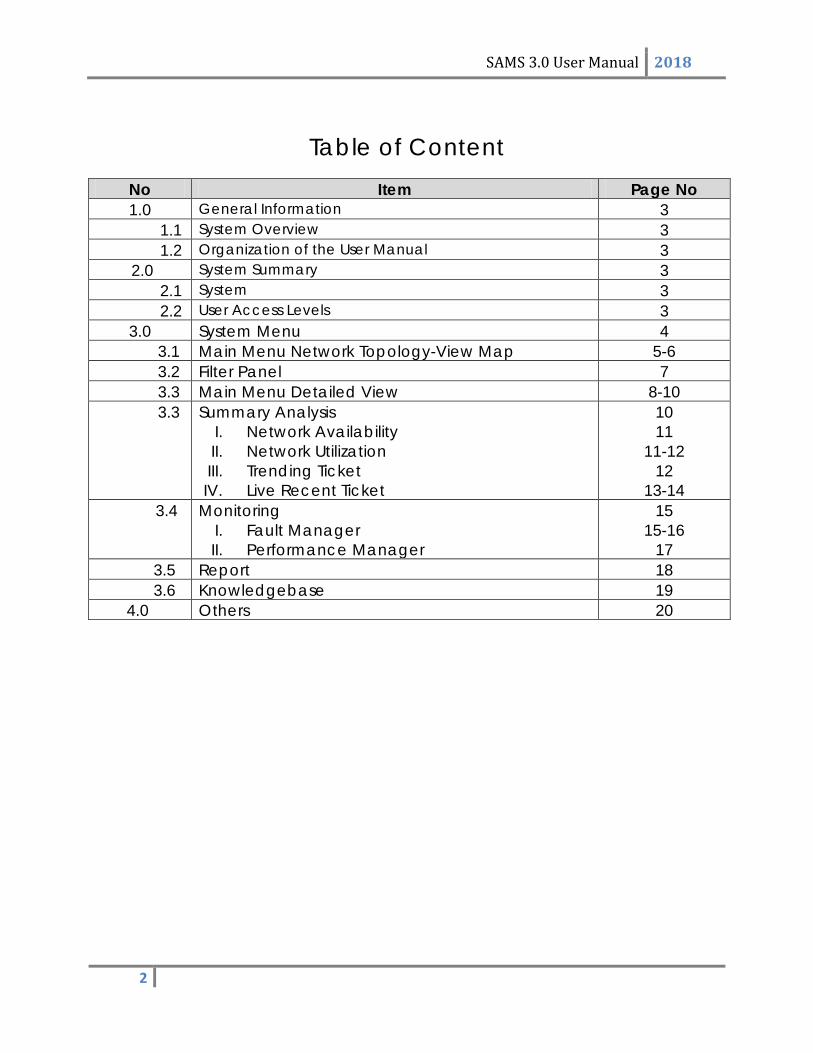
Table of Content No Item Page No 1.0 General Information 3
1.1 System Overview 3 1.2 Organization of the User Manual 3 2.0 System Summary 3 2.1 System 3 2.2 User Access Levels 3
3.0 System Menu 4 3.1 Main Menu Network Topology-View Map 5-6 3.2 Filter Panel 7 3.3 Main Menu Detailed View 8-10 3.3 Summary Analysis
I. Network Availability II. Network Utilization III. Trending Ticket IV. Live Recent Ticket
10 11
11-12 12
13-14 3.4 Monitoring
I. Fault Manager II. Performance Manager
15 15-16
17 3.5 Report 18 3.6 Knowledgebase 19
4.0 Others 20
2
SAMS 3.0 User Manual 2018 1.0 General Information
1.1 System Overview
1.1.1 Service Assurance Management System (SAMS) is a monitoring system which extend to the 1GOV*net users to show live data to monitor Network Fault, Performance, Sites Utilization and Ticket Report (TR) status for Secured Network and Optional Services.
1.2 Organization of the User Manual
1.2.1 The user’s manual consists of 4 (four) sections: General Information, System Summary, System Menu and Glossary.
1.2.2 General Information section explains on the system overview and the organizational of the User Manual.
1.2.3 System Summary section outlines the requirement of the system’s hardware, software requirements and user access levels.
1.2.4 System Menu section provides details on the SAMS features module which are Network Topology, Detail View, Summary Analysis, Monitoring, Reports & Knowledgebase.
1.2.5 Glossary section explains on the terms that used in the User Manual.
2.0 System Summary
2.1 System Requirement
2.1.1 SAMS can be access via laptop, computers & mobile devices.
Laptop/Computers
The recommended is Window 7, Window XP or equivalent with 1 gigahertz (GHz) or faster 32-bit (x86) or 64-bit (x64) processor, 1 gigabyte (GB) RAM (32-bit) or 2 GB RAM (64-bit), 16 GB available hard disk space (32-bit) or 20 GB (64-bit), higher driver.
Mobile Devices
The recommended mobile browser supported chrome and safari. Then Android version and ios both supported
2.2 User Access Levels
2.2.1 User required username and password to access and portal view will base on their hierarchy and privilege.
3
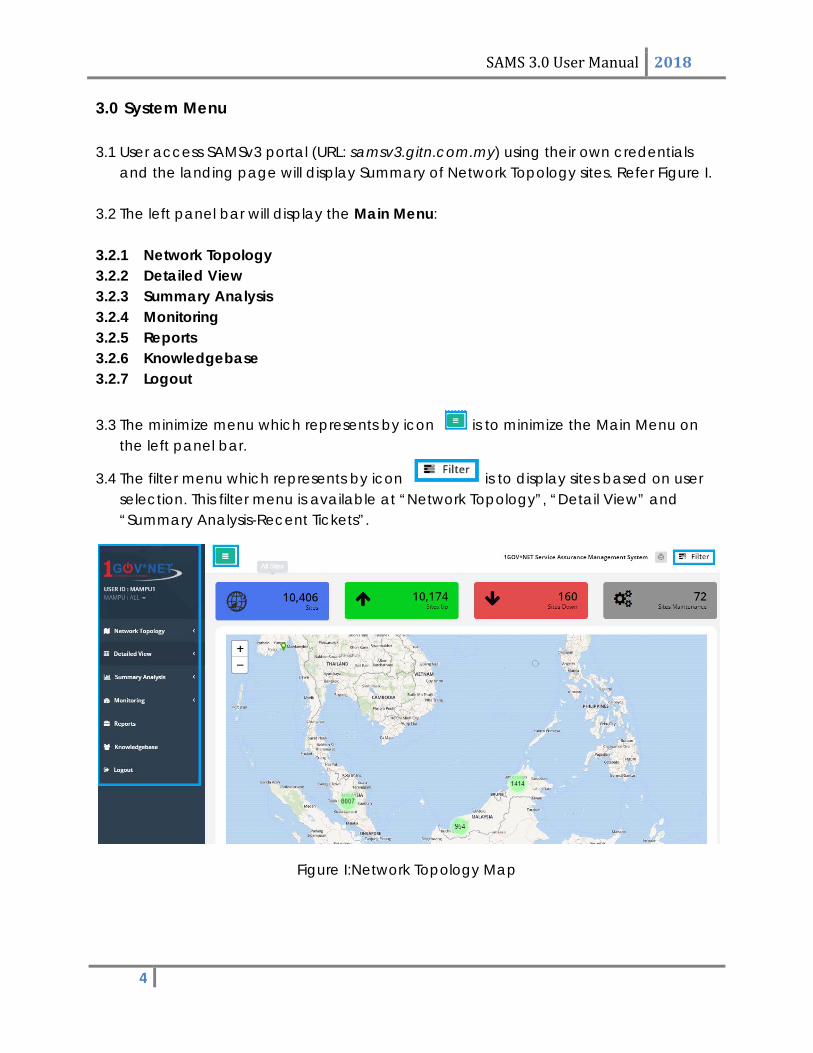
SAMS 3.0 User Manual 2018 3.0 System Menu
3.1 User access SAMSv3 portal (URL: samsv3.gitn.com.my) using their own credentials
and the landing page will display Summary of Network Topology sites. Refer Figure I.
3.2 The left panel bar will display the Main Menu:
3.2.1 Network Topology 3.2.2 Detailed View 3.2.3 Summary Analysis 3.2.4 Monitoring 3.2.5 Reports 3.2.6 Knowledgebase 3.2.7 Logout
3.3 The minimize menu which represents by icon is to minimize the Main Menu on the left panel bar.
3.4 The filter menu which represents by icon is to display sites based on user selection. This filter menu is available at “Network Topology”, “Detail View” and “Summary Analysis-Recent Tickets”.
Figure I:Network Topology Map
4
SAMS 3.0 User Manual 2018 3.5 Main Menu : Network Topology-View Map
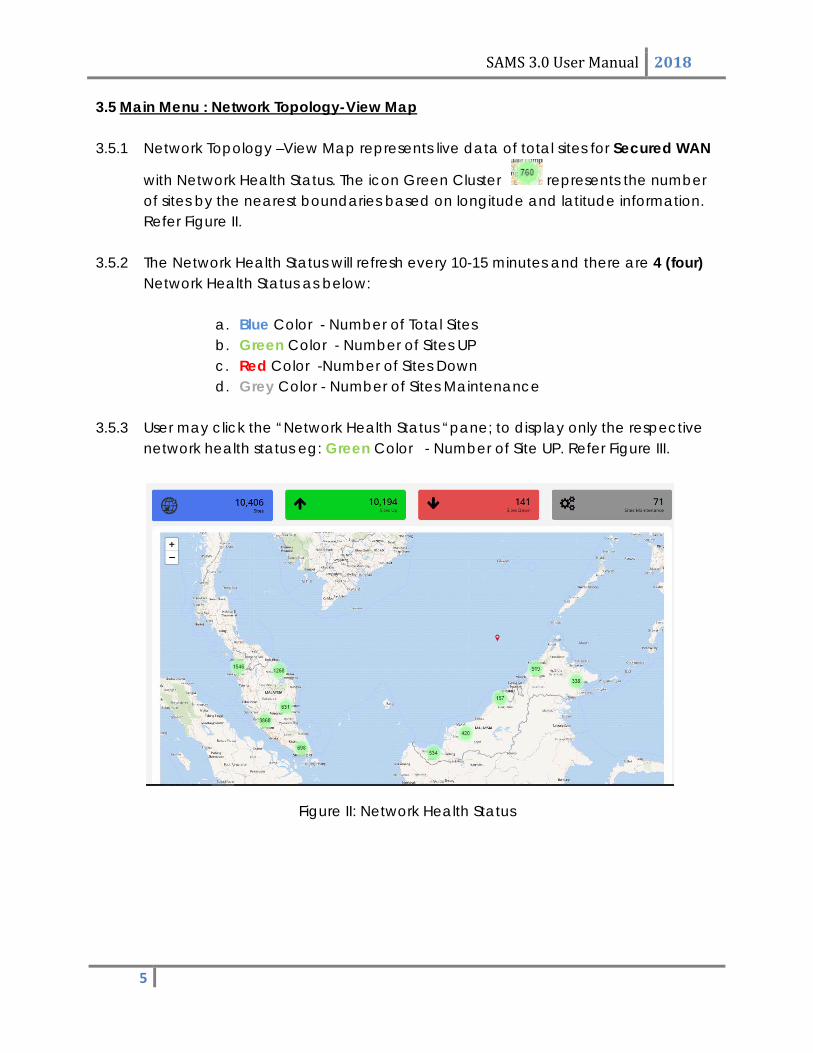
3.5.1 Network Topology –View Map represents live data of total sites for Secured WAN
with Network Health Status. The icon Green Cluster represents the number of sites by the nearest boundaries based on longitude and latitude information. Refer Figure II.
3.5.2 The Network Health Status will refresh every 10-15 minutes and there are 4 (four) Network Health Status as below:
a. Blue Color - Number of Total Sites b. Green Color - Number of Sites UP c. Red Color -Number of Sites Down d. Grey Color - Number of Sites Maintenance
3.5.3 User may click the “Network Health Status “pane; to display only the respective
network health status eg: Green Color - Number of Site UP. Refer Figure III.
Figure II: Network Health Status
5
SAMS 3.0 User Manual 2018
Figure III: Network Health-Sites Up
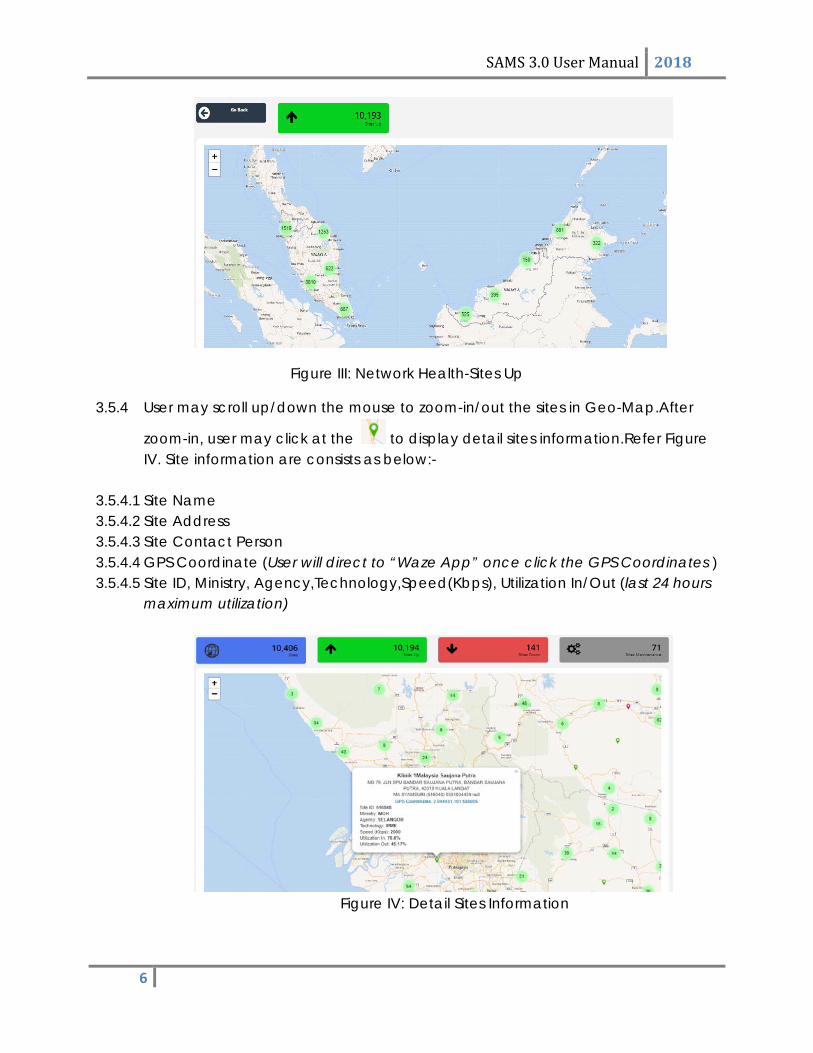
3.5.4 User may scroll up/down the mouse to zoom-in/out the sites in Geo-Map.After
zoom-in, user may click at the to display detail sites information.Refer Figure IV. Site information are consists as below:-
3.5.4.1 Site Name 3.5.4.2 Site Address 3.5.4.3 Site Contact Person 3.5.4.4 GPS Coordinate (User will direct to “Waze App” once click the GPS Coordinates ) 3.5.4.5 Site ID, Ministry, Agency,Technology,Speed(Kbps), Utilization In/Out (last 24 hours
maximum utilization)
Figure IV: Detail Sites Information
6
SAMS 3.0 User Manual 2018 3.6 Filter Panel
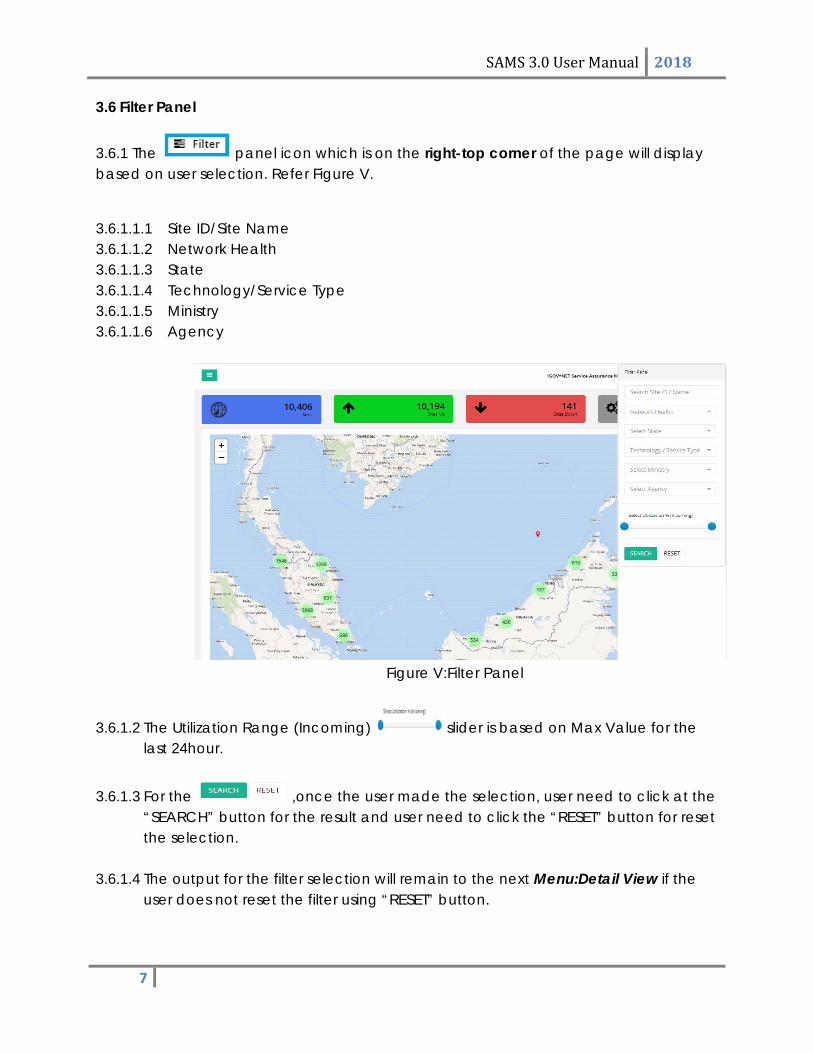
3.6.1 The panel icon which is on the right-top corner of the page will display based on user selection. Refer Figure V.
3.6.1.1.1 Site ID/Site Name 3.6.1.1.2 Network Health 3.6.1.1.3 State 3.6.1.1.4 Technology/Service Type 3.6.1.1.5 Ministry 3.6.1.1.6 Agency
Figure V:Filter Panel
3.6.1.2 The Utilization Range (Incoming) slider is based on Max Value for the last 24hour.
3.6.1.3 For the ,once the user made the selection, user need to click at the “SEARCH” button for the result and user need to click the “RESET” button for reset the selection.
3.6.1.4 The output for the filter selection will remain to the next Menu:Detail View if the user does not reset the filter using “RESET” button.
7
SAMS 3.0 User Manual 2018 3.7 Main Menu: Detailed View
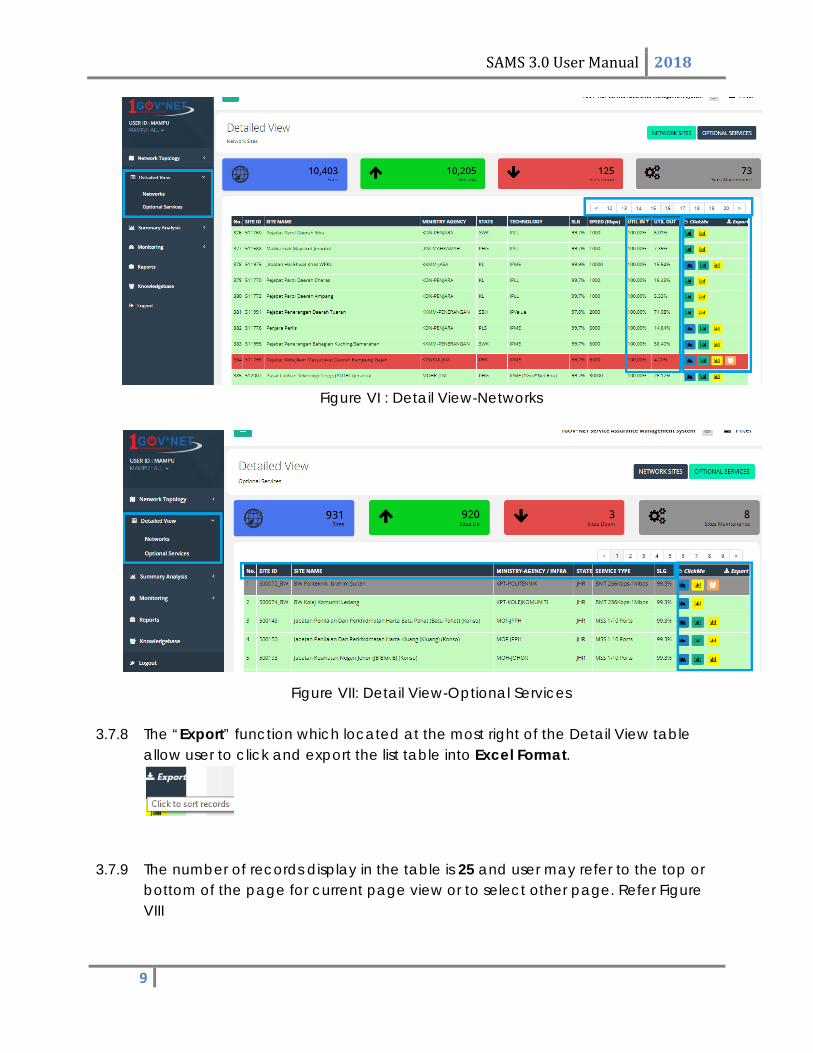
3.7.1 Detailed View is a listing table of detail sites which divide into two (2) sections
which are Network & Optional Services.
3.7.2 The Network Health Status as stated in Item 3.5.2 & 3.5.3 also has similar functions in Network Topology where User can have overall status and click for selection status.
3.7.3 The panel in Detail View which located on top of right is similar function in Network Topology as Item 3.6.1.
3.7.4 Detail view for Network & Optional Services will display information as Figure VI & Figure VII and each column can be sorting except for Site ID, ClickMe and Export.
3.7.5 For Network, the Utilization In/Out column will display for last 24 hours utilization data.
3.7.6 For Optional Services, it is consists of Firewall, Bandwidth Manager Tools (BMT), Floor Switch and Intrusion Preventive System (IPS).
3.7.7 The “ClickMe” function allow user to click the link and it is divided into 4 (four)link which are:
Link to launch Bandwidth Manager Tools (BMT) for sites who subscribed BMT
Link to launch Utilization Graph for last 24 Hours
Link to launch Availability Graph for last 24 Hours
Link to launch the Support Notes
8
SAMS 3.0 User Manual 2018
Figure VI : Detail View-Networks
Figure VII: Detail View-Optional Services
3.7.8 The “Export” function which located at the most right of the Detail View table allow user to click and export the list table into Excel Format.
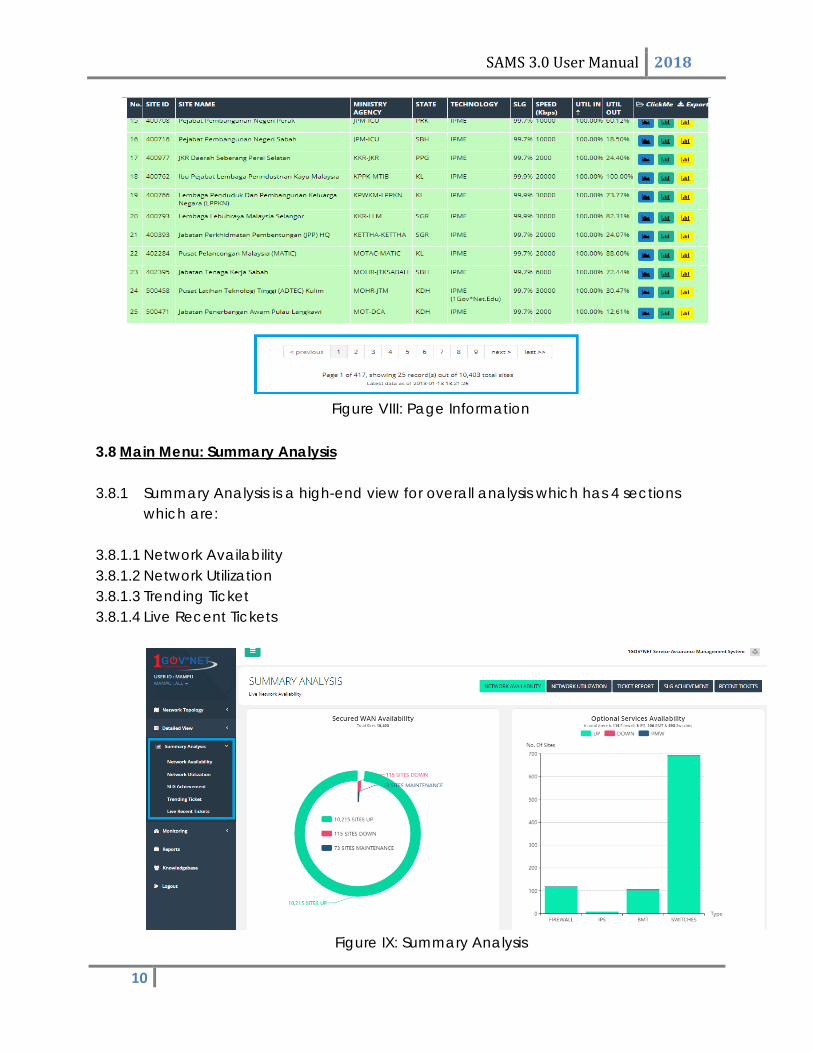
3.7.9 The number of records display in the table is 25 and user may refer to the top or bottom of the page for current page view or to select other page. Refer Figure VIII
9
SAMS 3.0 User Manual 2018
Figure VIII: Page Information
3.8 Main Menu: Summary Analysis
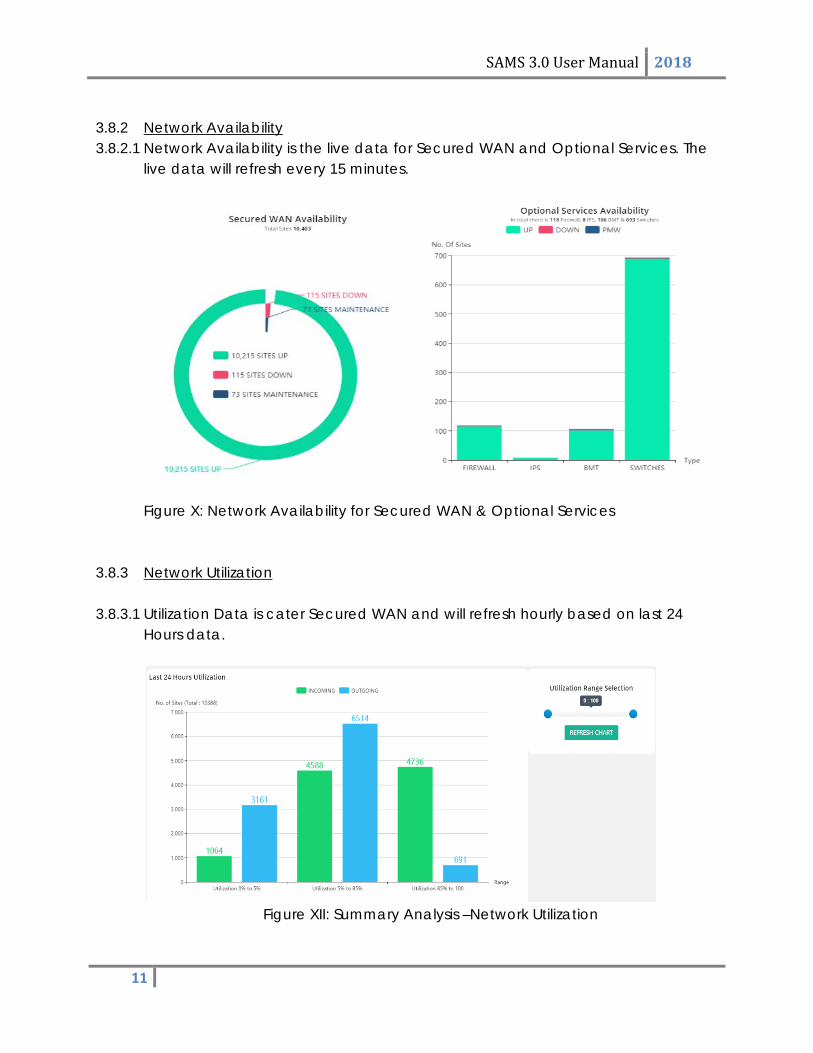
3.8.1 Summary Analysis is a high-end view for overall analysis which has 4 sections
which are:
3.8.1.1 Network Availability 3.8.1.2 Network Utilization 3.8.1.3 Trending Ticket 3.8.1.4 Live Recent Tickets
Figure IX: Summary Analysis
10
SAMS 3.0 User Manual 2018
3.8.2 Network Availability 3.8.2.1 Network Availability is the live data for Secured WAN and Optional Services. The
live data will refresh every 15 minutes.
Figure X: Network Availability for Secured WAN & Optional Services
3.8.3 Network Utilization
3.8.3.1 Utilization Data is cater Secured WAN and will refresh hourly based on last 24 Hours data.
Figure XII: Summary Analysis –Network Utilization
11
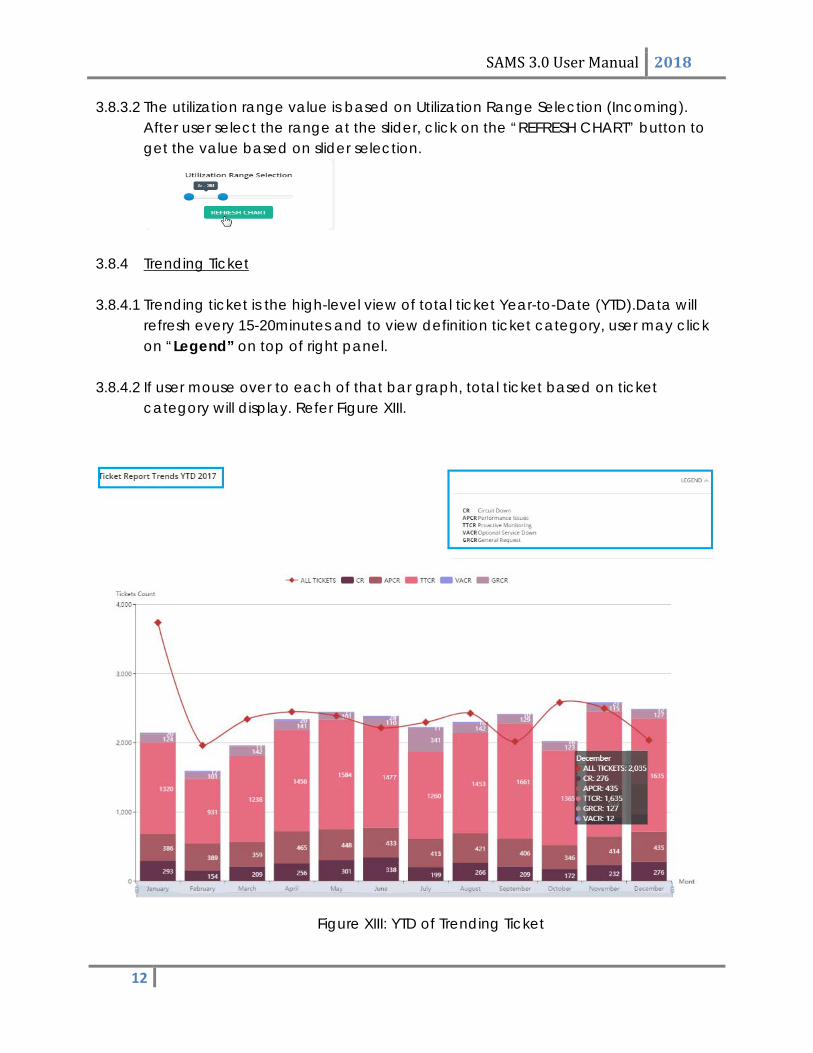
SAMS 3.0 User Manual 2018 3.8.3.2 The utilization range value is based on Utilization Range Selection (Incoming).
After user select the range at the slider, click on the “REFRESH CHART” button to get the value based on slider selection.
3.8.4 Trending Ticket
3.8.4.1 Trending ticket is the high-level view of total ticket Year-to-Date (YTD).Data will refresh every 15-20minutes and to view definition ticket category, user may click on “Legend” on top of right panel.
3.8.4.2 If user mouse over to each of that bar graph, total ticket based on ticket category will display. Refer Figure XIII.
Figure XIII: YTD of Trending Ticket
12
SAMS 3.0 User Manual 2018 3.8.5 Live Recent Ticket
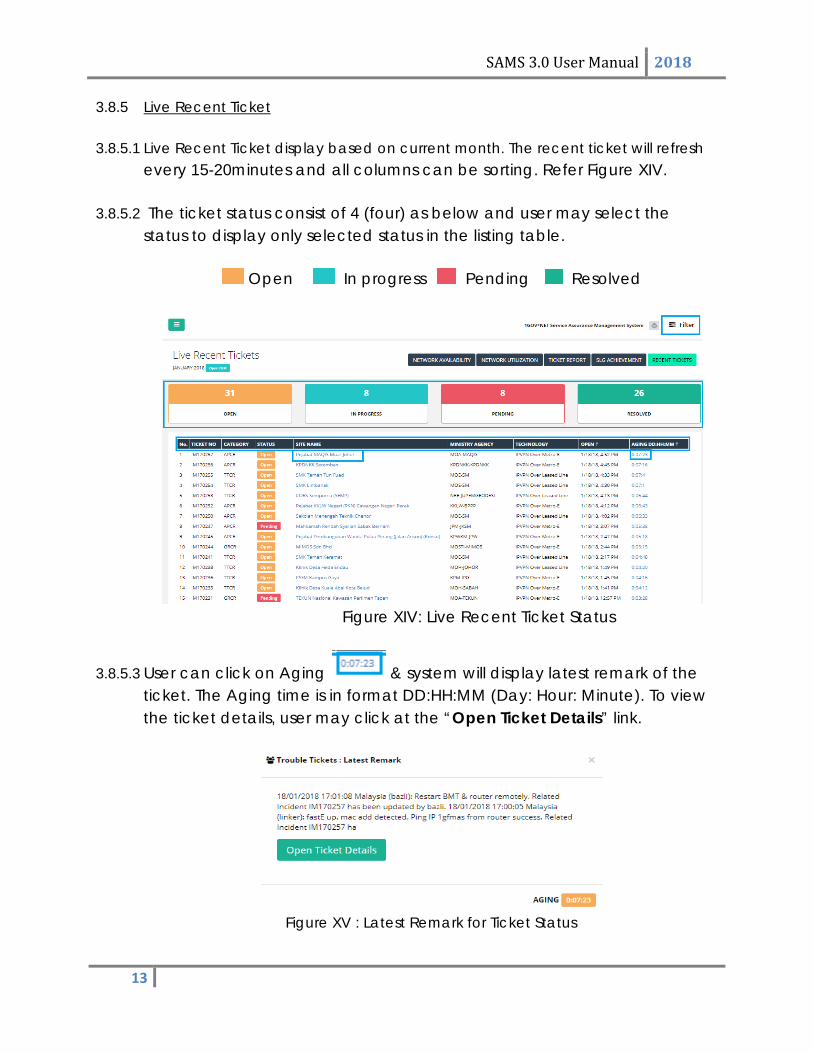
3.8.5.1 Live Recent Ticket display based on current month. The recent ticket will refresh
every 15-20minutes and all columns can be sorting. Refer Figure XIV.
3.8.5.2 The ticket status consist of 4 (four) as below and user may select the status to display only selected status in the listing table.
Open In progress Pending Resolved
Figure XIV: Live Recent Ticket Status
3.8.5.3 User can click on Aging & system will display latest remark of the ticket. The Aging time is in format DD:HH:MM (Day: Hour: Minute). To view the ticket details, user may click at the “Open Ticket Details” link.
Figure XV : Latest Remark for Ticket Status
13
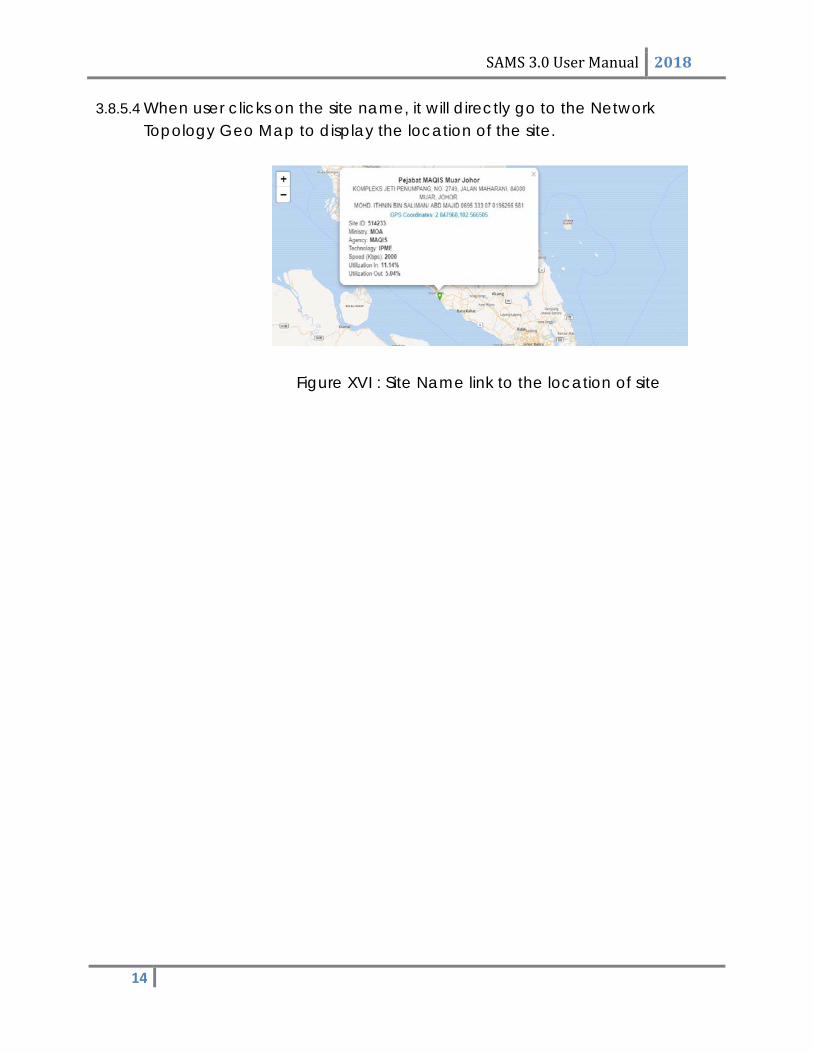
SAMS 3.0 User Manual 2018 3.8.5.4 When user clicks on the site name, it will directly go to the Network
Topology Geo Map to display the location of the site.
Figure XVI : Site Name link to the location of site
14
SAMS 3.0 User Manual 2018 3.9 Monitoring
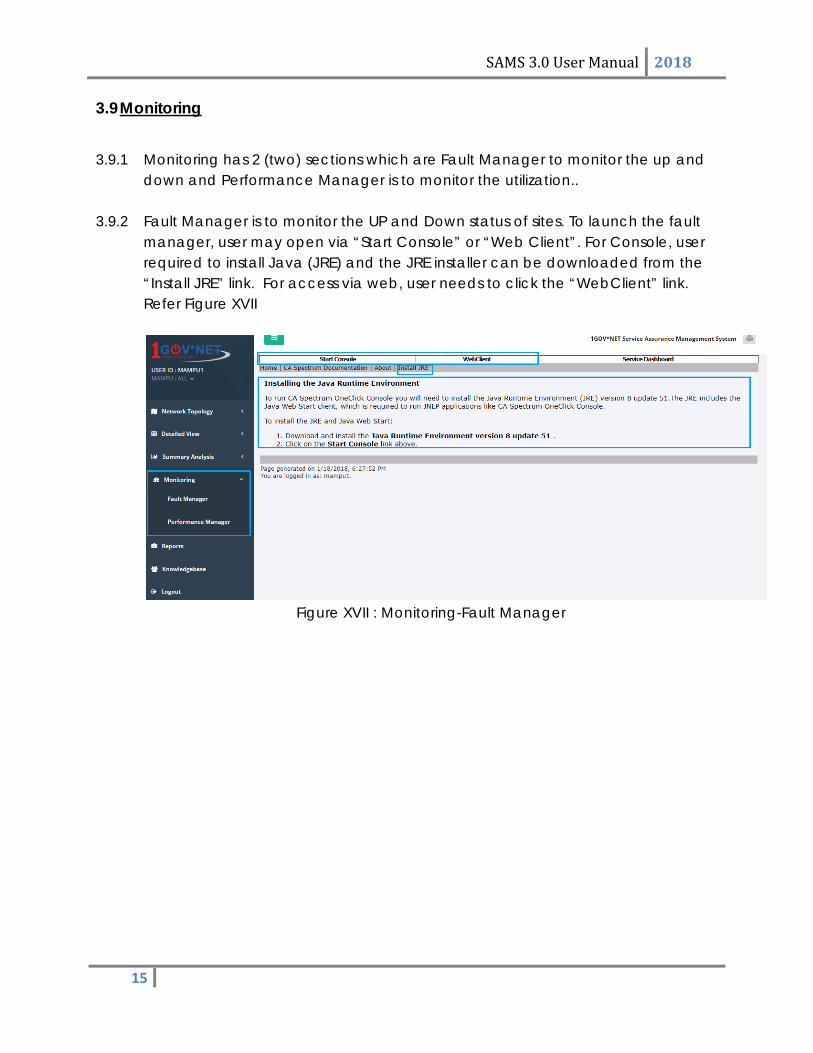
3.9.1 Monitoring has 2 (two) sections which are Fault Manager to monitor the up and
down and Performance Manager is to monitor the utilization..
3.9.2 Fault Manager is to monitor the UP and Down status of sites. To launch the fault manager, user may open via “Start Console” or “Web Client”. For Console, user required to install Java (JRE) and the JRE installer can be downloaded from the “Install JRE” link. For access via web, user needs to click the “WebClient” link. Refer Figure XVII
Figure XVII : Monitoring-Fault Manager
15
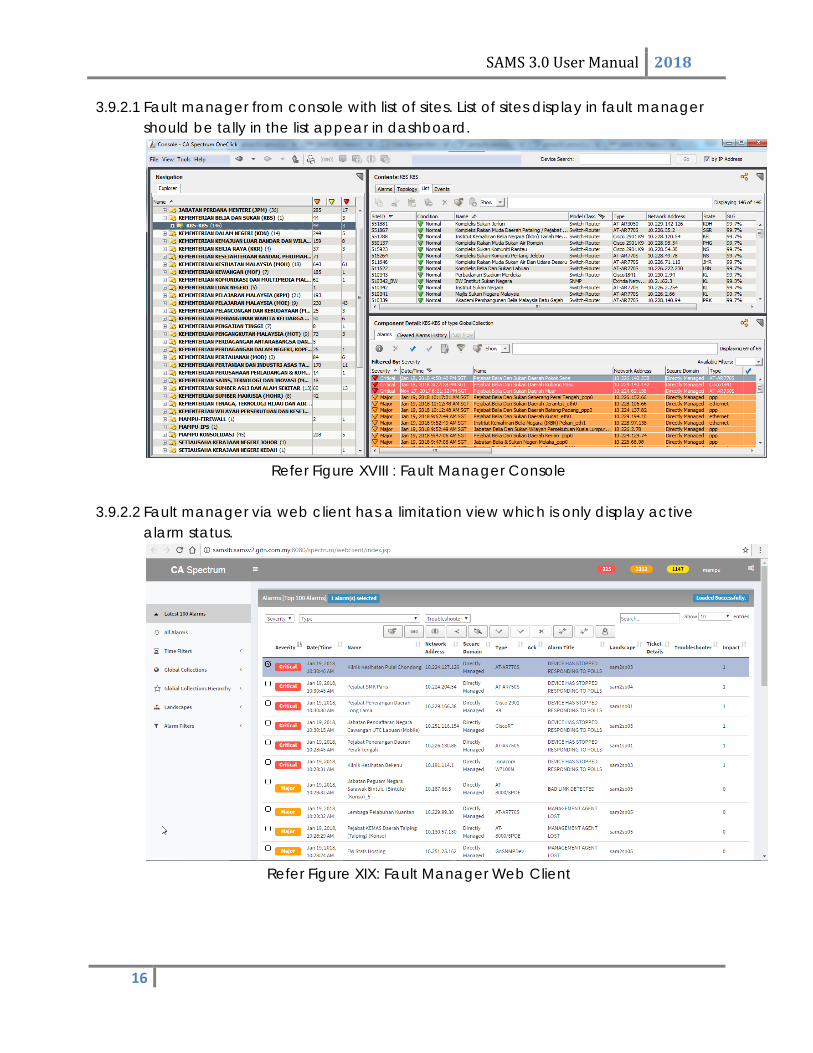
SAMS 3.0 User Manual 2018 3.9.2.1 Fault manager from console with list of sites. List of sites display in fault manager
should be tally in the list appear in dashboard.
Refer Figure XVIII : Fault Manager Console
3.9.2.2 Fault manager via web client has a limitation view which is only display active
alarm status.
Refer Figure XIX: Fault Manager Web Client
16
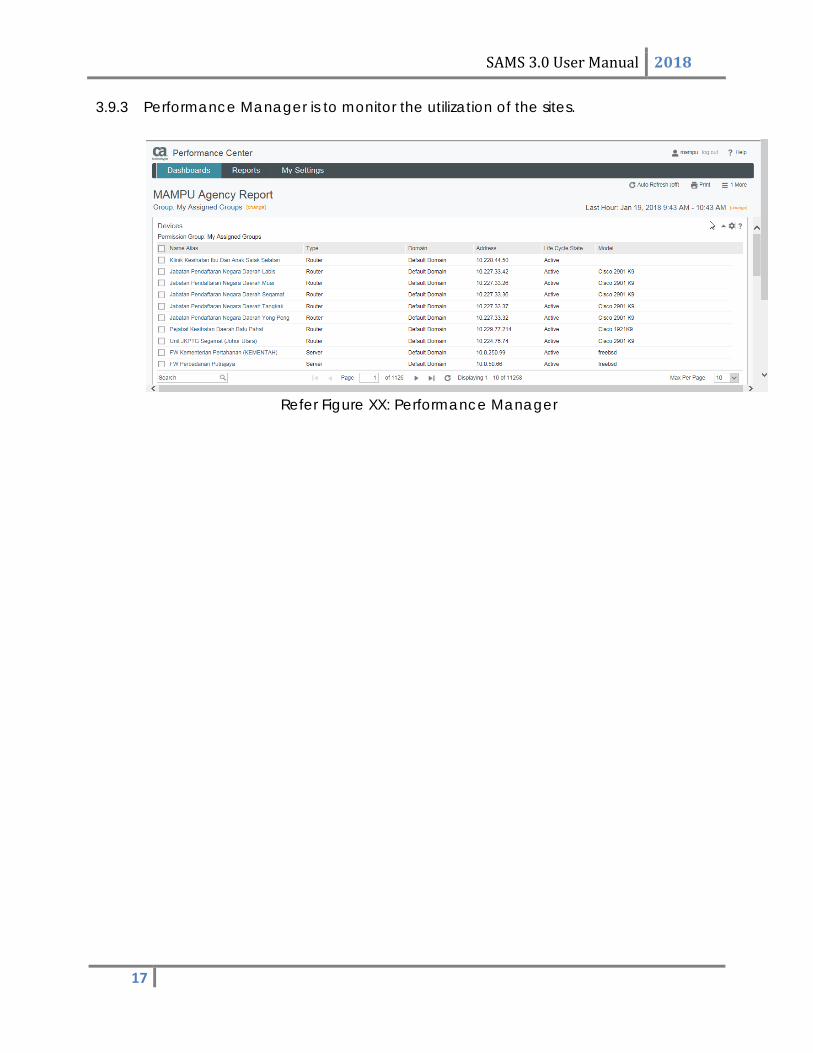
SAMS 3.0 User Manual 2018 3.9.3 Performance Manager is to monitor the utilization of the sites.
Refer Figure XX: Performance Manager
17
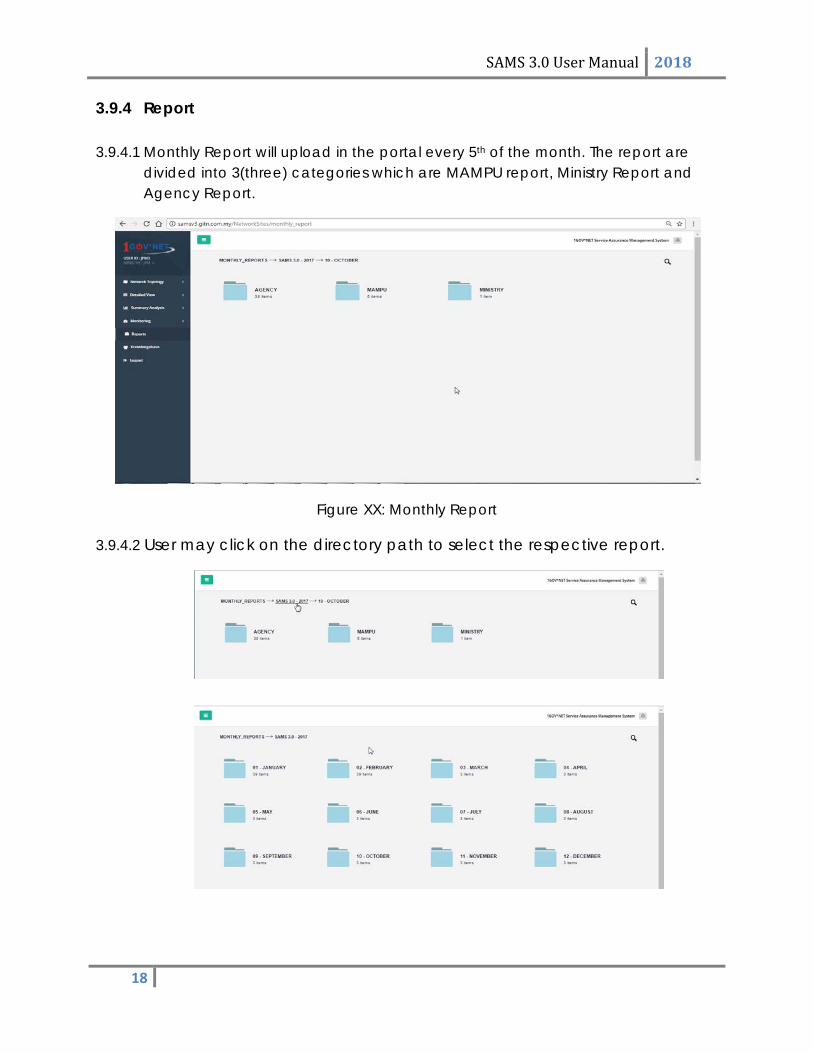
SAMS 3.0 User Manual 2018 3.9.4 Report
3.9.4.1 Monthly Report will upload in the portal every 5th of the month. The report are
divided into 3(three) categories which are MAMPU report, Ministry Report and Agency Report.
Figure XX: Monthly Report
3.9.4.2 User may click on the directory path to select the respective report.
18
SAMS 3.0 User Manual 2018
3.10 Knowledgebase
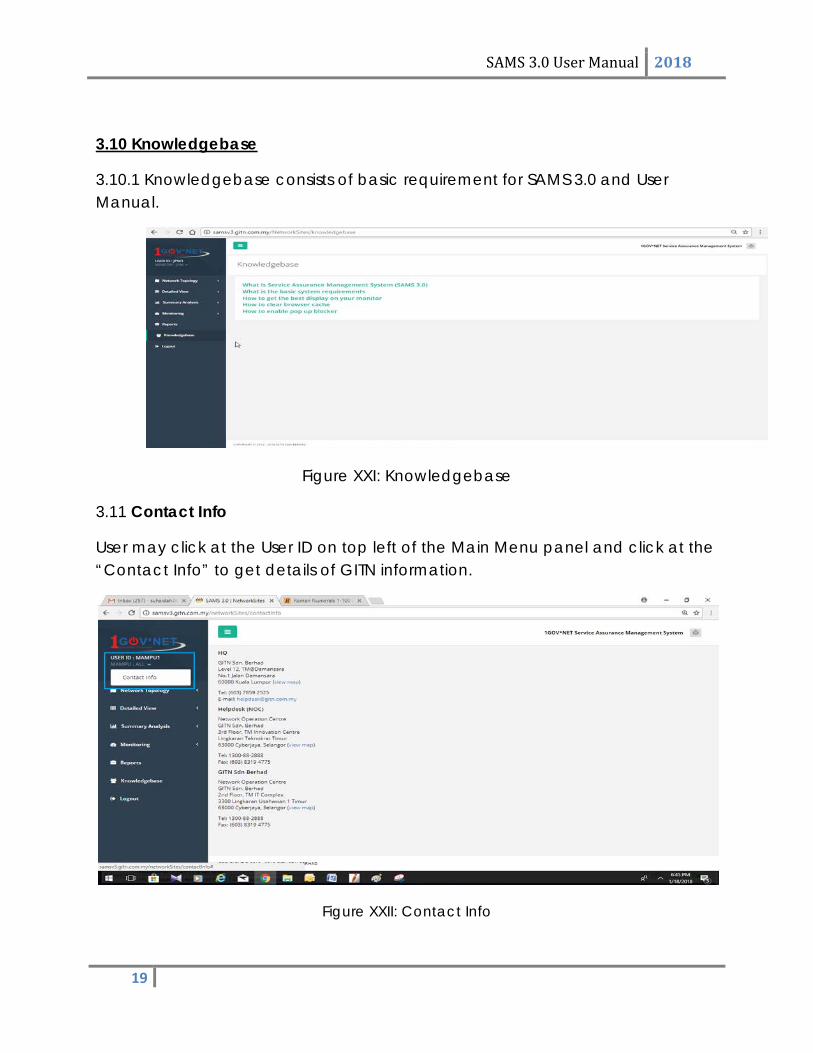
3.10.1 Knowledgebase consists of basic requirement for SAMS 3.0 and User Manual.
Figure XXI: Knowledgebase
3.11 Contact Info
User may click at the User ID on top left of the Main Menu panel and click at the “Contact Info” to get details of GITN information.
Figure XXII: Contact Info
19