Embed Size (px)
Citation preview
MANAGEMENT REPORT
Date: March 14, 2017
Author: Amanda Pitre-Hayes, Director, Planning & Projects
Phone No.: 604-331-4006
VanDocs#: DOC/2017/072441
Meeting Date: March 22, 2017
TO: Library Board
FROM: Amanda Pitre-Hayes
SUBJECT: VPL 2020 Strategic Plan Quarterly Report Template
SUMMARY The launch of Vancouver Public Library’s new strategic plan, VPL 2020, provides an opportunity to refresh the way in which quarterly progress toward achieving the strategy is reported to VPL Trustees. A scan of best practices was conducted and results were presented to Trustees in January. Based on feedback received, the attached draft VPL 2020 Strategic Plan Quarterly Board Report Template was developed and is being brought forward for approval. PURPOSE This report is for decision. RECOMMENDATION That the Board approve the revised Strategic Plan Quarterly Report template. POLICY The revised report template will be used to report to the VPL Board quarterly on progress toward implementing Vancouver Public Library’s new strategic plan: VPL 2020.
DOC/2017/072441 Page 1 of 3
STRATEGIC IMPLICATIONS The revised report template is designed to ensure that Trustees receive timely and relevant data with which they can monitor Vancouver Public Library’s progress toward achieving its strategic plan. COMMITTEE DISCUSSION The Committee discussed the proposed template, noting their appreciation for staff’s presentation of diverse types of information as well as the succinctness of the format. There were some suggestions around appearance, such as use of graphics, ensuring that colours have other associated codes in the event that a reader has colour blindness, an acronym guide, the VPL logo, and that the Chief Librarian’s comments include some formatting to enable reading. These changes have been incorporated into the attached, with the exception of the acronym guide; this will be added and updated quarterly as required. The Committee recommended that the template be approved with suggested changes noted. CHIEF LIBRARIAN’S COMMENTS The Chief Librarian recommends that the revised Strategic Plan Quarterly Report Template be approved as presented. BACKGROUND Vancouver Public Library’s new strategic plan, VPL 2020, launched at Vancouver City Council in February, 2017. As implementation begins, there is an opportunity to refresh the way in which quarterly progress toward achieving the strategy is reported to VPL Trustees. In January, VPL staff conducted a scan of best practices with respect to strategic plan board reporting in government and near-government organizations. The best practices (which are attached in Appendix A) were presented to VPL Trustees for discussion. Trustee feedback (which is presented in Appendix B) was used to inform the draft VPL 2020 Strategic Plan Quarterly Report Template (attached in Appendix C). DISCUSSION The new draft VPL 2020 Strategic Plan Quarterly Report Template is organized by Strategic Plan Outcome. The reporting on each outcome is organized into three sections:
1. Indicators Key Performance Indicator (KPI) data is presented. Where quarterly data is not available for a KPI, data for Supporting Indicators (a.k.a. proxy indicators) is presented. Key trends
DOC/2017/072441 Page 2 of 3
are illustrated through charts and relevant analysis is presented. The final Supporting Indicators are still being confirmed and may be altered from as presented in this report.
2. Initiatives Top line status for all strategic plan operating initiatives is presented.
3. Impact Stories illustrating outcomes achieved in support of the strategic plan are presented.
The proposed format responds directly to Trustee feedback on the strategic plan board reporting best practice scan. FINAL REMARKS The refreshed Strategic Plan Quarterly Report Template is designed to provide Trustees with relevant, timely, data with which to monitor the progress toward implementing the VPL 2020 Strategic Plan. Upon Board approval of the new report template, VPL staff will develop the data collection processes required to support the new reporting elements. VPL will deploy the new report template starting in Q2, 2017.
DOC/2017/072441 Page 3 of 3
Appendix A: Best Practice Reporting Scan
VPL 2020 STRATEGIC REPORTING BEST PRACTICE EXAMPLES
FOR DISCUSSION
1/25/17
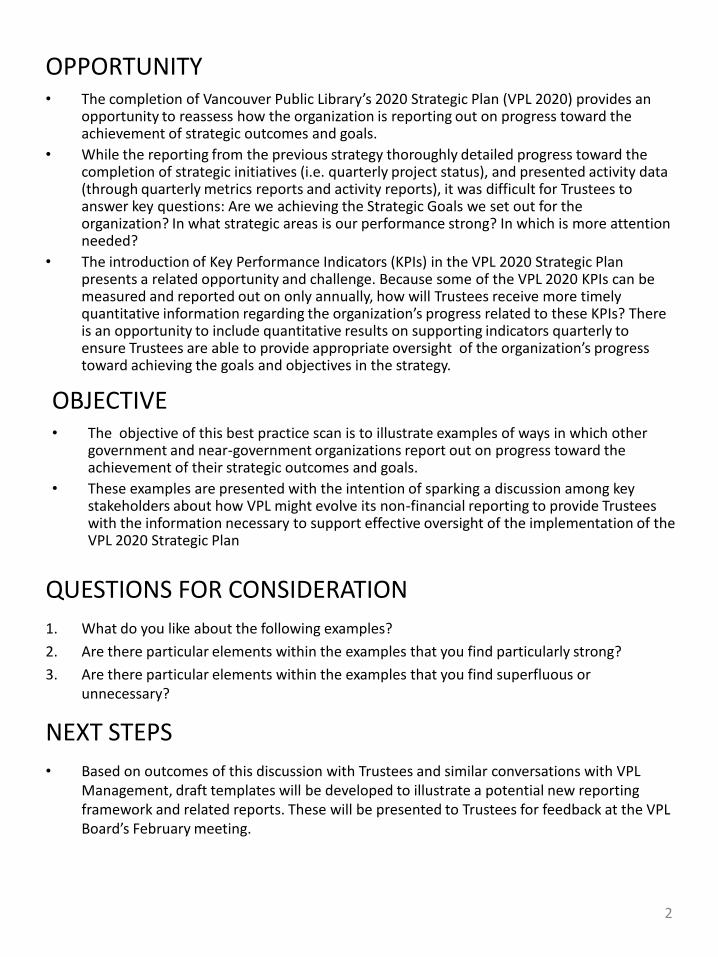
OPPORTUNITY • The completion of Vancouver Public Library’s 2020 Strategic Plan (VPL 2020) provides an
opportunity to reassess how the organization is reporting out on progress toward the achievement of strategic outcomes and goals.
• While the reporting from the previous strategy thoroughly detailed progress toward the completion of strategic initiatives (i.e. quarterly project status), and presented activity data (through quarterly metrics reports and activity reports), it was difficult for Trustees to answer key questions: Are we achieving the Strategic Goals we set out for the organization? In what strategic areas is our performance strong? In which is more attention needed?
• The introduction of Key Performance Indicators (KPIs) in the VPL 2020 Strategic Plan presents a related opportunity and challenge. Because some of the VPL 2020 KPIs can be measured and reported out on only annually, how will Trustees receive more timely quantitative information regarding the organization’s progress related to these KPIs? There is an opportunity to include quantitative results on supporting indicators quarterly to ensure Trustees are able to provide appropriate oversight of the organization’s progress toward achieving the goals and objectives in the strategy.
OBJECTIVE • The objective of this best practice scan is to illustrate examples of ways in which other
government and near-government organizations report out on progress toward the achievement of their strategic outcomes and goals.
• These examples are presented with the intention of sparking a discussion among key stakeholders about how VPL might evolve its non-financial reporting to provide Trustees with the information necessary to support effective oversight of the implementation of the VPL 2020 Strategic Plan
QUESTIONS FOR CONSIDERATION
1. What do you like about the following examples?
2. Are there particular elements within the examples that you find particularly strong?
3. Are there particular elements within the examples that you find superfluous or unnecessary?
NEXT STEPS
• Based on outcomes of this discussion with Trustees and similar conversations with VPL Management, draft templates will be developed to illustrate a potential new reporting framework and related reports. These will be presented to Trustees for feedback at the VPL Board’s February meeting.
2
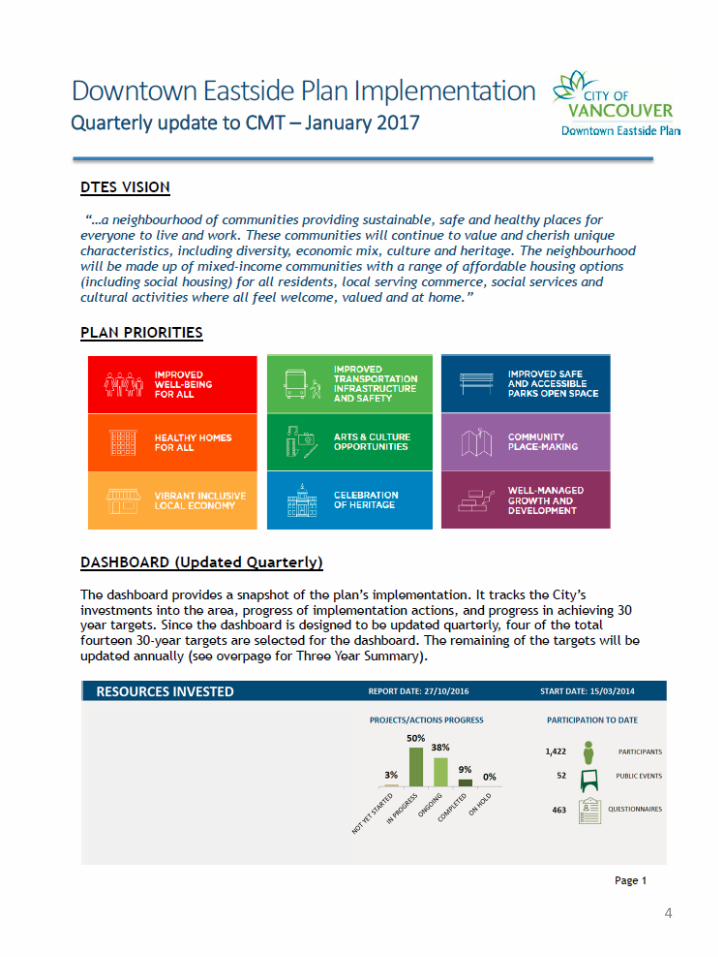
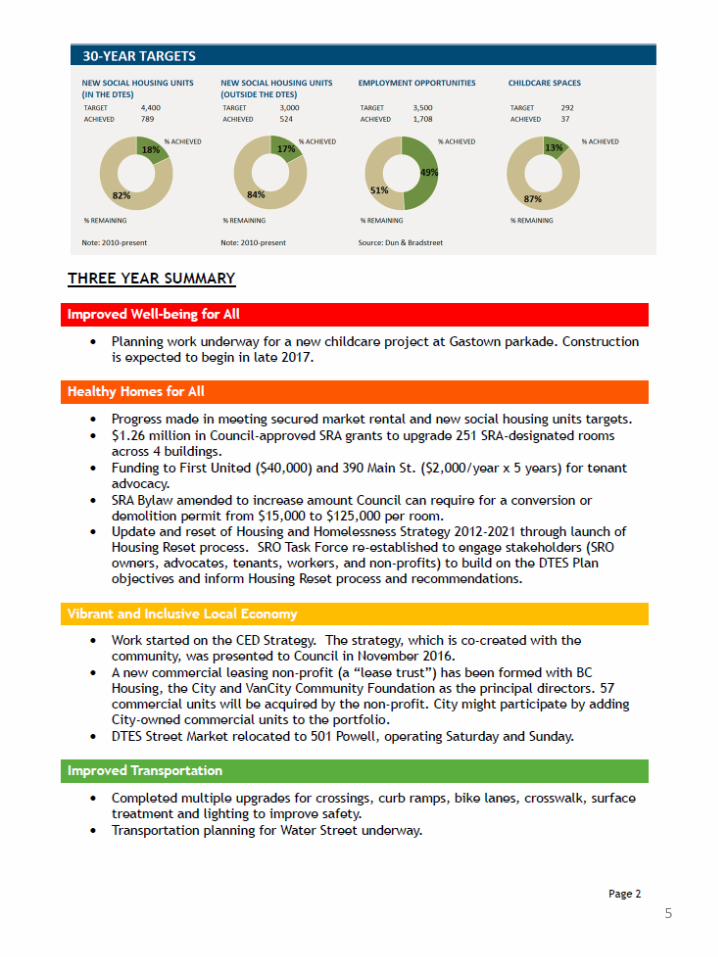
EXAMPLE A: CITY OF VANCOUVER
3
4
5

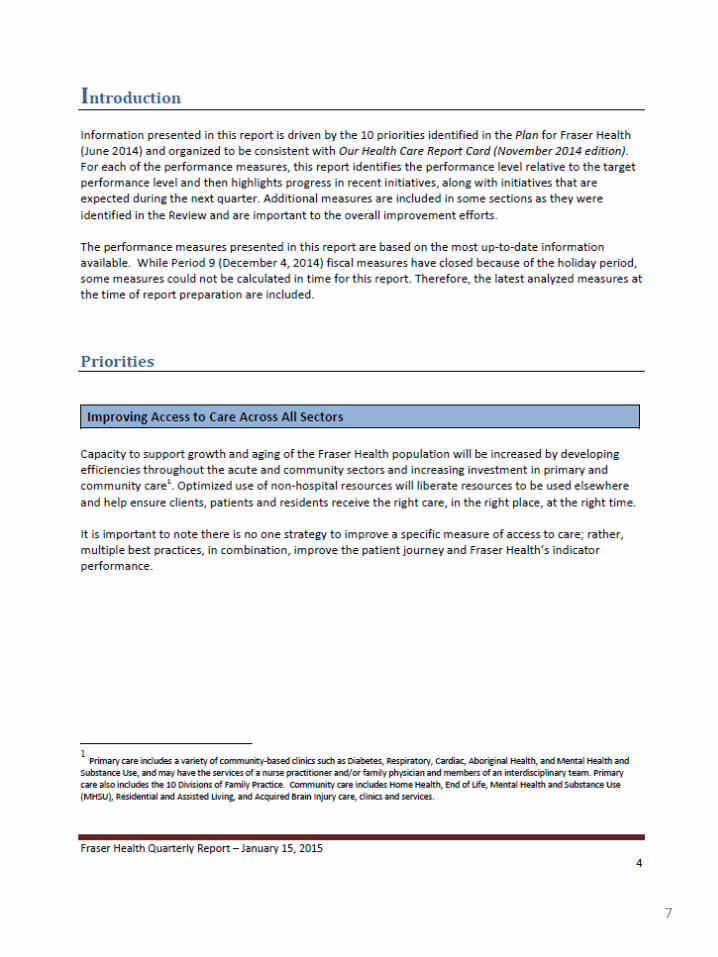
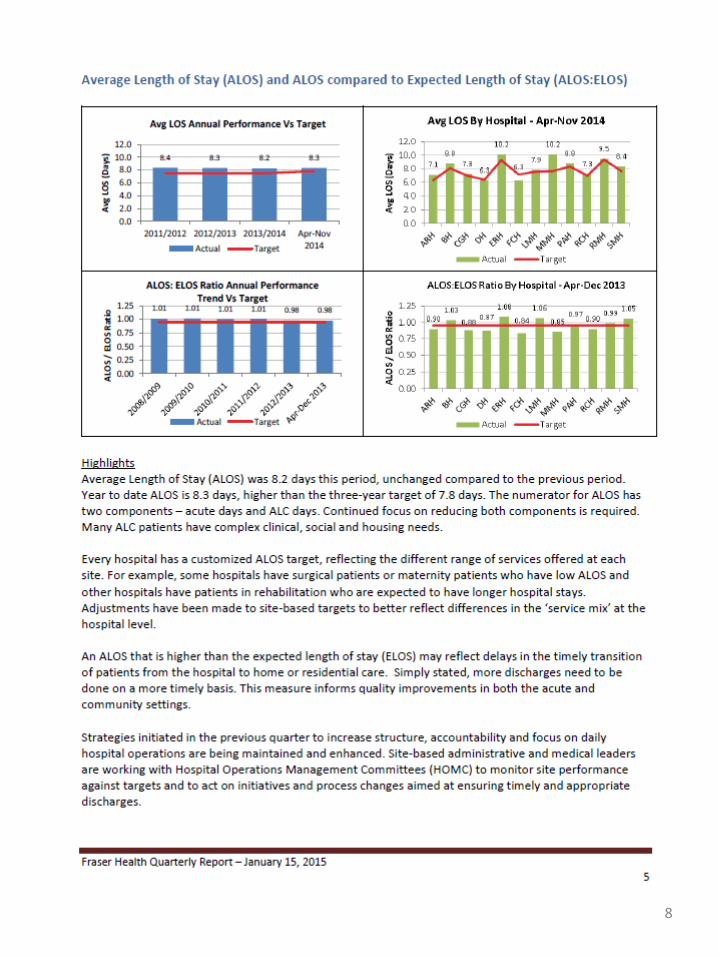
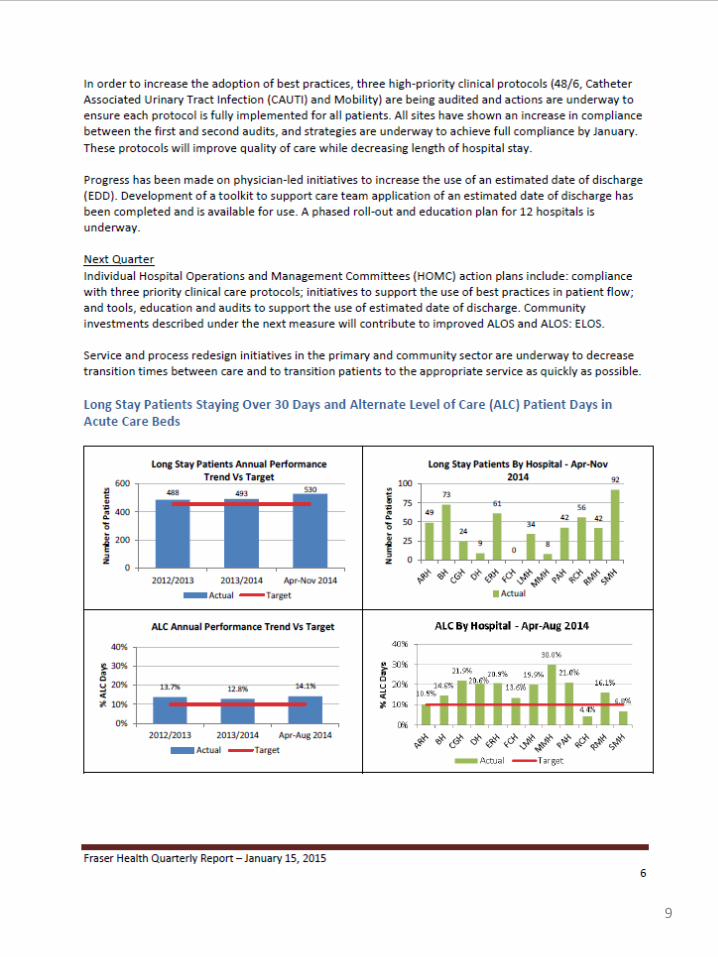
EXAMPLE B: FRASER HEALTH
6
7
8
9

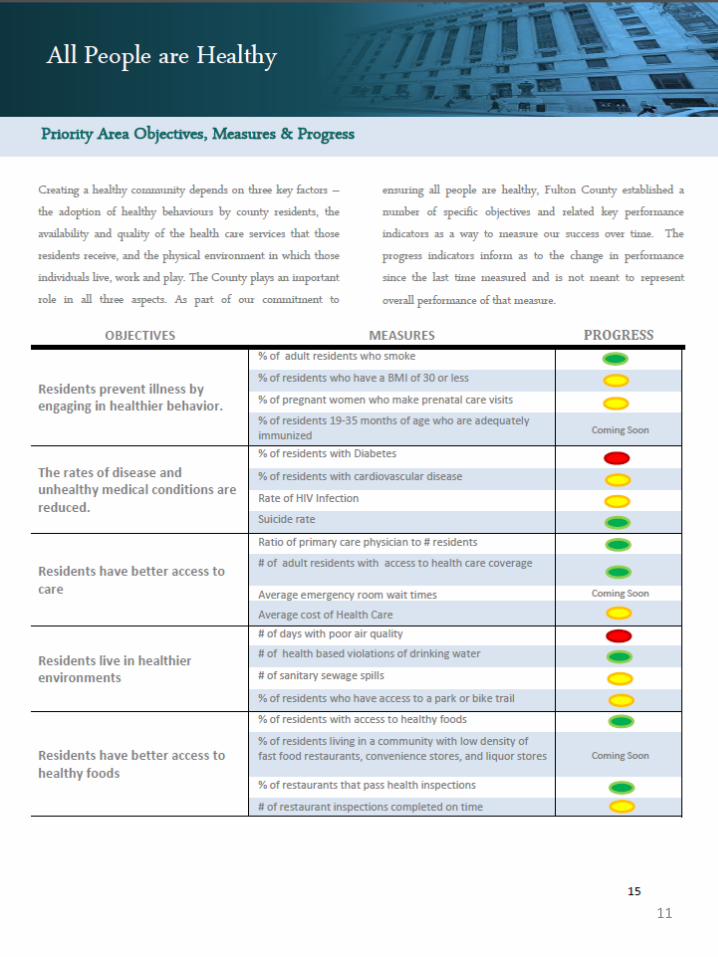
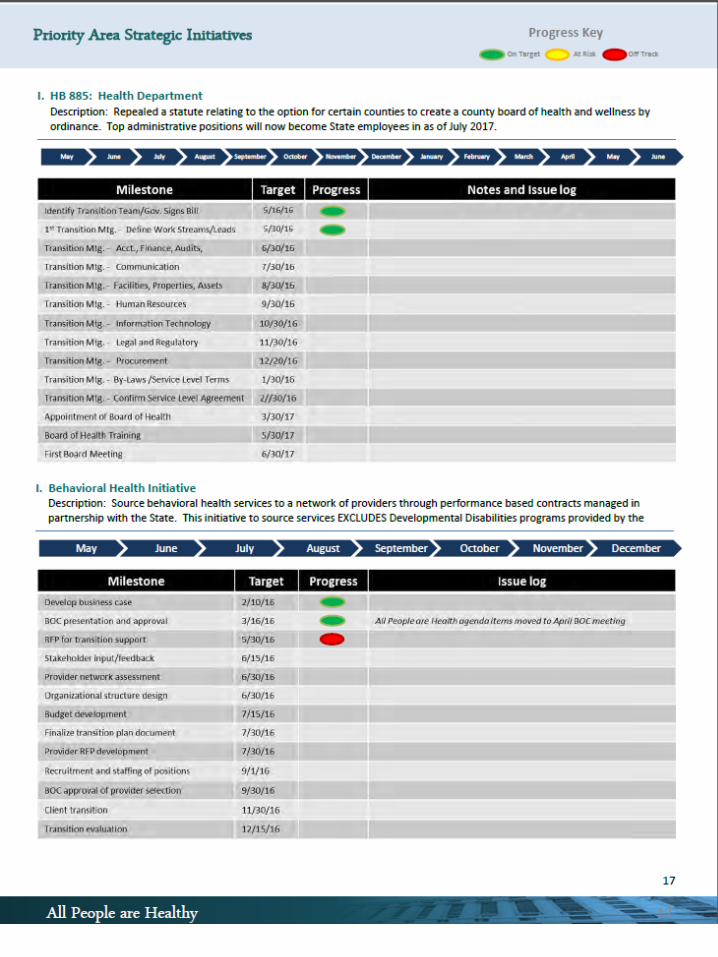
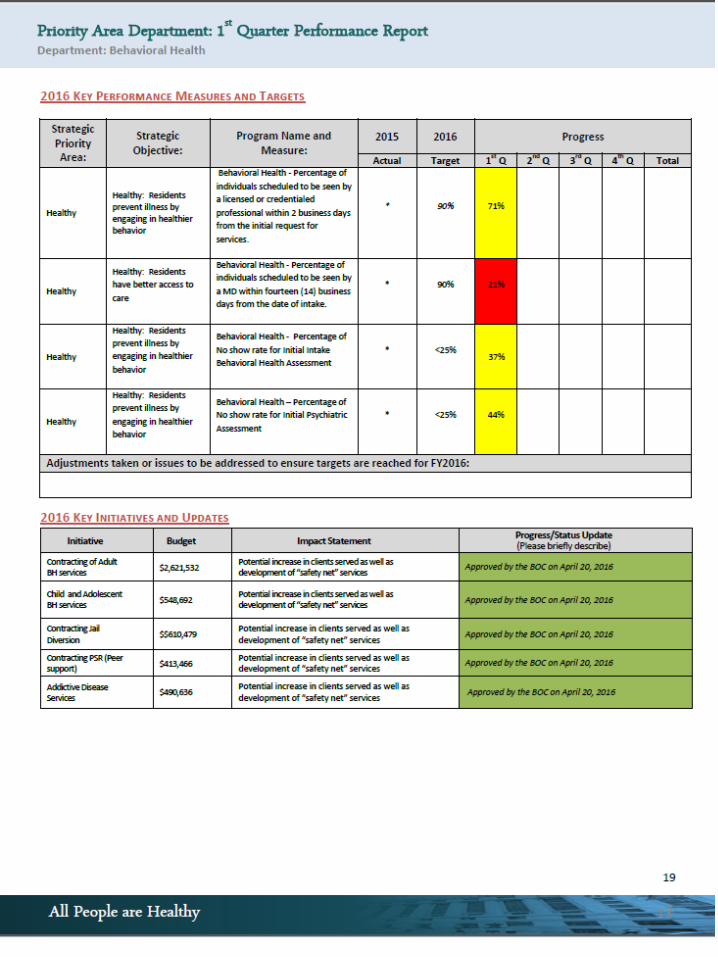
EXAMPLE C: FULTON COUNTY GOVERNMENT
10
11
12
13

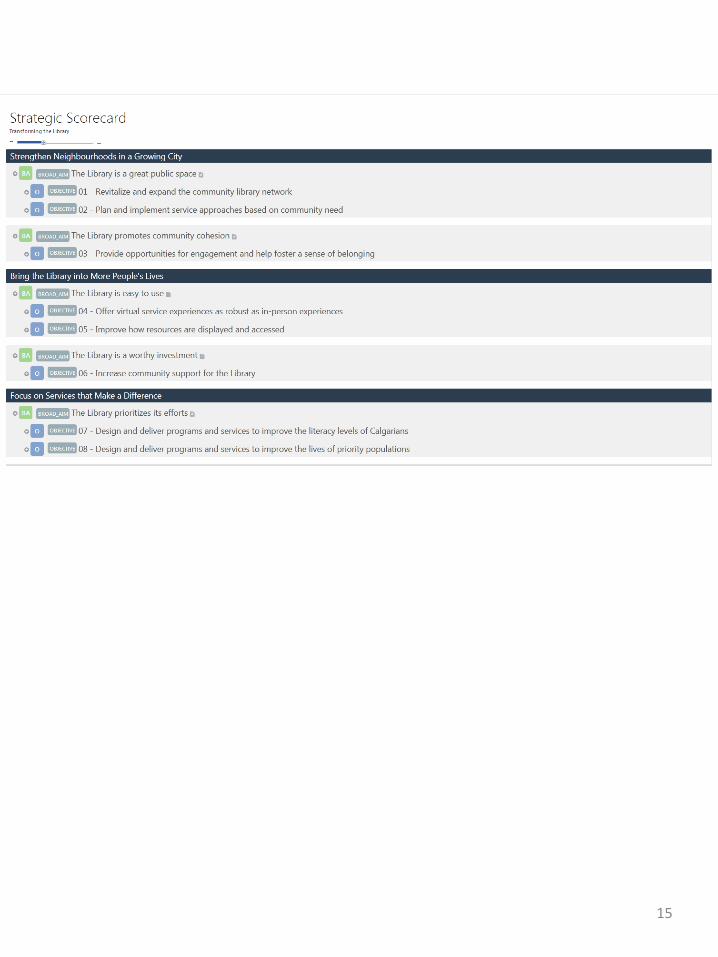
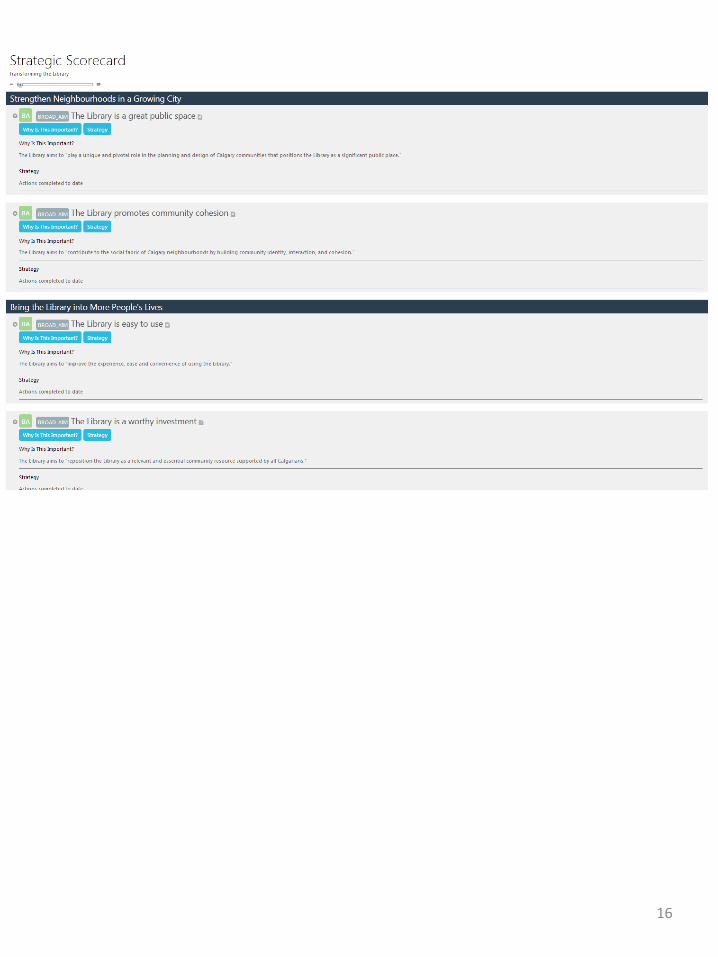
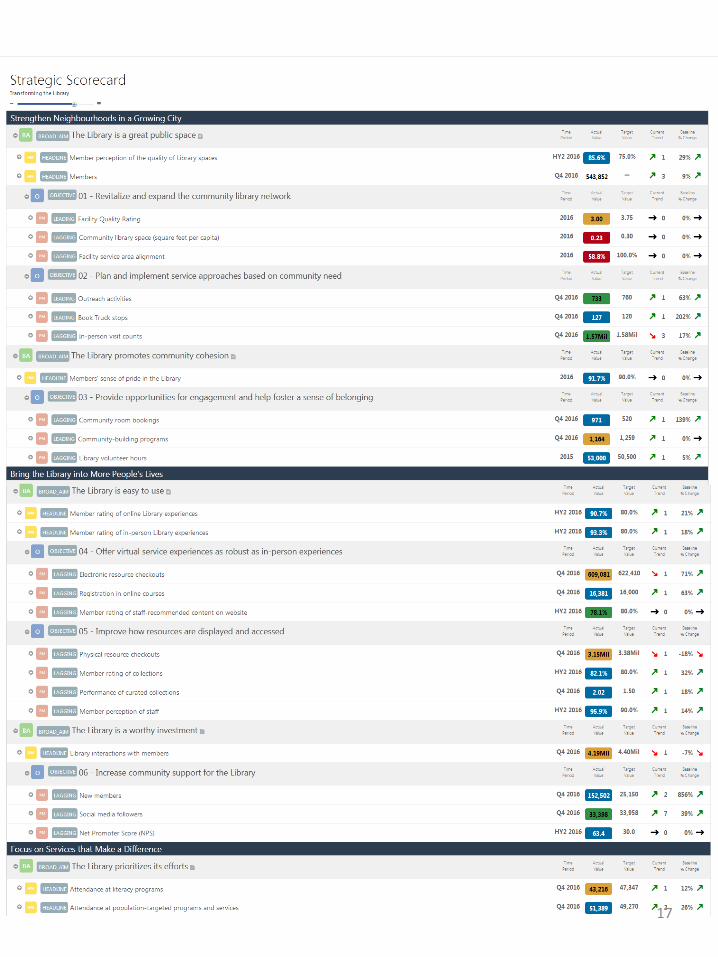
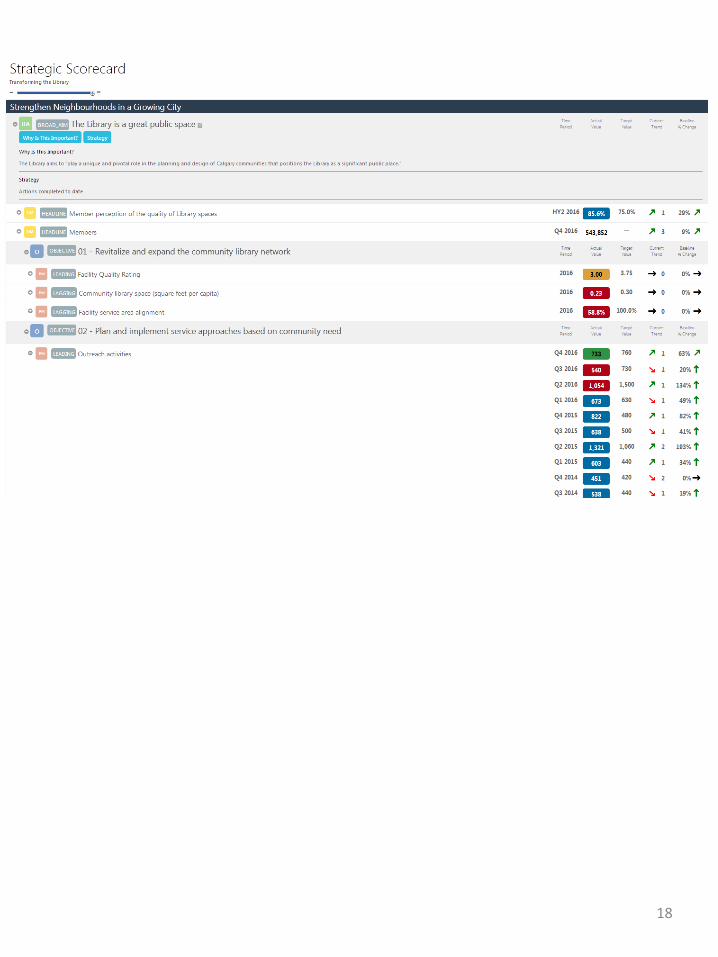
EXAMPLE D: CALGARY PUBLIC LIBRARY
14
15
16
17
18
Appendix B: Trustee Feedback on Best Practice Reporting Scan
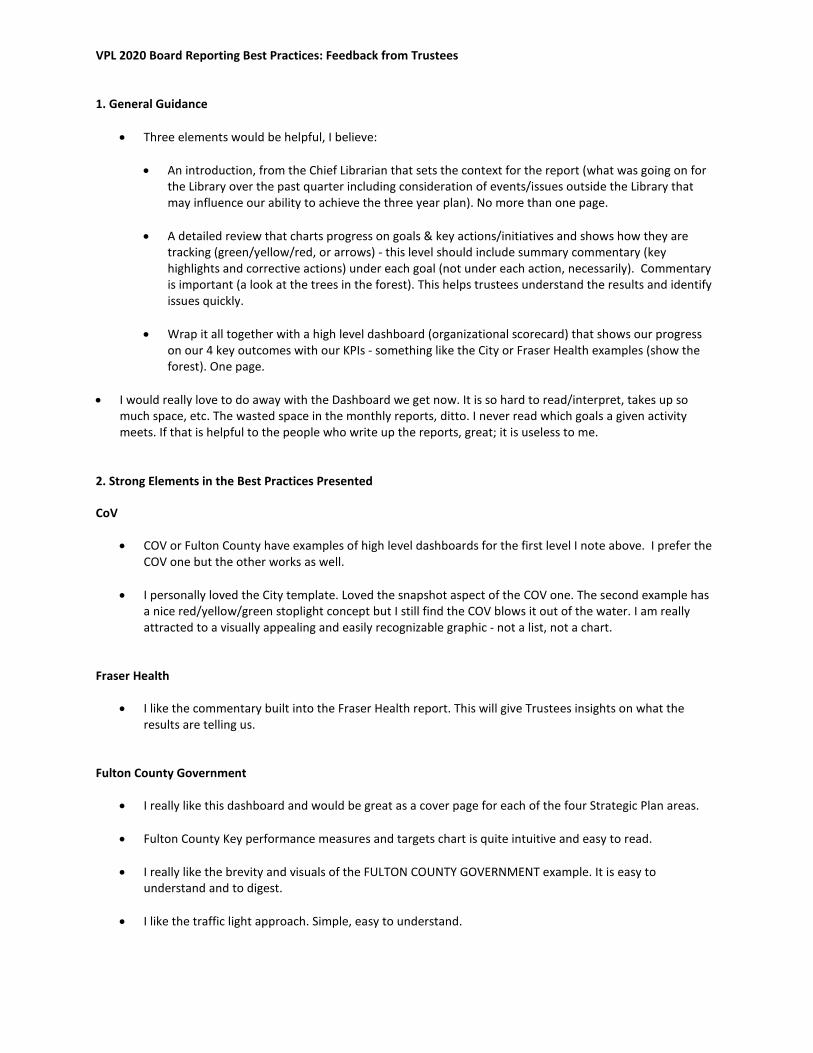
VPL 2020 Board Reporting Best Practices: Feedback from Trustees
1. General Guidance
• Three elements would be helpful, I believe:
• An introduction, from the Chief Librarian that sets the context for the report (what was going on for the Library over the past quarter including consideration of events/issues outside the Library that may influence our ability to achieve the three year plan). No more than one page.
• A detailed review that charts progress on goals & key actions/initiatives and shows how they are
tracking (green/yellow/red, or arrows) - this level should include summary commentary (key highlights and corrective actions) under each goal (not under each action, necessarily). Commentary is important (a look at the trees in the forest). This helps trustees understand the results and identify issues quickly.
• Wrap it all together with a high level dashboard (organizational scorecard) that shows our progress
on our 4 key outcomes with our KPIs - something like the City or Fraser Health examples (show the forest). One page.
• I would really love to do away with the Dashboard we get now. It is so hard to read/interpret, takes up so
much space, etc. The wasted space in the monthly reports, ditto. I never read which goals a given activity meets. If that is helpful to the people who write up the reports, great; it is useless to me.
2. Strong Elements in the Best Practices Presented
CoV
• COV or Fulton County have examples of high level dashboards for the first level I note above. I prefer the COV one but the other works as well.
• I personally loved the City template. Loved the snapshot aspect of the COV one. The second example has a nice red/yellow/green stoplight concept but I still find the COV blows it out of the water. I am really attracted to a visually appealing and easily recognizable graphic - not a list, not a chart.
Fraser Health
• I like the commentary built into the Fraser Health report. This will give Trustees insights on what the results are telling us.
Fulton County Government
• I really like this dashboard and would be great as a cover page for each of the four Strategic Plan areas.
• Fulton County Key performance measures and targets chart is quite intuitive and easy to read.
• I really like the brevity and visuals of the FULTON COUNTY GOVERNMENT example. It is easy to understand and to digest.
• I like the traffic light approach. Simple, easy to understand.
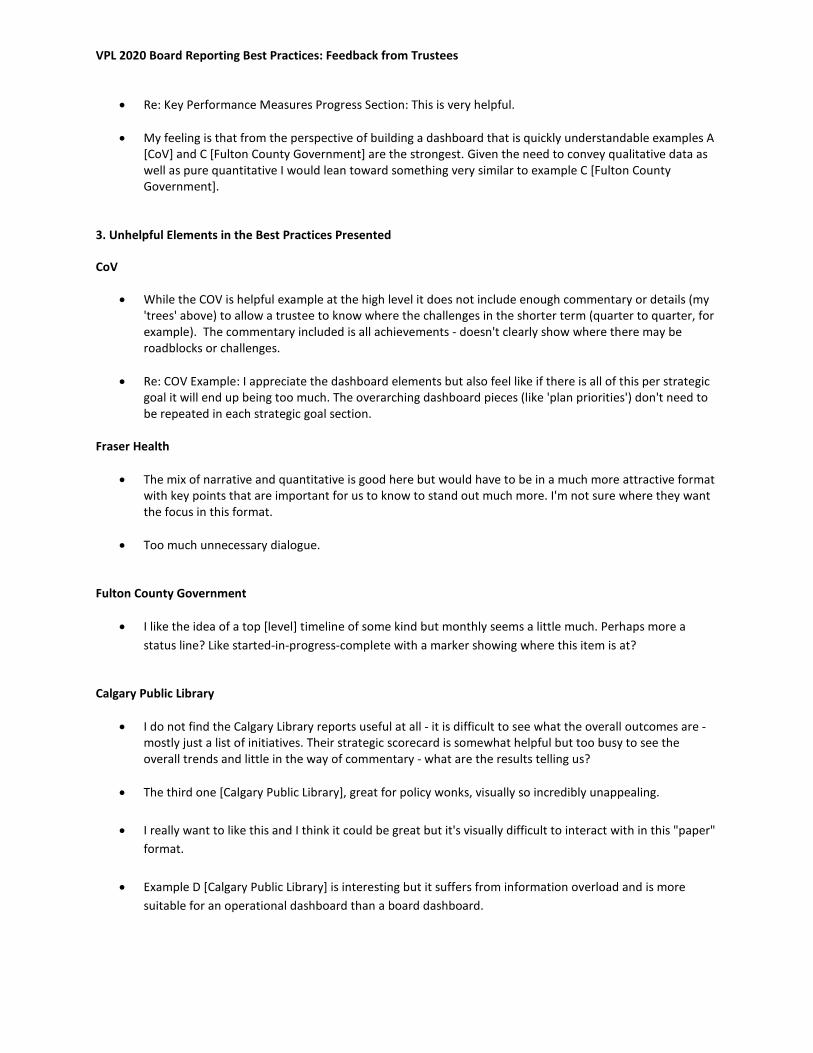
VPL 2020 Board Reporting Best Practices: Feedback from Trustees
• Re: Key Performance Measures Progress Section: This is very helpful.
• My feeling is that from the perspective of building a dashboard that is quickly understandable examples A [CoV] and C [Fulton County Government] are the strongest. Given the need to convey qualitative data as well as pure quantitative I would lean toward something very similar to example C [Fulton County Government].
3. Unhelpful Elements in the Best Practices Presented
CoV
• While the COV is helpful example at the high level it does not include enough commentary or details (my 'trees' above) to allow a trustee to know where the challenges in the shorter term (quarter to quarter, for example). The commentary included is all achievements - doesn't clearly show where there may be roadblocks or challenges.
• Re: COV Example: I appreciate the dashboard elements but also feel like if there is all of this per strategic goal it will end up being too much. The overarching dashboard pieces (like 'plan priorities') don't need to be repeated in each strategic goal section.
Fraser Health
• The mix of narrative and quantitative is good here but would have to be in a much more attractive format with key points that are important for us to know to stand out much more. I'm not sure where they want the focus in this format.
• Too much unnecessary dialogue.
Fulton County Government
• I like the idea of a top [level] timeline of some kind but monthly seems a little much. Perhaps more a status line? Like started-in-progress-complete with a marker showing where this item is at?
Calgary Public Library
• I do not find the Calgary Library reports useful at all - it is difficult to see what the overall outcomes are - mostly just a list of initiatives. Their strategic scorecard is somewhat helpful but too busy to see the overall trends and little in the way of commentary - what are the results telling us?
• The third one [Calgary Public Library], great for policy wonks, visually so incredibly unappealing.
• I really want to like this and I think it could be great but it's visually difficult to interact with in this "paper"
format.
• Example D [Calgary Public Library] is interesting but it suffers from information overload and is more suitable for an operational dashboard than a board dashboard.
Appendix C: Draft Report Template
Q2, 2017
VPL 2020 Strategic Plan
Quarterly Progress Report
- DRAFT TEMPLATE -
Chief Librarian Remarks
Summary
[An introduction from the Chief Librarian that sets the context for the report (what was going on for the Library over the past quarter including
consideration of events/issues outside the Library that may influence our ability to achieve the three year plan).]
[Chief Librarian's remarks relevant to LCI]
[Chief Librarian's remarks relevant to A&E]
[Chief Librarian's remarks relevant to S&C]
[Chief Librarian's remarks relevant to OS]
Learning, Creativity & Innovation: By 2020 VPL will be recognized as a go-to venue for learning, creativity, and innovation in Vancouver.
Access & Equity: By 2020 VPL will be accessible and inviting to everyone
Sharing & Collaboration: By 2020 VPL Will Be at the Centre of a Community That Shares Information, Ideas, & Stories
Organizational Strength: By 2020 VPL Will Be Seen as a Vital Civic Service and Will be Adaptable in the Face of Change.
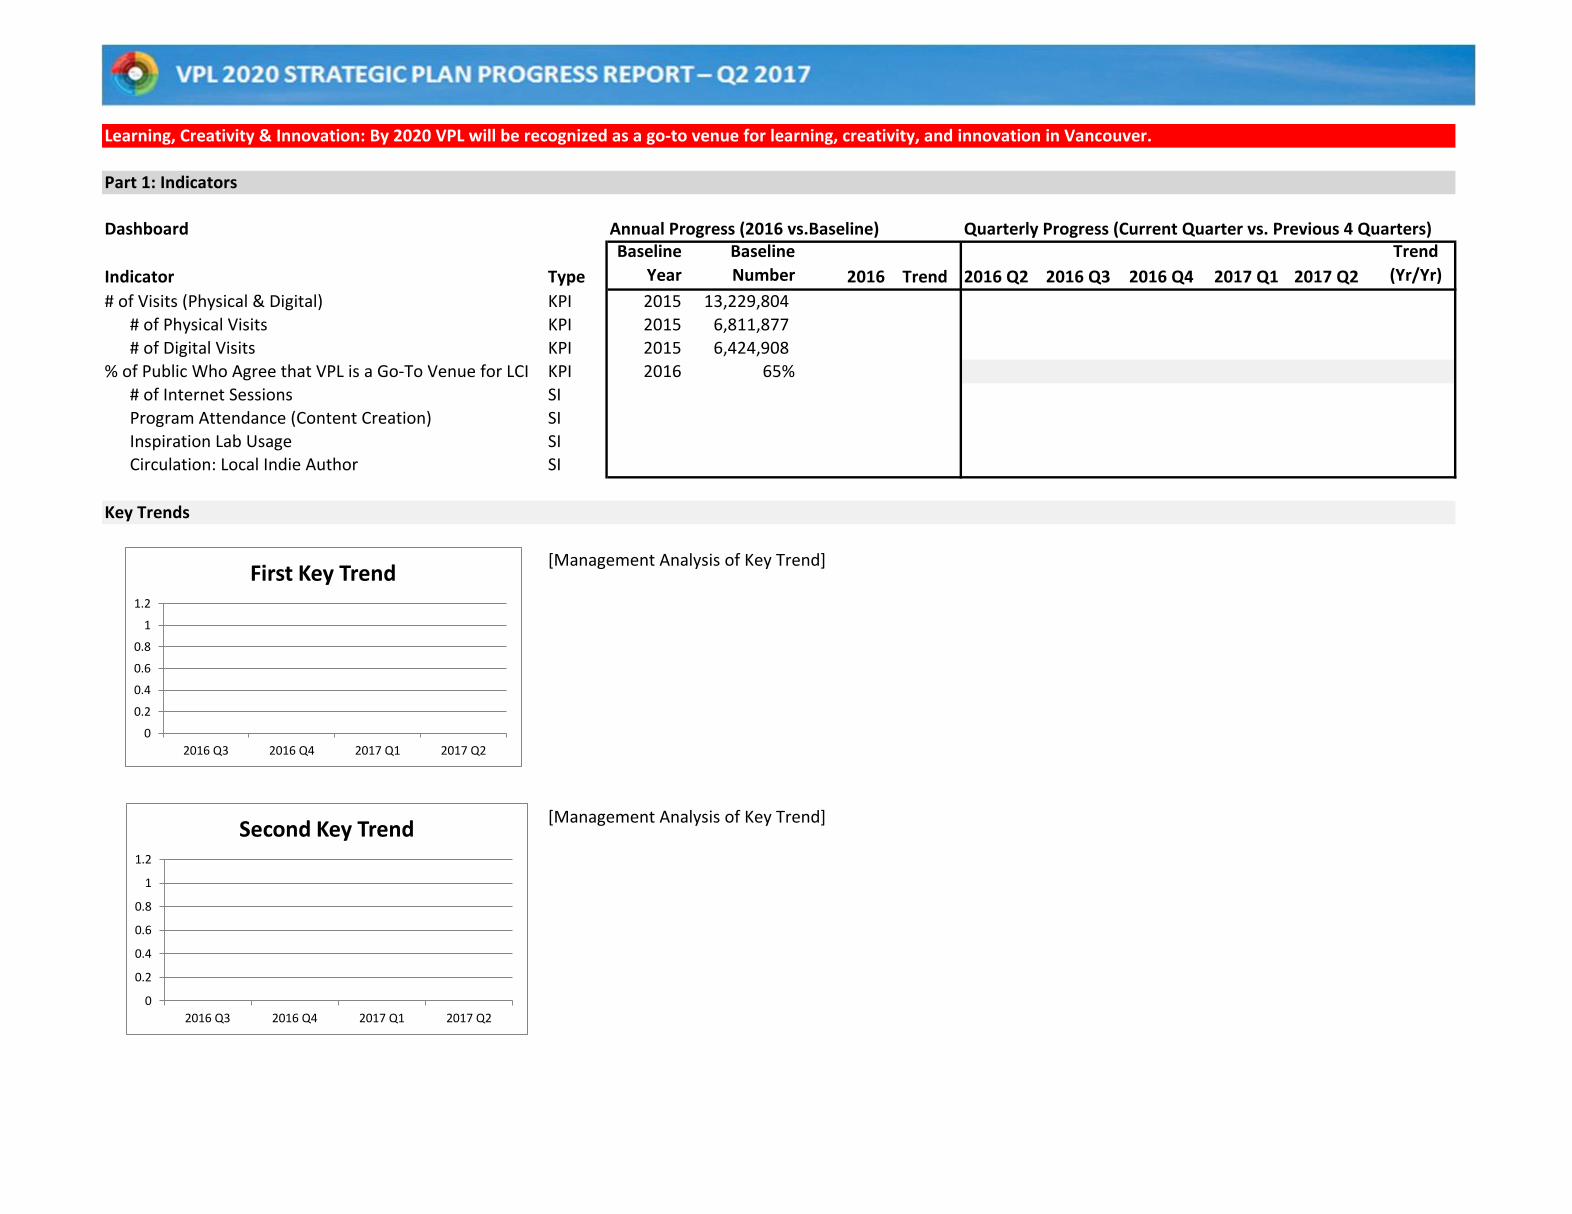
Learning, Creativity & Innovation: By 2020 VPL will be recognized as a go-to venue for learning, creativity, and innovation in Vancouver.
Part 1: Indicators
Dashboard Annual Progress (2016 vs.Baseline) Quarterly Progress (Current Quarter vs. Previous 4 Quarters)
Indicator Type
Baseline
Year
Baseline
Number 2016 Trend 2016 Q2 2016 Q3 2016 Q4 2017 Q1 2017 Q2
Trend
(Yr/Yr)
# of Visits (Physical & Digital) KPI 2015 13,229,804
# of Physical Visits KPI 2015 6,811,877
# of Digital Visits KPI 2015 6,424,908
% of Public Who Agree that VPL is a Go-To Venue for LCI KPI 2016 65%
# of Internet Sessions SI
Program Attendance (Content Creation) SI
Inspiration Lab Usage SICirculation: Local Indie Author SI
Key Trends
[Management Analysis of Key Trend]
[Management Analysis of Key Trend]
0
0.2
0.4
0.6
0.8
1
1.2
2016 Q3 2016 Q4 2017 Q1 2017 Q2
Second Key Trend
0
0.2
0.4
0.6
0.8
1
1.2
2016 Q3 2016 Q4 2017 Q1 2017 Q2
First Key Trend
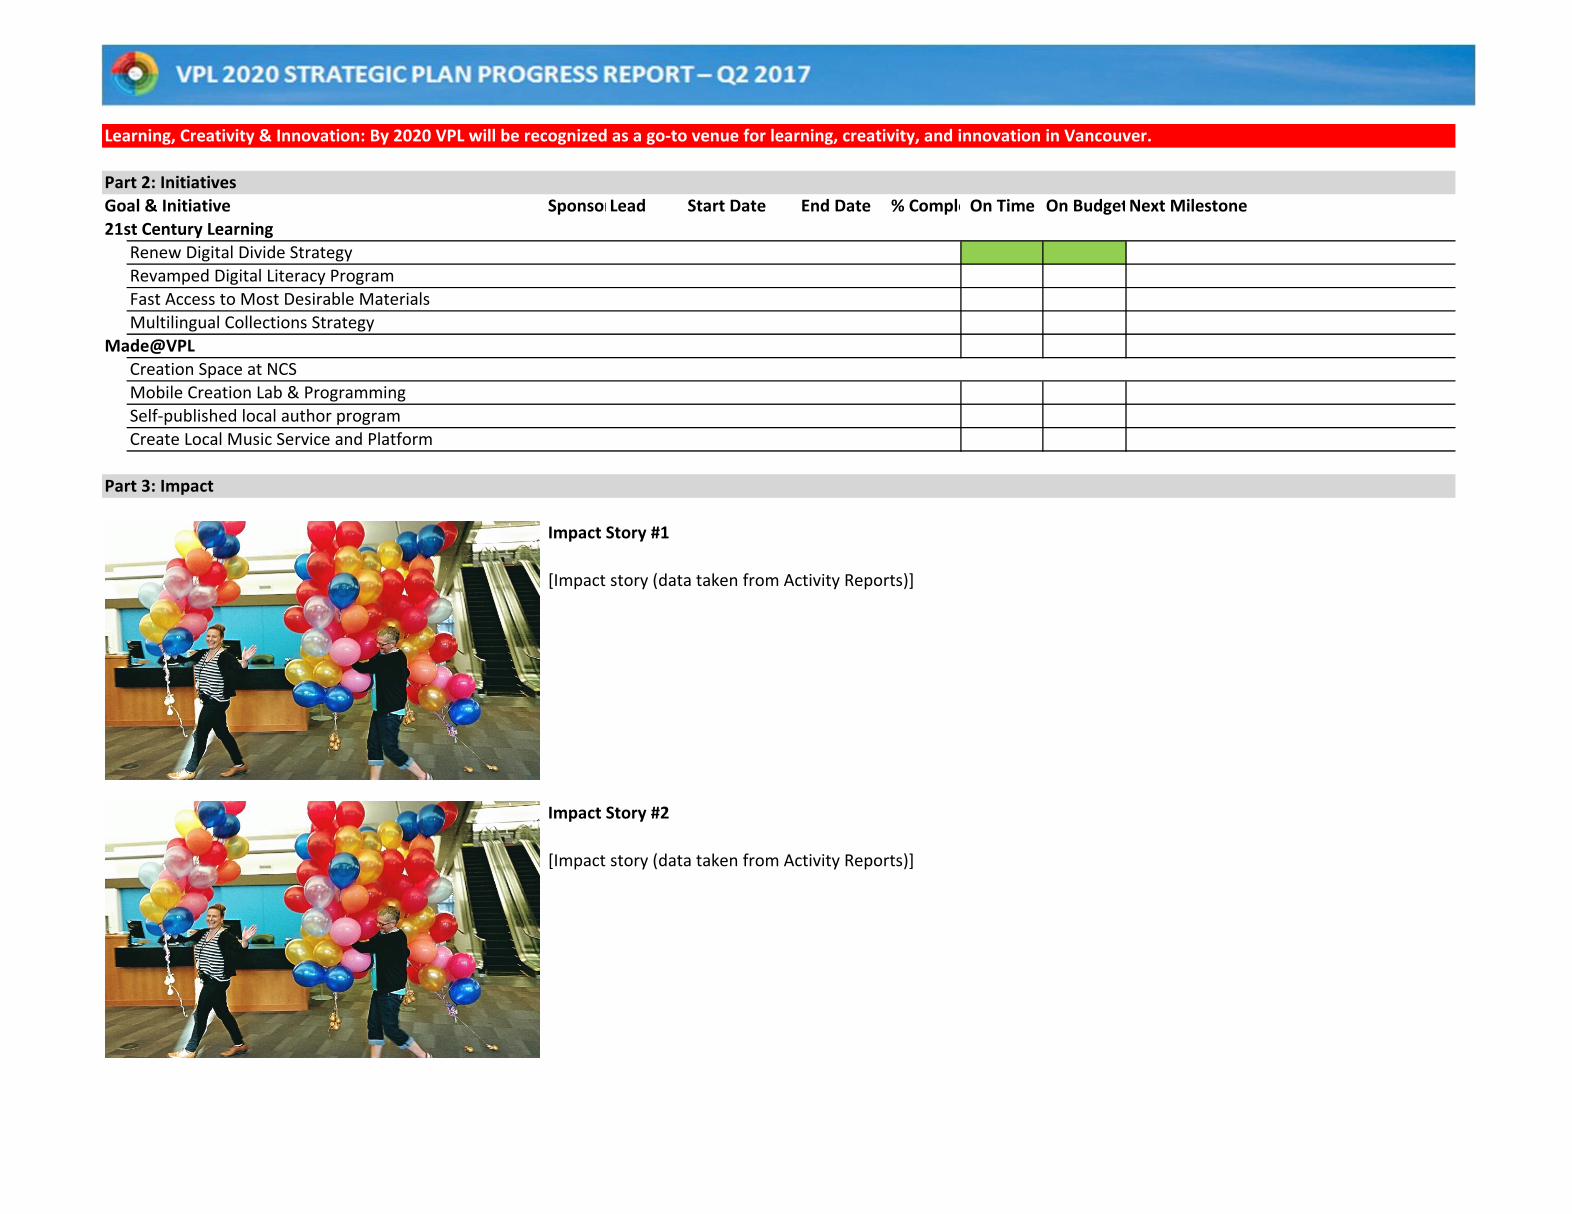
Learning, Creativity & Innovation: By 2020 VPL will be recognized as a go-to venue for learning, creativity, and innovation in Vancouver.
Part 2: Initiatives
Goal & Initiative SponsorLead Start Date End Date % CompleteOn Time On BudgetNext Milestone
21st Century Learning
Renew Digital Divide Strategy
Revamped Digital Literacy Program
Fast Access to Most Desirable Materials
Multilingual Collections Strategy
Made@VPL
Creation Space at NCS
Mobile Creation Lab & Programming
Self-published local author program
Create Local Music Service and Platform
Part 3: Impact
Impact Story #1
Impact Story #2
[Impact story (data taken from Activity Reports)]
[Impact story (data taken from Activity Reports)]
Access & Equity: By 2020 VPL will be accessible and inviting to everyone
Part 1: Indicators
Dashboard Annual Progress (2016 vs.Baseline) Quarterly Progress (Current Quarter vs. Previous 4 Quarters)
Indicator Type
Baseline
Year
Baseline
Number 2016 Trend 2016 Q2 2016 Q3 2016 Q4 2017 Q1 2017 Q2
Trend
(Yr/Yr)
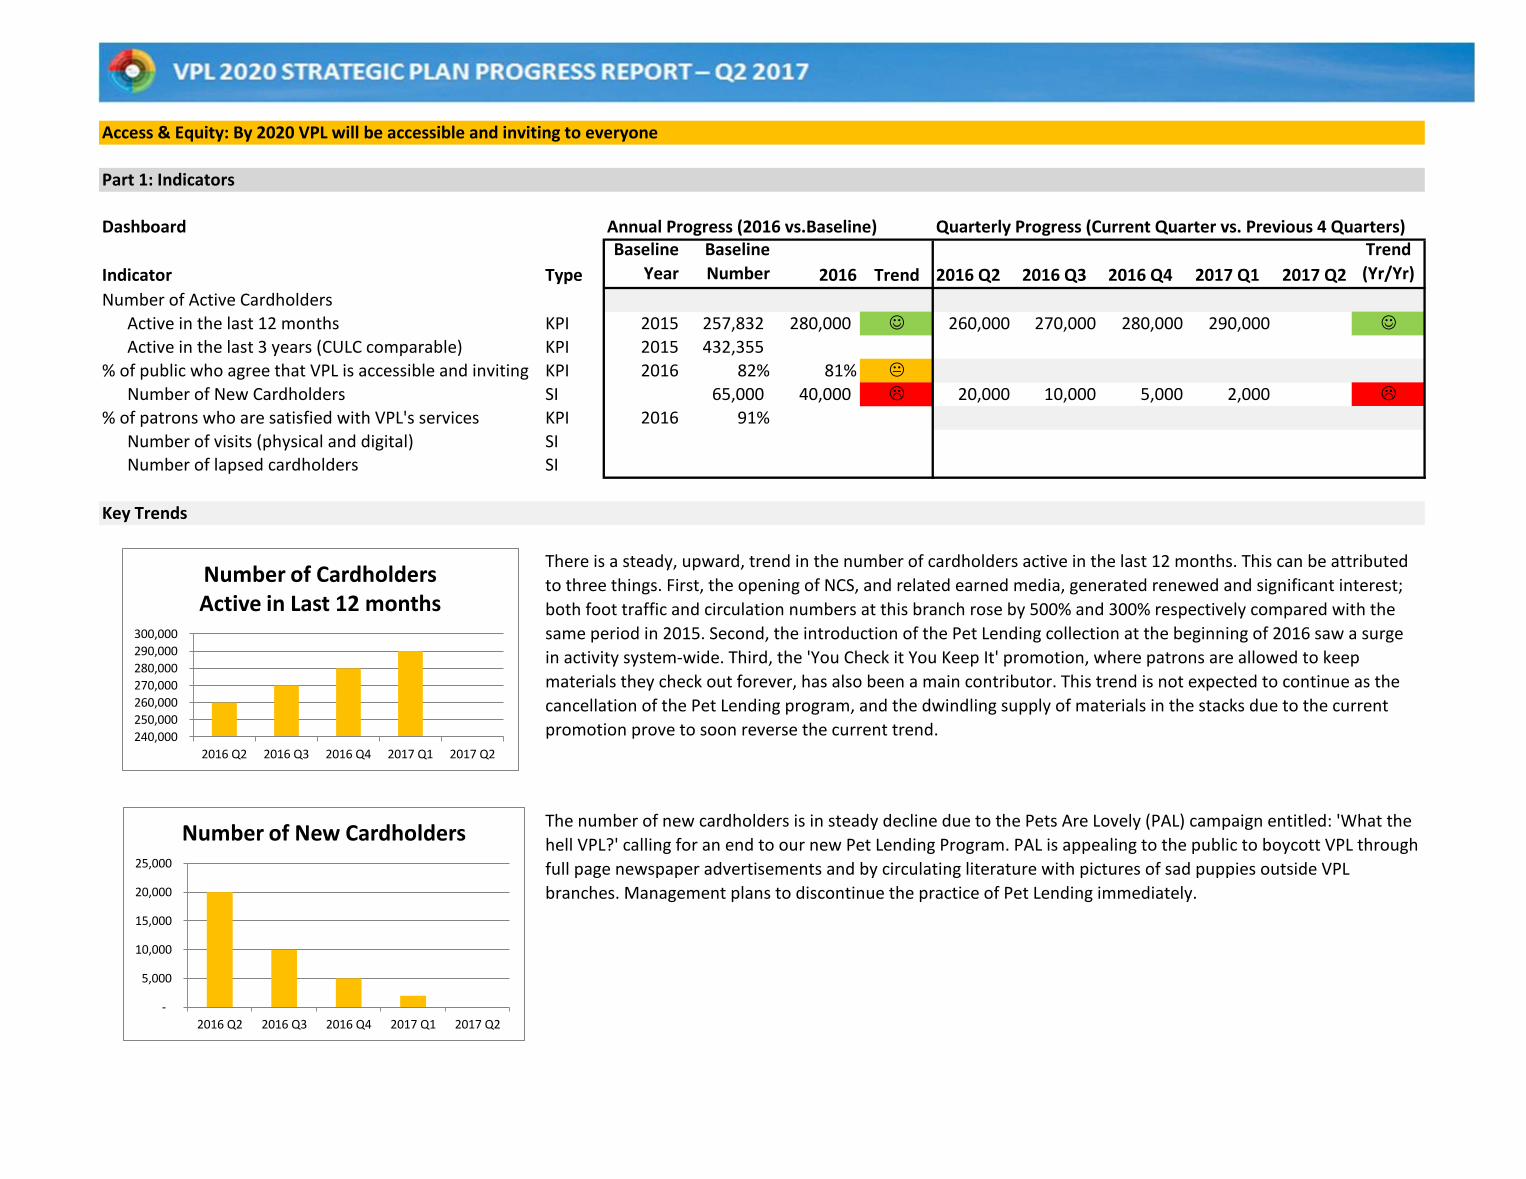
Number of Active Cardholders
Active in the last 12 months KPI 2015 257,832 280,000 J 260,000 270,000 280,000 290,000 J
Active in the last 3 years (CULC comparable) KPI 2015 432,355
% of public who agree that VPL is accessible and inviting KPI 2016 82% 81% K
Number of New Cardholders SI 65,000 40,000 L 20,000 10,000 5,000 2,000 L
% of patrons who are satisfied with VPL's services KPI 2016 91%
Number of visits (physical and digital) SINumber of lapsed cardholders SI
Key Trends
There is a steady, upward, trend in the number of cardholders active in the last 12 months. This can be attributed
to three things. First, the opening of NCS, and related earned media, generated renewed and significant interest;
both foot traffic and circulation numbers at this branch rose by 500% and 300% respectively compared with the
same period in 2015. Second, the introduction of the Pet Lending collection at the beginning of 2016 saw a surge
in activity system-wide. Third, the 'You Check it You Keep It' promotion, where patrons are allowed to keep
materials they check out forever, has also been a main contributor. This trend is not expected to continue as the
cancellation of the Pet Lending program, and the dwindling supply of materials in the stacks due to the current
promotion prove to soon reverse the current trend.
The number of new cardholders is in steady decline due to the Pets Are Lovely (PAL) campaign entitled: 'What the
hell VPL?' calling for an end to our new Pet Lending Program. PAL is appealing to the public to boycott VPL through
full page newspaper advertisements and by circulating literature with pictures of sad puppies outside VPL
branches. Management plans to discontinue the practice of Pet Lending immediately.
-
5,000
10,000
15,000
20,000
25,000
2016 Q2 2016 Q3 2016 Q4 2017 Q1 2017 Q2
Number of New Cardholders
240,000
250,000
260,000
270,000
280,000
290,000
300,000
2016 Q2 2016 Q3 2016 Q4 2017 Q1 2017 Q2
Number of Cardholders Active in Last 12 months
Access & Equity: By 2020 VPL will be accessible and inviting to everyone
Part 2: Initiatives
Goal & Initiative SponsorLead Start Date End Date % CompleteOn Time On Budget Next Milestone
Patron Centred Experience
New VPL.ca Website CdC KC 2016 2017 Q2 90%
NCS Branch
Creative Approaches to Extend Opening Hours
Branch Master Plan
UX at VPL
Welcoming Spaces
Patron Segmentation to Inform Service Offerings
Trans* Inclusion Strategy
Accessible Adaptive Equipment
Part 3: Impact
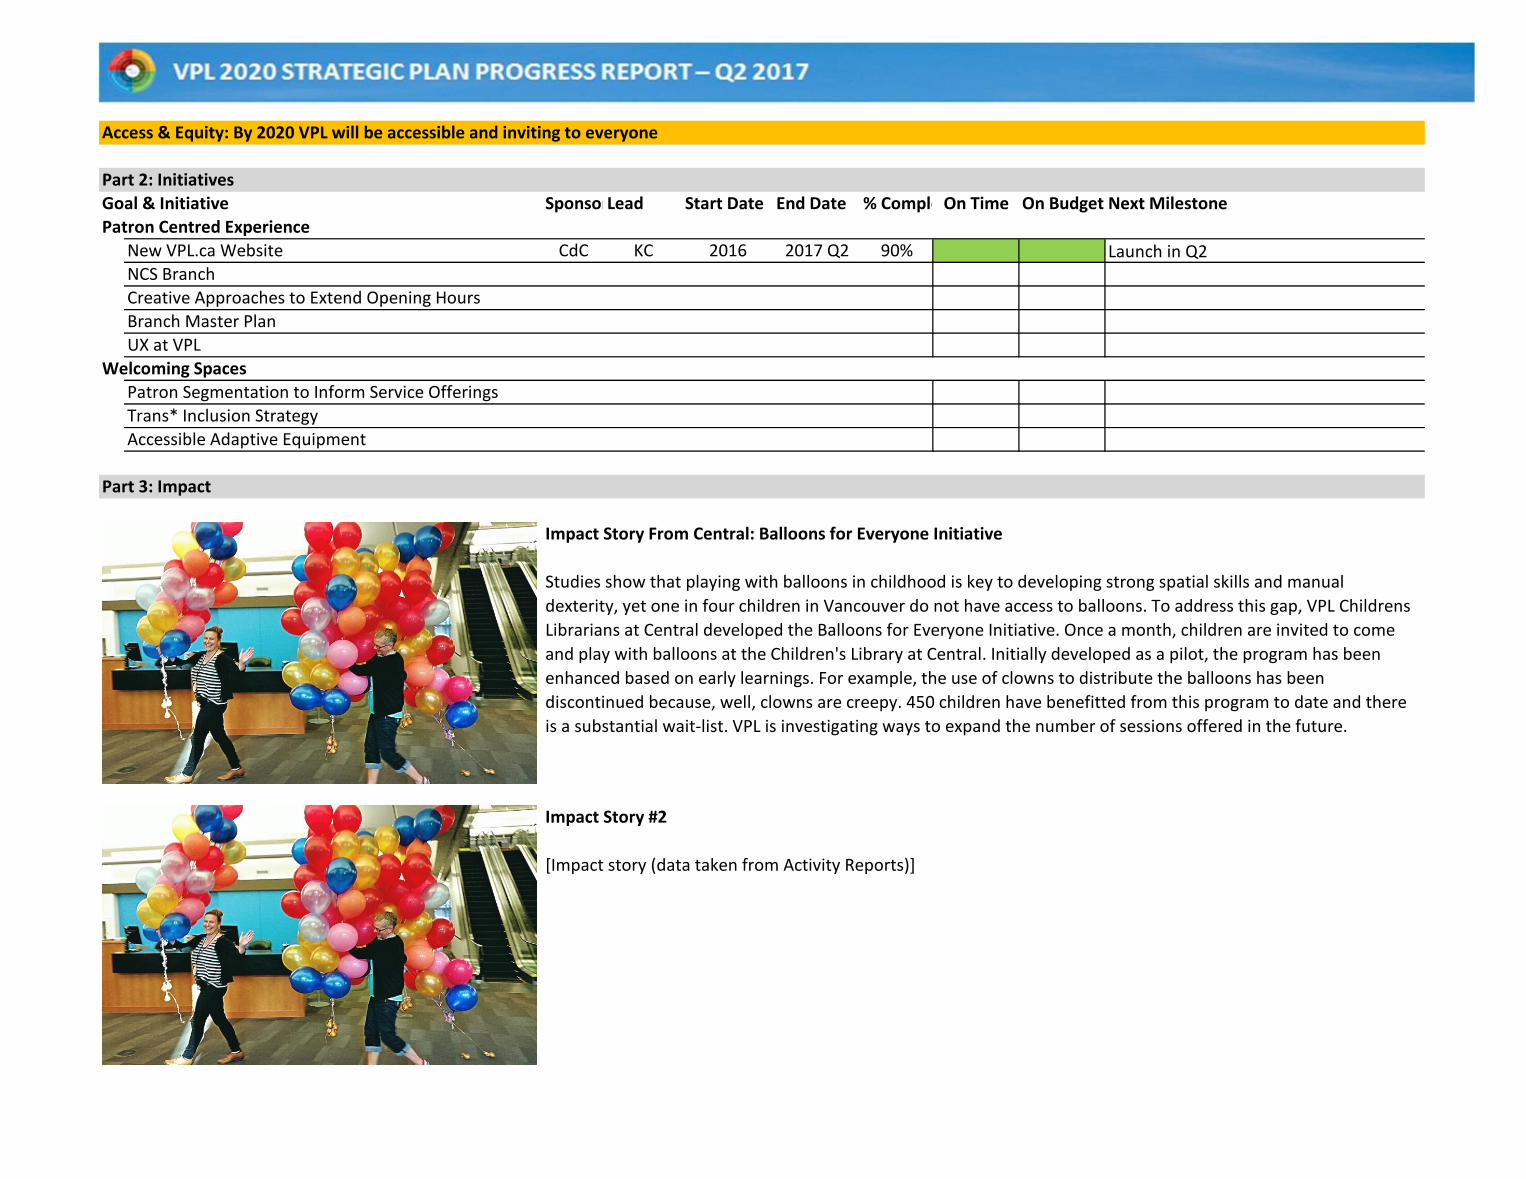
Impact Story From Central: Balloons for Everyone Initiative
Impact Story #2
[Impact story (data taken from Activity Reports)]
Launch in Q2
Studies show that playing with balloons in childhood is key to developing strong spatial skills and manual
dexterity, yet one in four children in Vancouver do not have access to balloons. To address this gap, VPL Childrens
Librarians at Central developed the Balloons for Everyone Initiative. Once a month, children are invited to come
and play with balloons at the Children's Library at Central. Initially developed as a pilot, the program has been
enhanced based on early learnings. For example, the use of clowns to distribute the balloons has been
discontinued because, well, clowns are creepy. 450 children have benefitted from this program to date and there
is a substantial wait-list. VPL is investigating ways to expand the number of sessions offered in the future.
Sharing & Collaboration: By 2020 VPL Will Be at the Centre of a Community That Shares Information, Ideas, & Stories
Part 1: Indicators
Dashboard Annual Progress (2016 vs.Baseline) Quarterly Progress (Current Quarter vs. Previous 4 Quarters)
Indicator Type
Baseline
Year
Baseline
Number 2016 Trend 2016 Q2 2016 Q3 2016 Q4 2017 Q1 2017 Q2
Trend
(Yr/Yr)
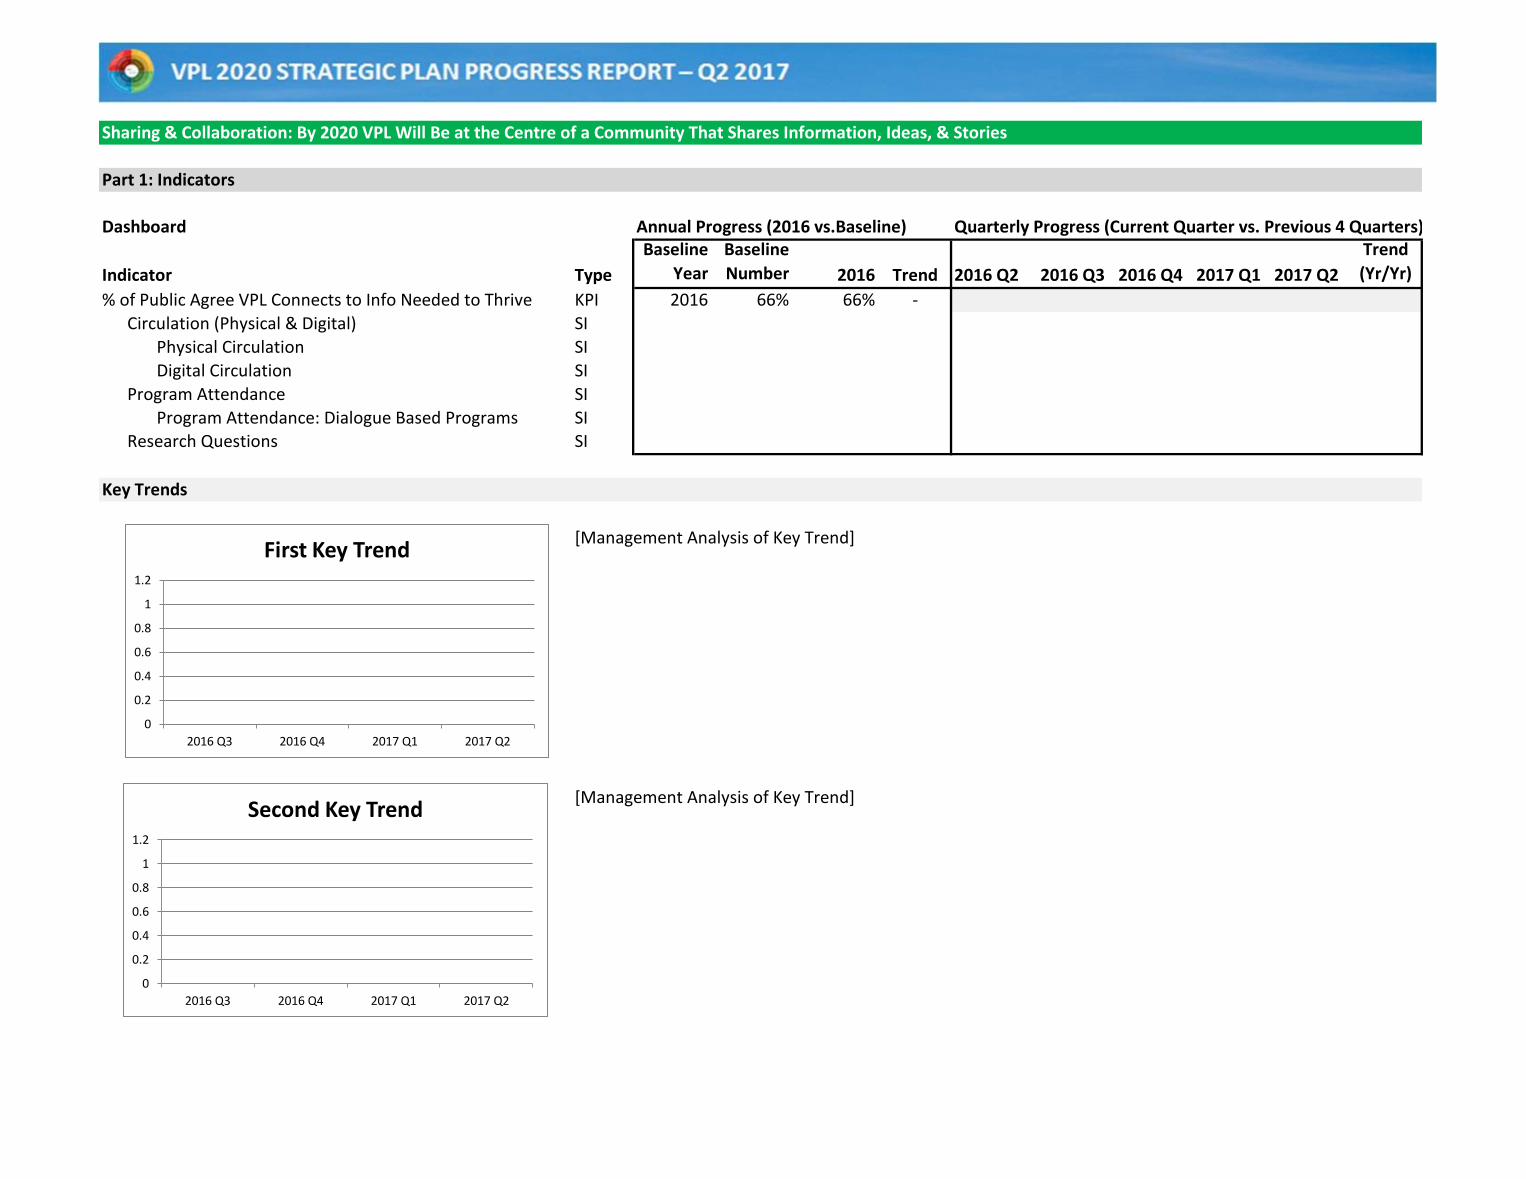
% of Public Agree VPL Connects to Info Needed to Thrive KPI 2016 66% 66% -
Circulation (Physical & Digital) SI
Physical Circulation SI
Digital Circulation SI
Program Attendance SI
Program Attendance: Dialogue Based Programs SIResearch Questions SI
Key Trends
[Management Analysis of Key Trend]
[Management Analysis of Key Trend]
0
0.2
0.4
0.6
0.8
1
1.2
2016 Q3 2016 Q4 2017 Q1 2017 Q2
Second Key Trend
0
0.2
0.4
0.6
0.8
1
1.2
2016 Q3 2016 Q4 2017 Q1 2017 Q2
First Key Trend
Sharing & Collaboration: By 2020 VPL Will Be at the Centre of a Community That Shares Information, Ideas, & Stories
Part 2: Initiatives
Goal & Initiative SponsorLead Start Date End Date % CompleteOn Time On BudgetNext Milestone
Community Connections
Civic Dialogue Partnership
Community Voices Film Festival
City Wide Book Club on Social Issues
Truth & Reconcilliation Calls to Action
Platforms for Sharing
Story City (Canada 150+)
Define VPL's Role in Sharing Economy
Day @ VPL for Organizations Pilot
Connect with Community Group Networks to ID Needs
Part 3: Impact
Impact Story #1
Impact Story #2
[Impact story (data taken from Activity Reports)]
[Impact story (data taken from Activity Reports)]
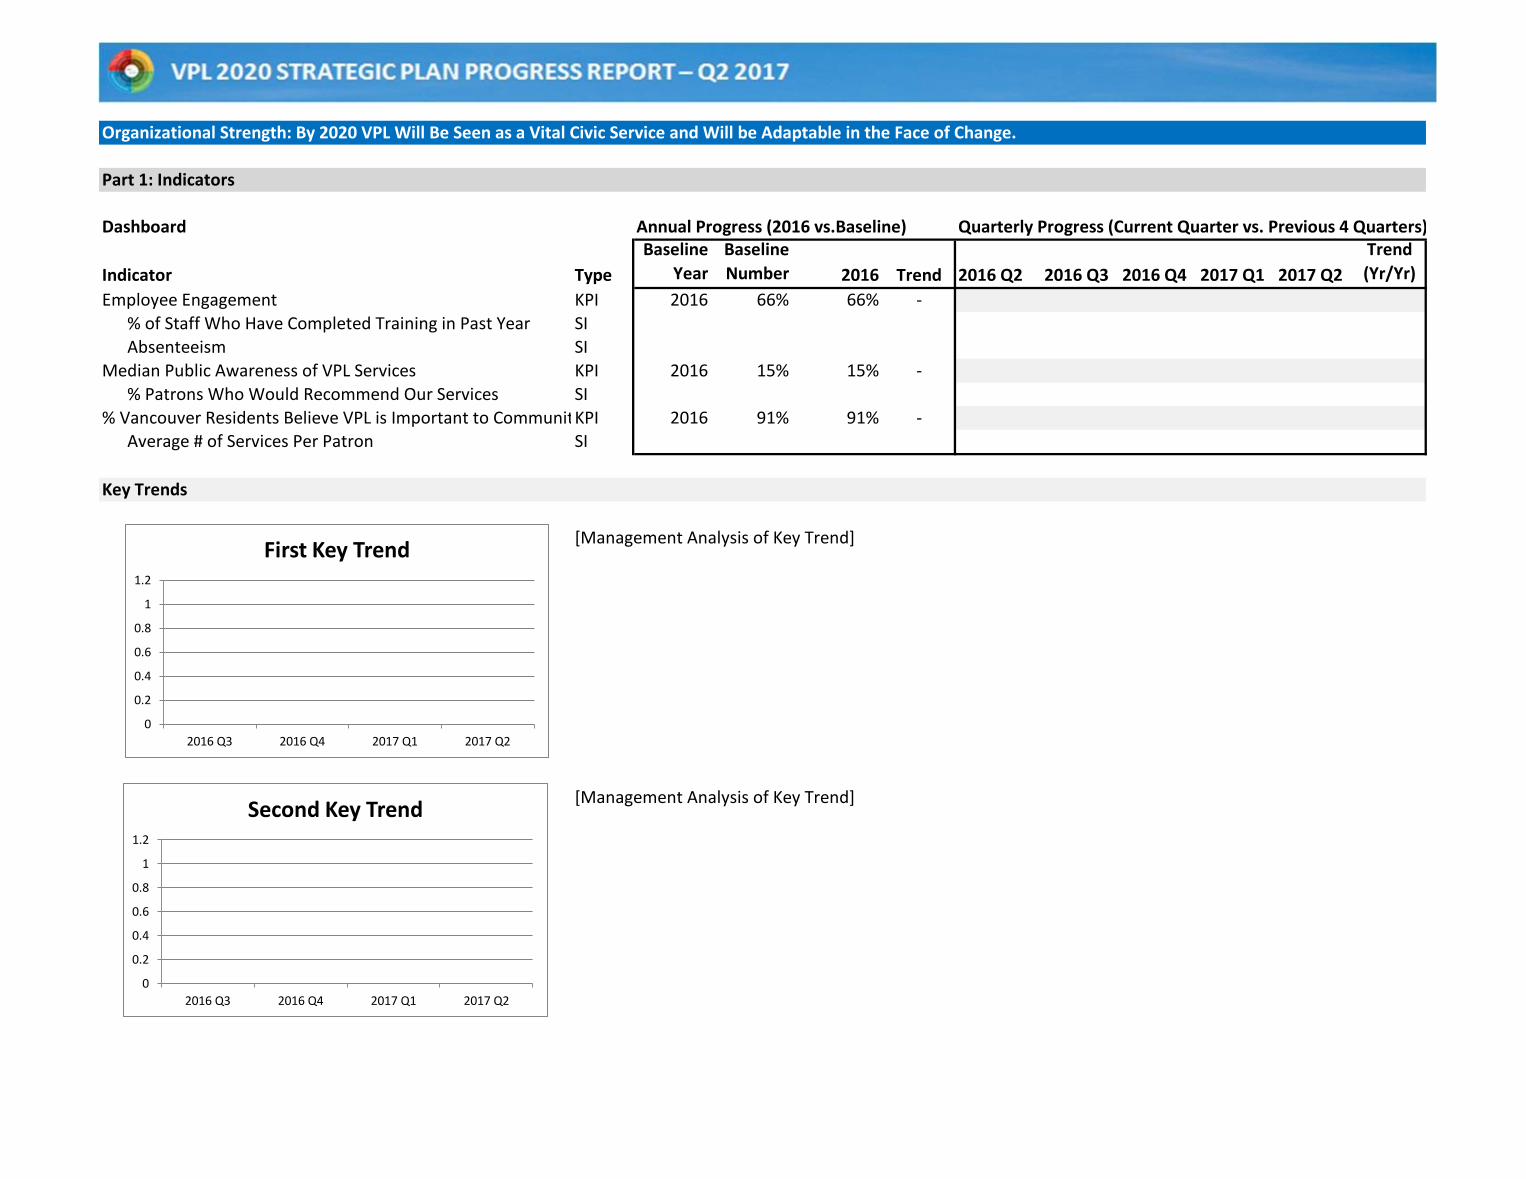
Organizational Strength: By 2020 VPL Will Be Seen as a Vital Civic Service and Will be Adaptable in the Face of Change.
Part 1: Indicators
Dashboard Annual Progress (2016 vs.Baseline) Quarterly Progress (Current Quarter vs. Previous 4 Quarters)
Indicator Type
Baseline
Year
Baseline
Number 2016 Trend 2016 Q2 2016 Q3 2016 Q4 2017 Q1 2017 Q2
Trend
(Yr/Yr)
Employee Engagement KPI 2016 66% 66% -
% of Staff Who Have Completed Training in Past Year SI
Absenteeism SI
Median Public Awareness of VPL Services KPI 2016 15% 15% -
% Patrons Who Would Recommend Our Services SI
% Vancouver Residents Believe VPL is Important to CommunityKPI 2016 91% 91% -Average # of Services Per Patron SI
Key Trends
[Management Analysis of Key Trend]
[Management Analysis of Key Trend]
0
0.2
0.4
0.6
0.8
1
1.2
2016 Q3 2016 Q4 2017 Q1 2017 Q2
Second Key Trend
0
0.2
0.4
0.6
0.8
1
1.2
2016 Q3 2016 Q4 2017 Q1 2017 Q2
First Key Trend
Organizational Strength: By 2020 VPL Will Be Seen as a Vital Civic Service and Will be Adaptable in the Face of Change.
Part 2: Initiatives
Goal & Initiative SponsorLead Start Date End Date % CompleteOn Time On BudgetNext Milestone
People & Culture
Refresh Community-led Training
Innovation Program
New Staff Orientation Training Review & Implementation
Support to Advance (career pathing; supervisor development & coaching; mentorship program)
Branch Staffing Model
Central Public Service Model
Value & Impact
Reporting & Data Management
Project Outcome for Evaluation
Create a new member experience strategy
Expand Activities to Promote VPL Services
Part 3: Impact
Impact Story #1
Impact Story #2
[Impact story (data taken from Activity Reports)]
[Impact story (data taken from Activity Reports)]