Embed Size (px)
Citation preview

Management Practices & Productivity
in British Manufacturing Firms
Richard Heys
UK Office for National Statistics
Global Forum on Productivity
Budapest, Hungary
26 June 2017 1

Motivation
2

Firm level productivity distribution, UK
whole economy
3 Source: ONS (ABS)

Current Price GDP per hour worked, G7
80
90
100
110
120
130
140
Japan Canada UK(=100) Italy G7 ex.UK France US Germany
2014 2015
4
Source: ONS (International Comparisons of Productivity)
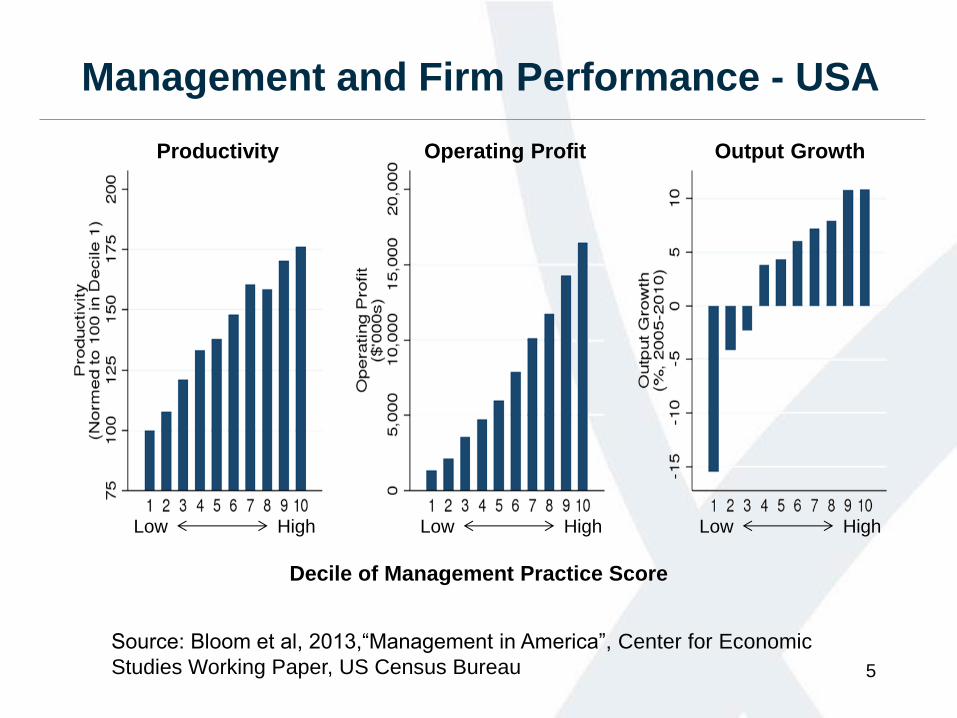
Management and Firm Performance - USA
Source: Bloom et al, 2013,“Management in America”, Center for Economic
Studies Working Paper, US Census Bureau 5
Productivity Operating Profit Output Growth
Decile of Management Practice Score
Low High Low High Low High

Purpose of MPS pilot
• Feasibility
-Are UK businesses willing to answer these
questions in a voluntary survey?
-Can we find a long term approach for collecting
data on management practices?
• Results
-How much do responses vary?
-Do we see an association between management
practices and productivity?
6

Designing a
Management Survey
Pilot
7

Management Practices Survey (MPS) pilot
Selected 8 questions from US MOPS on key aspects
of management practices including:
• Culture of continuous improvement
• Use and monitoring of Key Performance Indicators (KPIs)
• Setting stretching targets and related practices
• Employment practices, e.g. hiring, promotions and
underperformance

Survey Design - Sample
• 1,026 businesses from the Annual Business Survey’s sample for 2015
• Coverage: • Great Britain
• Reporting Units (businesses) with employment of at least 10, where employment is employees plus working proprietors
• Manufacturing (SIC 2007 section C, divisions 10-33)
• Stratified using employment and industry • Employment bands of 10-49, 50-99, 100-249 and 250+
• Industry at division level (two digit SIC code)
• Final response rate of 68% (702 businesses)
9

Results
10

Manufacturing environment in Great Britain
11 Source: ONS

Average score by business type
0.0 0.2 0.4 0.6 0.8 1.0
All manufacturing
Not family-owned
Family-owned
Family-owned and managed
Family-owned, not family-managed
Domestic
Multinationals
UK Multinationals
Non-UK Multinationals
Management Score (2015)
12
All manufacturing includes all manufacturing businesses with employment of at least 10
in Great Britain
Source: ONS

Average score by employment size band
0.0
0.1
0.2
0.3
0.4
0.5
0.6
0.7
0.8
0.9
1.0
Allmanufacturing
Family owned Family ownedand managed
Family owned,not familymanaged
Multinationals
10 to 49 employment 50 to 99 employment 100 to 249 employment 250+ employment
Management Score (2015)
13
All manufacturing includes all manufacturing businesses with employment of at least 10
in Great Britain
Source: ONS

Average management score by business age
0.0
0.1
0.2
0.3
0.4
0.5
0.6
0.7
0.8
0.9
1.0
Allmanufacturing
Not family-owned
Family-owned Domestic Multinational
Up to 5 years Over 5 years, up to 10 years Over 10 years, up to 20 years Over 20 years
Management Score (2015)
14
All manufacturing includes all manufacturing businesses with employment of at least 10
in Great Britain
Source: ONS

Average score by quintile and size band
15
0.0
0.1
0.2
0.3
0.4
0.5
0.6
0.7
0.8
0.9
1.0
1 2 3 4 5
All manufacturing 10-49 employment 50-99 employment
100-249 employment 250+ employment
Management Score (2015)
Quintile
All manufacturing includes all manufacturing businesses with employment of at least 10
in Great Britain
Source: ONS

Average score by quintile and type
16
0.0
0.1
0.2
0.3
0.4
0.5
0.6
0.7
0.8
0.9
1.0
1 2 3 4 5
All manufacturing Multinationals
Family owned Family owned and managed
Family owned and non-family managed
Management Score (2015)
Quintile
All manufacturing includes all manufacturing businesses with employment of at least 10
in Great Britain
Source: ONS

Multivariate analysis of management
score – Ordinary Least Squares
Management
score (1)
Management
score (2)
Management
score (3)
Management
score (4)
Management
score (5)
Log(employment) 0.110***
(0.015)
0.107***
(0.014)
0.108***
(0.016)
0.105***
(0.014)
0.108***
(0.014)
Family owned
business
0.004
(0.049)
0.001
(0.051)
-0.005
(0.054)
-0.010
(0.056)
-0.006
(0.058)
Family-owned and
non-family-run
0.047
(0.032)
0.057
(0.033)
0.053
(0.033)
Multinational 0.016
(0.032)
0.013
(0.032)
0.008
(0.043)
0.003
(0.042)
0.004
(0.043)
UK Multinational
0.002
(0.026)
0.002
(0.026)
0.002
(0.028)
Age (years)
-0.000
(0.012)
Age squared
-0.000
(0.000)
Industry dummies No Yes No Yes Yes
R2 0.299 0.328 0.303 0.332 0.337
Observations 694 694 694 694 694
Standard errors in parentheses, clustered by size band and industry. * p < 0.05, ** p < 0.01, *** p < 0.001
Source: Office for National Statistics
Full results are available on request.
17

Multivariate analysis by employment size
bands – Ordinary Least Squares Small businesses
(10-49 employment)
Medium businesses
(50-99 employment)
Medium businesses
(100-249 employment)
Large businesses
(250+ employment)
Log(employment) 0.201***
(0.034)
0.149***
(0.011)
0.117***
(0.015)
0.102***
(0.007)
Family owned
business
-0.006
(0.072)
-0.033
(0.039)
-0.082
(0.067)
0.011
(0.038)
Family-owned and
non-family-run
0.035
(0.045)
0.058
(0.026)
0.104
(0.069)
0.037
(0.032)
Multinational 0.056
(0.080)
-0.059
(0.068)
0.018
(0.034)
0.020
(0.035)
UK Multinational -0.001
(0.081)
0.055
(0.059)
0.021
(0.053)
-0.038
(0.025)
Age (years) 0.002
(0.016)
0.014
(0.009)
0.012
(0.014)
0.024*
(0.008)
Age squared -0.000
(0.001)
-0.000
(0.000)
-0.000
(0.001)
-0.001*
(0.000)
Industry dummies Yes Yes Yes Yes
R2 0.902 0.959 0.972 0.982
Observations 190 178 172 154
Standard errors in parentheses, clustered by size band and industry. * p < 0.05, ** p < 0.01, *** p < 0.001
Source: Office for National Statistics
Full results are available on request.
18

Management Practices and Productivity
19
Key:
All: All manufacturing
NF: Non-family owned
F: Family owned
FM: Family owned and
managed
FNM: Family owned but
not-family managed
D: Domestic
M: Multinational
MUK: UK multinational
MNUK: Non-UK
multinational

Management Practices and Productivity
20

Multivariate Analysis of Management Score and
Productivity (1) (2) (3) (4) (5)
Log(OPW) Log(OPW) Log(OPW) Log(OPW) Log(OPW)
Management score 0.855** 0.608** 0.609** 0.629** 0.669***
(0.312) (0.290) (0.223) (0.239) (0.226)
Log(employment) 0.049* 0.060 0.060 0.047
(0.027) (0.038) (0.037) (0.042)
Family-owned business -0.188***
(0.051)
Family-owned and family-
managed business
-0.162*** -0.184***
(0.055) (0.067)
Family-owned and non-
family-managed business
-0.271*** -0.265***
(0.094) (0.095)
Multinational (MPS data) -0.136 -0.086 -0.090
(0.124) (0.112) (0.105)
UK Multinational (MPS
data)
-0.072 -0.080
(0.114) (0.115)
Age (years) 0.017
(0.068)
Age squared -0.000
(0.002)
Industry dummies No Yes Yes Yes Yes
R2 0.079 0.184 0.203 0.205 0.216
Adjusted R2 0.077 0.171 0.188 0.187 0.195
Observations 591 591 591 591 591
Source: Office for National Statistics
Notes:
1.Standard errors in parentheses are clustered by industry and employment size band, * p < 0.1,
** p < 0.05,
*** p < 0.01 21

Conclusions
• We find a higher prevalence of structured management
practices among larger firms, multinationals and family
owned but not-family managed firms.
• There is strong positive associations between management
practice score and firm size (in terms of employment).
• There is strong positive correlation between management
practice score and labour productivity, even when controlled
for family ownership, multinational status, size and age.
• Family owned firms are around 20% less productive than
others and there is no significant effects for multinationals. 22

Next Steps
23

Management and Expectations Survey
• The ONS has teamed up with the ESCoE to run an expanded
set of questions on management practices and expectations
• Wider coverage of Manufacturing and Services
• Sample size of 25,000
• Data collection at Reporting Unit level, consistent with existing
ONS business surveys
• Survey despatch in July 2017, and initial analysis planned for
Q1 2018
24

Other developments around productivity measurement
• Development of quarterly regional labour input metrics
• Experimental annual industry-by-region labour metrics
• New quarterly regional output per hour and output per job
• Historical measures of output per job and hour since the
18th century
• Development of new quarterly Capital Productivity metrics
• Development of quarterly suite of growth accounting
measures of productivity – QALI, VICS and MFP
• Linking administrative data on Trade to the Business
Register to facilitate productivity research
• Developing new estimates of infrastructure capital
25

EXTRA SLIDES
27

Average score by quintile and size band
28
0.0
0.1
0.2
0.3
0.4
0.5
0.6
0.7
0.8
0.9
1.0
1 2 3 4 5
All manufacturing 10-49 employment 50-99 employment
100-249 employment 250+ employment
Management Score (2015)
Quintile
All manufacturing includes all manufacturing businesses with employment of
at least 10 in Great Britain
Source: ONS

MPS questions and scoring schedule
29
Question Score
1 In 2015, what generally best describes what happened at this business when a production problem arose?
a We fixed it but did not take further action 1/3
b We fixed it and took action to make sure that it did not happen again 2/3
c We fixed it and took action to make sure that it did not happen again, and had a continuous improvement process to anticipate problems like these in advance
1
d No action was taken 0
2 In 2015, how many key performance indicators were monitored at this business?
a 1 to 2 key performance indicators 1/3
b 3 to 9 key performance indicators 2/3
c 10 or more key performance indicators 1
d No key performance indicators 0
3 In 2015, how frequently were the key performance indicators reviewed at this business?
a Annually 1/6
b Quarterly 1/3
c Monthly 1/2
d Weekly 2/3
e Daily 5/6
f Hourly or more frequently 1
g Never 0
4 In 2015, what best describes the time frame of production targets at this business?
a Main focus was on short-term (less than one year) production targets 1/3
b Main focus was on long-term (more than one year) production targets 2/3
c Combination of short-term and long-term production targets 1
d No production targets 0

MPS questions and scoring schedule cont’d
30
Question Score
5 In 2015, how easy or difficult was it for this business to achieve its production targets?
a Possible to achieve without much effort 0
b Possible to achieve with some effort 1/2
c Possible to achieve with normal amount of effort 3/4
d Possible to achieve with more than normal effort 1
e Only possible to achieve with extraordinary effort 1/4
6 In 2015, how were employees usually promoted at this business?
a Promotions were based solely on performance and ability 1
b Promotions were based partly on performance and ability, and partly on other factors, such as tenure
2/3
c Promotions were based mainly on factors other than performance and ability, such as tenure 1/3
d Employees are normally not promoted 0
7 In 2015, when was an under-performing employee moved from their current role?
a Within 6 months of identifying employee under-performance 1
b After 6 months of identifying employee under-performance 1/2
c Rarely or never 0
8 In 2015, who made decisions over the hiring of permanent full-time employees?
a Only the owner(s) 0
b Mostly the owner(s) with some input from other employees 1/3
c Jointly the owner(s) and other employees 2/3
d Other employees 1