Embed Size (px)
Citation preview
ANNUAL REPORT ON THE
MANAGEMENT OF THE ENERGY SECTOR LEVIES AND
ACCOUNTS
FOR THE YEAR 2018
SUBMITTED TO PARLIAMENT BY
KEN OFORI-ATTA (MINISTER FOR FINANCE)
i
ANNUAL REPORT ON THE
MANAGEMENT OF THE ENERGY SECTOR LEVIES AND
ACCOUNTS
FOR THE YEAR 2018
SUBMITTED TO PARLIAMENT IN ACCORDANCE WITH
SECTION 6 OF THE ENERGY SECTOR LEVIES ACT, 2015 (ACT 899), AS AMENDED, 2017 (ACT 946)
ii
LIST OF ACRONYMS
BDC Bulk Oil Distribution Company
BOST Bulk Oil Storage and Transportation
BPA Bui Power Authority
CAGD Controller and Accountant General’s Department
ECG Electricity Company of Ghana
EDCs Electricity Distribution Companies
EDRL Energy Debt Recovery Levy
EDRLA Energy Debt Recovery Levy Account
EDSA Energy Debt Service Account
EF Energy Fund
EFL Energy Fund Levy
ESL Energy Sector Levy
ESLA Energy Sector Levies Act
GRA Ghana Revenue Authority
KG Kilogram
L/C Letter of Credit
LPG Liquified Petroleum Gas
MDAs Ministries Departments and Agencies
MGO Marine Gas Oil
MGO L/F Marine Gas Oil (Local/Foreign)
MoEn Ministry of Energy
MoF Ministry of Finance
NEDCo Northern Electricity Distribution Company
NEF National Electrification Fund
NESL National Electrification Scheme Levy
NPA National Petroleum Authority
OMC Oil Marketing Company
PCA Petroleum Collection Account
PDRA Petroleum Debt Recovery Account
PGISsA Power Generation and Infrastructure Support sub-Account
PLL Public Lighting Levy
ppkg price per kilogram
ppkWh price per kilowatt hour
iii
ppl price per litre
PPPR Prescribed Petroleum Pricing Regulations
PSRA Price Stabilisation and Recovery Account
PSRL Price Stabilisation and Recovery Levy
RF Road Fund
RFL Road Fund Levy
RFO Residual Fuel Oil
SDG Sustainable Development Goal
SOE State Owned Enterprise
TOR Tema Oil Refinery
VAT Value Added Tax
VRA Volta River Authority
iv
TABLE OF CONTENTS
LIST OF ACRONYMS.......................................................................................................... ii
LIST OF TABLES ................................................................................................................ v
LIST OF FIGURES .............................................................................................................. v
FOREWORD ....................................................................................................................... 1
EXECUTIVE SUMMARY ..................................................................................................... 3
SECTION 1: INTRODUCTION ............................................................................................ 6
SECTION 2: IMPOSITION AND COLLECTION OF THE LEVIES ....................................... 7
SECTION 3: ACCOUNTS .................................................................................................. 16
SECTION 4: STATUS OF UTILISATION OF THE ENERGY SECTOR LEVIES ............... 23
SECTION 5: TRANSFERS TO E.S.L.A. PLC AND UTILISATION OF PROCEEDS .......... 31
SECTION 6: FORECAST OF THE LEVIES FOR THE MEDIUM TERM............................ 33
SECTION 7: CONCLUSION .............................................................................................. 35
SECTION 8: APPENDICES ............................................................................................... 36
A. Total Volume of Products Lifted in 2018 .................................................................. 36
B. January to December 2018 Programmed and Actual Collection (in GH¢) - 1 .......... 37
C. Analysis of Programmed and Actual Collection for 2018/2017 (in GH¢) - 1 ............. 39
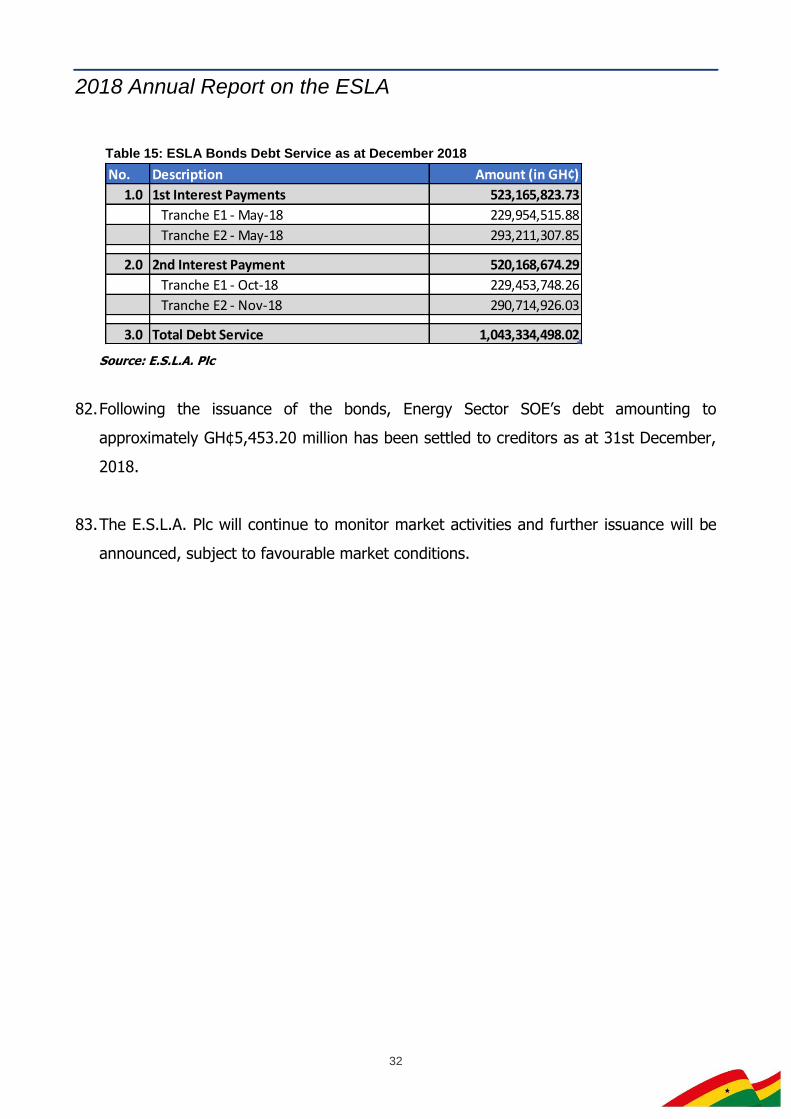
D. Distribution of the Levies by the Established ESLA Accounts and Other Accounts (in
GH¢) - 1 .......................................................................................................................... 43
E. Utilisation of the Energy Sector Levies in 2018 (in GH¢) - 1 .................................... 53
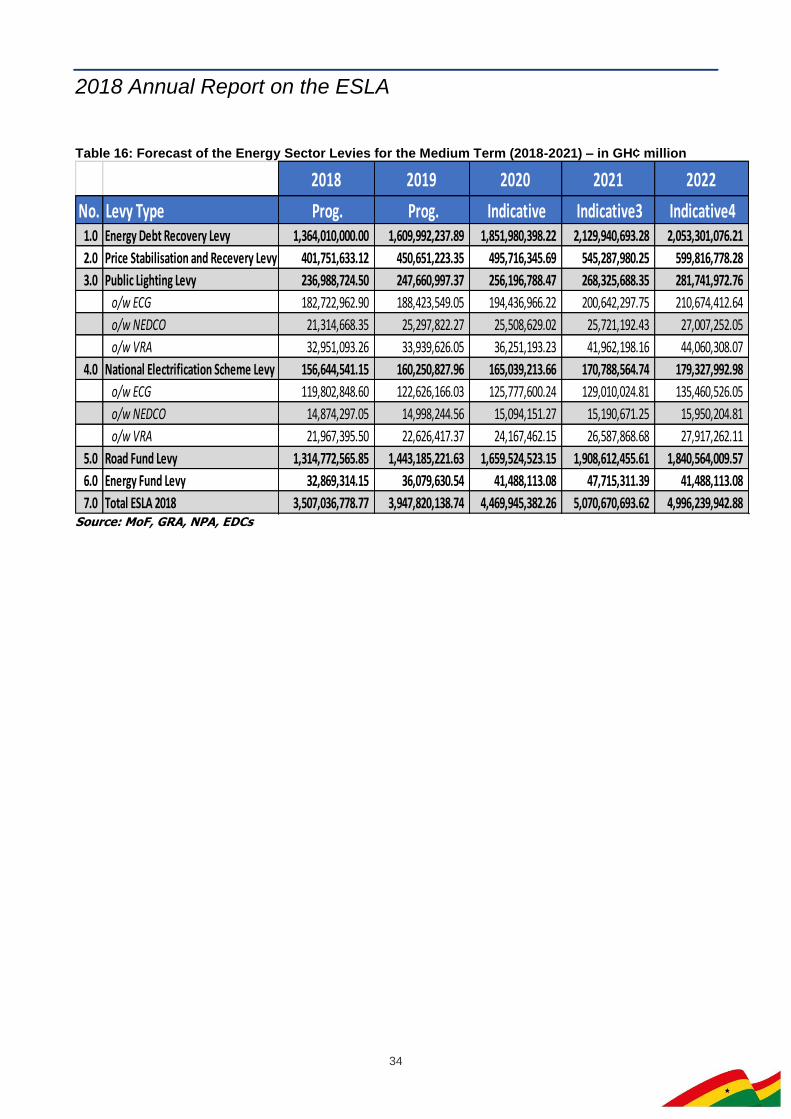
v
LIST OF TABLES
Table 1: Table 1: Energy Levies Pricing Matrix (ppl/ppkg in GH¢) ....................................... 8
Table 2: Total liftings by the established ESLA Levies (in GH¢) ........................................ 12
Table 3: Total liftings by Products ...................................................................................... 12
Table 4: Performance of the ESLs for the period ending December 31, 2018 ................... 13
Table 5: Analysis of programmed and Actual collection for 2018/2017 (in GH¢) ............... 14
Table 6: Distribution of the levies by the accounts established under the ESLA (in GH¢) . 19
Table 7: PLL and NESL Distribution .................................................................................... 20
Table 8: Distribution of the levies into Accounts Established under the ESLA and other
Accounts ............................................................................................................................ 21
Table 9: Other Receipts into the Established Accounts ..................................................... 22
Table 10: Utilisation of Levies lodged into the Established Accounts (in GH¢) .................. 26
Table 11: Summary of Utilisation of Levies Lodged into accounts other than the
Established ESLA Accounts (in GH¢) ................................................................................ 28
Table 12: Closing balances in the ESLA accounts as at 31/12/2018 ................................ 30
Table 13: Total Bonds issued under E.S.L.A Plc ............................................................... 31
Table 14: Total levies received by E.S.L.A Plc .................................................................. 31
Table 15: ESLA Bonds Debt Service as at December 2018 .............................................. 32
Table 16: Forecast of the Energy Sector Levies for the Medium Term (2018-2021) – in
GH¢ million ........................................................................................................................ 34
LIST OF FIGURES
Figure 1: Composition of collections by the ESLA levies (in GH¢) (ppl/ppkg in GH¢) .......... 9
Figure 2: Composition of collections by product (in GH¢) .................................................. 10
Figure 3: Total products lifted in 2018 ................................................................................ 11
Figure 4: Analysis of programmed and Actual collection for 2018/2017 (in GH¢) .............. 15
Figure 5: Ratio analysis of Levies lodged into the Established Accounts .......................... 26
Figure 6: Ratio analysis of Levies lodged into the Other ESLA Accounts .......................... 29
Figure 7: Share of Utilisation of Levies Lodged into the ESLA accounts and accounts other
than the Established ESLA Accounts (in GH¢) .................................................................. 30
2018 Annual Report on the ESLA
1
FOREWORD
1. The Energy Sector Levies Act, 2015 (Act 899) as amended (Act 946), was passed into
law in 2015, mainly to address the huge debt burden and operational challenges facing
State Owned Enterprises (SOEs) in the Energy Sector, support power generation and
power supply sustainability, subsidise premix and stabilise petroleum prices, support
road maintenance, as well as fund the activities of the Energy Commission.
2. The Act applied the levies on the price per litre (ppl) /price per kilogram (ppkg) of
petroleum, and the price per kilowatt hour (ppkWh) of electricity.
3. When we took office in 2017, we reduced the electricity levies under the ESLA, from 5.0
percent each on the ppkWh for Public Lighting and National Electrification Levies, to 3.0
percent ppkWh and 2.0 percent ppkWh respectively. This was done to ease the burden
of the payment of huge electricity tariffs on Ghanaians and ensure a cheaper and more
affordable electricity supply.
4. We have utilised the funds that accrued from the electricity levies to provide public
lighting infrastructure as well as cover the cost of providing public lighting. This has
addressed the problem of dark streets in cities and towns within Greater Accra, and other
regional capitals nationwide. Transfers into the National Electrification Fund together
with other budgetary flows, have also been utilised under the National Electrification
Programme to improve access to electricity, by over 84.0 percent as at the end of 2018
in line with the attainment of Goal 7 of the Sustainable Development Goals (SDGs), to
ensure access to affordable, reliable, sustainable, and modern energy for all.
5. The petroleum levies, on the other hand, have been utilised, through E.S.L.A. Plc, to
significantly reduce the liabilities of Energy Sector SOEs to keep them running and viable.
Proceeds from these levies have also gone into supporting road maintenance and the
activities of the Energy Commission.
6. In 2018, following the continuous increase in international crude oil prices, we intervened
in the market, in line with the provisions of Section 5 (2b) of the ESLA, by reducing and
2018 Annual Report on the ESLA
2
subsequently withdrawing the Price Stabilisation and Recovery Levy (PSRL) to prevent
the transmission of escalating international petroleum prices to the pumps. While this
resulted in a net loss of ESLA proceeds in excess of GH¢270.00 million, it provided some
relief to Ghanaians especially the users of public transportation. Nonetheless, we utilised
buffers from the PSRL to ensure guaranteed supply of premix and Residual Fuel Oil (RFO)
to our fishing communities and industries across the country.
7. This year’s report, which is the third since the passing of the Energy Sector Levies Act,
and the second since the assumption into office of this Government, provides an
overview of the total levies collected in 2018, the utilisation of proceeds, performance of
E.S.L.A. Plc, and the forecast for the Medium Term. We have also for the first time,
reported on the total volumes of products lifted during the year. While there were some
challenges reconciling the data from the NPA and GRA, we believe it is the right step
towards improving the reporting processes to give Ghanaians continued confidence in
our management and reporting of the levies. We expect that, going forward, the
integration and full operationalisation of the Enterprise Relational Database Management
System will ensure that information on liftings is consistent across collection and
reporting institutions.
8. I wish to express my sincere gratitude to all the Stakeholder Institutions on the ESLA
and their representatives on the Technical Working Group drawn from MoF, MoEn,
CAGD, GRA, ECG, VRA, NEDCo, NPA, Road Fund and Energy Commission for putting this
report together. My appreciation also goes to my colleague Minister for Energy, the Chief
Executives and Managing Directors of the stakeholder institutions on the ESLA as well
as E.S.L.A. Plc for their inputs and support towards the effective implementation of the
Act.
9. God Bless.
2018 Annual Report on the ESLA
3
EXECUTIVE SUMMARY
1. This report is prepared in line with Section 6 of the Energy Sector Levies Act 2015 (Act
899), as amended, Act 946 which requires the Minister for Finance to submit an annual
report to Parliament on the management of the levies and accounts established under
the Act.
2. The levies were imposed under the Act to effectively manage the hard core liabilities of
Energy Sector State Owned Enterprises (SOEs), promote investments in the sector,
support road maintenance and the activities of the Energy Commission, without
constraining the National Budget.
IMPOSITION AND PERFORMANCE OF THE LEVIES
3. Under the ESLA Act, a total of GH¢0.94 and GH¢0.92 is applied on the price per litre of
petrol and diesel respectively. GH¢0.03 is applied per litre of Marine Gas Oil Local and
Foreign (MGO L/F). GH¢0.05 is applied per litre of Fuel Oil. GH¢0.47 is charged on the
price per kilogram of LPG. GH¢0.01 is charged per litre of kerosene, and a total levy of
5.0 percent which includes 2.0/3.0 percent of NESL/PLL is applied on the ppkWh of
electricity consumed.
4. At the end of 2018, the total levies collected, based on the volume of products lifted and
arrears paid, amounted to GH¢3,190.74 million against a target of GH¢3,507.04 million.
This resulted in a shortfall in collections of GH¢316.29 million, 9.0 percent below the
programmed target for the year. The shortfall in collections was mainly on account of
the reduction and subsequent withdrawal of the PSRL from the petroleum price build-up
to mitigate potential increases in the ex-pump price of petroleum products.
5. The EDRL, RFL, and EFL on the other hand, all outperformed their targets by 7.9 percent,
0.72 percent, and 7.29 percent respectively. Total EDRL collections were higher than
programmed by GH¢107.95 million, from GH¢1,364.01 million to GH¢1,471.96 million.
The EFL and RFL also recorded positive performance in collections by GH¢2.40 million
and GH¢9.52 million, from GH¢32.87 million to GH¢35.27 million and GH¢1,314.77
2018 Annual Report on the ESLA
4
million to GH¢1,324.29 million, respectively. The positive performance of the levies was
on account of the increase in consumption volumes in 2018, by 11.79 percent, compared
with the same period in 2017.
ACCOUNTS
6. In total, an amount of GH¢3,088.04 million was lodged into the ESLA accounts against
actual collections of GH¢3,190.74 million and a programmed target of GH¢3,507.04
million. An amount of GH¢102.70 million which accounts for 3.22 percent of actual
collections was not lodged. The shortfall in lodgement was mainly as a result of the
following:
ECG retention of additional GH¢49.69 million and GH¢13.57 million of Public
Lighting Levy (PLL) and National Electrification Scheme Levy (NESL) collections
respectively;
NEDCo retention of additional GH¢6.18 million of PLL Collections;
VRA retention of GH¢3.89 million of NESL collections; and
Cash in transit subsequently lodged in 2019.
7. The Electricity Distribution Companies (ECG, VRA, NEDCo) retained PLL collected for the
MoEn to meet additional cost incurred in the provision of public lighting over the period.
STATUS OF UTILISATION OF THE ENERGY SECTOR LEVIES
8. As required by the Act, a total amount of GH¢2,565.50 million was utilised out of the
total levies collected for the period. A breakdown of the utilisation is as follows:
GH¢1,370.03 million was transferred to E.S.L.A. PLC towards servicing the ESLA
bond;
GH¢47.72 million for the payment of power utility debts;
GH¢4.20 million for the payment of L/Cs and L/C charges;
GH¢245.68 million for the payment of premix and RFO subsidy;
GH¢685 million transferred to the Road Fund for road maintenance;
GH¢13.07 million transferred to fund the activities of the Energy Commission
during the year;
2018 Annual Report on the ESLA
5
GH¢116.63 million retained by EDCs to cover the cost of providing public lighting;
and
GH¢82.67 million transferred to MoEn for Public Lighting Infrastructure and the
implementation of the National Electrification Programme to increase nationwide
access to electricity.
TRANSFERS TO E.S.L.A. PLC AND UTILISATION OF BOND PROCEEDS
9. E.S.L.A. Plc issued bonds with a face value of GH¢5,664.72 million as at December 2018,
as part of the Government’s plan to refinance Energy Sector debts. The issuance of the
bonds resulted in the reduction of SOE debts to its creditors by approximately
GH¢5,453.20 million as at 31st December 2018.
10. Total transfers from the ESLA Accounts towards the servicing of the ESLA bonds
amounted to GH¢1,353.71 million. Of the total amount transferred, E.S.L.A Plc made
coupon payments of GH¢1,043.30 million with cash held in excess of the Debt Service
Reserve amount transferred into a Lockbox Account for the benefit of bond holders.
2018 Annual Report on the ESLA
6
SECTION 1: INTRODUCTION
1. The Energy Sector Levies Act, 2015 (Act 899) as amended (Act 946) was passed into
law in December 2015 with full implementation starting from 1st January 2016. The Act1
was established to effectively manage the hard-core liabilities of Energy Sector State
Owned Enterprises (SOEs), promote investments in the sector, support road
maintenance and the activities of the Energy Commission, without constraining the
National Budget.
2. This report which is the third since the implementation of the Act, is submitted to
Parliament in conformity with section 6 of the Energy Sector Levies Act, 2015 (Act 899),
as amended (Act 946).
3. The report presents the status of the management of the levies and accounts for the
period January to December, 2018. The rest of the report is structured as follows:
Section 2: Imposition and Collection of the Levies;
Section 3: Accounts;
Section 4: Status of Utilisation of the Energy Sector Levies;
Section 5: E.S.L.A. PLC and the Refinancing of Energy Sector Debt;
Section 6: Forecast of the levies for the Medium Term;
Section 7:0 Conclusion; and
Section 8:0 Appendices
1 Unless otherwise defined, The Act in this report refers to the Energy Sector Levies Act, 2015 (Act 899), as amended, 2017 (Act 946)
2018 Annual Report on the ESLA
7
SECTION 2: IMPOSITION AND COLLECTION OF THE LEVIES
4. This section presents a summary of the various levies imposed under the Act, the energy
levies pricing matrix, and the performance of the levies in 2018. The total volume of
products lifted and exemptions granted are also discussed.
2.1 IMPOSITION OF THE LEVIES
5. The Energy Sector Levies Act (ESLA) Act 899, enacted in 2015, and as amended Act 946
in 2017, established the EDRL, PSRL, Road Fund Levy, Energy Fund Levy, Public Lighting
and the National Electrification Scheme Levies.
6. The levies were imposed under the Act to effectively manage the hard-core liabilities of
Energy Sector State Owned Enterprises (SOEs), promote investments in the sector,
support road maintenance and the activities of the Energy Commission, without
constraining the National Budget.
7. The imposition of the levies resulted in the consequential amendment and repeal of the
Customs and Excise (Petroleum Taxes and Petroleum Related Levies) Act, 2005 (Act
685) as amended Act 867, Debt Recovery (Tema Oil Refinery Company) Fund Act, 2003
(Act 642), Electricity (Special levies) Act 1995 (Act 497) and the National Petroleum
Authority (Prescribed Petroleum Pricing) Regulations, 2012 (L.I. 2186).
2.2 ENERGY LEVIES PRICING MATRIX
8. The Act imposed various levies on the price per litre (ppl) of petrol, diesel, MGO, fuel oil,
kerosene as well as on the ppkg and ppkwh of LPG and Electricity respectively. The
levies were applied as follows:
i. EDRL – A levy of GH¢0.41/ppl was imposed on petrol and diesel, GH¢0.03/ppl
on MGO, GH¢0.04/ppl on Fuel Oil and GH¢0.37/ppkg on LPG.
ii. Road Fund Levy – The ESLA applies a levy of GH¢0.40/ppl on petrol/diesel. Prior
to the ESLA, the NPA’s Prescribed Petroleum Pricing Regulations, 2012 (PPPR)
applied a rate of GH¢0.07/ppl of petrol and diesel. The rate was increased under
the ESLA to supplement funding from the budget in support of road maintenance.
2018 Annual Report on the ESLA
8
iii. Energy Fund Levy – GH¢0.01/ppl was levied on petrol, diesel, kerosene and
fuel oil to support the Energy Commission’s activities. Prior to the establishment
of the ESLA, a levy of GH¢0.0005 was applied under the PPPR.
iv. PSRL – A rate of GH¢0.12/ppl was imposed on petrol while GH¢0.10/ppl and
GH¢0.10/ppkg were applied on diesel and LPG respectively. The levy was imposed
to provide buffer for under recoveries or subsidies to stabilize petroleum prices
for the consumer.
v. PLL – A rate of 3.0% is applied on the ppkWh of electricity consumed. The rate
was initially pegged at 5%/ppkWh. This was however revised downwards to
3%/ppkWh in the amendment of the ESLA Act 946 to provide some relief to
consumers.
vi. NESL – A rate of 2.0% is applied on the ppkWh of electricity consumed. The rate was
initially pegged at 5%/ppkWh. This was however revised downwards to 2%/ppkWh in
the amendment of the ESLA Act 946 to provide some relief to consumers.
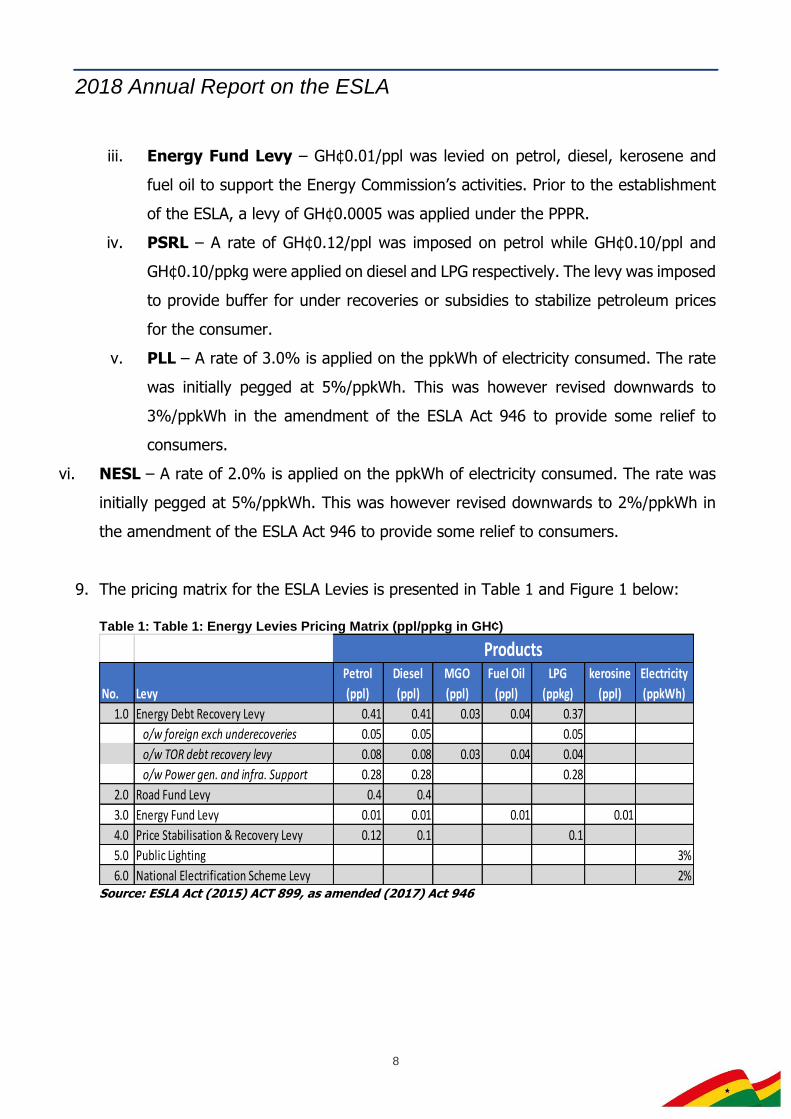
9. The pricing matrix for the ESLA Levies is presented in Table 1 and Figure 1 below:
Table 1: Table 1: Energy Levies Pricing Matrix (ppl/ppkg in GH¢)
Source: ESLA Act (2015) ACT 899, as amended (2017) Act 946
No. Levy
Petrol
(ppl)
Diesel
(ppl)
MGO
(ppl)
Fuel Oil
(ppl)
LPG
(ppkg)
kerosine
(ppl)
Electricity
(ppkWh)
1.0 Energy Debt Recovery Levy 0.41 0.41 0.03 0.04 0.37
o/w foreign exch underecoveries 0.05 0.05 0.05
o/w TOR debt recovery levy 0.08 0.08 0.03 0.04 0.04
o/w Power gen. and infra. Support 0.28 0.28 0.28
2.0 Road Fund Levy 0.4 0.4
3.0 Energy Fund Levy 0.01 0.01 0.01 0.01
4.0 Price Stabilisation & Recovery Levy 0.12 0.1 0.1
5.0 Public Lighting 3%
6.0 National Electrification Scheme Levy 2%
Products
2018 Annual Report on the ESLA
9
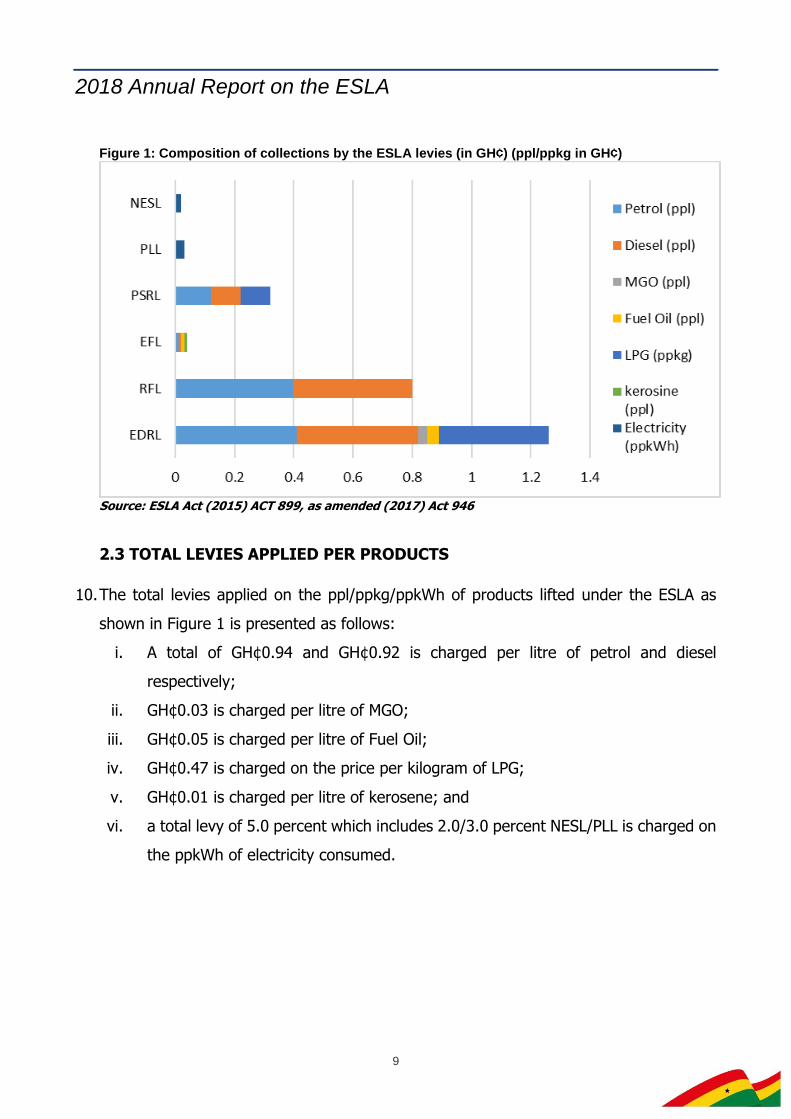
Figure 1: Composition of collections by the ESLA levies (in GH¢) (ppl/ppkg in GH¢)
Source: ESLA Act (2015) ACT 899, as amended (2017) Act 946
2.3 TOTAL LEVIES APPLIED PER PRODUCTS
10. The total levies applied on the ppl/ppkg/ppkWh of products lifted under the ESLA as
shown in Figure 1 is presented as follows:
i. A total of GH¢0.94 and GH¢0.92 is charged per litre of petrol and diesel
respectively;
ii. GH¢0.03 is charged per litre of MGO;
iii. GH¢0.05 is charged per litre of Fuel Oil;
iv. GH¢0.47 is charged on the price per kilogram of LPG;
v. GH¢0.01 is charged per litre of kerosene; and
vi. a total levy of 5.0 percent which includes 2.0/3.0 percent NESL/PLL is charged on
the ppkWh of electricity consumed.
2018 Annual Report on the ESLA
10
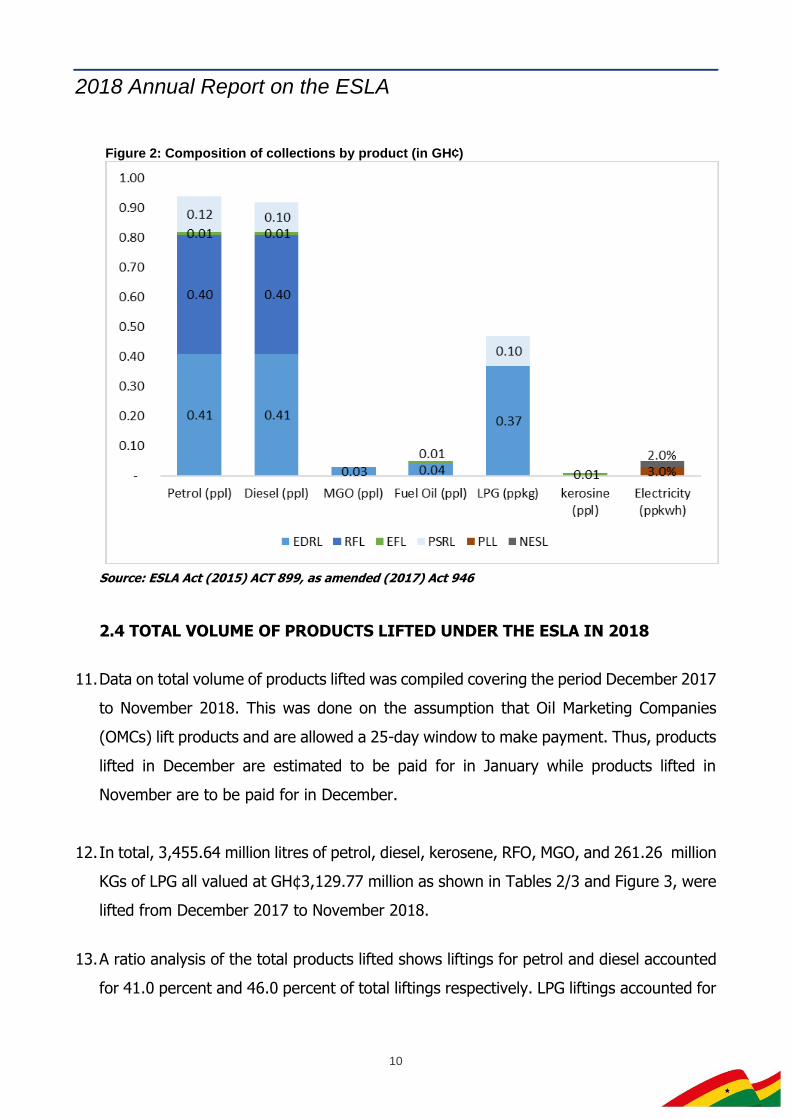
Figure 2: Composition of collections by product (in GH¢)
Source: ESLA Act (2015) ACT 899, as amended (2017) Act 946
2.4 TOTAL VOLUME OF PRODUCTS LIFTED UNDER THE ESLA IN 2018
11. Data on total volume of products lifted was compiled covering the period December 2017
to November 2018. This was done on the assumption that Oil Marketing Companies
(OMCs) lift products and are allowed a 25-day window to make payment. Thus, products
lifted in December are estimated to be paid for in January while products lifted in
November are to be paid for in December.
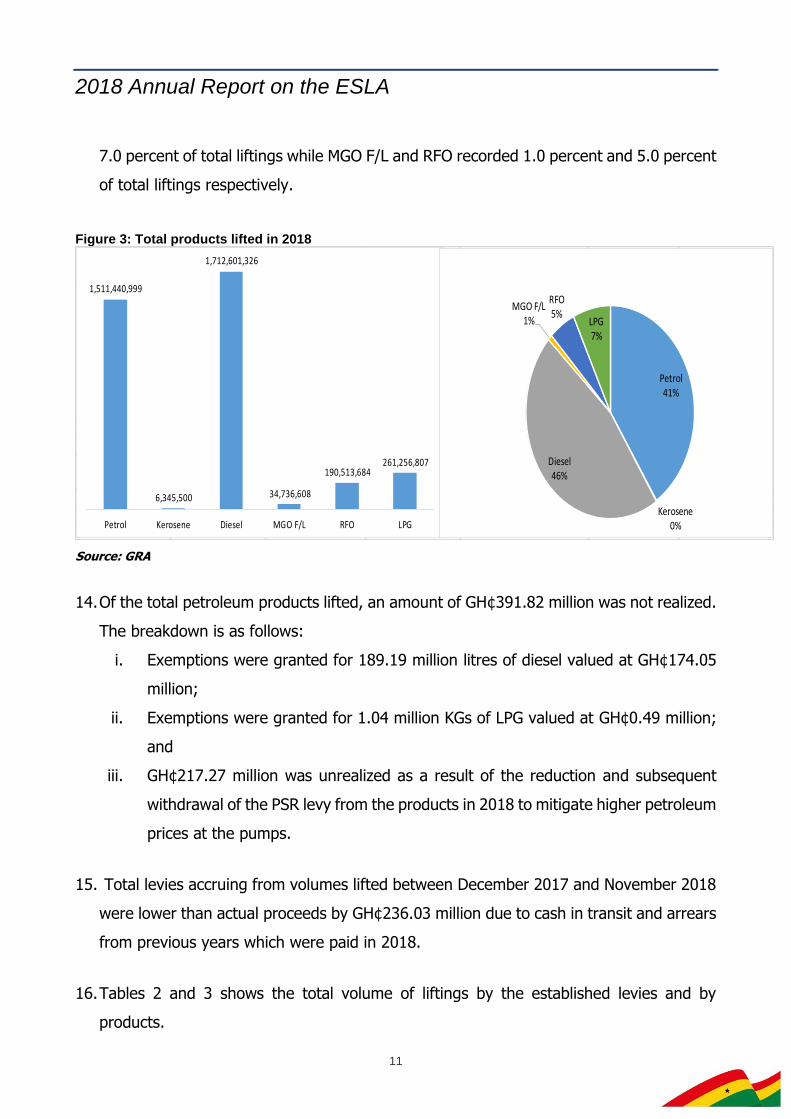
12. In total, 3,455.64 million litres of petrol, diesel, kerosene, RFO, MGO, and 261.26 million
KGs of LPG all valued at GH¢3,129.77 million as shown in Tables 2/3 and Figure 3, were
lifted from December 2017 to November 2018.
13. A ratio analysis of the total products lifted shows liftings for petrol and diesel accounted
for 41.0 percent and 46.0 percent of total liftings respectively. LPG liftings accounted for
2018 Annual Report on the ESLA
11
7.0 percent of total liftings while MGO F/L and RFO recorded 1.0 percent and 5.0 percent
of total liftings respectively.
Figure 3: Total products lifted in 2018
Source: GRA
14. Of the total petroleum products lifted, an amount of GH¢391.82 million was not realized.
The breakdown is as follows:
i. Exemptions were granted for 189.19 million litres of diesel valued at GH¢174.05
million;
ii. Exemptions were granted for 1.04 million KGs of LPG valued at GH¢0.49 million;
and
iii. GH¢217.27 million was unrealized as a result of the reduction and subsequent
withdrawal of the PSR levy from the products in 2018 to mitigate higher petroleum
prices at the pumps.
15. Total levies accruing from volumes lifted between December 2017 and November 2018
were lower than actual proceeds by GH¢236.03 million due to cash in transit and arrears
from previous years which were paid in 2018.
16. Tables 2 and 3 shows the total volume of liftings by the established levies and by
products.
1,511,440,999
6,345,500
1,712,601,326
34,736,608
190,513,684 261,256,807
Petrol Kerosene Diesel MGO F/L RFO LPG
Petrol41%
Kerosene0%
Diesel46%
MGO F/L1%
RFO5%
LPG7%
2018 Annual Report on the ESLA
12
Table 2: Total liftings by the established ESLA Levies (in GH¢)
Source: Computed based on GRA volumes
Table 3: Total liftings by Products
Source: Computed based on GRA volumes
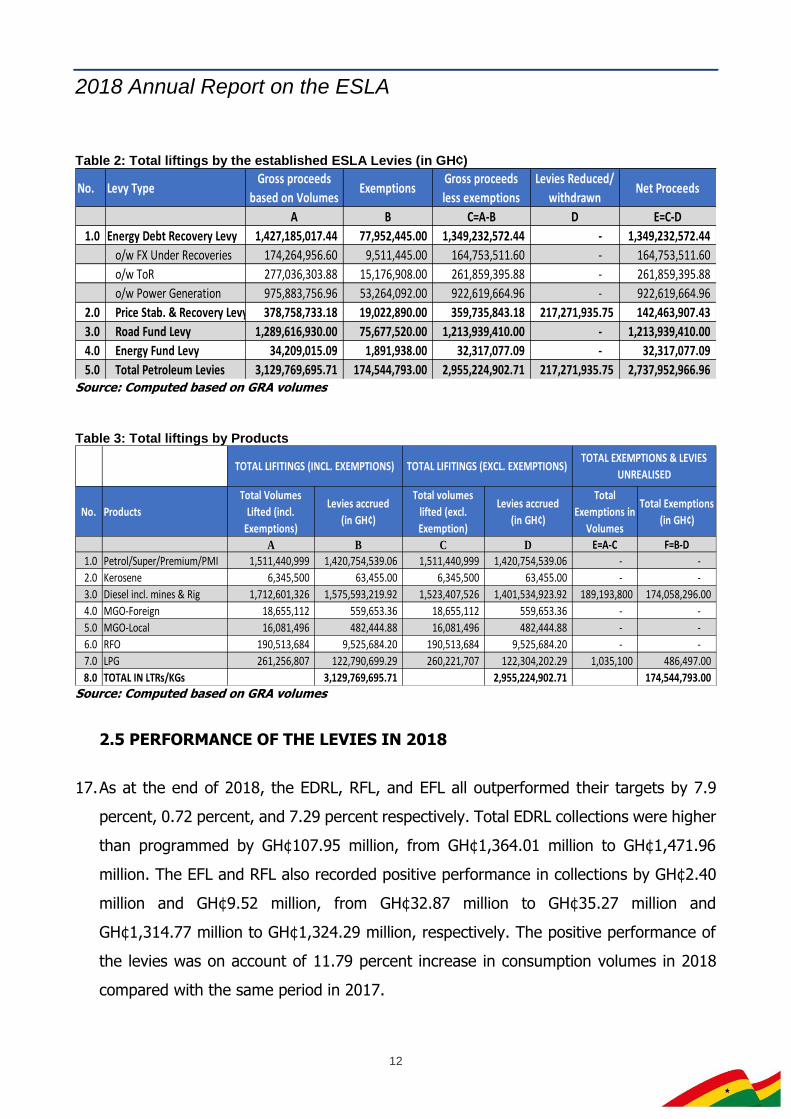
2.5 PERFORMANCE OF THE LEVIES IN 2018
17. As at the end of 2018, the EDRL, RFL, and EFL all outperformed their targets by 7.9
percent, 0.72 percent, and 7.29 percent respectively. Total EDRL collections were higher
than programmed by GH¢107.95 million, from GH¢1,364.01 million to GH¢1,471.96
million. The EFL and RFL also recorded positive performance in collections by GH¢2.40
million and GH¢9.52 million, from GH¢32.87 million to GH¢35.27 million and
GH¢1,314.77 million to GH¢1,324.29 million, respectively. The positive performance of
the levies was on account of 11.79 percent increase in consumption volumes in 2018
compared with the same period in 2017.
No. Levy TypeGross proceeds
based on VolumesExemptions
Gross proceeds
less exemptions
Levies Reduced/
withdrawnNet Proceeds
A B C=A-B D E=C-D
1.0 Energy Debt Recovery Levy 1,427,185,017.44 77,952,445.00 1,349,232,572.44 - 1,349,232,572.44
o/w FX Under Recoveries 174,264,956.60 9,511,445.00 164,753,511.60 - 164,753,511.60
o/w ToR 277,036,303.88 15,176,908.00 261,859,395.88 - 261,859,395.88
o/w Power Generation 975,883,756.96 53,264,092.00 922,619,664.96 - 922,619,664.96
2.0 Price Stab. & Recovery Levy 378,758,733.18 19,022,890.00 359,735,843.18 217,271,935.75 142,463,907.43
3.0 Road Fund Levy 1,289,616,930.00 75,677,520.00 1,213,939,410.00 - 1,213,939,410.00
4.0 Energy Fund Levy 34,209,015.09 1,891,938.00 32,317,077.09 - 32,317,077.09
5.0 Total Petroleum Levies 3,129,769,695.71 174,544,793.00 2,955,224,902.71 217,271,935.75 2,737,952,966.96
No. Products
Total Volumes
Lifted (incl.
Exemptions)
Levies accrued
(in GH¢)
Total volumes
lifted (excl.
Exemption)
Levies accrued
(in GH¢)
Total
Exemptions in
Volumes
Total Exemptions
(in GH¢)
A B C D E=A-C F=B-D
1.0 Petrol/Super/Premium/PMI 1,511,440,999 1,420,754,539.06 1,511,440,999 1,420,754,539.06 - -
2.0 Kerosene 6,345,500 63,455.00 6,345,500 63,455.00 - -
3.0 Diesel incl. mines & Rig 1,712,601,326 1,575,593,219.92 1,523,407,526 1,401,534,923.92 189,193,800 174,058,296.00
4.0 MGO-Foreign 18,655,112 559,653.36 18,655,112 559,653.36 - -
5.0 MGO-Local 16,081,496 482,444.88 16,081,496 482,444.88 - -
6.0 RFO 190,513,684 9,525,684.20 190,513,684 9,525,684.20 - -
7.0 LPG 261,256,807 122,790,699.29 260,221,707 122,304,202.29 1,035,100 486,497.00
8.0 TOTAL IN LTRs/KGs 3,129,769,695.71 2,955,224,902.71 174,544,793.00
TOTAL EXEMPTIONS & LEVIES
UNREALISEDTOTAL LIFITINGS (INCL. EXEMPTIONS) TOTAL LIFITINGS (EXCL. EXEMPTIONS)
2018 Annual Report on the ESLA
13
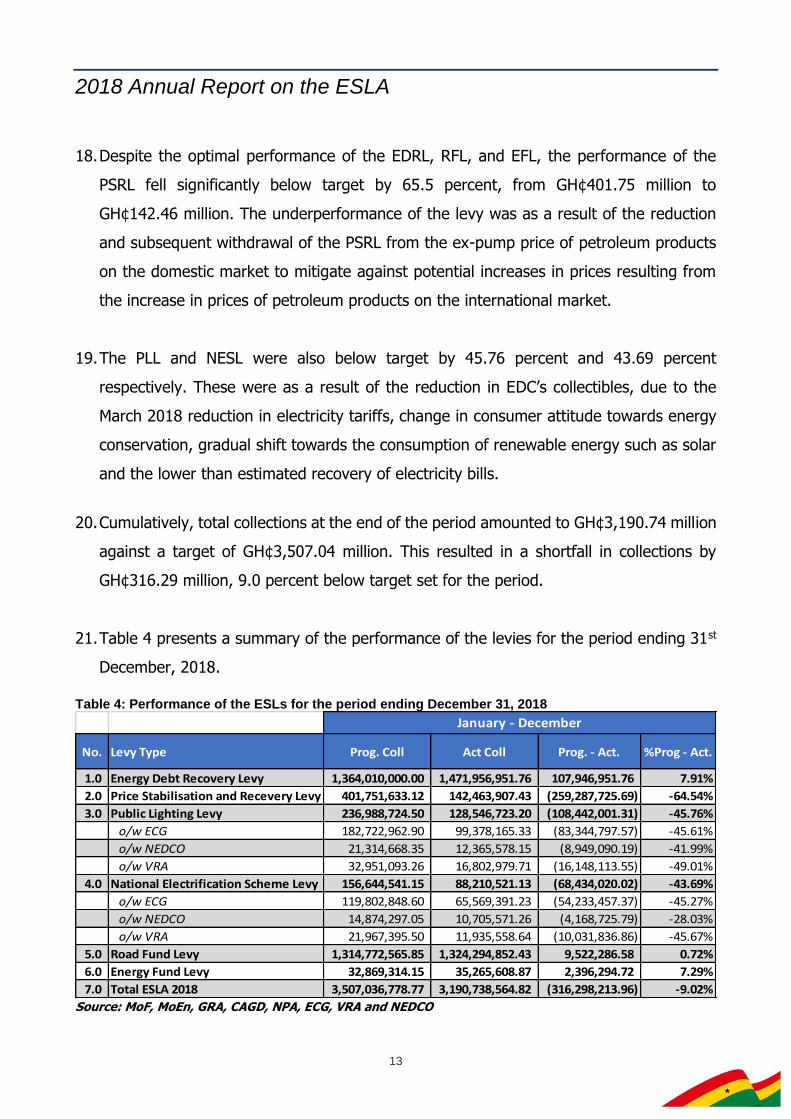
18. Despite the optimal performance of the EDRL, RFL, and EFL, the performance of the
PSRL fell significantly below target by 65.5 percent, from GH¢401.75 million to
GH¢142.46 million. The underperformance of the levy was as a result of the reduction
and subsequent withdrawal of the PSRL from the ex-pump price of petroleum products
on the domestic market to mitigate against potential increases in prices resulting from
the increase in prices of petroleum products on the international market.
19. The PLL and NESL were also below target by 45.76 percent and 43.69 percent
respectively. These were as a result of the reduction in EDC’s collectibles, due to the
March 2018 reduction in electricity tariffs, change in consumer attitude towards energy
conservation, gradual shift towards the consumption of renewable energy such as solar
and the lower than estimated recovery of electricity bills.
20. Cumulatively, total collections at the end of the period amounted to GH¢3,190.74 million
against a target of GH¢3,507.04 million. This resulted in a shortfall in collections by
GH¢316.29 million, 9.0 percent below target set for the period.
21. Table 4 presents a summary of the performance of the levies for the period ending 31st
December, 2018.
Table 4: Performance of the ESLs for the period ending December 31, 2018
Source: MoF, MoEn, GRA, CAGD, NPA, ECG, VRA and NEDCO
No. Levy Type Prog. Coll Act Coll Prog. - Act. %Prog - Act.
1.0 Energy Debt Recovery Levy 1,364,010,000.00 1,471,956,951.76 107,946,951.76 7.91%
2.0 Price Stabilisation and Recevery Levy 401,751,633.12 142,463,907.43 (259,287,725.69) -64.54%
3.0 Public Lighting Levy 236,988,724.50 128,546,723.20 (108,442,001.31) -45.76%
o/w ECG 182,722,962.90 99,378,165.33 (83,344,797.57) -45.61%
o/w NEDCO 21,314,668.35 12,365,578.15 (8,949,090.19) -41.99%
o/w VRA 32,951,093.26 16,802,979.71 (16,148,113.55) -49.01%
4.0 National Electrification Scheme Levy 156,644,541.15 88,210,521.13 (68,434,020.02) -43.69%
o/w ECG 119,802,848.60 65,569,391.23 (54,233,457.37) -45.27%
o/w NEDCO 14,874,297.05 10,705,571.26 (4,168,725.79) -28.03%
o/w VRA 21,967,395.50 11,935,558.64 (10,031,836.86) -45.67%
5.0 Road Fund Levy 1,314,772,565.85 1,324,294,852.43 9,522,286.58 0.72%
6.0 Energy Fund Levy 32,869,314.15 35,265,608.87 2,396,294.72 7.29%
7.0 Total ESLA 2018 3,507,036,778.77 3,190,738,564.82 (316,298,213.96) -9.02%
January - December
2018 Annual Report on the ESLA
14
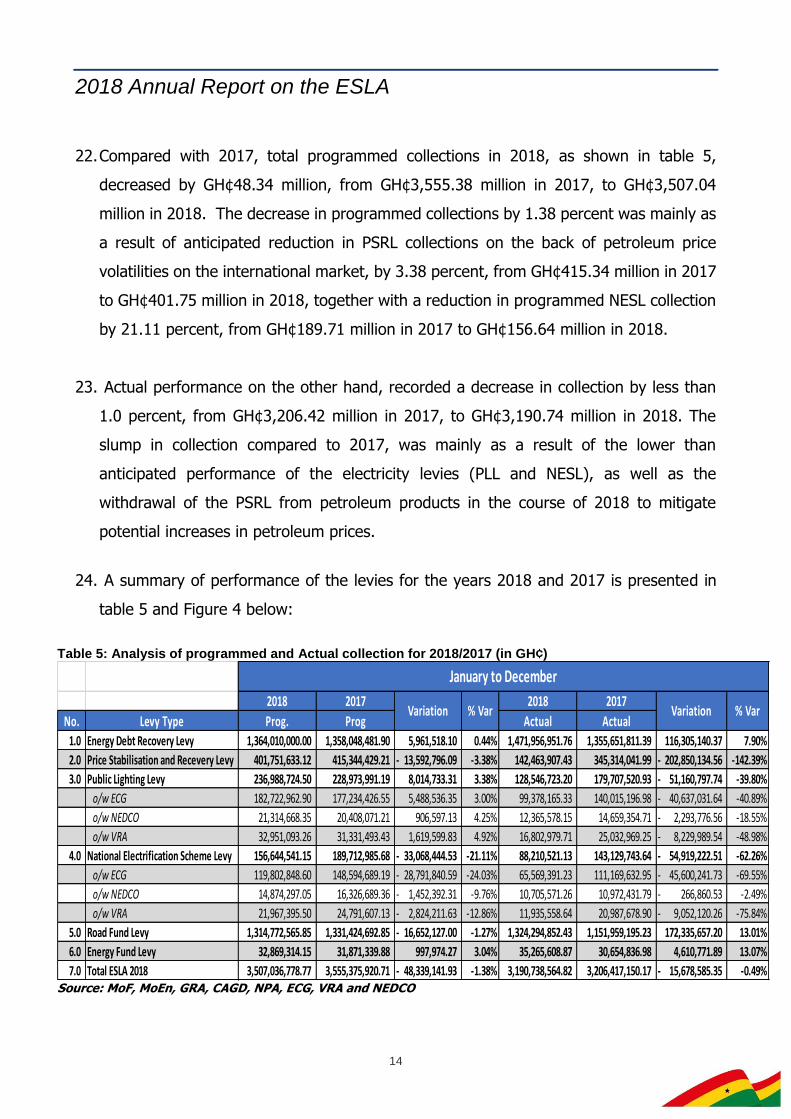
22. Compared with 2017, total programmed collections in 2018, as shown in table 5,
decreased by GH¢48.34 million, from GH¢3,555.38 million in 2017, to GH¢3,507.04
million in 2018. The decrease in programmed collections by 1.38 percent was mainly as
a result of anticipated reduction in PSRL collections on the back of petroleum price
volatilities on the international market, by 3.38 percent, from GH¢415.34 million in 2017
to GH¢401.75 million in 2018, together with a reduction in programmed NESL collection
by 21.11 percent, from GH¢189.71 million in 2017 to GH¢156.64 million in 2018.
23. Actual performance on the other hand, recorded a decrease in collection by less than
1.0 percent, from GH¢3,206.42 million in 2017, to GH¢3,190.74 million in 2018. The
slump in collection compared to 2017, was mainly as a result of the lower than
anticipated performance of the electricity levies (PLL and NESL), as well as the
withdrawal of the PSRL from petroleum products in the course of 2018 to mitigate
potential increases in petroleum prices.
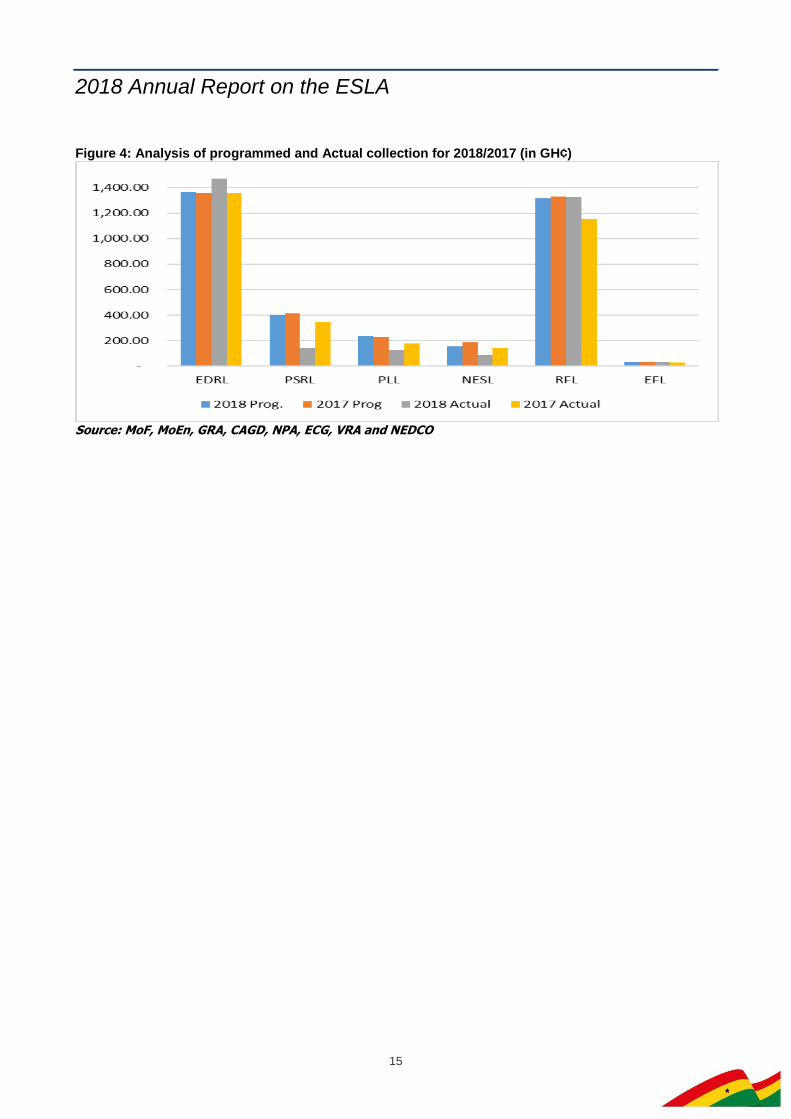
24. A summary of performance of the levies for the years 2018 and 2017 is presented in
table 5 and Figure 4 below:
Table 5: Analysis of programmed and Actual collection for 2018/2017 (in GH¢)
Source: MoF, MoEn, GRA, CAGD, NPA, ECG, VRA and NEDCO
2018 2017 2018 2017
No. Levy Type Prog. Prog Actual Actual
1.0 Energy Debt Recovery Levy 1,364,010,000.00 1,358,048,481.90 5,961,518.10 0.44% 1,471,956,951.76 1,355,651,811.39 116,305,140.37 7.90%
2.0 Price Stabilisation and Recevery Levy 401,751,633.12 415,344,429.21 13,592,796.09- -3.38% 142,463,907.43 345,314,041.99 202,850,134.56- -142.39%
3.0 Public Lighting Levy 236,988,724.50 228,973,991.19 8,014,733.31 3.38% 128,546,723.20 179,707,520.93 51,160,797.74- -39.80%
o/w ECG 182,722,962.90 177,234,426.55 5,488,536.35 3.00% 99,378,165.33 140,015,196.98 40,637,031.64- -40.89%
o/w NEDCO 21,314,668.35 20,408,071.21 906,597.13 4.25% 12,365,578.15 14,659,354.71 2,293,776.56- -18.55%
o/w VRA 32,951,093.26 31,331,493.43 1,619,599.83 4.92% 16,802,979.71 25,032,969.25 8,229,989.54- -48.98%
4.0 National Electrification Scheme Levy 156,644,541.15 189,712,985.68 33,068,444.53- -21.11% 88,210,521.13 143,129,743.64 54,919,222.51- -62.26%
o/w ECG 119,802,848.60 148,594,689.19 28,791,840.59- -24.03% 65,569,391.23 111,169,632.95 45,600,241.73- -69.55%
o/w NEDCO 14,874,297.05 16,326,689.36 1,452,392.31- -9.76% 10,705,571.26 10,972,431.79 266,860.53- -2.49%
o/w VRA 21,967,395.50 24,791,607.13 2,824,211.63- -12.86% 11,935,558.64 20,987,678.90 9,052,120.26- -75.84%
5.0 Road Fund Levy 1,314,772,565.85 1,331,424,692.85 16,652,127.00- -1.27% 1,324,294,852.43 1,151,959,195.23 172,335,657.20 13.01%
6.0 Energy Fund Levy 32,869,314.15 31,871,339.88 997,974.27 3.04% 35,265,608.87 30,654,836.98 4,610,771.89 13.07%
7.0 Total ESLA 2018 3,507,036,778.77 3,555,375,920.71 48,339,141.93- -1.38% 3,190,738,564.82 3,206,417,150.17 15,678,585.35- -0.49%
Variation % Var Variation % Var
January to December
2018 Annual Report on the ESLA
15
Figure 4: Analysis of programmed and Actual collection for 2018/2017 (in GH¢)
Source: MoF, MoEn, GRA, CAGD, NPA, ECG, VRA and NEDCO
2018 Annual Report on the ESLA
16
SECTION 3: ACCOUNTS
25. This section reports on the various accounts established under the ESLA for the purposes
of receiving ESLA levies collected. The accounts existing prior to the ESLA and the
amounts collected/lodged into these accounts are also discussed.
26. The PLL and NESL levies collected under the Act were also required to be transferred to
the MoEn, NEF and EDCs.
3.1 DISTRIBUTION OF THE LEVIES BY THE ACCOUNTS ESTABLISHED UNDER
THE ESLA
27. Sections three (3) to five (5) of the Act establishes three (3) accounts, the Energy Debt
Service Account (EDSA), the Power Generation and Infrastructure Support Sub-Account
(PGISsA), a sub-account of the EDSA, and the Price Stabilisation and Recovery Account
(PSRA). The EDSA and PGISsA were established for the purposes of receiving EDRL
collections. The PSRA was established on the other hand for receiving PSRL collections.
28. In addition to the accounts established under the ESLA, the Minister for Finance, in line
with Section 7 (b) of the ESLA, instructed the CAGD to open and operate the Energy
Debt Recovery Levy Account (EDRLA) for the purposes of receiving and distributing EDRL
collections into the EDSA and PGISsA. The account was created to avoid the comingling
of EDRL collections with other funds that were collected into the Petroleum Collection
Account (PCA) at the Bank of Ghana.
29. At the end of December 2018, a total amount of GH¢1,614.42 million was collected in
respect of the EDSA, PGISsA, and PSRA. Total lodgements into the accounts, on the
other hand amounted to GH¢1,600.47 million. An amount of GH¢13.95 million
accounting for less than 1.0 percent of total collections were not lodged into the three
(3) established accounts. It is expected that this amount would be lodged into the
established accounts in 2019. A breakdown of actual collections and lodgements in
respect of the established accounts is as follows:
2018 Annual Report on the ESLA
17
3.1.1 ENERGY DEBT SERVICE ACCOUNT (EDSA)
30. Section 3 of the Act requires the transfer of 32.0 percent of monies collected under the
Energy Debt Recovery Levy into the EDSA for the debt recovery of Tema Oil Refinery
(TOR) and the payment of downstream petroleum sector foreign exchange under
recoveries.
31. Of the total collections, an amount of GH¢155.89 million of EDRL was programmed
towards the payment of foreign exchange under recoveries. Actual collection was
GH¢179.99 million, while lodgements into the EDSA for forex under recoveries amounted
to GH¢177.36 million. A total amount of GH¢2.63 million which translates into 1.46
percent of levies collected for forex under recovery were not lodged during the period
under review.
32. Similarly, GH¢280.60 million was programmed for collection for the recovery of the TOR
debt. Actual collection amounted to GH¢284.90 million while lodgement amounted to
GH¢281.72 million. A total amount of GH¢3.19 million which translates into 1.12 percent
of levies collected for the recovery of the TOR debt was not lodged.
33. At the end of the period under review, a total amount of GH¢5.81 million of actual levies
collected in respect of the EDSA was not lodged. This is expected to be lodged into the
EDSA in 2019.
3.1.2 POWER GENERATION AND INFRASTRUCTURE SUPPORT SUB-ACCOUNT
34. Section 4 of the Act requires the transfer of 68.0 percent of EDRL collections into the
Power Generation and Infrastructure Support Sub-Account (PGISsA). Prior to the
amendment, the Act also required the transfer of 60.0 percent and 40.0 percent of funds
collected under the National Electrification Scheme Levy (NESL) and the Public Lighting
Levy (PLL) to be transferred into the PGISsA. This was however amended in the Energy
Sector Levies (Amendment) Act, 2017 (Act 946).
2018 Annual Report on the ESLA
18
35. As a result of the amendment, all levies collected in respect of the NESL and PLL were
to be distributed between the Ministry responsible for Power, and the EDCs to support
investments in the provision of public lighting, cover the cost of providing street lighting,
as well as improve access to electricity through the National Electrification Programme.
36. At the end of December 2018, total programmed levies in respect of the PGISsA, as
shown in Table 6, was GH¢927.53 million. Actual collections on the other hand amounted
to GH¢1,007.07 million while total lodgement was GH¢998.93 million.
37. Compared with programmed collections, actual collections exceeded its target by
GH¢28.40 million or 6.51 percent. Total lodgement was lower than actual collection by
GH¢8.14 million or 0.81 percent. The outstanding amount is expected to be lodged into
the Power Generation account after reconciliation in 2019.
3.1.3 PRICE STABILISATION AND RECOVERY ACCOUNT (PSRA)
38. Per the Act, an amount of GH¢0.12/ppl of petrol, GH¢0.10/ppl of diesel and
GH¢0.10/ppkg of LPG is to be collected and transferred into the PSRA to be used as
buffer for under recoveries or subsidies to stabilize petroleum prices for the consumer.
39. At the end of the period under review, an amount of GH¢401.75 million as shown in
Table 6 was estimated for collection into the PSRA. Actual collections and lodgement on
the other hand amounted to GH¢142.63 million. While all the levies on petroleum
products outperformed their target for the year, the amounts collected and lodged into
the PSRA were lower than programmed as a result of the reduction and subsequent
withdrawal of the PSR levies on the ex-pump price of petroleum products to mitigate the
pass-through effect due to high prices of petroleum products on the international market
in 2018.
2018 Annual Report on the ESLA
19
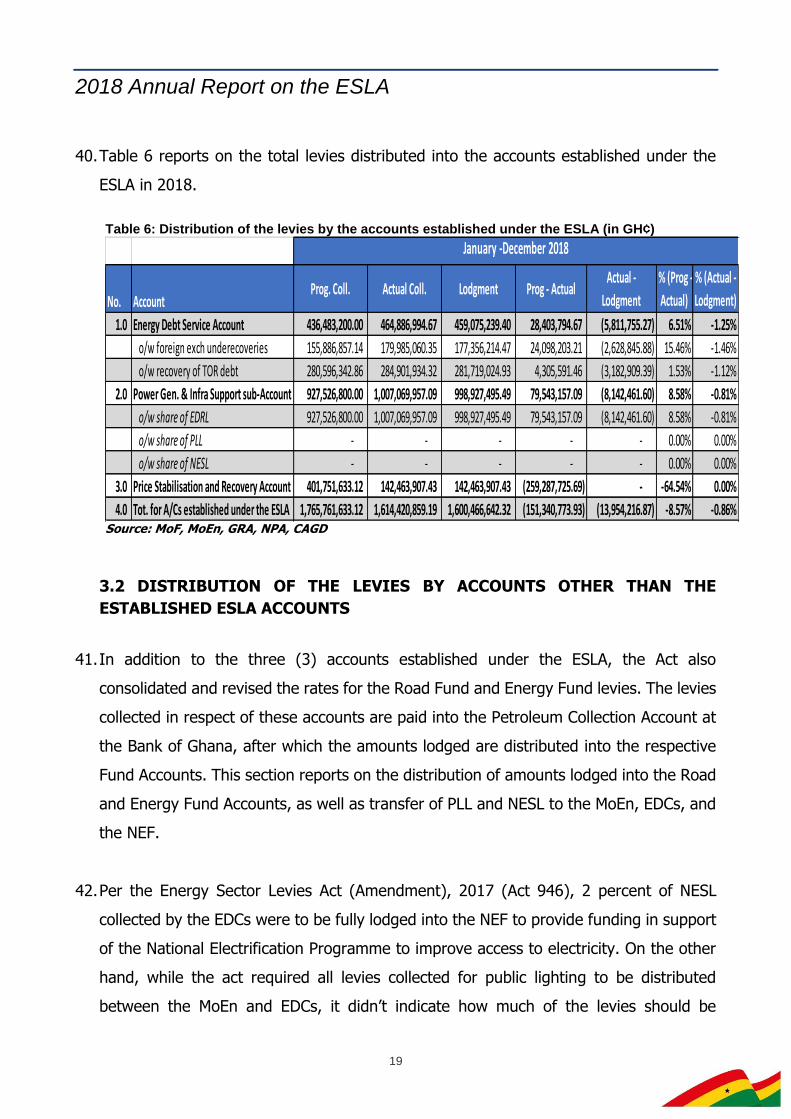
40. Table 6 reports on the total levies distributed into the accounts established under the
ESLA in 2018.
Table 6: Distribution of the levies by the accounts established under the ESLA (in GH¢)
Source: MoF, MoEn, GRA, NPA, CAGD
3.2 DISTRIBUTION OF THE LEVIES BY ACCOUNTS OTHER THAN THE
ESTABLISHED ESLA ACCOUNTS
41. In addition to the three (3) accounts established under the ESLA, the Act also
consolidated and revised the rates for the Road Fund and Energy Fund levies. The levies
collected in respect of these accounts are paid into the Petroleum Collection Account at
the Bank of Ghana, after which the amounts lodged are distributed into the respective
Fund Accounts. This section reports on the distribution of amounts lodged into the Road
and Energy Fund Accounts, as well as transfer of PLL and NESL to the MoEn, EDCs, and
the NEF.
42. Per the Energy Sector Levies Act (Amendment), 2017 (Act 946), 2 percent of NESL
collected by the EDCs were to be fully lodged into the NEF to provide funding in support
of the National Electrification Programme to improve access to electricity. On the other
hand, while the act required all levies collected for public lighting to be distributed
between the MoEn and EDCs, it didn’t indicate how much of the levies should be
No. AccountProg. Coll. Actual Coll. Lodgment Prog - Actual
Actual -
Lodgment
% (Prog -
Actual)
% (Actual -
Lodgment)
1.0 Energy Debt Service Account 436,483,200.00 464,886,994.67 459,075,239.40 28,403,794.67 (5,811,755.27) 6.51% -1.25%
o/w foreign exch underecoveries 155,886,857.14 179,985,060.35 177,356,214.47 24,098,203.21 (2,628,845.88) 15.46% -1.46%
o/w recovery of TOR debt 280,596,342.86 284,901,934.32 281,719,024.93 4,305,591.46 (3,182,909.39) 1.53% -1.12%
2.0 Power Gen. & Infra Support sub-Account 927,526,800.00 1,007,069,957.09 998,927,495.49 79,543,157.09 (8,142,461.60) 8.58% -0.81%
o/w share of EDRL 927,526,800.00 1,007,069,957.09 998,927,495.49 79,543,157.09 (8,142,461.60) 8.58% -0.81%
o/w share of PLL - - - - - 0.00% 0.00%
o/w share of NESL - - - - - 0.00% 0.00%
3.0 Price Stabilisation and Recovery Account 401,751,633.12 142,463,907.43 142,463,907.43 (259,287,725.69) - -64.54% 0.00%
4.0 Tot. for A/Cs established under the ESLA 1,765,761,633.12 1,614,420,859.19 1,600,466,642.32 (151,340,773.93) (13,954,216.87) -8.57% -0.86%
January -December 2018
2018 Annual Report on the ESLA
20
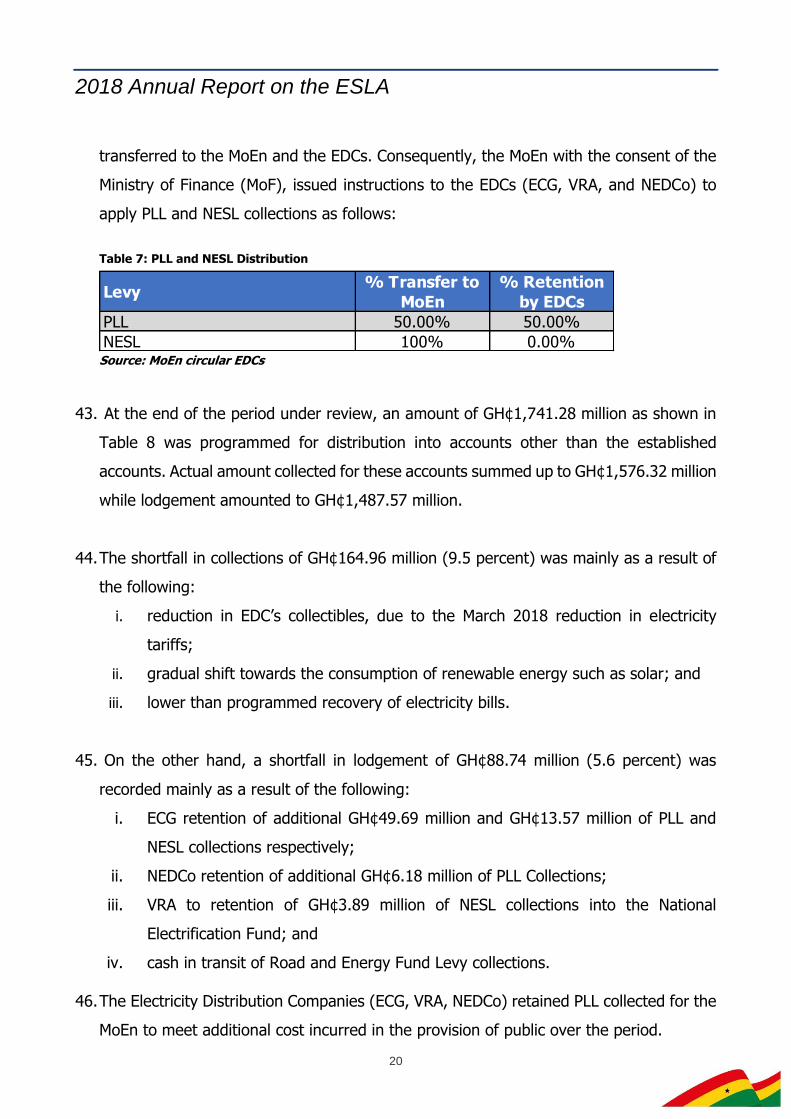
transferred to the MoEn and the EDCs. Consequently, the MoEn with the consent of the
Ministry of Finance (MoF), issued instructions to the EDCs (ECG, VRA, and NEDCo) to
apply PLL and NESL collections as follows:
Table 7: PLL and NESL Distribution
Source: MoEn circular EDCs
43. At the end of the period under review, an amount of GH¢1,741.28 million as shown in
Table 8 was programmed for distribution into accounts other than the established
accounts. Actual amount collected for these accounts summed up to GH¢1,576.32 million
while lodgement amounted to GH¢1,487.57 million.
44. The shortfall in collections of GH¢164.96 million (9.5 percent) was mainly as a result of
the following:
i. reduction in EDC’s collectibles, due to the March 2018 reduction in electricity
tariffs;
ii. gradual shift towards the consumption of renewable energy such as solar; and
iii. lower than programmed recovery of electricity bills.
45. On the other hand, a shortfall in lodgement of GH¢88.74 million (5.6 percent) was
recorded mainly as a result of the following:
i. ECG retention of additional GH¢49.69 million and GH¢13.57 million of PLL and
NESL collections respectively;
ii. NEDCo retention of additional GH¢6.18 million of PLL Collections;
iii. VRA to retention of GH¢3.89 million of NESL collections into the National
Electrification Fund; and
iv. cash in transit of Road and Energy Fund Levy collections.
46. The Electricity Distribution Companies (ECG, VRA, NEDCo) retained PLL collected for the
MoEn to meet additional cost incurred in the provision of public over the period.
Levy% Transfer to
MoEn
% Retention
by EDCs
PLL 50.00% 50.00%
NESL 100% 0.00%
2018 Annual Report on the ESLA
21
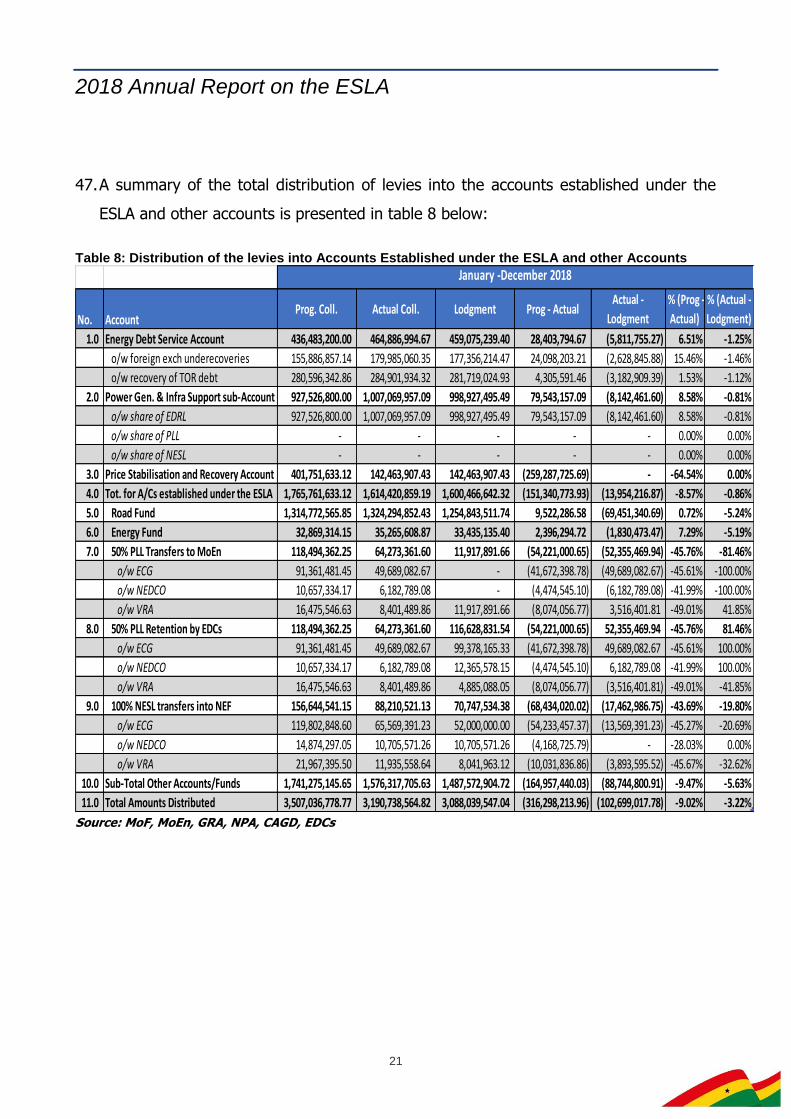
47. A summary of the total distribution of levies into the accounts established under the
ESLA and other accounts is presented in table 8 below:
Table 8: Distribution of the levies into Accounts Established under the ESLA and other Accounts
Source: MoF, MoEn, GRA, NPA, CAGD, EDCs
No. AccountProg. Coll. Actual Coll. Lodgment Prog - Actual
Actual -
Lodgment
% (Prog -
Actual)
% (Actual -
Lodgment)
1.0 Energy Debt Service Account 436,483,200.00 464,886,994.67 459,075,239.40 28,403,794.67 (5,811,755.27) 6.51% -1.25%
o/w foreign exch underecoveries 155,886,857.14 179,985,060.35 177,356,214.47 24,098,203.21 (2,628,845.88) 15.46% -1.46%
o/w recovery of TOR debt 280,596,342.86 284,901,934.32 281,719,024.93 4,305,591.46 (3,182,909.39) 1.53% -1.12%
2.0 Power Gen. & Infra Support sub-Account 927,526,800.00 1,007,069,957.09 998,927,495.49 79,543,157.09 (8,142,461.60) 8.58% -0.81%
o/w share of EDRL 927,526,800.00 1,007,069,957.09 998,927,495.49 79,543,157.09 (8,142,461.60) 8.58% -0.81%
o/w share of PLL - - - - - 0.00% 0.00%
o/w share of NESL - - - - - 0.00% 0.00%
3.0 Price Stabilisation and Recovery Account 401,751,633.12 142,463,907.43 142,463,907.43 (259,287,725.69) - -64.54% 0.00%
4.0 Tot. for A/Cs established under the ESLA 1,765,761,633.12 1,614,420,859.19 1,600,466,642.32 (151,340,773.93) (13,954,216.87) -8.57% -0.86%
5.0 Road Fund 1,314,772,565.85 1,324,294,852.43 1,254,843,511.74 9,522,286.58 (69,451,340.69) 0.72% -5.24%
6.0 Energy Fund 32,869,314.15 35,265,608.87 33,435,135.40 2,396,294.72 (1,830,473.47) 7.29% -5.19%
7.0 50% PLL Transfers to MoEn 118,494,362.25 64,273,361.60 11,917,891.66 (54,221,000.65) (52,355,469.94) -45.76% -81.46%
o/w ECG 91,361,481.45 49,689,082.67 - (41,672,398.78) (49,689,082.67) -45.61% -100.00%
o/w NEDCO 10,657,334.17 6,182,789.08 - (4,474,545.10) (6,182,789.08) -41.99% -100.00%
o/w VRA 16,475,546.63 8,401,489.86 11,917,891.66 (8,074,056.77) 3,516,401.81 -49.01% 41.85%
8.0 50% PLL Retention by EDCs 118,494,362.25 64,273,361.60 116,628,831.54 (54,221,000.65) 52,355,469.94 -45.76% 81.46%
o/w ECG 91,361,481.45 49,689,082.67 99,378,165.33 (41,672,398.78) 49,689,082.67 -45.61% 100.00%
o/w NEDCO 10,657,334.17 6,182,789.08 12,365,578.15 (4,474,545.10) 6,182,789.08 -41.99% 100.00%
o/w VRA 16,475,546.63 8,401,489.86 4,885,088.05 (8,074,056.77) (3,516,401.81) -49.01% -41.85%
9.0 100% NESL transfers into NEF 156,644,541.15 88,210,521.13 70,747,534.38 (68,434,020.02) (17,462,986.75) -43.69% -19.80%
o/w ECG 119,802,848.60 65,569,391.23 52,000,000.00 (54,233,457.37) (13,569,391.23) -45.27% -20.69%
o/w NEDCO 14,874,297.05 10,705,571.26 10,705,571.26 (4,168,725.79) - -28.03% 0.00%
o/w VRA 21,967,395.50 11,935,558.64 8,041,963.12 (10,031,836.86) (3,893,595.52) -45.67% -32.62%
10.0 Sub-Total Other Accounts/Funds 1,741,275,145.65 1,576,317,705.63 1,487,572,904.72 (164,957,440.03) (88,744,800.91) -9.47% -5.63%
11.0 Total Amounts Distributed 3,507,036,778.77 3,190,738,564.82 3,088,039,547.04 (316,298,213.96) (102,699,017.78) -9.02% -3.22%
January -December 2018
2018 Annual Report on the ESLA
22
3.3 OTHER RECEIPTS AND CASH BALANCES FROM 2017
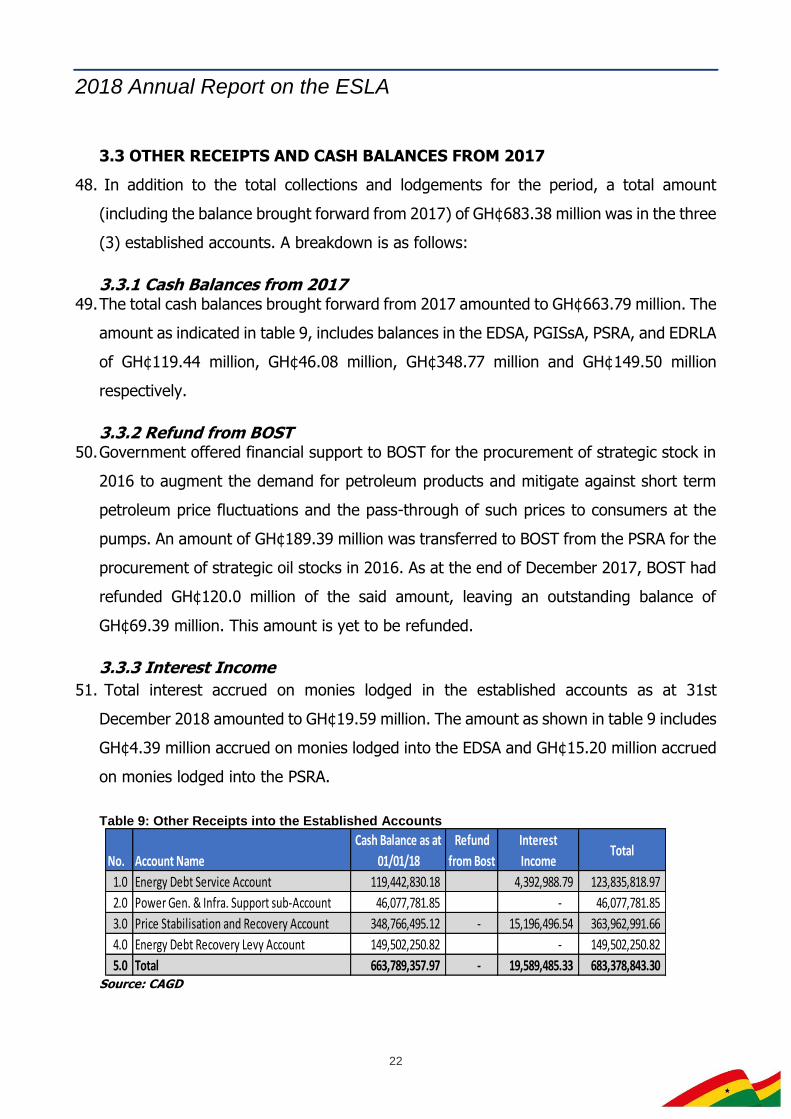
48. In addition to the total collections and lodgements for the period, a total amount
(including the balance brought forward from 2017) of GH¢683.38 million was in the three
(3) established accounts. A breakdown is as follows:
3.3.1 Cash Balances from 2017 49. The total cash balances brought forward from 2017 amounted to GH¢663.79 million. The
amount as indicated in table 9, includes balances in the EDSA, PGISsA, PSRA, and EDRLA
of GH¢119.44 million, GH¢46.08 million, GH¢348.77 million and GH¢149.50 million
respectively.
3.3.2 Refund from BOST 50. Government offered financial support to BOST for the procurement of strategic stock in
2016 to augment the demand for petroleum products and mitigate against short term
petroleum price fluctuations and the pass-through of such prices to consumers at the
pumps. An amount of GH¢189.39 million was transferred to BOST from the PSRA for the
procurement of strategic oil stocks in 2016. As at the end of December 2017, BOST had
refunded GH¢120.0 million of the said amount, leaving an outstanding balance of
GH¢69.39 million. This amount is yet to be refunded.
3.3.3 Interest Income
51. Total interest accrued on monies lodged in the established accounts as at 31st
December 2018 amounted to GH¢19.59 million. The amount as shown in table 9 includes
GH¢4.39 million accrued on monies lodged into the EDSA and GH¢15.20 million accrued
on monies lodged into the PSRA.
Table 9: Other Receipts into the Established Accounts
Source: CAGD
No. Account Name
Cash Balance as at
01/01/18
Refund
from Bost
Interest
IncomeTotal
1.0 Energy Debt Service Account 119,442,830.18 4,392,988.79 123,835,818.97
2.0 Power Gen. & Infra. Support sub-Account 46,077,781.85 - 46,077,781.85
3.0 Price Stabilisation and Recovery Account 348,766,495.12 - 15,196,496.54 363,962,991.66
4.0 Energy Debt Recovery Levy Account 149,502,250.82 - 149,502,250.82
5.0 Total 663,789,357.97 - 19,589,485.33 683,378,843.30
2018 Annual Report on the ESLA
23
SECTION 4: STATUS OF UTILISATION OF THE ENERGY SECTOR
LEVIES
52. The Act requires the utilisation of the Energy Sector Levies collected into the established
accounts mainly for the clearance of the legacy debts of Energy Sector SOEs; power
generation and support for power sector infrastructure; provide subsidy for premix and
RFO, and the stabilisation of petroleum prices.
53. Additionally, levies lodged into accounts outside the established accounts are for road
maintenance, support investments in the provision of public lighting under the National
Electrification Programme, support the activities of the Energy Commission, and to cover
the cost of providing public lighting.
54. While the responsibility for the utilisation of proceeds accruing into the Established
Accounts (EDSA, PGISsA, PSRA), lies with the Minister for Finance, the responsibility for
utilisation of Accounts/Funds outside the established accounts lies with the respective
institutions namely MoEn for 100.0 percent of NESL and 50.0 percent PLL collections,
Ghana Road Fund for Road Fund Levy collections, Energy Commission for Energy Fund
Levies, and EDCs for 50.0 percent of PLL levies collected.
55. At the end of December 2018, total monies utilised from the established and Other ESLA
Accounts/Funds as shown in Table 10, amounted to GH¢2,565.50 million. A breakdown
of utilisation by the Established Accounts, and other Accounts/Funds is summarized
below.
4.1 STATUS OF UTILISATION OF LEVIES LODGED INTO THE ESTABLISHED
ACCOUNTS
56. An amount of GH¢1,667.63 million was utilized from the Established Accounts in 2018.
A breakdown by the accounts is as follows:
2018 Annual Report on the ESLA
24
4.1.1 ENERGY DEBT SERVICE ACCOUNT
57. Section 3 (2) of the Act requires levies collected and lodged into the EDSA to be utilised
on:
a) the debt recovery of the Tema Oil Refinery (TOR); and
b) the payment of downstream petroleum sector foreign exchange under recoveries.
58. For the period under review, a total amount of GH¢468.76 million as shown in Table 10,
was utilised from the Energy Debt Service Account. A breakdown of the payments is as
follows:
a) GH¢468.76 million was paid to E.S.L.A. PLC for the purposes of servicing the ESLA
bond; and
b) GH¢0.001 million in bank charges and commission on transfers.
4.1.2 POWER GENERATION AND INFRASTRUCTURE SUPPORT SUB-ACCOUNT
59. Section 4 (3) of the Act requires that the Power Generation and Infrastructure Support
Sub-Account shall be used for the following purposes:
a) to support the payment of power utility debt;
b) to ensure power supply sustainability to achieve a secure, reliable and quality
electricity supply;
c) for power generation and infrastructure support recoveries; and
d) to support power infrastructure risk mitigation including partial risk guarantees.
60. For the period under review, GH¢952.32 million as shown in Table 10 was utilised for
the payment of power utility debts as well as to support power sector infrastructure. A
breakdown of the payments is as follows:
a) GH¢47.72 million was utilized in settlement of power utility debt;
b) GH¢4.20 million was paid in respect of L/C charges and matured letters of credit;
and
c) GH¢900.41 million transferred to E.S.L.A. PLC in partial settlement of the ESLA
Bond.
2018 Annual Report on the ESLA
25
4.1.3 ENERGY DEBT RECOVERY LEVY ACCOUNT
61. The EDRL was created to avoid the comingling of ESLA funds with other petroleum
related levies in the Petroleum Collection Account. Consequently, EDRL collections are
paid into the EDRLA and subsequently distributed into the EDSA and PGISsA. For the
period under review, an amount of GH¢0.87 million was transferred directly from the
EDRLA to E.S.L.A. PLC. The transfer was towards the servicing of the ESLA bond.
4.1.4 PRICE STABILISATION AND RECOVERY ACCOUNT
62. Section 5 (2) of the Act requires that the Price Stabilisation and Recovery Levy shall be
used as follows:
a) as buffer for under recoveries in the petroleum sector;
b) to stabilise petroleum prices for consumers; and
c) to subsidise premix and residual fuel oil.
63. As at the end of December 2018, an amount of GH¢245.68 million had been utilised.
The amount was used for the payment of outstanding premix and residual fuel oil under
recoveries to BDCs.
64. A summary of the use of the levies lodged in the established accounts is provided in
Table 10.
2018 Annual Report on the ESLA
26
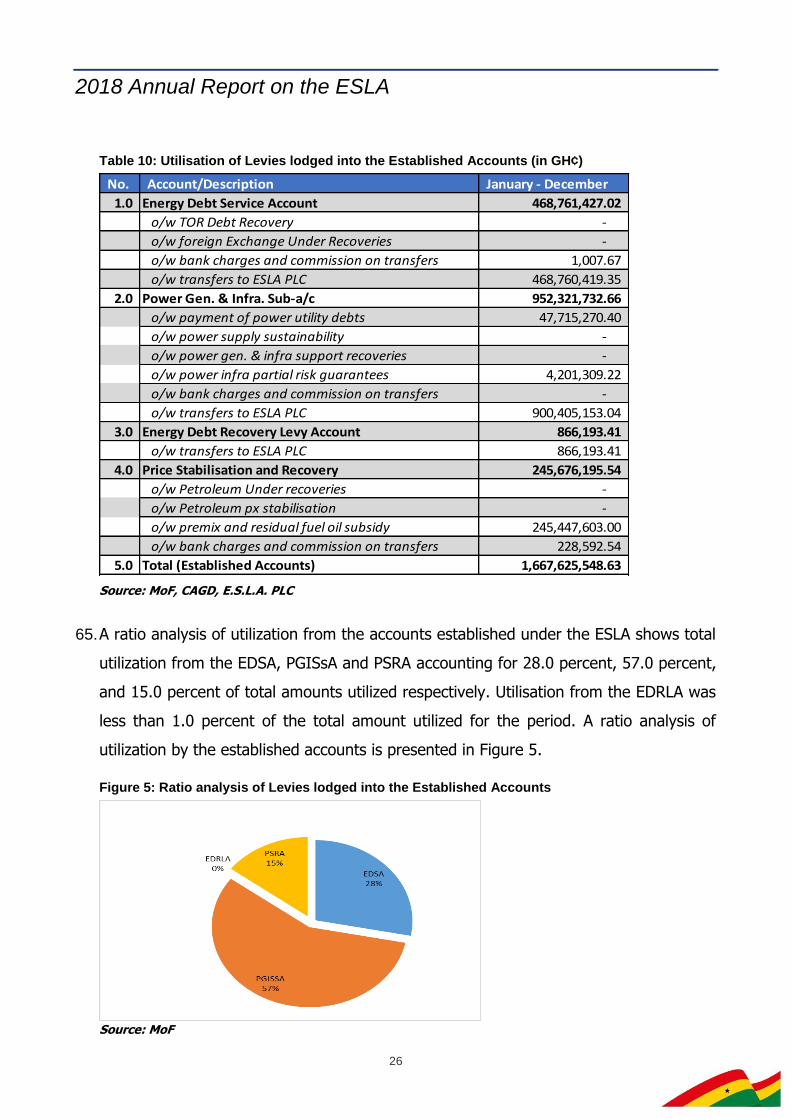
Table 10: Utilisation of Levies lodged into the Established Accounts (in GH¢)
Source: MoF, CAGD, E.S.L.A. PLC
65. A ratio analysis of utilization from the accounts established under the ESLA shows total
utilization from the EDSA, PGISsA and PSRA accounting for 28.0 percent, 57.0 percent,
and 15.0 percent of total amounts utilized respectively. Utilisation from the EDRLA was
less than 1.0 percent of the total amount utilized for the period. A ratio analysis of
utilization by the established accounts is presented in Figure 5.
Figure 5: Ratio analysis of Levies lodged into the Established Accounts
Source: MoF
No. Account/Description January - December
1.0 Energy Debt Service Account 468,761,427.02
o/w TOR Debt Recovery -
o/w foreign Exchange Under Recoveries -
o/w bank charges and commission on transfers 1,007.67
o/w transfers to ESLA PLC 468,760,419.35
2.0 Power Gen. & Infra. Sub-a/c 952,321,732.66
o/w payment of power utility debts 47,715,270.40
o/w power supply sustainability -
o/w power gen. & infra support recoveries -
o/w power infra partial risk guarantees 4,201,309.22
o/w bank charges and commission on transfers -
o/w transfers to ESLA PLC 900,405,153.04
3.0 Energy Debt Recovery Levy Account 866,193.41
o/w transfers to ESLA PLC 866,193.41
4.0 Price Stabilisation and Recovery 245,676,195.54
o/w Petroleum Under recoveries -
o/w Petroleum px stabilisation -
o/w premix and residual fuel oil subsidy 245,447,603.00
o/w bank charges and commission on transfers 228,592.54
5.0 Total (Established Accounts) 1,667,625,548.63
2018 Annual Report on the ESLA
27
4.2 STATUS OF UTILISATION OF THE LEVIES LODGED IN ACCOUNTS OUTSIDE
THE ESTABLISHED ACCOUNTS
4.2.1 ROAD FUND 66. The ESLA requires transfers into the Road Fund to be utilised for road maintenance. In
line with this provision, an amount of GH¢685.50 million as shown in table 11, was
transferred into the Road Fund Account. Of the total amount transferred, the Road Fund
utilised an amount of GH¢622.13 million. This includes an amount of GH¢297.24 million
in debt service to its creditor banks and GH¢324.89 million paid for road maintenance
across the country.
67. Transfer into the Road Fund account was lower than road levies lodged into the
Petroleum Collection Account mainly as a result of the implementation of Government’s
Capping Policy on the Statutory Funds and undistributed Road Fund collections for the
4th quarter of 2018 totalling GH¢569.34 million.
4.2.2 ENERGY FUND 68. As at the end of December 2018, a total amount of GH¢13.07 million as shown in Table
11, was transferred from the Petroleum Collection Account into the Energy Fund Account
at the Bank of Ghana. Of the total amount transferred, the Energy Commission utilised
GH¢9.30 million to support the Commission’s activities throughout the year.
69. Likewise the Road Fund, transfers from the Petroleum Collection Account into the Energy
Fund Account was lower than levies lodged. This was mainly as a result of the
implementation of Government’s Capping Policy and undistributed Energy Fund
collections for the period August to December 2018 of GH¢14.89 million and GH¢5.47
million respectively. The undistributed amounts are expected to be distributed into the
Energy Fund account in 2019.
2018 Annual Report on the ESLA
28
4.2.3 PLL TRANSFERS TO MINISTRY OF ENERGY
70. Of the total PLL levies due the MoEn, GH¢11.92 million was transferred by the EDCs to
the Ministry. MoEn utilised the total receipts on public lighting infrastructure and the
maintenance of Public lights, street lights, traffic lights and highway lights.
4.2.4 NATIONAL ELECTRIFICATION FUND (NEF)
71. Following the amendment of the ESLA, all NESL collections are to be paid into the
National Electrification Fund to support the National Electrification Programme to
improve access to electricity.
72. Out of the total amount of GH¢88.21 million collected for the year, an amount of
GH¢70.75 million was transferred into the National Electrification Fund. Actual utilisation
was however GH¢79.57 million, 12.5 percent higher than lodgements. This was as a
result of a balance of GH¢23.05 million brought forward from 2017.
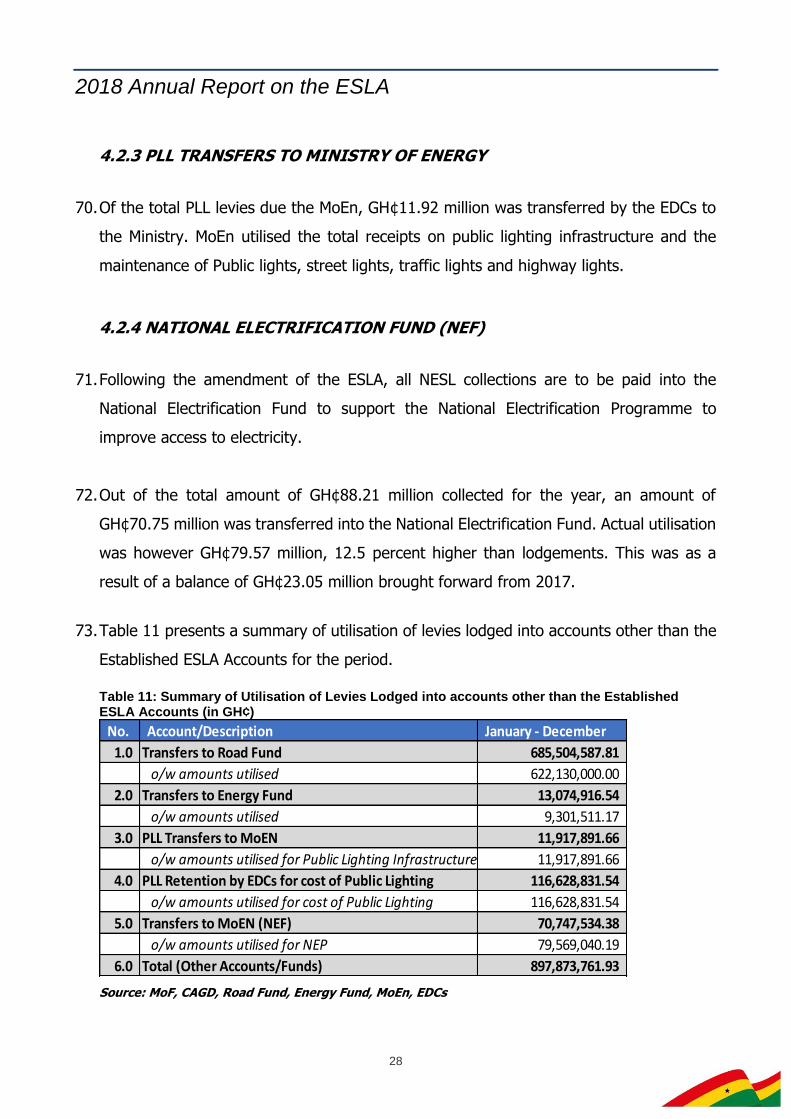
73. Table 11 presents a summary of utilisation of levies lodged into accounts other than the
Established ESLA Accounts for the period.
Table 11: Summary of Utilisation of Levies Lodged into accounts other than the Established ESLA Accounts (in GH¢)
Source: MoF, CAGD, Road Fund, Energy Fund, MoEn, EDCs
No. Account/Description January - December
1.0 Transfers to Road Fund 685,504,587.81
o/w amounts utilised 622,130,000.00
2.0 Transfers to Energy Fund 13,074,916.54
o/w amounts utilised 9,301,511.17
3.0 PLL Transfers to MoEN 11,917,891.66
o/w amounts utilised for Public Lighting Infrastructure 11,917,891.66
4.0 PLL Retention by EDCs for cost of Public Lighting 116,628,831.54
o/w amounts utilised for cost of Public Lighting 116,628,831.54
5.0 Transfers to MoEN (NEF) 70,747,534.38
o/w amounts utilised for NEP 79,569,040.19
6.0 Total (Other Accounts/Funds) 897,873,761.93
2018 Annual Report on the ESLA
29
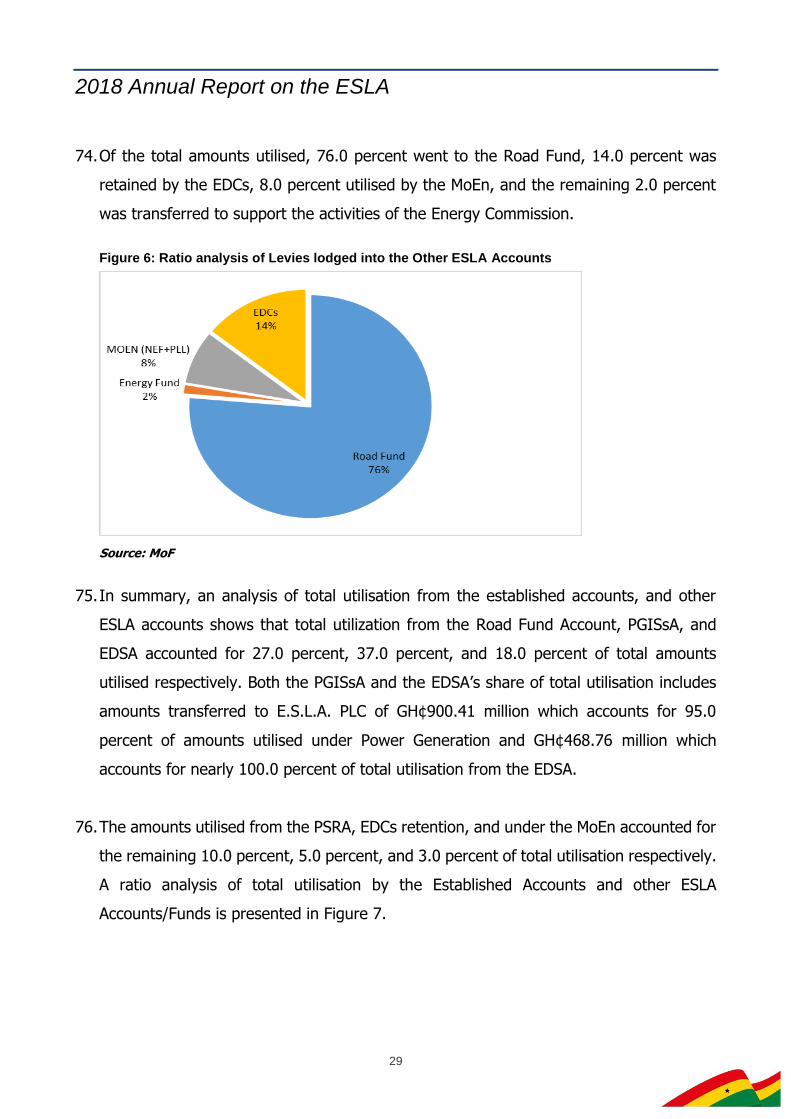
74. Of the total amounts utilised, 76.0 percent went to the Road Fund, 14.0 percent was
retained by the EDCs, 8.0 percent utilised by the MoEn, and the remaining 2.0 percent
was transferred to support the activities of the Energy Commission.
Figure 6: Ratio analysis of Levies lodged into the Other ESLA Accounts
Source: MoF
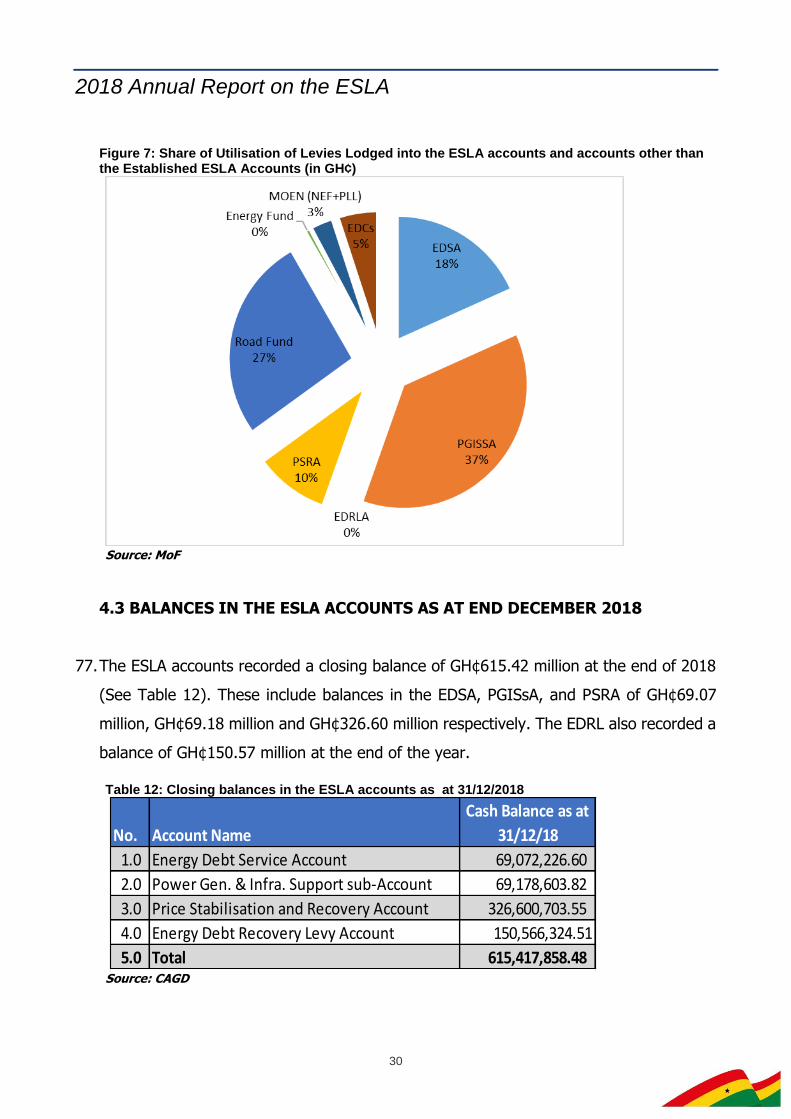
75. In summary, an analysis of total utilisation from the established accounts, and other
ESLA accounts shows that total utilization from the Road Fund Account, PGISsA, and
EDSA accounted for 27.0 percent, 37.0 percent, and 18.0 percent of total amounts
utilised respectively. Both the PGISsA and the EDSA’s share of total utilisation includes
amounts transferred to E.S.L.A. PLC of GH¢900.41 million which accounts for 95.0
percent of amounts utilised under Power Generation and GH¢468.76 million which
accounts for nearly 100.0 percent of total utilisation from the EDSA.
76. The amounts utilised from the PSRA, EDCs retention, and under the MoEn accounted for
the remaining 10.0 percent, 5.0 percent, and 3.0 percent of total utilisation respectively.
A ratio analysis of total utilisation by the Established Accounts and other ESLA
Accounts/Funds is presented in Figure 7.
2018 Annual Report on the ESLA
30
Figure 7: Share of Utilisation of Levies Lodged into the ESLA accounts and accounts other than the Established ESLA Accounts (in GH¢)
Source: MoF
4.3 BALANCES IN THE ESLA ACCOUNTS AS AT END DECEMBER 2018
77. The ESLA accounts recorded a closing balance of GH¢615.42 million at the end of 2018
(See Table 12). These include balances in the EDSA, PGISsA, and PSRA of GH¢69.07
million, GH¢69.18 million and GH¢326.60 million respectively. The EDRL also recorded a
balance of GH¢150.57 million at the end of the year.
Table 12: Closing balances in the ESLA accounts as at 31/12/2018
Source: CAGD
No. Account Name
Cash Balance as at
31/12/18
1.0 Energy Debt Service Account 69,072,226.60
2.0 Power Gen. & Infra. Support sub-Account 69,178,603.82
3.0 Price Stabilisation and Recovery Account 326,600,703.55
4.0 Energy Debt Recovery Levy Account 150,566,324.51
5.0 Total 615,417,858.48
2018 Annual Report on the ESLA
31
SECTION 5: TRANSFERS TO E.S.L.A. PLC AND UTILISATION OF PROCEEDS
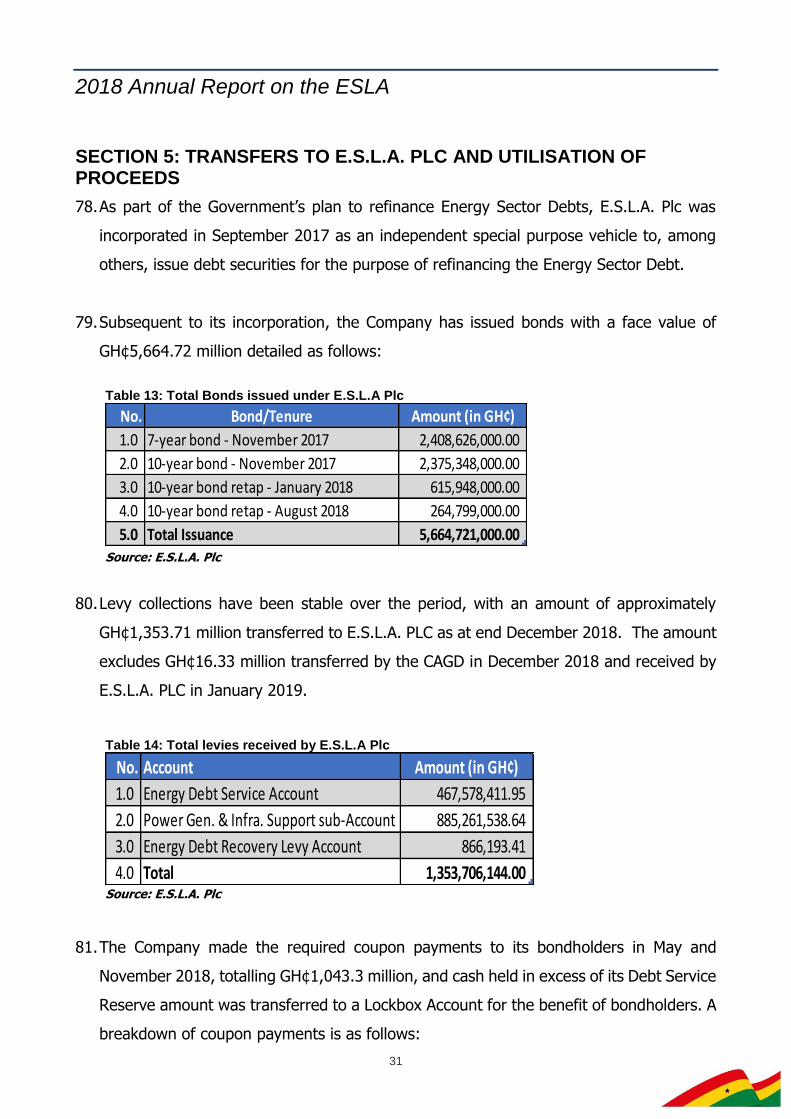
78. As part of the Government’s plan to refinance Energy Sector Debts, E.S.L.A. Plc was
incorporated in September 2017 as an independent special purpose vehicle to, among
others, issue debt securities for the purpose of refinancing the Energy Sector Debt.
79. Subsequent to its incorporation, the Company has issued bonds with a face value of
GH¢5,664.72 million detailed as follows:
Table 13: Total Bonds issued under E.S.L.A Plc
Source: E.S.L.A. Plc
80. Levy collections have been stable over the period, with an amount of approximately
GH¢1,353.71 million transferred to E.S.L.A. PLC as at end December 2018. The amount
excludes GH¢16.33 million transferred by the CAGD in December 2018 and received by
E.S.L.A. PLC in January 2019.
Table 14: Total levies received by E.S.L.A Plc
Source: E.S.L.A. Plc
81. The Company made the required coupon payments to its bondholders in May and
November 2018, totalling GH¢1,043.3 million, and cash held in excess of its Debt Service
Reserve amount was transferred to a Lockbox Account for the benefit of bondholders. A
breakdown of coupon payments is as follows:
No. Bond/Tenure Amount (in GH¢)
1.0 7-year bond - November 2017 2,408,626,000.00
2.0 10-year bond - November 2017 2,375,348,000.00
3.0 10-year bond retap - January 2018 615,948,000.00
4.0 10-year bond retap - August 2018 264,799,000.00
5.0 Total Issuance 5,664,721,000.00
No. Account Amount (in GH¢)
1.0 Energy Debt Service Account 467,578,411.95
2.0 Power Gen. & Infra. Support sub-Account 885,261,538.64
3.0 Energy Debt Recovery Levy Account 866,193.41
4.0 Total 1,353,706,144.00
2018 Annual Report on the ESLA
32
Table 15: ESLA Bonds Debt Service as at December 2018
Source: E.S.L.A. Plc
82. Following the issuance of the bonds, Energy Sector SOE’s debt amounting to
approximately GH¢5,453.20 million has been settled to creditors as at 31st December,
2018.
83. The E.S.L.A. Plc will continue to monitor market activities and further issuance will be
announced, subject to favourable market conditions.
No. Description Amount (in GH¢)
1.0 1st Interest Payments 523,165,823.73
Tranche E1 - May-18 229,954,515.88
Tranche E2 - May-18 293,211,307.85
2.0 2nd Interest Payment 520,168,674.29
Tranche E1 - Oct-18 229,453,748.26
Tranche E2 - Nov-18 290,714,926.03
3.0 Total Debt Service 1,043,334,498.02
2018 Annual Report on the ESLA
33
SECTION 6: FORECAST OF THE LEVIES FOR THE MEDIUM TERM
84. The forecast of the Energy Sector Levies for 2019 – 2022 are based on estimates
submitted by the collecting agencies, namely GRA, NPA, VRA, NEDCo, and ECG. The
projections cover the EDRL, PSRL, PLL, NESL, Road Fund Levy, and the Energy Fund
Levy.
85. A total of GH¢1,609.99 million is programmed for collection in 2019 in respect of the
EDRL. The estimated collection for 2019 represents 18.0 percent increase in collections
compared to the 2018 programmed collections of GH¢1,364.01 million.
86. Total PSRL collection for 2019 is estimated at GH¢450.65 million. The amount, as shown
in Table 16 represents a 12.2 percent increase in estimated collections over the same
period in 2018.
87. Total Road Fund projections for 2019 is estimated at GH¢1,443.19 million. The amount
represents an increase in collections by GH¢128.41 million (9.8 percent) compared with
2018 projection of GH¢1,314.77 million.
88. The projections for Energy Fund also increased by 9.8 percent, from GH¢32.87 million
in 2018 to GH¢36.08 million.
89. The increase in the projected petroleum levies namely EDRL, PSRL, RFL, and EFL is
mainly on account of expected increase in consumption volumes in 2019.
90. With respect to the power sector levies, the projected PLL and NESL are expected to
increase by 4.5 percent and 2.3 percent from GH¢236.99 million to GH¢247.66 million
and GH¢156.64 million to GH¢160.25 million respectively.
91. In total, an amount of GH¢3,947.82 million is estimated for collection under the ESLA in
2019. The amount represents an increase in 2018 collections by GH¢440.78 million, 12.6
percent higher than the projected amount of GH¢3,507.04 million. Table 16 presents a
summary of total projected collections for 2018-2021.
2018 Annual Report on the ESLA
34
Table 16: Forecast of the Energy Sector Levies for the Medium Term (2018-2021) – in GH¢ million
Source: MoF, GRA, NPA, EDCs
2018 2019 2020 2021 2022
No. Levy Type Prog. Prog. Indicative Indicative3 Indicative4 1.0 Energy Debt Recovery Levy 1,364,010,000.00 1,609,992,237.89 1,851,980,398.22 2,129,940,693.28 2,053,301,076.21
2.0 Price Stabilisation and Recevery Levy 401,751,633.12 450,651,223.35 495,716,345.69 545,287,980.25 599,816,778.28
3.0 Public Lighting Levy 236,988,724.50 247,660,997.37 256,196,788.47 268,325,688.35 281,741,972.76
o/w ECG 182,722,962.90 188,423,549.05 194,436,966.22 200,642,297.75 210,674,412.64
o/w NEDCO 21,314,668.35 25,297,822.27 25,508,629.02 25,721,192.43 27,007,252.05
o/w VRA 32,951,093.26 33,939,626.05 36,251,193.23 41,962,198.16 44,060,308.07
4.0 National Electrification Scheme Levy 156,644,541.15 160,250,827.96 165,039,213.66 170,788,564.74 179,327,992.98
o/w ECG 119,802,848.60 122,626,166.03 125,777,600.24 129,010,024.81 135,460,526.05
o/w NEDCO 14,874,297.05 14,998,244.56 15,094,151.27 15,190,671.25 15,950,204.81
o/w VRA 21,967,395.50 22,626,417.37 24,167,462.15 26,587,868.68 27,917,262.11
5.0 Road Fund Levy 1,314,772,565.85 1,443,185,221.63 1,659,524,523.15 1,908,612,455.61 1,840,564,009.57
6.0 Energy Fund Levy 32,869,314.15 36,079,630.54 41,488,113.08 47,715,311.39 41,488,113.08
7.0 Total ESLA 2018 3,507,036,778.77 3,947,820,138.74 4,469,945,382.26 5,070,670,693.62 4,996,239,942.88
2018 Annual Report on the ESLA
35
SECTION 7: CONCLUSION
92. The implementation of the Energy Sector Levies Act, 2015 (Act 899) as amended has
impacted positively on the operations of energy sector SOEs especially over the past 2
years.
93. The setup of the E.S.L.A. Plc, together with the ongoing restructuring of the Energy
Sector SOEs, have significantly reduced the huge profile of hard-core debts which
hitherto impacted significantly on the balance sheets of the SOEs and posed significant
credit and liquidity risk. As at the end 2018, a total of GH¢5,664.72 million of bonds have
been issued to ESLA bondholders with total coupon payments as at end 2018 amounting
to GH¢1,043.00 million.
94. The utilisation of ESLA proceeds in 2018, in addition to the transfers to E.S.L.A. PLC,
have been utilised on the payment of power utility debts, supported power infrastructure
and partial risk guarantees, subsidised premix and residual fuel oil, supported road
maintenance, as well as provided funding for the activities of the Energy Commission.
The electricity levies have also supported the provision of public lighting and support for
the National Electrification Programme to improve access to electricity.
95. Government, through the Ministry of Finance and the stakeholder institutions on the
ESLA is committed to applying the proceeds that accrue from the ESLA levies in the most
efficient manner in order to achieve the objectives of the Act. This will ensure that the
SOEs become competitive and viable in the short to medium term.
2018 Annual Report on the ESLA
36
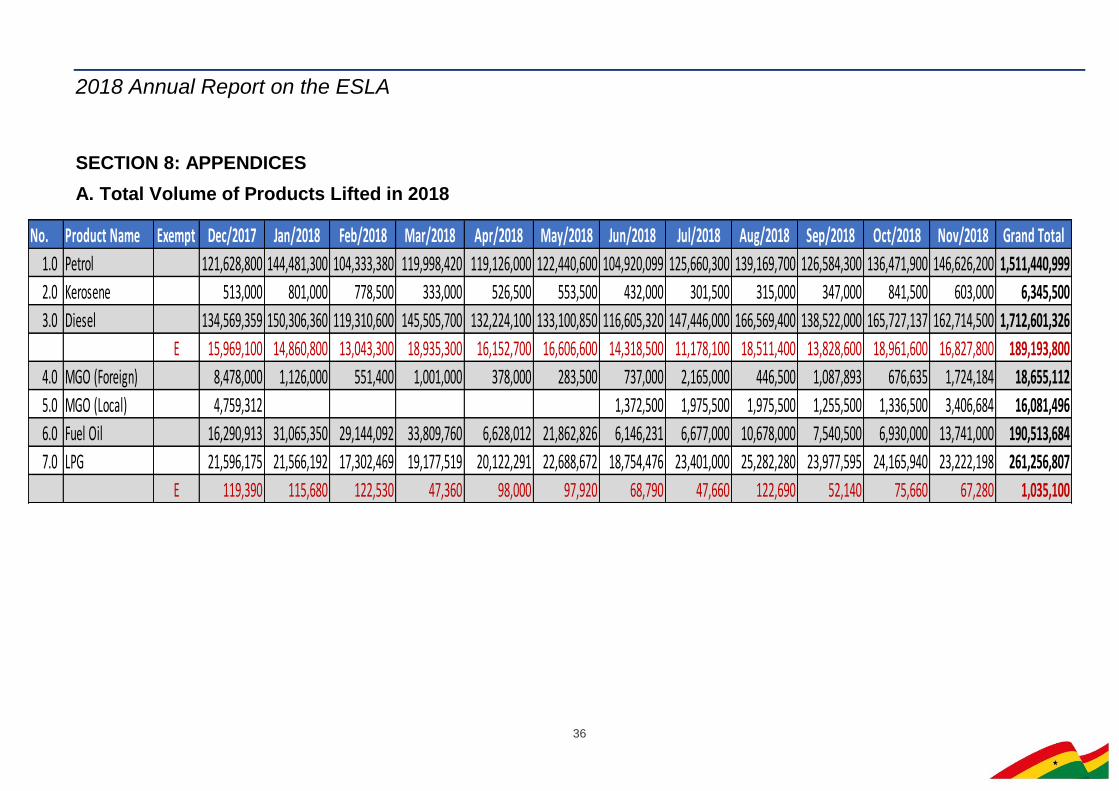
SECTION 8: APPENDICES
A. Total Volume of Products Lifted in 2018
No. Product Name Exempt Dec/2017 Jan/2018 Feb/2018 Mar/2018 Apr/2018 May/2018 Jun/2018 Jul/2018 Aug/2018 Sep/2018 Oct/2018 Nov/2018 Grand Total
1.0 Petrol 121,628,800 144,481,300 104,333,380 119,998,420 119,126,000 122,440,600 104,920,099 125,660,300 139,169,700 126,584,300 136,471,900 146,626,200 1,511,440,999
2.0 Kerosene 513,000 801,000 778,500 333,000 526,500 553,500 432,000 301,500 315,000 347,000 841,500 603,000 6,345,500
3.0 Diesel 134,569,359 150,306,360 119,310,600 145,505,700 132,224,100 133,100,850 116,605,320 147,446,000 166,569,400 138,522,000 165,727,137 162,714,500 1,712,601,326
E 15,969,100 14,860,800 13,043,300 18,935,300 16,152,700 16,606,600 14,318,500 11,178,100 18,511,400 13,828,600 18,961,600 16,827,800 189,193,800
4.0 MGO (Foreign) 8,478,000 1,126,000 551,400 1,001,000 378,000 283,500 737,000 2,165,000 446,500 1,087,893 676,635 1,724,184 18,655,112
5.0 MGO (Local) 4,759,312 1,372,500 1,975,500 1,975,500 1,255,500 1,336,500 3,406,684 16,081,496
6.0 Fuel Oil 16,290,913 31,065,350 29,144,092 33,809,760 6,628,012 21,862,826 6,146,231 6,677,000 10,678,000 7,540,500 6,930,000 13,741,000 190,513,684
7.0 LPG 21,596,175 21,566,192 17,302,469 19,177,519 20,122,291 22,688,672 18,754,476 23,401,000 25,282,280 23,977,595 24,165,940 23,222,198 261,256,807
E 119,390 115,680 122,530 47,360 98,000 97,920 68,790 47,660 122,690 52,140 75,660 67,280 1,035,100
2018 Annual Report on the ESLA
37
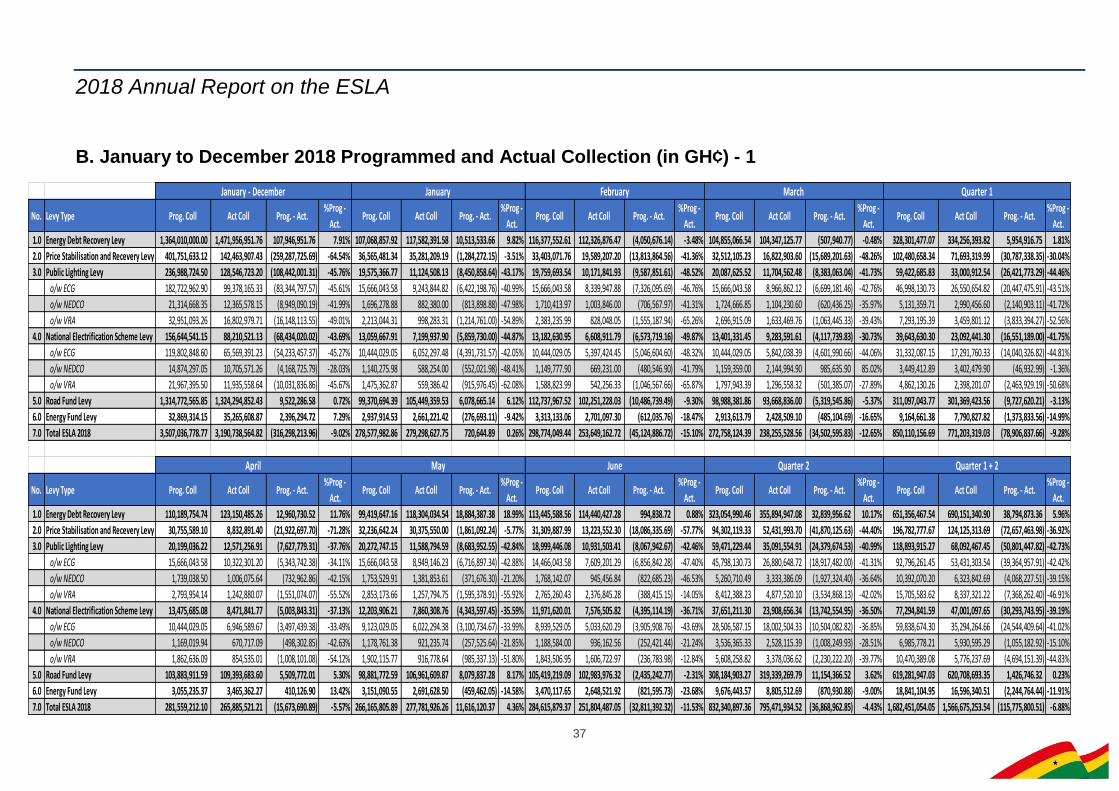
B. January to December 2018 Programmed and Actual Collection (in GH¢) - 1
No. Levy Type Prog. Coll Act Coll Prog. - Act.%Prog -
Act.Prog. Coll Act Coll Prog. - Act.
%Prog -
Act.Prog. Coll Act Coll Prog. - Act.
%Prog -
Act.Prog. Coll Act Coll Prog. - Act.
%Prog -
Act.Prog. Coll Act Coll Prog. - Act.
%Prog -
Act.
1.0 Energy Debt Recovery Levy 1,364,010,000.00 1,471,956,951.76 107,946,951.76 7.91% 107,068,857.92 117,582,391.58 10,513,533.66 9.82% 116,377,552.61 112,326,876.47 (4,050,676.14) -3.48% 104,855,066.54 104,347,125.77 (507,940.77) -0.48% 328,301,477.07 334,256,393.82 5,954,916.75 1.81%
2.0 Price Stabilisation and Recevery Levy 401,751,633.12 142,463,907.43 (259,287,725.69) -64.54% 36,565,481.34 35,281,209.19 (1,284,272.15) -3.51% 33,403,071.76 19,589,207.20 (13,813,864.56) -41.36% 32,512,105.23 16,822,903.60 (15,689,201.63) -48.26% 102,480,658.34 71,693,319.99 (30,787,338.35) -30.04%
3.0 Public Lighting Levy 236,988,724.50 128,546,723.20 (108,442,001.31) -45.76% 19,575,366.77 11,124,508.13 (8,450,858.64) -43.17% 19,759,693.54 10,171,841.93 (9,587,851.61) -48.52% 20,087,625.52 11,704,562.48 (8,383,063.04) -41.73% 59,422,685.83 33,000,912.54 (26,421,773.29) -44.46%
o/w ECG 182,722,962.90 99,378,165.33 (83,344,797.57) -45.61% 15,666,043.58 9,243,844.82 (6,422,198.76) -40.99% 15,666,043.58 8,339,947.88 (7,326,095.69) -46.76% 15,666,043.58 8,966,862.12 (6,699,181.46) -42.76% 46,998,130.73 26,550,654.82 (20,447,475.91) -43.51%
o/w NEDCO 21,314,668.35 12,365,578.15 (8,949,090.19) -41.99% 1,696,278.88 882,380.00 (813,898.88) -47.98% 1,710,413.97 1,003,846.00 (706,567.97) -41.31% 1,724,666.85 1,104,230.60 (620,436.25) -35.97% 5,131,359.71 2,990,456.60 (2,140,903.11) -41.72%
o/w VRA 32,951,093.26 16,802,979.71 (16,148,113.55) -49.01% 2,213,044.31 998,283.31 (1,214,761.00) -54.89% 2,383,235.99 828,048.05 (1,555,187.94) -65.26% 2,696,915.09 1,633,469.76 (1,063,445.33) -39.43% 7,293,195.39 3,459,801.12 (3,833,394.27) -52.56%
4.0 National Electrification Scheme Levy 156,644,541.15 88,210,521.13 (68,434,020.02) -43.69% 13,059,667.91 7,199,937.90 (5,859,730.00) -44.87% 13,182,630.95 6,608,911.79 (6,573,719.16) -49.87% 13,401,331.45 9,283,591.61 (4,117,739.83) -30.73% 39,643,630.30 23,092,441.30 (16,551,189.00) -41.75%
o/w ECG 119,802,848.60 65,569,391.23 (54,233,457.37) -45.27% 10,444,029.05 6,052,297.48 (4,391,731.57) -42.05% 10,444,029.05 5,397,424.45 (5,046,604.60) -48.32% 10,444,029.05 5,842,038.39 (4,601,990.66) -44.06% 31,332,087.15 17,291,760.33 (14,040,326.82) -44.81%
o/w NEDCO 14,874,297.05 10,705,571.26 (4,168,725.79) -28.03% 1,140,275.98 588,254.00 (552,021.98) -48.41% 1,149,777.90 669,231.00 (480,546.90) -41.79% 1,159,359.00 2,144,994.90 985,635.90 85.02% 3,449,412.89 3,402,479.90 (46,932.99) -1.36%
o/w VRA 21,967,395.50 11,935,558.64 (10,031,836.86) -45.67% 1,475,362.87 559,386.42 (915,976.45) -62.08% 1,588,823.99 542,256.33 (1,046,567.66) -65.87% 1,797,943.39 1,296,558.32 (501,385.07) -27.89% 4,862,130.26 2,398,201.07 (2,463,929.19) -50.68%
5.0 Road Fund Levy 1,314,772,565.85 1,324,294,852.43 9,522,286.58 0.72% 99,370,694.39 105,449,359.53 6,078,665.14 6.12% 112,737,967.52 102,251,228.03 (10,486,739.49) -9.30% 98,988,381.86 93,668,836.00 (5,319,545.86) -5.37% 311,097,043.77 301,369,423.56 (9,727,620.21) -3.13%
6.0 Energy Fund Levy 32,869,314.15 35,265,608.87 2,396,294.72 7.29% 2,937,914.53 2,661,221.42 (276,693.11) -9.42% 3,313,133.06 2,701,097.30 (612,035.76) -18.47% 2,913,613.79 2,428,509.10 (485,104.69) -16.65% 9,164,661.38 7,790,827.82 (1,373,833.56) -14.99%
7.0 Total ESLA 2018 3,507,036,778.77 3,190,738,564.82 (316,298,213.96) -9.02% 278,577,982.86 279,298,627.75 720,644.89 0.26% 298,774,049.44 253,649,162.72 (45,124,886.72) -15.10% 272,758,124.39 238,255,528.56 (34,502,595.83) -12.65% 850,110,156.69 771,203,319.03 (78,906,837.66) -9.28%
No. Levy Type Prog. Coll Act Coll Prog. - Act.%Prog -
Act.Prog. Coll Act Coll Prog. - Act.
%Prog -
Act.Prog. Coll Act Coll Prog. - Act.
%Prog -
Act.Prog. Coll Act Coll Prog. - Act.
%Prog -
Act.Prog. Coll Act Coll Prog. - Act.
%Prog -
Act.
1.0 Energy Debt Recovery Levy 110,189,754.74 123,150,485.26 12,960,730.52 11.76% 99,419,647.16 118,304,034.54 18,884,387.38 18.99% 113,445,588.56 114,440,427.28 994,838.72 0.88% 323,054,990.46 355,894,947.08 32,839,956.62 10.17% 651,356,467.54 690,151,340.90 38,794,873.36 5.96%
2.0 Price Stabilisation and Recevery Levy 30,755,589.10 8,832,891.40 (21,922,697.70) -71.28% 32,236,642.24 30,375,550.00 (1,861,092.24) -5.77% 31,309,887.99 13,223,552.30 (18,086,335.69) -57.77% 94,302,119.33 52,431,993.70 (41,870,125.63) -44.40% 196,782,777.67 124,125,313.69 (72,657,463.98) -36.92%
3.0 Public Lighting Levy 20,199,036.22 12,571,256.91 (7,627,779.31) -37.76% 20,272,747.15 11,588,794.59 (8,683,952.55) -42.84% 18,999,446.08 10,931,503.41 (8,067,942.67) -42.46% 59,471,229.44 35,091,554.91 (24,379,674.53) -40.99% 118,893,915.27 68,092,467.45 (50,801,447.82) -42.73%
o/w ECG 15,666,043.58 10,322,301.20 (5,343,742.38) -34.11% 15,666,043.58 8,949,146.23 (6,716,897.34) -42.88% 14,466,043.58 7,609,201.29 (6,856,842.28) -47.40% 45,798,130.73 26,880,648.72 (18,917,482.00) -41.31% 92,796,261.45 53,431,303.54 (39,364,957.91) -42.42%
o/w NEDCO 1,739,038.50 1,006,075.64 (732,962.86) -42.15% 1,753,529.91 1,381,853.61 (371,676.30) -21.20% 1,768,142.07 945,456.84 (822,685.23) -46.53% 5,260,710.49 3,333,386.09 (1,927,324.40) -36.64% 10,392,070.20 6,323,842.69 (4,068,227.51) -39.15%
o/w VRA 2,793,954.14 1,242,880.07 (1,551,074.07) -55.52% 2,853,173.66 1,257,794.75 (1,595,378.91) -55.92% 2,765,260.43 2,376,845.28 (388,415.15) -14.05% 8,412,388.23 4,877,520.10 (3,534,868.13) -42.02% 15,705,583.62 8,337,321.22 (7,368,262.40) -46.91%
4.0 National Electrification Scheme Levy 13,475,685.08 8,471,841.77 (5,003,843.31) -37.13% 12,203,906.21 7,860,308.76 (4,343,597.45) -35.59% 11,971,620.01 7,576,505.82 (4,395,114.19) -36.71% 37,651,211.30 23,908,656.34 (13,742,554.95) -36.50% 77,294,841.59 47,001,097.65 (30,293,743.95) -39.19%
o/w ECG 10,444,029.05 6,946,589.67 (3,497,439.38) -33.49% 9,123,029.05 6,022,294.38 (3,100,734.67) -33.99% 8,939,529.05 5,033,620.29 (3,905,908.76) -43.69% 28,506,587.15 18,002,504.33 (10,504,082.82) -36.85% 59,838,674.30 35,294,264.66 (24,544,409.64) -41.02%
o/w NEDCO 1,169,019.94 670,717.09 (498,302.85) -42.63% 1,178,761.38 921,235.74 (257,525.64) -21.85% 1,188,584.00 936,162.56 (252,421.44) -21.24% 3,536,365.33 2,528,115.39 (1,008,249.93) -28.51% 6,985,778.21 5,930,595.29 (1,055,182.92) -15.10%
o/w VRA 1,862,636.09 854,535.01 (1,008,101.08) -54.12% 1,902,115.77 916,778.64 (985,337.13) -51.80% 1,843,506.95 1,606,722.97 (236,783.98) -12.84% 5,608,258.82 3,378,036.62 (2,230,222.20) -39.77% 10,470,389.08 5,776,237.69 (4,694,151.39) -44.83%
5.0 Road Fund Levy 103,883,911.59 109,393,683.60 5,509,772.01 5.30% 98,881,772.59 106,961,609.87 8,079,837.28 8.17% 105,419,219.09 102,983,976.32 (2,435,242.77) -2.31% 308,184,903.27 319,339,269.79 11,154,366.52 3.62% 619,281,947.03 620,708,693.35 1,426,746.32 0.23%
6.0 Energy Fund Levy 3,055,235.37 3,465,362.27 410,126.90 13.42% 3,151,090.55 2,691,628.50 (459,462.05) -14.58% 3,470,117.65 2,648,521.92 (821,595.73) -23.68% 9,676,443.57 8,805,512.69 (870,930.88) -9.00% 18,841,104.95 16,596,340.51 (2,244,764.44) -11.91%
7.0 Total ESLA 2018 281,559,212.10 265,885,521.21 (15,673,690.89) -5.57% 266,165,805.89 277,781,926.26 11,616,120.37 4.36% 284,615,879.37 251,804,487.05 (32,811,392.32) -11.53% 832,340,897.36 795,471,934.52 (36,868,962.85) -4.43% 1,682,451,054.05 1,566,675,253.54 (115,775,800.51) -6.88%
Quarter 1 + 2
Quarter 1
April May June Quarter 2
January - December January February March
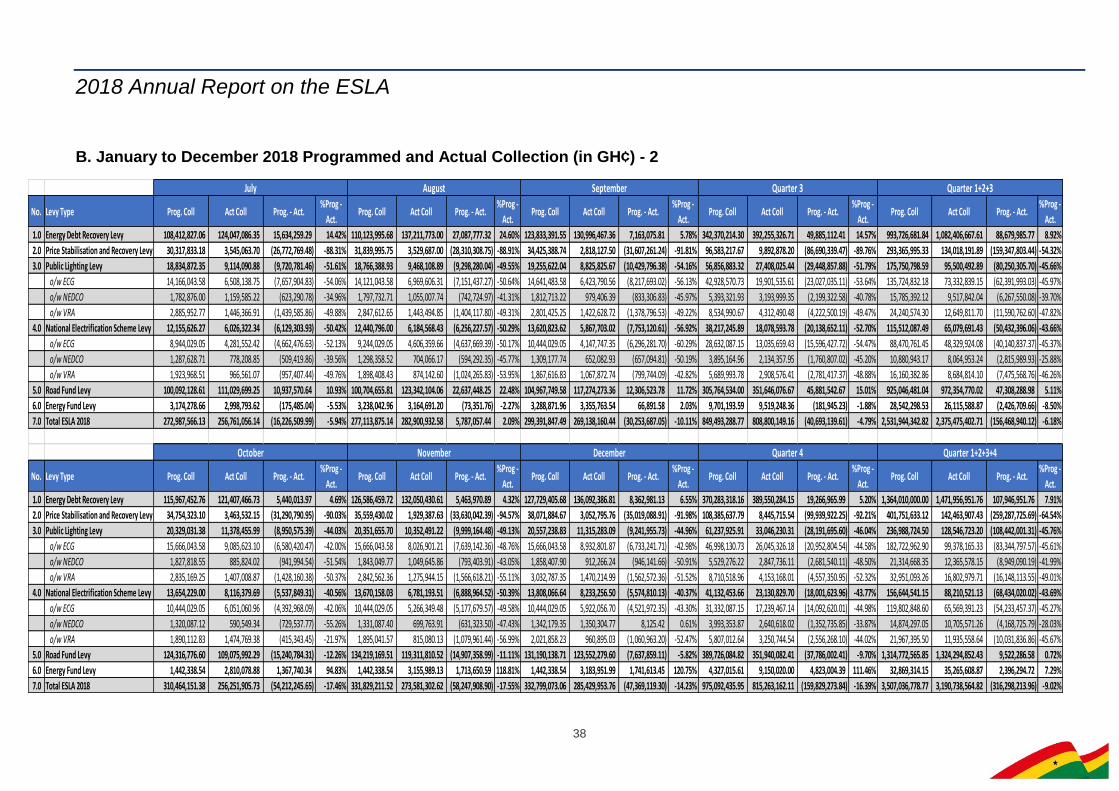
2018 Annual Report on the ESLA
38
B. January to December 2018 Programmed and Actual Collection (in GH¢) - 2
No. Levy Type Prog. Coll Act Coll Prog. - Act.%Prog -
Act.Prog. Coll Act Coll Prog. - Act.
%Prog -
Act.Prog. Coll Act Coll Prog. - Act.
%Prog -
Act.Prog. Coll Act Coll Prog. - Act.
%Prog -
Act.Prog. Coll Act Coll Prog. - Act.
%Prog -
Act.
1.0 Energy Debt Recovery Levy 108,412,827.06 124,047,086.35 15,634,259.29 14.42% 110,123,995.68 137,211,773.00 27,087,777.32 24.60% 123,833,391.55 130,996,467.36 7,163,075.81 5.78% 342,370,214.30 392,255,326.71 49,885,112.41 14.57% 993,726,681.84 1,082,406,667.61 88,679,985.77 8.92%
2.0 Price Stabilisation and Recovery Levy 30,317,833.18 3,545,063.70 (26,772,769.48) -88.31% 31,839,995.75 3,529,687.00 (28,310,308.75) -88.91% 34,425,388.74 2,818,127.50 (31,607,261.24) -91.81% 96,583,217.67 9,892,878.20 (86,690,339.47) -89.76% 293,365,995.33 134,018,191.89 (159,347,803.44) -54.32%
3.0 Public Lighting Levy 18,834,872.35 9,114,090.88 (9,720,781.46) -51.61% 18,766,388.93 9,468,108.89 (9,298,280.04) -49.55% 19,255,622.04 8,825,825.67 (10,429,796.38) -54.16% 56,856,883.32 27,408,025.44 (29,448,857.88) -51.79% 175,750,798.59 95,500,492.89 (80,250,305.70) -45.66%
o/w ECG 14,166,043.58 6,508,138.75 (7,657,904.83) -54.06% 14,121,043.58 6,969,606.31 (7,151,437.27) -50.64% 14,641,483.58 6,423,790.56 (8,217,693.02) -56.13% 42,928,570.73 19,901,535.61 (23,027,035.11) -53.64% 135,724,832.18 73,332,839.15 (62,391,993.03) -45.97%
o/w NEDCO 1,782,876.00 1,159,585.22 (623,290.78) -34.96% 1,797,732.71 1,055,007.74 (742,724.97) -41.31% 1,812,713.22 979,406.39 (833,306.83) -45.97% 5,393,321.93 3,193,999.35 (2,199,322.58) -40.78% 15,785,392.12 9,517,842.04 (6,267,550.08) -39.70%
o/w VRA 2,885,952.77 1,446,366.91 (1,439,585.86) -49.88% 2,847,612.65 1,443,494.85 (1,404,117.80) -49.31% 2,801,425.25 1,422,628.72 (1,378,796.53) -49.22% 8,534,990.67 4,312,490.48 (4,222,500.19) -49.47% 24,240,574.30 12,649,811.70 (11,590,762.60) -47.82%
4.0 National Electrification Scheme Levy 12,155,626.27 6,026,322.34 (6,129,303.93) -50.42% 12,440,796.00 6,184,568.43 (6,256,227.57) -50.29% 13,620,823.62 5,867,703.02 (7,753,120.61) -56.92% 38,217,245.89 18,078,593.78 (20,138,652.11) -52.70% 115,512,087.49 65,079,691.43 (50,432,396.06) -43.66%
o/w ECG 8,944,029.05 4,281,552.42 (4,662,476.63) -52.13% 9,244,029.05 4,606,359.66 (4,637,669.39) -50.17% 10,444,029.05 4,147,747.35 (6,296,281.70) -60.29% 28,632,087.15 13,035,659.43 (15,596,427.72) -54.47% 88,470,761.45 48,329,924.08 (40,140,837.37) -45.37%
o/w NEDCO 1,287,628.71 778,208.85 (509,419.86) -39.56% 1,298,358.52 704,066.17 (594,292.35) -45.77% 1,309,177.74 652,082.93 (657,094.81) -50.19% 3,895,164.96 2,134,357.95 (1,760,807.02) -45.20% 10,880,943.17 8,064,953.24 (2,815,989.93) -25.88%
o/w VRA 1,923,968.51 966,561.07 (957,407.44) -49.76% 1,898,408.43 874,142.60 (1,024,265.83) -53.95% 1,867,616.83 1,067,872.74 (799,744.09) -42.82% 5,689,993.78 2,908,576.41 (2,781,417.37) -48.88% 16,160,382.86 8,684,814.10 (7,475,568.76) -46.26%
5.0 Road Fund Levy 100,092,128.61 111,029,699.25 10,937,570.64 10.93% 100,704,655.81 123,342,104.06 22,637,448.25 22.48% 104,967,749.58 117,274,273.36 12,306,523.78 11.72% 305,764,534.00 351,646,076.67 45,881,542.67 15.01% 925,046,481.04 972,354,770.02 47,308,288.98 5.11%
6.0 Energy Fund Levy 3,174,278.66 2,998,793.62 (175,485.04) -5.53% 3,238,042.96 3,164,691.20 (73,351.76) -2.27% 3,288,871.96 3,355,763.54 66,891.58 2.03% 9,701,193.59 9,519,248.36 (181,945.23) -1.88% 28,542,298.53 26,115,588.87 (2,426,709.66) -8.50%
7.0 Total ESLA 2018 272,987,566.13 256,761,056.14 (16,226,509.99) -5.94% 277,113,875.14 282,900,932.58 5,787,057.44 2.09% 299,391,847.49 269,138,160.44 (30,253,687.05) -10.11% 849,493,288.77 808,800,149.16 (40,693,139.61) -4.79% 2,531,944,342.82 2,375,475,402.71 (156,468,940.12) -6.18%
No. Levy Type Prog. Coll Act Coll Prog. - Act.%Prog -
Act.Prog. Coll Act Coll Prog. - Act.
%Prog -
Act.Prog. Coll Act Coll Prog. - Act.
%Prog -
Act.Prog. Coll Act Coll Prog. - Act.
%Prog -
Act.Prog. Coll Act Coll Prog. - Act.
%Prog -
Act.
1.0 Energy Debt Recovery Levy 115,967,452.76 121,407,466.73 5,440,013.97 4.69% 126,586,459.72 132,050,430.61 5,463,970.89 4.32% 127,729,405.68 136,092,386.81 8,362,981.13 6.55% 370,283,318.16 389,550,284.15 19,266,965.99 5.20% 1,364,010,000.00 1,471,956,951.76 107,946,951.76 7.91%
2.0 Price Stabilisation and Recovery Levy 34,754,323.10 3,463,532.15 (31,290,790.95) -90.03% 35,559,430.02 1,929,387.63 (33,630,042.39) -94.57% 38,071,884.67 3,052,795.76 (35,019,088.91) -91.98% 108,385,637.79 8,445,715.54 (99,939,922.25) -92.21% 401,751,633.12 142,463,907.43 (259,287,725.69) -64.54%
3.0 Public Lighting Levy 20,329,031.38 11,378,455.99 (8,950,575.39) -44.03% 20,351,655.70 10,352,491.22 (9,999,164.48) -49.13% 20,557,238.83 11,315,283.09 (9,241,955.73) -44.96% 61,237,925.91 33,046,230.31 (28,191,695.60) -46.04% 236,988,724.50 128,546,723.20 (108,442,001.31) -45.76%
o/w ECG 15,666,043.58 9,085,623.10 (6,580,420.47) -42.00% 15,666,043.58 8,026,901.21 (7,639,142.36) -48.76% 15,666,043.58 8,932,801.87 (6,733,241.71) -42.98% 46,998,130.73 26,045,326.18 (20,952,804.54) -44.58% 182,722,962.90 99,378,165.33 (83,344,797.57) -45.61%
o/w NEDCO 1,827,818.55 885,824.02 (941,994.54) -51.54% 1,843,049.77 1,049,645.86 (793,403.91) -43.05% 1,858,407.90 912,266.24 (946,141.66) -50.91% 5,529,276.22 2,847,736.11 (2,681,540.11) -48.50% 21,314,668.35 12,365,578.15 (8,949,090.19) -41.99%
o/w VRA 2,835,169.25 1,407,008.87 (1,428,160.38) -50.37% 2,842,562.36 1,275,944.15 (1,566,618.21) -55.11% 3,032,787.35 1,470,214.99 (1,562,572.36) -51.52% 8,710,518.96 4,153,168.01 (4,557,350.95) -52.32% 32,951,093.26 16,802,979.71 (16,148,113.55) -49.01%
4.0 National Electrification Scheme Levy 13,654,229.00 8,116,379.69 (5,537,849.31) -40.56% 13,670,158.03 6,781,193.51 (6,888,964.52) -50.39% 13,808,066.64 8,233,256.50 (5,574,810.13) -40.37% 41,132,453.66 23,130,829.70 (18,001,623.96) -43.77% 156,644,541.15 88,210,521.13 (68,434,020.02) -43.69%
o/w ECG 10,444,029.05 6,051,060.96 (4,392,968.09) -42.06% 10,444,029.05 5,266,349.48 (5,177,679.57) -49.58% 10,444,029.05 5,922,056.70 (4,521,972.35) -43.30% 31,332,087.15 17,239,467.14 (14,092,620.01) -44.98% 119,802,848.60 65,569,391.23 (54,233,457.37) -45.27%
o/w NEDCO 1,320,087.12 590,549.34 (729,537.77) -55.26% 1,331,087.40 699,763.91 (631,323.50) -47.43% 1,342,179.35 1,350,304.77 8,125.42 0.61% 3,993,353.87 2,640,618.02 (1,352,735.85) -33.87% 14,874,297.05 10,705,571.26 (4,168,725.79) -28.03%
o/w VRA 1,890,112.83 1,474,769.38 (415,343.45) -21.97% 1,895,041.57 815,080.13 (1,079,961.44) -56.99% 2,021,858.23 960,895.03 (1,060,963.20) -52.47% 5,807,012.64 3,250,744.54 (2,556,268.10) -44.02% 21,967,395.50 11,935,558.64 (10,031,836.86) -45.67%
5.0 Road Fund Levy 124,316,776.60 109,075,992.29 (15,240,784.31) -12.26% 134,219,169.51 119,311,810.52 (14,907,358.99) -11.11% 131,190,138.71 123,552,279.60 (7,637,859.11) -5.82% 389,726,084.82 351,940,082.41 (37,786,002.41) -9.70% 1,314,772,565.85 1,324,294,852.43 9,522,286.58 0.72%
6.0 Energy Fund Levy 1,442,338.54 2,810,078.88 1,367,740.34 94.83% 1,442,338.54 3,155,989.13 1,713,650.59 118.81% 1,442,338.54 3,183,951.99 1,741,613.45 120.75% 4,327,015.61 9,150,020.00 4,823,004.39 111.46% 32,869,314.15 35,265,608.87 2,396,294.72 7.29%
7.0 Total ESLA 2018 310,464,151.38 256,251,905.73 (54,212,245.65) -17.46% 331,829,211.52 273,581,302.62 (58,247,908.90) -17.55% 332,799,073.06 285,429,953.76 (47,369,119.30) -14.23% 975,092,435.95 815,263,162.11 (159,829,273.84) -16.39% 3,507,036,778.77 3,190,738,564.82 (316,298,213.96) -9.02%
Quarter 1+2+3+4
Quarter 1+2+3
October November December Quarter 4
July August September Quarter 3
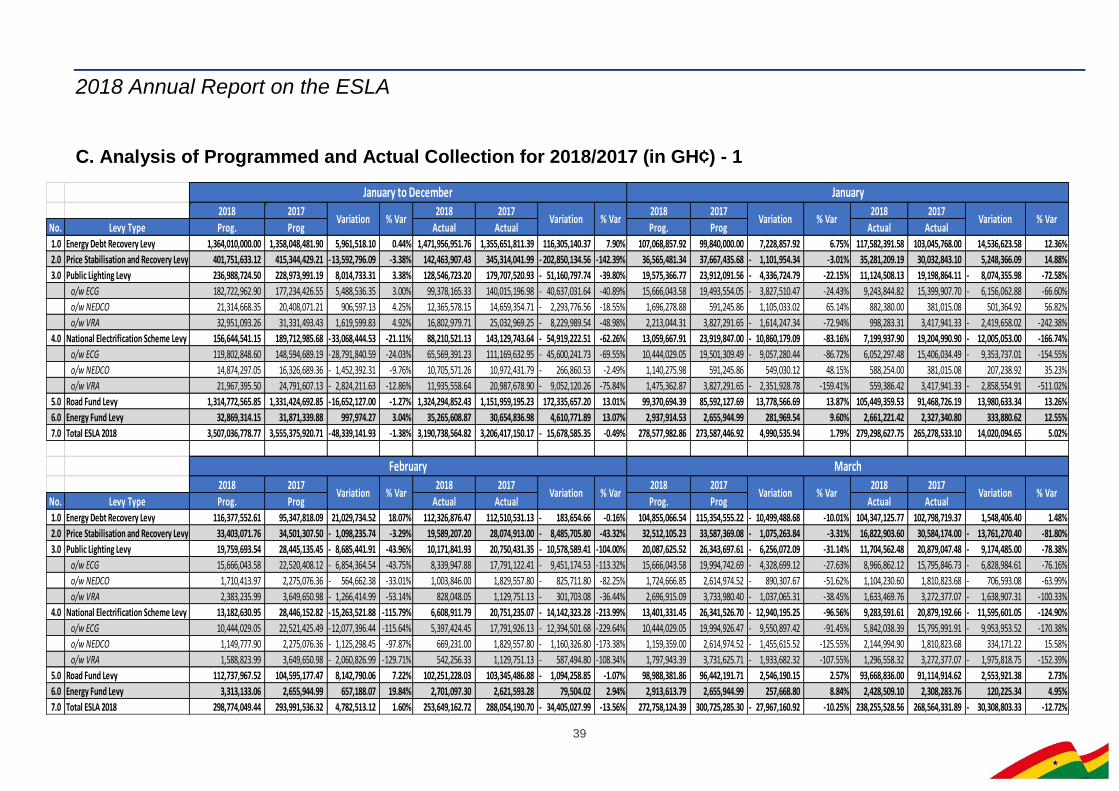
2018 Annual Report on the ESLA
39
C. Analysis of Programmed and Actual Collection for 2018/2017 (in GH¢) - 1
2018 2017 2018 2017 2018 2017 2018 2017
No. Levy Type Prog. Prog Actual Actual Prog. Prog Actual Actual1.0 Energy Debt Recovery Levy 1,364,010,000.00 1,358,048,481.90 5,961,518.10 0.44% 1,471,956,951.76 1,355,651,811.39 116,305,140.37 7.90% 107,068,857.92 99,840,000.00 7,228,857.92 6.75% 117,582,391.58 103,045,768.00 14,536,623.58 12.36%
2.0 Price Stabilisation and Recovery Levy 401,751,633.12 415,344,429.21 13,592,796.09- -3.38% 142,463,907.43 345,314,041.99 202,850,134.56- -142.39% 36,565,481.34 37,667,435.68 1,101,954.34- -3.01% 35,281,209.19 30,032,843.10 5,248,366.09 14.88%
3.0 Public Lighting Levy 236,988,724.50 228,973,991.19 8,014,733.31 3.38% 128,546,723.20 179,707,520.93 51,160,797.74- -39.80% 19,575,366.77 23,912,091.56 4,336,724.79- -22.15% 11,124,508.13 19,198,864.11 8,074,355.98- -72.58%
o/w ECG 182,722,962.90 177,234,426.55 5,488,536.35 3.00% 99,378,165.33 140,015,196.98 40,637,031.64- -40.89% 15,666,043.58 19,493,554.05 3,827,510.47- -24.43% 9,243,844.82 15,399,907.70 6,156,062.88- -66.60%
o/w NEDCO 21,314,668.35 20,408,071.21 906,597.13 4.25% 12,365,578.15 14,659,354.71 2,293,776.56- -18.55% 1,696,278.88 591,245.86 1,105,033.02 65.14% 882,380.00 381,015.08 501,364.92 56.82%
o/w VRA 32,951,093.26 31,331,493.43 1,619,599.83 4.92% 16,802,979.71 25,032,969.25 8,229,989.54- -48.98% 2,213,044.31 3,827,291.65 1,614,247.34- -72.94% 998,283.31 3,417,941.33 2,419,658.02- -242.38%
4.0 National Electrification Scheme Levy 156,644,541.15 189,712,985.68 33,068,444.53- -21.11% 88,210,521.13 143,129,743.64 54,919,222.51- -62.26% 13,059,667.91 23,919,847.00 10,860,179.09- -83.16% 7,199,937.90 19,204,990.90 12,005,053.00- -166.74%
o/w ECG 119,802,848.60 148,594,689.19 28,791,840.59- -24.03% 65,569,391.23 111,169,632.95 45,600,241.73- -69.55% 10,444,029.05 19,501,309.49 9,057,280.44- -86.72% 6,052,297.48 15,406,034.49 9,353,737.01- -154.55%
o/w NEDCO 14,874,297.05 16,326,689.36 1,452,392.31- -9.76% 10,705,571.26 10,972,431.79 266,860.53- -2.49% 1,140,275.98 591,245.86 549,030.12 48.15% 588,254.00 381,015.08 207,238.92 35.23%
o/w VRA 21,967,395.50 24,791,607.13 2,824,211.63- -12.86% 11,935,558.64 20,987,678.90 9,052,120.26- -75.84% 1,475,362.87 3,827,291.65 2,351,928.78- -159.41% 559,386.42 3,417,941.33 2,858,554.91- -511.02%
5.0 Road Fund Levy 1,314,772,565.85 1,331,424,692.85 16,652,127.00- -1.27% 1,324,294,852.43 1,151,959,195.23 172,335,657.20 13.01% 99,370,694.39 85,592,127.69 13,778,566.69 13.87% 105,449,359.53 91,468,726.19 13,980,633.34 13.26%
6.0 Energy Fund Levy 32,869,314.15 31,871,339.88 997,974.27 3.04% 35,265,608.87 30,654,836.98 4,610,771.89 13.07% 2,937,914.53 2,655,944.99 281,969.54 9.60% 2,661,221.42 2,327,340.80 333,880.62 12.55%
7.0 Total ESLA 2018 3,507,036,778.77 3,555,375,920.71 48,339,141.93- -1.38% 3,190,738,564.82 3,206,417,150.17 15,678,585.35- -0.49% 278,577,982.86 273,587,446.92 4,990,535.94 1.79% 279,298,627.75 265,278,533.10 14,020,094.65 5.02%
2018 2017 2018 2017 2018 2017 2018 2017
No. Levy Type Prog. Prog Actual Actual Prog. Prog Actual Actual1.0 Energy Debt Recovery Levy 116,377,552.61 95,347,818.09 21,029,734.52 18.07% 112,326,876.47 112,510,531.13 183,654.66- -0.16% 104,855,066.54 115,354,555.22 10,499,488.68- -10.01% 104,347,125.77 102,798,719.37 1,548,406.40 1.48%
2.0 Price Stabilisation and Recovery Levy 33,403,071.76 34,501,307.50 1,098,235.74- -3.29% 19,589,207.20 28,074,913.00 8,485,705.80- -43.32% 32,512,105.23 33,587,369.08 1,075,263.84- -3.31% 16,822,903.60 30,584,174.00 13,761,270.40- -81.80%
3.0 Public Lighting Levy 19,759,693.54 28,445,135.45 8,685,441.91- -43.96% 10,171,841.93 20,750,431.35 10,578,589.41- -104.00% 20,087,625.52 26,343,697.61 6,256,072.09- -31.14% 11,704,562.48 20,879,047.48 9,174,485.00- -78.38%
o/w ECG 15,666,043.58 22,520,408.12 6,854,364.54- -43.75% 8,339,947.88 17,791,122.41 9,451,174.53- -113.32% 15,666,043.58 19,994,742.69 4,328,699.12- -27.63% 8,966,862.12 15,795,846.73 6,828,984.61- -76.16%
o/w NEDCO 1,710,413.97 2,275,076.36 564,662.38- -33.01% 1,003,846.00 1,829,557.80 825,711.80- -82.25% 1,724,666.85 2,614,974.52 890,307.67- -51.62% 1,104,230.60 1,810,823.68 706,593.08- -63.99%
o/w VRA 2,383,235.99 3,649,650.98 1,266,414.99- -53.14% 828,048.05 1,129,751.13 301,703.08- -36.44% 2,696,915.09 3,733,980.40 1,037,065.31- -38.45% 1,633,469.76 3,272,377.07 1,638,907.31- -100.33%
4.0 National Electrification Scheme Levy 13,182,630.95 28,446,152.82 15,263,521.88- -115.79% 6,608,911.79 20,751,235.07 14,142,323.28- -213.99% 13,401,331.45 26,341,526.70 12,940,195.25- -96.56% 9,283,591.61 20,879,192.66 11,595,601.05- -124.90%
o/w ECG 10,444,029.05 22,521,425.49 12,077,396.44- -115.64% 5,397,424.45 17,791,926.13 12,394,501.68- -229.64% 10,444,029.05 19,994,926.47 9,550,897.42- -91.45% 5,842,038.39 15,795,991.91 9,953,953.52- -170.38%
o/w NEDCO 1,149,777.90 2,275,076.36 1,125,298.45- -97.87% 669,231.00 1,829,557.80 1,160,326.80- -173.38% 1,159,359.00 2,614,974.52 1,455,615.52- -125.55% 2,144,994.90 1,810,823.68 334,171.22 15.58%
o/w VRA 1,588,823.99 3,649,650.98 2,060,826.99- -129.71% 542,256.33 1,129,751.13 587,494.80- -108.34% 1,797,943.39 3,731,625.71 1,933,682.32- -107.55% 1,296,558.32 3,272,377.07 1,975,818.75- -152.39%
5.0 Road Fund Levy 112,737,967.52 104,595,177.47 8,142,790.06 7.22% 102,251,228.03 103,345,486.88 1,094,258.85- -1.07% 98,988,381.86 96,442,191.71 2,546,190.15 2.57% 93,668,836.00 91,114,914.62 2,553,921.38 2.73%
6.0 Energy Fund Levy 3,313,133.06 2,655,944.99 657,188.07 19.84% 2,701,097.30 2,621,593.28 79,504.02 2.94% 2,913,613.79 2,655,944.99 257,668.80 8.84% 2,428,509.10 2,308,283.76 120,225.34 4.95%
7.0 Total ESLA 2018 298,774,049.44 293,991,536.32 4,782,513.12 1.60% 253,649,162.72 288,054,190.70 34,405,027.99- -13.56% 272,758,124.39 300,725,285.30 27,967,160.92- -10.25% 238,255,528.56 268,564,331.89 30,308,803.33- -12.72%
% VarVariation Variation% VarVariation% VarVariation
% VarVariation% VarVariation
% Var
Variation % Var Variation % Var
January to December January
February March
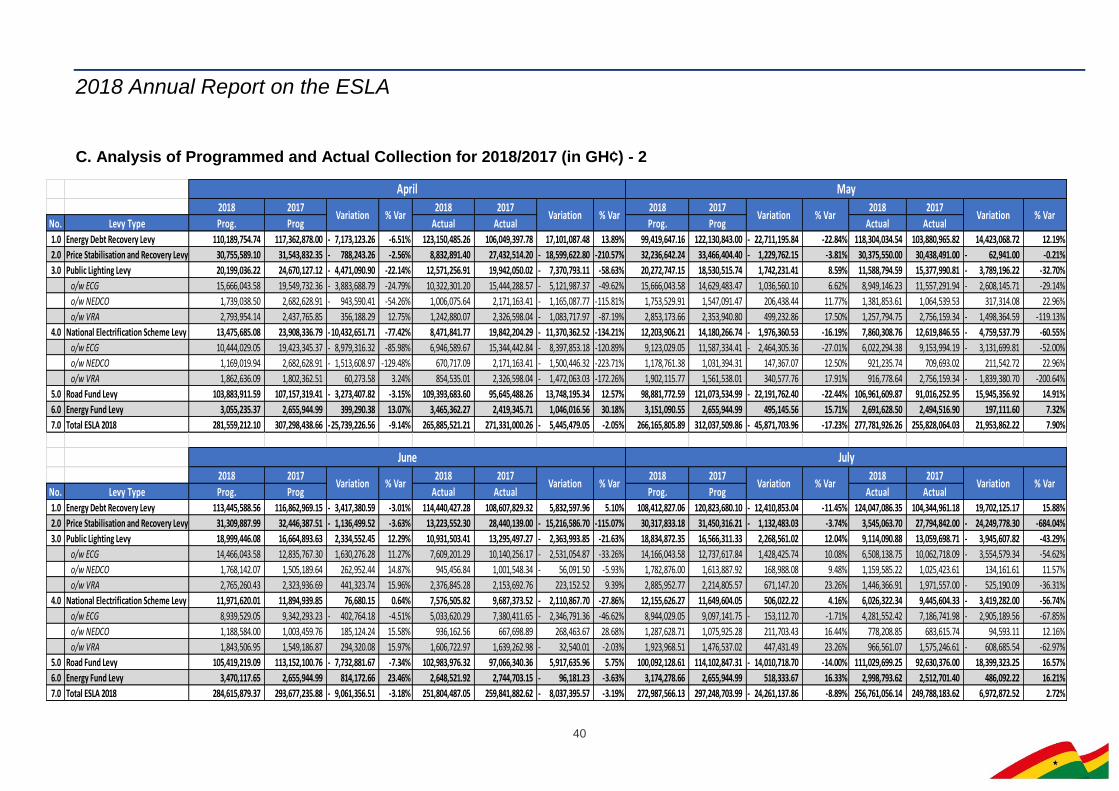
2018 Annual Report on the ESLA
40
C. Analysis of Programmed and Actual Collection for 2018/2017 (in GH¢) - 2
2018 2017 2018 2017 2018 2017 2018 2017
No. Levy Type Prog. Prog Actual Actual Prog. Prog Actual Actual1.0 Energy Debt Recovery Levy 110,189,754.74 117,362,878.00 7,173,123.26- -6.51% 123,150,485.26 106,049,397.78 17,101,087.48 13.89% 99,419,647.16 122,130,843.00 22,711,195.84- -22.84% 118,304,034.54 103,880,965.82 14,423,068.72 12.19%
2.0 Price Stabilisation and Recovery Levy 30,755,589.10 31,543,832.35 788,243.26- -2.56% 8,832,891.40 27,432,514.20 18,599,622.80- -210.57% 32,236,642.24 33,466,404.40 1,229,762.15- -3.81% 30,375,550.00 30,438,491.00 62,941.00- -0.21%
3.0 Public Lighting Levy 20,199,036.22 24,670,127.12 4,471,090.90- -22.14% 12,571,256.91 19,942,050.02 7,370,793.11- -58.63% 20,272,747.15 18,530,515.74 1,742,231.41 8.59% 11,588,794.59 15,377,990.81 3,789,196.22- -32.70%
o/w ECG 15,666,043.58 19,549,732.36 3,883,688.79- -24.79% 10,322,301.20 15,444,288.57 5,121,987.37- -49.62% 15,666,043.58 14,629,483.47 1,036,560.10 6.62% 8,949,146.23 11,557,291.94 2,608,145.71- -29.14%
o/w NEDCO 1,739,038.50 2,682,628.91 943,590.41- -54.26% 1,006,075.64 2,171,163.41 1,165,087.77- -115.81% 1,753,529.91 1,547,091.47 206,438.44 11.77% 1,381,853.61 1,064,539.53 317,314.08 22.96%
o/w VRA 2,793,954.14 2,437,765.85 356,188.29 12.75% 1,242,880.07 2,326,598.04 1,083,717.97- -87.19% 2,853,173.66 2,353,940.80 499,232.86 17.50% 1,257,794.75 2,756,159.34 1,498,364.59- -119.13%
4.0 National Electrification Scheme Levy 13,475,685.08 23,908,336.79 10,432,651.71- -77.42% 8,471,841.77 19,842,204.29 11,370,362.52- -134.21% 12,203,906.21 14,180,266.74 1,976,360.53- -16.19% 7,860,308.76 12,619,846.55 4,759,537.79- -60.55%
o/w ECG 10,444,029.05 19,423,345.37 8,979,316.32- -85.98% 6,946,589.67 15,344,442.84 8,397,853.18- -120.89% 9,123,029.05 11,587,334.41 2,464,305.36- -27.01% 6,022,294.38 9,153,994.19 3,131,699.81- -52.00%
o/w NEDCO 1,169,019.94 2,682,628.91 1,513,608.97- -129.48% 670,717.09 2,171,163.41 1,500,446.32- -223.71% 1,178,761.38 1,031,394.31 147,367.07 12.50% 921,235.74 709,693.02 211,542.72 22.96%
o/w VRA 1,862,636.09 1,802,362.51 60,273.58 3.24% 854,535.01 2,326,598.04 1,472,063.03- -172.26% 1,902,115.77 1,561,538.01 340,577.76 17.91% 916,778.64 2,756,159.34 1,839,380.70- -200.64%
5.0 Road Fund Levy 103,883,911.59 107,157,319.41 3,273,407.82- -3.15% 109,393,683.60 95,645,488.26 13,748,195.34 12.57% 98,881,772.59 121,073,534.99 22,191,762.40- -22.44% 106,961,609.87 91,016,252.95 15,945,356.92 14.91%
6.0 Energy Fund Levy 3,055,235.37 2,655,944.99 399,290.38 13.07% 3,465,362.27 2,419,345.71 1,046,016.56 30.18% 3,151,090.55 2,655,944.99 495,145.56 15.71% 2,691,628.50 2,494,516.90 197,111.60 7.32%
7.0 Total ESLA 2018 281,559,212.10 307,298,438.66 25,739,226.56- -9.14% 265,885,521.21 271,331,000.26 5,445,479.05- -2.05% 266,165,805.89 312,037,509.86 45,871,703.96- -17.23% 277,781,926.26 255,828,064.03 21,953,862.22 7.90%
2018 2017 2018 2017 2018 2017 2018 2017
No. Levy Type Prog. Prog Actual Actual Prog. Prog Actual Actual1.0 Energy Debt Recovery Levy 113,445,588.56 116,862,969.15 3,417,380.59- -3.01% 114,440,427.28 108,607,829.32 5,832,597.96 5.10% 108,412,827.06 120,823,680.10 12,410,853.04- -11.45% 124,047,086.35 104,344,961.18 19,702,125.17 15.88%
2.0 Price Stabilisation and Recovery Levy 31,309,887.99 32,446,387.51 1,136,499.52- -3.63% 13,223,552.30 28,440,139.00 15,216,586.70- -115.07% 30,317,833.18 31,450,316.21 1,132,483.03- -3.74% 3,545,063.70 27,794,842.00 24,249,778.30- -684.04%
3.0 Public Lighting Levy 18,999,446.08 16,664,893.63 2,334,552.45 12.29% 10,931,503.41 13,295,497.27 2,363,993.85- -21.63% 18,834,872.35 16,566,311.33 2,268,561.02 12.04% 9,114,090.88 13,059,698.71 3,945,607.82- -43.29%
o/w ECG 14,466,043.58 12,835,767.30 1,630,276.28 11.27% 7,609,201.29 10,140,256.17 2,531,054.87- -33.26% 14,166,043.58 12,737,617.84 1,428,425.74 10.08% 6,508,138.75 10,062,718.09 3,554,579.34- -54.62%
o/w NEDCO 1,768,142.07 1,505,189.64 262,952.44 14.87% 945,456.84 1,001,548.34 56,091.50- -5.93% 1,782,876.00 1,613,887.92 168,988.08 9.48% 1,159,585.22 1,025,423.61 134,161.61 11.57%
o/w VRA 2,765,260.43 2,323,936.69 441,323.74 15.96% 2,376,845.28 2,153,692.76 223,152.52 9.39% 2,885,952.77 2,214,805.57 671,147.20 23.26% 1,446,366.91 1,971,557.00 525,190.09- -36.31%
4.0 National Electrification Scheme Levy 11,971,620.01 11,894,939.85 76,680.15 0.64% 7,576,505.82 9,687,373.52 2,110,867.70- -27.86% 12,155,626.27 11,649,604.05 506,022.22 4.16% 6,026,322.34 9,445,604.33 3,419,282.00- -56.74%
o/w ECG 8,939,529.05 9,342,293.23 402,764.18- -4.51% 5,033,620.29 7,380,411.65 2,346,791.36- -46.62% 8,944,029.05 9,097,141.75 153,112.70- -1.71% 4,281,552.42 7,186,741.98 2,905,189.56- -67.85%
o/w NEDCO 1,188,584.00 1,003,459.76 185,124.24 15.58% 936,162.56 667,698.89 268,463.67 28.68% 1,287,628.71 1,075,925.28 211,703.43 16.44% 778,208.85 683,615.74 94,593.11 12.16%
o/w VRA 1,843,506.95 1,549,186.87 294,320.08 15.97% 1,606,722.97 1,639,262.98 32,540.01- -2.03% 1,923,968.51 1,476,537.02 447,431.49 23.26% 966,561.07 1,575,246.61 608,685.54- -62.97%
5.0 Road Fund Levy 105,419,219.09 113,152,100.76 7,732,881.67- -7.34% 102,983,976.32 97,066,340.36 5,917,635.96 5.75% 100,092,128.61 114,102,847.31 14,010,718.70- -14.00% 111,029,699.25 92,630,376.00 18,399,323.25 16.57%
6.0 Energy Fund Levy 3,470,117.65 2,655,944.99 814,172.66 23.46% 2,648,521.92 2,744,703.15 96,181.23- -3.63% 3,174,278.66 2,655,944.99 518,333.67 16.33% 2,998,793.62 2,512,701.40 486,092.22 16.21%
7.0 Total ESLA 2018 284,615,879.37 293,677,235.88 9,061,356.51- -3.18% 251,804,487.05 259,841,882.62 8,037,395.57- -3.19% 272,987,566.13 297,248,703.99 24,261,137.86- -8.89% 256,761,056.14 249,788,183.62 6,972,872.52 2.72%
% Var Variation % Var Variation % Var
Variation % Var
Variation % Var Variation
% Var Variation % Var Variation % VarVariation
April May
June July
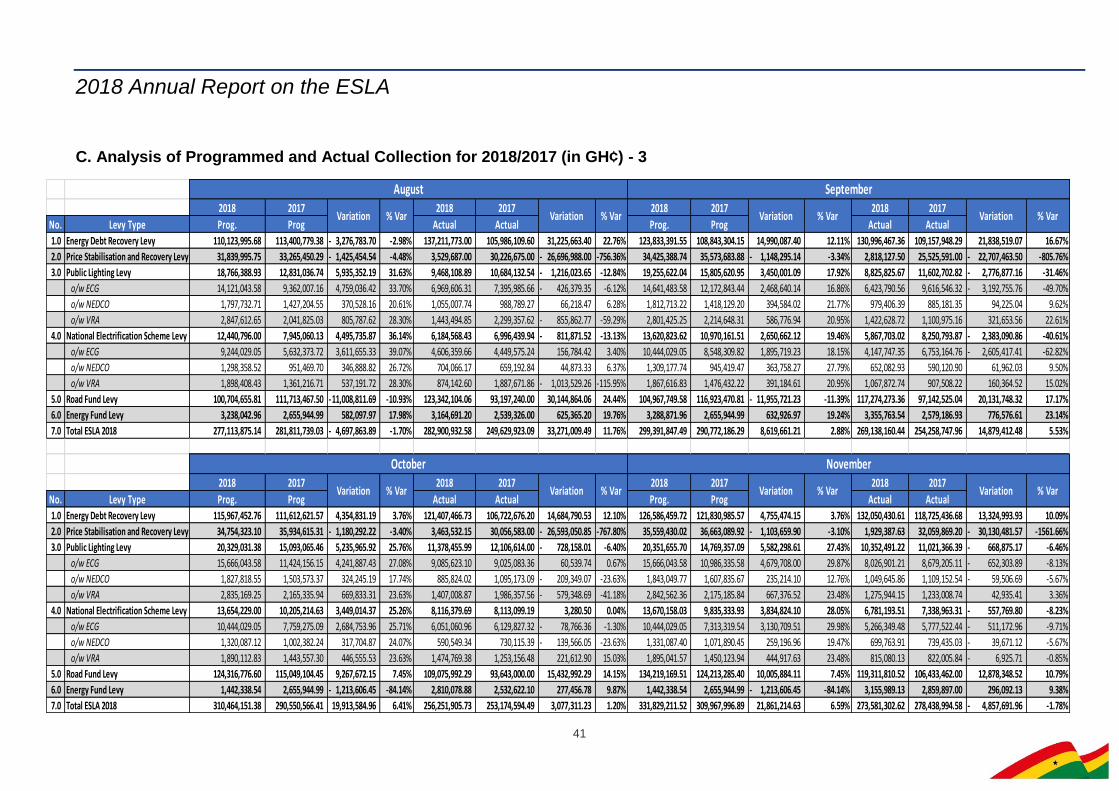
2018 Annual Report on the ESLA
41
C. Analysis of Programmed and Actual Collection for 2018/2017 (in GH¢) - 3
2018 2017 2018 2017 2018 2017 2018 2017
No. Levy Type Prog. Prog Actual Actual Prog. Prog Actual Actual1.0 Energy Debt Recovery Levy 110,123,995.68 113,400,779.38 3,276,783.70- -2.98% 137,211,773.00 105,986,109.60 31,225,663.40 22.76% 123,833,391.55 108,843,304.15 14,990,087.40 12.11% 130,996,467.36 109,157,948.29 21,838,519.07 16.67%
2.0 Price Stabilisation and Recovery Levy 31,839,995.75 33,265,450.29 1,425,454.54- -4.48% 3,529,687.00 30,226,675.00 26,696,988.00- -756.36% 34,425,388.74 35,573,683.88 1,148,295.14- -3.34% 2,818,127.50 25,525,591.00 22,707,463.50- -805.76%
3.0 Public Lighting Levy 18,766,388.93 12,831,036.74 5,935,352.19 31.63% 9,468,108.89 10,684,132.54 1,216,023.65- -12.84% 19,255,622.04 15,805,620.95 3,450,001.09 17.92% 8,825,825.67 11,602,702.82 2,776,877.16- -31.46%
o/w ECG 14,121,043.58 9,362,007.16 4,759,036.42 33.70% 6,969,606.31 7,395,985.66 426,379.35- -6.12% 14,641,483.58 12,172,843.44 2,468,640.14 16.86% 6,423,790.56 9,616,546.32 3,192,755.76- -49.70%
o/w NEDCO 1,797,732.71 1,427,204.55 370,528.16 20.61% 1,055,007.74 988,789.27 66,218.47 6.28% 1,812,713.22 1,418,129.20 394,584.02 21.77% 979,406.39 885,181.35 94,225.04 9.62%
o/w VRA 2,847,612.65 2,041,825.03 805,787.62 28.30% 1,443,494.85 2,299,357.62 855,862.77- -59.29% 2,801,425.25 2,214,648.31 586,776.94 20.95% 1,422,628.72 1,100,975.16 321,653.56 22.61%
4.0 National Electrification Scheme Levy 12,440,796.00 7,945,060.13 4,495,735.87 36.14% 6,184,568.43 6,996,439.94 811,871.52- -13.13% 13,620,823.62 10,970,161.51 2,650,662.12 19.46% 5,867,703.02 8,250,793.87 2,383,090.86- -40.61%
o/w ECG 9,244,029.05 5,632,373.72 3,611,655.33 39.07% 4,606,359.66 4,449,575.24 156,784.42 3.40% 10,444,029.05 8,548,309.82 1,895,719.23 18.15% 4,147,747.35 6,753,164.76 2,605,417.41- -62.82%
o/w NEDCO 1,298,358.52 951,469.70 346,888.82 26.72% 704,066.17 659,192.84 44,873.33 6.37% 1,309,177.74 945,419.47 363,758.27 27.79% 652,082.93 590,120.90 61,962.03 9.50%
o/w VRA 1,898,408.43 1,361,216.71 537,191.72 28.30% 874,142.60 1,887,671.86 1,013,529.26- -115.95% 1,867,616.83 1,476,432.22 391,184.61 20.95% 1,067,872.74 907,508.22 160,364.52 15.02%
5.0 Road Fund Levy 100,704,655.81 111,713,467.50 11,008,811.69- -10.93% 123,342,104.06 93,197,240.00 30,144,864.06 24.44% 104,967,749.58 116,923,470.81 11,955,721.23- -11.39% 117,274,273.36 97,142,525.04 20,131,748.32 17.17%
6.0 Energy Fund Levy 3,238,042.96 2,655,944.99 582,097.97 17.98% 3,164,691.20 2,539,326.00 625,365.20 19.76% 3,288,871.96 2,655,944.99 632,926.97 19.24% 3,355,763.54 2,579,186.93 776,576.61 23.14%
7.0 Total ESLA 2018 277,113,875.14 281,811,739.03 4,697,863.89- -1.70% 282,900,932.58 249,629,923.09 33,271,009.49 11.76% 299,391,847.49 290,772,186.29 8,619,661.21 2.88% 269,138,160.44 254,258,747.96 14,879,412.48 5.53%
2018 2017 2018 2017 2018 2017 2018 2017
No. Levy Type Prog. Prog Actual Actual Prog. Prog Actual Actual1.0 Energy Debt Recovery Levy 115,967,452.76 111,612,621.57 4,354,831.19 3.76% 121,407,466.73 106,722,676.20 14,684,790.53 12.10% 126,586,459.72 121,830,985.57 4,755,474.15 3.76% 132,050,430.61 118,725,436.68 13,324,993.93 10.09%
2.0 Price Stabilisation and Recovery Levy 34,754,323.10 35,934,615.31 1,180,292.22- -3.40% 3,463,532.15 30,056,583.00 26,593,050.85- -767.80% 35,559,430.02 36,663,089.92 1,103,659.90- -3.10% 1,929,387.63 32,059,869.20 30,130,481.57- -1561.66%
3.0 Public Lighting Levy 20,329,031.38 15,093,065.46 5,235,965.92 25.76% 11,378,455.99 12,106,614.00 728,158.01- -6.40% 20,351,655.70 14,769,357.09 5,582,298.61 27.43% 10,352,491.22 11,021,366.39 668,875.17- -6.46%
o/w ECG 15,666,043.58 11,424,156.15 4,241,887.43 27.08% 9,085,623.10 9,025,083.36 60,539.74 0.67% 15,666,043.58 10,986,335.58 4,679,708.00 29.87% 8,026,901.21 8,679,205.11 652,303.89- -8.13%
o/w NEDCO 1,827,818.55 1,503,573.37 324,245.19 17.74% 885,824.02 1,095,173.09 209,349.07- -23.63% 1,843,049.77 1,607,835.67 235,214.10 12.76% 1,049,645.86 1,109,152.54 59,506.69- -5.67%
o/w VRA 2,835,169.25 2,165,335.94 669,833.31 23.63% 1,407,008.87 1,986,357.56 579,348.69- -41.18% 2,842,562.36 2,175,185.84 667,376.52 23.48% 1,275,944.15 1,233,008.74 42,935.41 3.36%
4.0 National Electrification Scheme Levy 13,654,229.00 10,205,214.63 3,449,014.37 25.26% 8,116,379.69 8,113,099.19 3,280.50 0.04% 13,670,158.03 9,835,333.93 3,834,824.10 28.05% 6,781,193.51 7,338,963.31 557,769.80- -8.23%
o/w ECG 10,444,029.05 7,759,275.09 2,684,753.96 25.71% 6,051,060.96 6,129,827.32 78,766.36- -1.30% 10,444,029.05 7,313,319.54 3,130,709.51 29.98% 5,266,349.48 5,777,522.44 511,172.96- -9.71%
o/w NEDCO 1,320,087.12 1,002,382.24 317,704.87 24.07% 590,549.34 730,115.39 139,566.05- -23.63% 1,331,087.40 1,071,890.45 259,196.96 19.47% 699,763.91 739,435.03 39,671.12- -5.67%
o/w VRA 1,890,112.83 1,443,557.30 446,555.53 23.63% 1,474,769.38 1,253,156.48 221,612.90 15.03% 1,895,041.57 1,450,123.94 444,917.63 23.48% 815,080.13 822,005.84 6,925.71- -0.85%
5.0 Road Fund Levy 124,316,776.60 115,049,104.45 9,267,672.15 7.45% 109,075,992.29 93,643,000.00 15,432,992.29 14.15% 134,219,169.51 124,213,285.40 10,005,884.11 7.45% 119,311,810.52 106,433,462.00 12,878,348.52 10.79%
6.0 Energy Fund Levy 1,442,338.54 2,655,944.99 1,213,606.45- -84.14% 2,810,078.88 2,532,622.10 277,456.78 9.87% 1,442,338.54 2,655,944.99 1,213,606.45- -84.14% 3,155,989.13 2,859,897.00 296,092.13 9.38%
7.0 Total ESLA 2018 310,464,151.38 290,550,566.41 19,913,584.96 6.41% 256,251,905.73 253,174,594.49 3,077,311.23 1.20% 331,829,211.52 309,967,996.89 21,861,214.63 6.59% 273,581,302.62 278,438,994.58 4,857,691.96- -1.78%
% VarVariation % Var Variation % Var Variation
% Var Variation % Var
Variation % Var
Variation % Var Variation % Var Variation
September
October November
August
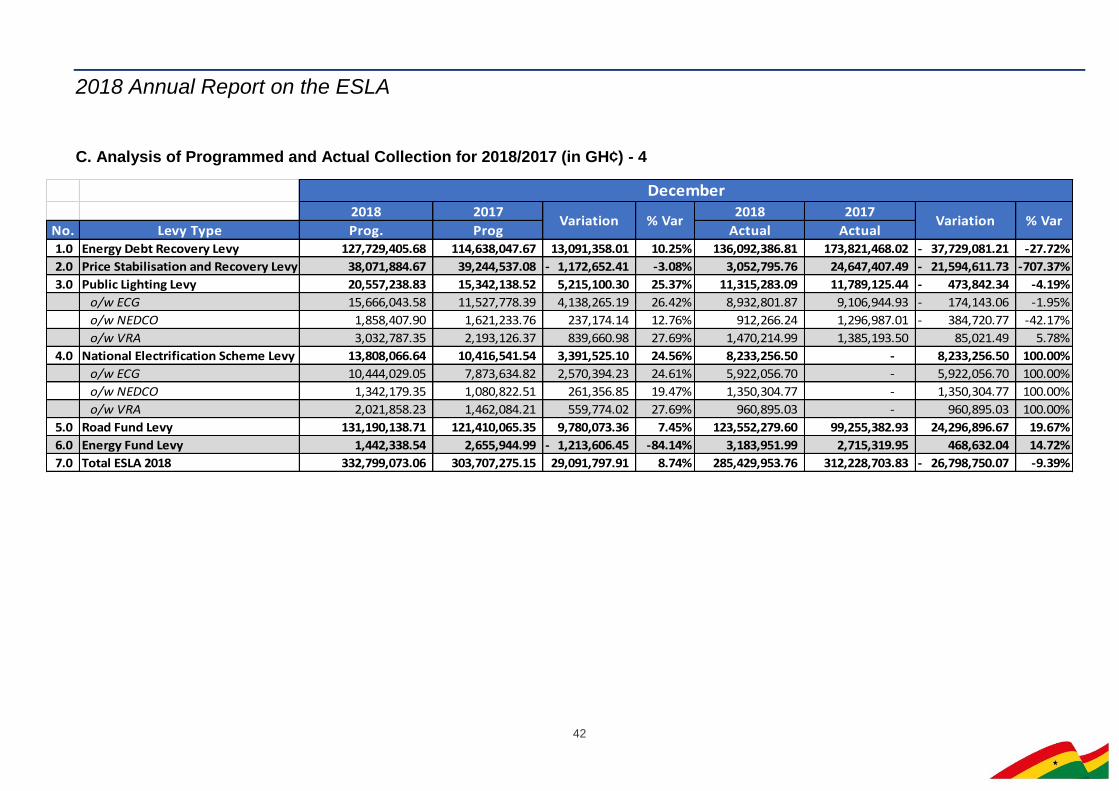
2018 Annual Report on the ESLA
42
C. Analysis of Programmed and Actual Collection for 2018/2017 (in GH¢) - 4
2018 2017 2018 2017
No. Levy Type Prog. Prog Actual Actual
1.0 Energy Debt Recovery Levy 127,729,405.68 114,638,047.67 13,091,358.01 10.25% 136,092,386.81 173,821,468.02 37,729,081.21- -27.72%
2.0 Price Stabilisation and Recovery Levy 38,071,884.67 39,244,537.08 1,172,652.41- -3.08% 3,052,795.76 24,647,407.49 21,594,611.73- -707.37%
3.0 Public Lighting Levy 20,557,238.83 15,342,138.52 5,215,100.30 25.37% 11,315,283.09 11,789,125.44 473,842.34- -4.19%
o/w ECG 15,666,043.58 11,527,778.39 4,138,265.19 26.42% 8,932,801.87 9,106,944.93 174,143.06- -1.95%
o/w NEDCO 1,858,407.90 1,621,233.76 237,174.14 12.76% 912,266.24 1,296,987.01 384,720.77- -42.17%
o/w VRA 3,032,787.35 2,193,126.37 839,660.98 27.69% 1,470,214.99 1,385,193.50 85,021.49 5.78%
4.0 National Electrification Scheme Levy 13,808,066.64 10,416,541.54 3,391,525.10 24.56% 8,233,256.50 - 8,233,256.50 100.00%
o/w ECG 10,444,029.05 7,873,634.82 2,570,394.23 24.61% 5,922,056.70 - 5,922,056.70 100.00%
o/w NEDCO 1,342,179.35 1,080,822.51 261,356.85 19.47% 1,350,304.77 - 1,350,304.77 100.00%
o/w VRA 2,021,858.23 1,462,084.21 559,774.02 27.69% 960,895.03 - 960,895.03 100.00%
5.0 Road Fund Levy 131,190,138.71 121,410,065.35 9,780,073.36 7.45% 123,552,279.60 99,255,382.93 24,296,896.67 19.67%
6.0 Energy Fund Levy 1,442,338.54 2,655,944.99 1,213,606.45- -84.14% 3,183,951.99 2,715,319.95 468,632.04 14.72%
7.0 Total ESLA 2018 332,799,073.06 303,707,275.15 29,091,797.91 8.74% 285,429,953.76 312,228,703.83 26,798,750.07- -9.39%
Variation % Var Variation % Var
December
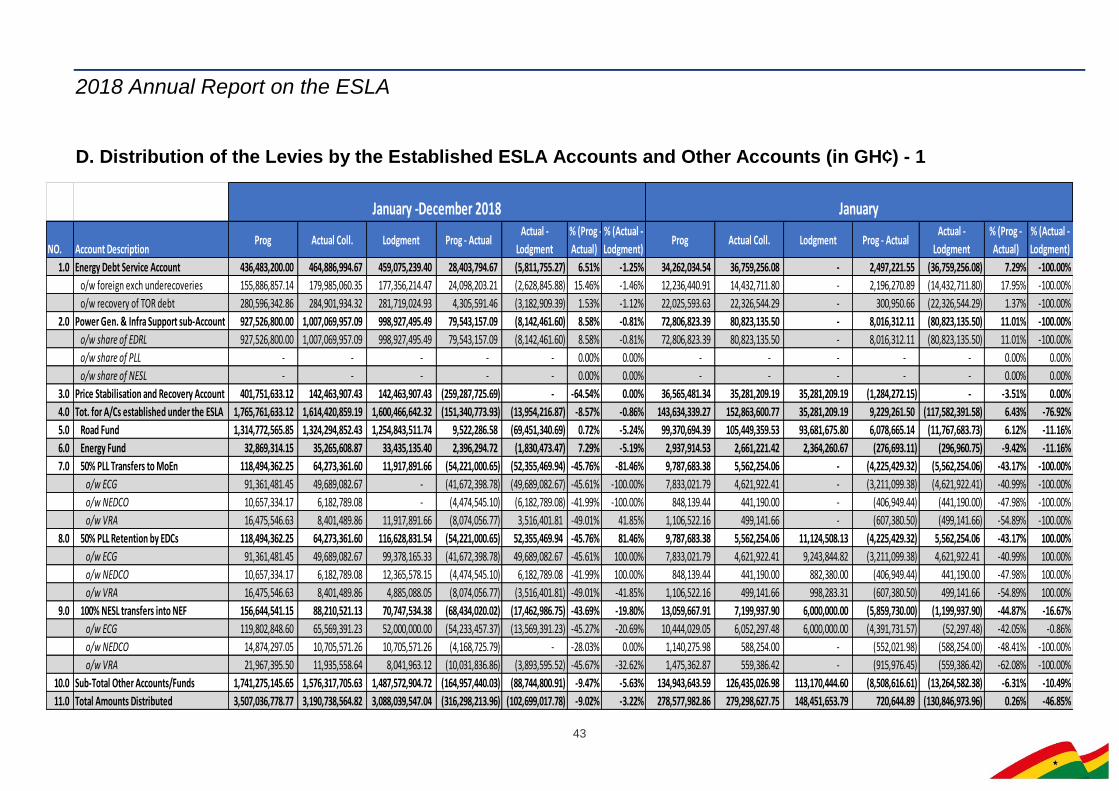
2018 Annual Report on the ESLA
43
D. Distribution of the Levies by the Established ESLA Accounts and Other Accounts (in GH¢) - 1
NO. Account DescriptionProg Actual Coll. Lodgment Prog - Actual
Actual -
Lodgment
% (Prog -
Actual)
% (Actual -
Lodgment)Prog Actual Coll. Lodgment Prog - Actual
Actual -
Lodgment
% (Prog -
Actual)
% (Actual -
Lodgment)
1.0 Energy Debt Service Account 436,483,200.00 464,886,994.67 459,075,239.40 28,403,794.67 (5,811,755.27) 6.51% -1.25% 34,262,034.54 36,759,256.08 - 2,497,221.55 (36,759,256.08) 7.29% -100.00%
o/w foreign exch underecoveries 155,886,857.14 179,985,060.35 177,356,214.47 24,098,203.21 (2,628,845.88) 15.46% -1.46% 12,236,440.91 14,432,711.80 - 2,196,270.89 (14,432,711.80) 17.95% -100.00%
o/w recovery of TOR debt 280,596,342.86 284,901,934.32 281,719,024.93 4,305,591.46 (3,182,909.39) 1.53% -1.12% 22,025,593.63 22,326,544.29 - 300,950.66 (22,326,544.29) 1.37% -100.00%
2.0 Power Gen. & Infra Support sub-Account 927,526,800.00 1,007,069,957.09 998,927,495.49 79,543,157.09 (8,142,461.60) 8.58% -0.81% 72,806,823.39 80,823,135.50 - 8,016,312.11 (80,823,135.50) 11.01% -100.00%
o/w share of EDRL 927,526,800.00 1,007,069,957.09 998,927,495.49 79,543,157.09 (8,142,461.60) 8.58% -0.81% 72,806,823.39 80,823,135.50 - 8,016,312.11 (80,823,135.50) 11.01% -100.00%
o/w share of PLL - - - - - 0.00% 0.00% - - - - - 0.00% 0.00%
o/w share of NESL - - - - - 0.00% 0.00% - - - - - 0.00% 0.00%
3.0 Price Stabilisation and Recovery Account 401,751,633.12 142,463,907.43 142,463,907.43 (259,287,725.69) - -64.54% 0.00% 36,565,481.34 35,281,209.19 35,281,209.19 (1,284,272.15) - -3.51% 0.00%
4.0 Tot. for A/Cs established under the ESLA 1,765,761,633.12 1,614,420,859.19 1,600,466,642.32 (151,340,773.93) (13,954,216.87) -8.57% -0.86% 143,634,339.27 152,863,600.77 35,281,209.19 9,229,261.50 (117,582,391.58) 6.43% -76.92%
5.0 Road Fund 1,314,772,565.85 1,324,294,852.43 1,254,843,511.74 9,522,286.58 (69,451,340.69) 0.72% -5.24% 99,370,694.39 105,449,359.53 93,681,675.80 6,078,665.14 (11,767,683.73) 6.12% -11.16%
6.0 Energy Fund 32,869,314.15 35,265,608.87 33,435,135.40 2,396,294.72 (1,830,473.47) 7.29% -5.19% 2,937,914.53 2,661,221.42 2,364,260.67 (276,693.11) (296,960.75) -9.42% -11.16%
7.0 50% PLL Transfers to MoEn 118,494,362.25 64,273,361.60 11,917,891.66 (54,221,000.65) (52,355,469.94) -45.76% -81.46% 9,787,683.38 5,562,254.06 - (4,225,429.32) (5,562,254.06) -43.17% -100.00%
o/w ECG 91,361,481.45 49,689,082.67 - (41,672,398.78) (49,689,082.67) -45.61% -100.00% 7,833,021.79 4,621,922.41 - (3,211,099.38) (4,621,922.41) -40.99% -100.00%
o/w NEDCO 10,657,334.17 6,182,789.08 - (4,474,545.10) (6,182,789.08) -41.99% -100.00% 848,139.44 441,190.00 - (406,949.44) (441,190.00) -47.98% -100.00%
o/w VRA 16,475,546.63 8,401,489.86 11,917,891.66 (8,074,056.77) 3,516,401.81 -49.01% 41.85% 1,106,522.16 499,141.66 - (607,380.50) (499,141.66) -54.89% -100.00%
8.0 50% PLL Retention by EDCs 118,494,362.25 64,273,361.60 116,628,831.54 (54,221,000.65) 52,355,469.94 -45.76% 81.46% 9,787,683.38 5,562,254.06 11,124,508.13 (4,225,429.32) 5,562,254.06 -43.17% 100.00%
o/w ECG 91,361,481.45 49,689,082.67 99,378,165.33 (41,672,398.78) 49,689,082.67 -45.61% 100.00% 7,833,021.79 4,621,922.41 9,243,844.82 (3,211,099.38) 4,621,922.41 -40.99% 100.00%
o/w NEDCO 10,657,334.17 6,182,789.08 12,365,578.15 (4,474,545.10) 6,182,789.08 -41.99% 100.00% 848,139.44 441,190.00 882,380.00 (406,949.44) 441,190.00 -47.98% 100.00%
o/w VRA 16,475,546.63 8,401,489.86 4,885,088.05 (8,074,056.77) (3,516,401.81) -49.01% -41.85% 1,106,522.16 499,141.66 998,283.31 (607,380.50) 499,141.66 -54.89% 100.00%
9.0 100% NESL transfers into NEF 156,644,541.15 88,210,521.13 70,747,534.38 (68,434,020.02) (17,462,986.75) -43.69% -19.80% 13,059,667.91 7,199,937.90 6,000,000.00 (5,859,730.00) (1,199,937.90) -44.87% -16.67%
o/w ECG 119,802,848.60 65,569,391.23 52,000,000.00 (54,233,457.37) (13,569,391.23) -45.27% -20.69% 10,444,029.05 6,052,297.48 6,000,000.00 (4,391,731.57) (52,297.48) -42.05% -0.86%
o/w NEDCO 14,874,297.05 10,705,571.26 10,705,571.26 (4,168,725.79) - -28.03% 0.00% 1,140,275.98 588,254.00 - (552,021.98) (588,254.00) -48.41% -100.00%
o/w VRA 21,967,395.50 11,935,558.64 8,041,963.12 (10,031,836.86) (3,893,595.52) -45.67% -32.62% 1,475,362.87 559,386.42 - (915,976.45) (559,386.42) -62.08% -100.00%
10.0 Sub-Total Other Accounts/Funds 1,741,275,145.65 1,576,317,705.63 1,487,572,904.72 (164,957,440.03) (88,744,800.91) -9.47% -5.63% 134,943,643.59 126,435,026.98 113,170,444.60 (8,508,616.61) (13,264,582.38) -6.31% -10.49%
11.0 Total Amounts Distributed 3,507,036,778.77 3,190,738,564.82 3,088,039,547.04 (316,298,213.96) (102,699,017.78) -9.02% -3.22% 278,577,982.86 279,298,627.75 148,451,653.79 720,644.89 (130,846,973.96) 0.26% -46.85%
JanuaryJanuary -December 2018
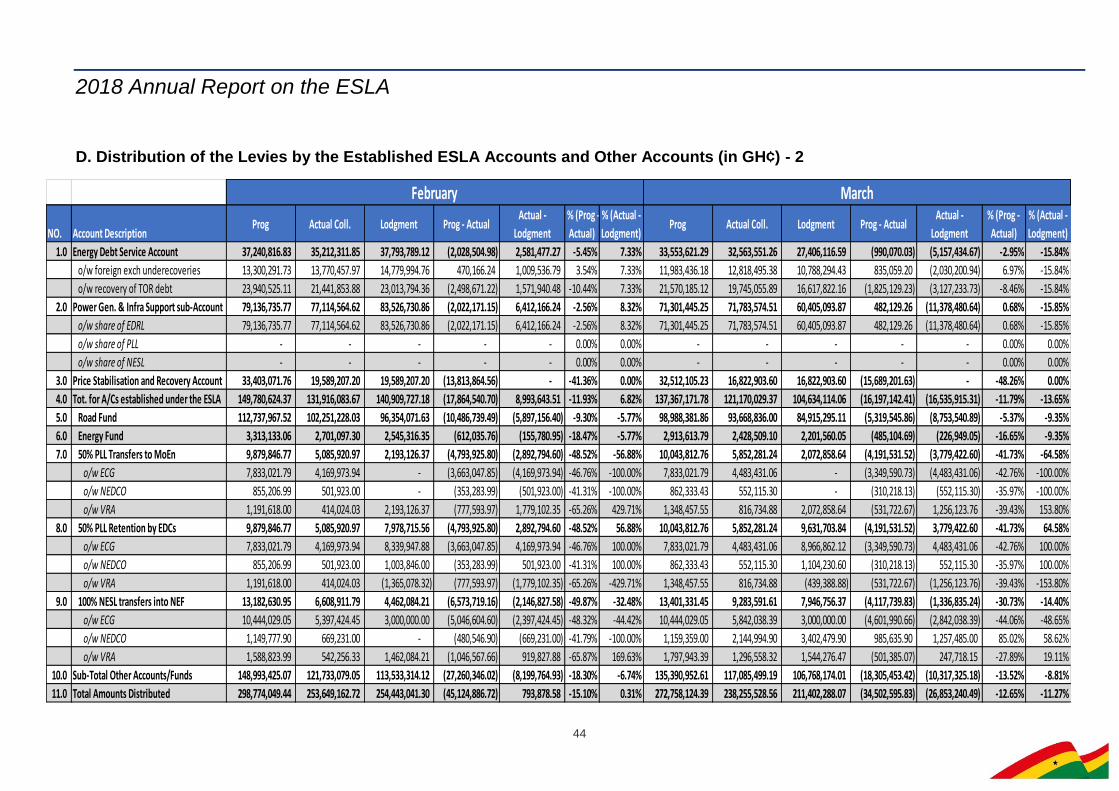
2018 Annual Report on the ESLA
44
D. Distribution of the Levies by the Established ESLA Accounts and Other Accounts (in GH¢) - 2
NO. Account DescriptionProg Actual Coll. Lodgment Prog - Actual
Actual -
Lodgment
% (Prog -
Actual)
% (Actual -
Lodgment)Prog Actual Coll. Lodgment Prog - Actual
Actual -
Lodgment
% (Prog -
Actual)
% (Actual -
Lodgment)
1.0 Energy Debt Service Account 37,240,816.83 35,212,311.85 37,793,789.12 (2,028,504.98) 2,581,477.27 -5.45% 7.33% 33,553,621.29 32,563,551.26 27,406,116.59 (990,070.03) (5,157,434.67) -2.95% -15.84%
o/w foreign exch underecoveries 13,300,291.73 13,770,457.97 14,779,994.76 470,166.24 1,009,536.79 3.54% 7.33% 11,983,436.18 12,818,495.38 10,788,294.43 835,059.20 (2,030,200.94) 6.97% -15.84%
o/w recovery of TOR debt 23,940,525.11 21,441,853.88 23,013,794.36 (2,498,671.22) 1,571,940.48 -10.44% 7.33% 21,570,185.12 19,745,055.89 16,617,822.16 (1,825,129.23) (3,127,233.73) -8.46% -15.84%
2.0 Power Gen. & Infra Support sub-Account 79,136,735.77 77,114,564.62 83,526,730.86 (2,022,171.15) 6,412,166.24 -2.56% 8.32% 71,301,445.25 71,783,574.51 60,405,093.87 482,129.26 (11,378,480.64) 0.68% -15.85%
o/w share of EDRL 79,136,735.77 77,114,564.62 83,526,730.86 (2,022,171.15) 6,412,166.24 -2.56% 8.32% 71,301,445.25 71,783,574.51 60,405,093.87 482,129.26 (11,378,480.64) 0.68% -15.85%
o/w share of PLL - - - - - 0.00% 0.00% - - - - - 0.00% 0.00%
o/w share of NESL - - - - - 0.00% 0.00% - - - - - 0.00% 0.00%
3.0 Price Stabilisation and Recovery Account 33,403,071.76 19,589,207.20 19,589,207.20 (13,813,864.56) - -41.36% 0.00% 32,512,105.23 16,822,903.60 16,822,903.60 (15,689,201.63) - -48.26% 0.00%
4.0 Tot. for A/Cs established under the ESLA 149,780,624.37 131,916,083.67 140,909,727.18 (17,864,540.70) 8,993,643.51 -11.93% 6.82% 137,367,171.78 121,170,029.37 104,634,114.06 (16,197,142.41) (16,535,915.31) -11.79% -13.65%
5.0 Road Fund 112,737,967.52 102,251,228.03 96,354,071.63 (10,486,739.49) (5,897,156.40) -9.30% -5.77% 98,988,381.86 93,668,836.00 84,915,295.11 (5,319,545.86) (8,753,540.89) -5.37% -9.35%
6.0 Energy Fund 3,313,133.06 2,701,097.30 2,545,316.35 (612,035.76) (155,780.95) -18.47% -5.77% 2,913,613.79 2,428,509.10 2,201,560.05 (485,104.69) (226,949.05) -16.65% -9.35%
7.0 50% PLL Transfers to MoEn 9,879,846.77 5,085,920.97 2,193,126.37 (4,793,925.80) (2,892,794.60) -48.52% -56.88% 10,043,812.76 5,852,281.24 2,072,858.64 (4,191,531.52) (3,779,422.60) -41.73% -64.58%
o/w ECG 7,833,021.79 4,169,973.94 - (3,663,047.85) (4,169,973.94) -46.76% -100.00% 7,833,021.79 4,483,431.06 - (3,349,590.73) (4,483,431.06) -42.76% -100.00%
o/w NEDCO 855,206.99 501,923.00 - (353,283.99) (501,923.00) -41.31% -100.00% 862,333.43 552,115.30 - (310,218.13) (552,115.30) -35.97% -100.00%
o/w VRA 1,191,618.00 414,024.03 2,193,126.37 (777,593.97) 1,779,102.35 -65.26% 429.71% 1,348,457.55 816,734.88 2,072,858.64 (531,722.67) 1,256,123.76 -39.43% 153.80%
8.0 50% PLL Retention by EDCs 9,879,846.77 5,085,920.97 7,978,715.56 (4,793,925.80) 2,892,794.60 -48.52% 56.88% 10,043,812.76 5,852,281.24 9,631,703.84 (4,191,531.52) 3,779,422.60 -41.73% 64.58%
o/w ECG 7,833,021.79 4,169,973.94 8,339,947.88 (3,663,047.85) 4,169,973.94 -46.76% 100.00% 7,833,021.79 4,483,431.06 8,966,862.12 (3,349,590.73) 4,483,431.06 -42.76% 100.00%
o/w NEDCO 855,206.99 501,923.00 1,003,846.00 (353,283.99) 501,923.00 -41.31% 100.00% 862,333.43 552,115.30 1,104,230.60 (310,218.13) 552,115.30 -35.97% 100.00%
o/w VRA 1,191,618.00 414,024.03 (1,365,078.32) (777,593.97) (1,779,102.35) -65.26% -429.71% 1,348,457.55 816,734.88 (439,388.88) (531,722.67) (1,256,123.76) -39.43% -153.80%
9.0 100% NESL transfers into NEF 13,182,630.95 6,608,911.79 4,462,084.21 (6,573,719.16) (2,146,827.58) -49.87% -32.48% 13,401,331.45 9,283,591.61 7,946,756.37 (4,117,739.83) (1,336,835.24) -30.73% -14.40%
o/w ECG 10,444,029.05 5,397,424.45 3,000,000.00 (5,046,604.60) (2,397,424.45) -48.32% -44.42% 10,444,029.05 5,842,038.39 3,000,000.00 (4,601,990.66) (2,842,038.39) -44.06% -48.65%
o/w NEDCO 1,149,777.90 669,231.00 - (480,546.90) (669,231.00) -41.79% -100.00% 1,159,359.00 2,144,994.90 3,402,479.90 985,635.90 1,257,485.00 85.02% 58.62%
o/w VRA 1,588,823.99 542,256.33 1,462,084.21 (1,046,567.66) 919,827.88 -65.87% 169.63% 1,797,943.39 1,296,558.32 1,544,276.47 (501,385.07) 247,718.15 -27.89% 19.11%
10.0 Sub-Total Other Accounts/Funds 148,993,425.07 121,733,079.05 113,533,314.12 (27,260,346.02) (8,199,764.93) -18.30% -6.74% 135,390,952.61 117,085,499.19 106,768,174.01 (18,305,453.42) (10,317,325.18) -13.52% -8.81%
11.0 Total Amounts Distributed 298,774,049.44 253,649,162.72 254,443,041.30 (45,124,886.72) 793,878.58 -15.10% 0.31% 272,758,124.39 238,255,528.56 211,402,288.07 (34,502,595.83) (26,853,240.49) -12.65% -11.27%
February March
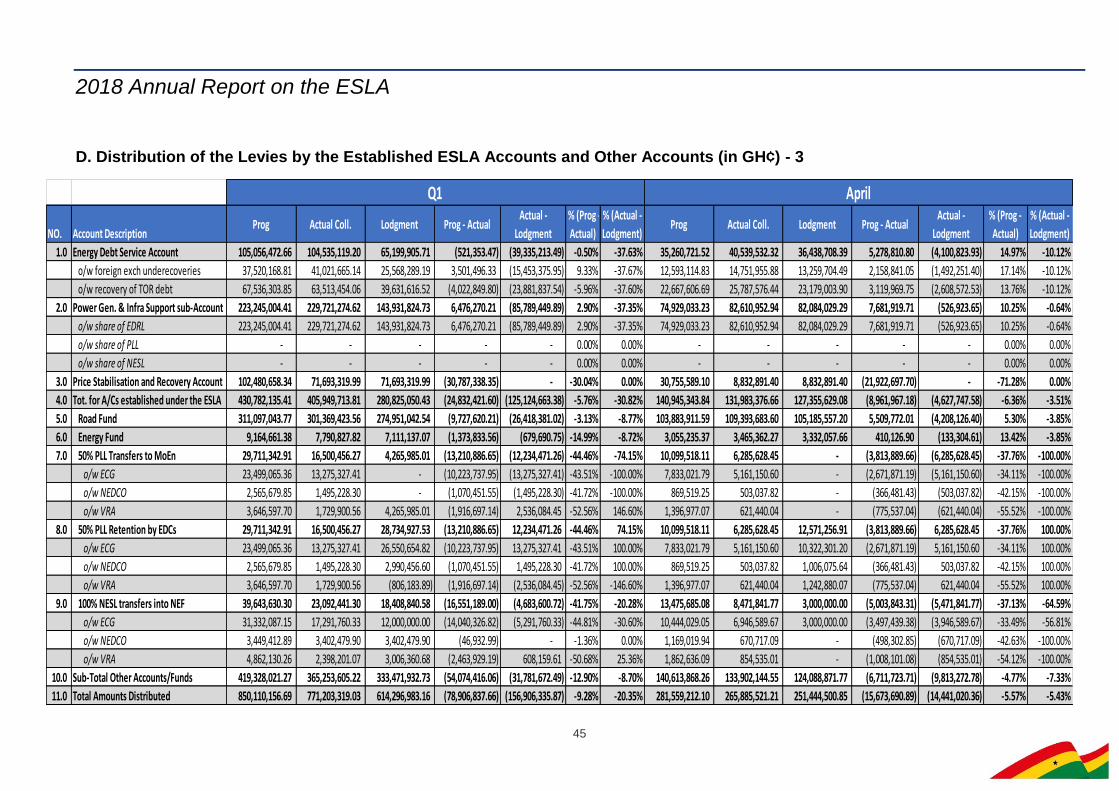
2018 Annual Report on the ESLA
45
D. Distribution of the Levies by the Established ESLA Accounts and Other Accounts (in GH¢) - 3
NO. Account DescriptionProg Actual Coll. Lodgment Prog - Actual
Actual -
Lodgment
% (Prog -
Actual)
% (Actual -
Lodgment)Prog Actual Coll. Lodgment Prog - Actual
Actual -
Lodgment
% (Prog -
Actual)
% (Actual -
Lodgment)
1.0 Energy Debt Service Account 105,056,472.66 104,535,119.20 65,199,905.71 (521,353.47) (39,335,213.49) -0.50% -37.63% 35,260,721.52 40,539,532.32 36,438,708.39 5,278,810.80 (4,100,823.93) 14.97% -10.12%
o/w foreign exch underecoveries 37,520,168.81 41,021,665.14 25,568,289.19 3,501,496.33 (15,453,375.95) 9.33% -37.67% 12,593,114.83 14,751,955.88 13,259,704.49 2,158,841.05 (1,492,251.40) 17.14% -10.12%
o/w recovery of TOR debt 67,536,303.85 63,513,454.06 39,631,616.52 (4,022,849.80) (23,881,837.54) -5.96% -37.60% 22,667,606.69 25,787,576.44 23,179,003.90 3,119,969.75 (2,608,572.53) 13.76% -10.12%
2.0 Power Gen. & Infra Support sub-Account 223,245,004.41 229,721,274.62 143,931,824.73 6,476,270.21 (85,789,449.89) 2.90% -37.35% 74,929,033.23 82,610,952.94 82,084,029.29 7,681,919.71 (526,923.65) 10.25% -0.64%
o/w share of EDRL 223,245,004.41 229,721,274.62 143,931,824.73 6,476,270.21 (85,789,449.89) 2.90% -37.35% 74,929,033.23 82,610,952.94 82,084,029.29 7,681,919.71 (526,923.65) 10.25% -0.64%
o/w share of PLL - - - - - 0.00% 0.00% - - - - - 0.00% 0.00%
o/w share of NESL - - - - - 0.00% 0.00% - - - - - 0.00% 0.00%
3.0 Price Stabilisation and Recovery Account 102,480,658.34 71,693,319.99 71,693,319.99 (30,787,338.35) - -30.04% 0.00% 30,755,589.10 8,832,891.40 8,832,891.40 (21,922,697.70) - -71.28% 0.00%
4.0 Tot. for A/Cs established under the ESLA 430,782,135.41 405,949,713.81 280,825,050.43 (24,832,421.60) (125,124,663.38) -5.76% -30.82% 140,945,343.84 131,983,376.66 127,355,629.08 (8,961,967.18) (4,627,747.58) -6.36% -3.51%
5.0 Road Fund 311,097,043.77 301,369,423.56 274,951,042.54 (9,727,620.21) (26,418,381.02) -3.13% -8.77% 103,883,911.59 109,393,683.60 105,185,557.20 5,509,772.01 (4,208,126.40) 5.30% -3.85%
6.0 Energy Fund 9,164,661.38 7,790,827.82 7,111,137.07 (1,373,833.56) (679,690.75) -14.99% -8.72% 3,055,235.37 3,465,362.27 3,332,057.66 410,126.90 (133,304.61) 13.42% -3.85%
7.0 50% PLL Transfers to MoEn 29,711,342.91 16,500,456.27 4,265,985.01 (13,210,886.65) (12,234,471.26) -44.46% -74.15% 10,099,518.11 6,285,628.45 - (3,813,889.66) (6,285,628.45) -37.76% -100.00%
o/w ECG 23,499,065.36 13,275,327.41 - (10,223,737.95) (13,275,327.41) -43.51% -100.00% 7,833,021.79 5,161,150.60 - (2,671,871.19) (5,161,150.60) -34.11% -100.00%
o/w NEDCO 2,565,679.85 1,495,228.30 - (1,070,451.55) (1,495,228.30) -41.72% -100.00% 869,519.25 503,037.82 - (366,481.43) (503,037.82) -42.15% -100.00%
o/w VRA 3,646,597.70 1,729,900.56 4,265,985.01 (1,916,697.14) 2,536,084.45 -52.56% 146.60% 1,396,977.07 621,440.04 - (775,537.04) (621,440.04) -55.52% -100.00%
8.0 50% PLL Retention by EDCs 29,711,342.91 16,500,456.27 28,734,927.53 (13,210,886.65) 12,234,471.26 -44.46% 74.15% 10,099,518.11 6,285,628.45 12,571,256.91 (3,813,889.66) 6,285,628.45 -37.76% 100.00%
o/w ECG 23,499,065.36 13,275,327.41 26,550,654.82 (10,223,737.95) 13,275,327.41 -43.51% 100.00% 7,833,021.79 5,161,150.60 10,322,301.20 (2,671,871.19) 5,161,150.60 -34.11% 100.00%
o/w NEDCO 2,565,679.85 1,495,228.30 2,990,456.60 (1,070,451.55) 1,495,228.30 -41.72% 100.00% 869,519.25 503,037.82 1,006,075.64 (366,481.43) 503,037.82 -42.15% 100.00%
o/w VRA 3,646,597.70 1,729,900.56 (806,183.89) (1,916,697.14) (2,536,084.45) -52.56% -146.60% 1,396,977.07 621,440.04 1,242,880.07 (775,537.04) 621,440.04 -55.52% 100.00%
9.0 100% NESL transfers into NEF 39,643,630.30 23,092,441.30 18,408,840.58 (16,551,189.00) (4,683,600.72) -41.75% -20.28% 13,475,685.08 8,471,841.77 3,000,000.00 (5,003,843.31) (5,471,841.77) -37.13% -64.59%
o/w ECG 31,332,087.15 17,291,760.33 12,000,000.00 (14,040,326.82) (5,291,760.33) -44.81% -30.60% 10,444,029.05 6,946,589.67 3,000,000.00 (3,497,439.38) (3,946,589.67) -33.49% -56.81%
o/w NEDCO 3,449,412.89 3,402,479.90 3,402,479.90 (46,932.99) - -1.36% 0.00% 1,169,019.94 670,717.09 - (498,302.85) (670,717.09) -42.63% -100.00%
o/w VRA 4,862,130.26 2,398,201.07 3,006,360.68 (2,463,929.19) 608,159.61 -50.68% 25.36% 1,862,636.09 854,535.01 - (1,008,101.08) (854,535.01) -54.12% -100.00%
10.0 Sub-Total Other Accounts/Funds 419,328,021.27 365,253,605.22 333,471,932.73 (54,074,416.06) (31,781,672.49) -12.90% -8.70% 140,613,868.26 133,902,144.55 124,088,871.77 (6,711,723.71) (9,813,272.78) -4.77% -7.33%
11.0 Total Amounts Distributed 850,110,156.69 771,203,319.03 614,296,983.16 (78,906,837.66) (156,906,335.87) -9.28% -20.35% 281,559,212.10 265,885,521.21 251,444,500.85 (15,673,690.89) (14,441,020.36) -5.57% -5.43%
Q1 April
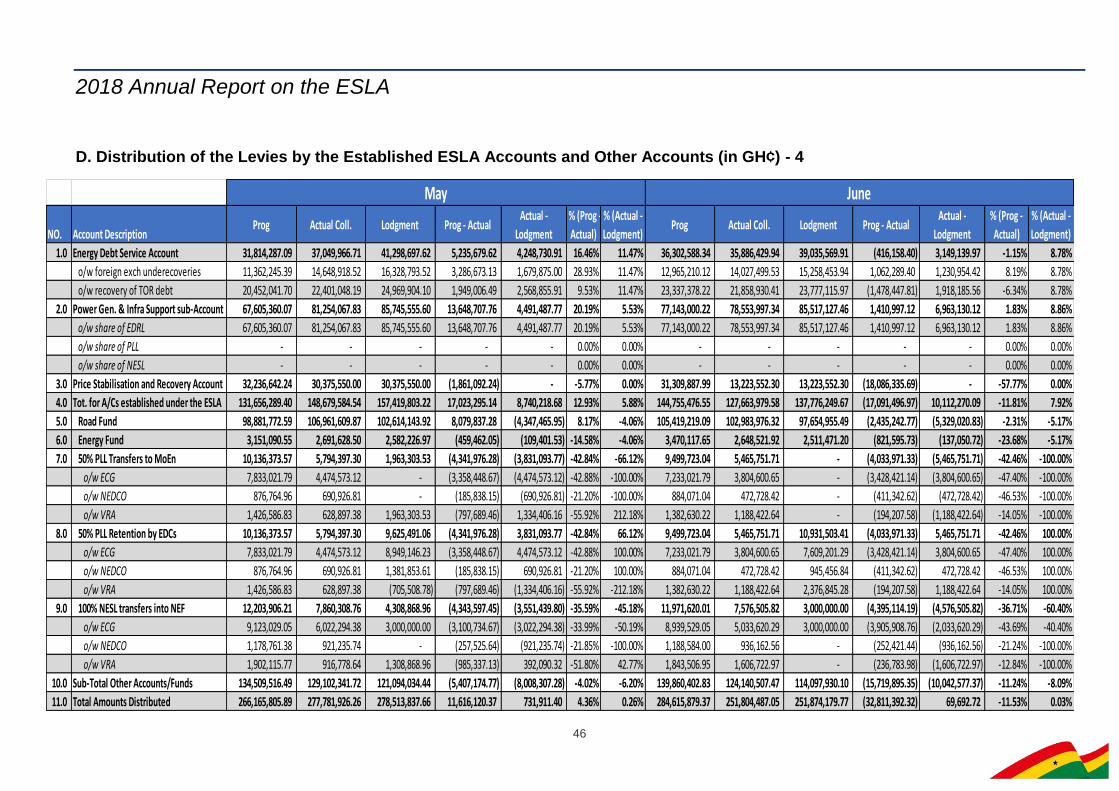
2018 Annual Report on the ESLA
46
D. Distribution of the Levies by the Established ESLA Accounts and Other Accounts (in GH¢) - 4
NO. Account DescriptionProg Actual Coll. Lodgment Prog - Actual
Actual -
Lodgment
% (Prog -
Actual)
% (Actual -
Lodgment)Prog Actual Coll. Lodgment Prog - Actual
Actual -
Lodgment
% (Prog -
Actual)
% (Actual -
Lodgment)
1.0 Energy Debt Service Account 31,814,287.09 37,049,966.71 41,298,697.62 5,235,679.62 4,248,730.91 16.46% 11.47% 36,302,588.34 35,886,429.94 39,035,569.91 (416,158.40) 3,149,139.97 -1.15% 8.78%
o/w foreign exch underecoveries 11,362,245.39 14,648,918.52 16,328,793.52 3,286,673.13 1,679,875.00 28.93% 11.47% 12,965,210.12 14,027,499.53 15,258,453.94 1,062,289.40 1,230,954.42 8.19% 8.78%
o/w recovery of TOR debt 20,452,041.70 22,401,048.19 24,969,904.10 1,949,006.49 2,568,855.91 9.53% 11.47% 23,337,378.22 21,858,930.41 23,777,115.97 (1,478,447.81) 1,918,185.56 -6.34% 8.78%
2.0 Power Gen. & Infra Support sub-Account 67,605,360.07 81,254,067.83 85,745,555.60 13,648,707.76 4,491,487.77 20.19% 5.53% 77,143,000.22 78,553,997.34 85,517,127.46 1,410,997.12 6,963,130.12 1.83% 8.86%
o/w share of EDRL 67,605,360.07 81,254,067.83 85,745,555.60 13,648,707.76 4,491,487.77 20.19% 5.53% 77,143,000.22 78,553,997.34 85,517,127.46 1,410,997.12 6,963,130.12 1.83% 8.86%
o/w share of PLL - - - - - 0.00% 0.00% - - - - - 0.00% 0.00%
o/w share of NESL - - - - - 0.00% 0.00% - - - - - 0.00% 0.00%
3.0 Price Stabilisation and Recovery Account 32,236,642.24 30,375,550.00 30,375,550.00 (1,861,092.24) - -5.77% 0.00% 31,309,887.99 13,223,552.30 13,223,552.30 (18,086,335.69) - -57.77% 0.00%
4.0 Tot. for A/Cs established under the ESLA 131,656,289.40 148,679,584.54 157,419,803.22 17,023,295.14 8,740,218.68 12.93% 5.88% 144,755,476.55 127,663,979.58 137,776,249.67 (17,091,496.97) 10,112,270.09 -11.81% 7.92%
5.0 Road Fund 98,881,772.59 106,961,609.87 102,614,143.92 8,079,837.28 (4,347,465.95) 8.17% -4.06% 105,419,219.09 102,983,976.32 97,654,955.49 (2,435,242.77) (5,329,020.83) -2.31% -5.17%
6.0 Energy Fund 3,151,090.55 2,691,628.50 2,582,226.97 (459,462.05) (109,401.53) -14.58% -4.06% 3,470,117.65 2,648,521.92 2,511,471.20 (821,595.73) (137,050.72) -23.68% -5.17%
7.0 50% PLL Transfers to MoEn 10,136,373.57 5,794,397.30 1,963,303.53 (4,341,976.28) (3,831,093.77) -42.84% -66.12% 9,499,723.04 5,465,751.71 - (4,033,971.33) (5,465,751.71) -42.46% -100.00%
o/w ECG 7,833,021.79 4,474,573.12 - (3,358,448.67) (4,474,573.12) -42.88% -100.00% 7,233,021.79 3,804,600.65 - (3,428,421.14) (3,804,600.65) -47.40% -100.00%
o/w NEDCO 876,764.96 690,926.81 - (185,838.15) (690,926.81) -21.20% -100.00% 884,071.04 472,728.42 - (411,342.62) (472,728.42) -46.53% -100.00%
o/w VRA 1,426,586.83 628,897.38 1,963,303.53 (797,689.46) 1,334,406.16 -55.92% 212.18% 1,382,630.22 1,188,422.64 - (194,207.58) (1,188,422.64) -14.05% -100.00%
8.0 50% PLL Retention by EDCs 10,136,373.57 5,794,397.30 9,625,491.06 (4,341,976.28) 3,831,093.77 -42.84% 66.12% 9,499,723.04 5,465,751.71 10,931,503.41 (4,033,971.33) 5,465,751.71 -42.46% 100.00%
o/w ECG 7,833,021.79 4,474,573.12 8,949,146.23 (3,358,448.67) 4,474,573.12 -42.88% 100.00% 7,233,021.79 3,804,600.65 7,609,201.29 (3,428,421.14) 3,804,600.65 -47.40% 100.00%
o/w NEDCO 876,764.96 690,926.81 1,381,853.61 (185,838.15) 690,926.81 -21.20% 100.00% 884,071.04 472,728.42 945,456.84 (411,342.62) 472,728.42 -46.53% 100.00%
o/w VRA 1,426,586.83 628,897.38 (705,508.78) (797,689.46) (1,334,406.16) -55.92% -212.18% 1,382,630.22 1,188,422.64 2,376,845.28 (194,207.58) 1,188,422.64 -14.05% 100.00%
9.0 100% NESL transfers into NEF 12,203,906.21 7,860,308.76 4,308,868.96 (4,343,597.45) (3,551,439.80) -35.59% -45.18% 11,971,620.01 7,576,505.82 3,000,000.00 (4,395,114.19) (4,576,505.82) -36.71% -60.40%
o/w ECG 9,123,029.05 6,022,294.38 3,000,000.00 (3,100,734.67) (3,022,294.38) -33.99% -50.19% 8,939,529.05 5,033,620.29 3,000,000.00 (3,905,908.76) (2,033,620.29) -43.69% -40.40%
o/w NEDCO 1,178,761.38 921,235.74 - (257,525.64) (921,235.74) -21.85% -100.00% 1,188,584.00 936,162.56 - (252,421.44) (936,162.56) -21.24% -100.00%
o/w VRA 1,902,115.77 916,778.64 1,308,868.96 (985,337.13) 392,090.32 -51.80% 42.77% 1,843,506.95 1,606,722.97 - (236,783.98) (1,606,722.97) -12.84% -100.00%
10.0 Sub-Total Other Accounts/Funds 134,509,516.49 129,102,341.72 121,094,034.44 (5,407,174.77) (8,008,307.28) -4.02% -6.20% 139,860,402.83 124,140,507.47 114,097,930.10 (15,719,895.35) (10,042,577.37) -11.24% -8.09%
11.0 Total Amounts Distributed 266,165,805.89 277,781,926.26 278,513,837.66 11,616,120.37 731,911.40 4.36% 0.26% 284,615,879.37 251,804,487.05 251,874,179.77 (32,811,392.32) 69,692.72 -11.53% 0.03%
May June

2018 Annual Report on the ESLA
47
D. Distribution of the Levies by the Established ESLA Accounts and Other Accounts (in GH¢) - 5
NO. Account DescriptionProg Actual Coll. Lodgment Prog - Actual
Actual -
Lodgment
% (Prog -
Actual)
% (Actual -
Lodgment)Prog Actual Coll. Lodgment Prog - Actual
Actual -
Lodgment
% (Prog -
Actual)
% (Actual -
Lodgment)
1.0 Energy Debt Service Account 103,377,596.95 113,475,928.96 116,772,975.92 10,098,332.02 3,297,046.96 9.77% 2.91% 208,434,069.61 218,011,048.16 181,972,881.63 9,576,978.55 (36,038,166.53) 4.59% -16.53%
o/w foreign exch underecoveries 36,920,570.34 43,428,373.93 44,846,951.95 6,507,803.59 1,418,578.03 17.63% 3.27% 74,440,739.15 84,450,039.07 70,415,241.14 10,009,299.92 (14,034,797.93) 13.45% -16.62%
o/w recovery of TOR debt 66,457,026.61 70,047,555.04 71,926,023.97 3,590,528.43 1,878,468.93 5.40% 2.68% 133,993,330.46 133,561,009.10 111,557,640.49 (432,321.37) (22,003,368.61) -0.32% -16.47%
2.0 Power Gen. & Infra Support sub-Account 219,677,393.52 242,419,018.12 253,346,712.35 22,741,624.60 10,927,694.23 10.35% 4.51% 442,922,397.93 472,140,292.74 397,278,537.08 29,217,894.81 (74,861,755.66) 6.60% -15.86%
o/w share of EDRL 219,677,393.52 242,419,018.12 253,346,712.35 22,741,624.60 10,927,694.23 10.35% 4.51% 442,922,397.93 472,140,292.74 397,278,537.08 29,217,894.81 (74,861,755.66) 6.60% -15.86%
o/w share of PLL - - - - - 0.00% 0.00% - - - - - 0.00% 0.00%
o/w share of NESL - - - - - 0.00% 0.00% - - - - - 0.00% 0.00%
3.0 Price Stabilisation and Recovery Account 94,302,119.33 52,431,993.70 52,431,993.70 (41,870,125.63) - -44.40% 0.00% 196,782,777.67 124,125,313.69 124,125,313.69 (72,657,463.98) - -36.92% 0.00%
4.0 Tot. for A/Cs established under the ESLA 417,357,109.79 408,326,940.78 422,551,681.97 (9,030,169.01) 14,224,741.19 -2.16% 3.48% 848,139,245.20 814,276,654.59 703,376,732.40 (33,862,590.61) (110,899,922.19) -3.99% -13.62%
5.0 Road Fund 308,184,903.27 319,339,269.79 305,454,656.61 11,154,366.52 (13,884,613.18) 3.62% -4.35% 619,281,947.03 620,708,693.35 580,405,699.15 1,426,746.32 (40,302,994.20) 0.23% -6.49%
6.0 Energy Fund 9,676,443.57 8,805,512.69 8,425,755.83 (870,930.88) (379,756.86) -9.00% -4.31% 18,841,104.95 16,596,340.51 15,536,892.90 (2,244,764.44) (1,059,447.61) -11.91% -6.38%
7.0 50% PLL Transfers to MoEn 29,735,614.72 17,545,777.46 1,963,303.53 (12,189,837.27) (15,582,473.93) -40.99% -88.81% 59,446,957.64 34,046,233.72 6,229,288.54 (25,400,723.91) (27,816,945.18) -42.73% -81.70%
o/w ECG 22,899,065.36 13,440,324.36 - (9,458,741.00) (13,440,324.36) -41.31% -100.00% 46,398,130.73 26,715,651.77 - (19,682,478.96) (26,715,651.77) -42.42% -100.00%
o/w NEDCO 2,630,355.24 1,666,693.05 - (963,662.20) (1,666,693.05) -36.64% -100.00% 5,196,035.10 3,161,921.35 - (2,034,113.75) (3,161,921.35) -39.15% -100.00%
o/w VRA 4,206,194.12 2,438,760.05 1,963,303.53 (1,767,434.07) (475,456.52) -42.02% -19.50% 7,852,791.81 4,168,660.61 6,229,288.54 (3,684,131.20) 2,060,627.93 -46.91% 49.43%
8.0 50% PLL Retention by EDCs 29,735,614.72 17,545,777.46 33,128,251.38 (12,189,837.27) 15,582,473.93 -40.99% 88.81% 59,446,957.64 34,046,233.72 61,863,178.91 (25,400,723.91) 27,816,945.18 -42.73% 81.70%
o/w ECG 22,899,065.36 13,440,324.36 26,880,648.72 (9,458,741.00) 13,440,324.36 -41.31% 100.00% 46,398,130.73 26,715,651.77 53,431,303.54 (19,682,478.96) 26,715,651.77 -42.42% 100.00%
o/w NEDCO 2,630,355.24 1,666,693.05 3,333,386.09 (963,662.20) 1,666,693.05 -36.64% 100.00% 5,196,035.10 3,161,921.35 6,323,842.69 (2,034,113.75) 3,161,921.35 -39.15% 100.00%
o/w VRA 4,206,194.12 2,438,760.05 2,914,216.57 (1,767,434.07) 475,456.52 -42.02% 19.50% 7,852,791.81 4,168,660.61 2,108,032.68 (3,684,131.20) (2,060,627.93) -46.91% -49.43%
9.0 100% NESL transfers into NEF 37,651,211.30 23,908,656.34 10,308,868.96 (13,742,554.95) (13,599,787.38) -36.50% -56.88% 77,294,841.59 47,001,097.65 28,717,709.54 (30,293,743.95) (18,283,388.11) -39.19% -38.90%
o/w ECG 28,506,587.15 18,002,504.33 9,000,000.00 (10,504,082.82) (9,002,504.33) -36.85% -50.01% 59,838,674.30 35,294,264.66 21,000,000.00 (24,544,409.64) (14,294,264.66) -41.02% -40.50%
o/w NEDCO 3,536,365.33 2,528,115.39 - (1,008,249.93) (2,528,115.39) -28.51% -100.00% 6,985,778.21 5,930,595.29 3,402,479.90 (1,055,182.92) (2,528,115.39) -15.10% -42.63%
o/w VRA 5,608,258.82 3,378,036.62 1,308,868.96 (2,230,222.20) (2,069,167.66) -39.77% -61.25% 10,470,389.08 5,776,237.69 4,315,229.64 (4,694,151.39) (1,461,008.05) -44.83% -25.29%
10.0 Sub-Total Other Accounts/Funds 414,983,787.57 387,144,993.74 359,280,836.31 (27,838,793.84) (27,864,157.42) -6.71% -7.20% 834,311,808.85 752,398,598.95 692,752,769.04 (81,913,209.89) (59,645,829.92) -9.82% -7.93%
11.0 Total Amounts Distributed 832,340,897.36 795,471,934.52 781,832,518.28 (36,868,962.85) (13,639,416.23) -4.43% -1.71% 1,682,451,054.05 1,566,675,253.54 1,396,129,501.44 (115,775,800.51) (170,545,752.11) -6.88% -10.89%
Q2 Q1+Q2
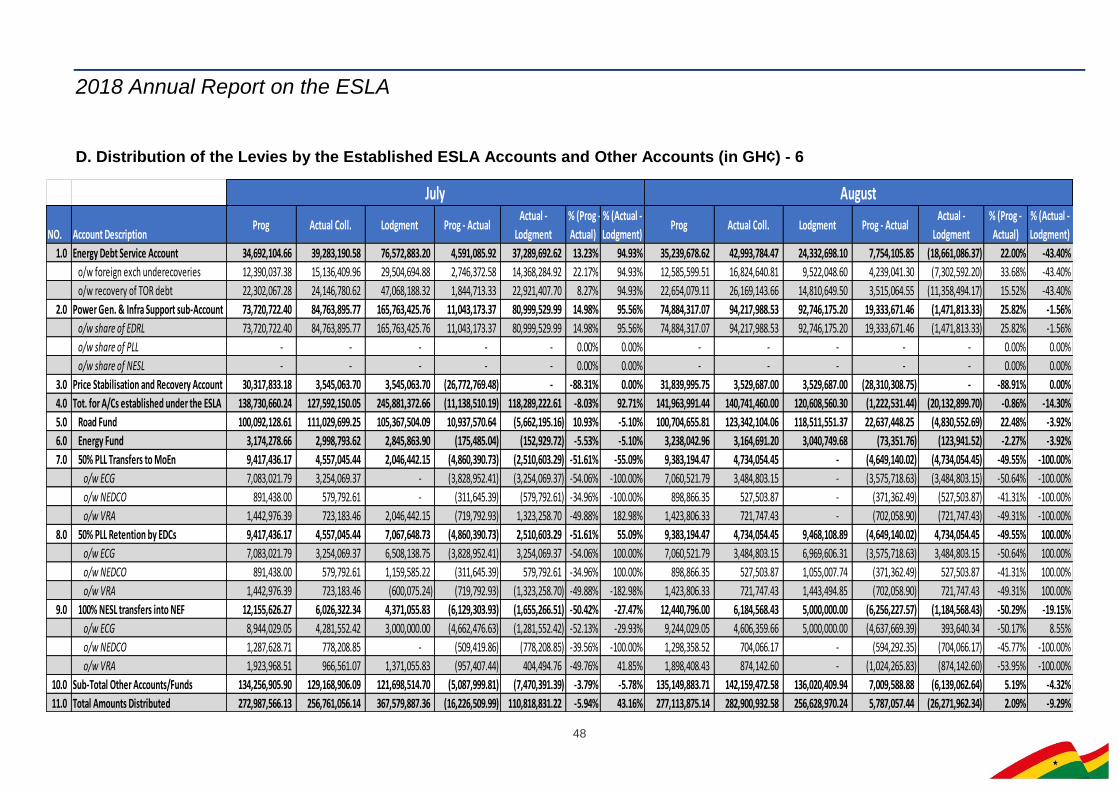
2018 Annual Report on the ESLA
48
D. Distribution of the Levies by the Established ESLA Accounts and Other Accounts (in GH¢) - 6
NO. Account DescriptionProg Actual Coll. Lodgment Prog - Actual
Actual -
Lodgment
% (Prog -
Actual)
% (Actual -
Lodgment)Prog Actual Coll. Lodgment Prog - Actual
Actual -
Lodgment
% (Prog -
Actual)
% (Actual -
Lodgment)
1.0 Energy Debt Service Account 34,692,104.66 39,283,190.58 76,572,883.20 4,591,085.92 37,289,692.62 13.23% 94.93% 35,239,678.62 42,993,784.47 24,332,698.10 7,754,105.85 (18,661,086.37) 22.00% -43.40%
o/w foreign exch underecoveries 12,390,037.38 15,136,409.96 29,504,694.88 2,746,372.58 14,368,284.92 22.17% 94.93% 12,585,599.51 16,824,640.81 9,522,048.60 4,239,041.30 (7,302,592.20) 33.68% -43.40%
o/w recovery of TOR debt 22,302,067.28 24,146,780.62 47,068,188.32 1,844,713.33 22,921,407.70 8.27% 94.93% 22,654,079.11 26,169,143.66 14,810,649.50 3,515,064.55 (11,358,494.17) 15.52% -43.40%
2.0 Power Gen. & Infra Support sub-Account 73,720,722.40 84,763,895.77 165,763,425.76 11,043,173.37 80,999,529.99 14.98% 95.56% 74,884,317.07 94,217,988.53 92,746,175.20 19,333,671.46 (1,471,813.33) 25.82% -1.56%
o/w share of EDRL 73,720,722.40 84,763,895.77 165,763,425.76 11,043,173.37 80,999,529.99 14.98% 95.56% 74,884,317.07 94,217,988.53 92,746,175.20 19,333,671.46 (1,471,813.33) 25.82% -1.56%
o/w share of PLL - - - - - 0.00% 0.00% - - - - - 0.00% 0.00%
o/w share of NESL - - - - - 0.00% 0.00% - - - - - 0.00% 0.00%
3.0 Price Stabilisation and Recovery Account 30,317,833.18 3,545,063.70 3,545,063.70 (26,772,769.48) - -88.31% 0.00% 31,839,995.75 3,529,687.00 3,529,687.00 (28,310,308.75) - -88.91% 0.00%
4.0 Tot. for A/Cs established under the ESLA 138,730,660.24 127,592,150.05 245,881,372.66 (11,138,510.19) 118,289,222.61 -8.03% 92.71% 141,963,991.44 140,741,460.00 120,608,560.30 (1,222,531.44) (20,132,899.70) -0.86% -14.30%
5.0 Road Fund 100,092,128.61 111,029,699.25 105,367,504.09 10,937,570.64 (5,662,195.16) 10.93% -5.10% 100,704,655.81 123,342,104.06 118,511,551.37 22,637,448.25 (4,830,552.69) 22.48% -3.92%
6.0 Energy Fund 3,174,278.66 2,998,793.62 2,845,863.90 (175,485.04) (152,929.72) -5.53% -5.10% 3,238,042.96 3,164,691.20 3,040,749.68 (73,351.76) (123,941.52) -2.27% -3.92%
7.0 50% PLL Transfers to MoEn 9,417,436.17 4,557,045.44 2,046,442.15 (4,860,390.73) (2,510,603.29) -51.61% -55.09% 9,383,194.47 4,734,054.45 - (4,649,140.02) (4,734,054.45) -49.55% -100.00%
o/w ECG 7,083,021.79 3,254,069.37 - (3,828,952.41) (3,254,069.37) -54.06% -100.00% 7,060,521.79 3,484,803.15 - (3,575,718.63) (3,484,803.15) -50.64% -100.00%
o/w NEDCO 891,438.00 579,792.61 - (311,645.39) (579,792.61) -34.96% -100.00% 898,866.35 527,503.87 - (371,362.49) (527,503.87) -41.31% -100.00%
o/w VRA 1,442,976.39 723,183.46 2,046,442.15 (719,792.93) 1,323,258.70 -49.88% 182.98% 1,423,806.33 721,747.43 - (702,058.90) (721,747.43) -49.31% -100.00%
8.0 50% PLL Retention by EDCs 9,417,436.17 4,557,045.44 7,067,648.73 (4,860,390.73) 2,510,603.29 -51.61% 55.09% 9,383,194.47 4,734,054.45 9,468,108.89 (4,649,140.02) 4,734,054.45 -49.55% 100.00%
o/w ECG 7,083,021.79 3,254,069.37 6,508,138.75 (3,828,952.41) 3,254,069.37 -54.06% 100.00% 7,060,521.79 3,484,803.15 6,969,606.31 (3,575,718.63) 3,484,803.15 -50.64% 100.00%
o/w NEDCO 891,438.00 579,792.61 1,159,585.22 (311,645.39) 579,792.61 -34.96% 100.00% 898,866.35 527,503.87 1,055,007.74 (371,362.49) 527,503.87 -41.31% 100.00%
o/w VRA 1,442,976.39 723,183.46 (600,075.24) (719,792.93) (1,323,258.70) -49.88% -182.98% 1,423,806.33 721,747.43 1,443,494.85 (702,058.90) 721,747.43 -49.31% 100.00%
9.0 100% NESL transfers into NEF 12,155,626.27 6,026,322.34 4,371,055.83 (6,129,303.93) (1,655,266.51) -50.42% -27.47% 12,440,796.00 6,184,568.43 5,000,000.00 (6,256,227.57) (1,184,568.43) -50.29% -19.15%
o/w ECG 8,944,029.05 4,281,552.42 3,000,000.00 (4,662,476.63) (1,281,552.42) -52.13% -29.93% 9,244,029.05 4,606,359.66 5,000,000.00 (4,637,669.39) 393,640.34 -50.17% 8.55%
o/w NEDCO 1,287,628.71 778,208.85 - (509,419.86) (778,208.85) -39.56% -100.00% 1,298,358.52 704,066.17 - (594,292.35) (704,066.17) -45.77% -100.00%
o/w VRA 1,923,968.51 966,561.07 1,371,055.83 (957,407.44) 404,494.76 -49.76% 41.85% 1,898,408.43 874,142.60 - (1,024,265.83) (874,142.60) -53.95% -100.00%
10.0 Sub-Total Other Accounts/Funds 134,256,905.90 129,168,906.09 121,698,514.70 (5,087,999.81) (7,470,391.39) -3.79% -5.78% 135,149,883.71 142,159,472.58 136,020,409.94 7,009,588.88 (6,139,062.64) 5.19% -4.32%
11.0 Total Amounts Distributed 272,987,566.13 256,761,056.14 367,579,887.36 (16,226,509.99) 110,818,831.22 -5.94% 43.16% 277,113,875.14 282,900,932.58 256,628,970.24 5,787,057.44 (26,271,962.34) 2.09% -9.29%
July August

2018 Annual Report on the ESLA
49
D. Distribution of the Levies by the Established ESLA Accounts and Other Accounts (in GH¢) - 7
NO. Account DescriptionProg Actual Coll. Lodgment Prog - Actual
Actual -
Lodgment
% (Prog -
Actual)
% (Actual -
Lodgment)Prog Actual Coll. Lodgment Prog - Actual
Actual -
Lodgment
% (Prog -
Actual)
% (Actual -
Lodgment)
1.0 Energy Debt Service Account 39,626,685.30 42,074,719.15 56,687,031.43 2,448,033.85 14,612,312.28 6.18% 34.73% 109,558,468.58 124,351,694.20 157,592,612.73 14,793,225.62 33,240,918.53 13.50% 26.73%
o/w foreign exch underecoveries 14,152,387.61 15,878,883.61 21,393,530.19 1,726,496.01 5,514,646.58 12.20% 34.73% 39,128,024.49 47,839,934.38 60,420,273.68 8,711,909.89 12,580,339.30 22.27% 26.30%
o/w recovery of TOR debt 25,474,297.69 26,195,835.54 35,293,501.24 721,537.85 9,097,665.70 2.83% 34.73% 70,430,444.08 76,511,759.82 97,172,339.05 6,081,315.73 20,660,579.24 8.63% 27.00%
2.0 Power Gen. & Infra Support sub-Account 84,206,706.26 88,921,748.21 86,755,740.33 4,715,041.95 (2,166,007.88) 5.60% -2.44% 232,811,745.72 267,903,632.51 345,265,341.29 35,091,886.79 77,361,708.78 15.07% 28.88%
o/w share of EDRL 84,206,706.26 88,921,748.21 86,755,740.33 4,715,041.95 (2,166,007.88) 5.60% -2.44% 232,811,745.72 267,903,632.51 345,265,341.29 35,091,886.79 77,361,708.78 15.07% 28.88%
o/w share of PLL - - - - - 0.00% 0.00% - - - - - 0.00% 0.00%
o/w share of NESL - - - - - 0.00% 0.00% - - - - - 0.00% 0.00%
3.0 Price Stabilisation and Recovery Account 34,425,388.74 2,818,127.50 2,818,127.50 (31,607,261.24) - -91.81% 0.00% 96,583,217.67 9,892,878.20 9,892,878.20 (86,690,339.47) - -89.76% 0.00%
4.0 Tot. for A/Cs established under the ESLA 158,258,780.29 133,814,594.86 146,260,899.26 (24,444,185.43) 12,446,304.40 -15.45% 9.30% 438,953,431.97 402,148,204.91 512,750,832.22 (36,805,227.06) 110,602,627.31 -8.38% 27.50%
5.0 Road Fund 104,967,749.58 117,274,273.36 113,608,961.45 12,306,523.78 (3,665,311.91) 11.72% -3.13% 305,764,534.00 351,646,076.67 337,488,016.91 45,881,542.67 (14,158,059.76) 15.01% -4.03%
6.0 Energy Fund 3,288,871.96 3,355,763.54 3,250,881.88 66,891.58 (104,881.66) 2.03% -3.13% 9,701,193.59 9,519,248.36 9,137,495.46 (181,945.23) (381,752.90) -1.88% -4.01%
7.0 50% PLL Transfers to MoEn 9,627,811.02 4,412,912.83 - (5,214,898.19) (4,412,912.83) -54.16% -100.00% 28,428,441.66 13,704,012.72 2,046,442.15 (14,724,428.94) (11,657,570.57) -51.79% -85.07%
o/w ECG 7,320,741.79 3,211,895.28 - (4,108,846.51) (3,211,895.28) -56.13% -100.00% 21,464,285.36 9,950,767.81 - (11,513,517.56) (9,950,767.81) -53.64% -100.00%
o/w NEDCO 906,356.61 489,703.19 - (416,653.41) (489,703.19) -45.97% -100.00% 2,696,660.96 1,596,999.67 - (1,099,661.29) (1,596,999.67) -40.78% -100.00%
o/w VRA 1,400,712.63 711,314.36 - (689,398.27) (711,314.36) -49.22% -100.00% 4,267,495.34 2,156,245.24 2,046,442.15 (2,111,250.10) (109,803.09) -49.47% -5.09%
8.0 50% PLL Retention by EDCs 9,627,811.02 4,412,912.83 8,825,825.67 (5,214,898.19) 4,412,912.83 -54.16% 100.00% 28,428,441.66 13,704,012.72 25,361,583.29 (14,724,428.94) 11,657,570.57 -51.79% 85.07%
o/w ECG 7,320,741.79 3,211,895.28 6,423,790.56 (4,108,846.51) 3,211,895.28 -56.13% 100.00% 21,464,285.36 9,950,767.81 19,901,535.61 (11,513,517.56) 9,950,767.81 -53.64% 100.00%
o/w NEDCO 906,356.61 489,703.19 979,406.39 (416,653.41) 489,703.19 -45.97% 100.00% 2,696,660.96 1,596,999.67 3,193,999.35 (1,099,661.29) 1,596,999.67 -40.78% 100.00%
o/w VRA 1,400,712.63 711,314.36 1,422,628.72 (689,398.27) 711,314.36 -49.22% 100.00% 4,267,495.34 2,156,245.24 2,266,048.33 (2,111,250.10) 109,803.09 -49.47% 5.09%
9.0 100% NESL transfers into NEF 13,620,823.62 5,867,703.02 4,000,000.00 (7,753,120.61) (1,867,703.02) -56.92% -31.83% 38,217,245.89 18,078,593.78 13,371,055.83 (20,138,652.11) (4,707,537.95) -52.70% -26.04%
o/w ECG 10,444,029.05 4,147,747.35 4,000,000.00 (6,296,281.70) (147,747.35) -60.29% -3.56% 28,632,087.15 13,035,659.43 12,000,000.00 (15,596,427.72) (1,035,659.43) -54.47% -7.94%
o/w NEDCO 1,309,177.74 652,082.93 - (657,094.81) (652,082.93) -50.19% -100.00% 3,895,164.96 2,134,357.95 - (1,760,807.02) (2,134,357.95) -45.20% -100.00%
o/w VRA 1,867,616.83 1,067,872.74 - (799,744.09) (1,067,872.74) -42.82% -100.00% 5,689,993.78 2,908,576.41 1,371,055.83 (2,781,417.37) (1,537,520.58) -48.88% -52.86%
10.0 Sub-Total Other Accounts/Funds 141,133,067.20 135,323,565.58 129,685,669.00 (5,809,501.62) (5,637,896.59) -4.12% -4.17% 410,539,856.81 406,651,944.25 387,404,593.64 (3,887,912.55) (19,247,350.61) -0.95% -4.73%
11.0 Total Amounts Distributed 299,391,847.49 269,138,160.44 275,946,568.26 (30,253,687.05) 6,808,407.81 -10.11% 2.53% 849,493,288.77 808,800,149.16 900,155,425.86 (40,693,139.61) 91,355,276.70 -4.79% 11.30%
Q3September
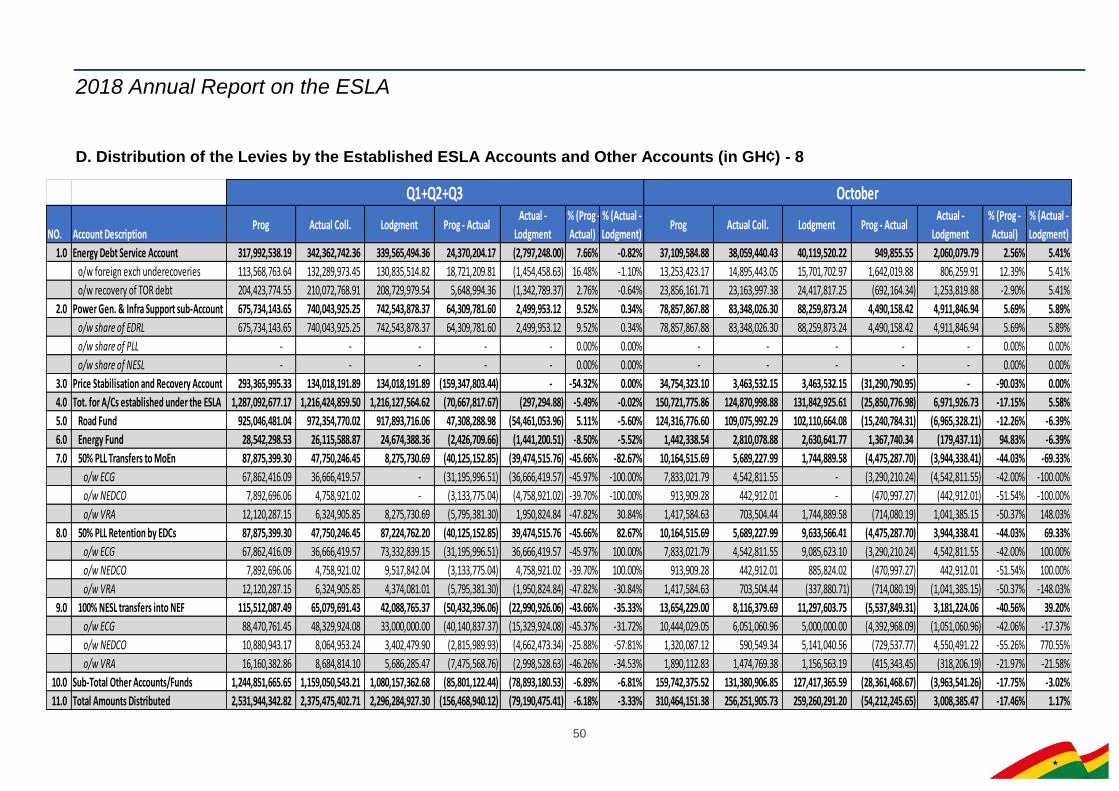
2018 Annual Report on the ESLA
50
D. Distribution of the Levies by the Established ESLA Accounts and Other Accounts (in GH¢) - 8
NO. Account DescriptionProg Actual Coll. Lodgment Prog - Actual
Actual -
Lodgment
% (Prog -
Actual)
% (Actual -
Lodgment)Prog Actual Coll. Lodgment Prog - Actual
Actual -
Lodgment
% (Prog -
Actual)
% (Actual -
Lodgment)
1.0 Energy Debt Service Account 317,992,538.19 342,362,742.36 339,565,494.36 24,370,204.17 (2,797,248.00) 7.66% -0.82% 37,109,584.88 38,059,440.43 40,119,520.22 949,855.55 2,060,079.79 2.56% 5.41%
o/w foreign exch underecoveries 113,568,763.64 132,289,973.45 130,835,514.82 18,721,209.81 (1,454,458.63) 16.48% -1.10% 13,253,423.17 14,895,443.05 15,701,702.97 1,642,019.88 806,259.91 12.39% 5.41%
o/w recovery of TOR debt 204,423,774.55 210,072,768.91 208,729,979.54 5,648,994.36 (1,342,789.37) 2.76% -0.64% 23,856,161.71 23,163,997.38 24,417,817.25 (692,164.34) 1,253,819.88 -2.90% 5.41%
2.0 Power Gen. & Infra Support sub-Account 675,734,143.65 740,043,925.25 742,543,878.37 64,309,781.60 2,499,953.12 9.52% 0.34% 78,857,867.88 83,348,026.30 88,259,873.24 4,490,158.42 4,911,846.94 5.69% 5.89%
o/w share of EDRL 675,734,143.65 740,043,925.25 742,543,878.37 64,309,781.60 2,499,953.12 9.52% 0.34% 78,857,867.88 83,348,026.30 88,259,873.24 4,490,158.42 4,911,846.94 5.69% 5.89%
o/w share of PLL - - - - - 0.00% 0.00% - - - - - 0.00% 0.00%
o/w share of NESL - - - - - 0.00% 0.00% - - - - - 0.00% 0.00%
3.0 Price Stabilisation and Recovery Account 293,365,995.33 134,018,191.89 134,018,191.89 (159,347,803.44) - -54.32% 0.00% 34,754,323.10 3,463,532.15 3,463,532.15 (31,290,790.95) - -90.03% 0.00%
4.0 Tot. for A/Cs established under the ESLA 1,287,092,677.17 1,216,424,859.50 1,216,127,564.62 (70,667,817.67) (297,294.88) -5.49% -0.02% 150,721,775.86 124,870,998.88 131,842,925.61 (25,850,776.98) 6,971,926.73 -17.15% 5.58%
5.0 Road Fund 925,046,481.04 972,354,770.02 917,893,716.06 47,308,288.98 (54,461,053.96) 5.11% -5.60% 124,316,776.60 109,075,992.29 102,110,664.08 (15,240,784.31) (6,965,328.21) -12.26% -6.39%
6.0 Energy Fund 28,542,298.53 26,115,588.87 24,674,388.36 (2,426,709.66) (1,441,200.51) -8.50% -5.52% 1,442,338.54 2,810,078.88 2,630,641.77 1,367,740.34 (179,437.11) 94.83% -6.39%
7.0 50% PLL Transfers to MoEn 87,875,399.30 47,750,246.45 8,275,730.69 (40,125,152.85) (39,474,515.76) -45.66% -82.67% 10,164,515.69 5,689,227.99 1,744,889.58 (4,475,287.70) (3,944,338.41) -44.03% -69.33%
o/w ECG 67,862,416.09 36,666,419.57 - (31,195,996.51) (36,666,419.57) -45.97% -100.00% 7,833,021.79 4,542,811.55 - (3,290,210.24) (4,542,811.55) -42.00% -100.00%
o/w NEDCO 7,892,696.06 4,758,921.02 - (3,133,775.04) (4,758,921.02) -39.70% -100.00% 913,909.28 442,912.01 - (470,997.27) (442,912.01) -51.54% -100.00%
o/w VRA 12,120,287.15 6,324,905.85 8,275,730.69 (5,795,381.30) 1,950,824.84 -47.82% 30.84% 1,417,584.63 703,504.44 1,744,889.58 (714,080.19) 1,041,385.15 -50.37% 148.03%
8.0 50% PLL Retention by EDCs 87,875,399.30 47,750,246.45 87,224,762.20 (40,125,152.85) 39,474,515.76 -45.66% 82.67% 10,164,515.69 5,689,227.99 9,633,566.41 (4,475,287.70) 3,944,338.41 -44.03% 69.33%
o/w ECG 67,862,416.09 36,666,419.57 73,332,839.15 (31,195,996.51) 36,666,419.57 -45.97% 100.00% 7,833,021.79 4,542,811.55 9,085,623.10 (3,290,210.24) 4,542,811.55 -42.00% 100.00%
o/w NEDCO 7,892,696.06 4,758,921.02 9,517,842.04 (3,133,775.04) 4,758,921.02 -39.70% 100.00% 913,909.28 442,912.01 885,824.02 (470,997.27) 442,912.01 -51.54% 100.00%
o/w VRA 12,120,287.15 6,324,905.85 4,374,081.01 (5,795,381.30) (1,950,824.84) -47.82% -30.84% 1,417,584.63 703,504.44 (337,880.71) (714,080.19) (1,041,385.15) -50.37% -148.03%
9.0 100% NESL transfers into NEF 115,512,087.49 65,079,691.43 42,088,765.37 (50,432,396.06) (22,990,926.06) -43.66% -35.33% 13,654,229.00 8,116,379.69 11,297,603.75 (5,537,849.31) 3,181,224.06 -40.56% 39.20%
o/w ECG 88,470,761.45 48,329,924.08 33,000,000.00 (40,140,837.37) (15,329,924.08) -45.37% -31.72% 10,444,029.05 6,051,060.96 5,000,000.00 (4,392,968.09) (1,051,060.96) -42.06% -17.37%
o/w NEDCO 10,880,943.17 8,064,953.24 3,402,479.90 (2,815,989.93) (4,662,473.34) -25.88% -57.81% 1,320,087.12 590,549.34 5,141,040.56 (729,537.77) 4,550,491.22 -55.26% 770.55%
o/w VRA 16,160,382.86 8,684,814.10 5,686,285.47 (7,475,568.76) (2,998,528.63) -46.26% -34.53% 1,890,112.83 1,474,769.38 1,156,563.19 (415,343.45) (318,206.19) -21.97% -21.58%
10.0 Sub-Total Other Accounts/Funds 1,244,851,665.65 1,159,050,543.21 1,080,157,362.68 (85,801,122.44) (78,893,180.53) -6.89% -6.81% 159,742,375.52 131,380,906.85 127,417,365.59 (28,361,468.67) (3,963,541.26) -17.75% -3.02%
11.0 Total Amounts Distributed 2,531,944,342.82 2,375,475,402.71 2,296,284,927.30 (156,468,940.12) (79,190,475.41) -6.18% -3.33% 310,464,151.38 256,251,905.73 259,260,291.20 (54,212,245.65) 3,008,385.47 -17.46% 1.17%
Q1+Q2+Q3 October

2018 Annual Report on the ESLA
51
D. Distribution of the Levies by the Established ESLA Accounts and Other Accounts (in GH¢) - 9
NO. Account DescriptionProg Actual Coll. Lodgment Prog - Actual
Actual -
Lodgment
% (Prog -
Actual)
% (Actual -
Lodgment)Prog Actual Coll. Lodgment Prog - Actual
Actual -
Lodgment
% (Prog -
Actual)
% (Actual -
Lodgment)
1.0 Energy Debt Service Account 40,507,667.11 41,668,465.20 42,396,127.75 1,160,798.09 727,662.55 2.87% 1.75% 40,873,409.82 42,796,346.68 36,994,097.07 1,922,936.86 (5,802,249.61) 4.70% -13.56%
o/w foreign exch underecoveries 14,467,023.97 16,139,636.69 16,421,485.54 1,672,612.72 281,848.85 11.56% 1.75% 14,597,646.36 16,660,007.17 14,397,511.15 2,062,360.80 (2,262,496.02) 14.13% -13.58%
o/w recovery of TOR debt 26,040,643.14 25,528,828.52 25,974,642.21 (511,814.63) 445,813.69 -1.97% 1.75% 26,275,763.45 26,136,339.51 22,596,585.93 (139,423.94) (3,539,753.59) -0.53% -13.54%
2.0 Power Gen. & Infra Support sub-Account 86,078,792.61 90,381,965.41 85,846,527.56 4,303,172.79 (4,535,437.85) 5.00% -5.02% 86,855,995.86 93,296,040.13 82,277,216.32 6,440,044.27 (11,018,823.81) 7.41% -11.81%
o/w share of EDRL 86,078,792.61 90,381,965.41 85,846,527.56 4,303,172.79 (4,535,437.85) 5.00% -5.02% 86,855,995.86 93,296,040.13 82,277,216.32 6,440,044.27 (11,018,823.81) 7.41% -11.81%
o/w share of PLL - - - - - 0.00% 0.00% - - - - - 0.00% 0.00%
o/w share of NESL - - - - - 0.00% 0.00% - - - - - 0.00% 0.00%
3.0 Price Stabilisation and Recovery Account 35,559,430.02 1,929,387.63 1,929,387.63 (33,630,042.39) - -94.57% 0.00% 38,071,884.67 3,052,795.76 3,052,795.76 (35,019,088.91) - -91.98% 0.00%
4.0 Tot. for A/Cs established under the ESLA 162,145,889.74 133,979,818.24 130,172,042.94 (28,166,071.50) (3,807,775.30) -17.37% -2.84% 165,801,290.35 139,145,182.57 122,324,109.15 (26,656,107.78) (16,821,073.42) -16.08% -12.09%
5.0 Road Fund 134,219,169.51 119,311,810.52 114,862,925.67 (14,907,358.99) (4,448,884.85) -11.11% -3.73% 131,190,138.71 123,552,279.60 119,976,205.93 (7,637,859.11) (3,576,073.67) -5.82% -2.89%
6.0 Energy Fund 1,442,338.54 3,155,989.13 3,038,308.98 1,713,650.59 (117,680.15) 118.81% -3.73% 1,442,338.54 3,183,951.99 3,091,796.29 1,741,613.45 (92,155.70) 120.75% -2.89%
7.0 50% PLL Transfers to MoEn 10,175,827.85 5,176,245.61 - (4,999,582.24) (5,176,245.61) -49.13% -100.00% 10,278,619.41 5,657,641.55 1,897,271.39 (4,620,977.87) (3,760,370.16) -44.96% -66.47%
o/w ECG 7,833,021.79 4,013,450.61 - (3,819,571.18) (4,013,450.61) -48.76% -100.00% 7,833,021.79 4,466,400.93 - (3,366,620.85) (4,466,400.93) -42.98% -100.00%
o/w NEDCO 921,524.88 524,822.93 - (396,701.95) (524,822.93) -43.05% -100.00% 929,203.95 456,133.12 - (473,070.83) (456,133.12) -50.91% -100.00%
o/w VRA 1,421,281.18 637,972.08 - (783,309.11) (637,972.08) -55.11% -100.00% 1,516,393.68 735,107.50 1,897,271.39 (781,286.18) 1,162,163.90 -51.52% 158.09%
8.0 50% PLL Retention by EDCs 10,175,827.85 5,176,245.61 10,352,491.22 (4,999,582.24) 5,176,245.61 -49.13% 100.00% 10,278,619.41 5,657,641.55 9,418,011.70 (4,620,977.87) 3,760,370.16 -44.96% 66.47%
o/w ECG 7,833,021.79 4,013,450.61 8,026,901.21 (3,819,571.18) 4,013,450.61 -48.76% 100.00% 7,833,021.79 4,466,400.93 8,932,801.87 (3,366,620.85) 4,466,400.93 -42.98% 100.00%
o/w NEDCO 921,524.88 524,822.93 1,049,645.86 (396,701.95) 524,822.93 -43.05% 100.00% 929,203.95 456,133.12 912,266.24 (473,070.83) 456,133.12 -50.91% 100.00%
o/w VRA 1,421,281.18 637,972.08 1,275,944.15 (783,309.11) 637,972.08 -55.11% 100.00% 1,516,393.68 735,107.50 (427,056.40) (781,286.18) (1,162,163.90) -51.52% -158.09%
9.0 100% NESL transfers into NEF 13,670,158.03 6,781,193.51 8,027,692.80 (6,888,964.52) 1,246,499.29 -50.39% 18.38% 13,808,066.64 8,233,256.50 9,333,472.46 (5,574,810.13) 1,100,215.96 -40.37% 13.36%
o/w ECG 10,444,029.05 5,266,349.48 8,000,000.00 (5,177,679.57) 2,733,650.52 -49.58% 51.91% 10,444,029.05 5,922,056.70 6,000,000.00 (4,521,972.35) 77,943.30 -43.30% 1.32%
o/w NEDCO 1,331,087.40 699,763.91 27,692.80 (631,323.50) (672,071.11) -47.43% -96.04% 1,342,179.35 1,350,304.77 2,134,358.00 8,125.42 784,053.23 0.61% 58.06%
o/w VRA 1,895,041.57 815,080.13 - (1,079,961.44) (815,080.13) -56.99% -100.00% 2,021,858.23 960,895.03 1,199,114.46 (1,060,963.20) 238,219.43 -52.47% 24.79%
10.0 Sub-Total Other Accounts/Funds 169,683,321.77 139,601,484.38 136,281,418.67 (30,081,837.39) (3,320,065.71) -17.73% -2.38% 166,997,782.71 146,284,771.19 143,716,757.77 (20,713,011.52) (2,568,013.41) -12.40% -1.76%
11.0 Total Amounts Distributed 331,829,211.52 273,581,302.62 266,453,461.61 (58,247,908.90) (7,127,841.01) -17.55% -2.61% 332,799,073.06 285,429,953.76 266,040,866.92 (47,369,119.30) (19,389,086.83) -14.23% -6.79%
November December
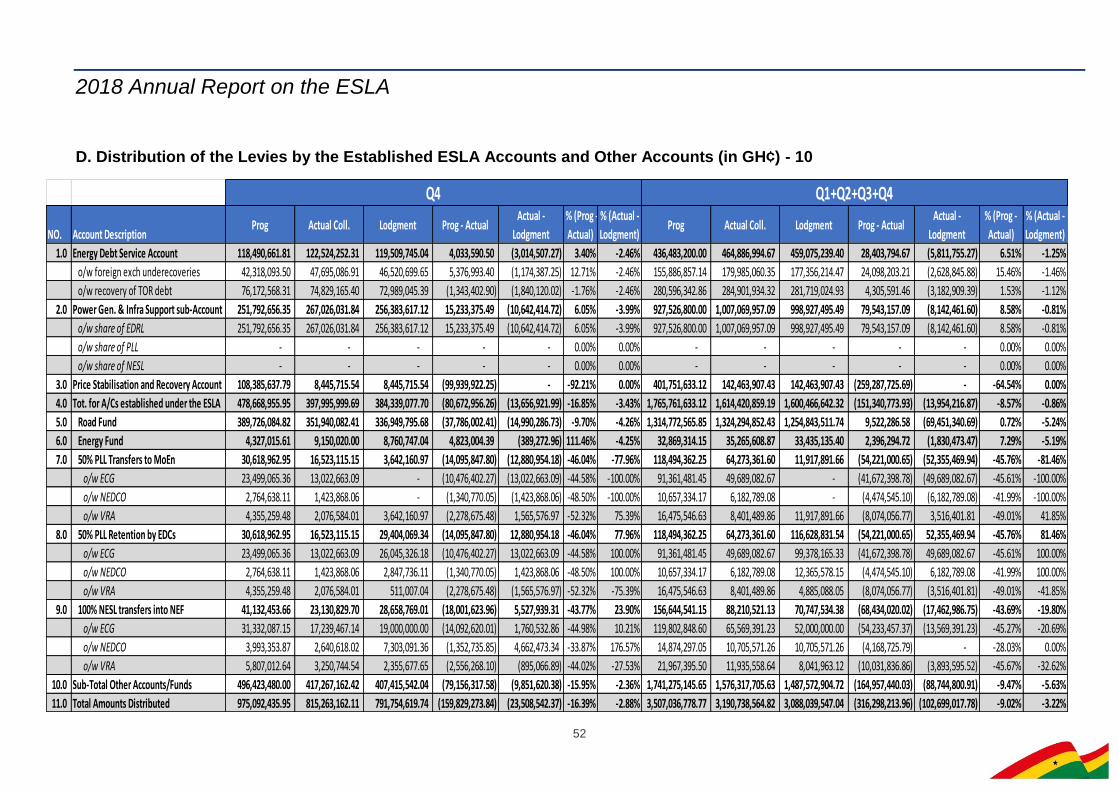
2018 Annual Report on the ESLA
52
D. Distribution of the Levies by the Established ESLA Accounts and Other Accounts (in GH¢) - 10
NO. Account DescriptionProg Actual Coll. Lodgment Prog - Actual
Actual -
Lodgment
% (Prog -
Actual)
% (Actual -
Lodgment)Prog Actual Coll. Lodgment Prog - Actual
Actual -
Lodgment
% (Prog -
Actual)
% (Actual -
Lodgment)
1.0 Energy Debt Service Account 118,490,661.81 122,524,252.31 119,509,745.04 4,033,590.50 (3,014,507.27) 3.40% -2.46% 436,483,200.00 464,886,994.67 459,075,239.40 28,403,794.67 (5,811,755.27) 6.51% -1.25%
o/w foreign exch underecoveries 42,318,093.50 47,695,086.91 46,520,699.65 5,376,993.40 (1,174,387.25) 12.71% -2.46% 155,886,857.14 179,985,060.35 177,356,214.47 24,098,203.21 (2,628,845.88) 15.46% -1.46%
o/w recovery of TOR debt 76,172,568.31 74,829,165.40 72,989,045.39 (1,343,402.90) (1,840,120.02) -1.76% -2.46% 280,596,342.86 284,901,934.32 281,719,024.93 4,305,591.46 (3,182,909.39) 1.53% -1.12%
2.0 Power Gen. & Infra Support sub-Account 251,792,656.35 267,026,031.84 256,383,617.12 15,233,375.49 (10,642,414.72) 6.05% -3.99% 927,526,800.00 1,007,069,957.09 998,927,495.49 79,543,157.09 (8,142,461.60) 8.58% -0.81%
o/w share of EDRL 251,792,656.35 267,026,031.84 256,383,617.12 15,233,375.49 (10,642,414.72) 6.05% -3.99% 927,526,800.00 1,007,069,957.09 998,927,495.49 79,543,157.09 (8,142,461.60) 8.58% -0.81%
o/w share of PLL - - - - - 0.00% 0.00% - - - - - 0.00% 0.00%
o/w share of NESL - - - - - 0.00% 0.00% - - - - - 0.00% 0.00%
3.0 Price Stabilisation and Recovery Account 108,385,637.79 8,445,715.54 8,445,715.54 (99,939,922.25) - -92.21% 0.00% 401,751,633.12 142,463,907.43 142,463,907.43 (259,287,725.69) - -64.54% 0.00%
4.0 Tot. for A/Cs established under the ESLA 478,668,955.95 397,995,999.69 384,339,077.70 (80,672,956.26) (13,656,921.99) -16.85% -3.43% 1,765,761,633.12 1,614,420,859.19 1,600,466,642.32 (151,340,773.93) (13,954,216.87) -8.57% -0.86%
5.0 Road Fund 389,726,084.82 351,940,082.41 336,949,795.68 (37,786,002.41) (14,990,286.73) -9.70% -4.26% 1,314,772,565.85 1,324,294,852.43 1,254,843,511.74 9,522,286.58 (69,451,340.69) 0.72% -5.24%
6.0 Energy Fund 4,327,015.61 9,150,020.00 8,760,747.04 4,823,004.39 (389,272.96) 111.46% -4.25% 32,869,314.15 35,265,608.87 33,435,135.40 2,396,294.72 (1,830,473.47) 7.29% -5.19%
7.0 50% PLL Transfers to MoEn 30,618,962.95 16,523,115.15 3,642,160.97 (14,095,847.80) (12,880,954.18) -46.04% -77.96% 118,494,362.25 64,273,361.60 11,917,891.66 (54,221,000.65) (52,355,469.94) -45.76% -81.46%
o/w ECG 23,499,065.36 13,022,663.09 - (10,476,402.27) (13,022,663.09) -44.58% -100.00% 91,361,481.45 49,689,082.67 - (41,672,398.78) (49,689,082.67) -45.61% -100.00%
o/w NEDCO 2,764,638.11 1,423,868.06 - (1,340,770.05) (1,423,868.06) -48.50% -100.00% 10,657,334.17 6,182,789.08 - (4,474,545.10) (6,182,789.08) -41.99% -100.00%
o/w VRA 4,355,259.48 2,076,584.01 3,642,160.97 (2,278,675.48) 1,565,576.97 -52.32% 75.39% 16,475,546.63 8,401,489.86 11,917,891.66 (8,074,056.77) 3,516,401.81 -49.01% 41.85%
8.0 50% PLL Retention by EDCs 30,618,962.95 16,523,115.15 29,404,069.34 (14,095,847.80) 12,880,954.18 -46.04% 77.96% 118,494,362.25 64,273,361.60 116,628,831.54 (54,221,000.65) 52,355,469.94 -45.76% 81.46%
o/w ECG 23,499,065.36 13,022,663.09 26,045,326.18 (10,476,402.27) 13,022,663.09 -44.58% 100.00% 91,361,481.45 49,689,082.67 99,378,165.33 (41,672,398.78) 49,689,082.67 -45.61% 100.00%
o/w NEDCO 2,764,638.11 1,423,868.06 2,847,736.11 (1,340,770.05) 1,423,868.06 -48.50% 100.00% 10,657,334.17 6,182,789.08 12,365,578.15 (4,474,545.10) 6,182,789.08 -41.99% 100.00%
o/w VRA 4,355,259.48 2,076,584.01 511,007.04 (2,278,675.48) (1,565,576.97) -52.32% -75.39% 16,475,546.63 8,401,489.86 4,885,088.05 (8,074,056.77) (3,516,401.81) -49.01% -41.85%
9.0 100% NESL transfers into NEF 41,132,453.66 23,130,829.70 28,658,769.01 (18,001,623.96) 5,527,939.31 -43.77% 23.90% 156,644,541.15 88,210,521.13 70,747,534.38 (68,434,020.02) (17,462,986.75) -43.69% -19.80%
o/w ECG 31,332,087.15 17,239,467.14 19,000,000.00 (14,092,620.01) 1,760,532.86 -44.98% 10.21% 119,802,848.60 65,569,391.23 52,000,000.00 (54,233,457.37) (13,569,391.23) -45.27% -20.69%
o/w NEDCO 3,993,353.87 2,640,618.02 7,303,091.36 (1,352,735.85) 4,662,473.34 -33.87% 176.57% 14,874,297.05 10,705,571.26 10,705,571.26 (4,168,725.79) - -28.03% 0.00%
o/w VRA 5,807,012.64 3,250,744.54 2,355,677.65 (2,556,268.10) (895,066.89) -44.02% -27.53% 21,967,395.50 11,935,558.64 8,041,963.12 (10,031,836.86) (3,893,595.52) -45.67% -32.62%
10.0 Sub-Total Other Accounts/Funds 496,423,480.00 417,267,162.42 407,415,542.04 (79,156,317.58) (9,851,620.38) -15.95% -2.36% 1,741,275,145.65 1,576,317,705.63 1,487,572,904.72 (164,957,440.03) (88,744,800.91) -9.47% -5.63%
11.0 Total Amounts Distributed 975,092,435.95 815,263,162.11 791,754,619.74 (159,829,273.84) (23,508,542.37) -16.39% -2.88% 3,507,036,778.77 3,190,738,564.82 3,088,039,547.04 (316,298,213.96) (102,699,017.78) -9.02% -3.22%
Q4 Q1+Q2+Q3+Q4
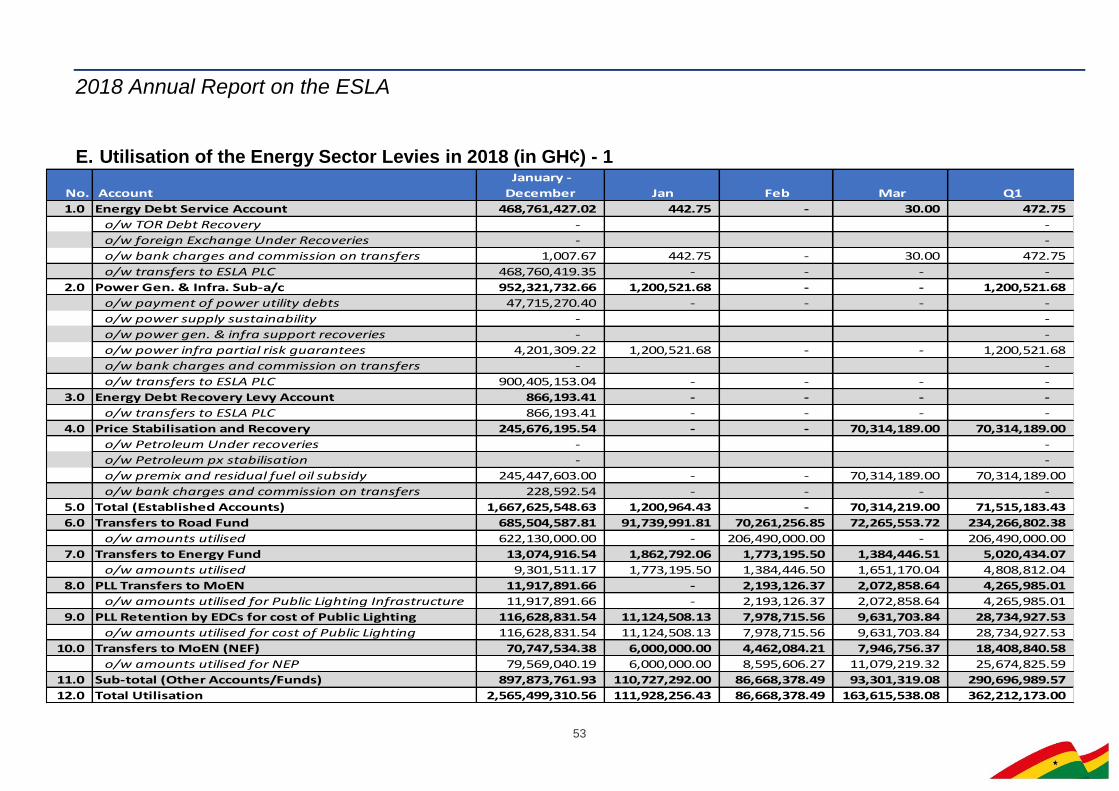
2018 Annual Report on the ESLA
53
E. Utilisation of the Energy Sector Levies in 2018 (in GH¢) - 1
No. Account
January -
December Jan Feb Mar Q1
1.0 Energy Debt Service Account 468,761,427.02 442.75 - 30.00 472.75
o/w TOR Debt Recovery - -
o/w foreign Exchange Under Recoveries - -
o/w bank charges and commission on transfers 1,007.67 442.75 - 30.00 472.75
o/w transfers to ESLA PLC 468,760,419.35 - - - -
2.0 Power Gen. & Infra. Sub-a/c 952,321,732.66 1,200,521.68 - - 1,200,521.68
o/w payment of power utility debts 47,715,270.40 - - - -
o/w power supply sustainability - -
o/w power gen. & infra support recoveries - -
o/w power infra partial risk guarantees 4,201,309.22 1,200,521.68 - - 1,200,521.68
o/w bank charges and commission on transfers - -
o/w transfers to ESLA PLC 900,405,153.04 - - - -
3.0 Energy Debt Recovery Levy Account 866,193.41 - - - -
o/w transfers to ESLA PLC 866,193.41 - - - -
4.0 Price Stabilisation and Recovery 245,676,195.54 - - 70,314,189.00 70,314,189.00
o/w Petroleum Under recoveries - -
o/w Petroleum px stabilisation - -
o/w premix and residual fuel oil subsidy 245,447,603.00 - - 70,314,189.00 70,314,189.00
o/w bank charges and commission on transfers 228,592.54 - - - -
5.0 Total (Established Accounts) 1,667,625,548.63 1,200,964.43 - 70,314,219.00 71,515,183.43
6.0 Transfers to Road Fund 685,504,587.81 91,739,991.81 70,261,256.85 72,265,553.72 234,266,802.38
o/w amounts utilised 622,130,000.00 - 206,490,000.00 - 206,490,000.00
7.0 Transfers to Energy Fund 13,074,916.54 1,862,792.06 1,773,195.50 1,384,446.51 5,020,434.07
o/w amounts utilised 9,301,511.17 1,773,195.50 1,384,446.50 1,651,170.04 4,808,812.04
8.0 PLL Transfers to MoEN 11,917,891.66 - 2,193,126.37 2,072,858.64 4,265,985.01
o/w amounts utilised for Public Lighting Infrastructure 11,917,891.66 - 2,193,126.37 2,072,858.64 4,265,985.01
9.0 PLL Retention by EDCs for cost of Public Lighting 116,628,831.54 11,124,508.13 7,978,715.56 9,631,703.84 28,734,927.53
o/w amounts utilised for cost of Public Lighting 116,628,831.54 11,124,508.13 7,978,715.56 9,631,703.84 28,734,927.53
10.0 Transfers to MoEN (NEF) 70,747,534.38 6,000,000.00 4,462,084.21 7,946,756.37 18,408,840.58
o/w amounts utilised for NEP 79,569,040.19 6,000,000.00 8,595,606.27 11,079,219.32 25,674,825.59
11.0 Sub-total (Other Accounts/Funds) 897,873,761.93 110,727,292.00 86,668,378.49 93,301,319.08 290,696,989.57
12.0 Total Utilisation 2,565,499,310.56 111,928,256.43 86,668,378.49 163,615,538.08 362,212,173.00
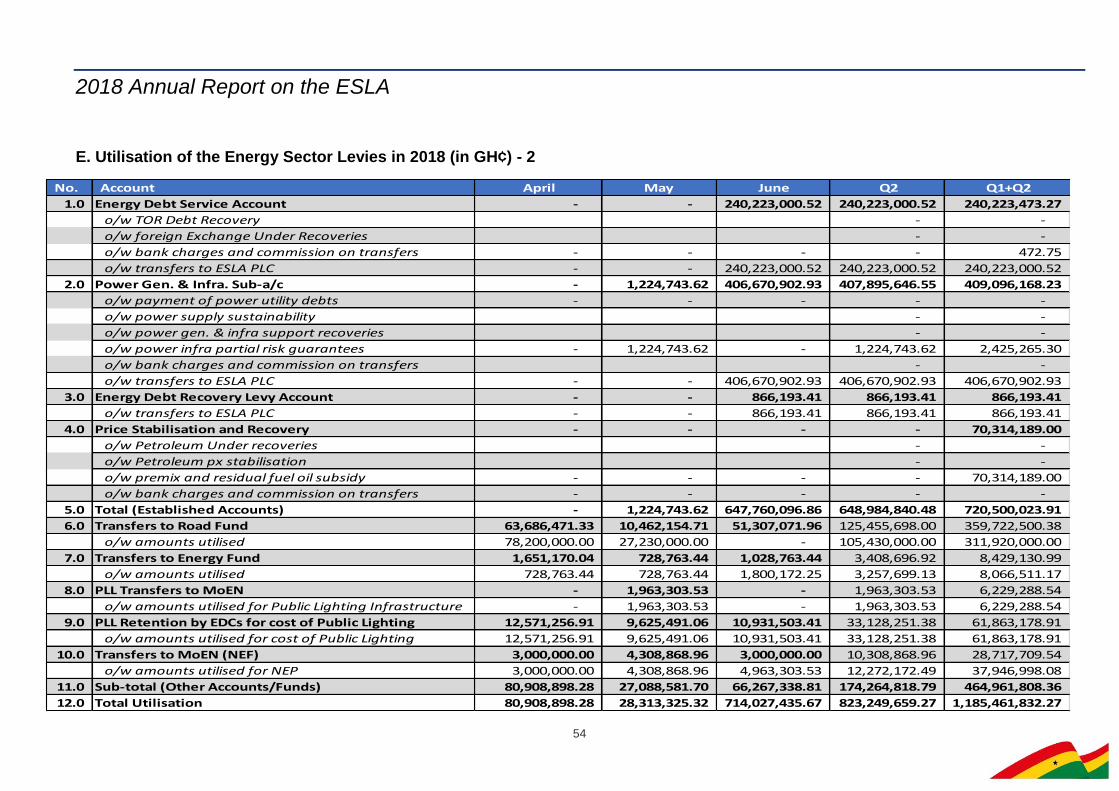
2018 Annual Report on the ESLA
54
E. Utilisation of the Energy Sector Levies in 2018 (in GH¢) - 2
No. Account April May June Q2 Q1+Q2
1.0 Energy Debt Service Account - - 240,223,000.52 240,223,000.52 240,223,473.27
o/w TOR Debt Recovery - -
o/w foreign Exchange Under Recoveries - -
o/w bank charges and commission on transfers - - - - 472.75
o/w transfers to ESLA PLC - - 240,223,000.52 240,223,000.52 240,223,000.52
2.0 Power Gen. & Infra. Sub-a/c - 1,224,743.62 406,670,902.93 407,895,646.55 409,096,168.23
o/w payment of power utility debts - - - - -
o/w power supply sustainability - -
o/w power gen. & infra support recoveries - -
o/w power infra partial risk guarantees - 1,224,743.62 - 1,224,743.62 2,425,265.30
o/w bank charges and commission on transfers - -
o/w transfers to ESLA PLC - - 406,670,902.93 406,670,902.93 406,670,902.93
3.0 Energy Debt Recovery Levy Account - - 866,193.41 866,193.41 866,193.41
o/w transfers to ESLA PLC - - 866,193.41 866,193.41 866,193.41
4.0 Price Stabilisation and Recovery - - - - 70,314,189.00
o/w Petroleum Under recoveries - -
o/w Petroleum px stabilisation - -
o/w premix and residual fuel oil subsidy - - - - 70,314,189.00
o/w bank charges and commission on transfers - - - - -
5.0 Total (Established Accounts) - 1,224,743.62 647,760,096.86 648,984,840.48 720,500,023.91
6.0 Transfers to Road Fund 63,686,471.33 10,462,154.71 51,307,071.96 125,455,698.00 359,722,500.38
o/w amounts utilised 78,200,000.00 27,230,000.00 - 105,430,000.00 311,920,000.00
7.0 Transfers to Energy Fund 1,651,170.04 728,763.44 1,028,763.44 3,408,696.92 8,429,130.99
o/w amounts utilised 728,763.44 728,763.44 1,800,172.25 3,257,699.13 8,066,511.17
8.0 PLL Transfers to MoEN - 1,963,303.53 - 1,963,303.53 6,229,288.54
o/w amounts utilised for Public Lighting Infrastructure - 1,963,303.53 - 1,963,303.53 6,229,288.54
9.0 PLL Retention by EDCs for cost of Public Lighting 12,571,256.91 9,625,491.06 10,931,503.41 33,128,251.38 61,863,178.91
o/w amounts utilised for cost of Public Lighting 12,571,256.91 9,625,491.06 10,931,503.41 33,128,251.38 61,863,178.91
10.0 Transfers to MoEN (NEF) 3,000,000.00 4,308,868.96 3,000,000.00 10,308,868.96 28,717,709.54
o/w amounts utilised for NEP 3,000,000.00 4,308,868.96 4,963,303.53 12,272,172.49 37,946,998.08
11.0 Sub-total (Other Accounts/Funds) 80,908,898.28 27,088,581.70 66,267,338.81 174,264,818.79 464,961,808.36
12.0 Total Utilisation 80,908,898.28 28,313,325.32 714,027,435.67 823,249,659.27 1,185,461,832.27
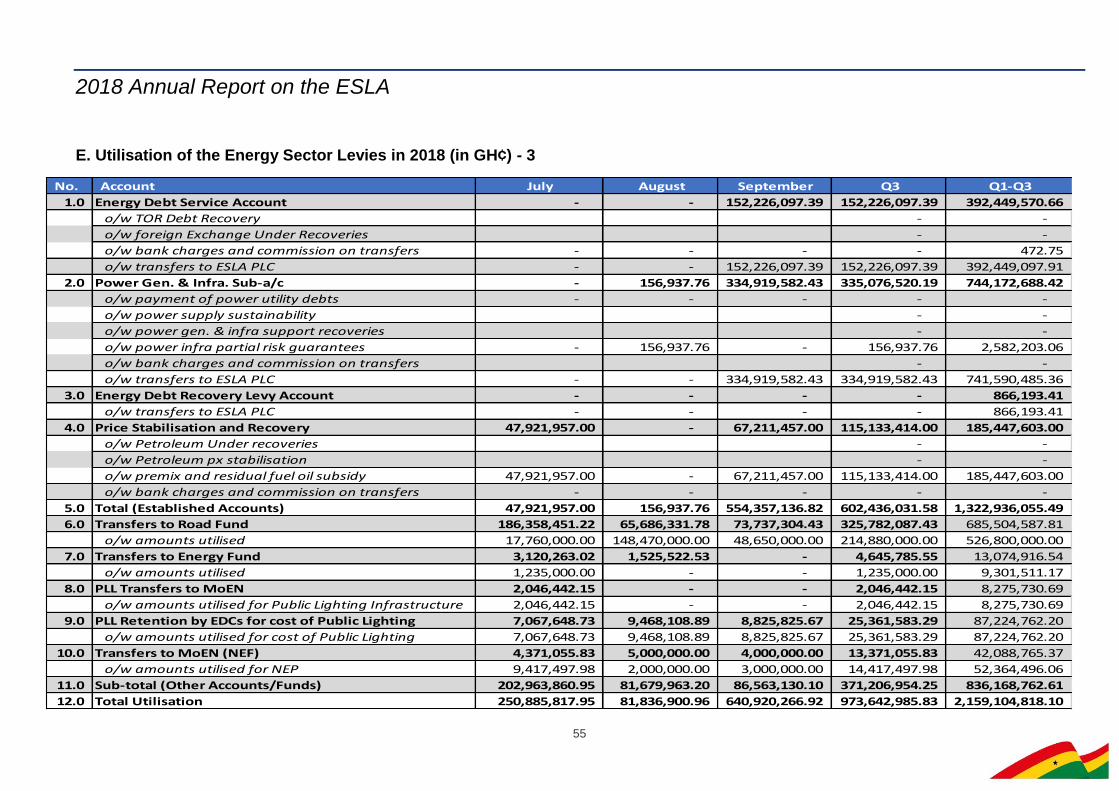
2018 Annual Report on the ESLA
55
E. Utilisation of the Energy Sector Levies in 2018 (in GH¢) - 3
No. Account July August September Q3 Q1-Q3
1.0 Energy Debt Service Account - - 152,226,097.39 152,226,097.39 392,449,570.66
o/w TOR Debt Recovery - -
o/w foreign Exchange Under Recoveries - -
o/w bank charges and commission on transfers - - - - 472.75
o/w transfers to ESLA PLC - - 152,226,097.39 152,226,097.39 392,449,097.91
2.0 Power Gen. & Infra. Sub-a/c - 156,937.76 334,919,582.43 335,076,520.19 744,172,688.42
o/w payment of power utility debts - - - - -
o/w power supply sustainability - -
o/w power gen. & infra support recoveries - -
o/w power infra partial risk guarantees - 156,937.76 - 156,937.76 2,582,203.06
o/w bank charges and commission on transfers - -
o/w transfers to ESLA PLC - - 334,919,582.43 334,919,582.43 741,590,485.36
3.0 Energy Debt Recovery Levy Account - - - - 866,193.41
o/w transfers to ESLA PLC - - - - 866,193.41
4.0 Price Stabilisation and Recovery 47,921,957.00 - 67,211,457.00 115,133,414.00 185,447,603.00
o/w Petroleum Under recoveries - -
o/w Petroleum px stabilisation - -
o/w premix and residual fuel oil subsidy 47,921,957.00 - 67,211,457.00 115,133,414.00 185,447,603.00
o/w bank charges and commission on transfers - - - - -
5.0 Total (Established Accounts) 47,921,957.00 156,937.76 554,357,136.82 602,436,031.58 1,322,936,055.49
6.0 Transfers to Road Fund 186,358,451.22 65,686,331.78 73,737,304.43 325,782,087.43 685,504,587.81
o/w amounts utilised 17,760,000.00 148,470,000.00 48,650,000.00 214,880,000.00 526,800,000.00
7.0 Transfers to Energy Fund 3,120,263.02 1,525,522.53 - 4,645,785.55 13,074,916.54
o/w amounts utilised 1,235,000.00 - - 1,235,000.00 9,301,511.17
8.0 PLL Transfers to MoEN 2,046,442.15 - - 2,046,442.15 8,275,730.69
o/w amounts utilised for Public Lighting Infrastructure 2,046,442.15 - - 2,046,442.15 8,275,730.69
9.0 PLL Retention by EDCs for cost of Public Lighting 7,067,648.73 9,468,108.89 8,825,825.67 25,361,583.29 87,224,762.20
o/w amounts utilised for cost of Public Lighting 7,067,648.73 9,468,108.89 8,825,825.67 25,361,583.29 87,224,762.20
10.0 Transfers to MoEN (NEF) 4,371,055.83 5,000,000.00 4,000,000.00 13,371,055.83 42,088,765.37
o/w amounts utilised for NEP 9,417,497.98 2,000,000.00 3,000,000.00 14,417,497.98 52,364,496.06
11.0 Sub-total (Other Accounts/Funds) 202,963,860.95 81,679,963.20 86,563,130.10 371,206,954.25 836,168,762.61
12.0 Total Utilisation 250,885,817.95 81,836,900.96 640,920,266.92 973,642,985.83 2,159,104,818.10
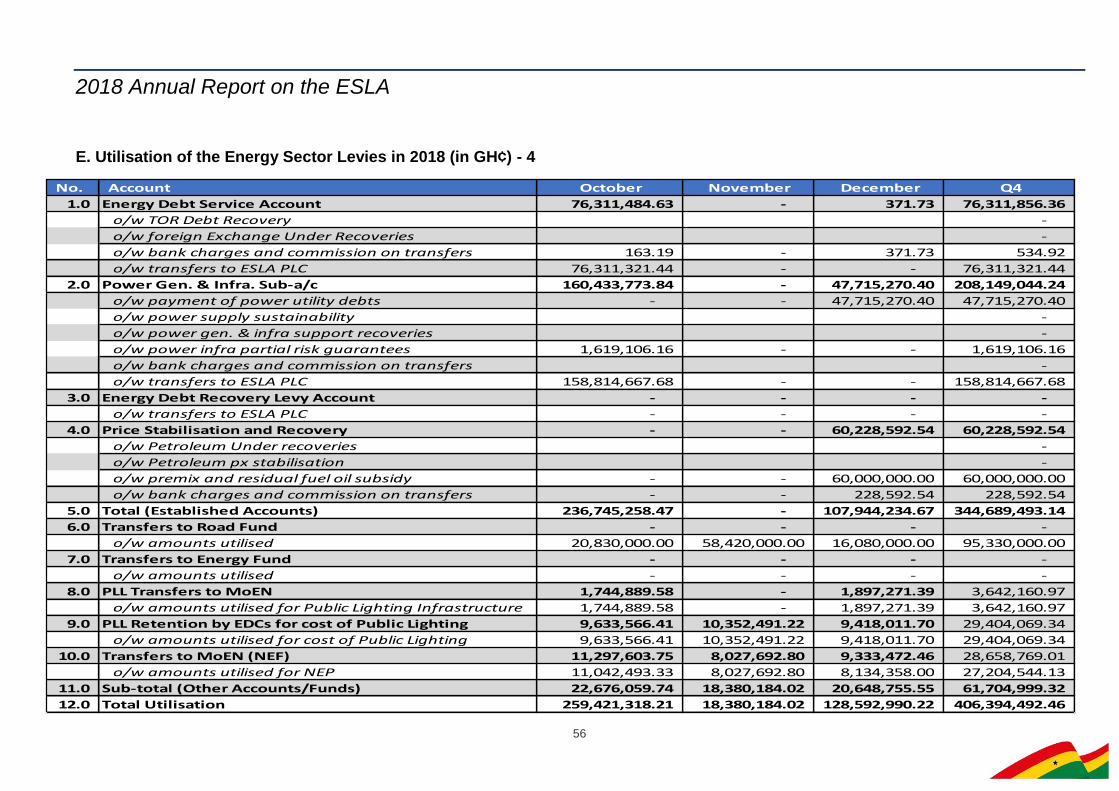
2018 Annual Report on the ESLA
56
E. Utilisation of the Energy Sector Levies in 2018 (in GH¢) - 4
No. Account October November December Q4
1.0 Energy Debt Service Account 76,311,484.63 - 371.73 76,311,856.36
o/w TOR Debt Recovery -
o/w foreign Exchange Under Recoveries -
o/w bank charges and commission on transfers 163.19 - 371.73 534.92
o/w transfers to ESLA PLC 76,311,321.44 - - 76,311,321.44
2.0 Power Gen. & Infra. Sub-a/c 160,433,773.84 - 47,715,270.40 208,149,044.24
o/w payment of power utility debts - - 47,715,270.40 47,715,270.40
o/w power supply sustainability -
o/w power gen. & infra support recoveries -
o/w power infra partial risk guarantees 1,619,106.16 - - 1,619,106.16
o/w bank charges and commission on transfers -
o/w transfers to ESLA PLC 158,814,667.68 - - 158,814,667.68
3.0 Energy Debt Recovery Levy Account - - - -
o/w transfers to ESLA PLC - - - -
4.0 Price Stabilisation and Recovery - - 60,228,592.54 60,228,592.54
o/w Petroleum Under recoveries -
o/w Petroleum px stabilisation -
o/w premix and residual fuel oil subsidy - - 60,000,000.00 60,000,000.00
o/w bank charges and commission on transfers - - 228,592.54 228,592.54
5.0 Total (Established Accounts) 236,745,258.47 - 107,944,234.67 344,689,493.14
6.0 Transfers to Road Fund - - - -
o/w amounts utilised 20,830,000.00 58,420,000.00 16,080,000.00 95,330,000.00
7.0 Transfers to Energy Fund - - - -
o/w amounts utilised - - - -
8.0 PLL Transfers to MoEN 1,744,889.58 - 1,897,271.39 3,642,160.97
o/w amounts utilised for Public Lighting Infrastructure 1,744,889.58 - 1,897,271.39 3,642,160.97
9.0 PLL Retention by EDCs for cost of Public Lighting 9,633,566.41 10,352,491.22 9,418,011.70 29,404,069.34
o/w amounts utilised for cost of Public Lighting 9,633,566.41 10,352,491.22 9,418,011.70 29,404,069.34
10.0 Transfers to MoEN (NEF) 11,297,603.75 8,027,692.80 9,333,472.46 28,658,769.01
o/w amounts utilised for NEP 11,042,493.33 8,027,692.80 8,134,358.00 27,204,544.13
11.0 Sub-total (Other Accounts/Funds) 22,676,059.74 18,380,184.02 20,648,755.55 61,704,999.32
12.0 Total Utilisation 259,421,318.21 18,380,184.02 128,592,990.22 406,394,492.46

© 2018. All rights reserved. No part of this publication may be stored in a retrieval system or
transmitted in any or by any means, electronic, mechanical, photocopying, recording or otherwise without the prior
written permission of the Ministry of Finance