Embed Size (px)
Citation preview
Management of the BritishColumbia Sea Cucumber
Fishery
CFEC 98-4N
Ben Muse
May, 1998
Alaska Commercial Fisheries Entry Commission8800 Glacier Highway, Suite 109
Juneau, Alaska 99801-8079907-789-6160

ii
iii
Abstract:
British Columbia sea cucumber commercial dive harvests began to take off in the early1980s. The fishery was an open access fishery through 1990. Total allowable catches wereintroduced in the mid-eighties, and a license limited entry system in 1991. In 1994fishermen tried unsuccessfully to set up a voluntary individual quota program similar tothose introduced in the red and green sea urchin fisheries that year. In 1995 theDepartment of Fisheries and Oceans introduced a formal, departmental, individual quotaprogram in this fishery. This report reviews the history of this fishery since the early1980s, paying particular attention to the introduction and operation of the limited entryand the individual quota programs.
Notice:
The Alaska Department of Fish and Game administers all programs and activities freefrom discrimination on the basis of sex, color, race, religion, national origin, age, maritalstatus, pregnancy, parenthood, or disability. For information on alternative formatsavailable for this and other department publications, contact the department ADAcoordinator at (voice) (907) 465-4120, or (TDD) (907) 465-3546. Any person whobelieves s/he has been discriminated against should write to:
ADFG
P.O. Box 25526
Juneau, AK 99802-5526
or O.E.O.
U.S. Department of the Interior
Washington, D.C. 20240

iv
v
Table of Contents
ABSTRACT........................................................................................................................................... iii
INTRODUCTION...................................................................................................................................1
B.C.’S SEA CUCUMBER RESOURCES...............................................................................................1
THE UNLIMITED FISHERY, 1971-1990 .............................................................................................3
THE LIMITED FISHERY, 1991-1994...................................................................................................5
INDIVIDUAL QUOTAS, 1995-1998 ......................................................................................................8
INITIAL ALLOCATION AND THE NATURE OF THE PROPERTY RIGHTS ................................................................8ENFORCEMENT...........................................................................................................................................9USER PAYS ...............................................................................................................................................10SOME PROGRAM RESULTS .........................................................................................................................11
Changes in effort levels .......................................................................................................................11Lengthening of the fishing season........................................................................................................11Data on license values ........................................................................................................................11License holders and crew ....................................................................................................................12Impacts on management ......................................................................................................................13
A NEW APPROACH TO MANAGEMENT .........................................................................................................14
DISCUSSION ........................................................................................................................................14
SOURCES .............................................................................................................................................17
ANNUAL SEA CUCUMBER TAC, LANDINGS, AND EFFORT INFORMATION ........................19

vi
Introduction1
British Columbia (B.C.) sea cucumber harvests began to take off in the early 1980s. Thefishery was an open access fishery through 1990. Total allowable catches (TACs) wereintroduced in 1986, and a license-type limited entry system in 1991.2 In 1994 fishermentried unsuccessfully to set up a voluntary individual quota program similar to thoseintroduced in the red and green sea urchin fisheries that year. In 1995 the Department ofFisheries and Oceans (DFO) introduced a formal, departmental, individual quota programin this fishery.3
Even today, relatively little is known about the biology or distribution of the resource inB.C. The fishery provides a case study of the development of a fishery by fishermen andmanagers in the face of great resource uncertainty, and also provides a case study of theuse of limited entry and individual quotas.
B.C.’s Sea Cucumber Resources
California sea cucumbers (Parastichopus californicus) are found throughout B.C.4 Theyoccur in relatively shallow water, but have also been found in prawn traps at depths below300 feet.5 Sea cucumber density is reported to be high in passes. Densities tend to beparticularly high in Central B.C., a region with lots of islands with channels betweenthem.6
California sea cucumbers can grow to be one and a half feet long. They look like stout,knobby, worms, typically five times as long as they are wide. They eat by ingesting marinesediments, cleaning them of microscopic organisms, and excreting them.7
Cucumbers have some mobility. They can swim a couple of feet if necessary to avoidpredation by star fish. Animals have been observed moving over 300 feet in 24 hours. It
1This report has benefited from comments by Kurt Schelle of the Alaska Commercial Fisheries EntryCommission and Eric Rome of Archipelago Marine Research. Only the author is responsible for anyerrors in this report.2Canadian documents often refer to the aggregate harvest from a fishery or from an area as a quota. Inthis report, these aggregate harvests will be referred to as “total allowable catches” or “TACs” todistinguish them more clearly from individual quotas.3The sea cucumber dive fishery is managed by Canada’s Federal government, not by the Provincialgovernment.4The California sea cucumber is one of a number of sea cucumber species found in B.C., but it is the onlyone harvested commercially. Throughout this paper a reference to sea cucumbers or cucumbers is areference to California sea cucumbers. The species is found from Baja California north to the Gulf ofAlaska.5Neifer, pers. comm.6Neifer, pers. comm7Mottet, pg 25.
2
is not known whether they move systematically. Some feel that they may migrate betweenshallower and deeper water.8
In B.C. they tend to spawn in June, July, and August, although they may sometimes spawnin the late spring. In September, after the spawning season, they become dormant andtheir internal organs shrink and atrophy. During the ensuing fall and winter months, theycan lose up to 25% of their body weight. During the spring the cucumbers begin feedingagain, and recover their body weight during the spring and summer.9
This annual pattern of spawning, atrophy, and recovery affects the timing of the harvests.Fishermen and processors prefer to harvest sea cucumbers during the period when theirinternal organs are atrophied, because they get a higher recovery weight from the animals,processing is easier, and the meat and skin are of a higher quality. Thus the fishery tendsto be opened in the fall and winter when weather conditions are often poor.10
Larvae can drift with the currents for weeks. This means that the spawning stock may bea long way from where the larvae will settle and grow. Thus the sources of new recruitsto a fishery may have come from some distance away, and there may be no tightrelationship between a stock in an area and recruitment to it.11
Managers do not know much about the sea cucumber resource in B.C. Information aboutthe biology, population dynamics, response to harvest, distribution, or biomass isextremely limited. Biologists have been unable to effectively age or tag the animals.Because information is so limited, the DFO has taken a very conservative approach tosetting its TACs.12
The sea cucumber fishery is a small scale fishery used by geoduck and urchin divefishermen to supplement their operations.13 The boats used in those fisheries are used inthis one. Boats may range in size from 22 foot skiffs to 40 foot salmon boats converted todiving. The median vessel size may lie between 30 and 38 feet. The typical operation hasthree to four persons, including two divers and a tender.14
The tender monitors the divers while they are under water. The divers move along thebottom, picking up the sea cucumbers and putting them in a bag. Divers have beenshifting from a system where air is pumped from the surface (a hookah system), to the useof scuba gear. This may reflect on-going changes in the related urchin fishery. Divers onhookah gear put their cucumbers in bags attached by rope to the vessel. Divers usingscuba gear also put their cucumbers in bags, but they leave their bags behind them on the
8Immamura and Kruse, page 6, Neifer, pers. comm.; Mottet, pg 26.9Immamura and Kruse, page 2-3.10Neifer, pers. comm; Ethelbah, pers. comm..11Smiley, in Paust, page 29.12Neifer, pers. comm.13Two divers can generally take the current vessel quotas in about a day. Neifer, pers. comm.14Keith, pers. comm.
3
sea bottom with small buoys to the surface. Their support vessels follow behind andrecover the bags. The cucumbers are then slit and eviscerated on the surface. Boats onthe North Coast tend to deliver to packer vessels.15
In the earlier years of the fishery, fishermen tended to land the sea cucumbers round.However, in the late eighties, fishermen began to slit the sea cucumbers once they werecaught to reduce the water content and the bulk. By the early nineties almost all seacucumbers were landed “split” rather than round. Reported fisheries statistics generallyconverted to split weight in 1992 to recognize this change in the fishery practices.16
Sea cucumber markets are in China, Korea, and Japan. Sea cucumbers are a traditionalEast Asian food. These Asian markets used to depend on local stocks of the seacucumber Stichopus japonicus. However, in the late seventies and early eighties thesupply of S. japonicus failed to meet demand and these markets began to turn to NorthAmerica and P. californicus.17 The principal products are the body wall, or skin, which isboiled, dried, and salted, and the muscles just inside the skin which are frozen.18
The Unlimited Fishery, 1971-1990
B.C.’s sea cucumber resource has been exploited for a long time. B.C.’s Nativesharvested sea cucumbers as a traditional food resource. However, the first commercialsea cucumber landings were not reported until 1971, and they appear to have remainedrelatively small until the early eighties.19
During the period up to 1990, entry to the fishery was not limited. In the early years ofthe fishery the only licensing requirements were a “C” license for the vessel and “fisher’sregistration cards” for everyone on board. The “C” vessel license allowed a vessel to beused to fish for “Schedule II” species. These were a miscellaneous group of lessimportant commercial species including sea urchins, skates, and octopus. The C licenseswere limited in 1977, but there were so many issued that they imposed no constraint onsea cucumber fishing. The fisher’s registration cards were required for everyone on boarda commercial fishing vessel.
In 1983, the DFO introduced “Z” fishing licenses. These were personal licenses, allowinga person to fish for a species using a vessel with the appropriate vessel license. Variouscategories of these were issued for different species. Separate Z licenses were issued forsea cucumbers as well as red and green sea urchins, and several other species. A “Z-D”
15Keith, pers. comm.; Neifer, pers. comm.16For consistency, estimates of fishery landings, or estimates of prices or CPUE based on weight measuresare reported in round weight in this report. Where necessary, round weights were derived using aconversion factor of 2.73 round pounds for each pound of split weight. This conversion factor wasobtained from Neifer and Rogers, Table 3.3.4.17Da Silva, et al., page 134.18Neifer, pers. comm.; Rome, pers. comm.19Mathews, et al, page 18; Neifer and Rogers, page 1.
4
license was issued for sea cucumbers. These Z licenses were not limited. They could beissued to companies as well as persons and a person could get more than one of them if hefished more than one vessel. The license holder did not have to be present with the fishingvessel.
As the fishery expanded in the early eighties, prices and effort, accompanied by harvests,rose quickly. A DFO landings price series that begins in 1984 shows prices at an averageof about $195 per metric ton, round weight, in 1984, and, and rising each year to $1,341 aton, round weight, in 1990.20
Effort followed prices up. Numbers of licenses rose from 40 in 1985 to 215 in 1990.Many of these licenses were not used, but the number of active vessels was positivelycorrelated with license numbers. In 1985, 21 vessels made landings while in 1990, 126vessels made landings.21 The available series on the numbers of divers runs from 1988 to1990 and shows an increase in each year, from 124 in 1988 to 163 in 1990. 22
Landings also rose. Landings ranged between 5 and 27 tons, round weight, from 1980 to1982, but jumped to 527 tons in 1983. Although they fell in 1984, they grew rapidlythereafter, rising to a peak of 1,922 tons, round weight, in 1988. Landings then fell in thenext two years, dropping by about 55% (to 870 tons, round weight) in 1990, the last yearbefore limited entry. Landings from 1987 to 1990 substantially exceeded the TACs for thefishery in each year.
The key management response to the increasing effort and harvests was the gradualimplementation and tightening of TACs. TACs were introduced despite the fact that littlewas known about the size of the stock.23 The first TAC was implemented on the SouthCoast in area 24 in 1985.24 This was extended to other areas in three regional TACscovering both the North and South Coasts in 1987.25 The total coastwide TAC that yearwas 1,500 tons. In 1989, due to concerns about stocks and catch per unit of effort(CPUE), these TACs were reduced to a total of 800 tons. In addition, the North CoastTAC was subdivided among three management areas. Aside from the “Area 24” TAC in1985, the TACs appear to have been applied over groupings of several statistical areas.26
In the absence of good information on sea cucumber stocks, these TACs were “arbitrary”and “precautionary.” 27
20All prices and values in this paper are reported in Canadian dollars. The U.S. equivalent would besmaller in nominal value. All “tons” are metric tons. The prices and many of the other data seriesdiscussed in this paper are summarized in a table at the end of the paper.21Heizer and Thomas, Table 4, page 12.; Parker, email.22Heizer and Thomas, Table 4, page 12.; Parker, email.23Heizer and Thomas, PSARC 1994, page 3.24Harbo, letter to Shirley.25I have followed Harbo in his letter to Shirley on the date for the region-wide TACs. However, DFO timeseries typically show the region-wide TACs beginning in 1986. DFO series are reported in the data tableat the end of this paper.26Harbo, letter to Shirley.27Neifer and Rogers, Table 3.3.1; Heizer and Thomas, Tables 2 and 3.
5
Increases in prices, increases in the numbers of licenses, vessels and divers, and decreasesin the TACs, appear to have led to shortening seasons. The total number of vessel fishingdays initially rose from 249 in 1984 to peak at 1,906 in 1987. However, thereafter ittended to fall. In 1990 it was 1,153 days - 40% below the 1987 peak. In 1986, the fisherywas open from January 1 to December 31. In 1990, in three of the five quota areas, theseason was over in about two weeks (by mid-January). It was closed everywhere by themiddle of February.28
In 1991 managers responded to the increases in effort and shortening seasons in thepreceding years by limiting the number of “Z-D” licenses they would issue into the fishery.In the same year DFO implemented limited entry in the red and green sea urchin divefisheries as well.
The Limited Fishery, 1991-1994
Seventy-eight licenses were originally issued, but following appeals and the issuance ofseveral licenses to Native bands, there were eventually a total of 85 licenses. Since 215licenses had been issued in 1990, this was a reduction of about 60%.29
Limited licenses were issued to license holders with 50,000 pounds of cumulative landingson their Z-D license during the three years from 1987 to 1989, or if they had 20 days ofrecorded harvests with it in any one year during this period.30 A person could receivemore than one of the limited licenses if they had more than one license in the base years.
The limited licenses could not be transferred. However, since the owner did not need tobe on-board, they could be leased. An actual sale could be approximated with a long termlease contract. This provided a way for license holders to effectively sell or otherwisetransfer their license. The limited licenses could be moved from one vessel to another, solong as the new vessel was not longer than the original vessel.
Limited entry did reduce some measures of fishery effort. The number of licenses issuedin the fishery, and the number of vessels fished, both dropped following entry limitation.As already noted, the number of licenses issued dropped from 215 in 1990 to no morethan 85 in any subsequent year. The number of vessels initially dropped by about half,from 126 to 60, but then rose to between 71 and 77 from 1992 to 1994. Even with theincrease from 1992 to 1994, the number of vessels under limitation was about 25% belowthe average in the three years just before limitation.31
To some extent price movements for sea cucumbers, rather than entry limitation may havebeen responsible for these results. Prices for sea cucumbers rose to very high levels in 28Neifer and Rogers, Tables 3.3.4 and 3.3.5; Harbo, letter to Shirley.29Neifer and Rogers, page 1 and Table 3.3.4.30DFO, Commercial Licensing Handbook, page 58.31Neifer and Rogers, Table 3.3.4.
6
1990, and the number of active fishing vessels appears to have responded to these priceincentives, also rising to very high levels. The number of vessels in 1990 was about 38%higher than it had been in 1989, and 1989 had had the highest number of vessels to thattime. In 1991, the first year of limited entry, the price of sea cucumbers plummeted byabout 43%. The number of vessels fished that year also plummeted. Limited entry mayhave played a role in this, but the number of active vessels dropped well below the limitednumber of licenses.
Despite the reduction in the number of separate vessels, the fishery appears to haveremained intense following limitation. The number of divers did not drop, the seasonsshortened, the number of days with landings dropped, and managers continued to haveproblems meeting the TAC. These statistics paint a picture of an intensifying fishery assmaller numbers of vessels were used as platforms by larger average numbers of divers inshortening fishing seasons.
The number of divers did not drop. It was actually somewhat higher in the yearsfollowing limited entry. The average for the three years before limited entry was 140divers a year, while the average during limited entry was 159 divers.
Fishing seasons shortened (although to some extent this may have been due to TACreductions). In each of the five TAC areas the season was much shorter in 1994 than ithad been in 1991. For example, on the West Coast of Vancouver Island the seasondropped from 12 fishing days to 1; in the Prince Rupert District on the North Coast, theseason dropped from 9 days to 4. Most of the reductions in fishing days from one year toanother took place in years when there was no TAC reduction.32
Fishing seasons may have been shortened during this period in part because of decliningTACs. The coastwide TAC was 800 tons for the first two years of limited entry, but thendeclined by 1994 to 575 tons. However, the catch per vessel fishing day rose considerablyduring this period, implying more intense fishing for the available TAC. In 1991, the firstyear of limitation, about 2.5 metric tons were landed per vessel fishing day, by 1994, thelast year before individual quotas, 3.3 metric tons were landed per vessel fishing day.Conversely, landings per diver were dropping. In 1991 landings were 9.8 metric tons perdiver, in 1994 they were 3.4 metric tons. 33
Shorter seasons meant fewer vessel fishing days. The number of vessel fishing daysdropped from 1,153 in 1990, the year before limitation, to 164 in 1994, the last yearbefore individual quotas. DFO statistics on vessel fishing days may underestimate theamount of time invested by divers since one practice during this period was to fish illegallybefore the season and stockpile sea cucumbers on the bottom in order to increase theharvest during the fishery opening. Days spent in this activity would not be recorded byDFO.34
32Rome, Eades, and Huston, Table 3.33These are all round product weights. Mylchreest, fax; Parker, email.34DFO, 1995 Fishery Update, Table 5, page 13.; Heizer and Thomas, PSARC 1995, page 6.
7
DFO managers had trouble meeting their TAC goals even with entry limits. In three of thefour years with limited entry, the TAC was exceeded. Part of the problem was that thereporting requirements worked with a lag. As the seasons shortened, the problems posedby these lags became more severe.
Initial DFO management responses to these effort increases included shortening seasons(as mentioned above) closing management areas within the five TAC regions, reducingTACs, and introducing area rotations. TACs were reduced from 800 tons in 1990 to 575tons by 1994, the last year before individual quotas. TACs were reduced in some areasand years in response to prior year overages. In 1991 the fishing areas in the South Coastfishery were placed on a two year rotation. Each area was allowed to lie fallow everyother year. In 1993 the South Coast fishery rotation was extended to three years. Thuseach area was given an opportunity to lie fallow for two years after each year that it hadbeen fished.35
License holders had been expressing an interest in individual quotas since 1992.36 In1994, The Pacific Sea Cucumber Harvester’s Association (PSCHA) proposed a voluntaryindividual quota program for the 1994 fishery. There could have been a number ofreasons for this initiative at this time. As noted above, there were management problems.The short fisheries increased the risk to fishermen that if something went wrong, theywould lose out on the harvest. The short fisheries would also have caused marketingproblems and exacerbated safety problems in this winter fishery. To get a jump on thefishery, some fishermen were harvesting sea cucumbers before the openings and storingthem in bags on the bottom for retrieval during the fishery. Managers were having a hardtime meeting their TAC goals.
Fishermen may also have reacted to events in the related geoduck and sea urchin divefisheries. The B.C. geoduck dive fishery had had a successful individual quota programsince 1989. The success of the geoduck program must have been well known in divingcircles at this time. In fact, geoduck ex-vessel prices had started to go up rapidly in 1992and this appears to have increased the value of the geoduck licenses and their associatedquotas. The prospect of a similar event in the cucumber fishery would have given licenseholders an incentive to press for individual quotas. In the early part of 1994, a voluntaryindividual quota program had been begun in the red urchin fishery, in which many seacucumber fishermen worked. This program was apparently seen to be successful fairlyquickly and this may have given further incentive to sea cucumber fishermen. As notedbelow, PSCHA’s proposed voluntary program resembled the red urchin program.
Under the PSCHA proposal quotas were to be divided equally among the license holders,the North Coast and South Coast would be separate license areas, and landings were to be
35Heizer and Thomas, PSARC 1995, page 3.; Harbo to Shirley.36Rome, pers. comm.
8
monitored by a private contractor.37 Although DFO arranged its 1994 fishery plans toaccommodate the PSCHA, the plan fell through before it could be implemented.Apparently one of the operators refused to cooperate with the voluntary quota program.The proposed individual quotas were small compared to the fishing power of individualoperations, so one operation represented a lot of fishing power with respect to theresource, even though it was a relatively small part of the fleet.38
Individual Quotas, 1995-1998
Initial allocation and the nature of the property rights
The DFO management plan for 1995 noted that “Open times for fishing have been shortdue to high levels of harvest and limited quotas...quota overages have been experienced inmost years and quota reductions in some areas in subsequent years have occurred as aresult...Due to the intensive nature of this fishery, problems with exceeding quotas anddiver safety considerations, the industry has recommended that individual vesselquotas...be implemented.”39
The DFO introduced a two year pilot individual quota program in 1995.40 Under thisprogram the TAC was divided equally among the 85 Z-D license holders. The totalcommercial TAC was about 636 tons, round weight, in 1995. Dividing this equally amongthe license holders gave each 16,514 pounds, round weight.41
With the introduction of the individual quotas, Z-D licenses were made transferable.42 Inaddition, fishermen were allowed to use three licenses on a single vessel (called stacking).Fishermen were not allowed to transfer quotas independently of the license (with theminor exceptions in the case of overages - discussed below). During the period of theindividual quotas, fishermen were also allowed to transfer their licenses to vessels thatwere longer than the vessel length specified with the Z-D license. The DFO reserved theright to require licenses to revert to vessels with their originally assigned lengths at the endof the pilot program.43
Area licensing was introduced with individual quotas. Five license areas along the coastwere originally designated and given their own individual TACs. Within these five licenseareas the annual subarea rotations were continued. Each license was assigned to one ofthese areas. The number of licenses in each area was determined by the area TAC and the
37This plan had a lot of similarities with the programs already adopted in the geoduck and red sea urchinfisheries.38Heizer and Thomas, PSARC 1995, page 5; Neifer, pers. comm.39DFO, 1995 Mgt Plan, page 4.40The pilot program was extended into 1997 and 1998. It has not yet been made permanent (in April1998, (however.41DFO, 1995 Mgt Plan, page 6.42Except for the five Native band licenses. DFO, 1995 Mgt. Plan, page 6.43DFO, 1995 Mgt Plan, pages 6-7.
9
number of pounds that had been assigned to each license. License holders were free tochoose the area in which they wanted to fish; when more people wanted to fish in an areathan there were quota opportunities a random lottery was used to see who would get thelicense. License totals in the first year were:
West Coast of Vancouver Island 10East Coast of Vancouver Island 10Central Coast 22Prince Rupert District 22Queen Charlotte Islands 21
Individual license quotas were equal in all areas.44 These license areas and numbers oflicenses allocated to each area were readjusted in subsequent years. One license area, theQueen Charlotte Islands, was closed in 1996 and 1997 due to the problems and dangers infishing there compared to those of fishing in other areas. 45
If there was more than one license being fished off of a single vessel, fishermen couldtransfer an overage from one license to another of the licenses, subject to no limit otherthan that the second license have sufficient unused quota. In 1995, quota overages of upto 100 pounds could also be transferred from a license fished on one vessel to a secondlicense fished off of another vessel, so long as the license receiving the overage hadsufficient unused quota, was being used to fish in the same quota area, and was landing inthe same port (the same port restriction was eliminated in 1997). If a license holder hadan overage greater than 100 pounds, and could not transfer the overage to another licenseon the vessel, the proceeds from the sale of the overage were turned over or“relinquished” to the government. With experience, managers adjusted the overagetransfer limit to 250 pounds in 1996, and again to 200 pounds in 1997. In addition,managers introduced a rule in 1997 deducting 1997 overages from 1998 individualquotas.46
Enforcement
Fishermen, through PSCHA, contracted with a private firm, Archipelago Marine Research(Archipelago), to monitor landings. All landings had to be monitored or “validated” byArchipelago. License holders were required to pay validation fees to PSCHA beforeArchipelago would validate their catch.47
Fishermen were required to notify, or “hail,” Archipelago 24 hours before fishing in anarea, and 24 hours before landing product. Landings had to be made at designated portswhere dockside observers were present. At the time of landing the fishermen were tosubmit a detailed dive log and charts for the trip to the Archipelago observer. This dive
44DFO, 1995 Mgt. Plan, page 8.45Rome and Eades, pg 4; Rome, Eades, and Huston, pg 5.46DFO, 1995 Mgt. Plan, pg 14; Rome and Eades, pg 8; Rome, Eades, and Huston, pg 10, 15.47DFO, 1995 Mgt. Plan, pg 6.
10
log was supposed to be filled out daily during the trip. The Archipelago observersmonitor the landings and record the weight of the catch. Prior to weighing, the seacucumbers had to be eviscerated and de-watered. 48
Problems with the monitoring system seem to have declined quickly during the 1995-1997period as observers, managers, and fishermen learned how to make the system work.Each year Archipelago maintained a log of problems with the monitoring system. A fewof these problems may have represented attempts to cheat the system, most almostcertainly represented accidents. In 1995 there were 30 problems that were serious enoughto lead to Archipelago “incident reports.” Of the 46 problems discussed in these 1995incident reports, 33 had to do with a failure to turn in harvest logs and charts when thecucumbers were delivered or with other problems with the logs and charts. Therequirement that fishermen turn in their logs and charts when they landed their productwas a new one in 1995. There were delays in its implementation, and fishermen wereunfamiliar with it. This undoubtedly contributed to the large number of problems thatyear. The number of incident reports dropped from 30 in 1995 to seven in 1996 and threein 1997.49
DFO enforcement operators were also active on the water doing fishing area and vesselchecks. DFO enforcement used Archipelago license holder “hails” to intercept vesseloperators.50
User pays
The dockside monitoring program is funded by management assessments collected by thePSCHA. Once these assessments are collected, the PSCHA notifies Archipelago, and afisherman can receive a standard logbook from Archipelago. DFO regulations requirefishermen to use standard logbooks supplied only by Archipelago. The PSCHAmanagement assessments are currently $750. The validation program has cost about$40,000 a year in 1995, 1996, and 1997. The cost has not been equal in each year, and infact has declined somewhat.51
With the $40,000 cost of the monitoring program divided equally among 85 licenses,about $470 of the management fee collected by PSCHA went to Archipelago each yearfor the monitoring program expenses. The remainder has been used by the PSCHA for itsown expenses. The income has in fact exceeded the association’s annual operatingexpenses. The association has used the balance to build up its cash reserves.52
48DFO, 1995 Mgt. Plan, pg 13, attachment.49Rome and Clarke, pgs. 8-9; Rome, Eades, and Huston, pg 14.; Rome, pers. comm.50Rome and Clarke, page 7.51The numbers in this paragraph and the next are approximate. They are based on an interview with anassociation representative who was not able to refer to records at the time. Keith, pers. comm.52Keith, pers. comm.
11
Some Program results
Changes in effort levels
The number of active vessels and the number of active divers both dropped underindividual quotas, while the number of vessel fishing days initially increased but thendeclined. The number of vessels dropped immediately in the first year of the program andthen dropped again in each of the following two years. Ultimately, the number of vesselsdropped by 42% from 71 in 1994 to 41 in 1997. While these measures of resourcesdevoted to effort shrank, the number of vessel fishing days initially rose by 71% from 164to 280, but declined thereafter.
The reduction in the number of vessels took place through the stacking of licenses onvessels. The stacking limit was three licenses per vessel. The number of vessels fishingwith only one license dropped each year from 22 vessels in 1995 to 15 vessels in 1997.The number of vessels fishing two licenses also dropped each year. The number fishingthree licenses rose each year, from 12 vessels in 1995 to 17 vessels in 1997.53
The number of divers also dropped under individual quotas. By 1997 the number haddropped to about 70 divers from 157 in 1994; this was a drop of about 55%. The numberof divers did not drop in each year, but the numbers in all three years under individualquotas were much lower than the numbers in any of the years before individual quotas.
Lengthening of the fishing season
The fishery immediately lengthened when individual quotas were introduced. In 1994, thelast year before individual quotas, the season in open areas lasted from one day on theWest Coast of Vancouver Island and the Central Coast area, to six days in the QueenCharlotte Islands. In 1995, the first year with individual quotas, the season lasted from 13days on the West Coast of Vancouver Island, to 20 days in the Central Coast area. By1997, the season lasted 19 days in each open management area.54
Data on license values
The DFO has prepared price estimates for sea cucumber limited entry licenses based oninterviews with brokers and fishermen. These price estimates must be used cautiously.The value estimate for 1991, the first year of limited entry was $10,000. Since licenseswere not formally transferable at that time, this value estimate must be interpreted as thevalue of a long-term lease. No DFO estimates are provided for 1992 or 1993. In 1994,the DFO price estimate was $35,000. The estimate rose in each year thereafter, to$60,000 in the first year of individual quotas, to $70,000 in 1996, and to $80,000 in 1997.
53Rome and Clarke, pg. 2; Rome and Eades, pg 5; Rome, Eades, and Huston, page 6.54Despite generally unchanged, or slightly smaller, aggregate coastwide TACs. Rome, Eades, and Huston,Table 3.
12
The DFO encourages cautious use of these estimates, describing them as “suspect”because their basis is in what fishermen say they would buy and sell for, rather than inactual market prices.55 Values based on hypothetical, “what if” scenarios often deviategreatly from prices that would actually be offered or accepted.
These DFO estimates are, however, consistent with other estimates of $60,000 to $80,000given by an industry representative on the basis of information about a sale in 1997 andrumors about recent offers. This source indicated that the market had strengthenedrecently due to rumors about potential TAC increases.56
License holders and crew
The vessel license price data above suggests that vessel license owners have enjoyed anincrease in net wealth from the increase in license values. To some extent this may be dueto the individual quota program. Other management elements could also be affectingprice expectations however. The validation program, while its cost may reduce thepresent value of revenues associated with the license, may also create expectations ofimproved TACs based on improved information in manager’s hands. The recent movetowards possible increased harvests under a management regime where the traditionalTACs are supplemented by exploratory harvests may also be a consideration.57
Operators also appear to have benefited from the program in other ways. As noted above,the season has been extended and fishermen have more flexibility. A sudden, unexpectedproblem is less likely now to prevent an operator from fishing and losing out on a season.A guaranteed harvest reduces an important element of fishing risk and allows fishermen toplan with more confidence. There is more opportunity for fishermen to work aroundweather problems, improving operational safety.58
There has been a considerable drop in the number of divers employed in the fishery. Withthe drop in the number of separate vessels, it seems possible that there has also been adrop in the number of crew members employed as tenders.
Without good information on possible changes in share systems it is hard to say what theimpact has been on diving wages. A reduction in employed divers may have led to excesssupply of diver labor and a reduction in diver wages. Alternatively, improved marketingopportunities may have led to higher sea cucumber prices than there might otherwise havebeen; if share systems change with a lag, divers may have enjoyed some short run rentsfrom this. Improvements in comfort, safety, or the likelihood of harvesting the quota,discussed in an earlier paragraph, would tend to reduce shares and actual cash incomefrom the fishery. These factors would increase the attractiveness of diving and increase
55Mylchreest, fax.56Recent offers as of April, 1998. Keith, pers. comm.57This last was mentioned by one source. Keith, pers. comm.58Rome and Eades, page 7.
13
the expected value of the income from any given share arrangement, reducing the size ofthe shares operators would have to offer to attract divers.
Impacts on management
Managers feel that individual quotas and the associated validation program have had goodresults for management. The fishery has slowed down, and it is now possible to keepharvest within the TAC limits. There are more opportunities for cooperation betweenmanagers and industry. The validation program has meant an increase in the accuracy ofharvest statistics.59 Before individual quotas were introduced, fishermen would often fishand stockpile sea cucumbers underwater prior to the fishery opening. With the advent ofindividual quotas this no longer made sense and the practice is believed to have beenabandoned.60
Some area TACs were exceeded in some years by small amounts under individual quotas,but the coastwide TACs were met in all years, primarily because at least one license quotawent unfished in each year. Some fishermen exceeded their license quotas in each year,but the proportion of license quotas that were exceeded also dropped each year. Twenty-eight percent of the license quotas were exceeded in 1995 but only 18% in 1997. 61
The percentages of the persons who exceeded their quotas, but who were still able to staywithin the “quota overage transfer limits” rose in each year, from 43% in 1995 to 67% in1997. The large increase in the overage transfer limit from 1995 to 1996, from 100 to 250pounds, probably helped increase this percentage, but it still increased, even when the limitwas reduced somewhat, to 200 pounds, in 1997. The 1997 reductions may reflect the newrule introduced that year deducting overages above the “overage transfer limit” from thenext year’s individual quota allocation.62
Some fishing spots within an area with an area-wide aggregate TAC can be moreattractive than others. Since sea cucumbers are not highly mobile, this raises thepossibility of localized overfishing.
There have been some instances under this individual quota program where this may havebeen a problem. In 1995, the West Coast of Vancouver Island (WCVI) TAC coveredareas 24 and 25. However, the entire TAC was taken from subarea 24-7. Fishermen tookthe entire TAC from 24-7 because it was closer to their homes and closer to processingplants. This appears to have led to reductions in the CPUE in 24-7 before the end of thetwo weeks of fishing.63
59Neifer, pers. comm.60Neifer and Rogers, pg 2.61Rome and Clarke, pg 5; Rome and Eades, pg 9; Rome, Eades, and Huston, pg 10.62Rome and Clarke, pg 5; Rome and Eades, pg 9; Rome, Eades, and Huston, pg 10.63Rome and Clarke, pg 5; Rome and Eades, pg 9; Rome, Eades, and Huston, pg 10.
14
This problem was addressed in 1996 and 1997 through a multiplication of subarea TACsto spread out the harvest. These subarea TACs came to be referred to as “quota blocks.”Thus in 1996 in the WCVI separate TACs were established for each of two “quotablocks.” By 1997 the overall TAC for each license area on the coast was divided up intoeither two or four quota blocks. 64
A new approach to management
During the last 18 months preparations have been made to make major changes in themanagement of the sea cucumbers. 65 Different portions of the coast will be managed indifferent ways.
About a quarter of the B.C. coast has been set aside for a continuation of the existingfishery, although only part of this area will be harvested. In the areas included in thisquarter of the coast, license holders will be able to harvest their individual quotas. In thisopen area the rotation of management areas (which predated in the individual quotas) willbe dropped. A quarter of the coast was set aside to harvest the existing TAC on the basisof very conservative assumptions about appropriate harvest rates and sea cucumberdensity.66
A portion of the coast will also be set aside for experimental sea cucumber fishing.Fishery surveys and experimental harvests would be carried out in these coastal areas todevelop data on sea cucumber populations, and on how those populations respond todifferent harvest rates. DFO hopes to carry out controlled experiments to develop theinformation. Harvests would be arranged by the PSCHA which might make some moneyfrom them. These experimental harvests would be in addition to the existing fishery TACand would not be a part of fishermen’s individual quotas. Data from these experimentalharvests may be used in the future to justify increases in the existing TAC.67
About half of the B.C. coast will be set aside and protected from harvest for theforeseeable future. Large buffer areas around the areas used for TACs and experimentalharvests will be taken from this half.68
Discussion
When this fishery began to take off, in the early to mid-eighties, managers knew very littleabout the status of the sea cucumber resource. In the late eighties they imposed arbitraryTACs on the fishery to control harvests. However, expanding effort by fishermen in
64In 1996 these were Areas 26 and 27 (because of area rotation). Rome and Eades, pg 14; Rome, Eades,and Huston, pg 16.65This is written in April, 1998.66A harvest rate of 4.2% of the biomass and a density of 2.5 sea cucumbers per meter of shoreline. Parker,pers. comm.; Rome, pers. comm.67Parker, pers. comm.; Rome, pers. comm.68Parker, pers. comm.; Rome, pers. comm.
15
response to rising prices, made this very hard to do. In 1991, managers introduced limitedentry in a further attempt to control fishery effort.
Limited entry alone, however, was not successful, particularly since TACs were alsoreduced. The number of active vessels was reduced, but the number of divers remainedclose to pre-limitation levels, and in fact was capable of exceeding pre-limitation levels.Lower TACs and intense effort led to shorter fishing seasons. The intense effort and shortseasons in turn created incentives for fishermen to illegally collect and stockpilecucumbers before the fishery opening. These would then be landed on the first day of theopening. Depending on the management area, seasons could be reduced to a single day.With the shortening of the fishing seasons, managers, did manage to gradually bringcoastal harvests down to the annual coastal TACs.
Due to problems in the sea cucumber fisheries, and in light of the examples of individualquotas in the related geoduck and red sea urchin fisheries, the industry was ready toattempt a voluntary individual quota program by 1994. Although this program failed to beimplemented, the DFO introduced a mandatory program in 1995. This mandatoryindividual quota program was associated with an enhanced landings validation program.It is difficult to separate the impacts of the two.
The combined individual quotas and validation program appears to have led to reductionsin the effort used in the fishery and extensions in the fishing seasons in the differentmanagement areas. Pre-fishery stockpiling of cucumbers stopped because the fishingcompetition which had provided the incentive for it had disappeared. Managers found iteasier to manage a slower fishery, TACs were met, and fishery data improved.Cooperation between managers and fishermen is also better. License holders appear tohave benefited from an increase in license prices. Fishermen appear to benefit fromimproved operational flexibility leading to marketing and safety advantages and to reducedlikelihood of missing the fishery due to an accident. The number of persons employed inthe fishery has dropped, and it is not clear what the impact has been on income for personsinvolved in fishing.

16
17
Sources:
Da Silva, Jack, J. Lane Cameron, and Peter V. Frankboner. (1986). “Movement andOrientation Patters in the Commercial Sea Cucumber Parastichopus californicus(Stimpson) (Holothuroidea Aspidochirotida).” Mar. Behav Physiol. 12:(133-147).
Department of Fisheries and Oceans, Pacific Region, Commercial Licensing Unit.(1994)“Pacific Coast Commercial Licensing handbook - 1994.” Vancouver, April , 1994.
Ethelbah, Harley. (1998) Southeast Alaska sea cucumber diver. Personalcommunication. April 28, 1998.
Harbo, Rick. (1991). Personal letter with attachments to Ms. Susan M. Shirley at theAlaska Commercial Fisheries Entry Commission. January 11, 1991.
Heizer, S. and G. Thomas. (n.d.) “Sea Cucumber.” PSARC Fishery Update-1995.”
Hook, Tom. 1991. (1991) “Sea cucumbers: A slow starter takes off.” Nationalfishermen. Nov. 1991. 72(7):9-11,22.
Keith, Terry. (1998) President of the Pacific Sea Cucumber Harvester’s Association.Personal communication. April 23, 1998. 604-815-8380.
Mathews, Vincent, Matthew Kookesh, and Robert Bosworth. (1990) “SubsistenceHarvest and Use of Sea Cucumber in Southeast Alaska.” Technical Paper No. 190.Division of Subsistence, Alaska Department of Fish and Game. Juneau: August, 1990.
McNair, Doug. (1982) “Sea Cucumbers. The Fish of the Month.” Pacific Fishing.September, 1982. pgs 47-52.
Mylchreest, Russell. (1998) Department of Fisheries and Oceans, Pacific Region. Faxwith information on dive fishery catch statistics, licensing statistics, and estimates oflicense values. March 9, 1998.
Neifer, S. and J. Rogers. (1997) “Sea Cucumbers (Parastichopus californicus).” Nodate. Probably from a 1997 PSARC document.
Parker, Guy. (1998) Department of Fisheries and Oceans, Pacific Region. Email withdata on numbers of sea cucumber licenses and divers. March, 1998.
Rome, Eric and Jason Clarke. (1996) “A Review of the 1995 Sea Cucumber Fishery.”Prepared for the Pacific Sea Cucumber Harvester’s Association and the Department ofFisheries and Oceans, Canada.. Archipelago Marine Research. Victoria, B.C.: 1996.

18
Rome, Eric and Valarie Eades. (1998) “1996 Sea Cucumber Fishery Review.” Preparedfor the Pacific Sea Cucumber Harvester’s Association and the Department of Fisheries andOceans, Canada.. Archipelago Marine Research. Victoria, B.C.: January, 1998.
Rome, Eric, Valarie Eades, and Wendy Huston. (1998) “1997 Sea Cucumber FisheryReview.” Prepared for the Pacific Sea Cucumber Harvester’s Association. ArchipelagoMarine Research. Victoria, B.C.: February, 1998.
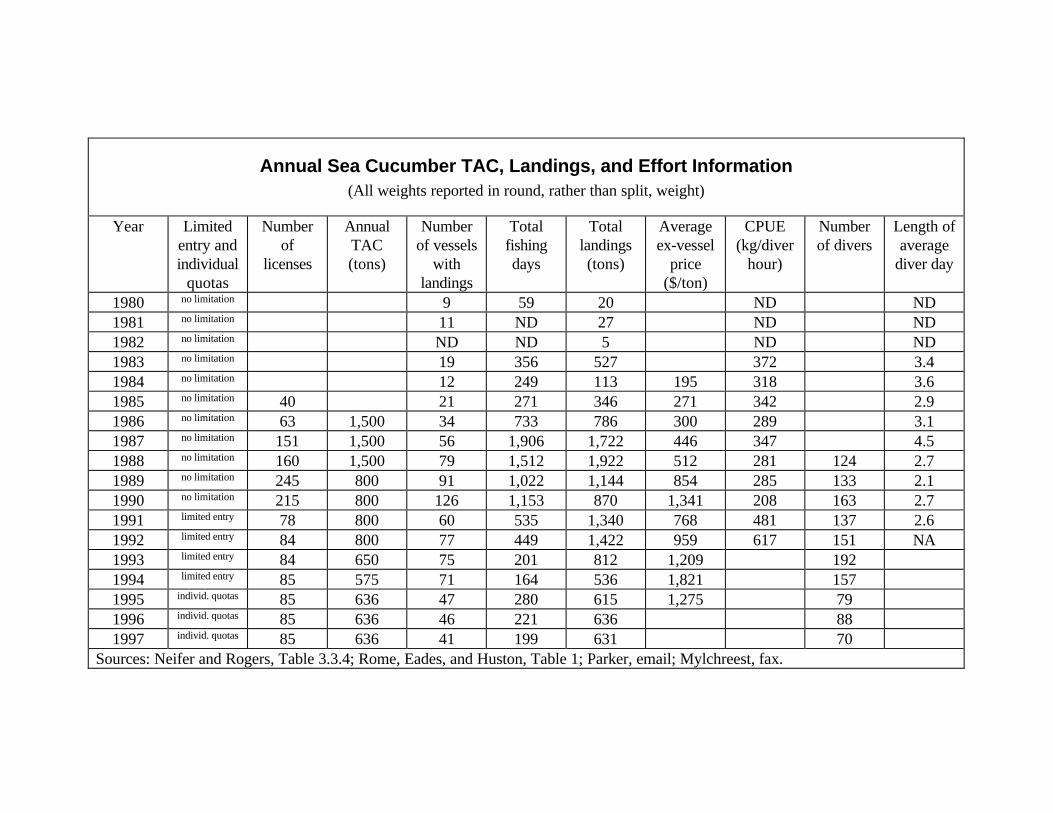
Annual Sea Cucumber TAC, Landings, and Effort Information(All weights reported in round, rather than split, weight)
Year Limitedentry andindividual
quotas
Numberof
licenses
AnnualTAC(tons)
Numberof vessels
withlandings
Totalfishingdays
Totallandings(tons)
Averageex-vessel
price($/ton)
CPUE(kg/diver
hour)
Numberof divers
Length ofaverage
diver day
1980 no limitation 9 59 20 ND ND1981 no limitation 11 ND 27 ND ND1982 no limitation ND ND 5 ND ND1983 no limitation 19 356 527 372 3.41984 no limitation 12 249 113 195 318 3.61985 no limitation 40 21 271 346 271 342 2.91986 no limitation 63 1,500 34 733 786 300 289 3.11987 no limitation 151 1,500 56 1,906 1,722 446 347 4.51988 no limitation 160 1,500 79 1,512 1,922 512 281 124 2.71989 no limitation 245 800 91 1,022 1,144 854 285 133 2.11990 no limitation 215 800 126 1,153 870 1,341 208 163 2.71991 limited entry 78 800 60 535 1,340 768 481 137 2.61992 limited entry 84 800 77 449 1,422 959 617 151 NA1993 limited entry 84 650 75 201 812 1,209 1921994 limited entry 85 575 71 164 536 1,821 1571995 individ. quotas 85 636 47 280 615 1,275 791996 individ. quotas 85 636 46 221 636 881997 individ. quotas 85 636 41 199 631 70
Sources: Neifer and Rogers, Table 3.3.4; Rome, Eades, and Huston, Table 1; Parker, email; Mylchreest, fax.