Embed Size (px)
Citation preview

Management of patients with stroke or TIA: assessment, investigation,
immediate management and secondary prevention
A clinical and resource impact assessmentMay 2009

© NHS Quality Improvement Scotland 2009 NHS Quality Improvement Scotland (NHS QIS) consents to the photocopying, electronic reproduction by ‘uploading’ or ‘downloading’ from the website, retransmission, or other copying of this report for the purpose of implementation in NHSScotland and educational and ‘not-for-profit’ purposes. No reproduction by or for commercial organisations is permitted without the express written permission of NHS QIS.

CONTENTS 1 EXECUTIVE SUMMARY ......................................................................................... 1 2 INTRODUCTION...................................................................................................... 8
2.1 Objective........................................................................................................... 8 2.2 Key recommendations ...................................................................................... 8 2.3 Document overview ........................................................................................ 10
3 BACKGROUND AND METHODOLOGY............................................................... 12 3.1 Introduction ..................................................................................................... 12 3.2 Methodology to estimate clinical benefit ......................................................... 12 3.3 Methodology to estimate resources required/associated costs and savings... 13 3.4 Methodology to estimate cost of resources and associated savings............... 14 3.5 Limitations....................................................................................................... 18
4 SCOTTISH STROKE EPIDEMIOLOGY ................................................................ 19 4.1 Introduction ..................................................................................................... 19 4.2 Incidence of a first hospital admission as a result of stroke or TIA.................. 19
5 TIMELY THROMBOLYSIS .................................................................................... 25 5.1 Background..................................................................................................... 25 5.2 Patient group................................................................................................... 25 5.3 Clinical benefit and associated resource savings............................................ 25 5.4 Resource requirements................................................................................... 26 5.5 Costs............................................................................................................... 28 5.6 Sensitivity analysis.......................................................................................... 28 5.7 Analyses by NHS board.................................................................................. 29
6 TIMELY CAROTID IMAGING AND CAROTID ENDARTERECTOMY .................. 34 6.1 Background..................................................................................................... 34 6.2 Patient group................................................................................................... 34 6.3 Clinical benefit and associated resource savings........................................... 35 6.4 Resource requirements................................................................................... 36 6.5 Costs............................................................................................................... 36 6.6 Sensitivity analysis.......................................................................................... 36 6.7 Analyses by NHS board.................................................................................. 37
7 TIMELY CT DIAGNOSTICS ................................................................................. 41 7.1 Background..................................................................................................... 41 7.2 Patient group................................................................................................... 42 7.3 Clinical benefits............................................................................................... 42 7.4 Resources....................................................................................................... 42 7.5 Costs............................................................................................................... 44 7.6 Sensitivity analysis.......................................................................................... 44

8 REFERENCES....................................................................................................... 45 9 APPENDICES........................................................................................................ 47
Appendix 1 Key recommendations .................................................................. 47 Appendix 2 Acknowledgements ....................................................................... 49 Appendix 3 Resource impact assessment process.......................................... 50 Appendix 4.1 ICD-10 codes for stroke or TIA...................................................... 51 Appendix 4.2 ICD-10 codes for other cerebrovascular diseases ........................ 52 Appendix 5.1 Incidence of first ever hospital admission for stroke and TIA for year ending 31 March 2007 .......................................................... 53 Appendix 5.2 Survival rates for stroke and TIA after a first ever hospital admission for year ending 31 March 2007 .................................... 54 Appendix 5.3 Re-admission rates for stroke and TIA after a first ever hospital admission for year ending 31 March 2007 .................................... 55 Appendix 5.4 Prior admission of patients who had a first ever admittance for stroke or TIA for year ending 31 March 2007................................ 56 Appendix 5.5 Incidence of stroke and TIA resulting in a first ever hospital admission by NHS board for year ending 31 March 2007............. 57 Appendix 5.6 Predicted mortality for patients with first admission of ischaemic stroke for year ending 31 March 2007........................................... 58 Appendix 5.7 Predicted mortality and disability for patients with first admission of ischaemic stroke for year ending 31 March 2007.......................... 59 Appendix 6.1 Estimated first hospital admissions for stroke or TIA..................... 60 Appendix 6.2 Estimated survival rates for patients following a first admission to hospital for stroke or TIA ............................................................... 61 Appendix 6.3 Estimated re-admission rates for patients following a first admission to hospital for stroke or TIA .......................................... 62 Appendix 6.4 Estimated prior admission rates for patients later admitted for stroke or TIA for the first time........................................................ 63 Appendix 6.5 Estimated admission rates for patients who have attended a neurovascular outpatient clinic ...................................................... 64 Appendix 7.1 Costs for the Scottish Ambulance Service .................................... 65 Appendix 7.2 Costs for attendance at an A&E department................................. 66 Appendix 7.3 Costs per event for CT, MRI and ultrasound diagnostics .............. 67 Appendix 7.4 Costs for a stroke consultant outpatient attendance ..................... 68 Appendix 7.5 Costs for a consultant vascular surgeon outpatient attendance.... 69 Appendix 7.6 Mean variable cost per day (excluding overheads and theatre costs) in a surgical ward................................................................ 70 Appendix 7.7 Mean variable cost per day (excluding overheads and theatre costs) in a general medical ward................................................... 71 Appendix 7.8 Costs per hour for theatre time inclusive of overheads, staff costs and consumables .......................................................................... 72
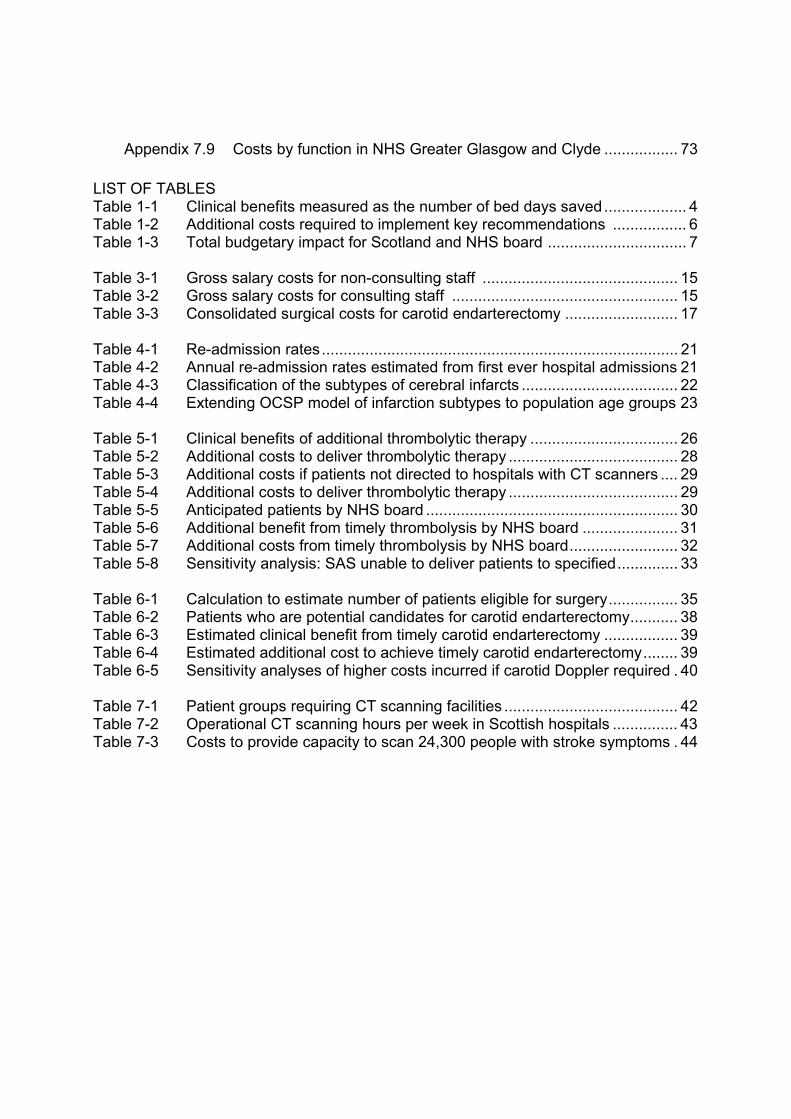
Appendix 7.9 Costs by function in NHS Greater Glasgow and Clyde ................. 73 LIST OF TABLES Table 1-1 Clinical benefits measured as the number of bed days saved................... 4 Table 1-2 Additional costs required to implement key recommendations ................. 6 Table 1-3 Total budgetary impact for Scotland and NHS board ................................ 7 Table 3-1 Gross salary costs for non-consulting staff ............................................. 15 Table 3-2 Gross salary costs for consulting staff .................................................... 15 Table 3-3 Consolidated surgical costs for carotid endarterectomy .......................... 17 Table 4-1 Re-admission rates.................................................................................. 21 Table 4-2 Annual re-admission rates estimated from first ever hospital admissions 21 Table 4-3 Classification of the subtypes of cerebral infarcts .................................... 22 Table 4-4 Extending OCSP model of infarction subtypes to population age groups 23 Table 5-1 Clinical benefits of additional thrombolytic therapy .................................. 26 Table 5-2 Additional costs to deliver thrombolytic therapy ....................................... 28 Table 5-3 Additional costs if patients not directed to hospitals with CT scanners .... 29 Table 5-4 Additional costs to deliver thrombolytic therapy ....................................... 29 Table 5-5 Anticipated patients by NHS board .......................................................... 30 Table 5-6 Additional benefit from timely thrombolysis by NHS board ...................... 31 Table 5-7 Additional costs from timely thrombolysis by NHS board......................... 32 Table 5-8 Sensitivity analysis: SAS unable to deliver patients to specified.............. 33 Table 6-1 Calculation to estimate number of patients eligible for surgery................ 35 Table 6-2 Patients who are potential candidates for carotid endarterectomy........... 38 Table 6-3 Estimated clinical benefit from timely carotid endarterectomy ................. 39 Table 6-4 Estimated additional cost to achieve timely carotid endarterectomy........ 39 Table 6-5 Sensitivity analyses of higher costs incurred if carotid Doppler required . 40 Table 7-1 Patient groups requiring CT scanning facilities ........................................ 42 Table 7-2 Operational CT scanning hours per week in Scottish hospitals ............... 43 Table 7-3 Costs to provide capacity to scan 24,300 people with stroke symptoms . 44
1
1 EXECUTIVE SUMMARY
In their recent report, Reducing Brain Damage: Faster access to better stroke care1, the National Audit Office stated that in England and Wales, stroke costs the NHS and the economy approximately £7 billion a year. Of this sum, £2.8 billion is estimated to be in direct costs to the NHS, £2.4 billion of informal care costs borne by the patients’ family and other carers, with a further £1.8 billion being lost productivity and disability income for those under the age of 65 who are unable to work as a result of their condition. Translating these numbers to Scotland suggests that the cost to the Scottish economy as a result of stroke is in the region of some £700 million. Whilst stroke is primarily associated with age and ageing, it is important to note that the number of patients under the age of 65 who are being admitted to Scottish hospitals due to stroke is increasing. This group now represents 26.5% of all stroke admissions; up 32.5% from the 20.0% of admissions reported in 2000 as part of the Scottish Borders Stroke Study2. Moreover, while the reported incidence of stroke has decreased marginally over the last 10 years, this trend may not continue because of the population demographics. In the next 10 years, one of the largest population deciles, the 55–65 age group, or the ‘baby boomers’, will progressively move into the next of the higher risk stroke age groups. The objective of this clinical and resource impact assessment is to facilitate more rapid implementation of the key recommendations in SIGN Guideline 108 Management of patients with stroke or TIA: assessment, investigation, immediate management and secondary prevention3. The report provides each NHS board with an estimate of the resources and costs required to implement the key recommendations, together with the associated clinical benefits, including potential cost savings. The guideline development group judged 15 recommendations to be clinically very important and should be prioritised for implementation. Following discussion with members of the group it was agreed that eight recommendations would not change current practice and therefore would not have a material impact on current resource use. These have been excluded from further analysis. A short explanation of each recommendation including commentary for those that have been excluded is provided in Appendix 1. Seven recommendations were judged to be clinically important and to require significant resources on implementation. The associated clinical benefits, resources and costs to implement these key recommendations are estimated in this report. These have been grouped into two headings; timely thrombolysis and timely carotid imaging and carotid endarterectomy. Implementing these two interventions are the key challenges for NHS boards. The individual recommendations for each intervention are:

2
Recommendations for timely thrombolysis • Emergency medical services should be redesigned to facilitate rapid access to
specialist stroke services.
• Stroke patients requiring admission to hospital should be admitted to a stroke unit staffed by a co-ordinated multidisciplinary team with a special interest in stroke care.
• All patients with suspected stroke should have brain imaging immediately on presentation.
• Patients admitted with stroke within 4.5 hours of definite onset of symptoms, who are considered suitable, should be treated with 0.9 mg/kg (up to maximum 90 mg) intravenous recombinant tissue plasminogen activator (rt-PA).
Recommendations for timely carotid imaging and carotid endarterectomy • All patients with non-disabling acute stroke syndrome/transient ischaemic attack
(TIA) in the carotid territory who are potential candidates for carotid surgery should have carotid imaging.
• All patients with carotid artery territory stroke (without severe disability, modified Rankin Scale [mRS] ≤2) or TIA should be considered for carotid endarterectomy as soon as possible after the index event.
• Carotid endarterectomy (on the internal carotid artery ipsilateral to the cerebrovascular event) should be considered in all:
- male patients with a carotid artery stenosis of 50–99% (by NASCET method) - female patients with a carotid artery stenosis of 70–99%.
• For all patients, carotid endarterectomy should be performed as soon as the patient is stable and fit for surgery, ideally within 2 weeks of the initial event.
Implementing both interventions requires the use of radiological diagnostics to assist in the primary determination of specific stroke type. The analysis contained in Section 7 on timely computed tomography (CT) diagnostics suggests approximately 24,300 CT scans will be required annually for all patients with potential strokes, to include those scanned immediately after thrombolysis. The resources and costs to manage a service to deliver these are also discussed.
The methodology used to develop this report adopts proven processes and principles4-7. Members of the guideline development group and other experts have provided advice and participated in peer review. The draft findings were presented to representatives from NHS Dumfries & Galloway, NHS Ayrshire & Arran, NHS Lanarkshire and NHS Greater Glasgow and Clyde. Due to time constraints, it was not possible to visit all NHS boards in Scotland. However, the remaining boards were provided with drafts of all the underlying analyses for comment and feedback. The boards visited represent the

3
varying spatial diversity of all boards, namely those that have one major hospital, two major hospitals, three major hospitals and multiple sites. The feedback from the visits has been adapted for the remaining boards. The information contained within this report at a national level represents the clinical, resource and budget impact consolidation of each of the individual mainland NHS boards, with the boards of NHS Orkney, NHS Shetland and NHS Western Isles combined into a single entity, the NHS island boards. The epidemiological variations that exist between the boards in Scotland have been taken into account in the preparation of this work through extensive epidemiological modelling covering the last 3 years. Estimated clinical benefits of implementing the key recommendations Implementing SIGN 108 is forecast to require: • 810 more patients receiving thrombolysis, compared to the current number of 205,
and
• 608 more patients receiving a carotid endarterectomy, and improving the timeliness of the current 552 procedures such that these are delivered within 14 days from event.
Diagnosing and managing these patients will require radiology departments to provide CT scanning and other imaging services for approximately 24,300 patients per year. The clinical benefits forecast following these interventions are estimated to be: • 82 patients making a full recovery and 364 having an improved outcome following
thrombolysis, and
• 217 recurrent strokes avoided from timely carotid endarterectomy. The associated bed days saved are estimated at 10,611, of which 4,752 are achieved by timely thrombolysis and 5,859 from timely carotid endarterectomy. The financial benefits are estimated at £2.94 million. This is calculated by applying a weighted average variable cost for Scotland (excluding overheads) of £277 per bed day. Table 1–1 gives the benefits by NHS board for each intervention. No account has been taken of the savings that successful implementation will have in the longer term, particularly from lower rehabilitation costs. Further analysis is provided in Sections 5 and 6 of this report.

4
Table 1-1 Clinical benefits measured as the number of bed days saved
NHS board Timely
thrombolysisTimely carotid
Total bed days saved
Average weighted
cost Total
savings NHS Ayrshire & Arran 621 405 1,026 £193 £198,018NHS Borders 153 135 288 £204 £58,752NHS Dumfries & Galloway 234 189 423 £323 £136,629NHS Fife 423 351 774 £439 £339,786NHS Forth Valley 243 243 486 £176 £85,536NHS Grampian 414 405 819 £223 £182,637NHS Greater Glasgow and Clyde 801 1,809 2,610 £233 £608,130NHS Highland 180 270 450 £410 £184,500NHS Island Boards 36 54 90 £295 £26,550NHS Lanarkshire 657 945 1,602 £210 £336,420NHS Lothian 585 702 1,287 £368 £473,616NHS Tayside 405 351 756 £415 £313,740NHSScotland 4,752 5,859 10,611 £277 £2,944,314 Additional staff required to implement the key recommendations Timely thrombolysis Additional staff will be required to assess, deliver and immediately manage patients receiving thrombolytic therapy. Each NHS board is assumed to require: • a band 7 specialist nurse who spends 1 hour assessing each of the 1,900 patients
who may be eligible for the therapy. If the responses indicate that the patient may be eligible for the therapy then the nurse is assumed to call for a consultant. Thereafter the nurse will attend patients receiving the therapy for a further 6 hours as the drug is administered and to oversee the initial management.
• consultant stroke physicians. Each NHS board is assumed to manage with no additional consultant resource during the core weekday hours. The additional workload associated with thrombolysing patients who present during core hours is assumed to displace the existing workload. However, this should reduce as the upfront investment in delivering the therapy is rewarded by having more patients with improved outcomes and consequently discharged earlier. This assumption will be particularly challenging for smaller boards where the consultant may have duties to conduct outwith the main hospital. Seven NHS boards, being those forecast to have more than 30 patients a year presenting for this therapy in the early evening, are forecast to recruit an extra 0.5 whole time equivalent (WTE) consultant each to

5
cover five planned activities per week, providing cover until 8pm. All other out of hours work is assumed to be undertaken by on-call arrangements.
The total staff required is estimated to be 4.2 WTE nurses, 35 additional planned activities per week to provide consultant resource in the early evening and 760 out of hours call-outs. An analysis of the staffing required by NHS board is provided in Section 5.7. Carotid endarterectomy Delivery of a timely carotid endarterectomy service will require staff to perform an additional 608 carotid endarterectomy procedures. The additional staff required are 1.1 WTE vascular surgeons, 0.65 WTE band 5 and 0.65 WTE band 6 theatre nurses and 0.65 WTE anaesthetist. Most inpatients should be able to receive the procedure during their initial inpatient stay, whilst outpatients are assumed to be admitted for 2 nights, one before and one after the procedure. The benefits from fewer recurrent strokes will reduce the demand for bed days over time. For example, undertaking five carotid endarterectomy procedures within 14 days of the original events, will require a total of 10 bed days (2 night stay in a surgical ward as a maximum) initially but may be rewarded by preventing one recurrent stroke, saving some 27 bed days. However, there may be a timing issue for hospitals since the extra beds and associated services are needed immediately but the overall long term benefit could potentially be over 5 years8. Timely CT diagnostics The total number of staff required to provide a timely CT scanning service for patients suspected of a stroke or TIA, and their subsequent management, is estimated to be almost 740 planned activity sessions for stroke consultants to read the images and approximately six band 7 radiographers, six band 6 radiographers, six band 3 helpers and six band 2 clerical officers. Many of these staff will be in place. However, it has not been possible to identify whether any additional staff could be required. Rather, an analysis of the current service provision suggests there is sufficient capacity in the system. An estimated 3.8 WTE additional band 6 business administration managers are forecast to be required across Scotland, in the first year, to support implementation. Estimated costs required to implement the key recommendations The estimated costs of implementing the key recommendations are £3.5 million in the first year. Thereafter the £0.13 million for business support should fall, leaving additional costs to the service of around £3.4 million.

6
Table 1–2 analyses the cost by NHS board for each of the three interventions. These costs exclude any costs for additional diagnostics. Provision of an efficient CT scanning service could cost approximately £0.95 million a year. It is not possible to estimate the current costs and thus whether additional costs are required. Table 1-2 Additional costs required to implement key recommendations in
SIGN 108
NHS board Timely
thrombolysis
Timely carotid
endarterectomy
Business admin
support Total costs
NHS Ayrshire & Arran £210,140 £33,439 £10,300 £253,879NHS Borders £34,314 £32,707 £5,150 £72,171NHS Dumfries & Galloway £52,696 £10,469 £5,150 £68,315NHS Fife £179,205 £69,429 £10,300 £258,934NHS Forth Valley £64,006 £17,460 £5,150 £86,616NHS Grampian £297,275 £29,960 £10,300 £336,534NHS Greater Glasgow and Clyde £294,679 £591,189 £36,049 £921,917NHS Highland £259,096 £22,427 £5,150 £286,673NHS Island Boards £5,133 £7,502 0 £12,635NHS Lanarkshire £229,262 £285,210 £15,449 £529,921NHS Lothian £217,764 £210,573 £15,449 £443,786NHS Tayside £178,759 £67,819 £10,300 £256,878NHSScotland £2,022,329 £1,377,185 £128,747 £3,528,260 Estimated net costs required to implement the key recommendations Comparing the total cost of implementing the guideline with a valuation based on the bed days saved is difficult to interpret. This is because reducing bed days seldom releases additional funding or staff resources; rather the beds are used to manage additional patients or non-stroke patients and staff are re-deployed elsewhere in the board. Despite that caveat, the estimated net cost (before any enhancements are made to the provision of diagnostic services) from implementing SIGN 108 is estimated at approximately £0.6 million in year one, as detailed in Table 1–3.

7
Table 1-3 Total budgetary impact for Scotland and NHS boards of SIGN 108
NHS board Estimated savings Total costs
Net cost impact
NHS Ayrshire & Arran £198,018 £253,879 £55,861NHS Borders £58,752 £72,171 £13,419NHS Dumfries & Galloway £136,629 £68,315 (£68,314)NHS Fife £339,786 £258,934 (£80,852)NHS Forth Valley £85,536 £86,616 £1,080NHS Grampian £182,637 £337,535 £153,898NHS Greater Glasgow and Clyde £608,130 £921,917 £313,787NHS Highland £184,500 £286,673 £102,173NHS Island Boards £26,550 £12,635 (£13,915)NHS Lanarkshire £336,420 £529,921 £193,501NHS Lothian £473,616 £443,786 (£29,830)NHS Tayside £313,740 £256,878 (£56,862)NHSScotland £2,944,314 £3,528,261 £583,946 NHS board reports In support of this national report, each NHS board (with the islands combined) has received spreadsheets covering: • data from ISD on the incidence and outcome of stroke that has resulted in a hospital
admission over the last 3 years, and
• the assumptions, values for each key parameter and analysis used to estimate their individual cost and savings.
It is hoped that these spreadsheets will provide a framework for boards to enable them to model potential solutions to the challenges presented in implementing the key recommendations in SIGN 108.

8
2 INTRODUCTION
2.1 Objective
The objective of this clinical and resource impact assessment is to facilitate more rapid implementation of the key recommendations in SIGN Guideline 108 Management of patients with stroke or TIA: assessment, investigation, immediate management and secondary prevention3. The report provides each NHS board with an estimate of the resources and costs required to implement the recommendations, together with the associated clinical benefits. This report does not reproduce the SIGN guideline and should be read in conjunction with it. A recent Audit Commission report concluded that the lack of robust information on the resources required and associated costs including any potential savings was one of the biggest difficulties in developing plans to implement clinical guidelines9. This report aims to provide such information to support implementation of the recommendations in NHS boards. It does not attempt to cost all aspects of the current diagnosis and management of patients with stroke or transient ischaemic attack (TIA). No cost effectiveness analyses are presented within this report.
2.2 Key recommendations
Timing is a central theme throughout SIGN 108. The changes in practice that are required to facilitate implementation of the key recommendations are not necessarily a marked departure from current clinical practice or the patient pathway of care within the acute setting. Rather, successful implementation requires doing the same things to a more demanding timescale. Stroke and TIA’s share common morbidity or co-morbidities with primarily, coronary heart disease, peripheral vascular disease and diabetes10, each of which in turn require the same resources, be that the Scottish Ambulance Service (SAS), radiological diagnostics or indeed theatre time. For each of the key recommendations, a synopsis of the relevant considerations that have been taken into account as part of the workflow arrangements which led to the preparation of this report is noted below.
Timely thrombolysis
Emergency medical services should be redesigned to facilitate rapid access to specialist stroke services (recommendation 2.1) The costings have focussed on the front line diagnostics required to determine the stroke type; a computed tomography (CT) scanner in the first instance. Adopting a protocol for SAS that enables the paramedics to recognise a potential stroke patient and to deliver the person to a hospital with a CT scanner rather than the nearest ‘place of safety’ should reduce the number of secondary transfers from non-CT scanning Accident & Emergency (A&E) departments. However, this may result in potentially

9
longer journeys in both distance and time. Under these circumstances, the use of the air ambulance service may be required as the only method of transport suitable to move patients to an appropriate place for thrombolytic therapy within the period of 4.5 hours of symptom onset.
Stroke patients requiring admission to hospital should be admitted to a stroke unit staffed by a co-ordinated multidisciplinary team with a special interest in stroke care (recommendation 2.2) All of Scotland’s hospitals which have a CT scanner also have a stroke unit associated11; either as an acute receiving unit, a rehabilitation unit or a combination of both. Geographical variations between and within NHS boards means that not all hospitals are in a position to offer thrombolytic therapy or to provide surgical facilities for carotid endarterectomy. Recruiting specialist nurses to deliver timely thrombolysis is judged to be sufficient to ensure all hospitals admitting stroke patients are staffed by a co-ordinated multidisciplinary team with a special interest in stroke care. All patients with suspected stroke should have brain imaging immediately on presentation (recommendation 2.3.1) The imaging may take place following assessment at A&E or by elective attendance at a neurovascular clinic. The report has quantified the demand for CT scanning services in all settings and assessed the capacity required to meet this demand. Patients requiring assessment for timely thrombolysis would still require to be seen on an urgent basis. Patients admitted with stroke within 4.5 hours of definite onset of symptoms, who are considered suitable, should be treated with 0.9 mg/kg (up to maximum 90 mg) intravenous rt-PA (recommendation 2.4) The process of delivery of the thrombolytic agent can, depending on the weight of the particular patient, take up to 1.5 hours to be delivered. Thereafter a period of 6 hours must be allowed for patient recovery in an environment akin to either a high dependency unit or an intensive care unit and thus require dedicated specialist care. Timely carotid endarterectomy All patients with non-disabling acute stroke syndrome/TIA in the carotid territory who are potential candidates for carotid surgery should have carotid imaging (recommendation 2.3.2) All patients with carotid artery territory stroke or TIA should be considered for carotid endarterectomy as soon as possible after the index event (recommendation 2.6.1)
Carotid endarterectomy (on the internal carotid artery ipsilateral to the cerebrovascular event) should be considered in all: - male patients with a carotid artery stenosis of 50–99% (by NASCET method) - female patients with a carotid artery stenosis of 70–99%

10
For all patients, carotid endarterectomy should be performed as soon as the patient is stable and fit for surgery, ideally within 2 weeks of the initial event (recommendation 2.6)
Implementing these recommendations will require arrangements to be made for possible surgical intervention as soon as possible after initial symptom onset; ideally within less than 14 days for maximum potential benefit based on the number needed to treat (NNT) to avoid a single recurring stroke event. Given the tendency for this procedure to be geared towards those with mild strokes (modified Rankin Scale [mRS] ≤2) and TIA’s the provision of this service must encompass not only those who have been admitted, but also those who have had an initial referral to a neurovascular outpatient clinic.
2.3 Document overview
Section 3 describes the methodology used to estimate the clinical benefit (which is expressed as a number of bed days saved with the associated weighted average variable costs [excluding overheads]), the estimate of resources required (including cost calculations for consulting and non-consulting staff) and the provisions for consumable costs, theatre operating rates per hour and the weighted average cost of the essential radiological scans. Section 4 describes the methodology adopted together with the background with regards to stroke. This involved the development of a model to predict mortality at 1 month following a first hospital admission, and the predictability of recurrent events that result in a re-admission at 3 months following an initial discharge for those who have survived. Sections 5, 6 and 7 report the estimates for each of the key recommendation groupings; timely thrombolysis, timely carotid endarterectomy and timely CT diagnostics in more detail. Sensitivity analyses are provided within each section. The detailed appendices contain the following information: Appendix 1 lists the 15 clinically important recommendations and explains why some were excluded from further study. Appendix 2 acknowledges those who have contributed to the development of this report. Appendix 3 provides a flowchart on the resource impact assessment process and implementing guidelines. Appendix 4 details the International Classification of Disease (ICD 10) codes as they relate to cerebrovascular disease. Appendix 5 details the epidemiological model for Scotland that has been derived from the analysis of mortality records from the General Register Office for Scotland (GROS) and Scottish Morbidity Admission Records (SMR01) databases from Information Services Division (ISD). Appendix 6 illustrates how these data has been used to drive the consolidated demand for admissions, re-admissions and survival rates for patients who are both inside and outside the follow up window of one year.

11
Appendix 7 provides an index to the sources of information which are published annually by ISD in relation to costs in NHSScotland. Further information For further information on this report, to obtain a copy, or to provide feedback on its usefulness please contact: Joyce Craig Lead Health Economist NHS Quality Improvement Scotland Delta House 50 West Nile Street GLASGOW G1 2NP 0141 225 6985 [email protected]

12
3 BACKGROUND AND METHODOLOGY
3.1 Introduction
Stroke is the third biggest cause of mortality and the primary cause of acquired disability in the adult population1. It is estimated that hospital care for patients with a stroke accounts for 7% of total beds occupied in Scottish hospitals and that the total cost of care represents nearly 5% of the entire NHSScotland budget11. The outcome for patients following stroke is generally referred to in terms of survival, functional status (dependence and disability) and the risk of recurrence12-14. Recurrent stroke carries a higher risk of mortality and can lead to profound long term disability in those who have survived their initial stroke, depending on the base level of impairment from that event. Implementing the key recommendations in SIGN 108 is anticipated to improve patient outcomes by enabling the appropriate therapies to be administered in the optimal time frames. Delivery of timely carotid endarterectomy should reduce the risk of a recurrent cerebrovascular event. Delivery of timely thrombolysis should reduce the level of possible dependency following a stroke and facilitate earlier hospital discharge.
3.2 Methodology to estimate clinical benefit
The mean length of stay as a result of stroke in Scottish hospitals is estimated at 27 days per event. This is a weighted average of the mean length of stay of 25.4 days reported by the Scottish Stroke Care Audit (SSCAS)11 and the mean length of stay of 28.9 days for ischaemic stroke and 27.2 days for inconclusive stroke, reported by ISD15. Preventing a stroke event that would otherwise result in either a repeat admission (if the patient had already been admitted previously and then subsequently discharged) or a first ever admission (if the patient had previously been seen at a neurovascular outpatient clinic) is assumed to save 27 bed days. SIGN 108 reports the clinical studies that demonstrate treatment with recombinant tissue plasminogen activator (rt-PA) within 4.5 hours of symptom onset improves the outcome of some but not all patients who are eligible for treatment. It should not be seen as a ‘cure’ for ischaemic stroke, including the possibility of preventing recurrent events; rather for some patients successful therapy can reduce the severity, including the level of disability or impairment, which can accompany the event. In the pathway from admission to final discharge the outcome from thrombolytic therapy has been estimated to enable 10% of patients to make a full recovery and be discharged early (the ‘Lazarus Effect’), whilst 45% of patients will have a significantly improved outcome enabling earlier discharge16. The question of time from symptom onset is fundamental in the delivery of thrombolytic therapy. Patients who arrive at hospital where the time of symptom onset is judged to be greater than 4.5 hours will not be eligible for therapy under the current licence for use. In the preparation of this report, the ICD 10 code for inconclusive stroke (I64) has been taken as an indicator, given the geographical variations within the epidemiology

13
(see Section 4) of the percentage of patients who currently do not arrive within the appropriate time frame for thrombolytic consideration. The time from symptom onset is also relevant for the effective provision of carotid endarterectomy. Section 11.1.1 of SIGN 108 demonstrates that the NNT to prevent one recurrent event rises as the time from symptom onset progresses. To calculate the clinical benefit from carotid endarterectomy, this report assumes NHS boards are able to provide the procedure within 14 days of the event, in line with the SIGN recommendation. This maximises the potential clinical benefit. This section of SIGN 108 also notes that ‘A proportion of patients who are severely disabled immediately following their stroke event can make rapid recovery such that they meet the criteria used in the studies’ for carotid endarterectomy’. This report assumes thrombolysis can improve the outcome of patients sufficiently to enable them to be considered for carotid evaluation and possible surgical intervention prior to discharge. Following administration of thrombolytic therapy, carotid artery occlusion and the anterior circulation infarcts that stem from this type of underlying cause have been reported as a determinant of poor outcome in the 3 months following treatment17, when by inference the risk of a recurrent event is greatest in this particular subtype of ischaemic stroke (see Section 4)12-14. This may be reduced by carotid endarterectomy. Not all patients who arrive within 4.5 hours of symptom onset will be eligible for thrombolytic therapy. The Summary of Product Characteristics (http://emc.medicines.org.uk/medicine/308/SPC/Actilyse/) does not recommend use for patients over the age of 80 years. Other contraindications include patients with severe stroke as assessed clinically and/or by appropriate imaging techniques, patients receiving oral anticoagulants and evidence of any haemorrhage events, including liver disease. These exclusions have been modelled in this report by assuming a specialist nurse trained in thrombolytic therapy undertakes an assessment in an A&E environment. For those patients who are assessed as unsuitable for thrombolysis but candidates for carotid endarterectomy, rapid access to carotid imaging and potential surgical intervention should be facilitated in order to meet the 14 day timeline for maximum clinical benefit. Due to the current low numbers being treated for thrombolysis this element has been difficult to model for this report, however it will be a significant factor to consider as implementation progresses.
3.3 Methodology to estimate resources required and associated costs and savings
Appendix 3 outlines the process developed and adopted to produce this report. Once the key themes and associated recommendations had been identified, draft patient pathways showing the changes required to implement each key recommendation were developed. These were informed by the results of a literature search on the epidemiology of stroke. ISD also provided extensive data on Scottish epidemiology and the facilities available at each NHS board. These data were combined with knowledge gained from intensive discussions with a number of the members of the guideline development group, feedback from members of the stroke managed clinical networks

14
and on-site visits. Discussions were also held with representatives from SAS. Planners from SAS modelled the implications of changing the destination for potential stroke patients, depending on the availability of CT scanning facilities. The data from these sources were combined into several models. An independent expert, with extensive knowledge of SSCAS was asked to validate the outcomes of the epidemiological model and other clinical experts were asked to validate the pathways assumed for their NHS board. Where possible published resource and cost data from ISD were used and supplemented by other published data as appropriate. Occasionally, unpublished sources were used and referenced. The models were made available to clinicians in all mainland NHS boards for review, supported, where possible, by meetings to discuss the findings. Data values and associated spreadsheets were quality assured by an independent health economist. An evaluation of the usefulness of this report to NHS boards as they seek to implement the recommendations in SIGN 108 will be commissioned by NHS Quality Improvement Scotland.
3.4 Methodology to estimate cost of resources and associated savings
The cost of rt-PA alteplase was taken from BNF 56 (www.bnf.org) being:
• 10 mg £135 excluding VAT; £158.63 including VAT at 17.5% • 20 mg £180 excluding VAT; £211.50 including VAT at 17.5% • 50 mg £300 excluding VAT; £352.50 including VAT at 17.5%.
For the purpose of this report the cost of alteplase has been taken as an average of 80 mg at a cost of £723 including VAT. Costs for events such as SAS journeys, A&E attendance, radiology attendance, outpatient consultation, inpatient stay and theatre costs per hour are routinely published by ISD (http://www.isdscotland.org/isd/5822.html). The costs adopted in this report are a weighted average taking into consideration the total costs (overheads, staff resources, supplies and consumables) and dividing this by the number of events or patients who have attended. To calculate the value of a ‘bed day saved’ the inpatient rate per day has been adjusted to remove overheads and theatre costs, leaving primarily staff costs plus some consumables that would normally be required during an inpatient stay. This approach, primarily applied to the cost data for the mainland NHS boards, gives a Scottish mean weighted cost for an overnight stay in a general medical ward, where stroke unit costs are recorded, of £277 per day (see Table 1–1).

15
Appendix 7 details all of the costs that have been used in this report. These are available to download from the ISD website at www.isdscotland.org/isd/4434.html. On an individual NHS board level the supporting excel spreadsheets have the facility to change the cost matrix should the need arise. The mean staff costs for the additional staff required as a result of implementing SIGN 108 have been taken as the mid-point within the Agenda for Change pay scales as it affects both consulting and non-consulting staff. This salary mid-point is ‘grossed up’ by 22% to take account of the current rate of national insurance contributions and pension overhead. Translating costs into the relevant WTE for the additional members of staff requires a further adjustment [52/42] to account for abstractions due to holiday entitlement and training. Table 3–1 details the mid-point on the pay scale bands under the current terms of employment in the NHS effective from 1 April 2008 for non- consulting staff. Table 3–2 details the mid-point on the pay scale bands under the current terms of employment in the NHS effective from 1 April 2008 for consulting staff. Full details of NHS employment contracts for both consulting and non_consulting staff are available from http://www.nhsemployers.org/PayAndContracts/Pages/Pay-and-contracts.aspx. Table 3-1 Gross salary costs taken as mid-point within each salary band
including and adjustment for WTE costs for non-consulting staff (Agenda for Change)
Band Mid-point Base Overhead @ 22% Gross Gross WTE
2 6 £14,428 £3,174 £17,602 £21,7933 10 £16,307 £3,588 £19,895 £24,6324 15 £19,038 £4,188 £23,226 £28,7565 21 £22,797 £5,015 £27,812 £34,4346 27 £28,141 £6,191 £34,332 £42,5067 32 £33,603 £7,393 £40,996 £50,757
Table 3-2 Gross salary costs taken as the mid-point salary band including and
adjustment for WTE costs for consulting staff (pay circular M&D 3/2008)
Pay Scale Point Base Overhead @ 22% Gross Gross WTE
MC72/LC72 9 £88,049 £19,371 £107,420 £132,996Clinical Excellence Awards 5 £14,565 £3,204 £17,769 £22,000Total £102,614 £22,575 £125,189 £154,996 Cost per individual session £397 Annual cost of one session per week £20,666
16
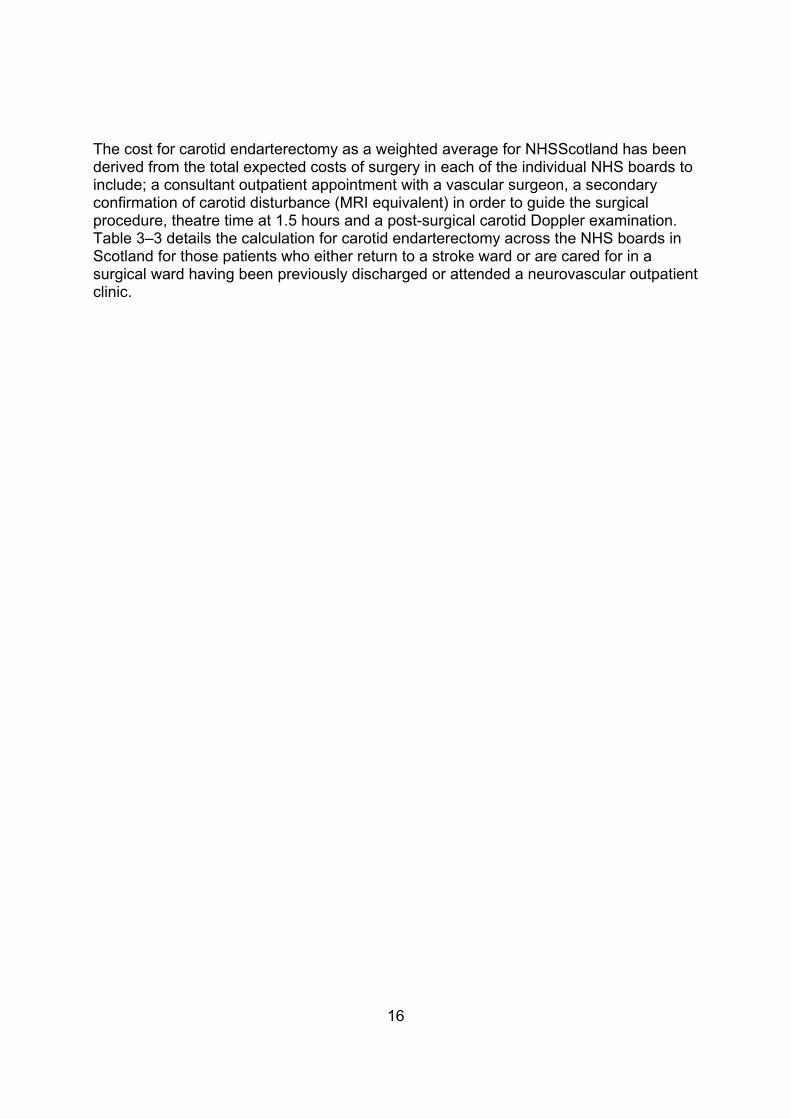
The cost for carotid endarterectomy as a weighted average for NHSScotland has been derived from the total expected costs of surgery in each of the individual NHS boards to include; a consultant outpatient appointment with a vascular surgeon, a secondary confirmation of carotid disturbance (MRI equivalent) in order to guide the surgical procedure, theatre time at 1.5 hours and a post-surgical carotid Doppler examination. Table 3–3 details the calculation for carotid endarterectomy across the NHS boards in Scotland for those patients who either return to a stroke ward or are cared for in a surgical ward having been previously discharged or attended a neurovascular outpatient clinic.

17
Tabl
e 3-
3 C
onso
lidat
ed s
urgi
cal c
osts
for c
arot
id e
ndar
tere
ctom
y, b
ased
on
whe
ther
the
patie
nt re
turn
s to
a
stro
ke w
ard
or h
as a
sep
arat
e ad
mis
sion
to a
sur
gica
l war
d
Co
stin
g m
etho
doly
for p
roce
dure
s car
ried
out o
n ex
istin
g in
patie
nts w
here
afte
r sur
gery
the
patie
nt
retu
rns b
ack
to th
e st
roke
(gen
eral
med
icin
e) w
ard
NH
S Sc
otla
nd
tota
l po
pula
tion
NH
S
Ay
rshi
re &
Ar
ran
NH
S
Bo
rder
s
NH
S
Dum
frie
s &
Gal
low
ay
NH
S
Fi
feN
HS
Fort
h Va
lley
NH
S
Gra
mpi
an
NH
S
G
reat
er
Gla
sgow
&
Clyd
e
NH
S
Hig
hlan
d
NH
S
Is
land
Bo
ards
NH
S La
nark
shire
NH
S
Lo
thia
nN
HS
Tays
ide
Tota
l Num
ber o
f Cas
es39
532
913
2719
3599
228
4852
31
Con
sulta
nt O
utpa
tient
- V
ascu
lar S
urge
ry£1
02£1
14£1
14£1
05£8
2£1
14£1
20£1
68£1
14£1
14£1
36£1
14Se
cond
ary
Con
firm
atio
n - M
RI E
quiv
alen
t£1
63£8
9£1
44£3
02£3
05£1
53£2
40£6
04£2
28£1
61£1
19£2
36Th
eatre
Cos
ts -
1.5
Hou
rs£1
,289
£1,5
63£1
,463
£1,3
17£1
,116
£1,4
25£1
,674
£1,2
89£1
,025
£1,3
20£1
,721
£1,2
98Se
cond
ary
Con
firm
atio
n - U
ltras
ound
Pos
t Sur
gery
£39
£42
£68
£38
£77
£66
£63
£79
£134
£53
£48
£31
Tota
l Uni
t Cos
ts -
Inpa
tient
Car
otid
Sur
gery
£1,8
55£1
,593
£1,8
07£1
,789
£1,7
62£1
,580
£1,7
59£2
,097
£2,1
40£1
,500
£1,6
47£2
,023
£1,6
79£0
Tota
l Cos
ts fo
r Inp
atie
nt C
arot
id S
urge
ry£7
32,6
96£5
0,96
8£1
6,26
6£2
3,25
8£4
7,58
1£3
0,02
3£6
1,55
2£2
07,6
40£4
7,07
4£1
2,00
3£7
9,07
5£1
05,2
10£5
2,04
5
Estim
ated
num
ber o
f cas
es c
arrie
d ou
t to
31 M
arch
20
08 fo
r ana
lysis
of a
dditi
onal
cas
es20
125
411
1416
2934
193
822
16
Cost
ing
met
hodo
logy
for p
roce
dure
s car
ried
out o
n pa
tient
s req
uirin
g a
new
adm
issio
n to
a su
rgic
al
war
d ei
ther
from
out
patie
nt a
ttend
ance
or f
ollo
win
g ea
rly d
ischa
rge
from
a st
roke
war
d
NH
S Sc
otla
nd
tota
l po
pula
tion
NH
S
Ay
rshi
re &
Ar
ran
NH
S
Bo
rder
s
NH
S
Dum
frie
s &
Gal
low
ay
NH
S
Fi
feN
HS
Fort
h Va
lley
NH
S
Gra
mpi
an
NH
S
G
reat
er
Gla
sgow
&
Clyd
e
NH
S
Hig
hlan
d
NH
S
Is
land
Bo
ards
NH
S La
nark
shire
NH
S
Lo
thia
nN
HS
Tays
ide
Tota
l Num
ber o
f Cas
e s76
550
1720
4132
4426
337
012
794
40
Con
sulta
nt O
utpa
tient
- V
ascu
lar S
urge
rgy
£102
£114
£114
£87
£82
£108
£120
£168
£114
£134
£105
Seco
ndar
y C
onfir
mat
ion
- MRI
Equ
ival
ent
£163
£89
£144
£302
£305
£153
£240
£604
£161
£119
£236
Inpa
tient
Sur
gery
- C
ost P
er D
ay's
Stay
£636
£560
£508
£582
£540
£548
£562
£528
£422
£704
£574
Thea
tre C
osts
- 1.
5 H
ours
£1,2
89£1
,563
£1,4
63£1
,317
£1,1
16£1
,425
£1,6
74£1
,289
£1,3
20£1
,721
£1,2
98Se
cond
ary
Con
firm
atio
n - U
ltras
ound
Pos
t Sur
gery
£39
£42
£68
£38
£77
£66
£63
£79
£53
£48
£31
Tota
l Uni
t Cos
ts -
Inpa
tient
Car
otid
Sur
gery
£2,4
43£2
,229
£2,3
67£2
,297
£2,3
26£2
,120
£2,3
01£2
,660
£2,6
68£0
£2,0
69£2
,725
£2,2
44
Tota
l Cos
ts fo
r Out
patie
nt C
arot
id S
urge
ry£1
,869
,010
£111
,438
£40,
245
£45,
941
£95,
376
£67,
844
£101
,228
£699
,501
£98,
706
£0£2
62,8
01£2
56,1
75£8
9,75
5
Estim
ated
num
ber o
f cas
es c
arrie
d ou
t to
31 M
arch
20
08 fo
r ana
lysis
of a
dditi
onal
cas
es35
140
717
2126
3692
310
2139
21

18
3.5 Limitations
The current report has a number of limitations in that it is primarily based on an overall model which encompasses a number of smaller models. The epidemiological model balances across Scotland and is within 10% for individual NHS boards. It has therefore been assumed to be robust and to generalise to events in future. Other important assumptions are set out below. • On full implementation of SIGN 108, NHS boards will not transfer patients across
boundaries for thrombolysis or carotid endarterectomy. • An appropriate number of beds are available in the short term to accommodate the
anticipated demand for patients receiving timely thrombolysis and carotid endarterectomy. Such interventions will reduce the demand for beds in the longer term but there will be a mismatch between the immediate requirements and realising the longer term benefit.
• Each hospital modelled to deliver thrombolysis has sufficient beds in a high dependency or intensive care unit available to accommodate the patients receiving such therapy. These patients should be monitored for adverse events during the immediate few hours after delivery of the drug.
• No growth in the number of stroke patients managed beyond the 2007 mid-year population baseline is assumed.
• Staff and facilities will be shared efficiently across Scotland. For example, there may be a need for an extra 4 WTE specialist nurses across Scotland to provide timely thrombolysis. This may equate to, say, 0.2 WTE of a nurse in one hospital. Recruiting such small increments of staff may not be possible, in which case the staff numbers required will be a material underestimate.
• The terminology refers to bed days ‘saved’, being bed days that will no longer be required because the intervention reduces the risk of future strokes. In reality these beds are likely to be occupied by patients with other conditions and thus the beds will still be used.
• The analyses do not aggregate the resources required to implement a revised service with the potential savings from fewer clinical events. This is partly because of timing differences, but also because the two estimates are made using different approaches. However, users may wish to consider a net table.
• Some significant cost categories have been excluded, particularly the cost of service redesign and associated training and recruitment costs.
• The role of telemedicine has also not been considered. The analysis is not intended to be an absolute definitive solution to the implementation challenges that are faced by NHS boards in Scotland either currently or when implementing SIGN 108. Much of the work which is being presented here will have to be repeated as time progresses, particularly as the true admission pattern for thrombolytic therapy is revealed at individual board level.

19
4 SCOTTISH STROKE EPIDEMIOLOGY
4.1 Introduction
In order to better understand how implementing the key recommendations in SIGN 108 can improve patient outcomes it has been necessary to undertake an epidemiological study of stroke as it relates to hospital admissions, rates of survival, the possibility of recurrence and by inference the likelihood of dependency. The principal drivers behind this study have been taken by way of extension from the published work of the Oxfordshire Community Stroke Project 1981-1986 (OCSP)12-14 and the Community-Based Stroke Incidence in a Scottish Population, the Scottish Borders Stroke Study 1998-2000 (SBSS)2. This section details the work that has been undertaken at both a national and local level in relation to stroke for the years ended 31 March 2006, 2007 and 200818. From the information gathered, a model has been developed at a national level which predicts the mortality of patients who have been admitted to hospital for the first time as a result of their stroke to within 99% accuracy. At NHS board level the same model can predict mortality, to within 90% or greater accuracy, in each of the 3 years.
4.2 Incidence of a first hospital admission as a result of stroke or TIA
Scotland has some of the best health service data in the world, in particular the SMR01 database of hospital admission records and the GROMR database of mortality records, which are held by ISD and GROS respectively. The high quality data, consistency, national coverage and the specific ability to link data between the two databases in order to allow patient based analysis and follow up has been fundamental in the analysis of patients who have been admitted to hospital for stroke or TIA. Following the protocols defined in both the SBSS and OCSP in relation to first ever stroke both ISD and GROS were asked to deliver data based on the following selection criteria from the ICD 10 codes for cerebrovascular disease. Full details of the codes are provided in Appendix 4: • For hospital admissions:
Include all patients who had a unique admission record (with subsequent discharge) in the range of ICD 10 codes specified for cerebrovascular disease including TIA’s for each of the years ended 31 March 2006–31 March 2008 inclusive.
• For mortality records: Include all deaths recorded (including autopsy) in the range of ICD 10 codes specified for cerebrovascular disease including TIA’s for each of the years ended 31 March 2006–31 March 2008 inclusive.

20
• Linked data: For hospital admissions, link the patient identification number and scan through the historical database records for a period of up to 10 years and eliminate any corresponding record that has had a previous entry in any of the ICD 10 codes specified. For mortality records, link the patient identification number and scan through the SMR01 database records and eliminate any corresponding admission record found that had an entry in any of the ICD 10 codes specified.
The resultant output combines unique records for patients who have either been admitted on the first occasion with a diagnosis of stroke or TIA (discharge code) or have died in the community as a result of their stroke, having never been admitted to hospital historically for the condition. The unique records of hospital admissions can be indexed within each of the individual years and linked back into the SMR01 database to search for further information based on the patients’ identification number. Historical information such as the last known hospital admission prior to the current event has revealed the growing problem of liver toxicity, brought about through drug and alcohol abuse, particularly in the younger cohort of patients being admitted for stroke in Scotland. Whilst for older patients, the increasing significance of diabetes type 2 and clinical obesity in relation to stroke is becoming more evident. Likewise, cross referencing the linked patient identification numbers for each of the years in question to the GROMR database has provided detailed information on the survival rates following stroke at 1, 3, 6 and 12 months, regardless of whether the patient died in hospital or in the community after having been discharged19. Appendices 5–1 to 5–5 provide details of the consolidated results for Scotland for the year ending 31 March 2007, which is the most recent year where all data collected through the SMR01 database is most complete. As a result of the extensive epidemiological studies carried out in the preparation of this report, there is some evidence to suggest that the rate of recurrence of stroke, but not TIA, in patients who have originally presented for a hospital admission in an historical period in excess of 1 year is increasing. Table 4–1 analyses hospital admissions in the years ending 31 March 2005, 2006 and 2007, being the last three years in which the ISD SMR01 database has complete hospital submission records for patient admittance and subsequent re-admittance following discharge. Recurrent events are linked to a first ever admission in each of the years in question. The difference between total first ever events and actual admissions indicates that a patient cohort has been admitted from a prior period and that the percentage of patients this number represents is increasing.

21
Table 4-1 Re-admission rates estimated from data collected from the ISD
SMR01 database
Stroke Classifications
Annual readmission rates calculated from total admissions & first ever stroke presentations
First ever event
Recurrent events
Total events
Total actual admissions
Recurrent event from
a prior year
% Additional recurrence
Readmission rate for 2005 1,557 247 1,804 2,040 236 15.2%Readmission rate for 2006 1,545 252 1,797 2,011 214 13.9%Readmission rate for 2007 1,625 240 1,865 2,061 196 12.1%Average readmission from prior years 1,576 246 1,822 2,037 215 13.7%
Readmission rate for 2005 1,185 126 1,311 1,544 233 19.7%Readmission rate for 2006 1,165 137 1,302 1,498 196 16.8%Readmission rate for 2007 1,198 131 1,329 1,561 232 19.4%Average readmission from prior years 1,183 131 1,314 1,534 220 18.6%
Readmission rate for 2005 6,334 1,033 7,367 8,706 1,339 21.1%Readmission rate for 2006 6,112 965 7,077 8,339 1,262 20.6%Readmission rate for 2007 5,879 881 6,760 8,198 1,438 24.5%Average readmission from prior years 6,108 960 7,068 8,414 1,346 22.1%
Ischaemic Stroke
Transient Ischaemic Attack
Haemorrhagic Stroke
While there is evidence that a simple score (ABCD or ABCD2) can be used to identify patients who, following an initial TIA, are likely to be at risk of developing an ischaemic stroke event, the admissions history from the SMR01 database will not record all of these, unless the stroke results in a hospital admission. What can be established is that the relationship between age and the percentage of multiple hospital re-admissions differs between TIA and both haemorrhagic and ischaemic stroke. For those suffering a TIA, multiple re-admissions are more prevalent in the over 65 age groups, whilst in either haemorrhagic or ischaemic stroke a greater percentage of stroke patients under the age of 65 are presenting for repeat admissions, as detailed in Table 4–2. Table 4-2 Annual re-admission rates estimated from first ever hospital
admissions
Stroke Classifications
Annual readmission rates calculated from first ever stroke presentations
Total population
0 - 44 years
45 - 54 years
55 - 64 years
65 - 74 years
75 - 84 years
85+ years
Readmission rate for 2005 15.9% 15.4% 15.2% 17.8% 13.8% 16.5% 16.7%Readmission rate for 2006 16.3% 3.6% 15.2% 15.3% 16.1% 18.3% 19.4%Readmission rate for 2007 14.8% 10.8% 7.0% 8.1% 14.4% 20.2% 18.5%Average readmission rate - current year 15.6% 9.9% 12.5% 13.7% 14.8% 18.4% 18.2%
Readmission rate for 2005 10.6% 19.0% 13.6% 13.2% 11.4% 8.9% 4.2%Readmission rate for 2006 11.8% 15.9% 14.9% 15.3% 8.9% 10.3% 11.2%Readmission rate for 2007 10.9% 11.0% 9.1% 12.4% 13.7% 9.5% 9.3%Average readmission rate - current year 11.1% 15.3% 12.5% 13.7% 11.4% 9.6% 8.2%
Readmission rate for 2005 16.3% 19.1% 20.6% 18.0% 17.4% 16.5% 11.8%Readmission rate for 2006 15.8% 19.3% 17.2% 15.9% 18.1% 15.3% 12.7%Readmission rate for 2007 15.0% 14.9% 15.7% 15.5% 16.5% 15.3% 12.3%Average readmission rate - current year 15.7% 17.8% 17.8% 16.5% 17.3% 15.7% 12.3%
Transient Ischaemic Attack
Haemorrhagic Stroke
Ischaemic Stroke

22
The relationship between mortality and recurrent events which are likely to result in a hospital re-admission can be explained by way of a clinical model. Clinical model The classification and natural history of clinically identifiable subtypes of cerebral infarction has been described in detail as part of the OCSP12-14. In summary the four different subtypes of infarct describe the estimated size of the lesion involved, the likelihood of the cause and, where practicable, the level of recurrence that might be expected for each of the groups on an annual basis. Table 4–3 details the four clinically identifiable subtypes of cerebral infarction; Lacunar Infarcts (LACI or Lacunar Syndrome LACS), Total Anterior Circulation Infarcts (TACI or Total Anterior Circulation Syndrome TACS), Partial Anterior Circulation Infarcts (PACI or Partial Anterior Circulation Syndrome PACS) and Posterior Circulation Infarcts (POCI or Posterior Circulation Syndrome POCS). Rates of recurrence, population split, mortality and functional outcome are from the original OCSP model. Information in relation to the likelihood of carotid distortion and cardio-embolic origins, together with the estimated size of the lesion, have also been included in Table 4–3 to illustrate the relationship between anterior circulation infarcts and the disturbances in the carotid territory that are associated with them. Table 4-3 Classification of the subtypes of cerebral infarcts
OCSP classification of cerebral infarcts
LACI TACI PACI POCI
Clinical features: Size of lesion small large medium small to
medium Likelihood of carotid disturbance low high high not
applicable Likelihood of cardio-embolic source low high high medium Likelihood of recurrent event 9% 6% 17% 20% Average population split 25% 17% 34% 24% Outcome at one year: Mortality 11% 60% 16% 19% Functional dependence 28% 36% 29% 19% Functional independence 61% 4% 55% 62% Total 100% 100% 100% 100% The population split between the four subtypes is an average of the population taken over the 5 years of this particular study between 1981–1986, where the average age range was more heavily concentrated in the region of 60–85 years (72.5 ± 12.6 standard deviation). While the general stroke population of those who have been admitted to hospital in Scotland is also predominantly concentrated within this group, this should not detract from the fact that there are patients outside of this age range who

23
are also being admitted. Closer inspection of the age specific incidence rates published in the OCSP illustrates that, although a very rare occurrence at that time, Partial Anterior Infarcts were predominantly evident in the under 45 age group and thereafter diminishing across the age groups as the other types of infarcts took prominence. The current adaptation of the four subtypes of infarction is shown in Table 4–4 where the number of potential infarcts is exclusive of the estimates for cryptogenic stroke. The allocation between the four subtypes is based on a ‘best fit’ to reach the population average reported in the original study. Table 4-4 Extending the OCSP model of infarction subtypes to population age
groups Original known admissions reported by ISD as at 31 March 2008
Total population
0 - 44 years
45 - 54 years
55 - 64 years
65 - 74 years
75 - 84 years
85+ years
Number of FES - TIA's Admitted 1,607 70 168 301 400 442 226Number of FES - Haemorrhagic Admitted 1,193 95 102 173 288 343 192Number of FES - Infarcts Admitted 5,743 204 380 774 1,298 1,871 1,216Total Admissions 8,543 369 650 1,248 1,986 2,656 1,634
Cryptogenic Stroke - Not Included 5% 40% 20% 10% 5% 0% 0%Cryptogenic Stroke - Patients Excluded 300 82 76 77 65 0 0
Clinically identifiable subtypes of cerebral infarction
Total population
0 - 44 years
45 - 54 years
55 - 64 years
65 - 74 years
75 - 84 years
85+ years
LACI - Lacunar Infarcts 25% 5% 35% 25% 25% 24% 25%TACI - Total Anterior Circulation Infarcts 17% 5% 10% 15% 15% 17% 25%PACI - Partial Anterior Circulation Infarcts 34% 85% 40% 35% 35% 34% 25%POCI - Posterior Circulation Infracts 24% 5% 15% 25% 25% 25% 25%
Subtotal 100% 100% 100% 100% 100% 100%Outcome of Infarct Analysis
LACI - Lacunar Infarcts 1,347 6 106 174 308 449 304TACI - Total Anterior Circulation Infarcts 948 6 30 105 185 318 304PACI - Partial Anterior Circulation Infarcts 1,842 104 122 244 432 636 304POCI - Posterior Circulation Infracts 1,306 6 46 173 308 469 304
Total Infarcts excluding Cryptogenic Stroke 5,443 122 304 696 1,233 1,872 1,216
Predictive Outcome Model (Adapted from OCSP 1986) - Identifying the Four Subtypes of Infarction
Having established the prominence of the four subtypes of infarct the model has been extended to look at the relationship between mortality in the first month and the possibility of re-admission for those who have survived in the first 3 months following discharge, as these are the only events which can be counted in the SMR01 database. Appendices 5.6 and 5.7 detail the full extension of the OCSP model as a best fit within the population groups for the total population of Scotland for the year ending 31 March 2007. These show the relationship between admission, survival and re-admittance. It is not possible to state that all patients who are being re-admitted to Scottish hospitals are as a result of a recurrent cerebrovascular event as this would require access to individual clinical patient information. Nonetheless, this model provides a best fit explanation to help predict the number of surviving patients who are likely to be re-

24
admitted following discharge, together with an estimate of the level of dependency. Its outputs are consistent with the observed data for Scotland and for each NHS board over the last 3 years. Hence it is considered to be robust and to generalise to the future. Given the robustness of the model, which has predicted mortality at 1 month and re-admission at 3 months to within 98.9% and 97.2% respectively over the same period, these data have been applied to underpin a principle assumption in this report. In order to ‘save beds’ through effective implementation of the recommendation in SIGN 108, there has to be the correct number of beds available (or allocated) in the first instance so that they can be ‘saved’ or reallocated within the general medical ward, where most stroke units are contained. Appendix 6 details the expected number of patients who are due for admittance in Scottish hospitals for the year ending 31 March 2009 based on the mid-year population estimate provided by the GROS as at 30 June 2007.

25
5 TIMELY THROMBOLYSIS
5.1 Background
SIGN 108 recommended administration of thrombolytic therapy with alteplase, within 4.5 hours from stroke onset. The guideline noted this significantly reduces death and disability at 90 days. The recommendations analysed within this report as required to deliver such a service include: • Emergency medical services should be redesigned to facilitate rapid access to
specialist stroke services.
• Stroke patients requiring admission to hospital should be admitted to a stroke unit staffed by a co-ordinated multidisciplinary team with a special interest in stroke care.
• All patients with suspected stroke should have brain imaging immediately on presentation.
• Patients admitted with stroke within 4.5 hours of definite onset of symptoms, who are considered suitable, should be treated with 0.9 mg/kg (up to maximum 90 mg) intravenous rt-PA.
5.2 Patient group
The patient subgroup assumed to receive thrombolytic therapy are those with a NIH Stroke Scale (NIHSS) score between 5–22, be under 80 years old (in accordance with the recommendation in its licence) and not experiencing a recurrent stroke within 3 months of the previous stroke. This group is forecast to be approximately 1,900 patients annually. Of these almost 50% will not be able to be treated within the 4.5 hour window or will be contraindicated. The anticipated numbers receiving the therapy is 1,015. This compares to an estimated 205 patients who are currently receiving the therapy, an increase of 810 patients. Approximately 48% of these patients are assumed to present at hospital between the hours of 8am–6pm, Monday to Friday, 27% outside these hours on a weekday and the remainder at a weekend. No-one is presumed to present after 11pm. This arrival pattern is based on that known for myocardial infarction, revised to assume a cut-off at 11pm, following discussion with the clinical experts in NHS boards currently administering the therapy.
5.3 Clinical benefit and associated resource savings
SIGN 108 notes the main clinical benefit from delivery of effective thrombolytic therapy is that some patients are able to make a full or near-full recovery. A pooled analysis suggests that approximately 10% of patients may make a full recovery, 45% will have a significantly improved outcome and 45% will have no change in outcome or an adverse outcome21.

26
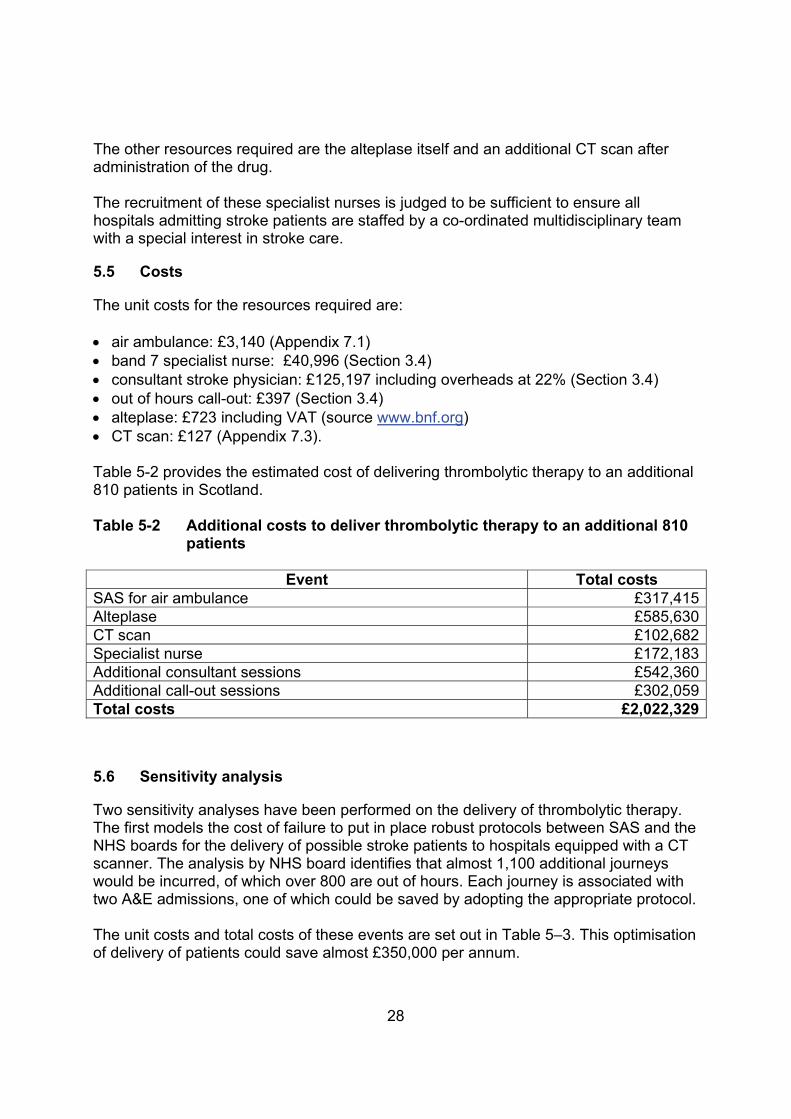
The mean length of continuous inpatient stay for patients with a cerebrovascular disease diagnosis (excluding transient attacks) is 27 days (see Section 3.2). A full recovery is forecast to save 18 days, an improved recovery 9 days and no clinical change or an adverse outcome is assumed to save zero days. The mean cost for an inpatient bed in a medical ward has been estimated to be £277. This cost is a direct cost primarily comprising staff and consumables. It excludes all overheads. Table 5–1 provides an estimate of bed days saved and related costs. Table 5-1 Clinical benefits of additional thrombolytic therapy
Patients NHSScotland Estimated number of patients receiving thrombolytic therapy 205Forecast number of patients receiving thrombolytic therapy on implementation 1,015Additional number of patients likely to benefit 810Forecast outcome for these additional cases: 10% full recovery 8245% improved outcome 36445% no change in outcome or adverse outcome 323Number of bed days saved based on mean of 27 days: 10% full recovery saving 18 days 1,47645% improved outcome - saving 9 days 3,276Total number of additional bed days saved 4,752 Total bed days financial savings £1,316,304
5.4 Resource requirements
A key requirement to enable rapid access to specialist stroke services is that all patients with suspected stroke are identified early by paramedics and admitted to a hospital with a CT scanner as a minimum. Currently approximately 9% of stroke patients are estimated to be admitted to hospitals without such a scanner. Discussions with SAS have identified that: • ambulance paramedics and technicians who have undergone training on stroke
recognition are accurate in their assessment of potential stroke patients, and
• virtually all such patients could be taken to an alternative hospital with a scanner at no extra cost to the service and within SAS response time targets.
The analysis assumes NHS boards and SAS agree revised protocols such that all potential stroke patients are delivered to hospitals with a CT scanner. Adopting such protocols would be resource saving for both SAS and the NHS board, onward journeys to hospitals with scanners would be avoided, together with the requirement for two

27
clinical assessments, one at each hospital. The sensitivity analysis explores the costs of not adopting this approach. However, SAS estimates that approximately 100 additional patients will require air transport to enable them to reach hospital in sufficient time to be assessed for thrombolytic therapy. These patients are forecast to be in the Highlands and Grampian. Other key assumptions include that: • the protocol with SAS nominates a lead hospital (or hospitals) for stroke within the
NHS board area. Thus, no cross boundary services are assumed. This is different from the current position where NHS Greater Glasgow and Clyde provide services for other boards
• each board has sufficient high dependency beds to manage the additional 810 patients to receive thrombolysis, and
• staff can be trained to deliver the therapy at minimal cost. The staff resources required to deliver the drug are assumed to be:
• band 7 specialist nurse who is assumed to require 1 hour to establish time of onset of stroke and prior history for each of the 1,900 patients who may be eligible for the therapy. If the responses indicate that the patient may be eligible for the therapy then the nurse is assumed to call for a consultant. Thereafter the nurse will attend the patient receiving the therapy for a further 6 hours as the drug is administered and to oversee the initial management.
• consultant stroke physicians. Each NHS board is assumed to manage with no additional consultant resource during the core weekday hours. The additional workload from thrombolysing patients who present during weekday core hours is assumed to displace existing workload. However, this should reduce as the upfront investment in delivering the therapy is rewarded by having more patients with improved outcomes and consequently discharged earlier. This assumption will be particularly challenging for smaller boards where the consultant may have duties to conduct outwith the main hospital.
Seven NHS boards, being those forecast to have more than 30 patients per year presenting for this therapy in the early evening, are forecast to recruit an extra 0.5 WTE consultant each to cover five planned activities a week, providing cover until 8pm. All other out of hours work is assumed to be undertaken by on-call arrangements.
The total staff required is estimated at 4.2 WTE nurses, 35 additional planned activities per week to provide consultant resources in the early evening and 760 out of hours call-outs.
28
The other resources required are the alteplase itself and an additional CT scan after administration of the drug. The recruitment of these specialist nurses is judged to be sufficient to ensure all hospitals admitting stroke patients are staffed by a co-ordinated multidisciplinary team with a special interest in stroke care.
5.5 Costs
The unit costs for the resources required are: • air ambulance: £3,140 (Appendix 7.1) • band 7 specialist nurse: £40,996 (Section 3.4) • consultant stroke physician: £125,197 including overheads at 22% (Section 3.4) • out of hours call-out: £397 (Section 3.4) • alteplase: £723 including VAT (source www.bnf.org) • CT scan: £127 (Appendix 7.3). Table 5-2 provides the estimated cost of delivering thrombolytic therapy to an additional 810 patients in Scotland. Table 5-2 Additional costs to deliver thrombolytic therapy to an additional 810
patients
Event Total costs SAS for air ambulance £317,415Alteplase £585,630CT scan £102,682Specialist nurse £172,183Additional consultant sessions £542,360Additional call-out sessions £302,059 Total costs £2,022,329
5.6 Sensitivity analysis
Two sensitivity analyses have been performed on the delivery of thrombolytic therapy. The first models the cost of failure to put in place robust protocols between SAS and the NHS boards for the delivery of possible stroke patients to hospitals equipped with a CT scanner. The analysis by NHS board identifies that almost 1,100 additional journeys would be incurred, of which over 800 are out of hours. Each journey is associated with two A&E admissions, one of which could be saved by adopting the appropriate protocol. The unit costs and total costs of these events are set out in Table 5–3. This optimisation of delivery of patients could save almost £350,000 per annum.

29
Table 5-3 Additional costs if patients are not directed to hospitals with CT scanners
Event Unit costs Total costs
Unnecessary SAS journeys £213 £235,873Unnecessary A&E assessments £101 £111,483Total costs £347,356 The second sensitivity analysis assumes that NHS boards prioritise commissioning services Monday to Friday during core hours only. The additional number of patients to be treated falls to around 390, or by just over 50%. All costs, other than for consultants, fall in line with the patient numbers. Under the assumptions, no additional consultant costs would be required, with thrombolysis displacing other activities. The total cost falls to around £567,149, equivalent to £1,455 per patient. This compares to a cost per patient of almost £2,500 for the 7 days a week, 24 hours a day service (see Table 5–4). Table 5-4 Additional costs to deliver thrombolytic therapy to an additional 390
patients
Event Total costs SAS for air ambulance £152,829Alteplase £281,970CT scan £49,530Specialist nurse £82,820Additional consultant sessions 0Additional call-out sessions 0Total costs £567,149
5.7 Analyses by NHS board
Tables 5–5 to 5–8 provide further information on the epidemiology, costs and benefits from timely thrombolysis by NHS board. Table 5–5 presents the anticipated patients, Table 5–6 the additional clinical benefit, Table 5–7 the additional costs and Table 5–8 the sensitivity analysis assuming SAS are not able to deliver patients to the specified hospital for timely thrombolysis.

30
Tabl
e 5-
5 A
ntic
ipat
ed p
atie
nts
by N
HS
boar
d
Dep
ende
ncy
Anal
ysis
of Is
chae
mic
Str
okes
mRS
>
2
NH
S Sc
otla
nd
tota
l po
pula
tion
NH
S
Ay
rshi
re &
Ar
ran
NH
S
Bo
rder
s
NH
S
Dum
frie
s &
Gal
low
ay
NH
S
Fi
feN
HS
Fort
h Va
lley
NH
S
Gra
mpi
an
NH
S
G
reat
er
Gla
sgow
&
Clyd
e
NH
S
Hig
hlan
d
NH
S
Is
land
Bo
ards
NH
S La
nark
shire
NH
S
Lo
thia
nN
HS
Tays
ide
No
FES
Infa
rcts
Adm
itted
2,42
719
456
8817
511
522
256
115
529
271
348
213
No
of R
ecur
rent
Stro
kes A
dmitt
ed1,
248
103
2545
9451
105
303
8318
137
175
110
Less
Pre
dict
ed R
ecur
renc
e at
3 m
onth
s40
033
816
3120
3790
265
4455
35To
tal n
umbe
r of D
epen
dent
Infa
rcts
3,27
626
573
117
238
146
290
775
212
4236
346
828
8Le
ss:
Age
Restr
ictio
n fo
r rt-P
A Li
cens
e57
.8%
59.7
%55
.9%
52.8
%57
.2%
60.7
%59
.4%
60.1
%54
.0%
53.3
%61
.1%
52.8
%57
.4%
Subt
otal
1,89
415
841
6113
689
172
465
114
2322
224
716
5Le
ss:
Hos
pita
l Adm
issio
n >
4.5
Hou
rs47
.4%
32.6
%41
.9%
34.8
%44
.2%
51.6
%46
.5%
41.8
%55
.1%
73.3
%43
.0%
47.8
%56
.4%
Cont
rain
dica
tions
for D
iabe
tes &
Liv
er3.
4%3.
4%2.
9%4.
0%4.
2%4.
1%4.
3%3.
7%4.
0%3.
7%3.
6%2.
9%3.
3%
Tota
l Ant
icip
ated
Can
dida
tes
1,01
510
525
4074
4291
261
515
123
130
68
Adm
ittan
ce P
atte
rn u
sing
Mod
el fo
r Opt
imal
Re
perf
usio
n in
ST
Elev
atio
n M
I on
an A
nnua
l Bas
is
NH
S Sc
otla
nd
tota
l po
pula
tion
NH
S
Ay
rshi
re &
Ar
ran
NH
S
Bo
rder
s
NH
S
Dum
frie
s &
Gal
low
ay
NH
S
Fi
feN
HS
Fort
h Va
lley
NH
S
Gra
mpi
an
NH
S
G
reat
er
Gla
sgow
&
Clyd
e
NH
S
Hig
hlan
d
NH
S
Is
land
Bo
ards
NH
S La
nark
shire
NH
S
Lo
thia
nN
HS
Tays
ide
48%
Patie
nts A
rriv
ing
8am
to 6
pm M
on -
Fri
909
7620
3065
4383
223
5511
107
119
7927
%Pa
tient
s Arr
ivin
g 6p
m to
11p
m M
on -
Fri
511
4311
1737
2447
126
316
6067
4525
%Pa
tient
s Arr
ivin
g 8a
m to
11p
m S
at /
Sun
473
4010
1534
2243
116
296
5662
41To
tal A
lloca
tion
1,89
415
841
6113
689
172
465
114
2322
224
716
5
Pred
icte
d O
utco
me
as a
resu
lt of
Thr
ombo
lysis
NH
S Sc
otla
nd
tota
l po
pula
tion
NH
S
Ay
rshi
re &
Ar
ran
NH
S
Bo
rder
s
NH
S
Dum
frie
s &
Gal
low
ay
NH
S
Fi
feN
HS
Fort
h Va
lley
NH
S
Gra
mpi
an
NH
S
G
reat
er
Gla
sgow
&
Clyd
e
NH
S
Hig
hlan
d
NH
S
Is
land
Bo
ards
NH
S La
nark
shire
NH
S
Lo
thia
nN
HS
Tays
ide
10%
Laza
rus E
ffect
- m
RS <
=1
102
113
47
49
265
112
137
45%
Impr
oved
Out
com
e - m
RS <
=2
457
4711
1833
1941
117
232
5559
3145
%N
o Ch
ange
in D
epen
denc
y45
747
1118
3319
4111
723
255
5931
Tota
l Out
com
e1,
015
105
2540
7442
9126
151
512
313
068

31
Tabl
e 5-
6 A
dditi
onal
ben
efit
from
tim
ely
thro
mbo
lysi
s by
NH
S bo
ard
Ad
ditio
nal b
enef
its a
s a re
sult
of im
prov
ed a
cces
s to
Thro
mbo
lytic
The
rapy
NH
S Sc
otla
nd
tota
l pop
ulat
ion
NH
S Ay
rshi
re &
Ar
ran
NH
S Bo
rder
s
NH
S D
umfr
ies &
G
allo
way
NH
S Fi
feN
HS
Fort
h Va
lley
NH
S G
ram
pian
NH
S G
reat
er
Gla
sgow
&
Clyd
e
NH
S H
ighl
and
NH
S Is
land
Bo
ards
NH
S La
nark
shire
NH
S Lo
thia
nN
HS
Tays
ide
Cur
rent
est
imat
e of
the
num
ber o
f cas
es o
f pat
ient
s re
ceiv
ing
thro
mbo
lytic
ther
apy
in S
cotla
nd20
50
00
00
2012
520
010
300
Fore
cast
num
ber o
f cas
es o
f pat
ient
s who
cou
ld re
ceiv
e th
rom
boly
tic th
erap
y in
the
futu
re1,
015
105
2540
7442
9126
151
512
313
068
Addi
tiona
l num
ber o
f pat
ient
s lik
ely
to b
enef
it81
010
525
4074
4271
136
315
113
100
68Li
kely
out
com
e fo
r the
se a
dditi
onal
cas
es:
10%
10%
Laz
arus
Effe
ct -
mRS
<=
182
113
47
47
143
111
107
45%
45%
Impr
oved
Out
com
e - m
RS <
=2
364
4711
1833
1932
6114
251
4531
45%
40%
No
Chan
ge in
Dep
ende
ncy
364
4711
1833
1932
6114
251
4531
Num
ber o
f bed
day
s sa
ved
base
d on
ave
rage
of 2
7 da
y s18
10%
Laz
arus
Effe
ct -
Savi
ng 1
8 D
ays
1,47
619
854
7212
672
126
252
5418
198
180
126
945
% Im
prov
ed O
utco
me
- Sav
ing
9 D
ays
3,27
642
399
162
297
171
288
549
126
1845
940
527
9
Tota
l num
ber o
f add
ition
al b
ed d
ays s
aved
4,75
262
115
323
442
324
341
480
118
036
657
585
405
*25
patie
nts f
rom
Ayr
shire
& A
rran
trf t
o G
lasg
ow

32
Tabl
e 5-
7 A
dditi
onal
cos
ts fr
om ti
mel
y th
rom
boly
sis
by N
HS
boar
d
Addi
tiona
l cos
ts a
s a re
sult
of im
prov
ed a
cces
s to
thro
mbo
lytic
ther
apy
NH
S Sc
otla
nd
tota
l pop
ulat
ion
NH
S Ay
rshi
re &
Ar
ran
NH
S Bo
rder
s
NH
S D
umfr
ies &
G
allo
way
NH
S Fi
feN
HS
Fort
h Va
lley
NH
S G
ram
pian
NH
S G
reat
er
Gla
sgow
&
Clyd
e
NH
S H
ighl
and
NH
S Is
land
Bo
ards
NH
S La
nark
shire
NH
S Lo
thia
nN
HS
Tays
ide
Scot
tish
Am
bula
nce
Serv
ice
- add
ition
al a
ir tra
nspo
rt se
rvic
es
requ
ired
to d
eliv
er p
atie
nts
for t
hrom
olys
is10
138
63A
ir am
bula
nce
cost
s pe
r jou
rney
£3
,143
£3,1
29£3
,151
Tota
l add
ition
al c
osts
for t
he A
mbu
lanc
e Se
rvic
e£3
17,4
15£1
18,9
02£1
98,5
13Es
timat
ed n
umbe
r of p
atie
nts
likel
y to
rece
ive
thro
mbo
lytic
th
erap
y w
ithin
the
4.5
hour
win
dow
and
with
out
com
plic
atio
ns:
1,01
510
525
4074
4291
261
515
123
130
68
Estim
ated
num
ber o
f pat
ient
s lik
ely
to h
ave
rece
ived
th
rom
boly
sis
to d
ate
205
00
00
020
125
200
1030
0A
dditi
onal
num
ber o
f pat
ient
s fo
llow
ing
succ
essf
ul
impl
emen
tatio
n w
ho c
ould
rece
ive
thro
mbo
lytic
ther
apy
on a
tim
ely
basi
s:81
010
525
4074
4271
136
315
113
100
68
Cos
t of A
ltepl
ase
rt-PA
incl
udin
g V
AT
as p
er B
NF
£723
£723
£723
£723
£723
£723
£723
£723
£723
£723
£723
£723
£723
Cos
t of C
T sc
an e
vent
in ta
rget
hos
pita
l for
thro
mbo
lysis
£127
£117
£150
£72
£151
£169
£98
£140
£206
£304
£102
£99
£155
Tota
l add
ition
al c
osts
for d
rugs
and
dia
gnos
tics
£688
,311
£88,
115
£21,
820
£31,
790
£64,
665
£37,
452
£58,
238
£117
,250
£28,
788
£5,1
33£9
3,21
3£8
2,14
1£5
9,70
7A
dditi
onal
spe
cial
ist n
ursin
g ho
urs
6,37
378
819
130
158
034
156
01,
058
255
5388
279
057
3Ba
nd 7
WTE
Spe
cial
ist N
urse
4.2
0.5
0.1
0.2
0.4
0.2
0.4
0.7
0.2
0.0
0.6
0.5
0.4
Tota
l add
ition
al c
osts
for s
peci
alist
nur
sing
£172
,183
£20,
498
£4,1
00£8
,199
£16,
398
£8,1
99£1
6,39
8£2
8,69
7£8
,199
£0£2
4,59
8£2
0,49
8£1
6,39
8A
dditi
onal
con
sulta
nt p
lann
ed a
ctiv
ities
cov
erin
g M
onda
y to
Fr
iday
OO
H fr
om 5
.30
pm to
9.0
0 pm
355
00
50
55
00
55
5
Add
ition
al c
onsu
ltant
pla
nned
ses
sion
s ca
ncel
led
as a
resu
lt of
an
OO
H c
all o
ut M
onda
y to
Frid
ay29
221
1117
1824
2363
310
3033
22
Add
ition
al c
onsu
ltant
pla
nned
ses
sion
s ca
ncel
led
as a
resu
lt of
an
OO
H c
all o
ut a
t the
wee
kend
468
4010
1534
2243
116
290
5662
41
Add
ition
al c
osts
for W
TE c
onsu
ltant
ses
sion
s£5
42,3
60£7
7,48
0£0
£0£7
7,48
0£0
£77,
480
£77,
480
£0£0
£77,
480
£77,
480
£77,
480
Add
ition
al c
osts
for c
ance
lled
sess
ions
follo
win
g ca
ll ou
t£3
02,0
59£2
4,04
7£8
,395
£12,
707
£20,
662
£18,
354
£26,
256
£71,
252
£23,
596
£0£3
3,97
2£3
7,64
5£2
5,17
3To
tal a
dditi
onal
cos
ts fo
r Con
sulta
nts
£844
,419
£101
,527
£8,3
95£1
2,70
7£9
8,14
2£1
8,35
4£1
03,7
36£1
48,7
32£2
3,59
6£0
£111
,452
£115
,125
£102
,653
Tota
l add
ition
al c
osts
like
ly to
be
incu
rred
in th
e im
plem
enta
tion
of th
rom
boly
tic th
erap
y th
roug
hout
Sc
otla
nd£2
,022
,329
£210
,140
£34,
314
£52,
696
£179
,205
£64,
006
£297
,275
£294
,679
£259
,096
£5,1
33£2
29,2
62£2
17,7
64£1
78,7
59

33
Tabl
e 5-
8 Se
nsiti
vity
ana
lysi
s: S
AS
unab
le to
del
iver
pat
ient
s to
spe
cifie
d
hosp
ital f
or ti
mel
y th
rom
boly
sis
by N
HS
boar
d Se
nsiti
vity
Ana
lysis
: The
SAS
are
in th
e po
sitio
n to
mak
e ev
ery
atte
mpt
at e
stab
lishi
ng th
e tim
e of
sym
ptom
ons
et th
is in
form
atio
n ca
n al
low
pat
ient
s to
be d
eliv
ered
dire
ctly
to th
e ta
rget
hos
pita
l for
thro
mbo
lysis
. If
time
of o
nset
is
esta
blish
ed a
t the
clo
sed
plac
e of
dia
gnos
tics,
ther
e w
ill b
e du
plic
ate
patie
nt tr
ansf
ers a
nd d
uplic
ate
A&E
adm
issio
ns:
NH
S Sc
otla
nd
tota
l pop
ulat
ion
NH
S
Ay
rshi
re &
Ar
ran
NH
S
Bo
rder
s
NH
S
Dum
frie
s &
Gal
low
ay
NH
S
Fi
feN
HS
Fort
h Va
lley
NH
S
Gra
mpi
an
NH
S
G
reat
er
Gla
sgow
&
Clyd
e
NH
S
Hig
hlan
dN
HS
Lana
rksh
ireN
HS
Loth
ian
NH
S
Ta
ysid
e
Num
ber o
f In
Hou
rs T
rans
fers
for T
hrom
boly
sis
297
400
918
013
101
2073
022
Num
ber o
f Out
of H
ours
Tra
nsfe
rs fo
r Thr
ombo
lysi
s81
179
019
350
2534
143
134
8649
Uni
t Cos
t of A
mbu
lanc
e Tr
ansf
er£2
13£2
42£4
95£4
60£1
92£1
76£2
64£1
63£4
89£1
70£1
71£2
92P
oten
tial a
dditi
onal
cos
ts to
the
Ambu
lanc
e Se
rvic
e£2
35,8
73£2
8,90
4£0
£12,
973
£10,
261
£0£1
0,13
7£7
2,13
9£3
0,99
2£3
5,14
5£1
4,71
8£2
0,60
5U
nit C
ost o
f A&E
Atte
ndan
ce£1
01£9
9£1
23£9
7£8
4£9
7£9
2£9
2£1
44£9
0£1
54£1
02P
oten
tial a
dditi
onal
cos
ts th
roug
h du
plic
ate
atte
ndan
ce in
A
&E£1
11,4
83£1
1,82
4£0
£2,7
36£4
,489
£0£3
,533
£40,
717
£9,1
26£1
8,60
6£1
3,25
5£7
,198

34
6 TIMELY CAROTID IMAGING AND CAROTID ENDARTERECTOMY
6.1 Background
SIGN 108 refers to the randomised controlled trials and related pooled data that report best medical treatment plus carotid endarterectomy is clinically effective compared to best medical treatment only in preventing recurrent stroke. The greatest benefit was seen in patients with severe stenosis. This evidence base informed the SIGN 108 recommendations on carotid endarterectomy to include that: • all patients with carotid artery stroke without severe disability, (mRS ≤2) or TIA
ischaemic attack should be considered for carotid endarterectomy as soon as possible after the index event
• carotid endarterectomy should be considered in all: - male patients with a carotid artery stenosis of 50–99%
- female patients with a carotid artery stenosis of 70–99% and
• carotid endarterectomy should be performed as soon as the patient is stable and fit for surgery, ideally within 2 weeks of event.
6.2 Patient group
The relevant patient group for this intervention is those patients with severe stenosis who are fit enough for surgery as measured by the modified Rankin Scale or mRS ≤2. The epidemiological model predicts that the annual incidence could be approximately 11,865 people. Approximately 6,060 of these will be inpatients and the balance will be identified at neurovascular outpatient clinics. The inpatients include some 500 patients who recover sufficiently following thrombolysis to benefit from surgery. It is estimated that around 50% of these patients will not be judged suitable for surgery for various reasons, to include co-morbidities. As noted in the guideline age in itself is not a restriction. Of the remaining 6,010 it is predicted that the carotid Doppler results will show that 80% of the TIA’s and 75% of relevant inpatients have stenosis, with 25% being sufficiently severe to require surgery. Thus approximately 1,160 patients are judged to meet the criteria in SIGN 108 for carotid endarterectomy; of these 395 (35%) will be inpatients and the remaining 765 outpatients. This information is presented in Table 6–1. Currently approximately 552 carotid endarterectomy procedures are performed in Scotland annually; 200 on inpatients and 350 on outpatients. The forecast additional number of procedures is 608, being 194 on inpatients and 414 on outpatients.
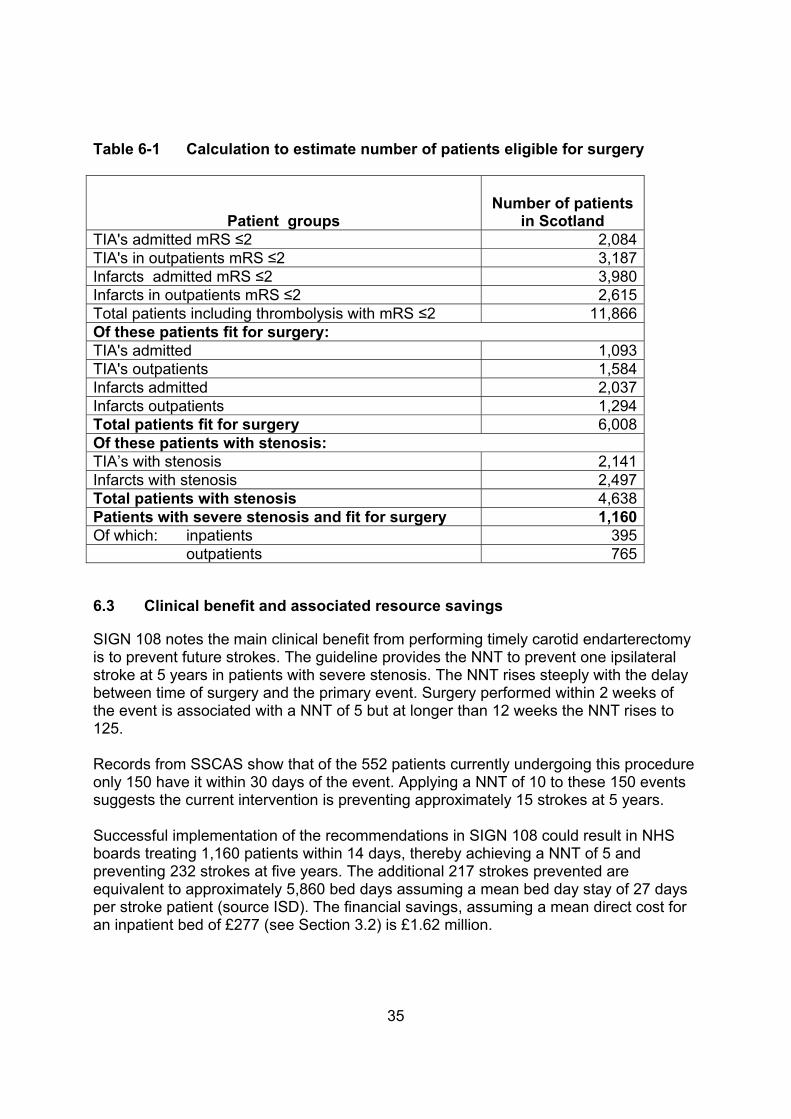
35
Table 6-1 Calculation to estimate number of patients eligible for surgery
Patient groups
Number of patients
in Scotland TIA's admitted mRS ≤2 2,084 TIA's in outpatients mRS ≤2 3,187 Infarcts admitted mRS ≤2 3,980 Infarcts in outpatients mRS ≤2 2,615 Total patients including thrombolysis with mRS ≤2 11,866 Of these patients fit for surgery: TIA's admitted 1,093 TIA's outpatients 1,584 Infarcts admitted 2,037 Infarcts outpatients 1,294 Total patients fit for surgery 6,008 Of these patients with stenosis: TIA’s with stenosis 2,141 Infarcts with stenosis 2,497 Total patients with stenosis 4,638 Patients with severe stenosis and fit for surgery 1,160 Of which: inpatients 395 outpatients 765
6.3 Clinical benefit and associated resource savings
SIGN 108 notes the main clinical benefit from performing timely carotid endarterectomy is to prevent future strokes. The guideline provides the NNT to prevent one ipsilateral stroke at 5 years in patients with severe stenosis. The NNT rises steeply with the delay between time of surgery and the primary event. Surgery performed within 2 weeks of the event is associated with a NNT of 5 but at longer than 12 weeks the NNT rises to 125. Records from SSCAS show that of the 552 patients currently undergoing this procedure only 150 have it within 30 days of the event. Applying a NNT of 10 to these 150 events suggests the current intervention is preventing approximately 15 strokes at 5 years. Successful implementation of the recommendations in SIGN 108 could result in NHS boards treating 1,160 patients within 14 days, thereby achieving a NNT of 5 and preventing 232 strokes at five years. The additional 217 strokes prevented are equivalent to approximately 5,860 bed days assuming a mean bed day stay of 27 days per stroke patient (source ISD). The financial savings, assuming a mean direct cost for an inpatient bed of £277 (see Section 3.2) is £1.62 million.

36
6.4 Resource requirements
The clinical resources required to perform a carotid endarterectomy on a patient who is already in hospital is assumed to be an additional MRI or equivalent scan, 1.5 hours in theatre (to include recovery) and an ultrasound post-surgery to inform the prognosis. It is assumed each outpatient will receive the scan and theatre time and spend 2 nights in hospital immediately prior to and post-surgery. Some surgeons may choose to perform the operation without routinely requiring the patient to be hospitalised for 2 nights once they are familiar with the procedure and associated risks and complications. The additional procedure related staff requirements are assumed to be:
• a surgeon who spends 2 hours with each patient,
• two theatre nurses (a band 5 and band 6 specialist nurse) who each require 1.5 hours, and
• an anaesthetist incurring 1.5 hours. The additional staff required to carry out 608 extra procedures are 1.1 WTE surgeons, 0.65 WTE each of a band 5 and band 6 theatre nurse and 0.65 WTE anaesthetist. The staff required for the additional scans is addressed in Section 7.
6.5 Costs
The unit costs associated with performing a carotid endarterectomy during an inpatient stay are estimated at £1,855 (see Section 3.4 and Table 3–3). Conducting the procedure on an outpatient is estimated to incur a cost of £2,443, with the difference being the cost of 2 overnight stays in a surgical ward. Applying these costs to an additional 194 inpatient and 414 outpatient procedures gives a total incremental cost of £1.38 million. This is the central estimate of the additional costs of performing carotid endarterectomy in line with the recommendations in SIGN 108.
6.6 Sensitivity analysis
An obvious sensitivity analysis is around patient numbers. For example, if an extra 300 patients are eligible for such a procedure then the costs would increase in proportion. Thus the cost to manage 608 patients is estimated to be £1.38 million, and the costs to manage 908 estimated at £2.06 million [being £1.38*908/608]. The analysis assumes that consultants can identify the 50% who are unlikely to be fit for surgery without undertaking a carotid Doppler examination. If, however, this is not the case then the cost is underestimated by £0.93 million; the cost of 5,570 visits to a general surgery outpatient clinic plus a carotid Doppler examination. The combined mean cost of these is £167 for each NHS board (see Section 3.4 and Table 3–3).

37
6.7 Analyses by NHS board
Tables 6–2 to 6–5 provide further information on the epidemiology, costs and benefits from timely carotid endarterectomy by NHS board. Table 6–3 presents the estimated clinical benefit, Table 6–4 the estimated additional costs to achieve timely carotid endarterectomy, and Table 6–5 the sensitivity analysis of the higher costs that would be incurred if a carotid Doppler scan is required to assess patients before surgery.

38
Tabl
e 6-
2 Pa
tient
s w
ho a
re p
oten
tial c
andi
date
s fo
r car
otid
end
arte
rect
omy
In
depe
nden
cy A
naly
sis o
f Isc
haem
ic S
trok
es &
CB
V Ev
ents
mRS
<=
2 pr
e th
rom
boly
sis
NH
S Sc
otla
nd
tota
l po
pula
tion
NH
S
Ay
rshi
re &
Ar
ran
NH
S
Bo
rder
s
NH
S
Dum
frie
s &
Gal
low
ay
NH
S
Fi
feN
HS
Fort
h Va
lley
NH
S
Gra
mpi
an
NH
S
G
reat
er
Gla
sgow
&
Clyd
e
NH
S
Hig
hlan
d
NH
S
Is
land
Bo
ards
NH
S La
nark
shire
NH
S
Lo
thia
nN
HS
Tays
ide
No
of T
IA's
Adm
itted
2,08
416
153
5814
779
171
524
149
3822
625
522
1N
o of
TIA
's in
NV
Out
patie
nts
3,18
720
678
6517
514
211
91,
226
131
058
834
511
3N
o of
Infa
rcts
- FES
Adm
itted
3,57
428
781
123
256
173
328
847
220
4140
850
430
6N
o of
Infa
rcts
- NV
Out
patie
nts
2,51
313
752
9811
794
179
817
131
039
242
175
Tota
l Pat
ient
s exc
ludi
ng T
hrom
boly
sis11
,358
791
263
344
695
488
797
3,41
463
080
1,61
51,
525
715
Addi
tions
as a
resu
lt of
Thr
ombo
lysis
NH
S Sc
otla
nd
tota
l po
pula
tion
NH
S
Ay
rshi
re &
Ar
ran
NH
S
Bo
rder
s
NH
S
Dum
frie
s &
Gal
low
ay
NH
S
Fi
feN
HS
Fort
h Va
lley
NH
S
Gra
mpi
an
NH
S
G
reat
er
Gla
sgow
&
Clyd
e
NH
S
Hig
hlan
d
NH
S
Is
land
Bo
ards
NH
S La
nark
shire
NH
S
Lo
thia
nN
HS
Tays
ide
Impr
ovem
ents
in m
RS <
=1
(Disc
harg
ed)
102
112
47
49
265
112
137
Impr
ovem
ents
in m
RS <
=2
(No
Disc
harg
e )40
642
1016
3017
3610
421
249
5227
Tota
l Add
ition
al P
atie
nts
508
5312
2037
2146
130
263
6265
34
Inde
pend
ency
Ana
lysis
of I
scha
emic
Str
okes
&
CBV
Even
ts m
RS <
=2
post
thro
mbo
lysis
NH
S Sc
otla
nd
tota
l po
pula
tion
NH
S
Ay
rshi
re &
Ar
ran
NH
S
Bo
rder
s
NH
S
Dum
frie
s &
Gal
low
ay
NH
S
Fi
feN
HS
Fort
h Va
lley
NH
S
Gra
mpi
an
NH
S
G
reat
er
Gla
sgow
&
Clyd
e
NH
S
Hig
hlan
d
NH
S
Is
land
Bo
ards
NH
S La
nark
shire
NH
S
Lo
thia
nN
HS
Tays
ide
No
of T
IA's
Adm
itted
2,08
416
153
5814
779
171
524
149
3822
625
522
1N
o of
TIA
's in
NV
Out
patie
nts
3,18
720
678
6517
514
211
91,
226
131
058
834
511
3N
o of
Infa
rcts
- FES
Adm
itted
3,98
032
991
139
286
189
365
951
241
4345
755
633
3N
o of
Infa
rcts
- NV
Out
patie
nts
2,61
514
854
102
124
9918
884
313
61
404
434
82To
tal P
atie
nts I
nclu
ding
Thr
ombo
lysis
11,8
6684
427
636
473
250
984
33,
544
656
821,
676
1,59
074
9
Rest
rictio
ns o
n Pa
tient
s bei
ng p
ut fo
rwar
d fo
r Su
rger
y
NH
S Sc
otla
nd
tota
l po
pula
tion
NH
S
Ay
rshi
re &
Ar
ran
NH
S
Bo
rder
s
NH
S
Dum
frie
s &
Gal
low
ay
NH
S
Fi
feN
HS
Fort
h Va
lley
NH
S
Gra
mpi
an
NH
S
G
reat
er
Gla
sgow
&
Clyd
e
NH
S
Hig
hlan
d
NH
S
Is
land
Bo
ards
NH
S La
nark
shire
NH
S
Lo
thia
nN
HS
Tays
ide
Estim
ate
of p
atie
nts t
oo in
firm
to su
rviv
e su
rger
y37
.2%
35.2
%38
.1%
40.9
%37
.2%
35.6
%37
.1%
35.0
%39
.4%
38.2
%34
.1%
38.3
%37
.1%
Cont
rain
dica
tions
- T2
DM
and
Clin
ical
Obe
sity
13.0
%14
.4%
14.5
%12
.0%
14.8
%12
.3%
13.8
%12
.2%
13.7
%8.
4%12
.1%
13.9
%13
.8%
Num
ber o
f Pat
ient
s Res
trict
ed fr
om S
urge
ry5,
858
419
145
193
381
244
430
1,67
534
938
775
829
381
Num
ber o
f Pat
ient
s Sch
edul
ed fo
r Car
otid
D
oppl
ar a
s Firs
t Lin
e In
vest
igat
ion
for C
arot
id
Sten
osis
NH
S Sc
otla
nd
tota
l po
pula
tion
NH
S
Ay
rshi
re &
Ar
ran
NH
S
Bo
rder
s
NH
S
Dum
frie
s &
Gal
low
ay
NH
S
Fi
feN
HS
Fort
h Va
lley
NH
S
Gra
mpi
an
NH
S
G
reat
er
Gla
sgow
&
Clyd
e
NH
S
Hig
hlan
d
NH
S
Is
land
Bo
ards
NH
S La
nark
shire
NH
S
Lo
thia
nN
HS
Tays
ide
No
of T
IA's
Adm
itted
1,09
386
2628
7342
8129
071
2013
313
011
3N
o of
TIA
's in
NV
Out
patie
nts
1,58
410
035
3081
7257
630
590
309
158
53N
o of
Infa
rcts
- FES
Adm
itted
2,03
716
645
6714
010
118
551
411
623
247
272
162
No
of In
farc
ts - N
V O
utpa
tient
s1,
294
7325
4758
5191
436
620
213
201
39To
tal P
atie
nts I
nclu
ding
Thr
ombo
lysis
6,00
842
513
117
235
226
541
31,
870
308
4490
176
136
8
Out
com
e fr
om C
arot
id D
oppl
ar E
xam
inat
ion
for
Leve
l of S
teno
sis
NH
S Sc
otla
nd
tota
l po
pula
tion
NH
S
Ay
rshi
re &
Ar
ran
NH
S
Bo
rder
s
NH
S
Dum
frie
s &
Gal
low
ay
NH
S
Fi
feN
HS
Fort
h Va
lley
NH
S
Gra
mpi
an
NH
S
G
reat
er
Gla
sgow
&
Clyd
e
NH
S
Hig
hlan
d
NH
S
Is
land
Bo
ards
NH
S La
nark
shire
NH
S
Lo
thia
nN
HS
Tays
ide
No
of T
IA's
Like
ly to
hav
e St
enos
is2,
141
149
4946
123
9111
073
610
416
353
231
133
No
of In
farc
ts Li
kely
to h
ave
Sten
osis
2,49
717
952
8514
811
320
771
213
318
345
354
151
Subt
otal
4,63
832
810
113
127
120
431
71,
448
237
3469
858
528
4N
umbe
r of P
atie
nts w
ith S
teno
sis se
vere
eno
ugh
to
requ
ire su
rger
y1,
160
8225
3368
5179
362
599
175
146
71
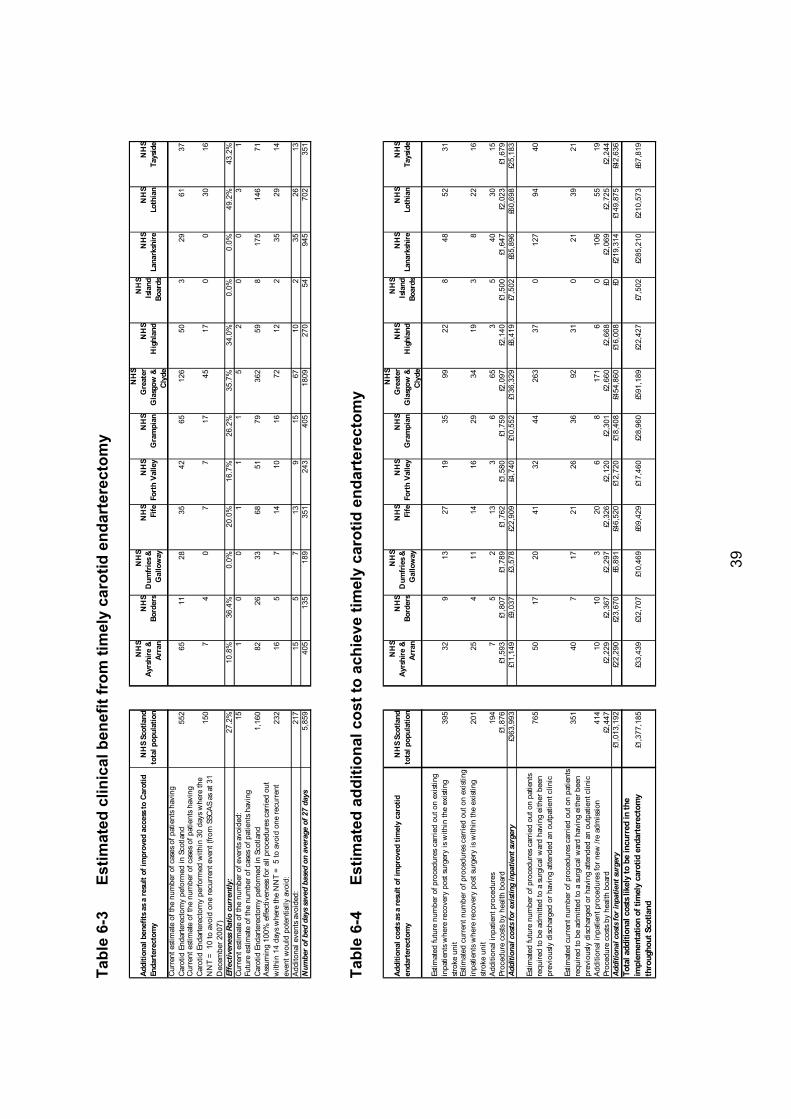
39
Tabl
e 6-
3 Es
timat
ed c
linic
al b
enef
it fr
om ti
mel
y ca
rotid
end
arte
rect
omy
Addi
tiona
l ben
efits
as a
resu
lt of
impr
oved
acc
ess t
o Ca
rotid
En
dart
erec
tom
yN
HS
Scot
land
to
tal p
opul
atio
n
NH
S Ay
rshi
re &
Ar
ran
NH
S Bo
rder
s
NH
S D
umfr
ies &
G
allo
way
NH
S Fi
feN
HS
Fort
h Va
lley
NH
S G
ram
pian
NH
S G
reat
er
Gla
sgow
&
Clyd
e
NH
S H
ighl
and
NH
S Is
land
Bo
ards
NH
S La
nark
shire
NH
S Lo
thia
nN
HS
Tays
ide
Cur
rent
est
imat
e of
the
num
ber o
f cas
es o
f pat
ient
s ha
ving
C
arot
id E
ndar
tere
ctom
y pe
form
ed in
Sco
tland
552
6511
2835
4265
126
503
2961
37C
urre
nt e
stim
ate
of th
e nu
mbe
r of c
ases
of p
atie
nts
havi
ng
Car
otid
End
arte
rect
omy
perfo
rmed
with
in 3
0 da
ys w
here
the
NN
T =
10
to a
void
one
recu
rren
t eve
nt (f
rom
SSC
AS
as a
t 31
Dec
embe
r 200
7)
150
74
07
717
4517
00
3016
Effe
ctiv
enes
s Rat
io c
urre
ntly
:27
.2%
10.8
%36
.4%
0.0%
20.0
%16
.7%
26.2
%35
.7%
34.0
%0.
0%0.
0%49
.2%
43.2
%C
urre
nt e
stim
ate
of th
e nu
mbe
r of e
vent
s avo
ided
:15
10
01
11
52
00
31
Futu
re e
stim
ate
of th
e nu
mbe
r of c
ases
of p
atie
nts
havi
ng
Car
otid
End
arte
rect
omy
pefo
rmed
in S
cotla
nd1,
160
8226
3368
5179
362
598
175
146
71As
sum
ing
100%
effe
ctiv
enes
s for
all
proc
edur
es c
arrie
d ou
t w
ithin
14
days
whe
re th
e N
NT
= 5
to a
void
one
recu
rren
t ev
ent w
ould
pot
entia
lly a
void
:23
216
57
1410
1672
122
3529
14
Addi
tona
l eve
nts a
void
ed:
217
155
713
915
6710
235
2613
Num
ber o
f bed
day
s sav
ed b
ased
on
aver
age
of 2
7 da
ys5,
859
405
135
189
351
243
405
1809
270
5494
570
235
1
Tabl
e 6-
4 Es
timat
ed a
dditi
onal
cos
t to
achi
eve
timel
y ca
rotid
end
arte
rect
omy
Addi
tiona
l cos
ts a
s a re
sult
of im
prov
ed ti
mel
y ca
rotid
en
dart
erec
tom
yN
HS
Scot
land
to
tal p
opul
atio
n
NH
S Ay
rshi
re &
Ar
ran
NH
S Bo
rder
s
NH
S D
umfr
ies &
G
allo
way
NH
S Fi
feN
HS
Fort
h Va
lley
NH
S G
ram
pian
NH
S G
reat
er
Gla
sgow
&
Clyd
e
NH
S H
ighl
and
NH
S Is
land
Bo
ard s
NH
S La
nark
shire
NH
S Lo
thia
nN
HS
Tays
ide
Estim
ated
futu
re n
umbe
r of p
roce
dure
s ca
rried
out
on
exist
ing
inpa
tient
s whe
re re
cove
ry p
ost s
urge
ry is
with
in th
e ex
istin
g st
roke
uni
t39
532
913
2719
3599
228
4852
31
Estim
ated
cur
rent
num
ber o
f pro
cedu
res c
arrie
d ou
t on
exis
ting
inpa
tient
s whe
re re
cove
ry p
ost s
urge
ry is
with
in th
e ex
istin
g st
roke
uni
t20
125
411
1416
2934
193
822
16
Addi
tiona
l inp
atie
nt p
roce
dure
s19
47
52
133
665
35
4030
15Pr
oced
ure
costs
by
heal
th b
oard
£1,8
76£1
,593
£1,8
07£1
,789
£1,7
62£1
,580
£1,7
59£2
,097
£2,1
40£1
,500
£1,6
47£2
,023
£1,6
79Ad
ditio
nal c
osts
for e
xist
ing
inpa
tient
surg
ery
£363
,993
£11,
149
£9,0
37£3
,578
£22,
909
£4,7
40£1
0,55
2£1
36,3
29£6
,419
£7,5
02£6
5,89
6£6
0,69
8£2
5,18
3
Estim
ated
futu
re n
umbe
r of p
roce
dure
s ca
rried
out
on
patie
nts
requ
ired
to b
e ad
mitt
ed to
a su
rgic
al w
ard
havi
ng e
ither
bee
n pr
evio
usly
dis
char
ged
or h
avin
g at
tend
ed a
n ou
tpat
ient
clin
ic
765
5017
2041
3244
263
370
127
9440
Estim
ated
cur
rent
num
ber o
f pro
cedu
res c
arrie
d ou
t on
patie
nts
requ
ired
to b
e ad
mitt
ed to
a su
rgic
al w
ard
havi
ng e
ither
bee
n pr
evio
usly
dis
char
ged
or h
avin
g at
tend
ed a
n ou
tpat
ient
clin
ic
351
407
1721
2636
9231
021
3921
Addi
tiona
l inp
atie
nt p
roce
dure
s for
new
/re
adm
issio
n41
410
103
206
817
16
010
655
19Pr
oced
ure
costs
by
heal
th b
oard
£2,4
47£2
,229
£2,3
67£2
,297
£2,3
26£2
,120
£2,3
01£2
,660
£2,6
68£0
£2,0
69£2
,725
£2,2
44Ad
ditio
nal c
osts
for i
npat
ient
surg
ery
£1,0
13,1
92£2
2,29
0£2
3,67
0£6
,891
£46,
520
£12,
720
£18,
408
£454
,860
£16,
008
£0£2
19,3
14£1
49,8
75£4
2,63
6To
tal a
dditi
onal
cos
ts li
kely
to b
e in
curr
ed in
the
impl
emen
tatio
n of
tim
ely
caro
tid e
ndar
tere
ctom
y th
roug
hout
Sco
tland
£1,3
77,1
85£3
3,43
9£3
2,70
7£1
0,46
9£6
9,42
9£1
7,46
0£2
8,96
0£5
91,1
89£2
2,42
7£7
,502
£285
,210
£210
,573
£67,
819

40
Tabl
e 6-
5 Se
nsiti
vity
ana
lyse
s of
hig
her c
osts
incu
rred
if c
arot
id D
oppl
er re
quire
d as
sess
ing
patie
nt b
efor
e
surg
ery
Se
nsiti
vity
Ana
lysis
: Car
otid
exa
min
atio
ns sh
ould
be
carr
ied
out w
ith a
vie
w to
incl
ude
the
mos
t pot
entia
l can
dida
tes f
or
surg
ery
taki
ng in
to a
ccou
nt, t
ime
of sy
mpt
om o
nset
vs d
elay
to
initi
al re
ferr
al a
nd p
oten
tial c
ompl
icat
ions
and
co-
mor
bidi
ties.
The
cost
of s
impl
y sc
reen
ing
is m
easu
red
as:
NH
S Sc
otla
nd
tota
l pop
ulat
ion
NH
S
Ay
rshi
re &
Ar
ran
NH
S
Bo
rder
s
NH
S
Dum
frie
s &
Gal
low
ay
NH
S
Fi
feN
HS
Fort
h Va
lley
NH
S
Gra
mpi
an
NH
S
G
reat
er
Gla
sgow
&
Clyd
e
NH
S
Hig
hlan
dN
HS
Lana
rksh
ireN
HS
Loth
ian
NH
S
Ta
ysid
e
Est
imat
ed A
ttend
ance
for T
IA M
inor
Stro
ke C
linic
11,2
7879
126
334
469
548
879
73,
414
630
1,61
51,
525
715
Res
trict
ed b
y tim
e - o
utsi
de o
f 30
days
from
ons
et
35.2
%38
.1%
40.9
%37
.2%
35.6
%37
.1%
35.0
%39
.4%
34.1
%38
.3%
37.1
%R
estri
cted
by
com
plic
atio
ns a
nd c
o-m
orbi
dity
14.4
%14
.5%
12.0
%14
.8%
12.3
%13
.8%
12.2
%13
.7%
12.1
%13
.9%
13.8
%To
tal %
of A
ttend
ees
unlik
ely
to w
arra
nt s
urge
ry49
.4%
49.6
%52
.6%
52.9
%52
.0%
47.9
%51
.0%
47.2
%53
.1%
46.2
%52
.1%
50.9
%N
umbe
r of i
nves
tigat
ions
'sav
ed'
5,56
839
313
918
236
123
440
61,
613
335
746
795
364
Cos
t - C
onsu
ltant
Out
patie
nt G
ener
al S
urge
ry£6
1£1
15£3
0£1
40£1
19£1
05£1
05£1
21£8
9£1
75£9
5C
ost -
Car
otid
Dop
plar
Exa
min
atio
n£3
9£4
2£6
8£3
3£7
7£6
1£6
1£1
10£4
9£5
0£3
5To
tal c
ost s
aved
or i
ncur
red
by S
cree
ning
£9
28,9
58£3
9,30
0£2
1,82
3£1
7,83
6£6
2,45
3£4
5,86
4£6
7,39
6£2
67,7
58£7
7,38
5£1
02,9
48£1
78,8
75£4
7,32
0

41
7 TIMELY CT DIAGNOSTICS
7.1 Background
SIGN 108 recommends that ‘All patients with suspected stroke should have brain imaging immediately on presentation’ (recommendation 2.3.1). The use of brain imaging is the first level of diagnostics necessary to distinguish whether a patient is presenting with a haemorrhagic stroke or an ischaemic stroke, including transient ischaemic events. The successful implementation of thrombolytic therapy within 4.5 hours of symptom onset requires the assessment of potential candidates using a CT head scanner immediately on arrival in hospital. This may require the patient to take precedent over others waiting for a scan, thereby interrupting the service for 15 minutes. Other stroke patients requiring scanning are less time critical and thus should be able to be planned within a daily schedule. No definite admission pattern for thrombolytic patients has been established. Feedback from some NHS boards indicates it is likely that a number of potential patients will present mid morning when radiology departments are often at their busiest. Extensive modelling has quantified the potential number of immediate scans required during this peak time to be twice per week in the larger boards and once per fortnight in the smaller boards. This assumes that all patients are delivered by SAS to the nominated target hospital in each NHS board. NHS Quality Improvement Scotland has published clinical standards on Stroke Services: Care of the Patient in the Acute Setting for all patients admitted with a stroke. These require that 80% of patients have CT/MRI imaging within 48 hours of admission. The standards are under review with a proposal to require that 80% of patients have CT/MRI imaging on the day of admission. A model has been developed to measure the demands that CT scanning for stroke places on radiology departments. This encompasses the resources and funding required solely to manage patients with suspected stroke including TIA. This model seeks to address some of the issues raised by members of the stroke managed clinical networks who reported significant delays in the radiological diagnostics service. Such services are tasked with delivering diagnostics to many other medical conditions, which are subject to their own timeframes and waiting time initiatives. The following analysis quantifies the resources required and costs of having a dedicated service for stroke. NHS boards may be able to compare these resources to current service levels to estimate whether additional resources are needed. In addition, in the first year, each NHS board is assumed to require additional support from a business administration manager to undertake the management and reporting of inpatients and outpatients and model patient flows. This activity should assist in optimising the resources required to support diagnostics, thrombolysis and carotid endarterectomy.

42
7.2 Patient group
The patient group for timely CT scanning includes all diagnosed stroke inpatients plus those who attend at a neurovascular outpatient clinic. In addition there are a number of known stroke mimics whose symptoms on presentation are sufficiently similar to require CT scanning as a first level diagnostic tool. The scan can eliminate this particular group of patients from the stroke care pathway. The total patient group that gives rise to the demand for CT diagnostics is detailed in Table 7–1. Table 7-1 Patient groups requiring CT scanning facilities
Patient groups Stroke Mimic Total
Attendance Inpatient admittance (ISD epidemiology): First ever hospital admission 8,814 Recurrent stroke event from current year 1,339 Recurrent stroke event from historical year 1,767 Uplift by 15% for mimics 1,759 Subtotal for inpatients 13,679Outpatient attendance (SSCAS): Estimated number of TIA patients 3,187 Estimated number of minor stroke patients 2,513 11% of patients with RAO or TMB 1,075 29% of patients with non CBV event 2,825 Subtotal for outpatients 9,600NHSScotland total 17,620 5,659 23,279 Key: Retinal Artery Occlusion (RAO); Transient Monocular Blindness (TMB) In addition, the 1,015 patients forecast to benefit from thrombolytic therapy are assumed to receive a scan to assess any potential haemorrhagic activity as a result of the drug administration. Thus, total demand is estimated to be almost 24,300 patients annually.
7.3 Clinical benefits
The clinical benefits associated with timely CT scanning are reported in Sections 5.3 and 6.3, being the clinical benefits attributable to timely thrombolysis and carotid endarterectomy.
7.4 Resources
The resources required to meet the demand for CT scanning services in Scotland’s hospitals have been calculated assuming 24,300 patients require a CT scan each year. The annual demand is then expressed as a weekly demand assuming 50 operational weeks per annum and no seasonality. Expressing this weekly demand in operational machine hours, with each scan event taking 15 minutes, suggests that for Scotland a

43
total of 122 hours are required (see Table 7–2). This is equivalent to operating 25 scanners for 1 hour per day Monday to Friday. For the majority of NHS boards this will be one scanner per hospital site providing acute stroke services, with the exception of NHS Grampian and NHS Greater Glasgow and Clyde where it is equivalent to 1 hour per weekday on two scanners per tertiary site. Table 7-2 Calculation of operational CT scanning hours per week in Scottish
hospitals
Resources required for timely CT scanning
First diagnostic
event
Additional scan post
thrombolysisTotal
demand
Number per
week (50)
Operational hours (15 min per scan)
No of scanners extended
time NHS Ayrshire & Arran 1,728 105 1,833 37 9.2 2NHS Borders 555 25 580 12 2.9 1NHS Dumfries & Galloway 748 40 788 16 3.9 1NHS Fife 1,475 74 1,549 31 7.7 2NHS Forth Valley 993 42 1,035 21 5.2 1NHS Grampian 1,864 91 1,955 39 9.8 2NHS Greater Glasgow and Clyde 6,561 261 6,822 136 34.1 7NHS Highland 1,369 51 1,420 28 7.1 1NHS Island Boards 179 5 184 4 0.9 0NHS Lanarkshire 2,979 123 3,102 62 15.5 3NHS Lothian 3,103 130 3,233 65 16.2 3NHS Tayside 1,723 68 1,791 36 9.0 2NHSScotland 23,277 1,015 24,292 486 121.5 25 The staff resources required to provide a weekday service for each scanner are assumed to be:
• one 0.5 planned activity session for a stroke consultant to read the scans
• 0.2 WTE band 7 radiographer specialising in CT head scanning
• 0.2 WTE band 6 radiographer with an interest in CT head scanning
• 0.2 WTE band 3 helper, and
• 0.2 WTE band 2 clerical officer. The annual resources required to provide a weekday service across Scotland are 625 planned activity sessions for consultants, 5 WTE band 7 radiographers, 5 WTE band 6 radiographers, 5 WTE band 3 helpers and 5 WTE band 2 clerical officers. This simplistic approach provides sufficient capacity to scan all patients on a weekday but not the two sevenths of inpatients; equivalent to approximately 4,340 inpatients who will require a service at weekends. Increasing the resources to provide scanning capability for those inpatients suggests the additional resources required are 737

44
planned activity sessions for consultants, 5.9 WTE band 7 radiographers, 5.9 WTE band 6 radiographers, 5.9 WTE band 3 helpers and 5.9 WTE band 2 clerical officers. Using this approach is consistent with assuming the number of appointments needed to manage 24,300 scans is 28,640. The additional 18% capacity recognises some outpatients will not attend the initial appointment and require a second appointment, the need for repeat scans and cases where the scan takes more than 15 minutes. An estimate of 3.8 WTE support from additional band 6 business administration managers is forecast to be required across Scotland, in the first year, to support implementation.
7.5 Costs
The unit costs and total costs for each resource are shown in Table 7–3. Table 7-3 Unit cost and total cost to provide capacity to scan 24,300 people
with stroke symptoms per year
Resource Resources required
Unit costs Total costs
Stroke consultant 15 planned
activities per week £20,660 per
planned activity £309,900 Band 7 radiographer 5.9 WTE £40,996 £241,590Band 6 radiographer 5.9 WTE £34,332 £202,319Band 3 helper 5.9 WTE £19,895 £117,241Band 2 clerical officer 5.9 WTE £17,602 £103,729Total for Scotland £974,779 The additional cost of the 3.8 WTE band 6 business administration managers is estimated at £128,745.
7.6 Sensitivity analysis
Information from SSCAS indicates that some NHS boards provide significantly more outpatient clinics than are indicated to be required to manage this patient group.

45
8 REFERENCES
1. National Audit Office. Report by the Comptroller and Auditor General. Department of Health. Reducing Brain Damage: Faster access to better stroke care. HC 452 Session 2005-2006. 16 November 2005.
2. Syme P., Byrne A., Chen R., Devenny R., Forbes J. Community-based stroke incidence in a Scottish population: the Scottish Borders Stroke Study. Stroke 2005; 36(9): 1837-43. (SBSS)
3. Scottish Intercollegiate Guidelines Network. Management of patients with stroke or TIA: assessment, investigation, immediate management and secondary prevention. A national clinical guideline. SIGN 108. 2008. Available from www.sign.ac.uk
4. Mauskopf J. et al. Principles of Good Practice for Budget Impact Analysis: Report of the ISPOR Task Force on Good Research Practice: Budget Impact Analysis. Value in Health 2007; 10(5): 336-347.
5. Trueman P., Hutton J., Drummond M. Developing Guidance for Budget Impact Analysis. Pharmacoeconomics 2001; 19(6): 609-621.
6. Trueman P., Cardow T. Independent Evaluation of the Resource Impact Tools Developed Alongside the SIGN CHD Guidelines. York Health Economics Consortium March 2008.
7. National Institute for Health and Clinical Excellence. Developing costing tools; Methods guide. January 2008. Available from: www.nice.org.uk
8. Rothwell P., Gutnikov S., Warlow C. European Carotid Surgery Trialist’s C. Reanalysis of the final results of the European Carotid Surgery Trial. Stroke 2003; 34(2): 514-23.
9. Audit Commission. National Report 2005. Managing the financial implications of NICE guidance. Available from www.audit-commission.gov.uk
10. Scottish Goverment. Coronary Heart Disease and Stroke: Strategy for Scotland. 3 October 2002. available from www.scotland.gov.uk
11. NHS National Services Scotland. Scottish Stroke Care Audit. Stroke Services in Scottish Hospitals; Data relating to 2005-2007. 2008 National Report. Available from www.isdscotland.org
12. Bamford J., Sandercock P., Dennis M. et al. A prospective study of acute cerebrovascular disease in the community: the Oxfordshire Community Stroke Project 1981-86. 1. Methodology, demography and incident cases of first-ever stroke. J Neurol Neurosurg Psychiatry 1988; 51: 1373-80

46
13. Bamford J., Sandercock P., Dennis M., Burn J., Warlow C. A prospective study of acute cerebrovascular disease in the community: the Oxfordshire Community Stroke Project 1981-86. 2. Incidence, case fatality rates and overall outcome at one year of cerebral infarction, primary Intracerebral haemorrhage and subarachnoid haemorrhage. J Neurol Neurosurg Psychiatry 1990; 53: 16-22
14. Bamford J., Sandercock P., Dennis M., Burn J., Warlow C. Classification and natural history of clinically identifiable subtypes of cerebral infarction. Lancet 1991; 337: 1521-26
15. Murphy D. Information Services Division (ISD). Cerebrovascular Disease Admissions in Scotland; episodes, continuous inpatient stays, number of patients and estimated costs in the patient pathway of care for the financial years 2002/03 to 2007/08 inclusive. File Reference IR2008-01983 in response to a request by Craig J. NHS Quality Improvement Scotland 13 August 2008.
16. Health Service Journal. Fast Thinking: Stroke Care 18-20. 12 March 2009 17. Caso V., Paciaroni M., Venti M., Palmerini F. et al. Determinant of outcome in
patients eligible for thrombolysis for ischaemic stroke. Vasc Health Risk Manag 2007; 3(5): 749-54
18. Murphy D. Information Services Division (ISD). Cerebrovascular Disease Admissions & Mortality in Scotland; first ever occurrence of cerebrovascular disease that has resulted in a hospital admission or that has resulted in death without admission as a unique once only event. File Reference IR2008-02372 in response to a request by Wallace G. NHS Quality Improvement Scotland 1 October 2008.
19. Murphy D. Information Services Division (ISD). Cerebrovascular Disease Unique First Ever Admissions for Stroke or TIA in Scotland: Linked database results for prior admission history, readmission and survival for the years 31 March 2006, 2007 and 2008. File Reference IR2008-02372 in response to a request by Wallace G. NHS Quality Improvement Scotland 1 October 2008.
20. Hacke W., Donnan G., Fieschi C., Kaste M., von Kummer R., Broderick JP et al. Association of outcomes with early stroke treatment: pooled analysis of ATLANTIS, ECASS and NINDS rt-PA stroke trials. Lancet 2004; 363 768-74.
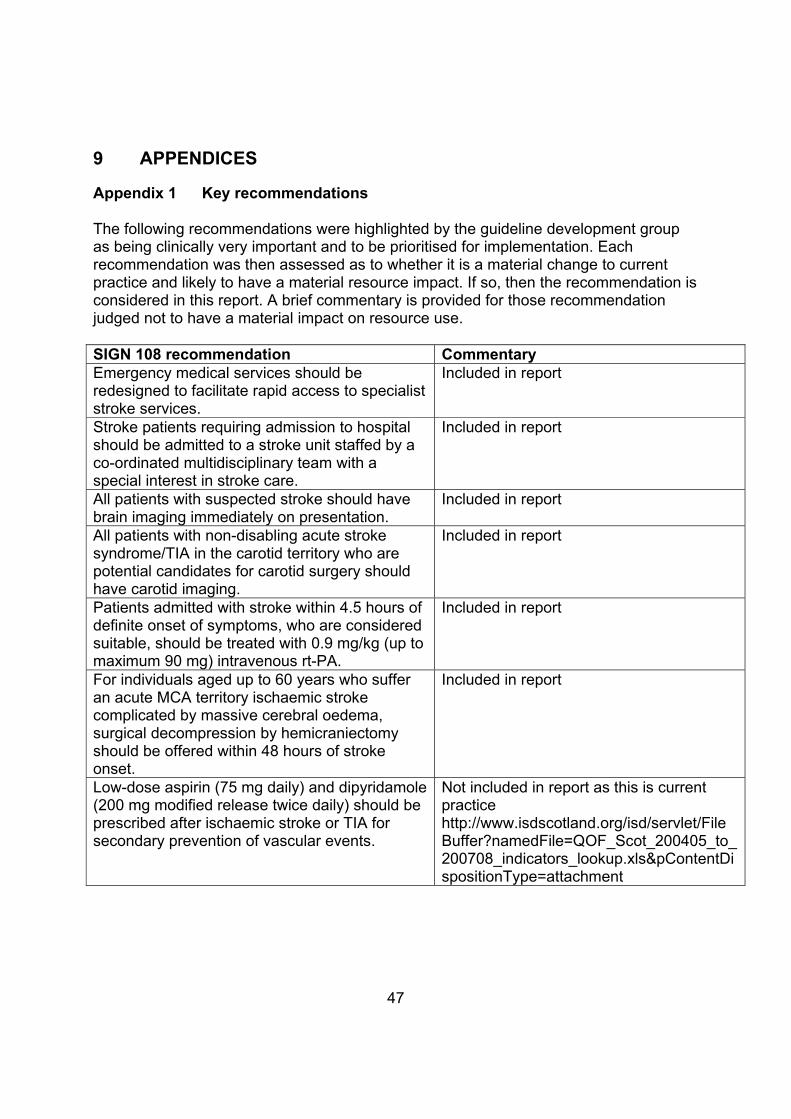
47
9 APPENDICES
Appendix 1 Key recommendations The following recommendations were highlighted by the guideline development group as being clinically very important and to be prioritised for implementation. Each recommendation was then assessed as to whether it is a material change to current practice and likely to have a material resource impact. If so, then the recommendation is considered in this report. A brief commentary is provided for those recommendation judged not to have a material impact on resource use. SIGN 108 recommendation Commentary Emergency medical services should be redesigned to facilitate rapid access to specialist stroke services.
Included in report
Stroke patients requiring admission to hospital should be admitted to a stroke unit staffed by a co-ordinated multidisciplinary team with a special interest in stroke care.
Included in report
All patients with suspected stroke should have brain imaging immediately on presentation.
Included in report
All patients with non-disabling acute stroke syndrome/TIA in the carotid territory who are potential candidates for carotid surgery should have carotid imaging.
Included in report
Patients admitted with stroke within 4.5 hours of definite onset of symptoms, who are considered suitable, should be treated with 0.9 mg/kg (up to maximum 90 mg) intravenous rt-PA.
Included in report
For individuals aged up to 60 years who suffer an acute MCA territory ischaemic stroke complicated by massive cerebral oedema, surgical decompression by hemicraniectomy should be offered within 48 hours of stroke onset.
Included in report
Low-dose aspirin (75 mg daily) and dipyridamole (200 mg modified release twice daily) should be prescribed after ischaemic stroke or TIA for secondary prevention of vascular events.
Not included in report as this is current practice http://www.isdscotland.org/isd/servlet/File Buffer?namedFile=QOF_Scot_200405_to_200708_indicators_lookup.xls&pContentDispositionType=attachment
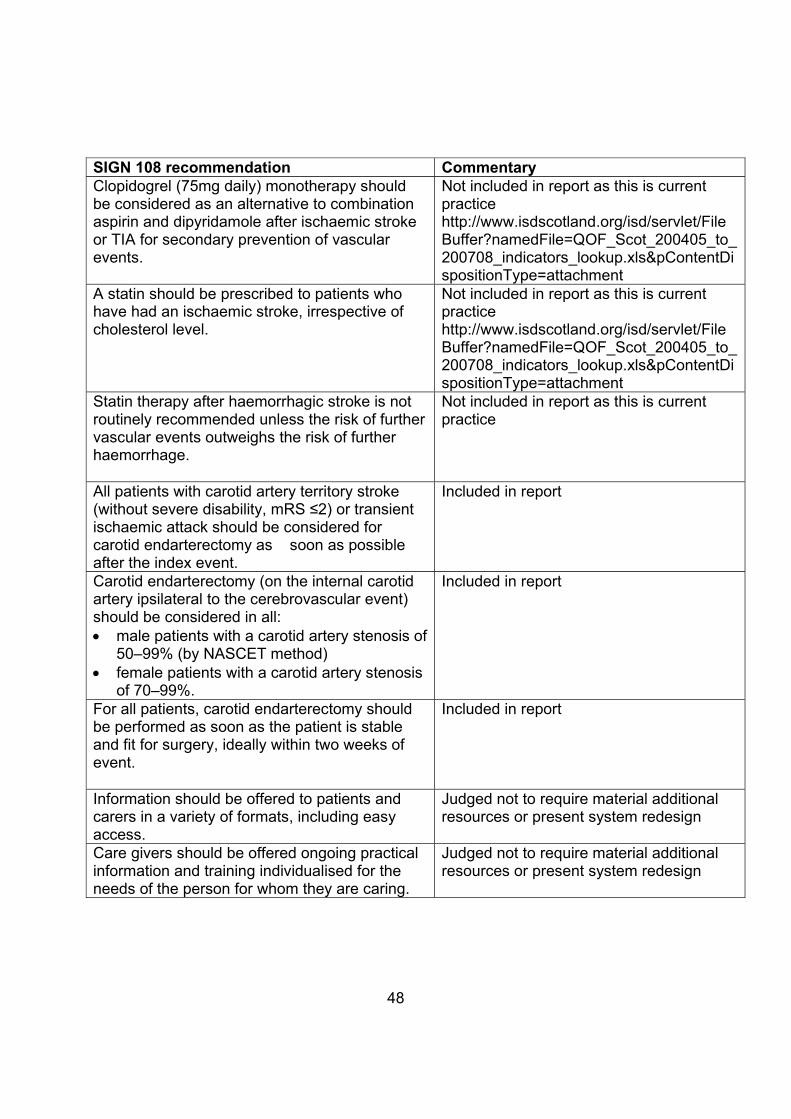
48
SIGN 108 recommendation Commentary Clopidogrel (75mg daily) monotherapy should be considered as an alternative to combination aspirin and dipyridamole after ischaemic stroke or TIA for secondary prevention of vascular events.
Not included in report as this is current practice http://www.isdscotland.org/isd/servlet/File Buffer?namedFile=QOF_Scot_200405_to_200708_indicators_lookup.xls&pContentDispositionType=attachment
A statin should be prescribed to patients who have had an ischaemic stroke, irrespective of cholesterol level.
Not included in report as this is current practice http://www.isdscotland.org/isd/servlet/File Buffer?namedFile=QOF_Scot_200405_to_200708_indicators_lookup.xls&pContentDispositionType=attachment
Statin therapy after haemorrhagic stroke is not routinely recommended unless the risk of further vascular events outweighs the risk of further haemorrhage.
Not included in report as this is current practice
All patients with carotid artery territory stroke (without severe disability, mRS ≤2) or transient ischaemic attack should be considered for carotid endarterectomy as soon as possible after the index event.
Included in report
Carotid endarterectomy (on the internal carotid artery ipsilateral to the cerebrovascular event) should be considered in all: • male patients with a carotid artery stenosis of
50–99% (by NASCET method) • female patients with a carotid artery stenosis
of 70–99%.
Included in report
For all patients, carotid endarterectomy should be performed as soon as the patient is stable and fit for surgery, ideally within two weeks of event.
Included in report
Information should be offered to patients and carers in a variety of formats, including easy access.
Judged not to require material additional resources or present system redesign
Care givers should be offered ongoing practical information and training individualised for the needs of the person for whom they are caring.
Judged not to require material additional resources or present system redesign

49
Appendix 2 Acknowledgements Authors (NHS Quality Improvement Scotland) Mr George M Wallace Senior Project Cost Accountant Ms Joyce Craig Lead Health Economist Authors’ acknowledgements We would like to thank all colleagues who contributed to the development of the report, provided responses to questionnaires and assisted in quality assuring the assumptions and pathways in individual NHS boards. In particular we would like to thank: Guideline development group members: Dr Anthony Byrne Stroke Consultant, Stirling Royal Infirmary Ms Hazel Fraser Lead MCN Nurse for Stroke, NHS Fife Professor Peter Langhorne Professor of Geriatric Medicine, Glasgow Royal Infirmary Dr Keith Muir Consultant Neurologist, Southern General Hospital, Glasgow Dr Scott Ramsay Stroke Consultant, St John’s Hospital, Livingstone Dr Giles Roditi Consultant Radiologist, Glasgow Royal Infirmary Dr Paul Syme Consultant Physician, Borders General Hospital, Melrose NHSScotland colleagues: Dr Mark Barber Lead Clinician Stroke, NHS Lanarkshire Ms Katrina Brennan Stroke MCN Manager, NHS Lanarkshire Ms Denise Brown Stroke MCN Manager, NHS Ayrshire & Arran Dr George Crooks Medical Director, Scottish Ambulance Service Professor Martin Dennis Professor of Stroke Medicine, University of Edinburgh Ms Anne Duthie Service Development Manager, Scottish Centre for Telehealth Dr Andrew Farrall Consultant Neuroradiologist, Royal Infirmary Edinburgh Dr James Godfrey Lead Clinician Stroke, NHS Ayrshire & Arran Mr Christian Goskirk Stroke MCN Manager, NHS Highland Dr Ian Hay Lead Clinician Stroke, NHS Dumfries & Galloway Dr Christine McAlpine Lead Clinician Stroke, NHS Greater Glasgow and Clyde Ms Pamela Mclauchlan Director of Finance, Scottish Ambulance Service Ms Morag Medwin Stroke MCN Manager, NHS Lothian Mr David Murphy Information Services Division Ms Stephanie Phillips Acting GM PPU, Scottish Ambulance Service Mr David Potter Stroke MCN Manager, NHS Dumfries & Galloway Ms Camilla Young Stroke MCN Manager, NHS Greater Glasgow and Clyde

50
Appendix 3 Resource impact assessment process Stage 1: Draft guideline at consultation stage Stage 2: Identify those recommendations likely to have a material resource impact Stage 3: Identify key cost drivers for each material recommendation and gather information on potential clinical benefits, pathways and cost evidence Stage 4: Develop model to estimate clinical benefits and associated resources and costs – incorporate sensitivity analysis Stage 5: Develop national clinical and resource impact report Stage 6: Determine links between national bodies and each NHS board and develop cost template where required Stage 7: Internal review with chair of the SIGN guideline development group and NHS Quality Improvement Scotland Stage 8: Circulate report and template to chair of guideline development group and others for peer review; update report based on feedback and any changes following consultations Stage 9: Final sign-off Stage 10: Publication, dissemination and impact assessment
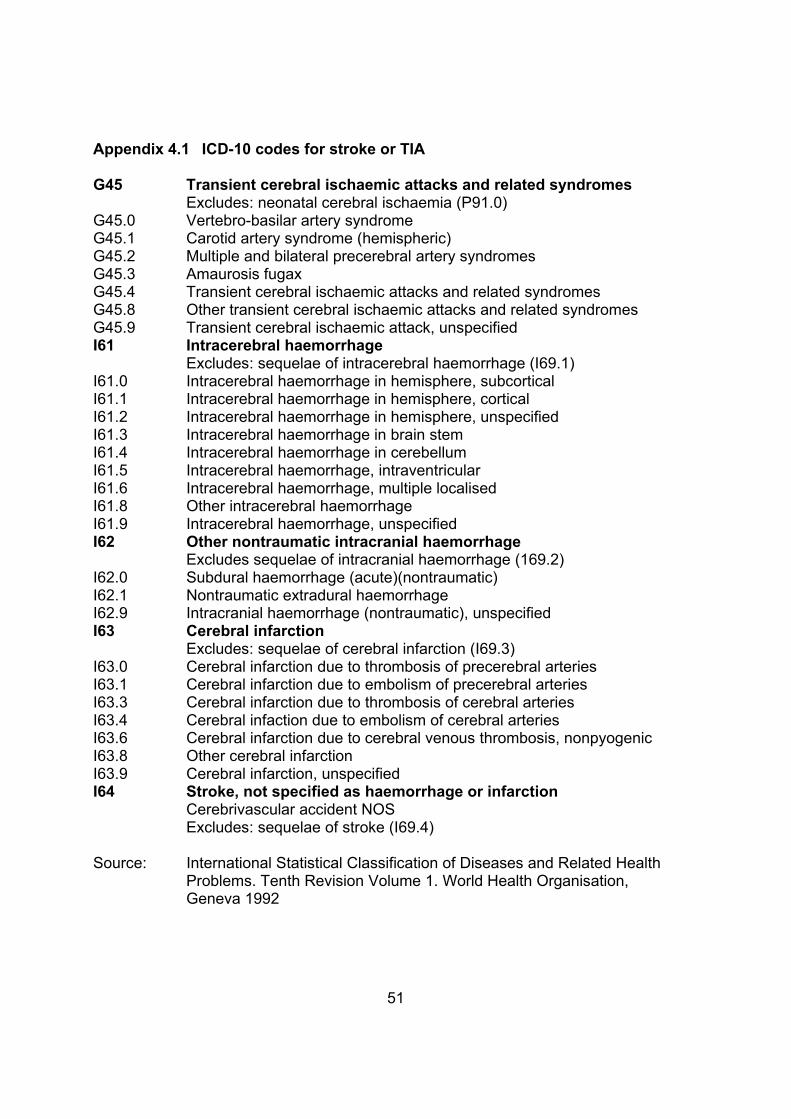
51
Appendix 4.1 ICD-10 codes for stroke or TIA G45 Transient cerebral ischaemic attacks and related syndromes Excludes: neonatal cerebral ischaemia (P91.0) G45.0 Vertebro-basilar artery syndrome G45.1 Carotid artery syndrome (hemispheric) G45.2 Multiple and bilateral precerebral artery syndromes G45.3 Amaurosis fugax G45.4 Transient cerebral ischaemic attacks and related syndromes G45.8 Other transient cerebral ischaemic attacks and related syndromes G45.9 Transient cerebral ischaemic attack, unspecified I61 Intracerebral haemorrhage Excludes: sequelae of intracerebral haemorrhage (I69.1) I61.0 Intracerebral haemorrhage in hemisphere, subcortical I61.1 Intracerebral haemorrhage in hemisphere, cortical I61.2 Intracerebral haemorrhage in hemisphere, unspecified I61.3 Intracerebral haemorrhage in brain stem I61.4 Intracerebral haemorrhage in cerebellum I61.5 Intracerebral haemorrhage, intraventricular I61.6 Intracerebral haemorrhage, multiple localised I61.8 Other intracerebral haemorrhage I61.9 Intracerebral haemorrhage, unspecified I62 Other nontraumatic intracranial haemorrhage Excludes sequelae of intracranial haemorrhage (169.2) I62.0 Subdural haemorrhage (acute)(nontraumatic) I62.1 Nontraumatic extradural haemorrhage I62.9 Intracranial haemorrhage (nontraumatic), unspecified I63 Cerebral infarction Excludes: sequelae of cerebral infarction (I69.3) I63.0 Cerebral infarction due to thrombosis of precerebral arteries I63.1 Cerebral infarction due to embolism of precerebral arteries I63.3 Cerebral infarction due to thrombosis of cerebral arteries I63.4 Cerebral infaction due to embolism of cerebral arteries I63.6 Cerebral infarction due to cerebral venous thrombosis, nonpyogenic I63.8 Other cerebral infarction I63.9 Cerebral infarction, unspecified I64 Stroke, not specified as haemorrhage or infarction Cerebrivascular accident NOS Excludes: sequelae of stroke (I69.4) Source: International Statistical Classification of Diseases and Related Health
Problems. Tenth Revision Volume 1. World Health Organisation, Geneva 1992

52
Appendix 4.2 ICD-10 codes for other cerebrovascular diseases I65 Occlusion and senosis of precerebral arteries, not resulting in cerebral infarction Excludes: when causing cerebral infarction (I63.-) I65.0 Occlusion and stenosis of vertebral artery I65.1 Occlusion and stenosis of basilar artery I65.2 Occlusion and stenosis of carotid artery I65.3 Occlusion and stenosis of multiple and bilateral precerebral arteries I65.8 Occlusion and stenosis of other precerebral artery I65.9 Occlusion and stenosis of unspecified precerebral artery I66 Occlusion and stenosis of cerebral arteries, not resulting in cerebral infarction Excludes: when causing cerebral infarction (163.-) I66.0 Occlusion and stenosis of middle cerebral artery I66.1 Occlusion and stenosis of anterior cerebral artery I66.2 Occlusion and stenosis of posterior cerebral artery I66.3 Occlusion and stenosis of cerebellar arteries I66.4 Occlusion and stenosis of multiple and bilateral cerebral arteries I66.8 Occlusion and stenosis of other cerebral artery I66.9 Occlusion and stenosis of unspecified cerebral artery I67 Other cerebrovascular diseases Excludes: sequelae of the listed conditions (I69.8) I67.0 Dissection of cerebral arteries, nonruptured I67.1 Cerebral aneurysm, nonruptured I67.2 Cerebral atherosclerosis I67.3 Progressive vascular leukoencephalopathy I67.4 Hypertensive encephalopathy I67.5 Moyamoya disease I67.6 Nonpyogenic thrombosis of intracranial venous system I67.7 Cerebral arteritis, not elsewhere classified I67.8 Other specified cerebrovascular diseases I67.9 Cerebrivascular disease, unspecified I69 Sequelae of cerebrovasular disease I69.0 Sequelae of subarachnoid haemorrhage I69.1 Sequelae of intracerebral haemorrhage I69.2 Sequelae of other non traumatic intracranial haemorrhage I69.3 Sequelae of cerebral infarction I69.4 Sequelae of stroke, not specified as haemorrhage or infarction I69.8 Sequelae of other and unspecified cerebrovascular diseases Source: International Statistical Classification of Diseases and Related Health
Problems. Tenth Revision Volume 1. World Health Organisation, Geneva 1992

53
Appendix 5.1 Incidence of first ever hospital admission for stroke and TIA for year ending 31 March 2007
Population statistics mid year estimate provided by GRO as at 30 June 2006
Total population
0 - 44 years
45 - 54 years
55 - 64 years
65 - 74 years
75 - 84 years
85+ years
Age group analysis 5,116,900 2,941,253 713,310 624,369 455,744 287,021 95,203% of total population 57.5% 13.9% 12.2% 8.9% 5.6% 1.9%% reduction in population groups 12.5% 27.0% 37.0% 66.8%
Stroke Classifications
(ICD 10)
Inpatient admission & GRO mortality records with no previous history of CBV in the year to 31 March 2007
Total population
0 - 44 years
45 - 54 years
55 - 64 years
65 - 74 years
75 - 84 years
85+ years
SMR01 Database ISD 1,625 65 142 284 437 465 232GRO Mortality Records - Added to I63Total Cases 1,625 65 142 284 437 465 232Incidence 0.32 0.02 0.20 0.45 0.96 1.62 2.44
SMR01 Database ISD 782 46 75 103 184 231 143GRO Mortality Records - I61 127 7 10 19 23 40 28Total Cases 909 53 85 122 207 271 171Incidence 0.18 0.02 0.12 0.20 0.45 0.94 1.80
SMR01 Database ISD 416 36 24 66 93 136 61GRO Mortality Records - I62 50 1 1 3 8 14 23Total Cases 466 37 25 69 101 150 84Incidence 0.09 0.01 0.04 0.11 0.22 0.52 0.88
SMR01 Database ISD 3,440 129 240 475 830 1,143 623GRO Mortality Records - G45 7 1 6GRO Mortality Records - I63 95 0 3 6 10 25 51GRO Mortality Records - I69 554 1 0 8 38 195 312Total Cases 4,096 130 243 489 878 1,364 992Incidence 0.80 0.04 0.34 0.78 1.93 4.75 10.42
SMR01 Database ISD 2,432 59 129 271 548 831 594GRO Mortality Records - I64 900 2 7 16 72 316 487Total Cases 3,332 61 136 287 620 1,147 1,081Incidence 0.65 0.02 0.19 0.46 1.36 4.00 11.35
Events calculated from data collected Total population
0 - 44 years
45 - 54 years
55 - 64 years
65 - 74 years
75 - 84 years
85+ years
Incidence of TIA 0.32 0.02 0.20 0.45 0.96 1.62 2.44Incidence of Haemorrhagic Stroke 0.27 0.03 0.15 0.31 0.68 1.47 2.68Incidence of Cerebral Infarcts 1.45 0.06 0.53 1.24 3.29 8.75 21.77Incidence of First Ever Stroke 1.72 0.10 0.69 1.55 3.96 10.22 24.45Incidence of First Ever CBV Event 2.04 0.12 0.88 2.00 4.92 11.84 26.89
Predicted TIA's 1,625 65 142 284 437 465 232Predicted Haemorrhagic Strokes 1,375 90 110 191 308 421 255Predicted Ischaemic Strokes 7,428 191 379 776 1,498 2,511 2,073
% Haemorrhagic Stroke Deaths 12.9% 8.9% 10.0% 11.5% 10.1% 12.8% 20.0%% Ischaemic Stroke Deaths 20.9% 1.6% 2.6% 3.9% 8.0% 21.3% 41.0%
Number of TIA's Admitted 1,625 65 142 284 437 465 232Number of Haemorrhagic Admitted 1,198 82 99 169 277 367 204
5,879 188 369 746 1,378 1,975 1,223
Total Number of Admissions 8,702 335 610 1,199 2,092 2,807 1,659
G45 - Transient Ischaemic Attack
Number of Ischaemic Infarcts Admitted
I64 - Inconclusive
Stroke
Predicted number of first ever cerebrovascular events
% of first ever cerebrovascular events not admitted - death in the community
Number of patients admitted to Scottish hospitals in the year to 31 March 2007
I61 - Intracerebral Haemorrhage
I62 - Intracranial Haemorrhage
I63 - Cerebral Infarction
Source ISD19

54
Appendix 5.2 Survival rates for stroke and TIA after a first ever hospital admission for year ending 31 March 2007
Original admissions Total population
0 - 44 years
45 - 54 years
55 - 64 years
65 - 74 years
75 - 84 years
85+ years
Number of TIA's 1,625 65 142 284 437 465 232Number of haemorrhagic strokes 1,198 82 99 169 277 367 204Number of ischaemic strokes 5,879 188 369 746 1,378 1,975 1,223Total Admissions 8,702 335 610 1,199 2,092 2,807 1,659
TIA 1,600 65 140 282 435 456 222Survival rate 98.5% 100.0% 98.6% 99.3% 99.5% 98.1% 95.7%Haemorrhagic stroke 736 55 73 114 177 219 98Survival rate 61.4% 67.1% 73.7% 67.5% 63.9% 59.7% 48.0%Ischaemic strokes 4,918 177 344 705 1,227 1,635 830Survival rate 83.7% 94.1% 93.2% 94.5% 89.0% 82.8% 67.9%
Comparator Infarct Analysis - Known Deaths 961 11 25 41 151 340 393Comparator Infarct Analysis - Predicted Deaths 954 7 19 52 158 364 355
TIA 1,565 65 140 282 425 444 209Survival rate 96.3% 100.0% 98.6% 99.3% 97.3% 95.5% 90.1%Haemorrhagic stroke 661 54 71 108 161 194 73Survival rate 55.2% 65.9% 71.7% 63.9% 58.1% 52.9% 35.8%Ischaemic strokes 4,535 177 339 690 1,162 1,492 675Survival rate 77.1% 94.1% 91.9% 92.5% 84.3% 75.5% 55.2%
TIA 1,522 65 139 281 414 433 190Survival rate 93.7% 100.0% 97.9% 98.9% 94.7% 93.1% 81.9%Haemorrhagic stroke 624 53 69 105 157 175 65Survival rate 52.1% 64.6% 69.7% 62.1% 56.7% 47.7% 31.9%Ischaemic strokes 4,293 174 337 672 1,124 1,393 593Survival rate 73.0% 92.6% 91.3% 90.1% 81.6% 70.5% 48.5%
TIA 1,458 65 139 276 405 403 170Survival rate 89.7% 100.0% 97.9% 97.2% 92.7% 86.7% 73.3%Haemorrhagic stroke 591 53 69 102 150 160 57Survival rate 49.3% 64.6% 69.7% 60.4% 54.2% 43.6% 27.9%Ischaemic strokes 4,024 170 328 653 1,076 1,276 521Survival rate 68.4% 90.4% 88.9% 87.5% 78.1% 64.6% 42.6%
Outcome - Month 12 numbers survived
Outcome - Month 1 numbers survived
Outcome - Month 3 numbers survived
Outcome - Month 6 numbers survived
Source ISD19
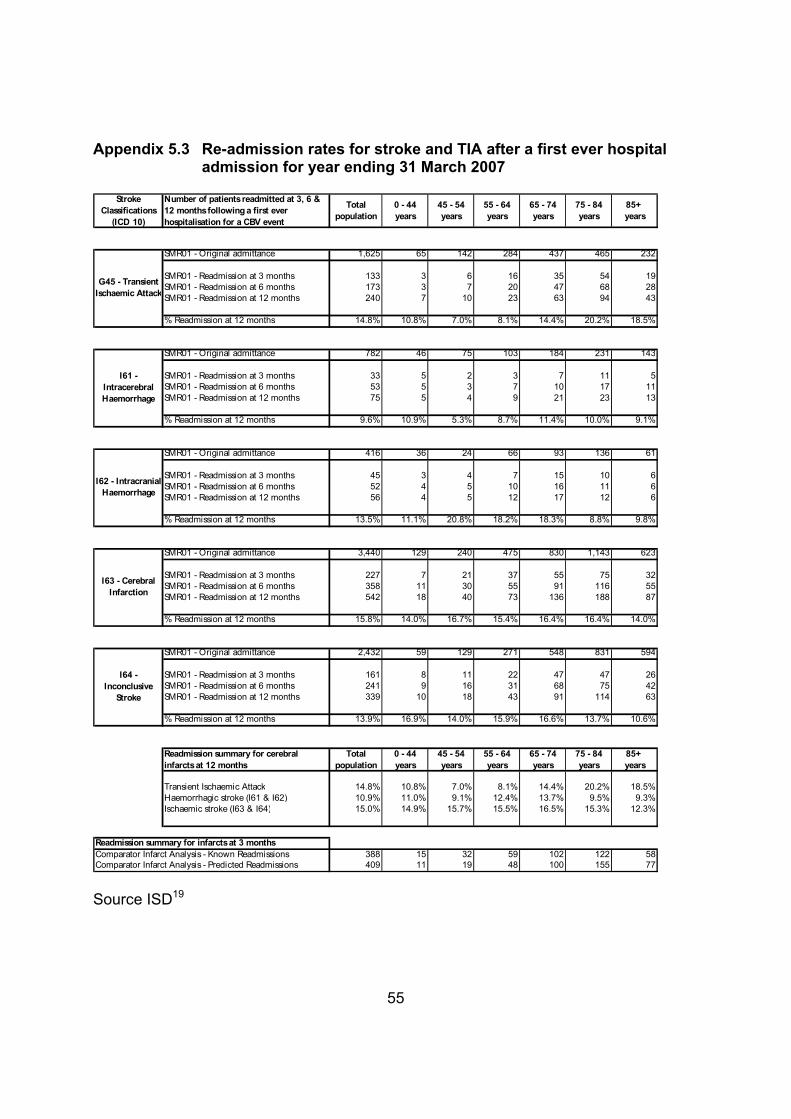
55
Appendix 5.3 Re-admission rates for stroke and TIA after a first ever hospital admission for year ending 31 March 2007
Stroke Classifications
(ICD 10)
Number of patients readmitted at 3, 6 & 12 months following a first ever hospitalisation for a CBV event
Total population
0 - 44 years
45 - 54 years
55 - 64 years
65 - 74 years
75 - 84 years
85+ years
SMR01 - Original admittance 1,625 65 142 284 437 465 232
SMR01 - Readmission at 3 months 133 3 6 16 35 54 19SMR01 - Readmission at 6 months 173 3 7 20 47 68 28SMR01 - Readmission at 12 months 240 7 10 23 63 94 43
% Readmission at 12 months 14.8% 10.8% 7.0% 8.1% 14.4% 20.2% 18.5%
SMR01 - Original admittance 782 46 75 103 184 231 143
SMR01 - Readmission at 3 months 33 5 2 3 7 11 5SMR01 - Readmission at 6 months 53 5 3 7 10 17 11SMR01 - Readmission at 12 months 75 5 4 9 21 23 13
% Readmission at 12 months 9.6% 10.9% 5.3% 8.7% 11.4% 10.0% 9.1%
SMR01 - Original admittance 416 36 24 66 93 136 61
SMR01 - Readmission at 3 months 45 3 4 7 15 10 6SMR01 - Readmission at 6 months 52 4 5 10 16 11 6SMR01 - Readmission at 12 months 56 4 5 12 17 12 6
% Readmission at 12 months 13.5% 11.1% 20.8% 18.2% 18.3% 8.8% 9.8%
SMR01 - Original admittance 3,440 129 240 475 830 1,143 623
SMR01 - Readmission at 3 months 227 7 21 37 55 75 32SMR01 - Readmission at 6 months 358 11 30 55 91 116 55SMR01 - Readmission at 12 months 542 18 40 73 136 188 87
% Readmission at 12 months 15.8% 14.0% 16.7% 15.4% 16.4% 16.4% 14.0%
SMR01 - Original admittance 2,432 59 129 271 548 831 594
SMR01 - Readmission at 3 months 161 8 11 22 47 47 26SMR01 - Readmission at 6 months 241 9 16 31 68 75 42SMR01 - Readmission at 12 months 339 10 18 43 91 114 63
% Readmission at 12 months 13.9% 16.9% 14.0% 15.9% 16.6% 13.7% 10.6%
Readmission summary for cerebral infarcts at 12 months
Total population
0 - 44 years
45 - 54 years
55 - 64 years
65 - 74 years
75 - 84 years
85+ years
Transient Ischaemic Attack 14.8% 10.8% 7.0% 8.1% 14.4% 20.2% 18.5%Haemorrhagic stroke (I61 & I62) 10.9% 11.0% 9.1% 12.4% 13.7% 9.5% 9.3%Ischaemic stroke (I63 & I64) 15.0% 14.9% 15.7% 15.5% 16.5% 15.3% 12.3%
388 15 32 59 102 122 58409 11 19 48 100 155 77Comparator Infarct Analysis - Predicted Readmissions
I62 - Intracranial Haemorrhage
I63 - Cerebral Infarction
I64 - Inconclusive
Stroke
Comparator Infarct Analysis - Known ReadmissionsReadmission summary for infarcts at 3 months
G45 - Transient Ischaemic Attack
I61 - Intracerebral Haemorrhage
Source ISD19

56
Appendix 5.4 Prior admission of patients who had a first ever admittance for stroke or TIA for year ending 31 March 2007
Stroke
Classifications (ICD 10)
Prior admissions identified for conditions likely to be contra indicated for thrombolysis & carotid surgery
Total population
0 - 44 years
45 - 54 years
55 - 64 years
65 - 74 years
75 - 84 years
85+ years
SMR01 - Original admittance 1,625 65 142 284 437 465 232
SMR01 - Liver Complications 12 1 1 2 3 5 0SMR01 - Type 1 Diabetes 35 0 5 8 15 5 2SMR01 - Type 2 Diabetes 206 4 12 30 68 71 21
% Total Complications Admitted 15.6% 7.7% 12.7% 14.1% 19.7% 17.4% 9.9%
SMR01 - Original admittance 782 46 75 103 184 231 143
SMR01 - Liver Complications 31 5 10 10 5 1 0SMR01 - Type 1 Diabetes 10 0 4 2 2 2 0SMR01 - Type 2 Diabetes 66 1 8 10 18 23 6
% Total Complications Admitted 13.7% 13.0% 29.3% 21.4% 13.6% 11.3% 4.2%
SMR01 - Original admittance 416 36 24 66 93 136 61
SMR01 - Liver Complications 11 2 4 4 0 1 0SMR01 - Type 1 Diabetes 4 0 0 0 1 3 0SMR01 - Type 2 Diabetes 38 0 1 5 10 19 3
% Total Complications Admitted 12.7% 5.6% 20.8% 13.6% 11.8% 16.9% 4.9%
SMR01 - Original admittance 3,440 129 240 475 830 1,143 623
SMR01 - Liver Complications 35 1 5 13 11 4 1SMR01 - Type 1 Diabetes 93 3 7 18 35 22 8SMR01 - Type 2 Diabetes 475 7 26 63 138 172 69
% Total Complications Admitted 17.5% 8.5% 15.8% 19.8% 22.2% 17.3% 12.5%
SMR01 - Original admittance 2,432 59 129 271 548 831 594
SMR01 - Liver Complications 34 1 6 6 13 6 2SMR01 - Type 1 Diabetes 63 5 5 9 21 18 5SMR01 - Type 2 Diabetes 335 4 18 36 104 125 48
% Total Complications Admitted 17.8% 16.9% 22.5% 18.8% 25.2% 17.9% 9.3%
Complications summary by CBV event Total population
0 - 44 years
45 - 54 years
55 - 64 years
65 - 74 years
75 - 84 years
85+ years
Transient Ischaemic Attack 15.6% 7.7% 12.7% 14.1% 19.7% 17.4% 9.9%Haemorrhagic Stroke 13.4% 9.8% 27.3% 18.3% 13.0% 13.4% 4.4%Cerebral Infarcts 17.6% 11.2% 18.2% 19.4% 23.4% 17.6% 10.9%
Complications summary by intervention Total population
0 - 44 years
45 - 54 years
55 - 64 years
65 - 74 years
75 - 84 years
85+ years
Contraindicated for Thrombolysis 3.8% 5.3% 6.2% 6.2% 5.8% 2.5% 1.3%Possible contraindications for carotid surgery 13.6% 5.9% 11.0% 12.5% 17.1% 15.1% 9.5%
I64 - Inconclusive
Stroke
G45 - Transient Ischaemic Attack
I61 - Intracerebral Haemorrhage
I62 - Intracranial Haemorrhage
I63 - Cerebral Infarction
Source ISD19

57
Appendix 5.5 Incidence of stroke and TIA resulting in a first ever hospital admission by NHS board for year ending 31 March 2007
Stroke Event 0 - 44 years
45 - 54 years
55 - 64 years
65 - 74 years
75 - 84 years
85+ years
Total population
G45 Transient Ischaemic Attack 65 142 284 437 465 232 1,625Total ICH 90 110 191 308 421 255 1,375Total Infarcts 191 379 776 1,498 2,511 2,073 7,428Total Number of Stokes 281 489 967 1,806 2,932 2,328 8,803Total CBV Events 346 631 1,251 2,243 3,397 2,560 10,428
Stoke Event 0 - 44 years
45 - 54 years
55 - 64 years
65 - 74 years
75 - 84 years
85+ years
Total population
G45 Transient Ischaemic Attack 0.02 0.20 0.45 0.96 1.62 2.44 0.32Total ICH 0.03 0.15 0.31 0.68 1.47 2.68 0.27Total Infarcts 0.06 0.53 1.24 3.29 8.75 21.77 1.45Total Number of Stokes 0.10 0.69 1.55 3.96 10.22 24.45 1.72Total CBV Events 0.12 0.88 2.00 4.92 11.84 26.89 2.04
Population Ranking Health Board 0 - 44
years45 - 54 years
55 - 64 years
65 - 74 years
75 - 84 years
85+ years
Total population
Comparator Scotland 0.10 0.69 1.55 3.96 10.22 24.45 1.721 Greater Glasgow & Clyde 0.12 0.90 1.76 4.46 10.05 25.52 1.752 Lothian 0.06 0.58 1.58 3.50 10.20 23.92 1.523 Lanarkshire 0.09 0.78 1.68 4.32 10.72 27.06 1.684 Grampian 0.11 0.70 1.20 3.66 9.76 24.63 1.615 Tayside 0.12 0.50 1.76 4.07 10.04 23.59 1.966 Ayr 0.12 0.60 1.88 3.58 11.35 25.14 1.95
Population Ranking Health Board 0 - 44
years45 - 54 years
55 - 64 years
65 - 74 years
75 - 84 years
85+ years
Total population
Comparator Scotland 0.10 0.69 1.55 3.96 10.22 24.45 1.727 Fife 0.08 0.57 1.28 4.27 10.63 21.49 1.718 Highlands 0.07 0.55 1.27 3.86 9.84 22.97 1.789 Forth Valley 0.10 0.74 1.41 3.79 10.43 24.22 1.6310 Dumfries 0.07 0.42 1.63 3.64 10.27 23.12 1.9911 Borders 0.09 0.74 1.15 3.83 8.74 27.04 1.9012 Islands 0.08 0.30 0.73 2.54 8.89 20.79 1.46
Health Board Analysis of Contribution to First Ever Stroke Incidence
Health Board Analysis of Contribution to First Ever Stroke Incidence
Age Analysis of First Ever in a lifetime Stroke - Number of Cases
Age Analysis of First Ever in a lifetime Stroke - Incidence per 1000 of the Population
Source ISD19

58
Appendix 5.6 Predicted mortality for patients with first admission of ischaemic stroke for year ending 31 March 2007
Original Admissions Total population
0 - 44 years
45 - 54 years
55 - 64 years
65 - 74 years
75 - 84 years
85+ years
Number of FES - TIA's Admitted 1,625 65 142 284 437 465 232Number of FES - Haemorrhagic Admitted 1,198 82 99 169 277 367 204Number of FES - Infarcts Admitted 5,879 188 369 746 1,378 1,975 1,223Total Admissions 8,702 335 610 1,199 2,092 2,807 1,659
Cryptogenic Stroke - Not Included 5% 40% 20% 10% 5% 0% 0%Cryptogenic Stroke - Patients Excluded 293 75 74 75 69 0 0
Clinically Identifiable Subtypes of Cerebral Infarction
Total population
0 - 44 years
45 - 54 years
55 - 64 years
65 - 74 years
75 - 84 years
85+ years
LACI - Lacunar Infarcts 25% 5% 35% 25% 25% 24% 25%TACI - Total Anterior Circulation Infarcts 17% 5% 10% 15% 15% 17% 25%PACI - Partial Anterior Circulation Infarcts 34% 85% 40% 35% 35% 34% 25%POCI - Posterior Circulation Infracts 24% 5% 15% 25% 25% 25% 25%
Subtotal 100% 100% 100% 100% 100% 100%Outcome of Infarct Analysis
LACI - Lacunar Infarcts 1,384 6 103 168 327 474 306TACI - Total Anterior Circulation Infarcts 975 6 30 101 196 336 306PACI - Partial Anterior Circulation Infarcts 1,885 96 118 235 458 672 306POCI - Posterior Circulation Infracts 1,345 6 44 167 327 495 306
Total Infarcts excluding Cryptogenic Stroke 5,589 114 295 671 1,308 1,977 1,224
Clinically Identifiable Subtypes of Cerebral Infarction
Total population
0 - 44 years
45 - 54 years
55 - 64 years
65 - 74 years
75 - 84 years
85+ years
LACI - Lacunar Infarcts 4% 2% 2% 2% 4% 4% 8%TACI - Total Anterior Circulation Infarcts 50% 25% 25% 25% 25% 60% 65%PACI - Partial Anterior Circulation Infarcts 11% 5% 5% 5% 11% 11% 22%POCI - Posterior Circulation Infracts 14% 7% 7% 7% 14% 14% 21%Application of OCSP Mortality Rate at 6 Months - Applied in Scotland in the First 30 Days of AdmissionLACI - Lacunar Infarcts 62 0 2 3 13 19 24TACI - Total Anterior Circulation Infarcts 484 2 8 25 49 202 199PACI - Partial Anterior Circulation Infarcts 214 5 6 12 50 74 67POCI - Posterior Circulation Infracts 195 0 3 12 46 69 64
Predicted No of Deaths in the First Month 954 7 19 52 158 364 355Known No of Deaths in the First Month 961 11 25 41 151 340 393
Number of Infarction Subtypes Survived at 1 Month
Total population
0 - 44 years
45 - 54 years
55 - 64 years
65 - 74 years
75 - 84 years
85+ years
LACI - Lacunar Infarcts 1,322 6 101 165 314 455 282TACI - Total Anterior Circulation Infarcts 491 5 23 76 147 134 107PACI - Partial Anterior Circulation Infarcts 1,671 91 112 223 408 598 239POCI - Posterior Circulation Infracts 1,150 6 41 155 281 426 242Application of OSCP Recurrent Stroke Rates LACI - Lacunar Infarcts 2% 1% 1% 1% 2% 2% 2%TACI - Total Anterior Circulation Infarcts 4% 2% 2% 2% 4% 4% 4%PACI - Partial Anterior Circulation Infarcts 14% 11% 12% 13% 14% 15% 16%POCI - Posterior Circulation Infracts 11% 8% 9% 10% 11% 12% 12%Predicted Number of Patients to be readmitted as a result of Recurrent StrokeLACI - Lacunar Infarcts 24 0 1 2 6 9 6TACI - Total Anterior Circulation Infarcts 18 0 0 2 6 5 4PACI - Partial Anterior Circulation Infarcts 237 10 13 29 57 90 38POCI - Posterior Circulation Infracts 131 0 4 16 31 51 29Predicted Readmissions at 3 Months 409 11 19 48 100 155 77Known Readmissions at 3 Months 388 15 32 59 102 122 58
Predictive Outcome Model (Adapted from OCSP 1986) - Identifying the Four Subtypes of Infarction
Predictive Outcome Model (Adapted from OCSP 1986) - 30 Day Mortality
Predictive Outcome Model (Adapted from OCSP 1986) - Recurrent Strokes Readmitted in the First 3 Months

59
Appendix 5.7 Predicted mortality and disability for patients with first admission of ischaemic stroke for year ending 31 March 2007
Original Admissions Total population
0 - 44 years
45 - 54 years
55 - 64 years
65 - 74 years
75 - 84 years
85+ years
Number of FES - TIA's Admitted 1,625 65 142 284 437 465 232Number of FES - Haemorrhagic Admitted 1,198 82 99 169 277 367 204Number of FES - Infarcts Admitted 5,879 188 369 746 1,378 1,975 1,223Total Admissions 8,702 335 610 1,199 2,092 2,807 1,659
Cryptogenic Stroke - Not Included 5% 40% 20% 10% 5% 0% 0%Cryptogenic Stroke - Patients Excluded 293 75 74 75 69 0 0
Clinically Identifiable Subtypes of Cerebral Infarction
Total population
0 - 44 years
45 - 54 years
55 - 64 years
65 - 74 years
75 - 84 years
85+ years
LACI - Lacunar Infarcts 25% 5% 35% 25% 25% 24% 25%TACI - Total Anterior Circulation Infarcts 17% 5% 10% 15% 15% 17% 25%PACI - Partial Anterior Circulation Infarcts 34% 85% 40% 35% 35% 34% 25%POCI - Posterior Circulation Infracts 24% 5% 15% 25% 25% 25% 25%
Subtotal 100% 100% 100% 100% 100% 100%Outcome of Infarct Analysis
LACI - Lacunar Infarcts 1,384 6 103 168 327 474 306TACI - Total Anterior Circulation Infarcts 975 6 30 101 196 336 306PACI - Partial Anterior Circulation Infarcts 1,885 96 118 235 458 672 306POCI - Posterior Circulation Infracts 1,345 6 44 167 327 495 306
Total Infarcts excluding Cryptogenic Stroke 5,589 114 295 671 1,308 1,977 1,224
Clinically Identifiable Subtypes of Cerebral Infarction
Total population
0 - 44 years
45 - 54 years
55 - 64 years
65 - 74 years
75 - 84 years
85+ years
LACI - Lacunar Infarcts 4% 2% 2% 2% 4% 4% 8%TACI - Total Anterior Circulation Infarcts 50% 25% 25% 25% 25% 60% 65%PACI - Partial Anterior Circulation Infarcts 11% 5% 5% 5% 11% 11% 22%POCI - Posterior Circulation Infracts 14% 7% 7% 7% 14% 14% 21%
LACI - Lacunar Infarcts 34% 20% 20% 30% 35% 35% 40%TACI - Total Anterior Circulation Infarcts 45% 30% 40% 50% 70% 40% 35%PACI - Partial Anterior Circulation Infarcts 33% 20% 20% 25% 30% 40% 40%POCI - Posterior Circulation Infracts 24% 10% 10% 15% 25% 25% 30%
LACI - Lacunar Infarcts 61% 78% 78% 68% 61% 61% 52%TACI - Total Anterior Circulation Infarcts 5% 45% 35% 25% 5% 0% 0%PACI - Partial Anterior Circulation Infarcts 55% 75% 75% 70% 59% 49% 38%POCI - Posterior Circulation Infracts 61% 83% 83% 78% 61% 61% 49%Total Allocation between Infarct Groups 100% 100% 100% 100% 100% 100% 100%
Number of Infarction Subtypes having an mRS of between 0 and 2
Total population
0 - 44 years
45 - 54 years
55 - 64 years
65 - 74 years
75 - 84 years
85+ years
LACI - Lacunar Infarcts 846 5 80 114 199 289 159TACI - Total Anterior Circulation Infarcts 48 3 11 25 10 0 0PACI - Partial Anterior Circulation Infarcts 1,041 72 89 165 270 329 116POCI - Posterior Circulation Infracts 823 5 37 130 199 302 150Total Allocation between Infarct Groups 2,758 85 216 434 678 920 425
Number of Infarction Subtypes having an mRS of between 3 and 5
Total population
0 - 44 years
45 - 54 years
55 - 64 years
65 - 74 years
75 - 84 years
85+ years
LACI - Lacunar Infarcts 475 1 21 50 114 166 122TACI - Total Anterior Circulation Infarcts 443 2 12 51 137 134 107PACI - Partial Anterior Circulation Infarcts 630 19 24 59 137 269 122POCI - Posterior Circulation Infracts 327 1 4 25 82 124 92Total Allocation between Infarct Groups 1,875 23 61 185 471 693 444
Dependency RatioTotal
population0 - 44 years
45 - 54 years
55 - 64 years
65 - 74 years
75 - 84 years
85+ years
Totals for Scotland 40% 21% 22% 30% 41% 43% 51%
Predictive Outcome Model (Adapted from OCSP 1986) - Age Related Ratio between Dependency & Independency
Application of OCSP Disability Rates at 30 Days - mRS of between 0 and 2
Predictive Outcome Model (Adapted from OCSP 1986) - Identifying Disability in the Four Subtypes of Infarction
Predictive Outcome Model (Adapted from OCSP 1986) - Death & Disability Rates at 30 Days
Predictive Outcome Model (Adapted from OCSP 1986) - Allocation Split of Dependence at 30 Days
Mortality Rate Detailed in Infarct Analysis & Readmission
Application of OCSP Disability Rates at 30 Days - mRS of between 3 and 5
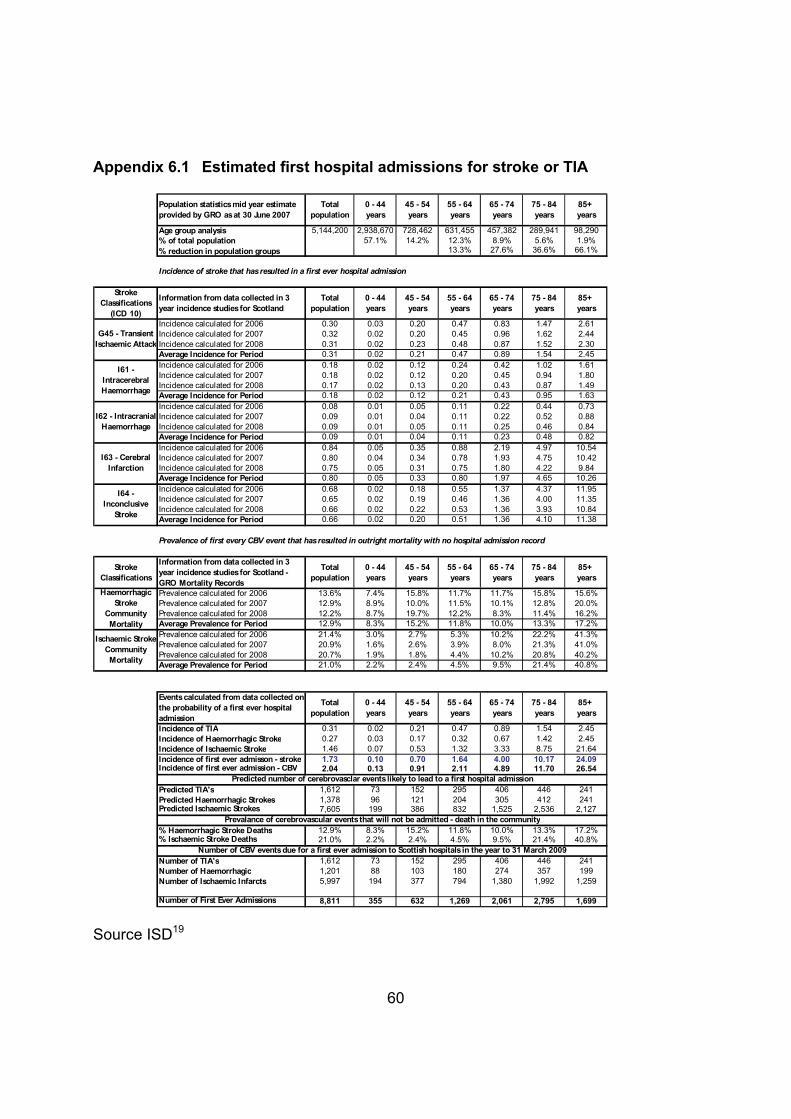
60
Appendix 6.1 Estimated first hospital admissions for stroke or TIA
Population statistics mid year estimate provided by GRO as at 30 June 2007
Total population
0 - 44 years
45 - 54 years
55 - 64 years
65 - 74 years
75 - 84 years
85+ years
Age group analysis 5,144,200 2,938,670 728,462 631,455 457,382 289,941 98,290% of total population 57.1% 14.2% 12.3% 8.9% 5.6% 1.9%% reduction in population groups 13.3% 27.6% 36.6% 66.1%
Incidence of stroke that has resulted in a first ever hospital admission
Stroke Classifications
(ICD 10)
Information from data collected in 3 year incidence studies for Scotland
Total population
0 - 44 years
45 - 54 years
55 - 64 years
65 - 74 years
75 - 84 years
85+ years
Incidence calculated for 2006 0.30 0.03 0.20 0.47 0.83 1.47 2.61Incidence calculated for 2007 0.32 0.02 0.20 0.45 0.96 1.62 2.44Incidence calculated for 2008 0.31 0.02 0.23 0.48 0.87 1.52 2.30Average Incidence for Period 0.31 0.02 0.21 0.47 0.89 1.54 2.45Incidence calculated for 2006 0.18 0.02 0.12 0.24 0.42 1.02 1.61Incidence calculated for 2007 0.18 0.02 0.12 0.20 0.45 0.94 1.80Incidence calculated for 2008 0.17 0.02 0.13 0.20 0.43 0.87 1.49Average Incidence for Period 0.18 0.02 0.12 0.21 0.43 0.95 1.63Incidence calculated for 2006 0.08 0.01 0.05 0.11 0.22 0.44 0.73Incidence calculated for 2007 0.09 0.01 0.04 0.11 0.22 0.52 0.88Incidence calculated for 2008 0.09 0.01 0.05 0.11 0.25 0.46 0.84Average Incidence for Period 0.09 0.01 0.04 0.11 0.23 0.48 0.82Incidence calculated for 2006 0.84 0.05 0.35 0.88 2.19 4.97 10.54Incidence calculated for 2007 0.80 0.04 0.34 0.78 1.93 4.75 10.42Incidence calculated for 2008 0.75 0.05 0.31 0.75 1.80 4.22 9.84Average Incidence for Period 0.80 0.05 0.33 0.80 1.97 4.65 10.26Incidence calculated for 2006 0.68 0.02 0.18 0.55 1.37 4.37 11.95Incidence calculated for 2007 0.65 0.02 0.19 0.46 1.36 4.00 11.35Incidence calculated for 2008 0.66 0.02 0.22 0.53 1.36 3.93 10.84Average Incidence for Period 0.66 0.02 0.20 0.51 1.36 4.10 11.38
Prevalence of first every CBV event that has resulted in outright mortality with no hospital admission record
Stroke Classifications
Information from data collected in 3 year incidence studies for Scotland - GRO Mortality Records
Total population
0 - 44 years
45 - 54 years
55 - 64 years
65 - 74 years
75 - 84 years
85+ years
Prevalence calculated for 2006 13.6% 7.4% 15.8% 11.7% 11.7% 15.8% 15.6%Prevalence calculated for 2007 12.9% 8.9% 10.0% 11.5% 10.1% 12.8% 20.0%Prevalence calculated for 2008 12.2% 8.7% 19.7% 12.2% 8.3% 11.4% 16.2%Average Prevalence for Period 12.9% 8.3% 15.2% 11.8% 10.0% 13.3% 17.2%Prevalence calculated for 2006 21.4% 3.0% 2.7% 5.3% 10.2% 22.2% 41.3%Prevalence calculated for 2007 20.9% 1.6% 2.6% 3.9% 8.0% 21.3% 41.0%Prevalence calculated for 2008 20.7% 1.9% 1.8% 4.4% 10.2% 20.8% 40.2%Average Prevalence for Period 21.0% 2.2% 2.4% 4.5% 9.5% 21.4% 40.8%
Events calculated from data collected on the probability of a first ever hospital admission
Total population
0 - 44 years
45 - 54 years
55 - 64 years
65 - 74 years
75 - 84 years
85+ years
Incidence of TIA 0.31 0.02 0.21 0.47 0.89 1.54 2.45Incidence of Haemorrhagic Stroke 0.27 0.03 0.17 0.32 0.67 1.42 2.45Incidence of Ischaemic Stroke 1.46 0.07 0.53 1.32 3.33 8.75 21.64Incidence of first ever admisson - stroke 1.73 0.10 0.70 1.64 4.00 10.17 24.09Incidence of first ever admission - CBV 2.04 0.13 0.91 2.11 4.89 11.70 26.54
Predicted TIA's 1,612 73 152 295 406 446 241Predicted Haemorrhagic Strokes 1,378 96 121 204 305 412 241Predicted Ischaemic Strokes 7,605 199 386 832 1,525 2,536 2,127
% Haemorrhagic Stroke Deaths 12.9% 8.3% 15.2% 11.8% 10.0% 13.3% 17.2%% Ischaemic Stroke Deaths 21.0% 2.2% 2.4% 4.5% 9.5% 21.4% 40.8%
Number of TIA's 1,612 73 152 295 406 446 241Number of Haemorrhagic 1,201 88 103 180 274 357 199Number of Ischaemic Infarcts 5,997 194 377 794 1,380 1,992 1,259
Number of First Ever Admissions 8,811 355 632 1,269 2,061 2,795 1,699
I61 - Intracerebral Haemorrhage
I62 - Intracranial Haemorrhage
I63 - Cerebral Infarction
I64 - Inconclusive
Stroke
Predicted number of cerebrovasclar events likely to lead to a first hospital admission
Prevalance of cerebrovascular events that will not be admitted - death in the community
Number of CBV events due for a first ever admission to Scottish hospitals in the year to 31 March 2009
Haemorrhagic Stroke
Community Mortality
Ischaemic Stroke Community Mortality
G45 - Transient Ischaemic Attack
Source ISD19

61
Appendix 6.2 Estimated survival rates for patients following a first admission to hospital for stroke or TIA
Predicted first ever hospital admissions as a result of stroke or CBV event
Total population
0 - 44 years
45 - 54 years
55 - 64 years
65 - 74 years
75 - 84 years
85+ years
Number of FES - TIA's 1,612 73 152 295 406 446 241Number of FES - Haemorrhagic 1,201 88 103 180 274 357 199Number of FES - Infarcts 5,997 194 377 794 1,380 1,992 1,259Total Admissions 8,811 355 632 1,269 2,061 2,795 1,699
Stroke Classifications
Average survial rates following a first ever admisson for stroke or TIA outcome at 1 month
Total population
0 - 44 years
45 - 54 years
55 - 64 years
65 - 74 years
75 - 84 years
85+ years
Survival rates in 2006 99.9% 98.8% 100.0% 100.0% 100.0% 100.0% 100.0%Survival rates in 2007 98.5% 100.0% 98.6% 99.3% 99.5% 98.1% 95.7%Survival rates in 2008 98.3% 100.0% 100.0% 99.0% 98.0% 98.4% 96.0%Average contribution for period 98.9% 99.6% 99.5% 99.4% 99.2% 98.8% 97.2%Survival rates in 2006 64.3% 79.5% 70.3% 73.5% 68.5% 57.8% 50.3%Survival rates in 2007 61.4% 67.1% 73.7% 67.5% 63.9% 59.7% 48.0%Survival rates in 2008 65.0% 86.3% 63.7% 74.6% 65.6% 61.2% 52.1%Average contribution for period 63.6% 77.6% 69.3% 71.9% 66.0% 59.6% 50.1%Survival rates in 2006 84.0% 95.8% 94.2% 94.2% 89.5% 81.1% 70.3%Survival rates in 2007 83.7% 94.1% 93.2% 94.5% 89.0% 82.8% 67.9%Survival rates in 2008 83.5% 95.1% 94.7% 93.3% 88.3% 80.9% 70.7%Average contribution for period 83.7% 95.0% 94.0% 94.0% 88.9% 81.6% 69.6%
Predicted number of first ever admissons as a result of stroke or TIA event likely to survive at 1 month
Total population
0 - 44 years
45 - 54 years
55 - 64 years
65 - 74 years
75 - 84 years
85+ years
Number of FES - TIA's 1,595 72 151 293 403 441 234Number of FES - Haemorrhagic 762 69 71 129 181 213 100Number of FES - Infarcts 5,015 185 354 747 1,228 1,625 877Total numbers survived at 1 month 7,372 326 577 1,169 1,811 2,278 1,211Number of FES - TIA's 18 0 1 2 3 5 7Number of FES - Haemorrhagic 439 20 32 51 93 144 99Number of FES - Infarcts 982 10 22 48 153 367 383Total mortality at 1 month 1,439 30 55 100 249 516 489
Total rate of mortality at 1 month 16.3% 8.4% 8.7% 7.9% 12.1% 18.5% 28.8%
Stroke Classifications
Average survial rates following a first ever admisson for stroke or TIA outcome at 1 year
Total population
0 - 44 years
45 - 54 years
55 - 64 years
65 - 74 years
75 - 84 years
85+ years
Survival rates in 2006 89.8% 98.8% 96.4% 96.5% 93.1% 87.9% 73.0%Survival rates in 2007 89.7% 100.0% 97.9% 97.2% 92.7% 86.7% 73.3%Survival rates in 2008 92.5% 100.0% 98.2% 97.7% 95.0% 88.5% 82.3%Average contribution for period 90.7% 99.6% 97.5% 97.1% 93.6% 87.7% 76.2%Survival rates in 2006 52.2% 77.3% 67.3% 62.4% 57.6% 42.2% 32.4%Survival rates in 2007 49.3% 64.6% 69.7% 60.4% 54.2% 43.6% 27.9%Survival rates in 2008 54.1% 77.9% 54.9% 68.8% 56.6% 47.8% 36.5%Average contribution for period 51.9% 73.3% 64.0% 63.9% 56.1% 44.5% 32.3%Survival rates in 2006 68.2% 92.2% 91.7% 87.5% 78.4% 63.3% 40.2%Survival rates in 2007 68.4% 90.4% 88.9% 87.5% 78.1% 64.6% 42.6%Survival rates in 2008 70.9% 93.6% 92.1% 87.6% 80.0% 65.1% 49.1%Average contribution for period 69.2% 92.1% 90.9% 87.5% 78.9% 64.3% 44.0%
Predicted number of first ever admissons as a result of stroke or TIA event likely to survive at 1 year
Total population
0 - 44 years
45 - 54 years
55 - 64 years
65 - 74 years
75 - 84 years
85+ years
Number of FES - TIA's 1,462 72 148 286 380 391 183Number of FES - Haemorrhagic 622 65 66 115 154 159 64Number of FES - Infarcts 4,140 179 343 695 1,088 1,281 554Total numbers survived at 1 year 6,224 316 557 1,096 1,622 1,831 801Number of FES - TIA's 151 0 4 8 26 55 57Number of FES - Haemorrhagic 579 24 37 65 120 198 135Number of FES - Infarcts 1,857 15 34 99 292 711 706Total mortality at 1 year 2,587 39 75 172 438 964 898
Total rate of mortality at 1 year 29.4% 11.1% 11.9% 13.6% 21.3% 34.5% 52.8%
Haemorrhagic Stroke
Ischaemic Stroke
Transient Ischaemic Attack
Haemorrhagic Stroke
Ischaemic Stroke
Transient Ischaemic Attack

62
Appendix 6.3 Estimated re-admission rates for patients following a first admission to hospital for stroke or TIA
Predicted first ever hospital admissions as a result of stroke or CBV event
Total population
0 - 44 years
45 - 54 years
55 - 64 years
65 - 74 years
75 - 84 years
85+ years
Number of FES - TIA's 1,612 73 152 295 406 446 241Number of FES - Haemorrhagic 1,201 88 103 180 274 357 199Number of FES - Infarcts 5,997 194 377 794 1,380 1,992 1,259Total Admissions 8,811 355 632 1,269 2,061 2,795 1,699Incidence of First Ever Stroke with No Previous Admission History b/fwd from Incidence Summary
Stroke Classifications
Annual readmission rates calculated from first ever stroke presentations
Total population
0 - 44 years
45 - 54 years
55 - 64 years
65 - 74 years
75 - 84 years
85+ years
Readmission rate for 2005 15.9% 15.4% 15.2% 17.8% 13.8% 16.5% 16.7%Readmission rate for 2006 16.3% 3.6% 15.2% 15.3% 16.1% 18.3% 19.4%Readmission rate for 2007 14.8% 10.8% 7.0% 8.1% 14.4% 20.2% 18.5%Average readmission rate - current year 15.6% 9.9% 12.5% 13.7% 14.8% 18.4% 18.2%Readmission rate for 2005 10.6% 19.0% 13.6% 13.2% 11.4% 8.9% 4.2%Readmission rate for 2006 11.8% 15.9% 14.9% 15.3% 8.9% 10.3% 11.2%Readmission rate for 2007 10.9% 11.0% 9.1% 12.4% 13.7% 9.5% 9.3%Average readmission rate - current year 11.1% 15.3% 12.5% 13.7% 11.4% 9.6% 8.2%Readmission rate for 2005 16.3% 19.1% 20.6% 18.0% 17.4% 16.5% 11.8%Readmission rate for 2006 15.8% 19.3% 17.2% 15.9% 18.1% 15.3% 12.7%Readmission rate for 2007 15.0% 14.9% 15.7% 15.5% 16.5% 15.3% 12.3%Average readmission rate - current year 15.7% 17.8% 17.8% 16.5% 17.3% 15.7% 12.3%
Predicted Additional Admissions from Recurrent Stroke in the Current Year
Total population
0 - 44 years
45 - 54 years
55 - 64 years
65 - 74 years
75 - 84 years
85+ years
Number of FES - TIA's 252 7 19 41 60 82 44Number of FES - Haemorrhagic 133 13 13 25 31 34 16Number of FES - Infarcts 940 35 67 131 239 313 155Total Admissions 1,325 55 99 196 330 429 215
Stroke Classifications
Annual readmission rates calculated from total admissions & first ever stroke presentations
First ever event
Recurrent events
Total events
Total actual admissions
Recurrent event from
a prior year
% Additional recurrence
Readmission rate for 2005 1,557 247 1,804 2,040 236 15.2%Readmission rate for 2006 1,545 252 1,797 2,011 214 13.9%Readmission rate for 2007 1,625 240 1,865 2,061 196 12.1%Average readmission from prior years 1,576 246 1,822 2,037 215 13.7%Readmission rate for 2005 1,185 126 1,311 1,544 233 19.7%Readmission rate for 2006 1,165 137 1,302 1,498 196 16.8%Readmission rate for 2007 1,198 131 1,329 1,561 232 19.4%Average readmission from prior years 1,183 131 1,314 1,534 220 18.6%Readmission rate for 2005 6,334 1,033 7,367 8,706 1,339 21.1%Readmission rate for 2006 6,112 965 7,077 8,339 1,262 20.6%Readmission rate for 2007 5,879 881 6,760 8,198 1,438 24.5%Average readmission from prior years 6,108 960 7,068 8,414 1,346 22.1%
Average readmission rates for stroke and TIA from prior years
Total population
0 - 44 years
45 - 54 years
55 - 64 years
65 - 74 years
75 - 84 years
85+ years
Transient Ischaemic Attack 13.7% 8.7% 10.9% 12.0% 12.9% 16.1% 15.9%Haemorrhagic Stroke 18.6% 25.6% 21.0% 22.9% 19.1% 16.0% 13.8%Ischaemic Stroke 22.1% 25.0% 25.1% 23.2% 24.4% 22.1% 17.3%
Predicted additional admissions from recurrent stroke from prior years
Total population
0 - 44 years
45 - 54 years
55 - 64 years
65 - 74 years
75 - 84 years
85+ years
Number of FES - TIA's 220 6 17 35 52 72 38Number of FES - Haemorrhagic 222 23 22 41 52 57 27Number of FES - Infarcts 1,321 49 95 184 336 440 217Total Admissions 1,763 78 134 260 440 569 282
Ischaemic Stroke
Transient Ischaemic Attack
Haemorrhagic Stroke
Ischaemic Stroke
Transient Ischaemic Attack
Haemorrhagic Stroke
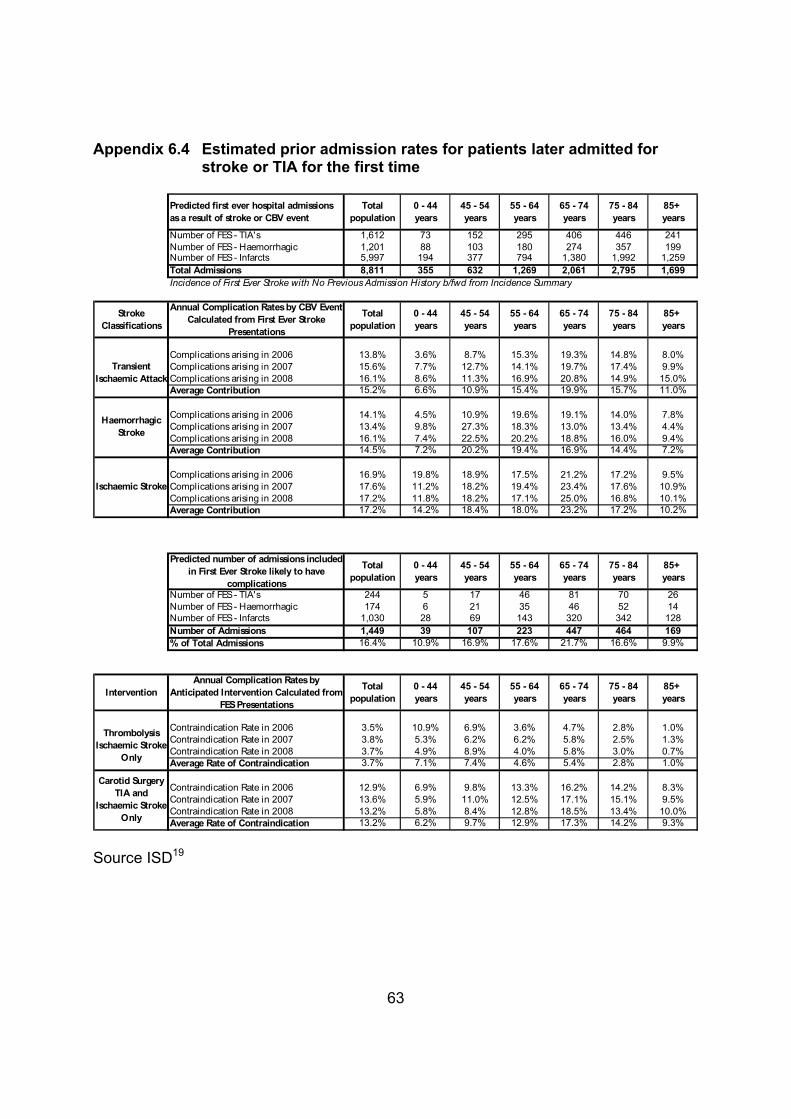
63
Appendix 6.4 Estimated prior admission rates for patients later admitted for stroke or TIA for the first time
Predicted first ever hospital admissions as a result of stroke or CBV event
Total population
0 - 44 years
45 - 54 years
55 - 64 years
65 - 74 years
75 - 84 years
85+ years
Number of FES - TIA's 1,612 73 152 295 406 446 241Number of FES - Haemorrhagic 1,201 88 103 180 274 357 199Number of FES - Infarcts 5,997 194 377 794 1,380 1,992 1,259Total Admissions 8,811 355 632 1,269 2,061 2,795 1,699Incidence of First Ever Stroke with No Previous Admission History b/fwd from Incidence Summary
Stroke Classifications
Annual Complication Rates by CBV Event Calculated from First Ever Stroke
Presentations
Total population
0 - 44 years
45 - 54 years
55 - 64 years
65 - 74 years
75 - 84 years
85+ years
Complications arising in 2006 13.8% 3.6% 8.7% 15.3% 19.3% 14.8% 8.0%Complications arising in 2007 15.6% 7.7% 12.7% 14.1% 19.7% 17.4% 9.9%Complications arising in 2008 16.1% 8.6% 11.3% 16.9% 20.8% 14.9% 15.0%Average Contribution 15.2% 6.6% 10.9% 15.4% 19.9% 15.7% 11.0%
Complications arising in 2006 14.1% 4.5% 10.9% 19.6% 19.1% 14.0% 7.8%Complications arising in 2007 13.4% 9.8% 27.3% 18.3% 13.0% 13.4% 4.4%Complications arising in 2008 16.1% 7.4% 22.5% 20.2% 18.8% 16.0% 9.4%Average Contribution 14.5% 7.2% 20.2% 19.4% 16.9% 14.4% 7.2%
Complications arising in 2006 16.9% 19.8% 18.9% 17.5% 21.2% 17.2% 9.5%Complications arising in 2007 17.6% 11.2% 18.2% 19.4% 23.4% 17.6% 10.9%Complications arising in 2008 17.2% 11.8% 18.2% 17.1% 25.0% 16.8% 10.1%Average Contribution 17.2% 14.2% 18.4% 18.0% 23.2% 17.2% 10.2%
Predicted number of admissions included in First Ever Stroke likely to have
complications
Total population
0 - 44 years
45 - 54 years
55 - 64 years
65 - 74 years
75 - 84 years
85+ years
Number of FES - TIA's 244 5 17 46 81 70 26Number of FES - Haemorrhagic 174 6 21 35 46 52 14Number of FES - Infarcts 1,030 28 69 143 320 342 128Number of Admissions 1,449 39 107 223 447 464 169% of Total Admissions 16.4% 10.9% 16.9% 17.6% 21.7% 16.6% 9.9%
InterventionAnnual Complication Rates by
Anticipated Intervention Calculated from FES Presentations
Total population
0 - 44 years
45 - 54 years
55 - 64 years
65 - 74 years
75 - 84 years
85+ years
Contraindication Rate in 2006 3.5% 10.9% 6.9% 3.6% 4.7% 2.8% 1.0%Contraindication Rate in 2007 3.8% 5.3% 6.2% 6.2% 5.8% 2.5% 1.3%Contraindication Rate in 2008 3.7% 4.9% 8.9% 4.0% 5.8% 3.0% 0.7%Average Rate of Contraindication 3.7% 7.1% 7.4% 4.6% 5.4% 2.8% 1.0%
Contraindication Rate in 2006 12.9% 6.9% 9.8% 13.3% 16.2% 14.2% 8.3%Contraindication Rate in 2007 13.6% 5.9% 11.0% 12.5% 17.1% 15.1% 9.5%Contraindication Rate in 2008 13.2% 5.8% 8.4% 12.8% 18.5% 13.4% 10.0%Average Rate of Contraindication 13.2% 6.2% 9.7% 12.9% 17.3% 14.2% 9.3%
Thrombolysis Ischaemic Stroke
Only
Carotid Surgery TIA and
Ischaemic Stroke Only
Transient Ischaemic Attack
Haemorrhagic Stroke
Ischaemic Stroke
Source ISD19

64
Appendix 6.5 Estimated admission rates for patients who have attended a neurovascular outpatient clinic
Predicted Admissions to Scottish Hospitals in the Year to 31st March 2009
Total population
0 - 44 years
45 - 54 years
55 - 64 years
65 - 74 years
75 - 84 years
85+ years
Number of FES - TIA's 1,612 73 152 295 406 446 241Number of Recurrent TIA's CY 252 7 19 41 60 82 44Number of Recurrent TIA's PY 220 6 17 35 52 72 38Total number of TIA Admitted 2,085 86 188 370 518 600 323Number of FES - Haemorrhagic 1,201 88 103 180 274 357 199Number of Recurrent Heamorrhagic CY 133 13 13 25 31 34 16Number of Recurrent Heamorrhagic PY 222 23 22 41 52 57 27Total number of Haemorrhagic Strokes 1,556 125 138 245 358 448 243Number of FES - Infarcts 5,997 194 377 794 1,380 1,992 1,259Number of Recurrent Infarcts CY 940 35 67 131 239 313 155Number of Recurrent Infarcts PY 1,321 49 95 184 336 440 217Total number of Infarcts Admitted 8,258 278 539 1,109 1,955 2,745 1,631
Total Admissions 11,898 488 865 1,725 2,831 3,793 2,196
Predicted Outpatients Attending Neurovascular Clinics
Total population
0 - 44 years
45 - 54 years
55 - 64 years
65 - 74 years
75 - 84 years
85+ years
Number of Ischaemic Events Admitted 10,343 364 727 1,480 2,473 3,345 1,954
93% Outpatient Attendance from SSCAS 9,598 338 675 1,373 2,295 3,104 1,81311% RAO & Transient Monocular Blindness 1,075 38 76 154 257 348 20329% Non Cerebrovascular Events 2,822 99 198 404 675 913 53359% TIA and Minor Stroke Attendances 5,701 201 401 816 1,363 1,844 1,077
Independency Analysis of Ischaemic Strokes & CBV Events mRS < = 2
Total population
0 - 44 years
45 - 54 years
55 - 64 years
65 - 74 years
75 - 84 years
85+ years
Independency Ratio First Ever Stroke 60% 79% 78% 70% 59% 57% 49%25% Independency Ratio Recurrent Stroke 45% 59% 59% 53% 44% 43% 37%
No of TIA's Admitted 2,085 86 188 370 518 600 323No of FES - Infarcts Admitted 3,572 153 294 557 815 1,137 616No of Recurrent Strokes Admitted 1,024 49 95 166 255 322 136No of Neurovascular OP Attendees 5,701 201 401 816 1,363 1,844 1,077
Total number of patients who subject to further investigation may be suitable for Carotid Surgery without complications
12,382 489 978 1,909 2,951 3,903 2,152
Dependency Analysis of Ischaemic Strokes mRS 3 - 5
Total population
0 - 44 years
45 - 54 years
55 - 64 years
65 - 74 years
75 - 84 years
85+ years
Dependency Ratio First Ever Stroke 40% 21% 22% 30% 41% 43% 51%Dependency Ratio Recurrent Stroke 55% 41% 41% 47% 56% 57% 63%
No of FES - Infarcts Admitted 2,425 41 82 237 566 855 643No of Recurrent Strokes Admitted 1,237 34 67 149 321 431 235
Total number of patients who subject to further investigation may be suitable for Thrombolysis assuming that they arrive on time without complications
3,662 75 150 386 886 1,286 879

65
App
endi
x 7.
1 C
osts
for t
he S
cotti
sh A
mbu
lanc
e Se
rvic
e R
910:
TH
E SC
OTT
ISH
AM
BU
LAN
CE
SER
VIC
ETh
is is
an
ISD
Sco
tland
Nat
iona
l Sta
tistic
s re
leas
eA
pril
2007
- M
arch
200
825
th N
ovem
ber 2
008
Boa
rdSc
otla
ndA
yrsh
irean
d A
rran
Bor
ders
Dum
fries
&G
allo
way
Fife
Forth
Val
ley
Gra
mpi
anG
lasg
ow &
C
lyde
Hig
hlan
dLa
nark
shire
Loth
ian
Ork
ney
She
tland
Tays
ide
Wes
tern
Isle
s
RO
AD
AM
BU
LAN
CE
SER
VIC
E
AC
CID
ENT
& E
MER
GEN
CY
Inci
dent
s58
4,10
844
,132
12,3
4216
,429
40,4
5527
,342
53,4
9015
0,55
239
,179
65,2
9988
,300
1,75
81,
684
40,0
703,
076
Tota
l Cos
t £' 0
0013
5,68
110
,699
6,11
47,
562
7,75
44,
803
14,1
0424
,502
19,1
5111
,106
15,0
6674
347
011
,718
1,88
9C
ost p
er In
cide
nt (
£ )
232.
2924
2.43
495.
3846
0.28
191.
6717
5.66
263.
6816
2.75
488.
8117
0.08
170.
6242
2.64
279.
1029
2.44
614.
11To
tal M
ileag
e13
,033
,062
1,16
7,76
251
5,29
184
5,67
088
6,10
848
7,67
61,
472,
866
1,72
5,26
41,
861,
851
1,07
5,61
61,
476,
701
69,9
1578
,519
1,14
6,87
322
2,95
1C
ost p
er M
ile (
£ )
10.4
19.
1611
.87
8.94
8.75
9.85
9.58
14.2
010
.29
10.3
310
.20
10.6
35.
9910
.22
8.47
PATI
ENT
TRA
NSP
OR
T SE
RVI
CE
(exc
lude
s A
mbu
lanc
e C
ar S
ervi
ce)
Pat
ient
Jou
rney
s ( I
ncl.
Esco
rts )
1,47
7,10
212
6,09
450
,264
49,5
8114
3,43
195
,874
90,5
6638
3,23
177
,172
140,
313
181,
011
2,07
53,
243
130,
790
3,45
7To
tal C
ost £
' 000
31,8
602,
676
979
1,12
42,
358
1,98
92,
911
6,90
31,
894
3,48
44,
249
5511
23,
002
124
Cos
t per
P.J
. ( £
)21
.57
21.2
219
.48
22.6
716
.44
20.7
532
.14
18.0
124
.54
24.8
323
.47
26.5
134
.54
22.9
535
.87
Tota
l Mile
age
10,6
29,4
381,
056,
647
463,
115
714,
432
896,
470
582,
627
727,
165
2,23
8,76
51,
139,
976
898,
469
788,
098
26,7
1678
,623
1,00
2,81
415
,070
Cos
t per
Mile
( £
)3.
002.
532.
111.
572.
633.
414.
003.
081.
663.
885.
392.
061.
422.
998.
23
AM
BU
LAN
CE
CA
R S
ERVI
CE
Pat
ient
Jou
rney
s ( I
ncl.
Esco
rts )
214,
869
17,0
384,
043
5,16
718
,334
39,9
966,
210
18,7
7241
,428
37,3
5310
,249
165
-
14,0
782,
036
Tota
l Cos
t £' 0
001,
821
163
5910
612
727
861
295
274
216
613
-
146
32C
ost p
er P
.J. (
£ )
8.47
9.57
14.5
920
.51
6.93
6.95
9.82
15.7
16.
615.
785.
9518
.18
-
10.3
715
.72
Tota
l Mile
age
4,17
0,59
242
9,41
415
8,68
320
9,76
331
3,66
861
6,01
015
9,66
465
6,88
550
0,82
052
9,75
117
8,03
05,
818
-
358,
962
52,9
71C
ost p
er M
ile (
£ )
0.44
0.38
0.37
0.51
0.40
0.45
0.38
0.45
0.55
0.41
0.34
0.52
-
0.41
0.60
PATI
ENT
AIR
TR
AN
SPO
RT
SER
VIC
EM
issi
ons
3,27
489
1641
438
217
462
1,30
044
2937
825
027
379
Tota
l Cos
t £' 0
0010
,266
270
4912
613
116
679
1,39
04,
096
135
881,
204
803
831,
214
Cos
t per
Mis
sion
( £
)3,
136
3,03
43,
063
3,07
33,
250
3,05
33,
129
3,00
93,
151
3,06
83,
034
3,18
53,
212
3,07
43,
203
Sou
rce:
ISD
http
://w
ww
.isds
cotla
nd.o
rg/is
d/44
34.h
tml E
xcel
File
R91
0 ht
tp://
ww
w.is
dsco
tland
.org
/isd/
serv
let/F
ileB
uffe
r?na
med
File
=Cos
ts_R
910_
2008
.xls
&pC
onte
ntD
ispo
sitio
nTyp
e=in
line

66
App
endi
x 7.
2 C
osts
for a
ttend
ance
at a
n A
&E
depa
rtm
ent
R04
4: S
PEC
IALT
Y G
RO
UP
CO
STS
- CO
NSU
LTA
NT
OU
TPA
TIEN
TSTh
is is
an
ISD
Sco
tland
Nat
iona
l Sta
tistic
s re
leas
e
Apr
il 20
07 -
Mar
ch 2
008
25th
Nov
embe
r 200
8A
ccid
ent &
Em
erge
ncy
* U
se d
rop-
dow
n m
enu
to s
elec
t spe
cial
ties
* If
men
u is
not
act
ive,
cha
nge
mac
ro s
ecur
ity s
ettin
gs u
sing
Too
ls, M
acro
, Sec
urity
- se
t sec
urity
leve
l to
Med
ium
and
re-o
pen
the
repo
rt.
Num
ber o
f Hos
pita
ls: 8
6
Tota
lN
ewTo
tal
Tota
lA
ttend
ance
sP
atie
nts
Dire
ctA
lloca
ted
Cos
t per
Cos
t per
Atte
ndan
ceA
ttend
ance
Gro
ssIn
com
eIn
com
eN
etG
roup
AC
TO
ther
Inde
x£
££
££
Tota
ls o
r Ave
rage
s1,
602,
537
1,49
8,71
072
3010
2-2
-793
100
Cro
ssho
use
Hos
pita
lA
A2
68,6
0365
,150
6232
94-1
-489
96Th
e A
yr H
ospi
tal
AA
243
,739
40,4
8273
2810
2-
-596
104
Bor
ders
Gen
eral
BA
222
,417
22,4
1775
5012
50
-212
313
3Q
ueen
Mar
gare
t Hos
pita
lF
A2
41,8
2739
,093
8318
100
0-2
9810
6V
icto
ria K
irkca
ldy
FA
245
,554
42,9
5459
1877
0-1
7581
Wes
t Hos
pita
lsG
A1
78,2
7073
,321
6718
86-2
-777
83G
lasg
ow R
oyal
Infir
mar
yG
A1
74,5
5773
,519
6923
92-3
-980
87S
outh
ern
Gen
eral
(SG
H)
GA
249
,536
48,0
4769
2795
-3-8
8491
Roy
al A
lexa
ndra
Hos
pita
lG
A2
68,7
8666
,935
7129
99-7
-489
96In
verc
lyde
Roy
al H
ospi
tal
GA
233
,963
31,9
1879
2510
4-1
5-4
8592
Sto
bhill
, Gla
sgow
GA
242
,639
41,2
4467
1683
-1-4
7884
Vic
toria
Infir
mar
y, G
lasg
owG
A2
72,1
1468
,100
6025
85-1
-875
81V
ale
of L
even
, Ale
xand
riaG
A3
17,2
0915
,044
5935
94-6
-484
91R
aigm
ore,
Inve
rnes
sH
A2
31,0
7129
,032
100
4814
8-1
-12
135
146
Lorn
& Is
land
s D
istri
ct G
.H.
HA
37,
367
6,35
284
8016
4-
-615
817
1C
aith
ness
Gen
eral
HA
37,
696
6,36
650
4999
-1-1
9810
6B
elfo
rdH
A3
12,3
099,
668
8534
119
-1-4
114
124
Wis
haw
Gen
eral
LA
262
,524
60,2
2462
3092
-1-6
8592
Mon
klan
ds H
ospi
tal
LA
260
,520
58,5
2052
3082
-1-6
7581
Hai
rmyr
es, E
ast K
ilbrid
eL
A2
48,6
1248
,004
6933
102
0-1
488
95A
berd
een
Roy
al In
firm
ary
NA
165
,258
61,5
1268
2391
-2-6
8491
Dr.
Gra
y's,
Elg
inN
A3
22,8
1821
,943
9235
127
0-2
125
135
Bal
four
, Kirk
wal
lR
A3
3,31
03,
310
9692
188
--1
187
202
Edi
nbur
gh R
oyal
Infir
mar
yS
A1
105,
827
103,
955
107
5416
1-6
-25
130
140
St.
John
's a
t How
den
SA
252
,253
44,3
3549
2170
-3-1
354
59N
inew
ells
TA
150
,620
49,7
3610
031
131
-5-4
122
132
Per
th R
oyal
Infir
mar
yT
A2
25,3
5924
,650
4717
640
-10
5458
Stir
ling
Roy
al In
firm
ary
VA
252
,601
50,8
3569
3410
3-1
-697
104
Falk
irk R
oyal
Infir
mar
yV
A2
31,1
9730
,012
4319
62-1
-556
60W
este
rn Is
les,
Sto
rnow
ayW
A3
8,54
57,
326
8828
116
--6
110
119
D&
G R
oyal
Infir
mar
yY
A2
35,8
8035
,880
6537
102
0-1
091
99G
allo
way
Com
mun
ity H
ospi
tal
YA
313
,399
13,3
9956
4399
0-1
9810
5G
ilber
t Bai
n, L
erw
ick
ZA
39,
206
7,86
173
9617
0-
-116
918
2
Tota
l Cos
ts
Hos
pita
l, B
oard
Cip
her
Cos
t per
Atte
ndan
cean
d C
lass
ifica
tion
S
ourc
e: IS
D h
ttp://
ww
w.is
dsco
tland
.org
/isd/
4434
.htm
l Exc
el F
ile R
044
Mac
ros
Ena
bled
ht
tp://
ww
w.is
dsco
tland
.org
/isd/
serv
let/F
ileB
uffe
r?na
med
File
=Cos
ts_R
044_
2008
.xls
&pC
onte
ntD
ispo
sitio
nTyp
e=in
line

67
App
endi
x 7.
3 C
osts
per
eve
nt fo
r CT,
MR
I and
ultr
asou
nd d
iagn
ostic
s
R12
0: R
AD
IOLO
GY
SER
VIC
ESTh
is is
an
ISD
Sco
tland
Nat
iona
l Sta
tistic
s re
leas
eA
pril
2007
- M
arch
200
825
th N
ovem
ber 2
008
* U
se d
rop-
dow
n m
enu
to s
elec
t spe
cial
ties
* If
men
u is
not
act
ive,
cha
nge
mac
ro s
ecur
ity s
ettin
gs u
sing
Too
ls, M
acro
, Sec
urity
- se
t sec
urity
leve
l to
Med
ium
and
re-o
pen
the
repo
rt.N
umbe
r of H
ospi
tals
: 43
Atte
ndan
ces
Atte
ndan
ces
Atte
ndan
ces
Gro
upG
roup
Gro
up£
Inde
x£
Inde
x£
Inde
xTo
tals
or A
vera
ges
248,
808
115.
4610
096
,525
228.
5910
039
8,06
952
.87
100
Cro
ssho
use
Hos
pita
lA
A2
7,70
111
6.56
101
3,83
112
5.99
5519
,999
38.9
674
The
Ayr
Hos
pita
lA
A2
6,98
011
5.71
100
3,14
516
3.40
719,
250
38.8
673
Bor
ders
Gen
eral
BA
24,
948
150.
1213
02,
386
88.8
639
6,02
941
.50
78Q
ueen
Mar
gare
t Hos
pita
lF
A2
6,40
615
1.22
131
--
-14
,116
37.8
172
Vic
toria
Kirk
cald
yF
A2
6,71
012
5.23
108
5,74
125
0.45
110
8,34
931
.31
59W
est H
ospi
tals
GA
116
,125
124.
5210
88,
782
229.
9810
116
,830
64.1
512
1G
lasg
ow R
oyal
Infir
mar
yG
A1
13,7
0111
1.11
963,
614
200.
8588
35,4
7252
.35
99S
outh
ern
Gen
eral
(SG
H)
GA
217
,792
139.
5012
112
,743
252.
1811
08,
531
65.7
312
4R
oyal
Ale
xand
ra H
ospi
tal
GA
29,
557
132.
4711
52,
915
239.
4710
512
,996
62.4
111
8In
verc
lyde
Roy
al H
ospi
tal
GA
28,
620
107.
8793
1,80
219
5.00
858,
234
50.8
296
Sto
bhill
, Gla
sgow
GA
25,
999
126.
0410
929
204.
2889
9,88
960
.73
115
Vic
toria
Infir
mar
y, G
lasg
owG
A2
7,99
776
.90
671,
393
168.
9574
9,88
036
.23
69V
ale
of L
even
, Ale
xand
riaG
A3
5,40
686
.84
7578
715
6.97
693,
950
40.9
177
Rai
gmor
e, In
vern
ess
HA
27,
695
36.2
031
3,99
860
4.39
264
12,5
2078
.84
149
Cai
thne
ss G
ener
alH
A3
364
200.
4217
4-
--
2,16
713
5.33
256
Bel
ford
HA
375
821
1.73
183
--
-1,
655
200.
4837
9W
isha
w G
ener
alL
A2
8,63
410
2.26
892,
670
169.
8774
13,8
1845
.56
86M
onkl
ands
Hos
pita
lL
A2
7,35
010
3.69
901,
851
161.
9771
13,6
0947
.89
91H
airm
yres
, Eas
t Kilb
ride
LA
27,
410
102.
9389
2,37
215
9.76
7012
,556
58.1
311
0A
berd
een
Roy
al In
firm
ary
NA
120
,233
97.6
385
4,21
115
3.26
6721
,784
66.3
812
6D
r. G
ray'
s, E
lgin
NA
32,
960
89.1
377
--
-5,
143
25.3
448
Bal
four
, Kirk
wal
lR
A3
--
--
--
645
199.
4137
7E
dinb
urgh
Roy
al In
firm
ary
SA
115
,770
98.7
886
6,99
617
7.84
7841
,752
47.6
890
Wes
tern
Gen
eral
, Edi
nbur
ghS
A1
14,1
1913
5.89
118
9,74
624
4.80
107
13,5
3663
.11
119
St.
John
's a
t How
den
SA
28,
529
55.5
348
1599
.40
4318
,482
25.0
547
Nin
ewel
lsT
A1
9,35
615
5.42
135
4,37
223
6.18
103
13,5
3331
.19
59P
erth
Roy
al In
firm
ary
TA
23,
669
132.
0211
42,
341
258.
3811
37,
068
38.5
573
Stra
cath
roT
A3
3,59
716
5.11
143
2,14
425
5.73
112
3,25
039
.33
74S
tirlin
g R
oyal
Infir
mar
yV
A2
6,20
816
9.09
146
130
4.81
133
10,8
7777
.33
146
Falk
irk R
oyal
Infir
mar
yV
A2
6,16
513
1.70
114
4,72
623
7.56
104
7,91
960
.43
114
Wes
tern
Isle
s, S
torn
oway
WA
377
130
4.02
263
--
-1,
569
100.
5719
0D
&G
Roy
al In
firm
ary
YA
25,
651
72.1
262
--
-10
,486
68.3
012
9G
ilber
t Bai
n, L
erw
ick
ZA
3-
--
--
-1,
761
114.
2721
6
and
Cla
ssifi
catio
npe
r Atte
ndan
cepe
r Atte
ndan
cepe
r Atte
ndan
ce
Imag
ing
Mag
netic
Res
onan
ceU
ltras
onic
s
Hos
pita
l, B
oard
Cip
her
Net
cos
tN
et c
ost
CT
Sca
nner
Net
cos
t
S
ourc
e: IS
D h
ttp://
ww
w.is
dsco
tland
.org
/isd/
4434
.htm
l E
xcel
File
R12
0 M
acro
s E
nabl
ed
http
://w
ww
.isds
cotla
nd.o
rg/is
d/se
rvle
t/File
Buf
fer?
nam
edFi
le=C
osts
_R12
0_20
08.x
ls&
pCon
tent
Dis
posi
tionT
ype=
inlin
e

68
App
endi
x 7.
4 C
osts
for a
str
oke
cons
ulta
nt o
utpa
tient
atte
ndan
ce
R04
4: S
PEC
IALT
Y G
RO
UP
CO
STS
- CO
NSU
LTA
NT
OU
TPA
TIEN
TSTh
is is
an
ISD
Sco
tland
Nat
iona
l Sta
tistic
s re
leas
e
Apr
il 20
07 -
Mar
ch 2
008
25th
Nov
embe
r 200
8G
ener
al M
edic
ine
* U
se d
rop-
dow
n m
enu
to s
elec
t spe
cial
ties
* If
men
u is
not
act
ive,
cha
nge
mac
ro s
ecur
ity s
ettin
gs u
sing
Too
ls, M
acro
, Sec
urity
- se
t sec
urity
leve
l to
Med
ium
and
re-o
pen
the
repo
rt.
Num
ber o
f Hos
pita
ls: 6
2
Tota
lN
ewTo
tal
Tota
lA
ttend
ance
sP
atie
nts
Dire
ctA
lloca
ted
Cos
t per
Cos
t per
Atte
ndan
ceA
ttend
ance
Gro
ssIn
com
eIn
com
eN
etG
roup
AC
TO
ther
Inde
x£
££
££
Tota
ls o
r Ave
rage
s23
2,50
983
,798
9636
132
-9-1
311
010
0C
ross
hous
e H
ospi
tal
AA
212
,850
3,37
561
2586
--3
8376
The
Ayr
Hos
pita
lA
A2
14,0
502,
731
6330
93-
-391
82B
orde
rs G
ener
alB
A2
7,50
62,
974
113
8219
5-2
-21
171
156
Que
en M
arga
ret H
ospi
tal
FA
21,
451
649
150
4919
9-2
-319
317
6V
icto
ria K
irkca
ldy
FA
22,
889
779
130
3116
1-2
-315
714
3W
est H
ospi
tals
GA
113
,651
3,42
617
746
223
-59
-23
141
129
Gla
sgow
Roy
al In
firm
ary
GA
15,
567
1,32
715
927
186
-31
-27
128
117
Sou
ther
n G
ener
al (S
GH
)G
A2
188
717
339
211
-7-3
217
215
7R
oyal
Ale
xand
ra H
ospi
tal
GA
217
,089
4,10
211
916
135
-25
-210
898
Inve
rcly
de R
oyal
Hos
pita
lG
A2
9,98
53,
722
105
2613
1-1
3-1
117
107
Sto
bhill
, Gla
sgow
GA
22,
823
1,03
494
1911
3-3
-610
595
Vic
toria
Infir
mar
y, G
lasg
owG
A2
1,15
340
613
835
173
-3-1
815
213
8V
ale
of L
even
, Ale
xand
riaG
A3
2,72
01,
064
118
912
7-1
10
115
105
Rai
gmor
e, In
vern
ess
HA
24,
626
1,47
213
628
163
-1-1
215
013
7Lo
rn &
Isla
nds
Dis
trict
G.H
.H
A3
1,91
445
716
588
252
-7-7
239
217
Cai
thne
ss G
ener
alH
A3
859
354
140
3017
1-1
-15
155
141
Bel
ford
HA
31,
116
402
111
2914
0-2
-10
127
116
Wis
haw
Gen
eral
LA
29,
072
1,25
276
9016
6-9
-41
116
106
Mon
klan
ds H
ospi
tal
LA
27,
672
1,44
481
5513
6-6
-26
104
95H
airm
yres
, Eas
t Kilb
ride
LA
27,
420
1,05
686
6415
00
-24
126
115
Abe
rdee
n R
oyal
Infir
mar
yN
A1
6,25
71,
578
128
4317
1-6
-34
131
120
Dr.
Gra
y's,
Elg
inN
A3
13,7
213,
152
6023
830
-380
73B
alfo
ur, K
irkw
all
RA
332
413
198
4814
6-
-46
100
91E
dinb
urgh
Roy
al In
firm
ary
SA
11,
860
992
7941
120
-4-1
997
88W
este
rn G
ener
al, E
dinb
urgh
SA
137
,579
33,2
4425
732
0-1
3229
St.
John
's a
t How
den
SA
21,
220
539
176
9326
9-6
-17
246
224
Nin
ewel
lsT
A1
7,26
01,
920
229
8931
8-2
0-7
522
320
3P
erth
Roy
al In
firm
ary
TA
22,
383
923
216
3024
6-
-100
146
133
Stra
cath
roT
A3
465
163
436
136
572
--1
1046
242
1S
tirlin
g R
oyal
Infir
mar
yV
A2
7,63
61,
783
129
4917
8-2
-17
159
145
Falk
irk R
oyal
Infir
mar
yV
A2
7,23
71,
487
119
4916
8-2
-20
146
133
Wes
tern
Isle
s, S
torn
oway
WA
32,
579
559
9214
105
--1
104
95D
&G
Roy
al In
firm
ary
YA
24,
565
1,13
350
1867
0-2
6559
Gal
low
ay C
omm
unity
Hos
pita
lY
A3
477
141
3520
550
-253
48G
ilber
t Bai
n, L
erw
ick
ZA
32,
226
474
219
3725
7-
-125
523
2
Tota
l Cos
ts
Hos
pita
l, B
oard
Cip
her
Cos
t per
Atte
ndan
cean
d C
lass
ifica
tion
S
ourc
e: IS
D h
ttp://
ww
w.is
dsco
tland
.org
/isd/
4434
.htm
l Exc
el F
ile R
044
Mac
ros
Ena
bled
ht
tp://
ww
w.is
dsco
tland
.org
/isd/
serv
let/F
ileB
uffe
r?na
med
File
=Cos
ts_R
044_
2008
.xls
&pC
onte
ntD
ispo
sitio
nTyp
e=in
line

69
App
endi
x 7.
5 C
osts
for a
con
sulta
nt v
ascu
lar s
urge
on o
utpa
tient
atte
ndan
ce
R04
4: S
PEC
IALT
Y G
RO
UP
CO
STS
- CO
NSU
LTA
NT
OU
TPA
TIEN
TSTh
is is
an
ISD
Sco
tland
Nat
iona
l Sta
tistic
s re
leas
e
Apr
il 20
07 -
Mar
ch 2
008
25th
Nov
embe
r 200
8Va
scul
ar S
urge
ry*
Use
dro
p-do
wn
men
u to
sel
ect s
peci
altie
s
* If
men
u is
not
act
ive,
cha
nge
mac
ro s
ecur
ity s
ettin
gs u
sing
Too
ls, M
acro
, Sec
urity
- se
t sec
urity
leve
l to
Med
ium
and
re-o
pen
the
repo
rt.
Num
ber o
f Hos
pita
ls: 1
4
Tota
lN
ewTo
tal
Tota
lA
ttend
ance
sP
atie
nts
Dire
ctA
lloca
ted
Cos
t per
Cos
t per
Atte
ndan
ceA
ttend
ance
Gro
ssIn
com
eIn
com
eN
etG
roup
AC
TO
ther
Inde
x£
££
££
Tota
ls o
r Ave
rage
s32
,623
12,6
8198
3513
3-5
-14
114
100
Cro
ssho
use
Hos
pita
lA
A21,
727
911
6742
109
--5
104
91Th
e A
yr H
ospi
tal
AA2
1,91
946
288
1410
2-
-10
289
Que
en M
arga
ret H
ospi
tal
FA2
1,01
843
183
2510
80
-210
592
Vic
toria
Kirk
cald
yF
A2
1,60
182
170
1181
0-2
7969
Wes
t Hos
pita
lsG
A1
2,49
61,
005
8842
130
-7-5
118
104
Gla
sgow
Roy
al In
firm
ary
GA
13,
856
1,45
912
427
150
-21
-27
102
89S
outh
ern
Gen
eral
(SG
H)
GA
22,
284
1,00
110
325
128
-30
125
110
Rai
gmor
e, In
vern
ess
HA
21,
874
840
9287
179
-1-1
016
814
7C
aith
ness
Gen
eral
HA3
234
6955
3388
-2-8
7868
Belfo
rdH
A388
3571
3210
3-2
-11
9079
Abe
rdee
n R
oyal
Infir
mar
yN
A1
5,10
22,
901
9633
129
-2-1
910
895
Edi
nbur
gh R
oyal
Infir
mar
yS
A1
5,75
91,
902
120
4416
5-7
-22
136
119
Stir
ling
Roy
al In
firm
ary
VA
22,
567
469
7427
101
-2-1
782
72Fa
lkirk
Roy
al In
firm
ary
VA
22,
098
375
104
3614
0-2
-16
122
107
Tota
l Cos
ts
Hos
pita
l, B
oard
Cip
her
Cos
t per
Atte
ndan
cean
d C
lass
ifica
tion
S
ourc
e: IS
D h
ttp://
ww
w.is
dsco
tland
.org
/isd/
4434
.htm
l Exc
el F
ile R
044
Mac
ros
Ena
bled
ht
tp://
ww
w.is
dsco
tland
.org
/isd/
serv
let/F
ileB
uffe
r?na
med
File
=Cos
ts_R
044_
2008
.xls
&pC
onte
ntD
ispo
sitio
nTyp
e=in
line

70
App
endi
x 7.
6 M
ean
varia
ble
cost
per
day
(exc
ludi
ng o
verh
eads
and
thea
tre
cost
s) in
a s
urgi
cal w
ard
R0
40: S
PECI
ALTY
GRO
UP C
OSTS
- IN
PATI
ENTS
IN A
LL S
PECI
ALTI
ES (E
XC L
ONG
STAY
)Th
is is
an IS
D Sc
otla
nd N
atio
nal S
tatis
tics
rele
ase
April
200
7 - M
arch
200
825
th N
ovem
ber 2
008
Gene
ral S
urge
ry* U
se d
rop-
down
men
u to
sel
ect s
pecia
lties
* If m
enu
is no
t act
ive, c
hang
e m
acro
sec
urity
set
tings
usin
g To
ols,
Mac
ro, S
ecur
ity -
set s
ecur
ity le
vel t
o M
ediu
m a
nd re
-ope
n th
e re
port.
Num
ber o
f Hos
pita
ls: 4
1
Disc
harg
esLe
ngth
Tota
lof
Sta
yAl
loca
ted
Spec
ialty
Med
ical
Nurs
ing
Phar
mac
yAH
PO
ther
Thea
treLa
bora
tory
Cost
per
Aver
age
and
Dire
ctCa
seG
ross
Inco
me
Inco
me
Net
Dent
alCa
reAC
TO
ther
££
££
££
££
££
££
Tota
ls o
r Ave
rage
s13
3558
4.2
383.
753
017
497
1754
213
872
926
11-4
4-1
4924
1827
417
444
9St
roke
Hos
pita
ls:
Cros
shou
se H
ospi
tal
A2A
5837
3.5
238.
757
214
895
3253
092
770
2477
-18
-112
2347
304
223
526
The
Ayr H
ospi
tal
A2A
2627
5.0
288.
470
225
731
174
522
153
858
3166
-104
-88
2974
318
171
489
Bord
ers
Gen
eral
A2B
2958
2.8
528.
122
919
279
458
7-
494
2113
-15
-226
1871
280
175
455
Que
en M
arga
ret H
ospi
tal
A2F
6526
4.3
314.
750
816
415
924
506
130
765
2571
-7-4
925
1529
117
947
0Vi
ctor
ia K
irkca
ldy
A2F
104
1.0
1177
.529
386
5012
535
1964
828
22-1
7-5
927
4616
0866
722
76W
est H
ospi
tals
A1G
8725
3.7
251.
038
215
970
1456
520
451
721
62-2
4-1
5119
8724
213
938
1G
lasg
ow R
oyal
Infir
mar
yA1
G72
914.
931
7.1
404
183
8817
529
258
733
2529
-68
-136
2324
217
150
367
Sout
hern
Gen
eral
(SG
H)A2
G37
935.
651
0.9
776
232
134
1650
128
773
431
91-5
3-1
7029
6831
013
144
1Ro
yal A
lexa
ndra
Hos
pita
lA2
G68
573.
638
6.3
368
140
5053
629
9442
421
45-1
17-2
919
9826
011
737
6In
verc
lyde
Roya
l Hos
pita
lA2
G38
104.
328
3.1
670
244
7038
385
126
580
2397
-83
-11
2303
311
135
445
Stob
hill,
Gla
sgow
A2G
4613
3.3
333.
746
711
581
2138
417
868
122
60-2
1-1
3621
0231
020
351
3Vi
ctor
ia In
firm
ary,
Gla
sgow
A2G
5242
4.4
410.
867
114
074
1873
912
465
028
26-4
3-1
8925
9427
314
741
9Va
le o
f Lev
en, A
lexa
ndria
A3G
361
2.1
253.
011
5072
383
136
258
145
547
3294
-101
-931
8411
3026
013
90Ra
igm
ore,
Inve
rnes
sA2
H57
743.
930
3.4
478
110
631
491
159
583
2187
-15
-81
2091
264
151
414
Lorn
& Is
land
s Di
stric
t G.H
.A3
H14
283.
729
6.2
425
3014
-20
6-
1017
1987
-15
-81
1891
180
274
454
Caith
ness
Gen
eral
A3H
1102
3.0
216.
844
782
472
205
4465
116
96-1
2-3
316
5026
421
648
0Be
lford
A3H
1479
3.3
289.
157
010
195
537
992
753
2285
-11
-64
2210
327
228
555
Wish
aw G
ener
alA2
L50
035.
021
6.8
418
145
406
641
6777
323
06-2
2-1
2121
6214
915
430
2M
onkla
nds
Hosp
ital
A2L
3883
4.6
338.
351
512
630
240
995
626
2143
-21
-188
1935
193
135
328
Hairm
yres
, Eas
t Kilb
ride
A2L
4453
4.9
280.
561
615
511
57
461
9585
725
88-1
0-1
2424
5423
117
440
5Ab
erde
en R
oyal
Infir
mar
yA1
N75
983.
642
8.5
420
123
207
-69
713
268
026
87-6
4-2
5023
7327
418
746
2Dr
. Gra
y's, E
lgin
A3N
2673
4.6
314.
965
055
130
-39
273
617
2232
-1-1
2321
0923
913
437
3Ba
lfour
, Kirk
wall
A3R
880
4.3
1165
.174
914
716
954
121
4811
8936
43-
-22
3622
538
277
815
Edin
burg
h Ro
yal I
nfirm
ary
A1S
1020
13.
753
7.8
655
269
528
486
110
923
3040
-81
-254
2705
352
250
603
Wes
tern
Gen
eral
, Edi
nbur
ghA1
S59
015.
875
3.9
609
487
110
3852
512
698
536
35-8
2-2
2533
2831
417
048
4St
. Joh
n's a
t How
den
A2S
816
1.2
523.
718
113
958
868
725
920
2542
-85
-224
2234
509
748
1257
Nine
wells
A1T
7423
5.6
429.
578
519
615
12
900
279
1021
3764
-79
-159
3526
287
183
470
Perth
Roy
al In
firm
ary
A2T
3282
2.8
333.
735
210
539
134
611
352
018
10-1
-69
1740
311
185
496
Stra
cath
roA3
T38
40.
946
0.8
731
151
903
220
1248
2887
--2
1726
7054
713
1718
63St
irlin
g Ro
yal I
nfirm
ary
A2V
4516
4.0
406.
954
815
099
2038
213
263
323
72-1
3-2
5021
0927
015
642
6Fa
lkirk
Roy
al In
firm
ary
A2V
865
6.4
331.
227
744
112
1246
613
271
520
89-1
3-1
3819
3711
711
122
8W
este
rn Is
les,
Sto
rnow
ayA3
W87
95.
139
3.3
612
213
533
568
3356
724
41-5
8-6
523
1823
111
134
2D&
G R
oyal
Infir
mar
yA2
Y35
424.
241
1.6
494
9214
020
654
7067
125
51-2
2-1
4123
8825
416
141
5G
allo
way
Com
mun
ity H
ospi
tal
A3Y
361.
410
8.4
197
2036
137
169
724
1526
-3-4
114
8227
952
180
0G
ilber
t Bai
n, L
erwi
ckA3
Z10
873.
924
1.3
1054
7962
2619
562
1270
2989
--4
829
4138
032
770
7
and
Clas
sifica
tion
Aver
age
Varia
ble
Cost
pe
r Day
£
Aver
age
Ove
rhea
d Co
st
Per D
ay
£
Tota
l Cos
t Pe
r Day
£
Dire
ct C
ost p
er C
ase
Tota
l Cos
ts
Hosp
ital,
Boar
d Ci
pher
Cost
per
Cas
e
S
ourc
e: IS
D h
ttp://
ww
w.is
dsco
tland
.org
/isd/
4434
.htm
l Exc
el F
ile R
040
Mac
ros
Ena
bled
ht
tp://
ww
w.is
dsco
tland
.org
/isd/
serv
let/F
ileB
uffe
r?na
med
File
=Cos
ts_R
040_
2008
.xls
&pC
onte
ntD
ispo
sitio
nTyp
e=in
line

71
App
endi
x 7.
7 M
ean
varia
ble
cost
per
day
(exc
ludi
ng o
verh
eads
and
thea
tre
cost
s) in
a g
ener
al m
edic
al w
ard
R040
: SPE
CIAL
TY G
ROUP
COS
TS -
INPA
TIEN
TS IN
ALL
SPE
CIAL
TIES
(EXC
LON
G ST
AY)
This
is an
ISD
Scot
land
Nat
iona
l Sta
tistic
s re
leas
e
April
200
7 - M
arch
200
825
th N
ovem
ber 2
008
Gene
ral M
edic
ine
Num
ber o
f Hos
pita
ls: 3
6
Disc
harg
esLe
ngth
Tota
lof
Sta
yAl
loca
ted
Spec
ialty
Med
ical
Nurs
ing
Phar
mac
yAH
PO
ther
Thea
treLa
bora
tory
Cost
per
Aver
age
and
Dire
ctCa
seGr
oss
Inco
me
Inco
me
Net
Dent
alCa
reAC
TO
ther
££
££
££
££
££
££
Tota
ls o
r Ave
rage
s26
0608
4.6
207.
855
217
995
92
129
562
1736
-39
-97
1600
225
122
348
Stro
ke H
ospi
tals
:Cr
ossh
ouse
Hos
pita
lA2
A11
864
4.9
74.4
568
182
8917
310
259
116
25-2
0-8
215
2318
811
930
8Th
e Ay
r Hos
pita
lA2
A96
944.
962
.756
431
995
1111
7268
718
21-3
0-1
2916
6219
814
134
0Bo
rder
s G
ener
alA2
B81
535.
531
5.1
681
268
948
-70
620
73-1
4-2
2318
3520
412
833
2Q
ueen
Mar
gare
t Hos
pita
lA2
F65
105.
078
.786
025
615
833
5373
321
72-1
3-4
021
1827
914
742
6Vi
ctor
ia K
irkca
ldy
A2F
9444
2.9
119.
440
510
211
49
9151
913
59-2
8-2
213
0927
418
045
4W
est H
ospi
tals
A1G
1195
05.
229
6.5
560
155
142
1125
567
520
95-2
45-1
0117
4920
713
033
7G
lasg
ow R
oyal
Infir
mar
yA1
G13
982
5.3
126.
651
516
685
819
548
815
82-6
8-6
314
5118
192
273
Sout
hern
Gen
eral
(SG
H)A2
G92
014.
927
2.7
627
238
106
930
462
321
81-3
6-1
5719
8828
012
840
8Ro
yal A
lexa
ndra
Hos
pita
lA2
G97
305.
015
0.6
617
214
7612
156
359
1583
-35
-11
1537
235
7230
7In
verc
lyde
Roya
l Hos
pita
lA2
G75
955.
220
3.8
554
148
7415
105
516
1616
-42
-915
6520
199
300
Stob
hill,
Glas
gow
A2G
8518
2.8
195.
040
196
4742
104
448
1333
-47
-99
1187
264
160
424
Vict
oria
Infir
mar
y, G
lasg
owA2
G11
651
4.1
188.
666
614
556
818
452
717
76-1
5-8
716
7428
112
941
0Va
le o
f Lev
en, A
lexa
ndria
A3G
4745
5.8
216.
169
517
883
1610
938
716
84-3
4-6
1644
215
6628
1Ra
igm
ore,
Inve
rnes
sA2
H87
344.
122
2.8
501
163
118
22
118
588
1716
-7-5
616
5325
814
340
1Lo
rn &
Isla
nds
Dist
rict G
.H.
A3H
1467
6.3
337.
280
531
14-
211
-10
0824
06-1
5-8
223
0917
416
133
6Ca
ithne
ss G
ener
alA3
H16
794.
627
8.1
630
152
501
910
666
318
90-5
-57
1828
251
144
395
Belfo
rdA3
H12
215.
831
7.1
1326
170
103
19
8511
1631
27-9
-77
3041
328
191
519
Wish
aw G
ener
alA2
L11
115
4.5
171.
249
815
843
416
653
115
72-9
-61
1502
214
117
331
Mon
kland
s Ho
spita
lA2
L11
983
3.7
166.
837
210
786
215
845
913
51-9
-57
1285
225
125
350
Hairm
yres
, Eas
t Kilb
ride
A2L
9640
4.5
216.
041
794
703
167
757
1725
-5-9
216
2719
216
735
8Ab
erde
en R
oyal
Infir
mar
yA1
N12
466
5.4
86.2
426
458
226
-10
744
217
46-6
2-1
6715
1720
082
282
Dr. G
ray's
, Elg
inA3
N42
496.
225
4.4
1033
161
97-
6462
122
30-1
-78
2151
245
100
345
Balfo
ur, K
irkwa
llA3
R11
014.
629
9.9
777
9822
155
054
998
2502
--3
624
6732
021
753
8Ed
inbu
rgh
Roya
l Inf
irmar
yA1
S18
649
2.5
336.
837
154
443
2643
912
74-4
4-1
8910
4124
117
641
7W
este
rn G
ener
al, E
dinb
urgh
A1S
5871
3.6
355.
443
416
076
848
441
1523
-47
-131
1344
253
124
377
St. J
ohn's
at H
owde
nA2
S93
285.
627
4.2
727
151
108
1756
691
2024
-40
-125
1858
208
123
331
Nine
wells
A1T
1473
64.
923
7.7
599
232
113
21
215
584
1985
-36
-107
1842
256
119
374
Perth
Roy
al In
firm
ary
A2T
7843
4.8
143.
439
417
955
112
938
912
910
-42
1249
180
8126
1St
raca
thro
A3T
241.
163
4.7
615
109
131
414
577
920
04-
-35
1969
808
719
1528
Stirl
ing
Roya
l Inf
irmar
yA2
V91
443.
621
7.3
443
145
698
413
646
214
85-7
-153
1325
237
127
364
Falki
rk R
oyal
Infir
mar
yA2
V39
521
.720
0.6
1834
225
194
255
136
1833
4452
-7-1
3543
1011
485
199
Wes
tern
Isle
s, S
torn
oway
A3W
1600
9.1
391.
613
9817
024
74
2864
1239
3542
-131
-129
3282
222
137
359
D&G
Roy
al In
firm
ary
A2Y
6052
4.9
384.
862
620
615
722
711
968
122
04-1
7-1
1520
7228
113
842
0G
allo
way C
omm
unity
Hos
pita
lA3
Y11
12.7
789.
917
0815
811
27
112
1893
4779
-21
-74
4684
219
149
368
Gilb
ert B
ain,
Ler
wick
A3Z
1052
5.3
615.
693
212
395
244
6811
0129
63-
-42
2921
343
208
550
and
Clas
sifica
tion
Tota
l Cos
t Pe
r Day
£
Aver
age
Ove
rhea
d Co
st
Per D
ay
£
Aver
age
Varia
ble
Cost
pe
r Day
£
Dire
ct C
ost p
er C
ase
Tota
l Cos
ts
Hosp
ital,
Boar
d Ci
pher
Cost
per
Cas
e
S
ourc
e: IS
D h
ttp://
ww
w.is
dsco
tland
.org
/isd/
4434
.htm
l Exc
el F
ile R
040
Mac
ros
Ena
bled
ht
tp://
ww
w.is
dsco
tland
.org
/isd/
serv
let/F
ileB
uffe
r?na
med
File
=Cos
ts_R
040_
2008
.xls
&pC
onte
ntD
ispo
sitio
nTyp
e=in
line

72
App
endi
x 7.
8 C
osts
per
hou
r for
thea
tre
time
incl
usiv
e of
ove
rhea
ds, s
taff
cost
s an
d co
nsum
able
s R1
40: T
HEAT
RE S
ERVI
CES
This
is a
n IS
D S
cotla
nd N
atio
nal S
tatis
tics
rele
ase
April
200
7 - M
arch
200
825
th N
ovem
ber 2
008
Acut
e Se
ctor
Hos
pita
ls e
xcl L
ong
Stay
* Use
dro
p-do
wn
men
u to
sel
ect s
peci
altie
s
* If m
enu
is n
ot a
ctiv
e, c
hang
e m
acro
sec
urity
set
tings
usi
ng T
ools
, Mac
ro, S
ecur
ity -
set s
ecur
ity le
vel t
o M
ediu
m a
nd re
-ope
n th
e re
port.
Num
ber o
f Hos
pita
ls: 3
8
Num
ber
Allo
cate
dTo
tal
Inco
me
ofC
osts
Expe
nditu
reAC
TTh
eatre
sPe
r(n
et o
f(n
ette
d in
Wee
kAC
Tth
eatre
Hou
rsG
roup
Med
ical
Nur
sing
Oth
erD
rugs
CSS
DO
ther
inco
me)
expe
nditu
re)
Inde
x&
Den
tal
Gro
up£0
00£0
00£0
00£0
00£0
00£0
00£0
00£0
00£0
00£
Inde
xTo
tals
or A
vera
ges
327
8,27
425
100
95,5
9810
9,96
17,
918
16,6
0613
,528
92,5
1210
1,89
143
8,01
557
01,
018
100
Stro
ke H
ospi
tals
:C
ross
hous
e H
ospi
tal
AA2
1739
023
913,
754
5,18
050
393
715,
068
4,64
419
,159
-94
593
The
Ayr H
ospi
tal
AA2
929
633
130
1,77
63,
707
378
690
234,
188
2,45
913
,221
-85
984
Bord
ers
Gen
eral
BA2
612
521
821,
721
1,79
411
312
835
176
01,
914
6,78
131
1,04
210
2Q
ueen
Mar
gare
t Hos
pita
lF
A29
248
2810
92,
917
2,16
572
723
588
2,71
02,
479
11,3
21-
878
86Vi
ctor
ia K
irkca
ldy
FA2
615
125
991,
492
1,30
340
824
438
42,
178
2,25
68,
265
-1,
055
104
Wes
t Hos
pita
lsG
A119
385
2080
5,39
46,
426
3788
444
36,
069
5,93
425
,187
-1,
257
123
Gla
sgow
Roy
al In
firm
ary
GA1
2146
522
886,
333
7,93
92
842
387
5,67
94,
726
25,9
08-
1,07
110
5So
uthe
rn G
ener
al (S
GH
)G
A219
422
2288
5,16
97,
137
113
844
205
7,31
22,
902
23,6
8243
41,
079
106
Roy
al A
lexa
ndra
Hos
pita
lG
A212
215
1871
3,37
15,
243
178
475
242,
452
4,79
116
,534
01,
477
145
Inve
rcly
de R
oyal
Hos
pita
lG
A26
9416
621,
281
2,03
087
228
82,
088
1,97
67,
698
01,
570
154
Stob
hill,
Gla
sgow
GA2
911
713
511,
884
2,67
22
193
381,
058
2,50
38,
350
-1,
375
135
Vict
oria
Infir
mar
y, G
lasg
owG
A28
9912
491,
178
2,36
62
216
782,
013
1,13
16,
983
188
1,35
613
3Va
le o
f Lev
en, A
lexa
ndria
GA3
221
1142
1,16
838
728
4910
309
819
2,77
00
2,51
624
7R
aigm
ore,
Inve
rnes
sH
A29
335
3714
73,
019
2,71
485
163
31,
266
3,79
32,
681
14,9
5795
859
84C
aith
ness
Gen
eral
HA3
124
2495
262
354
3524
2317
951
11,
387
171,
107
109
Belfo
rdH
A31
2525
101
335
296
7029
4081
378
1,23
07
929
91W
isha
w G
ener
alL
A211
242
2287
2,98
93,
064
-50
217
3,12
94,
149
13,8
49-
1,10
010
8M
onkl
ands
Hos
pita
lL
A29
250
2811
02,
868
2,53
4-
202
491,
959
3,26
710
,879
-83
582
Hai
rmyr
es, E
ast K
ilbrid
eL
A28
250
3112
42,
245
2,22
3-
498
453,
427
3,65
812
,097
-93
091
Aber
deen
Roy
al In
firm
ary
NA1
2366
929
115
8,24
37,
271
1,90
03,
705
519
3,03
58,
356
33,0
3090
795
093
Dr.
Gra
y's, E
lgin
NA3
591
1872
1,22
51,
574
-26
255
11,
655
1,97
87,
245
41,
535
151
Balfo
ur, K
irkw
all
RA3
128
2811
1-
189
-9
-11
329
160
2-
414
41Ed
inbu
rgh
Roy
al In
firm
ary
SA1
2171
834
135
8,76
99,
317
351,
466
-13
,081
10,1
8442
,853
796
1,14
711
3W
este
rn G
ener
al, E
dinb
urgh
SA1
1132
730
117
4,41
53,
443
-48
9-
3,23
44,
098
15,6
79-
923
91St
. Joh
n's
at H
owde
nS
A213
274
2183
3,70
13,
608
641
5-
2,14
44,
609
14,4
83-
1,01
510
0N
inew
ells
TA1
1865
536
144
6,78
17,
101
1,03
384
43,
395
4,14
96,
178
29,4
82-
865
85Pe
rth R
oyal
Infir
mar
yT
A28
215
2710
61,
177
2,04
133
423
51,
728
1,54
62,
396
9,45
5-
846
83St
raca
thro
TA3
355
1873
311
1,47
649
6151
534
2,70
15,
183
-1,
800
177
Stirl
ing
Roy
al In
firm
ary
VA2
817
722
871,
908
1,77
920
824
62,
616
76-
6,83
4-
744
73Fa
lkirk
Roy
al In
firm
ary
VA2
589
1871
911
1,72
975
529
795
22-
4,06
2-
874
86W
este
rn Is
les,
Sto
rnow
ayW
A32
7940
157
576
944
109
125
104
334
688
2,87
9-
698
69D
&G R
oyal
Infir
mar
yY
A28
260
3212
82,
314
3,08
468
134
512
4,76
41,
976
13,1
75-
975
96G
allo
way
Com
mun
ity H
ospi
tal
YA3
119
1973
269
375
-13
410
630
61,
074
-1,
110
109
Gilb
ert B
ain,
Ler
wic
kZ
A32
2915
5874
144
4-
-0
198
-1,
383
-91
190
Thea
tre H
ours
Use
dD
irect
Cos
tsN
et C
ost
per
Thea
tre&
Cla
ssifi
catio
nPe
r Wee
kH
our U
sed
Hos
pita
l, Bo
ard
Cip
her
Per T
heat
reSt
aff
Supp
lies
S
ourc
e: IS
D h
ttp://
ww
w.is
dsco
tland
.org
/isd/
4434
.htm
l Exc
el F
ile R
140
Mac
ros
Ena
bled
ht
tp://
ww
w.is
dsco
tland
.org
/isd/
serv
let/F
ileB
uffe
r?na
med
File
=Cos
ts_R
140_
2008
.xls
&pC
onte
ntD
ispo
sitio
nTyp
e=in
line

73
Appendix 7.9 Costs by function for hospitals in NHS Greater Glasgow and Clyde
Hospital NameSouthern General
Victoria Infirmary
Glasgow Royal
InfirmaryWestern Infirmary Stobhill
Royal Alexandra Hospital
Inverclyde Royal
HospitalVale of Leven
Principal LocationSouth
GlasgowSouth
GlasgowNorth
GlasgowNorth
GlasgowNorth
GlasgowPaisley
RenfrewGreenock Inverclyde
Alexandria Dumbarton
Hospital Classification Code A2 A2 A1 A1 A2 A2 A2 A3
Southern General
Victoria Infirmary
Glasgow Royal
InfirmaryWestern Infirmary Stobhill
Royal Alexandra Hospital
Inverclyde Royal
HospitalVale of Leven
Accident & Emergency 24 Hour Coverage Yes No Yes Yes Yes Yes Yes NoCT Scanning Facilities Yes Yes Yes Yes Yes Yes Yes YesMRI Scanning Facilities Yes Yes Yes Yes Yes Yes Yes NoUltrasound Scanning Facilities Yes Yes Yes Yes Yes Yes Yes YesCurrent Discharges for Carotid Endarterectomy Yes No Yes Yes No No No NoCurrently Delivering Thrombolytic Therapy Yes No No Yes No No No No
Ranking out of 6 6 3 5 6 4 4 4 2Estimated Number of Additional Hospital Transfers 0 3 1 0 2 2 2 4
Southern General
Victoria Infirmary
Glasgow Royal
InfirmaryWestern Infirmary Stobhill
Royal Alexandra Hospital
Inverclyde Royal
HospitalVale of Leven
Acute Stroke Unit Available Yes No Yes Yes Yes Yes Yes NoRehabilitation Stroke Unit Available Yes Yes No No Yes Yes Yes YesIf No Rehabilitation Unit are patients transferred Elsewhere n/a n/a Yes Yes n/a n/a n/a n/aNeurovascular Clinic Available Yes Yes Yes Yes Yes Yes Yes No
Costs of Patient Transport: SAS Greater Glasgow & Clyde
Health Board Total
Southern General
Victoria Infirmary
Glasgow Royal
InfirmaryWestern Infirmary Stobhill
Royal Alexandra Hospital
Inverclyde Royal
HospitalVale of Leven
Accident & Emergency - Cost per Incident 163 163 163 163 163 163 163 163 163Patient Transport Service - Cost per Journey 18 18 18 18 18 18 18 18 18Ambulance Car Service - Cost per Journey 16 16 16 16 16 16 16 16 16Patient Air Transport Service - Cost per Mission 3,009 3,009 3,009 3,009 3,009 3,009 3,009 3,009 3,009
Costs associated with an initial diagnosis of Stroke in Greater Glasgow & Clyde
Health Board Total
Southern General
Victoria Infirmary
Glasgow Royal
InfirmaryWestern Infirmary Stobhill
Royal Alexandra Hospital
Inverclyde Royal
HospitalVale of Leven
Accident & Emergency - Consultant Clinic Costs 83 84 75 80 77 78 89 85 83CT Scanning - Cost Per Scan Event 119 140 77 111 125 126 132 108 87MRI Scanning - Cost Per Scan Event 232 252 169 201 230 204 239 195 157Ultrasound Scanning - Cost Per Scan Event 56 66 36 52 64 61 62 51 41
Inpatient costs per day in Greater Glasgow & Clyde excluding surgery and overheads
Health Board Total
Southern General
Victoria Infirmary
Glasgow Royal
InfirmaryWestern Infirmary Stobhill
Royal Alexandra Hospital
Inverclyde Royal
HospitalVale of Leven
Inpatient Costs per Day - General Medicine 233 280 281 181 207 264 235 201 215
Consultant outpatient costs per event in Greater Glasgow & Clyde
Health Board Total
Southern General
Victoria Infirmary
Glasgow Royal
InfirmaryWestern Infirmary Stobhill
Royal Alexandra Hospital
Inverclyde Royal
HospitalVale of Leven
Consultant Outpatients - General Medicine 122 172 152 128 141 105 108 117 115Consultant Outpatients - General Surgery 182 127 125 96 110 70 98 103 93Consultant Outpatients - Vascular Surgery 115 125 0 102 118 0 0 0 0
Surgical intervention costs for inpatients and outpatients in Greater Glasgow & Clyde
Health Board Total
Southern General
Victoria Infirmary
Glasgow Royal
InfirmaryWestern Infirmary Stobhill
Royal Alexandra Hospital
Inverclyde Royal
HospitalVale of Leven
Daycase Surgery - General Surgery 751 928 840 720 755 680 581 730 773Inpatient Surgery - Cost Per Day's Stay 382 310 273 217 242 310 260 311 1,130Theatre Costs - Per Hour 1,463 1,079 1,356 1,071 1,257 1,375 1,477 1,570 2,516
Hospitals in Greater Glasgow & Clyde with a CT Scanner for first level diagnosis for the exclusion of haemorrhagic stroke
Current general service provision in the hospitals of Greater Glasgow & Clyde in relation to stroke pathway
Current service provision for stroke in Greater Glasgow & Clyde
Source: NHS Quality Improvement Scotland