Embed Size (px)
Citation preview

212 4TH CAN. PERMAFROST CONF. (1982)
Management of groundwater discharge for the solution of icing problems in the Yukon
R.O. VAN EVERDINGEN National Hydrology Research Institute, Environment Canada, Calgary, Alberta, Canada, T3A OX9
Icings fed by perennial discharge of groundwater cause traffic and maintenance problems at several points along the Alaska Highway in the Yukon. At the site investigated in detail (km 1817.5), slightly mineralized groundwater is being discharged at a rate of up to 9.4 m3 per hour. Isotope analyses indicate that the discharge is derived from recent precipitation. During the 19791 1980 winter, icing extended 240 m upstream from the highway, with a maximum thickness of 2.55 m and a total volume of about 14,000 m3; icing covered the highway on several occasions. Maximum predicted icing volume for this site is 33,000 m3, which would increase average thick- ness by 1.2 m and extend the icing area to about 350 m upstream from the highway. Annual expen- ditures for icing control at this and other icing sites can be reduced considerably (or eliminated) by improved management of groundwater discharge, through installation of subdrains, through provision of "icing-storage" areas, or some combination of these.
L'englacement engendrt par I'koulement continu de I'eau souterraine perturbe le trafic et pose des problemes d'entretien en divers points le long de la route de I'Alaska, dans le Yukon. Au point etudie en detail (kilometre 1817,50), le dibit de I'eau souterraine, lkgerement mineralisee, atteint jusqu'a 9,40 m3 par heure. Des analyses isotopiques montrent que I'eau rksurgente provient de prkcipitations rkentes. Durant I'hiver 1979-1980, I'englacement s'est etendu jusqu'ii 240 metres en amont de la route et son Cpaisseur maximale a ete de 2,55 metres, ce qui represente un volume total d'environ 14 000 m3; la route a ete englacke ii plusieurs occasions. Le volume maximum pro- jete de I'englacement est de 33 000 m3. Cela augmenterait I'epaisseur de la glace de 1,20 metre en moyenne et etendrait la surface englacee jusqu'ii environ 350 metres en amont de la route. Le codt annuel du deglacement en ce point et sur d'autres segments pourrait &re considerablement riduit (ou supprime) en- ameliorant I'ivacuation en sous-sol de I'eau souterraine par I'installation de drains, l'aminagement de bassins "d'englacement et de stockage des eaux" ou d'un systeme d'adduction combinant ces deux systtmes.
Proc. 4th Can. Permafrost Conf. (1982)
Introduction
Icings cause problems for traffic and mainte- nance in numerous locations along transportation routes in northern Canada. Such problems have been experienced along the Alaska Highway in the Yukon since the construction of the Pioneer Road was begun in 1942 (Eager and Pryor 1945; Thomson 1963).
The flows of water that lead to icing formation during the winter are either fed by lakes (and releases from storage reservoirs) or by discharge of groundwater. Most of the problems result from plugging of culverts by ice, which causes ice build- up upstream, ice (and water) on road surfaces, and, in some instances, washouts during snowmelt.
Eager and Pryor (1945) gave a detailed account of the extent and probable causes of icings along the full length of the Alaska Highway, from Dawson Creek, B.C., to Fairbanks, Alaska, during the winters of 1942143 and 1943144, with an outline of various icing-control methods. They found that more than 90 per cent of the problem icings were caused by discharge from springs and seepage areas and by flow in minor groundwater-fed streams, and that problem icings were associated with coarse- grained unconsolidated deposits (sand, gravel) or
with bedrock outcrops in more than 65 per cent of the cases they investigated. They stated that ". . . permafrost appears to be a factor in pro- moting icing activity" (Eager and Pryor 1945, p. 63). The prime reason for this is that the presence of permafrost tends to force the concentration of groundwater discharge in smaller areas through a smaller number of outlets. Eager and Pryor (ibid.) further stated: "It is evident that permafrost layers hold the water near the surface . . . instead of allowing it to soak away to protected depths." For many of the problem icings this is certainly not the case, because they are situated in relatively low- lying areas of natural groundwater discharge where the water would not soak away even if permafrost were absent.
As part of a hydrogeological reconnaissance of the transportation corridor in connection with the proposed Alaska Highway natural-gas pipeline, the present distribution of icing areas has been mapped, using colour air-photos taken in April 1978 by Kenting Earth Sciences for Foothills Pipe Lines (Yukon) Ltd. The main purpose of that project was to identify areas and locations where construction and operation of a buried pipeline (chilled or not chilled) could experience problems related to active groundwater systems, as listed by van Everdingen

Hydrology in Permafrost Regions 213
(1979). Subsequently, field studies were initiated along the highway between Whitehorse and the Yukon-Alaska border in late 1979 to identify icing areas that create highway traffic andlor mainte- nance problems, the solution of which could be aided by improved understanding of local ground- water conditions.
The most severe traffic and maintenance prob- lems result from icing build-up in minor ground- water-fed streams at places where springs or diffuse discharge areas occur near the highway. Examples are found at, or near, Highway km 1676, 1743, 1817.5, 1823.5, 1836, 1863, and 1870 (based on kilometre posts installed along the highway at inter- vals of 2 km). Four of the icing areas (those at km 1676, 1743, 1817.5, and 1823.5) were selected in 1979 for field observations; the icing site at km 1817.5, which presents a particularly trouble- some maintenance problem, is being studied in detail. This report presents results obtained since the fall of 1979 at that site.
The icing sites selected for study are located along the stretch of highway between Haines Junction and the Yukon-Alaska border that is being up- graded in preparation for future paving, under the 10-year Shakwak Highway Project. The hydrogeo- logical and icing studies at these sites will lead to a better understanding of the local groundwater sys- tems and the processes involved in icing formation.
FIGURE 1. Location of the Burlap creek icing at km 1817.5, Alaska Highway.
Gravel I Sand 100 >
re.... , rn .d . , I,".. I - . -/
FIGURE 2. Grain-size distribution: Till, km 1817.5; White River volcanic ash, from Swede Johnson Creek, km 1799; White River volcanic ash, sample No. 43a from Lerbekmo and Camp- bell (1969).
This will allow inclusion of more-adequate provi- sions for management of groundwater discharge in the upgraded highway design.
Setting of the Study Site The icing site selected for detailed study is located
on the north-east edge of the Shakwak Valley at km 1817.5 (just west of old milepost 1130), about 4.5 km south-east of the crossing of Donjek River (Figure 1). At this point the highway crosses a small stream near the lower end of a stream-cut ravine, at an elevation of approximately 740 m above sea level. According to the NTS 1:50,000-scale topo- graphic map sheet 115 GI12 (Donjek), the stream originates about 2.5 km north-east of the icing site at an elevation of about 870 m, and discharges into Donjek River some 350 m west of the site at an elevation of approximately 710 m. Mean annual precipitation in the area is about 340 mm, of which about 150 mm may fall as snow.
Bedrock exposures do not exist in the immediate vicinity of the site. At higher elevations to the north-east, bedrock consists of granodioritic rocks of the Ruby Range batholith, and schists, slates, and recrystallized limestone of the Yukon Complex (Bostock 1952; Muller and Christie 1966). The bed- rock is covered by morainic deposits (till) con- taining a high proportion of sand, gravel, and boulders, overlain by tephra (White River volcanic ash) and peat (Rampton 1979).
Grain-size distributions for the till and the vol- canic ash in the general area are presented in Fig- ure 2. The till sample was obtained from a depth of 1.4 m in a test pit dug near the centre of the small ravine about 215 m upstream from the highway. A clean sample of volcanic ash was collected from a surface exposure on the right bank of Swede John-

214 4TH CAN. PERMAFROST CONF. (1982)
son Creek, at the highway crossing some 16 km east of the study site. The grain-size distribution for a sample of White River ash from a location about 25 km north-west of the site, recalculated from data published by Lerbekmo and Campbell (1969), is in- cluded in Figure 2 for comparison.
The icing area at km 1817.5 extends about 350 m upstream from the highway. ~ a g e r ' and Pryor (1945) did not indicate an icing problem at, or near, this site on the original highway alignment (shown as abandoned in Figure 1, after NTS 115 G112, published in 1953). Observations recorded in 1956 also do not indicate an icing problem at this site (S. Thomson, University of Alberta, pers. com- mun. 1980). The presence of dead, dying, and "drunken" trees in the ravine is interpreted as the result of relatively recent man-made hydrological changes at the site, possibly caused by roadway relocation and the application of new or more- intensive icing control measures. The latter include extensive use of burlap (hessian cloth) fences. Remains of at least five such fences were in evidence at the site in the fall of 1979. This has led to the adoption of the working name "Burlap Creek" for the stream at km 1817.5.
TABLE 1. Water chemistry and isotope data for Burlap creek, km 1817.5, Alaska Highway
Date Nature of data 02-10-79 26-03-80 24-05-80 09-09-80
- - -- -
Properties T, "C 1.9 0.1 0.6 3.3 Conductivity, 610 890 640 661
pS l cm pH, units 7.8 7.6 7.8 7.8
Constituents (mg 1 L) Ca Mg Na K HCO, so4 CI F SiOz Sum
log (QIK): Calcite +0.02 +0.01 -0.04 +0.10 Dolomite -0.26 -0.22 -0.39 -0.10 Gypsum -1.49 -1.21 -1.41 -1.38 d180, '700 SMOW -21.1 -22.1 -21.5 -21.5 d2H, %o SMOW -169 -170 -175 -161 3H, Tritium units 107 k 10 105 2 10 107 * 10 110 k 10
NOTE: Chemical analyses by Water Quality Laboratory, IWD, Calgary. Isotope analyses by F. A. Michel, Dept. of Earth Sciences, University of Waterloo.
1 B u r l a p creek "Y
-I Ca** Mg" Naf Kt CI- SO,; H C O j
FIGURE 3. Semilog plots of water chemistry of Burlap creek.
Water Supply to the Icing The flow rate of Burlap creek at the highway cul-
vert appears to be relatively constant throughout the frost-free season, and not intermittent as sug- gested by the topographic map. On September 9, 1980, the measured flow rate at the culvert was 9.4 m3 per hour. Somewhat higher up the ravine, the creek flows underground over short distances. During the winter the flow rate at the culvert appears to fluctuate in response to variations in air temperature; no water reaches the culvert during periods of extreme cold weather.
Water temperatures measured at the culvert range from 0.1 to 3.3"C (Table 1); groundwater temperatures in the discharge area show a smaller variation, from about 0.5 to l.O°C. The water transports small amounts of volcanic ash as well as some silt and clay that may be eroded from the till.
Analyses of the chemical composition of the Bur- lap creek water (see Table l and Figure 3) show the influence of groundwater. Comparison of the com- position of the creek water after the main snow- melt period (24-05-1980), after extensive rain (09-09-1980), and after a long period without rain or snowmelt (26-03-1980) reveals only minor varia- tions, indicating that direct runoff of precipitation accounts for only a small percentage of the total flow, except during the peak of the snowmelt period.

Hydrology in Permafrost Regions 215
The water is slightly undersaturated with respect to gypsum and dolomite, and very slightly super- saturated with respect to calcite (see Table I). The calcium carbonate may be derived from recrystal- lized limestone of the Yukon Complex, which is ex- posed in outcrops at higher elevations,north-east of the site.
A sample of mineral precipitate collected from the surface of the icing near the culvert in March 1980 (Table 2) contained gypsum, but no calcite. The probable explanation is that formation of mineral precipitates during freezing takes place over some distance, as more of the water gradually freezes during its downhill movement over and through the icing. During this process the sulphates will be deposited somewhat farther down the icing than the less soluble carbonates; a single grab sam- ple can therefore not be expected to contain the full range of precipitate minerals. The other minerals present in small amounts in our sample (see Table 2) are suspected to be derived from water- borne sediment and air-borne highway dust.
The water of Burlap creek has been analyzed to determine relative abundances of the stable isotopes of oxygen and hydrogen ('80 and 2H) and of the radioactive hydrogen isotope tritium (3H). The results (see Table 1) are shown graphically in Fig- ures 4 and 5, to enable comparison with earlier data available on the isotopic composition of atmos- pheric precipitation. Whitehorse is the only station in the region for which such earlier data are avail- able. The dlsO and d2H values indicate that precipi- tation is the probable source of the Burlap creek water; the 3H values indicate that the Burlap creek water represents recent precipitation (most likely not more than 12 years old).
TABLE 2. Mineral composition of a precipitate sample from icing at km 1817.5, Alaska Highway
FIGURE 4. Plot of d l 8 0 VS. d*H for Burlap creek water and for 1979-1980 precipitation samples. Line represents best fit to data for precipitation at Whitehorse, 1961-1967 (from IAEA Environmental lsotope Data Series).
FIGURE 5. Tritium concentrations in Burlap creek water and in 1979-1980 precipitation samples, compared with earlier data for precipitation at Whitehorse, 1961-1967 (from IAEA Environ- mental Isotope Data Series).
Mineral Approximate percentage
Calcite 78 Feldspars 6 Quartz 4 Chlorite 4 Mite 4 Mixed-layer clays 4
NOTE: Analysis by A. Heindch, Institute of Sedimentary and Petroleum Geology, EMR, Calgary.
Icing Build-up, Winter 1979/1980
Daily time-lapse photography was used to record the build-up and decay of the Burlap creek icing during the 19791 1980 icing season. Three automatic
time-lapse camera systems of the type described by Banner and van Everdingen (1 979) were installed at the site on October 2 and 3, 1979 (see Figure 10 for locations). The cameras were set to expose three frames once a day, at solar noon. Staff gauges were installed as reference points and scales for measure- ment of ice build-up (two gauges, 2.5 m long, at the culvert, shown in Figure 6a; one gauge, 3 m long, against a tree at the edge of the forest about 100 m upstream from the culvert, shown in Figure 6b).
The icing potential at Burlap creek had been underestimated, with the unfortunate result that the battery containers of two of the cameras were filled with, and subsequently buried in, ice. As a cpnse- quence, the first camera (A see Figure 10, looking

216 4TH CAN. PERMAFROSTCONF. (1982)
downhill towards the culvert) stopped operating after it had taken its February 5 photographs. It was removed on February 20 by personnel of Water Survey of Canada, Whitehorse, because the camera itself appeared to be on the verge of being engulfed in ice. The second camera (B see Figure 10, looking uphill towards the edge of the forest) stopped oper- ating after it had taken its February 19 photo- graphs.
To make matters worse, the third camera (C see Figure 10, also looking towards the culvert) stopped operating, due to a faulty battery, after it had taken its March 12 photographs. This camera was revived with new batteries on March 26. The other two cameras could not be reactivated until new batteries and battery containers (with longer power cables) were installed at a slightly higher level on May 24, after most of the snow and ice had melted. All three cameras performed without interruption from May 24 till September 7, when films were retrieved and the site prepared for observations during the 19801 1981 icing season.
Notwithstanding the partial loss of record, the time-lapse photography proved to be very useful for the study of the growth and decay of the Burlap creek icing. A microfilm viewer, projecting individ- ual frames in a 17 x 22.7-cm format, was used for a frame-by-frame inspection of positive prints of the time-lapse films. It was found that the films had captured a wealth of detail, not only with regard t o icing activity, but also with regard to local weather conditions and human activities at the site.
The rate of build-up of the icing was determined by measuring (using a 1:25,000 engineer's scale on the viewer screen) for each day the portions of the staff gauges that were not covered by ice or snow. The measured levels have an accuracy of 2 1.5 cm. In Figure 7, the results of the measurements (B) can be compared with the record of daily mean temper- atures (A) observed at Burwash Landing Airport (the nearest weather station, 44 km south-east of the study site).
The comparison shows that icing accumulation at the culvert started in mid October 1979, shortly after daily mean temperatures dipped below freez- ing, and that it continued, with only minor inter- ruptions, well into February 1980. From the second week of February onwards, the ice build-up at the culvert was artificially limited because of the opera- tion of an oil-fired thaw barrel (or "moose warmer"). The film from camera B shows that ice build-up continued at the edge of the forest at least until February 19, when that camera stopped oper- ating. Field observations made on March 26 indi-
cate that a further 42 cm of ice accumulated at staff gauge b between February 19 and March 26. A fur- ther 3 cm of ice accumulated after this date, before the maximum thickness of 2.14 m was reached. Melting of the icing commenced in the first week of April, shortly after daily mean temperatures at Bur- wash Landing rose above freezing; the base of staff gauge c at the culvert was exposed by May 12. A sig- nificant amount of ice remained in the forested por- tion of the icing area for some time after May 25.
The incidental occurrence, shown in Figure 7, of daily mean temperatures slightly above freezing in late November, mid January, and early February did not noticeably impede icing activity at the culvert. During periods of very cold weather, how- ever, icing activity at the culvert was significantly slowed down. Field observations have indicated that this phenomenon is the result of freezing of the discharge farther upstream, closer to its source, during such colder periods. No evidence has been found for a significant reduction in the discharge rate even during very cold weather.

Hydrology in Permafrost Regions 217
D. s n o w . B u r w a s h . Y.T
D a t e
FIGURE 7. A. Daily mean temperatures recorded at Burwash Airport, winter 1979-1980. B. Icing build-up at the Burlap creek culvert, from time-lapse camera C; lettered arrows indicate time of installation
of burlap fences and thaw barrel (see Table 3a for explanation of abbreviations); last portion of curve is for ice level at staff gauge a (burnt top of staff gauge c broken off).
C . Snowfalls recorded at Burlap creek by time-lapse cameras; longer lines indicate significant snowfalls. D. Snowfall recorded at Burwash Airport, winter 19791 1980. (Data for Burwash Airport provided by H.E. Wahl,
A.E.S. Weather Office, Whitehorse Airport).
218 4TH CAN. PERMAFROST CONF. (1982)
Icing build-up was affected to some degree by the more significant snowfalls. Figure 7C indicates the days on which the time-lapse photography recorded that new snow had fallen: For a comparison of this snowfall record with the one from the weather sta- tion at Burwash Landing (Figure 7D) it should be kept in mind that any new snow recorded on a par- ticular day by the time-lapse photography may have fallen at any time during the preceding 24-hour period (solar noon to solar noon). It is nevertheless apparent from the comparison that the correlation between snowfalls at Burwash Landing and those at the Burlap creek icing site is imperfect; some of the snowfalls were recorded only at Burlap creek, some others only at Burwash Landing.
A comparison of icing build-up (see Figure 7B) with the occurrence of snowfalls (see Figure 7C) shows that two of the snowfalls (Oct. 19/20 and Nov. 141 15) produced a rapid rise in apparent icing level, followed by a somewhat smaller decline; the latter is presumed to have resulted from settling of the snow following gradual wetting by water flow- ing over the ice. Similar temporary declines in the icing level at the culvert, observed on a number of other occasions, were most likely the result of local erosion of the ice (Nov. 1 l), melting due to opera- tion of the thaw barrel (Dec. 31 and Jan. 20), and steaming of channels in the ice (Jan. 25 and last week of February).
Icing Control Activities The human activities that influenced icing build-
up at the Burlap creek icing site included installa- tion and operation of a thaw barrel, installation of burlap fences, steaming of channels in the icing, steaming of the culvert, scraping ice off the shoul- ders and the roadway, and building of ice dikes. The time-lapse photography recorded the results of these activities; in some instances the activities themselves were recorded. The main observations are listed chronologically in Table 3a. The activities listed did, of course, take place on the dates given in Table 3a; results first recorded by the photography on a particular date (according to Table 3a) repre- sent activities that may have taken place at any time during the 24-hour period preceding the photog- raphy. The observations for the period from No- vember 23, 1979 to March 3 1, 1980 were confirmed in general by a maintenance record provided by J. W. Flummerfelt, foreman of the highway main- tenance depot, Yukon Territorial Government, in Destruction Bay (pers. commun., January 26, 1981). Table 3b presents a summary of this main- tenance record for the icing site at km 1817.5.
Contribution of Snow to the Icing Volume
Snow may contribute to the growth of icings. Snow falling on an active icing usually becomes incorporated in the icing. In areas with relatively low snowfall but experiencing strong winds, drift- ing can contribute considerably more snow, espe- cially when the surface of the icing is wet, trapping the snow. In late winter, day-time snowmelt may accumulate in small depressions on or around an icing and freeze overnight.
The extent of the contribution by snow to the icing accumulation at km 1817.5 was investigated through study of the stratigraphy of the ice. On March 27, 1980, two continuous ice cores were ob- tained from holes drilled approximately 20 m up- stream of the culvert, using a Stihl Model 4308 earth auger and a frozen-ground coring kit with a 7.5-cm core barrel, provided by the Terrain Sciences Division, Geological Survey of Canada.
The core sequence from the first hole was 2.26 m long. The individual core pieces retrieved from the core barrel were sealed in heavy-duty plastic bags on which the top and number of the samples were marked. They were shipped in frozen condition (in an insulated container filled up with ice) to A. Gel1 of the Snow and Ice Division, NHRI, Ottawa, for ice-fabric analysis. After the ice-fabric analysis, selected portions of this core, representing either columnar ice (parallel C-axes) or "snow ice" (ran- domly oriented C-axes), were allowed to melt, transferred into 125-ml glass bottles, and shipped to F. A. Michel, Department of Earth Sciences, Uni- versity of Waterloo for environmental isotope analysis.
The core sequence from the second hole (2.35 m long) was split into samples representing depth intervals ranging from 3 to 6 cm. Individual ice samples were double-bagged in numbered plastic bags. After melting, these samples were also trans- ferred to 125-ml glass bottles and shipped to Water- loo to be analysed for environmental isotopes.
The results of the ice-fabric analysis of core No. 1 are presented in graphic form in Figure 8, together with the snowfall observations from the time-lapse photography. The ice-fabric analysis revealed a relatively clear separation into columnar ice and snow ice. Two portions of core No. 1 were too badly mangled to allow reliable fabric analysis.
Snow ice constituted approximately 17.5 cm or 11.3 per cent of the 155-cm length of the non- mangled portions of the core. One may assume that at least 10 per cent of the volume of the snow ice was contributed by snow (fall or drift); this percent- age could of course be higher. Using the 10 per cent
Hydrology in Permafrost Regions 219
TABLE 3. Icing control activities at Burlap creek, km 1817.5, Alaska Highway
o. Recorded by Time-lapse Photography(1)
Date
03- 10-79 04-10-79 12-10-79 06-1 1-79 28-1 1-79 30-1 1-79 20- 12-79 05-01-80 08-01-80 09-01 -80 23-01-80
24-01 -80 25-01-80
Activity or result observed
Cameras and gauges installed First automatic camera shots Posts for burlap fence installed along left bank Burlap fence installed on right bank near culvert (BR-l in Figure 7) Burlap fence, second level, installed on right bank near culvert (BR-2) Thaw barrel. M, installed and fired upc2) Burlap fence installed in edge of forest (BF-1) Thaw barrel moved closer to culvert Burlap fence installed on left bank near culvert (BL) Burlap fence, second level, installed in edge of forest (BF-2) Fuel barrel removed, rack burned, upper ends of staff gauges a and
c burned(3) New fuel barrel installed, on new rack Second barrel installed Channel steamed in icing Highway plowed andlor scraped Burlap fence, third level, installed in edge of forest (BF-3) Channels steamed in icing Ice scraped off highway shoulder Batteries of camera A covered by icing Ice piled in ridge (IR) along right bank near culvert Ice ridge on right bank built higher Steaming channels andlor culvert; refuelling thaw barrel Batteries of camera B covered by icing Ice scraped off highway Steaming channels andlor culvert Steaming channels and culvert Channel steamed in ice above culvert
By Camera No.
NOTES: ( I ) Only significant observations are listed here; new vehicle tracks and minor changes in the layout of the thaw-barrel installation
were recorded on November 16; on December 6, 14, 16, 17, and 28; on January 7, 8, 13, 15, 17, 19,21,23,24, and 25; on April 22; on June 26; on July 24; on August 30; and on September 2 and 7 (activities may have taken place on the day before their results were recorded by the cameras).
(2) Between November 30, 1979 and March l I, 1980, the time-lapse photography indicated that the thaw barrel was operating on at least 66 out of a total of 103 days.
(3) This damage resulted because somebody opened the control valve of the thaw-barrel burner all the way.
b. Summary of Maintenance Record
Month Crew size(') Days Man days Activities
Operation of burner, days
1979 November I 3 X I12 1112 Check; use CaCI2 I December I 8 x I12 4 Check; use CaCI2 3 1
2 7 x 1 14 Install burlap fences and burner etc.
1980 January
February
March
TOTAL
I 13 x '12 2 7 x 1 1 8 x I12 2 5 x 1 I I x l I 13 x 112 2 1 x 1
N.A. 66 visits
Check burner 31 Burlap fences; steaming culvert Check burner 29 Steaming culvert, trenches Rip and remove ice Check burner 31 Steaming culverts, trenches N.A. 123 days(')
(1) One-man crew using 3/a-ton pickup; two-man crew using 5-ton truck. Estimated equipment charges:
36.5 days @ 8 hours @ $15.00 $4,380.00 27.0 days @ 8 hours @ $32.00 6,912.00
(2) Estimated wages: 63.5 days @ 8 hours Q $14.00 7,112.00
(3) Thaw-barrel fuel use, estimated: 123 days @ 50 Ild @ $0.30 1,845.00
Supplies (steamer fuel, CaC12, burlap etc.) 200.00 TOTAL $20,449.00
NOTE: from data provided by J. W. Rummerfelt.

220 4TH CAN. PERMAFROST CONF. (1982)
minimum figure and the percentage of snow ice, be- tween 17.5 and 175 mm water was contributed to
0 the icing thickness by snow. couumn., I=. Each snowfall recorded by the time-lapse photog- m
'Snow IC. raphy is plotted (see Figure 8) at the level of the
€zJ icing at the culvert on the date of the observed .,,,,,, ,,,, snowfall (according to the film from camera C). The probable correlation between the observed snowfalls and the snow-ice portions of the core are indicated by broken lines in Figure 8.
The results of the isotope analyses of the samples from the two cores did not allow determination of the percentage of snow incorporated in the ice. It is likely that at least some of the variations in isotope abundances found in these cores are a consequence of temperature variations during formation of the icing. The detailed results and a more complete dis- cussion of the possible interpretation will be pre- sented elsewhere.
Extent and Thickness of the Icing During visits to the site on March 26 and 27,
1980, nails were driven into a number of trees and posts, at the level of the surface of the icing, to enable measurements of ice thickness to be made after melting of the ice. The trees thus marked were identified with flagging tape (Figure 9a).
The ice thicknesses of March 26 and 27, repre- sented by the nails, were measured on September 9, 1980. At that time it was found that some of the
FWRE 8 . Ice-fabric analysis for core No. I from Burlapcreek trees showed "scars" at the ice level (see icing and correlation with snowfalls recorded by time-lapse arrow in Figure 9a), presumably as a result of ver- photography. tical movements of the ice caused by build-up of

Hydrology in Permafrost Regions 221
FIGURE 10. Contour map of thickness of the Burlap creek icing, from survey on March 26 and 27, 1980. Section see Figure 13.
groundwater pressures. Evidence of maximum ice levels was also discernible on the posts and on the lumber used as supports for the three staff gauges installed in October 1979 (light discolouration just above the nail in the post shown in Figure 9b and on the support of the staff gauge in Figure 9c, at a level of 2.14 m on the gauge).
Locations of ice-level markers along the access road were surveyed using a Wild T2 universal theo- dolite. Locations of markers in the forested part of the ravine were tied in with the transit survey by triangulation, using a 30-m survey tape, because it was impossible to use the theodolite outside the access-road clearing. The results of the survey are presented as a contour map of ice thickness in Fig- ure 10. The upstream limit of the icing was just beyond the east edge of Figure 10; airphotos taken in late May 1964 (A18395-95 to 97) show that the icing extended about 120 m farther up the ravine in the 1963 1 1964 winter.
Figure 10 shows that ice thickness was greatest in the creek channels, as expected. A noticeable differ- ence between the ice levels upstream and down- stream of the burlap fence along the edge of the forest, behind staff gauge b, is evidence of the effectiveness of the fence in "holding back" the icing. Ice build-up at the culvert was limited by the operation of the thaw barrel. The time-lapse pho- tography revealed that ice spread over the roadway on several occasions when the fire in the thaw barrel went out.
Highway maintenance personnel from Destruc- tion Bay have indicated that the icing build-up at Burlap creek during the 197911980 winter was not the largest observed at this site. The approximate volume of the icing (see Figure 10) was 14,000 m3. This volume accumulated over a period of approxi-
mately 150 days when daily mean temperatures were below freezing (see Figure 7A). If one assumes that all the water discharged in Burlap creek during this time was stored as ice upstream of the culvert, then the volume of the icing would represent an average discharge rate of approximately 3.9 m3 per hour. It is known, however, that some water passed through the culvert during at least part of the icing period; if the flow rate of 9.4 m3 per hour, meas- ured in September 1980, were representative of the groundwater discharge for most of the winter of 19791 1.980, an average flow of about 5.5 m3 per hour would have passed through the culvert. If this water were also to be stored as ice, then the volume of the Burlap creek icing could reach 33,700 m3, which could extend the icing area a further 100 m upstream and increase the thickness by an average of about 1.2 m over the l979/ 1980 level.
Icing Build-up Processes
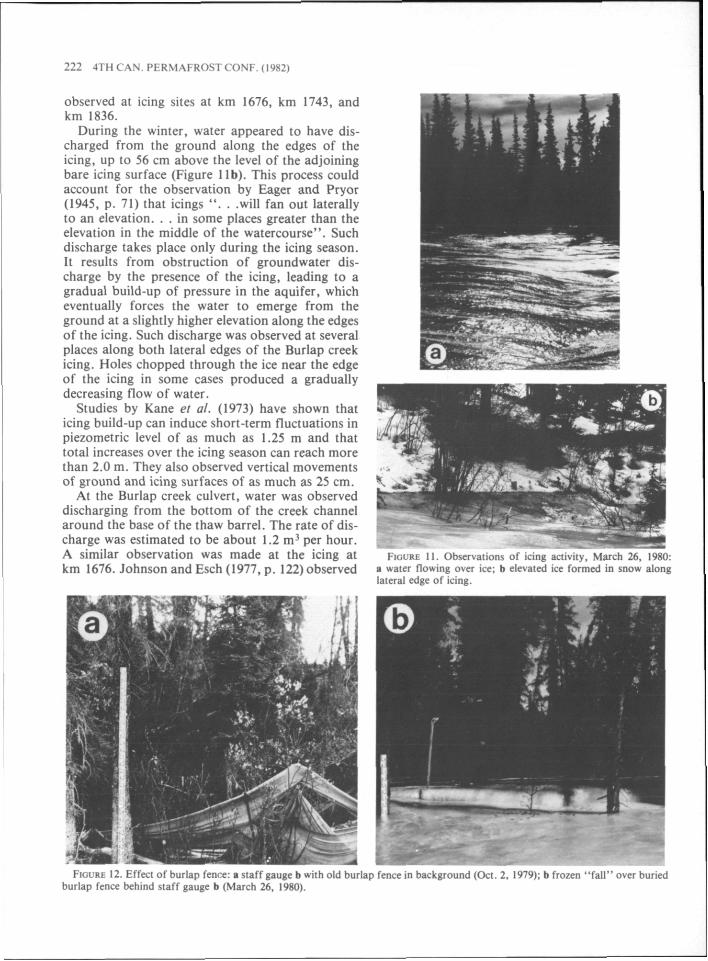
A number of observations made during the March 1980 visit to the icing site contributed further to the understanding of the icing process.
During late night and early morning little or no water was flowing over the surface of the icing. The limited flow that did take place appeared to move primarily through openings between the upper layers of the icing; water that emerged onto the sur- face froze quickly, within a short distance of its point of emergence. By the end of the morning, widespread flow over the icing gradually became established (Figure 1 la). It was found that much of this flow reached the surface of the icing through fractures in icing mounds and along the stems of shrubs and bushes. This phenomenon, described earlier by Johnson and Esch (1977, p. 1 19), was also
222 4TH CAN. PERMAFROSTCONF. ( I Y U 2 l
observed at icing sites at km 1676, km 1743, and km 1836.
During the winter, water appeared to have dis- charged from the ground along the edges of the icing, up to 56 cm above the level of the adjoining bare icing surface (Figure l lb) . This process could account for the observation by Eager and Pryor (1945, p. 71) that icings ". . .will fan out laterally to an elevation. . . in some places greater than the elevation in the middle of the watercourse". Such discharge takes place only during the icing season. It results from obstruction of groundwater dis- charge by the presence of the icing, leading to a gradual build-up of pressure in the aquifer, which eventually forces the water to emerge from the ground at a slightly higher elevation along the edges of the icing. Such discharge was observed at several places along both lateral edges of the Burlap creek icing. Holes chopped through the ice near the edge of the icing in some cases produced a gradually decreasing flow of water.
Studies by Kane et a/. (1973) have shown that icing build-up can induce short-term fluctuations in piezometric level of as much as 1.25 m and that total increases over the icing season can reach more than 2.0 m. They also observed vertical movements of ground and icing surfaces of as much as 25 cm.
At the Burlap creek culvert, water was observed discharging from the bottom of the creek channel around the base of the thaw barrel. The rate of dis- charge was estimated to be about 1.2 m1 per hour. A similar observation was made at the icing at km 1676. Johnson and Esch (1977, p. 122) observed
. I . . , -... .,- -. .. II - Ir<;cn~ I I . Ohnervarionr of ccmp acuw\ . \ l a r c h ih, l v10:
s water flowing over ice; b elevaled ice formed in snow along lateral edge of icing.

Hydrology in Permafrost Regions 223
the same phenomenon in Alaska; they suggested that this discharge resulted from thawing .of sea- sonal frost in the channel. Such flow would tend to relieve pressures in the groundwater system upstream.
The effect of the main burlap fence across Burlap creek (Figure 12a) could still be seen on March 26, although the time-lapse photography indicated that the fence had been overtopped by ice on February 7. A frozen "fall", 40 cm high, was found slightly downhill from the position of the buried fence behind staff gauge b (Figure 125). After all the ice had melted, the March 27 ice-level markers revealed that the ice in front of the fence had been 2.0 m thick, whereas that behind the fence was slightly over 2.4 m thick. The frozen fall had gradually been displaced in a downhill direction from the location of the fence, as ice accumulated above, on the front of, and below the fence. If icing activity had con- tinued longer, the fall would eventually have been eliminated by the more rapid accumulation of ice at its base.
On September 10, 1980, two test pits were dug near the upper end of the icing; their locations are marked on the map (see Figure 10) and in a cross- section (Figure 13) constructed on the basis of a survey conducted on the same date.
Test pit No. 1 penetrated 25 cm of peat, 25 cm of mixed peat and volcanic ash, 2 cm of clean ice, and 15 cm of water-saturated mixed silt and volcanic ash; it was terminated 15 cm into a layer of satu- rated sandy gravel ("washed" till?). Test pit No. 2 penetrated 30 cm of peat, 40 cm of mixed peat and volcanic ash (with thin ice lenses in the lower 5 cm), and 75 cm of clean ice; it was terminated in satu- rated sandy gravel ("washed" till?). The grain-size distribution in a sample of the sandy gravel was pre- sented earlier (see Figure 2). The mixing of peat and volcanic ash observed in the test pits is post-deposi-
I
= Pa., V D I S . " , C a s h
o- :: O C D " t l D l ,,,, 0 0 l " t
FIGURE 13. Section across Burlap creek about 215 m upstream from the highway culvert, showing ice levels on March 27, 1980 and subsurface data from two test pits.
tional and is presumed to have resulted from re- peated frost action (heaving,. formation of frost blisters) and subsequent slumping.
A low cavity (4 to 6 cm high) was found to extend horizontally between the ice and the underlying sandy gravel in test pit No. 2. This cavity could have been formed by slow melting of the base of the ice by heat from the water moving through the sandy gravel, or it could be a remnant of the cavity of a frost blister. The positions of the March 27 ice-level markers, relative to each other and relative to the ground surface along the section (see Figure 13), appear to indicate that a large, low frost blister may have existed here during the 19791 1980 winter. Such a frost blister was described by Eager and Pryor (1945, p. 64) from another icing area along the Alaska Highway. Diagnostic criteria for the recog- nition of frost blisters, as well as a description of their seasonal development have been published by van Everdingen (1978).
Potemtisd Cures foe !king ProbUems
While maintenance expedients in icing control in- clude operation of thaw barrels, installation of bur- lap fences, steaming of culverts and of channels in icings, and scraping of ice off roadways, they remain essentially the same as they were when the Alaska Highway was constructed. The Yukon Territorial Government has recently started using electric heating cables in culverts at some tenacious icing sites where power is, or can readily be made, accessible (Quong 1978). At a number of icing sites, overflow culverts have been installed above pre- dicted or observed maximum icing levels, to accom- modate spring runoff over these icings.
Present methods of icing control have a number of drawbacks that vary in significance, depending on local conditions. Calcium chloride, used during the early part of the icing season, and diesel fuel leaking from thaw-barrel installations both contam- inate the lower reaches of the streams on which they are used. In some icing areas the vegetation is extensively damaged by seasonal drowning, by ver- tical movements of the icing ice, and through trim- ming during ice-removal operations. Some sites are littered by the remains of burlap fences (see Figure 12a).
The efficiency of thaw barrels as an icing-control device is severely limited by several factors that in- clude incomplete burning of fuel (many "moose warmers" smoke); high rates of heat loss to the atmosphere; flame-outs, which often result in the barrel being completely buried in ice; and varying (in some cases high) rates of fuel loss through theft.

224 4TH CAN. PERMAFROST CONF. (1982)
Normal rates of fuel consumption by individual thaw barrels average. about 50 litres per day accord- ing to J. W. Flummerfelt (pers. commun., Jan- uary 26, 1981). Theft occasionally raises this figure to over 200 litres per day for some installations. To assure more or less continuous operation in spite of these shortcomings, thaw-barrel installations are usually visited for checking andlor refueling at least every other day (except on weekends).
Use of steam to open channels through ice- blocked culverts is a well-established practice. It can be very effective, especially when steampipes, with vertical risers at both ends, are installed perma- nently (and filled with antifreeze to prevent freez- ing). Steam is also used extensively to cut deep, narrow channels in icings to accelerate drainage towards the culverts. The steaming operations are expensive and may have to be repeated several times, unless culverts are steamed open at exactly the right time at the beginning of the snow-melt period.
It can be readily appreciated that the costs in- volved in such icing-control operations constitute a significant portion of the highway maintenance budget. A conservative estimate of the expenditures for icing control a t the Burlap creek icing site during the 19791 1980 winter, based on the mainte- nance record (see Table 3b), is about $20,000. The figure may be somewhat lower in some winters and could be considerably higher in others. The magni- tude of this expenditure on icing control at a single icing site during a single icing season indicates that it would be financially attractive to incorporate spe- cial icing-control features in the design and con- struction of new drainage structures, if icing prob- lems could thereby be eliminated for a significant period of time. If, for instance, an extra $50,000 spent on design and construction of a new crossing at Burlap creek could eliminate icingcontrol requirements for a ten-year period, a potential saving of $200,000 in maintenance costs would be achieved.
Some of the sites where icings create maintenance problems every winter have been called incurable by Quong (1978). This label should apply only insofar as icing formation is concerned. It must be possible, in at least a number of these cases, to create con- ditions in which icings will form either upstream or downstream of the highway crossings in such a way that the continued passage of traffic, as well as un- impeded spring runoff do not require any special maintenance efforts.
One approach that may achieve this is the provi- sion of an "ice-storage" area upstream of the high-
way, which should have sufficient capacity to ac- commodate the full icing volume with a maximum ice level well below the elevation of the travelling surface. Overflow culverts, with their invert eleva- tions above the maximum predicted icing level, would have to be installed to accommodate spring runoff. Based on the maximum volume and maxi- mum height calculated for the Burlap creek icing, the "ice storage" approach would require that the grade level be raised by 1.2 m plus the diameter of the overflow culvert plus the depth of fill required over the culvert, or a total of at least 3 m. Special stability measures have to be incorporated in the design and construction of the highway embank- ment at "ice-storage" sites, because ponding of water against the embankment during spring runoff through the overflow culvert will tend to cause satu- ration of the embankment materials. This in turn might lead to failure of the embankment.
In view of the existing plans for the reconstruc- tion of portions of the Alaska Highway, a more practical choice for the solution of icing problems at sites like km 1817.5 could be the installation of subdrains. For this method to be effective, springs and diffuse groundwater seepage would have to be intercepted close to their source, with lateral sub- drains installed below the level of seasonal frost if possible (Johnson and Esch 1977, p. 124).
In the case of Burlap creek, this would require subdrains extending possibly as far as 200 m up- stream from the highway. They would have to be designed and constructed in such a way that clog- ging by volcanic ash and silt is prevented. This might require either graded filters over and around the drains to prevent "piping" of fines into them, or careful sizing of the drains to allow continuous flushing of any fines that do enter them, or both. A subdrain system for the Burlap creek site would have to accommodate flows of about 9.4 m3 per hour, possibly somewhat higher during the initial period after installation, during which the ground- water level is being drawn down slightly from its pre-installation position.
Reliable information on the temperature regime of the groundwater at the points of discharge would be required to determine whether subdrains should be insulated and, if so, to what extent. Natural in- sulating material (peat) is available at a number of sites; at other sites the use of man-made insulation could be . more economical. Special protective arrangements might be necessary to protect drain outlets from freezing, which could render the sys- tem inoperative.
A hybrid icingcontrol system that combines a

Hydrology in Permafrost Regions 225
.-Select material
'2 k S e l e c t material
CROSS SECTION
, Common backf i l l 7
P- L ~ n s u ~ a t i o n Select mater ia l
L ~ t e a m p i p e
SECTION A T CENTRE LINE
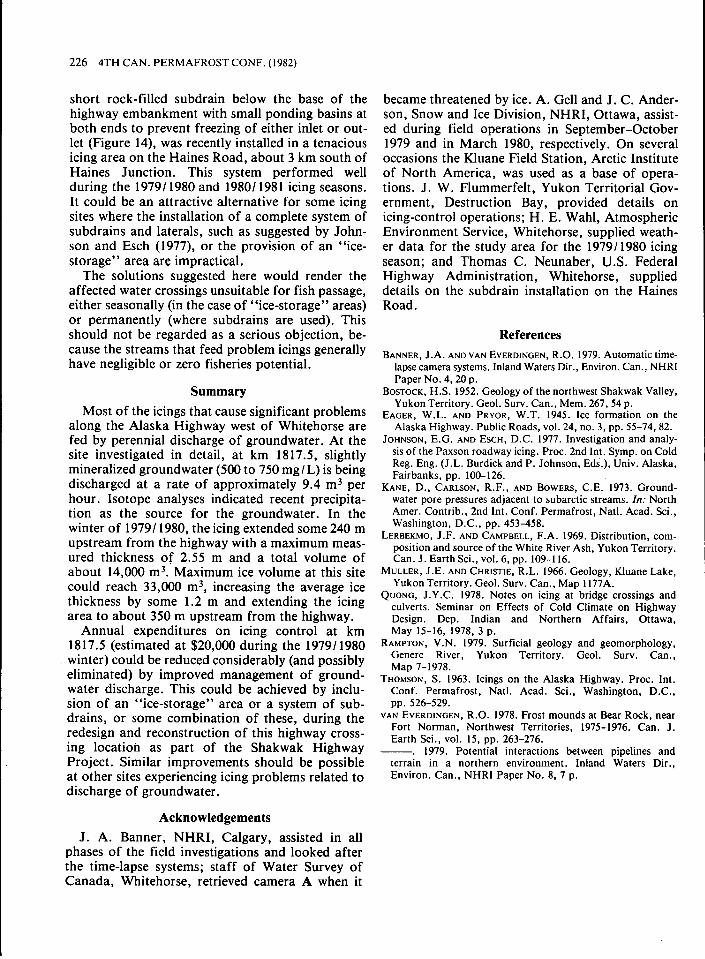
FIGURE 14. Subdrain and culvert installation for groundwater-fed icing sites, modified from a design used on the Haines Road about 3 km south of Haines Junction (modified after Public Works Canada).
226 4TH CAN. PERMAFROST CONF. (1982)
short rock-filled subdrain below the base of the highway embankment with small ponding basins at both ends to prevent freezing of either inlet or out- let (Figure 14), was recently installed in a tenacious icing area on the Haines Road, about 3 km south of Haines Junction. This system performed well during the 19791 1980 and 19801 1981 icing seasons. It could be an attractive alternative for some icing sites where the installation of a complete system of subdrains and laterals, such as suggested by John- son and Esch (1977), or the provision of an "ice- storage" area are impractical.
The solutions suggested here would render the affected water crossings unsuitable for fish passage, either seasonally (in the case of "ice-storage" areas) or permanently (where subdrains are used). This should not be regarded as a serious objection, be- cause the streams that feed problem icings generally have negligible or zero fisheries potential.
Summary Most of the icings that cause significant problems
along the Alaska Highway west of Whitehorse are fed by perennial discharge of groundwater. At the site investigated in detail, at km 1817.5, slightly mineralized groundwater (500 to 750 mgl L) is being discharged at a rate of approximately 9.4 m3 per hour. Isotope analyses indicated recent precipita- tion as the source for the groundwater. In the winter of 19791 1980, the icing extended some 240 m upstream from the highway with a maximum meas- ured thickness of 2.55 m and a total volume of about 14,000 m3. Maximum ice volume at this site could reach 33,000 m3, increasing the average ice thickness by some 1.2 m and extending the icing area to about 350 m upstream from the highway.
Annual expenditures on icing control at km 1817.5 (estimated at $20,000 during the 19791 1980 winter) could be reduced considerably (and possibly eliminated) by improved management of ground- water discharge. This could be achieved by inclu- sion of an "ice-storage" area or a system of sub- drains, or some combination of these, during the redesign and reconstruction of this highway cross- ing location as part of the Shakwak Highway Project. Similar improvements should be possible at other sites experiencing icing problems related to discharge of groundwater.
Acknowledgements
became threatened by ice. A. Gel1 and J. C. Ander- son, Snow and Ice Division, NHRI, Ottawa, assist- ed during field operations in September-October 1979 and in March 1980, respectively. On several occasions the Kluane Field Station, Arctic Institute of North America, was used as a base of opera- tions. J. W. Flummerfelt, Yukon Territorial Gov- ernment, Destruction Bay, provided details on icing-control operations; H. E. Wahl, Atmospheric Environment Service, Whitehorse, supplied weath- er data for the study area for the 197911980 icing season; and Thomas C. Neunaber, U.S. Federal Highway Administration, Whitehorse, supplied details on the subdrain installation on the Haines Road.
References BANNER, J.A. AND VAN EVERDINGEN, R.O. 1979. Automatic time-
lapse camera systems. Inland Waters Dir., Environ. Can., NHRI Paper No. 4,20 p.
BOSTOCK, H.S. 1952. Geology of the northwest Shakwak Valley, Yukon Territory. Geol. Surv. Can., Mem. 267,54 p.
EAGER, W.L. AND PRYOR, W.T. 1945. Ice formation on the Alaska Highway. Public Roads, vol. 24, no. 3, pp. 55-74,82.
JOHNSON, E.G. AND ESCH, D.C. 1977. Investigation and analy- sis of the Paxson roadway icing. Proc. 2nd Int. Symp. on Cold Reg. Eng. (J.L. Burdick and P. Johnson, Eds.), Univ. Alaska, Fairbanks, pp. 100-126.
KANE, D., CARLSON, R.F., AND BOWERS, C.E. 1973. Ground- water pore pressures adjacent to subarctic streams. In: North Amer. Contrib., 2nd Int. Conf. Permafrost, Natl. Acad. Sci., Washington, D.C., pp. 453-458.
LERBEKMO, J.F. AND CAMPBELL, F.A. 1969. Distribution, com- position and source of the White River Ash, Yukon Territory. Can. J . Earth Sci., vol. 6, pp. 109-1 16.
MULLER, J.E. AND CHRISTIE, R.L. 1966. Geology, Kluane Lake, Yukon Territory. Geol. Sum. Can., Map 1177A.
QUONG, J.Y.C. 1978. Notes on icing at bridge crossings and culverts. Seminar on Effects of Cold Climate on Highway Design. Dep. Indian and Northern Affairs, Ottawa, May 15-16, 1978, 3 p.
RAMPTON, V.N. 1979. Surficial geology and geomorphology, Generc River, Yukon Territory. Geol. Surv. Can., Map 7-1978.
THOMSON, S. 1963. Icings on the Alaska Highway. Proc. Int. Conf. Permafrost, Natl. Acad. Sci., Washington, D.C., pp. 526-529.
VAN EVERDINGEN, R.O. 1978. Frost mounds at Bear Rock, near Fort Norman, Northwest Territories, 1975-1976. Can. J. Earth Sci., vol. 15, pp. 263-276.
-. 1979. Potential interactions between pipelines and terrain in a northern environment. Inland Waters Dir., Environ. Can., NHRl Paper No. 8, 7 p.
J. A. Banner, NHRI, Calgary, assisted in all phases of the field investigations and looked after the time-lapse systems; staff of Water Survey of Canada, Whitehorse, retrieved camera A when it