Embed Size (px)
Citation preview
Fisheries Research Report No. 196, 2009
Fisheries Research DivisionWestern Australian Fisheries and Marine Research Laboratories PO Box 20 NORTH BEACH, Western Australia 6920
Fisheries Research andDevelopment Corporation
Australian Government
Management of bioeroding sponges in wild stocks of Pinctada maxima
in Western AustraliaFinal FRDC Report – Project 2005/074
Sabine Daume, Jane Fromont, Anthony Hart

ii Fisheries Research Report [Western Australia] No. 196, 2009
Correct citation:
Daume, S., Fromont, J., Hart, A. (2009). Management of bioeroding sponges in wild stocks of Pinctada maxima in Western Australia. Final report to Fisheries Research and Development Corporation on Project No. 2005/074. Fisheries Research Report No. 196. Department of Fisheries, Western Australia. 48p.
Enquiries:
WA Fisheries and Marine Research Laboratories, PO Box 20, North Beach, WA 6920 Tel: +61 8 9203 0111 Email: [email protected] Website: www.fish.wa.gov.au ABN: 55 689 794 771
A complete list of Fisheries Research Reports is available online at www.fish.wa.gov.au
This work is copyright. Except as permitted under the Copyright Act 1968, no part of this publication may be reproduced by any process, electronic or otherwise, without specific written permission of the copyright owners. Neither may information be stored electronically in any form whatsoever without such permission.
The Fisheries Research and Development Corporation plans, invests in, and manages fisheries research and development throughout Australia. It is a federal statutory authority jointly funded by the Australian Government and the fishing industry.
© Department of Fisheries, Western Australia. November 2009. ISSN: 1035 - 4549 ISBN: 1 921258 73 X

Fisheries Research Report [Western Australia] No. 196, 2009 iii
Contents
Non technical summary ....................................................................................................... 1
Objectives ....................................................................................................................... 1
Outcome achieved .......................................................................................................... 1
Acknowledgements ........................................................................................................ 3
1.0 Introduction .................................................................................................................. 4
1.1 Background ............................................................................................................. 4
1.2 Need ........................................................................................................................ 4
1.3 Objectives ............................................................................................................... 5
2.0 Methods ......................................................................................................................... 5
2.1 Site description and habitat types ........................................................................... 5
2.2 Habitat sampling ..................................................................................................... 5
2.3 Pearl shell sampling ............................................................................................... 72.3.1 Pearl shell sampling for spatial and temporal distribution of bioeroding sponges ...................................................................................... 72.3.2 Pearl shell sampling for area and volume estimated of bioeroding sponge erosions ............................................................................................ 7
2.4 Estimating pearl oyster stock density and density of infested shells ..................... 9
2.5 Bioeroding sponge identification .......................................................................... 102.5.1 Visual assessment of bioeroding sponges .................................................... 102.5.2 Histological identification of bioeroding sponge species ............................ 11
2.6 Frequency of occurrence of bioeroding sponge species......................................... 11
2.7 Area and volume estimation of bioeroding sponges .............................................. 11
2.8 Data analyses .......................................................................................................... 12
3.0 Results .......................................................................................................................... 12
3.1 Bioeroding sponge species frequency of occurrence in habitat and shell samples ........................................................................................................... 12
3.2 Visual assessments of bioeroding sponges and histological confirmation in shell samples ....................................................................................................... 14
3.2.1 Correlating visual detection of bioeroding sponges with histology ............ 14
3.3 Bioeroding sponge infestation rates in habitat samples ......................................... 18
3.4 Spatial and temporal pattern of bioeroding sponge infestation in pearl shells ...... 18
3.5 Monitoring of bioeroding sponges using visual assessments ................................ 22
3.6 Area and volume calculations of bioeroding sponges ............................................ 24
4.0 Discussion ..................................................................................................................... 33
4.1 Bioeroding sponge species occurrence and infestation rates ................................ 33
4.2 Visual assessments of bioeroding sponges ............................................................. 33
4.3 Bioeroding sponge in relation to pearl oyster shell size ........................................ 34
iv Fisheries Research Report [Western Australia] No. 196, 2009
4.4 Bioeroding sponge in the main pearl oyster fishing grounds................................. 35
4.5 Bioeroding sponge species occurrence and amount of erosion ............................. 36
5.0 Benefits .......................................................................................................................... 36
6.0 Further Development ................................................................................................... 37
7.0 Planned Outcomes ........................................................................................................ 38
8.0 Conclusions ................................................................................................................... 38
9.0 References ..................................................................................................................... 40
10.0 Appendices .................................................................................................................... 42
10.1 Appendix 1: Field guide to identify bioeroding sponges in pearl oyster shell ...... 42
10.2 Appendix 2: Intellectual Property .......................................................................... 42
10.3 Appendix 3: Staff .................................................................................................... 42
10.4 Appendix 4: Examples of sponge infestation grades From the field guide ........... 42
Fisheries Research Report [Western Australia] No. 196, 2009 1
Non technical summary
Management of bioeroding sponges in wild stocks of Pinctada maxima in Western Australia
Principal Investigator: Dr Sabine Daume
Address: Department of Fisheries Western Australian Fisheries and Research Laboratories PO Box 20 North Beach, WA 6020 Telephone: 08 92030219 Fax: 08 9230199
Objectives1. To develop a field guide for identifying bioeroding sponges present in Pinctada maxima
2. To develop sampling techniques for estimating the biomass and reproductive capacity of bioeroding sponges in pearl oyster shells and benthic substrates
3. To estimate the effect of size/age, location and time on infection rates of bioeroding sponges in wild stocks of Pinctada maxima for key fishing locations
4. To establish a sponge infestation database, including both oysters and the habitat in which they live, for representative fishing grounds
5. To evaluate management options to maintain the health of the wild stocks and ameliorate the economic impact of bioeroding sponge infestation on the industry
Outcome achieved
Data on bioeroding sponge species that excavate shells of the pearl oyster, Pinctada maxima, was collected from the main fishing grounds in North Western Australia. Estimates on infestation rates across size/age classes of shell are provided from the main fishing grounds and over three consecutive fishing seasons. Minimal infestation occurred in smaller shells therefore lowering the minimum size provides one approach to minimizing the impact of these sponges. Estimates of infestation rates in calcareous substrates of the fishing ground are also provided and compared on an area basis with shell infestation rates, including shell density and calcareous substrate density estimates of the fishing grounds. Techniques were developed to estimate the volume of bioeroding sponge erosions in pearl oyster shells and results are compared between different sponge species and fishing grounds. A field guide was developed to demonstrate the most common visual appearances of bioeroding sponge infestations. Industry and research personnel can use this field guide for bioeroding sponges in general and as a guideline to determine grades of infestation during field surveys.
2 Fisheries Research Report [Western Australia] No. 196, 2009
The Western Australian fishery is the only remaining significant fishery for pearl oysters in the world and comprises most of the exported pearl product of Australia, currently worth around $125 million annually. The majority of pearl shells used to culture pearls come from the pearling beds in the inshore waters near Broome. The fishery for pearl oysters preferentially targets smaller ‘culture’ shell (4-5 years age class, 120mm - 160mm shell length) that are more suitable for growing pearls, leaving larger MOP oysters (6+ age class, 175mm+) on the fishing grounds.
Silver-lipped pearl oysters (Pinctada maxima) harvested from wild stocks and transferred to farms are experiencing considerable levels of infestation of bioeroding sponges. Bioeroding sponges can damage the shell and sometimes the pearl and thus reduce the value of the pearls. Despite the potential loss to the industry, little was known about bioeroding sponges in pearl oyster wild stocks at the start of this project.
A total of seven bioeroding sponge species were found in pearl oyster shell samples from the fishing grounds in North Western Australia: Pione velans, Cliona dissimilis, Cliona orientalis, two unidentified species of Cliona, and two unidentified species, one of Aka and one of Zyzzya. Pione velans was the dominant species at all study sites followed by C. dissimilis. However Cliona dissimilis eroded more shell material than P. velans at two of the sites, which may imply differences in local recruitment patterns of these bioeroding sponge species. The main species (P. velans) appeared to have had high recruitment rates recently, based on the high number of smaller infestations seen for this species, whereas C. dissimilis may have had low recruitment rates at these sites as it showed low numbers of larger infestations.
The presence of bioeroding sponges is generally indicated by the presence of small pits (1-3 mm in diameter) that are sometimes associated with orange-yellow or red coloration. However colour is not a suitable criterion to separate species. The two main species occurred in a range of colours.
In pearl oyster shells a lower infestation rate was found in the 2-3 year age class compared to the 4-5 and 6+ year age classes. The sponge infestation rate increased with pearl oyster shell size. Shells smaller than 115 mm in shell length (spat) had negligible infestation. Lowering the size limit to the larger end of the 2-3-age class (115-120 mm in shell length) could potentially reduce the overall infestation rate of animals on industry farms, if the wild stock is the major source of infestation. If, after further discussion with industry, this is regarded as a possible and feasible strategy, the implications to the stock structure would need to be assessed after full consideration by the management advisory committee.
Estimates of potential bioeroding sponge habitat showed that all other calcareous substrates (excluding pearl shells) is at least two orders of magnitude more available than shell habitat. However areas of infestation are higher in shells than in habitat, indicating that bioeroding sponges may have a preference for pearl oyster shell. Calcareous substrate will contribute to the spreading of the sponge to a lesser degree than discarded and larger shells.
A clear relationship was found between the estimated eroded area on the surface of pearl oyster shells and the internal erosion volume of bioeroding sponge. This relationship can be described with simple, linear regressions. Therefore surface area estimates can provide a good indication of internal erosion volume in pearl oyster shells and is a suitable method for use on industry vessels. Grading shells into three different categories, according to the severity of erosion, proved to be a suitable method to quickly assess the amount of erosion caused by bioeroding sponges. Generally the methods were more accurate in shells with larger amounts of erosion.
Fisheries Research Report [Western Australia] No. 196, 2009 3
However a large proportion of all pearl shells had visual signs of infestation but active sponge tissue was confirmed in only 1/3 of these samples, indicating that visual assessment can not give a reliable indication of active bioeroding sponges and results of monitoring programs need to be confirmed by histological examinations on a regular basis to determine active sponge tissue.
The field guide that was developed as part of this project will help industry and research personnel to identify bioeroding sponges in general and can be used to determine grades of infestation during field surveys. However, it cannot be used to identify species because external appearance proved to be unsuitable for species identification.
Key wORDs: Bioeroding sponges, calcareous habitat, erosion area, biomass, pearl oyster, Pinctada maxima, Pione velans, Cliona dissimilis, Western Australia
Acknowledgements
This project would have not been possible without the support of the Western Australian Pearling Industry (PPA). We are grateful to the crews and divers of the industry vessels for allowing us to come on board and sample the shells and conduct the habitat surveys using a tender vessel to reach the sites.
I would like to thank the Fisheries Technical Officers David Murphy, Fiona Parker, Mark Davidson, Frank Fabris, Jamin Brown and Sam Hair as well as Oliver Gomez from the WA Museum for their enthusiasm and hard work on this project.
Dr Nick Caputi reviewed various sections of the report and provided guidance on management recommendations.
Finally we thank the Fisheries Research and Development Corporation for funding this project (2005/075).

4 Fisheries Research Report [Western Australia] No. 196, 2009
1.0 Introduction
1.1 Background
The West Australian Pearling industry is one of Australia’s most valuable aquaculture industries, currently generating around $125 million annually (Wells & Jernakoff 2006). The majority of pearl shell used to culture pearls come from the pearling beds in the inshore waters near Broome. The fishery for pearl oysters preferentially targets smaller ‘culture’ shell (120mm - 160mm shell length) that are more suitable for growing pearls, leaving larger MOP oysters (175mm+) on the pearling grounds. Historically, MOP were harvested in large numbers to service the trade in shell buttons and other nacre products. The harvest of MOP, which occurred for most of the 20th century, was discontinued in the mid 1980’s as the markets declined and the requirement for culture shells became into the main focus.
Silver-lipped pearl oysters (Pinctada maxima) harvested from wild stocks and transferred to farms in both WA and NT are experiencing considerable levels of infestation of bioeroding sponges (hereafter Cliona sp.). Cliona sp. life history traits (sexual and asexual reproduction) may be allowing them to exploit previously unavailable niches created by industry harvesting and cleaning practices, and increase their population sizes beyond what would naturally occur, and the subject of this project is to assess whether this hypothesis is true. A workshop in Broome in October 2003 on the wild pearl oyster fishery identified Cliona as a chief concern for the future sustainability of the natural resource (Challenge 1), as well as imposing a multi-million cost to the industry at the pearling farm sites. Discussion initially focused on assessing the problem in wild stocks and farm sites, however, this was deemed too broad for an initial study, and the agenda constrained to the wild fishery stocks, with farm site issues to be addressed pending the outcomes of work on wild stocks.
1.2 Need
Cliona sponges burrow into shell causing damage and occasionally death, rendering the half-shell, and occasionally the pearl, unsaleable. Estimates of cost to the industry from Cliona sp. run into the millions of dollars per year (Moase et al. 1999) and preliminary studies have identified the species responsible and some aspects of their reproductive cycle relevant to pest management and control (Rawlinson 2000, Fromont et al. 2006). However, there is need to understand, and then control, the recruitment/ infection rate of Cliona sp., and the project shall provide this knowledge. The specific knowledge sought is an understanding of the process of recruitment or transmission of sponges onto pearl oysters, and an assessment of the source of bioeroding sponges in the environment. Key areas of investigation are the distribution and abundance of Cliona sp. relative to size and age of oysters, and in the fishing ground habitats, and key biological questions are: is the incidence of Cliona sp. increasing in wild stocks over time, and what effect is the biomass of bioeroding sponges in large, unfished pearl shell having on the fished proportion of the population? Effective management of these sponges in the pearling industry requires that the recruitment issue be resolved, so remedial action can be focused correctly. Management outcomes from the project are likely to include changes to wild-shell fishing practices, shell treatment and shell discard processes, all of which will ameliorate the economic impact of Cliona sp. on the industry and maintain the health of the wild stocks.
Fisheries Research Report [Western Australia] No. 196, 2009 5
1.3 Objectives1. To develop a field guide for identifying bioeroding sponges present in Pinctada maxima
2. To develop sampling techniques for estimating the biomass and reproductive capacity of bioeroding sponges in pearl oyster shells and benthic substrates
To estimate the effect of size/age, location and time on infection rates of bioeroding sponges in wild stocks of Pinctada maxima for key fishing locations
To establish a sponge infestation database, including both oysters and the habitat in which they live, for representative fishing grounds.
To evaluate management options to maintain the health of the wild stocks and ameliorate the economic impact of bioeroding sponge infestation on the industry
2.0 Methods
2.1 Site description and habitat types
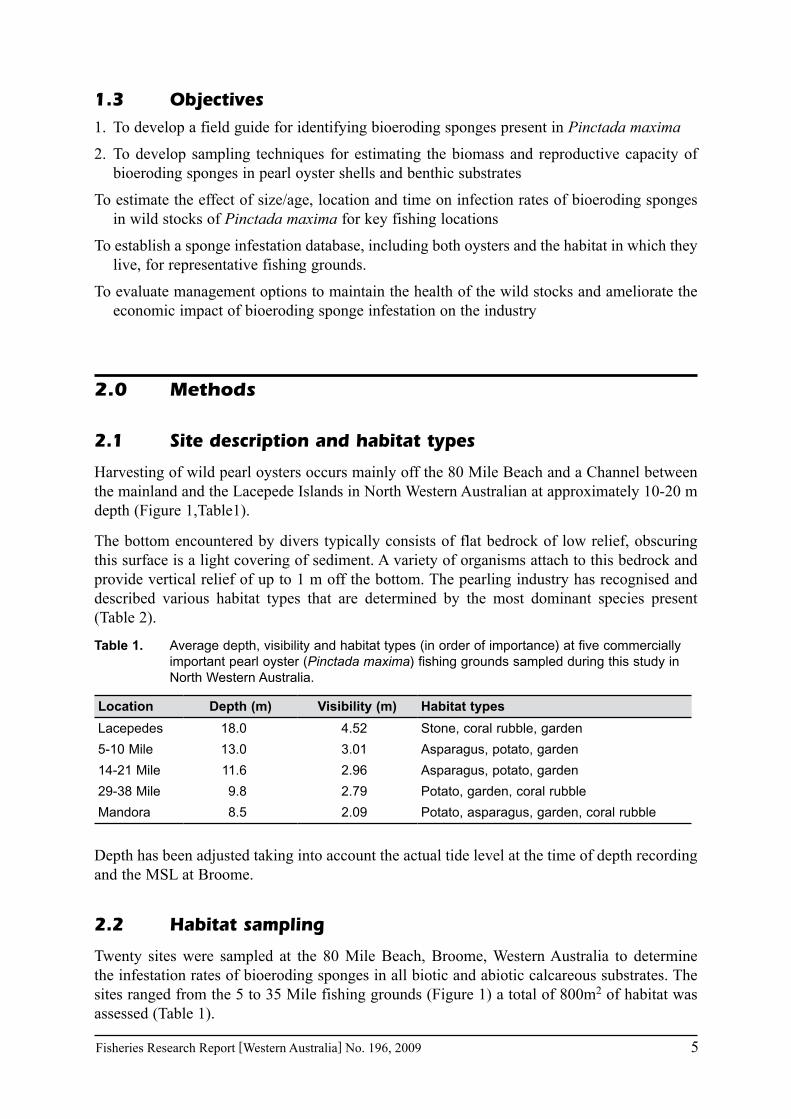
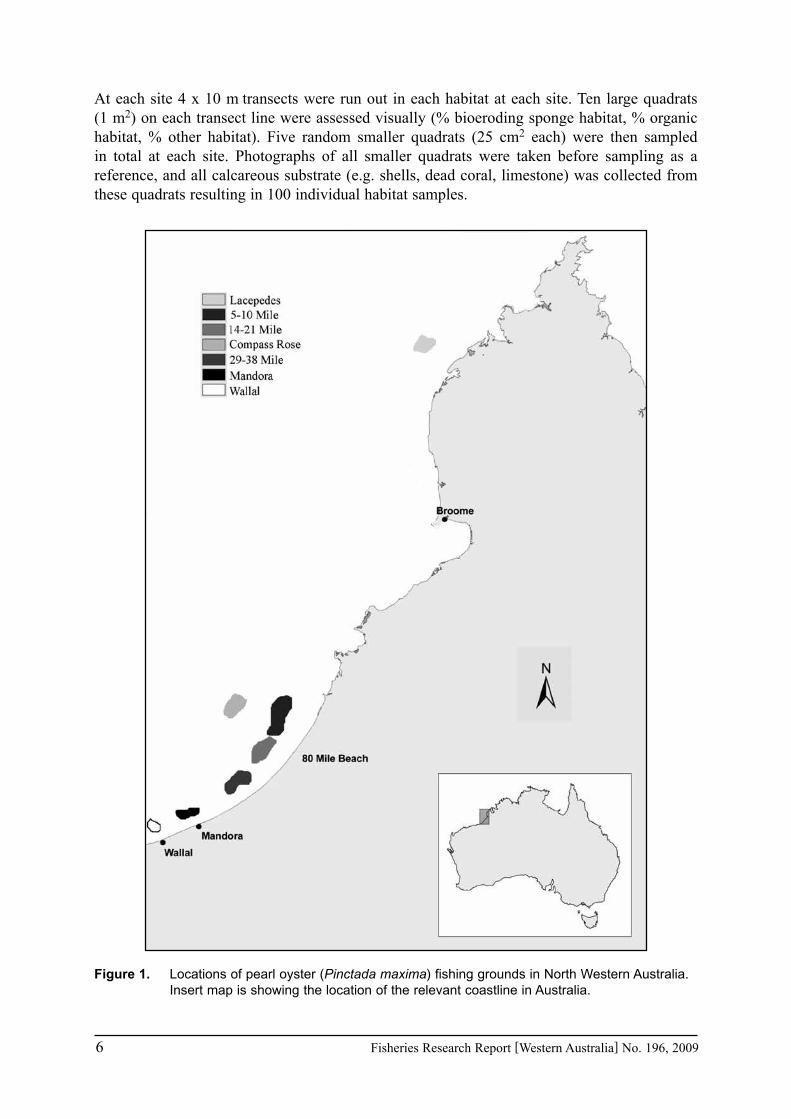
Harvesting of wild pearl oysters occurs mainly off the 80 Mile Beach and a Channel between the mainland and the Lacepede Islands in North Western Australian at approximately 10-20 m depth (Figure 1,Table1).
The bottom encountered by divers typically consists of flat bedrock of low relief, obscuring this surface is a light covering of sediment. A variety of organisms attach to this bedrock and provide vertical relief of up to 1 m off the bottom. The pearling industry has recognised and described various habitat types that are determined by the most dominant species present (Table 2).
Table 1. Average depth, visibility and habitat types (in order of importance) at five commercially important pearl oyster (Pinctada maxima) fishing grounds sampled during this study in North Western Australia.
Location Depth (m) Visibility (m) Habitat types
Lacepedes 18.0 4.52 Stone, coral rubble, garden
5-10 Mile 13.0 3.01 Asparagus, potato, garden
14-21 Mile 11.6 2.96 Asparagus, potato, garden
29-38 Mile 9.8 2.79 Potato, garden, coral rubble
Mandora 8.5 2.09 Potato, asparagus, garden, coral rubble
Depth has been adjusted taking into account the actual tide level at the time of depth recording and the MSL at Broome.
2.2 Habitat sampling
Twenty sites were sampled at the 80 Mile Beach, Broome, Western Australia to determine the infestation rates of bioeroding sponges in all biotic and abiotic calcareous substrates. The sites ranged from the 5 to 35 Mile fishing grounds (Figure 1) a total of 800m2 of habitat was assessed (Table 1).
6 Fisheries Research Report [Western Australia] No. 196, 2009
At each site 4 x 10 m transects were run out in each habitat at each site. Ten large quadrats (1 m2) on each transect line were assessed visually (% bioeroding sponge habitat, % organic habitat, % other habitat). Five random smaller quadrats (25 cm2 each) were then sampled in total at each site. Photographs of all smaller quadrats were taken before sampling as a reference, and all calcareous substrate (e.g. shells, dead coral, limestone) was collected from these quadrats resulting in 100 individual habitat samples.
Figure 1. Locations of pearl oyster (Pinctada maxima) fishing grounds in North Western Australia. Insert map is showing the location of the relevant coastline in Australia.

Fisheries Research Report [Western Australia] No. 196, 2009 7
Table 2. Descriptions of habitat types encountered during this study.
Habitat types Description
Stone Stones and coral rubble of various sizes covered by coralline red algae and rounded by the rolling effect from tides and currents. A mixture of whip corals, sea fans, sponges and coloured corals can be attached.
Garden Diverse faunal assemblages dominated by alcyonarian sea whips, which grow to a height of 1m. A variety of sponges and ascidians are present and coral cups are common.
Asparagus Clustered varieties of sponges mostly green/grey and silted in varying densities.
Potato Dominated by a round and densely packed ascidian species that grows attached to the bottom. Sponges are present with a large variety of vase shaped, cup and massive sponges up to 0.5m high.
2.3 Pearl shell sampling
2.3.1 Pearl shell sampling for spatial and temporal distribution of bioeroding sponges
During the commercial fishing season (March – June) of the years 2004-2006, 1033 pearl shells were sampled from seven major pearl oyster fishing grounds in North Western Australia (Figure 1). Sampling was divided up into specimens examined for laboratory (spicule identification) and histological examination for species identification, and a much larger data set that was visually assessed on board industry vessels (~ 67,000 shells).
The samples were taken from four age classes of pearl oysters (Pinctada maxima) 0-1, 2-3, 4-5 and 6+ years (Table 4A). The sampling was done systematically and targeted, where each fishing day (n=52) approximately 20 shells varying from no visible infestation to heavy infestation were sampled.
Throughout the fishing season of the years 2004-2006, 69966 pearl shells were assessed visually (see below) and the presence and absents of bioeroding sponges were recorded. Shells from seven major pearl oyster fishing grounds and four age classes were assessed (Table 4B).
2.3.2 Pearl shell sampling for area and volume estimated of bioeroding sponge erosions
During the commercial fishing season (March – June) of the years 2007 and 2008, 180 pearl shells were sampled from three major pearl oyster fishing grounds in North Western Australia (Figure 1). Pearl oyster (Pinctada maxima) shells were randomly selected across the whole size range (80-270 mm in shell length) independent of the fishing activity. Shells smaller than 80 mm in shell length were not sampled because a previous study determined that shells at that size have negligible infestation rates (< 1%).

8 Fisheries Research Report [Western Australia] No. 196, 2009
Table 3. Average depth and habitat types (in order of importance) of 20 sites for sample calcareous substrate at the 80 Mile Beach pearl oyster (Pinctada maxima) fishing grounds in North Western Australia.
Location Site number Position Depth (m) Habitat type
10 Mile 18 Inshore 10.6 Garden
15 Mile 15 Inshore 10.3 Potato
18 Mile 3 Inshore 10.7 Asparagus, Potato
18 Mile 4 Inshore 12.1 Asparagus, Potato
27 Mile 6 Inshore 9.7 Asparagus, Potato
31 Mile 9 Inshore 8.9 Potato
35 Mile 14 Inshore 10.0 Potato, Asparagus
Average 10.3
5 Mile 20 Midshore 13.8 Asparagus, Potato
5 Mile 19 Midshore 14.8 Potato, Garden
15 Mile 17 Midshore 11.4 Asparagus, Potato
18 Mile 2 Midshore 11.3 Garden, Potato
27 Mile 5 Midshore 10.2 Asparagus, Potato
31 Mile 8 Midshore 11.8 Garden
27 Mile 10 Midshore 12.9 Asparagus
35 Mile 13 Midshore 9.8 Asparagus, Potato
Average 12.0
15 Mile 16 Offshore 10.3 Garden
18 Mile 1 Offshore 14.9 Garden
31 Mile 7 Offshore 12.9 Potato, Garden
27 Mile 11 Offshore 13.2 Garden
35 Mile 12 Offshore 10.5 Garden
Average 12.4

Fisheries Research Report [Western Australia] No. 196, 2009 9
Table 4. Number of pearl shell (Pinctada maxima) sampled for presence of bioeroding sponges at the pearl oyster fishing grounds in North Western Australia. A) Samples for spatial temporal assessment B) Samples for visual assessments.
A Age class of pearl shell
Location 0-1 2-3 4-5 6+ Total
Lacepedes 54 27 30 83 194
Compass Rose 0 2 7 11 20
5-10 Mile 62 26 117 57 252
14-21 Mile 117 68 178 83 456
29-38 Mile 1 13 17 15 46
Mandora 6 6 29 4 45
Wallal 0 0 10 10 20
Total 127 152 416 265 1033
B Age class of pearl shell
Location 0-1 2-3 4-5 6+ Total
Lacepedes 3 301 3519 1925 5748
Compass Rose 0 8 76 82 166
5-10 Mile 42 4435 16594 2264 23335
14-21 Mile 33 7715 22053 2378 32179
29 Mile 3 1938 3823 1160 6924
Mandora 0 244 982 231 1457
Wallal 0 19 105 33 157
Total 81 14660 47152 8073 69966
2.4 Estimating pearl oyster stock density and density of infested shells
Shell density was determined for each fishing ground using an equation derived by Hart and Friedman (2004).
∑=
=P
i
p
p
pC S
A
q
hB
1
Bc is the estimate of pearl stocks
P is the total number of pearl oyster fishing grounds “patches”
hp is the mean catch rate of pearl oysters (number caught per diver hour) at each fishing ground (pearl patch p).
qp is the catchability of oysters in patch p. This depends on the habitat type.
Ap is the total area of habitat at each fishing ground (pearl patch p).
S is the area swept per diver hour (0.01408 km2)

10 Fisheries Research Report [Western Australia] No. 196, 2009
The density of infested shells was determined by multiplying the estimated shell density with the estimated infestation rate for the targeted age class (4-5 year age class).
2.5 Bioeroding sponge identification
Pearl oyster shells were assessed visually for the presence and absence of bioeroding sponges, a fast and easy method that has been used for long term monitoring of bioeroding sponge infestation in pearl oyster stocks in Western Australia. Shell samples, were also examined histologically to establish if shells that visually appeared to contain bioeroding sponges could be confirmed with live sponge tissue. Shell samples were initially screened for the presence of spicules, which are used to aid the identification of sponge species (Hooper & van Soest, 2002). If bioeroding sponge spicules and sponge tissue were seen these indicated active, growing sponge, and the shell was determined to have active bioerosion.
2.5.1 Visual assessment of bioeroding sponges
Bioeroding sponges in pearl oyster shells were generally indicated by the presence of small pits (1-3 mm in diameter) that were sometimes associated with coloration (orange to red) (Figure 2). The live colour was recorded, and shells were graded according to the level of infestation. These visual grades ranged from 0 to 3, where 0 was no visible infestation (shell surface is smooth, with no pitting or discoloration), 1 low level infestation (small amount of pitting only occurs around the umbo region of the shell), 2 medium infestation (more extensive pitting, erosion started to deform the shell heel) and 3 heavy infestation (extensive pitting over large area of the shell, erosion caused shell heel to thin).
Area of infestation
Figure 2. Heavy infestation of the bioeroding sponge Pione velans showing pitting and orange coloration.

Fisheries Research Report [Western Australia] No. 196, 2009 11
2.5.2 Histological identification of bioeroding sponge species
A small sample was taken from each shell in an area where typical bioeroding sponge pitting was apparent, or if no visual infestation was determined, an area close to the umbo was sampled. Samples were fixed in FACCS (10 mL 37-40% formaldehyde solution, 5 mL glacial acetic acid, 1.3 g calcium carbonate dihydrate and 85mL tap water) that preserved the sponge tissue and softened the shell slightly. Samples were transferred into 70% ethanol after fixation. All samples were treated with bleach (sodium hypochlorite) digestion to check for the presence of sponge spicules. Small pieces of the shell sample were placed on slides with a few drops of commercial bleach and allowed to stand until tissue had been digested and bubbling had stopped. The slides were then examined under a compound microscope and spicule presence and spicule shapes were noted.
Shell samples with spicules were processed histologically. Sections 8 mm thick were cut, stained with haematoxylin-eosin, permanently mounted and examined with light microscopy for the presence of sponge tissue and type and length of sponge spicules. The species were identified using characters described in Fromont et al. (2005).
2.6 Frequency of occurrence of bioeroding sponge species
For each fishing ground, the frequency of occurrence of each bioeroding sponge species was determined by dividing the number of shell samples on which the species occurred by the total number of shell samples with identified species and multiplying by 100 to obtain percent frequency of each species at each site.
2.7 Area and volume estimation of bioeroding sponges
The total surface area and the infested area (eroded area and sponge tissue) of each dorsal and ventral shell were estimated by laying a grid (450 cm2) over the shell surfaces and counting the squares occupied 1) by the whole shell and 2) by the area of visual erosion (Figure 3). The area was also estimated by tracing the whole and infected surface area on digital photographs of the shells using an image analysis program (Image J, version 1.38b).
Each shell was cut into 20 mm sections parallel to the hinge line, and starting from the hinge. Each cut was photographed and digital images were analysed by tracing the infested area (eroded area and sponge tissue) of each cut using Image J. The volume was calculated using the following formula:
2.5.2 Histological identification of bioeroding sponge species
A small sample was taken from each shell in an area where typical bioeroding sponge pitting was apparent, or if no visual infestation was determined, an area close to theumbo was sampled. Samples were fixed in FACCS (10 mL 37-40% formaldehydesolution, 5 mL glacial acetic acid, 1.3 g calcium carbonate dihydrate and 85mL tapwater) that preserved the sponge tissue and softened the shell slightly. Samples weretransferred into 70% ethanol after fixation. All samples were treated with bleach (sodium hypochlorite) digestion to check for the presence of sponge spicules. Small pieces of the shell sample were placed on slides with a few drops of commercialbleach and allowed to stand until tissue had been digested and bubbling had stopped. The slides were then examined under a compound microscope and spicule presenceand spicule shapes were noted.
Shell samples with spicules were processed histologically. Sections 8 µm thick werecut, stained with haematoxylin-eosin, permanently mounted and examined with light microscopy for the presence of sponge tissue and type and length of sponge spicules. The species were identified using characters described in Fromont et al. (2005).
2.6 Frequency of occurrence of bioeroding sponge species
For each fishing ground, the frequency of occurrence of each bioeroding spongespecies was determined by dividing the number of shell samples on which the speciesoccurred by the total number of shell samples with identified species and multiplyingby 100 to obtain percent frequency of each species at each site.
2.7 Area and volume estimation of bioeroding sponges
The total surface area and the infested area (eroded area and sponge tissue) of each dorsal and ventral shell were estimated by laying a grid (450 cm2) over the shell surfaces and counting the squares occupied 1) by the whole shell and 2) by the area of visual erosion (Figure 3). The area was also estimated by tracing the whole andinfected surface area on digital photographs of the shells using an image analysis program (Image J, version 1.38b).
Each shell was cut into 20 mm sections parallel to the hinge line, and starting from thehinge. Each cut was photographed and digital images were analysed by tracing theinfested area (eroded area and sponge tissue) of each cut using Image J. The volume was calculated using the following formula:
1020)1(1
AnxxnABn
iC +−=∑
=
Bc = Bioeroding sponge biomassAn = Estimated bioeroding sponge area of the cut n
The last cut was never eroded throughout, and hence the assumption was made that only ½ of this cut (10 mm) was eroded.
17
Bc = Bioeroding sponge biomass
An = Estimated bioeroding sponge area of the cut n
The last cut was never eroded throughout, and hence the assumption was made that only ½ of this cut (10 mm) was eroded.
To determine the accuracy of the digital image analyses method, three independent observers estimated the surface area and volume of bioeroding sponges on both valves of each of five

12 Fisheries Research Report [Western Australia] No. 196, 2009
pearl oyster valves. Standard errors were calculated and differences were analysed by analyses of variance (see below).
2.8 Data analyses
All data analyses were carried out using STATISTICA software (version 8 StatSoft. Inc.2007). Normality was checked with Kolmogornov-Smirnov tests. When necessary, data was arcsine (square root) transformed to achieve a normal distribution. Correlation analyses and multiple regressions were used to explore relationships between visual assessed and histologically confirmed bioeroding sponge infestation. Correlation analyses were also used to explore relationships between the visual (grading and surface estimates) and digital methods (surface estimates and volume). Data on infestation rates (%) of each fishing day were grouped by fishing trips (2-5 days). Data for each sampling year was analysed separately as different fishing grounds were sampled in different years. Factorial analyses of variance (ANOVA) was used to analyse infestation rate, with location and age classes as factors for each year, followed by Tukeys post-hoc comparisons. Only 2 fishing grounds (5-10 Mile and 14-21 Mile) were sampled every year and could be compared through time with sampling year, location and age as factors. Data on surface area and volume of bioeroding sponges was analysed by one-way ANOVA for each fishing ground (5-10 Mile, 14-21 Mile and Lacepedes) and factorial ANOVA with location, age classes or grades as factors with Tukeys post-hoc comparisons. An analysis of covariance (ANCOVA) was performed on volume data using shell size as a covariate.
3.0 Results
3.1 Bioeroding sponge species frequency of occurrence in habitat and shell samples
Three species of bioeroding sponges were identified in the habitat samples (n=456), Pione velans, Cliona dissimilis and Cliona orientalis (Table 5). P. velans was the dominant species found (71%); C. dissimilis and C. orientalis were found in one sample each (14%).
Table 5. Occurrence of bioeroding sponge species and infestation rates in habitat samples from the 80 Mile Beach pearl oyster fishing grounds in North Western Australia.
Location P. velans C. dissimilis C. orientalis Infestation rate (%)
5 Mile 1 2.00
10 Mile 0.00
15 Mile 0.00
18 Mile 3 1 3.15
27 Mile 1 1.33
31 Mile 1 1.89
35 Mile 0.00
P. velans was found in habitat samples at the 18 Mile, 27 Mile and the 31 Mile. C. dissimilis was found at the 18 Mile and C. orientalis occurred at the 5 Mile location (Table 5). P. velans occurred most frequently in inshore habitats and was also detected in midshore habitats (Table

Fisheries Research Report [Western Australia] No. 196, 2009 13
6). Both C. dissimilis and C. orientalis were found in midshore habitats. No bioeroding sponge infestation was found in offshore habitats.
Four species of bioeroding sponges were identified from the 1033 shell samples that were sampled during the commercial fishing seasons of the years 2004-2006, Pione velans, Cliona dissimilis, Cliona orientalis, and an unidentified species of Cliona. P. velans was the dominant species found (75%), followed by C. dissimilis (22%) (Figure 3). C. orientalis was found in one sample (0.7%) and the unidentified species of Cliona was found in 3 samples (2%).
0102030405060708090
100
Ove
rall
Lace
pede
s
Com
pass
Rose
5-10
Mile
14-2
1 M
ile
29-3
8 M
ile
Man
dora
Wal
lal
P. velansC. dissimilisC. orientalisCliona sp.
Freq
uenc
y of
occ
urre
nce (
%) n=147
n=15
n=3
n=33 n=73
n=11n=10 n=2
Figure 3. Frequency of occurrence (%) of four bioeroding sponge species in pearl oyster shells sampled from seven fishing grounds in North Western Australia.
All four species were found in shell samples at the 14-21 Mile (Figure 3). The two main species Pione velans and Cliona dissimilis were found in five of the seven fishing grounds. Compass Rose was only sampled in 2004 and only three samples had the bioeroding sponge P. velans confirmed. Wallal was only sampled in 2005 with two confirmed P. velans samples. Therefore these two fishing grounds were excluded from further analyses.
During the commercial fishing season of 2007, four species of bioeroding sponges were identified in shell samples (n=120) from the two fishing grounds off the 80 Mile Beach (5-10 Mile and 14-21 Mile): Pione velans, Cliona dissimilis, Cliona orientalis, and an unidentified species of Cliona. Pione velans was the dominant species (82%), followed by C. dissimilis (12%). Cliona orientalis was found in one sample and the unidentified species of Cliona was found in 3 samples.
Seven species were found in samples from the Lacepedes fishing ground (n=60 shell samples): Pione velans, Cliona dissimilis, Cliona orientalis, two unidentified species of Cliona, and unidentified species of Aka and Zyzzya. As at the 80 Mile locations, P. velans was also the dominant species at the Lacepedes (59%), followed by an unidentified species of Cliona (14%), C. dissimilis (7%) and C. orientalis (7%).
Pione velans and Cliona dissimilis occurred at all fishing grounds. Cliona orientalis occurred at the 14-21 Mile and the Lacepedes fishing ground. One unidentified species of Cliona was
14 Fisheries Research Report [Western Australia] No. 196, 2009
found at the Lacepedes and the 5-10 Mile, whereas the other unidentified species of Cliona, the Aka sp. and Zyzzya sp. were only found at the Lacepedes.
3.2 Visual assessments of bioeroding sponges and histological confirmation in shell samples
3.2.1 Correlating visual detection of bioeroding sponges with histology
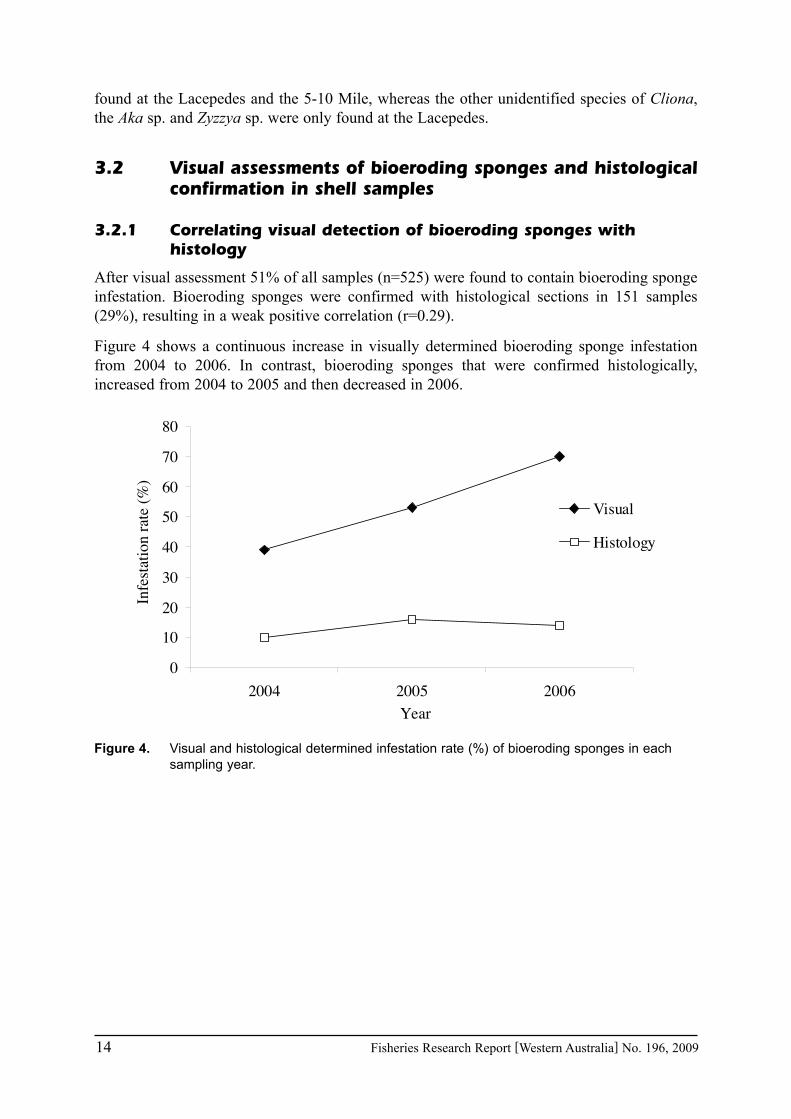
After visual assessment 51% of all samples (n=525) were found to contain bioeroding sponge infestation. Bioeroding sponges were confirmed with histological sections in 151 samples (29%), resulting in a weak positive correlation (r=0.29).
Figure 4 shows a continuous increase in visually determined bioeroding sponge infestation from 2004 to 2006. In contrast, bioeroding sponges that were confirmed histologically, increased from 2004 to 2005 and then decreased in 2006.
0
10
20
30
40
50
60
70
80
2004 2005 2006
Visual
Histology
Year
Infe
statio
n ra
te (%
)
Figure 4. Visual and histological determined infestation rate (%) of bioeroding sponges in each sampling year.

Fisheries Research Report [Western Australia] No. 196, 2009 15
0
10
20
30
40
50
60
70
Visual Histology Visual Histology Visual Histology Visual Histology
200420052006
Grade 0 Grade 1 Grade 2 Grade 3
Infe
statio
n ra
te (%
)
Figure 5. Visual and histological determined infestation rate (%) of bioeroding sponges in each grade and sampling year.
0
10
20
30
40
50
60
70
80
90
100
spicules and tissuespicules, no tissueno spicules, no tissue
Perc
enta
ge (%
)
Grade 0 Grade 1 Grade 2 Grade 3
Figure 6. Percentage of samples with and without spicules and detected sponge tissue in each of the visual grades.

16 Fisheries Research Report [Western Australia] No. 196, 2009
0
10
20
30
40
50
60
70
80
90
100
Lace
pede
s
5-10
Mile
14-2
1 M
ile
29-3
8 M
ile
Lace
pede
s
5-10
Mile
14-2
1 M
ile
29-3
8 M
ile
Man
dora
5-10
Mile
14-2
1 M
ile
29-3
8 M
ile
Man
dora
spicules andtissuespicules, notissueno spicules,no tissue
Perc
enta
ge(%
)
Grade 1 Grade 2 Grade 3
Figure 7. Percentage of samples with and without spicules and detected sponge tissue in each of the visual grades at each fishing ground.
0
10
20
30
40
50
60
orange clear yellow red brown
P. velansC. dissimilis
Freq
uenc
y of
occ
urre
nce (
%)
Color
Figure 8. Frequency of occurrence (%) of colour in the main bioeroding sponge species (Pione velans and Cliona dissimilis).
Fisheries Research Report [Western Australia] No. 196, 2009 17
0
10
20
30
40
50
60
70
80
90
Grade 1 Grade 2 Grade 3
orangeclearyellowredbrown
Freq
uenc
y of
occ
urre
nce (
%)
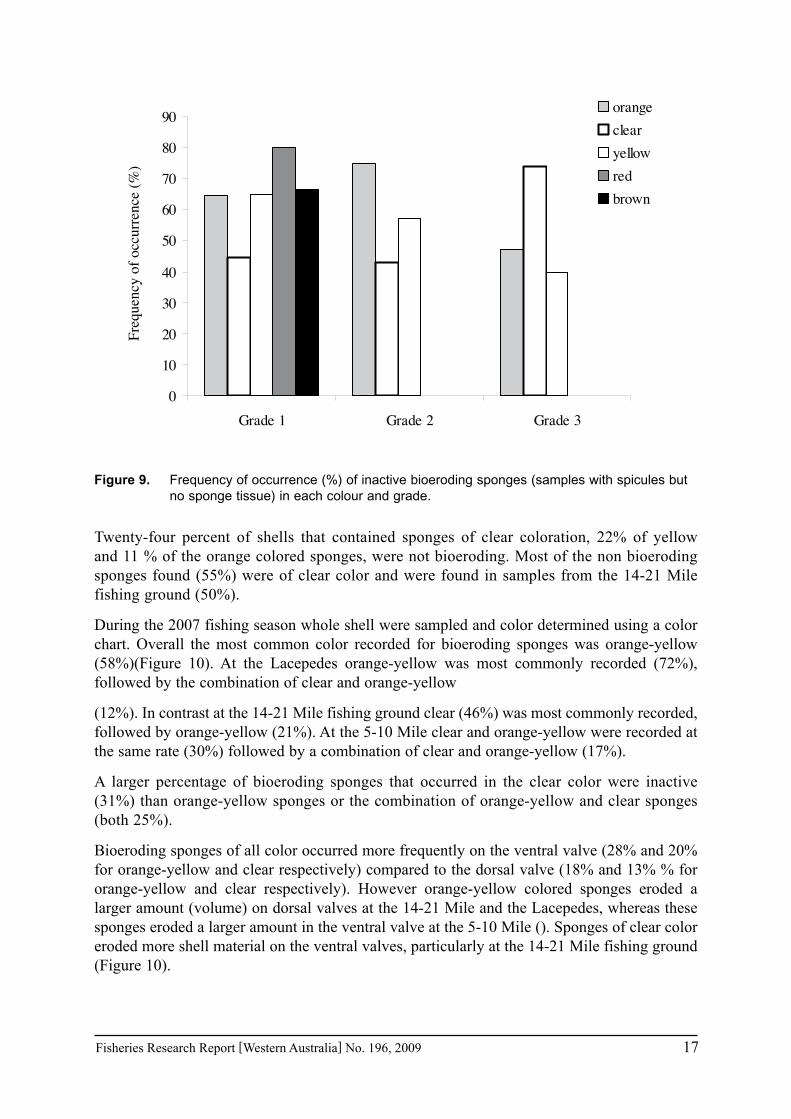
Figure 9. Frequency of occurrence (%) of inactive bioeroding sponges (samples with spicules but no sponge tissue) in each colour and grade.
Twenty-four percent of shells that contained sponges of clear coloration, 22% of yellow and 11 % of the orange colored sponges, were not bioeroding. Most of the non bioeroding sponges found (55%) were of clear color and were found in samples from the 14-21 Mile fishing ground (50%).
During the 2007 fishing season whole shell were sampled and color determined using a color chart. Overall the most common color recorded for bioeroding sponges was orange-yellow (58%)(Figure 10). At the Lacepedes orange-yellow was most commonly recorded (72%), followed by the combination of clear and orange-yellow
(12%). In contrast at the 14-21 Mile fishing ground clear (46%) was most commonly recorded, followed by orange-yellow (21%). At the 5-10 Mile clear and orange-yellow were recorded at the same rate (30%) followed by a combination of clear and orange-yellow (17%).
A larger percentage of bioeroding sponges that occurred in the clear color were inactive (31%) than orange-yellow sponges or the combination of orange-yellow and clear sponges (both 25%).
Bioeroding sponges of all color occurred more frequently on the ventral valve (28% and 20% for orange-yellow and clear respectively) compared to the dorsal valve (18% and 13% % for orange-yellow and clear respectively). However orange-yellow colored sponges eroded a larger amount (volume) on dorsal valves at the 14-21 Mile and the Lacepedes, whereas these sponges eroded a larger amount in the ventral valve at the 5-10 Mile (). Sponges of clear color eroded more shell material on the ventral valves, particularly at the 14-21 Mile fishing ground (Figure 10).

18 Fisheries Research Report [Western Australia] No. 196, 2009
3.3 Bioeroding sponge infestation rates in habitat samples
An infestation rate of 1.5% was found in habitat samples (7 out of 456 samples). The infestation rate was highest at the 18 Mile (Table 5) and highest in inshore habitats (Table 6).
The largest proportion of calcareous substrate was made up of other shells and shell fragments (79%) followed by bryozoa, worm casing and calcareous rock (all 5%). Other unidentifiable calcareous substrate (5%) and coral fragments (1%) were also present.
Table 6. Occurrence of bioeroding sponge species and infestation rates in habitat samples from inshore, midshore and offshore pearl oyster fishing grounds in North Western Australia.
Position P. velans C. dissimilis C. orientalis Infestation rate (%)
Inshore 4 2.22
Midshore 1 1 1 2.00
Offshore 0.00
A higher percentage of calcareous substrate was found at the 35 Mile followed by the 5 Mile and 18 Mile (Table 7) and in midshore habitats (Table 8). Overall highest occurrences to availability ratios were found at the 18 Mile and in the inshore habitats.
Table 7. Percentage of calcareous substrate, infestation rate and occurrence to availability ratio in habitats sampled at the 80 Mile Beach fishing grounds in North Western Australia.
Location Calcareous Substrate (%)
Infestation (%)
Occurrence/ Availability ratio
5 Mile 3.86 2.00 0.52
10 Mile 2.90 0.00 0.00
15 Mile 2.97 0.00 0.00
18 Mile 3.58 1.55 0.43
27 Mile 3.21 1.33 0.42
31 Mile 3.15 1.89 0.60
35 Mile 6.21 0.00 0.00
Table 8. Percentage of calcareous substrate, infestation rate and occurrence to availability ratio in inshore, midshore and offshore habitats sampled at the 80 Mile Beach fishing grounds in North Western Australia.
Position Calcareous Substrate (%)
Infestation (%)
Occurrence/ Availability ratio
Inshore 1.35 2.22 1.64
Midshore 1.87 1.33 0.71
Offshore 1.23 0.00 0.00
3.4 Spatial and temporal pattern of bioeroding sponge infestation in pearl shells
An infestation rate of 12% was estimated for all shell samples (Figure 11). Infestation rates in pearl oyster spat (0+ and 1+ age class) were minimal (< 1%). Only one shell in the 1 year + age class (69 mm in shell length) was found to contain a bioeroding sponge (Pione velans). The 0+ and 1+ year age classes were therefore excluded from further analyses.

Fisheries Research Report [Western Australia] No. 196, 2009 19
A significantly lower infestation rate was found in the 2-3 years age class (6%) compared to the 4-5 years age class (25%) (Figure 11, Table 9), Tukeys post-hoc test p < 0.05). There was no significant difference between the locations.
Table 9. Multifactorial Analyses of Variance of infestation rates across 5 locations and 3 age classes (sample units = neaps).
Effect SS Degrees of Freedom
MS F p
Location 826.95 4 206.74 0.96 0.441
Age 2036.32 2 1018.16 4.72 0.015
Location x Age 868.18 8 108.52 0.50 0.846
Error 7763.30 36 215.65
Colour E (clear)
0
10000
20000
30000
40000
50000
60000
70000
80000
Dorsal valveVentral valve
n=11
n=9
Tota
l vol
ume (
mm
3 )To
tal v
olum
e (m
m3 )
Lacepedes *
n=3
5-10 Mile 14-21 Mile
05000
100001500020000
250003000035000
4000045000
5-10 Mile 14-21 Mile Lacepedes
Colour A (orange-yellow)
n=5
n=9
n=18
Figure 10. Bioeroding sponge volume (mm3 ± S.E.) of pearl oyster shells at each of the three commercial fishing grounds (5-10 Mile, 14-21 Mile and Lacepedes). A. Bioeroding sponges with a coloration of yellow-orange and E. Bioeroding sponges appearing in a clear colour.
20 Fisheries Research Report [Western Australia] No. 196, 2009
0
5
10
15
20
25
30
35
40
45
Overall 0-1 2-3 4-5 6+
Lacepedes5-10 Mile14-21 Mile29-38 MileMandora
Age
Infe
statio
n ra
te (%
)
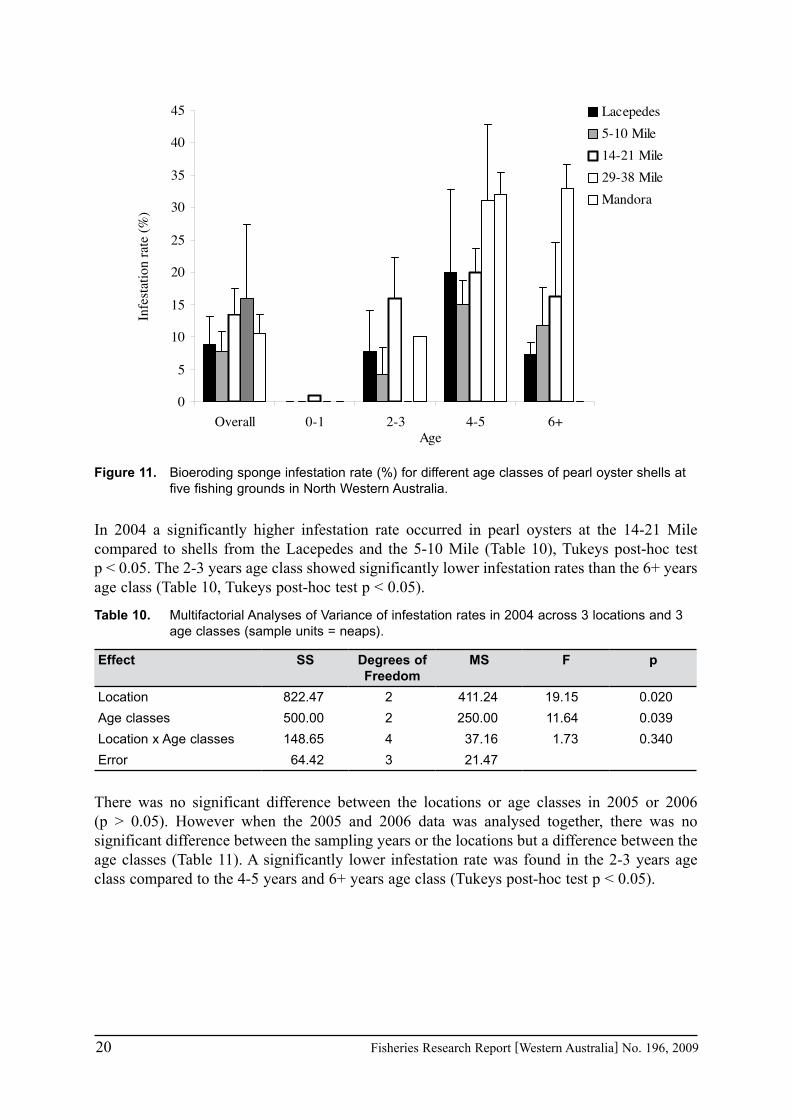
Figure 11. Bioeroding sponge infestation rate (%) for different age classes of pearl oyster shells at five fishing grounds in North Western Australia.
In 2004 a significantly higher infestation rate occurred in pearl oysters at the 14-21 Mile compared to shells from the Lacepedes and the 5-10 Mile (Table 10), Tukeys post-hoc test p < 0.05. The 2-3 years age class showed significantly lower infestation rates than the 6+ years age class (Table 10, Tukeys post-hoc test p < 0.05).
Table 10. Multifactorial Analyses of Variance of infestation rates in 2004 across 3 locations and 3 age classes (sample units = neaps).
Effect SS Degrees of Freedom
MS F p
Location 822.47 2 411.24 19.15 0.020
Age classes 500.00 2 250.00 11.64 0.039
Location x Age classes 148.65 4 37.16 1.73 0.340
Error 64.42 3 21.47
There was no significant difference between the locations or age classes in 2005 or 2006 (p > 0.05). However when the 2005 and 2006 data was analysed together, there was no significant difference between the sampling years or the locations but a difference between the age classes (Table 11). A significantly lower infestation rate was found in the 2-3 years age class compared to the 4-5 years and 6+ years age class (Tukeys post-hoc test p < 0.05).
Fisheries Research Report [Western Australia] No. 196, 2009 21
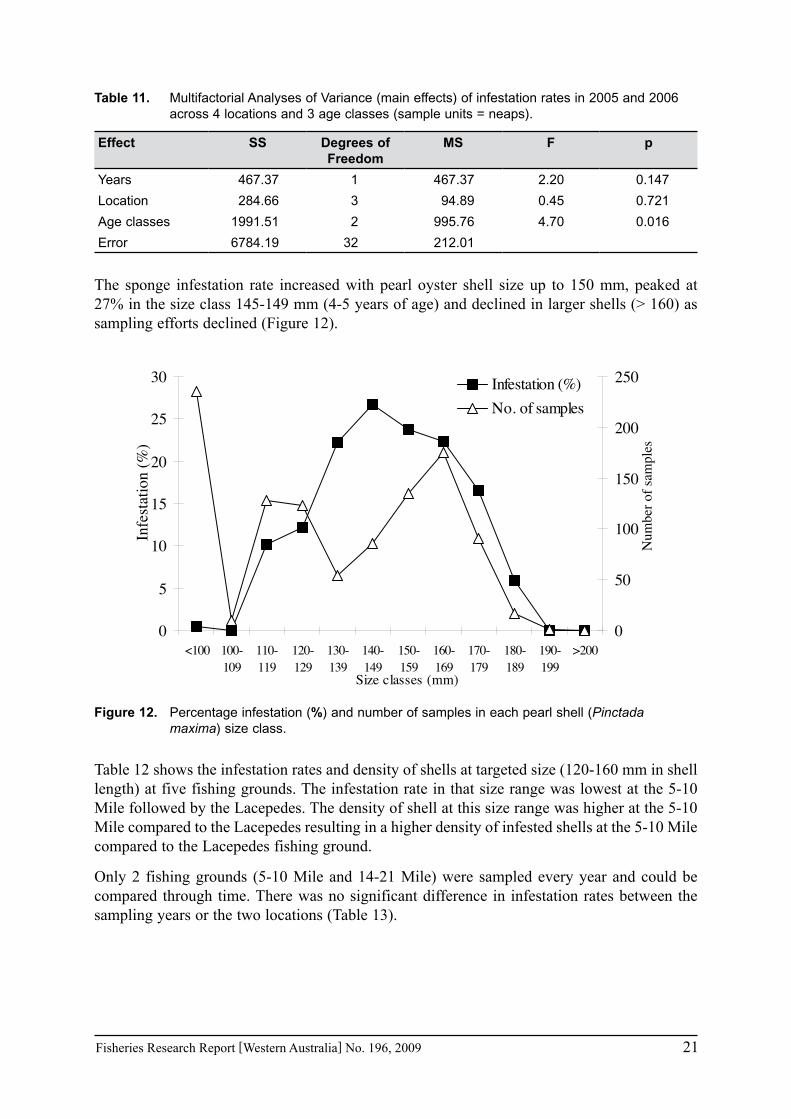
Table 11. Multifactorial Analyses of Variance (main effects) of infestation rates in 2005 and 2006 across 4 locations and 3 age classes (sample units = neaps).
Effect SS Degrees of Freedom
MS F p
Years 467.37 1 467.37 2.20 0.147
Location 284.66 3 94.89 0.45 0.721
Age classes 1991.51 2 995.76 4.70 0.016
Error 6784.19 32 212.01
The sponge infestation rate increased with pearl oyster shell size up to 150 mm, peaked at 27% in the size class 145-149 mm (4-5 years of age) and declined in larger shells (> 160) as sampling efforts declined (Figure 12).
0
5
10
15
20
25
30
<100 100-109
110-119
120-129
130-139
140-149
150-159
160-169
170-179
180-189
190-199
>2000
50
100
150
200
250Infestation (%)No. of samples
Infe
statio
n (%
)
Num
ber o
f sam
ples
Size classes (mm)
Figure 12. Percentage infestation (%) and number of samples in each pearl shell (Pinctada maxima) size class.
Table 12 shows the infestation rates and density of shells at targeted size (120-160 mm in shell length) at five fishing grounds. The infestation rate in that size range was lowest at the 5-10 Mile followed by the Lacepedes. The density of shell at this size range was higher at the 5-10 Mile compared to the Lacepedes resulting in a higher density of infested shells at the 5-10 Mile compared to the Lacepedes fishing ground.
Only 2 fishing grounds (5-10 Mile and 14-21 Mile) were sampled every year and could be compared through time. There was no significant difference in infestation rates between the sampling years or the two locations (Table 13).

22 Fisheries Research Report [Western Australia] No. 196, 2009
Table 12. Infestation rates of bioeroding sponges, density of shells and density of infested shells (120-160 mm in shell length) at the pearl oyster fishing grounds in North Western Australia.
Location Infestation rate%
Density of shells (120-160 mm) per km2
Density of infested shells per km2
Lacepedes 20 4139 828
5-10 Mile 17 11724 1993
14-21 Mile 24 9969 2393
29-38 Mile 31 10876 3372
Mandora 32 12207 3906
Table 13. Multifactorial Analyses of Variance of infestation rates across 3 years and 2 locations (sample units = neaps).
Effect SS Degrees of Freedom
MS F p
Years 412.93 2 206.46 0.94 0.402
Locations 589.79 1 589.79 2.69 0.112
Years x Locations 46.02 2 23.01 0.11 0.902
Error 5914.09 27 219.04
The surface area of pearl shells is much lower than all other calcareous habitat area at both the 5-10 Mile and the 14-21 Mile fishing ground, whereas the estimated area of infestation is similar in habitat and pearl shell samples resulting in higher occurrence to availability ratios in shells compared to habitat samples (Table 14).
Table 14. Comparison between shell and other calcareous habitat available and infected with bioeroding sponge at both the 5-10 Mile and the 14-21 Mile fishing grounds.
Source Location Area availablecm2 per m2
Area infestedcm2 per m2
Occurrence/ availability ratio
Shell 5-10 Mile 1.67 0.01 0.00519
Shell 14-21 Mile 1.61 0.02 0.00935
Habitat 5-10 Mile 352.50 0.01 0.00002
Habitat 14-21 Mile 331.79 0.01 0.00003
During the 2007 and 2008 fishing season whole pearl shells were sampled and fifty-three percent of shells showed active sponge infestations. The infestation rate was highest in the 6+age class (75%), followed by the 4-5 year age class (33%) and lowest in the 2-3 year age class (15%). Twenty-three percent of shells that had visual signs of sponge erosions were inactive; that is sponge tissue could not be confirmed. A higher infestation rate was found on the ventral valves (58%) compared to the dorsal valves (42%).
3.5 Monitoring of bioeroding sponges using visual assessments
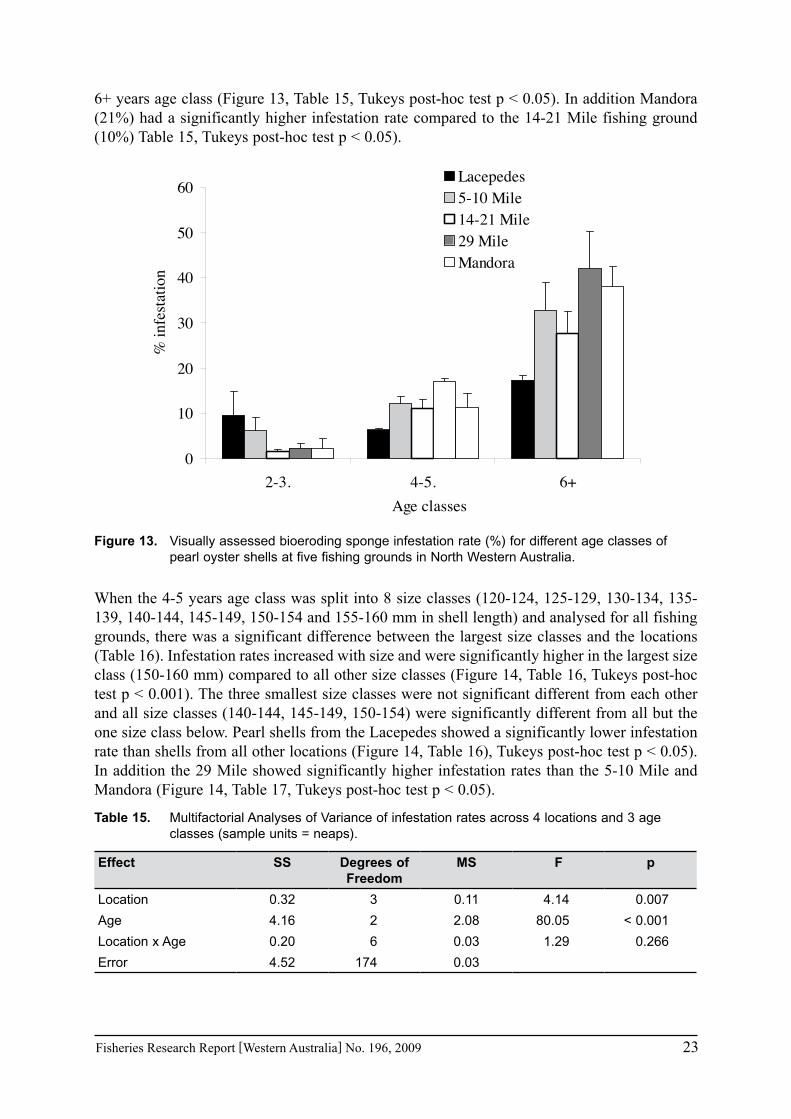
A larger set of pearl oyster shells was visually inspected for the presence and absence of bioeroding sponges during annual catch-sampling surveys. Analysing the visual data the infestation rate was significantly lower in the 2-3 years age class (4%) compared to the 4-5 (12%) and 6+ years age class (32%) and the 4-5 yeas age class was significantly lower to the
Fisheries Research Report [Western Australia] No. 196, 2009 23
6+ years age class (Figure 13, Table 15, Tukeys post-hoc test p < 0.05). In addition Mandora (21%) had a significantly higher infestation rate compared to the 14-21 Mile fishing ground (10%) Table 15, Tukeys post-hoc test p < 0.05).
0
10
20
30
40
50
60
2-3. 4-5. 6+
Lacepedes5-10 Mile14-21 Mile29 MileMandora
% in
festa
tion
Age classes
Figure 13. Visually assessed bioeroding sponge infestation rate (%) for different age classes of pearl oyster shells at five fishing grounds in North Western Australia.
When the 4-5 years age class was split into 8 size classes (120-124, 125-129, 130-134, 135-139, 140-144, 145-149, 150-154 and 155-160 mm in shell length) and analysed for all fishing grounds, there was a significant difference between the largest size classes and the locations (Table 16). Infestation rates increased with size and were significantly higher in the largest size class (150-160 mm) compared to all other size classes (Figure 14, Table 16, Tukeys post-hoc test p < 0.001). The three smallest size classes were not significant different from each other and all size classes (140-144, 145-149, 150-154) were significantly different from all but the one size class below. Pearl shells from the Lacepedes showed a significantly lower infestation rate than shells from all other locations (Figure 14, Table 16), Tukeys post-hoc test p < 0.05). In addition the 29 Mile showed significantly higher infestation rates than the 5-10 Mile and Mandora (Figure 14, Table 17, Tukeys post-hoc test p < 0.05).
Table 15. Multifactorial Analyses of Variance of infestation rates across 4 locations and 3 age classes (sample units = neaps).
Effect SS Degrees of Freedom
MS F p
Location 0.32 3 0.11 4.14 0.007
Age 4.16 2 2.08 80.05 < 0.001
Location x Age 0.20 6 0.03 1.29 0.266
Error 4.52 174 0.03
24 Fisheries Research Report [Western Australia] No. 196, 2009
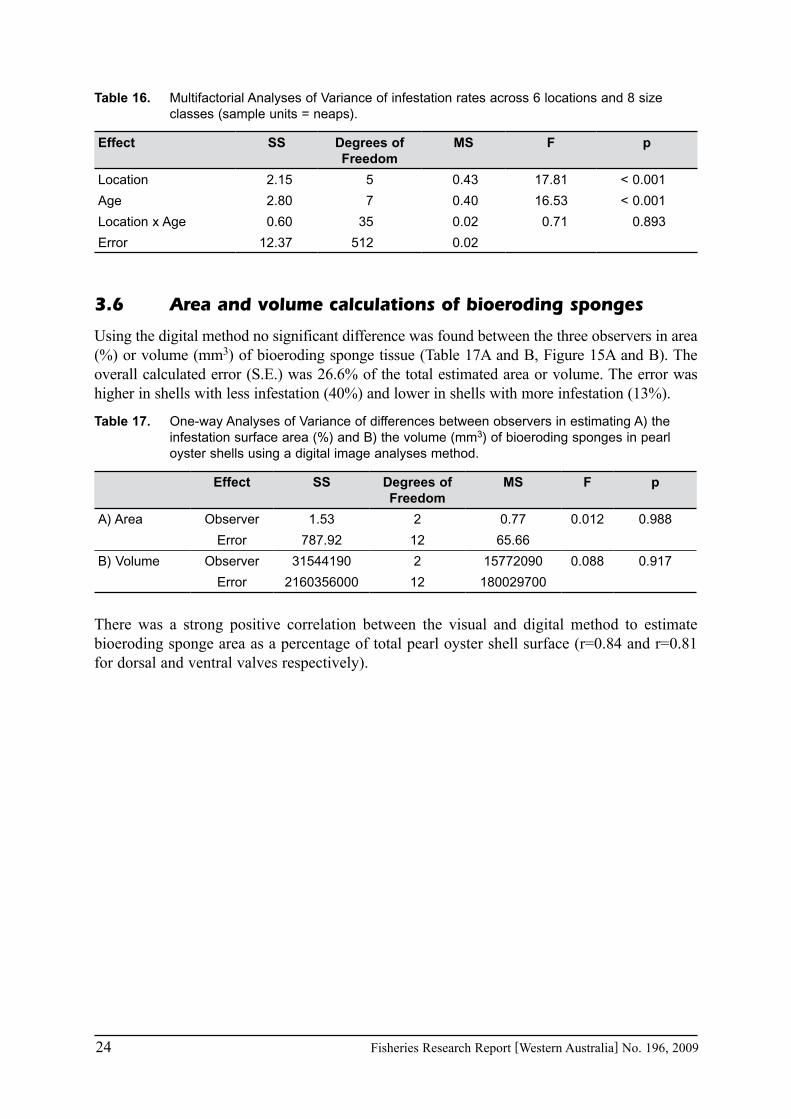
Table 16. Multifactorial Analyses of Variance of infestation rates across 6 locations and 8 size classes (sample units = neaps).
Effect SS Degrees of Freedom
MS F p
Location 2.15 5 0.43 17.81 < 0.001
Age 2.80 7 0.40 16.53 < 0.001
Location x Age 0.60 35 0.02 0.71 0.893
Error 12.37 512 0.02
3.6 Area and volume calculations of bioeroding sponges
Using the digital method no significant difference was found between the three observers in area (%) or volume (mm3) of bioeroding sponge tissue (Table 17A and B, Figure 15A and B). The overall calculated error (S.E.) was 26.6% of the total estimated area or volume. The error was higher in shells with less infestation (40%) and lower in shells with more infestation (13%).
Table 17. One-way Analyses of Variance of differences between observers in estimating A) the infestation surface area (%) and B) the volume (mm3) of bioeroding sponges in pearl oyster shells using a digital image analyses method.
Effect SS Degrees of Freedom
MS F p
A) Area Observer 1.53 2 0.77 0.012 0.988
Error 787.92 12 65.66
B) Volume Observer 31544190 2 15772090 0.088 0.917
Error 2160356000 12 180029700
There was a strong positive correlation between the visual and digital method to estimate bioeroding sponge area as a percentage of total pearl oyster shell surface (r=0.84 and r=0.81 for dorsal and ventral valves respectively).

Fisheries Research Report [Western Australia] No. 196, 2009 25
0102030405060120-124
130-134
140-144
150-154
120-124
130-134
140-144
150-154
120-124
130-134
140-144
150-154
120-124
130-134
140-144
150-154
120-124
130-134
140-144
150-154
120-124
130-134
140-144
150-154
Infestation rate (%)
ba
cb
bcbc
b
a
a
aa
a
a
bbc
bc
bbc
bbc
b
bc
b
bcb
bcc
bcc
bcc
bc
bc c
bc
c
dd
d
dd
dd
dd
dd
dd
dd
dd
d
Fig
ure
14.
V
isua
lly a
sses
sed
bioe
rodi
ng s
pong
e in
fest
atio
n ra
te (
%)
for
diffe
rent
siz
e cl
asse
s of
the
“cu
lture
” pe
arl o
yste
r sh
ells
in N
orth
Wes
tern
Aus
tral
ia.

26 Fisheries Research Report [Western Australia] No. 196, 2009
0
5
10
15
20
25
1 2 3 4 5
Surfa
ce ar
ea (%
)
0
5000
10000
15000
20000
25000
30000
35000
1 2 3 4 5
Vol
ume (
mm3 )
Figure 15. Bioeroding sponge infestation area (% of total ± S.E.) and volume (mm3 ± S.E.) of five pearl oyster shells estimated by three independent observers.
Results of surface area and volume calculations found greater erosion for all sponge species at the Lacepedes compared to the 5-10 Mile and 14-21 Mile sites (Figure 16).

Fisheries Research Report [Western Australia] No. 196, 2009 27
02468
101214161820 5-10 Mile
Grade 1 Grade 2 Grade 3 Grade 3P. velans C. dissimilis
a
a
a
a
0
5
10
15
20
25
30 DorsalVentral
Grade 0 Grade Grade 2 Grade 3
14-21 Mile
Infe
sted
surfa
ce ar
ea (%
of t
otal
)
aa
a
b
0
510
15
20
2530
35
40
Grade 1Grade 3
alli
GradeP. velans
Lacepedes
a
b b
Figure 16. Bioeroding sponge infestation area (% of total ± S.E.) in pearl oyster shells in each of the visual grades (0-3) collected from 2 fishing grounds at the 80 Mile Beach (5-10 Mile and 14-21 Mile) as well as the Lacepedes. Bars with different letters are significant different (Tukeys post-hoc test p£0.001).

28 Fisheries Research Report [Western Australia] No. 196, 2009
At the 5-10 Mile and at the Lacepedes the sponge Cliona dissimilis showed more erosion in area (%) and volume (mm3) per shell. This was particularly obvious in ventral valves of the grade 3 shells from the 5-10 Mile (Figure 17, Figure 18). In contrast P. velans eroded more shell material (surface area and volume) at the 14-21 Mile. However, there was no significant difference between the species in bioeroding area or volume (Table 18).
Table 18. One-way Analyses of Variance of differences between bioeroding sponges species in A) infested surface area (mm2) and B) infestation volume (mm3) of both dorsal and ventral valves of pearl oyster shells.
Effect Value F Effect df Error df p
A) Area Species 0.96 0.25 10 130 0.990
B) Volume Species 0.86 0.52 20 136 0.955
The area and volume of sponge erosion did not differ significantly between the fishing grounds but a significant difference was found between the grades (Table 19A, Table 4). Grade 3 shells (ventral and dorsal valves) showed significantly higher amounts of erosion than all other grades (Tukeys post-hoc test p < 0.05).
Table 19. Analyses of Variance of differences between fishing grounds and visual grades in A) the infestation surface area (%) and B) volume (mm3) of bioeroding sponges in pearl oyster shells of both dorsal and ventral valves.
Effect Value F Effect df Error df p
A) Area Fishing grounds 0.95 1.76 2 67 0.179
Grade 0.74 5.44 4 134 0.0004
Fishing ground x Grade
0.80 1.59 10 134 0.116
B) Volume Fishing grounds 0.94 2.15 2 68 0.125
Grade 0.81 3.99 4 136 0.004
Fishing ground x Grade
0.83 1.35 10 136 0.210
Post-hoc tests revealed that grade 3 shells from the Lacepedes showed a significantly higher infestation area than 5-10 Mile shells of all grades and 14-21 Mile shells of all grades except grade 3 (Figure 16, Table 19A, Tukeys post-hoc test p < 0.05). Similarly grade 3 shells from the Lacepedes showed significantly higher amounts of internal erosion (volume) than 14-21 Mile shells in all grades except grade 3 and the ventral valves of grade 2 (Figure 17, Table 19B, Tukeys post-hoc test p < 0.05). These shells also had significantly more erosion than dorsal valves of the 5-10 Mile (all grades) and ventral valves in all but grade 3 shells. Cliona dissimilis contributed most to the difference between the valves at the 5-10 Mile.

Fisheries Research Report [Western Australia] No. 196, 2009 29
0
10000
20000
30000
40000
50000
60000
70000
Grade 1 Grade 3 Grade 3
Lace pe de s
P. velansall species
a
bb
0
5000
10000
15000
20000
Grade 0 Grade 1 Grade 2 Grade 3
DorsalVentral
Bioe
rodi
ng sp
onge
vol
ume (
mm
3) 14-21 M ile
b
b
aa a
0
5000
10000
15000
20000
25000
30000
35000
Grade 1 Grade 2 Grade 3 Grade 3
5-10 M ile
P. velans C. dissimilis
a
a aa
b
Figure 17. Bioeroding sponge volume (mm3 ± S.E.) in pearl oyster shells in each of the visual grades (0-3) collected from 2 fishing grounds at the 80 Mile Beach (5-10 Mile and 14-21 Mile) as well as the Lacepedes. Bars with different letters are significant different (Tukeys post-hoc test p < 0.05).
30 Fisheries Research Report [Western Australia] No. 196, 2009
0
5000
10000
15000
20000
25000
30000
171-180 171-180 181-190 191-200 201-210
5-10 Mile
0
5000
10000
15000
20000
25000
161-170 171-180 181-190 191-200
Dorsal valve Ventral valve
Bioe
rodi
ng sp
onge
vol
ume (
mm 3
)
14-21 Mile
0
5000
10000
15000
20000
25000
30000
151-160 191-200 201-210
Lacepedes
Size classes (mm)
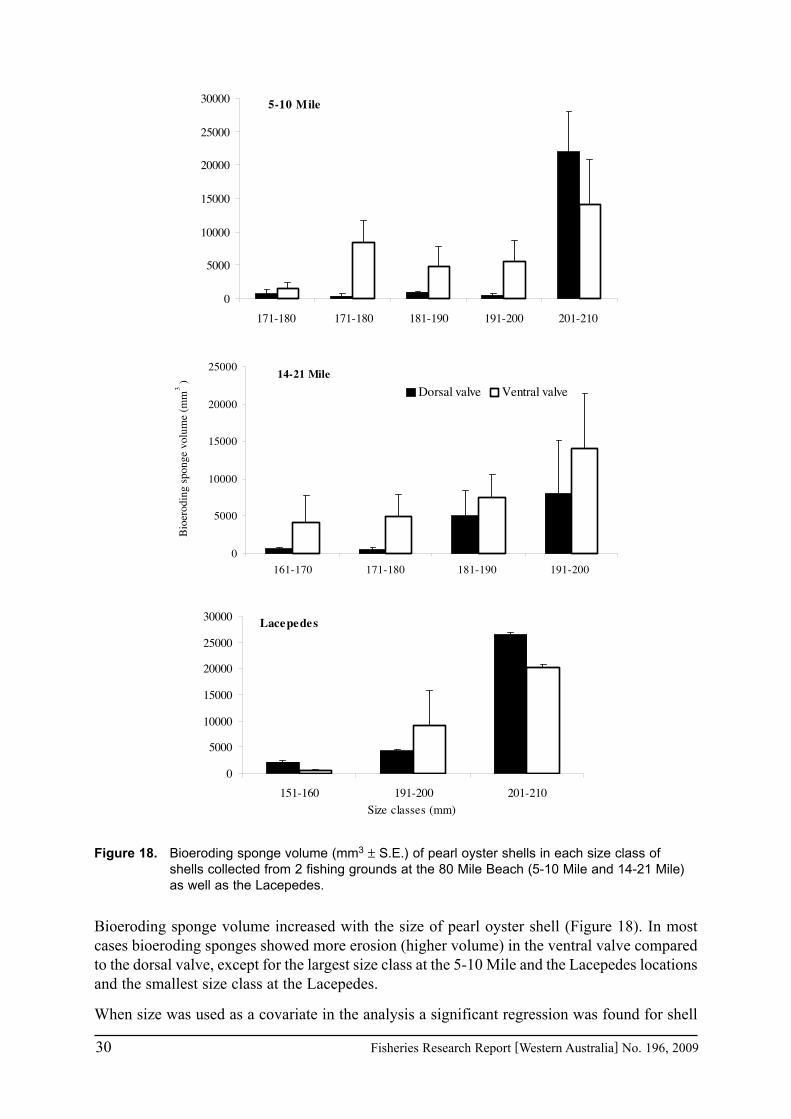
Figure 18. Bioeroding sponge volume (mm3 ± S.E.) of pearl oyster shells in each size class of shells collected from 2 fishing grounds at the 80 Mile Beach (5-10 Mile and 14-21 Mile) as well as the Lacepedes.
Bioeroding sponge volume increased with the size of pearl oyster shell (Figure 18). In most cases bioeroding sponges showed more erosion (higher volume) in the ventral valve compared to the dorsal valve, except for the largest size class at the 5-10 Mile and the Lacepedes locations and the smallest size class at the Lacepedes.
When size was used as a covariate in the analysis a significant regression was found for shell

Fisheries Research Report [Western Australia] No. 196, 2009 31
size (Table 20). In terms of infested area (% of total area) dorsal valves showed a significantly higher infestation area at the Lacepedes compared to the 5-10 Mile location but no significant difference in ventral valves (Tukeys post-hoc test p < 0.05). Similarly sponge volume differed in dorsal valves and was significantly higher at the Lacepedes compared to the 5-10 Mile and the 14-21 Mile locations (Tukeys post-hoc test p < 0.05) but was not significantly different in ventral valves (Figure 18).
Table 20. Analyses of Covariance of differences between fishing grounds with shell size as covariate in A) the infestation surface area (%) and B) volume (mm3) of bioeroding sponges in pearl oyster shells of both dorsal and ventral valves.
Effect Value F Effect df Error df p
A) Area Size 0.80 9.31 2 75 0.0003
Fishing grounds
0.95 0.93 4 150 0.451
B) Volume Size 0.76 11.58 2 75 0.00004
Fishing grounds
0.93 1.47 4 150 0.215
The area occupied by bioeroding sponges (% of total shell surface area) increased with grades showing significant positive correlations (Figure 16, Table 21). The correlations were stronger at the Lacepedes compared to the 14-21 Mile fishing grounds. Only the erosion area of the ventral valves correlated significantly with visual grades at the 5-10 Mile. At the 14-21 Mile a small number of grade 0 (no infestation) shells contained low amounts of surface and internal erosion.
Table 21. Correlation between surface area and visual grades of bioeroding sponge infestations in pearl oyster shells at three commercial fishing grounds using two methods, a visual and a digital method.
Method Valve 5-10 Mile 14-21 Mile Lacepedes
Visual Dorsal 0.10 ns 0.62 0.47
Digital Dorsal 0.27 ns 0.51 0.54
Visual Ventral 0.39 0.53 0.60
Digital Ventral 0.37 0.50 0.64
ns: not significant
Significant positive correlations were found between volume estimates and visual grades of bioeroding sponge infestations in pearl oyster shells at the 14-21 Mile fishing grounds and the Lacepedes (Figure 17, Table 22). As with the surface area, the correlations were stronger at the Lacepedes compared to the other fishing grounds and they were also stronger in the ventral compared to the dorsal valves.
Table 22. Correlation between volume and visual grades of bioeroding sponge infestations in both dorsal and ventral valves of pearl oyster shells at the 80 Mile and Lacepedes fishing grounds.
5-10 Mile 14-21 Mile Lacepedes
Dorsal valve 0.07 ns 0.53 0.44
Ventral valve 0.28 ns 0.58 0.58
ns: not significant

32 Fisheries Research Report [Western Australia] No. 196, 2009
Table 23. Correlation between area and volume of bioeroding sponge tissue invading pearl oyster shells (dorsal and ventral valves) with regression coefficients to predict bioeroding sponge volume (V) inside the shell from area estimates (A) on the shell surface.
Valve Regression r2 V
Dorsal simple, linear 0.88 -1383.15 + 4.73 x A
Ventral simple, linear 0.65 -211.14 + 3.96 x A
Area (mm2) and volume (mm3) estimates of dorsal and ventral pearl oyster valves were significantly correlated (Figure 19). The relationship between area and volume can be described with simple linear regressions (Table 23).
0 1000 2000 3000 4000 5000 6000 7000
Dorsal infestation area (mm2)
0
5000
10000
15000
20000
25000
30000
35000
Dor
sal i
nfes
tatio
n vo
lum
e (m
m3 )
Volume = -505.7374+3.0758 x Area
0 1000 2000 3000 4000 5000 6000 7000
Ventral infestation area (mm2)
0
10000
20000
30000
40000
50000
60000
70000
Ven
tral i
nfes
tatio
n vo
lum
e (m
m3 )
Volume = -395.24+4.28 x Area
Figure 19. Bioeroding sponge volume (mm3) versus surface area (mm2) of A. dorsal and B. ventral pearl oyster (Pinctada maxima) valves from fishing grounds at the 80 Mile Beach, Western Australia.
Fisheries Research Report [Western Australia] No. 196, 2009 33
4.0 Discussion
4.1 Bioeroding sponge species occurrence and infestation rates
Bioeroding sponges have been reported in pearl oyster wild stocks and farm stocks in India, Sri Lanka as well as Australia (Herdman 1905, Algarswami & Chellam 1976, Velayudhan 1983, Fromont et al. 2005). At the turn of the last century Herdman (1905) found that more than 75% of the oysters were affected by Cliona margaritiferae in Sri Lankan Pearl Banks. More recently, Velayudhan (1983) reported that the bioeroding sponge C. celata was affecting less than 1% of pearl oyster wild stock in India. In contrast, 21% of farm stock was affected (Velayudhan 1983). In shell samples of the years 2004-2006, we estimated that bioeroding sponges in northwestern Australia affected approximately 12% of all pearl shells. However this is only an estimate as field sampling was targeted to select for shells with varying levels of infestation. In addition only small fragments of the shell were sampled on industry vessels and examined histologically in the laboratory. Bioeroding sponge infestation may have been missed due to the small sample size. In samples taken during the fishing season 2007-2008, a much higher infestation rate (53%) was estimated for all shells excluding spat (< 80 mm in shell length). Whole shells were collected and both valves thoroughly examined in the laboratory.
A very low level of infestation (1.5%) was found in the habitat of the fishing grounds. All other calcareous substrates (excluding pearl shells) are at least two orders of magnitude more available than shell habitat, however estimated areas of infestation are higher in shells than in habitat, indicating that bioeroding sponges may have a preference for pearl oyster shell.
Pearl oyster farm stock has not been assessed quantitatively in northwestern Australia. However to date three species have been identified (Fromont et al. 2005). In the previous study Cliona dissimilis was the most common species found in farm samples. The present study revealed that Pione velans was by far the dominant species and occurred in 75% of the infested pearl shells and 71% of the habitat samples. C. dissimilis occurred less frequently (22% and 14 % for pearl shells and habitat samples respectively).
4.2 Visual assessments of bioeroding sponges
When comparing visual and histologically determined infestation rates of bioeroding sponges it became apparent that more than 50% of pearl shell samples that were visually assessed and scored to contain bioeroding sponges were biologically inactive (ie no sponge tissue was seen microscopially) ( Figure 6). Sediment and silt may have covered shells or shells may have been turned by cyclones or storm events and consequently bioeroding sponges may have been smothered and died. Observations of abandoned porous surfaces that were previously inhabited by bioeroding sponges have been reported in other studies (Acker and Risk 1985).
Visual assessment using characters such as pitting and coloration in the shell does not detect active, growing bioeroding sponges. Histological sectioning is necessary to confirm active tissue. In contrast, visual assessment was accurate in 98% of the cases of the grade 0 shell (no visual infestation). This grade may be useful and reliable for long-term monitoring projects. However histological confirmation is recommended for the following reasons:

34 Fisheries Research Report [Western Australia] No. 196, 2009
We detected a continuous increase in infestation levels from 2004 to 2006 using visual assessments, which take into account active and inactive bioeroding sponges. This pattern was not confirmed histologically, indicating that generally erosion in shells increased over time but not the incidences of active bioeroding sponges. Active erosions of bioeroding sponges can change to abandoned porous substrate from one year to the next (Acker and Risk 1985).
We also found a remarkable difference between fishing grounds in terms of accuracy of detection using visual assessment. Visual assessments were least accurate in fishing grounds with high proportions of inactive bioeroding sponges like the 5-10 Mile and the Lacepedes. The 5-10 Mile had the highest percentage of grade 3 infestation (Table 7). However a large proportions of shell samples from the 5-10 Mile (72%) contained inactive bioeroding sponges with no tissues but the presence of spicules ( Figure 7). Visual assessments were most accurate at the 29-38 Mile and the 14-21 Mile, particularly in the grade 3 shells, were all shells visually scored to contain bioeroding sponges were confirmed histologically. These results suggest that there is a difference in mortality of bioeroding sponges between the fishing grounds that could have occurred due to differences in sedimentation, hydrodynamics or storm events.
Color was not a suitable criterion to separate species, showing no significant correlation. The two main species occurred in a range of colors. Orange, the most frequently observed color, was present in both species with similar frequency. However in the two dominant species, P. velans and C. dissimilis, orange is most likely associated with heavy infestation (grade 3), whereas clear (no color) tend to indicate lower infestation levels in P. velans. Visual assessment was least accurate in shells without color (clear) were a large proportion of shells, particularly in grade 3, showed signs of bioeroding sponge erosions (pitting and spicules present) but no tissue indicating that these sponges were no longer active. Non - bioeroding sponge species occurred most frequently without color (clear). These results indicate that particularly in shells with heavy infestation, sponges with no color could be disregarded because they are most likely to be either inactive or non-bioeroding species. Dorsal valves contained more sponges with pigmentation (orange-yellow color). In comparison sponges with no color (clear) eroded more shell material (larger volume) on the ventral valves, suggesting that this lack of pigmentation may be related to the orientation of the shells on the substrate with ventral valves more frequently laying on the substrate. In addition sponges with the clear color were more frequently inactive possibly due to smothering by fine sediment on the substrate surface.
4.3 Bioeroding sponge in relation to pearl oyster shell size
Rosell et al (1999) found the percentage of infestation to be independent of oyster (Ostrea edulis) size and suggested that colonization by the bioeroding sponge Cliona viridis could occur early in the oysters’ life cycle. In contrast we demonstrated that infestation rates increased with pearl oyster size up to 150mm in shell length and declined in larger shells. Larger shells (180 mm and more) showed very low infestation rates possibly because sampling efforts declined for shells of large size. In samples taken independently of fishing activity during the 2007-2008 season infestation rates were highest in the largest age class and did not decline. A similar result was found in the visual data set, where a larger set of pearl shells were inspected visually for the presence and absence of bioeroding sponges. Infestation rates increased as shell size increased, this was particularly obvious in the “culture shell” (size range 120-160 mm in shell length)(Figure 14). However, the size of the sampled pearl oyster shells are a true reflection of the stock structure showing that shells at the Lacepedes during the 2007-2008 season are larger than shells at the 80 Mile fishing grounds with fewer shells in the “culture shell” size range.
Fisheries Research Report [Western Australia] No. 196, 2009 35
We detected no infestation in the 0+ age class and only one incident in the 1+ age class, (one small shell 69 mm in shell length). Similar to our study, Barthel el al. (1994) showed that in Chlamys islandica 90% of the scallops less than 65mm in shell length had negligible infestation. Bioeroding sponges do not establish themselves in pearl oyster shells until oysters are 2 years old and reach about 115 mm in shell length ( Figure 6). Similarly Mao Che et al. (1996) established that sponge infestations became significant in 3-year-old wild pearl oyster shell.
It has been suggested that erosion in denser materials is more pronounced (Schoenberg 2002, Rose and Risk 1985, Highsmith et al. 1983). Older shells are likely to have heavier and denser material than younger and thinner pearl shells. Alternatively the foot of the pearl oyster may be able to reach certain parts of the top of the shell cleaning of potential epibionts. The foot is highly mobile and capable of considerable elongation and contraction. In larger shells the foot may not be able to reach the whole shell surface, specifically the umbo region. Mao Che et al (1996) suggested that infestation starts at the umbo region due to erosion of the periostracum, a proteinaceous protective layer of the shell in this region. This could also be the reason why the incidence of infestation increases with the age of the shell (Barthel et al., 1994, Doroudi, 1996) as the protective layer gets further eroded.
4.4 Bioeroding sponge in the main pearl oyster fishing grounds
The fishing ground at the Lacepedes is further offshore and deeper and shell samples from this area showed lower levels of infestation than the 14-21 Mile in 2004.
Shell density estimates of targeted shells (120-160 mm in shell length) were calculated using catch and effort data, reflecting fishing pressure at the different fishing grounds. Infestation rates were not higher in areas of higher shell density or higher fishing pressure indicating that other factors determine the observed pattern.
Other studies have found a decrease in erosion rates with water depth (e.g. Kobluk and Kozelj 1985). Some bioeroding sponges are known to contain zooxanthellae and are therefore light dependent and occur more frequently in shallower waters (Rosell & Uritz 1992, Hill 1996). However, zooxanthellae were not detected in any of the histological sections produced in this study, although they are known to occur in Cliona orientalis, a species that was found in one shell sample.
Sammarco and Risk (1990) and Risk et al. (1995) demonstrated that bioerosion decreased significantly in Porites corals with distance offshore on the outer shelf of the Great Barrier Reef. They suggested that the decrease might be partially due to lower levels of productivity and lower levels of terrestrially derived organic matter, or increased abundance in grazing fish (Risk et al. 1995). The Lacepedes fishing grounds showed lower levels of infestation than the 14-21 Mile in 2004 and a higher visibility than the 14-21 Mile (Table 1), possibly indicating lower levels of organic and inorganic material in the water column, which could explain the observed pattern.
Spatial patterns in bioeroding sponge distribution were not consistent from one year to the next indicating that the occurrence of active bioeroding sponges can change from year to year as indicated by other researchers (Acker & Risk 1985). These changes in occurrence could be due to local environmental changes such as storm events that can result in higher sedimentation and smothering of bioeroding sponges, or biological factors such as increased larval settlement and recruitment that can lead to a higher infestation rate.

36 Fisheries Research Report [Western Australia] No. 196, 2009
4.5 Bioeroding sponge species occurrence and amount of erosion
The Lacepedes showed a higher bioeroding sponge species diversity during the 2007-2008 sampling. This is in contrast the finding of the 2004-2006 sampling where four species of bioeroding sponges were found at all of these study sites. Throughout Pione velans occurred more frequently than other species. However C. dissimilis eroded more shell material (surface area and volume) than P. velans at the Lacepedes and the 5-10 Mile fishing grounds.
Lopez-Victoria & Zea (2005) suggested that a lower proportion of small individuals compared to larger ones indicate low recruitment rates in bioeroding sponges. We found large areas of infestation of C. dissimilis implying that this species had not had any recent recruitment at these two sites, whereas P. velans seemed to have had high recruitment rates recently, based on the high number of smaller infestations seen for this species. Alternatively C. dissimilis may have found a more suitable environment at these sites and grown at a faster rate.
Shells from the Lacepedes fishing grounds showed higher amounts of erosion (area and volume) particularly in the highest grade (grade 3) and the dorsal valves. This difference was influenced by the larger overall shell size sampled at the Lacepedes.
5.0 Benefits
At the start of this project very little information was available on the species occurrence and distribution of bioeroding sponges in pearl oyster wild stocks (Pinctada maxima) and their habitats. The benefits of the results of this project to the pearling industry and scientific community at large are substantial, as there is now general faunistic and ecological data available that can be used as baseline information and as a reference for future infestation studies on bioeroding sponges in pearl oyster stocks.
This project provides estimates on infestation rates of bioeroding sponges in pearl oyster shells across size/age classes of shell, at the main pearl oyster fishing grounds and over three consecutive fishing seasons. No consistent increase in infestation rate was detected through time and long-term monitoring is recommended to assess if bioeroding sponge infestations are increasing in pearl oyster shells.
Comparisons of infestation rates in pearl oyster shells with estimates of infestation rates in calcareous substrates on the fishing grounds on an area basis are provided. Results indicate that bioeroding sponges may have a preference for pearl oyster shell. Contribution of calcareous substrate (other than pearl shells) from the fishing grounds to the spreading of the sponge may be negligible.
Techniques were developed to estimate the volume of bioeroding sponge erosions in pearl oyster shells. These estimates are provided and results are compared between different sponge species and fishing grounds. Potential differences in local recruitment between the bioeroding sponge species were detected.
Detailed recommendations are given to aid ongoing field surveys and to demonstrate the limitations of visual assessments. These include an interactive field guide that was developed to demonstrate the most common visual appearance of bioeroding sponge infestations. The guide will help industry and research personnel in identifying bioeroding sponges in general and will also serve as a guideline to determine grades of infestation during field surveys.
Fisheries Research Report [Western Australia] No. 196, 2009 37
6.0 Further Development
This project focused on bioeroding sponge infestations and their management in pearl oyster wild stock (Pinctada maxima) in North Western Australia. Quantitative data on bioeroding sponge infestations in pearl oyster farm stock is not available. However such data would allow assessing if wild stocks were the major source of infestation in the farms or if environmental conditions and husbandry techniques allow for the further development and spread of the sponges at the farms.
Initial results by Fromont et al., (2006) suggest that a different sponge species (Cliona dissimilis) is dominant in farm shells. However only a small number of shells were sampled during this initial study. This project provides some evidence that the main species in wild stocks, P. velans, may have had high recruitment rates recently, based on the high number of smaller infestations seen for this species. Further studies on industry farms are recommended to investigate infestation rates of bioeroding sponges in pearl oysters in farm environments and how they relate to the results obtained from this study.
The reproductive pathways of bioeroding sponges in pearl oysters on commercial pearl oyster farms could be the focus of a new study. Determining the reproductive processes is important for understanding the timing and pathways of infestation so that treatments can be applied at the appropriate time. During the current project reproductive output of bioeroding sponges could not be determined in wild stocks of the pearl oyster because the suspected reproductive period of the main bioeroding sponge species was outside the sampling period, which was linked to the fishing season (March-June). Working on farm samples would allow sampling to occur year round. A monthly sampling design could be developed with two or three cooperating pearl oyster farms. Monthly sampling of shells would reveal whether the main sponge species are sexually reproductive in November at all locations and whether any sexual development or clonal spread occurs via fragmentation.
The current project indicated that environmental conditions (e.g. heavy sedimentation, turning of shells) on the fishing ground might have caused the mortality of bioeroding sponges. In addition bioeroding sponge infestations do not develop in pearl shells until shells reach about 120 mm in shell length. It has been hypothesised that this is due to the erosion of the periostracum in certain areas of the shell by natural attrition (Mao Che et al. 1996). In a farm situation, cleaning could contribute to shell erosion. Questions to be asked and tested in tank experiments could include the following: how long does it take for infestations to spread across a panel? Do shells have to touch or can infestations across shells occur even if shells are physically separated? Does erosion of the periostracum (through cleaning) enhance the risk of infestation? Is sponge larval settlement hindered by a protective layer on the shell surface (periostracum or coating)? Do smaller shells (2-3 year age class) that have not been previously infected become infected at the hinge if not treated? How long do sponges need to be covered (preventing filtration) before mortality occurs?

38 Fisheries Research Report [Western Australia] No. 196, 2009
7.0 Planned Outcomes
The planned outcomes for this project were identified as performance indicators in the original project. Each of these are addressed below.
1. Field identification guide for bioeroding sponge infestation and appearances developed
An interactive field guide was developed to demonstrate the most common visual appearances of bioeroding sponge infestations. It will help industry and research personnel in identifying bioeroding sponges. This will serve as a guideline to determine grades of infestation during field surveys.
2. A methodology for quantifying sponge erosion within pearl oyster shells and pearl shell habitat developed
3. A methodology was developed to obtain estimates on bioeroding sponge erosion volume within pearl oyster shells. However estimates on erosion volumes in habitat samples could not be obtained because infestation rates were very low (< 1%) and superficial in most cases.
A database of bioeroding sponge incidence in habitat and pearl shell established
A database has been developed and the data is now available for future comparisons.
4. Analysis of spatial and temporal trends in bioeroding sponge infestation rates completed
Detailed faunistic data was obtained from seven fishing grounds, the two main fishing grounds were sampled across three consecutive fishing seasons (n=1,033). Visually determined presence and absence data was collected from seven fishing grounds and two of the main fishing grounds were sampled across three consecutive fishing seasons (n=69,966). Both data sets were analysed.
5. Recommendations for the management of bioeroding sponge infestations made
No simple and straightforward management changes have been derived from this project. Lowering the size limit to the larger end of the 2-3-age class (115-120 mm in shell length) could potentially reduce the overall infestation rate of animals on industry farms if the wild stock is the major source of infestation. If, after further discussion with industry, this is regarded as a feasible strategy, the implications to the stock structure would need to be assessed after full consideration by the management advisory committee.
8.0 Conclusions
This project was successful in providing general faunistic and ecological data on the occurrence of bioeroding sponge species in pearl oyster shells (Pinctada maxima). A total of seven bioeroding sponge species were found in pearl oyster shell samples from the fishing grounds in North Western Australia: Pione velans, Cliona dissimilis, Cliona orientalis, two unidentified species of Cliona, and one unidentified species each of Aka and Zyzzya. Estimates on infestation rates of bioeroding sponges across size/age classes of shell at the main pearl oyster fishing grounds and over three consecutive fishing seasons are given. The sponge infestation rate increased with pearl oyster shell size. A lower infestation rate was found in the 2-3 year age class compared to the 4-5 and 6+ year age classes. Shells smaller than 115 mm in shell length (spat) had negligible infestation possibly because the periostracum, a proteinaceous layer of

Fisheries Research Report [Western Australia] No. 196, 2009 39
the shell, is still covering and protecting younger shell. The periostracum becomes eroded as shell age increases and first erosion occurs around the umbo, where bioeroding sponges first establish themselves.
No consistent increase in infestation rates of bioeroding sponges was detected in pearl oyster shells through time, indicating that rates are fluctuating and long-term data is necessary to determine if infestations by bioeroding sponges are increasing in pearl oyster shells.
Comparisons of infestation rates in pearl oyster shells with estimates of infestation rates in calcareous substrates on the fishing grounds (other than pearl shells) on an area basis revealed that calcareous substrate is at least two orders of magnitude more available than shell habitat. However infestation rates in calcareous substrate is substantially lower. These results indicate that bioeroding sponges may have a preference for pearl oyster shell. Calcareous substrate (excluding pearl shells) on the fishing grounds will contribute to the increased incidence of the sponge to a lesser degree than discarded and larger pearl oyster shells.
Techniques were developed to estimate the volume of bioeroding sponge erosions in pearl oyster shells and comparisons of bioeroding sponge volume are given between different sponge species and fishing grounds. Pione velans was the dominant species at all study sites, however, Cliona dissimilis eroded more shell material than P. velans at two of the sites. A lower proportion of small individuals compared to larger ones may indicate low recruitment rates of C. dissimilis at these sites, whereas P. velans appeared to have had high recent recruitment rates, based on the high number of smaller infestations seen for this species.
A clear relationship was found between the estimated eroded area on the surface of pearl oyster shells and the internal erosion volume of bioeroding sponge. This relationship was described with simple, linear regressions. Therefore surface area estimates can provide a good indication of internal erosion volume in pearl oyster shells and is a suitable method for use on industry vessels. Grading shells into three different categories, according to the severity of erosion, proved to be a suitable method to quickly assess the amount of erosion caused by bioeroding sponges. Generally the methods were more accurate in shells with larger amounts of erosion.
External appearances such as colour or pit size were not suitable criteria to separate species of bioeroding sponges. The two main species occurred in a range of colours. Orange, the most frequently observed colour, was present in both species with similar frequency. Both species had boring holes of varying sizes. A large proportion of all pearl shells had visual signs of infestation but active sponge tissue was confirmed in only 1/3 of these samples. The results indicate that visual assessment alone cannot give a reliable indication of active sponge bioerosion and results of monitoring programs need to be confirmed by histological examinations on a regular basis to determine active sponge bioerosion.
The interactive field guide was developed to demonstrate the most common visual appearances of bioeroding sponges and to demonstrate the limitation of visual, external assessments. The guide will help industry and research personnel in identifying bioeroding sponges and will serve as a guideline to determine grades of infestation during field surveys.

40 Fisheries Research Report [Western Australia] No. 196, 2009
9.0 References
Acker KL, Risk MJ (1985) Substrate destruction and sediment production by the boring sponge Cliona caribbaea on Grand Cayman Island. Journal of Sedimentary Petrology 55:705-711
Alagarswami K, Chellam A (1976) On fouling and boring organisms and mortality of pearl oysters in the farm at Veppalodai, Gulf of Mannar. Indian Journal of Fisheries 23:10-22
Barthel D, Sunder J, Barthel K-G (1994) The boring sponge Cliona vastifica in a subarctic population of Chlamys islandica - An example of balanced commensalism? In: Van Soest, Van Kempen, Braekman (eds) Sponges in time and space. Balkema, Rotterdam, p 289-296
Bergman KM, Elner RW, Risk MJ (1982) The influence of Polydora websteri borings on the strength of the shell of the sea scallop Placopecten magellanicus. Can.J.Zool. 60:2551-2556
Calcinai B, Azzini F, Bavestrello G, Cerrano C, Pansini M, Thung D-C (2006) Boring sponges from Ha Long Bay, Tonkin Gulf, Vietnam. Zoological Studies 45:201-212
Doroudi.MS (1996) Infestation of pearl oysters by boring and fouling organisms in the northern Persian Gulf. Indian Journal of Marine Sciences 25:168-169
Fromont J, Craig R, Rawlinson L, Alder J (2005) Excavating sponges that are destructive to farmed pearl oysters in Western Australia. Aquaculture Research 36:150-162
Hart A, Murphy D, Slowik V (2004) Pearl Oyster Managed Fishery Status Report. In: JW Penn, WJ Fletcher, F Head (eds) State of the Fisheries Report 2004/05, Department of Fisheries, Western Australia, p 172-177
Hart AM, Friedman K. (2004) Mother-of Pearl Shell (Pinctada maxima): Stock Evaluation for Management and Future Harvesting in Western Australia, FRDC Project 1998/153, Fisheries Research Contract Report No. 10, Department of Fisheries, Western Australia, 84
Hart AM, Taylor JT (in press). Exploitation and culture of the silver-lipped pearl oyster. In: The Biology and Culture of pearl Oysters. Eds: Lucas J and Southgate PC
Highsmith RC (1981) Coral Bioerosion:Damage relative to skeletal density. Am.Nat. 117:193-198
Herdmann WA (1905) Report on the sponges. In: Herdmann Waeal (ed) Report to Cylon Pearl Oyster Fisheries of Gulf of Mannar. Royal Society London, p 57-237
Highsmith RC, Lueptow RL, Schonberg SC (1983) Growth and bioerosion of three massive corals on the Belize barrier reef. Marine Ecology Progress Series 13:261-271
Hill MS (1996) Symbiotic zooxanthellae enhance boring and growth rates of the tropical sponge Anthosigmella varians forma varians. Marine Biology 125:649-654
Holms KE, Edinger EN, Hariyadi, Limmon GV, Risk MJ (2000) Bioerosion of live massive corals and branching coral rubble on Indonesian Coral Reefs. Marine Pollution Bulletin 40:606-617
Holms KE (2007) Effects of eutrophication on bioeroding sponge communities with the description of new West Indian sponges, Cliona spp. (Porifera: Hadromerida: Clionidae). Invertebrate Biology 119:125-138
Hooper JNA, Soest RWM van (2002). Systema Porifera: a guide to the classification of sponges. Eds: Hooper JNA, van Soest RWM. Kluwer Academic/Plenum Publishers, New York 2: 1-1707
Lopez-Victoria M, Zea S (2005) Current trends of space occupation by encrusting excavating sponges on Colombian coral reefs. Marine Ecology 26:33-41
Mao Che L, Le Campion-Alsumard T, Boury-Esnault N, Payri C, Golubic S, Bezac C (1996) Biodegradation of shells of the black pearl oyster, Pinctada margaritifera var. cumingii, by microborers and sponges of French Polynesia. Marine Biology 126:509-519
Fisheries Research Report [Western Australia] No. 196, 2009 41
Moase PB, Wilmont A, Parkinson SA (1999) Cliona - an enemy of the pearl oyster Pinctada maxima in the West Australian pearling industry. SPC Pearl Oyster Information Bulletin 13:27
Reis MAC, Leao ZMAN (2000) Bioerosion rate of the sponge Cliona celata (Grant 1826) from reefs in turbid waters, north Bahia, Brazil., pp 273-278
Risk MJ, Sammarco PW, Edinger EN (1995) Bioerosion in Acropora across the continental shelf of the Great Barrier Reef. Coral Reefs 13:79-86
Rose CS, Risk MJ (1985) Increase in Cliona delitrix infestation of Montastrea cavernosa heads on an organically polluted portion of the Grand Cayman Fringing Reef. Marine Ecology 6:345-363
Rosell D (1994) Morphological and ecological relationships of two clionid sponges. Ophelia 40:37-50
Rosell D, Uriz M-J, Martin D (1999) Infestation by excavating sponges on the oyster (Ostrea edulis) populations of the Blanes littoral zone (north-western Mediterranean Sea). J.Mar.Biol.Ass.U.K. 79:409-413
Ruetzler K (1975) The role of burrowing sponges in bioerosion. Oecologia 19:203-216
Ruetzler K (2002) Impact of crustose clionid sponges on Caribbean reef corals. Acta Geologica Hispanica 37:61-72
Sammarco PW, Risk MJ (1990) Large-scale patterns in internal bioerosion of Porites: cross continental shelf trends on the Great Barrier Reef. Marine Ecology Progress Series 59:145-156
Schoenberg CHL (2001) Estimating the extent of endolithic tissue of a clionid Great Barrier Reef sponge. Senckenbergiana maritima 31:29-39
Schoenberg CHL (2002) Substrate effects on the bioeroding demosponge Cliona orientalis. 1. Bioerosion rates. PSZNI.Mar.Ecol. 23:313-326
Schoenberg CHL (2003) Substrate effects on the bioeroding demosponge Cliona orientalis. 2. Substrate colonisation and tissue growth. PSZNI.Mar.Ecol. 24:59-74
Velayudhan TS (1983) On the occurrence of shell boring polychaetes and sponges on pearl oyster Pinctada fucata and control of boring organisms. Proc.Symp.Coastal Aquaculture 2:614-618
Williams EH, Bartels PJ, Bunkley-Williams L (1999) Predicted disappearance of coral-reef ramparts: a direct result of major ecological disturbances. Global Change Biology 5:839-845
Zundelevich A, Lazar B, Ilan M (2007) Chemical versus mechanical bioerosion of coral reefs by boring sponges - lessons from Pione cf. vastifica. Journal of experimental biology 210:91-96

42 Fisheries Research Report [Western Australia] No. 196, 2009
10.0 Appendices
10.1 Appendix 1: Field guide to identify bioeroding sponges in pearl oyster shell
The interactive field guide was developed to demonstrate the most common visual appearances of bioeroding sponge infestations and to show different levels of infestation (grade 1-3) in pearl oysters (Pinctada maxima) wild stocks. Infestations of other bioeroders in pearl shells are shown to eliminate confusion with bioeroding sponges.
Industry and research personnel can use the field guide to help identifying bioeroding sponges in general and as a guideline for determining grades of infestation during field surveys. It cannot be used to identify species because external appearance proved to be unsuitable for species identification.
The interactive field guide can be viewed at http://www.geocities.com/sabinedaume/index.html and will be available on CD. Examples from this field guide are provided in Appendix 4.
10.2 Appendix 2: Intellectual Property
There is no intellectual property issues associated with the materials generated during this project.
10.3 Appendix 3: Staff
Dr Sabine Daume (Department of Fisheries, Western Australia)
Dr Jane Fromont (Western Australian Museum)
Dr Anthony Hart (Department of Fisheries, Western Australia)
Dave Murphy (Department of Fisheries, Western Australia)
Fiona Parker (Department of Fisheries, Western Australia)
Mark Davidson (Department of Fisheries, Western Australia)
Oliver Gomez (Western Australian Museum)
Frank Fabris (Department of Fisheries, Western Australia)
Jamin Brown (Department of Fisheries, Western Australia)
Sam Hair (Department of Fisheries, Western Australia)
10.4 Appendix 4: Examples of sponge infestation grades From the field guide
See Following Pages
VIsUAL IDeNTIFICATION FOR CLIONA INFesTATION on the flat valve
Note: infection usually noticed on the flat valve of a pearl shell, this side sits on sediment/seabed.

Fisheries Research Report [Western Australia] No. 196, 2009 43
Grade 0 - No Infection (Normal)
Shell surface is smooth and even.
Hard smooth shell surface with no pitting or discolouration.
Grade 1 – Light Infection
VIsUAL IDeNTIFICATION FOR CLIONA INFesTATION (continued)
Round pitting typical of cliona.
Rougher shell surface with pinholes developing. Smaller area of infection compared to Grade 2.
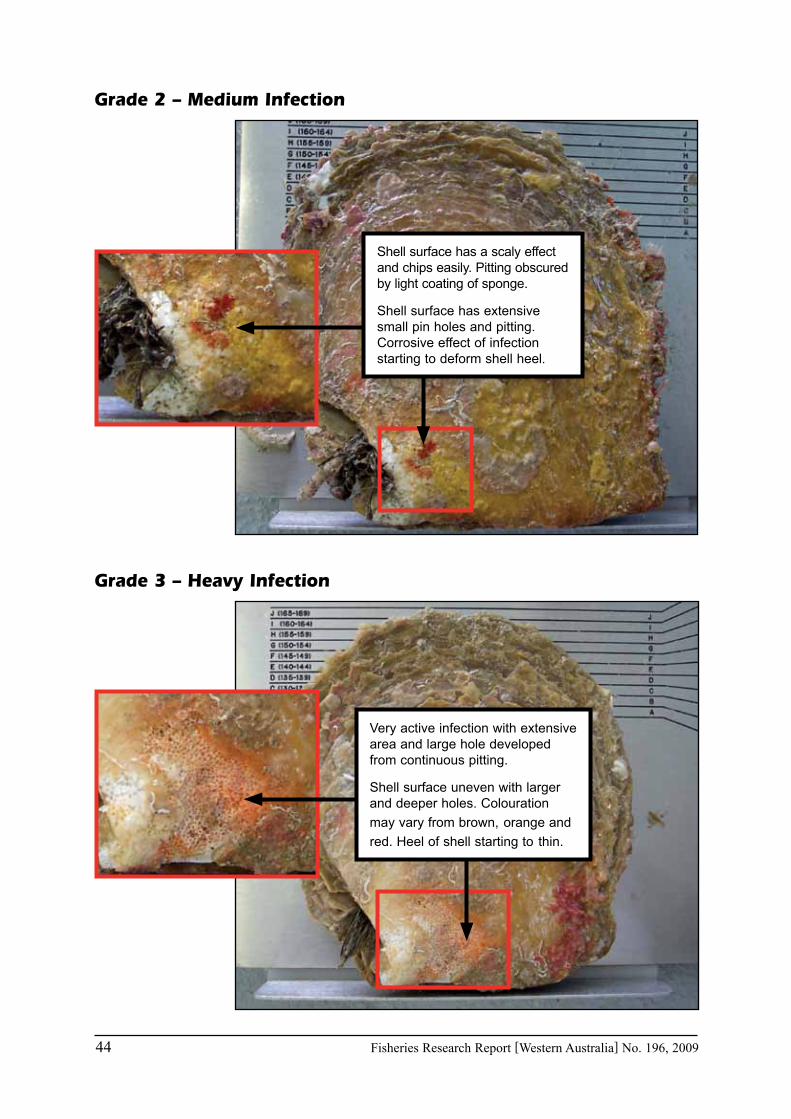
44 Fisheries Research Report [Western Australia] No. 196, 2009
Grade 2 – Medium Infection
Shell surface has a scaly effect and chips easily. Pitting obscured by light coating of sponge.
Shell surface has extensive small pin holes and pitting. Corrosive effect of infection starting to deform shell heel.
Grade 3 – Heavy Infection
Very active infection with extensive area and large hole developed from continuous pitting.
Shell surface uneven with larger and deeper holes. Colouration
may vary from brown, orange and
red. Heel of shell starting to thin.