Embed Size (px)
Citation preview

Virginia Department of Corrections
Management Information Summary Annual Report
Year Ended June 30, 2005
Compiled ByThe Budget Office
Office of the Controller

COVER DESCRIPTION Section 53.1-41 of the Code of Virginia states that “to the extent feasible, it shall be the duty of the Director to provide persons sentenced to the Department with opportunities to work…”. Offender employment allows offenders to earn a small income to purchase hygiene and other commissary items, and helps to reduce taxpayer cost of operating essential prison operations. Inmate employment also provides work habits, experience, training and skills, thereby increasing inmates’ chances for post-release employments; thus reducing the chances of re-offending. As of June, 2005, there were 22,075 employment opportunities in institutional, industrial, highway maintenance, work center/public service work crews, agribusiness and capital construction. The cover depicts inmates at work in some of the following areas of employment opportunities: Institutional Jobs: A range of jobs are operated by individual prisons to support daily operations. Examples include food service, maintenance, laundry and janitorial work. Virginia Correctional Enterprises: Inmates employed in industrial prison jobs produce goods or services for sale. Industries such as upholstery, furniture building, printing, and commercial laundry provide services and products for sale to other State agencies and provide inmates with skilled job training. The Private Industry Enhancement (PIE) program enables private businesses to manufacture within prisons using inmate labor. Inmates working in PIE jobs are paid prevailing wages and are required to return the majority of earnings to pay court costs, restitution, child support, and a portion of prison housing costs. One such program is at Coffeewood Correctional Center where carburetors are rebuilt. Joint ventures in manufacturing between VCE and private entities increase the quality and value of VCE products while expanding the market for community businesses.
Highway Road Maintenance: Through the Department’s contract with the Virginia Department of Transportation, carefully screened inmate work crews maintain rural highways. Revenue earned through this program helps offset food costs at field units.
Work Centers / Public Service Work Crews: Inmates housed primarily at Work Centers serve local governments and other state agencies with low/no-cost labor crews. These crews provide services such as: maintaining grounds at the State Capitol and in State Parks, painting schools and public buildings, cleaning landfills, helping localities in emergencies such as floods and heavy snow removal, etc.
Agribusiness: Inmate workers in farming activities produce food for the inmate population, reducing the Department's need to purchase these items. 100% of the dairy, pork, beef and fish consumed by inmates are produced through the DOC agribusiness program. Hydroponics enables the Department to produce fresh vegetables year-round. The freeze plant at Southampton Correctional Center allows produce grown and/or purchased on the open market to be quick frozen. The DOC also operates a Farmer’s Market in Courtland and Jarrett. The markets distribute produce to over ninety (90) facilities statewide including DOC Food Service, Regional Jails, Department of Juvenile Justice and Mental Health.
Capital Construction: The Department through its Division of Architectural and Engineering Services operates a Construction Unit which utilizes the construction skills of its inmate level one population. This unit has been responsible for construction projects, major facility repairs, roofing projects, paving roads and parking lots, and asbestos removal at DOC facilities as well as other State agencies.

VIRGINIA DEPARTMENT OF CORRECTIONS ANNUAL MANAGEMENT INFORMATION SUMMARY REPORT
FOR THE FISCAL YEAR ENDED JUNE 30, 2005
Table of Contents
Page Strategic Plan …………………………………………………………………………. 1 The Year In Review ………………………………………………………..…………. 2 Financial/Operating Overview ……………………………………………………… 4 Financial Report ………………………………………………………………………. 17 Operating Per Capita Statement of Facilities ……………………………………. 30 Schedule of Direct and Indirect Inmate Costs …………………………………… 55 Average Daily Inmate and Probationer Population …………………………….. 75 Fiduciary Financial Statements (Inmate Trust & Commissary) ……………… 79 Employment Level Monitoring Report ……………………………………………. 82
Note: All dollar and percentage figures used in this report are shown as rounded to the nearest dollar and 1/10 of a percentage point,
respectively. Thus the results of arithmetic calculations (sums, divisions, percentages, etc.) when using the exact figures are correct, but due to rounding the results in this report might appear to be off by a few dollars or tenths of a percentage point.

STRATEGIC PLAN
VISION The Virginia Department of Corrections is a model correctional agency and a proven innovative leader in the profession. Virginia is a safer place to live and work because the Department provides exemplary services and programs that provide appropriate custody and supervision of offenders. The employees of the Department are the cornerstone of the agency. They share a common purpose and a commitment to the highest professional standards and excellence in public service. The Department, through its unwavering commitment to its employees, is a satisfying and rewarding place to work and grow professionally. MISSION The Department of Corrections enhances public safety by controlling and supervising sentenced offenders in a humane, cost-efficient manner, consistent with sound correctional principles and constitutional standards. VALUES We, the Department of Corrections, believe we can best fulfill our vision and accomplish our mission by demonstrating and living these values in our daily work. ♦ Doing work that is meaningful, and fulfilling, which contributes to the agency and society. ♦ Conforming to high professional, ethical and moral standards of conduct. ♦ Contributing to the achievement of the Department’s vision, mission and goals. ♦ Demonstrating a commitment to the Department’s purpose. ♦ Balancing the needs of the individual, society and all aspects of the agency. ♦ Being team players and supporting one another.
1

DEPARTMENT OF CORRECTIONS THE YEAR IN REVIEW
For the Fiscal Year Ended June 30, 2005 A few of the accomplishments of the Department of Corrections for the fiscal year ended 6/30/05 are highlighted below:
Year End Close Out The year-end close out continues to be a success. Once again, the Department of Corrections effectively utilized 100.00% of its general fund appropriation.
Employee Assistance Fund (EAF) The EAF was established during FY 2003 and on December 17, 2004, made it’s 100th award. The fund was created to provide monetary relief to current employees of the Virginia Department of Corrections who have experienced a crisis resulting in a financial need to include, but not limited to, death of an employee, serious illness of an employee or an immediate family member, loss of property due to fire, etc. The EAF is supported by DOC fund-raising activities and tax-deductible contributions from employees and other supporters. The Fund enables DOC to disburse immediate resources to employees without friends and co-workers “passing the hat.” Contributions to the EAF are used only for the benefit of current DOC employees. As of 6/30/05, the fund balance was $41,725.
Recognition from the Department of Defense On August 2, 2005, the Department received Five Star recognition from the Virginia Committee for Employer Support of the Guard and Reserve (VAESGR), a Department of Defense all volunteer committee. This Five Star recognition is given to employers who: (1) sign a statement of support, (2) review their Human Resource policies to ensure compliance with the Uniformed Services Employment and Reemployment Act of 1994, (3) train Managers and Supervisors in the provision of the law and how to manage employees in the military, (4) adopt ‘Above and Below’ policies by providing more support than just that required by law, and (5) support VAESGR. As of the date of the award, the Department has had over 160 employees called to active duty since 9/11 and over 100 were currently on active duty. VirginiaCORIS (Correctional Information System) The Department is continuing its efforts towards a multi-year software implementation effort that will result in an application capable of automating most of its offender related processes. FY 2005 served as the year for planning associated with the Time Computation module, with implementation scheduled for FY 2006. Planning is programmed in FY 2006 for modules associated with the Division of Community Corrections and the Division of Institutions with implementation scheduled for FY 2007/2008 and FY 2009/2010, respectively. Community Service Hours One of the foundations of work centers, detention and diversion centers is the performance of community service. In FY 2005, outside the Department of Corrections, these units performed more than 300,000 hours of community service. These hours were spent providing services to other state agencies and local government agencies thereby permitting either completion of projects that might not otherwise be accomplished or 2

the diversion of funds to other critical, unfunded needs. Among the agencies served was Southside Virginia Community College, Richmond City Public Works, Piedmont Geriatric Hospital, Capitol Public Works and multiple localities to include Buckingham, Nottoway, Amelia, Emporia, Crewe and South Hill to name a few.
New/Expanded Prisons The 2004 General Assembly session provided funding for the construction of two medium security prisons in Tazewell and Pittsylvania counties. Funding was also provided for St. Brides Phase II and the expansion of Deerfield Correctional Center. Construction for the expansion at Deerfield and completion of Phase II of St. Brides are projected to be November, 2006 and July, 2007, respectively. Construction of the new facilities in Tazewell and Pittsylvania counties are projected to be April, 2007 and May, 2007, respectively. Completion dates reflect when the facility will be turned over to DOC. A 60-day “shake down” period is conducted prior to inmate intake.
Environmental Protection Initiatives During FY 2005, the Department established a Pollution Prevention Section within the Environmental Services Unit in an effort to maintain a stable and safe environment and ensure ongoing identification and correction of any EPA violations. The 2005 General Assembly provided $2.5 million in funding over the biennium to correct environmental deficiencies discovered during EPA inspections at 16 facilities. In FY 2005, the Department expended approximately $500K in operating funds. Virginia Correctional Enterprises FY 2005 was a banner year for Virginia Correctional Enterprises with sales of approximately $45 million, an increase of 7% over the prior year, and a net income yield of $2.3 million. In addition to its successful financial year, VCE was instrumental in the renovation of a major staff office building. In June of this year, the Old State Library became the Patrick Henry Executive Office Building and began life as the administrative headquarters for Virginia Governor, Cabinet Secretaries, the Department of Planning and Budget and offices of the Department of General Services. The newly renovated 258,300 square foot building was outfitted from the basement to the top floor with quality products manufactured by VCE facilities. Evidence-Based Practices (EBP) The Department is pursuing the adoption of concepts that are scientifically based in an overall effort to improve operations and offender outcomes within the Divisions of Community Corrections and Institutions. Among these concepts is EBP, representing a series of programmatic and service components that have been found to be effective in improving the outcomes and reducing the recidivism of offenders. Upcoming Initiatives in FY 2006 Among the initiatives to look forward to in FY 2006 is full operation of the new agribusiness market at Jarrett, the development of Commissary spending plans, and the implementation of Western Union/JPay as an option for families and friends to send funds to inmates.
3
TOTAL EXPENDITURES BY CATEGORY - ALL FUNDS
X
FY 2005 FY 2004Personal Services (1) 544,289,806$ 516,885,121$ Supplies & Materials (2) 95,521,882 89,688,196 Contractual Services (3) 124,052,238 104,591,312 Other Services 72,422,009 70,735,043 Fixed Assets 23,042,752 28,024,530
859,328,687$ 809,924,202$
* Pulaski, Botetourt, and Baskerville costs will continue to be reflected in the field unit per capita rate and direct and indirect cost statements. **
(1) The increase in personal services is largely the result of annualization and increases in central appropriation adjustments (salary, fringe benefits, etc.).(2) The increase in supplies and materials is associated with merchandise procured by VCE, repair and maintenance costs, and the increased cost of heating oil. (3) The increase in contractual serices is associated primarily with medical and skilled services and the establishment of an expenditure code (1278) to capture goods and services provided through the Virginia Information Technology Agency (VITA). Historically, information technology goods were coded as fixed assets. This accounting change is a primary contributor to the net reduction in fixed assets expense.
FINANCIAL/OPERATING OVERVIEW
TOTAL EXPENDITURES BY CATEGORY - FY 2005
Fixed Assets2.7%
Other Services8.4%
Contractual Services (3)
14.4%
Supplies & Materials (2)
11.1%
Personal Services (1)63.3%
For the fiscal year ended June 30, 2005, the General Assembly appropriated the Department of Corrections (DOC) an adjusted operating budget of $860,956,801. The DOC expended $859,328,687, with the major portion of these expenditures being earmarked for salaries and benefits. The Department operated 30 Major Institutions (includes the conversion of Pulaski, Botetourt and Baskerville Correctional Centers from field units*), 10 Field Units, 6 Work Centers, 5 Diversion Centers, and 4 Detention Centers in which 30,373 offenders** were housed. In addition, the Department operated 43 Probation & Parole Districts and 10 Day Reporting Centers. (As of June 30, 2005, the number of offenders under such community-based supervision totaled 51,674, an increase of approximately 8% over last year.)
On average 30,373 offenders were housed in facilities operated by DOC during Fiscal Year 2005. Excluded from that statistic were 1,568 DOC inmates housed in a privately-operated prison in Lawrenceville.
4

CATEGORY DEFINITIONS
Personal Services are the salaries, wages, overtime and fringe benefits (social security, health insurance, group life insurance, long-term disability insurance, retirement, etc.) of DOC employees.
The Supplies and Materials category include expenditures for supplies and materials used in administration (employee clothing, office supplies, stationery, etc.), energy production (coal, natural gas, gasoline, fuel oil, etc.), manufacturing and merchandising (manufacturing supplies, packaging supplies, etc.), medical care (laboratory supplies, medical and dental supplies, drugs, etc.), repair and maintenance (including custodial care), inmate residence (inmate clothing, food, laundry and linen, toiletries, etc.), and miscellaneous other uses (agriculture, computer operation, education, recreation, etc.).
Examples of Contractual Services are freight, postage, telecommunications services, employee development and training, health care, legal services, consulting, advertising, repair and maintenance, architecture and engineering services, food service, laundry and linen service, computer hardware and software maintenance, software acquisition, computer operation, and travel-related services (transport, meals, lodging, etc.).
Other Services consist of miscellaneous expenditures such as unemployment compensation, incentive payments for participation in State-sponsored programs and activities (e.g., halfway houses), grants and aid to local governments, insurance premiums (property, medical malpractice, workers compensation, etc.) , lease payments, rent, utility charges (for water, sewerage, electricity, etc.), garbage collection, installment purchases, and debt service.
Fixed Assets are equipment, property, physical plant, and improvements to property and physical plant. Examples of fixed assets include electronic equipment (radar, radios, televisions, etc.), motor vehicles (cars, trucks, buses, forklifts, etc.), office furniture (bookcases, desks, files, tables, lamps, etc.), and household equipment (beds, mattresses, chairs, refrigerators, stoves, etc). Additional examples of fixed assets include site improvements, such as exterior lighting systems, fences, landscaping, parking areas, roadways, walkways, etc.
5

EXPENDITURES BY DIVISION - ALL FUNDS
DIVISION FY 2005 FY 2004Administration 52,290,750$ 46,817,384$ Operations 807,037,937 763,106,818
859,328,687$ 809,924,202$
EXPENDITURES BY DIVISION - FY 2005
The DOC has two major divisions - the "Division of Operations" and the "Division of Administration". The Division of Operations accounts for the vast majority of dollars expended since all DOC facilities, Community Corrections and Virginia Correctional Enterprises are included in this division. The Division of Administration consists of the Board of Corrections, Director's Office, Communications Unit, Inspector General, Compliance/Accreditation, Computer Technology Services Unit, Controller's Office, Research and Management Services, Architectural and Engineering Services, Procurement and Risk Management, and Employee Relations & Training.
Operations93.9%
Administration6.1%
6

DIVISION OF OPERATIONS FY 2005 FY 2004Administration (1) 42,238,815$ 41,765,547$ Facilities 617,736,530 581,626,940 Office of Health Services (2) 31,842,247 35,569,265 Community (excl. Facilities) 68,135,490 63,972,791 Va. Correctional Enterprises (3) 47,084,855 40,172,275
807,037,937$ 763,106,818$
(1) Administration includes Central Administration at Atmore, Employee Relations &Training, and management of the Division of Institutions (excluding the Office of HealthServices.
(3) The increase in expenditures within VCE represents an increase in production, primarily offset by increased sales.
EXPENDITURES OF THE DIVISION OF OPERATIONS - FY 2005
Facilities76.5%
Administration (1)5.2%
Community (excl. Facilities)
8.4%
Va. Correctional Enterprises (3)
5.8%
Office of Health Services (2)
3.9%(2) The Office of Health Services accounts for only 30.9% of all health services expenditures. These expenditures are for administrative expenses, off-site health care and drugs. The decrease is due to the procurement of HIV Antiretroviral drugs through VCU Health Services that were previously paid through Anthem. The remaining 69.1% is incurred by DOC correctional facilities where the health services are rendered.
7
DIVISION OF ADMINISTRATION FY 2005 FY 2004
Board of Corrections 14,018$ 12,554$ Director's Office 1,284,602 1,432,961 Communications Unit 374,659 355,105 Inspector General 2,719,214 2,861,747 Compliance & Accreditation 988,452 909,487 Technology Services Unit (CTSU) (1) 16,075,868 14,496,305 Controller's Office 2,709,457 2,745,386 General Services (2) 5,682,013 3,750,363 Research & Management Serv. 592,854 465,794 Architect. & Engr. Services (3) 5,994,513 4,687,109 Procurement/Risk Management 7,977,789 7,544,251 Employee Relations & Training 7,877,311 7,556,322
52,290,750$ 46,817,384$
ADP DISTRIBUTION BY FACILITY TYPE
EXPENDITURES OF THE DIVISION OF ADMINISTRATION - FY 2005
Employee Relations & Training
15.1%
Procurement/Risk Management
15.3%
Compliance & Accreditation
1.9%
ComputerTechnology Services
Unit (CTSU)30.7%
Controller's Office 5.2%
General Services10.9%
Inspector General5.2%
Communications Unit0.7%
Director's Office2.5%
Board of Corrections0.03%
Research & Management Serv.
1.1%
Architect. & Engr. Services11.5%
(1) The increase in expenditures is due to the purchase of computers to replace aging systems.(2) The increase in expenditures above FY04 levels is largely the result of continued adjustments to the billing cycle for Atmore lease payments.(3) The increase in expenditures is due in large part to projects undertaken by the Capital Construction Unit.
8
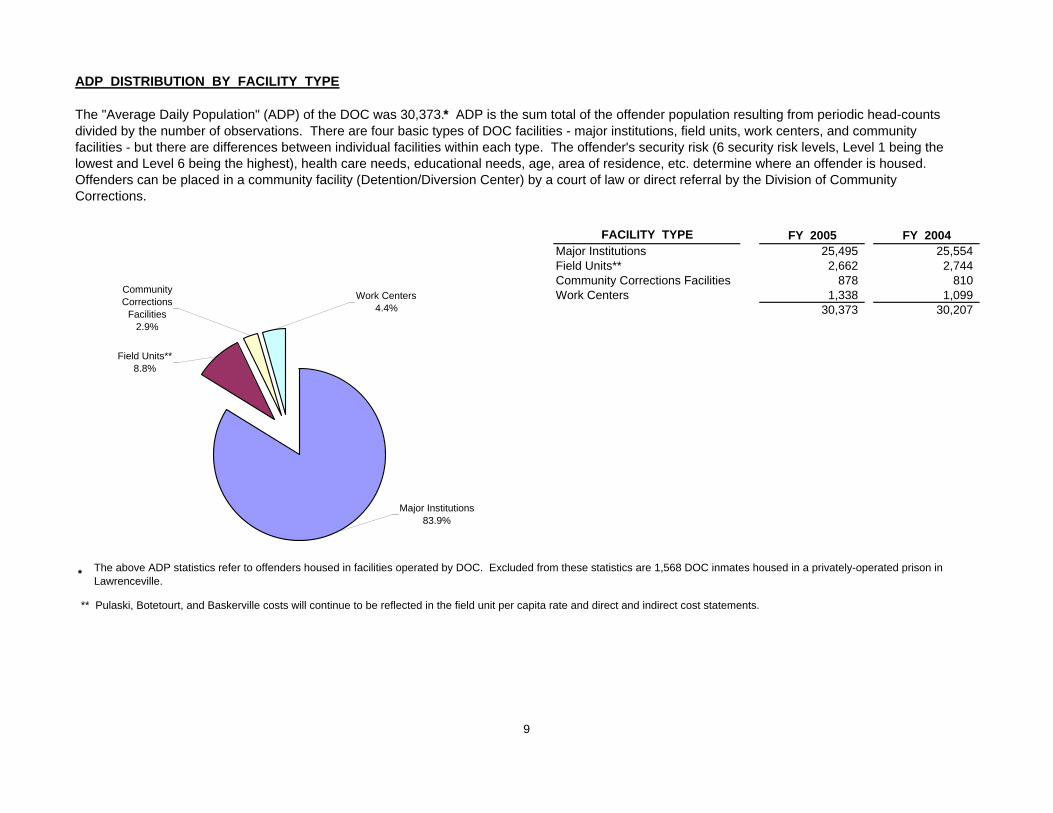
FACILITY TYPE FY 2005 FY 2004Major Institutions 25,495 25,554 Field Units** 2,662 2,744 Community Corrections Facilities 878 810 Work Centers 1,338 1,099
30,373 30,207
*
** Pulaski, Botetourt, and Baskerville costs will continue to be reflected in the field unit per capita rate and direct and indirect cost statements.
ADP DISTRIBUTION BY FACILITY TYPE - FY 2003
ADP DISTRIBUTION BY FACILITY TYPE
The "Average Daily Population" (ADP) of the DOC was 30,373.* ADP is the sum total of the offender population resulting from periodic head-counts divided by the number of observations. There are four basic types of DOC facilities - major institutions, field units, work centers, and community facilities - but there are differences between individual facilities within each type. The offender's security risk (6 security risk levels, Level 1 being the lowest and Level 6 being the highest), health care needs, educational needs, age, area of residence, etc. determine where an offender is housed. Offenders can be placed in a community facility (Detention/Diversion Center) by a court of law or direct referral by the Division of Community Corrections.
Work Centers4.4%
Community Corrections
Facilities2.9%
Field Units**8.8%
Major Institutions83.9%
The above ADP statistics refer to offenders housed in facilities operated by DOC. Excluded from these statistics are 1,568 DOC inmates housed in a privately-operated prison in Lawrenceville.
9

INMATE POPULATION - DEMOGRAPHICS *
Race/EthnicityOther1.9%
White35.0%
Black63.1%
Age
25 - 3433.6%
35 - 4430.8%
65+0.9%
55 - 592.6%
60 - 641.3%
Under 180.1%
45 - 5415.8%
18 - 2415.0%
GenderFemale7.3%
Male92.7%
* This demographic data represents the DOC inmate population as of December 31, 2004, the most recent data available. Out-of-state inmates were not included in this data pool, nor were inmates incarcerated in local jails.
10

INMATE POPULATION - OFFENSE DATA *
*
Offense
Not Reported0.2%
Assault9.8%
Larceny/Fraud16.3% Robbery
14.9%
Rape/Sexual Assault10.1%
Abduction5.0%
Murder10.8%Other Drugs
3.4%
Heroin/Cocaine11.4%
Other Non-Violent5.3%
Weapons2.6%
Burglary/Breaking & Entering
9.8%
Manslaughter1.1%
This offense data represents the DOC inmate population as of December 31, 2004, the most recent data available. Out-of-state inmates were not included in this data pool, nor were inmates incarcerated in local jails. Inmates convicted of multiple offenses are represented here by their most serious offense. For example, a drug trafficker who raped and murdered someone would be represented in the murder category. In regards to 'not reported' offenses, this data represents the percentage of inmates whose actual committing offense had not been reported (entered into OBSCIS). Over time this information is updated for that particular population.
11

OPERATING COST PER OFFENDER (PER CAPITA)
Field Units: Increase in per capita from FY 2004 to FY 2005 is the result of a reduction in ADP.Work Centers: Decrease in per capita from FY 2004 to FY 2005 is the result of continued inaccurate account coding between the work center and its parent Correctional agency.
OPERATING COST PER OFFENDER - FY 2005 VERSUS FY 2004
The Department-wide per capita cost of housing offenders was $21,248 in FY 2005, up 4.2% from FY 2004. The different facility types have different per capita costs for a variety of reasons. Inmates housed in field units and work centers present lower security risks than those housed in major institutions. These inmates also do not have chronic, serious health problems, therefore they need only modest medical resources. For these reasons, field units and work centers tend to have lower per capita costs than major institutions. Probationers housed in community facilities also present lower security risks and have lower medical costs than inmates housed in major institutions. However, the small size of these facilities prevents them from realizing economies of scale. Every facility, regardless of size, incurs fixed costs (administrative/food/medical staff, utilities, repairs, maintenance, etc.) that do not vary directly with offender population, causing small facilities to experience higher per capita costs than large ones.
$20,861
$17,733
$14,694
$20,401
$22,672
$19,332
$21,809
$13,705
$22,241$21,248
$-
$5,000
$10,000
$15,000
$20,000
$25,000
Major Institutions Field Units Work Centers Community CorrectionsFacilities
DOC-Wide Average
FY 2004FY 2005
12

OUT-OF-STATE INMATE REVENUE
DISTRIBUTION OF REVENUEDept. of Corrections 1,637,316$ To General Fund 2,107,272
Total 3,744,588$
OUT-OF-STATE INMATE REVENUE - FY 2005
DOC has successfully utilized excess prison capacity by housing inmates from other states for a fee. Inmates from Connecticut, Hawaii, and the Virgin Islands were housed in Virginia prisons during FY 2005. Revenue amounting to $3,744,588 was received in FY 2005 from housing these inmates. $1,637,316 of this revenue was retained by DOC to operate prisons, pay expenses related to the incarceration of these inmates, and provide funding for working capital. The balance of revenue in the amount of $2,107,272 was transferred to the general fund.
The revenue in FY 2005 decreased significantly from that in FY 2004 ($21,092,668) as result of the departure of inmates from Connecticut. At the end of FY05, a balance of approximately $470,000 existed in the Out-of-State revenue fund. The DOC is requesting nongeneral fund appropriation to allow the Department to utilize these funds plus any future revenue from approximately 22 inmates (3 from Hawaii and 19 from the Virgin Islands) to support the Department of Corrections’ Virginia Correctional Information System (Virginia CORIS).
To General Fund56.3%
Dept. of Corrections43.7%
13
COMMISSIONS EARNED FROM OFFENDER TELEPHONE SYSTEM
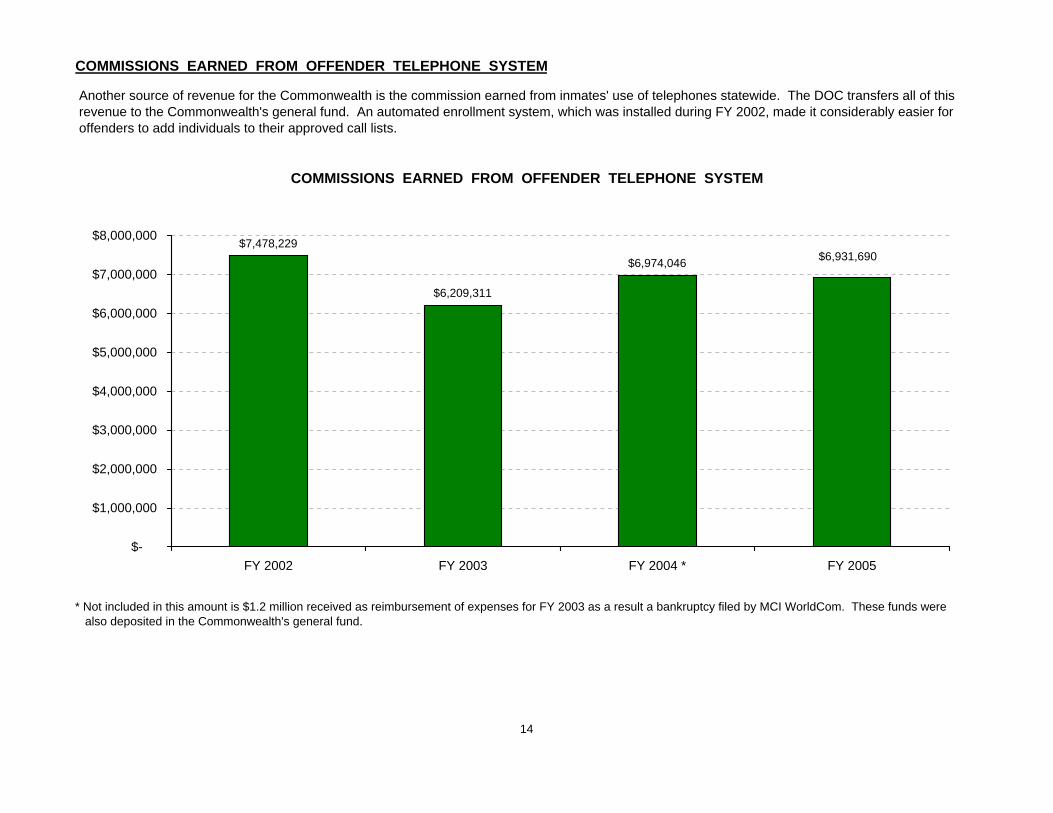
* Not included in this amount is $1.2 million received as reimbursement of expenses for FY 2003 as a result a bankruptcy filed by MCI WorldCom. These funds were also deposited in the Commonwealth's general fund.
COMMISSIONS EARNED FROM OFFENDER TELEPHONE SYSTEM
Another source of revenue for the Commonwealth is the commission earned from inmates' use of telephones statewide. The DOC transfers all of this revenue to the Commonwealth's general fund. An automated enrollment system, which was installed during FY 2002, made it considerably easier for offenders to add individuals to their approved call lists.
$7,478,229
$6,209,311
$6,974,046 $6,931,690
$-
$1,000,000
$2,000,000
$3,000,000
$4,000,000
$5,000,000
$6,000,000
$7,000,000
$8,000,000
FY 2002 FY 2003 FY 2004 * FY 2005
14

PER CAPITA MEDICAL EXPENDITURES
% OF TOTAL DOC
OPERATING EXPENDITURES
FY 2002 11.6%FY 2003 11.4%FY 2004 12.0%FY 2005 12.0%
PER CAPITA MEDICAL EXPENDITURES
On a per capita basis, DOC medical expenditures increased 6.7% in FY 2002, increased .3% in FY 2003, increased 6.1% in FY 2004 and increased by 5.2% in FY 2005. It is very difficult to predict medical costs, however generally speaking the fluctuations may be attributed to inflation, rising inpatient medical service costs, an aging offender population and the annualized cost of medical services contracts initiated in FY 2004. Despite the overall increase in medical expenditures, the Department experienced a significant reduction in the cost of HIV drugs due to the 340B program with VCU Health Services.
$3,028 $3,037$3,221
$3,389
$-
$500
$1,000
$1,500
$2,000
$2,500
$3,000
$3,500
$4,000
FY 2002 FY 2003 FY 2004 FY 2005
15

INMATE MEDICAL CO-PAYMENT REVENUE
INMATE MEDICAL CO-PAYMENT REVENUE
In response to the increasing cost of medical services, the DOC initiated in FY 1996 a "Medical Co-Pay" program whereby inmates are charged a fee or co-payment for certain medical services. The size of the co-payment varies with the kind of medical service rendered (doctor's visits, dental services, prescription drugs, artificial limbs, dentures, eyeglasses, hearing aids, etc.). The revenue from inmate medical co-payments is used to fund the DOC's telemedicine program. The telemedicine program, established at 16 facilities, enables inmates to receive medical care from remote locations (in this case the UVA and VCU/MCV medical centers), reducing the security costs associated with transporting inmates to medical facilities.
$496,310 $498,382 $491,204 $498,332
$-
$100,000
$200,000
$300,000
$400,000
$500,000
$600,000
FY 2002 FY 2003 FY 2004 FY 2005
16

=============================================== FINANCIAL REPORT
For the Fiscal Year Ended June 30, 2005 ===============================================
Page Summary ………………………………………………………………………… 18 Appropriation and Expenditures: By Fund ………………………………………………………………….. 19 All Funds ………………………………………………………………… 20 General Funds ……………………………………………………………. 26 Federal Funds ……………………………………………………………. 27 Special Funds ……………………………………………………………. 28
17
FINANCIAL REPORT SUMMARY
For the Fiscal Year Ended June 30, 2005 Total DOC appropriations for FY 2005 were $860,956,801, compared to $814,031,384 for the prior fiscal year. This represents an increase of 5.8%. Of the total appropriations, the General Fund for the Department of Corrections totaled $795,844,330 (approximately 92%) in FY 2005, compared to $744,536,030 (approximately 91%) for the prior fiscal year. This increase of $51,308,300 (6.9%) is primarily attributable to the annualization of FY 2004 central appropriation adjustments in the amount of $24.9 million and $14.4 million in FY 2005 central appropriation adjustments. These central appropriation adjustments consist of increases in health insurance premiums, reductions in the VRS rate, suspension of group life insurance and funding for salary increases. The General Fund appropriation includes the substitution of general fund appropriation in the amount of $14.2 million versus nongeneral fund appropriation previously supported with out-of-state inmate revenue. Out-of-state revenue was initially generated as a result of a DOC initiative to utilize excess prison capacity by housing inmates from other states for a fee. With revenue generated from these fees, appropriation was used this fiscal year to partially fund the operation of Sussex II. However, the decrease in special funds appropriation from last year is the result of the loss of out-of-state inmate revenue, due to DOC’s own need to retain the beds to house its growing population and to reduce the out-of-compliance numbers. Total Non-General Fund appropriations of $62,868,382 comprised approximately 7% of the Department’s budget. Virginia Correctional Enterprises (VCE) appropriation ($47,095,279) and out-of-state revenue appropriation ($6,625,932) comprised 85% of the total. Warranty overhead, the Capital Construction Unit, pre-sentence investigations (HB 664), diversion center expenditures supported with room and board revenue, and medical expenditures supported with medical co-payment funds, as well as miscellaneous other activities accounted for the remaining ($9,147,171) special fund appropriation. Virginia Correctional Enterprises (VCE) is a manufacturing arm of the DOC providing various products and services to other state agencies. VCE is primarily a program to keep inmates employed while simultaneously teaching them a trade. It is financially self-sufficient through the appropriation of revenue from the sale of good and services. During FY 2005, VCE had sales of approximately $45 million, yielding net income of $2.3 million, which is used as working capital. VCE operates 13 different lines of business located throughout the state. In addition to the production of license plates for DMV, some other products and services provided include clothing, laundry, shoes, wood furniture, office systems and automotive services. Substance Abuse Treatment Grants ($1,806,392) for outpatient or therapeutic treatment programs comprise the majority of the Federal Fund appropriation. The remaining balance consists of appropriation for the Department’s offender management system initiative - Virginia CORIS, and evaluation of the St. Brides expansion.
18

DEPARTMENT OF CORRECTIONSOPERATING APPROPRIATIONS AND EXPENDITURES - BY FUND
FOR THE FISCAL YEAR ENDING JUNE 30, 2005
Appropriation Total PercentPer Ch. 4 Total Adjusted Total Expended
FUND (1) 2004 Assembly Adjustments Appropriation Expenditures Y-T-DGENERAL 781,398,804$ 14,445,526$ 795,844,330$ 795,840,168$ 100%
FEDERAL - 2,244,089 2,244,089 1,823,074 81%
SPECIAL 49,636,770 13,231,612 62,868,382 61,665,445 98%
TOTAL FUNDS 831,035,574$ 29,921,227$ 860,956,801$ 859,328,687$ 100%
(1) The General Fund designations relate to ordinary DOC operations, including all activities that do not qualify for inclusion in any other fund. Federal Fund designations relate to appropriations and expenditures of grants issued by the Federal Government. Special Fund designations relate to appropriations and expenditures that are restricted to specific programs & projects.
General Federal Special TotalRECAP OF ADJUSTMENTS (2): Funds Funds Funds Funds
Federal Grant Match -$ -$ -$ -$ Federal Grants - 2,244,089 - 2,244,089 Mandatory Reappropriation 4,522 - 4,522 Realighment to Corrections Special Reserve (32,589) - 32,589 - Other Non-General Funds (3) - 7,235,014 7,235,014 Central Appropriation Adjustment (4) 14,473,593 - 14,473,593 2005 General Assembly Action (Increase for VCE) 5,964,009 5,964,009
TOTAL ADJUSTMENTS 14,445,526$ 2,244,089$ 13,231,612$ 29,921,227$
(2) The Department of Criminal Justice Services (DCJS) no longer provides state match as a result of statewide budget reductions. Required state match funds are provided by the applicable agency(s).(3) Of the $7,235,014 in additional nongeneral fund appropriation, $5,095,279 is attributed to an appropriation increase for Virginia Correctional Enterprises (VCE).(4) Included among these central appropriation adjustments are increases in health insurance premiums, VRS rate reduction, suspension of group life insurance, and funding for the annualization of the 2.25% salary increase effective November 25, 2003 and an increase of 3% effective November 25, 2004.
19

DEPARTMENT OF CORRECTIONSDIVISIONS OF ADMINISTRATION & OPERATIONS
OPERATING APPROPRIATIONS AND EXPENDITURES - ALL FUNDSFOR THE FISCAL YEAR ENDING JUNE 30, 2005
Appropriation Total PercentPer Ch. 4 Total Adjusted Total Expended
D I V I S I O N 2004 Assembly Adjustments Appropriation Expenditures Y-T-D
ADMINISTRATION:Central Administration 32,097,696$ 13,406,069$ 45,503,765$ 44,413,439$ 98%
Employee Relations & Training 7,368,839 508,472 7,877,311 7,877,311 100%
SUBTOTAL - ADMINISTRATION 39,466,535$ 13,914,541$ 53,381,076$ 52,290,750$ 98%
OPERATIONS:
Administration -$ 42,048,667$ 42,048,667$ 42,238,815$ 100%
Facilities - 617,725,287 617,725,287 617,736,530 100%
Office of Health Services - 32,105,020 32,105,020 31,842,247 99%
Community (excluding Facilities) - 68,411,045 68,411,045 68,135,490 100%
Reallocations within the Division 755,533,048 (755,342,621) 190,427 - 0% of Operations
Virginia Correctional Enterprises 36,035,991 11,059,288 47,095,279 47,084,855 100%
SUBTOTAL - OPERATIONS 791,569,039$ 16,006,686$ 807,575,725$ 807,037,937$ 100%
TOTAL - DEPT. OF CORRECTIONS 831,035,574$ 29,921,227$ 860,956,801$ 859,328,687$ 100%
20

DEPARTMENT OF CORRECTIONSDIVISION OF ADMINISTRATION
OPERATING APPROPRIATIONS AND EXPENDITURES - BY OFFICE - ALL FUNDSFOR THE FISCAL YEAR ENDING JUNE 30, 2005
Appropriation Total PercentDIVISION OF Per Ch. 4 Total Adjusted Total Expended
ADMINISTRATION 2004 Assembly Adjustments Appropriation Expenditures Y-T-DBoard of Corrections -$ 14,871$ 14,871$ 14,018$ 94%
Director's Office - 1,299,641 1,299,641 1,284,602 99%
Communications Unit - 374,659 374,659 374,659 100%
Inspector General - 2,721,137 2,721,137 2,719,214 100%
Compliance/Accreditation - 988,452 988,452 988,452 100%
Corrections Technology Services Unit (CTSU) (1) - 16,570,544 16,570,544 16,075,868 97%
Controller's Office - 2,755,157 2,755,157 2,709,457 98%
General Services - 5,682,013 5,682,013 5,682,013 100%
Research & Management Services - 592,854 592,854 592,854 100%
Architectural & Engineering Services (2) - 6,526,648 6,526,648 5,994,513 92%
Procurement/Risk Management - 7,977,789 7,977,789 7,977,789 100%
Employee Relations & Training 7,368,839 508,472 7,877,311 7,877,311 100%
Reallocations within the Division 32,097,696 (32,097,696) - - - of Administration
TOTAL - ADMINISTRATION 39,466,535$ 13,914,541$ 53,381,076$ 52,290,750$ 98%
(1) The adjusted appropriation includes $292,500 in nongeneral fund unexpended appropriation for the Telemedicine program. If adjusted for this amount,year-to-date expenditures would be 99%.
(2) The adjusted appropriation includes $447,135 in unexpended nongeneral fund appropriation for Warranty Overhead and the Captial Construction Unit. If adjusted for this amount, year-to-date expenditures would be 99%.
21
DEPARTMENT OF CORRECTIONSDIVISION OF OPERATIONS
OPERATING APPROPRIATIONS AND EXPENDITURES - BY OFFICE/FACILITY - ALL FUNDSFOR THE FISCAL YEAR ENDING JUNE 30, 2005
Appropriation Total PercentDIVISION OF Per Ch. 4 Total Adjusted Total Expended
OPERATIONS 2004 Assembly Adjustments Appropriation Expenditures Y-T-DDEPUTY DIRECTOR, REGIONAL OFFICES AND STAFF:
Administration 18,979,418$ 18,979,418$ 18,893,758$ 100%
Probation and Parole 61,264,253 61,264,253 61,032,462 100%
Classification 6,698,602 6,698,602 6,938,352 104%
Day Reporting Centers (1) 3,664,401 3,897,546 3,664,401 94%
Adult Residential (1) 882,479 882,479 1,115,107 126%
Financial Assistance for Confinement - - - 0% in Local Facilities
Office of Health Services (OHS) 32,105,020 32,105,020 31,842,247 99%
Secure Confinement 18,927,841 18,927,841 18,730,225 99%
Reallocations within the Division -
of Operations 180,484,725$ (37,729,566)$ 142,755,159$ 142,216,552$ 100%
TOTAL - VA CORR. ENTERPRISES 36,035,991$ 11,059,288$ 47,095,279$ 47,084,855$ 100%
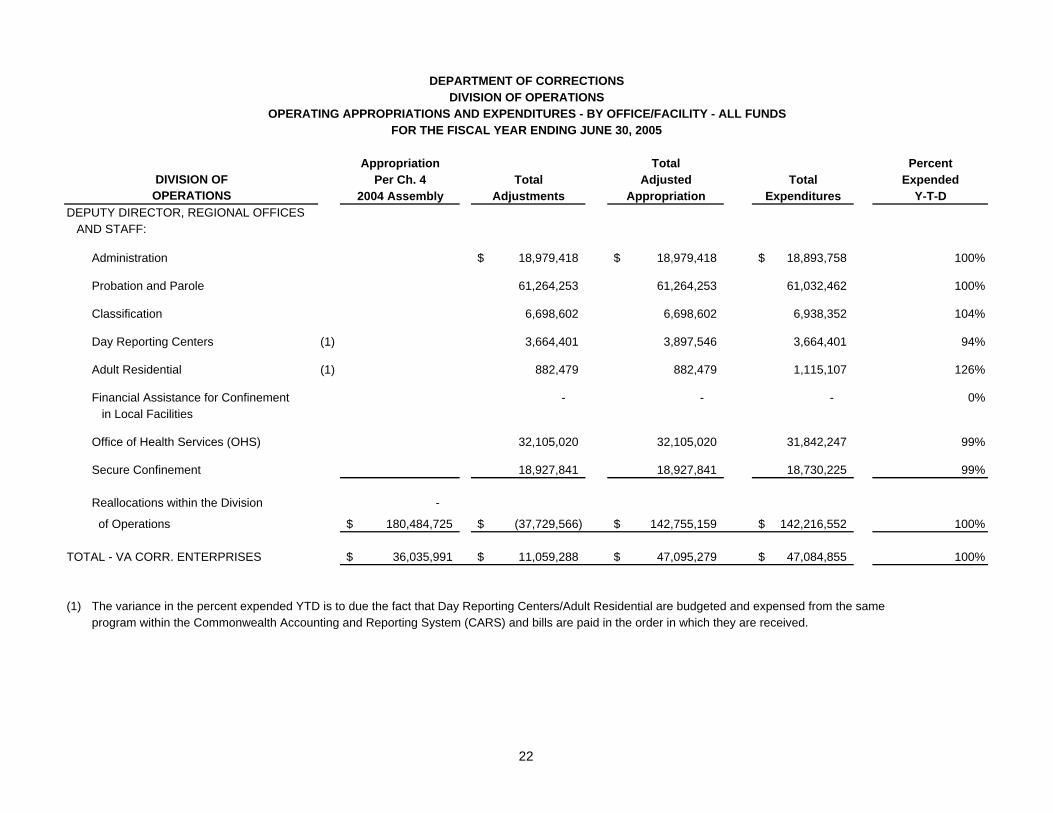
(1) The variance in the percent expended YTD is to due the fact that Day Reporting Centers/Adult Residential are budgeted and expensed from the sameprogram within the Commonwealth Accounting and Reporting System (CARS) and bills are paid in the order in which they are received.
22

DEPARTMENT OF CORRECTIONSDIVISION OF OPERATIONS
OPERATING APPROPRIATIONS AND EXPENDITURES - BY OFFICE/FACILITY - ALL FUNDSFOR THE FISCAL YEAR ENDING JUNE 30, 2005
Appropriation Total PercentDIVISION OF Per Ch. 4 Total Adjusted Total Expended
OPERATIONS 2004 Assembly Adjustments Appropriation Expenditures Y-T-D
FACILITIES
MAJOR INSTITUTIONS:
Celled Prototypes (MSI):
Brunswick Correctional Center 21,356,620$ (2,217,451)$ 19,139,169$ 19,005,882$ 99% Sussex I Correctional Center 27,201,024 (378,205) 26,822,819 26,822,819 100% Sussex II Correctional Center 23,309,059 893,200 24,202,259 24,202,259 100% Nottoway Correctional Center (1) 23,244,017 773,120 24,017,137 24,892,037 104% Buckingham Correctional Center 19,272,004 723,717 19,995,721 19,995,721 100% Augusta Correctional Center 23,152,961 (74,694) 23,078,267 23,078,003 100% Red Onion Correctional Center 21,127,742 127,143 21,254,885 21,254,884 100% Wallens Ridge Correctional Center 21,176,724 1,118,625 22,295,349 22,295,343 100% Keen Mountain Correctional Center 15,902,560 193,183 16,095,743 16,095,743 100% Greensville Correctional Center (1) 60,739,260 (1,619,801) 59,119,459 61,027,441 103%
SUBTOTAL - CELLED PROTOTYPES 256,481,971$ (461,163)$ 256,020,808$ 258,670,133$ 101%
Dormitory Prototypes (MSD):
Deep Meadow Correctional Center 17,710,889$ 679,659$ 18,390,548$ 18,390,548$ 100% Deerfield Correctional Center 10,427,275 359,802 10,787,077 10,787,075 100% Dillwyn Correctional Center 15,501,005 242,652 15,743,657 15,743,657 100% Indian Creek Correctional Center 16,997,773 (770,172) 16,227,601 16,227,601 100% Haynesville Correctional Center (2) 17,843,490 (1,967,206) 15,876,284 16,203,887 102% Coffeewood Correctional Center 16,077,831 2,365,713 18,443,544 18,443,544 100% Lunenburg Correctional Center 16,902,383 1,883,184 18,785,567 18,785,567 100%
SUBTOTAL - DORM. PROTOTYPES 111,460,646$ 2,793,632$ 114,254,278$ 114,581,879$ 100%
(1) The percentage YTD is due primarily to delays in processing IATs for shared services to the Nottoway and Greensville Work Centers.(2) The percentage YTD is due primarily to delays in processing IATs for shared services with Haynesville and Caroline Correctional Field Units.
23

DEPARTMENT OF CORRECTIONSDIVISION OF OPERATIONS
OPERATING APPROPRIATIONS AND EXPENDITURES - BY OFFICE/FACILITY - ALL FUNDSFOR THE FISCAL YEAR ENDING JUNE 30, 2005
Appropriation Total PercentDIVISION OF Per Ch. 4 Total Adjusted Total ExpendedOPERATIONS 2004 Assembly Adjustments Appropriation Expenditures Y-T-D
FACILITIES (Continued)
OTHER INSTITUTIONS:
Powhatan Correctional Center 24,385,912$ 1,003,131$ 25,389,043$ 25,389,043$ 100%Virginia Correctional Center for Women 11,992,074 505,041 12,497,115 12,497,115 100%Southampton Correctional Center 17,594,176 (2,312,080) 15,282,096 15,282,096 100%Bland Correctional Center 15,733,789 363,001 16,096,790 16,096,790 100%James River Correctional Center (1) 14,240,348 (2,318,723) 11,921,625 11,927,982 100%Powhatan Reception/Classification 9,317,903 325,270 9,643,173 9,643,173 100%St. Brides Correctional Center 9,769,539 313,574 10,083,113 10,083,113 100%Fluvanna Correctional Center 27,324,055 159,841 27,483,896 27,478,112 100%Mecklenburg Correctional Center 17,277,731 363,331 17,641,062 17,701,538 100%Marion Correctional Treatment Center 12,072,224 40,733 12,112,957 12,112,957 100%
SUBTOTAL - OTHER INSTITUTIONS 159,707,751$ (1,556,881)$ 158,150,870$ 158,211,919$ 100%
FIELD UNITS:
Western Region Field Units (2) 26,165,801$ (1,535,109)$ 24,630,692$ 24,937,118$ 101%Central Region Field Units 9,509,655 3,244,379 12,754,034 12,426,431 97%Eastern Region Field Units 11,722,499 508,002 12,230,501 12,170,025 100%
SUBTOTAL - FIELD UNITS 47,397,955$ 2,217,272$ 49,615,227$ 49,533,574$ 100%
(1) The percentage YTD is due primarily to delays in processing IATs for shared services with James River Work Center.(2) The percentage expended YTD is due primarily to the fact that the field units and its one work center are budgeted and expensed from the same programs within
the Commonwealth Accounting and Reporting System (CARS). Year-end expenditures are made in the order which bills are received for Western Region Field Units (Agency 757).
24

DEPARTMENT OF CORRECTIONSDIVISION OF OPERATIONS
OPERATING APPROPRIATIONS AND EXPENDITURES - BY OFFICE/FACILITY - ALL FUNDSFOR THE FISCAL YEAR ENDING JUNE 30, 2005
Appropriation Total PercentDIVISION OF Per Ch. 4 Total Adjusted Total Expended
OPERATIONS 2004 Assembly Adjustments Appropriation Expenditures Y-T-D
FACILITIES (Continued)
WORK CENTERS: Brunswick (1) -$ 2,547,146$ 2,547,146$ 2,680,433$ 105%Cold Springs (1) - 2,688,078 2,688,078 2,378,723 88%Greensville (1) - 4,634,622 4,634,622 2,726,640 59%James River - 3,630,139 3,630,139 3,623,782 100%Nottoway (1) - 2,511,786 2,511,786 1,636,886 65%Southampton - 4,877,527 4,877,527 4,877,527 100%
SUBTOTAL - OTHER INSTITUTIONS -$ 20,889,298$ 20,889,298$ 17,923,990$ 86%
COMMUNITY CORRECTIONS FACILITIES (2)White Post Detention Center -$ 2,417,060$ 2,417,060$ 2,361,163$ 98%White Post Diversion Center - 2,063,061 2,063,061 1,886,330 91%Appalachian Men's Detention Center - 2,203,890 2,203,890 2,091,471 95%Chatham Men's Diversion Center - 2,053,978 2,053,978 2,367,533 115%Harrisonburg Men's Diversion Center - 2,322,881 2,322,881 2,428,788 105%Southampton Men's Detention Center - 2,566,525 2,566,525 2,559,954 100%Richmond Women's Diversion Center - 1,061,051 1,061,051 789,076 74%Chesterfield Women's Diversion Center - 1,742,276 1,742,276 2,147,702 123%Stafford Diversion Center - 2,124,104 2,124,104 2,183,019 103%Funding for Detention/Diversion Centers - 239,980 239,980 - -
SUBTOTAL - COMM. CORR. FACILITIES -$ 18,794,806$ 18,794,806$ 18,815,035$ 100%
TOTAL - ALL FACILITIES 575,048,323$ 42,676,964$ 617,725,287$ 617,736,530$ 100%
TOTAL - DIVISION OF OPERATIONS 791,569,039$ 16,006,686$ 807,575,725$ 807,037,937$ 100%
(1) The percent expended YTD is due primarily to delays in processing IATs for shared services by the parent Correctional Agency or the CommonwealthAccounting and Reporting system (CARS) agency code.
(2) The variance in the percent expended YTD is to due (1) the fact that the Detention/Diversion Centers are budgeted and expensed from the same programswithin the Commonwealth Accounting and Reporting System (CARS) and bills are paid in the order in which they are received and (2) the budget for the administration of Detention/Diversion is in the same program as that for the administration of the Division of Community Corrections.
25
DEPARTMENT OF CORRECTIONSOPERATING APPROPRIATIONS AND EXPENDITURES
GENERAL FUNDS BY DIVISIONFOR THE FISCAL YEAR ENDING JUNE 30, 2005
Appropriation Total PercentPer Ch. 4 Total Adjusted Total Expended
DIVISION 2004 Assembly Adjustments Appropriation Expenditures Y-T-D
DIVISION OF ADMINISTRATION 37,311,535$ 11,809,639$ 49,121,174$ 49,121,174$ 100%
DIVISION OF OPERATIONS 744,087,269 2,635,887 746,723,156 746,718,994 100%
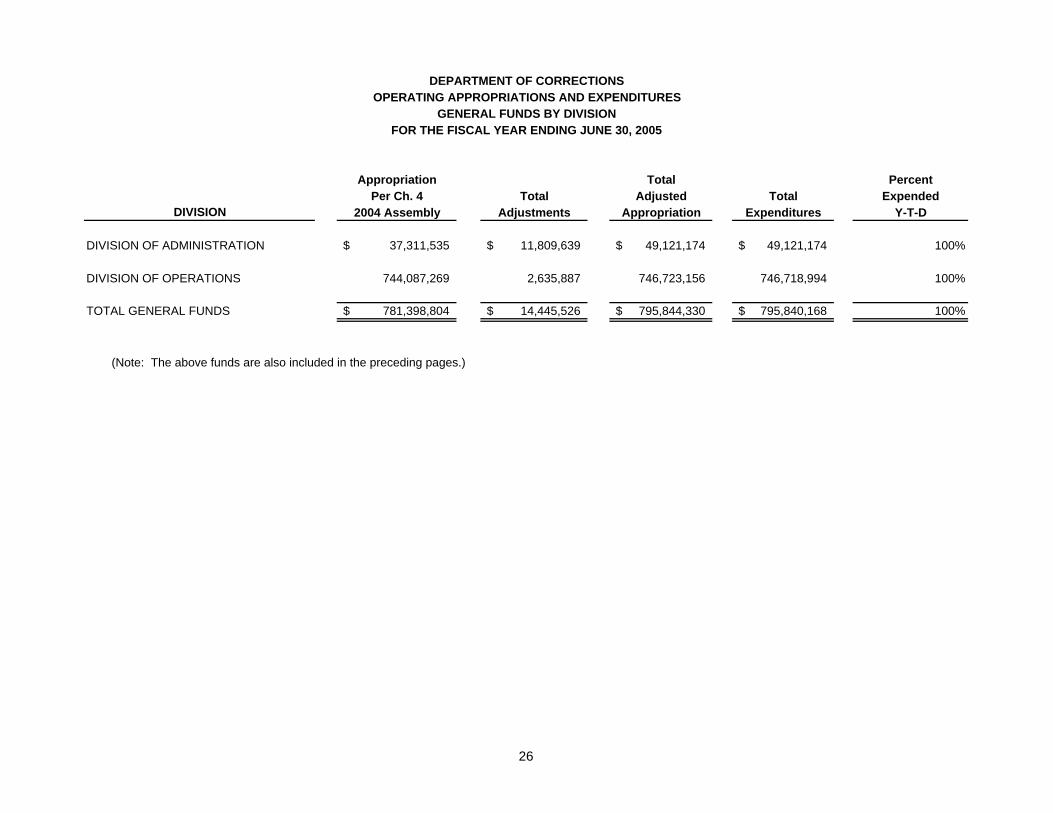
TOTAL GENERAL FUNDS 781,398,804$ 14,445,526$ 795,844,330$ 795,840,168$ 100%
(Note: The above funds are also included in the preceding pages.)
26
DEPARTMENT OF CORRECTIONSOPERATING APPROPRIATIONS AND EXPENDITURES
FEDERAL FUNDS BY DIVISIONFOR THE FISCAL YEAR ENDING JUNE 30, 2005
Appropriation Total PercentPer Ch. 4 Total Adjusted Total Expended
DIVISION 2004 Assembly Adjustments Appropriation (1) Expenditures Y-T-D
DIVISION OF ADMINISTRATION:
Central Administration -$ 421,350$ 421,350$ 201,995$ 48%TOTAL - ADMINISTRATION -$ 421,350$ 421,350$ 201,995$ 48%
DIVISION OF OPERATIONS -$ 1,822,739$ 1,822,739$ 1,621,080$ 89%
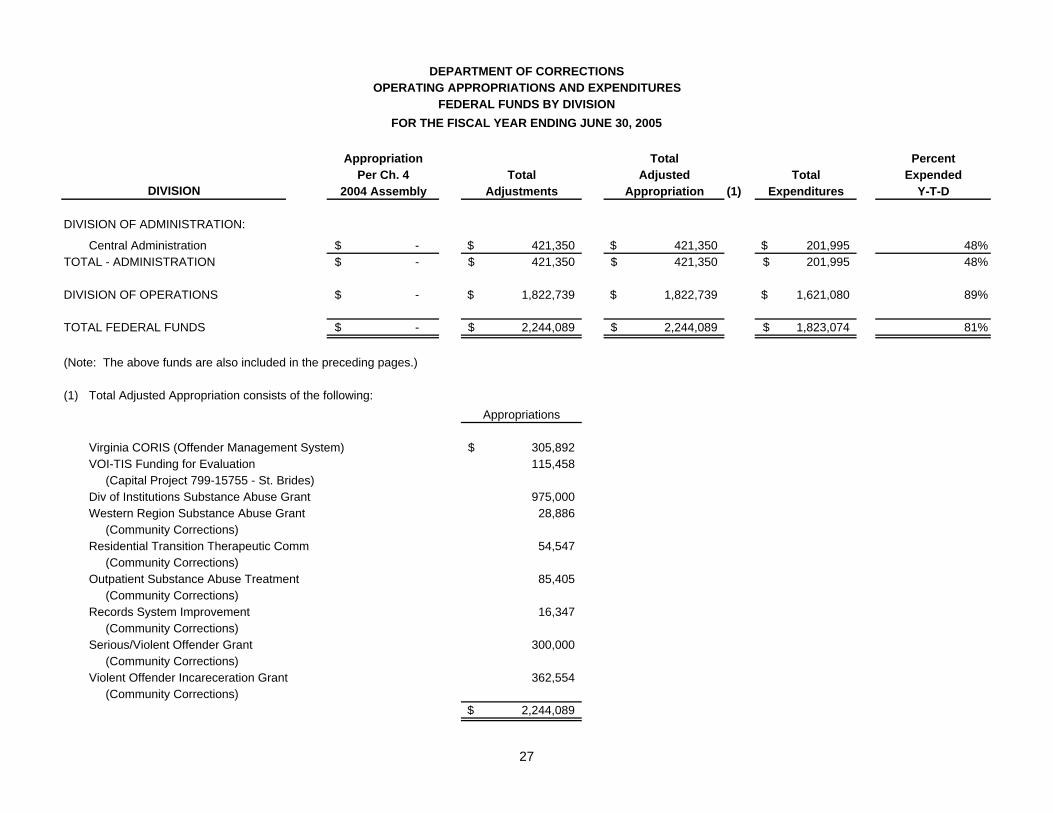
TOTAL FEDERAL FUNDS -$ 2,244,089$ 2,244,089$ 1,823,074$ 81%
(Note: The above funds are also included in the preceding pages.)
(1) Total Adjusted Appropriation consists of the following:Appropriations
Virginia CORIS (Offender Management System) 305,892$ VOI-TIS Funding for Evaluation 115,458 (Capital Project 799-15755 - St. Brides)Div of Institutions Substance Abuse Grant 975,000 Western Region Substance Abuse Grant 28,886 (Community Corrections)Residential Transition Therapeutic Comm 54,547 (Community Corrections)Outpatient Substance Abuse Treatment 85,405 (Community Corrections)Records System Improvement 16,347 (Community Corrections)Serious/Violent Offender Grant 300,000 (Community Corrections)Violent Offender Incareceration Grant 362,554 (Community Corrections)
2,244,089$
27

DEPARTMENT OF CORRECTIONSOPERATING APPROPRIATIONS AND EXPENDITURES
SPECIAL FUNDS BY DIVISIONFOR THE FISCAL YEAR ENDING JUNE 30, 2005
Appropriation Total PercentPer Ch. 4 Total Adjusted Total Expended
DIVISION 2004 Assembly Adjustments Appropriation Expenditures Y-T-D
DIVISION OF ADMINISTRATIONCentral Administration Other (1) 2,155,000$ 1,558,552$ 3,713,552$ 2,910,403$ 78%Central Administration Out-of-State Inmate Revenue (2) - 125,000 125,000 57,179 46%
DIVISION OF OPERATIONSVirginia Corr. Enterprises 36,035,991$ 11,059,288$ 47,095,279$ 47,084,855$ 100%Out-of-State Inmate Revenue 6,500,932 - 6,500,932 6,500,932 100%Other (3) 4,944,847 488,772 5,433,619 5,112,076 94%
TOTAL - OPERATIONS 47,481,770$ 11,548,060$ 59,029,830$ 58,697,863$ 99%
TOTAL SPECIAL FUNDS 49,636,770$ 13,231,612$ 62,868,382$ 61,665,445$ 98%
(Note: The above funds are also included in the preceding pages.)
(1) The adjusted appropriation includes $292,500 in unexpended appropriation for Telemedicine as well as $447,135 in unexpended appropriation for Warranty Overheadand the Capital Construction Unit. If adjusted for these amounts, the percent expended year-to-date would be 98%.
(2) This adjusted appropriation represents the state match for the Department's grant for Virginia CORIS. The balance of the unexpended revenue will be reappropriated in FY 2006.(3) The adjusted appropriation includes $190,427 in undistributed appropriation. If adjusted for the amount, the percentage expended year-to-date would be 97%.
28

Total Adjusted Appropriations Consist of the Following:
Warranty Overhead 507,751$ Capital Construction Unit 2,492,249 Telemedicine 600,000 Commissary Automation 55,000 Victim Notification 58,552 Virginia CORIS (State Match: Source - Out-of-State Inmate Revenue) 125,000 Subtotal Central Administration 3,838,552$
Virginia Correctional Enterprises 47,095,279$ Out-of-State Inmate Revenue 6,500,932 Diversion Center Expenditures Supported with Room & Board Revenue 2,000,000 Pre-sentence Investigations (HB664) 1,019,847 Compensation for Probation & Parole Officers (Arlington/Alexandria) 115,000 Insurance Recovery 689,257 Prison Visitation Project 150,000 Enhanced Faith-Based Services 300,000 Save Our Shelters Pen Pals Program 75,000 Recyclable Materials 20,000 Surplus Property 31,926 Corrections Special Reserve Fund 32,589 Replacement of GF with NGF 1,000,000 Subtotal Operations 59,029,830$
Division of Operations
Central Administration
DEPARTMENT OF CORRECTIONSDETAIL OF OPERATING APPROPRIATIONS
SPECIAL FUNDS BY DIVISIONFOR THE FISCAL YEAR ENDING JUNE 30, 2005
29

=============================================== OPERATING PER CAPITA STATEMENT OF FACILITIES
For the Fiscal Year Ended June 30, 2005 ===============================================
Page Summary ………………………………………………………………………… 31 Per Capita: Summary By Type of Facility …………………………………………. 36 By Major Institutions …………………………………………………… 38 By Field Units ……………………………………………………………. 48 By Work Centers ………………………………………………………… 49 By Community Corrections Facilities ………………………………. 51 Sources ………………………………………………………………………….. 54
30
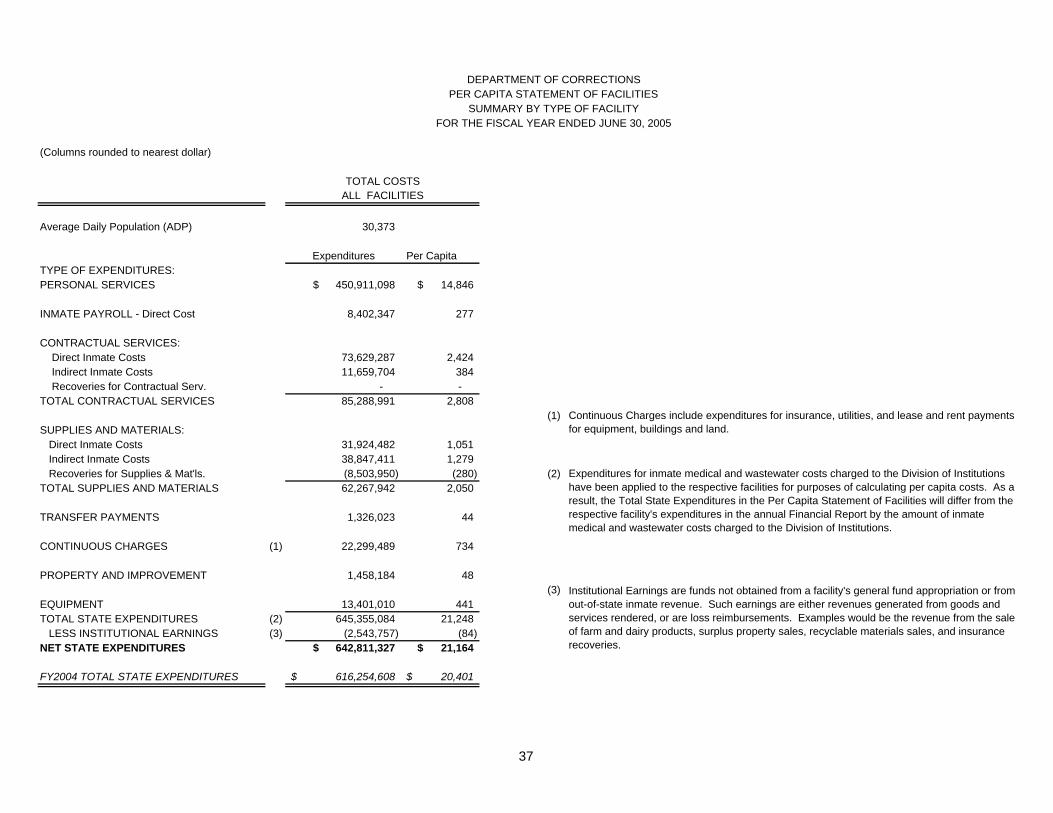
OPERATING PER CAPITA STATEMENT OF FACILITIES SUMMARY
For the Fiscal Year Ended June 30, 2005 During FY 2005, the Department of Corrections operated 30 Major Institutions (including the conversion of Pulaski, Botetourt, and Baskerville Correctional Centers from field units), 10 Correctional Field Units, 6 Work Centers, 5 Diversion Centers and 4 Detention Centers. It should be noted that while Baskerville, Pulaski, and Botetourt field units were given the designation of major institution in FY 2005, their staffing and mission did not change and therefore for purposes of this report they will continue to be reported with the field units. The average per capita costs for these facility groups were: Major Institutions $21,809, Field Units $19,332, Work Centers $13,705 and Community Corrections Facilities $22,241. The FY05 Department-wide per capita cost was $21,248, representing an increase of $847, or 4.2%, over the FY04 per capita cost of $20,401. The per capita rate is obtained by dividing the total expenditures by the Average Daily Population (ADP). During this fiscal period, the expenditures increased by 4.7% ($29.1 million) and the ADP increased slightly by 0.55%, (166 offenders). This resulted in a higher per capita rate in FY 2005 when compared to FY 2004. It should be noted that expenditures for inmate medical costs charged to the Office of Health Services and wastewater costs charged to the Division of Institutions (Environmental Services Unit) have been applied to the respective facilities for purposes of calculating per capita costs. As a result, the Total State Expenditures in the Per Capita Statement of Facilities will differ from the respective facility’s expenditures in the annual Financial Report.
31

Major Institutions
The average per capita cost of major institutions was $21,809 per inmate, an increase of $948, or 4.5%, over the FY 2004 per capita cost of $20,861. As stated previously, the per capita rate is obtained by dividing the total expenditures by the Average Daily Population (ADP). Expenditures increased from FY 2004 to FY 2005 by 4.3%. The major factor that contributed to the increase in expenditures is $17.7 million increase in personal services. This increase is largely the result of the annualization of FY 2004 and FY 2005 increases in salary and fringe benefit rates Haynesville had the lowest per capita cost of major institutions ($15,260). This facility was opened in 1993, thus its maintenance costs are lower than at older prisons. While Haynesville’s vacancy rate was 4.6%, careful roster management resulted in it being the fourth lowest per capita personal services expenditure rate following Dillwyn, Coffeewood, and Lunenburg. Marion Correctional Treatment Center continues to incur the highest per capita cost of the major institutions ($60,143). Virtually all of Marion’s inmates are mentally ill, resulting in high mental health costs. Marion has a low inmate-to-staff ratio, 0.9 inmates per staff member versus an average of 2.9 for all other major institutions. Powhatan Correctional Center had the second highest per capita cost of the major institutions ($30,846), primarily as a result of high medical costs. Excluding mental beds, Powhatan’s 46-bed infirmary, ties with the 46-bed Fluvanna infirmary as the second largest medical facility in DOC (after Deerfield). Powhatan is one of the five psychiatric facilities, which also include Marion, Fluvanna, Brunswick, and Greensville. St. Brides experienced the most significant increase in per capita cost between FY 04 and FY 05. The major contributing factor was its lower ADP than last fiscal year. In January, 2005 inmates assigned to the Youthful Offender Program were involved in a disturbance which caused significant structural damage to the facility. As a result of their actions, the inmates were immediately relocated to Greensville, and ultimately assigned to Indian Creek. The damaged space was not reopened. Additionally, a housing unit was closed to allow for Correctional Officer training for the transition to the new facility.
32
Three major institutions – Southampton, Bland and James River – have large agribusiness operations that accounted for 9.5%, 5.9% and 16.1% of their expenditures, respectively. Of all other facilities that operated an agribusiness program, the expenditures accounted for approximately 1% of the total costs. Although these three institutions have higher per capita costs because they host large agribusiness operations, these functions are vital to maintaining the Department’s overall food costs.
Field Units
The average per capita cost of the field units was $19,332 per inmate, an increase of $1,599, or 9%, above the FY 2004 per capita cost of $17,733. The ADP decreased by 3.0%, while the expenditures increased by 5.8%. This resulted in a higher per capita rate from the prior year. Personal Services and Contractual Services increased by 5.5% and 23% respectively. The 23% increase was primarily due to mechanical, electrical and vehicle repair and maintenance, A&E services, and expenses for VITA related goods and services which had previously been charged as equipment. The per capita cost for the Eastern region was $17,725, representing the lowest of the three regions. The Western regional field units’ per-capita costs were $19,576 while the Central region field units had the highest per capita rate of $20,648. Field unit inmates are lower security risks than those housed in major institutions. Field units have limited medical facilities and staff, thus inmates with major health problems will not be housed in a field unit. Field units also have higher inmate-to-staff ratios – 3.4-to-1 on average versus 2.9-to-1 for major institutions. For these reasons per capita costs for field units tend to be lower than for major institutions. Work Centers
The average per capita cost of the work centers was $13,705 per inmate, a decrease of $989, or 6.7%, over the FY 2004 per capita cost of $14,694. The ADP increased by 239 inmates or 21.7%, and the expenditures increased by 13.5%. A major factor in the increased ADP is the reopening of Nottoway Work Center in July 2004.
33
Per capita costs for individual work centers range from $10,249 at Greensville Work Center to $18,073 at Southampton Work Center for Men and Pre-Release and Work Center for Women. These variations can be misleading because some host facilities are more diligent about coding work-center-related expenditures to their respective work center’s cost code than are other host facilities. Work center inmates are the lowest security risks when compared to major institutions and field units because they must be able to perform agribusiness and maintenance work at various correctional facilities and in the general community. Inmates assigned to these facilities do not have major health problems. Work centers also share goods and services with their respective host institutions. As a result, per capita costs for work centers tend to be lower than for major institutions and field units. Community Corrections Facilities
There are two types of community corrections facilities – detention centers and diversion centers. Both facility types administer probation programs of 4-6 months duration for nonviolent offenders. Probationers assigned to detention centers undergo military-style discipline and training, and work without pay in the community in supervised groups. Probationers assigned to diversion centers work in paying jobs in the community on an individual basis, and are not supervised by corrections personnel while working. Probationers assigned to diversion centers pay DOC for room and board and travel, and may also make payments (when applicable) to other parties for alimony, child support, victim restitution, back taxes, etc. The average per capita cost of community facilities was $22,241 per probationer, a decrease of $431, or 1.9%, over the FY 2004 per capita cost of $22,672. Total expenditures increased by 6.3%. The ADP in FY 2005 increased by 8.4% (68 probationers) over the FY 2004 ADP. Per capita costs range from $19,362 at the White Post Diversion and Detention Center to $24,952 at the Chatham Men’s Diversion Center. Since staff costs make up the majority of the expenses at the community corrections facilities, staff-to-probate ratios rationalize the variance between the highest to the lowest per capita costs.
34

Like their field unit and work center counterparts, probationers housed in community facilities present lower security risks and have lower medical costs than inmates housed in major institutions. However, the small size of these facilities prevents them from realizing economies of scale. Every facility, regardless of size, incurs fixed costs (administrative/food/medical staff, utilities, repairs, maintenance, etc.) that do not vary directly with offender population, causing smaller facilities to experience higher per capita costs than larger ones.
35

(Columns rounded to nearest dollar)
MAJOR INSTITUTIONS FACILITIES
Average Daily Population (ADP) 25,495 2,662 1,338 878
Expenditures Per Capita Expenditures Per Capita Expenditures Per Capita Expenditures Per CapitaTYPE OF EXPENDITURES:PERSONAL SERVICES 381,688,474$ 14,971$ 40,173,001$ 15,091$ 13,513,259$ 10,100$ 15,536,364$ 17,695$
INMATE PAYROLL - Direct Cost 6,456,099 253 1,130,290 425 815,958 610 - -
CONTRACTUAL SERVICES: Direct Inmate Costs 70,715,929 2,774 1,194,479 449 1,190,705 890 528,175 602 Indirect Inmate Costs 10,076,976 395 1,055,320 396 229,531 172 297,877 339 Recoveries for Contractual Serv. - - - - - - - - TOTAL CONTRACTUAL SERVICES 80,792,904 3,169 2,249,798 845 1,420,237 1,061 826,052 941
SUPPLIES AND MATERIALS: Direct Inmate Costs 27,039,414 1,061 2,813,560 1,057 1,127,004 842 944,504 1,076 Indirect Inmate Costs 33,898,153 1,330 3,225,992 1,212 546,831 409 1,176,435 1,340 Recoveries for Supplies & Mat'ls. (7,504,328) (294) (999,622) (376) - - - - TOTAL SUPPLIES AND MATERIALS 53,433,239 2,096 5,039,929 1,893 1,673,835 1,251 2,120,939 2,416
TRANSFER PAYMENTS 1,256,733 49 29,772 11 23,340 17 16,178 18
CONTINUOUS CHARGES (1) 19,850,670 779 1,475,792 554 487,668 364 485,360 553
PROPERTY AND IMPROVEMENT 1,393,586 55 63,640 24 - - 959 1
EQUIPMENT 11,156,145 438 1,300,380 488 402,568 301 541,916 617 TOTAL STATE EXPENDITURES (2) 556,027,849 21,809 51,462,603 19,332 18,336,865 13,705 19,527,766 22,241 LESS INSTITUTIONAL EARNINGS (3) (2,638,387) (103) 94,630 36 - - - - NET STATE EXPENDITURES 553,389,462$ 21,706$ 51,557,233$ 19,368$ 18,336,865$ 13,705$ 19,527,766$ 22,241$
FY2004 TOTAL STATE EXPENDITURES 533,082,195$ 20,861$ 48,658,813$ 17,733$ 16,149,102$ 14,694$ 18,364,498$ 22,672$
WORK CENTERSCOMMUNITY CORRECTIONS
DEPARTMENT OF CORRECTIONSPER CAPITA STATEMENT OF FACILITIES
SUMMARY BY TYPE OF FACILITYFOR THE FISCAL YEAR ENDED JUNE 30, 2005
FIELD UNITS
36
DEPARTMENT OF CORRECTIONSPER CAPITA STATEMENT OF FACILITIES
SUMMARY BY TYPE OF FACILITYFOR THE FISCAL YEAR ENDED JUNE 30, 2005
(Columns rounded to nearest dollar)
TOTAL COSTSALL FACILITIES
Average Daily Population (ADP) 30,373
Expenditures Per CapitaTYPE OF EXPENDITURES:PERSONAL SERVICES 450,911,098$ 14,846$
INMATE PAYROLL - Direct Cost 8,402,347 277
CONTRACTUAL SERVICES: Direct Inmate Costs 73,629,287 2,424 Indirect Inmate Costs 11,659,704 384 Recoveries for Contractual Serv. - - TOTAL CONTRACTUAL SERVICES 85,288,991 2,808
(1)SUPPLIES AND MATERIALS: Direct Inmate Costs 31,924,482 1,051 Indirect Inmate Costs 38,847,411 1,279 Recoveries for Supplies & Mat'ls. (8,503,950) (280) (2)TOTAL SUPPLIES AND MATERIALS 62,267,942 2,050
TRANSFER PAYMENTS 1,326,023 44
CONTINUOUS CHARGES (1) 22,299,489 734
PROPERTY AND IMPROVEMENT 1,458,184 48 (3)
EQUIPMENT 13,401,010 441 TOTAL STATE EXPENDITURES (2) 645,355,084 21,248 LESS INSTITUTIONAL EARNINGS (3) (2,543,757) (84) NET STATE EXPENDITURES 642,811,327$ 21,164$
FY2004 TOTAL STATE EXPENDITURES 616,254,608$ 20,401$
Continuous Charges include expenditures for insurance, utilities, and lease and rent payments for equipment, buildings and land.
Expenditures for inmate medical and wastewater costs charged to the Division of Institutions have been applied to the respective facilities for purposes of calculating per capita costs. As a result, the Total State Expenditures in the Per Capita Statement of Facilities will differ from the respective facility's expenditures in the annual Financial Report by the amount of inmate medical and wastewater costs charged to the Division of Institutions.
Institutional Earnings are funds not obtained from a facility's general fund appropriation or from out-of-state inmate revenue. Such earnings are either revenues generated from goods and services rendered, or are loss reimbursements. Examples would be the revenue from the sale of farm and dairy products, surplus property sales, recyclable materials sales, and insurance recoveries.
37

DEPARTMENT OF CORRECTIONSPER CAPITA STATEMENT OF FACILITIES
MAJOR INSTITUTIONSFOR THE FISCAL YEAR ENDED JUNE 30, 2005
(Columns rounded to the nearest dollar)(709) (716) (717)
POWHATAN VIRGINIA CORRECTIONAL SOUTHAMPTONCORRECTIONAL CENTER CENTER FOR WOMEN CORRECTIONAL CENTER
Average Daily Population (ADP) 849 533 649
Expenditures Per Capita Expenditures Per Capita Expenditures Per CapitaTYPE OF EXPENDITURES:PERSONAL SERVICES 15,978,259$ 18,820$ 9,625,502$ 18,059$ 11,535,297$ 17,774$
INMATE PAYROLL - Direct Cost 180,199 212 142,389 267 232,690 359 `
CONTRACTUAL SERVICES: Direct Inmate Costs 6,408,620 7,548 900,538 1,690 728,456 1,122 Indirect Inmate Costs 289,100 341 394,988 741 507,354 782 Recoveries for Contractual Serv. - - - - - - TOTAL CONTRACTUAL SERVICES 6,697,720 7,889 1,295,525 2,431 1,235,810 1,904
SUPPLIES AND MATERIALS: Direct Inmate Costs 796,152 938 778,416 1,460 864,365 1,332 Indirect Inmate Costs 3,087,316 3,636 786,543 1,476 1,793,588 2,764 Recoveries for Supplies & Mat'ls. (1,303,155) (1,535) - - - - TOTAL SUPPLIES AND MATERIALS 2,580,313 3,039 1,564,959 2,936 2,657,953 4,095
TRANSFER PAYMENTS 18,844 22 38,237 72 36,500 56
CONTINUOUS CHARGES 450,043 530 332,396 624 308,385 475
PROPERTY AND IMPROVEMENT - - - - 27 - .
EQUIPMENT 283,268 334 357,248 670 427,748 659 TOTAL STATE EXPENDITURES 26,188,645 30,846 13,356,256 25,059 16,434,411 25,323 LESS INSTITUTIONAL EARNINGS (21,359) (25) (110,439) (207) (784,066) (1,208) NET STATE EXPENDITURES 26,167,285$ 30,821$ 13,245,816$ 24,851$ 15,650,345$ 24,115$
FY2004 TOTAL STATE EXPENDITURES 25,235,716$ 29,412$ 12,863,862$ 25,883$ 15,785,920$ 24,286$
38

DEPARTMENT OF CORRECTIONSPER CAPITA STATEMENT OF FACILITIES
MAJOR INSTITUTIONSFOR THE FISCAL YEAR ENDED JUNE 30, 2005
(Columns rounded to nearest dollar)(718) (719)
BLAND JAMES RIVERCORRECTIONAL CENTER CORRECTIONAL CENTER
Average Daily Population (ADP) 630 464 455
Expenditures Per Capita Expenditures Per Capita Expenditures Per CapitaTYPE OF EXPENDITURES:PERSONAL SERVICES 13,927,392$ 22,107$ 9,818,941$ 21,162$ 4,972,362$ 10,928$
INMATE PAYROLL - Direct Cost 209,917 333 166,503 359 44,862 99
CONTRACTUAL SERVICES: Direct Inmate Costs 643,154 1,021 491,037 1,058 3,086,609 6,784 Indirect Inmate Costs 268,337 426 349,853 754 179,597 395 Recoveries for Contractual Serv. - - - - - - TOTAL CONTRACTUAL SERVICES 911,491 1,447 840,890 1,812 3,266,206 7,178
SUPPLIES AND MATERIALS: Direct Inmate Costs 866,054 1,375 635,219 1,369 547,729 1,204 Indirect Inmate Costs 2,315,198 3,675 4,732,236 10,199 531,809 1,169 Recoveries for Supplies & Mat'ls. (1,662,965) (2,640) (3,795,837) (8,181) - - TOTAL SUPPLIES AND MATERIALS 1,518,287 2,410 1,571,618 3,387 1,079,538 2,373
TRANSFER PAYMENTS 354 - 11,029 24 7,732 17
CONTINUOUS CHARGES 362,364 575 431,619 930 151,192 332
PROPERTY AND IMPROVEMENT - - 111,042 - - -
EQUIPMENT 345,170 548 315,549 680 217,256 477 TOTAL STATE EXPENDITURES 17,274,975 27,421 13,267,191 28,593 9,739,150 21,405 LESS INSTITUTIONAL EARNINGS (398,039) (632) (1,018,093) (2,194) (56) (0) NET STATE EXPENDITURES 16,876,936$ 26,789$ 12,249,098$ 26,399$ 9,739,094$ 21,405$
FY2004 TOTAL STATE EXPENDITURES 16,685,550$ 26,153$ 12,423,022$ 26,832$ 9,067,650$ 19,929$
(721)POWHATAN RECEPTION &CLASSIFICATION CENTER
39

DEPARTMENT OF CORRECTIONSPER CAPITA STATEMENT OF FACILITIES
MAJOR INSTITUTIONSFOR THE FISCAL YEAR ENDED JUNE 30, 2005
(Columns rounded to nearest dollar)(730) (733)
BRUNSWICK SUSSEX 1CORRECTIONAL CENTER STATE PRISON
Average Daily Population (ADP) 719 1,146 1,252
Expenditures Per Capita Expenditures Per Capita Expenditures Per CapitaTYPE OF EXPENDITURES:PERSONAL SERVICES 15,306,450$ 21,289$ 16,210,251$ 14,145$ 16,102,914$ 12,862$
INMATE PAYROLL - Direct Cost 259,659 361 219,192 191 221,034 177
CONTRACTUAL SERVICES: Direct Inmate Costs 923,468 1,284 4,796,321 4,185 4,965,243 3,966 Indirect Inmate Costs 339,272 472 474,558 414 398,369 318 Recoveries for Contractual Serv. - - - - - - TOTAL CONTRACTUAL SERVICES 1,262,740 1,756 5,270,879 4,599 5,363,612 4,284
SUPPLIES AND MATERIALS: Direct Inmate Costs 1,277,612 1,777 478,520 418 375,743 300 Indirect Inmate Costs 1,025,702 1,427 1,147,728 1,002 963,204 769 Recoveries for Supplies & Mat'ls. - - - - - - TOTAL SUPPLIES AND MATERIALS 2,303,314 3,203 1,626,248 1,419 1,338,947 1,069
TRANSFER PAYMENTS 66,186 92 146,136 128 175,343 140
CONTINUOUS CHARGES 594,879 827 3,118,698 2,721 838,718 670
PROPERTY AND IMPROVEMENT 19,169 27 - - 1,994 2
EQUIPMENT 445,660 620 342,510 299 255,416 204 TOTAL STATE EXPENDITURES 20,258,057 28,175 26,933,914 23,503 24,297,979 19,407 LESS INSTITUTIONAL EARNINGS (10,045) (14) (14,607) (13) (14,929) (12) NET STATE EXPENDITURES 20,248,011$ 28,161$ 26,919,307$ 23,490$ 24,283,050$ 19,395$
FY2004 TOTAL STATE EXPENDITURES 19,874,865$ 26,642$ 25,943,731$ 21,747$ 23,502,208$ 18,332$
STATE PRISON SUSSEX II
(734)
40

DEPARTMENT OF CORRECTIONSPER CAPITA STATEMENT OF FACILITIES
MAJOR INSTITUTIONSFOR THE FISCAL YEAR ENDED JUNE 30, 2005
(Columns rounded to nearest dollar)
ST. BRIDESCORRECTIONAL CENTER
Average Daily Population (ADP) 1,200 477 784
Expenditures Per Capita Expenditures Per Capita Expenditures Per CapitaTYPE OF EXPENDITURES:PERSONAL SERVICES 17,624,829$ 14,687$ 8,406,985$ 17,625$ 17,583,223$ 22,428$
INMATE PAYROLL - Direct Cost 249,484 208 117,695 247 120,478 154
CONTRACTUAL SERVICES: Direct Inmate Costs 684,158 570 276,959 581 809,609 1,033 Indirect Inmate Costs 239,250 199 231,358 485 180,480 230 Recoveries for Contractual Serv. - - - - - - TOTAL CONTRACTUAL SERVICES 923,408 770 508,316 1,066 990,090 1,263
SUPPLIES AND MATERIALS: Direct Inmate Costs 1,591,673 1,326 645,050 3,337 1,195,209 1,525 Indirect Inmate Costs 796,992 664 692,298 1,671 681,826 870 Recoveries for Supplies & Mat'ls. - - - - - - TOTAL SUPPLIES AND MATERIALS 2,388,665 1,991 1,337,348 5,008 1,877,034 2,394
TRANSFER PAYMENTS 63,008 53 65 0 108,640 139
CONTINUOUS CHARGES 1,161,217 968 301,484 632 988,679 1,261
PROPERTY AND IMPROVEMENT 8,500 7 17,819 37 12,277 16
EQUIPMENT 485,919 405 66,792 140 276,328 352 TOTAL STATE EXPENDITURES 22,905,029 19,088 10,756,503 22,550 21,956,749 28,006 LESS INSTITUTIONAL EARNINGS (601) (1) (3,043) (6) (6,318) (8) NET STATE EXPENDITURES 22,904,428$ 19,087$ 10,753,460$ 22,544$ 21,950,431$ 27,998$
FY2004 TOTAL STATE EXPENDITURES 21,388,225$ 18,745$ 10,755,076$ 19,171$ 21,639,217$ 29,085$
WALLENS RIDGESTATE PRISON
(735)
STATE PRISON RED ONION
(741)(737)
41

DEPARTMENT OF CORRECTIONSPER CAPITA STATEMENT OF FACILITIES
MAJOR INSTITUTIONSFOR THE FISCAL YEAR ENDED JUNE 30, 2005
(Columns rounded to nearest dollar)(743) (744) (745)
FLUVANNA CORRECTIONAL MECKLENBURG NOTTOWAYCENTER FOR WOMEN CORRECTIONAL CENTER CORRECTIONAL CENTER
Average Daily Population (ADP) 1,162 726 1,199
Expenditures Per Capita Expenditures Per Capita Expenditures Per CapitaTYPE OF EXPENDITURES:PERSONAL SERVICES 15,639,920$ 13,459$ 14,374,598$ 19,800$ 19,567,048$ 16,319$
INMATE PAYROLL - Direct Cost 238,767 205 129,320 178 257,136 214
CONTRACTUAL SERVICES: Direct Inmate Costs 8,903,233 7,662 806,380 1,111 1,147,490 957 Indirect Inmate Costs 609,564 525 165,529 228 790,247 659 Recoveries for Contractual Serv. - - - - - - TOTAL CONTRACTUAL SERVICES 9,512,798 8,187 971,909 1,339 1,937,737 1,616
SUPPLIES AND MATERIALS: Direct Inmate Costs 1,014,266 873 935,676 1,289 1,370,332 1,143 Indirect Inmate Costs 870,094 749 625,729 862 1,343,272 1,120 Recoveries for Supplies & Mat'ls. - - - - - -
TOTAL SUPPLIES AND MATERIALS 1,884,360 1,622 1,561,404 2,151 2,713,604 2,263
TRANSFER PAYMENTS 59,627 51 5,341 7 14,327 12
CONTINUOUS CHARGES 601,973 518 1,075,117 1,481 658,446 549
PROPERTY AND IMPROVEMENT - - 2,195 3 30,243 25
EQUIPMENT 431,803 372 237,366 327 869,412 725 TOTAL STATE EXPENDITURES 28,369,248 24,414 18,357,251 25,285 26,047,952 21,725 LESS INSTITUTIONAL EARNINGS - - - NET STATE EXPENDITURES 28,369,248$ 24,414$ 18,357,251$ 25,285$ 26,047,952$ 21,725$
FY2004 TOTAL STATE EXPENDITURES 27,691,006$ 23,851$ 17,507,047$ 24,048$ 23,807,525$ 19,856$
42

DEPARTMENT OF CORRECTIONSPER CAPITA STATEMENT OF FACILITIES
MAJOR INSTITUTIONSFOR THE FISCAL YEAR ENDED JUNE 30, 2005
(Columns rounded to nearest dollar)(747) (749) (752)
MARION CORRECTIONAL BUCKINGHAM DEEP MEADOWTREATMENT CENTER CORRECTIONAL CENTER CORRECTIONAL CENTER
Average Daily Population (ADP) 220 985 990
Expenditures Per Capita Expenditures Per Capita Expenditures Per CapitaTYPE OF EXPENDITURES:PERSONAL SERVICES 10,996,191$ 49,983$ 15,794,807$ 16,035$ 14,382,204$ 14,527$
INMATE PAYROLL - Direct Cost 59,047 268 238,132 242 162,363 164
CONTRACTUAL SERVICES: Direct Inmate Costs 466,075 2,119 657,863 668 1,218,665 1,231 Indirect Inmate Costs 145,473 661 400,370 406 349,545 353 Recoveries for Contractual Serv. - - - - - - TOTAL CONTRACTUAL SERVICES 611,548 2,780 1,058,232 1,074 1,568,210 1,584
SUPPLIES AND MATERIALS: Direct Inmate Costs 894,563 4,066 1,224,847 1,243 1,502,873 1,518 Indirect Inmate Costs 378,342 1,720 997,632 1,013 1,679,090 1,696 Recoveries for Supplies & Mat'ls. - - - - (734,100) (742) TOTAL SUPPLIES AND MATERIALS 1,272,905 5,786 2,222,479 2,256 2,447,863 2,473
TRANSFER PAYMENTS 1,706 8 40,892 42 18,873 19
CONTINUOUS CHARGES 139,379 634 763,955 776 295,231 298
PROPERTY AND IMPROVEMENT - - 197,853 201 133,115 134
EQUIPMENT 150,743 685 787,853 800 616,188 622 TOTAL STATE EXPENDITURES 13,231,519 60,143 21,104,204 21,426 19,624,045 19,822 LESS INSTITUTIONAL EARNINGS (550) (2) (85,117) (86) (8,815) (9) NET STATE EXPENDITURES 13,230,969$ 60,141$ 21,019,087$ 21,339$ 19,615,229$ 19,813$
FY2004 TOTAL STATE EXPENDITURES 12,644,795$ 57,739$ 19,901,339$ 20,204$ 18,489,439$ 18,983$
43

DEPARTMENT OF CORRECTIONSPER CAPITA STATEMENT OF FACILITIES
MAJOR INSTITUTIONSFOR THE FISCAL YEAR ENDED JUNE 30, 2005
(Columns rounded to nearest dollar)(753) (754) (768)
DEERFIELD AUGUSTA KEEN MOUNTAINCORRECTIONAL CENTER CORRECTIONAL CENTER CORRECTIONAL CENTER
Average Daily Population (ADP) 474 1,118 894
Expenditures Per Capita Expenditures Per Capita Expenditures Per CapitaTYPE OF EXPENDITURES:PERSONAL SERVICES 9,010,320$ 19,009$ 18,021,782$ 16,120$ 12,519,126$ 14,003$
INMATE PAYROLL - Direct Cost 194,275 410 278,789 249 275,350 308
CONTRACTUAL SERVICES: Direct Inmate Costs 2,066,673 4,360 935,075 836 569,531 637 Indirect Inmate Costs 129,956 274 326,221 292 117,103 131 Recoveries for Contractual Serv. - - - - - - TOTAL CONTRACTUAL SERVICES 2,196,628 4,634 1,261,297 1,128 686,634 768
SUPPLIES AND MATERIALS: Direct Inmate Costs 912,983 1,926 1,491,189 1,334 1,037,483 1,160 Indirect Inmate Costs 441,337 931 1,237,945 1,107 1,064,035 1,190 Recoveries for Supplies & Mat'ls. - - (8,270) (7) - - TOTAL SUPPLIES AND MATERIALS 1,354,321 2,857 2,720,864 2,434 2,101,517 2,351
TRANSFER PAYMENTS 19,691 42 14,940 13 5,201 6
CONTINUOUS CHARGES 158,196 334 881,082 788 921,056 1,030
PROPERTY AND IMPROVEMENT 1,000 2 129,412 116 - -
EQUIPMENT 359,994 759 859,550 769 320,887 359 TOTAL STATE EXPENDITURES 13,294,423 28,047 24,167,715 21,617 16,829,772 18,825 LESS INSTITUTIONAL EARNINGS (4,288) (9) (70,240) (63) (13,068) (15) NET STATE EXPENDITURES 13,290,135$ 28,038$ 24,097,476$ 21,554$ 16,816,704$ 18,811$
FY2004 TOTAL STATE EXPENDITURES 12,138,270$ 25,881$ 24,075,904$ 21,516$ 16,160,759$ 17,996$
44

DEPARTMENT OF CORRECTIONSPER CAPITA STATEMENT OF FACILITIES
MAJOR INSTITUTIONSFOR THE FISCAL YEAR ENDED JUNE 30, 2005
(Columns rounded to nearest dollar)(769) (770) (771)
GREENSVILLE DILLWYN INDIAN CREEKCORRECTIONAL CENTER CORRECTIONAL CENTER CORRECTIONAL CENTER
Average Daily Population (ADP) 3,006 1,088 950
Expenditures Per Capita Expenditures Per Capita Expenditures Per CapitaTYPE OF EXPENDITURES:PERSONAL SERVICES 35,225,614$ 11,718$ 11,675,670$ 10,731$ 10,539,151$ 11,094$
INMATE PAYROLL - Direct Cost 860,018 286 315,092 290 267,636 282
CONTRACTUAL SERVICES: Direct Inmate Costs 17,294,699 5,753 1,373,702 1,263 2,593,096 2,730 Indirect Inmate Costs 620,986 207 273,308 251 1,567,473 1,650 Recoveries for Contractual Serv. - - - - - - TOTAL CONTRACTUAL SERVICES 17,915,685 5,960 1,647,009 1,514 4,160,570 4,380
SUPPLIES AND MATERIALS: Direct Inmate Costs 1,061,581 353 1,317,853 1,211 1,059,637 1,115 Indirect Inmate Costs 2,686,252 894 772,242 710 875,624 922 Recoveries for Supplies & Mat'ls. - - - - - - TOTAL SUPPLIES AND MATERIALS 3,747,833 1,247 2,090,095 1,921 1,935,261 2,037
TRANSFER PAYMENTS 264,240 88 28,557 26 10,059 11
CONTINUOUS CHARGES 2,170,804 722 561,670 516 510,497 537
PROPERTY AND IMPROVEMENT 69,971 23 493,160 453 2,405 3
EQUIPMENT 1,427,959 475 237,297 218 230,262 242 TOTAL STATE EXPENDITURES 61,682,124 20,520 17,048,550 15,670 17,655,840 18,585 LESS INSTITUTIONAL EARNINGS (13,593) (5) (3,721) (3) (10,615) (11) NET STATE EXPENDITURES 61,668,531$ 20,515$ 17,044,829$ 15,666$ 17,645,226$ 18,574$
FY2004 TOTAL STATE EXPENDITURES 58,441,600$ 19,262$ 16,682,392$ 15,319$ 16,535,155$ 17,314$
45

DEPARTMENT OF CORRECTIONSPER CAPITA STATEMENT OF FACILITIES
MAJOR INSTITUTIONSFOR THE FISCAL YEAR ENDED JUNE 30, 2005
(Columns rounded to nearest dollar)(773) (774)
COFFEEWOOD LUNENBURG CORRECTIONAL CENTER CORRECTIONAL CENTER CORRECTIONAL CENTER
Average Daily Population (ADP) 1,144 1,195 1,186
Expenditures Per Capita Expenditures Per Capita Expenditures Per CapitaTYPE OF EXPENDITURES:PERSONAL SERVICES 12,604,460$ 11,018$ 12,238,078$ 10,241$ 12,007,101$ 10,124$
INMATE PAYROLL - Direct Cost 352,311 308 324,756 272 339,004 286
CONTRACTUAL SERVICES: Direct Inmate Costs 1,232,867 1,078 3,466,158 2,901 3,270,249 2,757 Indirect Inmate Costs 258,814 226 263,455 220 206,417 174 Recoveries for Contractual Serv. - - - - - - TOTAL CONTRACTUAL SERVICES 1,491,681 1,304 3,729,613 3,121 3,476,666 2,931
SUPPLIES AND MATERIALS: Direct Inmate Costs 1,316,895 1,151 844,298 707 1,003,198 846 Indirect Inmate Costs 940,244 822 744,871 623 687,003 579 Recoveries for Supplies & Mat'ls. - - - - - - TOTAL SUPPLIES AND MATERIALS 2,257,139 1,973 1,589,168 1,330 1,690,201 1,425
TRANSFER PAYMENTS 32,809 29 24,931 21 43,466 37
CONTINUOUS CHARGES 448,484 392 506,481 424 1,118,624 943
PROPERTY AND IMPROVEMENT 4,613 4 132,017 110 26,774 23
EQUIPMENT 266,139 233 326,555 273 215,274 182 TOTAL STATE EXPENDITURES 17,457,636 15,260 18,871,600 15,792 18,917,110 15,950 LESS INSTITUTIONAL EARNINGS (25,535) (22) (13,135) (11) (8,114) (7) NET STATE EXPENDITURES 17,432,100$ 15,238$ 18,858,465$ 15,781$ 18,908,996$ 15,944$
FY2004 TOTAL STATE EXPENDITURES 16,805,630$ 15,086$ 18,599,870$ 15,565$ 18,436,421$ 15,519$
(772)HAYNESVILLE
46
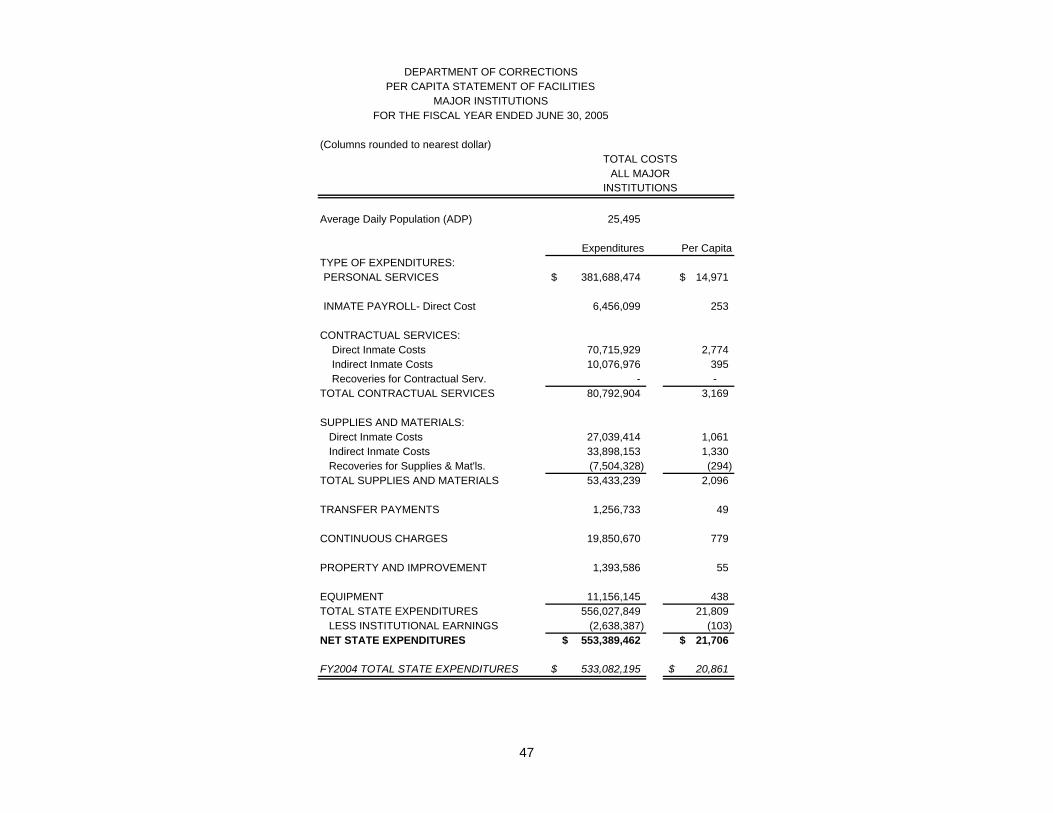
DEPARTMENT OF CORRECTIONSPER CAPITA STATEMENT OF FACILITIES
MAJOR INSTITUTIONSFOR THE FISCAL YEAR ENDED JUNE 30, 2005
(Columns rounded to nearest dollar)
Average Daily Population (ADP) 25,495
Expenditures Per CapitaTYPE OF EXPENDITURES:PERSONAL SERVICES 381,688,474$ 14,971$
INMATE PAYROLL- Direct Cost 6,456,099 253
CONTRACTUAL SERVICES: Direct Inmate Costs 70,715,929 2,774 Indirect Inmate Costs 10,076,976 395 Recoveries for Contractual Serv. - - TOTAL CONTRACTUAL SERVICES 80,792,904 3,169
SUPPLIES AND MATERIALS: Direct Inmate Costs 27,039,414 1,061 Indirect Inmate Costs 33,898,153 1,330 Recoveries for Supplies & Mat'ls. (7,504,328) (294) TOTAL SUPPLIES AND MATERIALS 53,433,239 2,096
TRANSFER PAYMENTS 1,256,733 49
CONTINUOUS CHARGES 19,850,670 779
PROPERTY AND IMPROVEMENT 1,393,586 55
EQUIPMENT 11,156,145 438 TOTAL STATE EXPENDITURES 556,027,849 21,809 LESS INSTITUTIONAL EARNINGS (2,638,387) (103) NET STATE EXPENDITURES 553,389,462$ 21,706$
FY2004 TOTAL STATE EXPENDITURES 533,082,195$ 20,861$
TOTAL COSTSALL MAJOR
INSTITUTIONS
47

DEPARTMENT OF CORRECTIONSPER CAPITA STATEMENT OF FACILITIES
FIELD UNIT SUMMARY BY REGIONFOR THE FISCAL YEAR ENDED JUNE 30, 2005
(Columns rounded to nearest dollar)(757) (760) (761)
WESTERN REGION CENTRAL REGION EASTERN REGION TOTAL COSTS CORRECTIONAL FIELD UNITS CORRECTIONAL FIELD UNITS CORRECTIONAL FIELD UNITS FIELD UNITS
Average Daily Population (ADP) 1,323 626 713 2,662
Expenditures Per Capita Expenditures Per Capita Expenditures Per Capita Expenditures Per CapitaTYPE OF EXPENDITURES:PERSONAL SERVICES $ 20,530,231 15,518$ 9,445,923$ 15,089$ $ 10,196,848 14,301$ 40,173,001$ 15,091$
INMATE PAYROLL - Direct Cost 579,410 438 288,072 460 262,809 369 1,130,290 425
CONTRACTUAL SERVICES: Direct Inmate Costs 639,379 483 212,290 339 342,809 481 1,194,479 449 Indirect Inmate Costs 431,937 326 505,576 808 117,807 165 1,055,320 396 Recoveries for Contractual Serv. - - - - - - - - TOTAL CONTRACTUAL SERVICES 1,071,317 810 717,866 1,147 460,616 646 2,249,798 845
SUPPLIES AND MATERIALS: Direct Inmate Costs 1,448,653 1,095 656,715 1,049 708,191 993 2,813,560 1,057 Indirect Inmate Costs 1,365,976 1,032 1,305,880 2,086 554,136 777 3,225,992 1,212 Recoveries for Supplies & Mat'ls. (607,403) (459) (139,971) (224) (252,249) (354) (999,622) (376) TOTAL SUPPLIES AND MATERIALS 2,207,227 1,668 1,822,624 2,912 1,010,078 1,417 5,039,929 1,893
TRANSFER PAYMENTS 17,471 13 9,121 15 3,180 - 29,772 11
CONTINUOUS CHARGES 816,586 617 230,791 369 428,415 601 1,475,792 554
PROPERTY AND IMPROVEMENT 2,305 2 56,883 91 4,452 6 63,640 24
EQUIPMENT 674,893 510 354,132 566 271,355 381 1,300,380 488 TOTAL STATE EXPENDITURES 25,899,440 19,576 12,925,411 20,648 12,637,753 17,725 51,462,603 19,332 LESS INSTITUTIONAL EARNINGS 51,728 39 871 1 42,031 59 94,630 36 NET STATE EXPENDITURES 25,951,168$ 19,615$ 12,926,282$ 20,649$ 12,679,784$ 17,784$ 51,557,233$ 19,368$
FY2004 TOTAL STATE EXPENDITURES 24,624,827$ 17,857$ 12,100,241$ 19,055$ 11,933,746$ 16,348$ 48,658,813$ 17,733$
48

(Columns rounded to nearest dollar)
BRUNSWICK
Average Daily Population (ADP) 305 192 158
Expenditures Per Capita Expenditures Per Capita Expenditures Per CapitaTYPE OF EXPENDITURES:PERSONAL SERVICES 3,055,959$ 10,020$ 1,925,061$ 10,026$ $ 1,124,090 7,114$
INMATE PAYROLL - Direct Cost 164,619 540 168,476 877 86,185 545
CONTRACTUAL SERVICES: Direct Inmate Costs 68,998 226 181,870 947 10,249 65 Indirect Inmate Costs 6,007 20 88,322 460 24,554 155 Recoveries for Contractual Serv. - - - - - - TOTAL CONTRACTUAL SERVICES 75,005 246 270,193 1,407 34,803 220
SUPPLIES AND MATERIALS: Direct Inmate Costs 176,316 578 237,325 1,236 137,942 873 Indirect Inmate Costs 120,797 396 96,071 500 56,855 360 Recoveries for Supplies & Mat'ls. - - - - - - TOTAL SUPPLIES AND MATERIALS 297,113 974 333,396 1,736 194,797 1,233
TRANSFER PAYMENTS 5,000 16 11,352 59 - -
CONTINUOUS CHARGES - - 122,177 636 8,273 52
PROPERTY AND IMPROVEMENT - - - - - -
EQUIPMENT 143,133 469 1,603 8 194,755 1,233 TOTAL STATE EXPENDITURES 3,740,830 12,265 2,832,258 14,751 1,642,903 10,398 LESS INSTITUTIONAL EARNINGS - - - - - - NET STATE EXPENDITURES 3,740,830$ 12,265$ 2,832,258$ 14,751$ 1,642,903$ 10,398$
FY2004 TOTAL STATE EXPENDITURES 3,376,395$ 11,931$ 2,670,500$ 15,260$ 326,141$ -$ (1)
(1) Facility re-opened in July 2004. Expenditures represent start-up costs.
(719/402)JAMES RIVER
(745/405)NOTTOWAY
(730/403)
DEPARTMENT OF CORRECTIONSPER CAPITA STATEMENT OF FACILITIES
WORK CENTER SUMMARYFOR THE FISCAL YEAR ENDED JUNE 30, 2005
49

DEPARTMENT OF CORRECTIONSPER CAPITA STATEMENT OF FACILITIES
WORK CENTER SUMMARY FOR THE FISCAL YEAR ENDED JUNE 30, 2005
(Columns rounded to nearest dollar)
TOTAL COSTS COLD SPRINGS ALL WORK CENTERS
Average Daily Population (ADP) 146 267 270 1,338
Expenditures Per Capita Expenditures Per Capita Expenditures Per Capita Expenditures Per Capita TYPE OF EXPENDITURES:PERSONAL SERVICES 2,376,511$ 16,277$ 1,340,013$ 5,019$ 3,691,625$ 13,673$ 13,513,259$ 10,100$
INMATE PAYROLL - Direct Cost - - 161,646 605 235,032 870 815,958 610
CONTRACTUAL SERVICES: Direct Inmate Costs 110,983 760 776,560 2,908 42,044 156 1,190,705 890 Indirect Inmate Costs 0 0 481 2 110,167 408 229,531 172 Recoveries for Contractual Serv. - - - - - - - - TOTAL CONTRACTUAL SERVICES 110,983 760 777,041 2,910 152,211 564 1,420,237 1,061
SUPPLIES AND MATERIALS: Direct Inmate Costs 15,153 104 123,764 464 436,504 1,617 1,127,004 842 Indirect Inmate Costs - - 81,670 306 191,438 709 546,831 409 Recoveries for Supplies & Mat'ls. - - - - - - - - TOTAL SUPPLIES AND MATERIALS 15,153 104 205,434 769 627,942 2,326 1,673,835 1,251
TRANSFER PAYMENTS 2,212 - 2,038 8 2,737 10 23,340 17
CONTINUOUS CHARGES - - 250,178 937 107,041 396 487,668 364
PROPERTY AND IMPROVEMENT - - - - - - - -
EQUIPMENT - - 70 0 63,007 233 402,568 301 TOTAL STATE EXPENDITURES 2,504,859 17,157 2,736,419 10,249 4,879,596 18,073 18,336,865 13,705 LESS INSTITUTIONAL EARNINGS - - - - - - - - NET STATE EXPENDITURES 2,504,859$ 17,157$ 2,736,419$ 10,249$ 4,879,596$ 18,073$ 18,336,865$ 13,705$
FY2004 TOTAL STATE EXPENDITURES 2,396,369$ 16,527$ 2,536,088$ 8,961$ 4,843,609$ 22,634$ (1) 16,149,102$ 14,694$
(1) During FY 2004, Southampton Reception & Classification Center was converted to a work/prerelease center.
(757/407) (769/401)GREENSVILLE
(740)SOUTHAMPTON
50
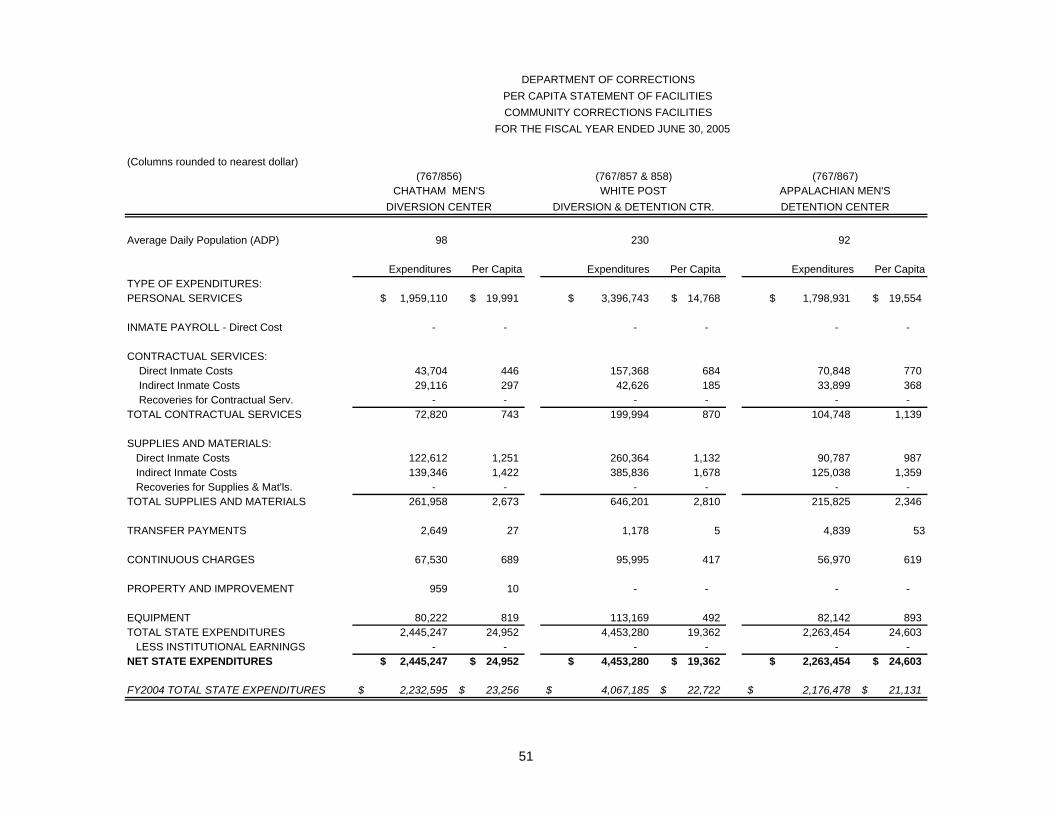
(Columns rounded to nearest dollar)
WHITE POSTDIVERSION & DETENTION CTR.
Average Daily Population (ADP) 98 230 92
Expenditures Per Capita Expenditures Per Capita Expenditures Per CapitaTYPE OF EXPENDITURES:PERSONAL SERVICES 1,959,110$ 19,991$ 3,396,743$ 14,768$ 1,798,931$ 19,554$
INMATE PAYROLL - Direct Cost - - - - - -
CONTRACTUAL SERVICES: Direct Inmate Costs 43,704 446 157,368 684 70,848 770 Indirect Inmate Costs 29,116 297 42,626 185 33,899 368 Recoveries for Contractual Serv. - - - - - - TOTAL CONTRACTUAL SERVICES 72,820 743 199,994 870 104,748 1,139
SUPPLIES AND MATERIALS: Direct Inmate Costs 122,612 1,251 260,364 1,132 90,787 987 Indirect Inmate Costs 139,346 1,422 385,836 1,678 125,038 1,359 Recoveries for Supplies & Mat'ls. - - - - - - TOTAL SUPPLIES AND MATERIALS 261,958 2,673 646,201 2,810 215,825 2,346
TRANSFER PAYMENTS 2,649 27 1,178 5 4,839 53
CONTINUOUS CHARGES 67,530 689 95,995 417 56,970 619
PROPERTY AND IMPROVEMENT 959 10 - - - -
EQUIPMENT 80,222 819 113,169 492 82,142 893 TOTAL STATE EXPENDITURES 2,445,247 24,952 4,453,280 19,362 2,263,454 24,603 LESS INSTITUTIONAL EARNINGS - - - - - - NET STATE EXPENDITURES 2,445,247$ 24,952$ 4,453,280$ 19,362$ 2,263,454$ 24,603$
FY2004 TOTAL STATE EXPENDITURES 2,232,595$ 23,256$ 4,067,185$ 22,722$ 2,176,478$ 21,131$
(767/856)CHATHAM MEN'S
DEPARTMENT OF CORRECTIONS PER CAPITA STATEMENT OF FACILITIES COMMUNITY CORRECTIONS FACILITIES
FOR THE FISCAL YEAR ENDED JUNE 30, 2005
DIVERSION CENTER
(767/867)APPALACHIAN MEN'SDETENTION CENTER
(767/857 & 858)
51
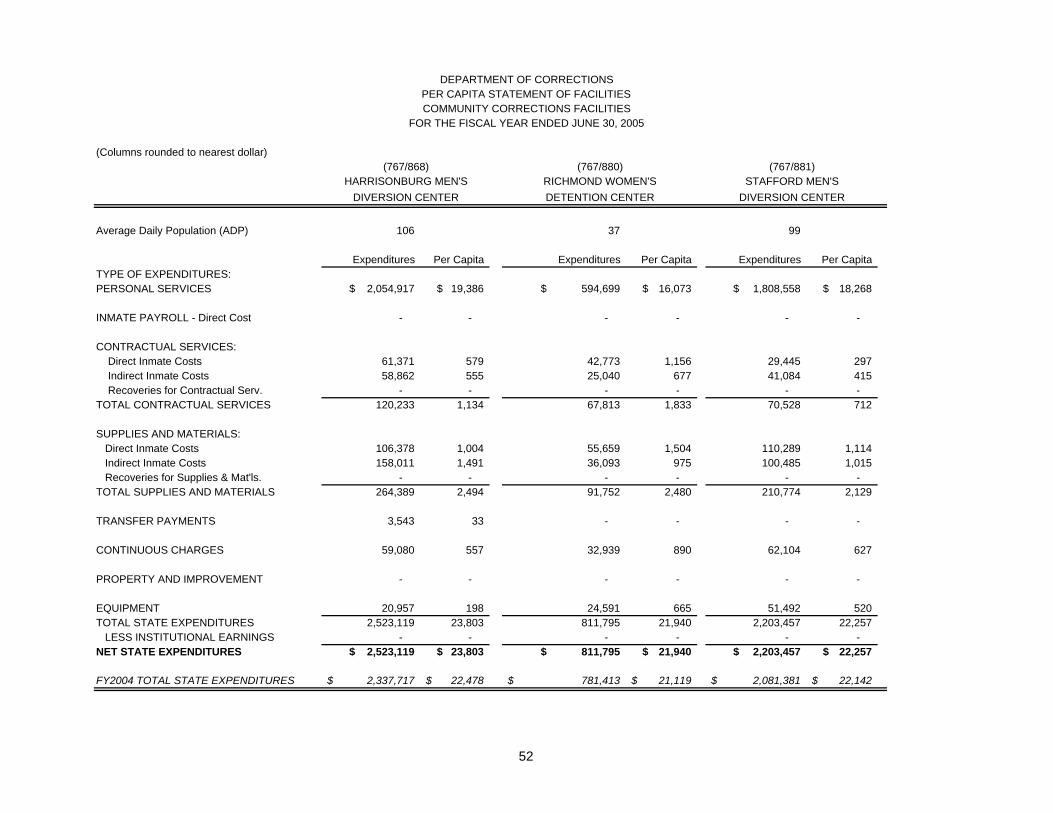
DEPARTMENT OF CORRECTIONSPER CAPITA STATEMENT OF FACILITIESCOMMUNITY CORRECTIONS FACILITIES
FOR THE FISCAL YEAR ENDED JUNE 30, 2005
(Columns rounded to nearest dollar)
HARRISONBURG MEN'S RICHMOND WOMEN'S STAFFORD MEN'SDIVERSION CENTER DETENTION CENTER DIVERSION CENTER
Average Daily Population (ADP) 106 37 99
Expenditures Per Capita Expenditures Per Capita Expenditures Per Capita TYPE OF EXPENDITURES:PERSONAL SERVICES 2,054,917$ 19,386$ 594,699$ 16,073$ 1,808,558$ 18,268$
INMATE PAYROLL - Direct Cost - - - - - -
CONTRACTUAL SERVICES: Direct Inmate Costs 61,371 579 42,773 1,156 29,445 297 Indirect Inmate Costs 58,862 555 25,040 677 41,084 415 Recoveries for Contractual Serv. - - - - - - TOTAL CONTRACTUAL SERVICES 120,233 1,134 67,813 1,833 70,528 712
SUPPLIES AND MATERIALS: Direct Inmate Costs 106,378 1,004 55,659 1,504 110,289 1,114 Indirect Inmate Costs 158,011 1,491 36,093 975 100,485 1,015 Recoveries for Supplies & Mat'ls. - - - - - - TOTAL SUPPLIES AND MATERIALS 264,389 2,494 91,752 2,480 210,774 2,129
TRANSFER PAYMENTS 3,543 33 - - - -
CONTINUOUS CHARGES 59,080 557 32,939 890 62,104 627
PROPERTY AND IMPROVEMENT - - - - - -
EQUIPMENT 20,957 198 24,591 665 51,492 520 TOTAL STATE EXPENDITURES 2,523,119 23,803 811,795 21,940 2,203,457 22,257 LESS INSTITUTIONAL EARNINGS - - - - - - NET STATE EXPENDITURES 2,523,119$ 23,803$ 811,795$ 21,940$ 2,203,457$ 22,257$
FY2004 TOTAL STATE EXPENDITURES 2,337,717$ 22,478$ 781,413$ 21,119$ 2,081,381$ 22,142$
(767/868) (767/881)(767/880)
52
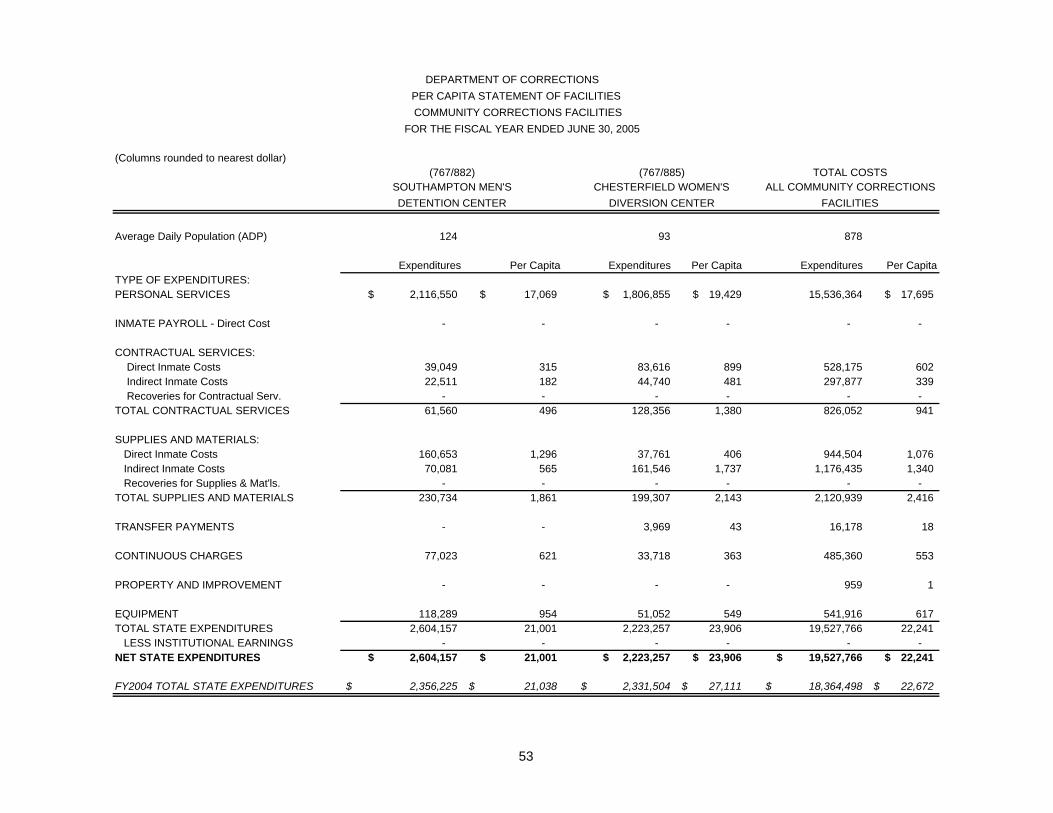
(Columns rounded to nearest dollar)
Average Daily Population (ADP) 124 93 878
Expenditures Per Capita Expenditures Per Capita Expenditures Per CapitaTYPE OF EXPENDITURES:PERSONAL SERVICES 2,116,550$ 17,069$ 1,806,855$ 19,429$ 15,536,364 17,695$
INMATE PAYROLL - Direct Cost - - - - - -
CONTRACTUAL SERVICES: Direct Inmate Costs 39,049 315 83,616 899 528,175 602 Indirect Inmate Costs 22,511 182 44,740 481 297,877 339 Recoveries for Contractual Serv. - - - - - - TOTAL CONTRACTUAL SERVICES 61,560 496 128,356 1,380 826,052 941
SUPPLIES AND MATERIALS: Direct Inmate Costs 160,653 1,296 37,761 406 944,504 1,076 Indirect Inmate Costs 70,081 565 161,546 1,737 1,176,435 1,340 Recoveries for Supplies & Mat'ls. - - - - - - TOTAL SUPPLIES AND MATERIALS 230,734 1,861 199,307 2,143 2,120,939 2,416
TRANSFER PAYMENTS - - 3,969 43 16,178 18
CONTINUOUS CHARGES 77,023 621 33,718 363 485,360 553
PROPERTY AND IMPROVEMENT - - - - 959 1
EQUIPMENT 118,289 954 51,052 549 541,916 617 TOTAL STATE EXPENDITURES 2,604,157 21,001 2,223,257 23,906 19,527,766 22,241 LESS INSTITUTIONAL EARNINGS - - - - - - NET STATE EXPENDITURES 2,604,157$ 21,001$ 2,223,257$ 23,906$ 19,527,766$ 22,241$
FY2004 TOTAL STATE EXPENDITURES 2,356,225$ 21,038$ 2,331,504$ 27,111$ 18,364,498$ 22,672$
DEPARTMENT OF CORRECTIONS PER CAPITA STATEMENT OF FACILITIES COMMUNITY CORRECTIONS FACILITIES
FOR THE FISCAL YEAR ENDED JUNE 30, 2005
DETENTION CENTER
(767/882)SOUTHAMPTON MEN'S
FACILITIES
(767/885)CHESTERFIELD WOMEN'S
TOTAL COSTSALL COMMUNITY CORRECTIONS
DIVERSION CENTER
53

DEPARTMENT OF CORRECTIONS OPERATING PER CAPITA STATEMENT OF FACILITIES
SOURCES For the Fiscal Year Ended June 30, 2005
• DOC REPORTS: Operating Expenditures for the FY Ending June 30, 2005 • CARS ACTR 1671: Detail Agency Net Revenue Fund Report as of June 30, 2005 • Average Daily Population Report as of June 30, 2005
54

================================================ SCHEDULE OF DIRECT AND INDIRECT INMATE COSTS
For the Fiscal Year Ended June 30, 2005 ================================================
Page Summary ………………………………………………………………………… 56 Direct and Indirect Inmate Costs: Summary By Type of Facility ………………………………………. 58 By Major Institutions ………………………………………………… 59 By Field Units …………………………………………………………… 69 By Work Centers …………………………….………………………….. 70 By Community Corrections Facilities ……………….………………. 72
55

SCHEDULE OF DIRECT AND INDIRECT INMATE COSTS SUMMARY
For the Fiscal Year Ended June 30, 2005 A detailed analysis of Direct and Indirect Inmate Costs is provided as supporting documentation for the Operating Per Capita Statement of Facilities. The schedule presents the information in the categories of “Inmate Payroll”, “Contractual Services” and “Supplies and Materials”. Direct Inmate Costs (inmate pay, postal services, clinic/dental/hospital/medical/X-ray services, food services, laundry and linen services, lab/medical/dental supplies, drugs, clothing, food and food service supplies, linen and laundry supplies, personal care supplies, and recreational supplies) are the expenditures that vary in direct proportion to the inmate population. Indirect Inmate Costs (utilities, repairs, maintenance, wastewater, and other miscellaneous expenditures) are costs that are not directly related to inmate population. Indirect costs are calculated by taking the total expenditures for Contractual Services and Supplies and Materials and subtracting direct inmate cost from the appropriate categories. Contractual Services totaled $85,288,991 for all types of facilities, while Supplies and Materials totaled $62,267,942. Direct Inmate Costs were $113,956,116 (including $8,402,347 for Inmate Payroll) and Indirect Inmate Costs were $50,507,114. Expenditure recoveries totaled $8,503,950. Examples of recoveries would be the sale of meat, milk and produce by agribusiness programs at DOC facilities, the warehouse operation at Powhatan Correctional Center, and highway maintenance performed for the Department of Transportation. This income is used to offset expenditures incurred by the facilities in providing the goods or services. Routine, regularly recurring recoveries such as agribusiness and highway maintenance are often factored into the facilities’ appropriations.
56
The variances in both direct and indirect inmate costs from year to year represent nominal increases or decreases that would be expected under normal operations. The one area reporting the largest decrease in expenditures was pharmaceutical drugs. The 42% decrease from $13,465,637 in fiscal year 2004 to $7,856,505 in fiscal year 2005 is due primarily to the reduction in the cost of HIV drugs as a result of the utilization of the 340B program through VCU Health Services. Also worth mentioning is the fact that the Chesterfield Women’s Diversion Center food service costs decreased from $189,628 in FY 2004 to $0 in FY05. This was due primarily to a change in the operating procedure whereby the budget and expenditures for both Chesterfield Women’s Diversion Center and Pocahontas Field Unit are recorded in Pocahontas Field Unit, who provides meals for both locations.
57

DEPARTMENT OF CORRECTIONSDIRECT AND INDIRECT INMATE COSTS
ALL CORRECTIONAL FACILITIES FOR THE FISCAL YEAR ENDED JUNE 30, 2005
(Columns rounded to nearest dollar)COMMUNITY TOTAL DIRECT &
MAJOR CORRECTIONS INDIRECT INMATE COSTSINSTITUTIONS FIELD UNITS WORK CENTERS FACILITIES ALL FACILITIES
INMATE PAYROLL - Direct Cost 6,456,099$ 1,130,290$ 815,958$ -$ 8,402,347$
CONTRACTUAL SERVICES:1214 Postal Services 170,511 28,230 7,060 15,820 221,621 1231 Clinic Services 4,005,177 373,705 70,551 132,754 4,582,186 1232 Dental Services 163,995 46,428 8,646 788 219,858 1233 Hospital Services 5,805,865 220,802 130,534 102,074 6,259,275 1234 Medical Services 51,857,898 446,498 476,156 243,597 53,024,149 1236 X-Ray and Lab Services 1,358,330 77,492 41,155 27,872 1,504,849 1264 Food Services 6,199,645 711 393,819 793 6,594,968 1265 Laundry and Linen Services 1,154,508 612 62,784 4,477 1,222,382 Direct Inmate Costs 70,715,929 1,194,479 1,190,705 528,175 73,629,287 Indirect Inmate Costs 10,076,976 1,055,320 229,531 297,877 11,659,704 Recoveries For Contractual Services - - - - - TOTAL FOR CONTRACTUAL SERVICES 80,792,904 2,249,798 1,420,237 826,052 85,288,991
SUPPLIES AND MATERIALS:1341/1342 Lab, Medical and Dental Supplies 1,244,717 107,603 37,082 35,894 1,425,297 1344 Pharmaceutical Drugs 7,275,740 362,637 115,119 103,010 7,856,505 1361 Clothing Supplies 4,136,922 426,619 434,129 171,100 5,168,769 1362/1363 Food and Food Service Supplies 12,800,280 1,775,026 454,972 579,319 15,609,597 1364 Linen and Laundry Supplies 1,189,970 128,866 73,265 27,289 1,419,390 1365 Personal Care Supplies 379,606 12,809 12,437 27,411 432,263 1378 Recreational Supplies 12,180 - - 481 12,661 Direct Inmate Costs 27,039,414 2,813,560 1,127,004 944,504 31,924,482 Indirect Inmate Costs 33,898,153 3,225,992 546,831 1,176,435 38,847,411 Recoveries For Supplies and Materials (7,504,328) (999,622) - - (8,503,950) TOTAL SUPPLIES AND MATERIALS 53,433,239 5,039,929 1,673,835 2,120,939 62,267,942
SUMMARY: DIRECT INMATE COSTS 104,211,441 5,138,329 3,133,667 1,472,679 113,956,116
INDIRECT INMATE COSTS 43,975,128 4,281,312 776,363 1,474,312 50,507,114 RECOVERIES (7,504,328) (999,622) - - (8,503,950)
TOTAL COSTS 140,682,242$ 8,420,018$ 3,910,030$ 2,946,991$ 155,959,280$
58

DEPARTMENT OF CORRECTIONS
(Columns rounded to nearest dollar)(709) (716) (717)
POWHATAN VIRGINIA CORRECTIONAL SOUTHAMPTONCORRECTIONAL CTR. CENTER FOR WOMEN CORRECTIONAL CTR.
INMATE PAYROLL - Direct Cost 180,199$ 142,389$ 232,690$
CONTRACTUAL SERVICES:1214 Postal Services 7,228 16,913 6,790 1231 Clinic Services 210,593 308,274 234,158 1232 Dental Services - 156 12,128 1233 Hospital Services 363,526 109,884 153,934 1234 Medical Services 5,803,703 331,077 271,744 1236 X-Ray and Lab Services 12,747 102,657 24,388 1264 Food Services - - 11,964 1265 Laundry and Linen Services 10,823 31,576 13,351 Direct Inmate Costs 6,408,620 900,538 728,456 Indirect Inmate Costs 289,100 394,988 507,354 Recoveries For Contractual Services - - - TOTAL FOR CONTRACTUAL SERVICES 6,697,720 1,295,525 1,235,810
SUPPLIES AND MATERIALS:1341/1342 Lab, Medical and Dental Supplies 4,461 43,823 61,598 1344 Pharmaceutical Drugs 153,129 344,670 182,710 1361 Clothing Supplies 46,387 84,744 134,758 1362/1363 Food and Food Service Supplies 548,745 279,154 443,909 1364 Linen and Laundry Supplies 35,115 21,797 38,442 1365 Personal Care Supplies 8,315 4,228 2,949 1378 Recreational Supplies - - - Direct Inmate Costs 796,152 778,416 864,365 Indirect Inmate Costs 3,087,316 786,543 1,793,588 Recoveries For Supplies and Materials (1,303,155) - TOTAL SUPPLIES AND MATERIALS 2,580,313 1,564,959 2,657,953
SUMMARY: DIRECT INMATE COSTS 7,384,971 1,821,342 1,825,512 INDIRECT INMATE COSTS 3,376,416 1,181,531 2,300,942 RECOVERIES (1,303,155) - -
TOTAL COSTS 9,458,232$ 3,002,873$ 4,126,454$
DIRECT AND INDIRECT INMATE COSTSMAJOR INSTITUTIONS
FOR THE FISCAL YEAR ENDED JUNE 30, 2005
59

DEPARTMENT OF CORRECTIONSDIRECT AND INDIRECT INMATE COSTS
MAJOR INSTITUTIONSFOR THE FISCAL YEAR ENDED JUNE 30, 2005
(Columns rounded to nearest dollar) (718) (719) (721)
BLAND JAMES RIVER POWHATAN RECEP. &CORRECTIONAL CTR. CORRECTIONAL CTR. CLASS CTR.
INMATE PAYROLL - Direct Cost 209,917$ 166,503$ 44,862$
CONTRACTUAL SERVICES:1214 Postal Services - (837) 10,096 1231 Clinic Services 139,986 192,638 - 1232 Dental Services 1,336 988 - 1233 Hospital Services 268,218 200,977 - 1234 Medical Services 200,331 72,417 3,030,681 1236 X-Ray and Lab Services 29,355 24,854 450 1264 Food Services 1,388 - - 1265 Laundry and Linen Services 2,541 - 45,382 Direct Inmate Costs 643,154 491,037 3,086,609 Indirect Inmate Costs 268,337 349,853 179,597 Recoveries For Contractual Services - - - TOTAL FOR CONTRACTUAL SERVICES 911,491 840,890 3,266,206
SUPPLIES AND MATERIALS:1341/1342 Lab, Medical and Dental Supplies 74,752 60,038 - 1344 Pharmaceutical Drugs 268,775 97,672 95,527 1361 Clothing Supplies 123,851 50,935 90,810 1362/1363 Food and Food Service Supplies 366,471 411,969 331,720 1364 Linen and Laundry Supplies 25,322 14,320 27,855 1365 Personal Care Supplies 6,883 285 1,818 1378 Recreational Supplies - - - Direct Inmate Costs 866,054 635,219 547,729 Indirect Inmate Costs 2,315,198 4,732,236 531,809 Recoveries For Supplies and Materials (1,662,965) (3,795,837) - TOTAL SUPPLIES AND MATERIALS 1,518,287 1,571,618 1,079,538
SUMMARY: DIRECT INMATE COSTS 1,719,125 1,292,759 3,679,201 INDIRECT INMATE COSTS 2,583,535 5,082,088 711,406 RECOVERIES (1,662,965) (3,795,837) -
TOTAL COSTS 2,639,695$ 2,579,011$ 4,390,607$
60

(Columns rounded to nearest dollar)(730) (733) (734)
BRUNSWICK SUSSEX 1 SUSSEX IICORRECTIONAL CTR. STATE PRISON STATE PRISON
INMATE PAYROLL - Direct Cost 259,659$ 219,192$ 221,034$
CONTRACTUAL SERVICES:1214 Postal Services 8,064 8,391 4,644 1231 Clinic Services 159,745 29,220 25,094 1232 Dental Services 3,344 - - 1233 Hospital Services 313,852 3,483 39,940 1234 Medical Services 390,748 3,423,954 3,409,182 1236 X-Ray and Lab Services 47,715 976 572 1264 Food Services - 1,207,727 1,391,676 1265 Laundry and Linen Services - 122,571 94,136 Direct Inmate Costs 923,468 4,796,321 4,965,243 Indirect Inmate Costs 339,272 474,558 398,369 Recoveries For Contractual Services - - - TOTAL FOR CONTRACTUAL SERVICES 1,262,740 5,270,879 5,363,612
SUPPLIES AND MATERIALS:1341/1342 Lab, Medical and Dental Supplies 40,974 43,745 11,979 1344 Pharmaceutical Drugs 548,897 65,459 16,543 1361 Clothing Supplies 158,099 262,906 273,914 1362/1363 Food and Food Service Supplies 477,028 (6,691) 1,191 1364 Linen and Laundry Supplies 46,760 71,514 71,759 1365 Personal Care Supplies 5,854 38,944 274 1378 Recreational Supplies - 2,643 84 Direct Inmate Costs 1,277,612 478,520 375,743 Indirect Inmate Costs 1,025,702 1,147,728 963,204 Recoveries For Supplies and Materials - - - TOTAL SUPPLIES AND MATERIALS 2,303,314 1,626,248 1,338,947
SUMMARY: DIRECT INMATE COSTS 2,460,739 5,494,033 5,562,020 INDIRECT INMATE COSTS 1,364,974 1,622,286 1,361,574 RECOVERIES - - -
TOTAL COSTS 3,825,712$ 7,116,319$ 6,923,594$
DEPARTMENT OF CORRECTIONSDIRECT AND INDIRECT INMATE COSTS
MAJOR INSTITUTIONSFOR THE FISCAL YEAR ENDED JUNE 30, 2005
61

(Columns rounded to nearest dollar)(735) (737) (741)
WALLENS RIDGE ST. BRIDES RED ONIONSTATE PRISON CORRECTIONAL CTR. STATE PRISON
INMATE PAYROLL - Direct Cost 249,484$ 117,695$ 120,478$
CONTRACTUAL SERVICES:1214 Postal Services 5,953 5,200 7,421 1231 Clinic Services 58,668 46,832 84,451 1232 Dental Services 4,556 6,498 4,861 1233 Hospital Services 110,490 72,103 171,359 1234 Medical Services 417,673 136,201 502,486 1236 X-Ray and Lab Services 86,637 9,225 39,016 1264 Food Services - - - 1265 Laundry and Linen Services 180 899 16 Direct Inmate Costs 684,158 276,959 809,609 Indirect Inmate Costs 239,250 231,358 180,480 Recoveries For Contractual Services - - - TOTAL FOR CONTRACTUAL SERVICES 923,408 508,316 990,090
SUPPLIES AND MATERIALS:1341/1342 Lab, Medical and Dental Supplies 54,251 49,663 32,510 1344 Pharmaceutical Drugs 364,002 85,587 366,512 1361 Clothing Supplies 119,658 172,759 74,094 1362/1363 Food and Food Service Supplies 929,010 335,935 616,466 1364 Linen and Laundry Supplies 105,866 486 55,432 1365 Personal Care Supplies 18,869 620 49,510 1378 Recreational Supplies 18 - 686 Direct Inmate Costs 1,591,673 645,050 1,195,209 Indirect Inmate Costs 796,992 692,298 681,826 Recoveries For Supplies and Materials - - - TOTAL SUPPLIES AND MATERIALS 2,388,665 1,337,348 1,877,034
SUMMARY: DIRECT INMATE COSTS 2,525,315 1,039,703 2,125,296 INDIRECT INMATE COSTS 1,036,242 923,655 862,306 RECOVERIES - - -
TOTAL COSTS 3,561,557$ 1,963,359$ 2,987,602$
DEPARTMENT OF CORRECTIONSDIRECT AND INDIRECT INMATE COSTS
MAJOR INSTITUTIONS FOR THE FISCAL YEAR ENDED JUNE 30, 2005
62
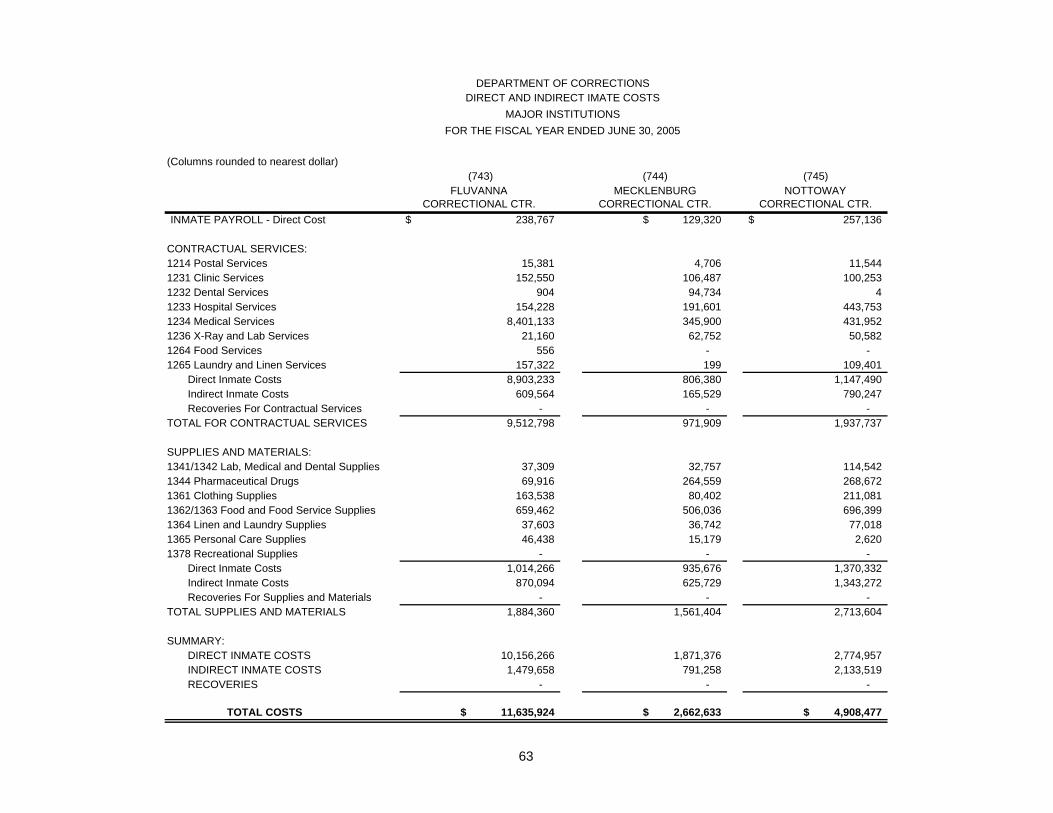
DEPARTMENT OF CORRECTIONSDIRECT AND INDIRECT IMATE COSTS
MAJOR INSTITUTIONSFOR THE FISCAL YEAR ENDED JUNE 30, 2005
(Columns rounded to nearest dollar)(743) (744) (745)
FLUVANNA MECKLENBURG NOTTOWAYCORRECTIONAL CTR. CORRECTIONAL CTR. CORRECTIONAL CTR.
INMATE PAYROLL - Direct Cost 238,767$ 129,320$ 257,136$
CONTRACTUAL SERVICES:1214 Postal Services 15,381 4,706 11,544 1231 Clinic Services 152,550 106,487 100,253 1232 Dental Services 904 94,734 4 1233 Hospital Services 154,228 191,601 443,753 1234 Medical Services 8,401,133 345,900 431,952 1236 X-Ray and Lab Services 21,160 62,752 50,582 1264 Food Services 556 - - 1265 Laundry and Linen Services 157,322 199 109,401 Direct Inmate Costs 8,903,233 806,380 1,147,490 Indirect Inmate Costs 609,564 165,529 790,247 Recoveries For Contractual Services - - - TOTAL FOR CONTRACTUAL SERVICES 9,512,798 971,909 1,937,737
SUPPLIES AND MATERIALS:1341/1342 Lab, Medical and Dental Supplies 37,309 32,757 114,542 1344 Pharmaceutical Drugs 69,916 264,559 268,672 1361 Clothing Supplies 163,538 80,402 211,081 1362/1363 Food and Food Service Supplies 659,462 506,036 696,399 1364 Linen and Laundry Supplies 37,603 36,742 77,018 1365 Personal Care Supplies 46,438 15,179 2,620 1378 Recreational Supplies - - - Direct Inmate Costs 1,014,266 935,676 1,370,332 Indirect Inmate Costs 870,094 625,729 1,343,272 Recoveries For Supplies and Materials - - - TOTAL SUPPLIES AND MATERIALS 1,884,360 1,561,404 2,713,604
SUMMARY: DIRECT INMATE COSTS 10,156,266 1,871,376 2,774,957 INDIRECT INMATE COSTS 1,479,658 791,258 2,133,519 RECOVERIES - - -
TOTAL COSTS 11,635,924$ 2,662,633$ 4,908,477$
63
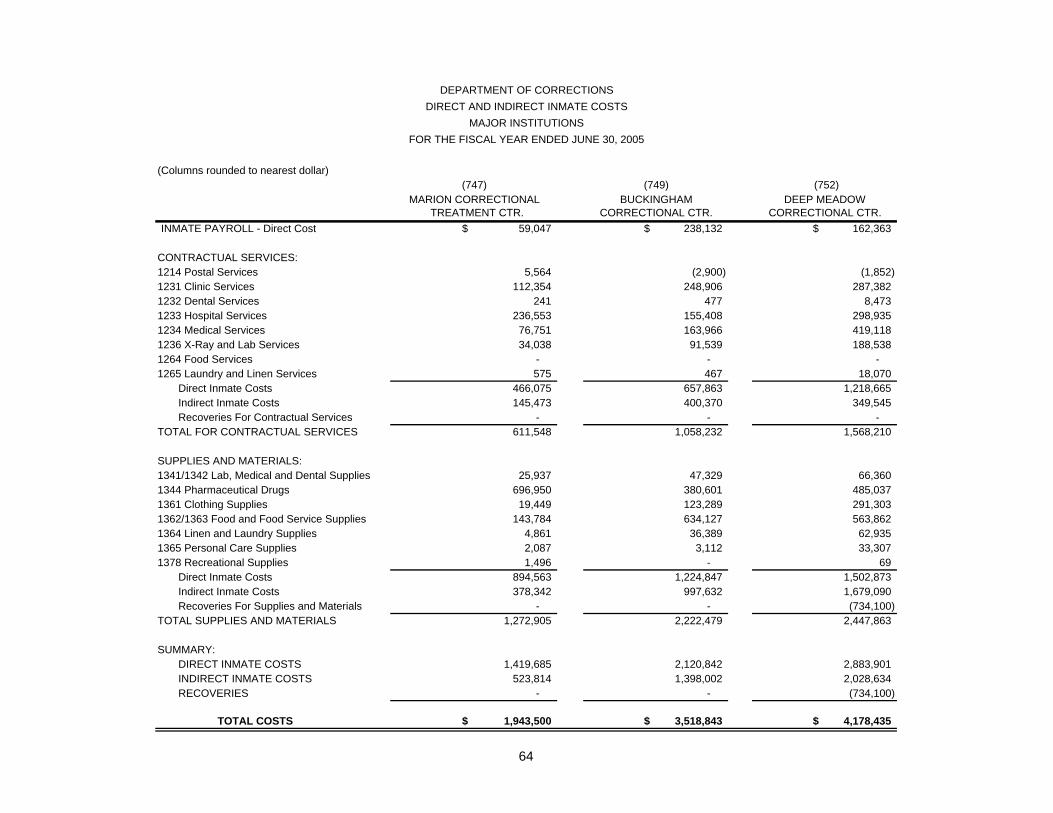
DEPARTMENT OF CORRECTIONSDIRECT AND INDIRECT INMATE COSTS
MAJOR INSTITUTIONSFOR THE FISCAL YEAR ENDED JUNE 30, 2005
(Columns rounded to nearest dollar)(747) (749) (752)
MARION CORRECTIONAL BUCKINGHAM DEEP MEADOW TREATMENT CTR. CORRECTIONAL CTR. CORRECTIONAL CTR.
INMATE PAYROLL - Direct Cost 59,047$ 238,132$ 162,363$
CONTRACTUAL SERVICES:1214 Postal Services 5,564 (2,900) (1,852) 1231 Clinic Services 112,354 248,906 287,382 1232 Dental Services 241 477 8,473 1233 Hospital Services 236,553 155,408 298,935 1234 Medical Services 76,751 163,966 419,118 1236 X-Ray and Lab Services 34,038 91,539 188,538 1264 Food Services - - - 1265 Laundry and Linen Services 575 467 18,070 Direct Inmate Costs 466,075 657,863 1,218,665 Indirect Inmate Costs 145,473 400,370 349,545 Recoveries For Contractual Services - - - TOTAL FOR CONTRACTUAL SERVICES 611,548 1,058,232 1,568,210
SUPPLIES AND MATERIALS:1341/1342 Lab, Medical and Dental Supplies 25,937 47,329 66,360 1344 Pharmaceutical Drugs 696,950 380,601 485,037 1361 Clothing Supplies 19,449 123,289 291,303 1362/1363 Food and Food Service Supplies 143,784 634,127 563,862 1364 Linen and Laundry Supplies 4,861 36,389 62,935 1365 Personal Care Supplies 2,087 3,112 33,307 1378 Recreational Supplies 1,496 - 69 Direct Inmate Costs 894,563 1,224,847 1,502,873 Indirect Inmate Costs 378,342 997,632 1,679,090 Recoveries For Supplies and Materials - - (734,100) TOTAL SUPPLIES AND MATERIALS 1,272,905 2,222,479 2,447,863
SUMMARY: DIRECT INMATE COSTS 1,419,685 2,120,842 2,883,901 INDIRECT INMATE COSTS 523,814 1,398,002 2,028,634 RECOVERIES - - (734,100)
TOTAL COSTS 1,943,500$ 3,518,843$ 4,178,435$
64
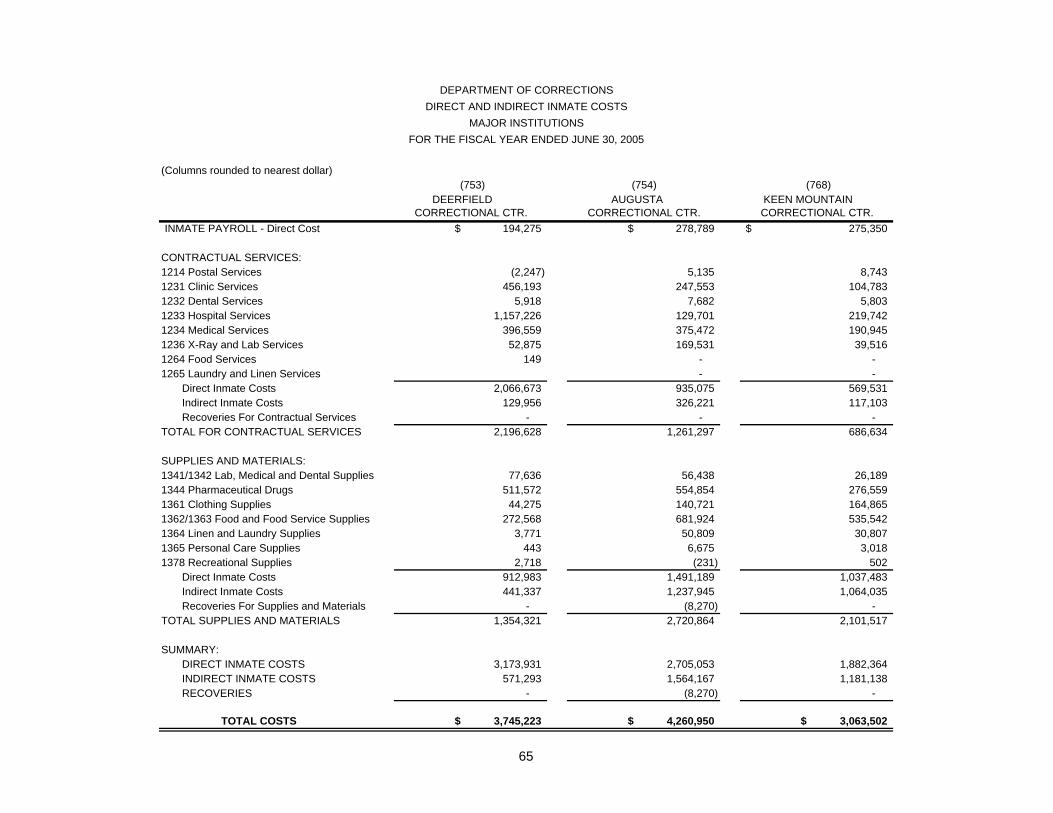
DEPARTMENT OF CORRECTIONSDIRECT AND INDIRECT INMATE COSTS
MAJOR INSTITUTIONSFOR THE FISCAL YEAR ENDED JUNE 30, 2005
(Columns rounded to nearest dollar) (753) (754) (768)
DEERFIELD AUGUSTA KEEN MOUNTAINCORRECTIONAL CTR. CORRECTIONAL CTR. CORRECTIONAL CTR.
INMATE PAYROLL - Direct Cost 194,275$ 278,789$ 275,350$
CONTRACTUAL SERVICES:1214 Postal Services (2,247) 5,135 8,743 1231 Clinic Services 456,193 247,553 104,783 1232 Dental Services 5,918 7,682 5,803 1233 Hospital Services 1,157,226 129,701 219,742 1234 Medical Services 396,559 375,472 190,945 1236 X-Ray and Lab Services 52,875 169,531 39,516 1264 Food Services 149 - - 1265 Laundry and Linen Services - - Direct Inmate Costs 2,066,673 935,075 569,531 Indirect Inmate Costs 129,956 326,221 117,103 Recoveries For Contractual Services - - - TOTAL FOR CONTRACTUAL SERVICES 2,196,628 1,261,297 686,634
SUPPLIES AND MATERIALS:1341/1342 Lab, Medical and Dental Supplies 77,636 56,438 26,189 1344 Pharmaceutical Drugs 511,572 554,854 276,559 1361 Clothing Supplies 44,275 140,721 164,865 1362/1363 Food and Food Service Supplies 272,568 681,924 535,542 1364 Linen and Laundry Supplies 3,771 50,809 30,807 1365 Personal Care Supplies 443 6,675 3,018 1378 Recreational Supplies 2,718 (231) 502 Direct Inmate Costs 912,983 1,491,189 1,037,483 Indirect Inmate Costs 441,337 1,237,945 1,064,035 Recoveries For Supplies and Materials - (8,270) - TOTAL SUPPLIES AND MATERIALS 1,354,321 2,720,864 2,101,517
SUMMARY: DIRECT INMATE COSTS 3,173,931 2,705,053 1,882,364 INDIRECT INMATE COSTS 571,293 1,564,167 1,181,138 RECOVERIES - (8,270) -
TOTAL COSTS 3,745,223$ 4,260,950$ 3,063,502$
65

DEPARTMENT OF CORRECTIONSDIRECT AND INDIRECT INMATE COSTS
MAJOR INSTITUTIONSFOR THE FISCAL YEAR ENDED JUNE 30, 2005
(Columns rounded to nearest dollar)(769) (770) (771)
GREENSVILLE DILLWYN INDIAN CREEKCORRECTIONAL CTR. CORRECTIONAL CTR. CORRECTIONAL CTR.
INMATE PAYROLL - Direct Cost 860,018$ 315,092$ 267,636$
CONTRACTUAL SERVICES:1214 Postal Services 7,990 18,172 6,036 1231 Clinic Services 164,928 207,907 32,407 1232 Dental Services - 2,059 1,011 1233 Hospital Services 147,017 499,333 129,091 1234 Medical Services 12,899,888 533,219 2,417,064 1236 X-Ray and Lab Services 53,111 96,897 1,107 1264 Food Services 3,586,184 - - 1265 Laundry and Linen Services 435,581 16,115 6,381 Direct Inmate Costs 17,294,699 1,373,702 2,593,096 Indirect Inmate Costs 620,986 273,308 1,567,473 Recoveries For Contractual Services - - - TOTAL FOR CONTRACTUAL SERVICES 17,915,685 1,647,009 4,160,570
SUPPLIES AND MATERIALS:1341/1342 Lab, Medical and Dental Supplies 48,513 99,006 15,099 1344 Pharmaceutical Drugs 185,363 418,811 38,219 1361 Clothing Supplies 637,848 106,822 303,959 1362/1363 Food and Food Service Supplies (10,238) 649,467 607,125 1364 Linen and Laundry Supplies 108,617 35,929 84,288 1365 Personal Care Supplies 91,477 7,391 9,338 1378 Recreational Supplies - 428 1,608 Direct Inmate Costs 1,061,581 1,317,853 1,059,637 Indirect Inmate Costs 2,686,252 772,242 875,624 Recoveries For Supplies and Materials - - - TOTAL SUPPLIES AND MATERIALS 3,747,833 2,090,095 1,935,261
SUMMARY: DIRECT INMATE COSTS 19,216,298 3,006,647 3,920,369 INDIRECT INMATE COSTS 3,307,238 1,045,550 2,443,098 RECOVERIES - - -
TOTAL COSTS 22,523,536$ 4,052,196$ 6,363,467$
66

DEPARTMENT OF CORRECTIONS DIRECT AND INDIRECT INMATE COSTS
MAJOR INSTITUTIONS FOR THE FISCAL YEAR ENDED JUNE 30, 2005
(Columns rounded to nearest dollar)(772) (773) (774)
HAYNESVILLE COFFEEWOOD LUNENBURGCORRECTIONAL CTR. CORRECTIONAL CTR. CORRECTIONAL CTR.
INMATE PAYROLL - Direct Cost 352,311$ 324,756$ 339,004$
CONTRACTUAL SERVICES:1214 Postal Services 18,143 (4,858) 1,090 1231 Clinic Services 238,587 28,053 27,174 1232 Dental Services 2,824 - - 1233 Hospital Services 235,512 - - 1234 Medical Services 630,633 3,408,190 3,176,911 1236 X-Ray and Lab Services 107,168 10,738 186 1264 Food Services - - - 1265 Laundry and Linen Services - 24,035 64,888 Direct Inmate Costs 1,232,867 3,466,158 3,270,249 Indirect Inmate Costs 258,814 263,455 206,417 Recoveries For Contractual Services - - - TOTAL FOR CONTRACTUAL SERVICES 1,491,681 3,729,613 3,476,666
SUPPLIES AND MATERIALS:1341/1342 Lab, Medical and Dental Supplies 83,791 15,394 20,624 1344 Pharmaceutical Drugs 377,618 59,960 97,568 1361 Clothing Supplies 113,788 82,825 59,842 1362/1363 Food and Food Service Supplies 684,512 626,142 814,661 1364 Linen and Laundry Supplies 41,846 54,264 9,424 1365 Personal Care Supplies 14,881 4,013 1,080 1378 Recreational Supplies 460 1,700 - Direct Inmate Costs 1,316,895 844,298 1,003,198 Indirect Inmate Costs 940,244 744,871 687,003 Recoveries For Supplies and Materials - - - TOTAL SUPPLIES AND MATERIALS 2,257,139 1,589,168 1,690,201
SUMMARY: DIRECT INMATE COSTS 2,902,074 4,635,211 4,612,451 INDIRECT INMATE COSTS 1,199,058 1,008,326 893,420 RECOVERIES - - -
TOTAL COSTS 4,101,131$ 5,643,537$ 5,505,871$
67

DEPARTMENT OF CORRECTIONSDIRECT AND INDIRECT INMATE COSTS
MAJOR INSTITUTIONSFOR THE FISCAL YEAR ENDED JUNE 30, 2005
(Columns rounded to nearest dollar)
TOTAL FOR ALL MAJOR INSTITUTIONS
INMATE PAYROLL - Direct Cost 6,456,099$
CONTRACTUAL SERVICES:1214 Postal Services 170,511 1231 Clinic Services 4,005,177 1232 Dental Services 163,995 1233 Hospital Services 5,805,865 1234 Medical Services 51,857,898 1236 X-Ray and Lab Services 1,358,330 1264 Food Services 6,199,645 1265 Laundry and Linen Services 1,154,508 Direct Inmate Costs 70,715,929 Indirect Inmate Costs 10,076,976 Recoveries For Contractual Services - TOTAL FOR CONTRACTUAL SERVICES 80,792,904
SUPPLIES AND MATERIALS:1341/1342 Lab, Medical and Dental Supplies 1,244,717 1344 Pharmaceutical Drugs 7,275,740 1361 Clothing Supplies 4,136,922 1362/1363 Food and Food Service Supplies 12,800,280 1364 Linen and Laundry Supplies 1,189,970 1365 Personal Care Supplies 379,606 1378 Recreational Supplies 12,180 Direct Inmate Costs 27,039,414 Indirect Inmate Costs 33,898,153 Recoveries For Supplies and Materials (7,504,328) TOTAL SUPPLIES AND MATERIALS 53,433,239
SUMMARY: DIRECT INMATE COSTS 104,211,441 INDIRECT INMATE COSTS 43,975,128 RECOVERIES (7,504,328)
TOTAL COSTS 140,682,242$
68

(Columns rounded to nearest dollar)(757) (760) (761)
WESTERN REGION CENTRAL REGION EASTERN REGION TOTAL COSTS CORRECTIONAL FIELD UNITS CORRECTIONAL FIELD UNITS CORRECTIONAL FIELD UNITS ALL FIELD UNITS
INMATE PAYROLL - Direct Cost 579,410$ 288,072$ 262,809$ 1,130,290$
CONTRACTUAL SERVICES:1214 Postal Services 15,329 7,368 5,533 28,230 1231 Clinic Services 153,277 120,095 100,333 373,705 1232 Dental Services 39,018 2,249 5,161 46,428 1233 Hospital Services 121,119 8,580 91,103 220,802 1234 Medical Services 267,559 52,421 126,518 446,498 1236 X-Ray and Lab Services 41,834 21,497 14,161 77,492 1264 Food Services 631 80 - 711 1265 Laundry and Linen Services 612 - - 612 Direct Inmate Costs 639,379 212,290 342,809 1,194,479 Indirect Inmate Costs 431,937 505,576 117,807 1,055,320 Recoveries For Contractual Services - - - - TOTAL FOR CONTRACTUAL SERVICES 1,071,317 717,866 460,616 2,249,798
- SUPPLIES AND MATERIALS: - 1341/1342 Lab, Medical and Dental Supplies 52,139 31,768 23,697 107,603 1344 Pharmaceutical Drugs 197,941 90,442 74,253 362,637 1361 Clothing Supplies 244,762 49,487 132,369 426,619 1362/1363 Food and Food Service Supplies 886,522 438,914 449,590 1,775,026 1364 Linen and Laundry Supplies 61,255 40,090 27,522 128,866 1365 Personal Care Supplies 6,035 6,014 760 12,809 1378 Recreational Supplies - - - - Direct Inmate Costs 1,448,653 656,715 708,191 2,813,560 Indirect Inmate Costs 1,365,976 1,305,880 554,136 3,225,992 Recoveries For Supplies and Materials (607,403) (139,971) (252,249) (999,622) TOTAL SUPPLIES AND MATERIALS 2,207,227 1,822,624 1,010,078 5,039,929
- - SUMMARY: - - DIRECT INMATE COSTS 2,667,443 1,157,078 1,313,809 5,138,329 INDIRECT INMATE COSTS 1,797,914 1,772,389 671,943 4,281,312 RECOVERIES (607,403) (139,971) (252,249) (999,622)
- - TOTAL COSTS 3,857,954$ 2,828,562$ 1,733,502$ 8,420,018$
DEPARTMENT OF CORRECTIONSDIRECT AND INDIRECT INMATE COSTS
CORRECTIONAL FIELD UNITS - REGIONAL SUMMARYFOR THE FISCAL YEAR ENDED JUNE 30, 2005
69

DEPARTMENT OF CORRECTIONSDIRECT AND INDIRECT INMATE COSTS
WORK CENTERS FOR THE FISCAL YEAR ENDED JUNE 30, 2005
(Columns rounded to nearest dollar)
(719/402) (730/403) (745/405)JAMES RIVER BRUNSWICK NOTTOWAY (1)
INMATE PAYROLL - Direct cost 164,619$ 168,476$ 86,185$
CONTRACTUAL SERVICES:1214 Postal Services - 1,747 - 1231 Clinic Services 28,440 27,716 1,817 1232 Dental Services 821 6,990 - 1233 Hospital Services 22,696 30,869 - 1234 Medical Services 14,546 79,825 605 1236 X-Ray and Lab Services 2,495 24,231 7,828 1264 Food Services - - - 1265 Laundry and Linen Services - 10,492 - Direct Inmate Costs 68,998 181,870 10,249 Indirect Inmate Costs 6,007 88,322 24,554 Recoveries For Contractual Services - - - TOTAL FOR CONTRACTUAL SERVICES 75,005 270,193 34,803
SUPPLIES AND MATERIALS:1341/1342 Lab, Medical and Dental Supplies - 6,147 12,372 1344 Pharmaceutical Drugs 48,050 36,617 3,422 1361 Clothing Supplies 60,803 59,326 34,587 1362/1363 Food and Food Service Supplies 61,422 124,259 76,013 1364 Linen and Laundry Supplies 5,976 4,840 11,547 1365 Personal Care Supplies 65 6,136 - 1378 Recreational Supplies - - - Direct Inmate Costs 176,316 237,325 137,942 Indirect Inmate Costs 120,797 96,071 56,855 Recoveries For Supplies and Materials - - - TOTAL SUPPLIES AND MATERIALS 297,113 333,396 194,797
SUMMARY: DIRECT INMATE COSTS 409,934 587,671 234,376 INDIRECT INMATE COSTS 126,804 184,393 81,410 RECOVERIES - - -
TOTAL COSTS 536,737$ 772,064$ 315,786$
(1) Facility re-opened as work center July 1, 2004
70

DEPARTMENT OF CORRECTIONSDIRECT AND INDIRECT INMATE COSTS
WORK CENTERS FOR THE FISCAL YEAR ENDED JUNE 30, 2005
(Columns rounded to nearest dollar)
(757/407) (769/401) 740 TOTAL COSTSCOLD SPRINGS GREENSVILLE SOUTHAMPTON (1) WORK CENTERS
INMATE PAYROLL - Direct cost -$ 161,646 235,032$ 815,958$
CONTRACTUAL SERVICES:1214 Postal Services - - 5,313 7,060 1231 Clinic Services 12,578 - - 70,551 1232 Dental Services 330 - 505 8,646 1233 Hospital Services 76,970 - - 130,534 1234 Medical Services 19,680 355,468 6,031 476,156 1236 X-Ray and Lab Services 1,426 - 5,175 41,155 1264 Food Services - 393,819 - 393,819 1265 Laundry and Linen Services - 27,273 25,019 62,784 Direct Inmate Costs 110,983 776,560 42,044 1,190,705 Indirect Inmate Costs 0 481 110,167 229,531 Recoveries For Contractual Services - - - - TOTAL FOR CONTRACTUAL SERVICES 110,983 777,041 152,211 1,420,237
SUPPLIES AND MATERIALS:1341/1342 Lab, Medical and Dental Supplies - 30 18,533 37,082 1344 Pharmaceutical Drugs 15,153 9,906 1,972 115,119 1361 Clothing Supplies - 112,053 167,359 434,129 1362/1363 Food and Food Service Supplies - 268 193,009 454,972 1364 Linen and Laundry Supplies - - 50,902 73,265 1365 Personal Care Supplies - 1,507 4,729 12,437 1378 Recreational Supplies - - - - Direct Inmate Costs 15,153 123,764 436,504 1,127,004 Indirect Inmate Costs - 81,670 191,438 546,831 Recoveries For Supplies and Materials - - - - TOTAL SUPPLIES AND MATERIALS 15,153 205,434 627,942 1,673,835
SUMMARY: DIRECT INMATE COSTS 126,136 1,061,970 713,581 3,133,667 INDIRECT INMATE COSTS 0 82,151 301,605 776,363 RECOVERIES - - - -
TOTAL COSTS 126,136$ 1,144,121$ 1,015,185$ 3,910,030$
(1) During FY 2004, Southampton Reception & Classification Center was converted to a work/prerelease center. The majority of individuals housed there are in the work center.
71

DEPARTMENT OF CORRECTIONSDIRECT AND INDIRECT INMATE COSTS COMMUNITY CORRECTIONS FACILITIES
FOR THE FISCAL YEAR ENDED JUNE 30, 2005
(Columns rounded to nearest dollar)(767/856) (767/857 & 858) (767/867) (767/868)
CHATHAM MEN'S WHITE POST APPALACHIAN MEN'S HARRISONBURG MEN'SDIVERSION CENTER DETENTION/DIVERSION CTR DETENTION CENTER DIVERSION CENTER
INMATE PAYROLL - Direct Cost -$ -$ -$ -$
CONTRACTUAL SERVICES:1214 Postal Services 2,600 8,609 2,021 - 1231 Clinic Services 266 48,236 20,118 10,251 1232 Dental Services 154 108 47 31 1233 Hospital Services 8,554 33,713 18,344 6,356 1234 Medical Services 29,332 62,678 22,004 41,668 1236 X-Ray and Lab Services 2,798 3,287 8,315 3,016 1264 Food Services - 738 - 49 1265 Laundry and Linen Services - - - - Direct Inmate Costs 43,704 157,368 70,848 61,371 Indirect Inmate Costs 29,116 42,626 33,899 58,862 Recoveries For Contractual Services - - - - TOTAL FOR CONTRACTUAL SERVICES 72,820 199,994 104,748 120,233
SUPPLIES AND MATERIALS:1341/1342 Lab, Medical and Dental Supplies 1,510 9,375 2,167 6,541 1344 Pharmaceutical Drugs 9,148 23,216 10,589 16,076 1361 Clothing Supplies 25,456 54,009 10,089 10,326 1362/1363 Food and Food Service Supplies 71,864 160,269 62,118 71,396 1364 Linen and Laundry Supplies 10,481 5,610 2,929 1,080 1365 Personal Care Supplies 4,153 7,457 2,895 921 1378 Recreational Supplies - 428 - 38 Direct Inmate Costs 122,612 260,364 90,787 106,378 Indirect Inmate Costs 139,346 385,836 125,038 158,011 Recoveries For Supplies and Materials - - - - TOTAL SUPPLIES AND MATERIALS 261,958 646,201 215,825 264,389
SUMMARY: DIRECT INMATE COSTS 166,316 417,733 161,636 167,749 INDIRECT INMATE COSTS 168,461 428,462 158,937 216,872 RECOVERIES - - - -
TOTAL COSTS 334,778$ 846,194$ 320,573$ 384,621$
72

(Columns rounded to nearest dollar)(767/880) (767/881) (767/882)
RICHMOND WOMEN'S STAFFORD MEN'S SOUTHAMPTON MEN'SDETENTION CENTER DIVERSION CENTER DETENTION CENTER
INMATE PAYROLL - Direct Cost -$ -$ -$
CONTRACTUAL SERVICES:1214 Postal Services - 89 3,778 1231 Clinic Services 24,018 3,197 9,118 1232 Dental Services - - - 1233 Hospital Services 7,640 7,084 - 1234 Medical Services 10,605 19,640 21,102 1236 X-Ray and Lab Services 510 (626) 680 1264 Food Services - 6 - 1265 Laundry and Linen Services - 56 4,372 Direct Inmate Costs 42,773 29,445 39,049 Indirect Inmate Costs 25,040 41,084 22,511 Recoveries For Contractual Services - - - TOTAL FOR CONTRACTUAL SERVICES 67,813 70,528 61,560
SUPPLIES AND MATERIALS:1341/1342 Lab, Medical and Dental Supplies 1,134 9,960 2,298 1344 Pharmaceutical Drugs 4,946 7,779 14,030 1361 Clothing Supplies 6,798 26,887 29,715 1362/1363 Food and Food Service Supplies 40,996 64,509 105,045 1364 Linen and Laundry Supplies 742 - 1,422 1365 Personal Care Supplies 1,044 1,140 8,143 1378 Recreational Supplies - 15 - Direct Inmate Costs 55,659 110,289 160,653 Indirect Inmate Costs 36,093 100,485 70,081 Recoveries For Supplies and Materials - - - TOTAL SUPPLIES AND MATERIALS 91,752 210,774 230,734
SUMMARY: DIRECT INMATE COSTS 98,433 139,734 199,702 INDIRECT INMATE COSTS 61,133 141,568 92,593 RECOVERIES - - -
TOTAL COSTS 159,565$ 281,302$ 292,294$
DEPARTMENT OF CORRECTIONSDIRECT AND INDIRECT INMATE COSTS COMMUNITY CORRECTIONS FACILITIES
FOR THE FISCAL YEAR ENDED JUNE 30, 2005
73
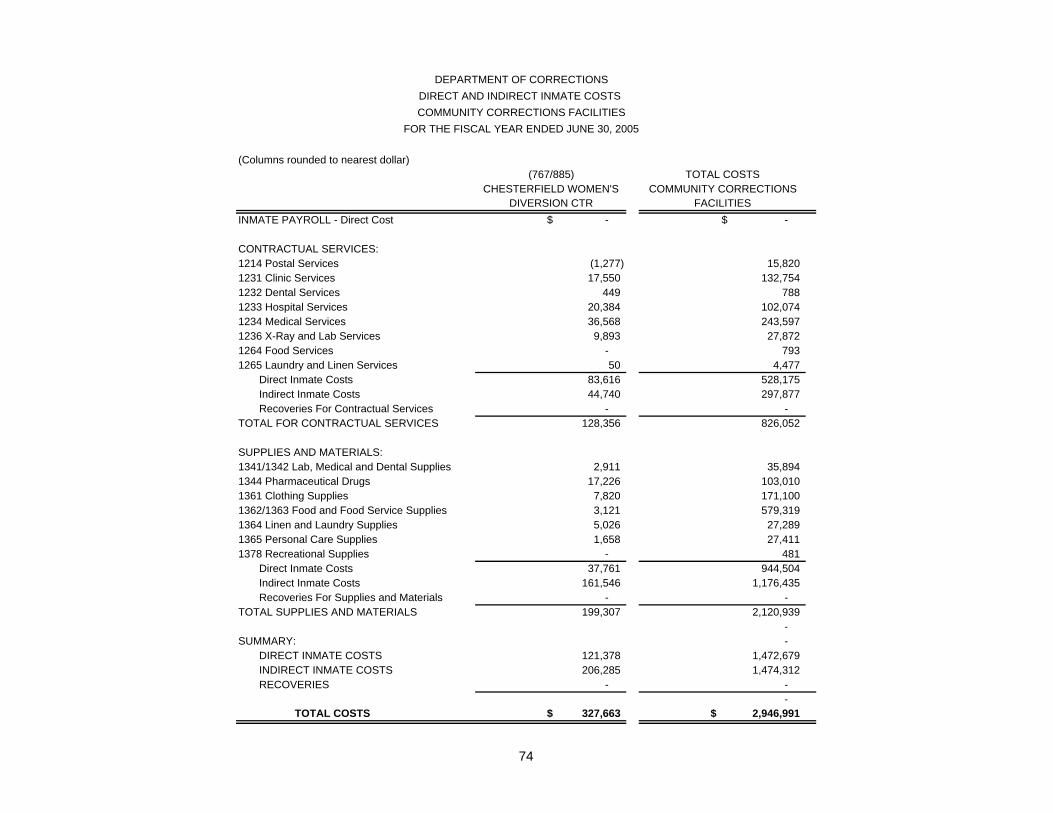
(Columns rounded to nearest dollar)(767/885) TOTAL COSTS
CHESTERFIELD WOMEN'S COMMUNITY CORRECTIONSDIVERSION CTR FACILITIES
INMATE PAYROLL - Direct Cost -$ -$
CONTRACTUAL SERVICES:1214 Postal Services (1,277) 15,820 1231 Clinic Services 17,550 132,754 1232 Dental Services 449 788 1233 Hospital Services 20,384 102,074 1234 Medical Services 36,568 243,597 1236 X-Ray and Lab Services 9,893 27,872 1264 Food Services - 793 1265 Laundry and Linen Services 50 4,477 Direct Inmate Costs 83,616 528,175 Indirect Inmate Costs 44,740 297,877 Recoveries For Contractual Services - - TOTAL FOR CONTRACTUAL SERVICES 128,356 826,052
SUPPLIES AND MATERIALS:1341/1342 Lab, Medical and Dental Supplies 2,911 35,894 1344 Pharmaceutical Drugs 17,226 103,010 1361 Clothing Supplies 7,820 171,100 1362/1363 Food and Food Service Supplies 3,121 579,319 1364 Linen and Laundry Supplies 5,026 27,289 1365 Personal Care Supplies 1,658 27,411 1378 Recreational Supplies - 481 Direct Inmate Costs 37,761 944,504 Indirect Inmate Costs 161,546 1,176,435 Recoveries For Supplies and Materials - - TOTAL SUPPLIES AND MATERIALS 199,307 2,120,939
- SUMMARY: - DIRECT INMATE COSTS 121,378 1,472,679 INDIRECT INMATE COSTS 206,285 1,474,312 RECOVERIES - -
- TOTAL COSTS 327,663$ 2,946,991$
DEPARTMENT OF CORRECTIONSDIRECT AND INDIRECT INMATE COSTS COMMUNITY CORRECTIONS FACILITIES
FOR THE FISCAL YEAR ENDED JUNE 30, 2005
74

====================================================== AVERAGE DAILY INMATE AND PROBATIONER POPULATION
For the Fiscal Year Ended June 30, 2005 ======================================================
Page Summary ………………………………………………………………………… 76 Fiscal Year 2005 vs. Fiscal Year 2004 ……………………………………… 77 Fiscal Year 2005 by Month …………………………………………………… 78
75

AVERAGE DAILY INMATE & PROBATIONER POPULATION SUMMARY
For the Fiscal Year Ended June 30, 2005 The Average Daily Inmate & Probationer Population (ADP) is defined as follows: the sum total of the population resulting from periodic head-counts divided by the number of observations. This calculation is widely used internally and externally to the DOC for purposes of calculating and forecasting various costs per inmate and providing a basis for funding. Two graphs of average daily inmate and probationer population (ADP) are presented in this section. 1) BY REGION AND TOTAL DOC: This first graph reflects the average daily inmate and probationer
population, by Region, utilized in the computation of the Operating Per Capita Statement of Facilities for the Fiscal Years 2004 and 2005.
2) BY MONTHS: The second graph represents the average inmate and probationer population reported by the
Virginia Department of Corrections for each month of Fiscal Year 2005. Data is representative of inmates and probationers located at Major Institutions, Field Units, Work Centers, Detention Centers, and Diversion Centers. Probationers and parolees living at home while being monitored by probation and parole officers, day reporting centers, electronic home monitoring programs, etc., were excluded from this report. Private contract bed and adult residential facility populations were also excluded. The system-wide population varied during the year from a drop of –.26% in April to an increase of .50% in August. The annual system-wide population average was 31,941. This figure includes the Lawrenceville Private Prison, which had a total ADP of 1,568.
76

77
Average Daily Inmate & Probationer PopulationFY 2005 vs. FY 2004
12,09711,018
810
6,318
12,337
10,841
878
30,207
6,281
30,373
0
5,000
10,000
15,000
20,000
25,000
30,000
35,000
Western Central Eastern Community DOC Total
Region
Ave
rage
Dai
ly P
opul
atio
n
FY 2004 ADPFY 2005 ADP
NOTES:Private Contract Bed, Adult Residential Facility and Private Prison (Lawrenceville Correctional Center) populations have been excluded. Both FY 2004 and FY 2005 ADP figures are based on a 12-month average.
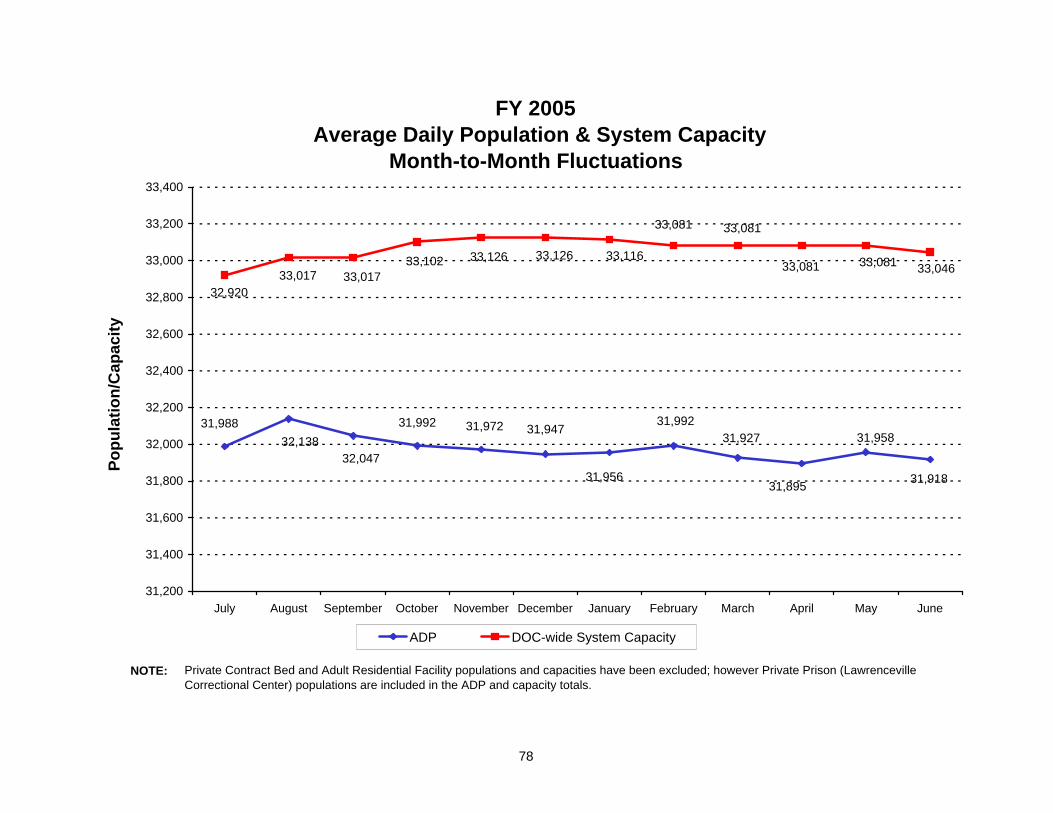
78
FY 2005 Average Daily Population & System Capacity
Month-to-Month Fluctuations
31,98832,138
32,047
31,992 31,972 31,947
31,956
31,99231,927
31,895
31,958
31,918
33,04633,08133,081
33,08133,081
33,11633,12633,12633,10233,01733,017
32,920
31,200
31,400
31,600
31,800
32,000
32,200
32,400
32,600
32,800
33,000
33,200
33,400
July August September October November December January February March April May June
Popu
latio
n/C
apac
ity
ADP DOC-wide System Capacity
Private Contract Bed and Adult Residential Facility populations and capacities have been excluded; however Private Prison (Lawrenceville Correctional Center) populations are included in the ADP and capacity totals.
NOTE:

FIDUCIARY FINANCIAL STATEMENTS (INMATE TRUST AND COMMISSARY FUNDS)
The Fiduciary Financial Statements of the Department of Corrections provide an official accounting for assets held by a governmental unit in a trustee capacity and consists of two distinct types: Inmate Trust Fund and Commissary Fund. INMATE TRUST FUND
The Inmate Trust financial statements reflect the results of banking transactions relating to funds held by the Department of Corrections in a custodial capacity on behalf of inmates. Inmate Trust monies are generally held by banking institutions near the correctional facility where the inmate resides. The local facility’s business office administers the fund on a day-to-day basis with oversight provided by Regional or Central Office personnel. COMMISSARY FUND
The Commissary financial statements reflect the results of the purchase and resale of products to the general inmate population. Generally, all Institutions, Field Units, and Detention Centers have one or more Commissary operations where a wide variety of products are made available for sale to inmates. The products must be approved from a security perspective, and are paid for by individual inmates through the transfer of funds from the inmates’ trust account. Profits generated from the Commissary operations are reserved for purchases of items that would benefit the Department’s inmate population. The Department of Corrections awarded a contract to Keefe Commissary Supply effective July 1, 2002, for a one-year term with four (4) renewal options. There were seven original pilots to include Coffeewood, Deep Meadow, Sussex II, Keen Mountain, Dinwiddie Field Unit, Chatham and Harrisonburg. To date, all DOC facilities have been added to the contract except for three. They include Sussex I, Dillywn and Botetourt.
79

DEPARTMENT OF CORRECTIONSINMATE TRUST FUND
FOR THE FISCAL YEAR ENDING JUNE 30, 2005
Balance June 30, 2005ASSETS
Cash Held with the Treasurer (GLA 101) -$ Cash Not with the Treasurer 3,953,281 Cash Equivalents with the Treasurer (Securities Lending from Treasury) - Cash Equivalents with the Treasurer - Other - Cash Equivalents not with the Treasurer -
Cash and Cash Equivalents - Total 3,953,281
Investments with the Treasurer (Securities Lending from Treasury) - Investments with the Treasurer - Other 2,895,295 Investments not with the Treasurer 21,009 Short-term Investments -
Investments - Total 2,916,304
Accounts and Loans Receivables, Net 252,659 Receivables, Net - Total 252,659
Due from Other Funds (1,218) Due from Fiduciary Funds -
Other Assets - Other Assets Total -
TOTAL ASSETS 7,121,026$
LIABILITIESAccounts Payable 1,700,323$ Amounts Due to Other Governments - Due to Other Funds 95,605 Due to Fiduciary Funds - Insurance Premiums and Claims Payable - Deferred Revenue - Obligations Under Securities Lending Program -
Due to Program Participants, Escrows, and Providers - Accrued Interest Payable - Other Liabilities 5,325,098 Deposits Pending Distribution -
Other Liabilities - Total 5,325,098$ TOTAL LIABILITIES 7,121,026$
80

FY05 FY04 ABSOLUTE % CHANGE EXPLANATION
Charges for Sales/Services 2,866,051.43$ 8,275,848.15$ (5,409,796.72) -65.37% * (A)
Cost of Sales/Services 2,421,211.40 7,002,616.91 (4,581,405.51) -65.42% * (A)
Gross Profit 444,840.03 1,273,231.24 (828,391.21) -65.06% * (A)
Operating Expenses:Personal Services (6,492.20) 436,100.53 (442,592.73) -101.49% * (A)Store Supplies 14,999.67 32,580.70 (17,581.03) -53.96% *Store Equipment 25,899.23 7,490.63 18,408.60 245.76% *Unsaleable Merchandise 2,181.35 16,050.28 (13,868.93) -86.41% *Sales Taxes 120,015.63 308,294.25 (188,278.62) -61.07% * (A)Depreciation 2,895.75 2,258.88 636.87 28.19% *Miscellaneous 72,177.43 36,678.49 35,498.94 96.78% * Total Operating Expenses 231,676.86 839,453.76 (607,777) -72.40% * (A)
Operating Income 213,163.17 433,777.48 (220,614) -50.86% * (A)
Non-Operating Revenues and Expenses: Interest 62,792.64 33,336.25 29,456.39 88.36% *Commissary Commission (Keefe) 1,375,090.26 978,980.76 396,109.50 40.46% * (B)Other Income (Expenses) 817,260.89 512,346.61 304,914.28 59.51% * (C)Funds Transfers - (45,000.00) 45,000.00 100.00% * Total Non-Oper.Rev. (Expenses) 2,255,143.79 1,479,663.62 775,480.17 52.41% *Net Income before Inmate Welfare 2,468,306.96 1,913,441.10 554,865.86 29.00% *(Inmate Welfare) (2,724,661.56) (2,397,051.24) (327,610.32) -13.67% * (D)Net Income (Loss) (256,354.60) (483,610.14) 882,476 182.48% * (E)
Fund Balance-July 1 5,043,264.22 5,526,874.36 (483,610) -8.75% ADJUSTMENTS * (14,989.04) - (14,989) Infinity *
Fund Balance-June 30 (256,354.60)$ (483,610.14)$ 227,255.54 46.99% *
EXPLANATIONS FOR FLUCTUATIONS
An asterisk (*) by the fluctuation indicates that the fluctuation meets the threshold of materiality, and is explained below.
(A) - -
(B) -$
(C)
(D)
(E)
Threshold of Materiality = Variance of $50,000.00 and a 10% change from the previous year.
FLUCTUATION
FY05 vs FY04 FLUCTUATION ANALYSIS OF COMMISSARY SPECIAL REVENUE FUND
The DOC has nearly completed the process of privatizing Commissaries. This would account for decreases in all Sales/Operating Expense related items on the Income Statement.
The increase in Inmate Welfare expenses is due to the institutions absorbing a large part of the cost of three new programs: Faith Based Services to Inmates, Assisting Families of Inmates and Save Our Shelters "Pen Pals".
The increase in Other Income is attributed to items such as fines and forfeitures, confiscated funds, beauty and optical shop revenue, picture tickets, inmate holiday pack revenue and from the sale of ice cream, which the privatized commissary no longer sells.
This is the Commissary Commission Income earned by the DOC from the company that has taken over operation of the Commissaries, (Keefe Inc).
The improvement in Net Income is due to the favorable impact of a continuation of the privatization of more Commissaries and a resulting reduction of operating expenses.
81

======================================= EMPLOYMENT LEVEL MONITORING REPORT
For the Fiscal Year Ended June 30, 2005 =======================================
Page Summary ……………………………………………………………………… 83 Employment Level Monitoring Report: Average Employment Level (Graph) ……………………………. 84 Average Employment Level (Table) …………………………… 85
82

EMPLOYMENT LEVEL * SUMMARY
For the Fiscal Year Ended June 30, 2005 The DOC’s authorized position level for Fiscal Year 2005 was 12,602.50, up from the previous fiscal year’s level by 70.75 (.56%). The average employment level of 11,572 increased by 23, or .2% more than the previous year’s level. The average employment level, by Division, was as follows:
Increase/(Decrease) FY 2005 FY 2005 FY 2004 Level Percent % of Total
Division of Administration - 293 321 (28) (8.7%) 2.5%
Division of Operations Community Corrections – 1,293 1,271 22 1.7% 11.2% Institutions - 9,820 9,794 26 .3% 84.9% Va. Correctional Enterprises - 166 163 3 1.7% 1.4% Division of Operations Subtotal 11,279 11,228 51 .5% 97.5%
====== ====== ====== ====== ======= Departmental Total - 11,572 11,549 23 .2% 100.0% * The source for DOC’s employment level is the “Employment Level Monitoring Report”, obtained from the Personnel Management Information System (PMIS).
83

84
DOC EMPLOYMENT LEVEL(FY 2005 Authorized Position Level = 12,602.50)
11,64311,543 11,601
11,551
11,495
11,553
11,625
11,630
11,54911,562
11,511
11,601
11,000
11,200
11,400
11,600
11,800
12,000
07/31/04 08/31/04 09/30/04 10/31/04 11/30/04 12/31/04 01/31/05 02/28/05 03/31/05 04/30/05 05/31/05 06/30/05
Month Ending Date
Posi
tions
Fill
ed

Agency Code Agency Name
Average Employment
Level
Increase/ (Decrease) as
Compared to FY 2004
701 Department of Corrections Central Activities 191 (24)709 Powhatan Correctional Center 319 (14)711 Virginia Correctional Enterprises 166 3716 Virginia Correctional Center for Women 207 14717 Southampton Correctional Center 251 4718 Bland Correctional Center 302 15719 James River Correctional Center 258 (2)721 Powhatan Reception & Classification Center 110 (8)730 Brunswick Correctional Center 373 (8)733 Sussex I State Prison 343 (4)734 Sussex II State Prison 366 8735 Wallens Ridge State Prison 405 2737 St. Brides Correctional Center 176 (2)740 Southampton Work/Prerelease Center 74 (5)741 Red Onion State Prison 403 (12)742 Academy for Staff Development 103 (3)743 Fluvanna Correctional Center for Women 353 0744 Mecklenburg Correctional Center 312 (2)745 Nottoway Correctional Center 462 43747 Marion Correctional Treatment Center 226 2749 Buckingham Correctional Center 343 0752 Deep Meadow Correctional Center 303 (14)753 Deerfield Correctional Center 185 2754 Augusta Correctional Center 403 (6)756 Division of Institutional Services 330 13757 Western Regional Field Units 487 2760 Central Regional Field Units 154 1761 Eastern Regional Field Units 214 7767 Division of Community Corrections 1293 22768 Keen Mountain Correctional Center 290 10769 Greensville Correctional Center 822 (5)770 Dillwyn Correctional Center 263 1771 Indian Creek Correctional Center 248 (19)772 Haynesville Correctional Center 315 3773 Coffeewood Correctional Center 258 6774 Lunenburg Correctional Center 264 (7)
Department of Corrections Totals 11,572 23
EMPLOYMENT LEVEL MONITORING REPORTFY 2005 AVERAGE (All Funds)
(Authorized Position Level = 12,602.50)
85