Embed Size (px)
Citation preview
Management Discussion and Analysis Half-year ended June 30, 2012
0
d-hire
Management Discussion and Analysis of the financial position and results of operations Half-year ended June 30, 2012
Management Discussion and Analysis Half-year ended June 30, 2012
1
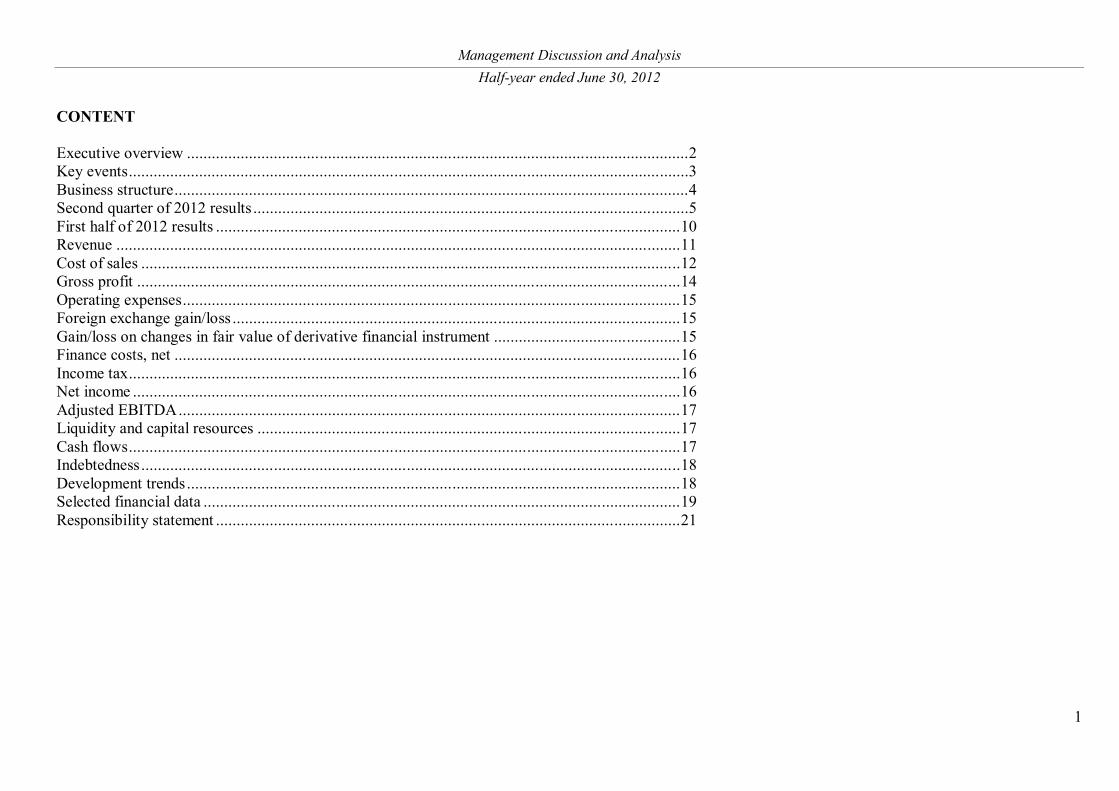
CONTENT Executive overview .........................................................................................................................2 Key events .......................................................................................................................................3 Business structure ............................................................................................................................4 Second quarter of 2012 results .........................................................................................................5 First half of 2012 results ................................................................................................................ 10 Revenue ........................................................................................................................................ 11 Cost of sales .................................................................................................................................. 12 Gross profit ................................................................................................................................... 14 Operating expenses ........................................................................................................................ 15 Foreign exchange gain/loss ............................................................................................................ 15 Gain/loss on changes in fair value of derivative financial instrument ............................................. 15 Finance costs, net .......................................................................................................................... 16 Income tax ..................................................................................................................................... 16 Net income .................................................................................................................................... 16 Adjusted EBITDA ......................................................................................................................... 17 Liquidity and capital resources ...................................................................................................... 17 Cash flows ..................................................................................................................................... 17 Indebtedness .................................................................................................................................. 18 Development trends ....................................................................................................................... 18 Selected financial data ................................................................................................................... 19 Responsibility statement ................................................................................................................ 21
Management Discussion and Analysis Half-year ended June 30, 2012
2
The following review of our financial position and results of operations is based on, and should be read in conjunction with, our unaudited interim condensed consolidated financial statements for the first half of 2012.
Certain information contained in this section, including information with respect to our plans and strategy, includes forward-looking statements and inherently involves risks and uncertainties. In assessing this report, various risk factors must be considered, which means that our actual results may differ significantly from those presented in these forward-looking statements.
Rounding
Certain monetary amounts, percentages and other figures included in this report are subject to rounding adjustments. On occasion, therefore, amounts shown in tables may not be the arithmetic accumulation of the figures that precede them, and figures expressed as percentages in the text and in tables may not total 100%.
Executive overview
We are one of the leading global manufacturers and suppliers of tubular products for the energy industry, as well as other industrial applications. We are also the leading manufacturer and supplier of steel pipes for the energy industry in Russia. We focus our efforts on high-margin oil country tubular goods (OCTG), which account for the majority of our sales. We sell our products worldwide to major oil and gas, automotive, engineering, and power generation companies, and provide oilfield services. Our operations are geographically diversified with manufacturing facilities in Russia, the United States, Romania and Kazakhstan, and research centers in Russia and the United States. Our global market presence is supported by an extensive distribution network. In the first half of 2012, we delivered 55% of our tubular products to our customers located in Russia and 27% in North America.
According to our estimates, as compared to the first half of 2011, the Russian pipe market declined by 22% as a result of lower pipe consumption, primarily welded large diameter (LD) pipe. At the same time, our sales volumes decreased to a lesser extent and our estimated share in the Russian pipe market improved to 26% in the first half of 2012 versus 25% in the first half of 2011.
We are the largest exporter of pipes in Russia. Exports of pipes produced in Russia accounted for 18% of our total sales volumes in the first half of 2012 as compared to 12% in the same period of 2011. In the first half of 2012, we sold 2,106 thousand tonnes of steel pipes including 1,272 thousand tonnes of seamless pipe. Sales of seamless and welded OCTG reached 905 thousand tonnes, a 14% increase year-on-year, whereas sales of welded LD pipe dropped by 53% to 180 thousand tonnes as a result of completion of major pipeline projects in the second half of 2011 and the postponement of new projects by our customers. In the first half of 2012, our total consolidated revenue decreased by 3%, to $3,439 million from $3,547 million in the same period last year. Adjusted EBITDA1 decreased to $567 million as compared to $625 million in the first half of 2011. Adjusted EBITDA margin was 16% as compared to 18% in the first half of 2011.
As compared to the first quarter of 2012, our sales volumes were up 10% in the second quarter of 2012, while revenue increased by 7% from $1,659 million to $1,781 million, growing at a slower rate than volumes mostly as a result of the negative effect of currency translation2. Adjusted EBITDA was up 5% from $277 million in the first quarter 2012 to
1 Adjusted EBITDA - See “Selected financial data”. 2 For the purposes of this management discussion and analysis, the effect of currency translation on revenue/costs and income/expense illustrates an influence of different rates used for translation of such revenue/costs or incomes/expenses from functional to presentation currency in different reporting periods.
Management Discussion and Analysis Half-year ended June 30, 2012
3
$290 million in the second quarter 2012, while adjusted EBITDA margin slightly decreased.
Key events
TMK has developed and introduced vacuum insulated tubing (VIT), a technologically unique product offered by a limited number of producers globally. In January 2012, we delivered the first shipment of VIT to Gazprom for use in the Bovanenkovo gas condensate field on the Yamal Peninsula. Other major Russian oil and gas companies have also expressed interest in VIT. In 2012, we plan to manufacture and deliver approximately 9,000 running meters of this high-tech product. In February 2012, TMK PF ET premium connections successfully passed qualification tests in accordance with ISO 13679 CAL IV standard for 100% gas tightness under the application of total compression force. The tests were conducted at the Oil States Industries international testing centre in Aberdeen, UK. TMK PF ET passed tests designed to ensure gas-tightness when subject to internal and external pressure, tension and compression forces. Completion of this certification serves as confirmation of the world quality level of our threads and allows us to enter the league of the leading global suppliers of tubular products for complex drilling and hydrocarbon production both onshore and offshore.
In March 2012, we started production of 13-Chrome steel casing pipe. The pipes, manufactured for Gazprom, are threaded with TMK GF premium connections. 13-Chrome steel pipes have unique characteristics that allow using them in various aggressive environments. TMK GF premium connections are used in directional wells and ensure a high level of gas-tightness in the pipe string under difficult conditions like bending, compression, tension and high torque.
In March 2012, TMK IPSCO started development of a new pipe threading and service facility in Edmonton, Canada. The state-of-the-art production
equipment at the facility will thread a full range of ULTRA™ Premium connections. In addition, it will offer accessories, services and repairs of pipes. We plan to start operations there late 2012. This facility will expand TMK’s local presence and enable us to better serve our customers in North America.
In April 2012, we started pilot production of long cold-deformed pipe for use in the nuclear industry, machine building and energy sectors. The new production facility at our Sinarsky Pipe Plant has allowed us to manufacture pipe up to 24 meters long which has never been produced in Russia before. The launch of new pipe production will strengthen our position within this pipe segment.
In April and May 2012, we shipped casing with ULTRA™ FJ Premium connections to Lukoil and Gazprom. This premium product was patented by our American division and manufactured at our Orsky Machine Building Plant. The shipments of our premium product, new for the Russian market, confirm our commitment to offer top-quality innovative products to our strategic partners.
In June 2012, the annual shareholders’ meeting approved a final dividend for 2011 in the amount of 2,531 million Russian roubles ($76 million at the exchange rate on the date of approval) or 2.70 Russian roubles ($0.08) per ordinary share, of which 201 million Russian roubles ($6 million at the exchange rate on the date of approval) related to treasury shares in possession of the Group.
In July 2012, TMK and Gazprom signed agreements on technology cooperation for 2012-2015. The Sci-Tech cooperation programme concentrates on developing and delivering substitutes for imported product and new types of tubular products with high performance characteristics that would meet the advanced needs of the gas company. In July 2012, Orsky Machine Building Plant of the TMK’s Oilfield Services underwent an audit for compliance of its quality management system that
Management Discussion and Analysis Half-year ended June 30, 2012
4
covers both the plant and its OCTG production with the American Petroleum Institute (API) standard. This certification will enhance the Company's capabilities in securing new packaged orders.
Business structure
Our operating segments reflect the Group’s management structure and the way financial information is regularly reviewed. For management purposes, the Group is organised into business divisions based on geographical location and has three reporting segments:
Russian division: manufacturing facilities located in the Russian Federation and Kazakhstan, and oilfield service companies and trading companies in Russia, Kazakhstan, Switzerland, the United Arab Emirates and South Africa. The Russian division is engaged in the production and supply of seamless and welded pipe, premium products and the provision of related services to oil and gas companies;
American division: manufacturing facilities and trading companies located in North America. The American division is engaged in the production and supply of seamless and welded pipe and premium products, including ULTRA™ connections;
European division: manufacturing facilities located in Romania and trading companies located in Italy and Germany. The European division is engaged in the production and supply of seamless pipe and steel billets.
Management Discussion and Analysis Half-year ended June 30, 2012
5
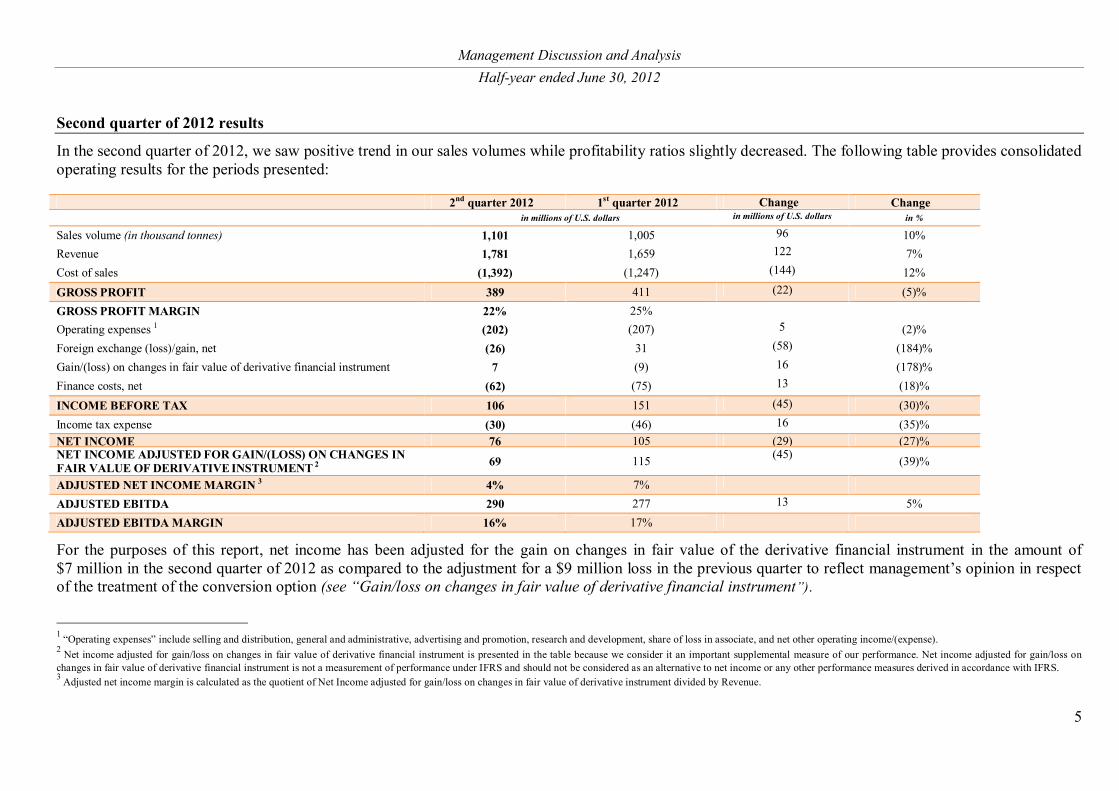
Second quarter of 2012 results
In the second quarter of 2012, we saw positive trend in our sales volumes while profitability ratios slightly decreased. The following table provides consolidated operating results for the periods presented:
2nd quarter 2012 1st quarter 2012 Change Change in millions of U.S. dollars in millions of U.S. dollars in %
Sales volume (in thousand tonnes) 1,101 1,005 96 10% Revenue 1,781 1,659 122 7% Cost of sales (1,392) (1,247) (144) 12% GROSS PROFIT 389 411 (22) (5)% GROSS PROFIT MARGIN 22% 25% Operating expenses 1 (202) (207) 5 (2)% Foreign exchange (loss)/gain, net (26) 31 (58) (184)% Gain/(loss) on changes in fair value of derivative financial instrument 7 (9) 16 (178)% Finance costs, net (62) (75) 13 (18)% INCOME BEFORE TAX 106 151 (45) (30)% Income tax expense (30) (46) 16 (35)% NET INCOME 76 105 (29) (27)% NET INCOME ADJUSTED FOR GAIN/(LOSS) ON CHANGES IN FAIR VALUE OF DERIVATIVE INSTRUMENT 2 69 115 (45) (39)%
ADJUSTED NET INCOME MARGIN 3 4% 7% ADJUSTED EBITDA 290 277 13 5% ADJUSTED EBITDA MARGIN 16% 17%
For the purposes of this report, net income has been adjusted for the gain on changes in fair value of the derivative financial instrument in the amount of $7 million in the second quarter of 2012 as compared to the adjustment for a $9 million loss in the previous quarter to reflect management’s opinion in respect of the treatment of the conversion option (see “Gain/loss on changes in fair value of derivative financial instrument”).
1 “Operating expenses” include selling and distribution, general and administrative, advertising and promotion, research and development, share of loss in associate, and net other operating income/(expense). 2 Net income adjusted for gain/loss on changes in fair value of derivative financial instrument is presented in the table because we consider it an important supplemental measure of our performance. Net income adjusted for gain/loss on changes in fair value of derivative financial instrument is not a measurement of performance under IFRS and should not be considered as an alternative to net income or any other performance measures derived in accordance with IFRS. 3 Adjusted net income margin is calculated as the quotient of Net Income adjusted for gain/loss on changes in fair value of derivative instrument divided by Revenue.
Management Discussion and Analysis Half-year ended June 30, 2012
6
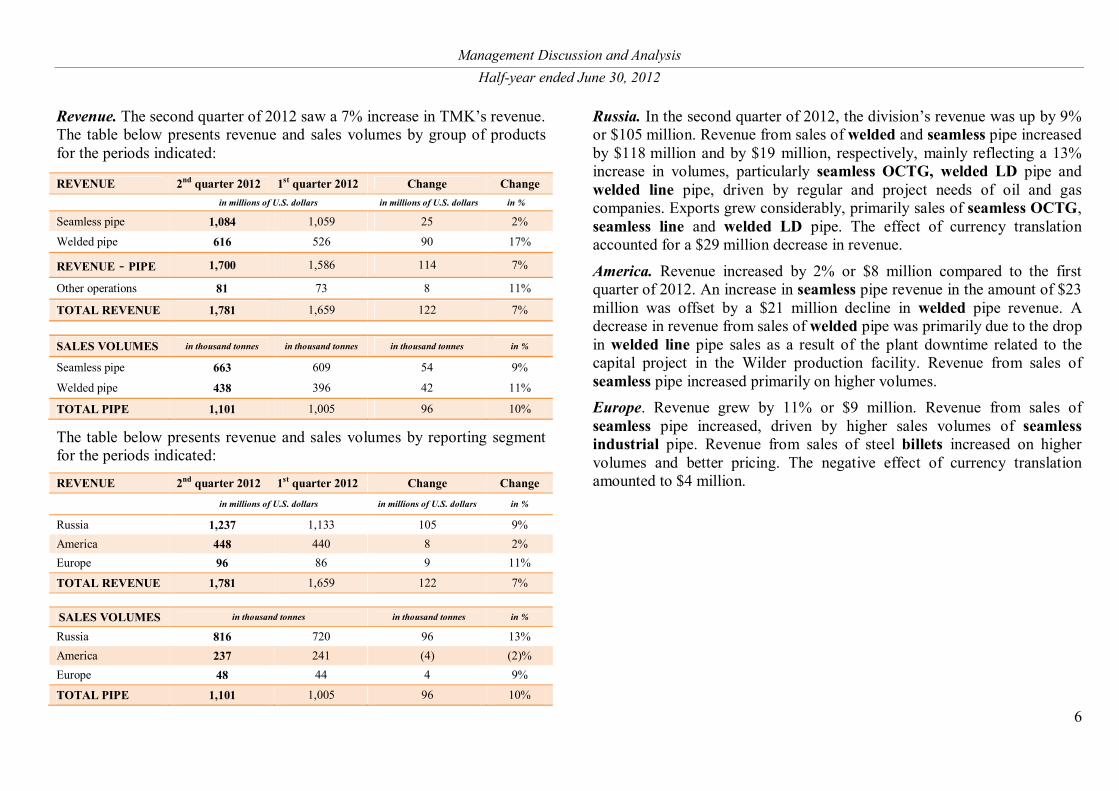
Revenue. The second quarter of 2012 saw a 7% increase in TMK’s revenue. The table below presents revenue and sales volumes by group of products for the periods indicated:
The table below presents revenue and sales volumes by reporting segment for the periods indicated:
REVENUE 2nd quarter 2012 1st quarter 2012 Change Change in millions of U.S. dollars in millions of U.S. dollars in %
Russia 1,237 1,133 105 9% America 448 440 8 2% Europe 96 86 9 11%
TOTAL REVENUE 1,781 1,659 122 7%
SALES VOLUMES in thousand tonnes in thousand tonnes in %
Russia 816 720 96 13% America 237 241 (4) (2)% Europe 48 44 4 9%
TOTAL PIPE 1,101 1,005 96 10%
Russia. In the second quarter of 2012, the division’s revenue was up by 9% or $105 million. Revenue from sales of welded and seamless pipe increased by $118 million and by $19 million, respectively, mainly reflecting a 13% increase in volumes, particularly seamless OCTG, welded LD pipe and welded line pipe, driven by regular and project needs of oil and gas companies. Exports grew considerably, primarily sales of seamless OCTG, seamless line and welded LD pipe. The effect of currency translation accounted for a $29 million decrease in revenue.
America. Revenue increased by 2% or $8 million compared to the first quarter of 2012. An increase in seamless pipe revenue in the amount of $23 million was offset by a $21 million decline in welded pipe revenue. A decrease in revenue from sales of welded pipe was primarily due to the drop in welded line pipe sales as a result of the plant downtime related to the capital project in the Wilder production facility. Revenue from sales of seamless pipe increased primarily on higher volumes. Europe. Revenue grew by 11% or $9 million. Revenue from sales of seamless pipe increased, driven by higher sales volumes of seamless industrial pipe. Revenue from sales of steel billets increased on higher volumes and better pricing. The negative effect of currency translation amounted to $4 million.
REVENUE 2nd quarter 2012 1st quarter 2012 Change Change in millions of U.S. dollars in millions of U.S. dollars in %
Seamless pipe 1,084 1,059 25 2%
Welded pipe 616 526 90 17%
REVENUE - PIPE 1,700 1,586 114 7%
Other operations 81 73 8 11%
TOTAL REVENUE 1,781 1,659 122 7%
SALES VOLUMES in thousand tonnes in thousand tonnes in thousand tonnes in %
Seamless pipe 663 609 54 9%
Welded pipe 438 396 42 11%
TOTAL PIPE 1,101 1,005 96 10%
Management Discussion and Analysis Half-year ended June 30, 2012
7
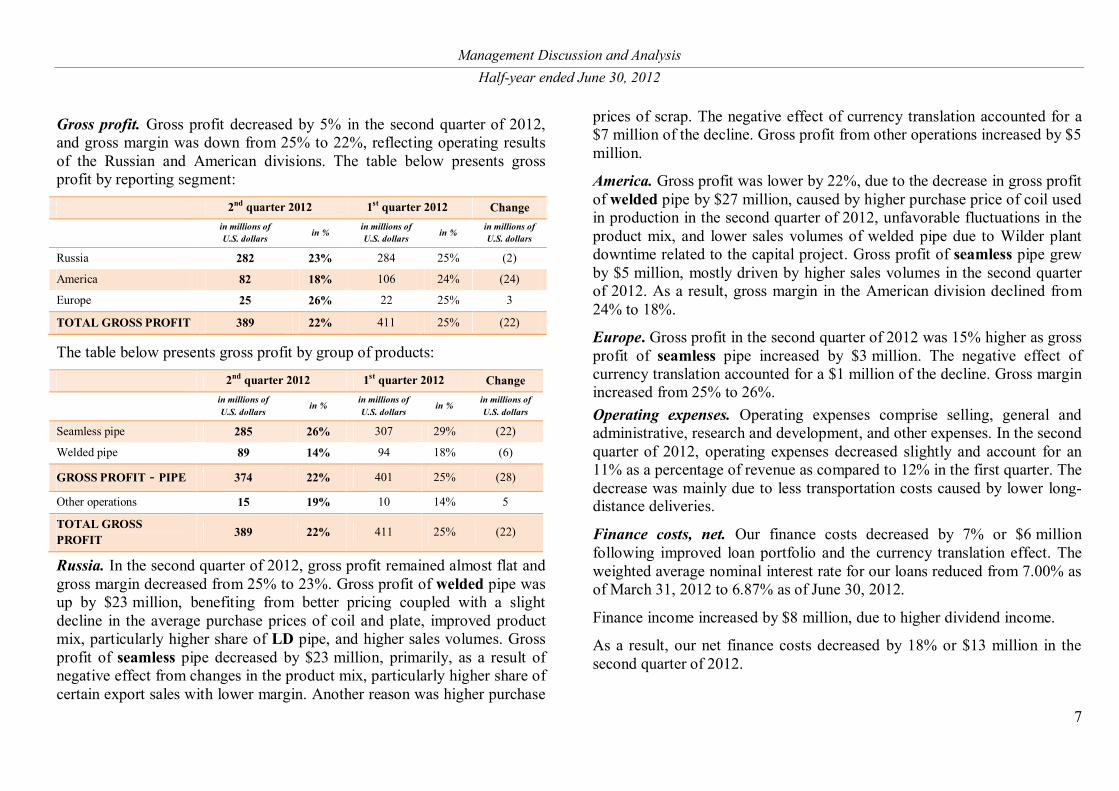
Gross profit. Gross profit decreased by 5% in the second quarter of 2012, and gross margin was down from 25% to 22%, reflecting operating results of the Russian and American divisions. The table below presents gross profit by reporting segment:
2nd quarter 2012 1st quarter 2012 Change
in millions of U.S. dollars in % in millions of
U.S. dollars in % in millions of U.S. dollars
Russia 282 23% 284 25% (2)
America 82 18% 106 24% (24)
Europe 25 26% 22 25% 3
TOTAL GROSS PROFIT 389 22% 411 25% (22)
The table below presents gross profit by group of products:
2nd quarter 2012 1st quarter 2012 Change
in millions of U.S. dollars
in % in millions of U.S. dollars
in % in millions of U.S. dollars
Seamless pipe 285 26% 307 29% (22)
Welded pipe 89 14% 94 18% (6)
GROSS PROFIT - PIPE 374 22% 401 25% (28)
Other operations 15 19% 10 14% 5
TOTAL GROSS PROFIT 389 22% 411 25% (22)
Russia. In the second quarter of 2012, gross profit remained almost flat and gross margin decreased from 25% to 23%. Gross profit of welded pipe was up by $23 million, benefiting from better pricing coupled with a slight decline in the average purchase prices of coil and plate, improved product mix, particularly higher share of LD pipe, and higher sales volumes. Gross profit of seamless pipe decreased by $23 million, primarily, as a result of negative effect from changes in the product mix, particularly higher share of certain export sales with lower margin. Another reason was higher purchase
prices of scrap. The negative effect of currency translation accounted for a $7 million of the decline. Gross profit from other operations increased by $5 million.
America. Gross profit was lower by 22%, due to the decrease in gross profit of welded pipe by $27 million, caused by higher purchase price of coil used in production in the second quarter of 2012, unfavorable fluctuations in the product mix, and lower sales volumes of welded pipe due to Wilder plant downtime related to the capital project. Gross profit of seamless pipe grew by $5 million, mostly driven by higher sales volumes in the second quarter of 2012. As a result, gross margin in the American division declined from 24% to 18%.
Europe. Gross profit in the second quarter of 2012 was 15% higher as gross profit of seamless pipe increased by $3 million. The negative effect of currency translation accounted for a $1 million of the decline. Gross margin increased from 25% to 26%. Operating expenses. Operating expenses comprise selling, general and administrative, research and development, and other expenses. In the second quarter of 2012, operating expenses decreased slightly and account for an 11% as a percentage of revenue as compared to 12% in the first quarter. The decrease was mainly due to less transportation costs caused by lower long-distance deliveries.
Finance costs, net. Our finance costs decreased by 7% or $6 million following improved loan portfolio and the currency translation effect. The weighted average nominal interest rate for our loans reduced from 7.00% as of March 31, 2012 to 6.87% as of June 30, 2012.
Finance income increased by $8 million, due to higher dividend income.
As a result, our net finance costs decreased by 18% or $13 million in the second quarter of 2012.
Management Discussion and Analysis Half-year ended June 30, 2012
8
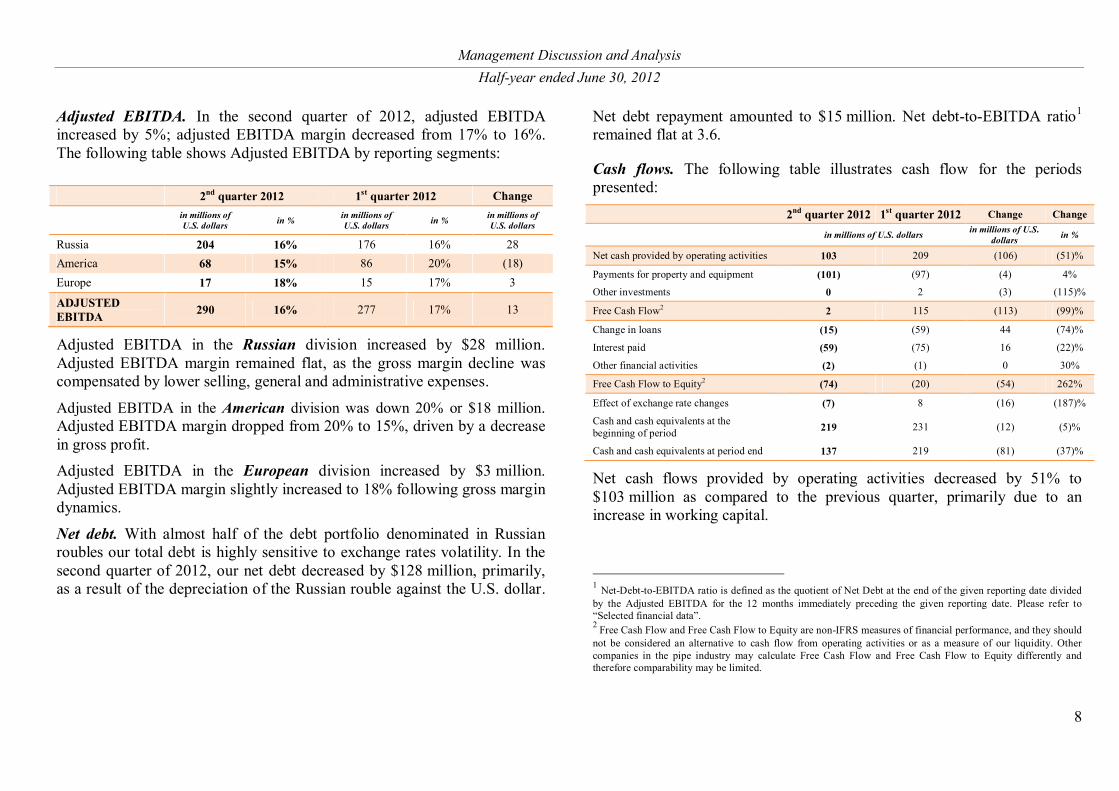
Adjusted EBITDA. In the second quarter of 2012, adjusted EBITDA increased by 5%; adjusted EBITDA margin decreased from 17% to 16%. The following table shows Adjusted EBITDA by reporting segments:
Adjusted EBITDA in the Russian division increased by $28 million. Adjusted EBITDA margin remained flat, as the gross margin decline was compensated by lower selling, general and administrative expenses.
Adjusted EBITDA in the American division was down 20% or $18 million. Adjusted EBITDA margin dropped from 20% to 15%, driven by a decrease in gross profit. Adjusted EBITDA in the European division increased by $3 million. Adjusted EBITDA margin slightly increased to 18% following gross margin dynamics.
Net debt. With almost half of the debt portfolio denominated in Russian roubles our total debt is highly sensitive to exchange rates volatility. In the second quarter of 2012, our net debt decreased by $128 million, primarily, as a result of the depreciation of the Russian rouble against the U.S. dollar.
Net debt repayment amounted to $15 million. Net debt-to-EBITDA ratio1 remained flat at 3.6.
Cash flows. The following table illustrates cash flow for the periods presented:
2nd quarter 2012 1st quarter 2012 Change Change
in millions of U.S. dollars in millions of U.S. dollars in %
Net cash provided by operating activities 103 209 (106) (51)%
Payments for property and equipment (101) (97) (4) 4%
Other investments 0 2 (3) (115)%
Free Cash Flow2 2 115 (113) (99)%
Change in loans (15) (59) 44 (74)%
Interest paid (59) (75) 16 (22)%
Other financial activities (2) (1) 0 30%
Free Cash Flow to Equity2 (74) (20) (54) 262%
Effect of exchange rate changes (7) 8 (16) (187)%
Cash and cash equivalents at the beginning of period 219 231 (12) (5)%
Cash and cash equivalents at period end 137 219 (81) (37)%
Net cash flows provided by operating activities decreased by 51% to $103 million as compared to the previous quarter, primarily due to an increase in working capital.
1 Net-Debt-to-EBITDA ratio is defined as the quotient of Net Debt at the end of the given reporting date divided by the Adjusted EBITDA for the 12 months immediately preceding the given reporting date. Please refer to “Selected financial data”. 2 Free Cash Flow and Free Cash Flow to Equity are non-IFRS measures of financial performance, and they should not be considered an alternative to cash flow from operating activities or as a measure of our liquidity. Other companies in the pipe industry may calculate Free Cash Flow and Free Cash Flow to Equity differently and therefore comparability may be limited.
2nd quarter 2012 1st quarter 2012 Change
in millions of U.S. dollars in % in millions of
U.S. dollars in % in millions of U.S. dollars
Russia 204 16% 176 16% 28 America 68 15% 86 20% (18) Europe 17 18% 15 17% 3
ADJUSTED EBITDA 290 16% 277 17% 13
Management Discussion and Analysis Half-year ended June 30, 2012
9
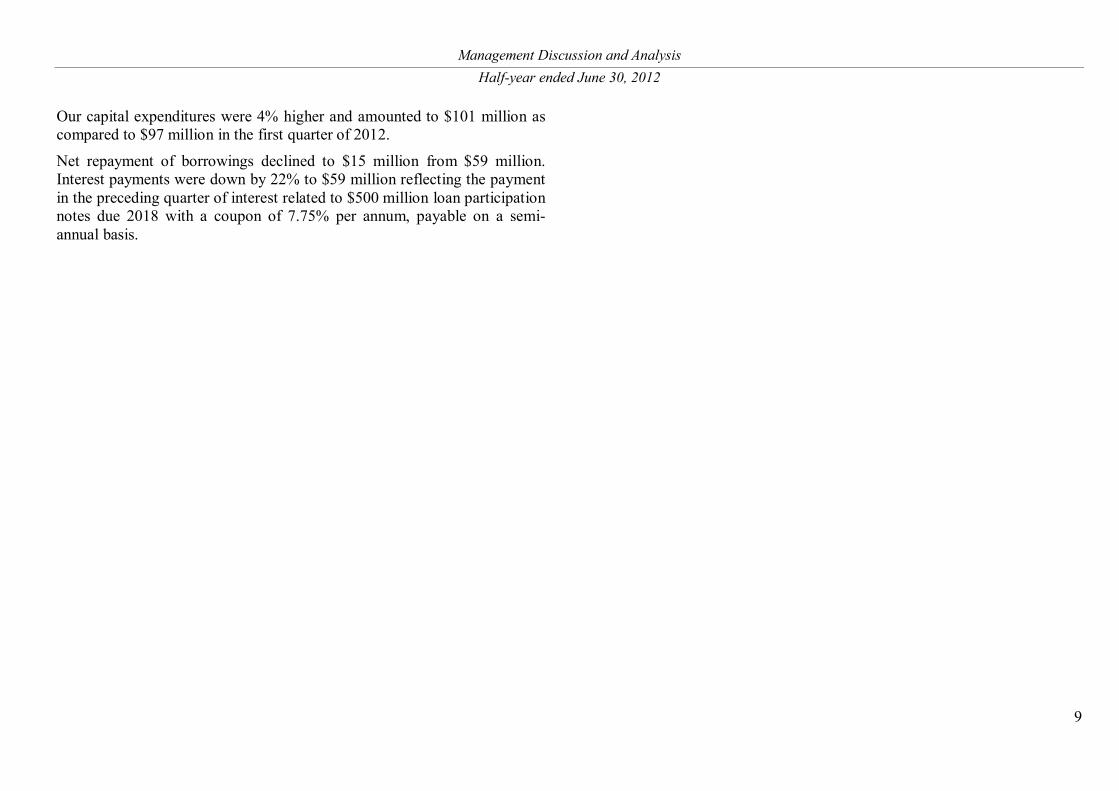
Our capital expenditures were 4% higher and amounted to $101 million as compared to $97 million in the first quarter of 2012.
Net repayment of borrowings declined to $15 million from $59 million. Interest payments were down by 22% to $59 million reflecting the payment in the preceding quarter of interest related to $500 million loan participation notes due 2018 with a coupon of 7.75% per annum, payable on a semi-annual basis.
Management Discussion and Analysis Half-year ended June 30, 2012
10
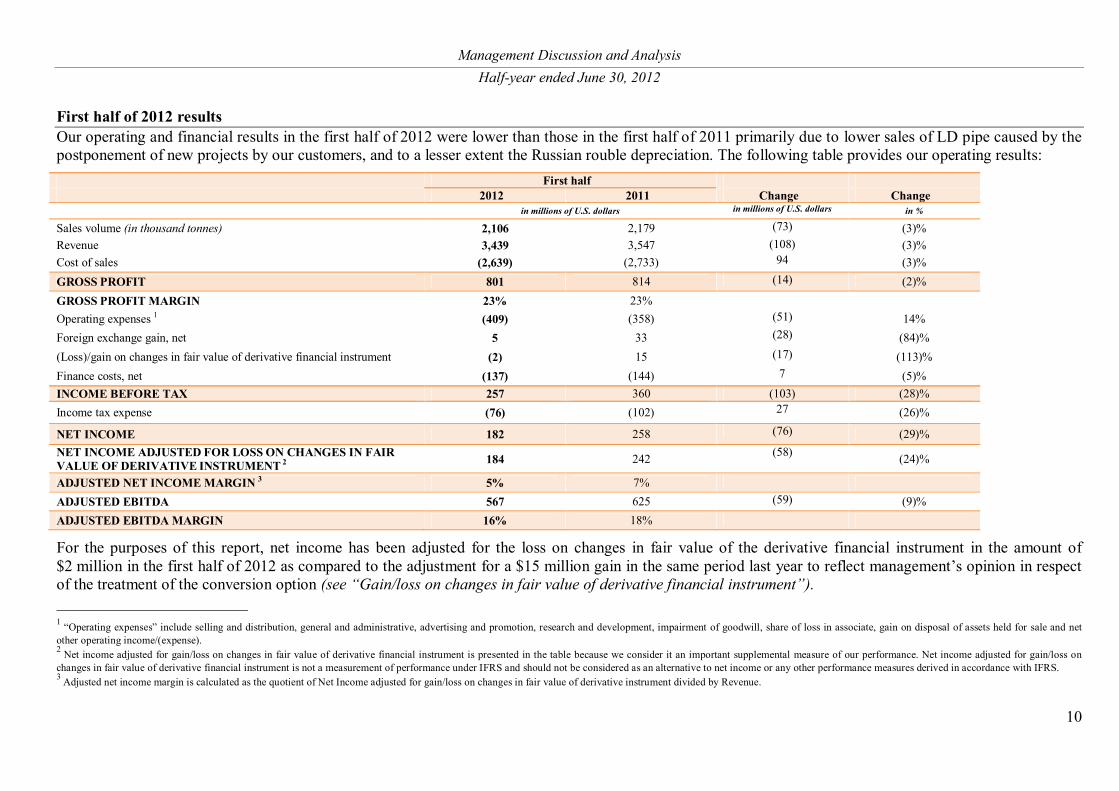
First half of 2012 results Our operating and financial results in the first half of 2012 were lower than those in the first half of 2011 primarily due to lower sales of LD pipe caused by the postponement of new projects by our customers, and to a lesser extent the Russian rouble depreciation. The following table provides our operating results:
First half 2012 2011 Change Change in millions of U.S. dollars in millions of U.S. dollars in %
Sales volume (in thousand tonnes) 2,106 2,179 (73) (3)% Revenue 3,439 3,547 (108) (3)% Cost of sales (2,639) (2,733) 94 (3)% GROSS PROFIT 801 814 (14) (2)% GROSS PROFIT MARGIN 23% 23% Operating expenses 1 (409) (358) (51) 14% Foreign exchange gain, net 5 33 (28) (84)% (Loss)/gain on changes in fair value of derivative financial instrument (2) 15 (17) (113)% Finance costs, net (137) (144) 7 (5)% INCOME BEFORE TAX 257 360 (103) (28)% Income tax expense (76) (102) 27 (26)%
NET INCOME 182 258 (76) (29)% NET INCOME ADJUSTED FOR LOSS ON CHANGES IN FAIR VALUE OF DERIVATIVE INSTRUMENT 2 184 242 (58) (24)%
ADJUSTED NET INCOME MARGIN 3 5% 7% ADJUSTED EBITDA 567 625 (59) (9)% ADJUSTED EBITDA MARGIN 16% 18%
For the purposes of this report, net income has been adjusted for the loss on changes in fair value of the derivative financial instrument in the amount of $2 million in the first half of 2012 as compared to the adjustment for a $15 million gain in the same period last year to reflect management’s opinion in respect of the treatment of the conversion option (see “Gain/loss on changes in fair value of derivative financial instrument”). 1 “Operating expenses” include selling and distribution, general and administrative, advertising and promotion, research and development, impairment of goodwill, share of loss in associate, gain on disposal of assets held for sale and net other operating income/(expense). 2 Net income adjusted for gain/loss on changes in fair value of derivative financial instrument is presented in the table because we consider it an important supplemental measure of our performance. Net income adjusted for gain/loss on changes in fair value of derivative financial instrument is not a measurement of performance under IFRS and should not be considered as an alternative to net income or any other performance measures derived in accordance with IFRS. 3 Adjusted net income margin is calculated as the quotient of Net Income adjusted for gain/loss on changes in fair value of derivative instrument divided by Revenue.
Management Discussion and Analysis Half-year ended June 30, 2012
11
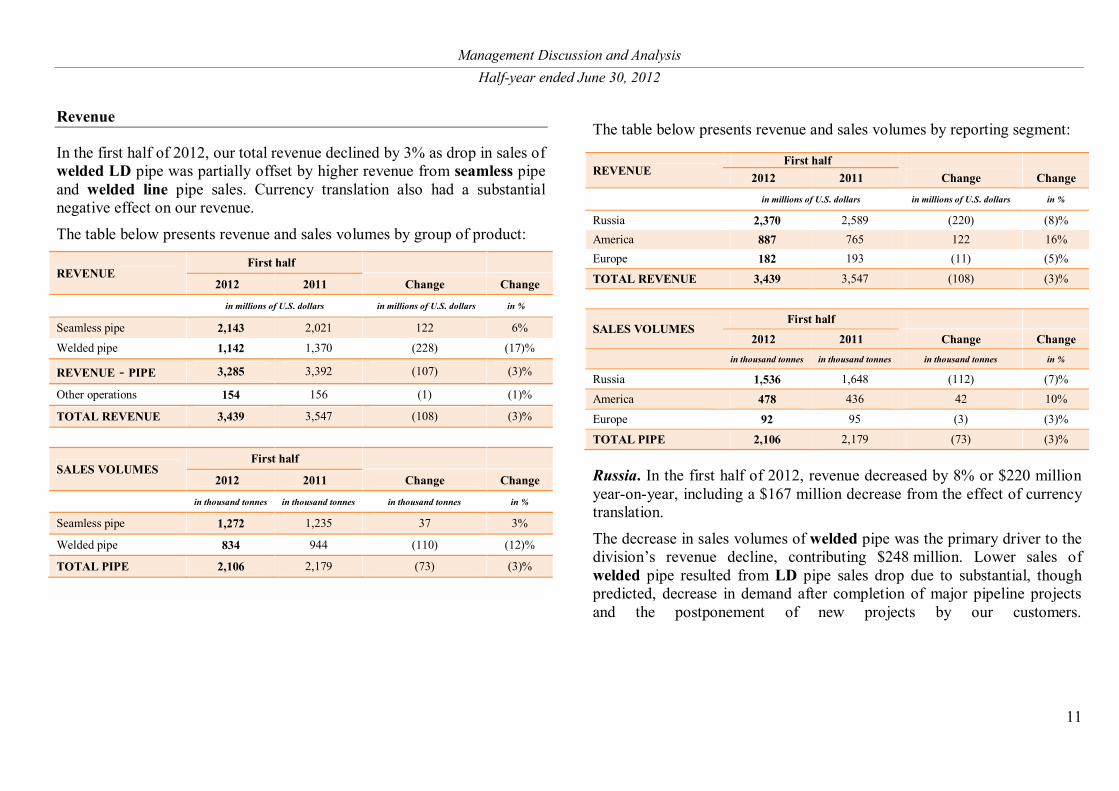
Revenue
In the first half of 2012, our total revenue declined by 3% as drop in sales of welded LD pipe was partially offset by higher revenue from seamless pipe and welded line pipe sales. Currency translation also had a substantial negative effect on our revenue.
The table below presents revenue and sales volumes by group of product:
REVENUE First half
2012 2011 Change Change
in millions of U.S. dollars in millions of U.S. dollars in %
Seamless pipe 2,143 2,021 122 6%
Welded pipe 1,142 1,370 (228) (17)%
REVENUE - PIPE 3,285 3,392 (107) (3)%
Other operations 154 156 (1) (1)%
TOTAL REVENUE 3,439 3,547 (108) (3)%
SALES VOLUMES First half
2012 2011 Change Change
in thousand tonnes in thousand tonnes in thousand tonnes in %
Seamless pipe 1,272 1,235 37 3%
Welded pipe 834 944 (110) (12)%
TOTAL PIPE 2,106 2,179 (73) (3)%
The table below presents revenue and sales volumes by reporting segment:
REVENUE First half
2012 2011 Change Change
in millions of U.S. dollars in millions of U.S. dollars in %
Russia 2,370 2,589 (220) (8)% America 887 765 122 16% Europe 182 193 (11) (5)%
TOTAL REVENUE 3,439 3,547 (108) (3)%
SALES VOLUMES First half
2012 2011 Change Change
in thousand tonnes in thousand tonnes in thousand tonnes in %
Russia 1,536 1,648 (112) (7)% America 478 436 42 10%
Europe 92 95 (3) (3)%
TOTAL PIPE 2,106 2,179 (73) (3)%
Russia. In the first half of 2012, revenue decreased by 8% or $220 million year-on-year, including a $167 million decrease from the effect of currency translation.
The decrease in sales volumes of welded pipe was the primary driver to the division’s revenue decline, contributing $248 million. Lower sales of welded pipe resulted from LD pipe sales drop due to substantial, though predicted, decrease in demand after completion of major pipeline projects and the postponement of new projects by our customers.
Management Discussion and Analysis Half-year ended June 30, 2012
12
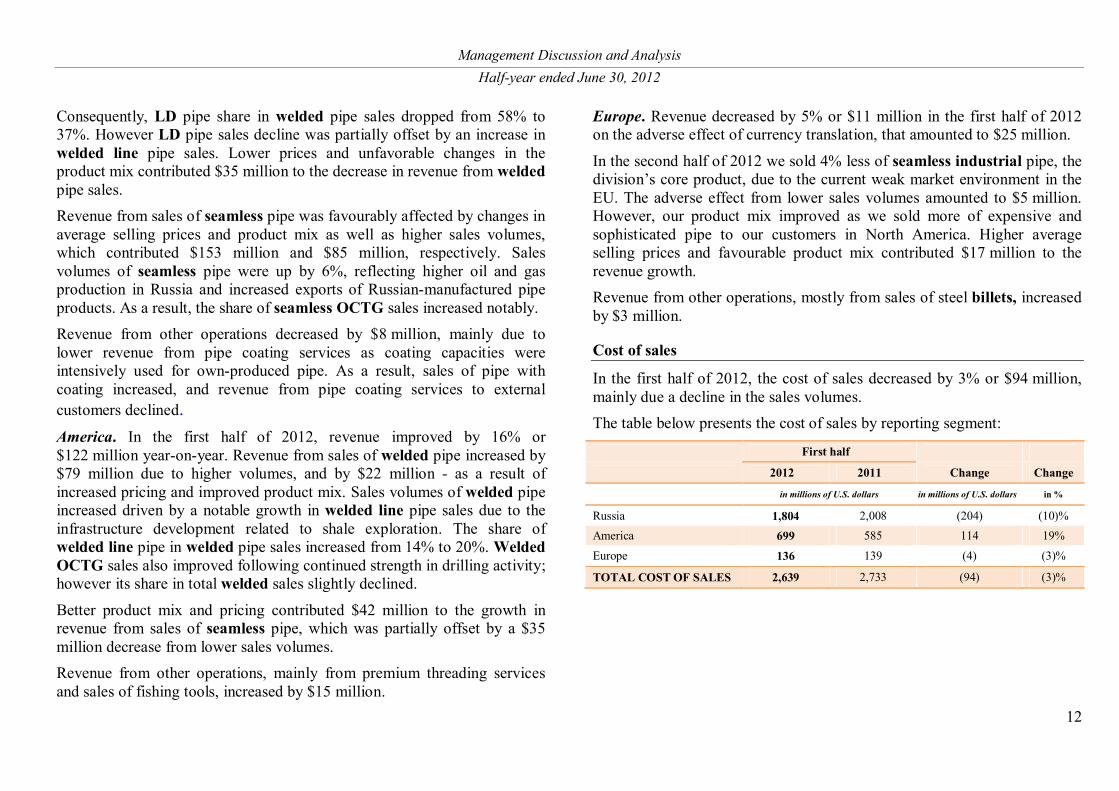
Consequently, LD pipe share in welded pipe sales dropped from 58% to 37%. However LD pipe sales decline was partially offset by an increase in welded line pipe sales. Lower prices and unfavorable changes in the product mix contributed $35 million to the decrease in revenue from welded pipe sales. Revenue from sales of seamless pipe was favourably affected by changes in average selling prices and product mix as well as higher sales volumes, which contributed $153 million and $85 million, respectively. Sales volumes of seamless pipe were up by 6%, reflecting higher oil and gas production in Russia and increased exports of Russian-manufactured pipe products. As a result, the share of seamless OCTG sales increased notably. Revenue from other operations decreased by $8 million, mainly due to lower revenue from pipe coating services as coating capacities were intensively used for own-produced pipe. As a result, sales of pipe with coating increased, and revenue from pipe coating services to external customers declined. America. In the first half of 2012, revenue improved by 16% or $122 million year-on-year. Revenue from sales of welded pipe increased by $79 million due to higher volumes, and by $22 million - as a result of increased pricing and improved product mix. Sales volumes of welded pipe increased driven by a notable growth in welded line pipe sales due to the infrastructure development related to shale exploration. The share of welded line pipe in welded pipe sales increased from 14% to 20%. Welded OCTG sales also improved following continued strength in drilling activity; however its share in total welded sales slightly declined.
Better product mix and pricing contributed $42 million to the growth in revenue from sales of seamless pipe, which was partially offset by a $35 million decrease from lower sales volumes. Revenue from other operations, mainly from premium threading services and sales of fishing tools, increased by $15 million.
Europe. Revenue decreased by 5% or $11 million in the first half of 2012 on the adverse effect of currency translation, that amounted to $25 million.
In the second half of 2012 we sold 4% less of seamless industrial pipe, the division’s core product, due to the current weak market environment in the EU. The adverse effect from lower sales volumes amounted to $5 million. However, our product mix improved as we sold more of expensive and sophisticated pipe to our customers in North America. Higher average selling prices and favourable product mix contributed $17 million to the revenue growth. Revenue from other operations, mostly from sales of steel billets, increased by $3 million.
Cost of sales
In the first half of 2012, the cost of sales decreased by 3% or $94 million, mainly due a decline in the sales volumes. The table below presents the cost of sales by reporting segment:
First half
2012 2011 Change Change
in millions of U.S. dollars in millions of U.S. dollars in %
Russia 1,804 2,008 (204) (10)% America 699 585 114 19%
Europe 136 139 (4) (3)%
TOTAL COST OF SALES 2,639 2,733 (94) (3)%
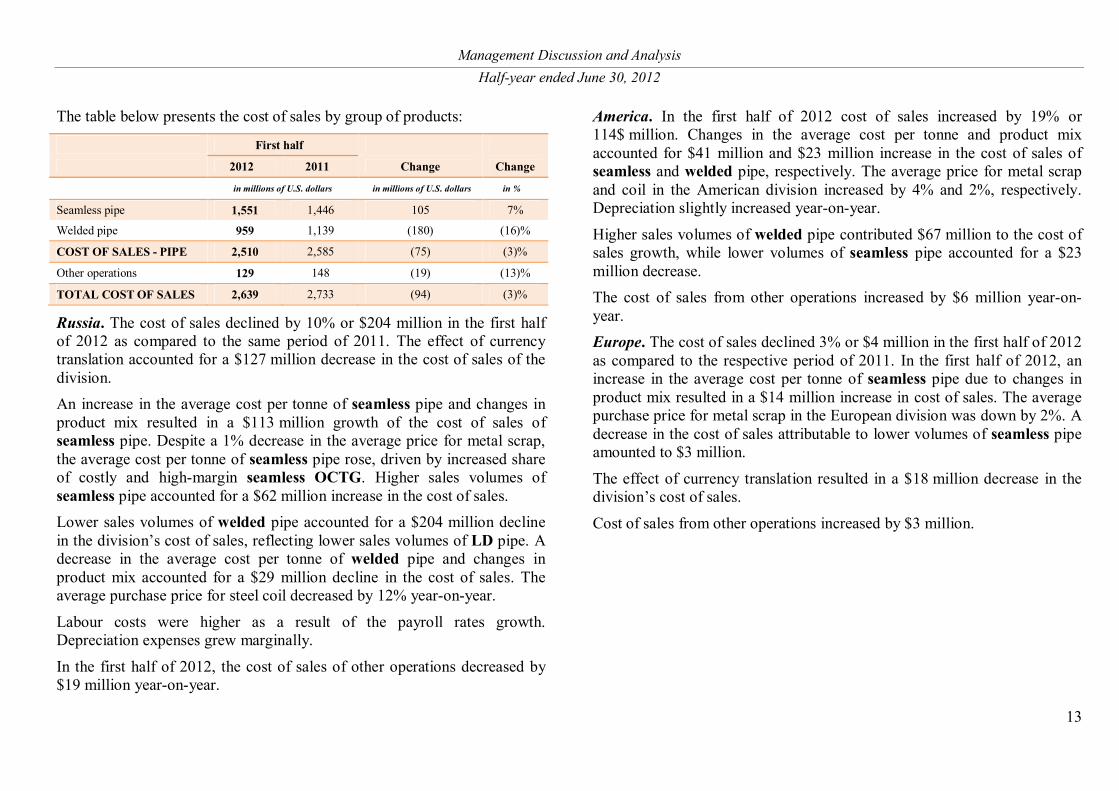
Management Discussion and Analysis Half-year ended June 30, 2012
13
The table below presents the cost of sales by group of products:
First half
2012 2011 Change Change
in millions of U.S. dollars in millions of U.S. dollars in %
Seamless pipe 1,551 1,446 105 7%
Welded pipe 959 1,139 (180) (16)%
COST OF SALES - PIPE 2,510 2,585 (75) (3)%
Other operations 129 148 (19) (13)%
TOTAL COST OF SALES 2,639 2,733 (94) (3)%
Russia. The cost of sales declined by 10% or $204 million in the first half of 2012 as compared to the same period of 2011. The effect of currency translation accounted for a $127 million decrease in the cost of sales of the division. An increase in the average cost per tonne of seamless pipe and changes in product mix resulted in a $113 million growth of the cost of sales of seamless pipe. Despite a 1% decrease in the average price for metal scrap, the average cost per tonne of seamless pipe rose, driven by increased share of costly and high-margin seamless OCTG. Higher sales volumes of seamless pipe accounted for a $62 million increase in the cost of sales. Lower sales volumes of welded pipe accounted for a $204 million decline in the division’s cost of sales, reflecting lower sales volumes of LD pipe. A decrease in the average cost per tonne of welded pipe and changes in product mix accounted for a $29 million decline in the cost of sales. The average purchase price for steel coil decreased by 12% year-on-year.
Labour costs were higher as a result of the payroll rates growth. Depreciation expenses grew marginally.
In the first half of 2012, the cost of sales of other operations decreased by $19 million year-on-year.
America. In the first half of 2012 cost of sales increased by 19% or 114$ million. Changes in the average cost per tonne and product mix accounted for $41 million and $23 million increase in the cost of sales of seamless and welded pipe, respectively. The average price for metal scrap and coil in the American division increased by 4% and 2%, respectively. Depreciation slightly increased year-on-year.
Higher sales volumes of welded pipe contributed $67 million to the cost of sales growth, while lower volumes of seamless pipe accounted for a $23 million decrease. The cost of sales from other operations increased by $6 million year-on-year. Europe. The cost of sales declined 3% or $4 million in the first half of 2012 as compared to the respective period of 2011. In the first half of 2012, an increase in the average cost per tonne of seamless pipe due to changes in product mix resulted in a $14 million increase in cost of sales. The average purchase price for metal scrap in the European division was down by 2%. A decrease in the cost of sales attributable to lower volumes of seamless pipe amounted to $3 million.
The effect of currency translation resulted in a $18 million decrease in the division’s cost of sales.
Cost of sales from other operations increased by $3 million.
Management Discussion and Analysis Half-year ended June 30, 2012
14
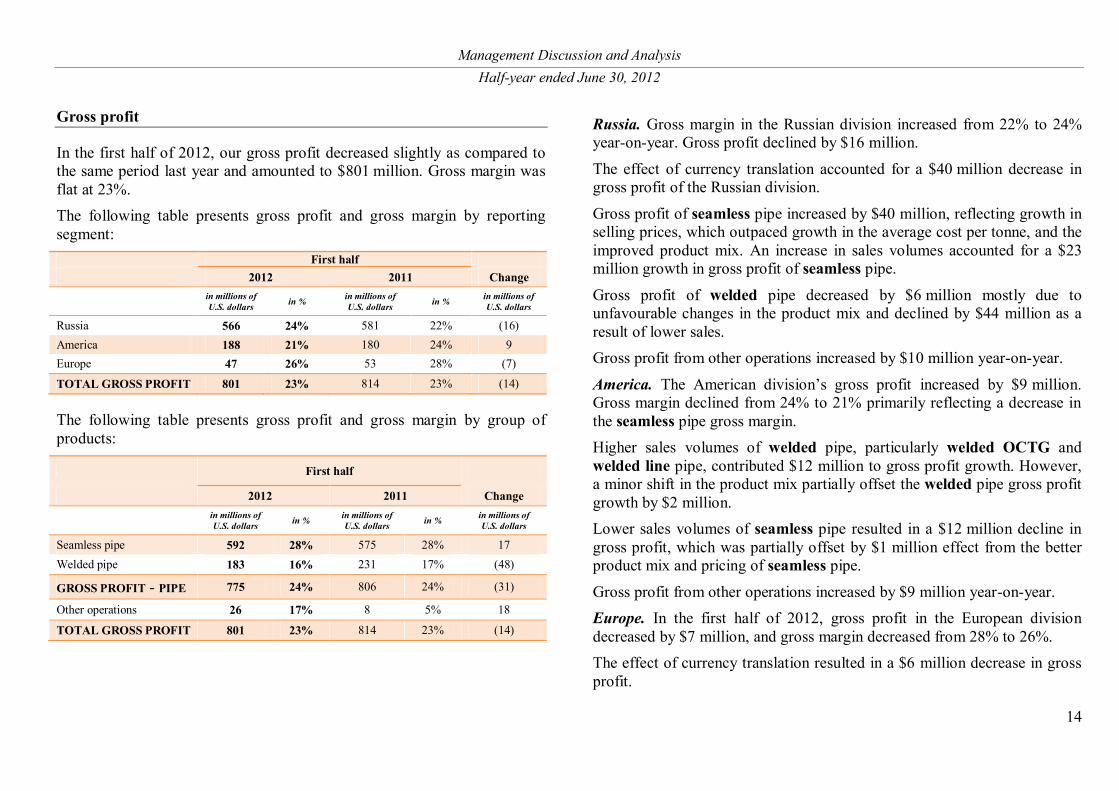
Gross profit
In the first half of 2012, our gross profit decreased slightly as compared to the same period last year and amounted to $801 million. Gross margin was flat at 23%. The following table presents gross profit and gross margin by reporting segment:
First half 2012 2011 Change
in millions of U.S. dollars in % in millions of
U.S. dollars in % in millions of U.S. dollars
Russia 566 24% 581 22% (16) America 188 21% 180 24% 9 Europe 47 26% 53 28% (7)
TOTAL GROSS PROFIT 801 23% 814 23% (14)
The following table presents gross profit and gross margin by group of products:
First half
2012 2011 Change
in millions of U.S. dollars in % in millions of
U.S. dollars in % in millions of U.S. dollars
Seamless pipe 592 28% 575 28% 17 Welded pipe 183 16% 231 17% (48)
GROSS PROFIT - PIPE 775 24% 806 24% (31)
Other operations 26 17% 8 5% 18
TOTAL GROSS PROFIT 801 23% 814 23% (14)
Russia. Gross margin in the Russian division increased from 22% to 24% year-on-year. Gross profit declined by $16 million.
The effect of currency translation accounted for a $40 million decrease in gross profit of the Russian division.
Gross profit of seamless pipe increased by $40 million, reflecting growth in selling prices, which outpaced growth in the average cost per tonne, and the improved product mix. An increase in sales volumes accounted for a $23 million growth in gross profit of seamless pipe.
Gross profit of welded pipe decreased by $6 million mostly due to unfavourable changes in the product mix and declined by $44 million as a result of lower sales. Gross profit from other operations increased by $10 million year-on-year.
America. The American division’s gross profit increased by $9 million. Gross margin declined from 24% to 21% primarily reflecting a decrease in the seamless pipe gross margin. Higher sales volumes of welded pipe, particularly welded OCTG and welded line pipe, contributed $12 million to gross profit growth. However, a minor shift in the product mix partially offset the welded pipe gross profit growth by $2 million. Lower sales volumes of seamless pipe resulted in a $12 million decline in gross profit, which was partially offset by $1 million effect from the better product mix and pricing of seamless pipe.
Gross profit from other operations increased by $9 million year-on-year. Europe. In the first half of 2012, gross profit in the European division decreased by $7 million, and gross margin decreased from 28% to 26%. The effect of currency translation resulted in a $6 million decrease in gross profit.
Management Discussion and Analysis Half-year ended June 30, 2012
15
A higher gross profit per tonne of seamless pipe, resulted from a better product mix, accounted for a $3 million increase in gross profit, while lower sales volumes resulted in a $1 million gross profit decrease. Gross profit from sales of steel billets remained flat year-on-year. Gross profit from other operations were lower by $2 million.
Operating expenses
Net operating expenses increased by $51 million year-on-year, and, expressed as a percentage of revenue, increased from 10% to 12%. The effect of currency translation accounted for a $23 million decrease in net operating expenses. The increase in net operating expenses was primarily due to a $39 million growth in freight costs, mainly in the Russian division as a result of increased transportation tariffs and higher share of sales with long distance delivery terms. Staff costs rose by $11 million. Depreciation and amortisation costs declined by $4 million on lower amortisation costs of an intangible asset, “Customer relationships”, in the American division; the asset is amortised using the reducing balance method to reflect the pattern of consumption of the related economic benefits. In the first half of 2011, we received a $19 million gain from sale of TMK Hydroenergy Power S.R.L., which reduced net operating expenses for the first half of 2011. No such gain was recognised in the first half of 2012.
Foreign exchange gain/loss
Our results are affected by fluctuations in foreign currency exchange rates. TMK is mainly exposed to fluctuations in the value of the U.S. dollar and the euro.
We recorded a foreign exchange gain in the amount of $5 million in the first half of 2012 as compared to $33 million in the same period of 2011. In addition, we recognised a foreign exchange loss from exchange rate fluctuations in the amount of $18 million (net of income tax) in the first half of 2012 as compared to a $77 million gain (net of income tax) in the same period of 2011 in the statement of other comprehensive income. The amount in the statement of comprehensive income represents the effective portion of foreign exchange gains or losses on our hedging instruments.
Gain/loss on changes in fair value of derivative financial instrument
In February 2010, we issued $413 million 5.25% convertible bonds due 2015, convertible into TMK's GDRs. The convertible bonds represent a combined financial instrument containing two components: (i) a bond liability and (ii) an embedded derivative representing a conversion option in foreign currency combined with an issuer call. In accordance with IFRS, a bond liability of $368 million (net of transaction costs of $9 million) was recognised and the liability under the embedded conversion option of $35 million at the initial recognition date.
As of June 30, 2012, the bond liability and the liability under the embedded conversion option were $399 million and $5 million, respectively. As of December 31, 2011, the bond liability and the liability under the embedded conversion option were $386 million and $3 million respectively. As a result, we recognised a loss of $2 million on changes in fair value of the derivative financial instrument in the first half of 2012 as compared to a $15 million gain in the same period last year.
Management nevertheless believes that the IFRS accounting treatment of the conversion option of the bond does not reflect the expected outflow of resources under the conversion rights. The conversion option, whether exercised or expired, will not result in cash outflows. In the event of the bond not being converted, the liability under the conversion option will be

Management Discussion and Analysis Half-year ended June 30, 2012
16
recognised as a gain in our income statement. In the event of the exercise of the option, the liability will be transferred to equity (together with the carrying value of the converted bonds); no gain or loss will be recognised on the transaction. Additionally, the accounting treatment of the conversion option requires that changes in fair value of the embedded instrument be recognised in the income statement. The price and volatility of TMK’s GDRs have significant impact on fair value of the embedded derivative. In the event the GDRs perform well, the liability under the conversion option will increase and result in losses in the income statement. Changes in fair value may be material in comparison to our net income and may cause distortions in the income statement. As such, for the purposes of this report, in addition to net income as reflected in the consolidated income statement, it has been decided to present, in this report, an adjusted net income so that it does not reflect gain/loss on changes in fair value of the derivative financial instrument with respect to the embedded derivative component of the convertible bond. The adjusted net income is an alternative performance measure that is not reflected in our consolidated financial statements and has not been audited or reviewed in accordance with ISA.
Finance costs, net
In the first half of 2012, our finance costs decreased by 7% or $10 million, following the improved structure of our loan portfolio and the effect of currency translation. Weighted average nominal interest rate declined to 6.87% as of June 30, 2012 from 7.33% as of June 30, 2011.
Finance income decreased by 20% or $3 million year-on-year, due to a decrease in dividend income.
As a result, net finance costs decreased by 5% or $7 million year-on-year.
Income tax
TMK, as a global company with production facilities and trading companies located in Russia, the CIS, the United States, and Europe, is exposed to local taxes charged to businesses. In the first half of 2011 and 2012, the following corporate income tax rates were in force in the countries where our production facilities are located: 20% in Russia, 35% (federal rate) in the United States and 16% in Romania.
In the first half of 2012, a pre-tax income of $257 million was reported as compared to $360 million in the same period of 2011, and an income tax expense of $76 million was recognised as compared to $102 million in the first half of 2011. Our effective income tax rate increased from 28% to 29%, mainly the result of higher share of profit before tax of the entities with higher than the Group average income tax rate in the first half of 2012 as compared to the first half of 2011.
Net income
As a result of the above-mentioned factors, net income in the amount of $182 million was recognised in the first half of 2012 as compared to $258 million in the first half of 2011. Net income adjusted for the loss on changes in fair value of the derivative financial instrument was $184 million in the first half of 2012 as compared to $242 million in the same period last year (See “Gain/loss on changes in fair value of derivative financial instrument” for the reasons for using this non-IFRS measure). Adjusted net income margin1 decreased from 7% to 5% year-on-year.
1 Adjusted net income margin is calculated as a quotient of Net Income adjusted for gain on changes in fair value of derivative instrument divided by Revenue.
Management Discussion and Analysis Half-year ended June 30, 2012
17
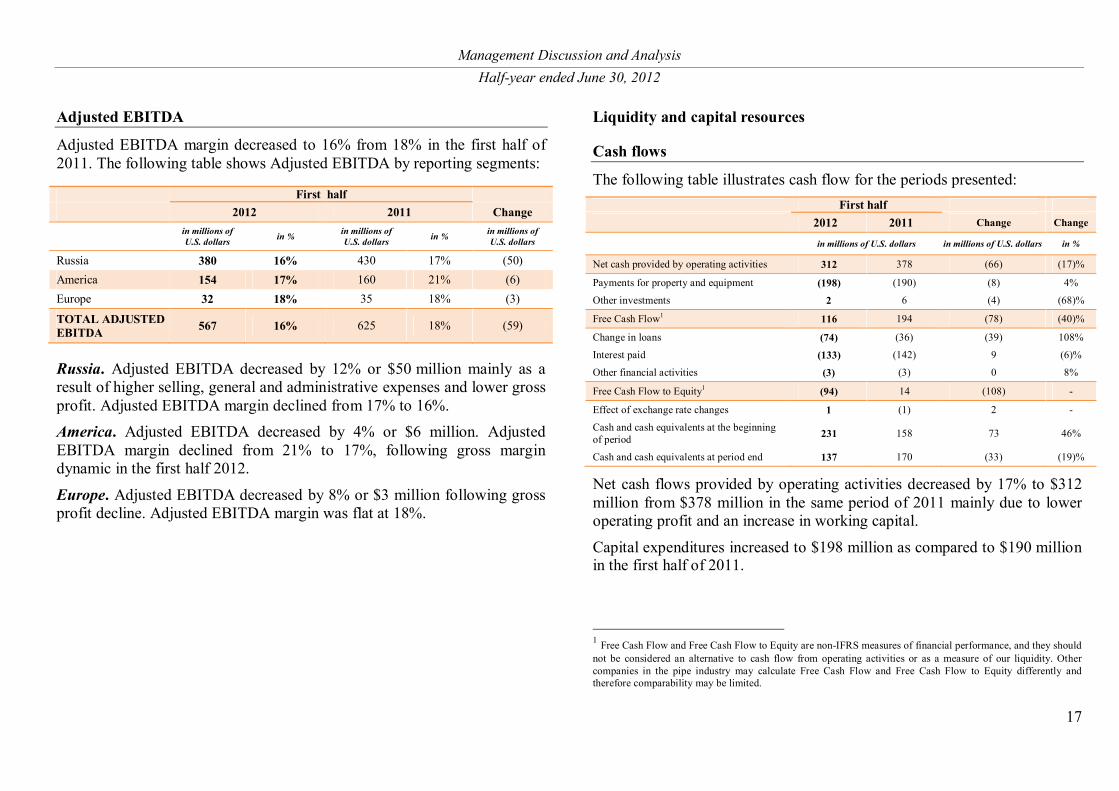
Adjusted EBITDA
Adjusted EBITDA margin decreased to 16% from 18% in the first half of 2011. The following table shows Adjusted EBITDA by reporting segments:
Russia. Adjusted EBITDA decreased by 12% or $50 million mainly as a result of higher selling, general and administrative expenses and lower gross profit. Adjusted EBITDA margin declined from 17% to 16%. America. Adjusted EBITDA decreased by 4% or $6 million. Adjusted EBITDA margin declined from 21% to 17%, following gross margin dynamic in the first half 2012.
Europe. Adjusted EBITDA decreased by 8% or $3 million following gross profit decline. Adjusted EBITDA margin was flat at 18%.
Liquidity and capital resources
Cash flows
The following table illustrates cash flow for the periods presented: First half
2012 2011 Change Change
in millions of U.S. dollars in millions of U.S. dollars in %
Net cash provided by operating activities 312 378 (66) (17)%
Payments for property and equipment (198) (190) (8) 4%
Other investments 2 6 (4) (68)%
Free Cash Flow1 116 194 (78) (40)%
Change in loans (74) (36) (39) 108%
Interest paid (133) (142) 9 (6)%
Other financial activities (3) (3) 0 8%
Free Cash Flow to Equity1 (94) 14 (108) -
Effect of exchange rate changes 1 (1) 2 -
Cash and cash equivalents at the beginning of period 231 158 73 46%
Cash and cash equivalents at period end 137 170 (33) (19)%
Net cash flows provided by operating activities decreased by 17% to $312 million from $378 million in the same period of 2011 mainly due to lower operating profit and an increase in working capital.
Capital expenditures increased to $198 million as compared to $190 million in the first half of 2011.
1 Free Cash Flow and Free Cash Flow to Equity are non-IFRS measures of financial performance, and they should not be considered an alternative to cash flow from operating activities or as a measure of our liquidity. Other companies in the pipe industry may calculate Free Cash Flow and Free Cash Flow to Equity differently and therefore comparability may be limited.
First half 2012 2011 Change
in millions of U.S. dollars in % in millions of
U.S. dollars in % in millions of U.S. dollars
Russia 380 16% 430 17% (50) America 154 17% 160 21% (6) Europe 32 18% 35 18% (3)
TOTAL ADJUSTED EBITDA 567 16% 625 18% (59)
Management Discussion and Analysis Half-year ended June 30, 2012
18
A net repayment of borrowings was $74 million as compared to $36 million in the same period last year. Interest payments decreased by 6% to $133 million as compared to $142 million in the first half of 2011.
Indebtedness
The current debt portfolio comprises diversified debt instruments, including bank loans, bonds, convertible bonds and other credit facilities. Our overall financial debt decreased by 2% from $3,787 million as of December 31, 2011 to $3,710 million as of June 30, 2012. The net repayment of borrowings in the first half of 2012 amounted to $74 million. As of June 30, 2012, Russian rouble-, U.S. dollar-, and euro-denominated debt accounted for 44%, 51% and 5%, respectively, of the total financial debt. The share of short-term debt increased to 27% as of June 30, 2012 as compared to 16% as of December 31, 2011, as the convertible bond liability was included in short-term loans and borrowings as of June 30, 2012. The bondholders have a right to request redemption of the convertible bonds, issued in the first quarter 2010, on the third anniversary following the issue date. Our debt portfolio includes fixed as well as floating interest rate debt facilities. As of June 30, 2012, borrowings with a floating interest rate represented $663 million, or 18%, as compared to $2,995 million, or 82%, of borrowings with a fixed interest rate. The weighted average nominal interest rate decreased by 5 basis points as compared to December 31, 2011 and stood at 6.87% as of June 30, 2012.
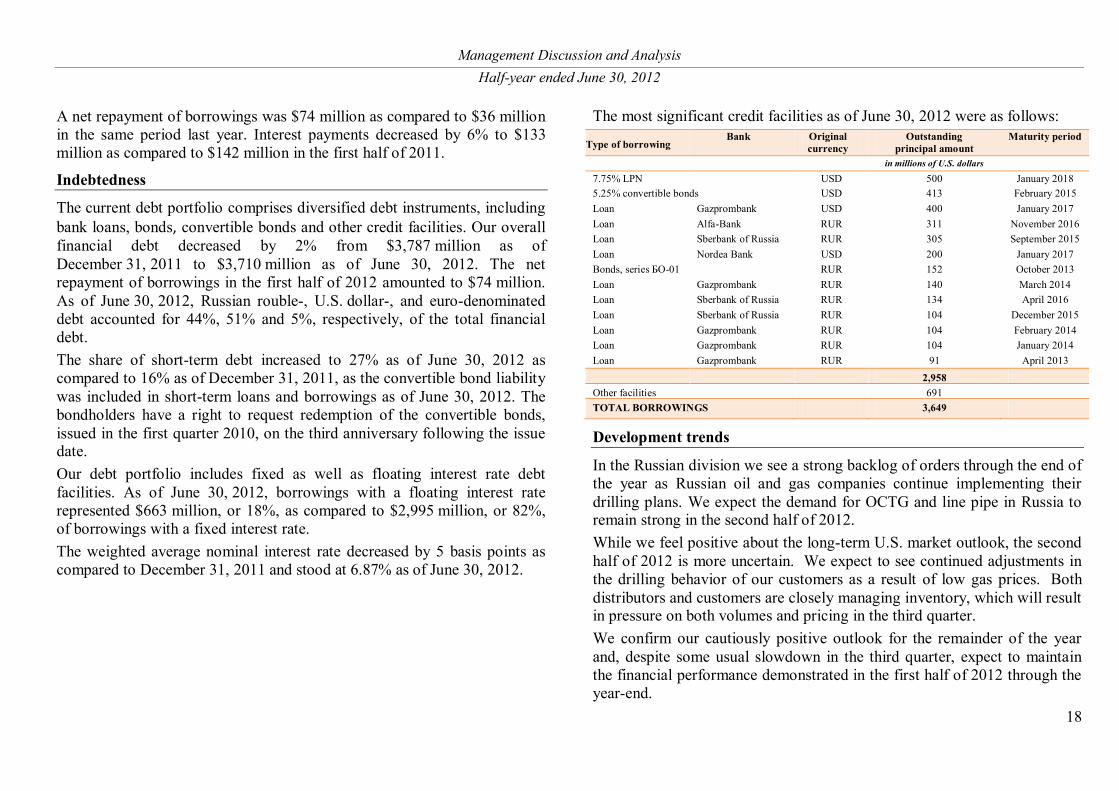
The most significant credit facilities as of June 30, 2012 were as follows:
Type of borrowing Bank Original
currency Outstanding
principal amount Maturity period
in millions of U.S. dollars
7.75% LPN USD 500 January 2018 5.25% convertible bonds USD 413 February 2015 Loan Gazprombank USD 400 January 2017 Loan Alfa-Bank RUR 311 November 2016 Loan Sberbank of Russia RUR 305 September 2015 Loan Nordea Bank USD 200 January 2017 Bonds, series БО-01 RUR 152 October 2013 Loan Gazprombank RUR 140 March 2014 Loan Sberbank of Russia RUR 134 April 2016 Loan Sberbank of Russia RUR 104 December 2015 Loan Gazprombank RUR 104 February 2014 Loan Gazprombank RUR 104 January 2014 Loan Gazprombank RUR 91 April 2013
2,958 Other facilities 691 TOTAL BORROWINGS 3,649
Development trends
In the Russian division we see a strong backlog of orders through the end of the year as Russian oil and gas companies continue implementing their drilling plans. We expect the demand for OCTG and line pipe in Russia to remain strong in the second half of 2012. While we feel positive about the long-term U.S. market outlook, the second half of 2012 is more uncertain. We expect to see continued adjustments in the drilling behavior of our customers as a result of low gas prices. Both distributors and customers are closely managing inventory, which will result in pressure on both volumes and pricing in the third quarter. We confirm our cautiously positive outlook for the remainder of the year and, despite some usual slowdown in the third quarter, expect to maintain the financial performance demonstrated in the first half of 2012 through the year-end.
Management Discussion and Analysis Half-year ended June 30, 2012
19
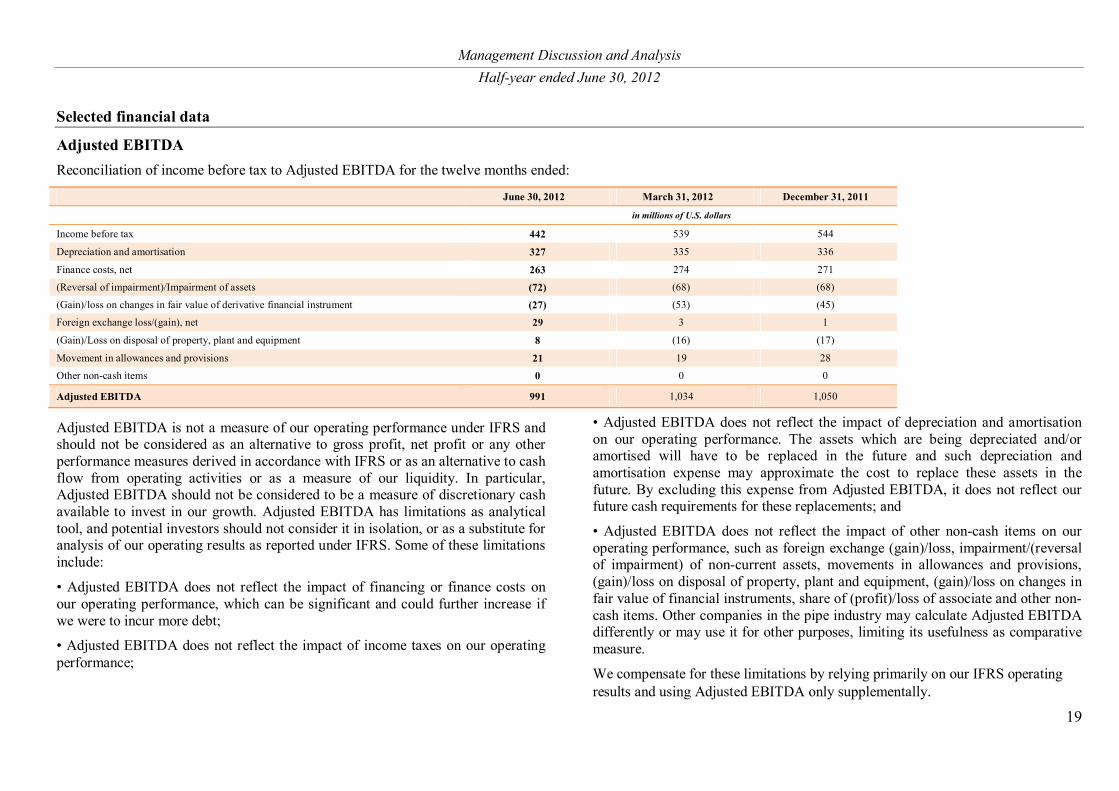
Selected financial data
Adjusted EBITDA Reconciliation of income before tax to Adjusted EBITDA for the twelve months ended:
June 30, 2012 March 31, 2012 December 31, 2011
in millions of U.S. dollars
Income before tax 442 539 544
Depreciation and amortisation 327 335 336
Finance costs, net 263 274 271
(Reversal of impairment)/Impairment of assets (72) (68) (68)
(Gain)/loss on changes in fair value of derivative financial instrument (27) (53) (45)
Foreign exchange loss/(gain), net 29 3 1
(Gain)/Loss on disposal of property, plant and equipment 8 (16) (17)
Movement in allowances and provisions 21 19 28
Other non-cash items 0 0 0
Adjusted EBITDA 991 1,034 1,050
Adjusted EBITDA is not a measure of our operating performance under IFRS and should not be considered as an alternative to gross profit, net profit or any other performance measures derived in accordance with IFRS or as an alternative to cash flow from operating activities or as a measure of our liquidity. In particular, Adjusted EBITDA should not be considered to be a measure of discretionary cash available to invest in our growth. Adjusted EBITDA has limitations as analytical tool, and potential investors should not consider it in isolation, or as a substitute for analysis of our operating results as reported under IFRS. Some of these limitations include:
• Adjusted EBITDA does not reflect the impact of financing or finance costs on our operating performance, which can be significant and could further increase if we were to incur more debt;
• Adjusted EBITDA does not reflect the impact of income taxes on our operating performance;
• Adjusted EBITDA does not reflect the impact of depreciation and amortisation on our operating performance. The assets which are being depreciated and/or amortised will have to be replaced in the future and such depreciation and amortisation expense may approximate the cost to replace these assets in the future. By excluding this expense from Adjusted EBITDA, it does not reflect our future cash requirements for these replacements; and
• Adjusted EBITDA does not reflect the impact of other non-cash items on our operating performance, such as foreign exchange (gain)/loss, impairment/(reversal of impairment) of non-current assets, movements in allowances and provisions, (gain)/loss on disposal of property, plant and equipment, (gain)/loss on changes in fair value of financial instruments, share of (profit)/loss of associate and other non-cash items. Other companies in the pipe industry may calculate Adjusted EBITDA differently or may use it for other purposes, limiting its usefulness as comparative measure.
We compensate for these limitations by relying primarily on our IFRS operating results and using Adjusted EBITDA only supplementally.
Management Discussion and Analysis Half-year ended June 30, 2012
20
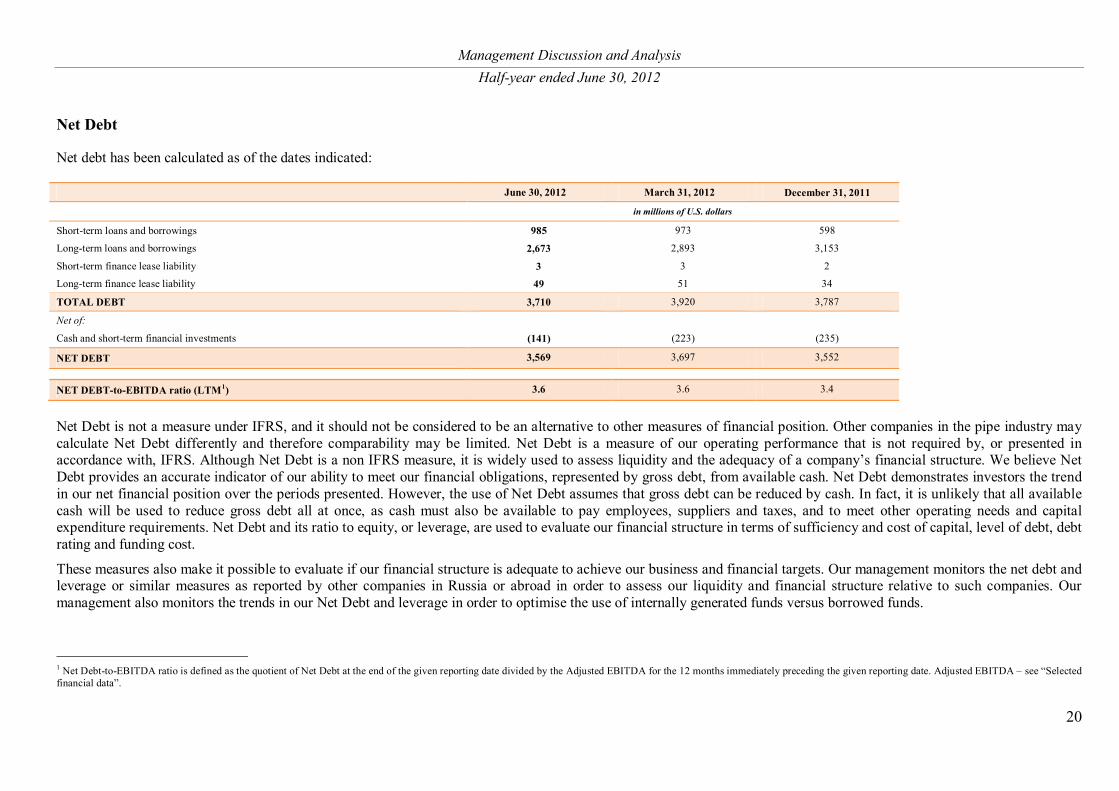
Net Debt
Net debt has been calculated as of the dates indicated:
June 30, 2012 March 31, 2012 December 31, 2011
in millions of U.S. dollars
Short-term loans and borrowings 985 973 598
Long-term loans and borrowings 2,673 2,893 3,153
Short-term finance lease liability 3 3 2
Long-term finance lease liability 49 51 34
TOTAL DEBT 3,710 3,920 3,787
Net of:
Cash and short-term financial investments (141) (223) (235)
NET DEBT 3,569 3,697 3,552
NET DEBT-to-EBITDA ratio (LTM1) 3.6 3.6 3.4
Net Debt is not a measure under IFRS, and it should not be considered to be an alternative to other measures of financial position. Other companies in the pipe industry may calculate Net Debt differently and therefore comparability may be limited. Net Debt is a measure of our operating performance that is not required by, or presented in accordance with, IFRS. Although Net Debt is a non IFRS measure, it is widely used to assess liquidity and the adequacy of a company’s financial structure. We believe Net Debt provides an accurate indicator of our ability to meet our financial obligations, represented by gross debt, from available cash. Net Debt demonstrates investors the trend in our net financial position over the periods presented. However, the use of Net Debt assumes that gross debt can be reduced by cash. In fact, it is unlikely that all available cash will be used to reduce gross debt all at once, as cash must also be available to pay employees, suppliers and taxes, and to meet other operating needs and capital expenditure requirements. Net Debt and its ratio to equity, or leverage, are used to evaluate our financial structure in terms of sufficiency and cost of capital, level of debt, debt rating and funding cost.
These measures also make it possible to evaluate if our financial structure is adequate to achieve our business and financial targets. Our management monitors the net debt and leverage or similar measures as reported by other companies in Russia or abroad in order to assess our liquidity and financial structure relative to such companies. Our management also monitors the trends in our Net Debt and leverage in order to optimise the use of internally generated funds versus borrowed funds.
1 Net Debt-to-EBITDA ratio is defined as the quotient of Net Debt at the end of the given reporting date divided by the Adjusted EBITDA for the 12 months immediately preceding the given reporting date. Adjusted EBITDA ‒ see “Selected financial data”.