Embed Size (px)
Citation preview
1
Vula Environmental Services (Pty) Ltd Reg. No. 2001/011003/07 • VAT Reg. No. 4150183558
PO Box 858
VREDENBURG 7380
Head Office Tel/Fax: 022 766 1106
Tel: 022 766 1206 Cape Town Tel/Fax: 021 972 1647
Cell: 082 564 5748 (Deon van Eeden) E-mail: [email protected] • Website:www.vula.biz
ENVIRONMENTAL REHABILITATION SPECIALISTS • INDIGENOUS SEED SUPPLIERS • LANDSCAPING • IRRIGATION • SAFETY, HEALTH, ENVIRONMENT, RISK
& QUALITY (SHERQ) ASSESSMENT
MANAGEMENT AND REHABILITATION PLAN FOR THE HOUT BAY DUNES
Report PO 4501955067 prepared for the City of Cape
Town
First Draft: November 2012 Second Draft: February 2013
Final report: March 2013
Volume 2
A. Barrie Low and J. Deon van Eeden
2011 SALI TROPHY for BEST ENVIRONMENTAL PROJECT in SA &
the 2011 Rand Water Trophy for BEST WATERWISE PROJECT in SOUTH AFRICA!
We are the LEADERS in SUSTAINABLE ECOLOGICAL landscaping. Landscape your future with us!.
Director: J D van Eeden (Managing) D P Rogers
hout bay dunes management & rehabilitation plan
i
EXECUTIVE SUMMARY1
An ecological assessment of the Hout Bay beachfront dunes has found the area to be extremely degraded. Chief causes have been a combination of unusually strong summer easterly and south-easterly winds and summer drought over the 2010/11 season, coupled with a lack of maintenance and damage from pedestrians. The latter has been the single most decisive factor in dune degradation, particularly as the planning programme recommended by the CSIR in 1989 was not sustained. Linked with this has been poor town planning, with much of the climbing-falling dune between Hout Bay and Sandy Bay rendered non-functional due to development in the mobile dune zone. Development encroachment onto the beach and Hout Bay River estuary has also severely compromised the dynamics of the mobile dune system and meandering of the river mouth.
Four Management Options are evaluated which present choices for the client, the City of Cape Town (CCT). Essentially these are to maintain the status quo (Option 1), basic sand removal, maintenance of some plant cover, and keeping pedestrians off the dunes (Option 2), reshaping, coupled with selected dune removal, revegetation of disturbed areas, keeping pedestrians off the dunes, and maintenance of the entire dune area (Option 3), and major earthworks and removal of sand, removal of all infrastructure within the dune area, re-profiling all dunes between the Promenade and Mariner’s Wharf car parks, intensive revegetation of all reshaped dunes, installation of new irrigation, keeping pedestrians off the dunes, and perpetual maintenance (Option 4). We have recommended the last Option as it is the only one which will effectively solve the problem of windblown sand in the long-term and has proven success in the Big Bay and Dolphin Beach areas.
Dune functionality was divided into 15 Sectors, with Sectors being combined into six Management Units (MU’s) for ease of maintenance.
Modelled on Option 4, each MU is addressed by describing its background, past management, prognosis for management, and a detailed rehabilitation/maintenance proposal presented. The latter entails removal of sand, re-profiling of dunes, kelp removal, volumes of sand to be removed, and costing for the operation.
Recommendations for Option 4, projected management costs are as follows (rounded off to the nearest R10 000):
Management Unit 1: R2 450 000
Management Units 2 and 3: R2 900 000
Management Unit 4: R110 000
Management Unit 5 (the bulk of the site): R11 250 000
Management Unit 6: R2 650 000
Basic assessment and public participation: R500 000
Total: R19 860 000 (excl. VAT).
1 Quote as: Low, A B. and van Eeden J.D., Management and Rehabilitation plan for the Hout Bay Dunes. Volume
2. Vula Environmental Service, Vredenburg
hout bay dunes management & rehabilitation plan
ii
Given the high cost of the exercise, the City and one of team members (DvE) discussed ways in which the City could contribute in kind to the overall costing. This reduced the budget by a substantial R????, with the City contributing significantly for labour and plant.
The revised costing is as follows:
Although it is our recommendation that ALL interventions are implemented as one, i.e. over a
single season, management could be phased in as follows:
Year 1: MU’s 1 and 6 (these are the most intensively used by the public) (R5 100 000)
Year 2: MU’s 2, 3 & 4 (including Hout Bay River estuary) (R3 010 000)
Year 3: MU5 (this is the largest intervention, requiring removal of massive amounts of sand) (R11 250 000).
The public participation process (R500 000) should be undertaken during the first year.
Furthermore, a management plan should be drawn up for the Hout Bay River, which would include consideration of the interaction between the river estuary and mouth, with management of the dunes and river being integrated by the City.
However, priority work could be undertaken, whereby the City would contribute labour and plant worth some R7.567 million and funding R5.650 million in external contracting. A further R6.553 million would need to be re-evaluated.
The report ends with a section on Monitoring, an element which was sorely missing in previous maintenance attempts. Good management must be underpinned by thorough, predictive monitoring which is absolutely essential for recording the efficacy of dune management.
Urgency for management intervention on a perpetual basis is stressed, given the massive build-up of bare and mobile sand in the area and the increased nuisance value sand will have in the foreseeable future. To this end, a management plan should be drawn up for the Hout Bay River, one which would include consideration of the interaction between the river estuary and primary dunes, with management of the dunes and river being integrated by the City.
hout bay dunes management & rehabilitation plan
iii
CONTENTS
EXECUTIVE SUMMARY ................................................................................................ I
GLOSSARY .............................................................................................................. VIII
ABBREVIATIONS ....................................................................................................... IX
1. PREFACE TO VOLUME 2 ...................................................................................... 1
2. INTRODUCTION .................................................................................................... 1
3. TERMS OF REFERENCE ...................................................................................... 2
4. EXPECTED OUTCOMES ....................................................................................... 2
5. APPROACH ........................................................................................................... 3
Desktop review and GIS layers ..................................................................... 3 5.1
Evaluation of dune management programmes ............................................ 3 5.2
Field survey .................................................................................................... 3 5.3
Dune contour data .......................................................................................... 4 5.4
Dune transects................................................................................................ 4 5.5
Sand volumes ................................................................................................. 4 5.6
Management plan and estimates .................................................................. 5 5.7
6. BACKGROUND ...................................................................................................... 6
Context (from Low & Pond, 2004; Low, 2012) .............................................. 6 6.1
History of the Hout Bay-Sandy Bay climbing-falling dune ......................... 9 6.2
Source and dynamics of sand supply ........................................................ 10 6.3
Stability of coastline ..................................................................................... 10 6.4
Sand movement dynamics .......................................................................... 11 6.5
Dumping of rubble on beachfront ............................................................... 11 6.6
Climate .......................................................................................................... 11 6.7
Coastal setback line ..................................................................................... 14 6.8
Vegetation ..................................................................................................... 14 6.9
History of planning in area .......................................................................... 17 6.10
7. REVIEW OF BIG BAY AND DOLPHIN BEACH MANAGEMENT
APPROACHES ..................................................................................................... 20
Advantages of this approach ...................................................................... 20 7.1
Implications of this approach ...................................................................... 21 7.2
hout bay dunes management & rehabilitation plan
iv
8. EVALUATION OF SAND MOVEMENT AT HOUT BAY BETWEEN 2009 AND
2011 ...................................................................................................................... 27
Survey of dune contours ............................................................................. 27 8.1
Change in sand volumes ............................................................................. 27 8.2
9. MANAGEMENT OF HOUT BAY DUNES ............................................................. 32
Dune management options ......................................................................... 32 9.1
The prime drivers in determining the sequence: ....................................... 40 9.2
10. HOUT BAY DUNE MANAGEMENT UNITS ......................................................... 46
Management Unit 1 (Sector 1 - eastern activities beach) .......................... 46 10.1
Management Unit 2 (Sectors 2 & 3 – back dunes above eastern beach) . 54 10.2
Management Unit 3 (part of Sectors 2 and 4 – beach around Hout Bay 10.3
River lower estuary and mouth) ............................................................... 62
Management Unit 4 (Sector 5 – sandy embankment between Hout Bay 10.4
River estuary and HBBC) .......................................................................... 66
Management Unit 5 (Sectors 6 to 14 – beach and dunes between Hout 10.5
Bay Beach Club and the storm water outlet adjacent to the western
car park) ..................................................................................................... 71
Management Unit 6 (Sector 15 – beach and parking area at Mariner’s 10.6
Wharf) ......................................................................................................... 87
11. MONITORING OF HOUT BAY DUNE MANAGEMENT ....................................... 93
Monitoring Methods ..................................................................................... 93 11.1
Maintenance requirements .......................................................................... 94 11.2
12. SUMMARY OF COST ESTIMATES ..................................................................... 96
13. RECOMMENDATIONS AND CONCLUSIONS .................................................... 98
14. ACKNOWLEDGEMENTS ................................................................................... 100
15. REFERENCES ................................................................................................... 101
hout bay dunes management & rehabilitation plan
v
FIGURES
Figure 1 Comparison of 1948 and 2011 aerial view of Hout Bay 7
Figure 2 Noordhoek monthly rainfall 12
Figure 3 Noordhoek wind patterns 13
Figure 4 Coastal setback line for study area 15
Figure 5 Cost of Big Bay Management options 22
Figure 6 Dolphin Beach 2001 23
Figure 7 Dolphin Beach 2009 23
Figure 8 Big Bay frontal dune scour 24
Figure 9 Big Bay frontal dune management prior to planting 24
Figure 10 Big Bay frontal dune management post planting 25
Figure 11 Erosion at Blaauwberg 25
Figure 12 Dune contours for Hout Bay Lidar May 2009 28
Figure 13 Dune contours for Hout Bay survey November 2011 29
Figure 14 Dune management sections for Hout Bay 30
Figure 15 Management Units for Hout Bay Dunes 34
Figure 16 Location of 13 transects 35
Figure 17 Typical dune management regime for Hout Bay 41
Figure 18 Proposed planting east 42
Figure 19 Proposed planting west 43
Figure 20 Schematic irrigation design east 44
Figure 21 Schematic irrigation design west 45
Figure 22 Schematic design of sand trap along promenade 51
Figure 23 Current and reconstructed Profile A (Sector 1 – eastern beach front and Promenade)
52
Figure 24 Current and reconstructed Profile B (Sector 1 – eastern beachfront, east of Hout Bay River mouth)
53
Figure 25a Current and reconstructed Profile C (Sectors 2 & 3 – eastern beach front and Promenade)
60
Figure 25b Current and reconstructed Profile C (Sectors 2 & 3 – back dunes in eastern section)
61
hout bay dunes management & rehabilitation plan
vi
Figure 26 Current and reconstructed Profile D (Sector 4 – beach around Hout Bay River lower estuary and mouth)
65
Figure 27a Current and reconstructed profile E (Sector 5 – section below Hout Bay Beach Club, west of the Hout Bay River estuary)
69
Figure 27b Remainder of profile E (no reconstruction) Sector 8 – section west of Hout Bay Beach Club)
70
Figure 28 Hout Bay Beach extent of planting in 2001 76
Figure 29 Detailed Profile 77
Figure 30a Current and reconstructed Profile F: front section of beach, high dunes and blowout directly west of HBBC (Sectors 6, 7 & 8)
78
Figure 30b Current and reconstructed Profile F: back section of high dunes directly west of HBBC (Sectors 6, 7 & 8)
79
Figure 31a Current and reconstructed Profile G: front section – main dunes between HBBC and Mariner’s Wharf (Sectors 6, 7 & 8)
80
Figure 31b Current and reconstructed Profile G: back section – main dunes between HBBC and Mariner’s Wharf (Sectors 6, 7 & 8)
81
Figure 32a Current and reconstructed Profile H: front section – main dunes south of Princess Road car park (Sectors 6, 7 & 8)
82
Figure 32b Current and reconstructed Profile H: back section – main dunes south of Princess Road car park (Sectors 6, 7 & 8)
83
Figure 33 Current and reconstructed Profile I: dunes immediately adjacent to (east) Yacht Club (Sectors 4, 5 & 8)
84
Figure 34 Current and reconstructed Profile J: dunes immediately west of Yacht Club (Sectors 13 & 14)
85
Figure 35 Current and reconstructed Profile K: directly east of Mariner’s Wharf car park (Sectors 13 & 14)
86
Figure 36 Schematic design of sand trap along Mariners Warf car park 90
Figure 37 Current and reconstructed Profile L: stormwater outlet just east of Mariner’s Wharf car park (Sector 15)
91
Figure 38 Current and reconstructed Profile M (Sector 15) – Mariner’s Wharf car park and beach, and bus parking area
92
hout bay dunes management & rehabilitation plan
vii
TABLES Table 1 Dune systems occurring within the City of Cape Town (from Low &
Pond, 2004) (modified in August, 2011) 8
Table 2 General characteristics of the Hout Bay-Sandy Bay climbing-falling dune systems on the Cape Peninsula (modified from Low & Pond, 2001)
18
Table 3 Chief flora and vegetation features of the Hout Bay-Sandy Bay dune system (modified from Low & Pond, 2001)
19
Table 4 Evaluation of artificial and managed dune profiles (drawn from experience at Dolphin Beach and Big Bay maintenance phase)
26
Table 5 Dune mobility in selected parts of the Cape Flats, Peninsula and West Coast determined by measuring movement of mobile dune front on sequential Google images
31
Table 6 Possible options for managing the dunes at Hout Bay 36
Table 7 Comparison of management costs 97
APPENDICES APPENDIX 1. WINDROSES FROM CAPE POINT FARMS, NOORDHOEK
APPENDIX 2. DETAILS OF ERVEN OWNERSHIP, ZONING AND LANDUSE IN THE HOUT BAY DUNES STUDY AREA APPENDIX 3. IMAGES OF THE STUDY AREA APPENDIX 4. DETAILED MANAGEMENT COSTS (submitted as a separate PDF file)
hout bay dunes management & rehabilitation plan
viii
GLOSSARY FOR VOLUMES 1 & 2
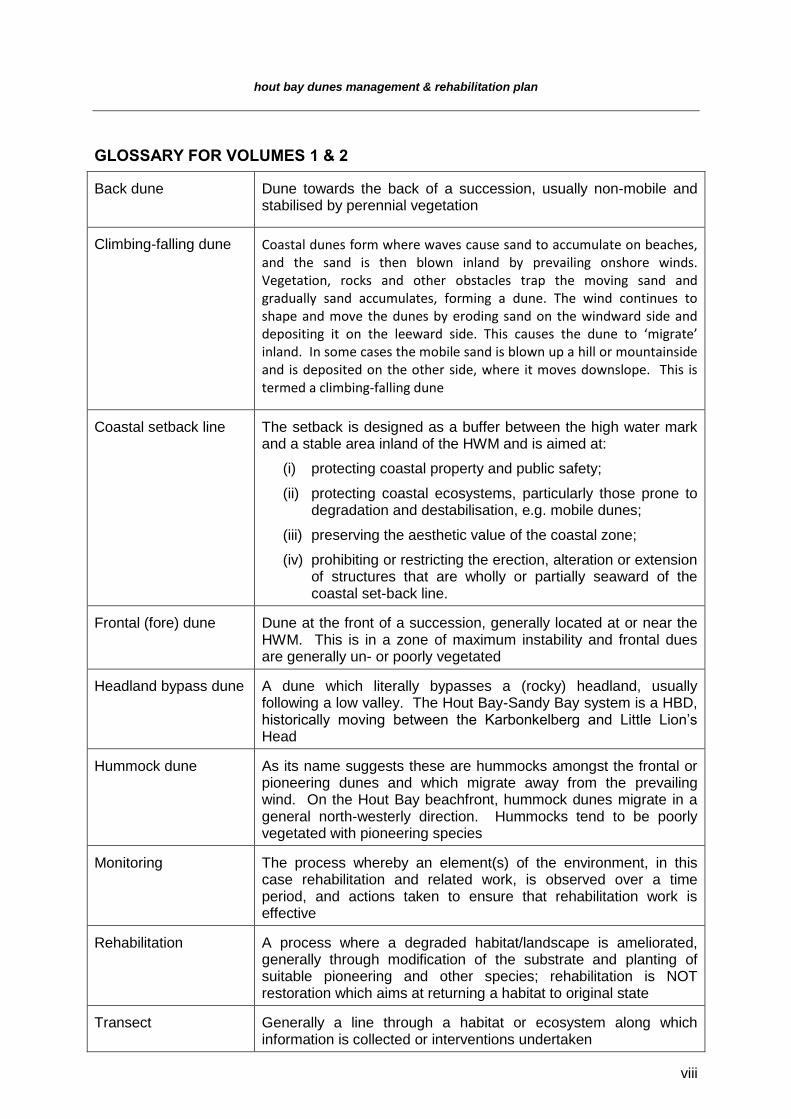
Back dune Dune towards the back of a succession, usually non-mobile and stabilised by perennial vegetation
Climbing-falling dune Coastal dunes form where waves cause sand to accumulate on beaches, and the sand is then blown inland by prevailing onshore winds. Vegetation, rocks and other obstacles trap the moving sand and gradually sand accumulates, forming a dune. The wind continues to shape and move the dunes by eroding sand on the windward side and depositing it on the leeward side. This causes the dune to ‘migrate’ inland. In some cases the mobile sand is blown up a hill or mountainside and is deposited on the other side, where it moves downslope. This is termed a climbing-falling dune
Coastal setback line The setback is designed as a buffer between the high water mark and a stable area inland of the HWM and is aimed at:
(i) protecting coastal property and public safety;
(ii) protecting coastal ecosystems, particularly those prone to degradation and destabilisation, e.g. mobile dunes;
(iii) preserving the aesthetic value of the coastal zone;
(iv) prohibiting or restricting the erection, alteration or extension of structures that are wholly or partially seaward of the coastal set-back line.
Frontal (fore) dune Dune at the front of a succession, generally located at or near the HWM. This is in a zone of maximum instability and frontal dues are generally un- or poorly vegetated
Headland bypass dune A dune which literally bypasses a (rocky) headland, usually following a low valley. The Hout Bay-Sandy Bay system is a HBD, historically moving between the Karbonkelberg and Little Lion’s Head
Hummock dune As its name suggests these are hummocks amongst the frontal or pioneering dunes and which migrate away from the prevailing wind. On the Hout Bay beachfront, hummock dunes migrate in a general north-westerly direction. Hummocks tend to be poorly vegetated with pioneering species
Monitoring The process whereby an element(s) of the environment, in this case rehabilitation and related work, is observed over a time period, and actions taken to ensure that rehabilitation work is effective
Rehabilitation A process where a degraded habitat/landscape is ameliorated, generally through modification of the substrate and planting of suitable pioneering and other species; rehabilitation is NOT restoration which aims at returning a habitat to original state
Transect Generally a line through a habitat or ecosystem along which information is collected or interventions undertaken
hout bay dunes management & rehabilitation plan
ix
ABBREVIATIONS FOR VOLUMES 1 & 2
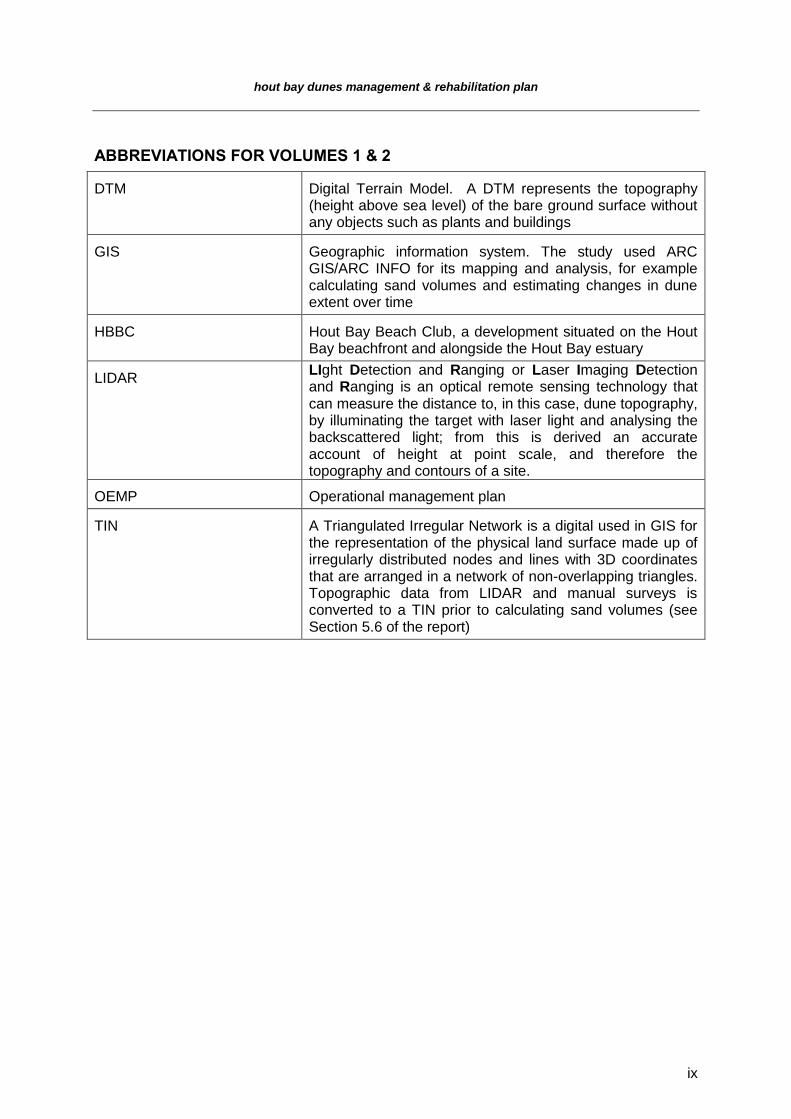
DTM Digital Terrain Model. A DTM represents the topography (height above sea level) of the bare ground surface without any objects such as plants and buildings
GIS Geographic information system. The study used ARC GIS/ARC INFO for its mapping and analysis, for example calculating sand volumes and estimating changes in dune extent over time
HBBC Hout Bay Beach Club, a development situated on the Hout Bay beachfront and alongside the Hout Bay estuary
LIDAR LIght Detection and Ranging or Laser Imaging Detection and Ranging is an optical remote sensing technology that can measure the distance to, in this case, dune topography, by illuminating the target with laser light and analysing the backscattered light; from this is derived an accurate account of height at point scale, and therefore the topography and contours of a site.
OEMP Operational management plan
TIN A Triangulated Irregular Network is a digital used in GIS for the representation of the physical land surface made up of irregularly distributed nodes and lines with 3D coordinates that are arranged in a network of non-overlapping triangles. Topographic data from LIDAR and manual surveys is converted to a TIN prior to calculating sand volumes (see Section 5.6 of the report)
hout bay dunes management & rehabilitation plan
1
1. PREFACE TO VOLUME 2
The study of dune management of the Hout Bay dunes encompasses two reports. Volume 1
deals with the essential actions which will be required to manage the dunes in a satisfactory
way, but excludes most of the technical detail on which the study was based.
Volume 2 (this Volume) is basically the Technical report for the study and describes the
approach and results of the research and analysis, concluding with the recommendation that
three phases of operation need to be followed if dune management at Hout Bay is to be a
success. It also includes most of the Figures and Diagrams which underpin the work.
Whilst the two reports should ideally be read in conjunction with each other, Volume 1
provides sufficient information for officials to make a cogent decision on the three phases of
dune management described.
2. INTRODUCTION
Mobile sand has become a major problem above the beach at Hout Bay. Ever since
development compromised the functioning of the climbing-falling dune system between Hout
Bay and Sandy Bay, sand has, as it were, had no place to go, with development having
severed the link between the two Bays. Despite strong recommendations for windblown
sand (CSIR, 1989), management of the problem was eventually curtailed and then stopped
due to lack of funds, and dare we say, interest. The result is that the problem became
exacerbated and unwanted mobile sand, driven by the south-easterly winds, is now a major
issue in the Hout Bay development.
In March 2012, the City of Cape Town (CCT) called for tenders to address the issue. The
tender was won by VULA and Coastec, acting in partnership, with an appointment on 7 June
2012. The project seeks to provide a solution(s) for windblown sand emanating from the
beach at Hout Bay and to provide a workable basis from which the City can manage the
beach in an ecologically responsible way.
Initially a draft report was produced for the City to review. Following the review of the draft
report, and, whilst agreeing with the recommendations for interventive action and
rehabilitation on the Hout Bay beachfront, City officials found the costs for implementation to
be too high. Howard Gold, Amy Davison (City of Cape Town) and Deon van Eeden
hout bay dunes management & rehabilitation plan
2
discussed the possibility of revising the initial cost estimate and splitting the costs between
potential “in house” cost and contract cost. The City was able to reduce much of the total
cost of the project through provision of labour and plant. This resulted in a second draft
(revised) which now included a revised cost structure.
Phasing of the project was considered and incorporated in the new revised cost estimate.
3. TERMS OF REFERENCE
Source and review the CSIR Report (Hout Bay Beachfront: Development Plan, 1989), and any other relevant material, detailing a previous dune management strategy at Hout Bay Beach;
Consider and evaluate alternative management approaches to the problem;
Conduct an assessment of the status quo, based on an on-site survey and inspection that will include a “per property” review and comment, and which will also tie in with a review of adjacent plots;
Consolidate a basic photo documentation and basic quantification per property for the Hout Bay Beachfront;
Compile and present an Assessment Report to the City;
Develop a detailed Long-Term Dune and Beachfront Management Strategy for Hout Bay based on the most appropriate and sustainable option(s), and which will include budgetary and capacity requirements;
The Management Strategy must consider viable, cost effective and legal mechanisms to deal with/dispose of any sand that will be in excess of the needs of the Strategy.
4. EXPECTED OUTCOMES
Progress reports to the City’s Project Steering Committee (PSC);
Consultation with key City functions during the project in sourcing of information;
Deliver a detailed Assessment Report to the PSC;
Present a final Dune and Beachfront Management Strategy to the PSC.

hout bay dunes management & rehabilitation plan
3
5. APPROACH
Desktop review and GIS layers 5.1
Key reports consulted included the CSIR’s (1989) dune management plan and the Hout Bay
estuary account (Grindley, 1988). Several existing GIS layers were interrogated and these
included the coastal dune survey for the City (Low, 2004, and Low & Pond, 2007).
Legal aspects of coastal dune management were also included. Owing to the potential
impact of the proposed management measures, the detailed planning phase should comply
with the requirements as stipulated by the relevant legislation. This will include:
The National Environmental Management Biodiversity Act of 2004 (Act No. 10 of 2004);
National Water Act of 1998 (Act No. 36 of 1998);
National Environmental Management-Integrated Coastal Management (Act No. 24 of 2008);
National Environmental Management Act: Amendment of regulations for Control of use of vehicles in coastal zone, (G 33711 – GN. 1012)
Although much of the dune system at Hout Bay has been artificially manipulated, approvals
will need to be sought for a range of interventions including removal of sand and altering of
the river channel. Once a detailed plan for managing the Hout Bay dunes is developed, then
the various triggers which these Acts deal with would need to be addressed.
Evaluation of dune management programmes 5.2
Dune management initiatives at Dolphin Beach and Big Bay provided an essential backdrop
to approaches applied in the Hout Bay study. Both these studies give excellent accounts of
the do’s and don’ts of dune management along the City coast, particularly where mobile
sand and development are in conflict.
Field survey 5.3
The site was visited on 1 and 26 June, and 1 October 2012, to record the characteristics of
dune mobility, plant species and vegetation, and development, as well photographic records
of the state of the dunes in the various private and City Erven, and to make observations on
seasonal dynamics of the system.
hout bay dunes management & rehabilitation plan
4
Dune contour data 5.4
Two sets of dune contour data were available for the study. In May 2009, the City undertook
a Lidar aerial survey of Hout Bay and this included most of the dunes in the study area.
Further, in November 2011 the City undertook a manual survey of the dunes but which
excluded the northern part of the study area. However, the key sand mobility routes were
included, enabling direct comparison of changes over the one a half year period between
contours. During this visit extensive photographic records were taken of the state of the site
in the various private and City Erven.
Dune transects 5.5
On 19 June 2012, one of us (ABL) visited the site with Mr John Coetzee, a surveyor with the
City, in order to survey dune profiles from the high water mark to development behind the
dunes (Harbour Road, Princess Road, Beach Road, Promenade). The transects were key to
reviewing current and desirable dune sections for the management plan, as well indicating
the amount of sand required to be removed from the site.
Sand volumes 5.6
Based upon the contours and using the sectors provide by the consultants, sand volumes
were computed for the two datasets. Digital Terrain Models (DTM) for the study area were
constructed for May 2009 and November 2011. Input for the 2009 DTM was a LIDAR mass-
point data set provided by the City; the 2011 DTM was supplied in a point elevation file
representing a 0.5 m GRID of the study area. The terrain data provided was converted into
TIN’s (triangulated irregular networks) in order to facilitate the volume calculations using the
following steps:
Step 1: the 2009 LIDAR mass-point data were converted to a 0.5 m DTM GRID using Global Mapper v13. Both the 2009 DTM and the 2011 DTM provided were then converted to TIN’s using ARCGIS 10.
Step 2: the ARCGIS "Polygon Volume Tool" was used to calculate the volume per each Hout Bay dune sector for the 2009 and 2011 TIN’s. This was undertaken by subtracting the 2009 volumes from the 2011 volumes to provide the net volume change over this period. This amount was then divided by the 2009 volume to give the percentage volume change per sector.
Equation: 2011 Vol - 2009 Vol = Volume Change
Volume Change/2009 VOL x 100 = Percentage Volume Change.
hout bay dunes management & rehabilitation plan
5
Step 3: the GRID map of volume change was created as follows: "Surface Difference Tool" (ARCGIS) was used to generate a GRID (10 m x 10 m) showing the elevation differences between 2009 and 2011 TIN’s. This grid was multiplied by 100 to get a volume per cell.
Equation: Vol 2011-Vol 2009/Vol 2009 = Volume difference per 10 m x 10 m grid.
Management plan and estimates 5.7
The impact of human settlement in the Hout Bay valley and in particular the establishment of
an urban area between the Karbonkelberg and the back of Table Mountain has not only
compromised the climbing-falling dune system but also limited the management options
available. In determining the most suitable management approach to this severely modified
system, in particular to ensure ease of implementation, the study area was divided into six
management units.
The reasons for the failure of past interventions were explored as this has to be understood
in order to avoid a repeat of these failures. There are two key issues regarding past
interventions:
Limited scale of structured intervention exposed these managed areas to the impact of windblown sand that originated from un-managed areas, increasing the need and intensity of maintenance required
Failure of maintenance in areas where interventions were implemented.
Different management options are proposed and one recommended on the basis of the most
cost-effective approach in the long term.
Cost implications will be substantial for any of the approaches and were evaluated against
the experiences of similar management regimes at Big Bay and Dolphin Beach. Final costs
are provided only for our preferred management intervention and will require refinement once
the City has decided on the appropriate course of action.
A cost estimate, based on current rates has been prepared for the most suitable
management option, Option 4 (see Section 9.1 below for discussion of options) (Appendix 4).
Since a detailed design would be required, the estimate is a guideline to assist the planning
and budgeting phase.
hout bay dunes management & rehabilitation plan
6
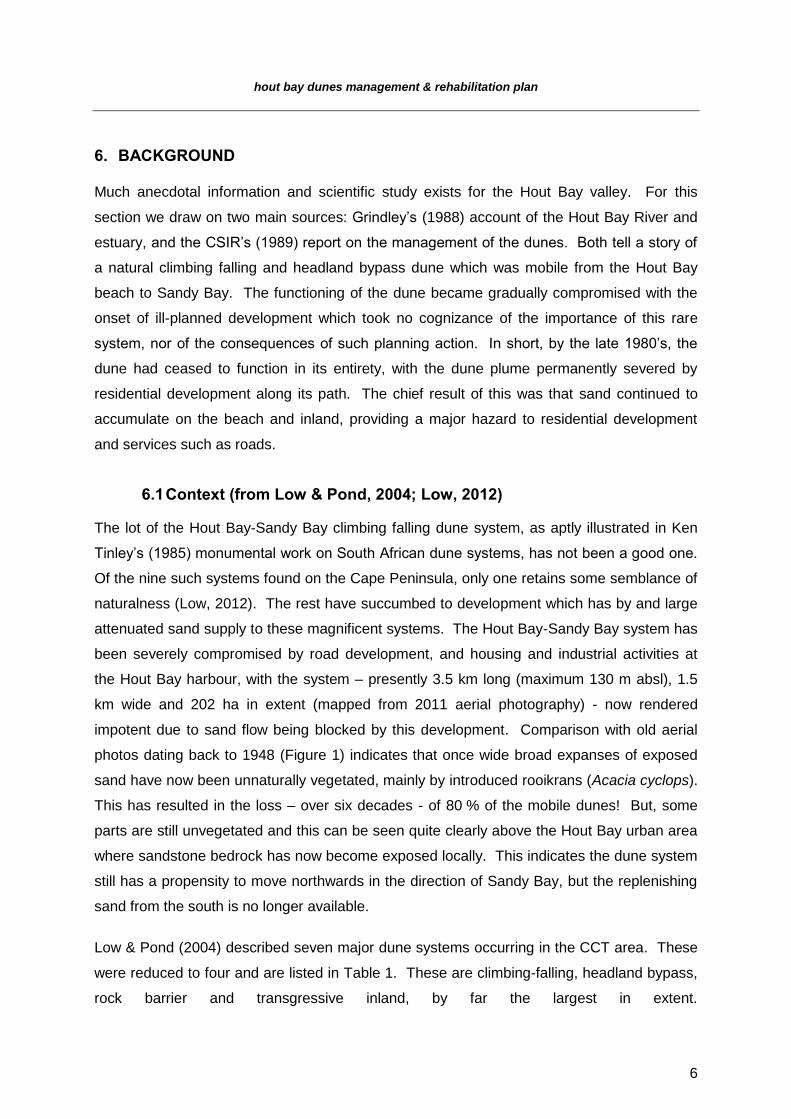
6. BACKGROUND
Much anecdotal information and scientific study exists for the Hout Bay valley. For this
section we draw on two main sources: Grindley’s (1988) account of the Hout Bay River and
estuary, and the CSIR’s (1989) report on the management of the dunes. Both tell a story of
a natural climbing falling and headland bypass dune which was mobile from the Hout Bay
beach to Sandy Bay. The functioning of the dune became gradually compromised with the
onset of ill-planned development which took no cognizance of the importance of this rare
system, nor of the consequences of such planning action. In short, by the late 1980’s, the
dune had ceased to function in its entirety, with the dune plume permanently severed by
residential development along its path. The chief result of this was that sand continued to
accumulate on the beach and inland, providing a major hazard to residential development
and services such as roads.
Context (from Low & Pond, 2004; Low, 2012) 6.1
The lot of the Hout Bay-Sandy Bay climbing falling dune system, as aptly illustrated in Ken
Tinley’s (1985) monumental work on South African dune systems, has not been a good one.
Of the nine such systems found on the Cape Peninsula, only one retains some semblance of
naturalness (Low, 2012). The rest have succumbed to development which has by and large
attenuated sand supply to these magnificent systems. The Hout Bay-Sandy Bay system has
been severely compromised by road development, and housing and industrial activities at
the Hout Bay harbour, with the system – presently 3.5 km long (maximum 130 m absl), 1.5
km wide and 202 ha in extent (mapped from 2011 aerial photography) - now rendered
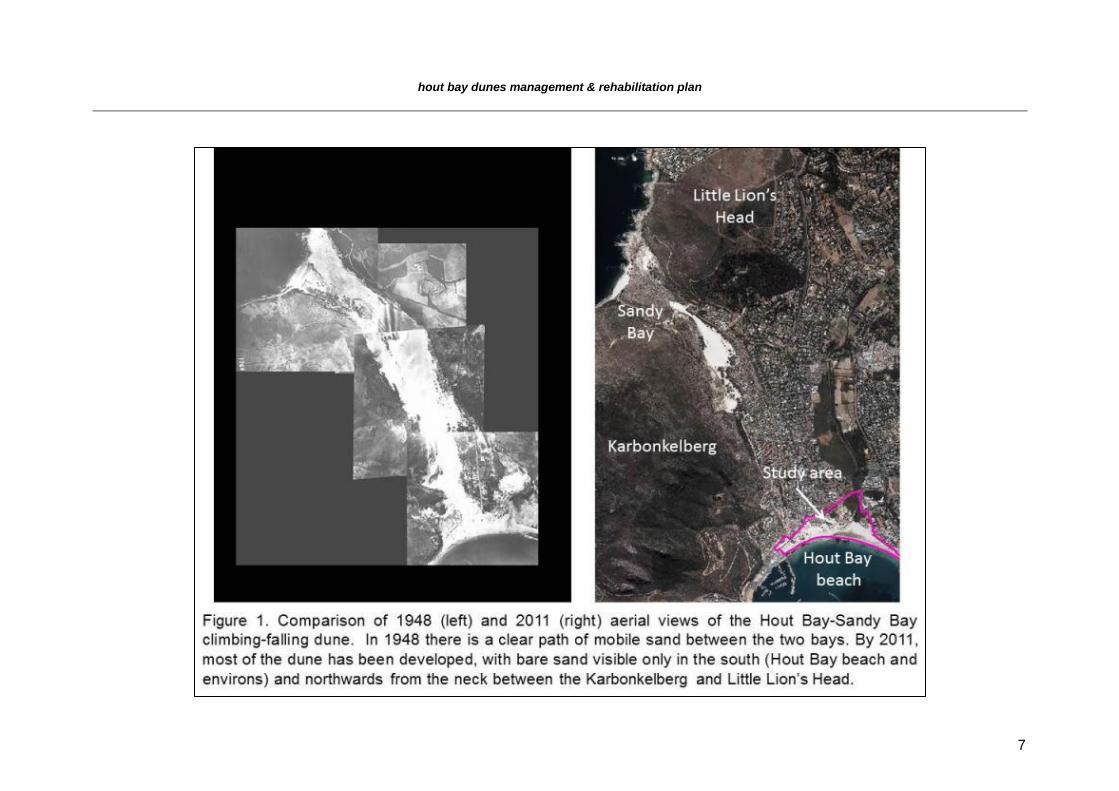
impotent due to sand flow being blocked by this development. Comparison with old aerial
photos dating back to 1948 (Figure 1) indicates that once wide broad expanses of exposed
sand have now been unnaturally vegetated, mainly by introduced rooikrans (Acacia cyclops).
This has resulted in the loss – over six decades - of 80 % of the mobile dunes! But, some
parts are still unvegetated and this can be seen quite clearly above the Hout Bay urban area
where sandstone bedrock has now become exposed locally. This indicates the dune system
still has a propensity to move northwards in the direction of Sandy Bay, but the replenishing
sand from the south is no longer available.
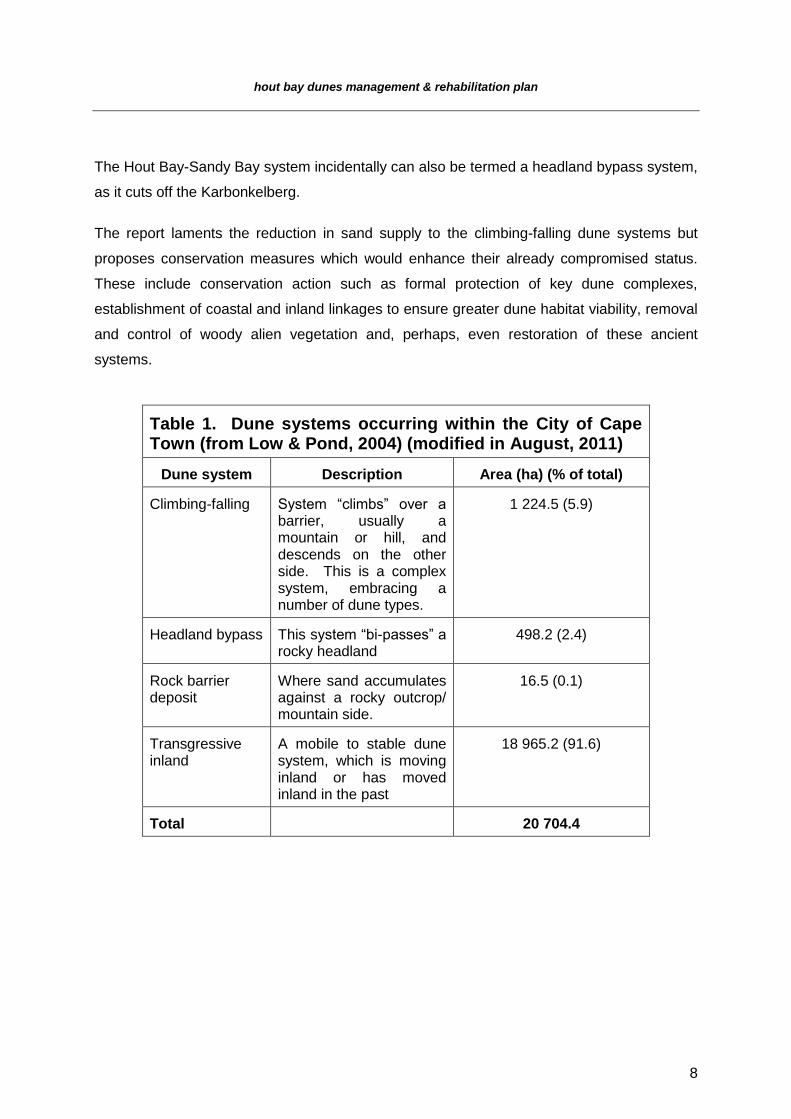
Low & Pond (2004) described seven major dune systems occurring in the CCT area. These
were reduced to four and are listed in Table 1. These are climbing-falling, headland bypass,
rock barrier and transgressive inland, by far the largest in extent.
hout bay dunes management & rehabilitation plan
7
hout bay dunes management & rehabilitation plan
8
The Hout Bay-Sandy Bay system incidentally can also be termed a headland bypass system,
as it cuts off the Karbonkelberg.
The report laments the reduction in sand supply to the climbing-falling dune systems but
proposes conservation measures which would enhance their already compromised status.
These include conservation action such as formal protection of key dune complexes,
establishment of coastal and inland linkages to ensure greater dune habitat viability, removal
and control of woody alien vegetation and, perhaps, even restoration of these ancient
systems.
Table 1. Dune systems occurring within the City of Cape Town (from Low & Pond, 2004) (modified in August, 2011)
Dune system Description Area (ha) (% of total)
Climbing-falling System “climbs” over a barrier, usually a mountain or hill, and descends on the other side. This is a complex system, embracing a number of dune types.
1 224.5 (5.9)
Headland bypass This system “bi-passes” a rocky headland
498.2 (2.4)
Rock barrier deposit
Where sand accumulates against a rocky outcrop/ mountain side.
16.5 (0.1)
Transgressive inland
A mobile to stable dune system, which is moving inland or has moved inland in the past
18 965.2 (91.6)
Total 20 704.4
hout bay dunes management & rehabilitation plan
9
History of the Hout Bay-Sandy Bay climbing-falling dune 6.2
The earliest available aerial photograph for the area (1944) indicates sparsely vegetated
hummock dunes present to the west of the river mouth. The road to the harbour crosses the
southern part of the dune system but does not impede northwards movement of sand.
By 1968 the sediment pathway has been severely compromised by development and
stabilization of vegetation, and by 1989, the system has ceased to function as development
has permanently cut off sand supply from the south. The situation is severely exacerbated
between 1989 and 2000, with unprecedented development in the valley.
In 1979, hummocks are still visible west of the river mouth, but are now backed by a gravel
car park, presumably to reduce windblown sand. Brushwood barriers have been erected to
prevent windblown sand from encroaching on development to the north.
By 1987, the sand encroachment observed in 1979 has been arrested through the
establishment of vegetation on the mobile dunes. Sand trapping barriers have been erected
between the gravel car park in the east and the river mouth, and across the beach to the east
of the mouth.
A comparison of the 1948 and 2011 aerial photos (Figure 1) indicates a major loss of mobile
sand between the two periods. Losses are attributed to an exponential increase in the urban
footprint (2011) with 178.3 ha in 1948 compared with a mere 29.9 ha in 2010. However, a
year later when a major sand ingression occurred at Hout Bay (see below), the area of bare
sand had increased slightly to 30.2 ha.
A site visit to the area by the CSIR on 22 February 1989 reported the following (CSIR, 1989):
(i) Diagonally placed, unvegetated brushwood barriers have been constructed at the eastern end of the beach (1.5 to 3.5 m tall). Sand is periodically removed through bulldozing back onto the beach. A dune of 8 m tall is located inland of Beach Road
(ii) The beach is flat and wide in the vicinity of the river mouth, backed by degraded hummock dunes vegetated with marram grass
(iii) To the west of the river mouth, vegetated compound dunes rise to 13 m. Low, incipient foredunes are located at the base of the higher dunes. A deflation hollow occurs between here and the western car park, with several hummocks – this appears to be the path of the strongest winds and the main source of sand across the car park and into Princess St.
(iv) The sea wall in front of the gravel car park stops windblown sand
(v) The western end of the beach is flat; windblown sand is a problem for the harbour.
hout bay dunes management & rehabilitation plan
10
Source and dynamics of sand supply 6.3
Although Grindley (1988) claims the main source of windblown sand on the mobile dunes
was during the Pleistocene (1.5 my to 14 000 years ago when sea levels dropped to 100 m
below their present levels), she did not explain that sand ingression inland was a recurring
phenomenon, regardless of past exposure. Thus, although much of the Hout Bay-Sandy
mobile dune system has been lost to residential development, the tendency is for sand
supply from Hout Bay to continue.
Hout Bay is a minor, crescentic pocket embayment with a small beach which is protected
from the south-westerly winds, but exposed to those from the south-east. Sand deposition
on the beach is governed by the following factors: long-shore drift, on-off-shore transport (the
latter two due primarily to wave action), sand characteristics (grain size and mass), and wind
(direction, strength and seasonality. Under natural conditions these processes reach a
dynamic equilibrium; however this equilibrium is compromised by manmade interventions in
the area. These include:
(i) The harbour breakwater (400 m long in 1989), with a subsequent northern pier and other quays;
(ii) Construction of a revetment in front of the Yacht Club and parking area
(iii) Building of houses north of the beach;
(iv) Planting of vegetation around the houses;
(v) Possible dredging of the harbour mouth.
Stability of coastline 6.4
Studies have shown that the beach eroded between 1944 and 1979, but that the eastern
section accreted between 1979 and 1987 with the western section eroding during the same
period. The latter was due to the construction of the harbour wall and breakwater, between
1936 and 1966 (Fromme, 1985, in CSIR, 1989a). The main sediment transport is on-off
shore movement, with the potential for such movement increasing towards Flora Bay in the
east (i.e. below the start of Chapman’s Peak Drive). Of major significance is that sand blown
inland is no longer recycled to the beach.
Sand cannot be returned to the western beach by northerly winds due to stabilization of the
Hout Bay-Sandy Bay climbing falling dune. We would also argue that the damper sands in
winter would also greatly impeded southwards movement.
In summary, the CSIR predicted a 40 m3-1yr-1 net northwards movement of sand.
hout bay dunes management & rehabilitation plan
11
Sand movement dynamics 6.5
(i) Wind
Wind velocity ranges from 0 to 20 ms-1, but mostly between 0 and 6 to 8 ms-1.
(ii) Direction
Wind arises mainly in the south and south-south east, but there is also a north-north west to north-west component.
(iii) Sand
Grains are coarser in the east than the west. Finer sand will move more readily.
Using the method of Swart (1986), the following sand movement was computed:
S/SE/SW direction (mainly in summer): 30 + 40 + 11 = 81 m3-1yr-1
N/NW/NE direction (mainly in winter): 10 + 13 + 12 = 35 m3-1yr-1
In other words, a net northwards dominance of wind direction. Note that sand movement is
based upon short-term data and a long-term monitoring of wind velocity is needed.
Dumping of rubble on beachfront 6.6
Rubble has been dumped intermittently over the years on the section of the beach just west
of the Promenade and north of the artificial windrows. This has altered natural sand
movement substantially, with rubble often being exposed in the teeth of a strong south-
easterly, and natural flow of sand inland being impeded.
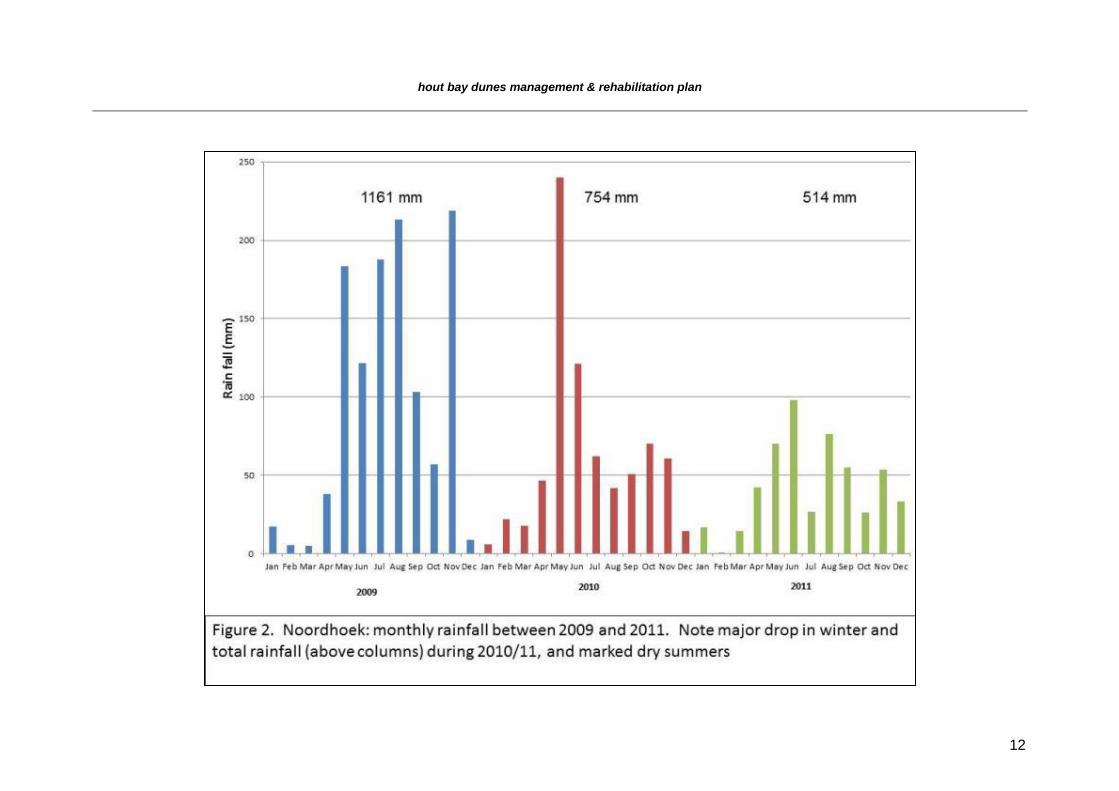
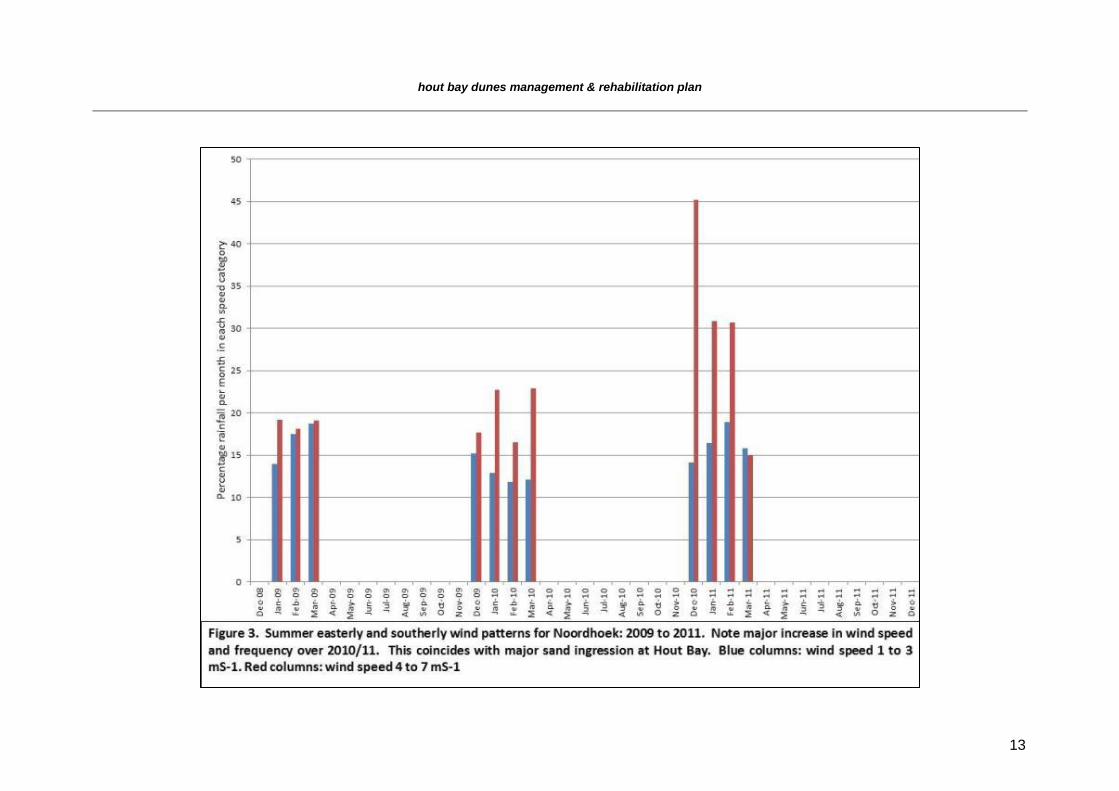
Climate 6.7
Wind strength and direction, and wetness of sand, are the two critical factors affecting sand
movement. Although sand movement is from the south-east along much of the beach,
where is also a strong northwards vector as one moves up the slope of the climbing-falling
dune. Episodic sand pulse activity is also responsible for major ingressions. The major
difference in sand volumes between May 2009 and December 2011 suggests a marked
change in weather patterns, at least for the period under review. Weather data from the
nearest coastal station, Cape Point Farms (Chapman’s Peak unfortunately lacks continuity
due to theft of their server) is shown in Figure 2 (rainfall) and Figure 3 (summer wind
behaviour over the period 2009 to 2011). Detailed windroses for this period appear in
Appendix 1 (Figures A1a – A1f). The results clearly indicate a major shift in rainfall with an
unusually dry period over 2010/11 (Figure 2) coupled with strong easterly winds in summer
(Figure 3 and Appendix 1).
hout bay dunes management & rehabilitation plan
12
hout bay dunes management & rehabilitation plan
13
hout bay dunes management & rehabilitation plan
14
Of concern, too, is that stronger southerlies and easterlies are predicted for the City (City of
Cape Town, 2011). If this prediction is true then this is highly likely to exacerbate the quality
and movement of sand inland at Hout Bay.
(iii) Beach erosion
Between 1944 and 1987, the CSIR ascertained a loss of 46 m of beach at the harbour wall
and 78 m at Beach Road (1989a). The CSIR at that stage regarded the beach to be in
equilibrium (i.e. erosion = accretion). The erosion setback line computed for the artificial
establishment of a dune along the beach was therefore static (see below).
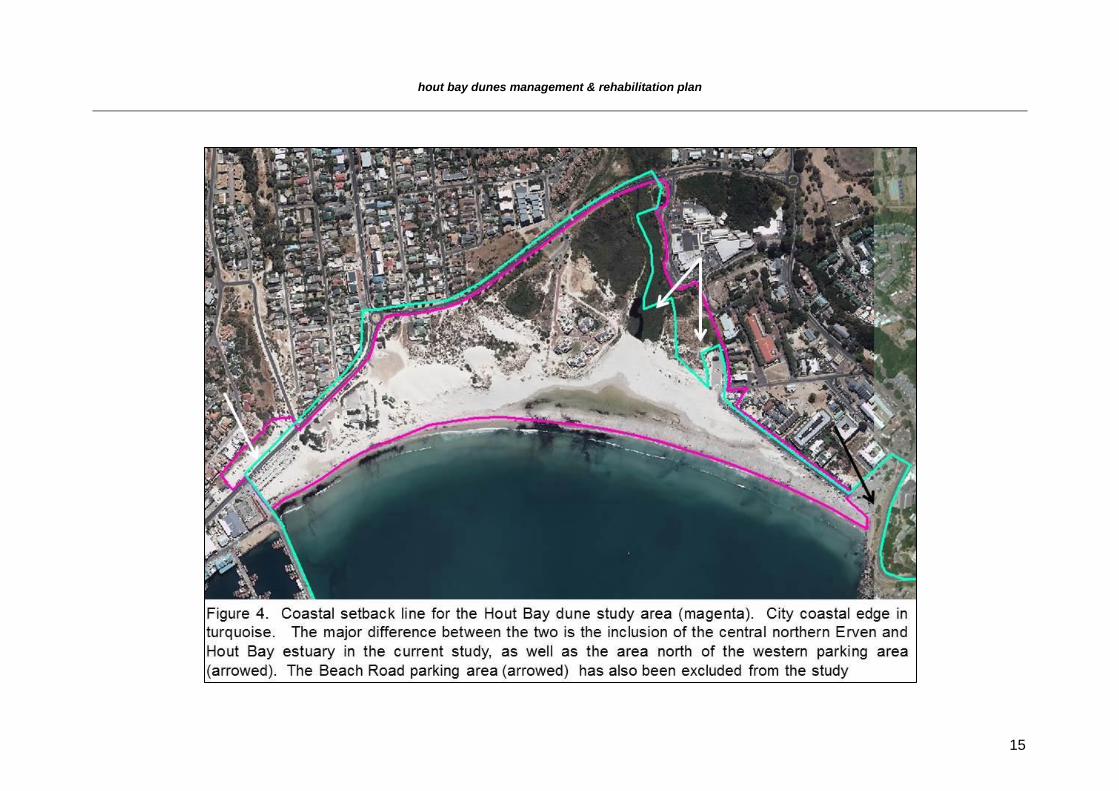
Coastal setback line 6.8
The City’s coastal edge for Hout Bay is shown in Figure 4. For our purposes, this is not a
true coastal setback line as it excludes Erf 9194 and much of Erf no. 653, both which contain
an the important back dune behind the eastern beach. This line also excludes part of the
Hout Bay River estuary. We have used a modified coastal setback line which uses Harbour
and Princess Roads as a boundary, but which includes the above-mentioned dune and
estuary (Figure 4), and this then forms the study area boundary for the project.
Vegetation 6.9
Dune vegetation is described in both Grindley (1988) and the CSIR (1989a). There is a
succession of plant communities between the beach and the stable back dunes.
6.9.1 Tetragonia decumbens-Acacia cyclops Foredunes
Just above the beach foredunes are colonized by Tetragonia decumbens kinkelbossie,
Acacia cyclops rooikrans, and Ammophila arenaria marram grass. Important species include
Tetragonia decumbens, Morella cordifolia dune waxberry, Metalasia muricata blombos,
Seriphium (Stoebe) plumosum slangbos and Chrysanthemoides monilifera bietou.
6.9.2 Metalasia muricata-Restio (Ischyrolepis) eleocharis Dune Fynbos
This community is present east of part of the Hout Bay-Sandy Bay climbing falling dune and
acts as a buffer between development and the mobile dune. Dominant species include
Metalasia muricata, Passerina corymbosa (P.vulgaris) gonnabas, Ehrharta villosa pypgras
and Hellmuthia membranacea duinebiesie.
hout bay dunes management & rehabilitation plan
15
hout bay dunes management & rehabilitation plan
16
6.9.1 Searsia (Rhus) glauca-Salvia africana-lutea Dune Scrub
This community represents the transition between Dune Fynbos and Dune Thicket (see
below) and is found in the stable dunes east of the Hout Bay River and reaching from 1 to
4 m tall. Dominant species include: Searsia glauca bloukoeniebos, Euclea racemosa
seeghwarrie, Olea exasperata slanghout, Osyris compressa Cape sumach, Otholobium
bracteolatum (O.fruticans) skaapbostee, Muraltia (Nylandtia) spinosa skilpadbessie and
Restio (Ischyrolepis) eleocharis duinekatstert.
6.9.2 Sideroxylon inerme-Chionanthus foveolatus Dune Thicket
This provides a good example of dune climax vegetation in the valley, reaching some 8 m
tall. The single canopy community is dominated by Sideroxylon inerme milkwood,
Chionanthus foveolatus fine-leaved ironwood, and Cassine peragua bastersaffraan. Large
Olea europaea subsp. africana individuals are also found.
6.9.3 Riverine vegetation
Although not particularly related to the current study, it is worth noting that the Hout Bay
River supports large stands of Phragmites australis fluitjiesriet along the edges of its main
channel and especially in its floodplain. The river tends to block during summer (low flow
and sand build up at the mouth), with a lagoon which could reach 500 m in length and 30 to
40 m wide (Grindley, 1988). The presence of primary mobile dunes at the mouth is thus
crucial to maintaining the seasonal lagoon, with winter spates breaking through these dunes
and providing a seasonal outlet to the sea.
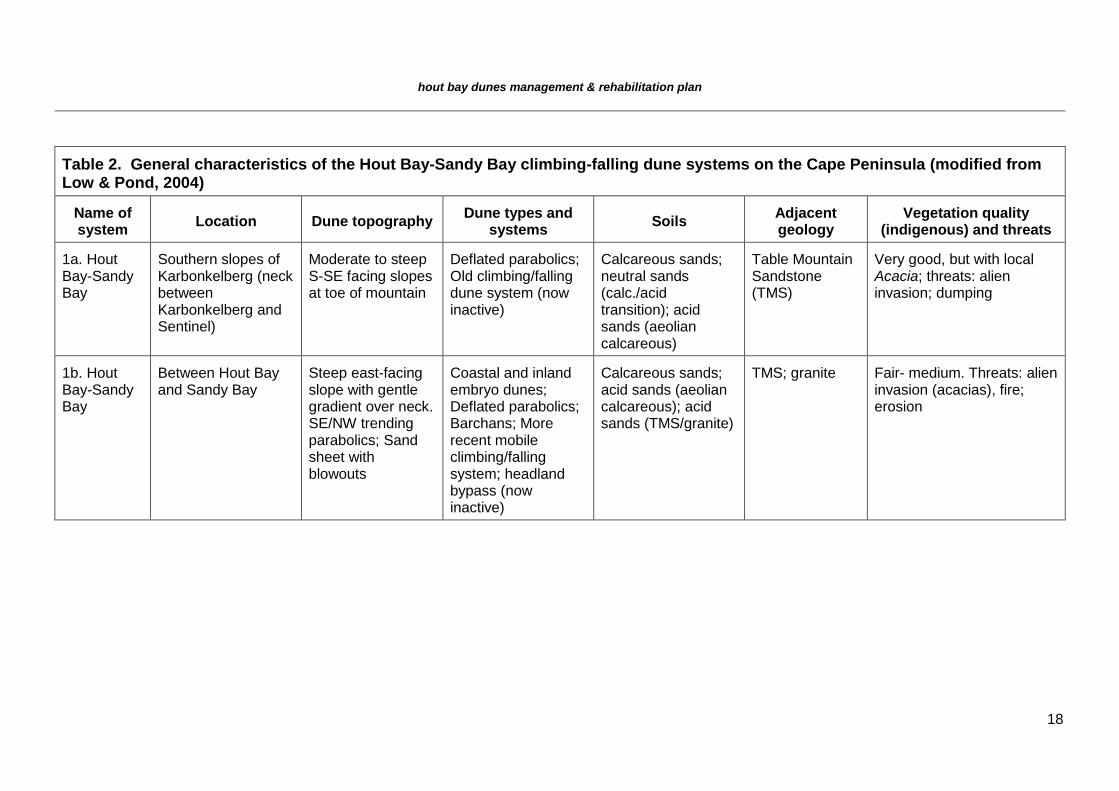
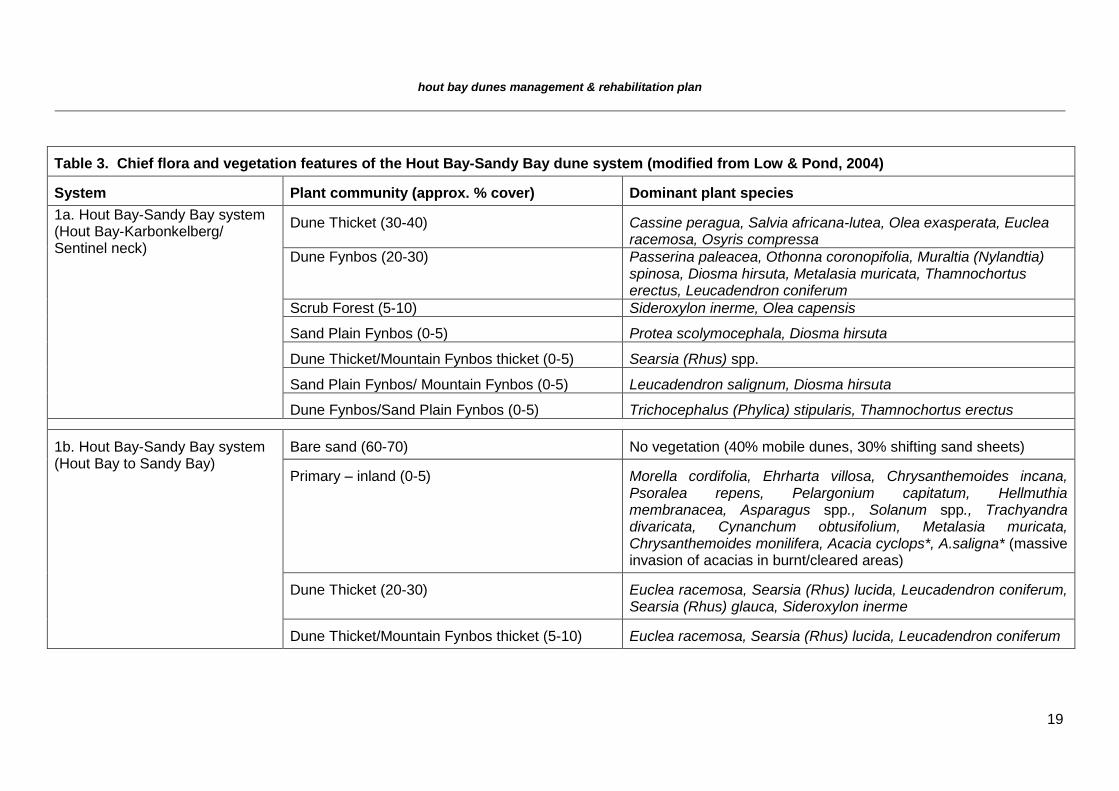
A semi-detailed account of the dune characteristics in the area is given for the Hout Bay-
Sandy Bay systems (Table 2), and is derived from Low & Pond’s (2004) qualitative
assessment of the dune vegetation of the Cape Peninsula. Table 3 depicts the dominant
flora and community types for the Hout Bay-Sandy Bay system and both provide a good
indication of the diversity in both dune type as well as botany found here.
hout bay dunes management & rehabilitation plan
17
History of planning in area 6.10
At this stage it is appropriate to briefly highlight the role of inappropriate historical planning
decisions and how these are linked to challenges we are currently facing in Hout Bay. Urban
development in Hout Bay has severely compromised not only the functioning of the climbing-
falling dune system between Hout Bay and Sandy Bay, but has also led to high pollution,
altered flow rates and artificial narrowing of the Hout Bay River, through developments too
close to the river banks, with major negative impacts on the beachfront itself, through
construction of housing within the primary dune system. Inappropriate development
includes:
(i) The Hout Bay Beach Club (Hout Bay River estuary and primary dunes)
(ii) Beach Road, Promenade, car park and associated development (dunes)
(iii) Hout Bay harbour (dunes, coastline)
(iv) Mariner’s Wharf car park (dunes)
(v) Yacht Club; law enforcement offices (dunes)
(vi) Guesthouse (dunes).
hout bay dunes management & rehabilitation plan
18
Table 2. General characteristics of the Hout Bay-Sandy Bay climbing-falling dune systems on the Cape Peninsula (modified from Low & Pond, 2004)
Name of system
Location Dune topography Dune types and
systems Soils
Adjacent geology
Vegetation quality (indigenous) and threats
1a. Hout Bay-Sandy Bay
Southern slopes of Karbonkelberg (neck between Karbonkelberg and Sentinel)
Moderate to steep S-SE facing slopes at toe of mountain
Deflated parabolics; Old climbing/falling dune system (now inactive)
Calcareous sands; neutral sands (calc./acid transition); acid sands (aeolian calcareous)
Table Mountain Sandstone (TMS)
Very good, but with local Acacia; threats: alien invasion; dumping
1b. Hout Bay-Sandy Bay
Between Hout Bay and Sandy Bay
Steep east-facing slope with gentle gradient over neck. SE/NW trending parabolics; Sand sheet with blowouts
Coastal and inland embryo dunes; Deflated parabolics; Barchans; More recent mobile climbing/falling system; headland bypass (now inactive)
Calcareous sands; acid sands (aeolian calcareous); acid sands (TMS/granite)
TMS; granite Fair- medium. Threats: alien invasion (acacias), fire; erosion
hout bay dunes management & rehabilitation plan
19
Table 3. Chief flora and vegetation features of the Hout Bay-Sandy Bay dune system (modified from Low & Pond, 2004)
System Plant community (approx. % cover) Dominant plant species
1a. Hout Bay-Sandy Bay system (Hout Bay-Karbonkelberg/ Sentinel neck)
Dune Thicket (30-40) Cassine peragua, Salvia africana-lutea, Olea exasperata, Euclea racemosa, Osyris compressa
Dune Fynbos (20-30) Passerina paleacea, Othonna coronopifolia, Muraltia (Nylandtia) spinosa, Diosma hirsuta, Metalasia muricata, Thamnochortus erectus, Leucadendron coniferum
Scrub Forest (5-10) Sideroxylon inerme, Olea capensis
Sand Plain Fynbos (0-5) Protea scolymocephala, Diosma hirsuta
Dune Thicket/Mountain Fynbos thicket (0-5) Searsia (Rhus) spp.
Sand Plain Fynbos/ Mountain Fynbos (0-5) Leucadendron salignum, Diosma hirsuta
Dune Fynbos/Sand Plain Fynbos (0-5) Trichocephalus (Phylica) stipularis, Thamnochortus erectus
1b. Hout Bay-Sandy Bay system (Hout Bay to Sandy Bay)
Bare sand (60-70) No vegetation (40% mobile dunes, 30% shifting sand sheets)
Primary – inland (0-5) Morella cordifolia, Ehrharta villosa, Chrysanthemoides incana, Psoralea repens, Pelargonium capitatum, Hellmuthia membranacea, Asparagus spp., Solanum spp., Trachyandra divaricata, Cynanchum obtusifolium, Metalasia muricata, Chrysanthemoides monilifera, Acacia cyclops*, A.saligna* (massive invasion of acacias in burnt/cleared areas)
Dune Thicket (20-30) Euclea racemosa, Searsia (Rhus) lucida, Leucadendron coniferum, Searsia (Rhus) glauca, Sideroxylon inerme
Dune Thicket/Mountain Fynbos thicket (5-10) Euclea racemosa, Searsia (Rhus) lucida, Leucadendron coniferum
hout bay dunes management & rehabilitation plan
20
7. REVIEW OF BIG BAY AND DOLPHIN BEACH MANAGEMENT APPROACHES
A review of coastal dune management at Big Bay and Dolphin Beach indicates a number of
positive and negative aspects. Despite poor planning approvals, which led to development in
inappropriate sites, success was most evident when management was applied
immediately after construction. Big Bay has demonstrated major successes in dune
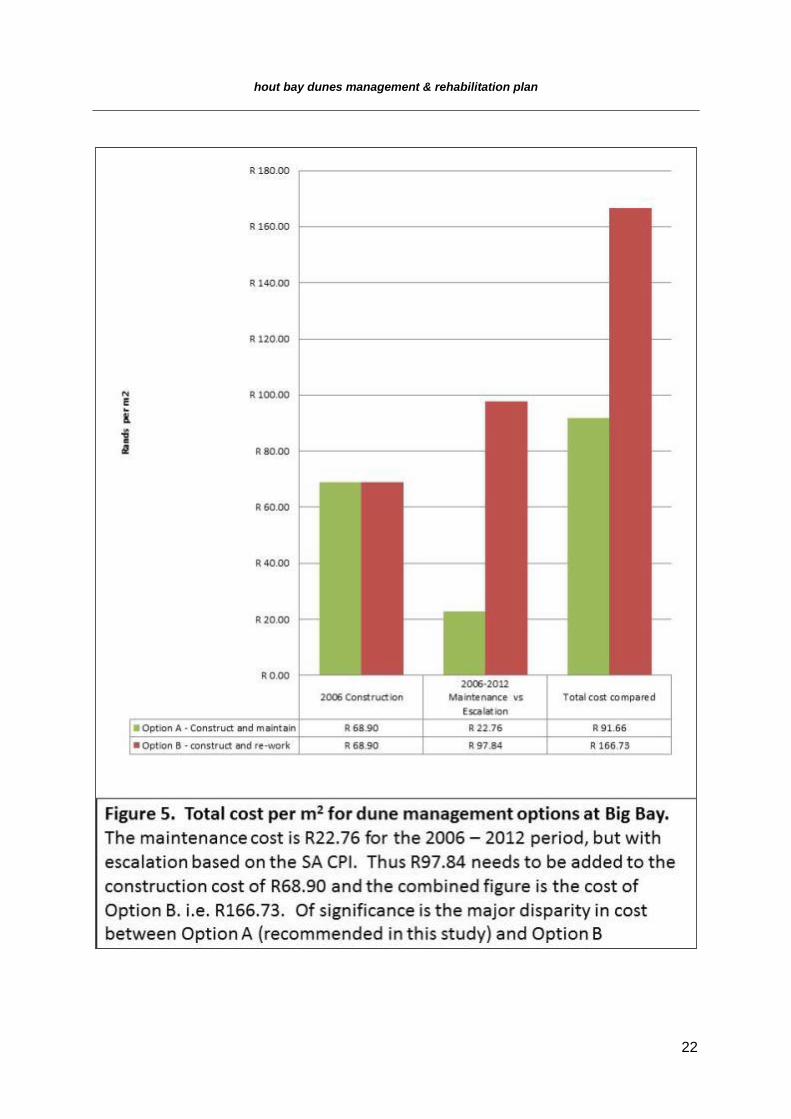
management in the post-construction phase over the last seven years (Figure 5). On the
other hand, Dolphin Beach functioned very well during the first four years after construction,
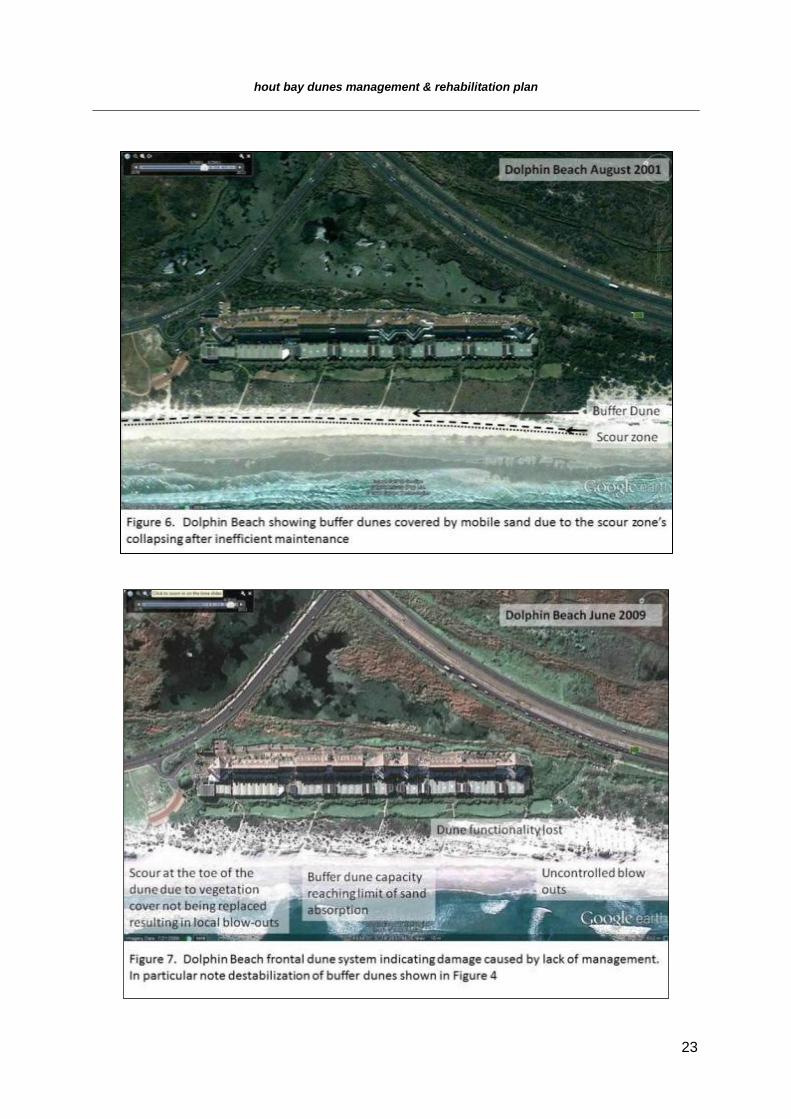
until 1999, when maintenance was curtailed (Figure 5). The impact of reduced maintenance
resulted in the loss of frontal dune vegetation. This accelerated sand accumulation in the
buffer dune by 2001, with the dune system becoming unstable by 2009. Ad hoc
interventions, including sand removal, planting and brush wood fence placement, have been
ineffectual and the approach is currently under review in order to restore the management
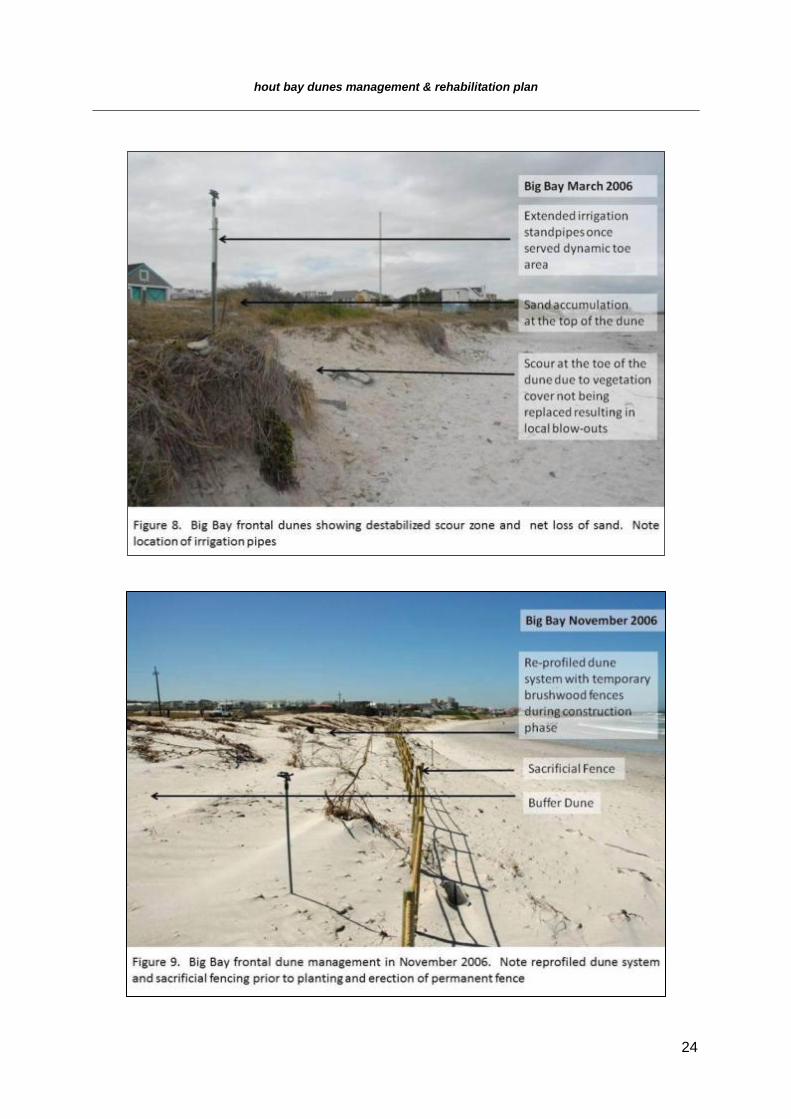
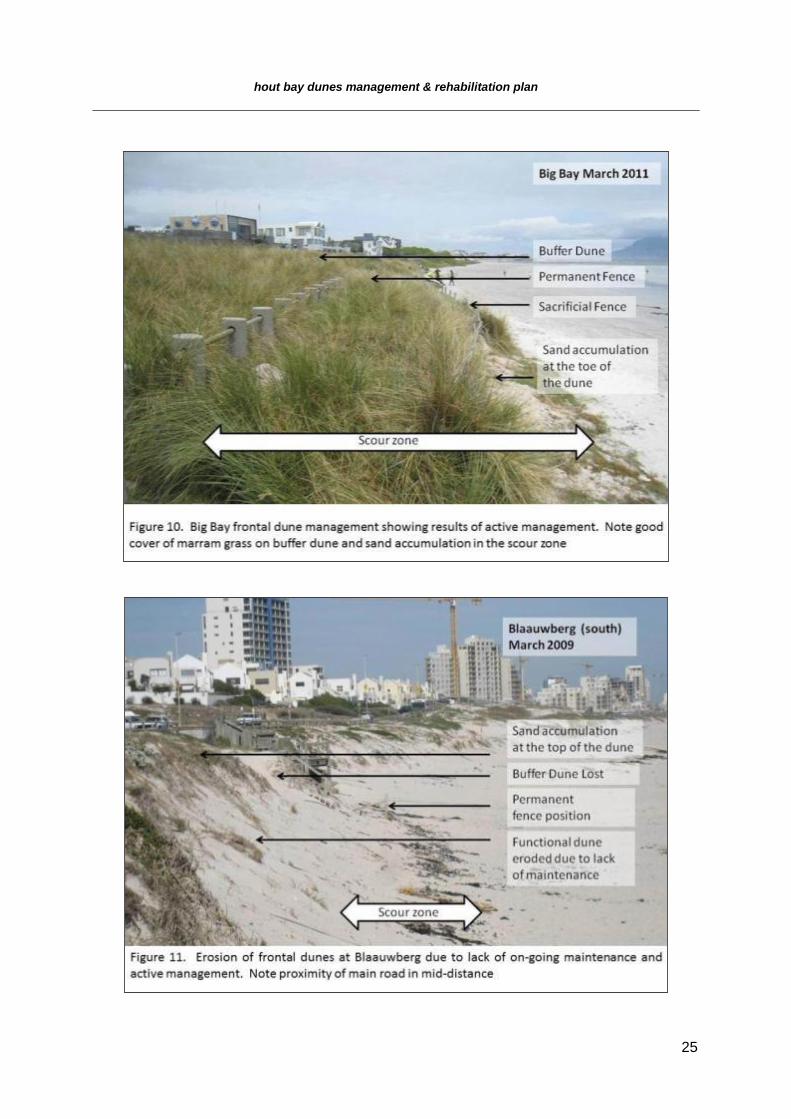
and functionality of the dune system. A summary of management interventions along this
coastline is shown in Figures 6 and 7 (Dolphin Beach), Figures 8 to 10 (Big Bay) and
Figure 11 (Blaauwberg).
Advantages of this approach 7.1
7.1.1 Possible management permutations are reduced and impacts are mitigated.
(a) Known parameters and predictable outcomes (within a range of variables) allow for effective long-term planning and management.
(b) Detailed management strategies can be incorporated into OEMP’s that can serve as an institutionalized memory. These OEMP’s can be adjusted over time as management techniques improve.
7.1.2 Reduced long term cost
(a) It has been shown at all the reference sites that the initial cost of repair is far greater than diligent ongoing maintenance
(b) Once systems are in place, management and external consultation is restricted to preventative management approaches and costly, ineffective ad hoc crisis management is avoided
7.1.3 Solution to critical issues such as nuisance
7.1.4 Restore system balance to “designer state”, based upon the profile provided by the CSIR (1991)
7.1.5 Scheduled maintenance can be predicted and included in budgets as part of a timeline of management interventions
hout bay dunes management & rehabilitation plan
21
7.1.6 The City environment gains benefits from a more functional dune system and concomitant delivery of ecosystem services, especially in combatting storm surges and controlling wind-blown sand.
Implications of this approach 7.2
7.2.1 A basic assessment2 is required
7.2.2 Cost, and possible phased implementation because of this
7.2.3 Management required during planning, implementation and maintenance
7.2.4 Public must be informed and perceptions must be managed
7.2.5 Disposal of sand might require a mining license, whilst other disposal methods present major challenges and even difficulties.
Table 4 provides an evaluation of artificial and managed dune profiles at Big Bay and
Dolphin Beach.
2Basic Assessment is the level of environmental assessment applied to activities listed in Listing 1 of
the regulations. These are smaller scale activities, the impacts of which are generally known and can be easily managed. See: http://www.eiatoolkit.ewt.org.za Listing 1: http://www.eiatoolkit.ewt.org.za/legal/listing1.html
hout bay dunes management & rehabilitation plan
22
hout bay dunes management & rehabilitation plan
23
hout bay dunes management & rehabilitation plan
24
hout bay dunes management & rehabilitation plan
25
hout bay dunes management & rehabilitation plan
26
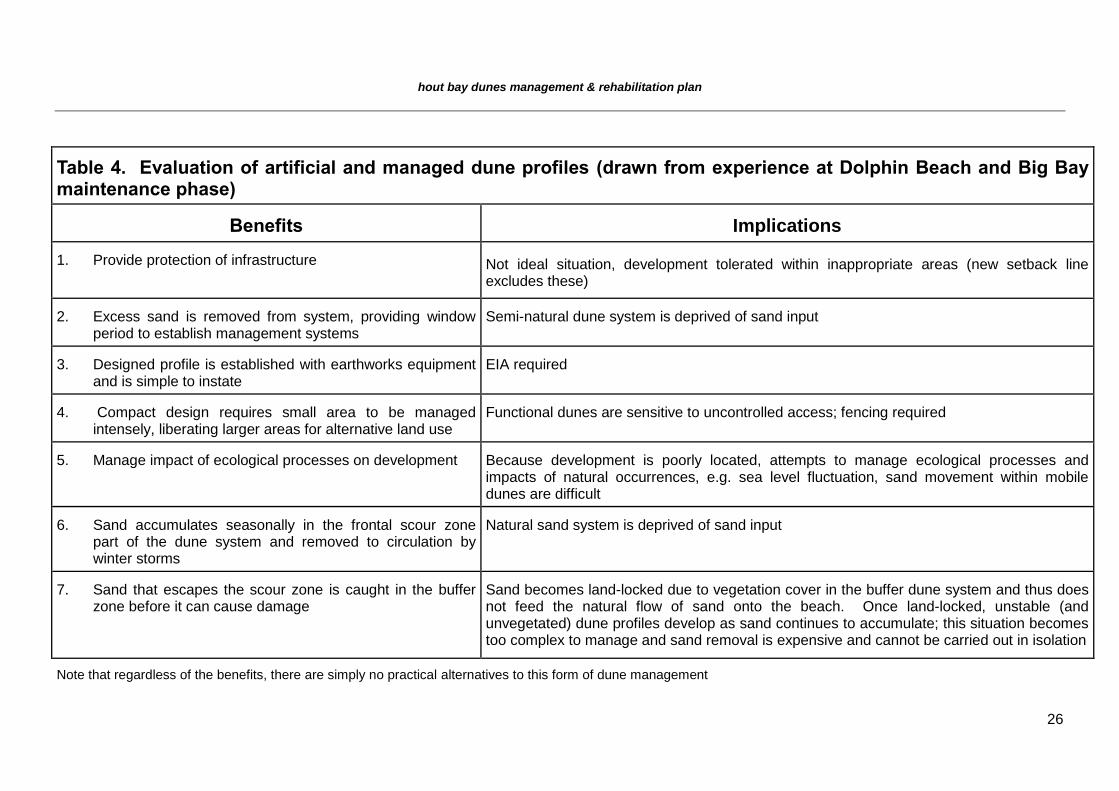
Table 4. Evaluation of artificial and managed dune profiles (drawn from experience at Dolphin Beach and Big Bay maintenance phase)
Benefits Implications
1. Provide protection of infrastructure Not ideal situation, development tolerated within inappropriate areas (new setback line excludes these)
2. Excess sand is removed from system, providing window period to establish management systems
Semi-natural dune system is deprived of sand input
3. Designed profile is established with earthworks equipment and is simple to instate
EIA required
4. Compact design requires small area to be managed intensely, liberating larger areas for alternative land use
Functional dunes are sensitive to uncontrolled access; fencing required
5. Manage impact of ecological processes on development Because development is poorly located, attempts to manage ecological processes and impacts of natural occurrences, e.g. sea level fluctuation, sand movement within mobile dunes are difficult
6. Sand accumulates seasonally in the frontal scour zone part of the dune system and removed to circulation by winter storms
Natural sand system is deprived of sand input
7. Sand that escapes the scour zone is caught in the buffer zone before it can cause damage
Sand becomes land-locked due to vegetation cover in the buffer dune system and thus does not feed the natural flow of sand onto the beach. Once land-locked, unstable (and unvegetated) dune profiles develop as sand continues to accumulate; this situation becomes too complex to manage and sand removal is expensive and cannot be carried out in isolation
Note that regardless of the benefits, there are simply no practical alternatives to this form of dune management
hout bay dunes management & rehabilitation plan
27
8. EVALUATION OF SAND MOVEMENT AT HOUT BAY BETWEEN 2009 AND 2011
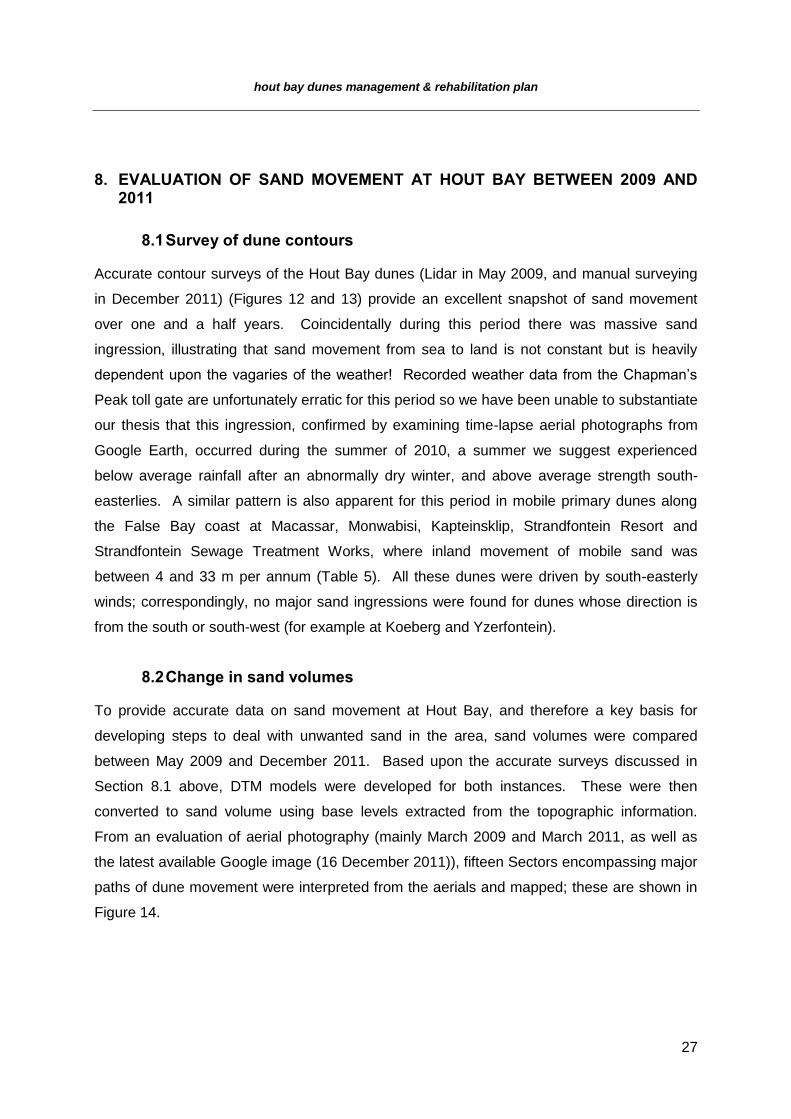
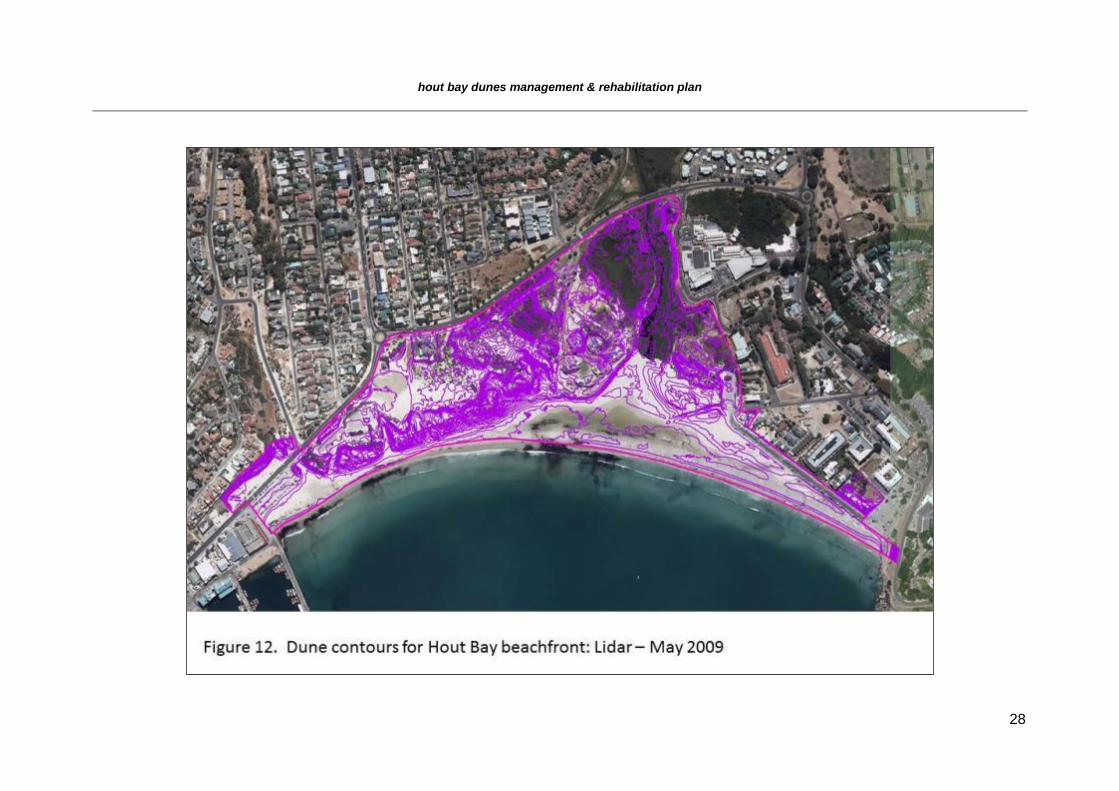
Survey of dune contours 8.1
Accurate contour surveys of the Hout Bay dunes (Lidar in May 2009, and manual surveying
in December 2011) (Figures 12 and 13) provide an excellent snapshot of sand movement
over one and a half years. Coincidentally during this period there was massive sand
ingression, illustrating that sand movement from sea to land is not constant but is heavily
dependent upon the vagaries of the weather! Recorded weather data from the Chapman’s
Peak toll gate are unfortunately erratic for this period so we have been unable to substantiate
our thesis that this ingression, confirmed by examining time-lapse aerial photographs from
Google Earth, occurred during the summer of 2010, a summer we suggest experienced
below average rainfall after an abnormally dry winter, and above average strength south-
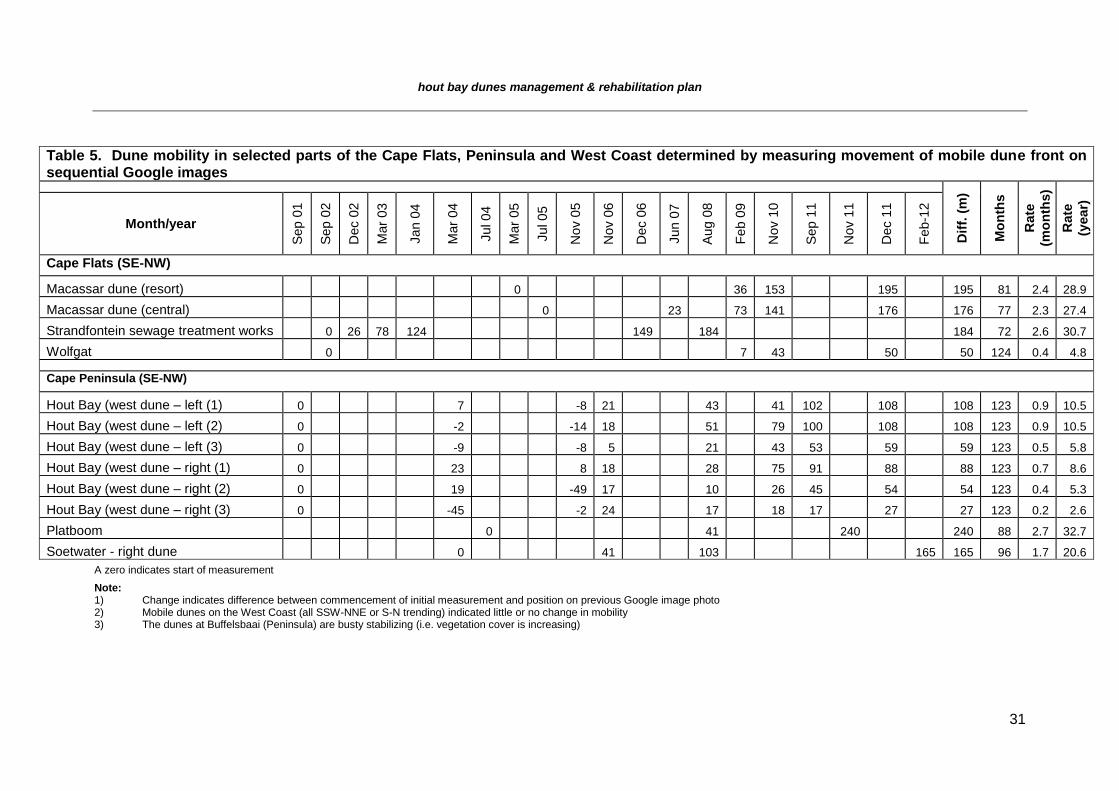
easterlies. A similar pattern is also apparent for this period in mobile primary dunes along
the False Bay coast at Macassar, Monwabisi, Kapteinsklip, Strandfontein Resort and
Strandfontein Sewage Treatment Works, where inland movement of mobile sand was
between 4 and 33 m per annum (Table 5). All these dunes were driven by south-easterly
winds; correspondingly, no major sand ingressions were found for dunes whose direction is
from the south or south-west (for example at Koeberg and Yzerfontein).
Change in sand volumes 8.2
To provide accurate data on sand movement at Hout Bay, and therefore a key basis for
developing steps to deal with unwanted sand in the area, sand volumes were compared
between May 2009 and December 2011. Based upon the accurate surveys discussed in
Section 8.1 above, DTM models were developed for both instances. These were then
converted to sand volume using base levels extracted from the topographic information.
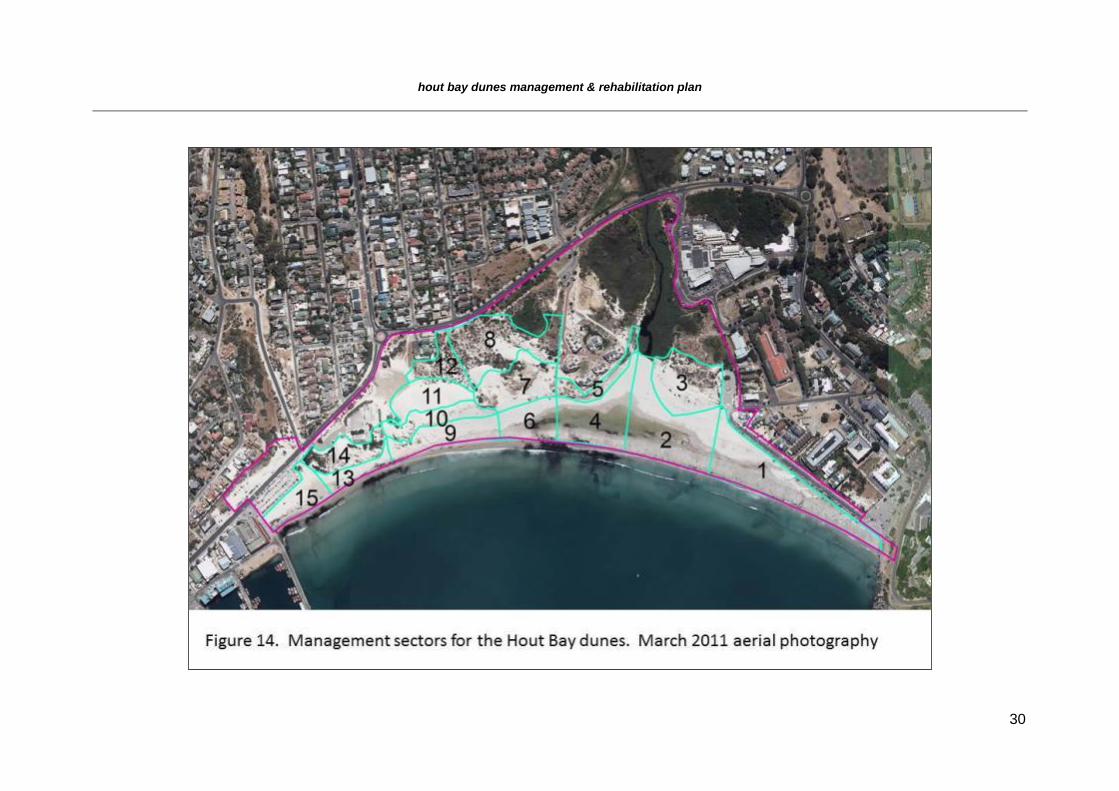
From an evaluation of aerial photography (mainly March 2009 and March 2011, as well as
the latest available Google image (16 December 2011)), fifteen Sectors encompassing major
paths of dune movement were interpreted from the aerials and mapped; these are shown in
Figure 14.
hout bay dunes management & rehabilitation plan
28
hout bay dunes management & rehabilitation plan
29
hout bay dunes management & rehabilitation plan
30
hout bay dunes management & rehabilitation plan
31
Table 5. Dune mobility in selected parts of the Cape Flats, Peninsula and West Coast determined by measuring movement of mobile dune front on sequential Google images
Dif
f. (
m)
Mo
nth
s
Rate
(mo
nth
s)
Rate
(year)
Month/year
Sep 0
1
Sep 0
2
Dec 0
2
Mar
03
Jan 0
4
Mar
04
Jul 04
Mar
05
Jul 05
Nov 0
5
Nov 0
6
Dec 0
6
Jun 0
7
Aug 0
8
Feb 0
9
Nov 1
0
Sep 1
1
Nov 1
1
Dec 1
1
Feb-1
2
Cape Flats (SE-NW)
Macassar dune (resort)
0
36 153
195
195 81 2.4 28.9
Macassar dune (central)
0
23
73 141
176
176 77 2.3 27.4
Strandfontein sewage treatment works 0 26 78 124
149
184
184 72 2.6 30.7
Wolfgat 0
7 43
50
50 124 0.4 4.8
Cape Peninsula (SE-NW)
Hout Bay (west dune – left (1) 0
7
-8 21
43
41 102
108
108 123 0.9 10.5
Hout Bay (west dune – left (2) 0 -2 -14 18 51 79 100 108 108 123 0.9 10.5
Hout Bay (west dune – left (3) 0 -9 -8 5 21 43 53 59 59 123 0.5 5.8
Hout Bay (west dune – right (1) 0 23 8 18 28 75 91 88 88 123 0.7 8.6
Hout Bay (west dune – right (2) 0 19 -49 17 10 26 45 54 54 123 0.4 5.3
Hout Bay (west dune – right (3) 0 -45 -2 24 17 18 17 27 27 123 0.2 2.6
Platboom
0
41
240
240 88 2.7 32.7
Soetwater - right dune
0
41
103
165 165 96 1.7 20.6
A zero indicates start of measurement
Note: 1) Change indicates difference between commencement of initial measurement and position on previous Google image photo 2) Mobile dunes on the West Coast (all SSW-NNE or S-N trending) indicated little or no change in mobility 3) The dunes at Buffelsbaai (Peninsula) are busty stabilizing (i.e. vegetation cover is increasing)
hout bay dunes management & rehabilitation plan
32
9. MANAGEMENT OF HOUT BAY DUNES
Based upon the past experiences of dune management at Hout Bay, particularly through the
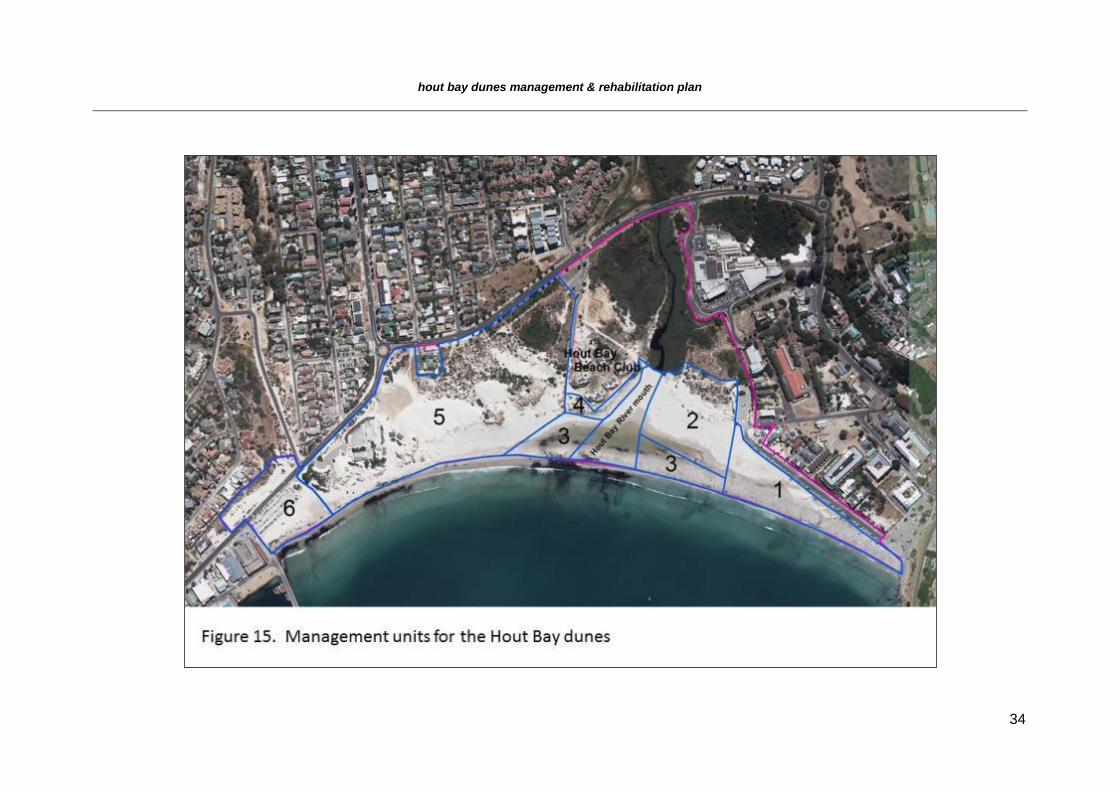
work of the CSIR (1989), and more recently at Big Bay and Dolphin Beach (see above), we
have provided four possible scenarios for dune management at Hout Bay (Table 6). The site
has been divided into six Management Units (MU’s) (Figure 15) which are designed to
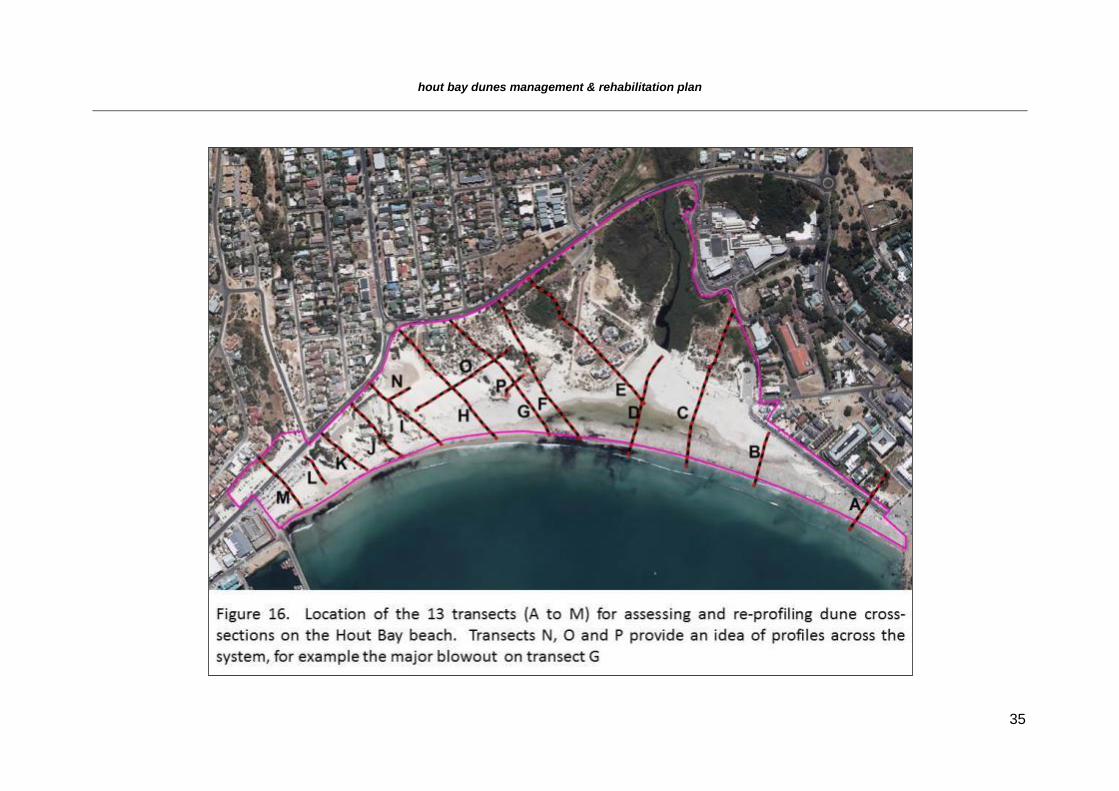
optimize implementation of the proposed interventions. In each MU, transects have been
drawn, based upon a field survey (Figure 16), to provide detail of current and desirable future
dune cross-sections or profiles, and response to current maintenance practices and past
interventions such as the implementation of the structured interventions in MU’s 4, and 5.
The re-profiled dune is crucial to the success of implementing the management
strategy for Hout Bay beach.
Dune management options3 9.1
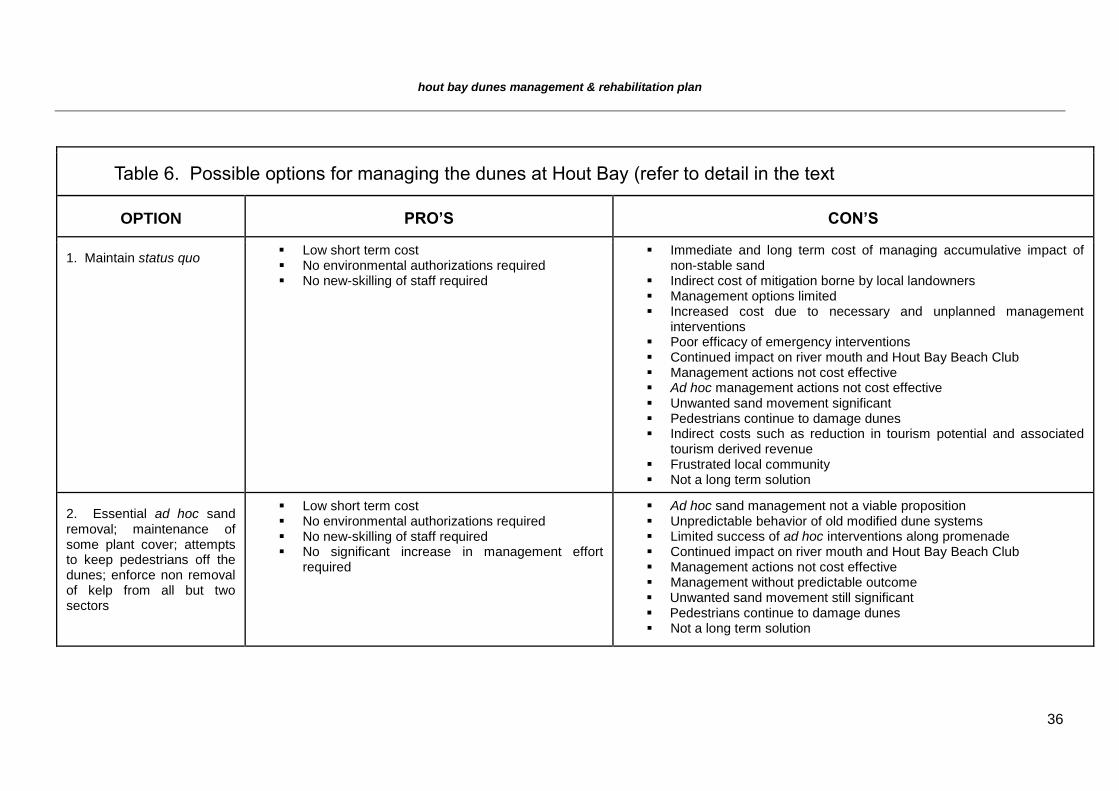
Option 1 effectively is the business as usual approach (Table 6). The major advantages are
that it offers a low cost option in the short term, no environmental authorization and no
skilling of staff. However, the negatives are substantial and include long term cost in
repeated management interventions, continued impact on the Hout Bay River mouth,
continued ad hoc management interventions and ongoing damage by pedestrians. In
essence there is very little reduction in sand movement with significant volumes
accumulating in the area
Option 2 addresses essential removal of sand and the maintenance of some plant cover,
with some attempts at pedestrian control. Again this is a low cost Option, with no
environmental authorization required, no skilling of staff and very little increase in
management effort. The Option involves ad hoc removal of sand, continued impact on the
river mouth, and although the damage to the dunes by pedestrians is reduced, it is
nevertheless unchecked. As with Option 1, unwanted movement and accumulation of sand
continues.
3 The City is incurring significant costs as a consequence of the management status quo on the Hout
Bay beachfront. Under this scenario, these costs are expected to increase exponentially into the future
hout bay dunes management & rehabilitation plan
33
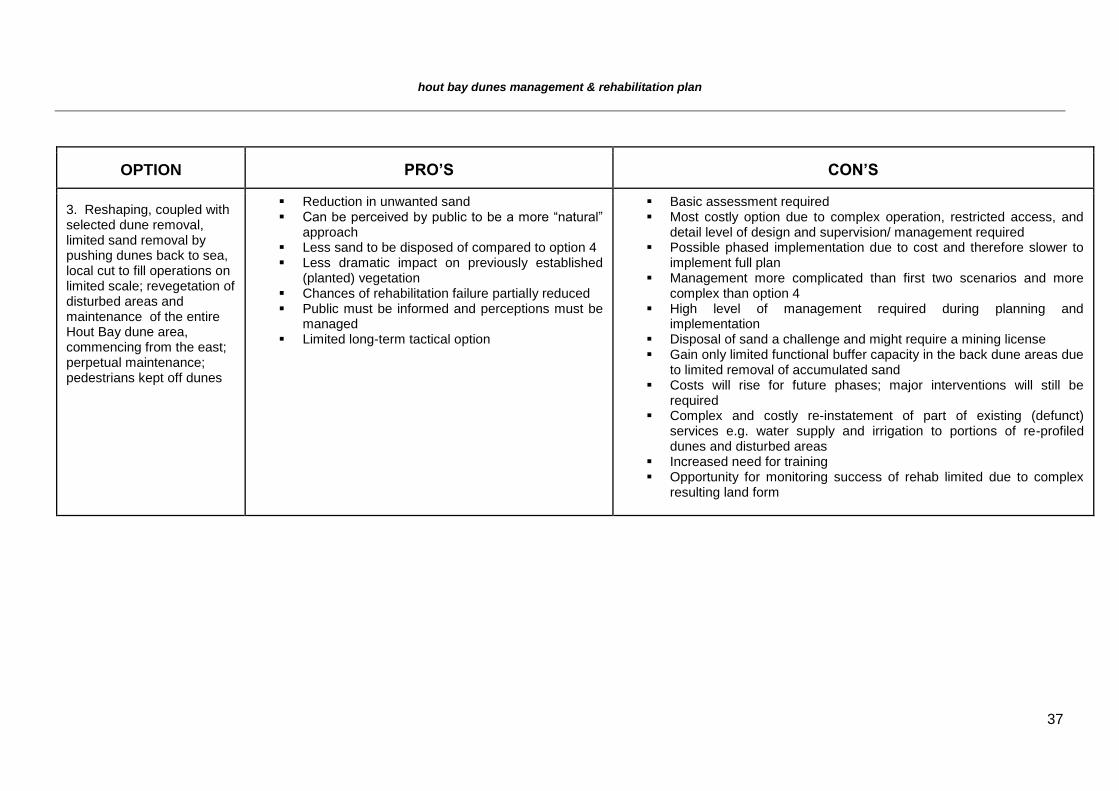
In Option 3, reshaping of the dunes is included, coupled with selective dune removal,
revegetation of disturbed areas and maintenance of the entire dune field on a long-term
basis, with pedestrians being kept off the dunes. This approach would lead to a reduction in
unwanted sand with chances of rehabilitation failure partially reduced. However, the
approach would require a Basic Assessment and is far more costly in the short term than the
above Options. This might result in a phased implementation of methods, with the whole
system not being managed as an entity. This Option requires a high level of management
during planning and implementation and sand disposal will be a challenge. The Option will
also require the reinstatement of water supply, re-profiling and revegetating of dunes, and
staff training will be needed for the more advanced management methods. Option 4 is
preferred as, in our opinion, it offers the best long-term and most cost-effective solution to
dealing with sand management and removal at Hout Bay, and stresses the need for
perpetual maintenance. It also requires the greatest intervention in that the whole dune
system needs major re-profiling, from the east to west, with removal of large volumes of
sand. Newly profiled dunes would need effective revegetating, with installation of new
irrigation and water supply. All infrastructure within the designated area should be removed.
Management interventions would be permanent and pedestrians would need to be kept off
the dunes at all times. This Option would allow the City to more successfully deal with
unwanted sand and should see the development of well-vegetated dunes with a subsequent
reduction in windblown sand, particularly during the dry summer months. Chances of
rehabilitation failure are substantially reduced, and, above all, costs are drastically reduced
(see outcome of business as usual versus long term intervention management for Big Bay
(see above). Negatives are the requirement of a Basic Assessment, relatively high costs in
the short term, and high level of management inputs. Disposal of high volumes of sand
would also be a major challenge and might require a mining licence.
hout bay dunes management & rehabilitation plan
34
hout bay dunes management & rehabilitation plan
35
hout bay dunes management & rehabilitation plan
36
Table 6. Possible options for managing the dunes at Hout Bay (refer to detail in the text
OPTION PRO’S CON’S
1. Maintain status quo Low short term cost No environmental authorizations required No new-skilling of staff required
Immediate and long term cost of managing accumulative impact of non-stable sand
Indirect cost of mitigation borne by local landowners Management options limited Increased cost due to necessary and unplanned management
interventions Poor efficacy of emergency interventions Continued impact on river mouth and Hout Bay Beach Club Management actions not cost effective Ad hoc management actions not cost effective Unwanted sand movement significant Pedestrians continue to damage dunes Indirect costs such as reduction in tourism potential and associated
tourism derived revenue Frustrated local community Not a long term solution
2. Essential ad hoc sand removal; maintenance of some plant cover; attempts to keep pedestrians off the dunes; enforce non removal of kelp from all but two sectors
Low short term cost No environmental authorizations required No new-skilling of staff required No significant increase in management effort
required
Ad hoc sand management not a viable proposition Unpredictable behavior of old modified dune systems Limited success of ad hoc interventions along promenade Continued impact on river mouth and Hout Bay Beach Club Management actions not cost effective Management without predictable outcome Unwanted sand movement still significant Pedestrians continue to damage dunes Not a long term solution
hout bay dunes management & rehabilitation plan
37
OPTION PRO’S CON’S
3. Reshaping, coupled with selected dune removal, limited sand removal by pushing dunes back to sea, local cut to fill operations on limited scale; revegetation of disturbed areas and maintenance of the entire Hout Bay dune area, commencing from the east; perpetual maintenance; pedestrians kept off dunes
Reduction in unwanted sand Can be perceived by public to be a more “natural”
approach Less sand to be disposed of compared to option 4 Less dramatic impact on previously established
(planted) vegetation Chances of rehabilitation failure partially reduced Public must be informed and perceptions must be
managed Limited long-term tactical option
Basic assessment required Most costly option due to complex operation, restricted access, and
detail level of design and supervision/ management required Possible phased implementation due to cost and therefore slower to
implement full plan Management more complicated than first two scenarios and more
complex than option 4 High level of management required during planning and
implementation Disposal of sand a challenge and might require a mining license Gain only limited functional buffer capacity in the back dune areas due
to limited removal of accumulated sand Costs will rise for future phases; major interventions will still be
required Complex and costly re-instatement of part of existing (defunct)
services e.g. water supply and irrigation to portions of re-profiled dunes and disturbed areas
Increased need for training Opportunity for monitoring success of rehab limited due to complex
resulting land form
hout bay dunes management & rehabilitation plan
38
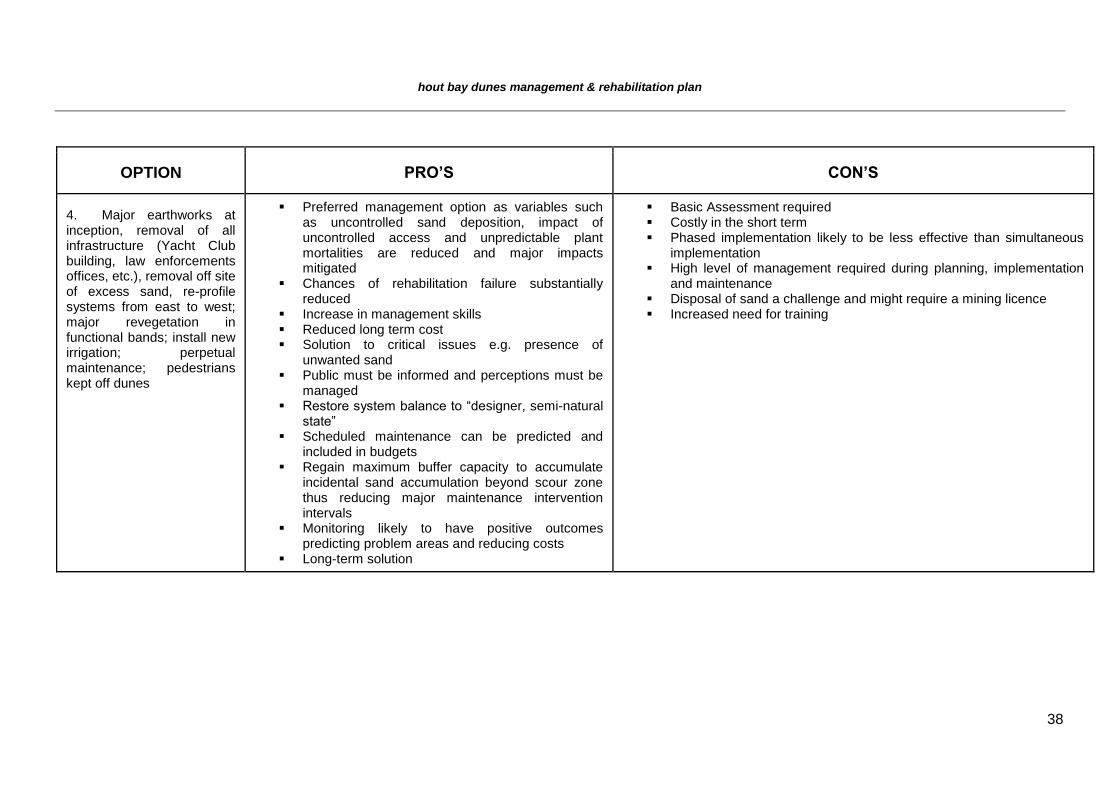
OPTION PRO’S CON’S
4. Major earthworks at inception, removal of all infrastructure (Yacht Club building, law enforcements offices, etc.), removal off site of excess sand, re-profile systems from east to west; major revegetation in functional bands; install new irrigation; perpetual maintenance; pedestrians kept off dunes
Preferred management option as variables such as uncontrolled sand deposition, impact of uncontrolled access and unpredictable plant mortalities are reduced and major impacts mitigated
Chances of rehabilitation failure substantially reduced
Increase in management skills Reduced long term cost Solution to critical issues e.g. presence of
unwanted sand Public must be informed and perceptions must be
managed Restore system balance to “designer, semi-natural
state” Scheduled maintenance can be predicted and
included in budgets Regain maximum buffer capacity to accumulate
incidental sand accumulation beyond scour zone thus reducing major maintenance intervention intervals
Monitoring likely to have positive outcomes predicting problem areas and reducing costs
Long-term solution
Basic Assessment required Costly in the short term Phased implementation likely to be less effective than simultaneous
implementation High level of management required during planning, implementation
and maintenance Disposal of sand a challenge and might require a mining licence Increased need for training
hout bay dunes management & rehabilitation plan
39
In short, the entire Hout Bay dune system must be managed as an integrated system
and NOT in piecemeal fashion, as has happened in the past. Management should be
phased in from the east and in the shortest possible timeframe. Part implementation of the
proposals would lead to inadequate management and more costly interventions at a later
stage (see Figure 5). It is for this reason that we have selected Option 4 (Table 6) as the
preferred approach to holistic management of this dune system. This has followed several
discussions with the project management team and the City, and represents an effort which
not only should save the City substantial costs in management in the long-term, but also in
developing a dune system which provides the lowest nuisance value with regard to
windblown sand.
For Option 4 to succeed, major earthworks, followed by dune reshaping and vegetating, are
required. The CSIR report (CSIR, 1989a) deals with four management zones, with an
additional area added when the Hout Bay Beach Club was developed. The review of the
sand volume movement between May 2009 and December 2011 has resulted in the division
of the dune system into 15 sectors (Figure 15) that reflect a net accrual or loss during the
period. In order to expedite more efficient management, some of these sectors have been
grouped together into “functional or management units” that can be implemented as a single
phase in a possible sequence of management interventions.
Six management units are recognized (MU 1 to 6 – see Figure 16). These are the eastern
beach, between Beach road and the first back dune system (MU1 – Sector 1 (see
Figure 15)); the beach above the high water mark, just east and west of the Hout Bay river
mouth (MU3 – Sector 3); the back dune system landward of this (MU2 – Sector 2); the Hout
Bay river estuary (this should be managed as part of MU’s 3 & 4, but the river requires its
own management plan); the artificial dunes just below Hout Bay Beach Club (HBBC) (MU4
– Sectors 4 & 5); the major primary and back dune systems between HBBC and the western
parking area (MU5 – Sectors 6 to 14); and the western parking area and beach at mariner’s
Wharf (MU6 – Sector 15) (see Figures 15 and 16).
Although not part of the scope of this study, it is absolutely critical that management on the
beachfront (dunes, river, stormwater) is aligned and that a CCT task force is set up to
facilitate this process.
hout bay dunes management & rehabilitation plan
40
The prime drivers in determining the sequence: 9.2
(i) the principle of addressing the problem at (or close to) source of impact
(ii) reduction of any management unit’s exposure to uncontrolled impact from upwind
(iii) systematic, sequential approach
(iv) addressing areas of greatest use first
(v) the HBBC, although severely exposed and affected, is managing the local footprint in front of the property by arrangement and per an approved OEMP4 providing opportunity to address primary problem areas and areas of source first.
Management should follow a set pattern as follows:
(i) remove inappropriate and derelict infrastructure
(ii) rescue usable indigenous plants
(iii) remove excess sand
(iv) re-profile systems from east to west
(v) install irrigation
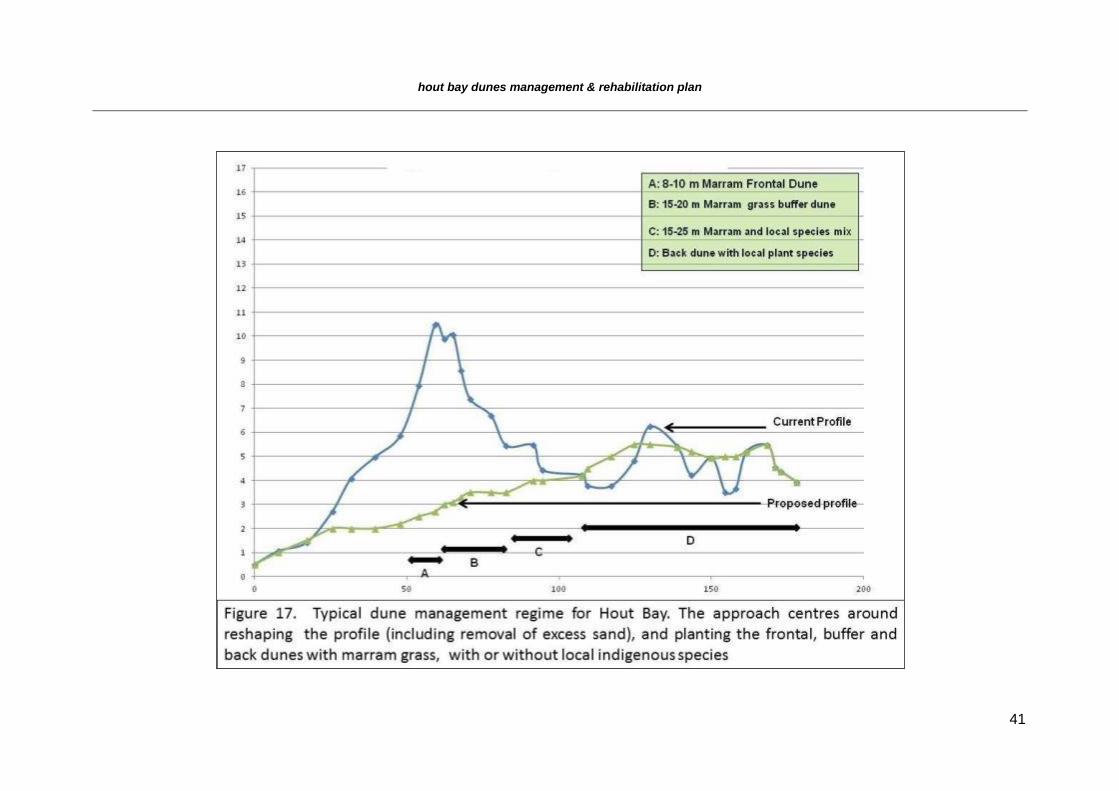
(vi) vegetate dunes in functional bands using nursery grown material and seed. There are basically three bands of vegetation:
a) The Frontal Dune (an 8 to 10 m wide sacrificial area and foredune) that is exclusively marram grass
b) the marram grass frontal portion of the Buffer Dune, approximately 15 to 20 m wide marram grass/local plant species mix that forms the remainder of the Buffer Dune approximately 15 to 20 m wide
c) the Back Dune area approximately 50 to 60 m wide that is vegetated exclusively by local plant species and that covers the remainder of the dune area
(vii) translocate and establish the rescued plants from (ii) above (undertake as part of (vi))
(viii) erect fencing and establish controlled access points
(ix) ensure maintenance in perpetuity.
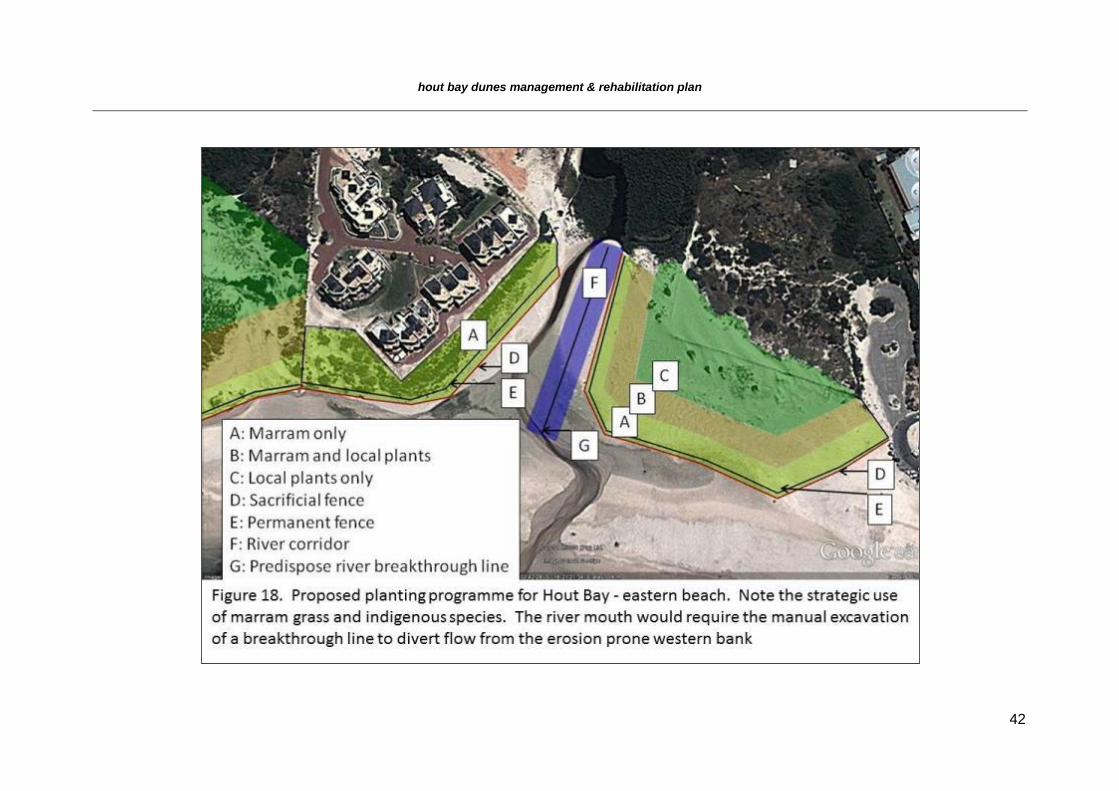
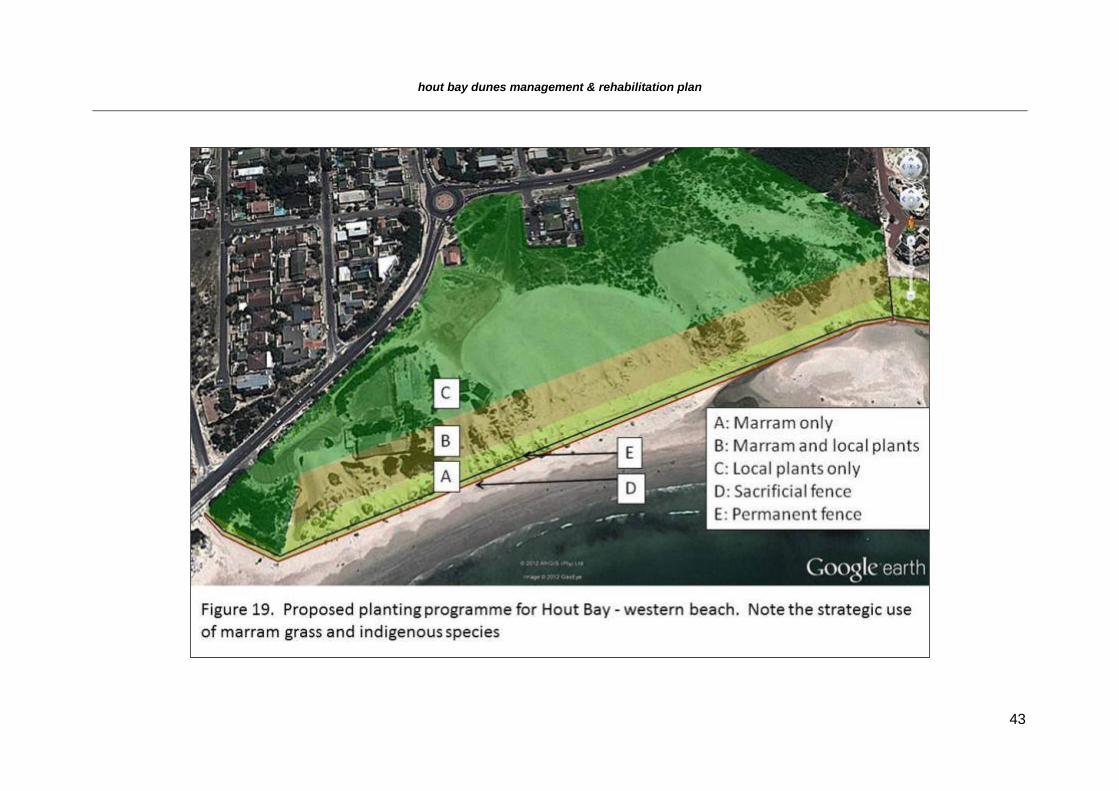
A typical managed dune profile appears in Figure 17, with the proposed planting programme
for the Hout Bay shown in Figures 18 (eastern beach) and 19 (western beach) as well as
irrigation plan. Included in Figure 18 is the proposed predisposal alignment of the river
mouth which should be trenched, together with management interventions on either side of
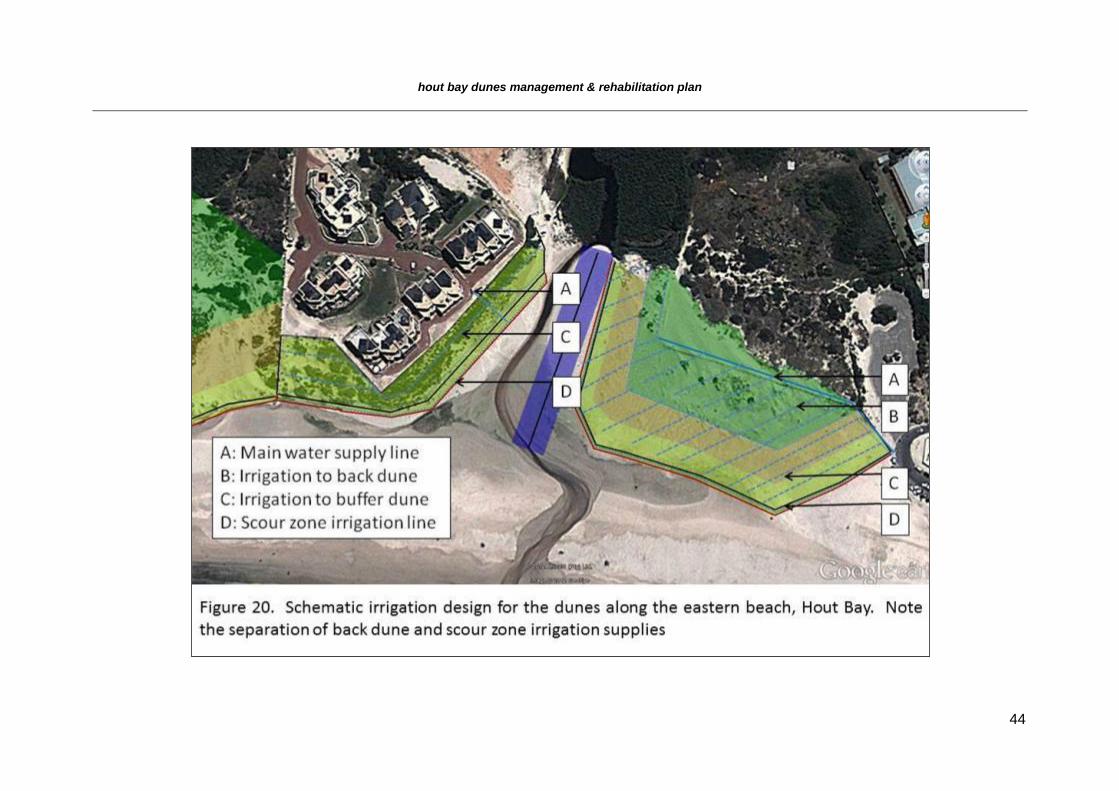
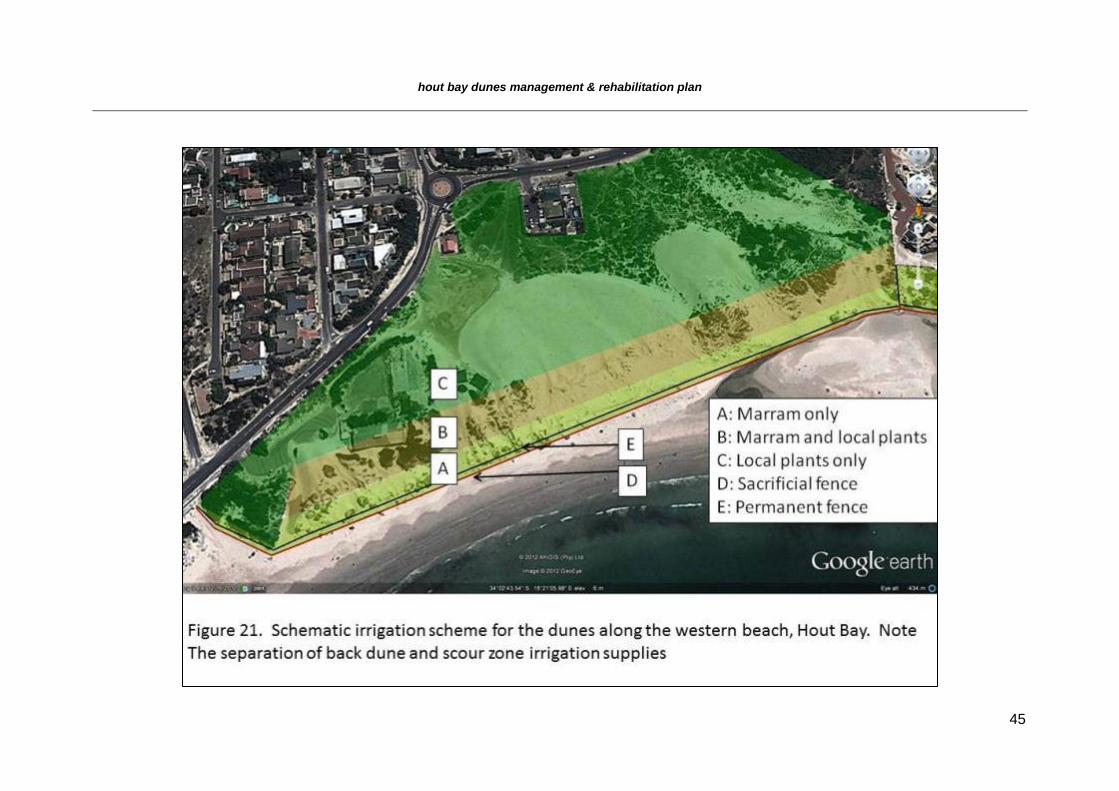
the channel. Schematic irrigation designs are shown in Figures 20 and 21. Note that back
dune and scour zone irrigation systems are separate.
4 The OEMP was due to have been submitted to DEA&DP for comment on 12 October 2012
hout bay dunes management & rehabilitation plan
41
hout bay dunes management & rehabilitation plan
42
hout bay dunes management & rehabilitation plan
43
hout bay dunes management & rehabilitation plan
44
hout bay dunes management & rehabilitation plan
45
hout bay dunes management & rehabilitation plan
46
10. HOUT BAY DUNE MANAGEMENT UNITS
Management Unit 1 (Sector 1 - eastern activities beach) - 10.1see Figures 15 & 16)
Ownership is by the City of Cape Town, with zoning as POS and use for beach activities (see Appendices 2 & 3 for details of Erven and images).
(i) Description and current status
The beach is flanked in the south-east by a rocky shore and inland by a low wall that forms
the foundation and edge of the Promenade. Periods of regression (receding) have been
shown by the beach in the past, with but sand input and loss appearing to be in equilibrium
by the late 1980’s (the CSIR (1989). According to the comparison between 2009 LIDAR data
and the 2011 survey conducted by the City of Cape Town, a net loss of 1% of the sand in
this sector occurred between May 2009 and December 2011. These figures are however
inaccurate as they do not take into account the management interventions that took place as
much of the accumulated sand was pushed back to sea during 2010 (Howard Gold,
pers.comm.). Correspondingly Sectors 13 and 14 experienced a 4% increase in sand
volume in the same period.
(ii) Past management
Ad hoc maintenance by the CCT and Hout Bay Ratepayer’s Association included the
erection of brushwood fencing at various angles, distances apart and intervals between 2006
and 2009) (DvE, pers.obs.). Coupled with this, no fences were erected during this period,
resulting in an increase in sand accumulation on the Promenade and in Beach Road.
The initial low vegetation cover on the remnant dunes that existed in the middle of and to the
west of the Sector gradually decreased from 2001 until 2008, with all vegetation having been
lost by 2009 (from examination of Google images). This resulted in unrestricted sand
movement towards the western section of the Promenade and onto the adjacent private
Erven 1126, 1128 and 9615, as well as into the Hout Bay River mouth and beyond.
hout bay dunes management & rehabilitation plan
47
(iii) Prognosis
It is clear that net sand deposition continues and that the narrow beach cannot retain the
sand that previously freely circulated and moved along the original dune system. Since the
flattening of the accumulated sand that formed localized hummock dunes in 2010 by the City
of Cape Town (Howard Gold, pers.comm.), sand has had a tendency to accumulate against
the foundation and low wall of the walkway, spilling over into the Promenade area. The
brushwood rows have further resulted in localized deposition of sand until the capacity of
these structures was reached. Once this happened, sand continued to move in unrestricted
fashion onto the Promenade, into the road and onto the private properties to the north of the
beach.
Within the western portion of Sector 1, in the vicinity of the storm water manhole, an area of
approximately 80 m x 20 m contains construction rubble, with an estimated volume of some
1 200 m3. The storm water outlet on to the beach creates an unmanageable situation. The
option of creating a back dune retention pond would consume a substantial portion of the
back beach. Since such a system would require protection against silting up from the
summer sand movement, the establishment of a dune system to the south would be the only
workable option. This would, however, be unpractical should the high use pattern of the
beach continue. It is thus recommended that the storm water is pumped via a rising pipeline
and discharged into the Hout Bay River at a suitable point west of the shopping centre along
Stream Road or Sentinel Street, south of the Princess Street bridge.
(iv) Detailed proposal
The high use pattern of this sector requires a management regime that is simple and
effective. The location of the Promenade restricts options and the narrow width of the beach
limits these further. Kelp removal from this sector is likely to continue as alternatives cannot
be managed in the confines. Brushwood fences are unlikely to be integrated into a
meaningfully long term scenario.
(a) Removal of sand from the beach and Promenade: construction of a purpose-built retaining wall
Accumulation of sand in a predictable manner in an accessible area for periodic
removal would be the most practical management option for this sector. The
deposition pattern against the low retaining wall of the Promenade is already
established and remains relatively stable each year. However, the wall was not
hout bay dunes management & rehabilitation plan
48
designed specifically to arrest sand movement and the existing foundations are
inadequate for this purpose.
The construction of a purpose build retaining wall 50 cm higher than the current
structure is strongly recommended (see schematic design in Figure 22). The wall
should be engineered to withstand possible inundation by the sea and should have an
adequate foundation. A Reno mattress, at least 2 m wide and 30 cm thick, should run
the entire length of the Promenade and define the sand maintenance level. Sand must
be allowed to accumulate against the wall for scheduled removal. Initial planning
should allow for monthly removal from October until April, and this should be sufficient
for the year as no significant accumulation is expected during the winter months (wet
sand and gentler winds). The volume data gathered during the first year should then
be used to refine the management and removal cycles for subsequent years.
A schematic cross-section of the intervention is shown in Figure 17. Detail will only be
provided for all sections at the implementation phase.
A D6 bulldozer would be required to push sand towards the north to a loading area.
Here a ramp would need to be constructed in order for a front-end loader to dispose of
sand in trucks. Sand disposal should be undertaken in keeping with the proposed sand
management regime
The sand management options that should be considered, discussed and decided
upon include two options that would require a mining license application:
1. Using the sand as a resource for City of Cape Town projects
2. Selling the sand to interested parties
The non-mining alternative would be to dispose of the sand
1. To a registered dump site5
5 Sand mined from the Hout Beach could well be used to replace the supplies now lost to the Hout
Bay-Sandy Bay climbing-falling dune system or to augment the supply of sand to the beach at Sandy Bay. Both of these options would require expert input and consultation with the public
hout bay dunes management & rehabilitation plan
49
After sand removal, reshaping of the activities beach should be completed. The final
profile of the activities beach should allow for a gentle slope from the intertidal zone to
the proposed retaining wall along the Promenade. This section of beach should be
kept clear of kelp and debris, and should be regularly maintained and cleared of litter.
Access to the beach from the Promenade would be in the form of a series of stairs
constructed from Poly-wood and that can hinge into position to allow free access by the
public to the beach. This would also permit unrestricted access to the cleaning teams
enabling maintenance of the Promenade and immediate beach.
It is recommended that Sector 1, together with Sector 15 (Figure 15), be developed
and utilized as the primary beaches for public use, concentrating people in these two
areas and relieving pressure on the dune systems between the two Sectors (see
below).
(b) Re-profiling of Sector 1 and construction of artificial dune (profiles A & B in Figures 23 & 24)
There should be no interference below the intertidal zone. The spring equinox is often
associated with exceptionally high seas and it is expected that the flat beach profile
would increase the reach of these events. Owing to the spring tides and the narrow
width of the beach on the eastern side of Sector 1, we recommend that managed
vegetated dunes should not be constructed to protect the Promenade.
(c) Kelp removal
In order to permit general stability and significantly reduce windblown sand, we
maintain kelp should be left on the beach in this Sector. However, we acknowledge the
“nuisance value” posed by seaweed to the general public and suggest kelp is removed
only from Sectors 1 and 15 (Figure 15), in accordance with CCT Kelp Cleaning Policy,
but not in-between these two areas. Kelp should only be removed to the east of the
management line demarcated for Sector 1 (MU1 - Figure 16). Removal of kelp from
MU1 should be by hand and placed in one pile along the newly constructed revetment
for collection.
(d) Volumes of sand to be moved
The extent of current sand deposits along the 380 m long Promenade is about 20 m in
width wide and on average 50 cm deep. The estimated volume of sand currently in the
system is approximately 3 800 m3.
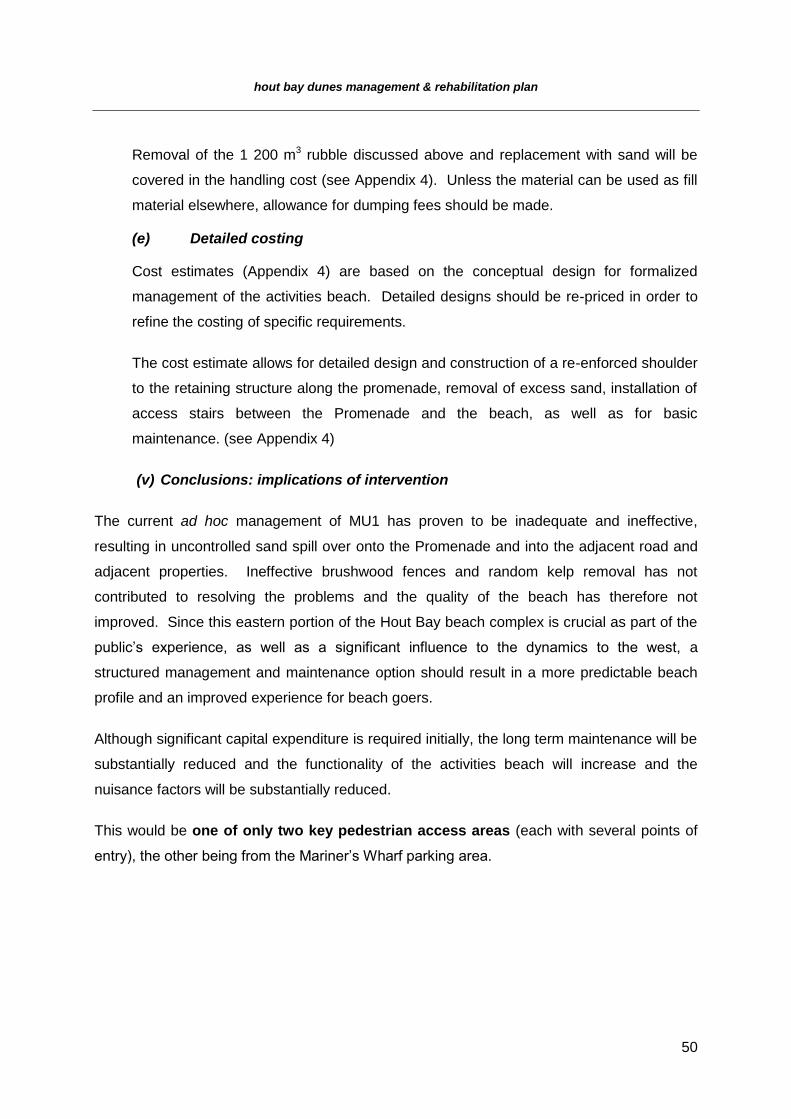
hout bay dunes management & rehabilitation plan
50
Removal of the 1 200 m3 rubble discussed above and replacement with sand will be
covered in the handling cost (see Appendix 4). Unless the material can be used as fill
material elsewhere, allowance for dumping fees should be made.
(e) Detailed costing
Cost estimates (Appendix 4) are based on the conceptual design for formalized
management of the activities beach. Detailed designs should be re-priced in order to
refine the costing of specific requirements.
The cost estimate allows for detailed design and construction of a re-enforced shoulder
to the retaining structure along the promenade, removal of excess sand, installation of
access stairs between the Promenade and the beach, as well as for basic
maintenance. (see Appendix 4)
(v) Conclusions: implications of intervention
The current ad hoc management of MU1 has proven to be inadequate and ineffective,
resulting in uncontrolled sand spill over onto the Promenade and into the adjacent road and
adjacent properties. Ineffective brushwood fences and random kelp removal has not
contributed to resolving the problems and the quality of the beach has therefore not
improved. Since this eastern portion of the Hout Bay beach complex is crucial as part of the
public’s experience, as well as a significant influence to the dynamics to the west, a
structured management and maintenance option should result in a more predictable beach
profile and an improved experience for beach goers.
Although significant capital expenditure is required initially, the long term maintenance will be
substantially reduced and the functionality of the activities beach will increase and the
nuisance factors will be substantially reduced.
This would be one of only two key pedestrian access areas (each with several points of
entry), the other being from the Mariner’s Wharf parking area.
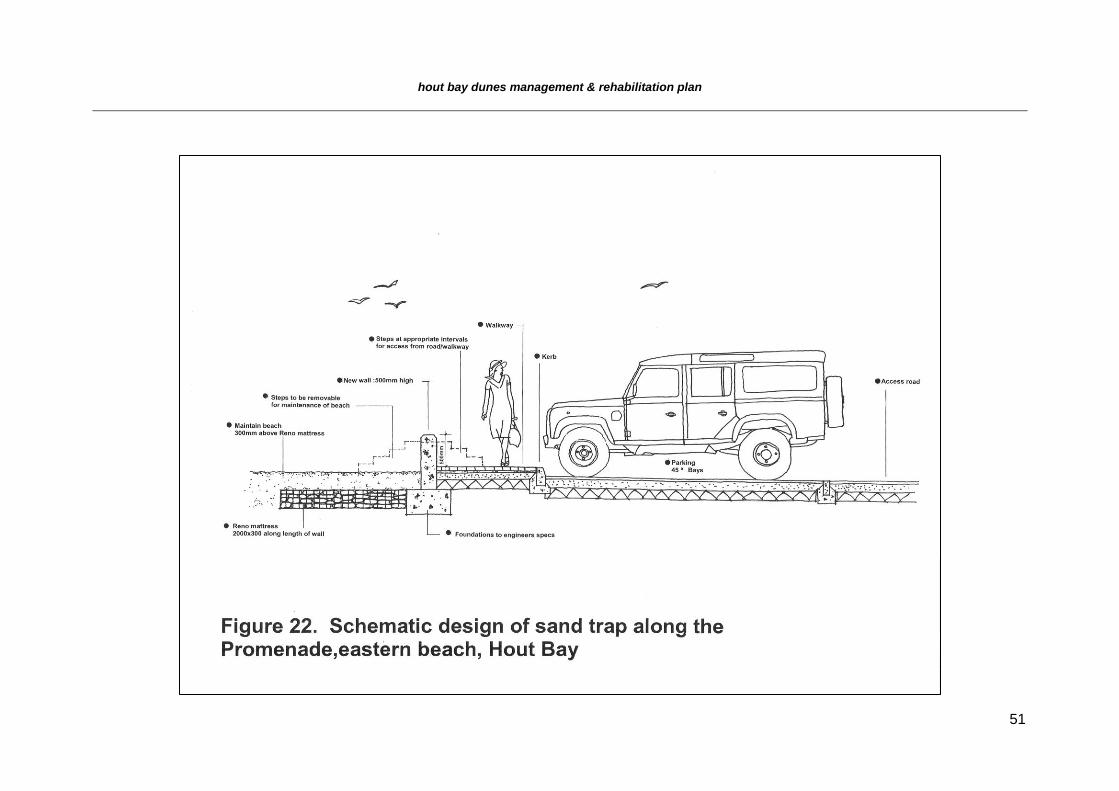
hout bay dunes management & rehabilitation plan
51
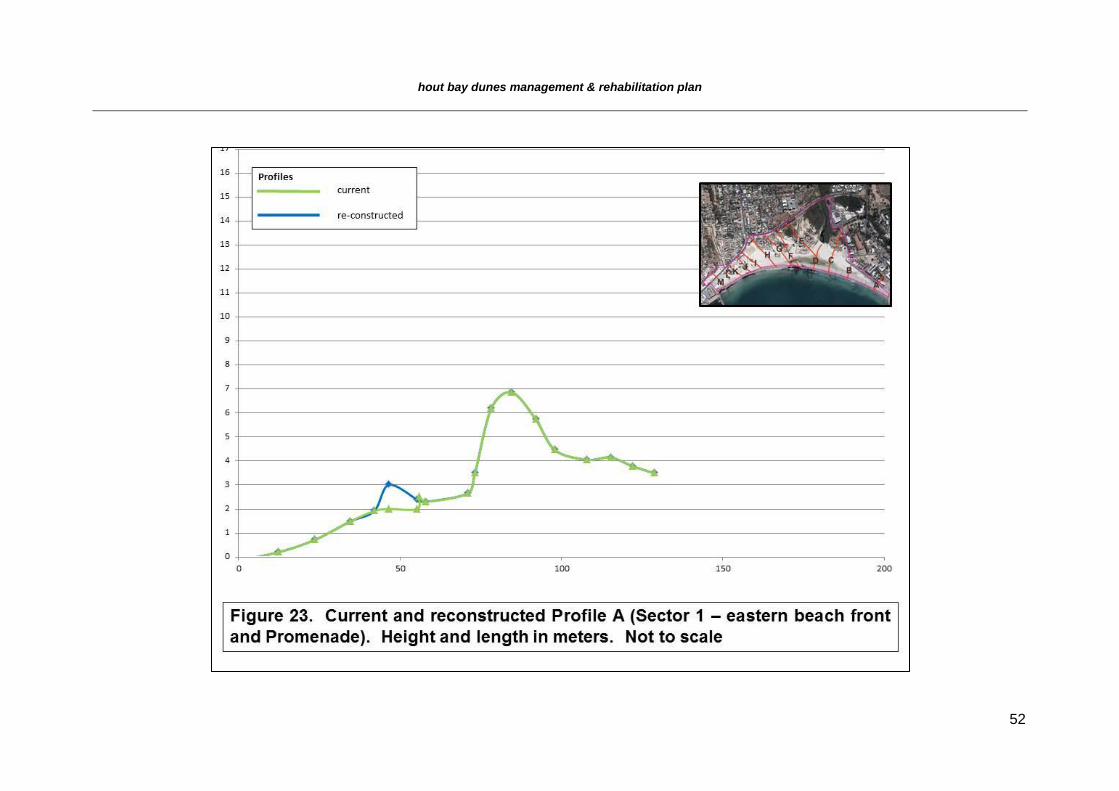
hout bay dunes management & rehabilitation plan
52
hout bay dunes management & rehabilitation plan
53
Figure 24. Current and reconstructed Profile B (Sector 1 – eastern
beachfront, east of Hout Bay River mouth)
hout bay dunes management & rehabilitation plan
54
Management Unit 2 (Sectors 2 & 3 – back dunes above eastern 10.2beach) - see Figures 15 & 16
Ownership is by the City of Cape Town (beach) and private (back dunes), with zoning as POS and beach activities in Sector 2, and unknown zoning for Sector 3 (see Appendices 2 & 3 for details of Erven and images).
(i) Description and current status
This section of the beach continues from Sector 1 to the west, as far as the Hout Bay River
mouth, and is bounded by the back dune of Sector 3 (Figure 15). Sector 2 is currently
characterized by a relatively flat profile with much of the vegetation of the original back dunes
being lost due to blowouts that formed as a result of a combination of pedestrian access,
vagrant activity, increased impact from the poorly managed Sector 1 (mainly between 2005
and 2008) (Howard Gold, pers.comm.) and the continual removal of kelp along the high
water mark. This has resulted in sand from this area spilling into Sector 3 and into the river
mouth in Sector 4, as well as into the narrow Sector 5 that forms the buffer for the Hout Bay
Beach Club (HBBC). These observations were made by one of us (DvE) during frequent site
inspections conducted in order to assist the HBBC with developing methods to prevent
mobile sand from accumulating within the building complex.
(ii) Past management
The beach forms a key component in the effective management of the Hout Bay dune
complex. After the flattening of the beach profile in Sector 1 during 2010, (Howard Gold,
pers.comm.) the amount of sand that blew onto Sector 2 was reduced and the buildup of
unconsolidated sand has consequently slowed.
(iii) Prognosis
Owing to its location and distinct lack of ongoing management, Sector 2 has been
instrumental in causing the instability and collapse of the eastern dunes constructed in 1990
(CSIR, 1989). In order to establish a meaningful and sustainable management regime to the
west of the Hout Bay River, Sector 2 must be stabilized. If Sector 2 is unstable, sand
accumulation in the river mouth during the low flow summer months results in the river
periodically opening up against the artificially re-enforced edge of the western embankment.
This is undesirable as it leaves no space to re-instate, manage and maintain the CSIR dune
management profile. It furthermore forms the buffer between the eastern activities beach
and the river mouth to slow down sand movement across the flat clean beach surface during
hout bay dunes management & rehabilitation plan
55
strong winds. MU2 must thus be able to withstand the edge effect that is likely to prevail
where the sand laden winds from across MU1 will have a more profound impact on the
eastern edge of the area. This can be achieved by increased planting densities, additional
irrigation and fertilization of the marram grass along the edge of the Unit, and following an
adaptive management strategy where intervention is available as a response to possible
variation in the behaviour of sand on the edge of MU2.
The unpredictable seasonal infill by mobile sand and the annual breakthrough of the Hout
Bay River presents a further challenge, complicating planned management. Given the
confines of the space available for addressing mobile sand in the Hout Bay system,
construction of a dune system to trap mobile sand would be favoured as this would help in
reducing the secondary and uncontrolled impacts from the adjacent area.
(iv) Detailed proposal
Owing to the importance of MU2 in the management of the Hout Bay dune complex, it is
recommended that the area be stabilized and treated in a manner that will accumulate sand
in the dynamic scour sector on the seaward side of the planned vegetated buffer dune. The
latter would accumulate excess sand with a stable back dune section.
(a) Re-profiling of Sectors and construction of artificial dune (profile C in Figures 25a & 25b)
Most of the sand that would accumulate on the site would be derived from the Sector 1
(MU1) beach and would need to be caught in a robust system of nets, brushwood
fences, vegetation, such as marram grass, or a combination of two or more of these.
Cost and ease of maintenance would favour a number of rows of custom made wind
nets placed perpendicular to the summer winds. The nets, supplied by both Allnet and
Nittex, come in 225 m long rolls, are 750 mm high, and have stitched sleeves spaced
every 2.5 m for 1.2 m x 10 mm steel droppers6 to be inserted and pushed into the
ground. These can be lifted and maintained after major wind storms and routinely on a
14 day cycle. The nets would be removed in autumn to allow bulldozing of the
accumulated sand to the loading platform described for MU1, with subsequent
reinstatement of the nets. Lifespan of the latter is estimated to be two years under
these conditions. The use of the nets in conjunction with the marram grass and
irrigation lines along the windward edges of MU2 would greatly reduce the negative
6 This is the only cost-effective option to use under these circumstances; the droppers are easy to
erect and to maintain
hout bay dunes management & rehabilitation plan
56
wind erosion edge effect on the Unit. This would result in a larger stable, vegetated
footprint, thus increasing sand accumulation in the longer term7.
The historical Google Earth images clearly show a much more stable vegetation
regime pre 2005. Since the pre-2005 vegetation cover has now been lost, it is
proposed that excess sand is removed and a managed dune profile constructed. It is
likely that once Sector 2 is stable, the vegetation in the Sector 3 back dunes would
progressively recover owing to protection from the impact of mobile sand.
The current dune profiles in this area are unmanageable since sand accumulation has
occurred within land-locked areas where it is not exposed to occasional erosion. The
current dune profiles are at unstable angles as the dune footprint has remained stable
but the height has increased over time due to unnatural buildup of sand in the
vegetation. The accumulated sand between Sectors 2 and 3 further pre-disposes the
Hout Bay River to break scour close to the HBBC re-enforced embankment, limiting the
management options for Sector 4. The accumulated sand should be removed from the
corridor formed between Sectors 2 and 3, and 4 and 5 (the eastern river bank); the
profile should be flattened after the removal of plants that can be used in the re-
vegetation phase. Excess sand from this process should be reused as required in the
reconstructing of the dune profiles. The remaining sand should be removed via the
access ramp that should be constructed adjacent to the Promenade, and must be
disposed of as detailed under MU1.
The dune profile should have a setback line at +2MSL, with a sacrificial fence at this
point. This fence should be inexpensive and “disposable”, constructed on the seaward
side of the scour zone. This position, on the seaward side of the fence, is well within
the area that will be inundated by the spring equinox storms. A further 3 m back, a
more permanent fence should be erected (Figure 17). Ideally this fence should be a
post and rail type if funds are available but in the estimates, provision has been made
for the use of a simple treated timber post fence with two strands of Deltex Polywire,
the same specifications suggested for the sacrificial fence. The front 20 m behind the
latter fence should be irrigated and planted with marram grass. The marram grass strip
on the eastern and southern sides should be 20 m wide, but on the estuary side can be
reduced to 10 m, as less of sand accumulation is anticipated in that area. The dune
7 Netting would be subject to vandalism and theft, and the management authority needs to implement
security which would deter or hopefully prevent these activities
hout bay dunes management & rehabilitation plan
57
toe should be situated at +2MSL, with a 1:5 slope reaching 5 m inland, and this would
result in a buffer dune at +3MSL. The latter will vary from 30 to 50 m wide. The first
part of the buffer dune will fall in the irrigated marram grass planting zone, with the
remainder containing both marram grass and locally occurring vegetation.
Finally, the back dune should be vegetated with locally occurring species only. The
width of this zone will vary as it stretches from behind the buffer dune to the inland
edge of the dune management area.
It is important to note that the estimates given may vary from the detailed design
required at the time of implementation particularly if implementation were to be
delayed. The area is very dynamic, with sand volumes and dune profiles constantly
shifting thus influencing the detailed design and therefore the cost. Schematic cross
sections of the re-profiled system are shown in Figures 25a & 25b.
The irrigation of the sacrificial sector (the front 3 to 5 m of the dune) should be
standalone and operate independently of the irrigation serving the remainder of the
dune system. It should also run parallel with the coastline as opposed to the
perpendicular design of the main irrigation system. The frontal dynamic portion of the
dunes will require seasonal maintenance to ensure that the system functions effectively
and that most of the sand is trapped and recycled here. Excess sand that cannot be
contained in the dynamic zone is then accumulated in the buffer dunes (the first 30 m
from the sacrificial fence). It is envisaged that occasional re-profiling of these buffer
dunes would be required since their relatively narrow limited footprint would result in a
limited ability to absorb the influx of all mobile sand. The frequency of maintenance
would be determined by the effectiveness of management of the dynamic zone and, in
particular, the amount of rainfall and strength of on-shore winds.
(b) Kelp removal
An unmodified profile should be retained down to the mean high water mark, i.e. west
of Sector 1. Kelp should be allowed to accumulate (i.e. harvesting should NOT be
allowed in this Sector) and a fluctuating buildup of sand should be permitted for 30 m
inland but at below +2MSL. There will thus be a relatively flat beach profile below
2MSL that will accumulate kelp and pioneer vegetation (notably Arctotheca populifolia
sea pumpkin) on a seasonal basis. This “kelp section” should extend westwards and
be included in and on either side of the Hout Bay River corridor mouth area (MU3).
hout bay dunes management & rehabilitation plan
58
(c) Hout Bay River
Management of the Hout Bay River corridor8 should be integrated with that of the
dunes: the unpredictable movement of mobile sand and resulting random break-out
patterns of the river (if the mouth were to be silted up by windblown sand from the
east), tend to cause an increase in unnecessary beach scour. If the river breaks
through to the sea at the start of the rainy season in a position close to the western
embankment, excessive scour occurs that will undermine the stability of the engineered
embankment protecting the development to the west. With the removal of the infill on
the eastern bank of the river, along the junction of Sectors 4 and 2 (Figure 12), the
migration of the mouth to the east again becomes possible. This would then allow the
extension of sacrificial dunes in Sector 5; this is currently not possible owing to
inappropriate scour patterns that develop as the meander is deflected by the infill of the
sand from the activities beach to the east.
(d) Volumes of sand to be removed
Since the area is very dynamic, the current quantities will differ from those that will be
moved once re-profiling has taken place. Accurate volumes are therefore difficult to
quantify.
(e) Detailed costing
Cost estimates (Appendix 4) for MU 2 & 3 are based on the conceptual design of the
main catchment buffer of sand that will flow in from the east. Detailed designs should
be re-priced in order to refine the costing of specific requirements of this area at the
time of implementation.
The cost estimate allows for detailed design and construction of the managed dune
system. This includes the removal of excess sand from the river mouth and dune
areas, installation of irrigation and permanent as well as sacrificial fences and for 12
months of basic maintenance
88
There is currently no management plan for the river, least of all for the estuary. We see this as a top priority for the City to develop in conjunction with sand management along the beachfront
hout bay dunes management & rehabilitation plan
59
(v) Conclusions: implications of intervention
The current patterns of sand movement in MU2 are similar to those for MU1, above, and
have resulted in the degradation of this dune system, seasonal infill of the river mouth and
sand accumulations in MU4. With MU1 being optimized for active use by the public (see
above), less sand will be available for movement into MU2, apart from the smaller
accumulations against the proposed Promenade wall.
Good management of MU2 will improve the status of the degraded dune system in MU5 to
the west (see below). Being a small and compact area, MU2 is relatively cost effective to
manage and this will ease the impact on the adjacent areas.
.
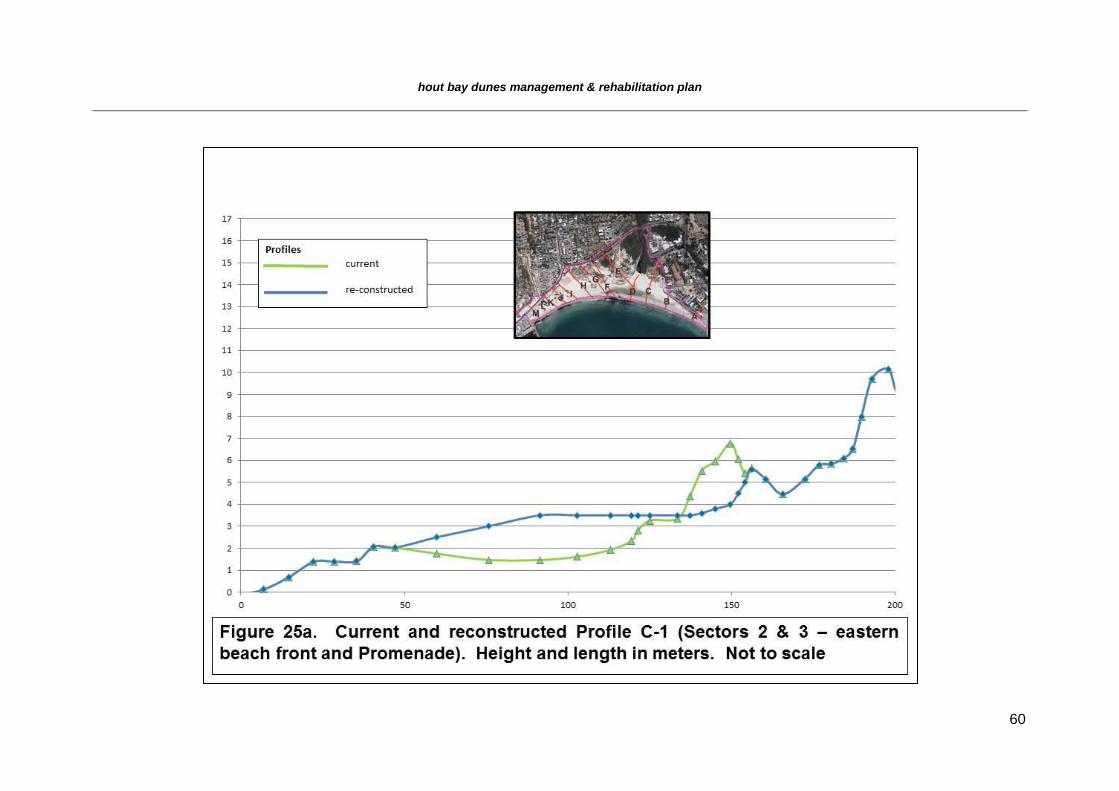
hout bay dunes management & rehabilitation plan
60
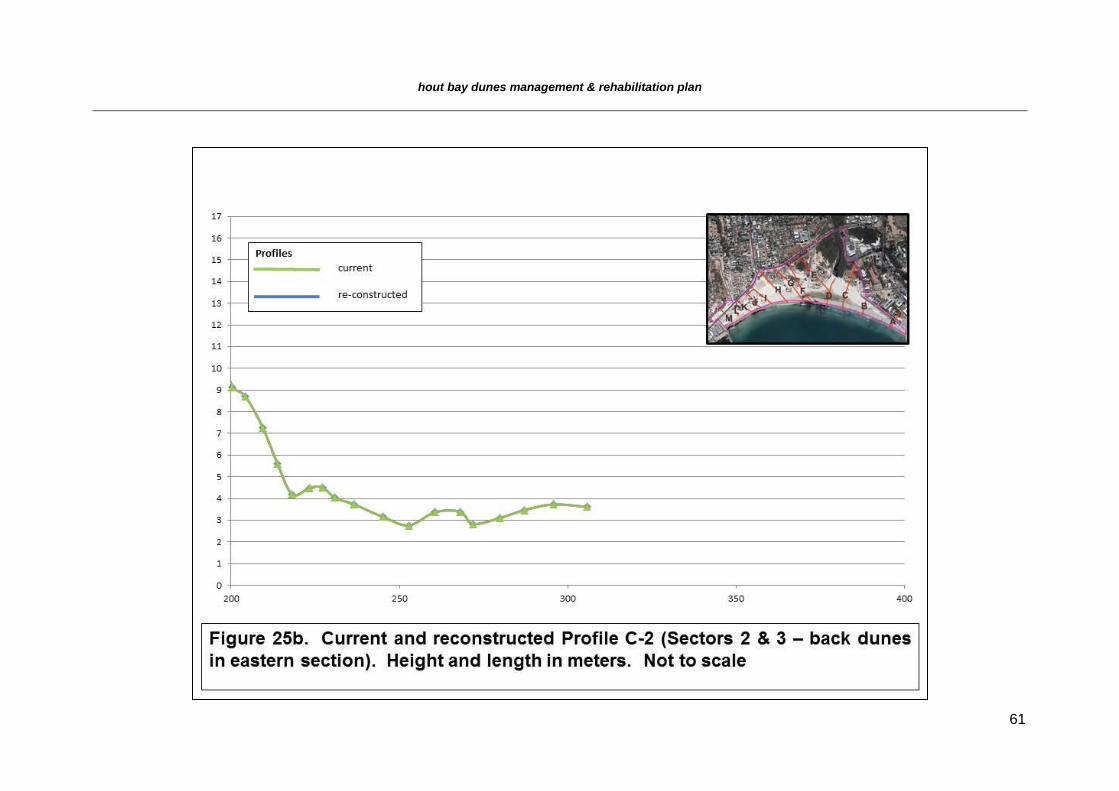
hout bay dunes management & rehabilitation plan
61
Figure 25b. Current Profile C (Sectors 2 & 3 – back dunes in eastern section). Note there is no change to the back dune
profile
hout bay dunes management & rehabilitation plan
62
Management Unit 3 (part of Sectors 2 and 4 – beach around Hout 10.3Bay River lower estuary and mouth) – see Figures 15 & 16
Ownership is partly by the City of Cape Town (beach) and private, with zoning as POS and use for beach activities (see details of Erven and images in Appendices 2 & 3).
Although management of the river is not specifically part of this brief, some interventions are
discussed here, but fall mainly under Sectors 2 and 4 on either side of the river. It is
imperative that the CCT develop a plan for integrating river management with that of the
dunes in question.
(i) Current status
The river mouth changes its course on an annual basis and affects all adjacent areas
directly. From observation of previous aerial photographs, the unpredictable course is partly
the result of sand accumulation in Sectors 2 and 3 (MU2) that limits the river’s tendency to
meander to the east. The deflection of the river to the west (September 2011 Google image)
by the sand bank that formed as a result of the infilling from MU1 and MU2, has also caused
excessive scour of the western embankment below the HBBC. This erosion has frequently
exposed the Reno mattress and armor flex foundations that were installed to protect the river
embankment as part of the 1989 CSIR study that preceded the HBBC development
approvals in 1994. Such erosion is undesirable as it undermines the long term integrity of
these engineered layers.
(ii) Past management
As mentioned elsewhere, the river has no management plan (Howard Gold, pers.comm.) and
has been severely constrained by development on its banks and within its floodplain. The
latter is also compromised through the construction of levees along its banks, preventing the
functioning of the floodplain.
(iii) Prognosis
Failure to manage the infill of sand, in particular from Sector 2, will result in the river mouth
silting up on a regular basis, particularly during summer. In addition, buildup of sand along
the eastern edge of the mouth means that the river will tend to erode the embankment below
(western edge) the HBBC.
hout bay dunes management & rehabilitation plan
63
(iv) Detailed proposal
(a) Re-profiling of Sectors and construction of artificial dune (see profile D in Figure 26)
Excess sand should be removed as part of the management of MU 2, after vegetation
from the eastern embankment has been salvaged. Once the accumulated sand has
been removed and the eastern beach has been managed (see MU 2), less mobile
sand will be expected to infill the Hout Bay River mouth. Should the latter close up in
summer, and this is highly likely, the break-through point should be predetermined
early in the following winter. A narrow trench should be excavated so as to guide the
initial break-through of the river, roughly in the middle of the river corridor (see
Figures 27a (profile to west of river mouth) and 18 (planting programme)).
The management of MU 4 (see below) should result in a vegetated embankment to
the west of the river mouth. The river corridor is 25 m wide at the narrow inland area
and approximately 100 m wide at the wave sector.
(b) Kelp removal
Summer accumulation of kelp and sand should not be hindered and no collection
permitted in and around the mouth of the river.
(c) Opening of mouth
Allow for annual evaluation and establishment of a low point trench (see above) to
pre-determine the break-through alignment of the river mouth after silting up in
summer. This would be carried out by a team of supervised labourers for two days
per annum.
(d) Volumes of sand to be removed
This has been discussed under MU2 above, but again the area is very dynamic, and
current quantities will differ from those that will be moved once re-profiling has taken
place. Accurate volumes are therefore difficult to quantify.
(d) Detailed costing
Provision has been made for the initial re-profiling of the area. The ongoing cost will
be reduced as the implementation of MU2 will result in a reduction of the sand infill
into the river channel. Without complex modeling, it is not possible to predict the
volume of sand infill and therefore no accurate estimate can be given for the annual
hout bay dunes management & rehabilitation plan
64
removal of sand. Budget provisions have however been included based on 10% of
current volumes.
(vi) Conclusions: implications of intervention
The management of MU2 to 4 is interlinked as the areas affect each other directly. The
earthworks associated with re-profiling MU2 will include the removal of the accumulated sand
that currently deflects the river westwards. Since sand will not be pushed back to sea it will
remain a potential source that will require removal in future. The excess material must be
removed via the loading ramp along the eastern edge of MU1. Implementation of the
management proposals detailed in MU2 will result in less sand being blown into the river
during summer. Siltation by river sediments will however still take place but are less likely to
completely close up the river mouth during this period. Should this happen, pre-determining
the point of breakthrough and management of the process is important to avoid the current
random and unmanageable scenarios associated with a westward position of the main
channel; this has had a knock-on effect on the management of MU4 and MU5, reducing
management options and increasing costs.
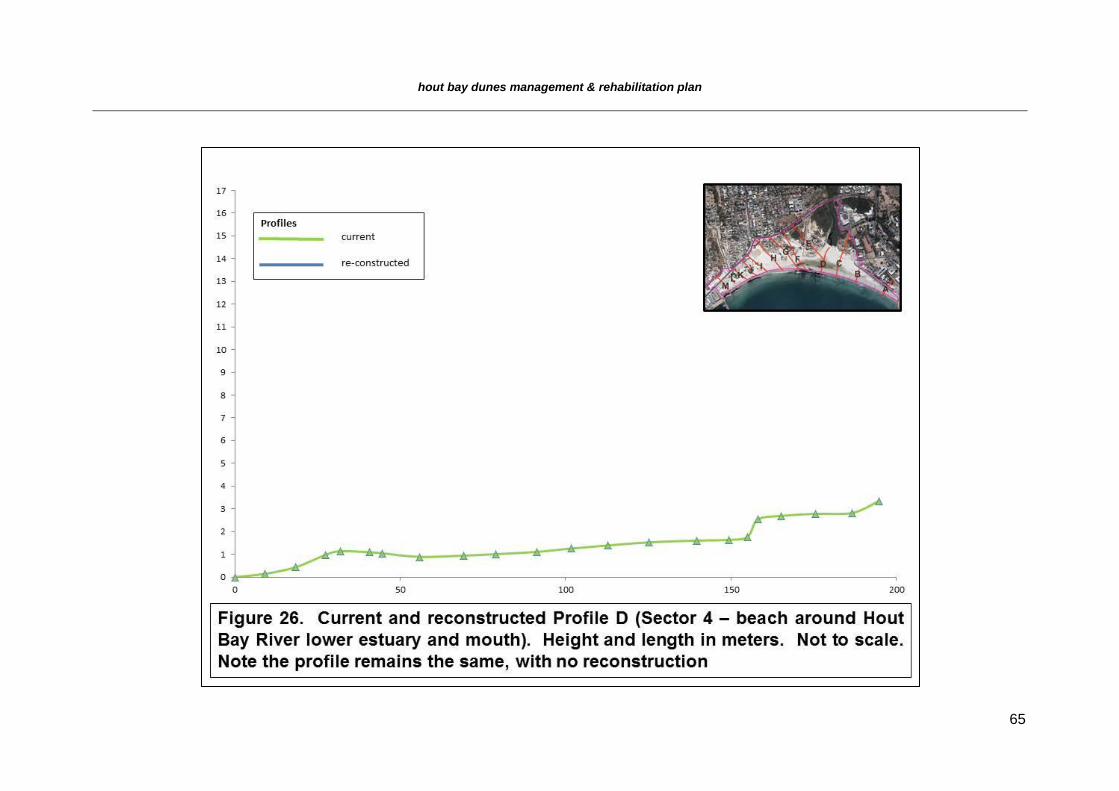
hout bay dunes management & rehabilitation plan
65
hout bay dunes management & rehabilitation plan
66
Management Unit 4 (Sector 5 – sandy embankment between Hout 10.4Bay River estuary and HBBC) – see Figures 15 & 16
The narrow strip of beach above the high water mark belongs to the CCT, with the dunes behind this under private ownership. Zoning for the area is POS and use for beach activities (see Appendices 2 & 3 for details of Erven and images).
(i) Current status
This sector contains part of the flood plain of the Hout Bay River and the eastern extreme of
the HBBC development, as well as the protective dunes to the south of the complex. The
status of this area is largely unpredictable as the sand deposition and river patterns are
dynamic.
This managed dune system is the last of the CSIR designed systems (CSIR, 1989) in the
Hout Bay dune complex that still remains partly functional.
(ii) Past management
Functionality was previously compromised due to inefficient maintenance that treated the
symptoms rather than the cause of windblown sand. This resulted in the need for major ad
hoc interventions, including the re-instatement of the designed profile following an arduous
18 month process embarked on by the HBBC that resulted in the issue of an Environmental
Authorization by DEA&DP on 7 October 2007. The approvals for on-going maintenance
nearly lapsed as the OEMP was not revised timeously. This was a precondition of the
Environmental Authorization and would have entrenched the maintenance options as rights.
The approvals for on-going maintenance nearly lapsed as the OEMP was not revised
timeously. As a pre-condition, the Environmental Authorization had to allow regular
maintenance of the dune system associated with the HBBC, and that the maintenance
methods be described in an amended OEMP.
The HBBC has now commissioned the Nature Conservation Corporation (NCC) to compile
an OEMP based on previously approved methods and interventions in order to maintain the
CSIR designed profile protecting the development. These methods were developed by Vula
Environmental for the HBBC and were amended during October 2012 to accommodate the
changes that took place during the period when the OEMP was being revised. The
principles proposed for incorporation in the OEMP are in keeping with the strategies
hout bay dunes management & rehabilitation plan
67
proposed in this document. Approval of the revised OEMP is expected during December
2012 (see footnote 2 on page 20)
(iii) Prognosis
The profile is characterized by a narrow flat slope east of the channel at +1MSL and an
extremely steep rise to +6MSL. This is an unsustainable profile and the situation is
worsened when the river meanders to the west and undercuts the toe of the dune. This
occurred during the winter of 2012, resulting in a vertical face of more than 3 m high directly
above the re-enforcing Armourflex layer. This profile is undesirable as due to its height and
slope angle; it severely restricts the buffer capacity of the dune to absorb windblown sand in
if it is not caught in the scour zone. Owing to inconsistent maintenance at the toe of the
berm, the narrow buffer zone has already reached its capacity and urgent intervention is
required.
The eastern edge of MU4 should form part of the Hout Bay River management plan, so that
the western embankment of the river remains protected from scour.
(iv) Detailed proposal
(a) Re-profiling of Sector and construction of artificial dune (profile E in Figures 27a & 27b)
Sand accumulation west of the embankment towards the river channel should be
encouraged in order to provide a more functional vegetated base on top of the
present engineered re-enforcement layers. The latter are currently exposed below
the HBBC.
The lost buffer capacity on the top and in front of the narrow embankment should be
regained, with a functional toe of the dune re-established. The latter should be
protected through the erection of a fence at the edge of the toe of the dune
Since the buffer dune has little remaining sand-trapping capacity, it is now necessary
to remove the marram grass in 2 m wide strips from the top down to the river, and
then to transport all the accumulated sand down to the toe of the embankment and,
on the same day, re-plant the marram and place under irrigation. This process needs
to start in the north (i.e. upstream) and follow the entire face of the development in
order to re-claim capacity for future sand accumulation in the buffer zone.
hout bay dunes management & rehabilitation plan
68
The river channel should be established 20 m to the east (see above), flanked by a
2 m edge and a gradual infill to +4MSL during the re-profiling of Sectors 2 and 3.
(b) Kelp removal
Kelp should not be removed from the section of the beach below the embankment
and on either side of the river mouth.
(c) Volumes of sand to be removed
No sand removal is required as the area has been severely eroded. Infill is not
suggested as it will reduce the ability of the area to absorb windblown sand.
(d) Detailed costing
Cost estimates (Appendix 4) for MU 4 is based on the current post storm scenario.
Due to inconsistent maintenance and the lack of maintenance of MU1-3, conditions in
MU4 are extremely dynamic. It is anticipated the conditions should become more
stable once the appropriate management interventions are in place.
The cost estimate allows for the installation of temporary wind nets to accumulate
sand in the eroded toe area of the dune, Repairs to irrigation and planting has been
priced. Maintenance is provided by the HBBC and has been excluded from the
estimate. The re-profiling of the interface between MU4 and Mu 2 & 3, including the
excavation of the excess sand accumulated in the river has been priced under
MU2 & 3.
(v) Conclusions: implications of intervention
As there cannot be uncoordinated shared responsibility for this zone by the different role
players, the operations of MU’s 2, 3 and 4 should be integrated to ensure successful sand
management. The HBBC has a vested interest in protecting its assets and should be
granted approval to maintain the adjacent areas directly affecting the development. The
CCT is however the custodian and owner of most of MU2 and MU3 (see Appendix 2). It is
therefore recommended that the CCT and HBBC enter into a formal agreement about the
protocols to be followed in sand and river mouth management, including detail regarding
both management and funding responsibilities.
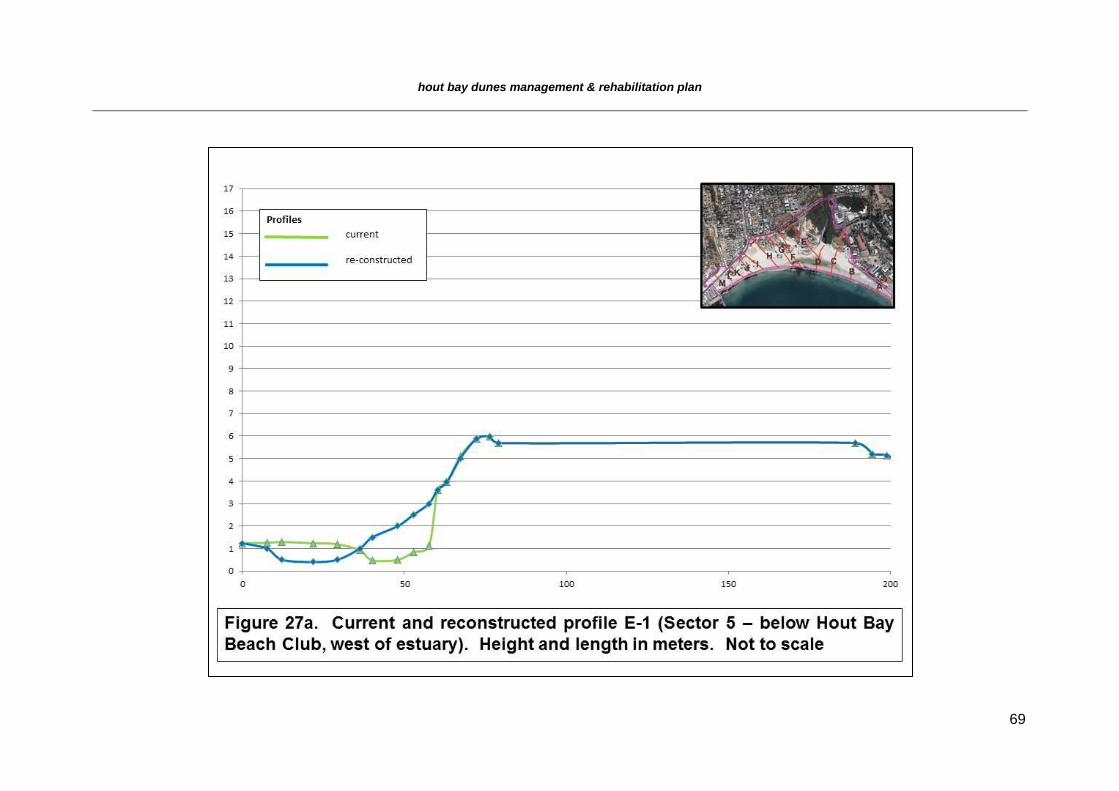
hout bay dunes management & rehabilitation plan
69
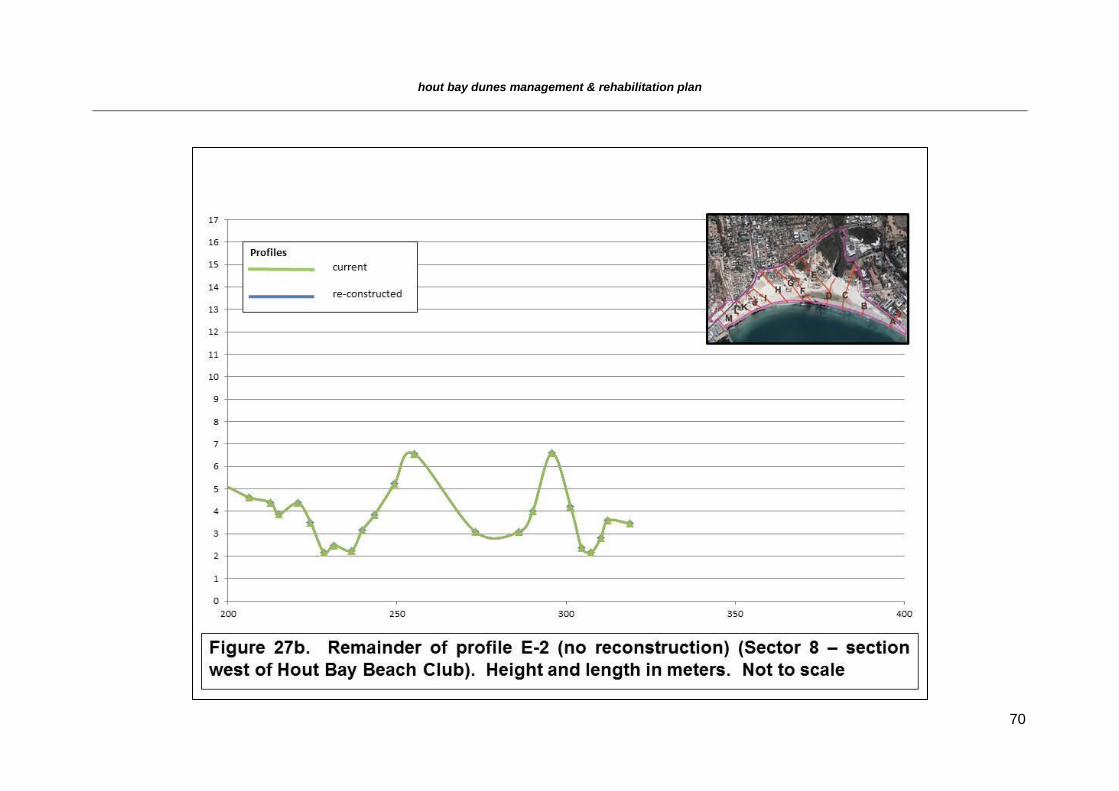
hout bay dunes management & rehabilitation plan
70
Figure 13b. Remainder of Profile E (no reconstruction) (Sector 8 –
section west of the Hout Bay Beach Club)
Figure 21b. Remainder of Profile E (no reconstruction) (Sector 8 –
section west of Hout Bay Beach Club)
Figure 27b. Remainder of Profile E (no reconstruction)
(Sector 8 – section west of the Hout Bay Beach Club)
hout bay dunes management & rehabilitation plan
71
Management Unit 5 (Sectors 6 to 14 – beach and dunes between 10.5Hout Bay Beach Club and the storm water outlet adjacent to the western car park) – see Figures 15 & 16
Most of this MU is owned by the CCT, with some residential Erven near the beach. Present zoning is mainly POS, with the private Erven unknown (see Appendices 2 & 3 for details of Erven and images). It is crucial that this MU, by far the largest in the study, is managed as an integrated unit.
(i) Current status
Failure to implement the CSIR’s (1989) management plan in the long-term has resulted in an
unnaturally mobile dune system, with several blowouts. This has resulted in significant
quantities of sand moving north into the parking area off Princess Road, partly covering the
law enforcement offices, amenities buildings and the Yacht Club. All the pathways and
ramps that were provided as part of the formalized beach access have also been covered.
The fence demarcating the +2MSL setback line on the beach is once again visible after sand
migrated inland once the blow out positions had cut paths through to +3MSL. This resulted
in an unnatural dune field being created over the present parking area.
(ii) Past management
Dunes along the beach in this MU, as well as the adjacent inland areas, were re-constructed
according to the CSIR dune management module (CSIR, 1989), and see diagram of the
2001 planting intervention in Figure 28. Owing to the lack of timely and ongoing
maintenance (also see comments above), these areas are now completely nonfunctional
and, owing to their largely unvegetated condition, are arguably in a worse state than before
the original intervention (Figure 29).
The dynamic frontal zone was not re-instated after being eroded by winter storms in 1997.
This resulted in sand accumulation in the frontal buffer zone and not in the sacrificial zone as
per the design. The dunes grew higher as sand was trapped, primarily by fast growing
marram grass, as well as some of the indigenous woody species such as Brachylaena
discolor wild silver oak, Chrysanthemoides monilifera bietou and Searsia (Rhus) glauca
which were introduced in the back parts of the dunes. Once the mobile sand equilibrium had
been lost and the dune profile in the front had become too steep, blowouts began to occur.
The natural dune dynamics were compromised by the introduction of fast growing marram
grass with its strong root systems was introduced. The areas were initially irrigated by
hout bay dunes management & rehabilitation plan
72
automated systems and later on an ad hoc basis by hand, resulting in a 1:1 dune profile in
places. The blowout position and time frame of occurrence was influenced, among other, by
the removal of irrigation as well as human impact due to unrestricted access to the beach
and back dunes.
Based on the assessment of recent aerial photos and the major changes in dune topography
(see above), the loss of vegetation accelerated between 2008 and 2011. This was due to a
combination of factors including a marked reduction in annual rainfall and stronger than
average easterly and south-easterly winds at the end of this period. Combined with the drier
conditions, the height of the dune profile in relation to footprint size led to severe droughting
of the vegetation outside the winter months. Dunes with a large “height to basal width ratio”
(i.e. taller than +8MSL) are prone to faster water loss due to increased percolation through
the sand profile. The resultant die-back in vegetation results in lower cover and therefore a
lower ability to trap mobile sand. This is illustrated by the net loss of sand from Sectors 1, 4,
6, 7, 9, 10 and 15 that occurred between 2009 and 2011, and the corresponding
accumulation in Sectors 2, 3, 5, 8, 11 (by far the greatest), 12, 13 and 14. (see above).
(iii) Prognosis
Since the collapse of the CSIR’s (1989) proposed dune management regime, the bulk of the
sand has accumulated beyond the original 50 m buffer dune system (see Figure 28). In the
current situation, the sand is unstable and unnaturally mobile. This has presented a major
nuisance to residents and other users behind (to the north of) the back dunes. Without major
intervention and reshaping, stabilization of sand would be impractical as it would require
major earthworks followed by an elaborate re-vegetation process spanning at least two
winter seasons.
The current accumulated sand volume exceeds the buffer capacity of the back dunes and
cannot be accommodated in the current location. The impact of sand moving onto the
Sectors to the west of the Hout Bay River, coupled with uncontrolled pedestrian access, the
sand erosion patterns are severe and largely unpredictable.
The presence of disused buildings, paved and unpaved parking areas, defunct launch ramps
and uncontrolled sand movement makes this MU particularly difficult to manage adequately
and cost effectively.
hout bay dunes management & rehabilitation plan
73
(iv) Detailed proposal
(a) Re-profiling of Sectors and construction of artificial dune (detailed profile in Figure 29; schematic profiles F to K in Figures 30 to 35)
The long term stability of the dune management complex depends on limiting the
influx of sand to the buffer zone by trapping it in the vegetated toe situated within the
scour zone from where it is seasonally recycled. Finer sand particles mobilized under
strong wind conditions are accumulated within the vegetated buffer zone. The
vegetation traps the sand and continues to grow, forming increasingly higher dunes.
The maximum stable dune height of a 60 m wide dune complex without irrigation to
the buffer area is between approximately +6MSL and +7MSL.
The dune profile should be re-instated in line with the original CSIR proposals (CSIR,
1989a) with some variation to address problems experienced with the old design.
This would include a larger buffer dune section and a more stable profile footprint that
would not be compromised by the position of existing buildings as these would be
removed
No provision should be made for direct beach access for either pedestrians or small
craft. The dune system would be stabilized with marram grass on the dynamic edge
and on the dune front face and crown, with local dune vegetation in the back buffer
area.
The dune complex should have an uninterrupted sand flow from east to west. The
entire system should be constructed, managed and maintained as a unit but only
once the dunes in MU2 & MU4 have been reconstructed. The system (MU5) would
not be able to successfully withstand the longshore impact of the unmanaged eastern
beach as this area is the source of sand that caused the buildup and collapse of the
current dunes in this area.
The entire managed dune complex should be fenced off as pedestrian access to this
fragile system has proven to be pivotal in the collapse of these artificial systems.
The dunes should be reconstructed to retain accumulated sand in the dynamic scour
zone with only excessive amounts of sand spilling over and entering the buffer zone
(Figure 29). It is however anticipated that the latter would accrue sand over time.
After this, the vegetation will be need to be harvested, accumulated sand removed
and the buffer area re-profiled and the vegetation reinstated. The time frame is not
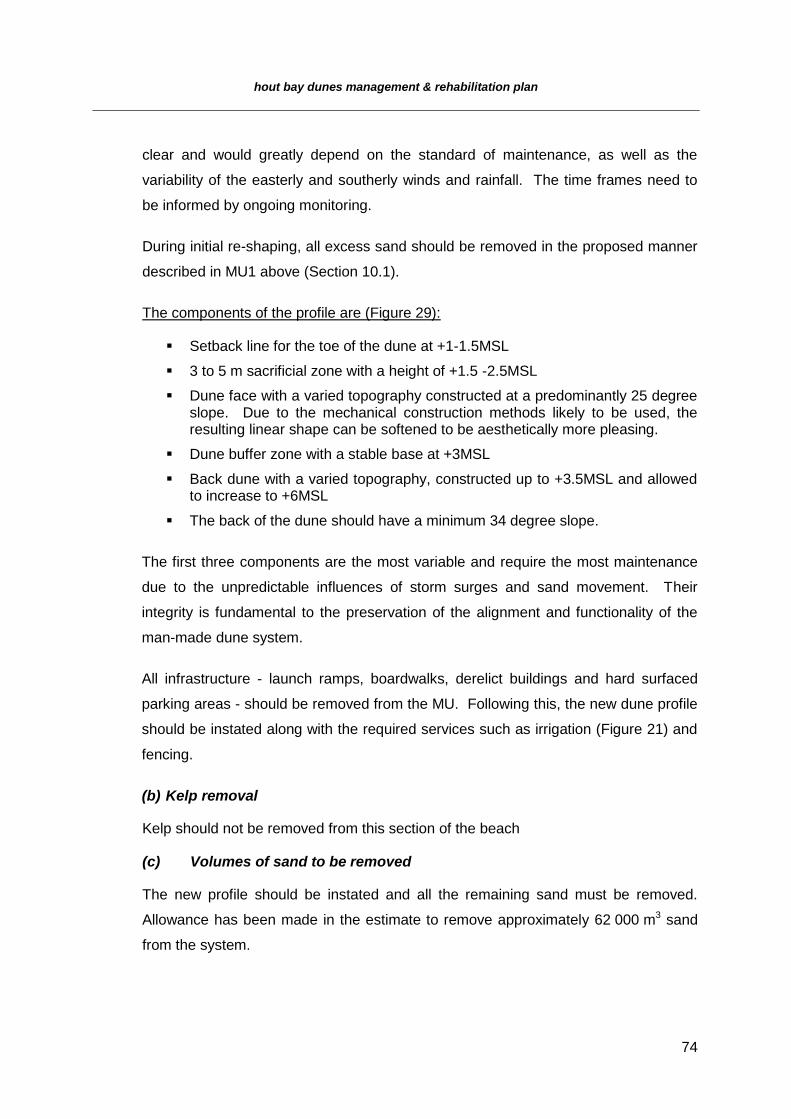
hout bay dunes management & rehabilitation plan
74
clear and would greatly depend on the standard of maintenance, as well as the
variability of the easterly and southerly winds and rainfall. The time frames need to
be informed by ongoing monitoring.
During initial re-shaping, all excess sand should be removed in the proposed manner
described in MU1 above (Section 10.1).
The components of the profile are (Figure 29):
Setback line for the toe of the dune at +1-1.5MSL
3 to 5 m sacrificial zone with a height of +1.5 -2.5MSL
Dune face with a varied topography constructed at a predominantly 25 degree slope. Due to the mechanical construction methods likely to be used, the resulting linear shape can be softened to be aesthetically more pleasing.
Dune buffer zone with a stable base at +3MSL
Back dune with a varied topography, constructed up to +3.5MSL and allowed to increase to +6MSL
The back of the dune should have a minimum 34 degree slope.
The first three components are the most variable and require the most maintenance
due to the unpredictable influences of storm surges and sand movement. Their
integrity is fundamental to the preservation of the alignment and functionality of the
man-made dune system.
All infrastructure - launch ramps, boardwalks, derelict buildings and hard surfaced
parking areas - should be removed from the MU. Following this, the new dune profile
should be instated along with the required services such as irrigation (Figure 21) and
fencing.
(b) Kelp removal
Kelp should not be removed from this section of the beach
(c) Volumes of sand to be removed
The new profile should be instated and all the remaining sand must be removed.
Allowance has been made in the estimate to remove approximately 62 000 m3 sand
from the system.
hout bay dunes management & rehabilitation plan
75
(d) Detailed costing
The cost estimate (Appendix 4) for MU 5 is based on the conceptual design of the
main catchment buffer west of the river. Detailed designs should be re-priced in order
to refine the costing of specific requirements of this area at the time of
implementation.
The cost estimate allows for detailed design and construction of the managed dune system.
This includes the removal of excess sand from the areas of accumulation in the current
dysfunctional public areas, installation of irrigation and permanent as well as sacrificial
fences and for 12 months of basic maintenance, the cost of demolishing and making safe of
the existing infrastructure is excluded.
(v) Conclusions: implications of intervention
The re-profiling and management of MU 5 presents the greatest challenge to the success or
otherwise of the management plan. It is in this area that most of the sand ingression has
occurred and where stability will be crucial to reducing inland sand flow. The system must be
treated as an integrated whole, with all elements undertaken in concert, as recommended
above. Past management of this unit in isolation has been difficult given that the MU is
exposed to the impact of harsh summer winds from the east and south-east. The successful
stabilization of MU2 and MU4 will reduce the sand input into MU5 thus improving the
management capability of the area substantially. Removing infrastructure from MU5 will also
enhance the management success of the MU in the long term, reducing sand ingression into
the neighboring urban area.
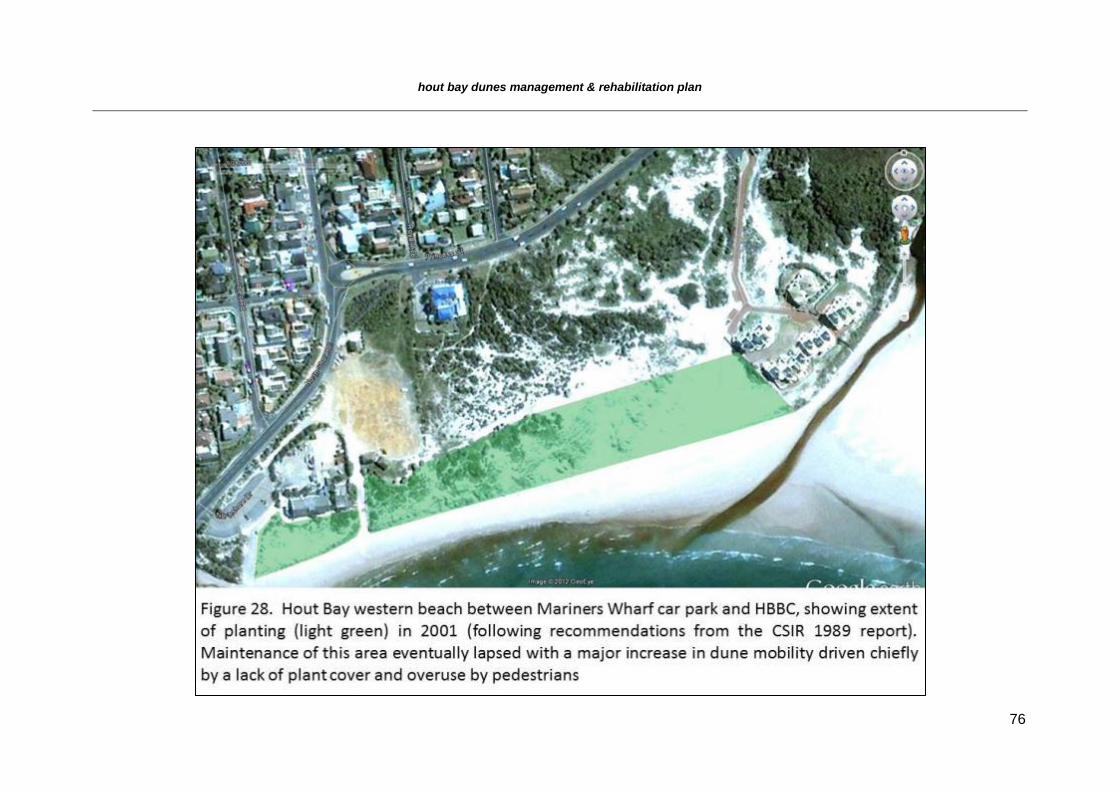
hout bay dunes management & rehabilitation plan
76
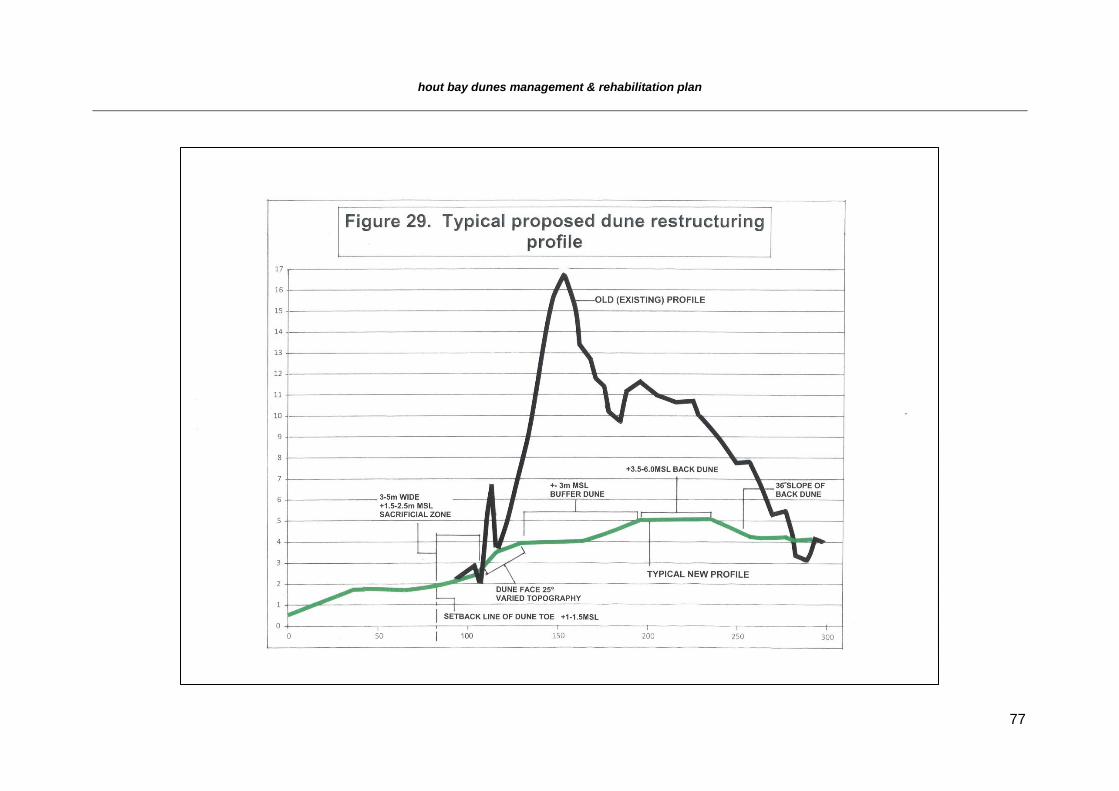
hout bay dunes management & rehabilitation plan
77
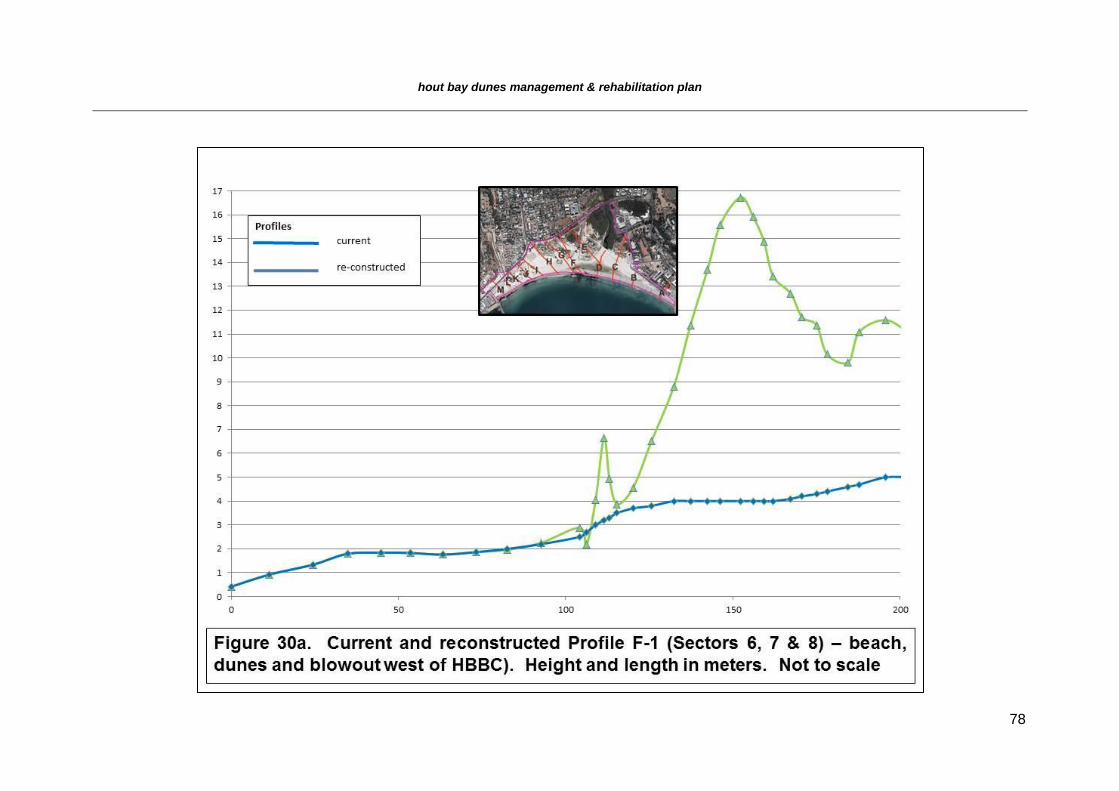
hout bay dunes management & rehabilitation plan
78
Figure 30a. Current and reconstructed Profile F: front section of beach, high dunes and blowout directly west of
HBBC (Sectors 6, 7 & 8)
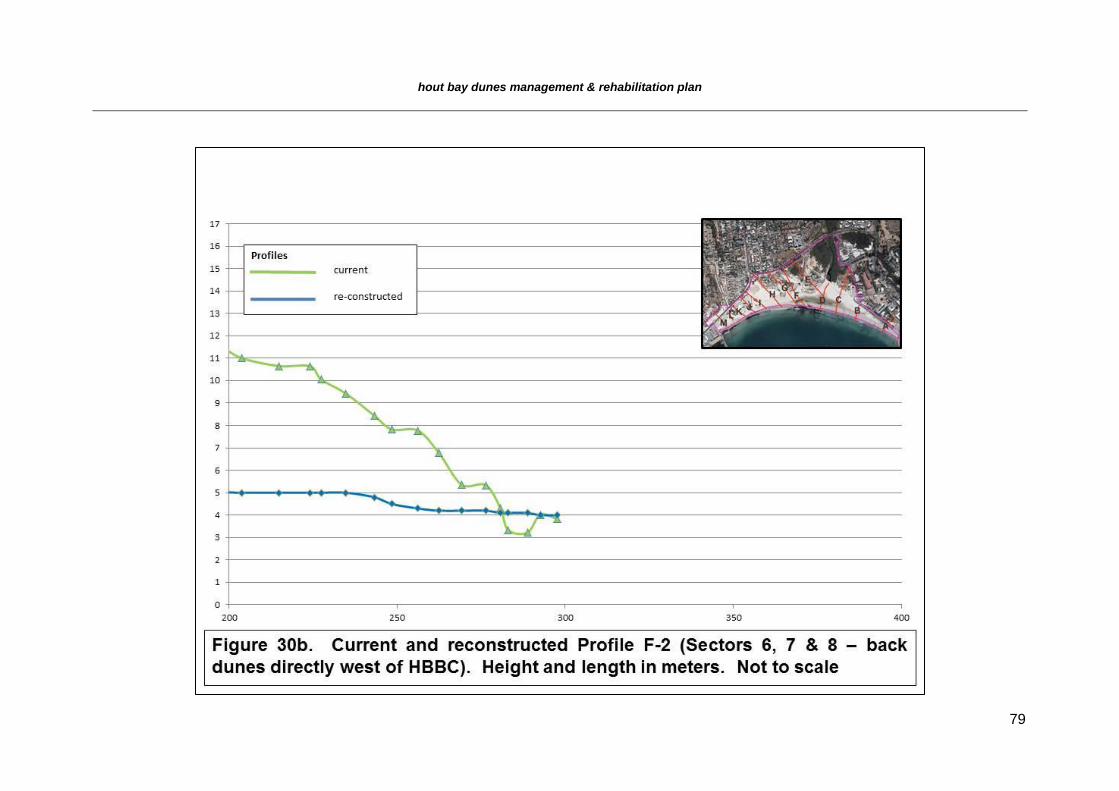
hout bay dunes management & rehabilitation plan
79
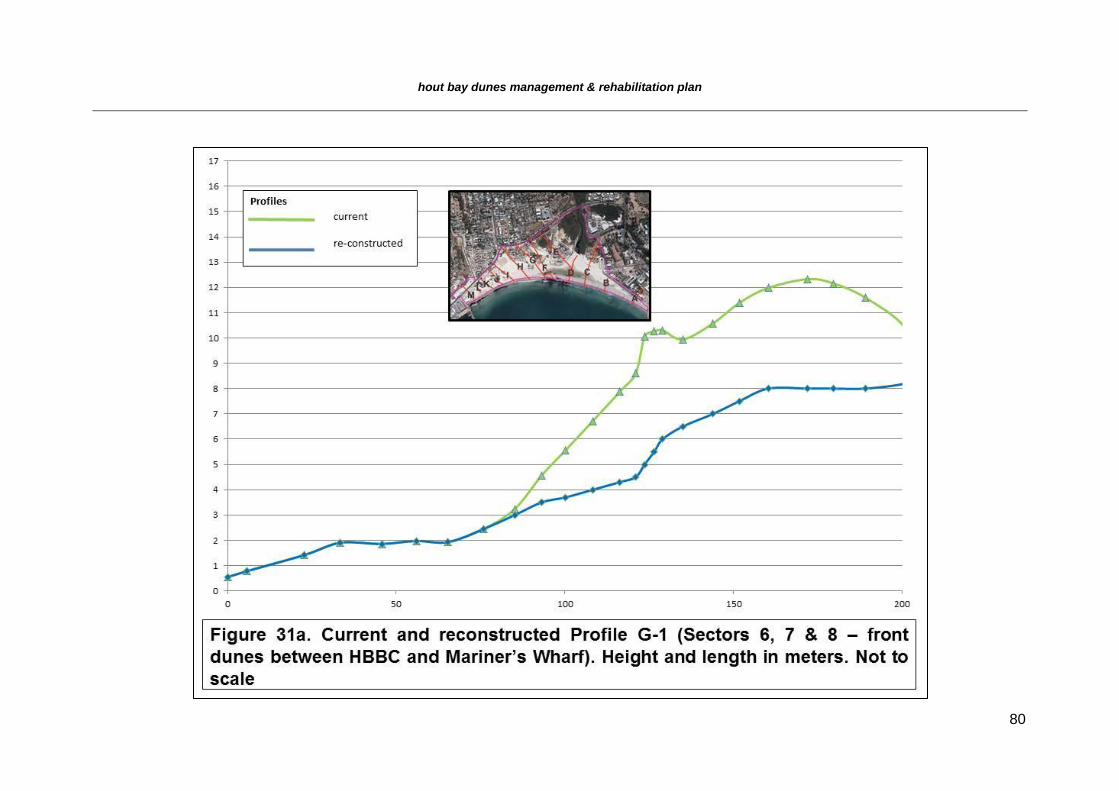
hout bay dunes management & rehabilitation plan
80
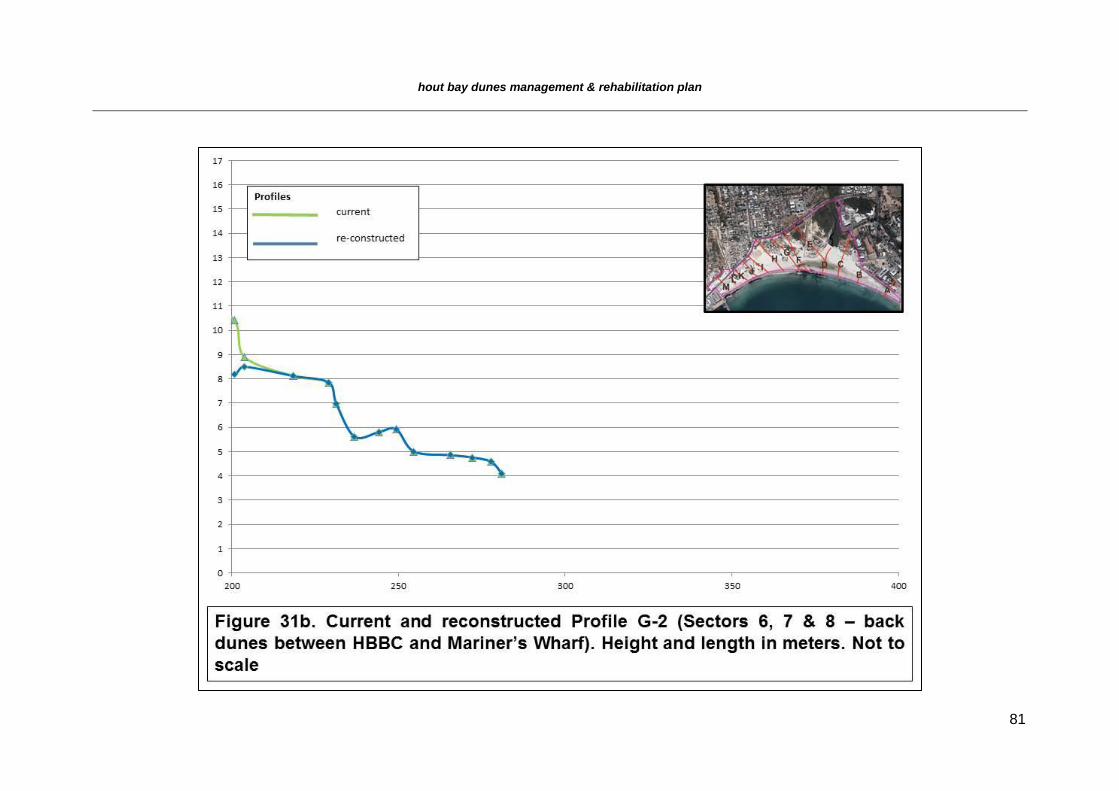
hout bay dunes management & rehabilitation plan
81
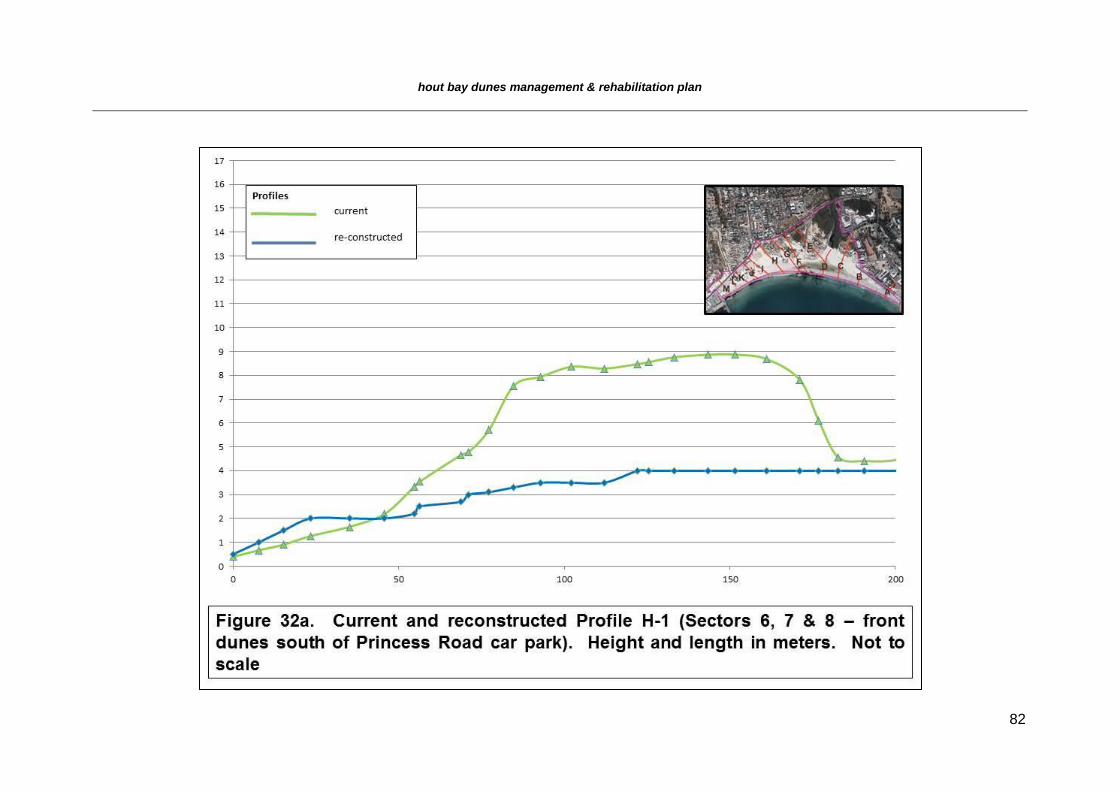
hout bay dunes management & rehabilitation plan
82
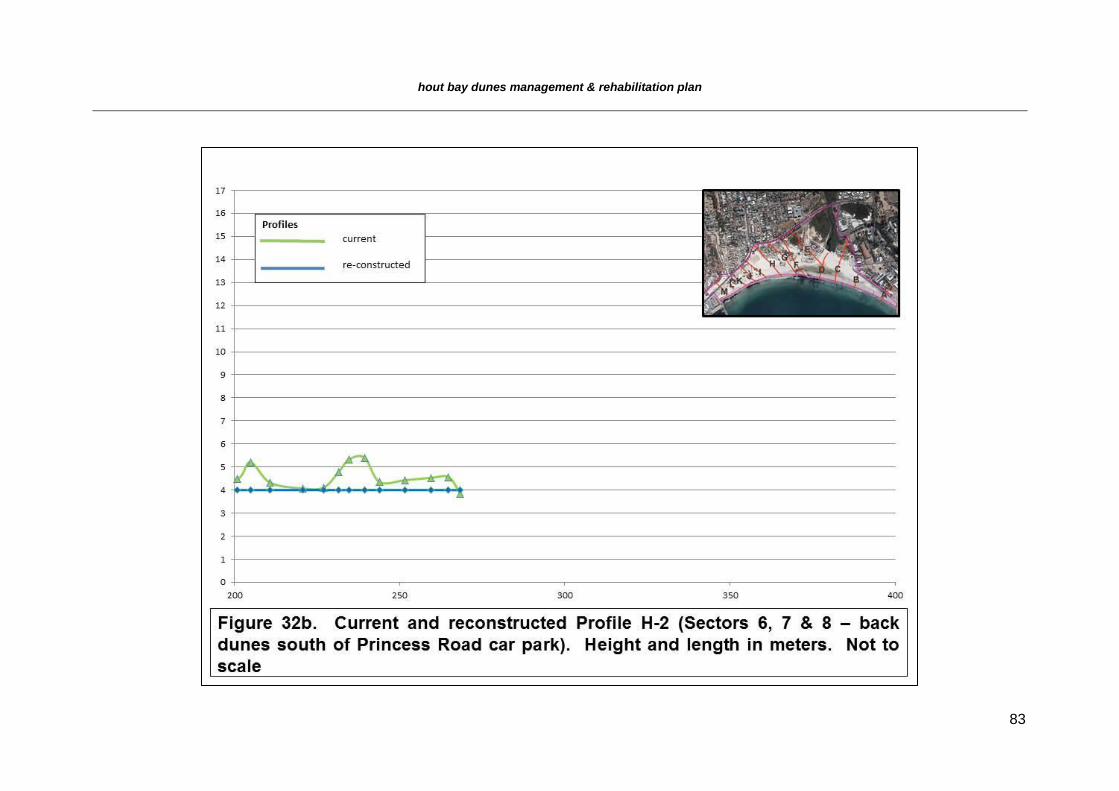
hout bay dunes management & rehabilitation plan
83
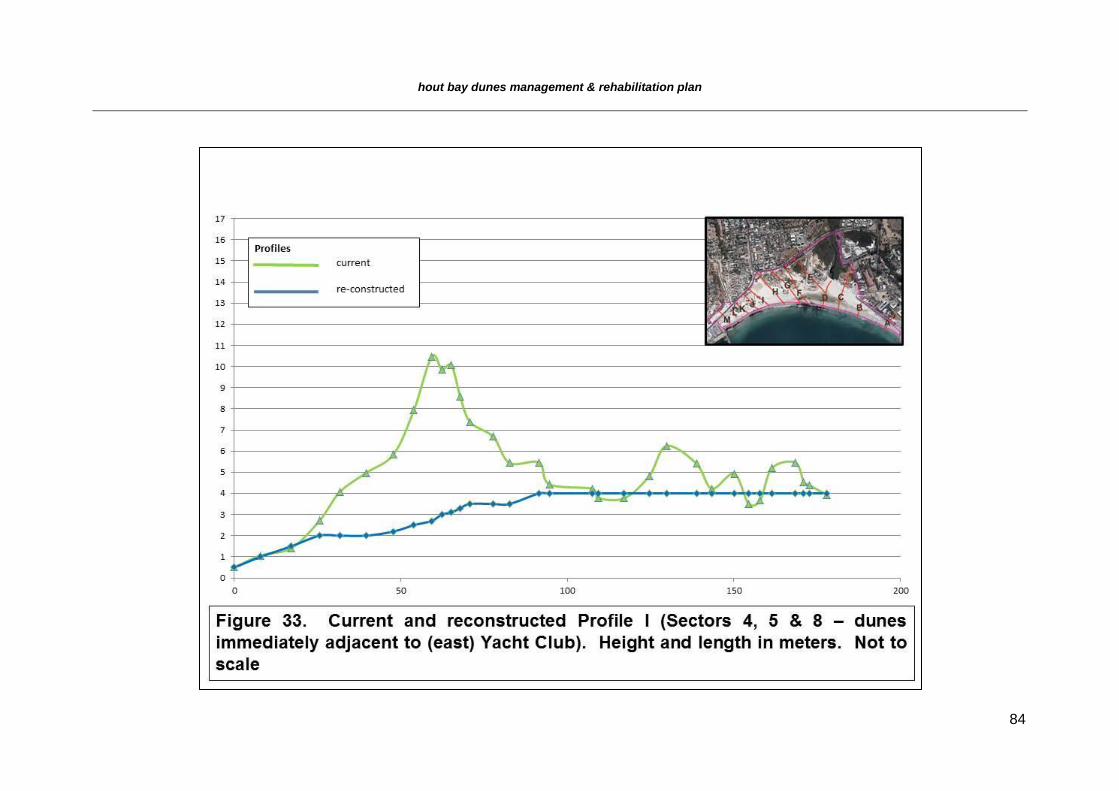
hout bay dunes management & rehabilitation plan
84
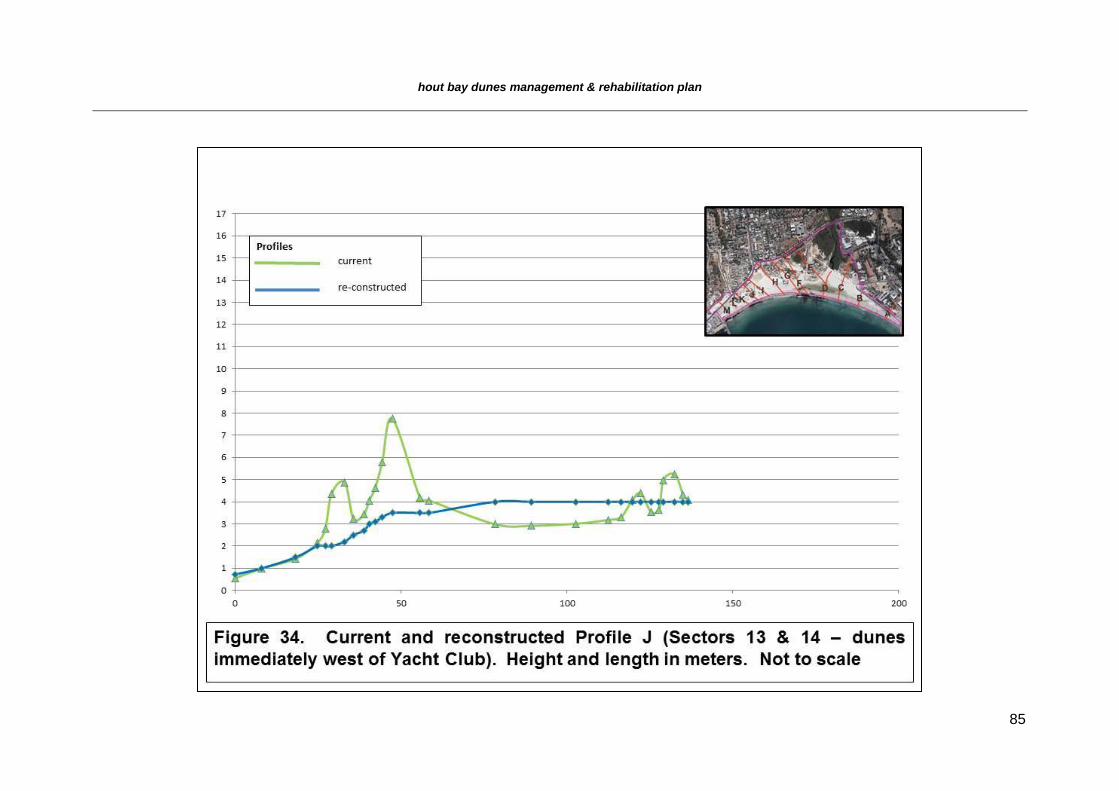
hout bay dunes management & rehabilitation plan
85
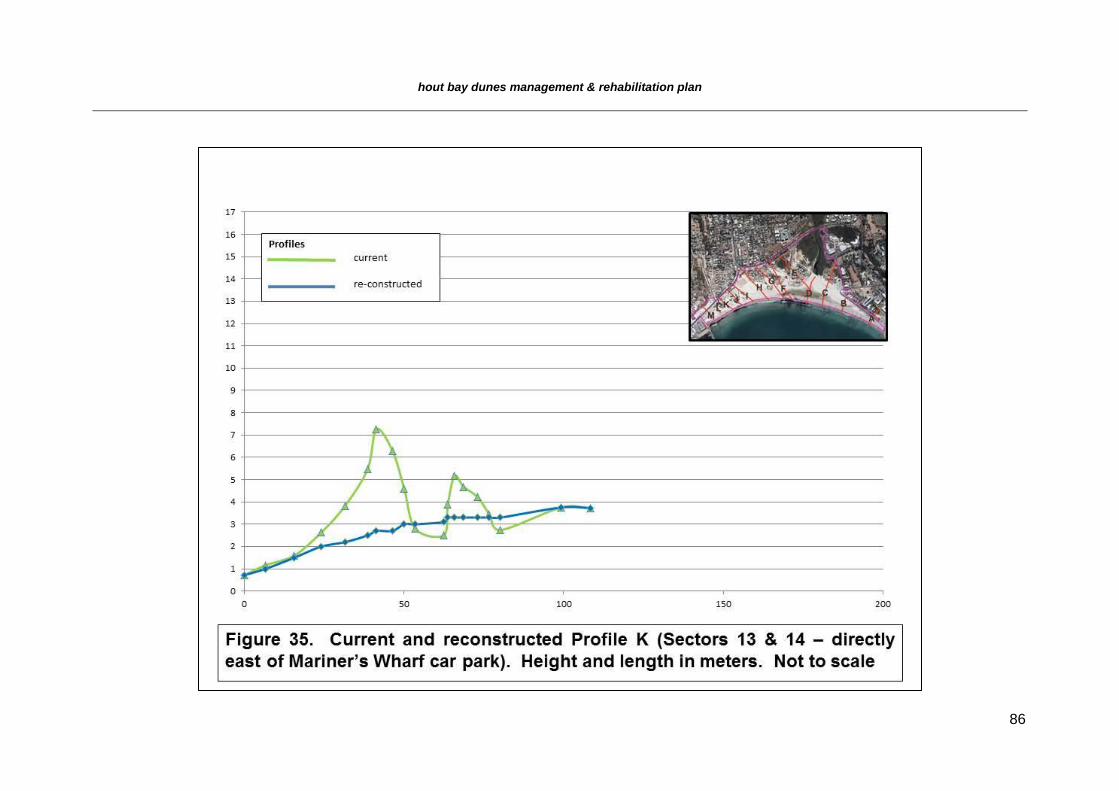
hout bay dunes management & rehabilitation plan
86
hout bay dunes management & rehabilitation plan
87
Management Unit 6 (Sector 15 – beach and parking area at 10.6Mariner’s Wharf) – see Figures 15 & 16
Ownership is mainly by the CCT, but also the Public Works Department and private, with one Erf unknown. Zoning is chiefly POS and beach activities, with the bulk of the private Erven unknown. Much of the site is currently used as a parking area to service restaurants in the Hout Bay harbour. See Appendices 2 & 3 for details of Erven and imgaes.
(i) Current status
The main activities beach in the west consists of a 120 m x 30 m beach and a parking area
flanked on the east by a storm water outlet and on the west by the vehicle access to the
harbour wall.
The parking area is currently edged by informal rock placement and sand spills through this
onto the parking area
The storm water outlet scours the beach in an unpredictable fashion resulting in a variable
and scoured topography in the area between the road and the high water mark
The flat profile of the beach and exposure to the summer winds has resulted in major erosion
of sand. Even the slight elevation of the parking area above the beach does not prevent
wind from moving sand across the parking area, into and across Harbour Road, to the bus
parking area behind this.
(ii) Past management
Sand accumulated in the bus parking area is periodically cleared by the City of Cape Town’s
Amenities department.
(iii) Prognosis
This Sector has the least movement of sand within the Hout Bay dune system and requires
minimum effort to manage sand arising from the beach.
(iv) Detailed proposal
(a) Re-profiling of Sector 15 and construction of artificial dune (profiles L & M in Figures 36 & 37)
Accumulation of sand in a predictable manner in an accessible area for periodic
removal would be the most practical management option for this sector. In essence
the proposal echoes that of Sector 1, the eastern beach and Promenade
hout bay dunes management & rehabilitation plan
88
The current profile should be retained. Removal of accumulated sand from a pre-
defined constructed edge would improve the current management. The construction
of a purpose built retaining wall 50 cm higher than the current parking area surface is
recommended (Figure 38). The wall should be engineered to withstand possible
inundation from spring equinox high tides and should have adequate foundations. A
Reno mattress, at least 2 m wide and 30 cm thick should run the entire length of the
parking area. Sand should be allowed to accumulate against the wall for scheduled
removal. A D6 bulldozer would be required to push sand towards the eastern end of
the parking area. Here a ramp would need to be constructed in order for a front-end
loader to dispose of sand in trucks. Sand disposal should be undertaken in keeping
with the proposed sand management regime (see options described in MU1). Re-
shaping and possible sand removal should be conducted in October. During April,
summer sand accumulation should be removed and the beach area re-shaped. After
sand removal, reshaping of the activities beach should be completed. The final
profile of the activities beach should allow for a gentle slope from the intertidal zone to
the proposed retaining wall along the parking area. This section of beach should be
kept clear of kelp and debris and should be regularly maintained and cleared of litter.
The parking area should be re-designed and extended to the east by 25 m, up to the
edge of Sectors 13 and 14, once the storm water has been re-routed (see below).
Access to the beach from the parking area should be in the form of a series of stairs
constructed from Poly-wood and that can hinge back onto the parking area for access
by the public and management teams (see Figure 38).
(b) Storm water outlet
The storm water outlet to the east of the parking area cannot be integrated into the
beach management plan. Rather, it should be ducted from the current position of the
culvert north of Northshore drive, along the bus parking area and then along the
vehicle ramp to the harbour wall. The outlet should be seaward of MSL.
(c) Kelp removal
Kelp removal from this Sector should continue as part of an overall kelp harvesting
programme which targets only this MU and MU 1 in the east.
hout bay dunes management & rehabilitation plan
89
(d) Volumes of sand to be removed
Minimal sand removal is required outside of the scope of works of the re-development
of the parking area.
(e) Detailed costing
Cost estimates (Appendix 4) for MU 6 are based on the conceptual design for
formalized management of the activities beach. Detailed designs should be re-priced
in order to refine the costing of specific requirements.
The cost estimate allows for detailed design and construction of a formal parking area
with a re-enforced shoulder to the edge of the parking area, removal of excess sand,
installation of access stairs between the parking area and the beach and the re-
routing of the storm water outlet to the edge of the pier. Basic maintenance for a 12
month period has also been priced
(v) Conclusions: implications of intervention
It is recommended that the Mariner’s Wharf car park serve as one of only two pedestrian
access points to the beach, the other being the Promenade in the east. Managing these
easy access areas for high impact use will alleviate pressure from the functional dune
areas. Public participation and education will be key to the successful implementation of
the management strategy. Increased capacity through the re-development and
expansion of the car park will result in less ad hoc parking during peak periods. The
managed dune profile will have an increased user capacity and the area is compact and
can be maintained at a high standard making it more desirable for tourists.
Improved storm water management will result in less ad hoc damage to the beach. The
management of the adjacent MU5 will reduce sand build-up in the storm water catchment
culvert on the bus parking area, reducing maintenance and allowing for better
functionality.
.
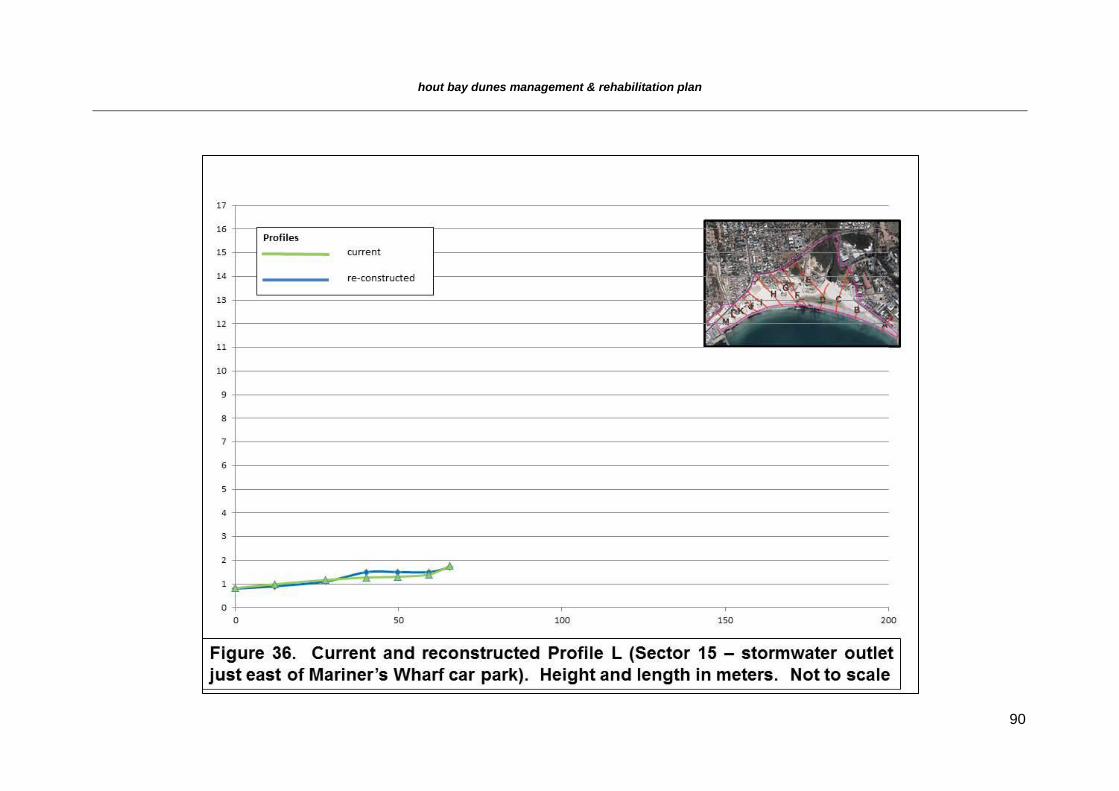
hout bay dunes management & rehabilitation plan
90
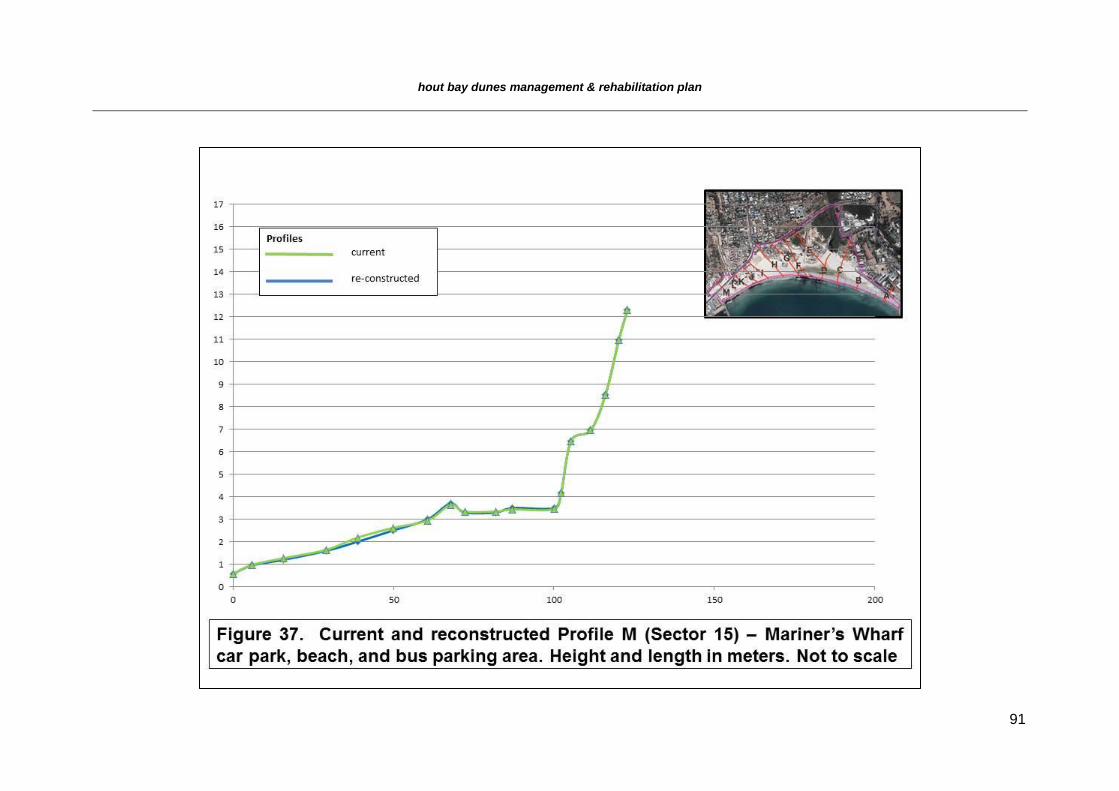
hout bay dunes management & rehabilitation plan
91
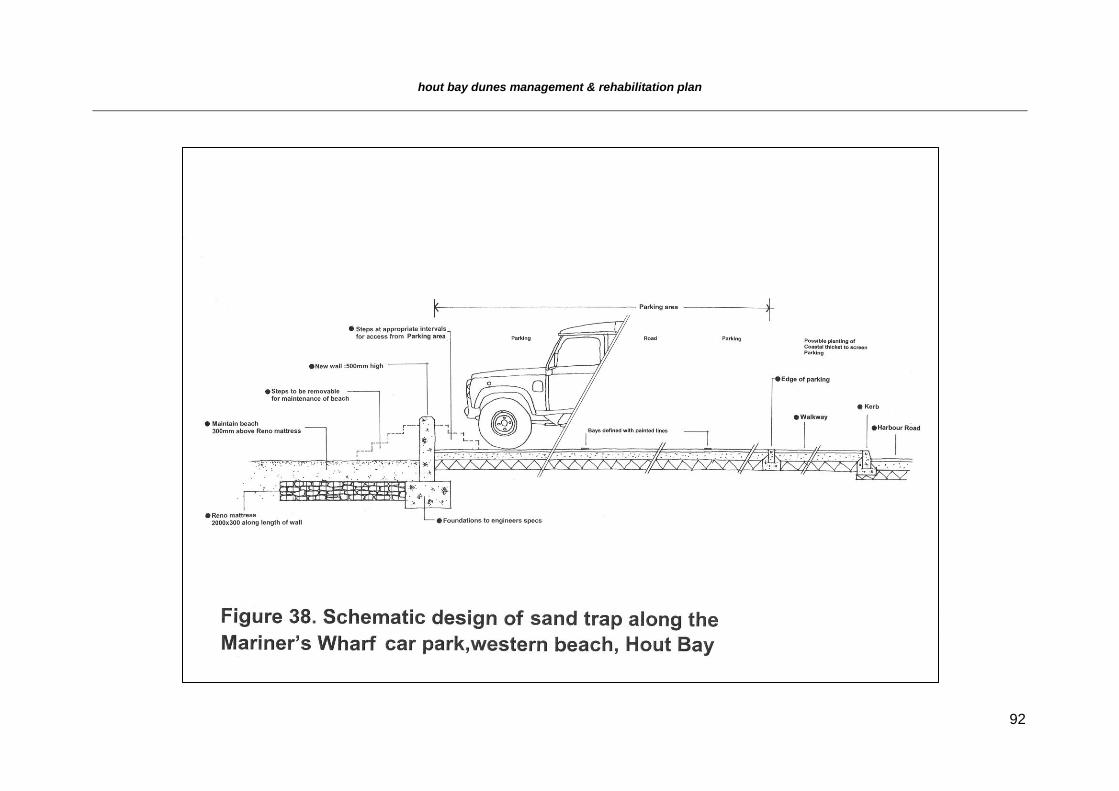
hout bay dunes management & rehabilitation plan
92
Figure 38. Current and reconstructed Profile M (Sector 15) – Mariner’s Wharf car park and beach, and bus parking area
hout bay dunes management & rehabilitation plan
93
11. MONITORING OF HOUT BAY DUNE MANAGEMENT
The purpose of monitoring the management programme for the Hout Bay dunes is several-
fold:
(i) To ensure windblown sand is kept to a minimum and is not a nuisance
(ii) To respond to windblown sand where it is causing a problem, particularly with the public
(iii) To ensure planned management interventions are undertaken timeously, within schedule, and in an adequate manner
(iv) To document plant cover and species presence and to re-establish plant cover where necessary
(v) To document changes in the weather in the area (using the Chapman’s Peak weather station as surrogate for Hout Bay) and to respond appropriately in severe wind and/or dry conditions
(vi) To monitor reconstructed dune profiles and to reshape where required
(vii) To monitor the impact of pedestrians on the dunes
(viii) To monitor the status of the river mouth in terms of closing in summer and breakout in winter; in particularly the effectiveness of manual methods of opening up the channel
(ix) To monitor the impact of kelp on dune building above the HWM and the success of “no kelp removal zones”
Monitoring Methods 11.1
A variety of monitoring methods would be required in order to obtain relevant information to
base an adaptive management regime on. The monitoring methods should be fully
developed as part of the detail design of the interventions.
(i) Automated weather station and data logger situated in the Hout Bay dune complex, recording local wind and rainfall data. Management can be adjusted according to deviation from long term norms.
(ii) Dust fall out monitoring stations, situated at approximately 100 m intervals along monitoring transects of 1000 m. Three to four transects will be required. These should be installed prior to any management interventions as no data is available to determine the fall out patterns resulting from the unmanaged dune system.
(iii) Fixed sand level measurement posts, installed to 1.5 m below and 1.5 m above the sand level, marked at 10 cm intervals. Sand level measurements to be recorded every 14 days and after storm events and high wind periods.
a. Installed on activities beaches east and west, to visually gage short term sand profile changes. Posts should be situated approximately midway between the retaining structures and the high water level. Another series of level pegs should be positioned against the retaining structure at 50 m intervals.
hout bay dunes management & rehabilitation plan
94
b. Installed at right angles to the fence lines in all the managed dune areas, at 50 m intervals, in short 20 m transects starting at the sacrificial fence spaced 5 m apart
(iv) Landscape functional analysis transects
a. Permanent transects should be installed from the high water mark to the inland edge of the dune management area MU 2, MU4 and MU5 at 50 m intervals. These transects should be monitored at the end of summer and the end of winter to determine the dynamic state of the dune systems
(see http://www.csiro.au/en/Organisation-Structure/Divisions/Ecosystem-Sciences/EcosystemFunctionAnalysis.aspx#a1)
(v) Inspection of the scour zone and buffer dunes
a. The condition of the vegetation and status of the irrigation should be assessed every 14 days. Maintenance schedule should be adjusted should the inspections reveal dieback or disease in the vegetation. Repairs should be affected to irrigation should it be required.
(vi) Fixed point photography
Maintenance requirements 11.2
Maintenance forms an integral part of the management of the dune system. The discussion
in Chapter 6 illustrates the importance of adequate and preventative maintenance on a
perpetual and ongoing basis as the most cost effective management option. A detailed
Operational Environmental Management Plan must be developed as part of the detailed
planning for the interventions and should include the following maintenance requirements:
(i) Activities Beach (MU 1 and MU 6)
a. Weekly removal of kelp from beach and placement in kelp zones of MU3-5
b. Daily removal of rubbish
c. Monitor sand accumulation against retaining wall. Remove sand once accumulation reaches an average of 300 mm above the designed level (Figure 24 & Figure 38).
(ii) Managed dunes profiles MU2, MU4 & MU5
a. Allow kelp accumulation
b. Monitor and maintain sacrificial fence during summer. Once damage is imminent (winter), remove for safekeeping
c. Re-instate sacrificial fence after September spring high tide
d. Maintain signage and permanent fence
e. Monitor irrigation system every two weeks and maintain in working order. Adjust controller in response to weather and plant growth. Once buffer and back dune vegetation has been established, irrigation can be reduced. Independent frontal irrigation line must function throughout summer in order to ensure adequate growth of Marram to catch any sand accumulation
hout bay dunes management & rehabilitation plan
95
f. Remove for safekeeping, the entire scour zone irrigation system’s piping and sprinklers at the end of April.
g. Fertilize marram grass areas once every month during summer using 2:3:2 (22) @ 400 kg/ha and Bounce Back @ 600 kg/ha during year one. Maintain this level of fertilization for the dune toe area and adjust in response to growth.
h. Post September high-tide maintenance:
i. Re-profile dune as required
ii. Re-plant Marram that have been washed away
iii. Repair or re-instate sacrificial fencing
iv. Re-instate irrigation system
v. Install wind nets at the toe of MU4 if required and maintain. Remove in April for storage
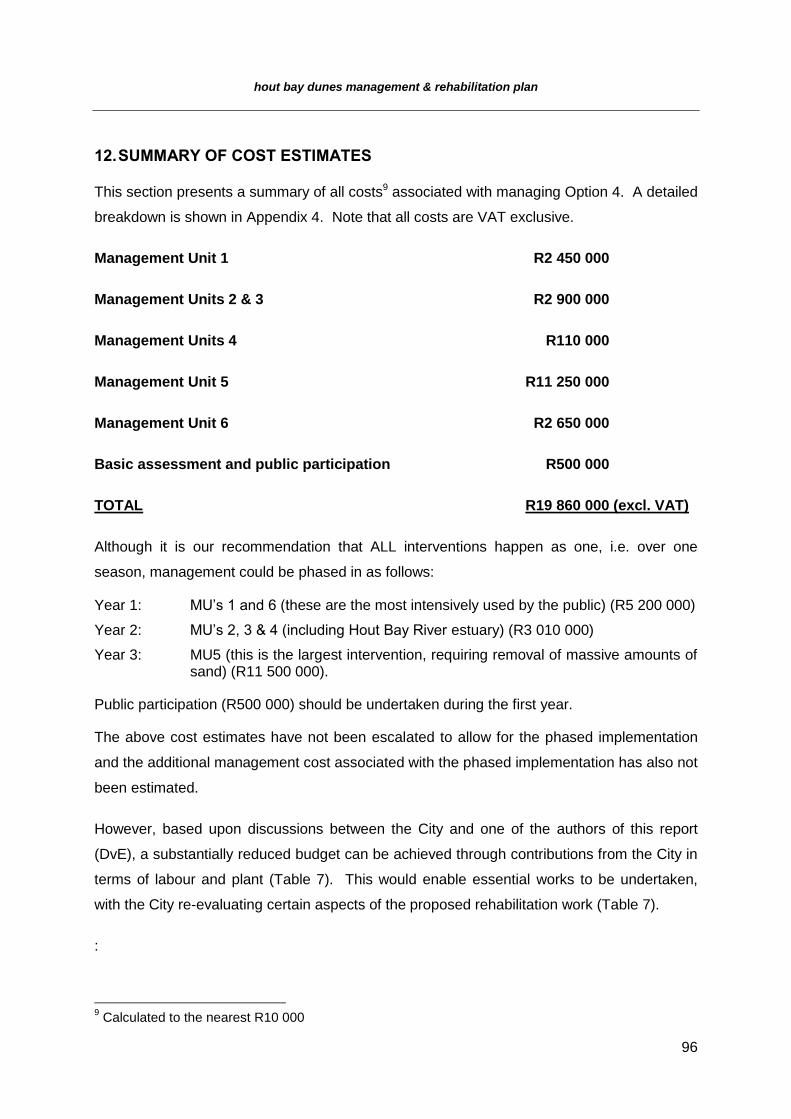
hout bay dunes management & rehabilitation plan
96
12. SUMMARY OF COST ESTIMATES
This section presents a summary of all costs9 associated with managing Option 4. A detailed
breakdown is shown in Appendix 4. Note that all costs are VAT exclusive.
Management Unit 1 R2 450 000
Management Units 2 & 3 R2 900 000
Management Units 4 R110 000
Management Unit 5 R11 250 000
Management Unit 6 R2 650 000
Basic assessment and public participation R500 000
TOTAL R19 860 000 (excl. VAT)
Although it is our recommendation that ALL interventions happen as one, i.e. over one
season, management could be phased in as follows:
Year 1: MU’s 1 and 6 (these are the most intensively used by the public) (R5 200 000)
Year 2: MU’s 2, 3 & 4 (including Hout Bay River estuary) (R3 010 000)
Year 3: MU5 (this is the largest intervention, requiring removal of massive amounts of sand) (R11 500 000).
Public participation (R500 000) should be undertaken during the first year.
The above cost estimates have not been escalated to allow for the phased implementation
and the additional management cost associated with the phased implementation has also not
been estimated.
However, based upon discussions between the City and one of the authors of this report
(DvE), a substantially reduced budget can be achieved through contributions from the City in
terms of labour and plant (Table 7). This would enable essential works to be undertaken,
with the City re-evaluating certain aspects of the proposed rehabilitation work (Table 7).
:
9 Calculated to the nearest R10 000
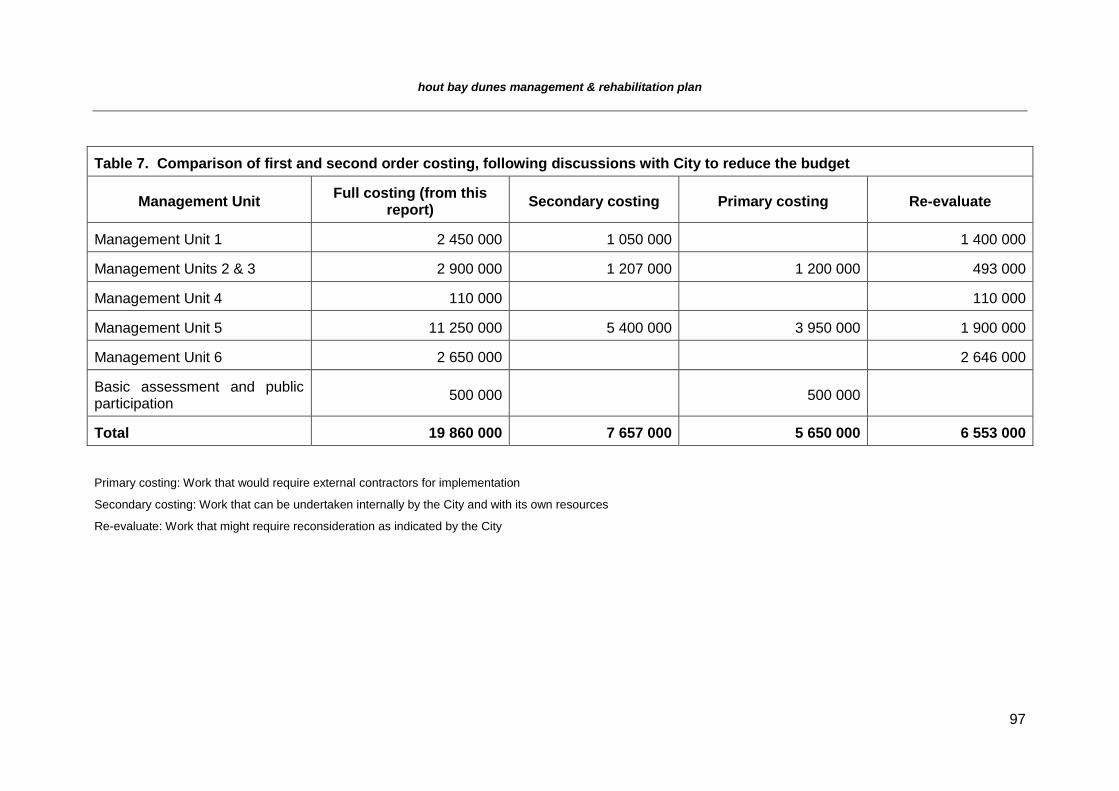
hout bay dunes management & rehabilitation plan
97
Table 7. Comparison of first and second order costing, following discussions with City to reduce the budget
Management Unit Full costing (from this
report) Secondary costing Primary costing Re-evaluate
Management Unit 1 2 450 000 1 050 000 1 400 000
Management Units 2 & 3 2 900 000 1 207 000 1 200 000 493 000
Management Unit 4 110 000 110 000
Management Unit 5 11 250 000 5 400 000 3 950 000 1 900 000
Management Unit 6 2 650 000 2 646 000
Basic assessment and public participation
500 000 500 000
Total 19 860 000 7 657 000 5 650 000 6 553 000
Primary costing: Work that would require external contractors for implementation
Secondary costing: Work that can be undertaken internally by the City and with its own resources
Re-evaluate: Work that might require reconsideration as indicated by the City
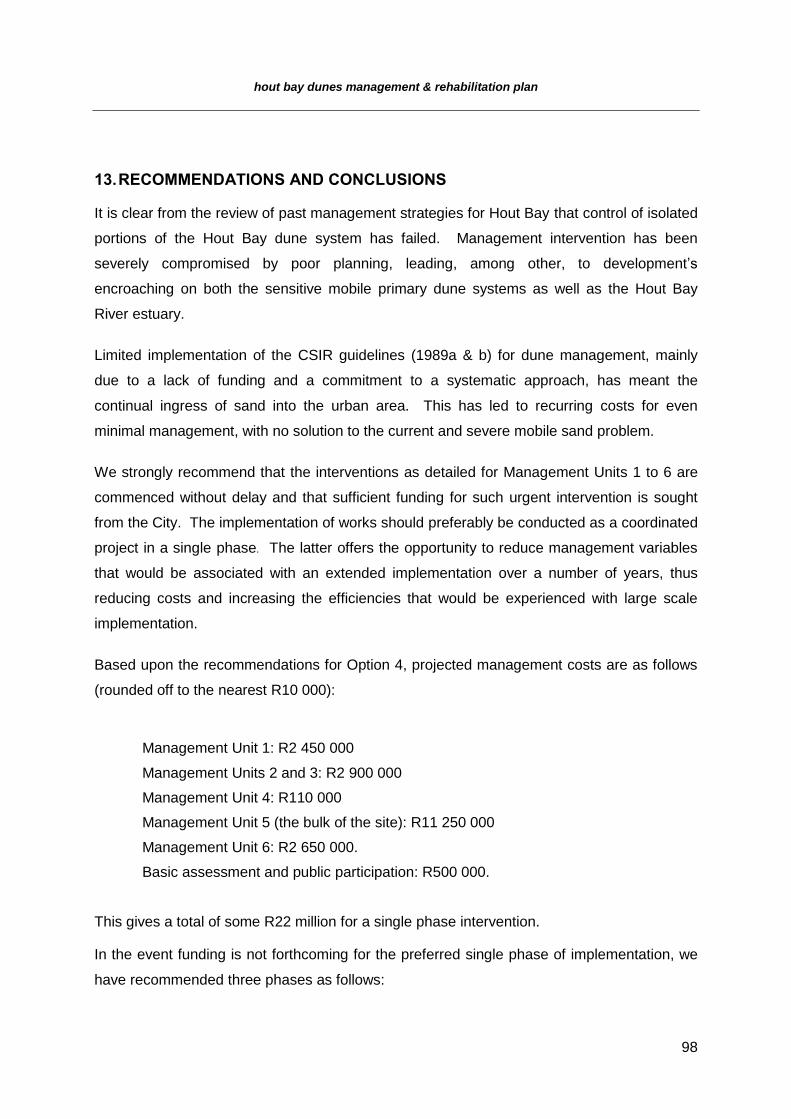
hout bay dunes management & rehabilitation plan
98
13. RECOMMENDATIONS AND CONCLUSIONS
It is clear from the review of past management strategies for Hout Bay that control of isolated
portions of the Hout Bay dune system has failed. Management intervention has been
severely compromised by poor planning, leading, among other, to development’s
encroaching on both the sensitive mobile primary dune systems as well as the Hout Bay
River estuary.
Limited implementation of the CSIR guidelines (1989a & b) for dune management, mainly
due to a lack of funding and a commitment to a systematic approach, has meant the
continual ingress of sand into the urban area. This has led to recurring costs for even
minimal management, with no solution to the current and severe mobile sand problem.
We strongly recommend that the interventions as detailed for Management Units 1 to 6 are
commenced without delay and that sufficient funding for such urgent intervention is sought
from the City. The implementation of works should preferably be conducted as a coordinated
project in a single phase. The latter offers the opportunity to reduce management variables
that would be associated with an extended implementation over a number of years, thus
reducing costs and increasing the efficiencies that would be experienced with large scale
implementation.
Based upon the recommendations for Option 4, projected management costs are as follows
(rounded off to the nearest R10 000):
Management Unit 1: R2 450 000
Management Units 2 and 3: R2 900 000
Management Unit 4: R110 000
Management Unit 5 (the bulk of the site): R11 250 000
Management Unit 6: R2 650 000.
Basic assessment and public participation: R500 000.
This gives a total of some R22 million for a single phase intervention.
In the event funding is not forthcoming for the preferred single phase of implementation, we
have recommended three phases as follows:
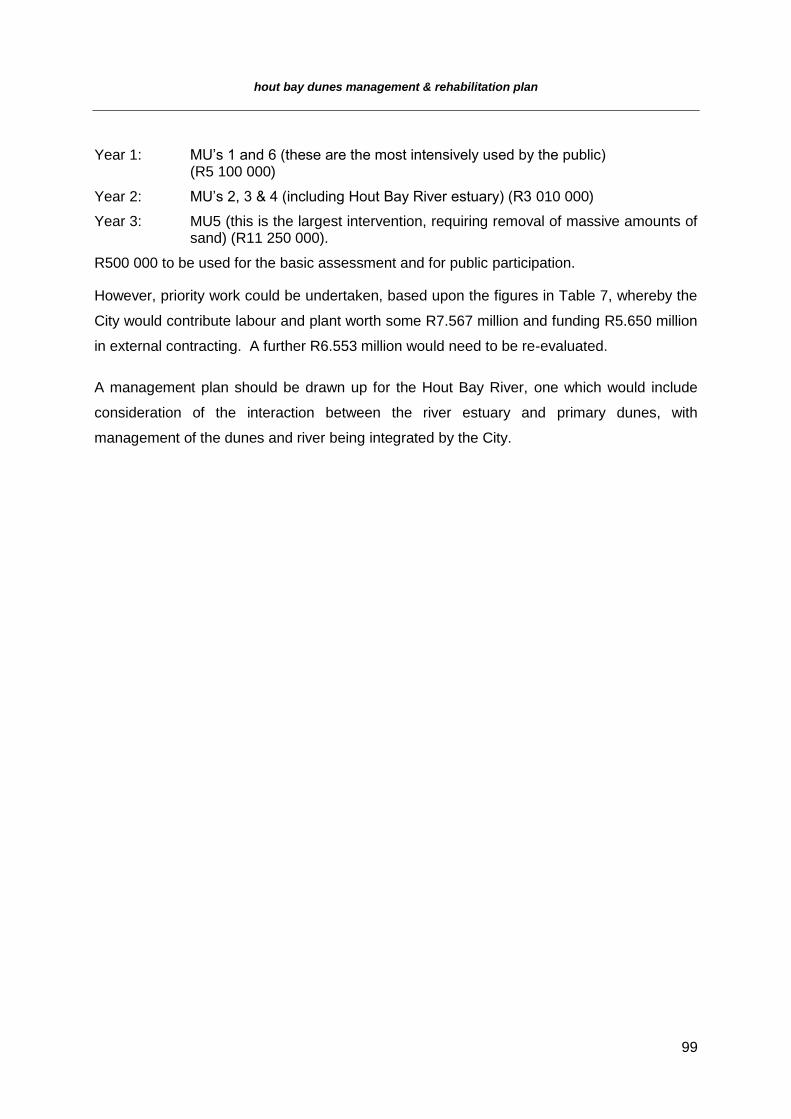
hout bay dunes management & rehabilitation plan
99
Year 1: MU’s 1 and 6 (these are the most intensively used by the public) (R5 100 000)
Year 2: MU’s 2, 3 & 4 (including Hout Bay River estuary) (R3 010 000)
Year 3: MU5 (this is the largest intervention, requiring removal of massive amounts of sand) (R11 250 000).
R500 000 to be used for the basic assessment and for public participation.
However, priority work could be undertaken, based upon the figures in Table 7, whereby the
City would contribute labour and plant worth some R7.567 million and funding R5.650 million
in external contracting. A further R6.553 million would need to be re-evaluated.
A management plan should be drawn up for the Hout Bay River, one which would include
consideration of the interaction between the river estuary and primary dunes, with
management of the dunes and river being integrated by the City.
hout bay dunes management & rehabilitation plan
100
14. ACKNOWLEDGEMENTS
To the CCT project management team, particularly Howard Gold and Darryl Collenbrander, for useful discussion and comment on the report
To Johan Coetzee for surveying the dune transects
To Andrew Skowno for calculating the sand volumes
To the South African Weather Bureau for supply of wind and rain data.
hout bay dunes management & rehabilitation plan
101
15. REFERENCES FOR VOLUMES 1 & 2
CSIR (1989a). Dune management plan and the Hout Bay estuary. CSIR, Stellenbosch
CSIR (1989b). Hout Bay beach front development plan. Report EMA-c 8996. CSIR, Stellenbosch
CSIR (1991). Dolphin Beach management plan and Post Construction Maintenance Manual. CSIR, Stellenbosch
City of Cape Town (2011). Climate change think tank: marine/freshwater theme – marine
inputs to Salt River flood model. Report No. 1063/1. September 2011. Prestidge Retief Dresner Wijnberg Pty) Ltd.
Grindley, S A (1988). Estuaries of the Cape: Part II: Synopsis of available information on individual systems. Report No. 29. Hout Bay (CW 27). Heydorn A E F & Morant P D (eds.). Stellenbosch, CSIR Research Report 428
Low, A B (2012). Dunes that climb and fall no more. Veld & Flora 98(3): 112 - 115
Low, A B & Pond, U (2004). Mapping of coastal dunes within the City of Cape Town metropolitan area. Coastec, Rondebosch
Tinley, K L (1985). Coastal dunes of South Africa. South African National Scientific Programmes Report no. 109. CSIR, Pretoria.

hout bay dunes management & rehabilitation plan
102
APPENDICES
hout bay dunes management & rehabilitation plan
103
APPENDIX 1 – WIND ROSES FROM CAPE POINT FARMS, NOORDHOEK
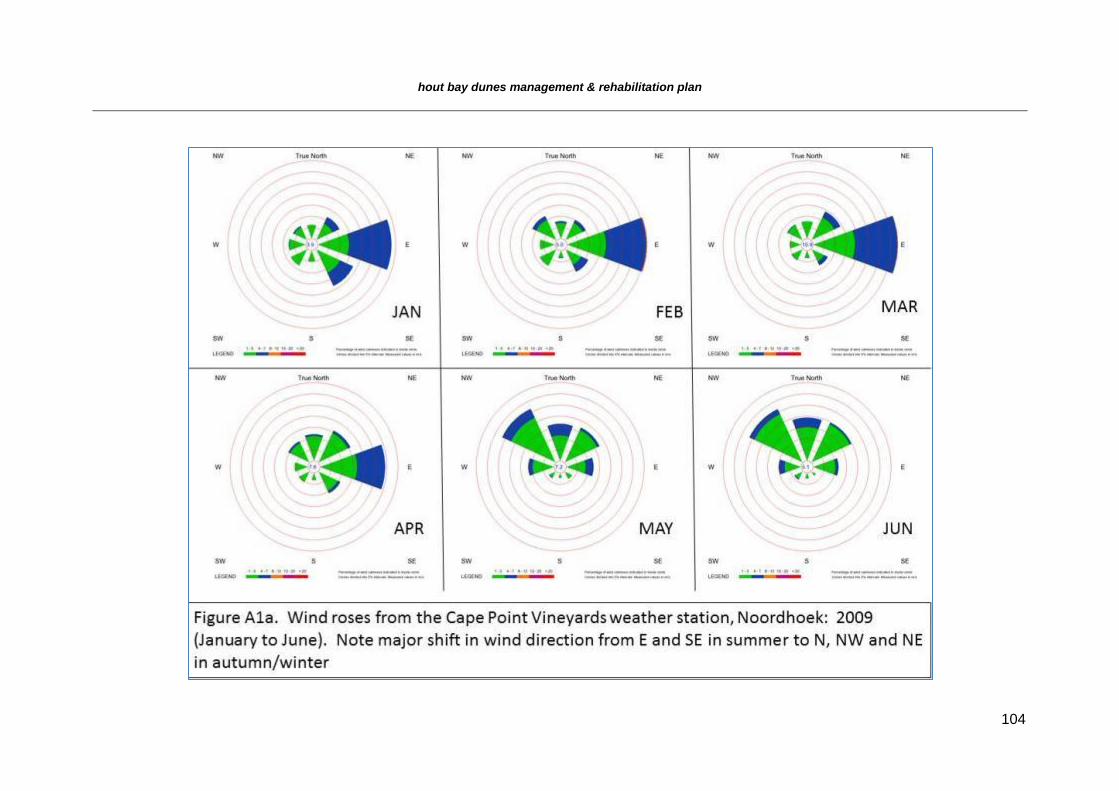
hout bay dunes management & rehabilitation plan
104
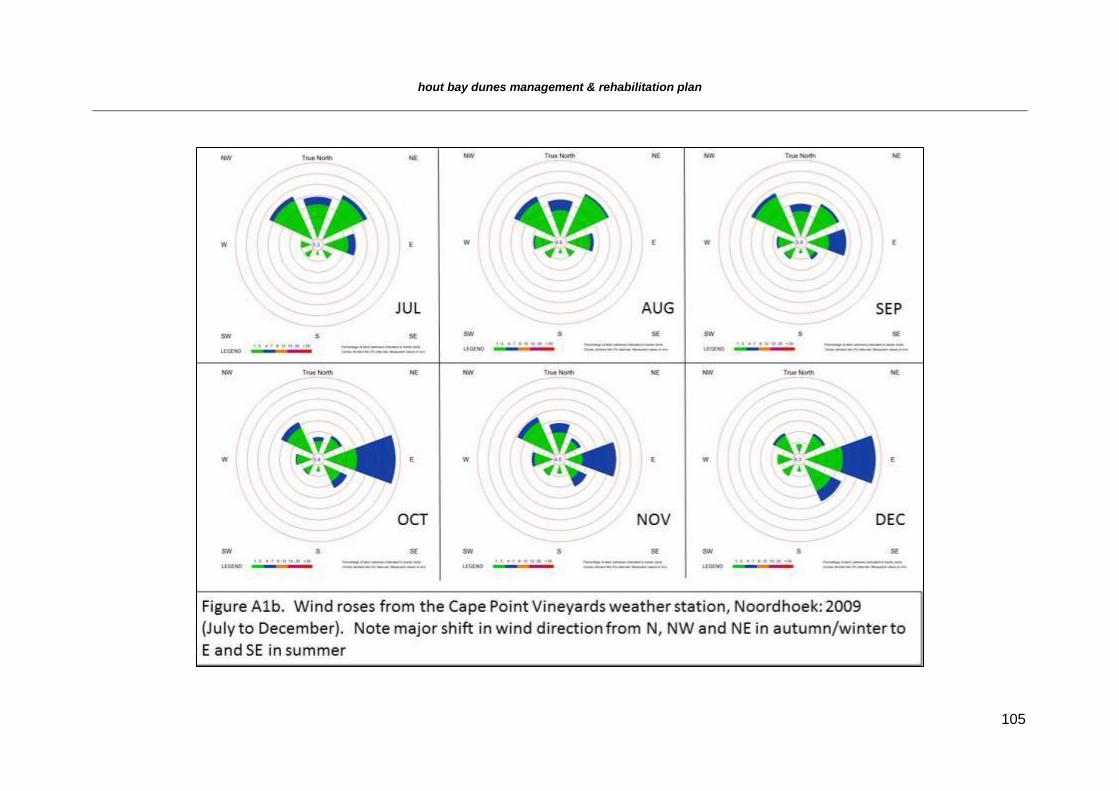
hout bay dunes management & rehabilitation plan
105
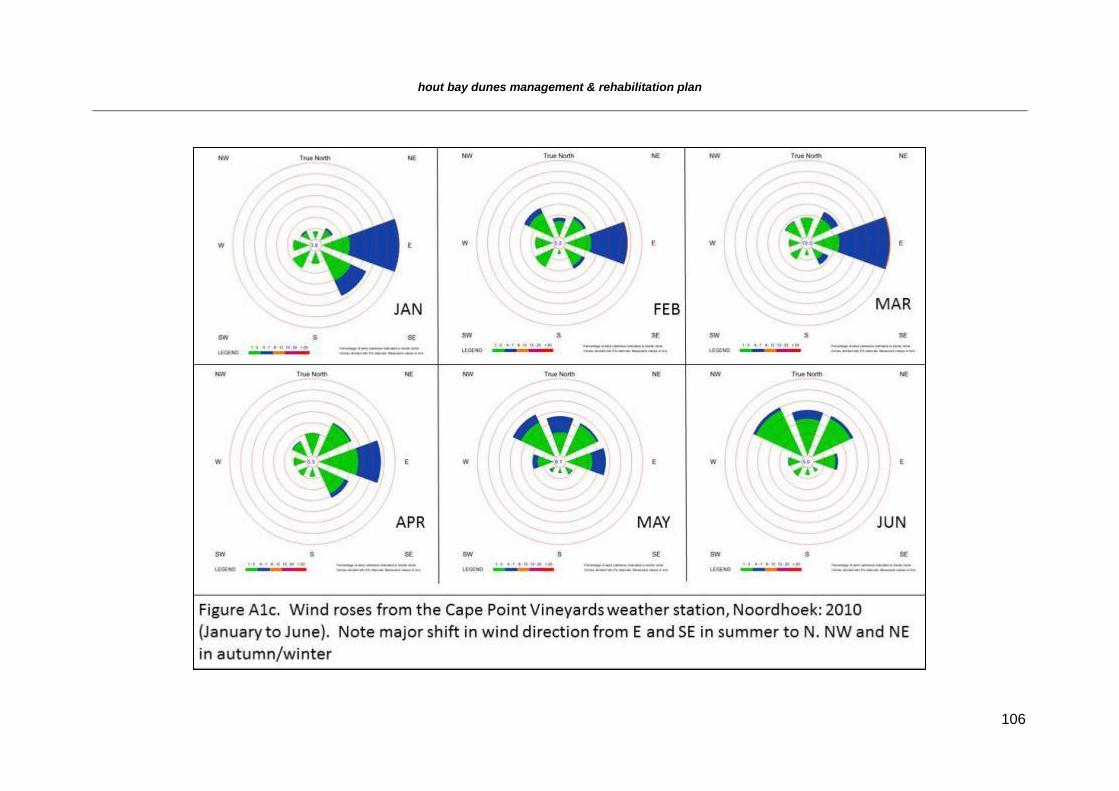
hout bay dunes management & rehabilitation plan
106
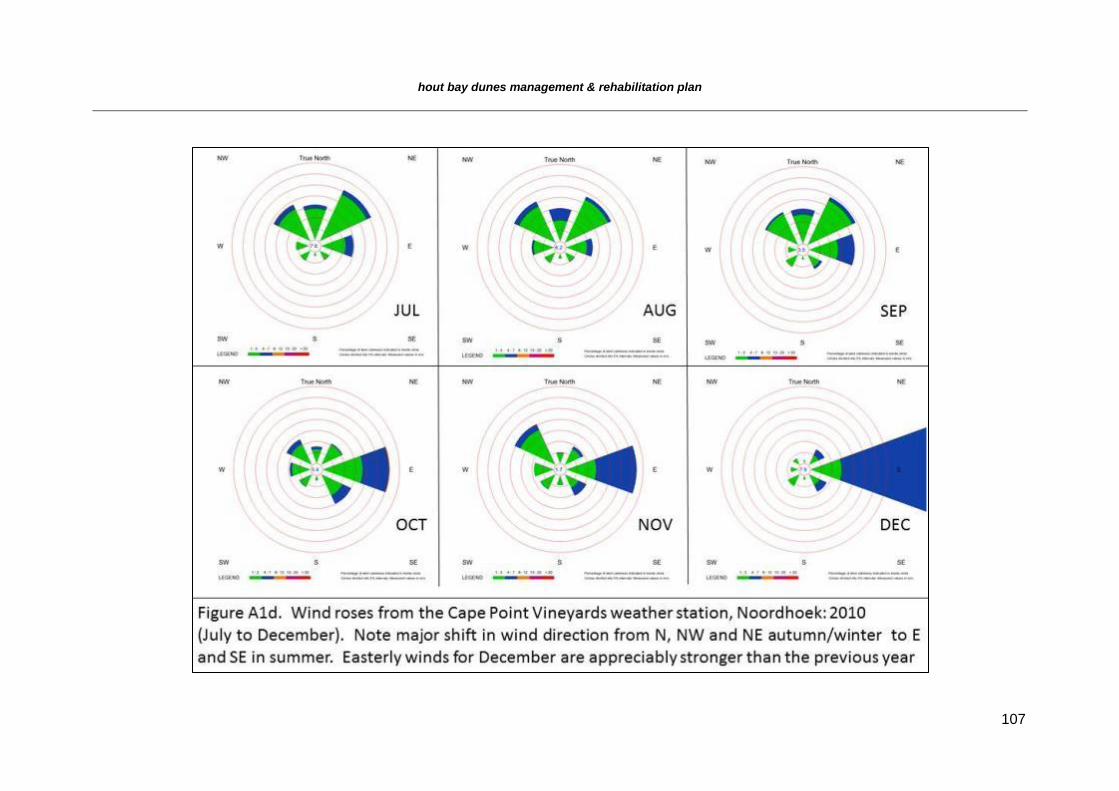
hout bay dunes management & rehabilitation plan
107
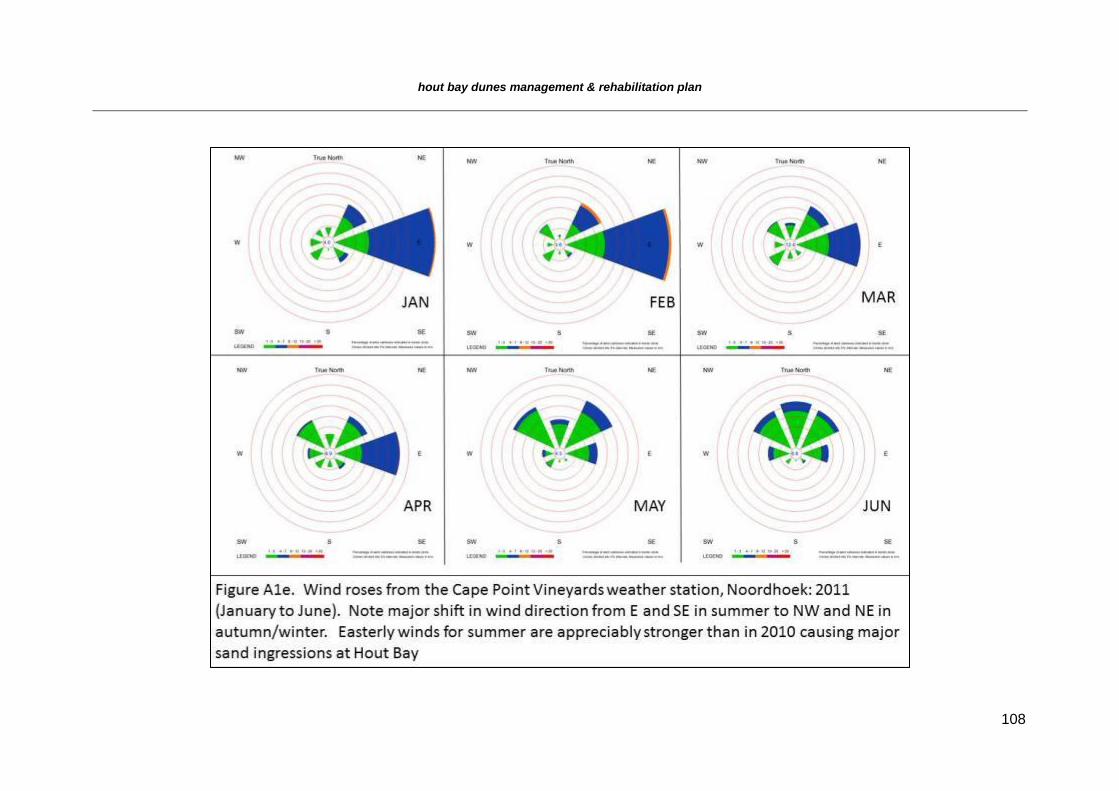
hout bay dunes management & rehabilitation plan
108
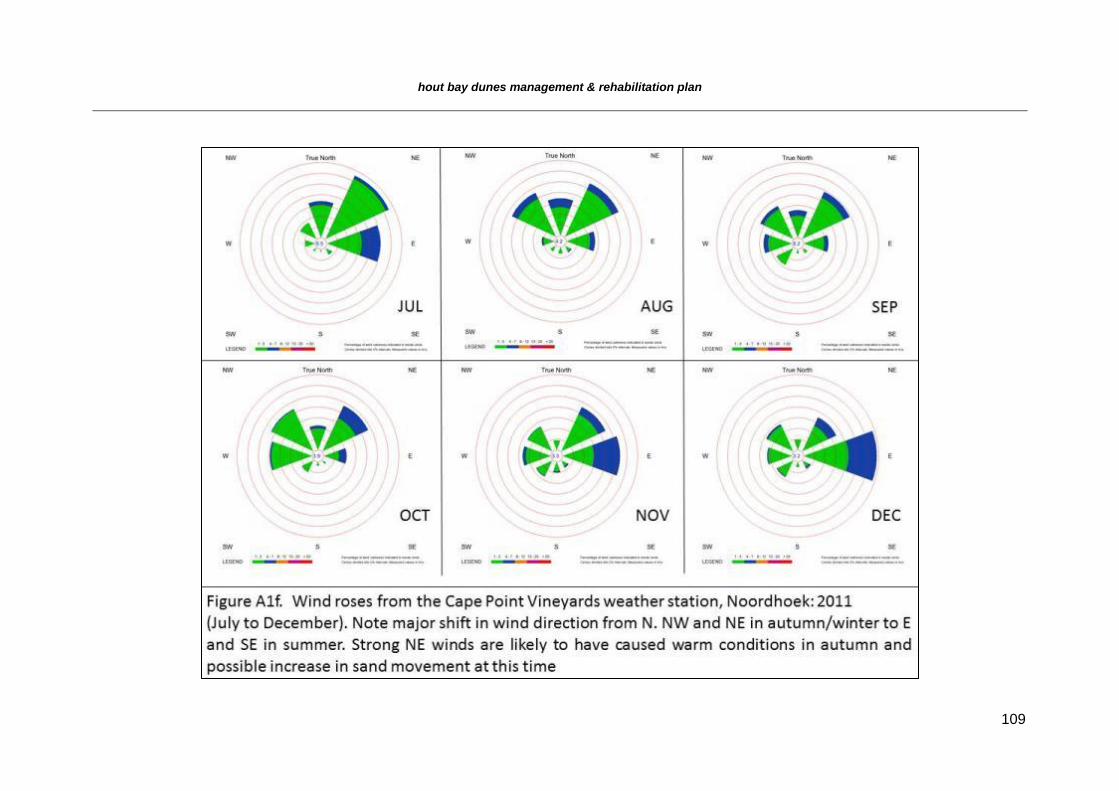
hout bay dunes management & rehabilitation plan
109
hout bay dunes management & rehabilitation plan
110
APPENDIX 2 – DETAILS OF ERVEN OWNERSHIP AND LANDUSE
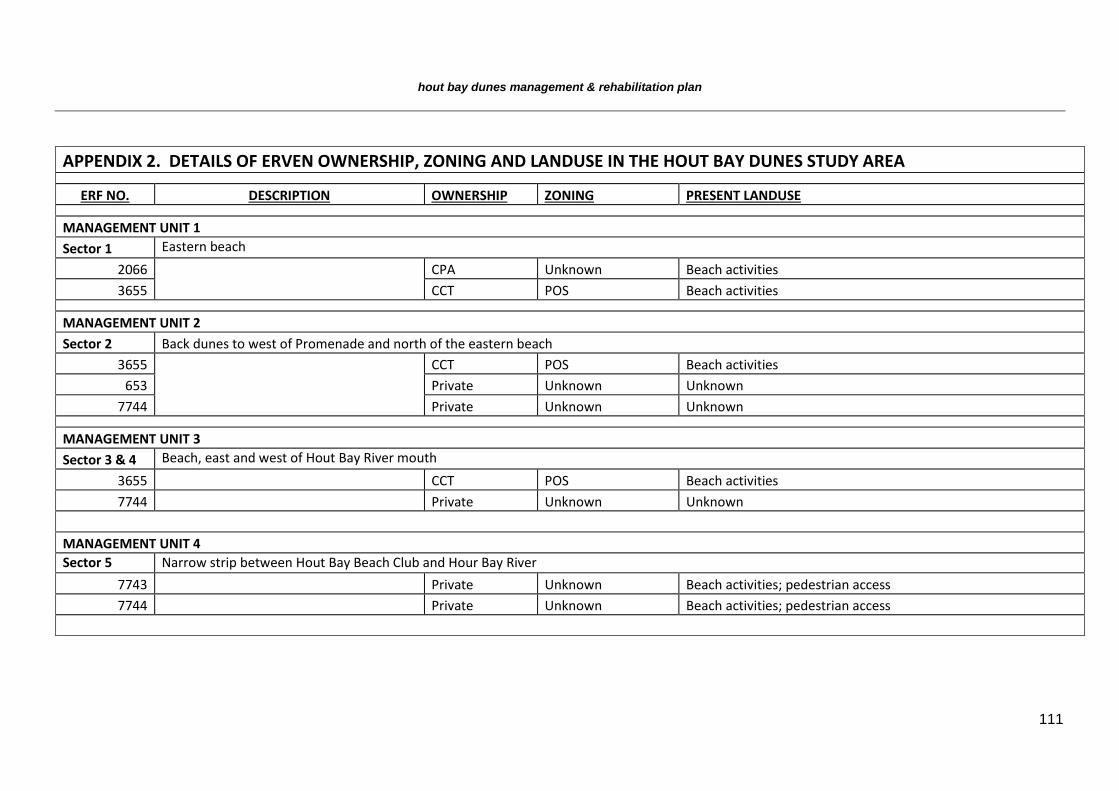
hout bay dunes management & rehabilitation plan
111
APPENDIX 2. DETAILS OF ERVEN OWNERSHIP, ZONING AND LANDUSE IN THE HOUT BAY DUNES STUDY AREA
ERF NO. DESCRIPTION OWNERSHIP ZONING PRESENT LANDUSE
MANAGEMENT UNIT 1
Sector 1 Eastern beach
2066 CPA Unknown Beach activities
3655 CCT POS Beach activities
MANAGEMENT UNIT 2
Sector 2 Back dunes to west of Promenade and north of the eastern beach
3655 CCT POS Beach activities
653 Private Unknown Unknown
7744 Private Unknown Unknown
MANAGEMENT UNIT 3
Sector 3 & 4 Beach, east and west of Hout Bay River mouth
3655 CCT POS Beach activities
7744
Private Unknown Unknown
MANAGEMENT UNIT 4
Sector 5 Narrow strip between Hout Bay Beach Club and Hour Bay River
7743
Private Unknown Beach activities; pedestrian access
7744
Private Unknown Beach activities; pedestrian access
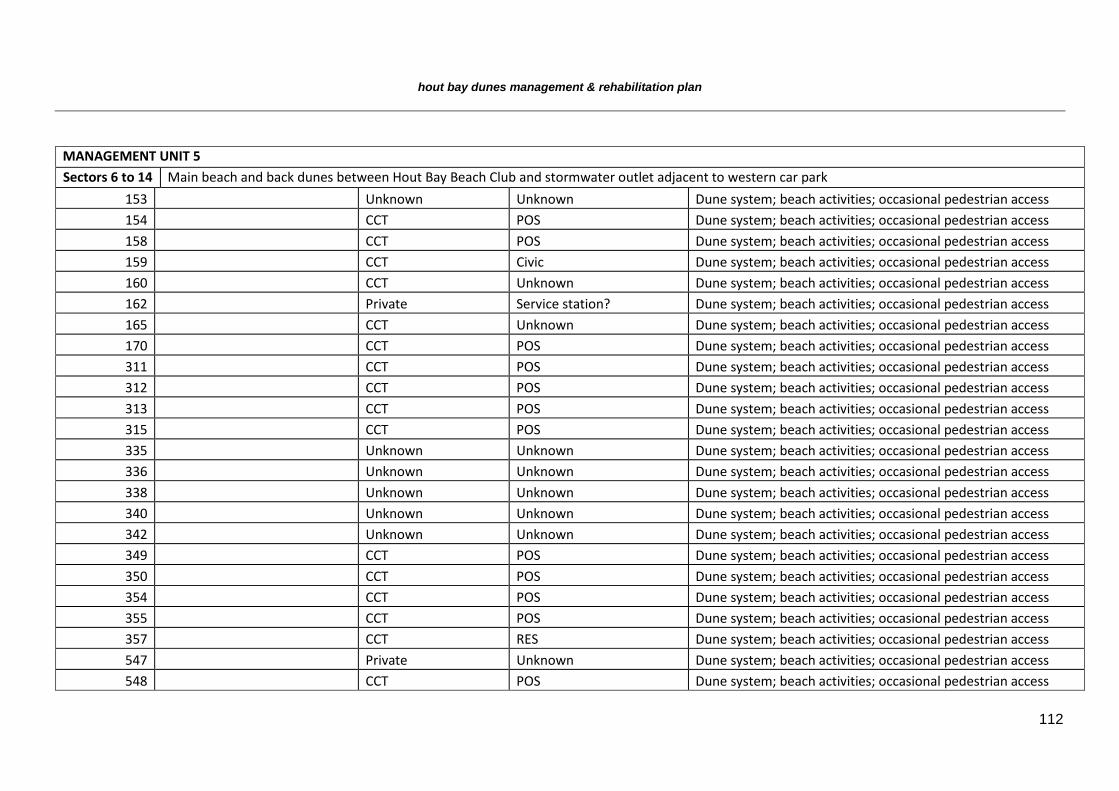
hout bay dunes management & rehabilitation plan
112
MANAGEMENT UNIT 5
Sectors 6 to 14 Main beach and back dunes between Hout Bay Beach Club and stormwater outlet adjacent to western car park
153
Unknown Unknown Dune system; beach activities; occasional pedestrian access
154
CCT POS Dune system; beach activities; occasional pedestrian access
158
CCT POS Dune system; beach activities; occasional pedestrian access
159
CCT Civic Dune system; beach activities; occasional pedestrian access
160
CCT Unknown Dune system; beach activities; occasional pedestrian access
162
Private Service station? Dune system; beach activities; occasional pedestrian access
165
CCT Unknown Dune system; beach activities; occasional pedestrian access
170
CCT POS Dune system; beach activities; occasional pedestrian access
311
CCT POS Dune system; beach activities; occasional pedestrian access
312
CCT POS Dune system; beach activities; occasional pedestrian access
313
CCT POS Dune system; beach activities; occasional pedestrian access
315
CCT POS Dune system; beach activities; occasional pedestrian access
335
Unknown Unknown Dune system; beach activities; occasional pedestrian access
336
Unknown Unknown Dune system; beach activities; occasional pedestrian access
338
Unknown Unknown Dune system; beach activities; occasional pedestrian access
340
Unknown Unknown Dune system; beach activities; occasional pedestrian access
342
Unknown Unknown Dune system; beach activities; occasional pedestrian access
349
CCT POS Dune system; beach activities; occasional pedestrian access
350
CCT POS Dune system; beach activities; occasional pedestrian access
354
CCT POS Dune system; beach activities; occasional pedestrian access
355
CCT POS Dune system; beach activities; occasional pedestrian access
357
CCT RES Dune system; beach activities; occasional pedestrian access
547
Private Unknown Dune system; beach activities; occasional pedestrian access
548
CCT POS Dune system; beach activities; occasional pedestrian access
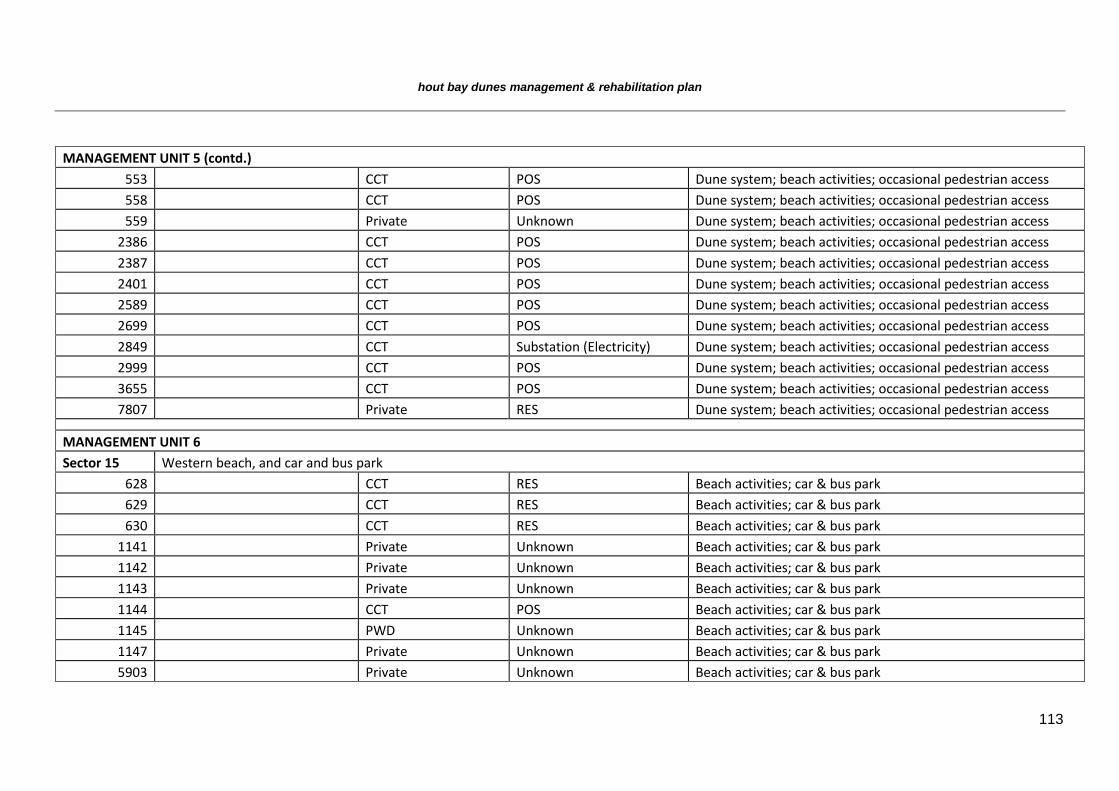
hout bay dunes management & rehabilitation plan
113
MANAGEMENT UNIT 5 (contd.)
553
CCT POS Dune system; beach activities; occasional pedestrian access
558
CCT POS Dune system; beach activities; occasional pedestrian access
559
Private Unknown Dune system; beach activities; occasional pedestrian access
2386
CCT POS Dune system; beach activities; occasional pedestrian access
2387
CCT POS Dune system; beach activities; occasional pedestrian access
2401
CCT POS Dune system; beach activities; occasional pedestrian access
2589
CCT POS Dune system; beach activities; occasional pedestrian access
2699
CCT POS Dune system; beach activities; occasional pedestrian access
2849
CCT Substation (Electricity) Dune system; beach activities; occasional pedestrian access
2999
CCT POS Dune system; beach activities; occasional pedestrian access
3655
CCT POS Dune system; beach activities; occasional pedestrian access
7807
Private RES Dune system; beach activities; occasional pedestrian access
MANAGEMENT UNIT 6
Sector 15 Western beach, and car and bus park
628
CCT RES Beach activities; car & bus park
629
CCT RES Beach activities; car & bus park
630
CCT RES Beach activities; car & bus park
1141
Private Unknown Beach activities; car & bus park
1142
Private Unknown Beach activities; car & bus park
1143
Private Unknown Beach activities; car & bus park
1144
CCT POS Beach activities; car & bus park
1145
PWD Unknown Beach activities; car & bus park
1147
Private Unknown Beach activities; car & bus park
5903
Private Unknown Beach activities; car & bus park
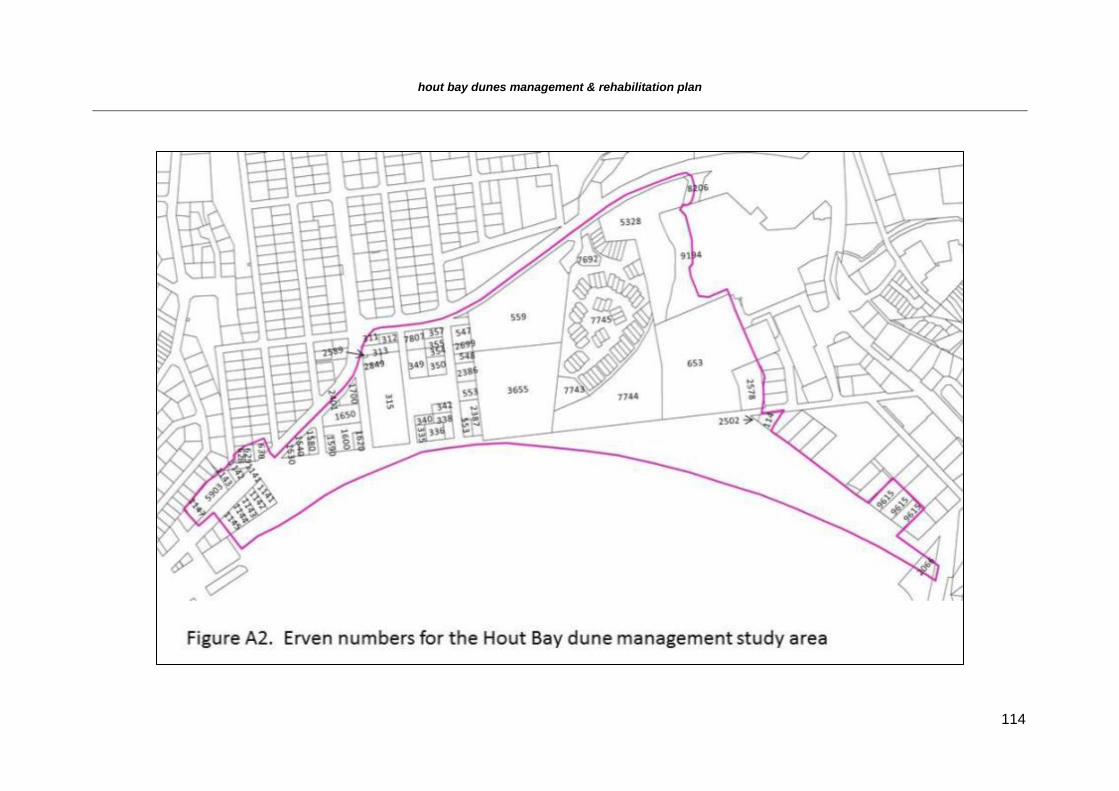
hout bay dunes management & rehabilitation plan
114
hout bay dunes management & rehabilitation plan
115
APPENDIX 3. IMAGES OF THE HOUT BAY DUNES STUDY AREA
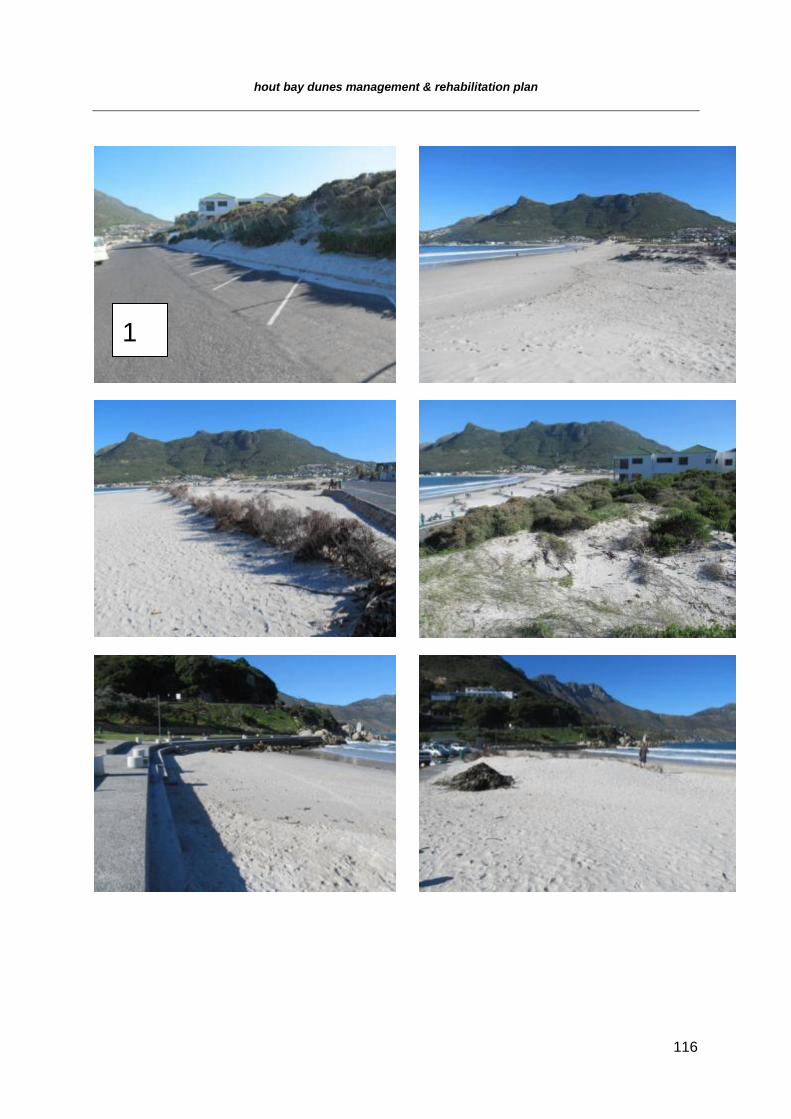
hout bay dunes management & rehabilitation plan
116
1
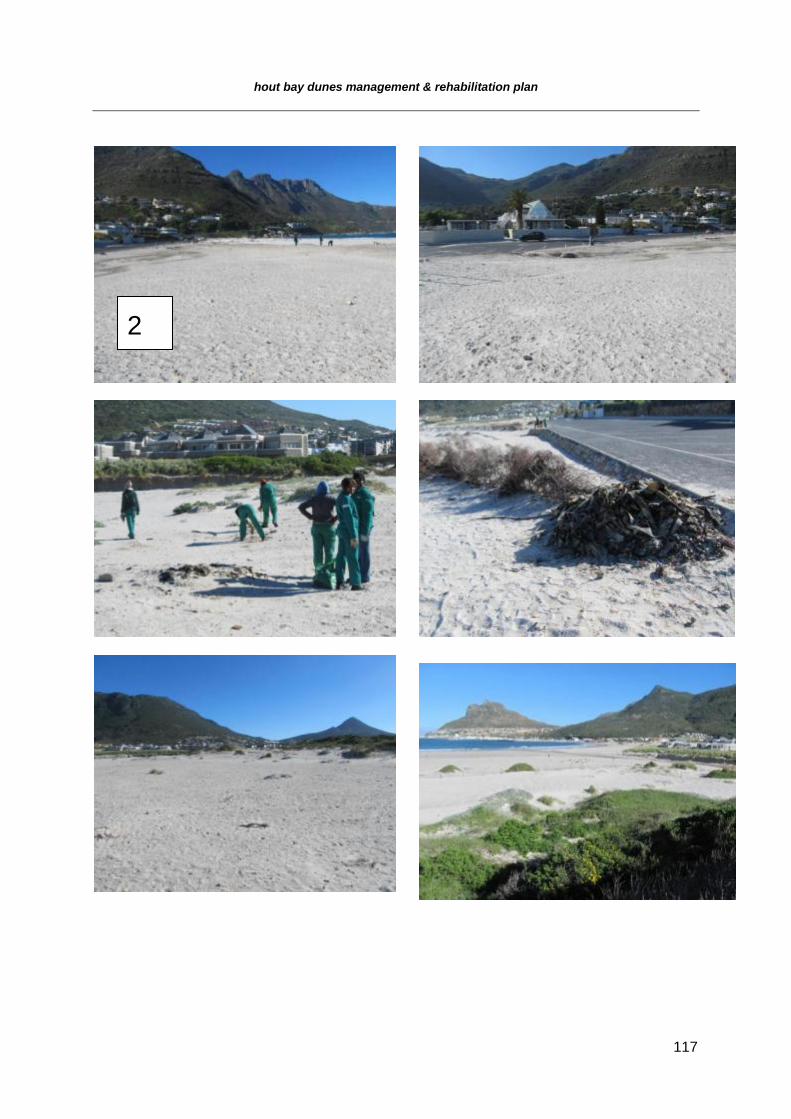
hout bay dunes management & rehabilitation plan
117
2
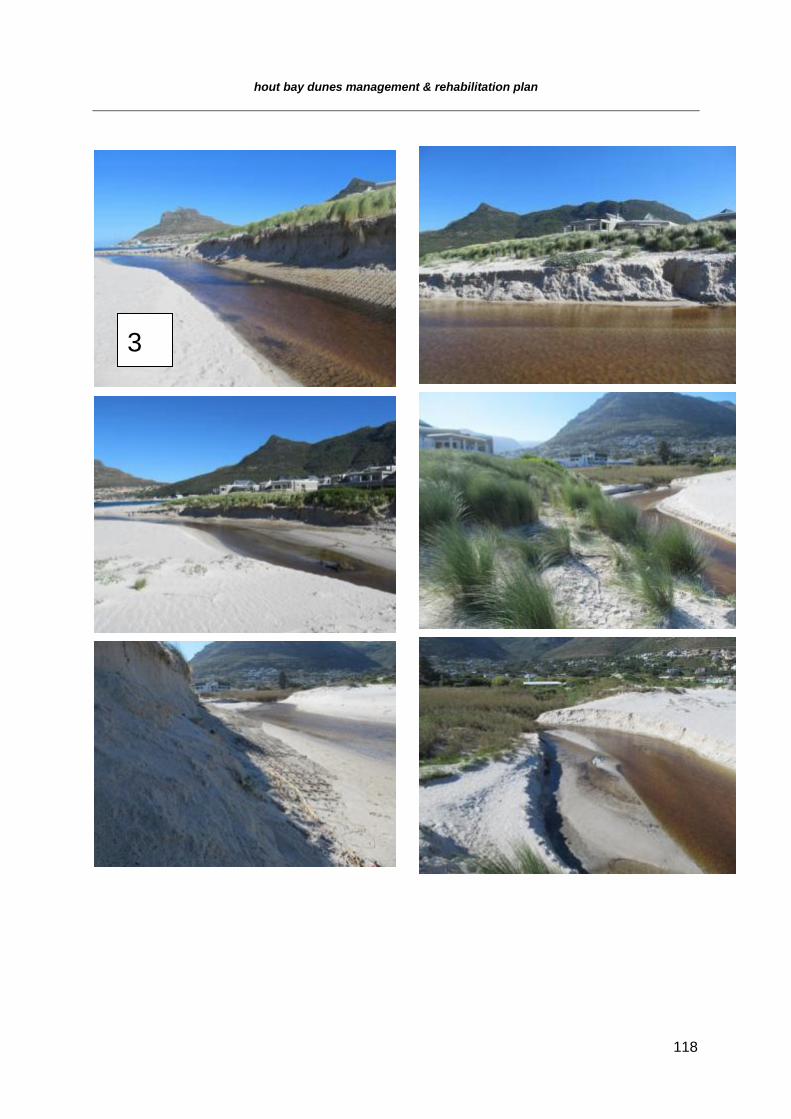
hout bay dunes management & rehabilitation plan
118
3
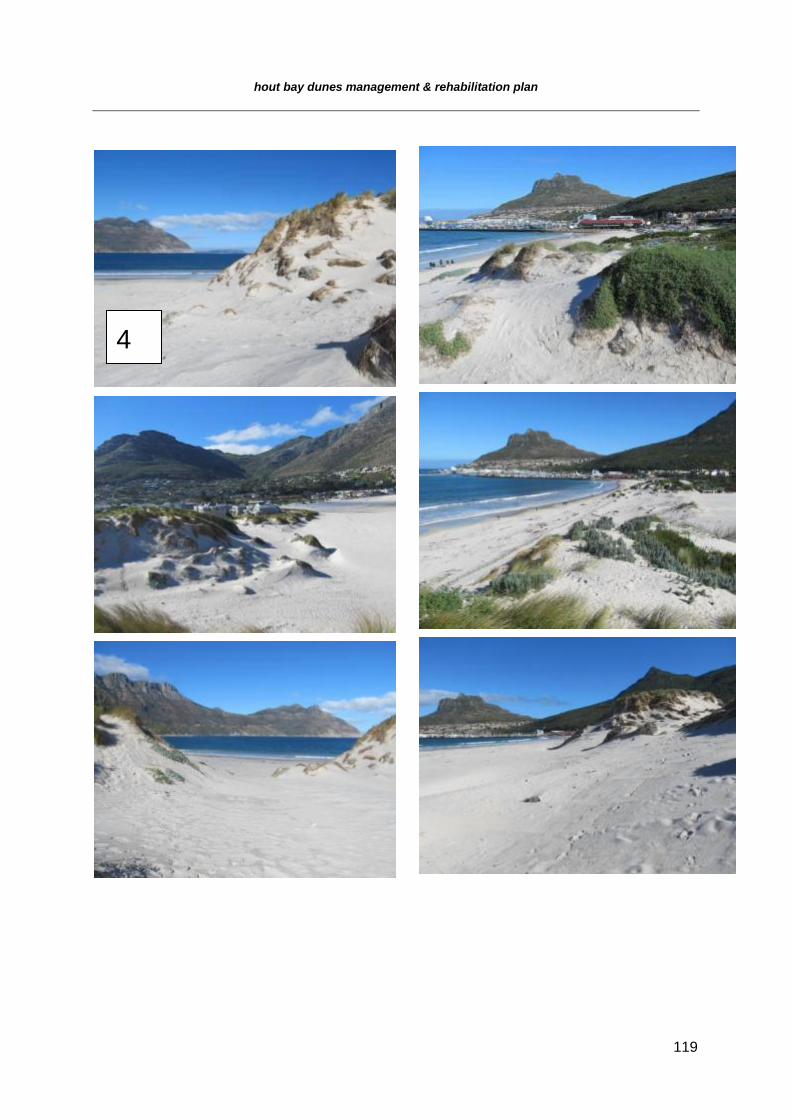
hout bay dunes management & rehabilitation plan
119
4
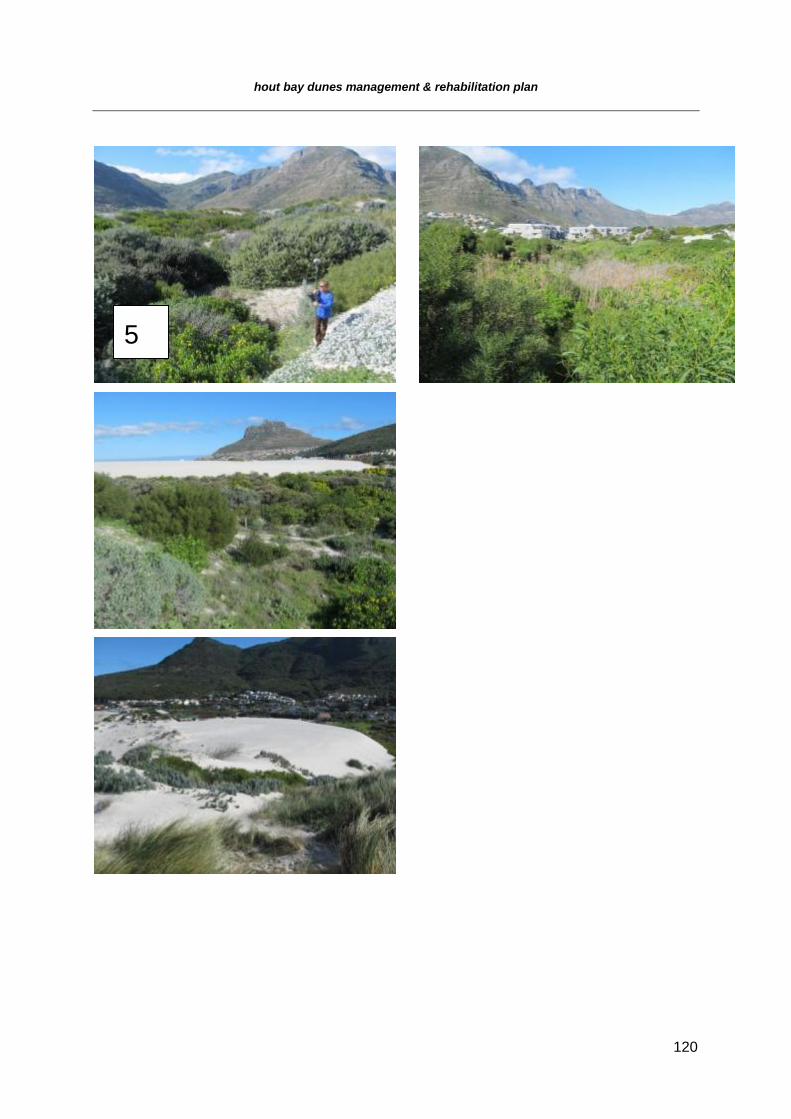
hout bay dunes management & rehabilitation plan
120
5
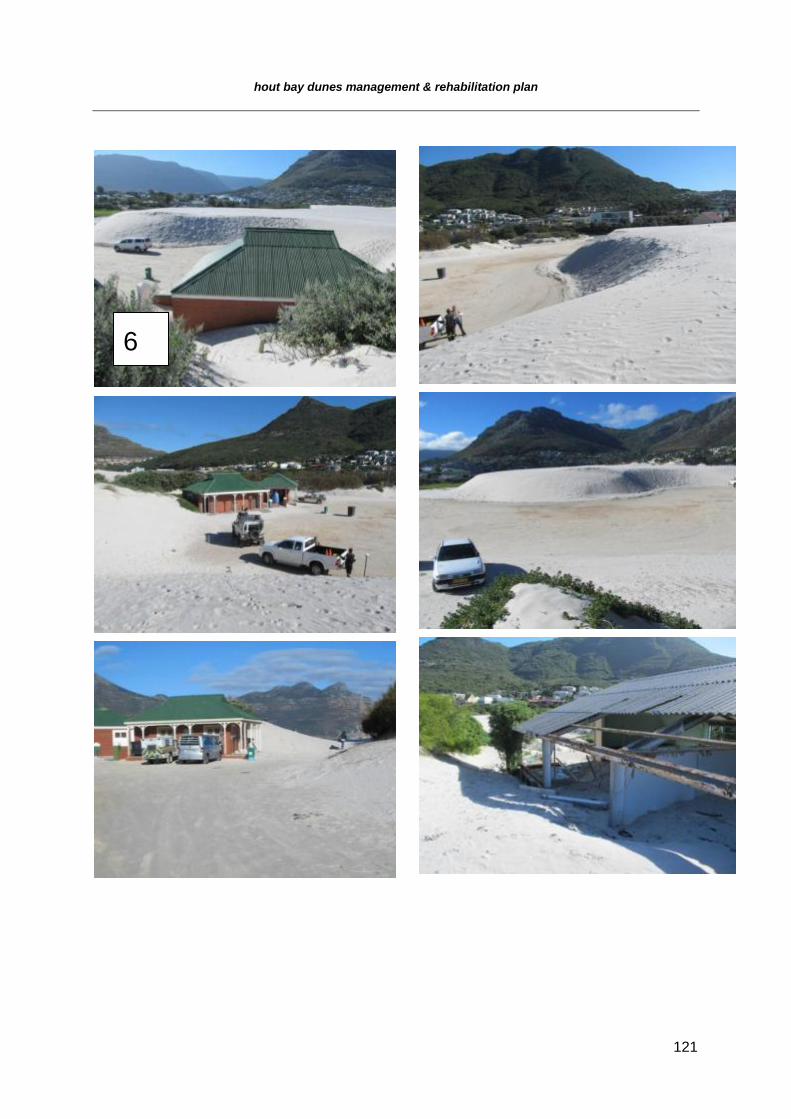
hout bay dunes management & rehabilitation plan
121
6
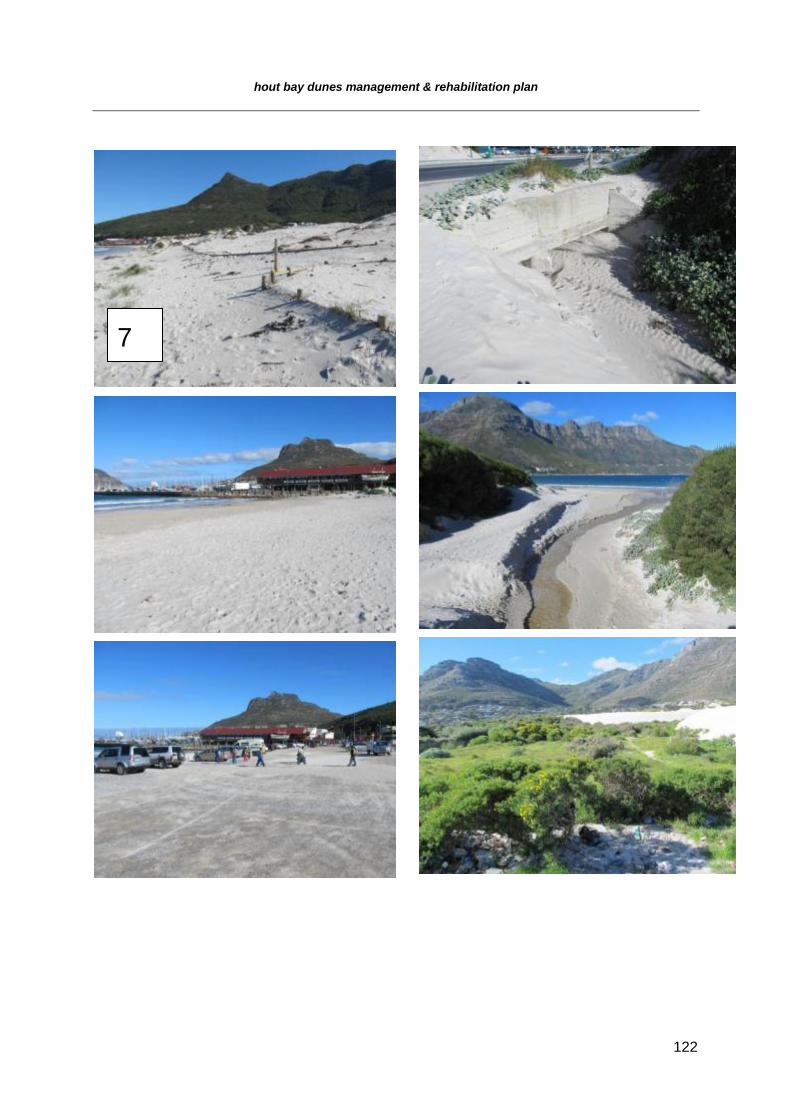
hout bay dunes management & rehabilitation plan
122
7
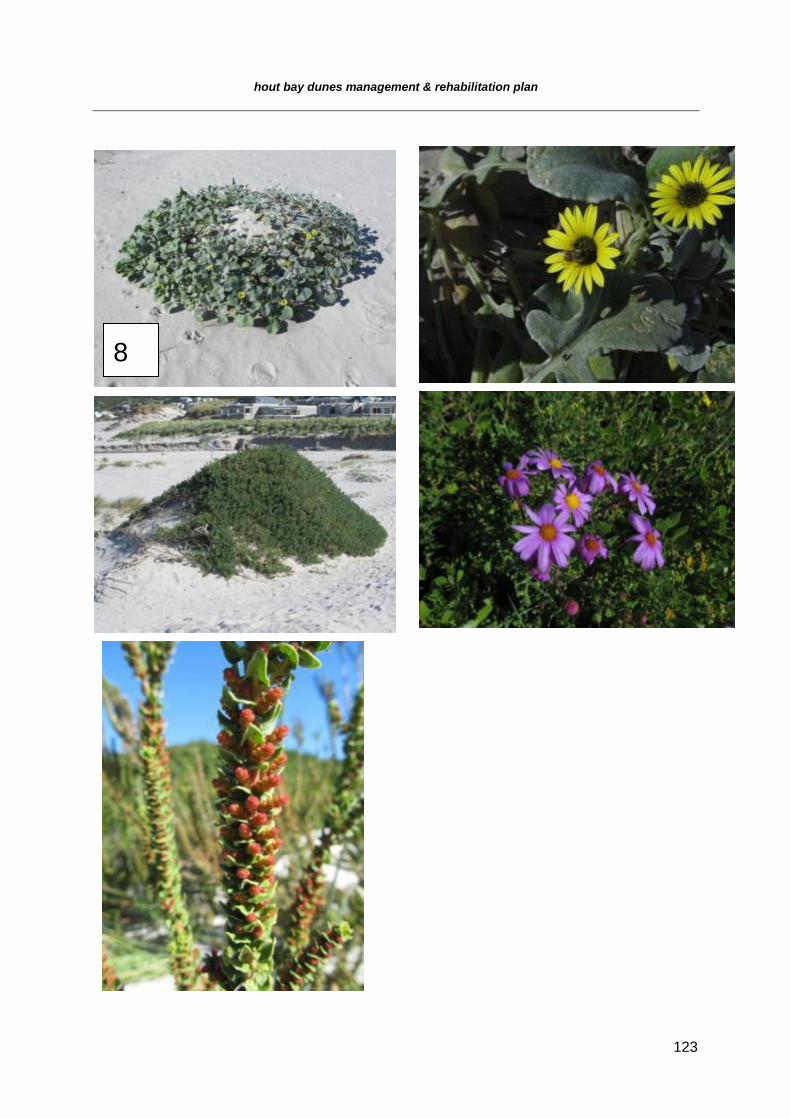
hout bay dunes management & rehabilitation plan
123
8
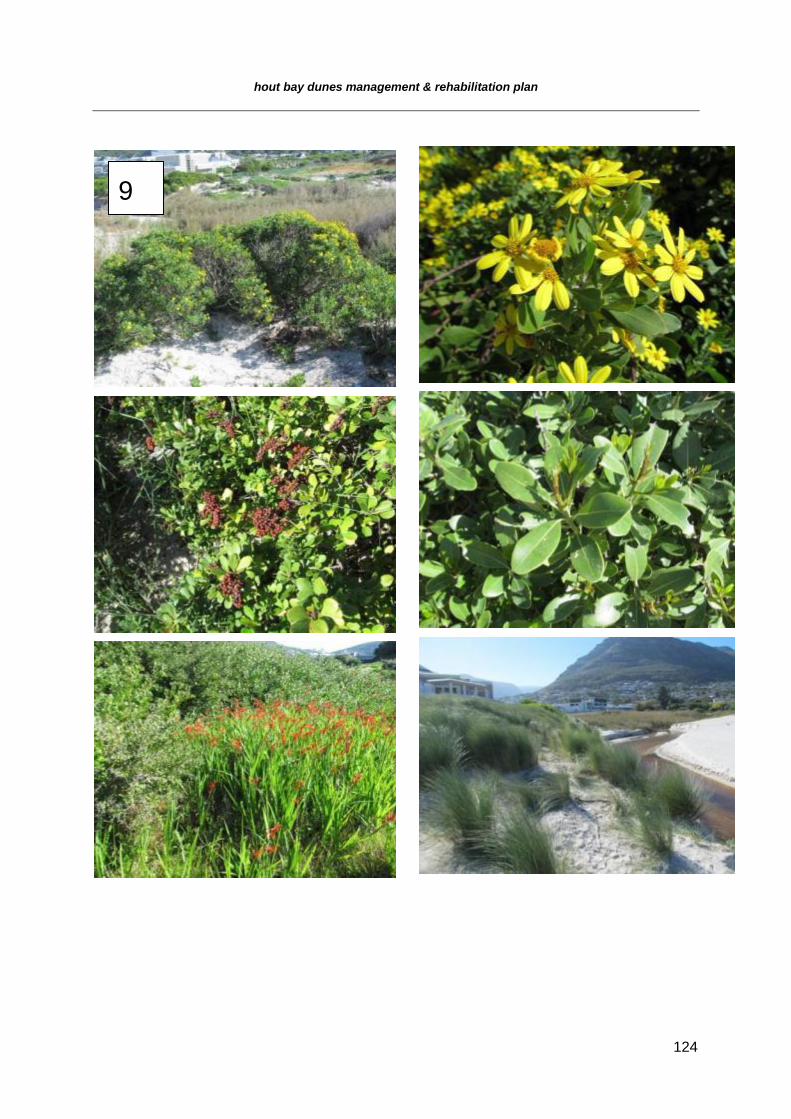
hout bay dunes management & rehabilitation plan
124
9
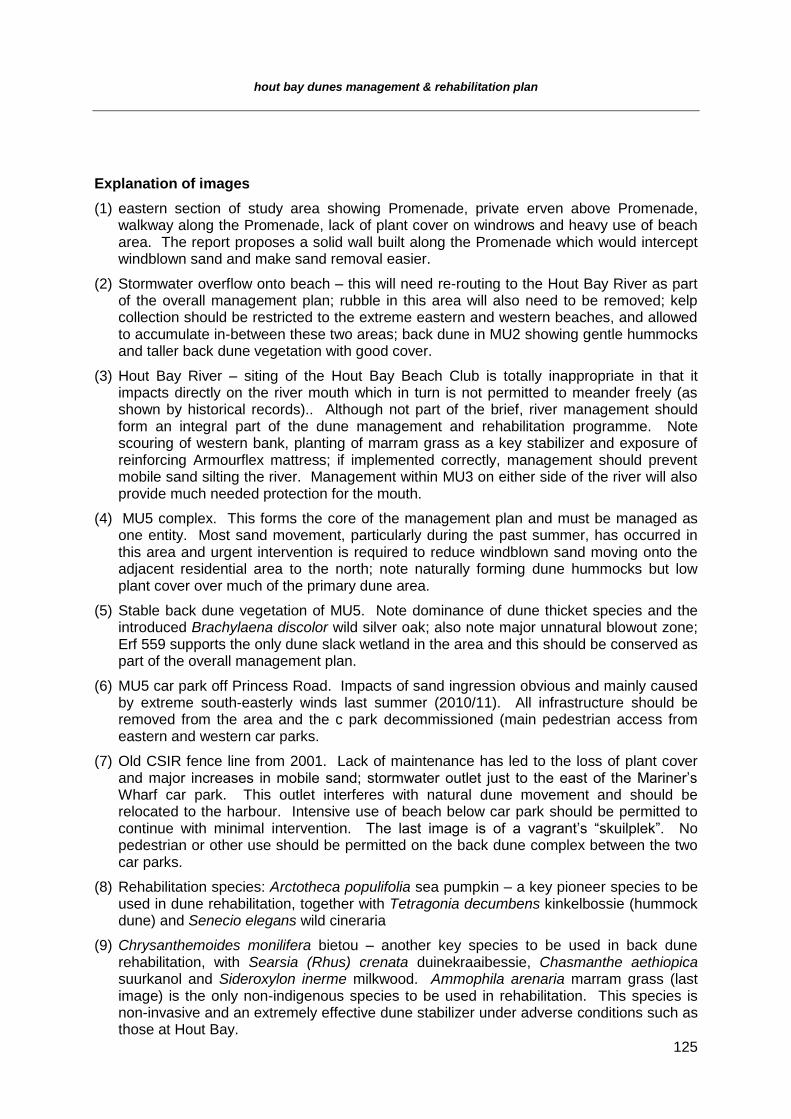
hout bay dunes management & rehabilitation plan
125
Explanation of images
(1) eastern section of study area showing Promenade, private erven above Promenade, walkway along the Promenade, lack of plant cover on windrows and heavy use of beach area. The report proposes a solid wall built along the Promenade which would intercept windblown sand and make sand removal easier.
(2) Stormwater overflow onto beach – this will need re-routing to the Hout Bay River as part of the overall management plan; rubble in this area will also need to be removed; kelp collection should be restricted to the extreme eastern and western beaches, and allowed to accumulate in-between these two areas; back dune in MU2 showing gentle hummocks and taller back dune vegetation with good cover.
(3) Hout Bay River – siting of the Hout Bay Beach Club is totally inappropriate in that it impacts directly on the river mouth which in turn is not permitted to meander freely (as shown by historical records).. Although not part of the brief, river management should form an integral part of the dune management and rehabilitation programme. Note scouring of western bank, planting of marram grass as a key stabilizer and exposure of reinforcing Armourflex mattress; if implemented correctly, management should prevent mobile sand silting the river. Management within MU3 on either side of the river will also provide much needed protection for the mouth.
(4) MU5 complex. This forms the core of the management plan and must be managed as one entity. Most sand movement, particularly during the past summer, has occurred in this area and urgent intervention is required to reduce windblown sand moving onto the adjacent residential area to the north; note naturally forming dune hummocks but low plant cover over much of the primary dune area.
(5) Stable back dune vegetation of MU5. Note dominance of dune thicket species and the introduced Brachylaena discolor wild silver oak; also note major unnatural blowout zone; Erf 559 supports the only dune slack wetland in the area and this should be conserved as part of the overall management plan.
(6) MU5 car park off Princess Road. Impacts of sand ingression obvious and mainly caused by extreme south-easterly winds last summer (2010/11). All infrastructure should be removed from the area and the c park decommissioned (main pedestrian access from eastern and western car parks.
(7) Old CSIR fence line from 2001. Lack of maintenance has led to the loss of plant cover and major increases in mobile sand; stormwater outlet just to the east of the Mariner’s Wharf car park. This outlet interferes with natural dune movement and should be relocated to the harbour. Intensive use of beach below car park should be permitted to continue with minimal intervention. The last image is of a vagrant’s “skuilplek”. No pedestrian or other use should be permitted on the back dune complex between the two car parks.
(8) Rehabilitation species: Arctotheca populifolia sea pumpkin – a key pioneer species to be used in dune rehabilitation, together with Tetragonia decumbens kinkelbossie (hummock dune) and Senecio elegans wild cineraria
(9) Chrysanthemoides monilifera bietou – another key species to be used in back dune rehabilitation, with Searsia (Rhus) crenata duinekraaibessie, Chasmanthe aethiopica suurkanol and Sideroxylon inerme milkwood. Ammophila arenaria marram grass (last image) is the only non-indigenous species to be used in rehabilitation. This species is non-invasive and an extremely effective dune stabilizer under adverse conditions such as those at Hout Bay.

hout bay dunes management & rehabilitation plan
126
APPENDIX 4 – DETAILED MANAGEMENT COSTS This is a separate PDF document, submitted with both Volume 1 & 2 of the report