Embed Size (px)
Citation preview
Management and Monitoring Interfaces for GPU Devices in a Cluster Environment
Sadaf Alam 2014 HPC Advisory Council Meeting, Lugano, Switzerland
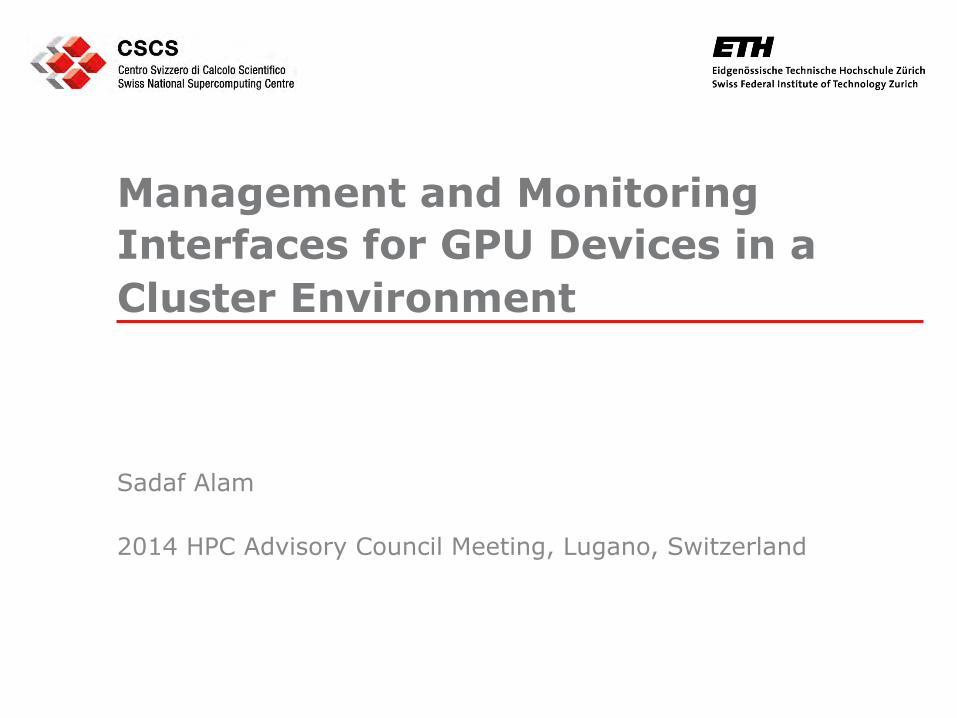
Classification of NVIDIA Tools and Interfaces
GPU Toolchain
Programming tools
cuda-gdb cuda-memcheck nvprof nvvp
Monitoring & diagnostics
tools
NVML nvidia-healthmon
2
Sys Admins Users & Code Developers
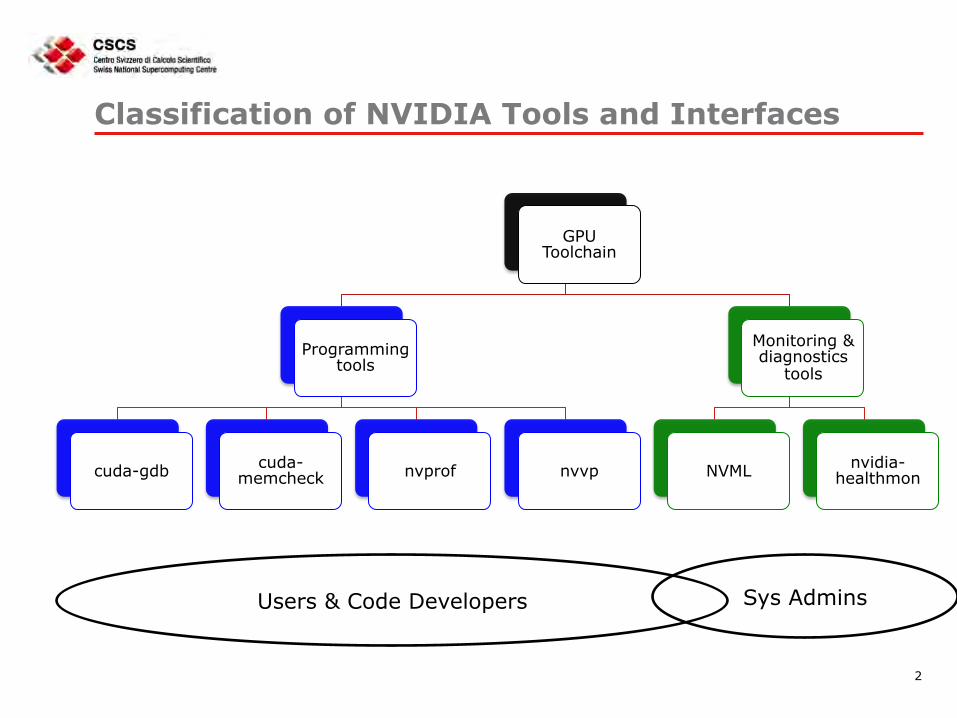
Users and Code Developers Concerns
• Is the code or application buggy?
• Does the code or application have memory issues?
• Why does the code or application run slow?
• Where are bottlenecks in the code or application ?
• What can I do to improve time to solution?
• Is the resource available?
• What is resource’s current configuration?
• How can I request for a change in resource configurations?
3
Code or Application Development Tools
• cuda-gdb – Command line in the Linux environment – Third-party tools, e.g. Allinea DDT
• cuda-memcheck – memcheck: memory access errors and leak detection – racecheck: shared memory data access hazard detection
• nvprof – Overview of CUDA functions and data transfer statistics – Can profile metric & events
• nvvp – Visual profiler – Offline profiling with nvprof traces
4
System Admin and Management Concerns
• Is the resource correctly provisioned?
• How to establish health of the resource?
• What is resource utilization?
• Is the resource occupied / allocated / available?
• What is resource usage and how to account for it?
• How to change resource configuration?
• How can I automatically and periodically monitor status of the resource?
• How to fix & repair the resource for known issues?
5
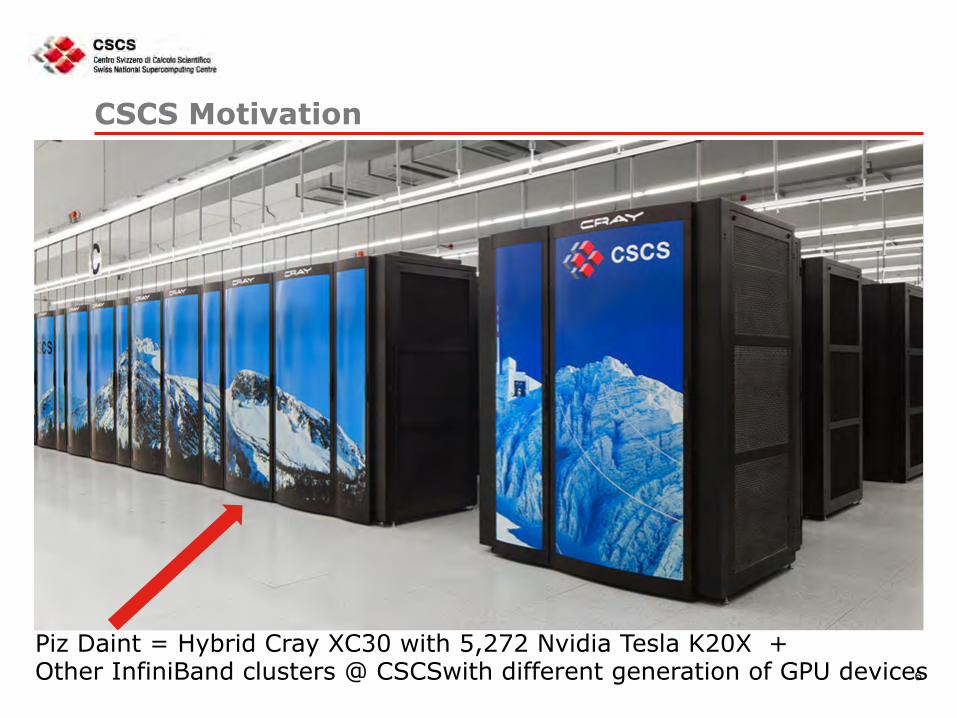
CSCS Motivation
6
Piz Daint = Hybrid Cray XC30 with 5,272 Nvidia Tesla K20X + Other InfiniBand clusters @ CSCSwith different generation of GPU devices
Solution: Tesla Deployment Kit (TDK)
• Nvidia Management Library (NVML)
– User and privileged features – Resource setup and configuration – Resource utilization – Diagnostics and monitoring – …
• nvidia-healthmon
– System provisioning – Operational health checks – …
• For details & download: https://developer.nvidia.com/tesla-deployment-kit
7
NVIDIA Management Library (NVML)
• A C API with a command line interface called nvidia-smi
• Features available thru the API
– Device initialization and cleanup
– Querying options at different levels
– Configuration commands
– Error handling and reporting
• nvidia-smi has privileged and user level options
• Python binding available via pyNVML
8
9
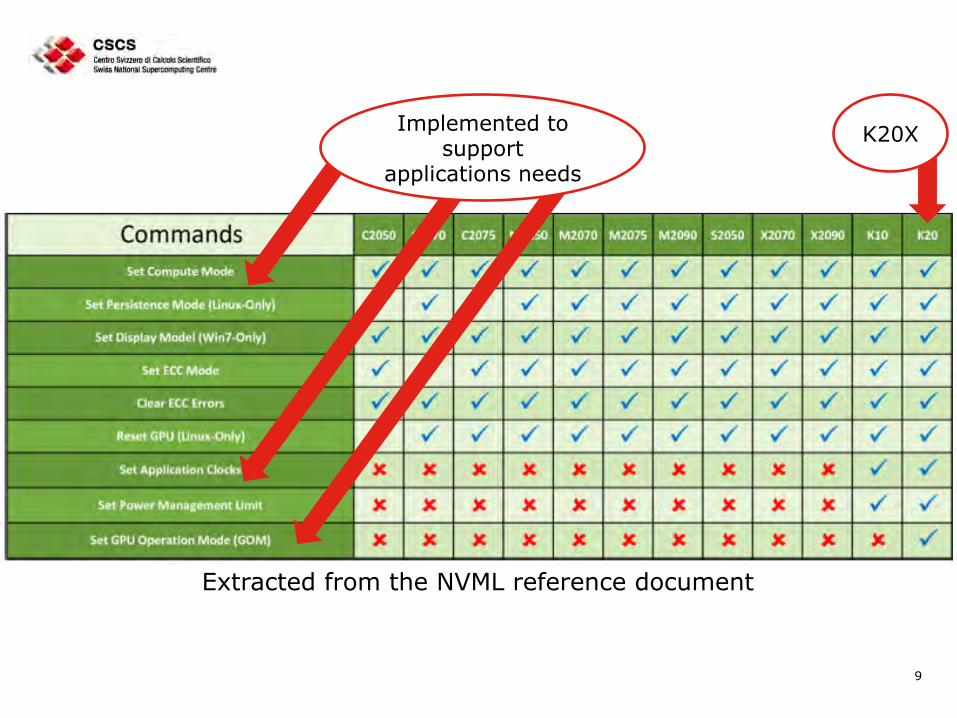
Extracted from the NVML reference document
Implemented to support
applications needs
K20X
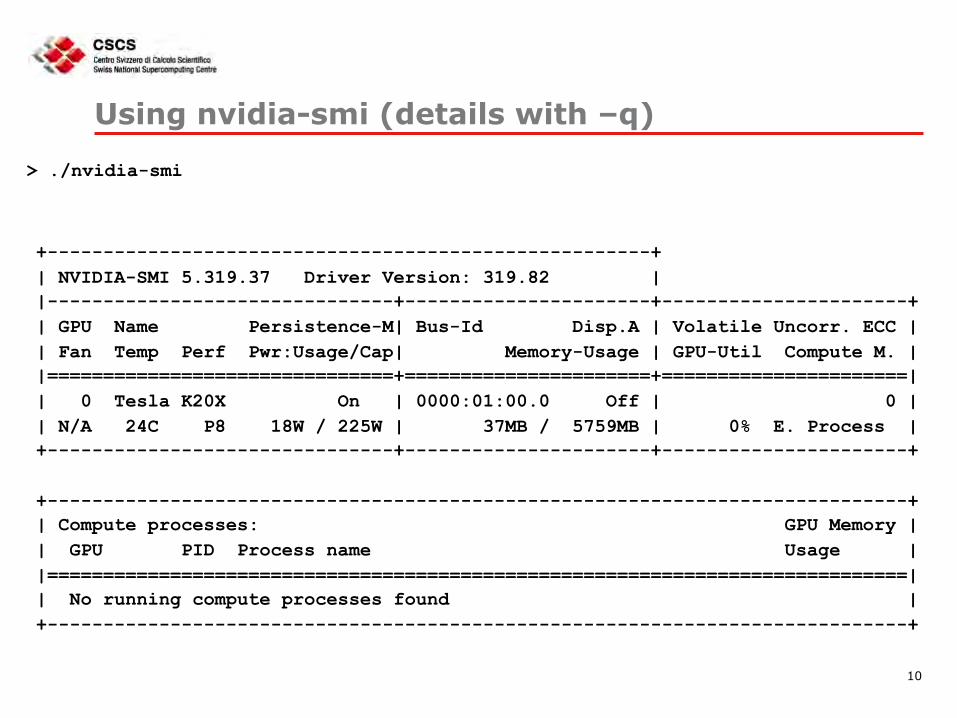
Using nvidia-smi (details with –q)
10
> ./nvidia-smi
+------------------------------------------------------+ | NVIDIA-SMI 5.319.37 Driver Version: 319.82 | |-------------------------------+----------------------+----------------------+ | GPU Name Persistence-M| Bus-Id Disp.A | Volatile Uncorr. ECC | | Fan Temp Perf Pwr:Usage/Cap| Memory-Usage | GPU-Util Compute M. | |===============================+======================+======================| | 0 Tesla K20X On | 0000:01:00.0 Off | 0 | | N/A 24C P8 18W / 225W | 37MB / 5759MB | 0% E. Process | +-------------------------------+----------------------+----------------------+ +-----------------------------------------------------------------------------+ | Compute processes: GPU Memory | | GPU PID Process name Usage | |=============================================================================| | No running compute processes found | +-----------------------------------------------------------------------------+
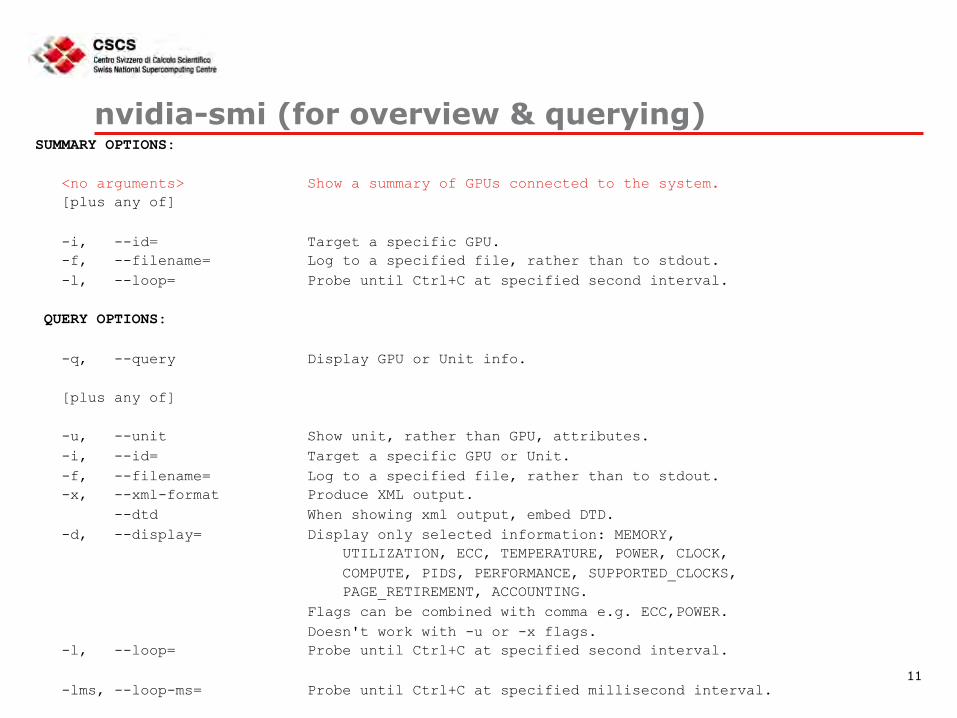
nvidia-smi (for overview & querying) SUMMARY OPTIONS: <no arguments> Show a summary of GPUs connected to the system. [plus any of] -i, --id= Target a specific GPU. -f, --filename= Log to a specified file, rather than to stdout. -l, --loop= Probe until Ctrl+C at specified second interval. QUERY OPTIONS: -q, --query Display GPU or Unit info. [plus any of] -u, --unit Show unit, rather than GPU, attributes. -i, --id= Target a specific GPU or Unit. -f, --filename= Log to a specified file, rather than to stdout. -x, --xml-format Produce XML output. --dtd When showing xml output, embed DTD. -d, --display= Display only selected information: MEMORY, UTILIZATION, ECC, TEMPERATURE, POWER, CLOCK, COMPUTE, PIDS, PERFORMANCE, SUPPORTED_CLOCKS, PAGE_RETIREMENT, ACCOUNTING. Flags can be combined with comma e.g. ECC,POWER. Doesn't work with -u or -x flags. -l, --loop= Probe until Ctrl+C at specified second interval. -lms, --loop-ms= Probe until Ctrl+C at specified millisecond interval.
11
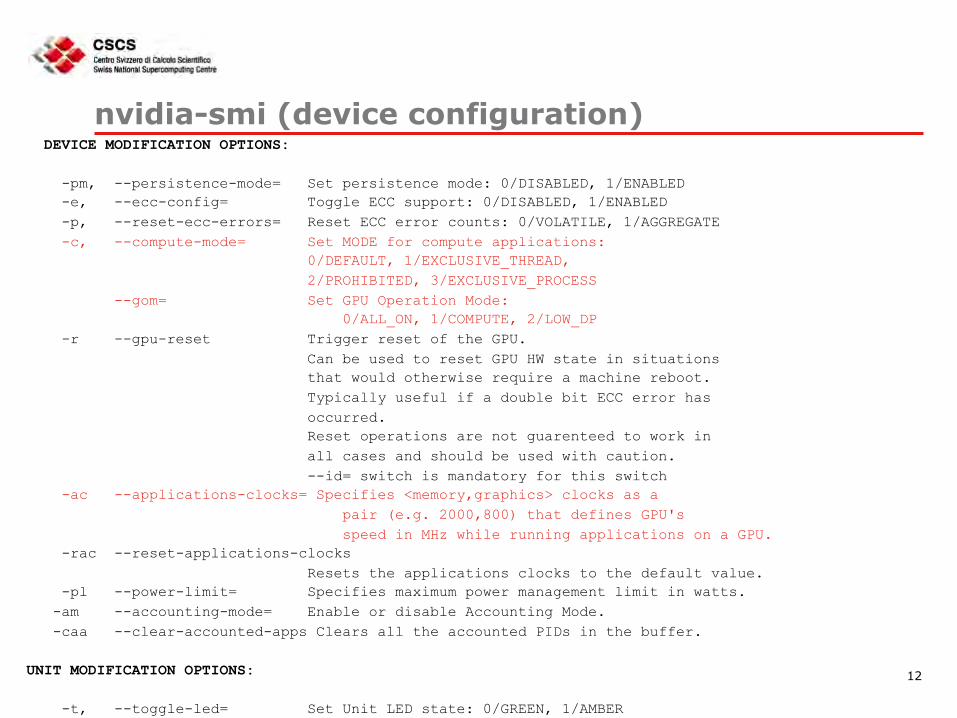
nvidia-smi (device configuration) DEVICE MODIFICATION OPTIONS: -pm, --persistence-mode= Set persistence mode: 0/DISABLED, 1/ENABLED -e, --ecc-config= Toggle ECC support: 0/DISABLED, 1/ENABLED -p, --reset-ecc-errors= Reset ECC error counts: 0/VOLATILE, 1/AGGREGATE -c, --compute-mode= Set MODE for compute applications: 0/DEFAULT, 1/EXCLUSIVE_THREAD, 2/PROHIBITED, 3/EXCLUSIVE_PROCESS --gom= Set GPU Operation Mode: 0/ALL_ON, 1/COMPUTE, 2/LOW_DP -r --gpu-reset Trigger reset of the GPU. Can be used to reset GPU HW state in situations that would otherwise require a machine reboot. Typically useful if a double bit ECC error has occurred. Reset operations are not guarenteed to work in all cases and should be used with caution. --id= switch is mandatory for this switch -ac --applications-clocks= Specifies <memory,graphics> clocks as a pair (e.g. 2000,800) that defines GPU's speed in MHz while running applications on a GPU. -rac --reset-applications-clocks Resets the applications clocks to the default value. -pl --power-limit= Specifies maximum power management limit in watts. -am --accounting-mode= Enable or disable Accounting Mode. -caa --clear-accounted-apps Clears all the accounted PIDs in the buffer. UNIT MODIFICATION OPTIONS: -t, --toggle-led= Set Unit LED state: 0/GREEN, 1/AMBER
12
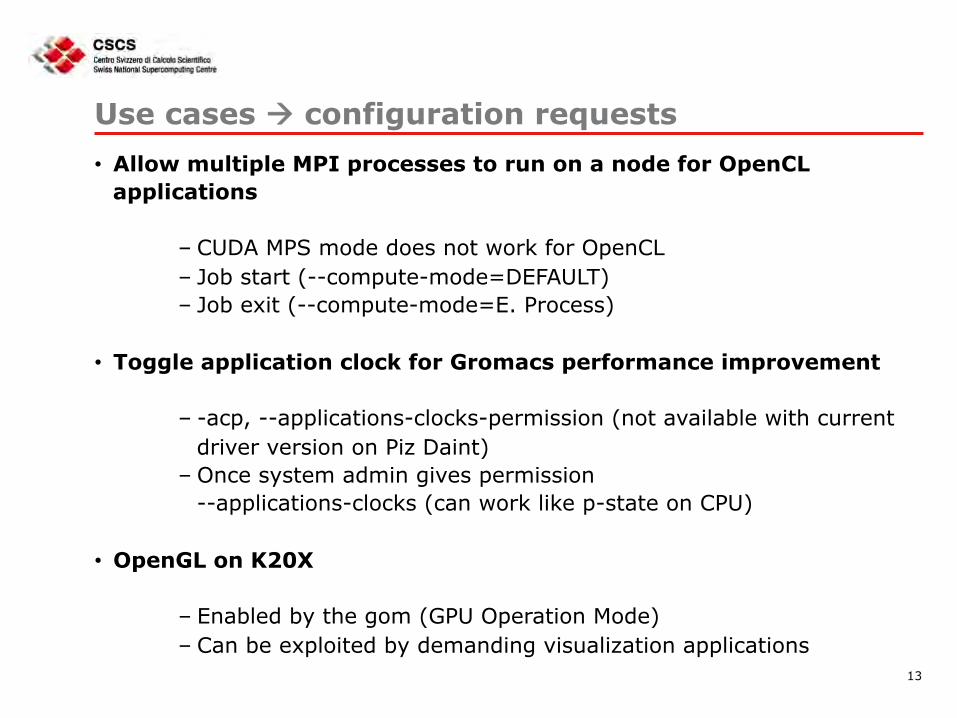
Use cases à configuration requests • Allow multiple MPI processes to run on a node for OpenCL
applications
– CUDA MPS mode does not work for OpenCL – Job start (--compute-mode=DEFAULT) – Job exit (--compute-mode=E. Process)
• Toggle application clock for Gromacs performance improvement
– -acp, --applications-clocks-permission (not available with current driver version on Piz Daint)
– Once system admin gives permission --applications-clocks (can work like p-state on CPU)
• OpenGL on K20X
– Enabled by the gom (GPU Operation Mode) – Can be exploited by demanding visualization applications
13
14
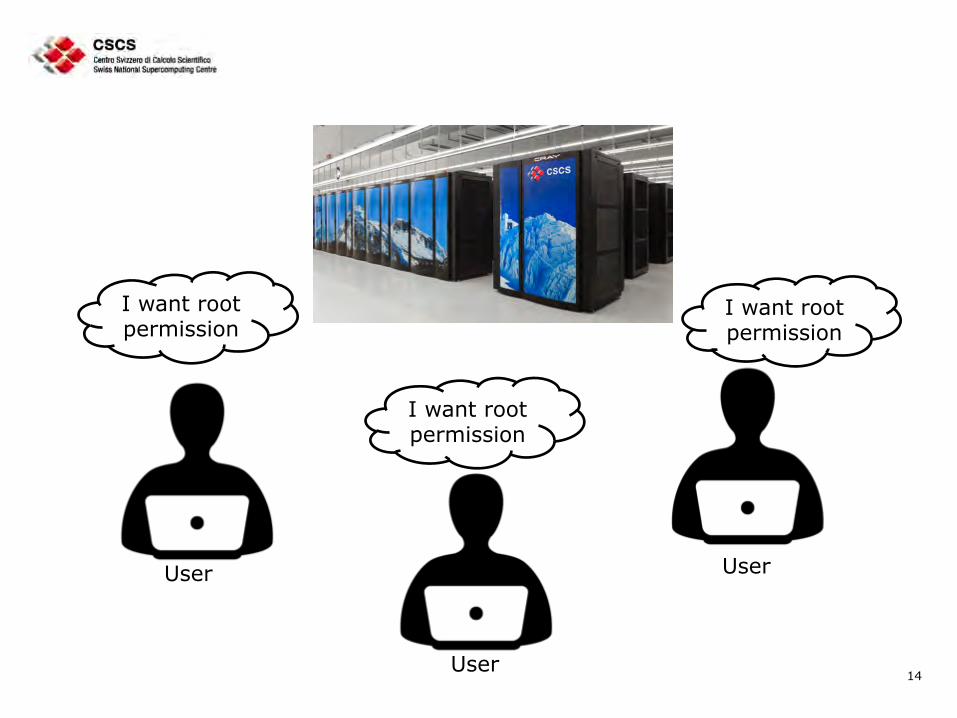
I want root permission
I want root permission
I want root permission
User
User
User
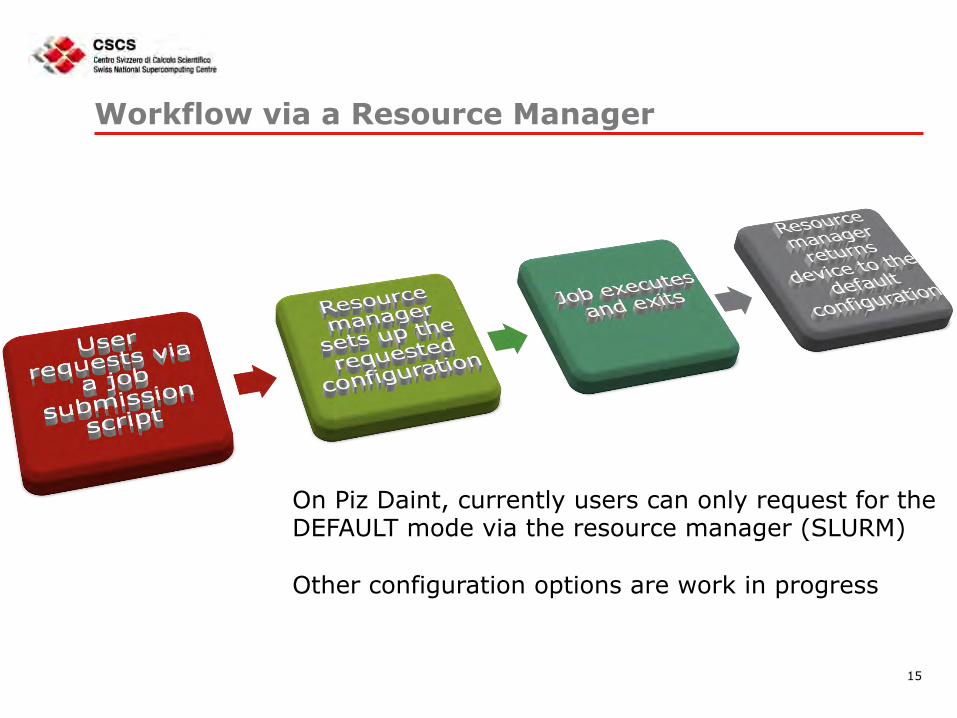
Workflow via a Resource Manager
15
On Piz Daint, currently users can only request for the DEFAULT mode via the resource manager (SLURM) Other configuration options are work in progress
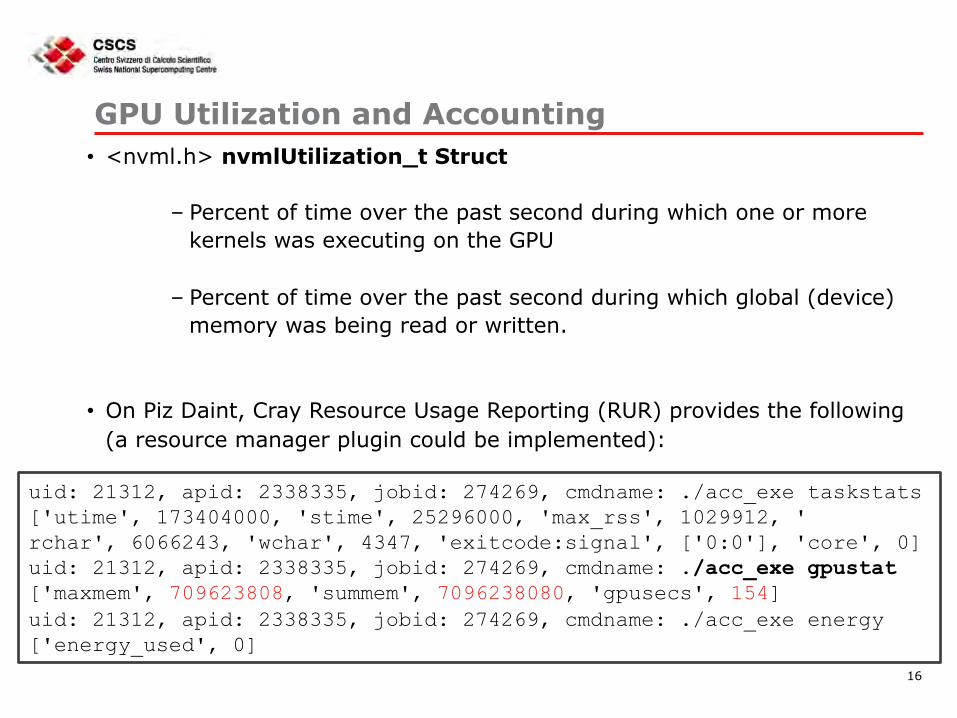
GPU Utilization and Accounting • <nvml.h> nvmlUtilization_t Struct
– Percent of time over the past second during which one or more kernels was executing on the GPU
– Percent of time over the past second during which global (device) memory was being read or written.
• On Piz Daint, Cray Resource Usage Reporting (RUR) provides the following (a resource manager plugin could be implemented):
16
uid: 21312, apid: 2338335, jobid: 274269, cmdname: ./acc_exe taskstats ['utime', 173404000, 'stime', 25296000, 'max_rss', 1029912, ' rchar', 6066243, 'wchar', 4347, 'exitcode:signal', ['0:0'], 'core', 0] uid: 21312, apid: 2338335, jobid: 274269, cmdname: ./acc_exe gpustat ['maxmem', 709623808, 'summem', 7096238080, 'gpusecs', 154] uid: 21312, apid: 2338335, jobid: 274269, cmdname: ./acc_exe energy ['energy_used', 0]
nvidia-healthmon • According to Nvidia, nvidia-healthmon is designed to:
– Discover common problems that affect a GPUs ability to run a
compute job including – (a) Software configuration issues – (b) System configuration issues – (c) System assembly issues, like loose cables – (d) A limited number of hardware issues
– Provide troubleshooting help
– Easily integrate into Cluster Scheduler and Cluster Management applications
– …
• Integrated in Piz Daint Node Health Check (NHC)
– Limited functionality—work in progress 17
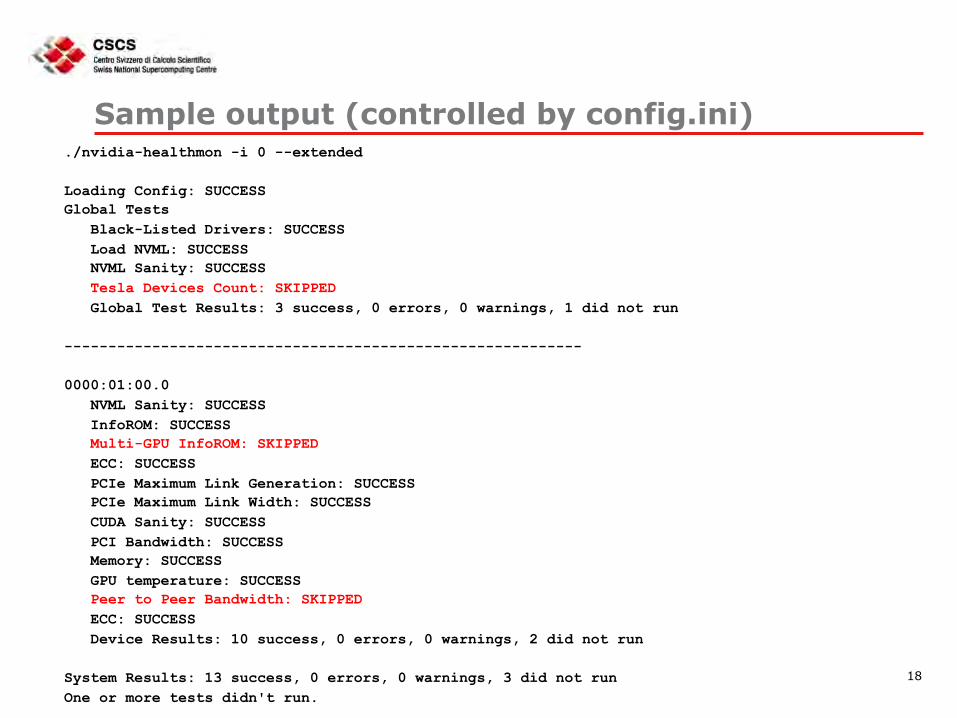
Sample output (controlled by config.ini) ./nvidia-healthmon -i 0 --extended Loading Config: SUCCESS Global Tests Black-Listed Drivers: SUCCESS Load NVML: SUCCESS NVML Sanity: SUCCESS Tesla Devices Count: SKIPPED Global Test Results: 3 success, 0 errors, 0 warnings, 1 did not run ----------------------------------------------------------- 0000:01:00.0 NVML Sanity: SUCCESS InfoROM: SUCCESS Multi-GPU InfoROM: SKIPPED ECC: SUCCESS PCIe Maximum Link Generation: SUCCESS PCIe Maximum Link Width: SUCCESS CUDA Sanity: SUCCESS PCI Bandwidth: SUCCESS Memory: SUCCESS GPU temperature: SUCCESS Peer to Peer Bandwidth: SKIPPED ECC: SUCCESS Device Results: 10 success, 0 errors, 0 warnings, 2 did not run System Results: 13 success, 0 errors, 0 warnings, 3 did not run One or more tests didn't run.
18
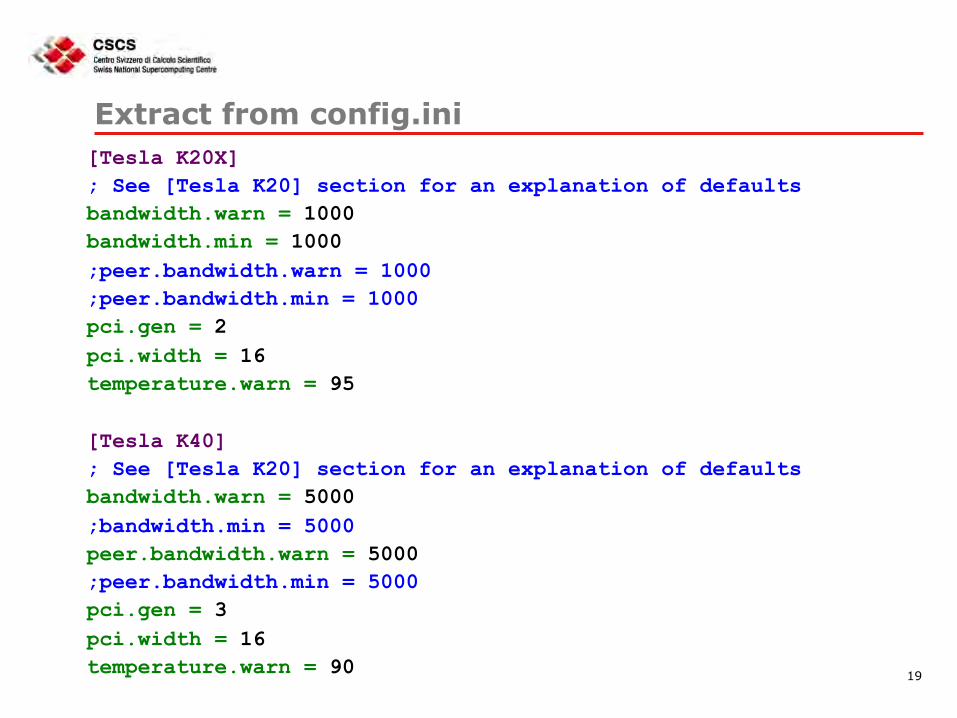
Extract from config.ini [Tesla K20X] ; See [Tesla K20] section for an explanation of defaults bandwidth.warn = 1000 bandwidth.min = 1000 ;peer.bandwidth.warn = 1000 ;peer.bandwidth.min = 1000 pci.gen = 2 pci.width = 16 temperature.warn = 95 [Tesla K40] ; See [Tesla K20] section for an explanation of defaults bandwidth.warn = 5000 ;bandwidth.min = 5000 peer.bandwidth.warn = 5000 ;peer.bandwidth.min = 5000 pci.gen = 3 pci.width = 16 temperature.warn = 90
19
Lessons Learned & Best Practices
• Nvidia device configuration tools are mature
– GPU configurations are possible …
– … enabling via resource managers is non-trivial
• Nvidia cluster management tools are work in progress
– For example, complex faults can go undetected
– A custom, extensible regression suite is manadatory
• HPC use case scenarios are evolving
– Collaboration with system admin and users critical
– Need regular feedback to Nvidia, OEMs and third-party tools and resource management vendors
20

Thank you!
21