Embed Size (px)
Citation preview
Half-Year Financial Report 2018
Taaleri Plc ı Business ID 2234823-5 ı Registered office Helsinki, Finland ı www.taaleri.com 1
TABLE OF CONTENTS
Operating profit on good level; assets under management and guaranty insurance portfo-lio grew
Taaleri Group 1 January–31 June 2018 2
Group Key Figures 2
Review by CEO Juhani Elomaa 3
Operating Environment 4
Financial Result 4
Business Segments
Wealth Management 5
Financing 7
Energy 9
Other Operations 10
Changes in Taaleri’s Management 10
Annual General Meeting 2018 11
Taaleri’s Personnel 12
Shares and Share Capital 13
Capital Adequacy of Taaleri 13
Taaleri’s Risk Management and Risk Position 16
Outlook 17
Key Figures 19
Tables and Notes
Consolidated Income Statement 24
Consolidated Balance Sheet 25
Consolidated Statement of Cash Flows 26
Changes in Group Equity Capital 27
Segment Information 28
Notes to the Half-Year Financial Report January-June 2018
29
Half-Year Financial Report 2018
Taaleri Plc ı Business ID 2234823-5 ı Registered office Helsinki, Finland ı www.taaleri.com 2
Taaleri Plc Half-Year Report January-June 2018
OPERATING PROFIT ON GOOD LEVEL; ASSETS UNDER
MANAGEMENT AND GUARANTY INSURANCE PORTFOLIO GREW
The Group’s income was EUR 35.2 (38.7) million, a decrease of 9.0 per cent. The Group’s continuing earnings grew by 7.1 per cent to EUR 26.9 (25.1) million. The Group’s assets under management grew by 7.5 per cent to EUR 6.0 (5.6) billion. The Group’s performance fees remained at last year’s level at EUR 5.6 (5.7) million.
The Group’s earnings from investment operations were EUR 3.0 (8.1) million. The decrease was due to the development of Garantia’s investment operations.
The Group’s operating profit was EUR 12.4 (15.6) million, due to lower investment income
Earnings per share were EUR 0.32 (0.44).
Wealth Management’s excellent profitability was due to the development of continuing earnings, the ad-
ditional earn-out from a wind power project, and the decreased personnel costs.
In the Financiang-segment, income from Garantia’s insurance operations grew by 9.5 per cent and the
insurance exposure by 7.0 per cent. Balance on the technical account was excellent. Garantia’s invest-
ment income was at zero.
Energy successfully advanced the committed projects in Solar Wind (Aurinkotuuli) fund and a wind
power project in the United States, and in June received the alternative investment fund manager li-
cense.
Income and operating profit from balance sheet investments was burdened by the impairment of the ge-
othermal project in Germany.
Group key figures 1-6/2018 1-6/2017 1-12/2017 Long-term target
Earnings key figures
Income, MEUR 35.2 38.7 81.0
Operating profit, MEUR 12.4 15.6 27.6
Operating profit, % 35.1 40.3 34.1 > 20.0
Profit for the period, MEUR 9.4 12.5 21.8
Return on equity*, % 17.4 26.2 21.8 > 15.0
Balance sheet key figures
Equity ratio, % 48.3 46.7 46.3 > 30.0
Group’s capital adequacy ratio, % 178.1 272.9 251.2 > 150.0
Per share key figures
Earnings/share, EUR 0.32 0.44 0.76
Equity/share, EUR 3.84 3.44 3.73
Share closing price, EUR 10.00 9.20 10.35
Other key figures
Cost/income ratio 65.1 59.9 66.2
Average full-time employees 177 175 175
Market capitalisation MEUR 283.1 260.4 293.0
Assets under management BEUR 6.0 5.3 5.6
* annualised
Half-Year Financial Report 2018
Taaleri Plc ı Business ID 2234823-5 ı Registered office Helsinki, Finland ı www.taaleri.com 3
Income statement items are compared with figures for the corresponding period last year. The balance sheet is compared to the situation at the end of 2017, unless otherwise stated.
Taaleri publishes its Half-Yearl Financial Report as a PDF file attached to a stock exchange release. The half-year financial report is also available at https://www.taaleri.com/en/investor-relations/reports-and-presen-tations.
CEO JUHANI ELOMAA
”The Group’s business developed favourably and was growing. The Group’s continuing earnings grew more
than seven per cent and totalled EUR 26.8 million, assets under management grew also correspondingly
more than seven per cent to EUR 6 billion, and in addition the guaranty insurance portfolio grew more than
seven per cent. January-June 2018 income of EUR 35.2 million and operating profit of EUR 12.4 million were
at a lower level compared to the corresponding period of the previous year, this was mainly due to the sub-
stantial decrease in sales profit and the weak development of stock markets, which had a direct impact on the
earnings of Garantia’s investment portfolio.
Wealth Management’s profitability was excellent and the continuing earnings grew. The improved profitability
was due to the development of continuing earnings, the decreased personnel costs, and also to the additional
earn-out from the wind power project. The main drivers for earnings growth were the higher assets under
management than the previous year, and increased advisory fees. During the financial period Taaleri ar-
ranged, e.g., financing for Turun Toripark, and acted as financial adviser to Keilaniemen kiinteistökehitys Oy
(real-estate development) in the issue of a EUR 100 million senior secured bond.
The Financing segment’s earnings grew due to an increase in premiums written and the balance on the tech-
nical account was excellent. Claims incurred remained especially low, but the return on investments at fair
value was -0.1 per cent.
The Energy segment took significant growth steps during the first part of the year: the Solar Wind fund’s wind
power and solar energy projects were successfully developed forward and Taaleri Energia purchased project
rights for a 227 MW wind power project. Taaleri Energy’s aim is to significantly grow the size of private equity
funds to be established by expanding the sales and marketing functions to large Finnish and international pro-
fessional investors. The premise is to establish new renewable energy private equity funds outside Finland.
In Other operations, i.e. balance sheet investments we are constantly pursuing new opportunities, and during
the first part of the year we increased our holding in, e.g., Fellow Finance, we invested in Turun Toripark and
in real estate projects in Barrie in Canada and in Finland.
Climate change, digitalisation and market developments are constantly impacting our environment and there-
fore also customer behaviours. Our aim is to improve the company’s profitability and growth by growing con-
tinuing earnings and increasing automation. The robo-advisor asset manager Evervest that was acquired in
summer was a step in response to the changes in the sector. Evervest’s functioning digital platform expands
Taaleri’s wealth management service offering for customers and complements the conventional meeting-
based wealth management service model. The product collaboration with the Savings Bank Group also cre-
ates new opportunities. The goal is to launch, together, the first environmentally themed investment solution
still this year.”
Half-Year Financial Report 2018
Taaleri Plc ı Business ID 2234823-5 ı Registered office Helsinki, Finland ı www.taaleri.com 4
REVIEW 1 JANUARY–30 JUNE 2018
OPERATING ENVIRONMENT
During the early part of the year volatility and correction movements increased in the stockmarket, and the po-
litical environment remained unstable globally. Nevertheless, the stockmarket in the United States, and partic-
ularly technology companies did well. The development has been driven by the decrease in corporate taxation
and strong economic growth in the United States, as well as by a structural revolution in which technology
companies are conquering new sectors. Economic activity in the euro area has fallen short of expectations.
Investors have started to increasingly question the continuation of economic growth, for example, in China.
International politics and mainly the trade war discussion as well as the tightening of the monetary policy by
the United States Federal Reserve create uncertainty.
The Finnish economy, on the other hand, has continued its strong and broad-based growth, and employment
has developed well. The economic outlook continues to be quite favourable, although the most intense phase
of growth seems to be behind us.
FINANCIAL RESULT
Income and operating profit
EUR million 1-6/2018 1-6/2017 Change, %
Group income 35.5 38.9 -8.9
Wealth Management 29.7 23.9 24.4
Financing 6.2 11.7 -47.2
Energy 1.1 0.8 40.3
Other operations -1.5 2.6 -157.4
Group operating profit/loss 12.4 15.6 -20.7
Wealth Management 14.1 7.9 79.9
Financing 2.4 7.9 -69.6
Energy -0.9 -0.7 35.6
Other operations -3.3 0.5 -754.4
The Group's share of the result of associated companies is taken into account in the segment-specific income. Segment information is
displayed on page 28.
The Group’s income was EUR 35.2 (38.7) million. The Group’s continuing earnings increased by 7.1 per cent
to EUR 26.9 million (25.1). The Group’s fee and commission income increased by 4.6 per cent to EUR 25.6
(24.5) million, of which the performance fees accounted for EUR 5.6 (5.7) million. The Group’s investment ac-
tivity generated EUR 3.0 (8.1) million during January-June 2018. Net income from insurance operations was
EUR 6.2 (11.7) million, of which guaranty insurance operations grew by 9.5 per cent to EUR 5.8 (5.3) million
and net income from investment operations declined to EUR 0.4 (6.4) million. With IFRS 9, the majority of the
change in the fair value of investments of Garantia’s investment portfolio is visible directly in income, while
previously the realised sales revenue without the change in the fair value was presented in income. Taaleri
Group’s investment operations without Garantia’s investment operations yielded EUR 2.6 (1.7) million, which
includes a loss from a geothermal project in Germany amounting to EUR 2.2 million, the additional earn-out
from the wind project and changes in market values. The return on investments in insurance operations at fair
value was - 0.1 (3.3) per cent.
The Group’s operating profit was EUR 12.4 (15.6) million and represented 35.1 (40.3) per cent of the Group's
income. The Group’s total administrative costs, including personnel costs, decreased by 9.9 per cent and to-
talled EUR 14.2 (15.8) million. Personnel costs decreased by 17.7 per cent to EUR 10.2 (12.4) million due to
the decrease in variable salaries. Other operating costs totalled EUR 3.7 (2.8) million. The increase in costs
was mainly due to costs related to the Helsinki office move, capital gains and project development.
Half-Year Financial Report 2018
Taaleri Plc ı Business ID 2234823-5 ı Registered office Helsinki, Finland ı www.taaleri.com 5
Profit for the financial period amounted to EUR 9.4 (12.5) million. Comprehensive income for the financial pe-
riod was EUR 9.0 (10.6) million.
Taaleri’s balance sheet, investments and financing
The balance sheet total of the Taaleri Group was EUR 226.8 (31 Dec. 2017: 229.3) million. The Group’s in-
vestments were EUR 154.4 (165.8) million, corresponding to 68.1 (72.3) per cent of the Group’s balance
sheet total.
The Group’s interest-bearing liabilities amounted to EUR 62.3 (62.7) million, which consisted of the bond pro-
grammes of Taaleri Plc of EUR 54.8 (54.8) million and liabilities to credit institutions of EUR 7.5 (8.0) million.
Liabilities totalled EUR 117.2 (123.2) million and equity stood at 109.6 (106.1) million.
The equity ratio of Taaleri Group remained strong and was 48.3 (46.3) per cent.
BUSINESS SEGMENTS
Taaleri manages its business through three segments: Wealth Management, Financing, and Energy. Opera-tions that do not belong to the segments are presented in “Other operations”.
WEALTH MANAGEMENT
Taaleri’s Wealth Management segment offers a broad range of wealth management services and investment
products both to private individuals and corporate customers. In addition to allocation solutions and fixed in-
come and equity funds, the offering also includes private equity funds, which invest in, among other things,
forest, property, and various renewable energy projects.
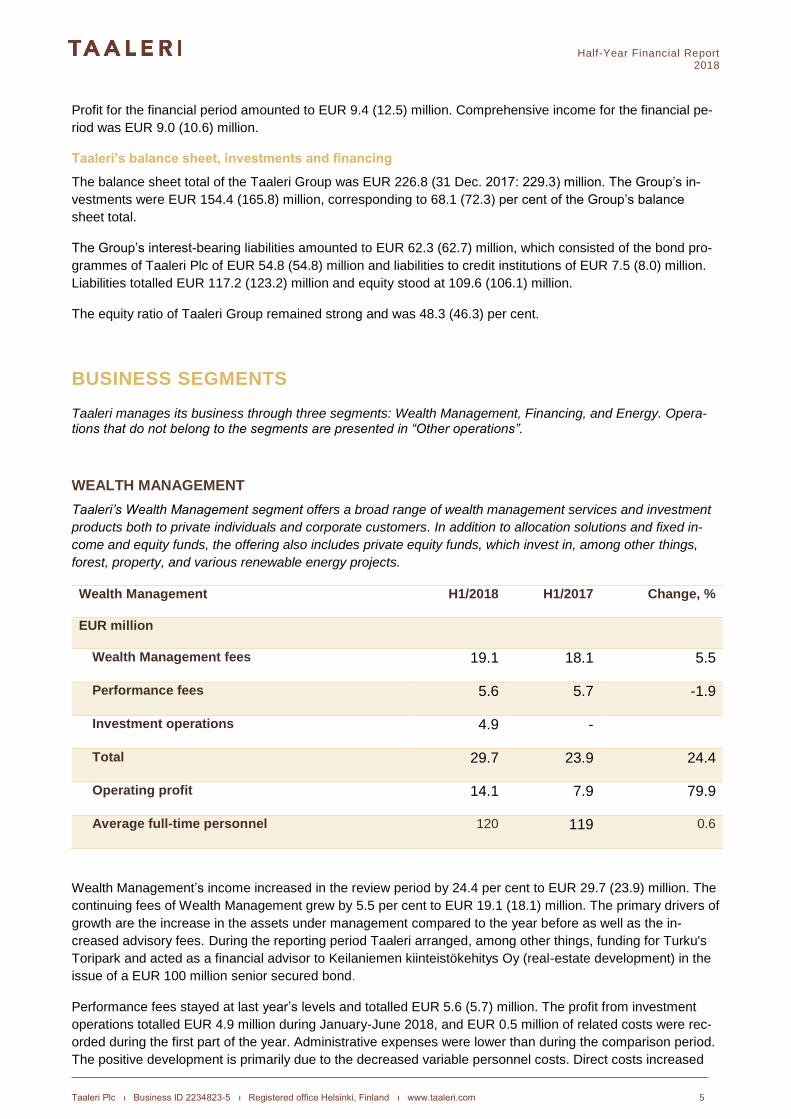
Wealth Management H1/2018 H1/2017 Change, %
EUR million
Wealth Management fees 19.1 18.1 5.5
Performance fees 5.6 5.7 -1.9
Investment operations 4.9 -
Total 29.7 23.9 24.4
Operating profit 14.1 7.9 79.9
Average full-time personnel 120 119 0.6
Wealth Management’s income increased in the review period by 24.4 per cent to EUR 29.7 (23.9) million. The
continuing fees of Wealth Management grew by 5.5 per cent to EUR 19.1 (18.1) million. The primary drivers of
growth are the increase in the assets under management compared to the year before as well as the in-
creased advisory fees. During the reporting period Taaleri arranged, among other things, funding for Turku's
Toripark and acted as a financial advisor to Keilaniemen kiinteistökehitys Oy (real-estate development) in the
issue of a EUR 100 million senior secured bond.
Performance fees stayed at last year’s levels and totalled EUR 5.6 (5.7) million. The profit from investment
operations totalled EUR 4.9 million during January-June 2018, and EUR 0.5 million of related costs were rec-
orded during the first part of the year. Administrative expenses were lower than during the comparison period.
The positive development is primarily due to the decreased variable personnel costs. Direct costs increased
Half-Year Financial Report 2018
Taaleri Plc ı Business ID 2234823-5 ı Registered office Helsinki, Finland ı www.taaleri.com 6
as a result of investment operation-related costs as well as the continuing investments in business growth and
the development of IT systems, and the costs related to the Helsinki office move.
Wealth Management’s operating profit grew by 79.9 per cent to EUR 14.1 (7.9) million.
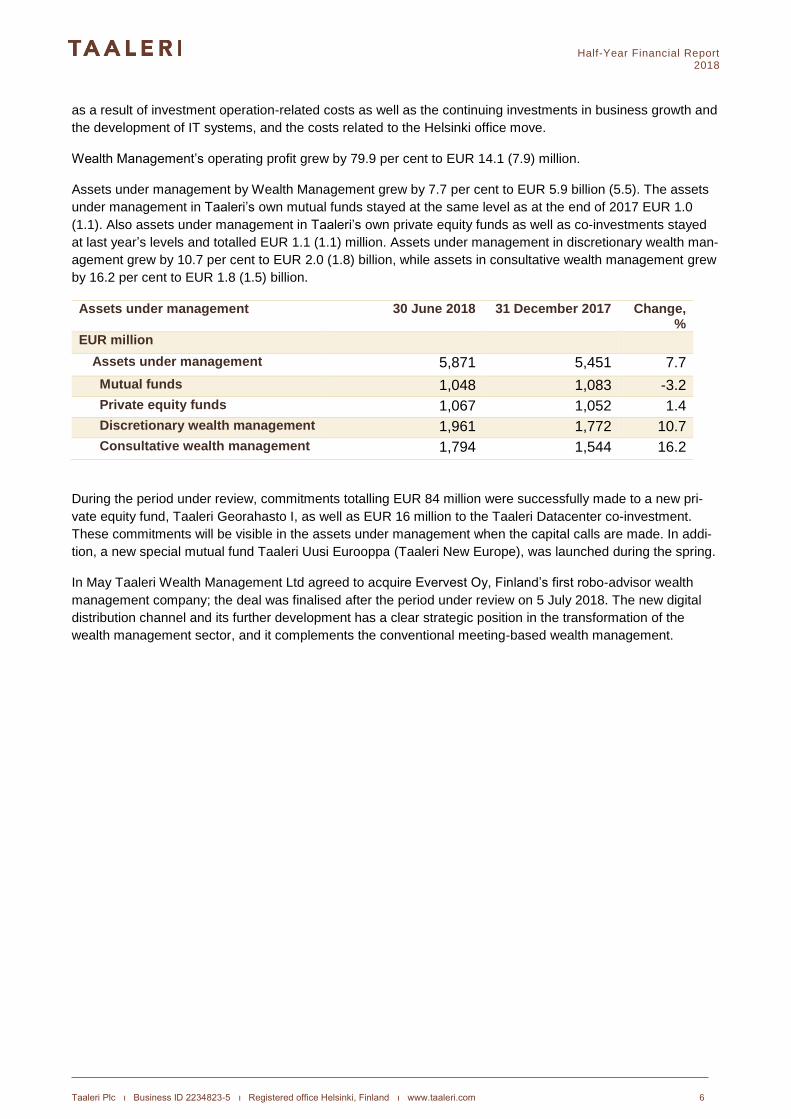
Assets under management by Wealth Management grew by 7.7 per cent to EUR 5.9 billion (5.5). The assets
under management in Taaleri’s own mutual funds stayed at the same level as at the end of 2017 EUR 1.0
(1.1). Also assets under management in Taaleri’s own private equity funds as well as co-investments stayed
at last year’s levels and totalled EUR 1.1 (1.1) million. Assets under management in discretionary wealth man-
agement grew by 10.7 per cent to EUR 2.0 (1.8) billion, while assets in consultative wealth management grew
by 16.2 per cent to EUR 1.8 (1.5) billion.
Assets under management 30 June 2018 31 December 2017 Change, %
EUR million
Assets under management 5,871 5,451 7.7
Mutual funds 1,048 1,083 -3.2
Private equity funds 1,067 1,052 1.4
Discretionary wealth management 1,961 1,772 10.7
Consultative wealth management 1,794 1,544 16.2
During the period under review, commitments totalling EUR 84 million were successfully made to a new pri-
vate equity fund, Taaleri Georahasto I, as well as EUR 16 million to the Taaleri Datacenter co-investment.
These commitments will be visible in the assets under management when the capital calls are made. In addi-
tion, a new special mutual fund Taaleri Uusi Eurooppa (Taaleri New Europe), was launched during the spring.
In May Taaleri Wealth Management Ltd agreed to acquire Evervest Oy, Finland’s first robo-advisor wealth
management company; the deal was finalised after the period under review on 5 July 2018. The new digital
distribution channel and its further development has a clear strategic position in the transformation of the
wealth management sector, and it complements the conventional meeting-based wealth management.
Half-Year Financial Report 2018
Taaleri Plc ı Business ID 2234823-5 ı Registered office Helsinki, Finland ı www.taaleri.com 7
FINANCING
The Financing segment includes Garantia Insurance Company Ltd, an insurance company specialising in
guaranty insurance. Through its solutions, Garantia helps its customers promote their sales, secure their fi-
nancing and improve their capital efficiency. The company’s main products are loan guaranties and commer-
cial bonds offered to Finnish companies as well as residential mortgage guaranties offered through partners.
Garantia is actively involved in various financing arrangements and develops new solutions for its customers’
needs. The company’s business is divided into guaranty insurance operations and investment operations.
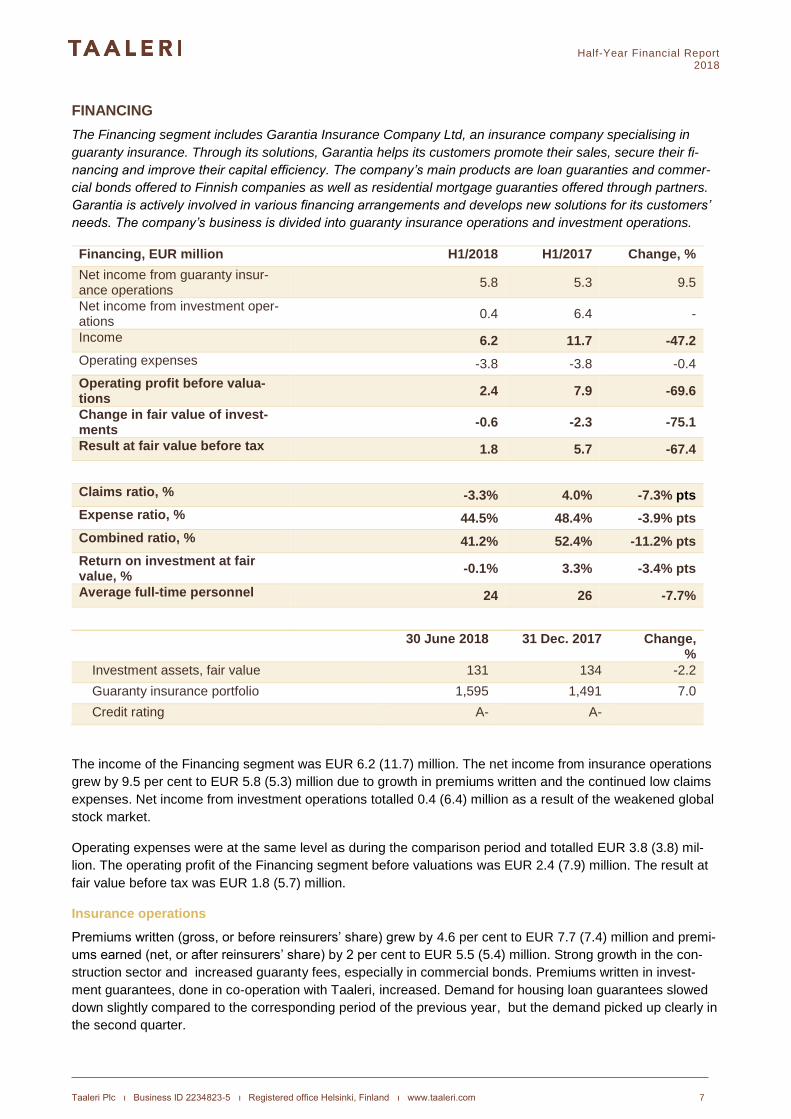
Financing, EUR million H1/2018 H1/2017 Change, %
Net income from guaranty insur-ance operations
5.8 5.3 9.5
Net income from investment oper-ations
0.4 6.4 -
Income 6.2 11.7 -47.2
Operating expenses -3.8 -3.8 -0.4
Operating profit before valua-tions
2.4 7.9 -69.6
Change in fair value of invest-ments
-0.6 -2.3 -75.1
Result at fair value before tax 1.8 5.7 -67.4
Claims ratio, % -3.3% 4.0% -7.3% pts
Expense ratio, % 44.5% 48.4% -3.9% pts
Combined ratio, % 41.2% 52.4% -11.2% pts
Return on investment at fair value, %
-0.1% 3.3% -3.4% pts
Average full-time personnel 24 26 -7.7%
30 June 2018 31 Dec. 2017 Change, %
Investment assets, fair value 131 134 -2.2
Guaranty insurance portfolio 1,595 1,491 7.0
Credit rating A- A-
The income of the Financing segment was EUR 6.2 (11.7) million. The net income from insurance operations
grew by 9.5 per cent to EUR 5.8 (5.3) million due to growth in premiums written and the continued low claims
expenses. Net income from investment operations totalled 0.4 (6.4) million as a result of the weakened global
stock market.
Operating expenses were at the same level as during the comparison period and totalled EUR 3.8 (3.8) mil-
lion. The operating profit of the Financing segment before valuations was EUR 2.4 (7.9) million. The result at
fair value before tax was EUR 1.8 (5.7) million.
Insurance operations
Premiums written (gross, or before reinsurers’ share) grew by 4.6 per cent to EUR 7.7 (7.4) million and premi-
ums earned (net, or after reinsurers’ share) by 2 per cent to EUR 5.5 (5.4) million. Strong growth in the con-
struction sector and increased guaranty fees, especially in commercial bonds. Premiums written in invest-
ment guarantees, done in co-operation with Taaleri, increased. Demand for housing loan guarantees slowed
down slightly compared to the corresponding period of the previous year, but the demand picked up clearly in
the second quarter.
Half-Year Financial Report 2018
Taaleri Plc ı Business ID 2234823-5 ı Registered office Helsinki, Finland ı www.taaleri.com 8
The gross exposure of the guaranty insurance portfolio increased by 7 per cent and was EUR 1,595 (1,491)
million at the end of review period. Residential mortgage guaranties accounted for 38 (39) per cent of the
gross exposure, commercial bonds 33 (29) per cent, loan guaranties 21 (24) per cent and other guaranties 8
(7) per cent.
Insurance claims paid remained exceptionally low. The claims ratio was -3.3 (4.0) per cent and insurance
claims incurred (less reinsurers’ share and including the share of actual operating expenses allocated to
claims handling) with respect to the guaranty insurance portfolio 0.05 (0.07) per cent. In January-June, EUR
0.6 (0.3) was paid in claims, of which approximately 40 per cent was due to residential mortgage guaranties
and the rest to commercial bonds. Of that sum, EUR 0.0 (0.0) million was recorded in claims of recourse. Of
claims paid during and before the period under review, EUR 0.5 (0.5) was recovered. Of that sum, EUR 0.2
(0.2) million was allocated to claims of recourse. The net provision for claims outstanding (or less reinsurers’
share) declined to EUR 1.2 (1.6) million, a result of changes in the provision for claims outstanding, which de-
creased claims incurred by EUR 0.4 million.
Garantia has received information that a matter concerning a potential insurance event and a EUR 5 million
claim with penalty consequences and legal fees has become pending in the Helsinki District Court. The insur-
ance claim concerns a pension fund that was a loan guaranty customer of Garantia in 2011 and that was
placed in liquidation in December 2011 under the Pension fund act (1164/1992, as amended), related to which
Garantia originally received a claim on 30 December 2011. Garantia considers the claim to be still unfounded,
which is why it has not been entered in the profit and loss account as a provision for outstanding claims. In
Taaleri Group’s financial report, the insurance claim is presented as a contingent liability.
The expense ratio of insurance operations improved to 44.5 (48.4) per cent and the combined ratio to 41.2
(52.4) per cent due to the strong growth of premiums earned (net) as well as of lower claim expenses. Com-
bined tratio claims were further improved by low claims paid.
Investment activity
Net income from investment operations was EUR 0.4 (6.4) million and consisted of interest income and
investment sales profits. The change in the fair value of investment assets before taxes was EUR -0.6 (-2.3)
million. Return on investment at fair value thus totalled EUR -0.2 (4.2) million, or -0.1 (3.3) per cent. The
investment (including cash and bank balances) was valued at EUR 131 (134) million.
Risk position
The principal risks associated with the Financing segment’s business operations are credit risks arising from
guaranty operations and the market risk regarding investment assets covering technical provisions.
The risk position of guaranty insurance operations remained stable during January-June 2018. The growth of
insurance exposure took place mainly in short-term commercial bonds covered by comprehensive reinsur-
ance, and a significant part came from well diversified residential mortgage guaranties. As a result of the pay-
off of some loan guaranties, the share of the insurance exposure classified as investment grade, i.e. with a
rating between AAA- and BBB-, excluding residential mortgage guaranties, residual value guaranties and as-
sumed reinsurance decreased somewhat and was 19 (21) per cent. The share of those with credit ratings of
C+ or lower decreased further and was 1.8 (2.7) per cent. The principal sectors in the insurance exposure
were construction at 47 (44) per cent and manufacturing at 22 (25) per cent. 55 (52) per cent of construction
guaranties are reinsured.
As a part of Taaleri Group, Garantia falls within the sphere of regulation of large customer risks determined in
the EU Capital Requirements Regulation. At the end of the year, Garantia’s largest single customer risk
amounted to 22.8 (21.8) per cent of Taaleri Group’s own funds.
In investment operations, the share of equity investments was reduced due to uncertainty in the investment
market. Fixed income investments (incl. cash and bank balances) made up 79.7 (76.0) per cent, equity invest-
ments (incl. private equity investments) 18.8 (22.7) per cent, and other investments 1.5 (1.3) per cent of the
investment portfolio. Fixed income investments mainly consist of investments in the bonds of Finnish and Nor-
Half-Year Financial Report 2018
Taaleri Plc ı Business ID 2234823-5 ı Registered office Helsinki, Finland ı www.taaleri.com 9
dic companies and credit institutions with strong creditworthiness. The share of investment- grade fixed in-
come investments (excl. fixed income funds) was 51.7 (54.0) per cent. The modified duration of fixed income
investments was 3.4 (3.7).
Credit rating
No changes took place in Garantia’s credit rating or its outlook during the year. Standard & Poor's Credit Mar-
ket Services Ltd (S&P) has confirmed Garantia Insurance Company Ltd.’s financial strength rating as A- with a
stable rating outlook.
Corporate arrangements
Garantia is expanding its activities to rental guaranty operations through a business acquisition. Garantia has
agreed to acquire the entire share capital of Suomen Vuokravastuu Oy (SVV) from its current shareholders.
SVV was established in 2015 and offers rent guaranties under two brands: Takaamo and Securent. Addition-
ally, SVV creates tailored portfolio guaranty solutions for the needs of large-scale renters. A rental guaranty
can replace the traditionally used deposit account as the rent collateral. The financial significance of the trans-
action will remain small for Garantia in the initial phase.
ENERGY
The Energy segment started its operations in 2016, and it operates on international energy infrastructure mar-
kets seeking new investment opportunities. Energy’s operational responsibilities are based on the life-cycle –
model: from seeking and selecting targets to develop, their project development, construction and operation
all the way to the controlled shutdown of energy plants. Taaleri Energy creates relations also with the leading
domestic and international institutional investors as well as develops and manages investment products tai-
lored for their needs.
Energy segment, EUR million H1/2018 H1/2017 Change, %
Income 1.1 0.8 40.3
Operating profit -0.9 -0.7 -35.6
Average full-time personnel 18 16 12.9
At the end of 2017 Taaleri Solar Wind fund acquired a 30 per cent stake in the 158-MW Čibuk wind power
project in Serbia and in the 248-MW Baynouna solar energy project in Jordan. Taaleri Energy took significant
growth steps in the first half of 2018 as the Čibuk advanced as planned; at the end of June half of the turbines
had been erected and the preparatory work at the Baynouna construction site is under way. Taaleri Energy’s
partner in both projects is Masdar, one of the world’s leaders in renewable energy. Masdar is owned by the
Abu Dhabi Emirate’s investment company Mubadala.
During the first half of the year Taaleri Energy established a subsidiary in the United States to seek out and
develop renewable energy investment opportunities in North America, and it acquired the project rights of a
277-MW wind power project in Texas. This wind power project is also progressing as planned.
Taaleri Energy’s subsidiary Taaleri Energia Funds Management Oy received the alternative investment fund
manager license in June 2018.
Half-Year Financial Report 2018
Taaleri Plc ı Business ID 2234823-5 ı Registered office Helsinki, Finland ı www.taaleri.com 10
OTHER OPERATIONS
Balance sheet investments include the Group administration services of Taaleri Plc that support the segments
and the investments on the Group’s own balance sheet, which are done primarily through Taaleri Investments
Ltd. The Group’s investment company Taaleri Investments Ltd invests from its own balance sheet in unlisted
and listed companies directly and on the principles of co-investment. Taaleri Investments Ltd aims to make
longer-term investments mainly in growth companies, where value is created for Taaleri through ownership
and where entrepreneurship, ideas and capital are combined.
Taaleri’s balance sheet investments include portfolio investments, co-investments and the Group’s own in-
vestments. The aim of the portfolio investments is to pursue new business opportunities that support the exist-
ing businesses and grow the value of the target companies. Portfolio investments include shares in, e.g., Fel-
low Finance Plc, Inderes Oy,ClarkApps Oy, (former Bonus Solutions Oy), Turun Toripark and Munkkiniemi
Group. The primary goal of co-investments is to create value for the target company. Co-investments include
shares in, e.g., Rauma Marine Constructions, Taaleri Geoenergia and Ficolo Oy. The Group’s own invest-
ments include TT Canada Real Estate Holding, other listed and unlisted investments, and granted loans.
Other operations, EUR million H1/2018 H1/2017 Change, %
Income -1.5 2.6 -157.4
Operating profit -3.3 0.5 -745.4
Average full-time personnel 15 15 2.2
30 June 2018 31 Dec. 2017 Change, %
Investments, fair value 39.8 33.7 17.9
- Portfolio investments 19.1 9.2 106.6
- Co-investments 6.5 6.3 2.4
- Own investments 14.2 18.2 21.6
Income from other operations amounted to EUR -1.5 (2.6) million and the operating profit to EUR -3.3 (0.5)
due to the impairment of the Erdwärme Oberland geothermal project in Germany. EUR 2.2 million of the im-
pairment is presented in income and EUR 0.2 million in external services. During the first part of the year
Taaleri increased the ownership in, e.g., Fellow Finance, invested in Turun Toripark and in real-estate projects
in Canada and Finland; the company also reduced its ownership in Inderes and redeemed fixed income funds
of EUR 10 million. Investments in other operations totalled 27.7 (27.2) million and loan receivables were EUR
12.1 (6.5) million.
OTHER EVENTS
CHANGES IN TAALERI’S MANAGEMENT
At the end of December 2017, Taaleri announced it is renewing its management system and thereby its or-
ganisation from 1 January 2018. Through these changes, the Group is seeking to streamline its operations
and to create an operating model that more strongly supports its core processes. Taaleri’s processes are built
around managing customer relationships and product development.
Samu Lang, Taaleri’s CIO, Director, Markets and Portfolio Management, was appointed Head of the Wealth
Management segment and a member of the Group’s Executive Management Team. Petri Lampinen, Head of
Customer Relationships in Taaleri’s Wealth Management segment, will continue in his current position and as
a member of the Executive Management Team. Heikki Nystedt was appointed Taaleri’s Head of Product and
Service Development.
Half-Year Financial Report 2018
Taaleri Plc ı Business ID 2234823-5 ı Registered office Helsinki, Finland ı www.taaleri.com 11
ANNUAL GENERAL MEETING 2018
Taaleri Plc's Annual General Meeting was held 21 March 2018 in Helsinki. The General Meeting adopted the financial statements for the 2017 financial period and granted the members of the Board of Directors and the CEO discharge from liability.
In accordance with the proposal of the Board of Directors, the General Meeting decided that, based on the
balance sheet to be adopted for the financial period ending 31 December 2017, a dividend of EUR 0.26 per
share be distributed and the remaining part of the distributable funds be retained in shareholders’ equity. The
dividend payment record date was 23 March 2018 and the dividend was paid on 3 April 2018.
The General Meeting decided on the annual remuneration payable to the members of the Board of Directors
as follows:
– Chairman of the Board of Directors EUR 50,000 – Vice Chairman of the Board of Directors EUR 36,000 – Chairman of the Audit Committee EUR 36,000 – Member of the Board of Directors EUR 30,000
The annual remuneration covers the whole of the term of office and committee work.
In addition, in accordance with the proposal of the Nomination Committee of the Board, it was decided that:
– Members of the Committees who are not members of the Board, are paid EUR 1,000 per meeting
– Travel and accommodation expenses of the members of the Board and the Committees are paid against
invoices, when the meeting takes place outside the member’s domicile.
It was decided that the number of members of the Board of Directors of the company be set at six (6). All of
the present members of the Board of Directors, that is Peter Fagernäs, Juha Laaksonen, Vesa Puttonen, Esa
Kiiskinen, Hanna Maria Sievinen and Tuomas Syrjänen, were re-elected to the Board. The term of office of the
Board of Directors will end at the close of the following Annual General Meeting.
The General Meeting elected Authorised Public Accountants Ernst & Young Oy to auditor for the term of of-
fice that will end at the close of the following Annual General Meeting. Ernst & Young Oy has announced that
the auditor-in-charge will be Ulla Nykky.
The General Meeting authorised the Board of Directors to decide on the purchase of the company's treasury
shares using assets belonging to unrestricted equity on the following conditions: Up to 2,000,000 shares may
be purchased, corresponding to 7.05% of all the company's shares. The purchase may be made in one or
more instalments. The purchase price per share shall be the price given on the Helsinki Stock Exchange or
another market-based price. The shares may be acquired to develop the company’s capital structure, to fi-
nance or implement corporate acquisitions, investments or other arrangements related to the company’s busi-
ness operations, to be used as part of the company’s reward scheme, or to be cancelled if justified from the
point of view of the company and its shareholders. The authorisation issued to the Board of Directors includes
the right to decide whether the shares will be acquired in a private placement or in proportion to the shares
owned by shareholders. The purchase may take place through private placement only if there is a weighty fi-
nancial reason for it from the company’s perspective. The Board of Directors has the right to decide on other
matters concerning the purchase of shares. This authorisation is valid for 18 months from the date of the close
of the Annual General Meeting. This authorisation supersedes the authorisation to purchase the company's
treasury shares issued at the Annual General Meeting of 29 March 2017.
The General Meeting also authorised the Board of Directors to decide on the issue of new shares and the as-
signment of treasury shares in the possession of the company on the following terms: The Board of Directors
may issue new shares and assign treasury shares in the possession of the company up to a maximum of
2,500,000 shares, corresponding to 8.82% of all the company's shares. The new shares may be issued and
the treasury shares possessed by the company may be assigned to the company’s shareholders in relation to
Half-Year Financial Report 2018
Taaleri Plc ı Business ID 2234823-5 ı Registered office Helsinki, Finland ı www.taaleri.com 12
their ownership of shares or deviating from the shareholder's pre-emptive subscription right in a private place-
ment, if there is a weighty financial reason for it from the point of view of the company, such as using the
shares as consideration in potential corporate acquisitions or other arrangements that are part of the com-
pany’s business operations, or to finance investments or as part of the company’s reward scheme. The Board
of Directors may also decide on a free-of-charge share issue to the company itself. The new shares may be
issued and the shares possessed by the company may be assigned either against payment or without pay-
ment. A private placement may only be without payment if there is an especially weighty reason for it from the
point of view of the company and taking into account the benefit of all its shareholders. The Board of Directors
will decide on all other factors related to share issues and the assignment of shares. The authorisation is valid
for one (1) year from the close of the Annual General Meeting, but no later than until 30 June 2019. This au-
thorisation supersedes the authorisation issued at the Annual General Meeting on 29 March 2017.
The General Meeting decided that Section 4 of the Articles of Association be amended to read as follows:
“Section 4 Board of Directors” The Board of Directors comprises at least three (3) and no more than eight (8)
members. The Chairman and Vice Chairman of the Board of Directors are elected by the General Meeting.
The term of office of the members of the Board of Directors ends at the close of the first Annual General Meet-
ing following the election.
Decisions regarding organisation of Taaleri Plc's Board of Directors
In its meeting held on 21 March 2018, Taaleri Plc's Board of Directors decided to elect Peter Fagernäs as Chairman of the Board of Directors and Juha Laaksonen as Vice Chairman.
Vesa Puttonen, Hanna Sievinen and Tuomas Syrjänen were elected as members of the Audit Committee of the Board of Directors. The Board of Directors elected Vesa Puttonen as Chairman of the Audit Committee.
Peter Fagernäs, Juha Laaksonen and Esa Kiiskinen were elected as members of the Remuneration Commit-tee of the Board of Directors. The Board of Directors elected Peter Fagernäs as Chairman of the Remunera-tion Committee.
Board members Peter Fagernäs and Juha Laaksonen, as well as the external member of the Board Pertti Laine were elected as members of the Nomination Committee of the Board of Directors. The Board of Direc-tors elected Peter Fagernäs as Chairman of the Nomination Committee.
TAALERI’S PERSONNEL
Taaleri’s most important success factor and strength is having professional and motivated personnel. The
company’s personnel turnover has been low throughout its operations, and the company’s growth has been
facilitated by successful recruitment.
The Group employed an average of 177 (175) full-time people during the period under review. There were 120
(119) full-time people in the Wealth Management segment, 24 (26) in the Financing segment and 18 (16) in
the Energy segment. The full-time personnel of Other operations averaged 15 (15). Of the personnel, 100 per
cent were employed in Finland.
The personnel costs of the Taaleri Group totalled EUR 10.2 (12.4) million during the period under review.
Incentive schemes
Taaleri has three share-based incentive schemes for the Group’s key persons.
The two first incentive schemes, 2013 and 2015, are synthetic option rights, the potential bonus of which will
be paid partly in the company shares and partly in cash in 2017–2018 and 2019-2020. By the end of the re-
view period the number of the year 2013 outstanding synthetic options was 55,000 and, correspondingly,
685,000 for year 2015. The Board of Directors has the right to require Taaleri key personnel to purchase com-
pany shares to a maximum of 50 per cent of the received bonus amount.
Half-Year Financial Report 2018
Taaleri Plc ı Business ID 2234823-5 ı Registered office Helsinki, Finland ı www.taaleri.com 13
The third incentive scheme, 2017, has three earning periods lasting three years each. The Board of Directors
will decide on the earning criteria and the targets set for each earning criterion at the beginning of each earn-
ing period. The bonuses paid will correspond with the value of no more than 180,000 Taaleri Plc shares, in-
cluding the part paid in cash. The bonus will be paid partly in company shares and partly in cash.
SHARES AND SHARE CAPITAL
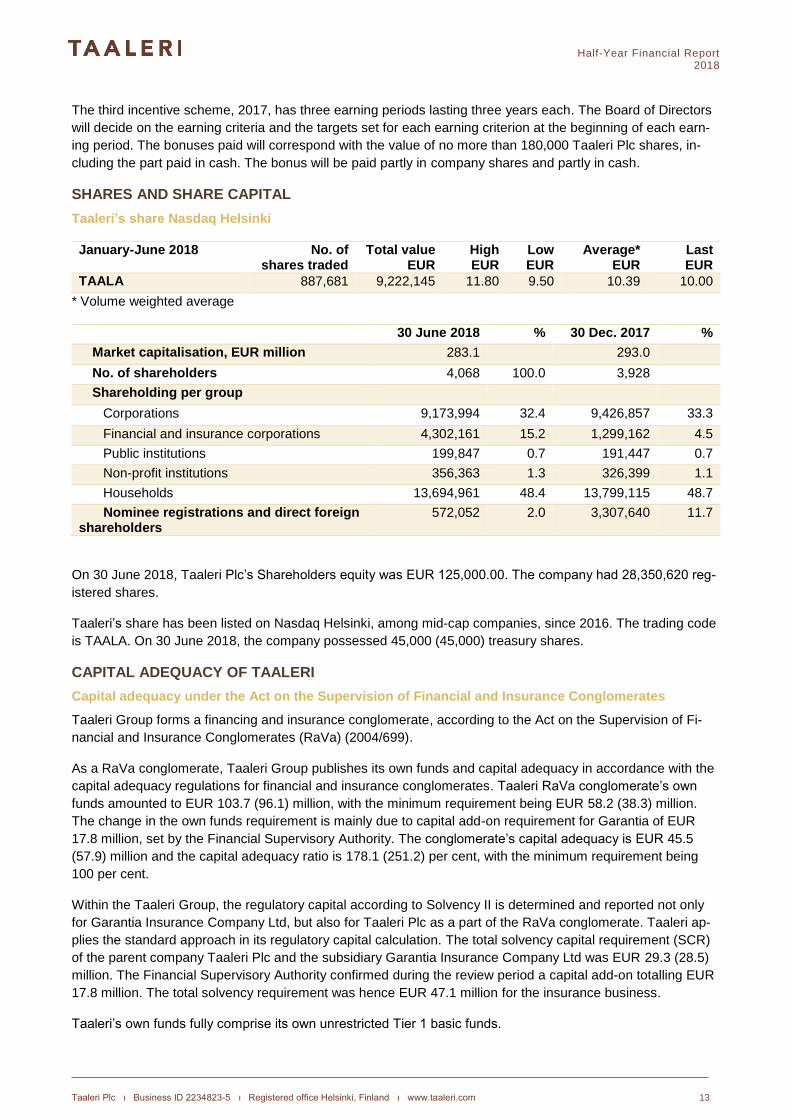
Taaleri’s share Nasdaq Helsinki
January-June 2018 No. of shares traded
Total value EUR
High EUR
Low EUR
Average* EUR
Last EUR
TAALA 887,681 9,222,145 11.80 9.50 10.39 10.00
* Volume weighted average
30 June 2018 % 30 Dec. 2017 %
Market capitalisation, EUR million 283.1 293.0
No. of shareholders 4,068 100.0 3,928
Shareholding per group
Corporations 9,173,994 32.4 9,426,857 33.3
Financial and insurance corporations 4,302,161 15.2 1,299,162 4.5
Public institutions 199,847 0.7 191,447 0.7
Non-profit institutions 356,363 1.3 326,399 1.1
Households 13,694,961 48.4 13,799,115 48.7
Nominee registrations and direct foreign shareholders
572,052 2.0 3,307,640 11.7
On 30 June 2018, Taaleri Plc’s Shareholders equity was EUR 125,000.00. The company had 28,350,620 reg-
istered shares.
Taaleri’s share has been listed on Nasdaq Helsinki, among mid-cap companies, since 2016. The trading code
is TAALA. On 30 June 2018, the company possessed 45,000 (45,000) treasury shares.
CAPITAL ADEQUACY OF TAALERI
Capital adequacy under the Act on the Supervision of Financial and Insurance Conglomerates
Taaleri Group forms a financing and insurance conglomerate, according to the Act on the Supervision of Fi-
nancial and Insurance Conglomerates (RaVa) (2004/699).
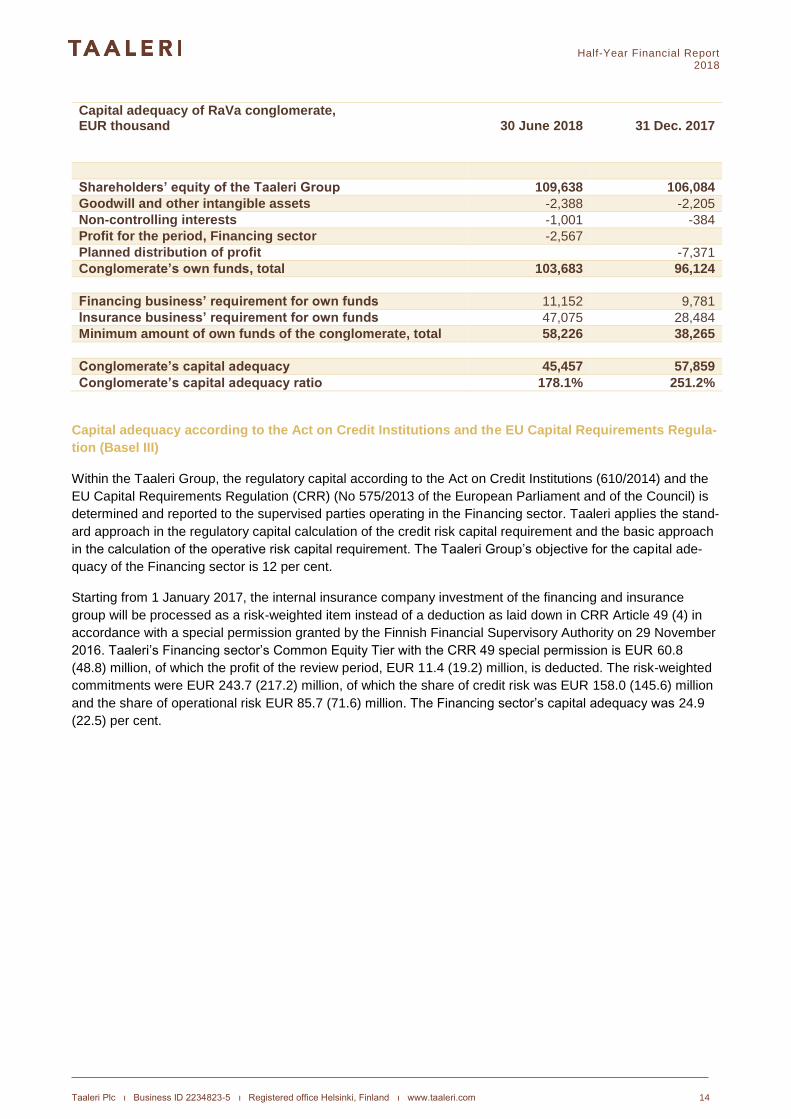
As a RaVa conglomerate, Taaleri Group publishes its own funds and capital adequacy in accordance with the
capital adequacy regulations for financial and insurance conglomerates. Taaleri RaVa conglomerate’s own
funds amounted to EUR 103.7 (96.1) million, with the minimum requirement being EUR 58.2 (38.3) million.
The change in the own funds requirement is mainly due to capital add-on requirement for Garantia of EUR
17.8 million, set by the Financial Supervisory Authority. The conglomerate’s capital adequacy is EUR 45.5
(57.9) million and the capital adequacy ratio is 178.1 (251.2) per cent, with the minimum requirement being
100 per cent.
Within the Taaleri Group, the regulatory capital according to Solvency II is determined and reported not only
for Garantia Insurance Company Ltd, but also for Taaleri Plc as a part of the RaVa conglomerate. Taaleri ap-
plies the standard approach in its regulatory capital calculation. The total solvency capital requirement (SCR)
of the parent company Taaleri Plc and the subsidiary Garantia Insurance Company Ltd was EUR 29.3 (28.5)
million. The Financial Supervisory Authority confirmed during the review period a capital add-on totalling EUR
17.8 million. The total solvency requirement was hence EUR 47.1 million for the insurance business.
Taaleri’s own funds fully comprise its own unrestricted Tier 1 basic funds.
Half-Year Financial Report 2018
Taaleri Plc ı Business ID 2234823-5 ı Registered office Helsinki, Finland ı www.taaleri.com 14
Capital adequacy of RaVa conglomerate, EUR thousand
30 June 2018
31 Dec. 2017
Shareholders’ equity of the Taaleri Group 109,638 106,084
Goodwill and other intangible assets -2,388 -2,205
Non-controlling interests -1,001 -384
Profit for the period, Financing sector -2,567
Planned distribution of profit -7,371
Conglomerate’s own funds, total 103,683 96,124
Financing business’ requirement for own funds 11,152 9,781
Insurance business’ requirement for own funds 47,075 28,484
Minimum amount of own funds of the conglomerate, total 58,226 38,265
Conglomerate’s capital adequacy 45,457 57,859
Conglomerate’s capital adequacy ratio 178.1% 251.2%
Capital adequacy according to the Act on Credit Institutions and the EU Capital Requirements Regula-
tion (Basel III)
Within the Taaleri Group, the regulatory capital according to the Act on Credit Institutions (610/2014) and the
EU Capital Requirements Regulation (CRR) (No 575/2013 of the European Parliament and of the Council) is
determined and reported to the supervised parties operating in the Financing sector. Taaleri applies the stand-
ard approach in the regulatory capital calculation of the credit risk capital requirement and the basic approach
in the calculation of the operative risk capital requirement. The Taaleri Group’s objective for the capital ade-
quacy of the Financing sector is 12 per cent.
Starting from 1 January 2017, the internal insurance company investment of the financing and insurance
group will be processed as a risk-weighted item instead of a deduction as laid down in CRR Article 49 (4) in
accordance with a special permission granted by the Finnish Financial Supervisory Authority on 29 November
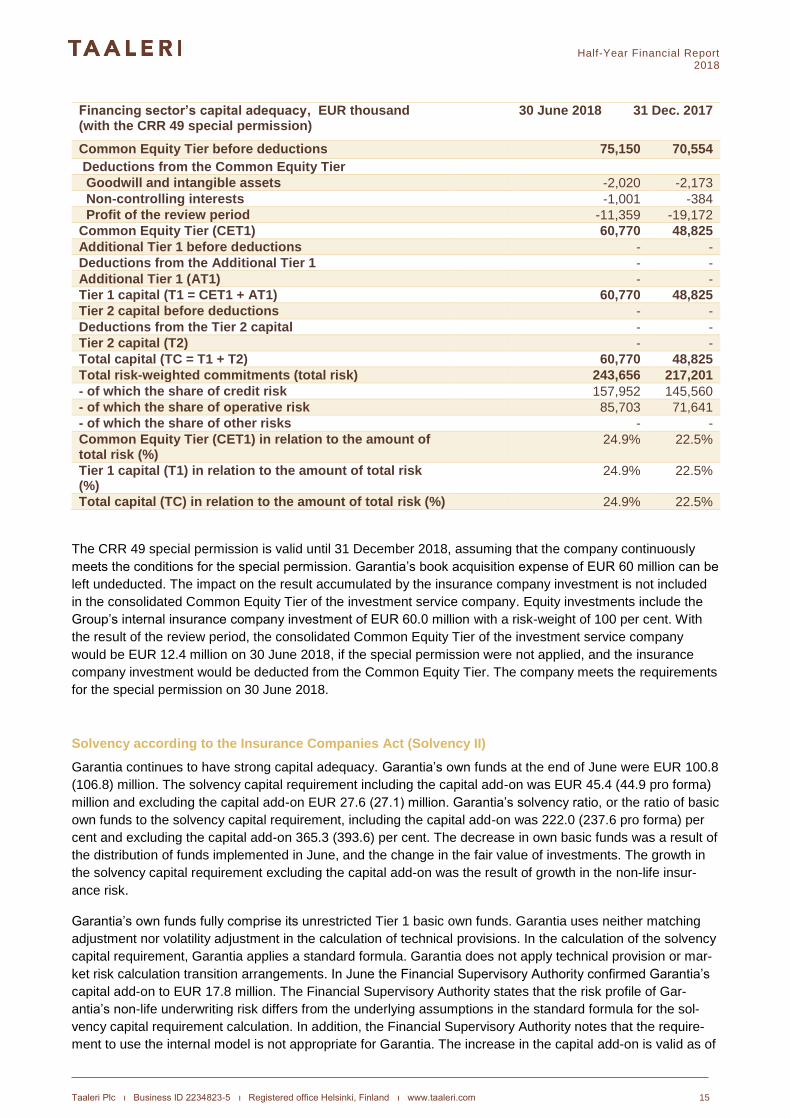
2016. Taaleri’s Financing sector’s Common Equity Tier with the CRR 49 special permission is EUR 60.8
(48.8) million, of which the profit of the review period, EUR 11.4 (19.2) million, is deducted. The risk-weighted
commitments were EUR 243.7 (217.2) million, of which the share of credit risk was EUR 158.0 (145.6) million
and the share of operational risk EUR 85.7 (71.6) million. The Financing sector’s capital adequacy was 24.9
(22.5) per cent.
Half-Year Financial Report 2018
Taaleri Plc ı Business ID 2234823-5 ı Registered office Helsinki, Finland ı www.taaleri.com 15
Financing sector’s capital adequacy, EUR thousand (with the CRR 49 special permission)
30 June 2018 31 Dec. 2017
Common Equity Tier before deductions 75,150 70,554
Deductions from the Common Equity Tier
Goodwill and intangible assets -2,020 -2,173
Non-controlling interests -1,001 -384
Profit of the review period -11,359 -19,172
Common Equity Tier (CET1) 60,770 48,825
Additional Tier 1 before deductions - -
Deductions from the Additional Tier 1 - -
Additional Tier 1 (AT1) - -
Tier 1 capital (T1 = CET1 + AT1) 60,770 48,825
Tier 2 capital before deductions - -
Deductions from the Tier 2 capital - -
Tier 2 capital (T2) - -
Total capital (TC = T1 + T2) 60,770 48,825
Total risk-weighted commitments (total risk) 243,656 217,201
- of which the share of credit risk 157,952 145,560
- of which the share of operative risk 85,703 71,641
- of which the share of other risks - -
Common Equity Tier (CET1) in relation to the amount of total risk (%)
24.9% 22.5%
Tier 1 capital (T1) in relation to the amount of total risk (%)
24.9% 22.5%
Total capital (TC) in relation to the amount of total risk (%) 24.9% 22.5%
The CRR 49 special permission is valid until 31 December 2018, assuming that the company continuously
meets the conditions for the special permission. Garantia’s book acquisition expense of EUR 60 million can be
left undeducted. The impact on the result accumulated by the insurance company investment is not included
in the consolidated Common Equity Tier of the investment service company. Equity investments include the
Group’s internal insurance company investment of EUR 60.0 million with a risk-weight of 100 per cent. With
the result of the review period, the consolidated Common Equity Tier of the investment service company
would be EUR 12.4 million on 30 June 2018, if the special permission were not applied, and the insurance
company investment would be deducted from the Common Equity Tier. The company meets the requirements
for the special permission on 30 June 2018.
Solvency according to the Insurance Companies Act (Solvency II)
Garantia continues to have strong capital adequacy. Garantia’s own funds at the end of June were EUR 100.8
(106.8) million. The solvency capital requirement including the capital add-on was EUR 45.4 (44.9 pro forma)
million and excluding the capital add-on EUR 27.6 (27.1) million. Garantia’s solvency ratio, or the ratio of basic
own funds to the solvency capital requirement, including the capital add-on was 222.0 (237.6 pro forma) per
cent and excluding the capital add-on 365.3 (393.6) per cent. The decrease in own basic funds was a result of
the distribution of funds implemented in June, and the change in the fair value of investments. The growth in
the solvency capital requirement excluding the capital add-on was the result of growth in the non-life insur-
ance risk.
Garantia’s own funds fully comprise its unrestricted Tier 1 basic own funds. Garantia uses neither matching
adjustment nor volatility adjustment in the calculation of technical provisions. In the calculation of the solvency
capital requirement, Garantia applies a standard formula. Garantia does not apply technical provision or mar-
ket risk calculation transition arrangements. In June the Financial Supervisory Authority confirmed Garantia’s
capital add-on to EUR 17.8 million. The Financial Supervisory Authority states that the risk profile of Gar-
antia’s non-life underwriting risk differs from the underlying assumptions in the standard formula for the sol-
vency capital requirement calculation. In addition, the Financial Supervisory Authority notes that the require-
ment to use the internal model is not appropriate for Garantia. The increase in the capital add-on is valid as of
Half-Year Financial Report 2018
Taaleri Plc ı Business ID 2234823-5 ı Registered office Helsinki, Finland ı www.taaleri.com 16
30.6.2018 until further notice, and the Financial Supervisory Authority will assess the amount at least once a
year.
Based on the Insurance Companies Act that came into force on 1 January 2016, the Solvency II capital ade-
quacy regulations do not fall within the sphere of statutory auditing.
TAALERI’S RISK MANAGEMENT AND RISK POSITION
The task of risk management is to identify, assess, measure, handle and monitor business operation-related
risks that influence the realisation of the Group’s strategic and operative goals, as well as to oversee that the
principles approved by the Taaleri Plc Board of Directors are complied with in the company’s operations. Risk
management aims to mitigate the likelihood of unforeseeable risks being realised, their influence on and the
threat they present to Taaleri Group’s business operations. Risk management supports the achieving of the
goals set in the strategy by promoting better utilisation of opportunities related to the different functions and
the distribution of risk-taking capacity to the different functions as efficiently as possible and within the frame-
work of risk appetite defined for projects.
Taaleri Group’s risks are divided into five main categories: strategic and business operations risk, credit risk,
liquidity risk, market risk and operative risk (including compliance risk). The principles of Taaleri's risk and
capital adequacy management are described in note 37 to the financial statements of 2017.
The risk-bearing capacity of the Taaleri Group comprises a properly optimised capital structure, profitability of
business operations and qualitative factors, which include reliable management, internal control and proactive
risk and capital adequacy management. Taaleri Group’s attitude towards risk-taking is based on calculated
risk/return thinking. Taaleri Plc’s Board of Directors has decided that the Group may not in its activities take a
risk that jeopardises the target level set for the capital adequacy ratio of the company’s own funds (1.5 times
the calculated minimum level of equity or 1.1 times the internal equity requirement).
Segment-specific risks
The greatest risks of Taaleri’s Wealth Management segment mainly consist of operative risks and, to a slight
extent, credit risks.
The business operations of Garantia Insurance Company Ltd in the insurance sector and the company’s in-
vestment operations play a key role in Taaleri’s risk position. Garantia’s capital adequacy is strong and its risk
position has remained stable. At the end of the review period, Garantia’s claims ratio was -3.3 percent and the
claims incurred in relation to gross exposure remained low at 0.05 per cent (LTM). The share of fixed income
investments in Garantia’s investments was 79.7 per cent. Standard & Poor's Credit Market Services Ltd.’s
(S&P) credit rating for Garantia is A- with stable prospects.
Although the Energy segment is a new business area for Taaleri, the company is utilising its previous exper-
tise in renewable energy in the new business. The Energy segment’s goal is to channel assets under manage-
ment to renewable energy production projects and to other energy projects supporting sustainability. The goal
is to internationalise and expand energy business operations. The Energy segment’s earnings are impacted
its success in finding suitable projects, its ability to identify all risks related to renewable energy’s international
development, construction, financing and operations, and its success in internationalization. The Energy seg-
ment’s earnings are also affected by the success of its own energy project investments.
The most significant risks of other business operations consist primarily of private investments and financing
granted by Taaleri Investments Ltd and of credit risks related to Taaleri Plc’s granted loans as well as receiva-
bles from credit institutions.
Taaleri falls within the sphere of regulation of large customer risks determined in the EU Capital Requirements
Regulation. At the end of the review period, Taaleri’s largest single customer risk was 22.8 (20.8) per cent of
the Group’s own funds and the liabilities of any (single) customer entity did not exceed the 25 percent limit set
by the law.
Half-Year Financial Report 2018
Taaleri Plc ı Business ID 2234823-5 ı Registered office Helsinki, Finland ı www.taaleri.com 17
MATERIAL EVENTS AFTER THE FINANCIAL PERIOD
On 3 May 2018, Taaleri Wealth Management Ltd announced the acquisition of Evervest Oy's entire share
capital. The deal was finalised on 5 July 2018 when the Financial Supervision Authority granted Taaleri
Wealth Management Ltd its acquisition approval.
On 15 August 2018, Vesa Aho, CEO of Garantia Insurance Company Ltd and member of Taaleri Plc.’s man-
agement team informed that he will move to another company. He will leave the company by 30 September
2018. Titta Elomaa, Head of Investment and deputy CEO of Garantia will assume responsibility for the duties
of CEO until a successor has been appointed.
OUTLOOK
SHORT-TERM RISKS AND CONCERNS
The most significant external factors affecting the Group’s operating profit are changes in the operating envi-
ronment and changes in the financial situation in Finland.
The result of the Wealth Management- and the Energy segments are influenced by the development of assets
under management, which depends on the progress of the private equity funds’ projects and the development
of private equity markets. The profit development is also influenced by the realisation of performance fee and
commission income tied to the success of investment operations. On the other hand, private equity fund man-
agement fees are based on long-term contracts that bring in a steady cash flow.
Financing’s i.e. Gararantia’s guaranty insurance business and investment activity have a major impact on
Taaleri’s business income.
The Other operations segment’s returns consist of the changes in the value of investments and of sales prof-
its/losses gained in connection with investment sales. The returns and income of the Other operations seg-
ment may thus vary significantly between periods under review.
LONG-TERM TARGETS
Taaleri’s long-term operating profit target is at least 20 per cent of income, its long-term return on equity is at
least 15 per cent, and its long-term equity ratio target is at least 30 per cent.
The company strives to increase the amount of dividend it distributes, and to annually distribute a competitive
dividend, taking into account the company’s financial and financing situation as well as the expiration of the
special permission by the Finnish Financial Supervisory Authority regarding the capital adequacy requirement.
Helsinki, 15 August 2018
Taaleri Plc
Board of Directors
Additional info:
CEO Juhani Elomaa, +358 40 778 9020
CFO Minna Smedsten, +358 40 700 1738
Head of Communications and IR Sophie Jolly, +358 40 828 7317, [email protected]
Half-Year Financial Report 2018
Taaleri Plc ı Business ID 2234823-5 ı Registered office Helsinki, Finland ı www.taaleri.com 18
Web cast and a short interview
An English presentation will be available from 13:00 CET at https://www.taaleri.com/en/investor-relations/re-
ports-and-presentations. In addition, a short interview will be available as of 17 August 2018. The material will
be found on the Taaleri homepage on demand.
Financial information
Taaleri Plc’s financial statements bulletin for the year 2018 will be published on 14 February 2019.
Half-Year Financial Report
2018
KEY FIGURES
1-6/2018 1-6/2017 1-12/2017
GROUP IFRS IFRS IFRS
Income, EUR 1 000 35,221 38,722 80,989
Operating profit (-loss), EUR 1 000 12,377 15,604 27,611
- as percentage of turnover 35.1 % 40.3 % 34.1 %
Net profit for the period, EUR 1 000 9,396 12,534 21,787
- as percentage of turnover 26.7 % 32.4 % 26.9 %
Basic earnings per share, EUR 0.32 0.44 0.76
Diluted earnings per share, EUR 0.32 0.44 0.76
Return on equity % (ROE) 1) 17.4 % 26.2 % 21.8 %
Return on equity at fair value % (ROE) 1) 16.6 % 22.1 % 19.1 %
Return on assets % (ROA) 1) 8.2 % 11.9 % 9.8 %
Cost/income ratio 65.1 % 59.9 % 66.2 %
Price/earnings (P/E) 1) 15.5 10.5 13.7
Number of employees, avg 185 186 184
1) Annualised.
_______________________________________________________________________________________
Taaleri Plc ı Business ID 2234823-5 ı Registered office Helsinki, Finland ı www.taaleri.com 19
Half-Year Financial Report
2018
1-6/2018 1-6/2017 1-12/2017
GROUP IFRS IFRS IFRS
Equity ratio -% 48.3 % 46.7 % 46.3 %
Modified equity ratio % 1) 48.3 % 46.7 % 46.3 %
Gearing -% 29.2 % 19.2 % 8%
Equity/share, EUR 3.84 3.44 3.73
Dividend/share, EUR 2) - - 0.26
Dividend/earnings, % 2) - - 34.3 %
Effective dividend yield, % 2) - - 2.5 %
Loan receivables, EUR 1 000 12,114 4,776 6,598
Conglomerate's capital adequacy ratio, % 178.1 % 272.9 % 251.2 %
Financing sector capital adequacy ratio, % 24.9 % - 22.5 %
Number of shares at the end of period 3) 28,305,620 28,305,620 28,305,620
Average number of shares 3) 28,305,620 28,305,620 28,305,620
Share average price, EUR 10.39 8.33 9.30
- highest price, EUR 11.80 9.38 11.50
- lowest price, EUR 9.50 7.78 7.78
- closing price, EUR 10.00 9.20 10.35
Market capitalization, EUR 1000 4) 283,056 260,412 292,963
Shares traded, thousands 888 1,304 2,487
Shares traded, % 3% 5% 9%
1) Modified equity ratio relates to a covenant term of a bond issued by the Group, which is presented according to FAS
up to 2014. From 2015 it equals the equity ratio, because Lainaamo Plc is no longer consolidated into the Group, and
therefore the equity ratio does not need to be modified. See calculation formula on page 22.
2) Adjusted for share issues and reduced by own shares acquired
3) Reduced by own shares acquired.
_______________________________________________________________________________________
Taaleri Plc ı Business ID 2234823-5 ı Registered office Helsinki, Finland ı www.taaleri.com 20
Half-Year Financial Report
2018
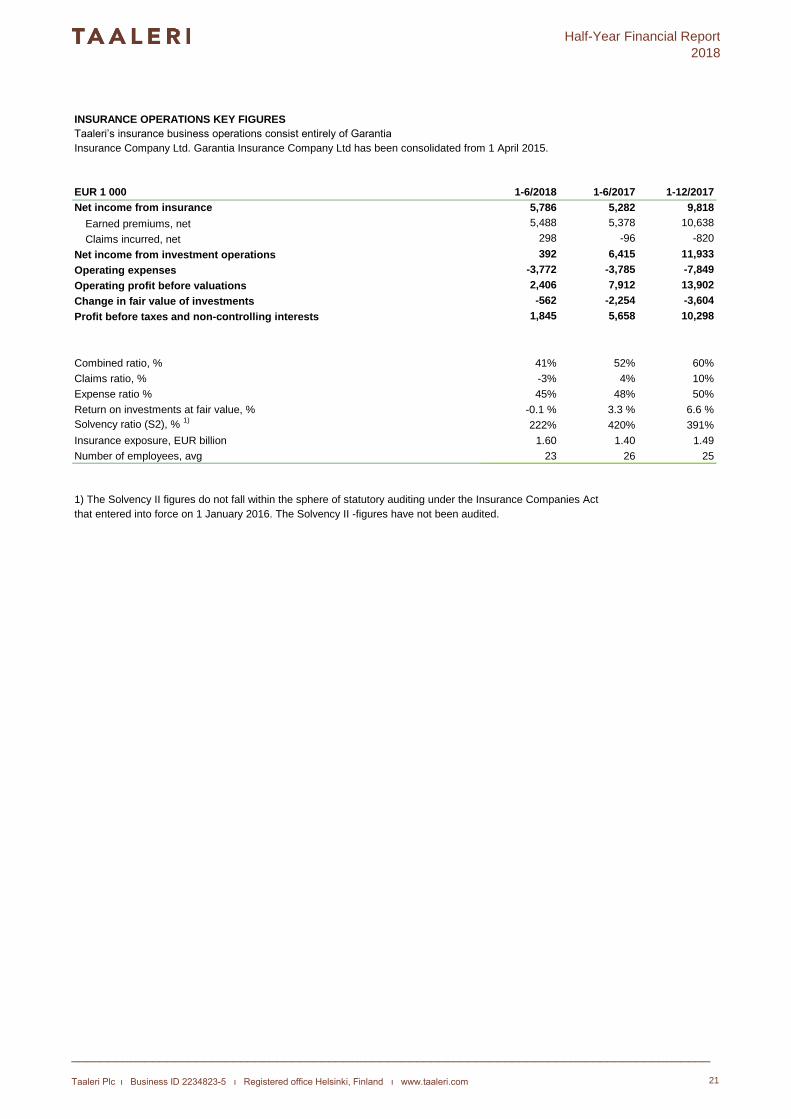
INSURANCE OPERATIONS KEY FIGURES
Taaleri’s insurance business operations consist entirely of Garantia
Insurance Company Ltd. Garantia Insurance Company Ltd has been consolidated from 1 April 2015.
EUR 1 000 1-6/2018 1-6/2017 1-12/2017
Net income from insurance 5,786 5,282 9,818
Earned premiums, net 5,488 5,378 10,638
Claims incurred, net 298 -96 -820
Net income from investment operations 392 6,415 11,933
Operating expenses -3,772 -3,785 -7,849
Operating profit before valuations 2,406 7,912 13,902
Change in fair value of investments -562 -2,254 -3,604
Profit before taxes and non-controlling interests 1,845 5,658 10,298
Combined ratio, % 41% 52% 60%
Claims ratio, % -3% 4% 10%
Expense ratio % 45% 48% 50%
Return on investments at fair value, % -0.1 % 3.3 % 6.6 %
Solvency ratio (S2), % 1)
222% 420% 391%
Insurance exposure, EUR billion 1.60 1.40 1.49
Number of employees, avg 23 26 25
1) The Solvency II figures do not fall within the sphere of statutory auditing under the Insurance Companies Act
that entered into force on 1 January 2016. The Solvency II -figures have not been audited.
_______________________________________________________________________________________
Taaleri Plc ı Business ID 2234823-5 ı Registered office Helsinki, Finland ı www.taaleri.com 21
Half-Year Financial Report
2018
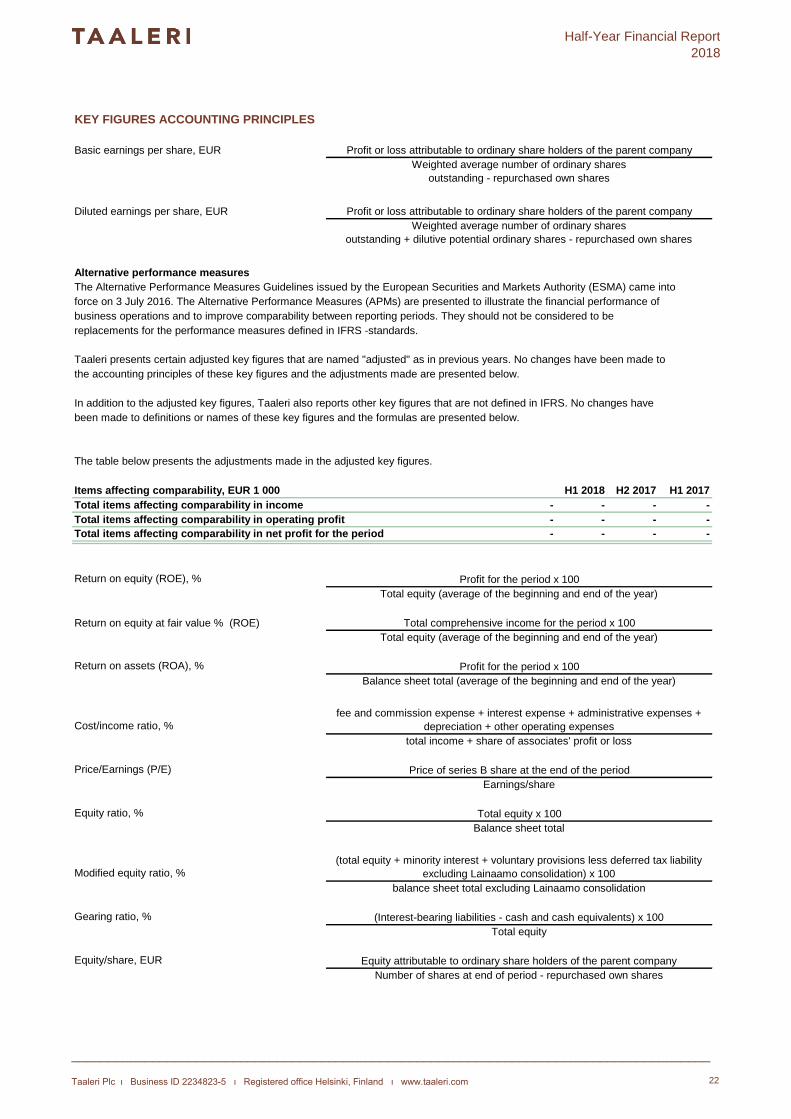
KEY FIGURES ACCOUNTING PRINCIPLES
Basic earnings per share, EUR
Diluted earnings per share, EUR
Alternative performance measures
The Alternative Performance Measures Guidelines issued by the European Securities and Markets Authority (ESMA) came into
force on 3 July 2016. The Alternative Performance Measures (APMs) are presented to illustrate the financial performance of
business operations and to improve comparability between reporting periods. They should not be considered to be
replacements for the performance measures defined in IFRS -standards.
Taaleri presents certain adjusted key figures that are named "adjusted" as in previous years. No changes have been made to
the accounting principles of these key figures and the adjustments made are presented below.
In addition to the adjusted key figures, Taaleri also reports other key figures that are not defined in IFRS. No changes have
been made to definitions or names of these key figures and the formulas are presented below.
The table below presents the adjustments made in the adjusted key figures.
Items affecting comparability, EUR 1 000 H1 2018 H2 2017 H1 2017
Total items affecting comparability in income - - - -
Total items affecting comparability in operating profit - - - -
Total items affecting comparability in net profit for the period - - - -
Return on equity (ROE), %
Return on equity at fair value % (ROE)
Return on assets (ROA), %
Cost/income ratio, %
Price/Earnings (P/E)
Equity ratio, %
Modified equity ratio, %
Gearing ratio, %
Equity/share, EUR
Profit or loss attributable to ordinary share holders of the parent company
Weighted average number of ordinary shares
outstanding - repurchased own shares
Profit or loss attributable to ordinary share holders of the parent company
Weighted average number of ordinary shares
outstanding + dilutive potential ordinary shares - repurchased own shares
Profit for the period x 100
Total equity (average of the beginning and end of the year)
Total comprehensive income for the period x 100
Total equity (average of the beginning and end of the year)
Profit for the period x 100
Balance sheet total (average of the beginning and end of the year)
fee and commission expense + interest expense + administrative expenses +
depreciation + other operating expenses
total income + share of associates' profit or loss
Price of series B share at the end of the period
Earnings/share
Total equity x 100
Balance sheet total
(total equity + minority interest + voluntary provisions less deferred tax liability
excluding Lainaamo consolidation) x 100
balance sheet total excluding Lainaamo consolidation
(Interest-bearing liabilities - cash and cash equivalents) x 100
Total equity
Equity attributable to ordinary share holders of the parent company
Number of shares at end of period - repurchased own shares
_______________________________________________________________________________________
Taaleri Plc ı Business ID 2234823-5 ı Registered office Helsinki, Finland ı www.taaleri.com 22
Half-Year Financial Report
2018
Dividend/share, EUR
Dividend/earnings, %
Effective dividend yield, %
Conglomerate's capital adequacy ratio, %
Total capital in relation to risk-weighted items
Market capitalization
Shares traded, %
KEY FIGURES FOR INSURANCE OPERATIONS
Combined ratio, % Claims ratio, % + Expense ratio, %
Claims ratio, %
This key figure is calculated after the share of the reinsurers.
Expense ratio, %
This key figure is calculated after the share of the reinsurers.
Solvency ratio (S2), %
Common equity tier in relation to risk-weighted items
Dividend payable for the financial period x 100
Weighted average number of ordinary shares
Dividend/share x 100
Basic earnings per share
Dividend/share x 100
Price of series B share at the end of the period
Conglomerate's total capital base
Conglomerate's minimum requirement of total capital base
Total Capital (TC)
Risk-weighted items (Total risk)
Common Equity Tier (CET1)
Risk-weighted items (Total risk)
(Operating costs - Group's allocated overhead and financing expenses +
operating expenes allocated to claims paid) x 100
Insurance premium income
Basic own funds x 100
Solvency capital requirement (SCR)
Number of shares at end of financial period, less repurchased own shares,
multiplied by stock exchange price at end of financial period
Shares traded during the financial period x 100
Weighted average number of ordinary shares outstanding
Claims incurred + operating expenses allocated to claims paid x 100
Insurance premium income
_______________________________________________________________________________________
Taaleri Plc ı Business ID 2234823-5 ı Registered office Helsinki, Finland ı www.taaleri.com 23
Half-Year Financial Report
2018
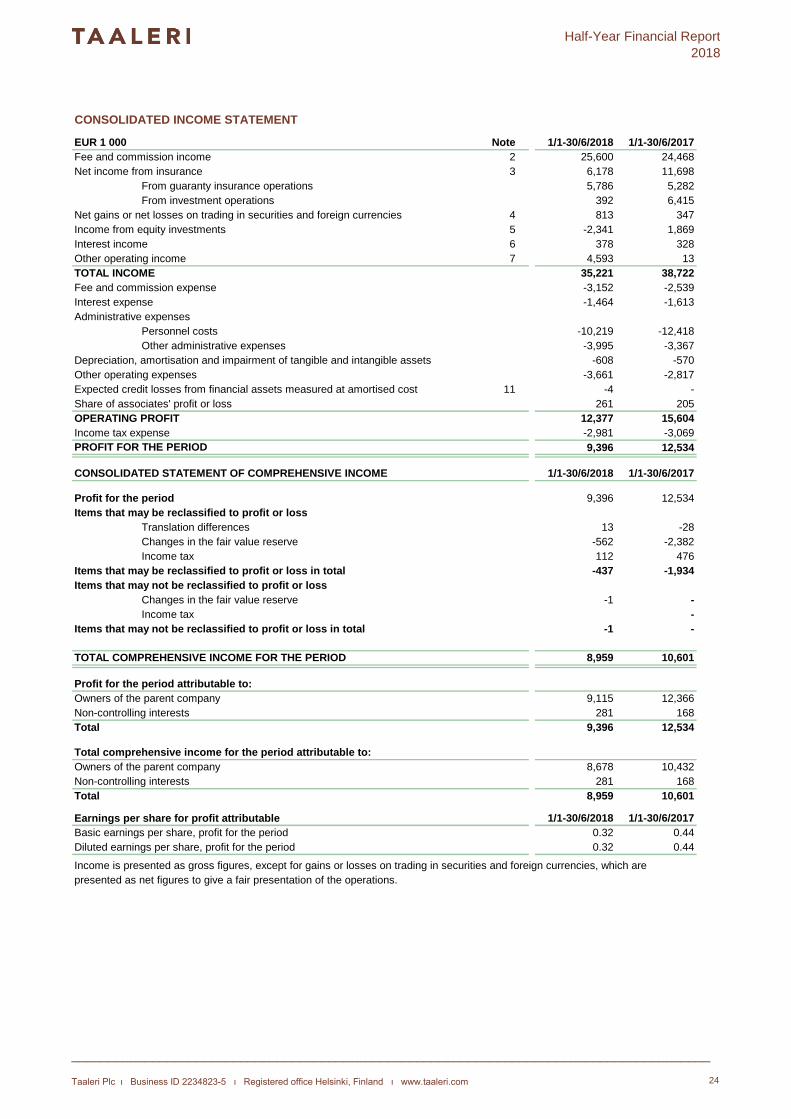
CONSOLIDATED INCOME STATEMENT
EUR 1 000 Note 1/1-30/6/2018 1/1-30/6/2017
Fee and commission income 2 25,600 24,468
3 6,178 11,698
From guaranty insurance operations 5,786 5,282
From investment operations 392 6,415
4 813 347
Income from equity investments 5 -2,341 1,869
6 378 328
Other operating income 7 4,593 13
TOTAL INCOME 35,221 38,722
-3,152 -2,539
-1,464 -1,613
Administrative expenses
Personnel costs -10,219 -12,418
Other administrative expenses -3,995 -3,367
Depreciation, amortisation and impairment of tangible and intangible assets -608 -570
Other operating expenses -3,661 -2,817
Expected credit losses from financial assets measured at amortised cost 11 -4 -
Share of associates' profit or loss 261 205
OPERATING PROFIT 12,377 15,604
-2,981 -3,069
PROFIT FOR THE PERIOD 9,396 12,534
CONSOLIDATED STATEMENT OF COMPREHENSIVE INCOME 1/1-30/6/2018 1/1-30/6/2017
Profit for the period 9,396 12,534
Items that may be reclassified to profit or loss
Translation differences 13 -28
Changes in the fair value reserve -562 -2,382
Income tax 112 476
Items that may be reclassified to profit or loss in total -437 -1,934
Items that may not be reclassified to profit or loss
Changes in the fair value reserve -1 -
Income tax -
Items that may not be reclassified to profit or loss in total -1 -
TOTAL COMPREHENSIVE INCOME FOR THE PERIOD 8,959 10,601
Profit for the period attributable to:
Owners of the parent company 9,115 12,366
Non-controlling interests 281 168
Total 9,396 12,534
Total comprehensive income for the period attributable to:
Owners of the parent company 8,678 10,432
Non-controlling interests 281 168
Total 8,959 10,601
1/1-30/6/2018 1/1-30/6/2017
Basic earnings per share, profit for the period 0.32 0.44
Diluted earnings per share, profit for the period 0.32 0.44
Income is presented as gross figures, except for gains or losses on trading in securities and foreign currencies, which are
presented as net figures to give a fair presentation of the operations.
Earnings per share for profit attributable
Income tax expense
Net income from insurance
Net gains or net losses on trading in securities and foreign currencies
Interest income
Fee and commission expense
Interest expense
_______________________________________________________________________________________
Taaleri Plc ı Business ID 2234823-5 ı Registered office Helsinki, Finland ı www.taaleri.com 24
Half-Year Financial Report
2018
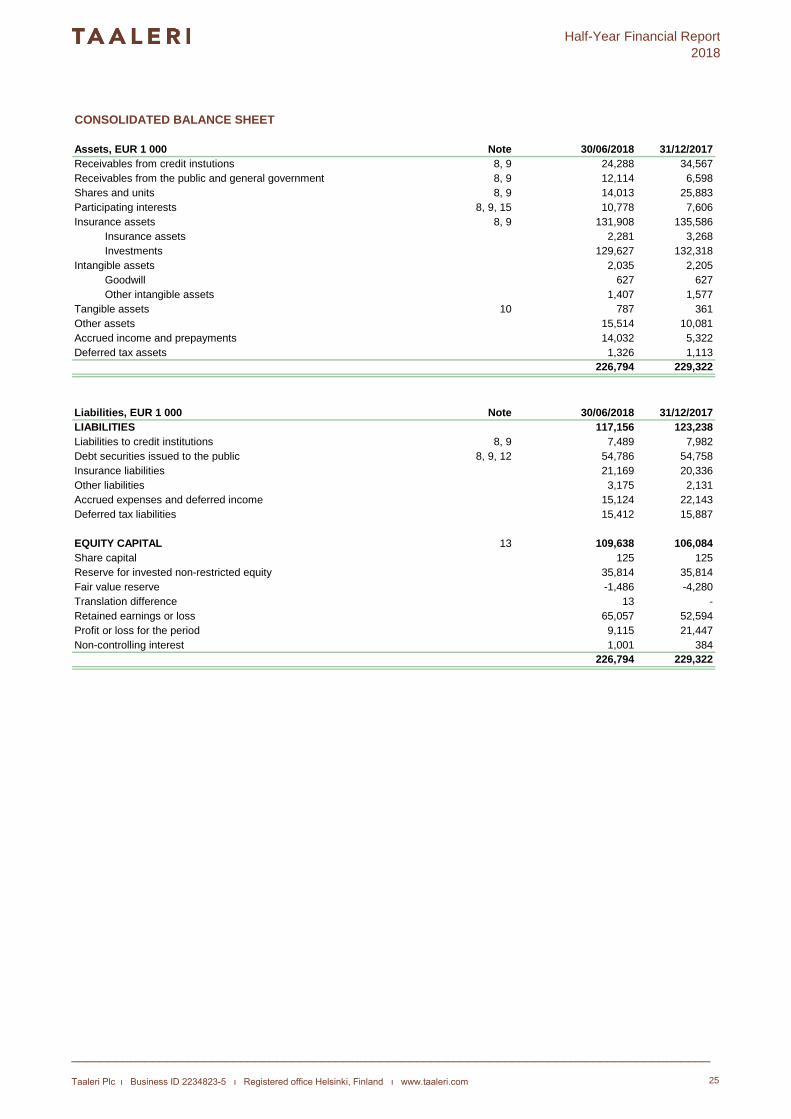
CONSOLIDATED BALANCE SHEET
Assets, EUR 1 000 Note 30/06/2018 31/12/2017
Receivables from credit instutions 8, 9 24,288 34,567
Receivables from the public and general government 8, 9 12,114 6,598
Shares and units 8, 9 14,013 25,883
Participating interests 8, 9, 15 10,778 7,606
Insurance assets 8, 9 131,908 135,586
Insurance assets 2,281 3,268
Investments 129,627 132,318
Intangible assets 2,035 2,205
Goodwill 627 627
Other intangible assets 1,407 1,577
Tangible assets 10 787 361
Other assets 15,514 10,081
Accrued income and prepayments 14,032 5,322
Deferred tax assets 1,326 1,113
226,794 229,322
Liabilities, EUR 1 000 Note 30/06/2018 31/12/2017
LIABILITIES 117,156 123,238
Liabilities to credit institutions 8, 9 7,489 7,982
Debt securities issued to the public 8, 9, 12 54,786 54,758
Insurance liabilities 21,169 20,336
Other liabilities 3,175 2,131
Accrued expenses and deferred income 15,124 22,143
Deferred tax liabilities 15,412 15,887
EQUITY CAPITAL 13 109,638 106,084
Share capital 125 125
Reserve for invested non-restricted equity 35,814 35,814
Fair value reserve -1,486 -4,280
Translation difference 13 -
Retained earnings or loss 65,057 52,594
Profit or loss for the period 9,115 21,447
Non-controlling interest 1,001 384
226,794 229,322
_______________________________________________________________________________________
Taaleri Plc ı Business ID 2234823-5 ı Registered office Helsinki, Finland ı www.taaleri.com 25
Half-Year Financial Report
2018
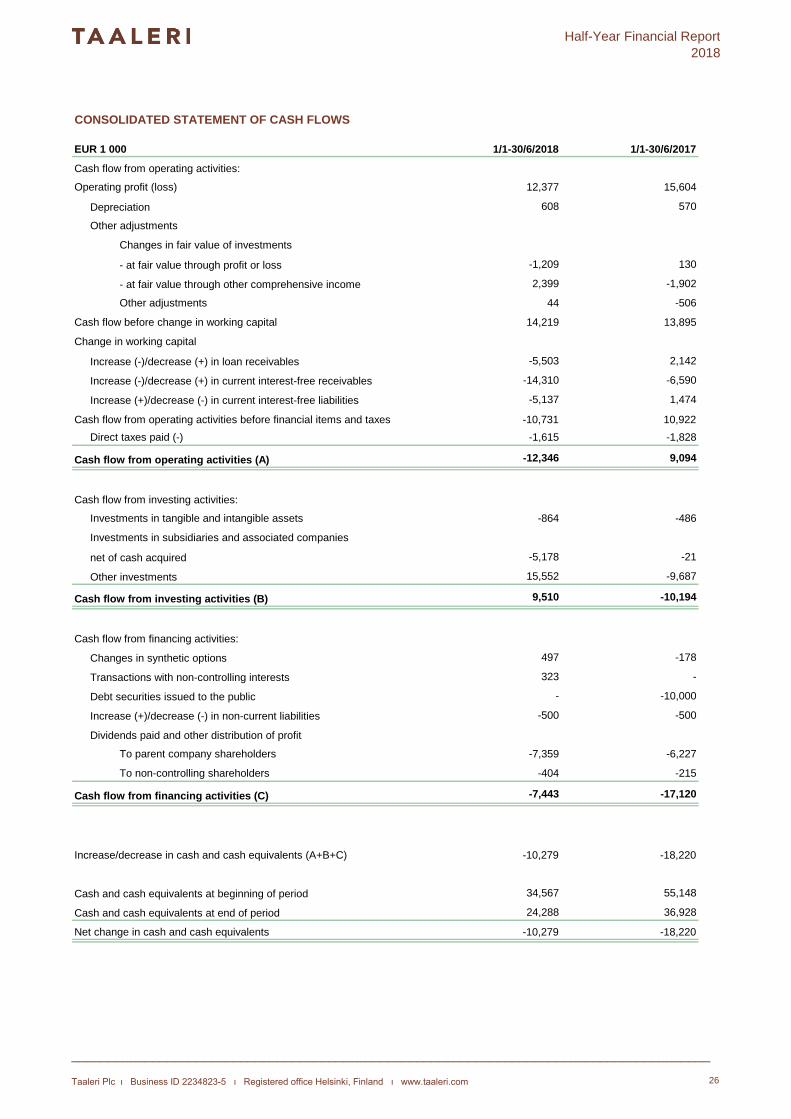
CONSOLIDATED STATEMENT OF CASH FLOWS
EUR 1 000 1/1-30/6/2018 1/1-30/6/2017
Cash flow from operating activities:
Operating profit (loss) 12,377 15,604
Depreciation 608 570
Other adjustments
Changes in fair value of investments
- at fair value through profit or loss -1,209 130
- at fair value through other comprehensive income 2,399 -1,902
Other adjustments 44 -506
Cash flow before change in working capital 14,219 13,895
Change in working capital
Increase (-)/decrease (+) in loan receivables -5,503 2,142
Increase (-)/decrease (+) in current interest-free receivables -14,310 -6,590
Increase (+)/decrease (-) in current interest-free liabilities -5,137 1,474
Cash flow from operating activities before financial items and taxes -10,731 10,922
Direct taxes paid (-) -1,615 -1,828
Cash flow from operating activities (A) -12,346 9,094
Cash flow from investing activities:
Investments in tangible and intangible assets -864 -486
Investments in subsidiaries and associated companies
net of cash acquired -5,178 -21
Other investments 15,552 -9,687
Cash flow from investing activities (B) 9,510 -10,194
Cash flow from financing activities:
Changes in synthetic options 497 -178
Transactions with non-controlling interests 323 -
Debt securities issued to the public - -10,000
Increase (+)/decrease (-) in non-current liabilities -500 -500
Dividends paid and other distribution of profit
To parent company shareholders -7,359 -6,227
To non-controlling shareholders -404 -215
Cash flow from financing activities (C) -7,443 -17,120
Increase/decrease in cash and cash equivalents (A+B+C) -10,279 -18,220
Cash and cash equivalents at beginning of period 34,567 55,148
Cash and cash equivalents at end of period 24,288 36,928
Net change in cash and cash equivalents -10,279 -18,220
_______________________________________________________________________________________
Taaleri Plc ı Business ID 2234823-5 ı Registered office Helsinki, Finland ı www.taaleri.com 26
Half-Year Financial Report
2018
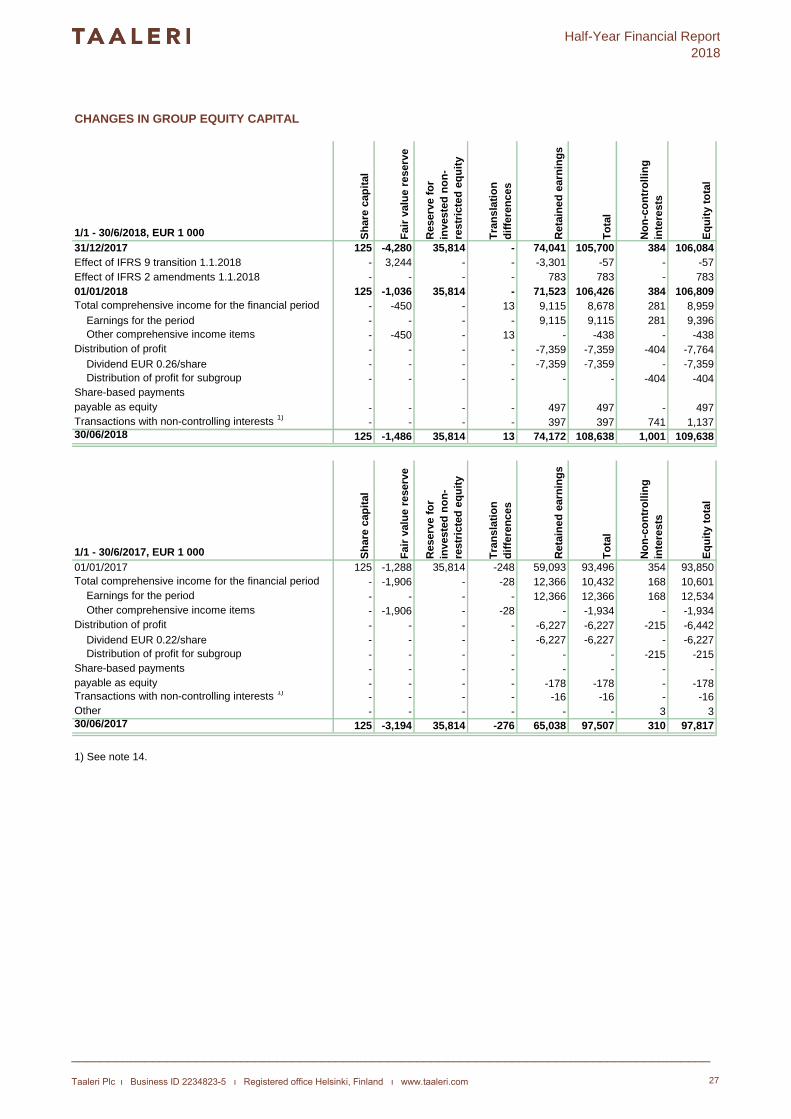
CHANGES IN GROUP EQUITY CAPITAL
1/1 - 30/6/2018, EUR 1 000 Sh
are
cap
ital
Fa
ir v
alu
e r
eserv
e
Reserv
e f
or
inv
este
d n
on
-
restr
icte
d e
qu
ity
Tra
ns
lati
on
dif
fere
nc
es
Reta
ine
d e
arn
ing
s
To
tal
No
n-c
on
tro
llin
g
inte
rests
Eq
uit
y t
ota
l
31/12/2017 125 -4,280 35,814 - 74,041 105,700 384 106,084
Effect of IFRS 9 transition 1.1.2018 - 3,244 - - -3,301 -57 - -57
Effect of IFRS 2 amendments 1.1.2018 - - - - 783 783 - 783
01/01/2018 125 -1,036 35,814 - 71,523 106,426 384 106,809
Total comprehensive income for the financial period - -450 - 13 9,115 8,678 281 8,959
Earnings for the period - - - - 9,115 9,115 281 9,396
Other comprehensive income items - -450 - 13 - -438 - -438
Distribution of profit - - - - -7,359 -7,359 -404 -7,764
Dividend EUR 0.26/share - - - - -7,359 -7,359 - -7,359
Distribution of profit for subgroup - - - - - - -404 -404
Share-based payments
payable as equity - - - - 497 497 - 497
Transactions with non-controlling interests 1)
- - - - 397 397 741 1,13730/06/2018 125 -1,486 35,814 13 74,172 108,638 1,001 109,638
1/1 - 30/6/2017, EUR 1 000 Sh
are
cap
ital
Fa
ir v
alu
e r
eserv
e
Reserv
e f
or
inv
este
d n
on
-
restr
icte
d e
qu
ity
Tra
ns
lati
on
dif
fere
nc
es
Reta
ine
d e
arn
ing
s
To
tal
No
n-c
on
tro
llin
g
inte
rests
Eq
uit
y t
ota
l
01/01/2017 125 -1,288 35,814 -248 59,093 93,496 354 93,850
Total comprehensive income for the financial period - -1,906 - -28 12,366 10,432 168 10,601
Earnings for the period - - - - 12,366 12,366 168 12,534
Other comprehensive income items - -1,906 - -28 - -1,934 - -1,934
Distribution of profit - - - - -6,227 -6,227 -215 -6,442
Dividend EUR 0.22/share - - - - -6,227 -6,227 - -6,227
Distribution of profit for subgroup - - - - - - -215 -215
Share-based payments - - - - - - - -
payable as equity - - - - -178 -178 - -178
Transactions with non-controlling interests 1)
- - - - -16 -16 - -16
Other - - - - - - 3 330/06/2017 125 -3,194 35,814 -276 65,038 97,507 310 97,817
1) See note 14.
_______________________________________________________________________________________
Taaleri Plc ı Business ID 2234823-5 ı Registered office Helsinki, Finland ı www.taaleri.com 27
Half-Year Financial Report
2018
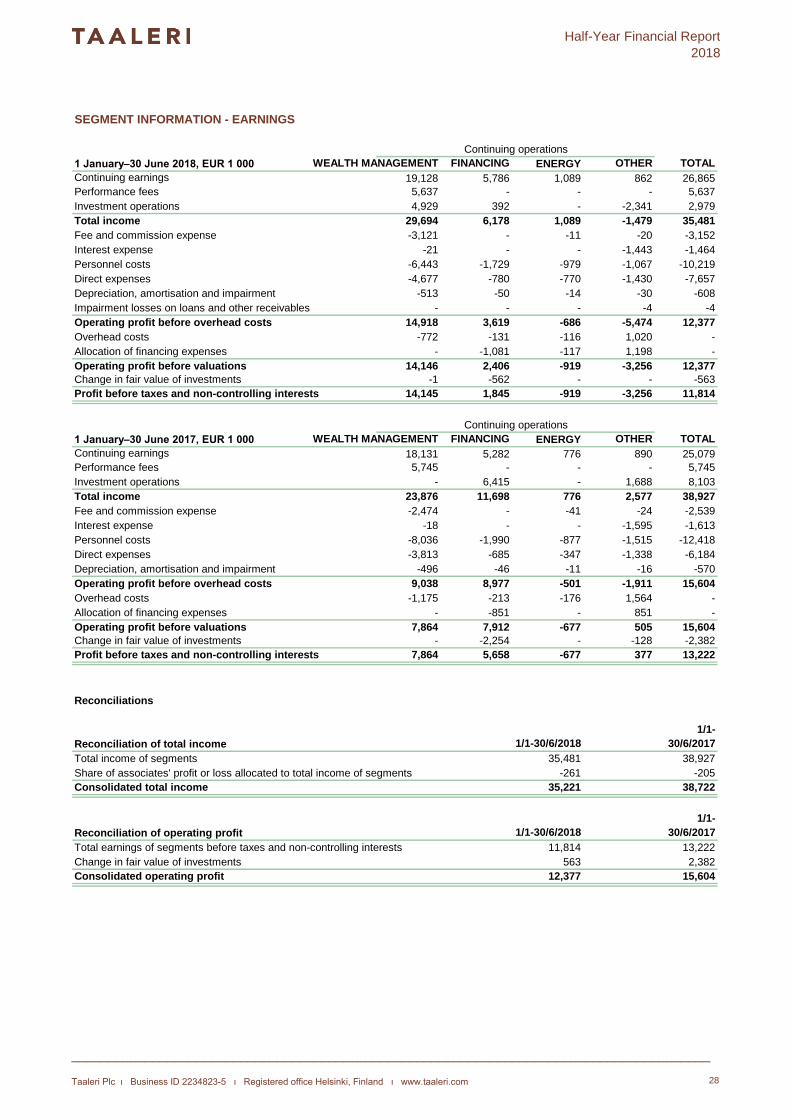
SEGMENT INFORMATION - EARNINGS
1 January–30 June 2018, EUR 1 000 WEALTH MANAGEMENT FINANCING ENERGY OTHER TOTAL
Continuing earnings 19,128 5,786 1,089 862 26,865
Performance fees 5,637 - - - 5,637
Investment operations 4,929 392 - -2,341 2,979
Total income 29,694 6,178 1,089 -1,479 35,481
Fee and commission expense -3,121 - -11 -20 -3,152
Interest expense -21 - - -1,443 -1,464
Personnel costs -6,443 -1,729 -979 -1,067 -10,219
Direct expenses -4,677 -780 -770 -1,430 -7,657
Depreciation, amortisation and impairment -513 -50 -14 -30 -608
Impairment losses on loans and other receivables - - - -4 -4
Operating profit before overhead costs 14,918 3,619 -686 -5,474 12,377
Overhead costs -772 -131 -116 1,020 -
Allocation of financing expenses - -1,081 -117 1,198 -
Operating profit before valuations 14,146 2,406 -919 -3,256 12,377
Change in fair value of investments -1 -562 - - -563
Profit before taxes and non-controlling interests 14,145 1,845 -919 -3,256 11,814
1 January–30 June 2017, EUR 1 000 WEALTH MANAGEMENT FINANCING ENERGY OTHER TOTAL
Continuing earnings 18,131 5,282 776 890 25,079
Performance fees 5,745 - - - 5,745
Investment operations - 6,415 - 1,688 8,103
Total income 23,876 11,698 776 2,577 38,927
Fee and commission expense -2,474 - -41 -24 -2,539
Interest expense -18 - - -1,595 -1,613
Personnel costs -8,036 -1,990 -877 -1,515 -12,418
Direct expenses -3,813 -685 -347 -1,338 -6,184
Depreciation, amortisation and impairment -496 -46 -11 -16 -570
Operating profit before overhead costs 9,038 8,977 -501 -1,911 15,604
Overhead costs -1,175 -213 -176 1,564 -
Allocation of financing expenses - -851 - 851 -
Operating profit before valuations 7,864 7,912 -677 505 15,604
Change in fair value of investments - -2,254 - -128 -2,382
Profit before taxes and non-controlling interests 7,864 5,658 -677 377 13,222
Reconciliations
Reconciliation of total income 1/1-30/6/2018
1/1-
30/6/2017
Total income of segments 35,481 38,927
Share of associates' profit or loss allocated to total income of segments -261 -205
Consolidated total income 35,221 38,722
0 0
Reconciliation of operating profit 1/1-30/6/2018
1/1-
30/6/2017
Total earnings of segments before taxes and non-controlling interests 11,814 13,222
Change in fair value of investments 563 2,382
Consolidated operating profit 12,377 15,604
Continuing operations
Continuing operations
_______________________________________________________________________________________
Taaleri Plc ı Business ID 2234823-5 ı Registered office Helsinki, Finland ı www.taaleri.com 28
Half-Year Financial Report
2018
NOTES TO THE HALF YEAR FINANCIAL REPORT 30 JUNE 2018
1 Accounting policies 30
2 Fee and commission income 36
3 Net income from insurance 36
4 Net gains or net losses on trading in securities and foreign currencies 37
5 Income from equity investments 37
6 Interest income 37
7 Other operating income 37
8 Classification of financial assets and liabilities 38
9 Financial instruments at fair value 39
10 Tangible assets 40
11 Impairment losses on receivables 40
12 Debt securities issued to the public 41
13 Equity capital 41
14 Investments in subsidiaries 42
15 Investments in associated companies 42
16 Contingent liabilities 43
17 Operating leases 43
18 Related party disclosures 44
_______________________________________________________________________________________
Taaleri Plc ı Business ID 2234823-5 ı Registered office Helsinki, Finland ı www.taaleri.com 29
HALF YEAR FINANCIAL REPORT 2018
Taaleri Plc ı Business ID 2234823-5 ı Registered office Helsinki ı www.taaleri.com 30
1. ACCOUNTING POLICIES
The half year financial report has been prepared in accordance with IAS 34 and with the accounting principles presented in the financial statements 2017, with exception of the changes described below.
The half year financial report is unaudited. All figures in the accounts have been rounded and consequently the sum of individual figures can deviate from the presented sum figure.
The half year financial report is available in Finnish and English. The Finnish version is the official half year financial report that will apply if there is any discrepancy between the language versions.
Applied new and amended standards
The Group has applied the following new and amended standards, with an effect on the group financial statements, as of 1.1.2018.
IFRS 9 Financial instruments
On 1 January 2018, the Group started applying the IFRS 9 Financial Instruments standard, which comprises the classifica-
tion, measurement and impairment of financial assets and liabilities. The standard affects the classification and measure-ment of the Group’s financial instruments as well as impairment. The Group does not apply hedge accounting. Below, we present the key effects of the standard in the Group, the conversion calculation of financial instruments per 1 January 2018 as well as accounting policies for financial instruments as of 1 January 2018. Taaleri does not correct comparative information, and the accounting policies for in effect in the comparative period are presented in the 2017 financial state-ments.
Key effects in the Group – classification and measurement
At initial recognition, the Group’s financial assets are classified into the following categories: those recognised at fair value through profit or loss, those recognised at fair value through other comprehensive income and those recognised at amor-tised cost. For the classification, financial assets are grouped into debt instruments, equity instruments and derivatives. Taaleri has reclassified its financial assets based on this grouping and, where debt instruments are concerned, also based on the business model and the cash flow characteristics of the instruments. The changes are presented in the table below.
IFRS 9 did not bring any changes to the classification and measurement of financial liabilities.
Conversion table for financial assets and liabilities as of 1 January 2018, without the effect of expected credit losses
1) Receivables from credit institutions, other financial assets and all liabilities are measured as before, at amortised
cost.
Financial assets 1/1/2018, EUR 1 000 IFRS 9 classification
IAS 39 classification
Amortised
cost
At fair value through other
comprehensive income
At fair value through other
comprehensive income
(without recycling)
At fair value through
profit or loss TOTAL Note
Loans and receivables 52 020 - - 564 52 583
Receivables from credit institutions 34 567 34 567 1)
Receivables from the public and general
government5 634 564 6 198 2)
Other f inancial assets 11 819 11 819 1)
At fair value through profit or loss - - - 20 470 20 470
Shares and units 20 470 20 470 3)
Available-for-sale - 67 735 390 70 006 138 132
Shares and units 390 5 023 5 413 4)
Receivables from the public and general
government400 400 5)
Insurance assets 67 735 64 583 132 318 6)
Assets in total 52 020 67 735 390 91 040 211 185
Excepted credit loss 71 204
Financial liabilities 1/1/2018, EUR 1 000 IFRS 9 classification
IAS 39 classification At fair value through profit or loss TOTAL
Other liabilities 79 164 - 79 164
Liabilities to credit institutions 7 982 - 7 982 1)
Debt securities issued to the public 54 758 - 54 758 1)
Other f inancial liabilities 16 424 - 16 424 1)
Liabilities in total 79 164 - 79 164
Amortised cost
HALF YEAR FINANCIAL REPORT 2018
Taaleri Plc ı Business ID 2234823-5 ı Registered office Helsinki ı www.taaleri.com 31
2) Receivables from the public and general government previously classified as loans and receivables will continue
to be measured at amortised cost. However, receivables whose cash flow characteristics are not consistent with
a basic lending arrangement are measured at fair value through profit or loss. At Taaleri, such receivables consist
of subordinated loans, among other things.
3) Shares previously measured at fair value through profit or loss will continue to be measured at fair value through
profit or loss.
4) Shares and units previously classified as available-for-sale will now be measured at fair value through profit or
loss. However, at the time of initial recognition, the management may make an irrevocable choice concerning a
procedure according to which changes in fair value are recognised in other comprehensive income and will not
later be recycled to profit or loss. Taaleri’s non-strategic investments will be measured according to this
procedure at fair value through other comprehensive income without recycling.
5) Receivables from the public and general government previously classified as available-for-sale will now be
measured at fair value through profit or loss. At Taaleri, such receivables consist of profit-sharing loans, among
other things.
6) Financial assets of insurance operations, previously classified as available-for-sale, will now be measured either
at fair value through other comprehensive income or at fair value through profit or loss. Debt instruments that
pass the cash flow test are measured at fair value through other comprehensive income. This category includes
normal bonds. Equity instruments and debt instruments that do not pass the cash flow test are measured at fair
value through profit or loss. This category includes mutual funds, private equity funds and hybrid loans.
Key effects in the Group – impairment
With regard to impairment, through IFRS 9 a model based on expected credit losses was introduced, replacing the model based on actual losses accordant with IAS 39. Impairment is recognised from all loans and debt instruments not recog-nised at fair value through profit or loss and from all off-balance sheet liabilities.
For the purposes of testing impairment, assets to be tested are divided into three levels. On the first level, there are instru-ments whose credit risk has not increased significantly; on the second level, there are instruments whose credit risk has increased significantly; and, on the third level, there are instruments whose value has decreased. For instruments on the first level, a deductible item is recognised that corresponds to the expected credit losses from 12 months. For instruments on the second and third levels, a deductible item is recognised to the amount which corresponds to the expected credit losses over the entire period of validity.
The majority of the items for which the expected credit loss is recognised are in Garantia’s investment portfolio. The ex-pected credit loss for debt instruments in Garantia’s investment portfolio is calculated based on an individual credit risk calculation model (PDxLGDxEAD)1, where the credit risk calculation model from Garantia’s economic capital model is uti-lized. The Group’s other debt instruments are very few in number, and their expected credit loss is also mainly calculated according to the corresponding individual credit risk calculation model. Expected credit loss is recognised for 12 months when the credit risk has not increased significantly and for the entire period of validity when the credit risk has increased significantly. A significant increase in credit risk is estimated on the basis of a change in credit rating; the credit rating is deemed to take into account reasonable and justifiable information to the necessary extent. In addition, the credit risk is estimated to have increased significantly if the payment is over 30 days due.
It is expected that the application of the expected credit loss model will increase and bring forward credit loss allowances, but the impact is not expected to be significant. In connection with the IFRS 9 conversion, expected credit losses amount-ing to EUR 204,000 were recognised for financial assets in insurance operations and EUR 71,000 for receivables from the public and general government.
IFRS 9 accounting policies
Chapter 2.7 Financial assets and liabilities of Taaleri’s accounting policies has changed as of 1 January 2018 as described hereunder, with the exception of the Measurement at fair value section. In addition, Chapter 2.8 Assets and liabilities from insurance operations has been updated regarding investment assets of insurance operations and Chapter 2.18 Account-ing policies requiring management’s judgement and key uncertainties regarding estimations has been updated with a par-
agraph on impairment. The changed accounting policies are presented below.
1 PD (probability of default) represents the other party’s probability of becoming insolvent within the next 12 months, LGD (loss given default) represents the proportion of financial loss in a case of insolvency, and EAD (exposure at default) represents the amount of liability at the moment of insolvency.
HALF YEAR FINANCIAL REPORT 2018
Taaleri Plc ı Business ID 2234823-5 ı Registered office Helsinki ı www.taaleri.com 32
2.7 Financial assets and liabilities
Assets and liabilities are presented in the order of liquidity which, for the Taaleri Group, offers more reliable and significant information than the presentation of current and non-current items.
Financial assets
At initial recognition, the Group’s financial assets are classified into the following categories: those measured at fair value through profit or loss, those measured at fair value through other comprehensive income and those measured at amor-tised cost. For the purpose of classification, financial assets are grouped into debt instruments, equity instruments and derivatives.
The classification of debt instruments depends on Taaleri’s business model in the management of financial assets and the characteristics of the cash flows of the financial assets in question. Taaleri mainly manages its debt instruments according to two different business models. Due to the nature of the insurance operations, the objective of Garantia’s investment operations is achieved by both collecting contractual cash flows and selling financial assets, i.e. applying the “hold to col-lect and sell” business model. Accordingly, debt instruments that pass the cash flow test are measured at fair value through other comprehensive income. For debt instruments other than those of insurance operations, the business model is mainly holding the debt instruments to collect contractual cash flows, meaning that debt instruments that pass the cash flow test are measured at amortised cost. This estimate is performed instrument-specifically, so the measurement basis is also determined instrument-specifically. In both insurance investment operations and the Group’s other investment opera-tions, debt instruments that do not pass the cash flow test are measured at fair value through profit or loss.
Changes in fair value from debt instruments measured at fair value through other comprehensive income are recognised in the fair value reserve. Interest income, impairment gains and losses as well as foreign exchange rate gains and losses are recognised in profit or loss. When a debt instrument is derecognised, the profit or loss in the fair value reserve is trans-ferred, as an adjustment due to a change in the classification, from equity to profit or loss in the net gains from insurance investment operations, as the item belongs to the investment assets of insurance operations.
The carrying amount of debt instruments recognised at amortised cost includes the deductible item for expected credit losses, and interest income is recognised in interest income using the effective interest method. Sales gains and losses are recognised in profit or loss.
Debt instruments measured at fair value through profit or loss are measured at fair value, and any changes in fair value are recognised in profit or loss. Interest income, profits from funds, foreign exchange rate gains and losses as well as sales gains and losses are also recognised in profit or loss.
A business model indicates how financial assets are managed to achieve a certain business objective. In the “hold to col-lect” business model, the objective is to collect contractual cash flows; in the “hold to collect and sell” business model, the objective is achieved by both collecting contractual cash flows and selling financial assets; in the “trading” business model, the objective is achieved by actively trading in the financial assets. Determining the business model is based on estimat-ing, for example, how the profitability of the financial assets is assessed, how the risks of the operations are managed and how often and to what extent the assets are traded in.
The characteristics of the cash flows of the debt instruments are evaluated in the cash flow test. If contractual cash flows do not consist solely of payments of principal and interest (basic lending arrangement), the instrument in question is meas-ured at fair value through profit or loss. If the cash flows are subject to, for example, share prices or the debtor’s financial situation, it is not a basic lending arrangement. At Taaleri, such debt instruments mainly consist of mutual fund invest-ments, convertible bonds as well as profit-sharing and subordinated loans.
Investments in equity instruments are measured at fair value through profit or loss, meaning that changes in fair value, dividends, interest income, foreign exchange rate gains and losses as well as sales gains and losses are recognised in profit or loss. At the time of initial recognition, the management may make an irrevocable choice concerning a procedure according to which changes in fair value are recognised in other comprehensive income and will not later be recycled to profit or loss. In this case, dividend yields are recognised in profit or loss, but changes in fair value, foreign exchange rate gains and losses as well as sales gains and losses are recognised in other comprehensive income. Taaleri’s non-strategic investments will be measured according to this procedure at fair value in other comprehensive income without recycling. Taaleri does not have significant non-strategic investments.
Investments in financial assets are originally recognised at fair value, to which transaction expenses are added, except if the financial asset in question is recognised at fair value through profit or loss, in which case the transaction expense is recognised in expenditure. When recognising financial instrument purchase and sales contracts, the date of the transac-tion is used as the basis for recognition.
Financial assets are derecognised when the Group has lost its contractual right to receive cash flows or moved the risks and profits outside the Group to a significant extent.
HALF YEAR FINANCIAL REPORT 2018
Taaleri Plc ı Business ID 2234823-5 ı Registered office Helsinki ı www.taaleri.com 33
Cash and cash equivalents, which correspond to the “Receivables from credit institutions” item in the Group’s balance sheet, comprise call deposits and fixed deposits.
Financial liabilities
At the time of initial recognition, the Group’s financial liabilities are classified into those measured at fair value through profit or loss and those measured at amortised cost. The Group has not had any financial liabilities measured at fair value through profit or loss in the 2017 and 2018 financial periods.
Other loans are originally recognised at fair value, to which transaction expenses are added. Later, other loans are recog-nised at amortised cost using the effective interest method. Other liabilities are derecognised when their obligations have been met and their validity has expired.
Impairment
Impairments are based on an expected credit loss (ECL) model and impairments are recognised on all loans and debt instruments that are not measured at fair value through profit or loss, and on off-balance sheet liabilities.
Impairment is calculated using an individual credit risk calculation model based on the probability of default (PD), the loss given default (LGD), the exposure at default (EAD) and the maturity (M): ECL = PD * LGD * EAD * M(min 1 or M).2
For the purpose of impairment testing, assets to be tested are divided into three stages. On the first stage are instruments whose credit risk has not increased significantly; on the second stage are instruments whose credit risk has increased sig-nificantly; and on the third stage are instruments whose value has decreased. For instruments on the first stage, a loss allowance for 12 month expected credit losses is recorded. For instruments on the second and third stages, a loss allow-ance for lifetime expected credit losses is recognised. On every reporting date Taaleri estimates whether the credit risks of instruments has increased significantly compared to the credit risk at initial recognition, and based on this defines the ex-pected credit loss.
A significant increase in credit risk is estimated based on changes (or expected changes)3 in the credit rating. The credit rating is deemed to take into account sensible and reasonable information to the necessary extent. Additionally, the credit risk is estimated to have increased significantly if payments are over 30 days due.
The credit risk is deemed to have increased significantly if the counterparty’s credit rating declines as follows:
Investment grade, so from AAA – (BBB-) to (BB-) or less;
from BB+ – (BB-) to (B-) or less:
from B+ – (B-) to C rating or less.
The expected credit loss for loans measured at amortised cost is recognised in the P/L line item “Expected credit loss from financial assets measured at amortised cost” and booked against the book value of the loan. The expected credit loss for financial assets measured at fair value through other comprehensive income is recognised in the P/L line item “Net income from insurance, investment operations”, when the asset is part of the insurance business’ investment portfolio, and booked against the fair value reserve in other comprehensive income.
2.8 Assets and liabilities from insurance operations (extract)
Investment assets of insurance operations are measured either at fair value through other comprehensive income or at fair value through profit or loss, depending on the business model used for managing the financial assets and the characteris-tics of the cash flows of the financial assets in question. More detailed measurement principles are presented in Section 2.7 Financial assets and liabilities.
2.18 Accounting policies requiring management’s judgment and key uncertainties regarding estimations (extract)
The classification and measurement of financial assets require management consideration when, for example, assessing whether an equity instrument is strategic or non-strategic, based on which the instrument is measured either at fair value through profit or loss or at fair value through other comprehensive income without recycling. The determination of ex-pected credit losses requires management consideration when, for example, selecting impairment models and assess-ment methods for their parameters.
2 PD (probability of default) represents the other party’s probability of becoming insolvent within the next 12 months, LGD (loss given de-fault) represents the proportion of financial loss in a case of insolvency, and EAD (exposure at default) represents the amount of liability at the moment of insolvency. 3 If it, due to recently received information, is deemed that the credit rating on the reporting date doesn’t reflect all available information (i.e. the credit rating has not yet been updated), the increase in credit risk is estimated based on managements’ judgement.
HALF YEAR FINANCIAL REPORT 2018
Taaleri Plc ı Business ID 2234823-5 ı Registered office Helsinki ı www.taaleri.com 34
IFRS 15 Revenue from contracts with customers
The Group applies IFRS 15 Revenue from contracts with customers as of 1.1.2018. The new standard does not affect Taaleri’s revenue recognition principles. Revenue is recognised when (or as) the company transfers control of goods or services to a customer and the customer thus can control its use and receive benefit from it. IFRS 15 applies to different fee and commission income in the Group, but insurance income (to which IFRS 4 is applied) and financial instruments (to which IAS 39/IFRS 9 are applied) remain outside the scope of application. The Group does not have customer contracts, where the revenue recognition changes due to the implementation of the new standard. The new notes to the financial statements required in the standard are presented in the half year financial report and the financial statements of the full year.
IFRS 2 Share-based payments
Taaleri has applied amendments to IFRS 2 Share-based payments prospectively as of 1.1.2018. At Taaleri, as of 1 Janu-ary 2018, all share-based bonuses are recognised in equity at fair value at the moment of granting, and the expense is not measured at market value during the earning period. When a bonus is paid, its actual cost is recognised by adjusting the amount recognised in equity.
In accordance with the amended standard, share bonus plans are treated as arrangements fully paid in equity, and the expense is amortised according to the gross shares granted, even though the employee receives a net payment and the Group pays withholding tax to the tax authorities as a monetary payment. The withholding tax paid by the Group to the tax authorities is recognised directly in equity. The adoption of the IFRS 2 amendments increased the equity in Taaleri’s open-ing balance 2018 by EUR 783,000. The change in the measurement bases for transactions paid in cash has no significant effect on personnel costs in the reporting period.
IFRS 2 – accounting principles
The section “Management long-term remuneration” in Chapter 2.12 “Employee benefits” of Taaleri’s accounting policies has changed as of 1 January 2018 as described below.
2.12 Employee benefits
Management long-term remuneration
All full-time Taaleri Group employees in Finland (except for the Group CEO and Deputy CEO) belong to Taaleri Group’s remuneration fund (Taaleri Palkkiorahasto hr.). Part of the Group’s annual remuneration is transferred to the remuneration fund according to predefined criteria.
The Group uses long-term remuneration systems for personnel based on which persons belonging to them may receive a bonus settled in Taaleri shares or cash for work performed during the vesting period. Depending on the payment method, these remuneration programmes are recognised either in equity or as cash-settled share-based payment transactions.
Share-based employee benefits paid in equity are measured at fair value at the moment of granting. The amount recog-nised in expenditure is amortised in personnel costs and as an increase in equity during the vesting period. Also in ar-rangements settled in the net amount – in which the Group is obliged to pay withholding tax on the bonus to be paid, due to which part of the bonus earned is spent on paying taxes – the bonus earned is treated as an asset fully paid in equity instruments, despite the tax part paid in money.
The estimated number of shares to be implemented is checked quarterly. The possible effects of adjustments made to the original estimates are recognised in the income statement as personnel costs, and the corresponding adjustment is made in equity.
Conversion calculation for opening balances
Due to the adoption of the IFRS 9 Financial Instruments standard and amendments to the IFRS 2 Share-based Payment standard, Taaleri’s opening balances for the reporting period have changed. The changes are presented hereunder.
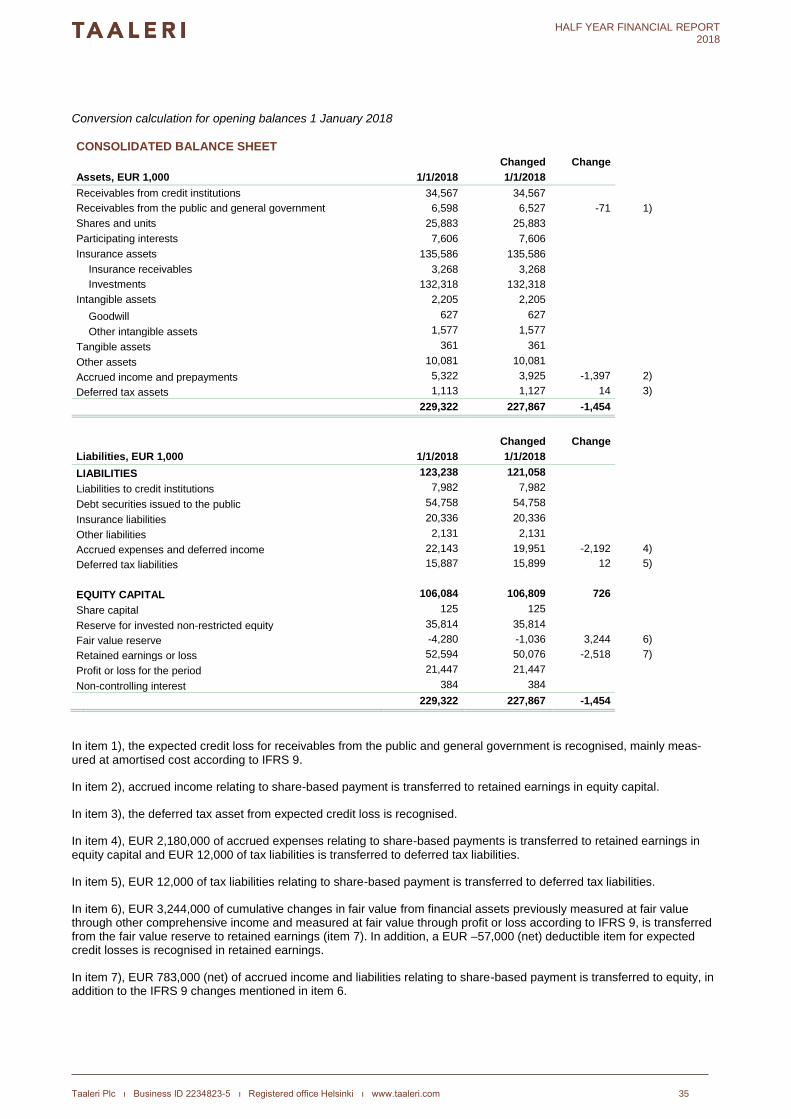
HALF YEAR FINANCIAL REPORT 2018
Taaleri Plc ı Business ID 2234823-5 ı Registered office Helsinki ı www.taaleri.com 35
Conversion calculation for opening balances 1 January 2018
CONSOLIDATED BALANCE SHEET
Changed Change
Assets, EUR 1,000 1/1/2018 1/1/2018
Receivables from credit institutions 34,567 34,567 Receivables from the public and general government 6,598 6,527 -71 1)
Shares and units 25,883 25,883 Participating interests 7,606 7,606 Insurance assets 135,586 135,586
Insurance receivables 3,268 3,268 Investments 132,318 132,318
Intangible assets 2,205 2,205
Goodwill 627 627
Other intangible assets 1,577 1,577
Tangible assets 361 361
Other assets 10,081 10,081
Accrued income and prepayments 5,322 3,925 -1,397 2)
Deferred tax assets 1,113 1,127 14 3)
229,322 227,867 -1,454
Changed Change
Liabilities, EUR 1,000 1/1/2018 1/1/2018
LIABILITIES 123,238 121,058
Liabilities to credit institutions 7,982 7,982
Debt securities issued to the public 54,758 54,758
Insurance liabilities 20,336 20,336
Other liabilities 2,131 2,131
Accrued expenses and deferred income 22,143 19,951 -2,192 4)
Deferred tax liabilities 15,887 15,899 12 5)
EQUITY CAPITAL 106,084 106,809 726
Share capital 125 125
Reserve for invested non-restricted equity 35,814 35,814
Fair value reserve -4,280 -1,036 3,244 6)
Retained earnings or loss 52,594 50,076 -2,518 7)
Profit or loss for the period 21,447 21,447
Non-controlling interest 384 384
229,322 227,867 -1,454
In item 1), the expected credit loss for receivables from the public and general government is recognised, mainly meas-ured at amortised cost according to IFRS 9.
In item 2), accrued income relating to share-based payment is transferred to retained earnings in equity capital.
In item 3), the deferred tax asset from expected credit loss is recognised.
In item 4), EUR 2,180,000 of accrued expenses relating to share-based payments is transferred to retained earnings in equity capital and EUR 12,000 of tax liabilities is transferred to deferred tax liabilities.
In item 5), EUR 12,000 of tax liabilities relating to share-based payment is transferred to deferred tax liabilities.
In item 6), EUR 3,244,000 of cumulative changes in fair value from financial assets previously measured at fair value through other comprehensive income and measured at fair value through profit or loss according to IFRS 9, is transferred from the fair value reserve to retained earnings (item 7). In addition, a EUR –57,000 (net) deductible item for expected credit losses is recognised in retained earnings.
In item 7), EUR 783,000 (net) of accrued income and liabilities relating to share-based payment is transferred to equity, in addition to the IFRS 9 changes mentioned in item 6.
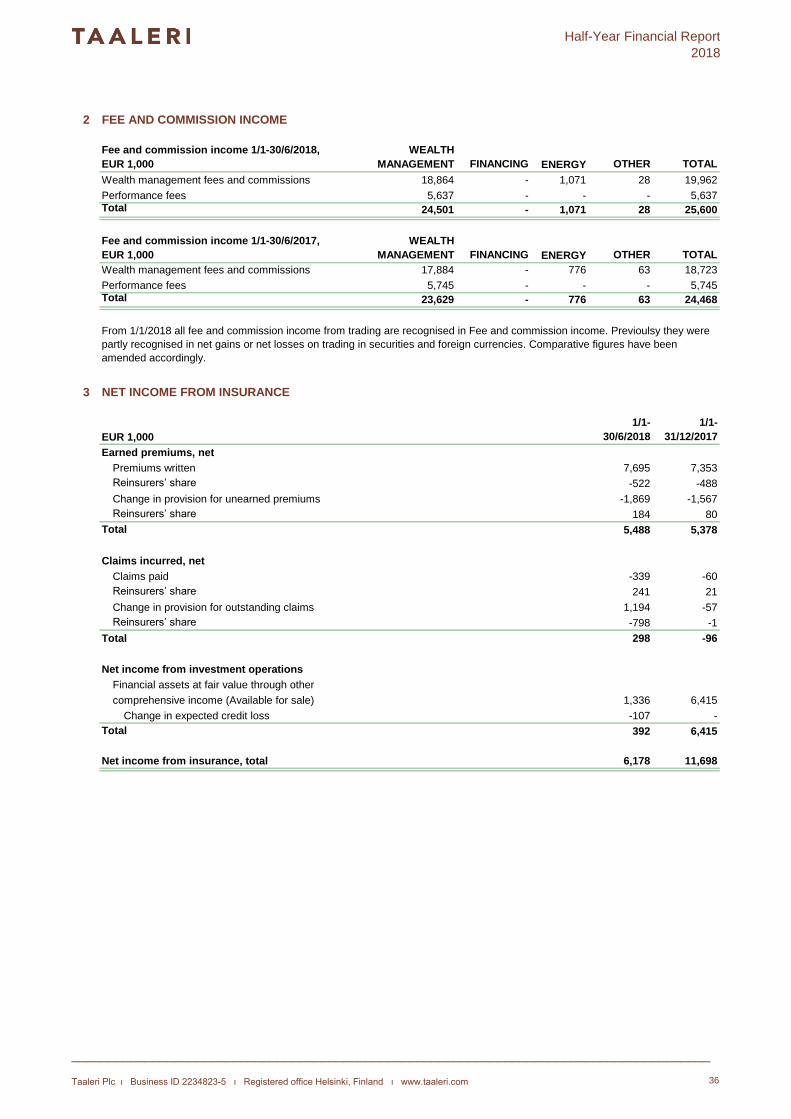
Half-Year Financial Report
2018
2 FEE AND COMMISSION INCOME
Fee and commission income 1/1-30/6/2018,
EUR 1,000
WEALTH
MANAGEMENT FINANCING ENERGY OTHER TOTAL
Wealth management fees and commissions 18,864 - 1,071 28 19,962
Performance fees 5,637 - - - 5,637Total 24,501 - 1,071 28 25,600
Fee and commission income 1/1-30/6/2017,
EUR 1,000
WEALTH
MANAGEMENT FINANCING ENERGY OTHER TOTAL
Wealth management fees and commissions 17,884 - 776 63 18,723
Performance fees 5,745 - - - 5,745Total 23,629 - 776 63 24,468
3 NET INCOME FROM INSURANCE
EUR 1,000
1/1-
30/6/2018
1/1-
31/12/2017
Earned premiums, net
Premiums written 7,695 7,353
Reinsurers’ share -522 -488
Change in provision for unearned premiums -1,869 -1,567
Reinsurers’ share 184 80
Total 5,488 5,378
Claims incurred, net
Claims paid -339 -60
Reinsurers’ share 241 21
Change in provision for outstanding claims 1,194 -57
Reinsurers’ share -798 -1
Total 298 -96
Net income from investment operations
Financial assets at fair value through other
comprehensive income (Available for sale) 1,336 6,415
Change in expected credit loss -107 -
Total 392 6,415
Net income from insurance, total 6,178 11,698
From 1/1/2018 all fee and commission income from trading are recognised in Fee and commission income. Previoulsy they were
partly recognised in net gains or net losses on trading in securities and foreign currencies. Comparative figures have been
amended accordingly.
_______________________________________________________________________________________
Taaleri Plc ı Business ID 2234823-5 ı Registered office Helsinki, Finland ı www.taaleri.com 36
Half-Year Financial Report
2018
4 NET GAINS OR NET LOSSES ON TRADING IN SECURITIES AND FOREIGN CURRENCIES
Net gains or net losses on trading in securities, EUR 1,000
1/1-
30/6/2018
1/1-
30/6/2017
From financial assets measured at fair value through profit or loss
Financial assets that need to be measured at fair value through profit or loss 621 258
Total 621 258
1/1-
30/6/2018
1/1-
30/6/2017
Net gains or net losses on trading in securities by type
From shares and units 621 124
Sales profit and loss 28 258
Changes in fair value 593 -134
Net gains or let losses on trading in securities, total 621 124
Net gains or net losses on trading in foreign currencies 192 223Total 813 347
5 INCOME FROM EQUITY INVESTMENTS
EUR 1,000 1/1-30/6/20181/1-30/6/2017
From financial assets measured at fair value through other comprehensive income - 1,741
Dividend income - 80
Profit or loss from divestments - 1,661
From group companies -2,240 -
Losses from divestment -2,240 -
From associated companies -101 128
Dividend income - 128
Profit or loss from divestments -101 -Total -2,341 1,869
6 INTEREST INCOME
EUR 1,000 1/1-30/6/20181/1-30/6/2017
Interest income from other loans and receivables
From receivables from credit institutions - 11
From receivables from the public and general government 377 316
Other interest income 1Total 378 328
7 OTHER OPERATING INCOME
EUR 1,000 1/1-30/6/20181/1-30/6/2017
Rental income 2 3
Project sales 4,294 -
Other income 297 10Total 4,593 13
Net gains or net losses on trading in securities and foreign currencies, EUR 1,000
_______________________________________________________________________________________
Taaleri Plc ı Business ID 2234823-5 ı Registered office Helsinki, Finland ı www.taaleri.com 37
Half-Year Financial Report
2018
8 CLASSIFICATION OF FINANCIAL ASSETS AND LIABILITIES
Financial assets and liabilities 30 June 2018, EUR 1 000
Financial assets Amortised cost Equity
instruments
Others Equity
instruments
Others Total Fair value
Receivables from credit institutions 1) 24,288 - - - - 24,288 24,288
Receivables from the public and general
government 1) 5,816 - - - 6,298 12,114 12,114
Shares and units - 496 - 13,517 - 14,013 14,013
Insurance assets - - 66,458 41,404 21,764 129,627 129,627
Other financial assets 18,148 - - - - 18,148
Financial assets total 48,252 496 66,458 54,921 28,063 198,190
Participating interests 10,778
Other than financial assets 17,827
Assets in total 30 June 2018 226,794
Financial liabilities Other
liabilities
Total Fair value
Liabilities to credit institutions 1) 7,489 7,489 7,489
Debt securities issued to the public 2) 54,786 54,786 58,659
Other financial liabilities 14,537 14,537
Financial liabilities total 76,813 76,813
Other than financial liabilities 40,343
Liabilities in total 30 June 2018117,156
Financial assets and liabilities 31 December 2017, EUR 1 000
Financial assets Loans and
receivables
Available-
for-sale
Total Fair value
Receivables from credit institutions 1) 34,567 34,567 34,567
Receivables from the public and general government 1) 6,198 400 6,598 6,598
Shares and units 20,470 5,413 25,883 25,883
Insurance assets 132,318 132,318 132,318
Other financial assets 11,819 11,819
Financial assets total 52,583 20,470 138,132 211,185
Participating interests 7,606
Other than financial assets 10,530
Assets in total 31 December 2017 229,322
Financial liabilities Other
liabilities
Total Fair value
Liabilities to credit institutions 1) 7,982 7,982 7,982
Debt securities issued to the public 2) 54,758 54,758 57,605
Other financial liabilities 16,424 16,424
Financial liabilities total 79,164 79,164
Other than financial liabilities 44,074
Liabilities in total 31 December 2017123,238
1) The carrying amount of these receivables and liabilities are seen as the best estimate of their fair values.
2) Bonds included in Debt securities issued to the public are carried at amortised cost.
At fair value through
other comprehensive
income
At fair value through profit
or loss
At fair value through
profit or loss
1) The carrying amount of these receivables and liabilities are seen as the best estimate of their fair values.
2) Bonds included in Debt securities issued to the public are carried at amortised cost.
At fair value
through profit
or loss
At fair value
through profit
or loss
_______________________________________________________________________________________
Taaleri Plc ı Business ID 2234823-5 ı Registered office Helsinki, Finland ı www.taaleri.com 38
Half-Year Financial Report
2018
9 FINANCIAL INSTRUMENTS MEASURED AT FAIR VALUE
Fair value
Fair value of assets 30 June 2018, EUR 1 000 Level 1 Level 2 Level 3 total
Receivables from credit institutions - 24,288 - 24,288
Receivables from the public and general government - 11,716 398 12,114
Shares and units 6,484 - 7,529 14,013
Insurance assets 124,795 - 4,832 129,627Total 131,279 11,716 12,759 180,041
Fair value
Fair value of liabilities 30 June 2018, EUR 1 000 Level 1 Level 2 Level 3 total
Liabilities to credit institutions - 7,489 - 7,489
Debt securities issued to the public - 58,659 - 58,659Total - 66,149 - 66,149
Fair value
Fair value of assets 31 December 2017, EUR 1 000 Level 1 Level 2 Level 3 total
Receivables from credit institutions - 34,567 - 34,567
Receivables from the public and general government - 6,198 400 6,598
Shares and units 20,470 - 5,413 25,883
Insurance assets 128,058 - 4,261 132,318Total 148,527 6,198 10,074 199,366
Fair value
Fair value of liabilities 31 December 2017, EUR 1 000 Level 1 Level 2 Level 3 total
Liabilities to credit institutions - 7,982 - 7,982
Debt securities issued to the public - 57,605 - 57,605Total - 65,588 - 65,588
Fair value hierarchy
Assets classified at level 3
Assets categorised within level 3 consist of unquoted shares in private equity funds, stocks and debt securities. Shares in private
equity funds are mainly measuered at the latest fair value received from the management company. Unquoted shares are
measured at fair value using discounted cash flow analysis or, if it is determined that fair value cannot be measured reliably, at
acquisition cost.
Level 1: Fair values are based on the prices quoted on the active market on identical assets or liabilities.
Level 2: Fair values are based on information other than quoted prices included within level 1 that are observable for the asset or
liability, either directly (from prices) or indirectly (derived from prices). When measuring the fair value of these instruments, Taaleri
Group uses generally accepted valuation models whose information is based to a significant degree on verifiable market
information.
Level 3: Fair values are based on information concerning an asset or liability, which is not based on verifiable market information.
Level 3 assets are mainly valued at a price received from an external party or, if no reliable fair value is available/determinable, at
purchase price.
_______________________________________________________________________________________
Taaleri Plc ı Business ID 2234823-5 ı Registered office Helsinki, Finland ı www.taaleri.com 39
Half-Year Financial Report
2018
Reconciliation of assets categorised within level 3, EUR 1 000 30/06/2018 31/12/2017
Fair value January 1 10,074 7,641
Purchases 1,782 3,652
Sales and deductions -464 -1,962
Change in fair value - income statement 762 -3
Change in fair value - comprehensive income statement -1 745
Change of associated company or subsidiary to an investment 607 -
Fair value at end of period 12,759 10,074
1/1-
30/6/2018
1/1-
31/12/2017
Net income from insurance 125 -
Net gains or net losses on trading in securities and foreign currencies 637 -Total 762 -
10 TANGIBLE ASSETS
EUR 1 000 30/06/2018 31/12/2017
Other tangible assets 787 361Total 787 361
1/1-
30/6/2018
1/1-
31/12/2017
Acquisition cost January 1 1,962 1,888
Additions 592 81
Deductions - 8
Acquisition cost at end of period 2,554 1,962
Accrued depreciation, amortisation and impairment January 1 1,601 1,385
Depreciation in the financial period 166 216
Accrued depreciation, amortisation and impairment at end of period 1,766 1,601
Book value on January 1 361 503
Book value at end of period 787 361
11 IMPAIRMENT LOSSES ON RECEIVABLES
1 000 euroa
Amortised
cost Total
ECL 1/1/2018 71 204 275
Additions due to purchases 5 104 109
Deductions due to derecognitions -1 -30 -31
Changes in risk parameters - 33 33
Recognised in profit or loss 4 107 111
ECL 30/6/2018 76 311 386
EUR 1 000
1/1-
30/6/2018
1/1-
31/12/2017
Expected credit losses from financial assets measured at amortised cost -4 -
Recognised in profit or loss -4 -
Unrealised gains or losses attributable to fair value measurements of assets or liabilities
categorised within level 3 held at the end of the reporting period recognised in profit or loss,
EUR 1 000
At fair value through
other comprehensive
income1)
All financial assets subject to ECL calculations are on level 1, i.e. the credit risk has not increased significantly. There are no
realised credit losses recognised in the presented financial periods.
1) Expected credit losses from financial assets measured at fair value through other comprehensive income all pertain to the
insurance business, and therefore the expected credit loss has been recognised in net income from insurance investment
operations. See note 3.
_______________________________________________________________________________________
Taaleri Plc ı Business ID 2234823-5 ı Registered office Helsinki, Finland ı www.taaleri.com 40
Half-Year Financial Report
2018
12 DEBT SECURITIES ISSUED TO THE PUBLIC
EUR 1 000 30/06/2018 31/12/2017
Publicly issued bonds 54,786 54,758Total 54,786 54,758
13 EQUITY CAPITAL
Share capital
Taaleri Plc has issued one bond in 2016 and two in 2014. The bond issued in 2016 is listed on the Nasdaq HEL Corporate Bond
market and the bonds issued in 2014 are listed on the Nasdaq First North Bond Market Finland. The bond 01/2014 with a capital
of EUR 10,000,000 was repaid in April 2017.
Further information about the bond programme can be found on the company’s website (only in Finnish):
www.taaleri.com/fi/investor-relations/velkasijoittajat.
The company’s share capital on 30 June 2018 was EUR 125 000 and the amount of shares 28 350 620. The company’s shares
do not have a nominal value. Taaleri Plc’s shares are traded on the Nasdaq Helsinki main market. The shares' trading code is
“TAALA” and ISIN code FI4000062195. The parent company possesses 45 000 of its own shares. All shares issued have been
paid for in full. The group uses share-based incentive schemes. The company has not issued convertible bonds or other than the
above-mentioned special rights.
_______________________________________________________________________________________
Taaleri Plc ı Business ID 2234823-5 ı Registered office Helsinki, Finland ı www.taaleri.com 41
Half-Year Financial Report
2018
14 INVESTMENTS IN SUBSIDIARIES
Changes in subsidiary shareholdings 1/1 - 30/6/2018
Subsidiary TT Canada RE Holding Corporation has in January subscribed to 85 % of the equity capital of Canadian
company Northern Lights Enterprises.
Taaleri Energia Oy had a directed share issue on 12 March 2018, due to which the Groups shareholding dropped
from 100 percent to 80.55 percent. The effect on the equity attributable to owners of the parent company is presented
in the table below.
In March three subsidiaries were incorporated: Taaleri Energia Holding S.a.r.l. in Luxembourg and TGE Taaleri LLC as well
as Taaleri Energia North America LLC both in the United States of America.
Changes in subsidiary shareholdings 2017
1/1-
30/6/2018
1/1-
31/12/2017
From an addition to the share owned in subsidiaries - -
397 53
Net effect on equity 397 53
There is not a material non-controlling interest in the group.
15 INVESTMENTS IN ASSOCIATED COMPANIES
Taaleri sold part of its share in Inderes Oy on 6 March 2018 and the Groups ownership decreased from 40 percent to 15 percent.
Inderes Oy has been been consolidated as an associated company until this date and after this as a strategic equity investment.
The Group purchased 47 % of the shares in Munkkiniemi Group Oy established in March, and on 11 June 2018 the Group
acquired 48.15 % of the shares in Turun Toriparkki Oy in a directed share issue. Both are consolidated in the Group as associated
companies from the acquisition date. On 30 June 2018 the group had four associated companies; Fellow Finance Plc, Ficolo Oy,
Munkkiniemi Group Oy and Turun Toriparkki Oy. Neither of these is considered material to the group. All associated companies
are consolidated using the equity method. A total of EUR 261 thousand of profit from continuing operations of the associated
companies has been recognised in the Group in the income statement item 'Share of associates' profit or loss'. The associated
companies have neither discontinued operations nor comprehensive income items.
Effects on the equity attributable to owners of the parent of any changes in its ownership
interest in a subsidiary that do not result in a loss of control, EUR 1 000
From a reduction in the share owned in subsidiaries, without loss of control
On 19 September 2017 the Group acquired 38.85 percent of Ficolo Oy, which has since been consolidated as an associated
company. There were no other changes in investments in associated companies during 2017. Hence, on 31 December 2017 the
group had three associated companies; Fellow Finance Plc, Inderes Oy and Ficolo Oy.
In August a 7 percent share of subsidiary Bonus Solutions Oy was sold after which the group’s shareholding is 68 percent.
Also during the financial period, the group discontinued, established and purchased shares in a range of small companies, mainly
in relation to its private equity fund operations.
In May the subsidiary Taaleri Energia Funds Management Ltd, was established and in June the subsidiary TT Canada RE Holding
Corporation was established in Canada.
In december the demerger of Taaleri Sijoitus Oy was completed, as a result of which the 100 % ownership of Taaleri Energia
Operations Oy was transfered to Taaleri Energia Oy from Taaleri Sijoitus Oy. The demerger had no effect on the group's own
capital.
Also during the financial period, the group discontinued, established and purchased shares in a range of small companies, mainly
in relation to its private equity fund operations.
The group has on 31 December 2017 sold a 66 percent share of its former subsidiary Taaleri Portföy Yönetimi A.Ş. at a sales
price of TRY 1.65 million (EUR 363 thousand). A loss of EUR 0.7 million was recognized in the income statement item “Income
from equity investments”. The group’s shareholding after the sale is 18.83 percent. The shareholding is included in the balance
sheet item “Shares and units” on 31 December 2017. The sale of the company is subject to approval by the Turkish authorities.
During the financial period, there were no other changes in subsidiary shareholdings that would have led to a change in ownership
interest without a loss of control. The effect of all minority shareholder transactions on the equity of parent company is presented
in the table below.
_______________________________________________________________________________________
Taaleri Plc ı Business ID 2234823-5 ı Registered office Helsinki, Finland ı www.taaleri.com 42
Half-Year Financial Report
2018
16 CONDITIONAL LIABILITIES AND CONTINGENT LIABILITIES
Commitments not recognised as liabilities, EUR 1 000 30/06/2018 31/12/2017
Total gross exposures of guarantee insurance 1,595,010 1,491,279
Guarantees 2,000 219
Investment commitments 15,353 14,874
Pledged securities 12,500 13,333
Credit limits (unused) 10,000 10,000Total 1,634,863 1,529,706
17 OPERATING LEASES
The total of future minimum lease payments under non-cancellable operating leases
EUR 1,000 30/06/2018 30/06/2017
Within one year 1,711 1,616
In over one year and within five years maximum 5,139 5,766Total 6,850 7,382
Garantia has received information that a matter concerning a potential insurance event and a EUR 5 million claim with penalty
consequences and legal fees has become pending in the Helsinki District Court. The insurance claim concerns a pension fund
which was a loan guaranty customer of Garantia in 2011 and which was placed in liquidation in December 2011 under the
Pension fund act (1164/1992, as amended), related to which Garantia originally received a claim on 30 December 2011. Garantia
considers that the claim is still unfounded which is why it has not been entered in the profit and loss account as a provision for
outstanding claims.
The group has leased the office premises it uses. The lengths of lease agreements vary from one to three years, and they
normally include the possibility to extend the agreement after the original date of expiry. Some companies in the group have also
leased cars and office machinery through leasing agreements. Of the above-mentioned items, EUR 1.1 million in leasing
expenses was recorded in other operating costs per 30 June 2018 (EUR 1.0 million in 1-6/2017).
_______________________________________________________________________________________
Taaleri Plc ı Business ID 2234823-5 ı Registered office Helsinki, Finland ı www.taaleri.com 43
Half-Year Financial Report
2018
18 RELATED PARTY DISCLOSURES
The following belong to the company’s related parties:
Related party transactions with associated companies and related parties, EUR 1 000
1/1-30/6/2018 Sales Purchases Receivables Liabilities
Associated companies 805 13 9,917 -
Other related parties 148 - 4,665 -
1/1-30/6/2017 Sales Purchases Receivables Liabilities
Associated companies 348 45 4,711 -
Other related parties 112 10 4,158 -
The parent company and its subsidiaries and associated companies belong to the group’s related parties. Related parties also
include the members of the Board of Directors and the executive board as well as their related parties.
1) Someone who, by virtue of shareholding, options or convertible bonds has or may have at least 20 percent of the company’s
stocks or shares, or the voting rights attached to them, or a corresponding shareholding or voting right in an organisation
belonging to the group, or in an organisation exercising control in the company, unless the significance of the company that is the
subject of ownership is minor in terms of the whole group.
2) A member and deputy member of the Board of Directors, CEO and Deputy CEO, and somebody in a similar position in a
company as referred to in point 1.
3) The children and spouse of someone as referred to in point 2, or someone in a marital relationship with that person.
4) An organisation and foundation in which an above-mentioned person, either alone or with another person, has control as
specified in Chapter 1, Paragraph 5 of the Accounting Act.
Business transactions made with the company and companies belonging to the group have been carried out on terms equivalent
to those that prevail in arm's length transactions.
Board member Peter Fagernäs is among the 10 largest shareholders of the company through a company he owns. The
company’s CEO Juhani Elomaa, Deputy CEO Karri Haaparinne and member of the Executive Board Petri Lampinen are also
amongst the company’s 10 largest shareholders.
Garantia has, in the course of its normal business, granted guarentees amounting to EUR 10 million to related parties.
_______________________________________________________________________________________
Taaleri Plc ı Business ID 2234823-5 ı Registered office Helsinki, Finland ı www.taaleri.com 44
Half-Year Financial Report
2018
TAALERI IN BRIEF
Taaleri is a Finnish financial service company, whose parent company Taaleri Plc is listed on Nasdaq
Helsinki's main market. The Taaleri Group comprises three business areas: Wealth Management,
Financing, and Energy. Taaleri provides services to institutional investors, companies and private
individuals. The Group’s operational subsidiaries are: Taaleri Wealth Management Ltd and its subsidiaries,
Taaleri Private Equity Funds Group, Taaleri Investments Group, Taaleri Energia Oy Group and Garantia
Insurance Company Ltd. In addition, Taaleri has associated companies Fellow Finance Plc, which offers
peer-to-peer lending services, Ficolo Oy developing data centers, and Turun Toriparkki Oy and
Munkkiniemi Group Oy that are real estate project companies.
At the end of June 2018, Taaleri had assets under management totalling EUR 6.0 billion and 4,600 asset
management customers. Taaleri Plc has some 4,100 shareholders. Taaleri’s operations are supervised by
the Finnish Financial Supervisory Authority.
More information about our company and services: www.taaleri.com
_______________________________________________________________________________________
Taaleri Plc ı Business ID 2234823-5 ı Registered office Helsinki, Finland ı www.taaleri.com 45