Embed Size (px)
Citation preview
MANAGEMENT AND CORPORATE GOVERNANCE
MANAGEMENT STRUCTURE
The following chart shows our management reporting structure:
Board of Directors Mr. Kenneth Dark (Chairman and Non-Executive Director)
Mr. Peter Bond (Chief Executive Officer and Managing Director)Mr. Craig Ricato (Non-Executive Director)
Mr. Jon Mathews (Non-Executive Independent Director)Mr. Lim Ah Doo (Non-Executive Lead Independent Director)
Mr. Koh Ban Heng (Non-Executive Independent Director)
Chief Executive Officer and Managing Director Mr. Peter Bond
Mr. StuartJones
Chief FinancialOfficer
Mr. John DAnderson
ChiefCommercialand Legal
Officer
Mr. ScottBroussard
President, Oil &Gas
Mr. Adam BondPresident, Clean
Energy
Mr. DonaldSchofield
President,SAPEX
Mr. Michael MappPresident, Coal
OUR DIRECTORS
Our board of directors has ultimate responsibility for the administration of the affairs of ourCompany. Our directors are as follows:
Name Age Address Position
Mr. Kenneth Dark . . . . . 70 Smellie & Co Building32 Edward StreetBrisbane, Queensland4000, Australia
Chairman and Non-ExecutiveDirector
Mr. Peter Bond .. . . . . . . 51 Smellie & Co Building32 Edward StreetBrisbane, Queensland4000, Australia
Chief Executive Officer andManaging Director
Mr. Craig Ricato . . . . . . . 43 Smellie & Co Building32 Edward StreetBrisbane, Queensland4000, Australia
Non-Executive Director
Mr. Lim Ah Doo.. . . . . . . 64 10 Anson Road#23-13International PlazaSingapore 079903
Non-Executive Lead IndependentDirector
Mr. Jon Mathews .. . . . . 62 Smellie & Co Building32 Edward StreetBrisbane, Queensland4000, Australia
Non-Executive IndependentDirector
Mr. Koh Ban Heng .. . . 65 One Temasek Avenue#27-00 Millenia TowerSingapore 039192
Non-Executive IndependentDirector
182
For
per
sona
l use
onl
y
Experience of our Directors
Information on the areas of responsibility, the business and working experience of ourdirectors is set out below:
Mr. Kenneth Dark is our Chairman and Non-Executive Director. Mr. Dark was appointed toour Board of Directors in October 2004 and has been Chairman since September 2011.Mr. Dark began his early working life as an electrician before gaining tertiary engineeringqualifications in the field of electronics and communications at NSW TAFE. Further study sawMr. Dark promoted to a management role at Alcan Aluminium Limited’s Australian smelter.Mr. Dark’s final role at Alcan Aluminium Limited saw him managing the in-plant multi-disciplined project engineering team. At that time, projects included world-leading innovationsin industrial process control. Concepts Mr. Dark pioneered then are still the mainstay ofprocess control for the international aluminium smelting industry.
In 1986, Mr. Dark left the corporate world and established a highly successful business in thefuel distribution and retail industry through his wholly-owned Darton group of companies.These entities purchase motor spirits for the retail market from BP plc and distributes and on-sells them to third parties. The Darton group of companies would also be responsible forproviding trucking services for delivery of such motor spirits to third party purchasers. He hasrepresented fuel distributors and retailers, chairing the national marketing committees for twomajor fuel companies and leading the national franchise negotiation committee to thesuccessful renewal of contracts with one of the oil majors. He then went on to built a smallchain of independent fuel and grocery outlets, a business in which he continues to maintainan interest. Mr. Dark’s other business pursuits include time spent providing freelancemanagement consulting. Mr. Dark has completed the Australian Institute of CompanyDirectors course and is admitted as a Graduate member.
Mr. Peter Bond is our Chief Executive Officer and Managing Director. Mr. Bond has asuccessful track record in the coal and mining industries, both in Australia and overseas. Hisbusiness interests include mineral, mining and associated operations in Australia and SouthEast Asia. Mr. Bond was appointed to our Board in October 2004 and has been pivotal to oursuccess since we listed on the ASX in May 2006. He has personally seen our Companyevolve from a small-capitalisation business into an ASX 200 company, and seen ourCompany grow in talent from a small team to over 400 employees around the world. Over theyears he has also owned and managed other of his own companies such as Bond BrosContracting Pty Ltd and P.A. Bond & Co Pty Limited. Between 1982 and 1993, Mr. Bond wasthe managing director of his wholly-owned P.A. Bond & Co. Pty Limited which carried outcontract coal processing operations. He was thereafter a director at SADA Pty. Limited, acompany involved in coal processing between 1993 to 2002 and a managing director in hiswholly-owned company, Ironwork (Elsmore) Pty Ltd, which is involved in ironwork between1993 and 2003.
Building on his early engineering background as a metallurgist trainee in the early 80s,Mr. Bond has gained a unique knowledge and understanding of the industry over the courseof a diversified career spanning more than 20 years. Mr. Bond has experience in the design,installation, commissioning and operation of complex processing plants and projects, and hisvarious companies such as Auminco Mineral Processing Pty Ltd and, Ore Pro Pty Ltd whichwere involved in the carrying out of mineral processing and microwave iron pellet kilntechnology businesses.
Mr. Craig Ricato is our Non-Executive Director. He brings a broad range of internationalexperience to our Company across the regulatory, accounting and legal industries. Mr. Ricatojoined our Company in March 2008 as General Counsel and Company Secretary, and wasappointed to our Board in late 2010. He was previously our Executive Director of Legal andCorporate Affairs, where he was responsible for all transactional and corporate legal matters,including the management of an engagement and negotiation of all key commercial and
183
For
per
sona
l use
onl
y
regulatory matters. Prior to joining us, Mr. Ricato was a partner at Hemming + Hart Lawyersfrom February 2006 to March 2008, and a senior associate at Mallesons Stephen Jacquesfrom January 2001 to February 2006, both in the area of dispute resolution and constructionlaw. He was an assistant manager in the forensic accounting practice at KPMG from early2000 to January 2001. Mr. Ricato also served as a police officer of the Queensland PoliceService for eight years from 1992.
Mr. Ricato is currently a professional member of the Queensland Law Society. He wasadmitted as a Legal Practitioner of the Supreme Court of New South Wales and the SupremeCourt of Queensland in 2001 after graduating with a Bachelor of Laws with First ClassHonours from the Queensland University of Technology. Mr. Ricato had also obtained aBachelor of Commerce degree in 1991 from University of Queensland.
Mr. Lim Ah Doo was appointed Non-Executive Lead Independent Director of our Companyon 22 November 2013. Mr. Lim is an independent director and chairman of the auditcommittees of Sembcorp Marine Ltd, GP Industries Limited and ARA-CWT TrustManagement (Cache) Limited, (all of which are listed on the SGX-ST). He is also anindependent director of SM Investments Corporation (a company listed on the PhilippineStock Exchange), an independent director, member of the audit committee and chairman ofthe nominating committee of Sateri Holdings Limited (a company listed on the Hong KongStock Exchange), and an independent director, chairman of the audit committee and memberof the remuneration committee of U Mobile Sdn Berhad.
Mr. Lim brings with him vast experience and wide knowledge as a former senior banker andcorporate executive. He held several key positions in Morgan Grenfell during his 18-yearbanking career with Morgan Grenfell (Asia) Limited (“MGAL”) from 1977 to 1995 including hisappointment as its Chairman and Managing Director in 1993, a position which he held until heleft MGAL in 1995. From 2003 to 2008, he was the president and subsequently non-executivevice chairman of RGE Pte. Ltd., formerly known as RGM International Pte. Ltd., a leadingglobal resource-based group. Mr. Lim was formerly an independent commissioner andchairman of the audit committee of PT Indosat Tbk, a leading listed Indonesiantelecommunications group. Mr. Lim previously held directorships in EDB Investments Pte.Ltd., PST Management Pte. Ltd. and Chemoil Energy Limited. He also represented RGE Pte.Ltd. as a council member of the Singapore-Shandong Business Council and Singapore-Jiangsu Co-operation Council, and served as chairman of EDBV Management Pte. Ltd. from2005 to 2006 and the Singapore Investment Banking Association in 1994 (as representativeof Morgan Grenfell (Asia) Limited).
Mr. Lim holds an honours degree in engineering from the Queen Mary College, University ofLondon and a Master in Business Administration degree from the Cranfield Institute ofTechnology.
Mr. Jon Mathews is our Non-Executive Independent Director. Mr. Jon Mathews joined ourCompany in December 2009. He brings to our Company over 30 years of experience in thecoal mining industry prior to joining us. Between 1971 and 1973 he was employed by theQueensland Coal Association as a Cadet Mine Manager. From 1976 to 1996 he wasemployed at Rhondda Collieries, Ipswich, holding positions through all facets of mining. Hebecame the Mine Manager of MW Haenke Mines in 1980, which at the time was the largestunderground producing operation in Queensland and from 1986 to 1996 progressed to theposition of Company Manager Qld.
During his period at Rhondda Collieries he worked for various companies who owned themining operation including Bond Coal Division, FAI mining Limited and Oceanic Coal Pty Ltd.He was also responsible during this period for ensuring the success of a joint venturepartnership with a Japanese company, Showa Coal Australia, between 1986 and 1996.Between 2001 and 2009, he was a self-employed consultant to the coal mining, transport andwaste industries.
184
For
per
sona
l use
onl
y
Mr. Mathews was a member of the Executive Committee of the Queensland Coal Associationbetween 1987 and 1996, he also served as Chairman of the Underground Mine ManagersCommittee for three years and was also a member of the selection panel for Cadet MineManager for Queensland.
Between 1987 and 1996, Mr. Mathews served as a director of West Moreton Coal Exportersbetween 1987 and 1996, and a Director of Parkhead Rail Terminal for the same period.Mr. Mathews obtained his unlimited first-class mine manager’s certificate of competency(coal) (opencut and underground) in 1975.
Mr. Koh Ban Heng was appointed Non-Executive Independent Director of our Company on22 November 2013. Mr. Koh started his career in the oil industry in 1972 with the then MobilOil Singapore as an operations engineer. In 1974, he joined Singapore Petroleum CompanyLimited where he held various positions throughout the years. Mr. Koh was appointed as theChief Executive Officer and Executive Director of Singapore Petroleum Company Limited in2003, and subsequently appointed Chief Executive Officer and Managing Director in March2009. He retired as Chief Executive Officer and Managing Director on 30 June 2011 and wasthen appointed as Senior Advisor from 1 July 2011. Mr. Koh’s experience spans aspects suchas refining operations and planning, marketing, distribution and terminalling, supply andtrading, oil and gas exploration and production, including the development and establishmentof new businesses. Mr. Koh currently holds directorships in Singapore Petroleum VenturePrivate Limited and Singapore Refining Company Private Limited. Mr. Koh is also anindependent director of Keppel Infrastructure Holding Pte. Ltd., a fully owned subsidiary ofKeppel Corporation Limited which is listed on the SGX-ST, and an independent director ofTipco Asphalt PLC, a listed company in Thailand. Mr. Koh is a director on the school boardsof Chung Cheng High School Main, Chung Cheng High School Yishun and Nanyang JuniorCollege. He also serves as the Chairman of the Asean Council on Petroleum for Singapore,as appointed by Keppel Corporation Limited which is a member of the Asean Council onPetroleum.
Mr. Koh graduated from the then University of Singapore with a Bachelor of Sciences degreein 1972 and obtained a post-graduate diploma in Business Administration from the thenUniversity of Singapore in 1978.
As evidenced by their respective business and working experience set out above, ourDirectors possess the appropriate expertise to act as directors of our Company. Inaccordance with the requirements under the SGX-ST listing rules, we have madearrangements for our Directors to be briefed on the roles and responsibilities of a director of apublic listed company in Singapore.
Other Principal Directorships of our Directors
The list of present and past directorships held by our Directors in the last five years precedingthe date of this offering document, excluding those held in our Company, is set out in“Appendix E—List of Present and Past Directorships—Directors”.
Interest in Shares
As at the date of this offering document, Mr. Peter Bond, Mr. Kenneth Dark, Mr. Craig Ricatoand Mr. Jon Mathews each holds interests in our Shares. For further details as to ourDirectors’ interests in our Shares, see “Share Ownership—Ownership Structure”.
Service Agreements
Our Group has entered into the following service agreements with our Directors:
‰ in relation to Mr. Peter Bond, with a company that Mr. Peter Bond is the sole shareholderand director, Newtron for the period 1 January 2010 to 31 December 2013, subject to
185
For
per
sona
l use
onl
y
renewal. This tenure of three years is determined by our Company taking intoconsideration the typical tenure for service agreements entered into with other Companyexecutives. Upon expiry, it is expected that each renewal will be for a further tenure ofthree years. He will be eligible to participate in our Company’s Performance Rights Plan.If the agreement is terminated for our convenience or by Newtron if there is a change ofcontrol of our Company (which is defined under Section 50AA of the Corporations Act asa change to the person or entity that has the capacity to determine the outcome ofdecision of our financial and operating policies), Mr. Bond will be entitled to the accruedamount of his management fee for the unexpired period of the entire term upontermination. The agreement may be terminated by our Company at any time by giving sixmonths written notice to Newtron. Apart from this management fee, Mr. Bond is notentitled to any other lump sum in the event of termination of his service agreement; and
‰ in relation to Mr. Craig Ricato with a professional contracting entity, the ExecutiveManagement Services Discretionary Trust for the provision of executive serviceseffective 1 July 2013 on an as-needed basis. There is no fixed term in the agreement.Mr. Ricato, with 14 days notice period in writing, will be entitled to any outstandingservice fees and/or expenses as at the date of termination, and if the agreement isterminated before 31 December 2013, a pro-rated amount of a retainer fee is due to himunder the agreement. Corresponding, we may terminate this agreement by, amongothers, providing 14 days written notice to Mr. Craig Ricato. Apart from this retainer fee,Mr. Ricato is not entitled to any other lump sum in the event of termination of his serviceagreement. This agreement was entered into when Mr. Craig Ricato stepped down fromhis full time role as executive director to non-executive director to pursue otheropportunities. In connection with his decision to step down, our Board had requested thathe continue to assist our Company given his experience and familiarity with us, which hehad acquired while carrying out his role as executive director previously. On this basis,there was no fixed term for the agreement. See “Interested Person Transactions andConflicts of Interest—Interested Person Transactions—Present and Ongoing InterestedPerson Transactions—Transactions with Directors—Mr. Craig Ricato” for further detailson this agreement.
Except as disclosed above, there are no existing or proposed service agreements enteredinto or to be entered into by our Directors with our Company or any of our subsidiaries.
Terms of Office
Our Directors do not currently have a fixed term of office. A director must not hold office (withoutre-election) past the third annual general meeting following that Director’s appointment or threeyears. A retiring director shall be eligible for re-election. We must hold an election of Directorseach year and if no election of Directors is otherwise scheduled to occur at an annual generalmeeting, then one Director must retire from office in that annual general meeting. The Director(other than a Director who is a Managing Director) to retire pursuant to which shall be the onewho has been longest in office since his last re-election or appointment.
186
For
per
sona
l use
onl
y
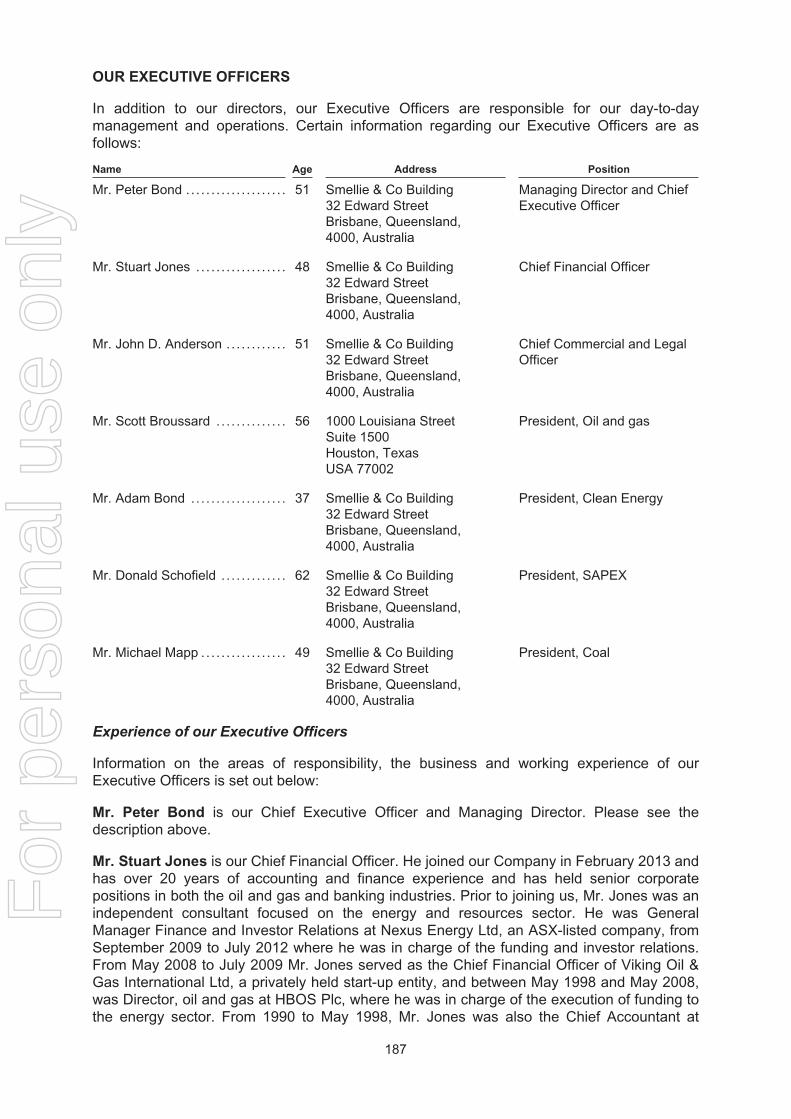
OUR EXECUTIVE OFFICERS
In addition to our directors, our Executive Officers are responsible for our day-to-daymanagement and operations. Certain information regarding our Executive Officers are asfollows:
Name Age Address Position
Mr. Peter Bond .. . . . . . . . . . . . . . . . . . . 51 Smellie & Co Building32 Edward StreetBrisbane, Queensland,4000, Australia
Managing Director and ChiefExecutive Officer
Mr. Stuart Jones . . . . . . . . . . . . . . . . . . 48 Smellie & Co Building32 Edward StreetBrisbane, Queensland,4000, Australia
Chief Financial Officer
Mr. John D. Anderson .. . . . . . . . . . . 51 Smellie & Co Building32 Edward StreetBrisbane, Queensland,4000, Australia
Chief Commercial and LegalOfficer
Mr. Scott Broussard . . . . . . . . . . . . . . 56 1000 Louisiana StreetSuite 1500Houston, TexasUSA 77002
President, Oil and gas
Mr. Adam Bond .. . . . . . . . . . . . . . . . . . 37 Smellie & Co Building32 Edward StreetBrisbane, Queensland,4000, Australia
President, Clean Energy
Mr. Donald Schofield . . . . . . . . . . . . . 62 Smellie & Co Building32 Edward StreetBrisbane, Queensland,4000, Australia
President, SAPEX
Mr. Michael Mapp .. . . . . . . . . . . . . . . . 49 Smellie & Co Building32 Edward StreetBrisbane, Queensland,4000, Australia
President, Coal
Experience of our Executive Officers
Information on the areas of responsibility, the business and working experience of ourExecutive Officers is set out below:
Mr. Peter Bond is our Chief Executive Officer and Managing Director. Please see thedescription above.
Mr. Stuart Jones is our Chief Financial Officer. He joined our Company in February 2013 andhas over 20 years of accounting and finance experience and has held senior corporatepositions in both the oil and gas and banking industries. Prior to joining us, Mr. Jones was anindependent consultant focused on the energy and resources sector. He was GeneralManager Finance and Investor Relations at Nexus Energy Ltd, an ASX-listed company, fromSeptember 2009 to July 2012 where he was in charge of the funding and investor relations.From May 2008 to July 2009 Mr. Jones served as the Chief Financial Officer of Viking Oil &Gas International Ltd, a privately held start-up entity, and between May 1998 and May 2008,was Director, oil and gas at HBOS Plc, where he was in charge of the execution of funding tothe energy sector. From 1990 to May 1998, Mr. Jones was also the Chief Accountant at
187
For
per
sona
l use
onl
y
Sanctuary Group where he was responsible for overall finance, funding and treasury matters.Mr. Jones obtained a Bachelor of Science (Mathematics) (with Honours) from the Universityof Liverpool in 1987 and obtained his ACCA Certificate, UK for July 1998 to February 2011.
Mr. John D. Anderson is our Chief Commercial and Legal Officer. Mr. Anderson wasappointed to his position in our Company effective from July 2013, and is responsible for allglobal commercial and legal functions including intellectual property management. Prior tojoining our Company, he founded BKK Partners, an Australian based investment bank andcorporate advisory firm focusing on resource, oil and gas in 2009. From 2003 to 2009 heworked with Goldman Sachs JBWere, Sydney, holding various positions including, ExecutiveDirector, Managing Director, Head of Financial Institutions Group, an Advisor, and from 1999to 2003 he was an Executive Director for Goldman Sachs Hong Kong. Prior to joiningGoldman Sachs, Mr. Anderson served as an associate foreign counsel with Davis Polk &Wardwell in Hong Kong from 1994 to 1999 where he focused on international capital marketsand mergers and acquisitions. Mr. Anderson obtained his Juris Doctor from the University ofMichigan Law School in 1986 where he graduated with a Magna Cum Laude, and a Bachelorof Arts from Albion College in 1983.
Mr. Scott Broussard is our President, Oil and gas. Mr. Broussard has over 30 years ofexecutive and operations experience in the Gulf Coast oil and gas business. He joined ourCompany in October 2011 where he served as General Manager of the Gulf Coast Region.From 2008 to late 2010, Mr. Broussard acted as chief executive officer and chairman of ProbeResources Ltd., an exploration and production company with assets in the Gulf of Mexico,United States listed on the Toronto Stock Exchange. Mr. Broussard was the vice president ofoperations at Norsk Hydro between January 2005 and December 2006, and from March 1998to December 2005, he was also vice president operations of Hydro Gulf of Mexico, formerlySpinnaker Exploration, where he supervised all phases of the oil and gas operations in the U.S.Gulf of Mexico region. He was also previously a partner from 1995 to 1998 in an engineeringconsulting firm, HTK Consultants, which that provided engineering and operations expertise,both offshore and onshore, on the Gulf Coast. Mr. Broussard obtained his Bachelor of Sciencedegree in petroleum engineering from Louisiana State University in 1982.
Mr. Adam Bond is our President, Clean Energy. Mr. Bond joined our Company as President,European Operations in 2011. He is now President of the Clean Energy department, wherehe is responsible for the execution and deployment of our Clean Energy strategy globally,including UCG to GTL projects. Mr. Bond has a commercial background in leading andexecuting large, complex infrastructure projects. Prior to joining us, Mr. Bond held keypositions with the British Government as Project Director on the United Kingdom’s first carboncapture and storage programme from October 2009 to July 2011. From May 2002 to October2009, Mr. Bond was an Associate Director in charge of project finance and corporate advisoryservices with Ernst & Young LLP, and was also previously a manager at Arthur Andersen—Brisbane from February 1999 to May 2002. Mr. Bond is presently a Non-Executive Director ofAFC Energy PLC. He obtained his Bachelor of Commerce in 1997 and his Bachelor of Lawsin 1998, both from the University of Queensland, and his Masters of Taxation from theUniversity of New South Wales in 2002.
Mr. Donald Schofield is our President, SAPEX. Mr. Schofield joined our Company in 2007as General Manager of our UCG business. Mr. Schofield was based in the United States asPresident of Linc Energy Operations Inc in 2010 and assumed the role of President of SAPEXin 2012. Between January 2004 and May 2007, Mr. Schofield was the Managing Director ofWhite Sands Petroleum Limited a petroleum exploration company. Between April 2002 andFebruary 2004, he was the Managing Director of OME Group Ltd which is involved in drillingoperations and petroleum exploration, and General Manager of A.J. Lucas Ltd from 2001 to2002 which was involved in directional drilling in large construction products and undergroundmine. Between 1994 and 2011, he was also an independent consultant on drilling, oil and gasand mining projects. Mr. Schofield was also appointed the director of Australian
188
For
per
sona
l use
onl
y
Oceanographics Pty. Ltd. in May 2009. Mr. Schofield obtained a Bachelor of Science(Geology) in 1973 and a Masters of Arts (Marine Geology) in May 1980.
Mr. Michael Mapp is our President, Coal. Mr. Mapp joined our Company in February 2012 asthe President of our conventional coal mining business. Mr. Mapp joined our Company fromIntra Energy Corporation Ltd where he held the position of Chief Operating Officer from May2011 to February 2012. Prior to Intra Energy Corporation Ltd, he worked at Xstrata Coal asOperations Manager of Ulan underground until May 2011. Between 2007 and 2010 heworked in various positions in Vale Australia including General Manager of the Integra CoalOperations and Executive General Manager of the NSW Operations before being promoted toDirector of the coal operations in Australia. Mr. Mapp was responsible for operations includingCarborough Downs, Isaac Plains, Broadlea and the Integra Coal underground and open-cutmines at Vale Australia. Between December 2005 and May 2007, he was General Managerof Integra Coal Operations with AMCI Holdings. Between 2009 and 2010, Mr. Mapp was anexecutive committee member of the New South Wales Minerals Council.
Other Principal Directorships of our Executive Officers
The list of present and past directorships held by our Directors in the last five years precedingthe date of this offering document, excluding those held in our Company, is set out in“Appendix E—List of Present and Past Directorships—Executive Officers”.
FAMILY RELATIONSHIPS
There are no family relationships between any of our Directors and Executive Officers andbetween our Directors and Executive Officers and our Substantial Shareholders.
INDEPENDENT DIRECTORS
None of our Non-Executive Independent Directors sits on the boards of our principalsubsidiaries that are based in jurisdictions other than Singapore.
ARRANGEMENTS OR UNDERSTANDING
None of our Directors or Executive Officers has any arrangement or understanding with anyof our Substantial Shareholders, customers or suppliers or other persons, pursuant to whichhe or she was appointed as our Director or Executive Officer, as the case may be.
189
For
per
sona
l use
onl
y
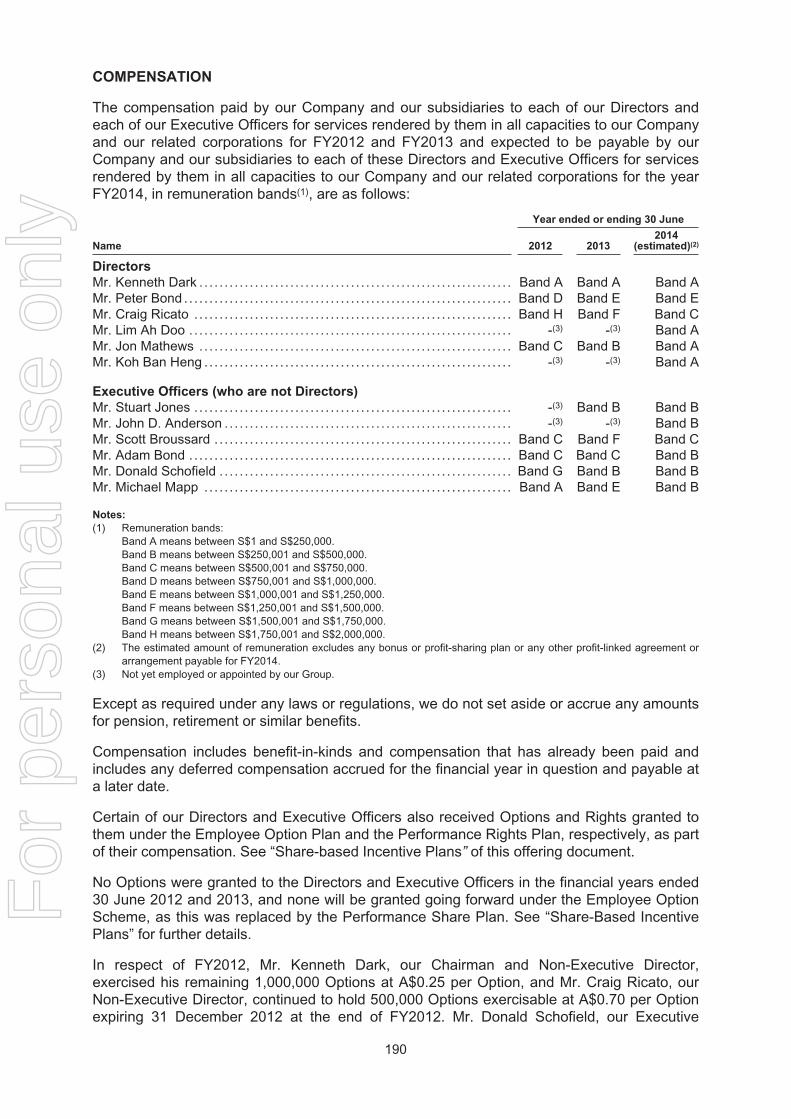
COMPENSATION
The compensation paid by our Company and our subsidiaries to each of our Directors andeach of our Executive Officers for services rendered by them in all capacities to our Companyand our related corporations for FY2012 and FY2013 and expected to be payable by ourCompany and our subsidiaries to each of these Directors and Executive Officers for servicesrendered by them in all capacities to our Company and our related corporations for the yearFY2014, in remuneration bands(1), are as follows:
Year ended or ending 30 June
Name 2012 20132014
(estimated)(2)
Directors
Mr. Kenneth Dark . . . . . . . . . . . . . . . . . . . . . . . . . . . . . . . . . . . . . . . . . . . . . . . . . . . . . . . . . . . . . . Band A Band A Band AMr. Peter Bond .. . . . . . . . . . . . . . . . . . . . . . . . . . . . . . . . . . . . . . . . . . . . . . . . . . . . . . . . . . . . . . . . Band D Band E Band EMr. Craig Ricato . . . . . . . . . . . . . . . . . . . . . . . . . . . . . . . . . . . . . . . . . . . . . . . . . . . . . . . . . . . . . . . Band H Band F Band CMr. Lim Ah Doo .. . . . . . . . . . . . . . . . . . . . . . . . . . . . . . . . . . . . . . . . . . . . . . . . . . . . . . . . . . . . . . . -(3) -(3) Band AMr. Jon Mathews .. . . . . . . . . . . . . . . . . . . . . . . . . . . . . . . . . . . . . . . . . . . . . . . . . . . . . . . . . . . . . Band C Band B Band AMr. Koh Ban Heng .. . . . . . . . . . . . . . . . . . . . . . . . . . . . . . . . . . . . . . . . . . . . . . . . . . . . . . . . . . . . -(3) -(3) Band A
Executive Officers (who are not Directors)
Mr. Stuart Jones . . . . . . . . . . . . . . . . . . . . . . . . . . . . . . . . . . . . . . . . . . . . . . . . . . . . . . . . . . . . . . . -(3) Band B Band BMr. John D. Anderson .. . . . . . . . . . . . . . . . . . . . . . . . . . . . . . . . . . . . . . . . . . . . . . . . . . . . . . . . -(3) -(3) Band BMr. Scott Broussard . . . . . . . . . . . . . . . . . . . . . . . . . . . . . . . . . . . . . . . . . . . . . . . . . . . . . . . . . . . Band C Band F Band CMr. Adam Bond .. . . . . . . . . . . . . . . . . . . . . . . . . . . . . . . . . . . . . . . . . . . . . . . . . . . . . . . . . . . . . . . Band C Band C Band BMr. Donald Schofield . . . . . . . . . . . . . . . . . . . . . . . . . . . . . . . . . . . . . . . . . . . . . . . . . . . . . . . . . . Band G Band B Band BMr. Michael Mapp .. . . . . . . . . . . . . . . . . . . . . . . . . . . . . . . . . . . . . . . . . . . . . . . . . . . . . . . . . . . . Band A Band E Band B
Notes:
(1) Remuneration bands:Band A means between S$1 and S$250,000.Band B means between S$250,001 and S$500,000.Band C means between S$500,001 and S$750,000.Band D means between S$750,001 and S$1,000,000.Band E means between S$1,000,001 and S$1,250,000.Band F means between S$1,250,001 and S$1,500,000.Band G means between S$1,500,001 and S$1,750,000.Band H means between S$1,750,001 and S$2,000,000.
(2) The estimated amount of remuneration excludes any bonus or profit-sharing plan or any other profit-linked agreement orarrangement payable for FY2014.
(3) Not yet employed or appointed by our Group.
Except as required under any laws or regulations, we do not set aside or accrue any amountsfor pension, retirement or similar benefits.
Compensation includes benefit-in-kinds and compensation that has already been paid andincludes any deferred compensation accrued for the financial year in question and payable ata later date.
Certain of our Directors and Executive Officers also received Options and Rights granted tothem under the Employee Option Plan and the Performance Rights Plan, respectively, as partof their compensation. See “Share-based Incentive Plans” of this offering document.
No Options were granted to the Directors and Executive Officers in the financial years ended30 June 2012 and 2013, and none will be granted going forward under the Employee OptionScheme, as this was replaced by the Performance Share Plan. See “Share-Based IncentivePlans” for further details.
In respect of FY2012, Mr. Kenneth Dark, our Chairman and Non-Executive Director,exercised his remaining 1,000,000 Options at A$0.25 per Option, and Mr. Craig Ricato, ourNon-Executive Director, continued to hold 500,000 Options exercisable at A$0.70 per Optionexpiring 31 December 2012 at the end of FY2012. Mr. Donald Schofield, our Executive
190
For
per
sona
l use
onl
y
Officer, exercised 483,334 Options at an exercise price of A$0.76 per Option within FY2012,and held 666,666 Options at the end of FY2012.
In respect of FY2013, Mr. Ricato exercised his remaining 500,000 Options, while DonaldSchofield, our executive officer, exercised his remaining 666,666 Options.
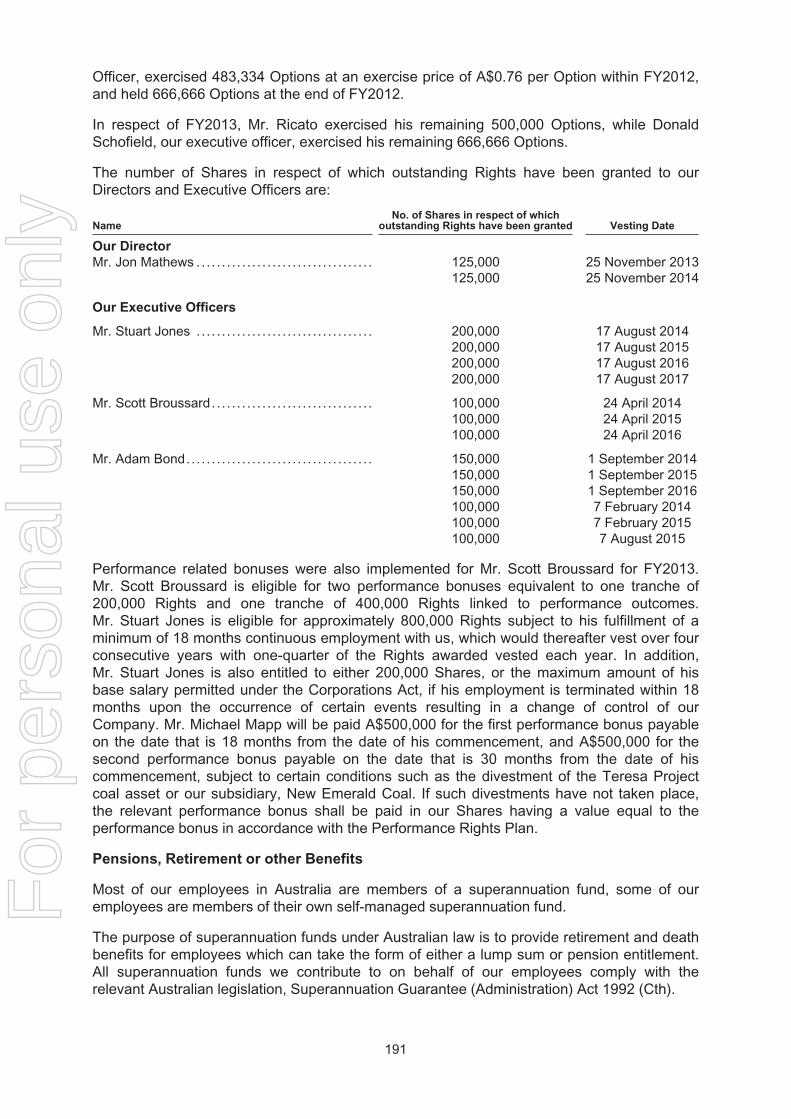
The number of Shares in respect of which outstanding Rights have been granted to ourDirectors and Executive Officers are:
NameNo. of Shares in respect of which
outstanding Rights have been granted Vesting Date
Our Director
Mr. Jon Mathews .. . . . . . . . . . . . . . . . . . . . . . . . . . . . . . . . . . 125,000125,000
25 November 201325 November 2014
Our Executive Officers
Mr. Stuart Jones . . . . . . . . . . . . . . . . . . . . . . . . . . . . . . . . . . . 200,000200,000200,000200,000
17 August 201417 August 201517 August 201617 August 2017
Mr. Scott Broussard. . . . . . . . . . . . . . . . . . . . . . . . . . . . . . . . 100,000100,000100,000
24 April 201424 April 201524 April 2016
Mr. Adam Bond.. . . . . . . . . . . . . . . . . . . . . . . . . . . . . . . . . . . . 150,000150,000150,000100,000100,000100,000
1 September 20141 September 20151 September 20167 February 20147 February 20157 August 2015
Performance related bonuses were also implemented for Mr. Scott Broussard for FY2013.Mr. Scott Broussard is eligible for two performance bonuses equivalent to one tranche of200,000 Rights and one tranche of 400,000 Rights linked to performance outcomes.Mr. Stuart Jones is eligible for approximately 800,000 Rights subject to his fulfillment of aminimum of 18 months continuous employment with us, which would thereafter vest over fourconsecutive years with one-quarter of the Rights awarded vested each year. In addition,Mr. Stuart Jones is also entitled to either 200,000 Shares, or the maximum amount of hisbase salary permitted under the Corporations Act, if his employment is terminated within 18months upon the occurrence of certain events resulting in a change of control of ourCompany. Mr. Michael Mapp will be paid A$500,000 for the first performance bonus payableon the date that is 18 months from the date of his commencement, and A$500,000 for thesecond performance bonus payable on the date that is 30 months from the date of hiscommencement, subject to certain conditions such as the divestment of the Teresa Projectcoal asset or our subsidiary, New Emerald Coal. If such divestments have not taken place,the relevant performance bonus shall be paid in our Shares having a value equal to theperformance bonus in accordance with the Performance Rights Plan.
Pensions, Retirement or other Benefits
Most of our employees in Australia are members of a superannuation fund, some of ouremployees are members of their own self-managed superannuation fund.
The purpose of superannuation funds under Australian law is to provide retirement and deathbenefits for employees which can take the form of either a lump sum or pension entitlement.All superannuation funds we contribute to on behalf of our employees comply with therelevant Australian legislation, Superannuation Guarantee (Administration) Act 1992 (Cth).
191
For
per
sona
l use
onl
y

Our United States subsidiaries offer their employees the option to contribute to a “401(k) plan”which is the common name in the United States for the tax-qualified, defined-contribution pensionaccount defined in subsection 401(k) of the U.S. Internal Revenue Taxation Code. Under thisplan, our employees employed in the United States may, but are not required, to contribute aportion of their salary to the plan, subject to certain internal revenue service limitations. We willmatch such contributions up to 5.0% per annum of the employee’s annual base salary.
We have no other liabilities with respect to retirement benefits or pensions for our employees.We have not set aside and have not accrued any amounts to provide pension, retirement orsimilar benefits for our Directors or our Executive Officers.
CORPORATE GOVERNANCE
We recognise the importance of corporate governance and the maintenance of highstandards of accountability to our Shareholders.
The Code of Corporate Governance recommends that the roles of chairman and chiefexecutive officer be separated, to ensure an appropriate balance of power and increasedaccountability to shareholders. The roles of Chief Executive Officer and Non-ExecutiveChairman are currently held by Mr. Peter Bond and Mr. Kenneth Dark, respectively.
In addition, Mr. Lim Ah Doo has been appointed the Non-Executive Lead IndependentDirector of our Company and is available to our Shareholders where they have concerns forwhich contact through the normal channels of Chief Executive Officer or Chief FinancialOfficer has failed to resolve or for which such contact is inappropriate.
We have three board committees, (i) the Audit and Risk Management Committee, (ii) theNominating Committee, and (iii) the Remuneration Committee.
Audit and Risk Management Committee
Our internal policy requires our Audit and Risk Management Committee to have at least threemembers, all of whom have to be non-executive and the majority of whom, including theChairman, have to be independent. Under our Audit and Risk Management Committee’sterms of reference, our Audit and Risk Management Committee should include members whoare financially literate and have at least two members, including the Chairman having recentand relevant accounting or related financial management expertise or experience and somemembers who have an understanding of the industries in which we operate. Our Audit andRisk Management Committee will have explicit authority to investigate any matter within itsterms of reference, full access to and co-operation by our management and full discretion toinvite any Director or Executive Officer to attend its meetings, and reasonable resources toenable it to discharge its functions properly.
The Audit and Risk Management Committee comprises three members, namely Mr. Lim AhDoo, Mr. Craig Ricato and Mr. Jon Mathews. The Chairman of the Audit and RiskManagement Committee is Mr. Lim Ah Doo. The Audit and Risk Management Committee isrequired to meet at least four times a year to perform functions such as:
(a) overseeing the adequacy of the controls established by executive management toidentify and manage areas of potential risk and to safeguard our assets;
(b) evaluating the processes in place to ensure that accounting records are properlymaintained in accordance with statutory requirements and financial informationprovided to Shareholders and our Directors is accurate and reliable;
(c) review the significant financial reporting issues and judgments so as to ensure theintegrity of the financial statements of our Company and any announcements relatingto our Company’s financial performance;
192
For
per
sona
l use
onl
y
(d) review with external and internal auditors and reporting to our Board at least annuallyon the adequacy and effectiveness of our internal control system, including financial,operational, compliance and information technology controls (such review can becarried out internally or with the assistance of any competent third parties);
(e) review with internal auditors, the programme, scope and results of the internal auditand our management’s response to their findings to ensure that appropriate follow-upmeasures are taken;
(f) review the effectiveness of our internal audit function;
(g) review the scope and results of the external audit, and the independence andobjectivity of the external auditors;
(h) review with external auditors the impact of any new or proposed changes inaccounting principles or regulatory requirements on our financial information;
(i) making recommendations to our Directors on the proposals to the shareholders on theappointment, re-appointment and removal of the external auditors, and approving theremuneration and terms of engagement of the external auditors;
(j) to review the interested person transactions (including the interested persontransactions disclosed in this offering document except for those insofar as they relateto remuneration matters) or the transactions that may lead to conflicts of interests, toensure that they are in compliance with the laws and the regulations of the SGX-ST,and are reasonable and in the best interests of our Company;
(k) monitor the investments in our customers, suppliers and competitors made by ourDirectors, controlling shareholders and their respective associates who are involved inthe management of or have shareholding interests in similar or related business of ourCompany and make assessments on whether there are any potential conflicts ofinterests;
(l) review filings with the SGX-ST or other regulatory bodies which contain our financialinformation and ensure proper disclosure;
(m) commission and review the findings of internal investigations into matters where thereis any suspected fraud or irregularity or failure of internal controls or infringement ofany law, rule and regulation which has or is likely to have a material impact on ouroperating results and/or financial position;
(n) review policy and arrangements by which our staff and any other persons may, inconfidence, raise concerns about possible improprieties in matters of financialreporting or other matters and ensure that arrangements are in place for suchconcerns to be raised and independently investigated, and for appropriate follow-upaction to be taken;
(o) reviewing our risk management structure (including all hedging policies) and anyoversight of our risk management processes and activities to mitigate and manage riskat acceptable levels determined by our Directors;
(p) report to our Board the work performed by our Audit and Risk Management Committeein carrying out its functions;
(q) reviewing the co-operation given by our officers to the external auditors; and
(r) to perform any other act as delegated by our Board and approved by our Audit andRisk Management Committee.
193
For
per
sona
l use
onl
y
All decisions at any meeting of our Audit and Risk Management Committee shall be decidedby a majority of votes of the members present and voting and such decision shall at all timesexclude the vote, approval or recommendation of any member who is interested in the subjectmatter under consideration.
Apart from the duties listed above, our Audit and Risk Management Committee is required tocommission and review the findings of internal investigations into matters where there is anysuspected fraud or irregularity, or failure of internal controls or infringement of any law, rule orregulation which has or is likely to have a material impact on our results of operations and/orfinancial position. Each member of our Audit and Risk Management Committee must abstainfrom voting on any resolution in respect of matters in which he is interested.
Adequacy of Internal Controls
Our Board, after making all reasonable enquiries and to the best of its knowledge and belief,with the concurrence of our Audit and Risk Management Committee, is of the opinion that theinternal controls of our Group are adequate to address the financial, operational andcompliance risks of our Group.
Suitability of our Chief Financial Officer
Our Audit and Risk Management Committee has reviewed Mr. Stuart Jones’ curriculum vitaeand has also interviewed Mr. Jones. Our Audit and Risk Management Committee noted thatMr. Jones has over 20 years of accounting and finance experience and has held seniorcorporate positions in both the oil and gas and banking industries. He was previously GeneralManager Finance and Investor Relations at Nexus Energy Ltd, an ASX-listed company fromSeptember 2009 to July 2012, and Director, oil and gas at HBOS Plc and Chief Accountant atSanctuary Group from 1990 to May 1998. Mr. Jones obtained a Bachelor of Mathematics(with Honours) from the University of Liverpool in 1987.
In the course of preparing for the listing of our Company on the Main Board of the SGX-ST,our Audit and Risk Management Committee has observed and noted Mr. Jones’ contributionsat various occasions, discussions and meetings. In the course of such interactions, our Auditand Risk Management Committee is of the view that Mr. Jones has demonstrated a strongand clear understanding of our businesses and familiarity with the finance and accountingfunctions of our Group, and our Audit and Risk Management Committee has not been madeaware of any other matter that would question Mr. Jones’ suitability for the position of ChiefFinancial Officer.
Having considered the above, and the qualifications and past working experience ofMr. Jones, our Audit and Risk Management Committee is of the view that Mr. Jones issuitable for the position of Chief Financial Officer of our Group.
After making all reasonable enquiries, and to the best of the knowledge and belief of our Auditand Risk Management Committee, nothing has come to the attention of the members of ourAudit and Risk Management Committee to cause them to believe that Mr. Jones, who isappointed Chief Financial Officer, does not have the competence, character and integrityexpected of a Chief Financial Officer (or its equivalent rank) of a listed issuer.
Nominating Committee
Our internal policy requires the Nominating Committee to have at least three members, ofwhom the majority has to be independent, including the Chairman. Our NominatingCommittee comprises Mr. Koh Ban Heng, Mr. Kenneth Dark and Mr. Lim Ah Doo. TheChairman of the Nominating Committee is Mr. Koh Ban Heng. Our Nominating Committee isresponsible for matters such as:
(a) review and recommend candidates for appointments to our Board and Boardcommittees (excluding the appointment of existing members of our Board to each of
194
For
per
sona
l use
onl
y
our Audit and Risk Management Committee, our Nominating Committee and ourRemuneration Committee for the purposes of the initial establishment of such Boardcommittees), as well as candidates for senior management staff, who are not alsocandidates for appointment to our Board;
(b) review of board succession plans for our Directors, in particular, our Chairman and ourChief Executive Officer;
(c) develop of a process for evaluation of the performance of our Board, our boardcommittees and our Directors;
(d) review of training and professional development programmes for our Board;
(e) review and recommend nomination for re-appointment or re-election or renewal ofappointment of our Directors;
(f) review and recommend candidates to be our nominees on the boards and boardcommittees of the listed companies and entities within our Group;
(g) determine independence of our Directors (except where the relevant Directors areconflicted);
(h) review the participation (whether by way of obtaining an interest in or taking a boardseat or otherwise) by each Non-Executive Independent Director in any competingbusinesses and take into account such matters in the re-appointment or re-election orrenewal of appointment of such Non-Executive Independent Director; and
(i) undertake generally such other functions and duties as may be required by law or theListing Manual, and by amendments made thereto from time to time.
In the event that any member of our Nominating Committee has an interest in a matter beingdeliberated upon by our Nominating Committee, he will abstain from participating in thereview and approval process relating to that matter as well as from voting on any resolutionsrelating to such matters.
Remuneration Committee
Our internal policy requires the Remuneration Committee to have at least three members, allof whom have to be non-executive and a majority of whom have to be independent, includingthe Chairman. Our Remuneration Committee comprises, Mr. Jon Mathews, Mr. Kenneth Darkand Mr. Koh Ban Heng. The Chairman of the Remuneration Committee is Mr. Jon Mathews.Our Remuneration Committee is responsible for, among others, recommending to our Boarda framework and criteria of remuneration for the directors and key executives, including thereview of interested person transactions that relate to remuneration matters, and forrecommending specific remuneration packages for each director and the chief executiveofficer. The recommendations of our Remuneration Committee are submitted forendorsement by the entire Board, subject to the requirement that no individual is directlyinvolved in deciding their own remuneration. All aspects of remuneration, including but notlimited to directors’ fees, salaries, allowances, bonuses, options and benefits in kind shall becovered by our Remuneration Committee.
All decisions at any meeting of our Remuneration Committee shall be decided by a majority ofvotes of the members present and voting and such decision shall at all times exclude thevote, approval or recommendation of any member who in interested in the subject matterunder consideration.
195
For
per
sona
l use
onl
y
SHARE-BASED INCENTIVE PLANS
Our Shareholders had approved the employee option plan (the “Employee Option Plan”) atour annual general meeting in 2005. Following changes to the taxation of employee shareschemes announced in the Australia 2009 Federal Budget, the Employee Option Plan wasreplaced with the performance rights plan (the “Performance Rights Plan”, together with theEmployee Option Plan, the “Share-Based Incentive Plans”), which was approved by ourShareholders at our annual general meeting in 2009. The rules of the Share-Based IncentivePlans may be inspected by Shareholders at the registered office of our Company for a periodof six months from the date of registration of this offering document. See Appendix C of thisoffering document for a summary of the rules of the Performance Rights Plans.
Employee Option Plan
The Employee Option Plan was established as an effective retention tool which providedalignment between the interests of the management and the shareholders. Under theEmployee Option Plan, the options under the Employee Option Plan (the “Options”) weregranted at the discretion of our Board in accordance with the rules of the Employee OptionPlan and all directors and employees employed by our Group are eligible participants. Asdetermined by our Board, a minimum continuous period of employment (usually twelvemonths) with our Company or any of our subsidiaries is required prior to the first exercisedate, which falls on 31 December annually. Subject to ongoing employment with ourCompany or any of our subsidiaries, the Options are exercisable at the earlier of (i) the datefalling two years after the grant date, and (ii) the date of which special circumstances(including total and permanent disablement, death, retirement or retrenchment) arise inrespect of the participant. The Options will lapse one the earliest of, the last exercise date,being five years from the date of grant of Options, termination of the participant’s employmentwhere termination arose from circumstances where our Board considers to involve fraud,dishonesty or other serious misconduct, the expiration of 30 days after termination, wheresuch termination arose from other circumstances not involving fraud, dishonesty or otherserious misconduct and the receipt by us of notice from the participant that the participant haselected to surrender the Options. The Options do not carry dividend or voting rights. Apartfrom a time-based service condition, there are no other conditions. When exercisable, eachOption is convertible into one Share.
Prior to being replaced by the Performance Rights Plan, we had granted to 121 participants(including our Directors, our Executive Officers and our employees) an aggregate of48,350,000 Options. As at the Latest Practicable Date, 1,944,992 Options remainoutstanding. All of these Options are held by our employees and none of which are held byour Directors. Subject to our Board’s discretion to charge a nominal consideration for thegrant of Option, no consideration was required to be paid by each participant on acceptanceof the grant of Options. Details of the outstanding Options, including those held by ouremployees are set out below:
No. of Shares in respect of which outstanding Options have beengranted Expiration Date Exercise Price
1,553,661 .. . . . . . . . . . . . . . . . . . . . . . . . . . . . . . . . . . . . . . . . . . . . . . . . . . . . . . . . . . . . 31 December 2013 A$0.59 to A$3.16391,331 .. . . . . . . . . . . . . . . . . . . . . . . . . . . . . . . . . . . . . . . . . . . . . . . . . . . . . . . . . . . . . . 31 December 2014 A$1.34 to A$3.16
Under the Employee Option Plan, in the event of a variation in our issued share capital(whether by way of a bonus issue, pro rata issue of Shares, reorganisation of capital), theexercise price, which is to be determined at the discretion of our Board at the time of the grantof Options, and/or number of Shares comprised in an Option to the extent unexercised shallbe adjusted in such manner as the committee administrating the Employee Option Plan mayin its absolute discretion determine to be appropriate.
Subsequent to the adoption of the Performance Rights Plan, no further Options were grantedpursuant to the Employee Option Plan. Accordingly, no further Options will be granted upon
196
For
per
sona
l use
onl
y
our admission to the Official List of the SGX-ST and our admission will not affect the validityof the Options that have been granted under the Employee Option Plan. However, Optionsmay lapse on certain events such as the participant ceasing to be an employee.
Performance Rights Plan
Similar to the Employee Option Plan which it replaced, the Performance Rights Plan seeks toalign the interest of the eligible employees with the future and current Shareholders throughthe sharing of a personal interest in the future growth and development of our Company. Theprovision for the Performance Rights Plan to vest in multiple tranches over multiple yearsprovides the balance between the objectives of attracting and retaining high performingemployees and aligning the interests of these employees with the shareholders in the longterm. The rights issued under the Performance Rights Plan (the “Rights”) will be determinedat the discretion of our Board. To this end, our Board may from time to time, in its absolutediscretion, grant to a full time employee or director of our Company or subsidiaries, Rights.The Rights will vest in four equal tranches over 48 months, with the first tranche vesting18 months following commencement of employment. In determining the number of Rightsgranted to an employee, our Board takes into consideration an employee’s base salary, levelwithin our Company and our Share price at the time of grant. Rights under the PerformanceRights Plan do not carry dividend or voting rights until they convert into ordinary Shares.Rights automatically convert to Shares on the vesting dates provided all vesting conditions,imposed at the discretion of our Board, have been met. Each Right is convertible to oneShare.
Should employment of the eligible participant lapse due to death or total permanent disability,the unvested Rights will continue to vest but there will be no further entitlements to futureRights awards. In the case where employment of the eligible participant ceases due toredundancy, our Board, in its sole and absolute discretion and on a case-by-case basis, mayconsider whether the unvested Rights will vest and if so, how many.
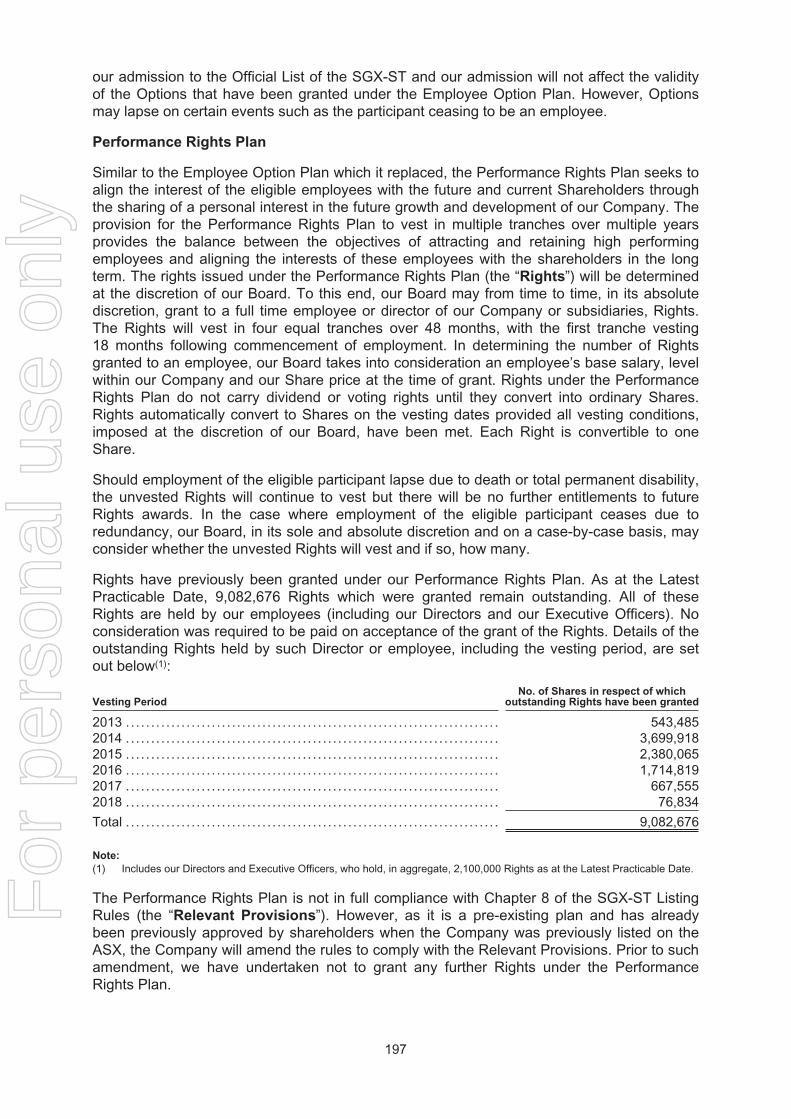
Rights have previously been granted under our Performance Rights Plan. As at the LatestPracticable Date, 9,082,676 Rights which were granted remain outstanding. All of theseRights are held by our employees (including our Directors and our Executive Officers). Noconsideration was required to be paid on acceptance of the grant of the Rights. Details of theoutstanding Rights held by such Director or employee, including the vesting period, are setout below(1):
Vesting PeriodNo. of Shares in respect of which
outstanding Rights have been granted
2013 .. . . . . . . . . . . . . . . . . . . . . . . . . . . . . . . . . . . . . . . . . . . . . . . . . . . . . . . . . . . . . . . . . . . . . . . . . 543,4852014 .. . . . . . . . . . . . . . . . . . . . . . . . . . . . . . . . . . . . . . . . . . . . . . . . . . . . . . . . . . . . . . . . . . . . . . . . . 3,699,9182015 .. . . . . . . . . . . . . . . . . . . . . . . . . . . . . . . . . . . . . . . . . . . . . . . . . . . . . . . . . . . . . . . . . . . . . . . . . 2,380,0652016 .. . . . . . . . . . . . . . . . . . . . . . . . . . . . . . . . . . . . . . . . . . . . . . . . . . . . . . . . . . . . . . . . . . . . . . . . . 1,714,8192017 .. . . . . . . . . . . . . . . . . . . . . . . . . . . . . . . . . . . . . . . . . . . . . . . . . . . . . . . . . . . . . . . . . . . . . . . . . 667,5552018 .. . . . . . . . . . . . . . . . . . . . . . . . . . . . . . . . . . . . . . . . . . . . . . . . . . . . . . . . . . . . . . . . . . . . . . . . . 76,834
Total . . . . . . . . . . . . . . . . . . . . . . . . . . . . . . . . . . . . . . . . . . . . . . . . . . . . . . . . . . . . . . . . . . . . . . . . . . 9,082,676
Note:
(1) Includes our Directors and Executive Officers, who hold, in aggregate, 2,100,000 Rights as at the Latest Practicable Date.
The Performance Rights Plan is not in full compliance with Chapter 8 of the SGX-ST ListingRules (the “Relevant Provisions”). However, as it is a pre-existing plan and has alreadybeen previously approved by shareholders when the Company was previously listed on theASX, the Company will amend the rules to comply with the Relevant Provisions. Prior to suchamendment, we have undertaken not to grant any further Rights under the PerformanceRights Plan.
197
For
per
sona
l use
onl
y

Administration of our Performance Rights Plan
Our Remuneration Committee will be designated as the committee responsible for theadministration of our Performance Rights Plan. Our Remuneration Committee will determine,among others, the following:
(i) the persons to be granted Rights; and
(ii) recommendations for modifications to the Performance Rights Plan.
In compliance with the requirements of the Listing Manual, a participant of the PerformanceRights Plan who is a member of the Remuneration Committee shall not be involved in itsdeliberations in respect of the Rights to be granted to or held by that member of theRemuneration Committee.
Size of the Performance Rights Plan
The aggregate number of new Shares which may be issued pursuant to the exercise ofRights granted under the Performance Rights Plan, when added to the number of Sharesissued in respect of the Employee Option Plan, at any point in time, shall not exceed 5.0% ofthe total issue share capital of our Company on the day immediately preceding the date of therelevant grant.
Participation of controlling shareholders
The Performance Rights Plan will also include the participation of the controlling shareholdersas defined by the Listing Manual, who have actively contributed to the progress and successof our Group. This will enable us to have a fair and equitable system to reward employeeswho have made and continue to make important contributions to the long-term growth of ourGroup notwithstanding that they are controlling shareholders. It will serve as a way ofrewarding them for their dedicated services to our Group and also as a motivation for them totake a long-term view of our Group.
Although the controlling shareholders already have shareholding interests in us, theirparticipation in the Performance Rights Plan ensures that they are equally entitled with ouremployees who are not controlling shareholders, to take part and benefit from these systemsof remuneration.
There will be safeguards in place to prevent abuses of the Performance Rights Plan resultingfrom the participation of controlling shareholders such as the following:
(i) the participation of the controlling shareholders must be specifically approved byindependent Shareholders in separate resolutions for each such person; and
(ii) in seeking such approval, clear justification as to their participation, the number ofShares comprised in the Rights and the terms of the Rights to be granted to thecontrolling shareholders must be provided.
The controlling shareholder who is entitled to participate in the Performance Rights Plan andthe rationale for his participation is described below.
Proposed participation of Mr. Peter Bond
We are proposing that Mr. Bond be given the opportunity to participate in the PerformanceRights Plan. Mr. Bond is our Chief Executive Officer and Managing Director and has beeninstrumental to our growth since he acquired a controlling interest in us and appointed as aDirector in 2004. Mr. Bond oversees all aspect of our Company and has been pivotal to oursuccess since we listed on the ASX in May 2006.
198
For
per
sona
l use
onl
y
Mr. Bond’s aggregate annual remuneration (including salary, bonus and other incentives(both monetary or otherwise)) in the last two financial years ended 30 June 2012 and 2013from our Group in respect of the executive capacities held by him in our Group was in therange S$750,001 and S$1,000,000. As at the Latest Practicable Date, Mr. Bond does nothold any Rights.
Financial Effects of the Share-based Incentive Plans
Share capital
The Share-based Incentive Plans may result in an increase in our Company’s issued sharecapital when new Shares are issued to participants pursuant to the exercise of Options or thegrant of the Rights, as the case may be. However, if existing Shares are purchased fordelivery to participants in lieu of issuing new Shares to them, there will be no impact on ourCompany’s issued share capital.
Net tangible assets
As described below, the Share-based Incentive Plans will result in a charge to our statementof profit or loss and other comprehensive income equal to the fair value at which the newShares are issued or liability recognised. For cash-settled Share-based Incentive Plans, ournet tangible assets will decrease by the amount of expenses charged to the statement ofprofit or loss and other comprehensive income. For equity-settled Share-based IncentivePlans, there will be no effect on our net tangible due to the offsetting effect of expensesrecognised and increased share capital or reserves.
It should be noted that the delivery of Shares to the participants is contingent upon theparticipants meeting prescribed performance targets and conditions. Accordingly, it will resultin significant added value to our net tangible assets before our Shares are delivered.
Costs to our Group
Equity-settled share-based payments are measured at fair value at the date of grant, whereascash-settled share-based payments are measured at current fair value at each statement offinancial position date. In estimating the fair value of the compensation costs, market-basedperformance conditions are taken into account. The cost is charged to the statement of profitor loss and other comprehensive income on a basis that fairly reflects the manner in whichthe benefits will accrue to the employees under the respective plans over the vesting period.
We have made an application to the SGX-ST for permission to deal in and for quotation of theEmployee Option Plan Shares and Performance Rights Plan Shares which may be issuedpursuant to the grant of Options and/or Rights under the Share-based Incentive Plans.
199
For
per
sona
l use
onl
y
SHARE OWNERSHIP
SHARE CAPITAL OF OUR COMPANY
Our company was incorporated as a no liability public company under the name “Linc EnergyN.L.”. In November 2000, we were converted to a public company limited by shares and wewere renamed “Linc Energy Ltd”. Our principal places of businesses are in the United Statesand Australia. As at the Latest Practicable Date, our issued and paid-up ordinary share capitalwas A$325,622,000 (US$300,358,063) comprising 522,996,195 shares.
At an extraordinary general meeting held on 6 November 2013, our Shareholders approved,among others:
(a) that our Company be removed from the Official List of ASX subject to our listing on theMain Board of the SGX-ST;
(b) that our Constitution be amended subject to our listing on the Main Board of theSGX-ST; and
(c) the issue of the 2018 Convertible Notes and the future issue of Shares to the holdersof the 2018 Convertible Notes (the “CN Shares”) in accordance with the terms andconditions of the 2018 Convertible Notes. The CN Shares when issued and fully paid-up, will rank pari passu in all respects with the existing issued and fully paid-upShares.
At the annual general meeting to be held on 28 November 2013, our Shareholders are askedto approve, among others, that authority be given to our Directors to (i) issue Shares whetherby way of rights, bonus or otherwise; and (ii) make or grant any offer, agreement or option(collectively, “Instruments”) that might or would require shares to be issued, including but notlimited to the creation and issue of (as well as adjustments to) warrants, debentures or otherinstrument convertible into Shares, at any time and upon such terms and conditions and forsuch purposes and to such persons as our Directors shall in their absolute discretion deem fit,(notwithstanding the authority conferred by such authority may have ceased to be in force)issue Shares in pursuance of any Instrument made or granted by our Directors while suchauthority was in force, provided that:
(A) the aggregate number of Shares to be issued pursuant to such authority (includingShares to be issued to in pursuance of Instruments made or granted pursuant to suchauthority) shall not exceed 50.0% of the total number of Shares in the post-Offeringissued share capital of our Company (excluding treasury shares), of which theaggregate number of Shares to be issued other than on a pro rata basis to the thenexisting Shareholders of our Company shall not exceed 20.0% of the number ofShares in the post-Offering issued share capital of our Company (excluding treasuryshares);
(B) (subject to such manner of calculation as may be prescribed by the SGX-ST) for thepurpose of determining the aggregate number of shares that may be issued under theparagraph above, the percentage of issued Shares shall be based on the total numberof issued Shares excluding treasury shares immediately following the close of theOffering, after adjusting for:
(i) new Shares arising from the conversion or exercise of any convertiblesecurities or share options or vesting of share awards which are outstanding orsubsisting at the time such authority is passed;
(ii) new Shares arising from exercising share options or vesting of share awardsoutstanding or subsisting at the time of the passing of this resolution; and
(iii) any subsequent bonus issue, consolidation or subdivision of Shares;
200
For
per
sona
l use
onl
y
(C) in exercising the authority conferred by such authority, we shall comply with theprovisions of the Listing Manual for the time being in force (unless such compliancehas been waived by the SGX-ST) and the Constitution; and
(D) unless revoked or varied by our Company in general meeting, such authority shallcontinue in full force until the conclusion of our next annual general meeting of ourCompany or the date by which the next annual general meeting is required by law orby our Constitution to be held, whichever is earlier, except that our Directors shall beauthorised to allot and issue new Shares pursuant to convertible securitiesnotwithstanding that such authority has ceased.
Details of changes in our issued share capital since 1 July 2012 and immediately after theOffering are as follows:
Number ofshares
Resultantissued share
capital (A$’000)
Shares as at 1 July 2012.. . . . . . . . . . . . . . . . . . . . . . . . . . . . . . . . . . . . . . . . . . . . . . . . . . . . . . . . 509,952,685 310,606Shares issued pursuant to the exercise of Options(1) . . . . . . . . . . . . . . . . . . . . . . . . . 3,266,797 315,832Shares issued on vesting of Rights(2) . . . . . . . . . . . . . . . . . . . . . . . . . . . . . . . . . . . . . . . . . . . 6,248,934 325,388Shares as at 30 June 2013 .. . . . . . . . . . . . . . . . . . . . . . . . . . . . . . . . . . . . . . . . . . . . . . . . . . . . . 519,468,416 325,388Pre-Offering share capital as at the Latest Practicable Date . . . . . . . . . . . . . . . . . 522,996,195 325,622Offering Shares to be issued pursuant to the Offering . . . . . . . . . . . . . . . . . . . . . . . . 47,850,000 49,296(3)
Share capital immediately after the Offering(4) . . . . . . . . . . . . . . . . . . . . . . . . . . . . . . . . . 571,150,642 374,918
Notes:
(1) The total cash received by our Group from the exercise of the Options was A$3.2 million.(2) No consideration was received for the vesting of the Rights. Since 1 July 2013, no Shares have been issued as a result of
the vesting of Rights.(3) This figure is the increase in share capital pursuant to the issue of the Offering Shares and not the resultant issued share
capital.(4) Based on the Listing Date of 18 December 2013, 293,292 Rights would have vested as at the date of the Offering
Document and it is intended that 11,155 Rights will further vest into Shares prior to Listing.
DELISTING FROM ASX
At our extraordinary general meeting dated 6 November 2013, our Shareholders approved,among others, the delisting of our Company from the ASX. We received a no-objection letterfrom the ASX on 30 September 2013 to the notice of meeting to our Shareholders containingthe resolution for the approval of our delisting from the ASX. As at the date of this offeringdocument, our Shares have been voluntarily suspended, pending our delisting which isexpected to take place on or about the Listing Date.
See “Share Ownership—Share Capital of our Company” for further details on the resolutionspassed at the extraordinary general meeting held on 6 November 2013 and the annualgeneral meeting to be held on 28 November 2013.
CONVERTIBLE NOTES
We had on 10 April 2013 issued the 2018 Convertible Notes, listed on the SGX-ST, being anaggregate principal amount of US$200.0 million 7.0% convertible, unsubordinated andunsecured notes, due 10 April 2018. The registered holder of the Convertible Notes is acommon depositary for Euroclear Bank S.A./N.V. and Clearstream Banking, sociétéanonyme. See “Management’s Discussion and Analysis of Financial Condition and Results ofOperations—Liquidity and Capital Resources—Borrowing and other indebtedness—2018Convertible Notes” of this offering document for further information on the summary terms ofthe 2018 Convertible Notes.
Following the resolutions passed at the CB Noteholder Meeting held on 16 October 2013,unless previously redeemed or purchased and cancelled, noteholders will have the rightcommencing 21 May 2013 until their redemption or maturity, to convert the 2018 Convertible
201
For
per
sona
l use
onl
y
Notes into CN Shares at the lower of (ii) A$3.40 per Share or (ii) the arithmetic average of thevolume weighted average price of Shares traded on the ASX for each day during the20 consecutive trading days ended on 15 November 2013, translated into Singapore dollar atthe prevailing rate on the Listing Date multiplied by 1.35. For illustrative purposes, based onthe convenience translation of A$1.00 = S$1.1648, the conversion price would be S$2.13.Pursuant to the CB Noteholder Meeting, the conditions of the 2018 Convertible Notes wereamended to, among others, facilitate our plans in reviewing optimal stock exchange venuesand jurisdictions, and our consideration in listing our shares in an alternative or additionalstock exchange from the ASX.
As at the Latest Practicable Date, none of the Convertible Notes has been converted toCN Shares.
GENTING CALL OPTION
On 11 December 2013, we entered into a call option agreement with Genting StrategicInvestments (Singapore) Pte Ltd (“Genting”), a wholly-owned subsidiary of Genting Berhad,pursuant to which, Genting was granted an option to subscribe for up to 10,750,000 Shares(the “Call Option Shares”) at the Offering Price per Share at any time during the period fromListing Date till six months thereafter, for a consideration of S$1.00 (the “Genting Call
Option”). Following the book-building process by agreement between the Joint Bookrunnersand Joint Lead Managers and us, we understand that Genting also intends to subscribe for47,850,000 Offering Shares in the Offering.
OWNERSHIP STRUCTURE
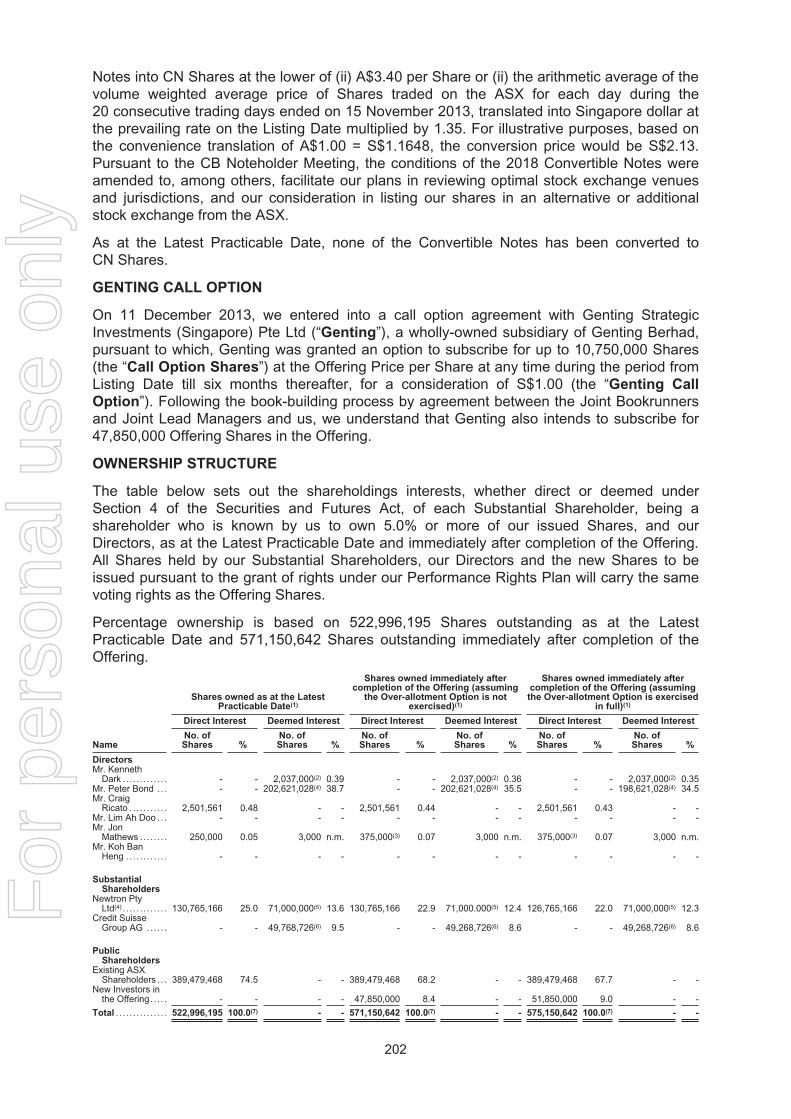
The table below sets out the shareholdings interests, whether direct or deemed underSection 4 of the Securities and Futures Act, of each Substantial Shareholder, being ashareholder who is known by us to own 5.0% or more of our issued Shares, and ourDirectors, as at the Latest Practicable Date and immediately after completion of the Offering.All Shares held by our Substantial Shareholders, our Directors and the new Shares to beissued pursuant to the grant of rights under our Performance Rights Plan will carry the samevoting rights as the Offering Shares.
Percentage ownership is based on 522,996,195 Shares outstanding as at the LatestPracticable Date and 571,150,642 Shares outstanding immediately after completion of theOffering.
Name
Shares owned as at the LatestPracticable Date(1)
Shares owned immediately aftercompletion of the Offering (assuming
the Over-allotment Option is notexercised)(1)
Shares owned immediately aftercompletion of the Offering (assumingthe Over-allotment Option is exercised
in full)(1)
Direct Interest Deemed Interest Direct Interest Deemed Interest Direct Interest Deemed Interest
No. ofShares %
No. ofShares %
No. ofShares %
No. ofShares %
No. ofShares %
No. ofShares %
DirectorsMr. Kenneth
Dark . . . . . . . . . . . . . - - 2,037,000(2) 0.39 - - 2,037,000(2) 0.36 - - 2,037,000(2) 0.35Mr. Peter Bond .. . - - 202,621,028(4) 38.7 - - 202,621,028(4) 35.5 - - 198,621,028(4) 34.5Mr. Craig
Ricato . . . . . . . . . . . 2,501,561 0.48 - - 2,501,561 0.44 - - 2,501,561 0.43 - -Mr. Lim Ah Doo .. . - - - - - - - - - - - -Mr. Jon
Mathews .. . . . . . . 250,000 0.05 3,000 n.m. 375,000(3) 0.07 3,000 n.m. 375,000(3) 0.07 3,000 n.m.Mr. Koh Ban
Heng .. . . . . . . . . . . - - - - - - - - - - - -
SubstantialShareholders
Newtron PtyLtd(4) . . . . . . . . . . . . . 130,765,166 25.0 71,000,000(5) 13.6 130,765,166 22.9 71,000.000(5) 12.4 126,765,166 22.0 71,000,000(5) 12.3
Credit SuisseGroup AG .. . . . . - - 49,768,726(6) 9.5 - - 49,268,726(6) 8.6 - - 49,268,726(6) 8.6
PublicShareholders
Existing ASXShareholders . . . 389,479,468 74.5 - - 389,479,468 68.2 - - 389,479,468 67.7 - -
New Investors inthe Offering. . . . . - - - - 47,850,000 8.4 - - 51,850,000 9.0 - -
Total . . . . . . . . . . . . . . . 522,996,195 100.0(7) - - 571,150,642 100.0(7) - - 575,150,642 100.0(7) - -
202
For
per
sona
l use
onl
y
Notes:
(1) Assuming none of the 2018 Convertible Notes have been converted into Shares and the Genting Call Option is notexercised. Ownership of Shares disclosed does not include the Options or Rights granted to our Directors under theShare-Based Incentive Plans.
(2) 2,017,000 shares are held by Ken & Sandy Dark Pty Ltd, a company wholly owned by Mr. Kenneth Dark.(3) 125,000 Shares were issued to Mr. Jon Mathews pursuant to the vesting of his Rights on 25 November 2013.(4) Mr. Peter Bond is deemed interested in 202,621,028 Shares, with 201,765,166 Shares held through Newtron and 855,862
Shares held through ISNY.Newtron is an Australian incorporated investment holding company which is the corporate trustee of The Peter BondFamily Trust, a discretionary trust whose sole beneficiary is Mr. Peter Bond, who is also the sole shareholder of Newtron.ISNY is an Australian incorporated investment holding company which is the corporate trustee of The Bond Family Trust, adiscretionary trust whose beneficiaries are Mr. Peter Bond, who is also the sole shareholder of ISNY, and his immediatefamily members. Accordingly, Mr. Peter Bond is deemed interested in Shares held by Newtron and ISNY by virtue ofSection 4(3) of the Securities and Futures Act.
(5) Newtron entered into a master loan agreement with Equities dated 12 September 2012 (the “Master Loan Agreement”).As at the Latest Practicable Date, Mr. Peter Bond has, through his wholly-owned company, Newtron, pledged 71,000,000Shares to Equities pursuant to the Master Loan Agreement and all supplements thereunder (the “Pledged Collateral”).Pursuant to the Master Loan Agreement, Mr. Peter Bond, through his wholly-owned company, Newtron, had pledged20,000,000 Shares to Equities in consideration for a loan from Equities to Borrower of funds equal to 65.0% of the currentfair market value of 20,000,000 Shares. Newtron and Equities had discussed that they each may elect to enter intoadditional loan transactions collateralised by additional tranches of the same security, whereby Equities would make itsbest efforts to fund additional loans in additional tranches contingent on market conditions such as Share price. Newtronshall pay Equities a simple interest on the loan principal amount at a fixed interest rate of 3.85% per annum. Newtronacknowledges that Equities has the absolute right to sell and buy any or all of the Pledged Collateral during the term of theMaster Loan Agreement and all supplements thereunder. Newtron further acknowledges and agrees that as long as theloan principal amount or the obligations remain outstanding, Equities may take any and all actions with respect to thePledged Collateral as Equities, in its sole and absolute discretion, may deem to be advisable, including without limitation,selling and buying some or all of the Pledged Collateral during the term of the Master Loan Agreement and allsupplements thereunder. It is noted that an event of default arises if the Pledge Collateral is removed from a national orinternational securities exchange, or trading is halted for more than three exchange business days by a regulatoryauthority. Upon the occurrence of an event of default which remains uncured, the loan, together with any accrued andunpaid interest thereon, shall be immediately due and payable without notice or demand.Pursuant to the master pledge agreement dated 12 September 2012 (the “Master Pledge Agreement”), Newtron astransferor of the Shares, shall receive from Equities a payment of credit against interest due of an amount equivalent to allinterest, dividends and other distributions which the beneficial owner of those Shares is entitled to receive during theperiod of the loan. All voting or other such consensual rights and powers are transferred to Equities. Equities will notexercise any voting or other consensual rights or powers under the terms of the agreements.
(6) Four affiliates of Credit Suisse Group AG hold an aggregate of approximately 9.5% of the issued share capital of ourCompany, pursuant to the provision of services related to securities activities. Of these affiliates, Credit Suisse Equities(Australia) Limited directly holds 49,019,688 Shares, representing 9.4% of the issued share capital of our Company. Noneof these holdings were acquired pursuant to transactions that were entered into on the instruction of or for the benefit ofour Directors, Controlling Shareholders and any of their respective associates. These holdings were purchased pursuantto open market transactions.37,453,184 Shares indirectly held by Mr. Peter Bond are the subject matter of a securities lending agreement (“SLA”)entered into between Newtron as lender, and Credit Suisse Equities (Australia) Limited as borrower which was enteredinto to facilitate hedging in connection with the 2018 Convertible Notes. Prior to the Listing Date, the SLA will beterminated and the New SLA, in substantially similar term to the SLA, will be entered into between Newtron and CreditSuisse Securities (Europe) Limited (“CS Europe”). As at the date of this offering document, no Shares have beenborrowed under the SLA.See “Plan of Distribution—Other Relationships”.
(7) Shareholding does not add up to 100.0% due to rounding differences.
Except as disclosed above, there are no other relationships between our Directors andSubstantial Shareholders.
The Shares held by our Directors and Substantial Shareholders described above do not carryany different voting rights from the Offering Shares.
CONTROL OF OUR COMPANY
To our knowledge, our Company will not be owned or controlled by any corporation (otherthan as disclosed above) immediately after the completion of the Offering. Other than asdescribed above, our Company is not indirectly or directly owned or controlled by anothercorporation, whether severally or jointly, or by any government or other natural or legalperson.
We are not aware of any arrangements that may, at a subsequent date, result in a change ofcontrol of our Company.
203
For
per
sona
l use
onl
y

SIGNIFICANT CHANGES IN PERCENTAGE OF OWNERSHIP
Except as disclosed in this offering document, there were no significant changes in thepercentage of ownership in our Company in the period from the beginning of the last threefinancial years up to the Latest Practicable Date.
204
For
per
sona
l use
onl
y
INTERESTED PERSON TRANSACTIONS AND CONFLICTS OF INTERESTS
INTERESTED PERSON TRANSACTIONS
In general, transactions between our Group and any of our interested persons (namely, thedirectors or controlling shareholder or the associates of such directors or controllingshareholder holding directly or indirectly 15.0% of the nominal amount of all voting shares inour Company) are “Interested Person Transactions” for the purposes of Chapter 9 of theListing Manual.
Except as disclosed below, there are no interested person transactions that are material inthe context of the Offering for the last three financial years ended 30 June 2011, 2012 and2013 and for the period from 1 July 2013 to the Latest Practicable Date. Except as otherwiseprovided in this section, investors, upon purchase of the Offering Shares, are deemed to havespecifically approved these transactions with our interested persons and as such thesetransactions are not subject to Rules 905 and 906 of the Listing Manual to the extent thatthere are no subsequent changes to the terms of the agreements in relation to each of thesetransactions.
In line with the rules set out in Chapter 9 of the Listing Manual, a transaction with a value ofless that S$100,000 is not considered material in the context of the Offering and is not takeninto account for the purposes of aggregation in this section.
In respect of all transactions described below which is stated to be entered into on arms’length as the terms and conditions of such transactions were no more favourable than thoseavailable, or which may be available on similar transactions with non-interested persons, suchconclusions were arrived at by our Board after taking into consideration factors including thepricing and market availability, the type of services being provided as well as the terms inrespect of comparable transactions with external parties.
Past Interested Person Transactions
Past transactions between our Group and interested persons which are material in thecontext of the Offering for the last three financial years ended 30 June 2011, 2012 and 2013and for the period from 1 July 2013 to the Latest Practicable Date.
Loans to Director / Entity controlled by Director
On 16 December 2011, our Company provided a loan of A$250,000 (US$233,375) toMr. Kenneth Dark, our Chairman and Non-Executive Director, for the purposes of exercisingoptions granted to him pursuant to the Employee Option Plan. The loan was provided onnormal commercial terms with interest calculated monthly at a rate of 10.08% per a perannum basis, secured by his Shares, and was accordingly entered into at arm’s length. Thelargest amount outstanding during the period under review was A$264,003 (US$246,447) andas at the Latest Practicable Date, A$241,104 (US$225,071) remained outstanding. The loanwas fully repaid on 23 November 2013. We have ceased such arrangements withMr. Kenneth Dark and do not intend to enter into similar transactions in the future.
On 22 August 2012, our Company entered into a loan agreement for approximatelyA$249,917 (US$233,298) denominated in pounds sterling, with Hillgrove Investments Pty Ltd,a company wholly-owned by Mr. Peter Bond, for the purposes of providing funding convertibleloan to Powerhouse Energy plc. On 5 November 2012, the loan was amended, extending thequantum by an additional A$16,661 (US$15,553). The loan was provided on normalcommercial terms with interest monthly at a rate of 10.08% and was accordingly entered intoat arm’s length. The largest amount outstanding during the period under review and as at theLatest Practicable Date was A$293,213 (US$273,714). The loan was fully repaid on23 November 2013. We have ceased such arrangements with Hillgrove Investments Pty Ltdand do not intend to enter into similar transactions in the future.
205
For
per
sona
l use
onl
y
Reimbursements from Entities controlled by Directors
Mr. Peter Bond
Mr. Peter Bond and Bond Bros Contracting Pty Ltd, a company which Mr. Peter Bond is thesole shareholder of, had from time to time, been required to reimburse our Group for personalexpenses (the “Reimbursement Expenses”) which had been incurred by our Group for theirrespective benefit. The Reimbursement Expenses included, among others, Mr. Bond’sNewcastle office premises and associated costs. The aggregate amount paid by Mr. PeterBond and Bond Bros Contracting Pty Ltd for the period under review is as follows:
FY2011 FY2012 FY2013
1 July 2013 to theLatest Practicable
Date
(A$) (A$) (A$) (A$) (US$)
Reimbursement Expenses paid . . . . . . . . . . . . . . . . . . . . . . . . . . 33,447 32,408 61,931 - -
The largest amount outstanding during the period under review was A$136,053(US$127,006). As we charge no interest in respect of the Reimbursement Expenses, thetransaction would not ordinarily be considered to have been entered into at arm’s length. TheReimbursement Expenses was fully repaid on 31 May 2013. We have ceased sucharrangements with Mr. Peter Bond and Bond Bros Contracting Pty Ltd and do not intend toenter into similar transactions in the future.
Reimbursements to Entities controlled by Directors
Mr. Kenneth Dark
In FY2012, we reimbursed KE & SL Dark, a family partnership established by Mr. KennethDark, for expenses incurred by KE & SL Dark on behalf of our Company in the course ofMr. Kenneth Dark’s chairmanship and directorship for an amount of A$12,369 (US$11,546).The reimbursement expenses incurred by KE & SL Dark included, among others, expensesincurred on Mr. Kenneth Dark’s accommodation and transportation. As no interest wascharged by KE & SL Dark in respect of the reimbursement expenses, the transaction wouldnot ordinarily be considered to have been entered into at arm’s length. There is A$0outstanding as at the Latest Practicable Date. We have ceased such arrangements withMr. Kenneth Dark and KE & SL Dark and do not intend to enter into similar transactions in thefuture.
Transactions with Directors
Mr. Craig Ricato
We had on 1 October 2010 entered into an agreement with Executive Management ServicesDiscretionary Trust for the provision of executive services. The agreement expired on 30 June2013 and a new arrangement was entered into on 1 July 2013 between our Company andExecutive Management Services Discretionary Trust. Please refer to the section titled“Interested Person Transactions and Conflicts of Interests—Present and Ongoing InterestedPerson Transaction—Transactions with Directors—Mr. Craig Ricato” for further details.Mr. Craig Ricato is the sole shareholder of EMS (QLD) Pty Ltd., the corporate trustee ofExecutive Management Services Discretionary Trust. The key beneficiaries of the ExecutiveManagement Services Discretionary Trust are Craig Ricato and his immediate family. Theexecutive services included, among others, executive services as a director of our Companyand those associated with his previous position as “Company Secretary and GeneralCounsel”. The amount paid to Executive Management Services Discretionary Trust, whichwas determined by our Board and Remuneration Committee after taking into consideration
206
For
per
sona
l use
onl
y
his experience and his duties and responsibilities in our Company, for the period under reviewis as follows:
FY2011 FY2012 FY2013
1 July 2013to theLatest
PracticableDate
(A$) (A$) (A$) (A$) (US$)
Executive Management Services Discretionary Trust . . . . . . . . . 297,713 555,940 633,072 - -
The transaction was entered into at arm’s length based on the method of determining theremuneration payable.
Mr. Peter Bond
We entered into an agreement with Rough Diamond Media Pty Ltd in November 2011 toprovide documentary film services. Mr. Peter Bond is the sole shareholder and director ofRough Diamond Media Pty Ltd. The amount paid to Rough Diamond Media Pty Ltd is asfollows:
FY2011 FY2012 FY2013
1 July 2013 to theLatest Practicable
Date
(A$) (A$) (A$) (A$) (US$)
Rough Diamond Media Pty Ltd . . . . . . . . . . . . . . . . . . . . . . . . . . . . . . . . . . . 50,000 67,897 2,913 5,005 4,616
The terms and conditions of the transaction with Rough Diamond Media Pty Ltd was no morefavourable than those available, or which may be available, on similar transactions to non-interested persons on an arm’s length basis.
Present and Ongoing Interested Person Transactions
Details of present and ongoing transactions between our Group and interested persons whichare material in the context of the Offering are set out below. These transactions and futuretransactions with any of the relevant interested persons will be subject to the reviewprocedures under “—Guidelines and Review Procedures for Present and Ongoing and FutureInterested Person Transactions” to the extent required by the Listing Manual.
Transactions with Directors
Mr. Peter Bond
We had on 10 September 2010 entered into an agreement with Newtron Pty Ltd for theprovision of executive services, effective 1 January 2010, by Mr. Peter Bond to our Group,with payment for such services being made to Bond Bros Contracting Pty Ltd which providesthe invoices on behalf of Newtron. Mr. Peter Bond is the sole shareholder of Bond BrosContracting Pty Ltd. The executive services included, among others, the provision ofMr. Bond’s services as Chief Executive Officer. The amount paid to Bond Bros ContractingPty Ltd for the provision of such executive services, which was determined by our Board andRemuneration Committee after taking into consideration his experience and his duties andresponsibilities to our Company, for the period under review is as follows. For the avoidanceof doubt, the payments made to Bond Bros Consulting Pty Ltd who invoices on behalf ofNewtron relates to the remuneration paid in respect of Mr. Bond’s capacity as a Director andnot in respect of him acting as agent for Newtron:
FY2011 FY2012 FY2013
1 July 2013 to theLatest Practicable
Date
(A$) (A$) (A$) (A$) (US$)
Bond Bros Contracting Pty Ltd . . . . . . . . . . . . . . . . . . . . . . . . . 583,000 824,633 1,008,333 458,333 422,720
207
For
per
sona
l use
onl
y
This manner of payment is a common structure adopted by professionals in Australia forefficient tax management purposes and is not in breach of any applicable laws. As theremuneration payable to Mr. Peter Bond was determined by our Remuneration Committeetaking into consideration the remuneration payable to other executives who occupy the sameposition in companies of the same scale operating in the same industry, this transaction wasentered into at arm’s length.
We had on 25 March 2011 entered into an agreement with Bond Air Charters Pty Ltd for theprovision of chartered flight services. This arrangement was adopted as it provides greaterflexibility in terms of timing of use as opposed to relying on commercial flights. Mr. Peter Bondis a shareholder of Bond Air Charters Pty Ltd. The fee payable to Bond Air Charters Pty Ltd isA$2,800 per hour, exclusive of taxes and third party service charges such as ground handlingcharges and reasonable crew accommodations and is reflective of comparable transactionswith unrelated third parties. The amount paid to Bond Air Charters for the period under reviewis as follows:
FY2011 FY2012 FY2013
1 July 2013 to theLatest Practicable
Date
(A$) (A$) (A$) (A$) (US$)
Bond Air Charters Pty Ltd . . . . . . . . . . . . . . . . . . . . . . . . . . . . . 259,140 480,188 173,201 7,089 6,538
The terms and conditions of the transaction with Bond Air Charters Pty Ltd were no morefavourable than those available, or which may be available, on similar transactions to non-interested persons. Accordingly, the transaction was entered into at arm’s length.
Mr. Craig Ricato
We had on 1 July 2013 entered into an agreement with Mr. Craig Ricato’s professionalcontracting entity, Executive Management Services Discretionary Trust, for the provisionconsultancy and project management services to us on an as-needed basis. When Mr. Ricatostepped down from an executive director to a non-executive director role in June 2013, ourBoard requested that he continue to assist us in respect of the management of ourCompany’s major corporate transactions given his experience and familiarity with our Group.Mr. Ricato holds EMS (QLD) Pty Ltd, the corporate trustee of Executive ManagementServices Discretionary Trust. The compensation for services provided to us comprises (i) atime-costed rate of A$550 per hour (inclusive of GST) based on the prevailing market rates ofa law firm partner, and (ii) a retainer fee payable in two tranches on 2 July 2013 and2 January 2014, being the respective dates of the beginning of the retainer and the end of theretainer, and calculated by reference to our closing share price on the relevant datesmultiplied by 250,000 per tranche. This was determined by reference to the 500,000 Shareswhich Mr. Ricato would have been eligible to receive at the end of 2013 if he had continuedas a full time employee of our Company. The payment of the retainer was to secureMr. Ricato’s availability in the event that our Company would require his services. The amountpaid to Executive Management Services Discretionary Trust for the period under review is asfollows. For the avoidance of doubt, the payments made to the trust relates to theremuneration paid in respect of Mr. Ricato’s capacity as a Director and not in respect of himacting as agent on behalf of such trust:
FY2011 FY2012 FY2013
1 July 2013 to theLatest Practicable
Date
(A$) (A$) (A$) (A$) (US$)
Executive Management Services DiscretionaryTrust . . . . . . . . . . . . . . . . . . . . . . . . . . . . . . . . . . . . . . . . . . . . . . . . . . . . . - - - 687,015 633,633
This manner of payment is a common structure adopted by professionals in Australia forefficient tax management purposes and is not breach of any applicable laws. This transaction
208
For
per
sona
l use
onl
y
was entered into at arm’s length based on the method of determining the remunerationpayable.
Mr. Kenneth Dark
We have entered an agreement with KE & SL Dark, a family partnership established byMr. Kenneth Dark, for the provision of executive services. Mr. Kenneth Dark is presently thesole partner of KE & SL Dark. The executive services relates to his duties provided to ourCompany which were customary of a non-executive director and chairman. As this relates tothe provision of non-executive services, there is no fixed term and can be terminated at anytime by us subject to the provision of reasonable notice to Mr. Kenneth Dark. The amountpaid to KE & SL Dark for executive services and the reimbursement of expenses for theperiod under review is as follows. For the avoidance of doubt, the payments made to thepartnership relates to the remuneration paid in respect of Mr. Dark’s capacity as a Directorand not in respect of him acting as agent on behalf on such partnership:
FY2011 FY2012 FY2013
1 July 2013 to theLatest Practicable
Date
(A$) (A$) (A$) (A$) (US$)
KE & SL Dark . . . . . . . . . . . . . . . . . . . . . . . . . . . . . . . . . . . . . . . . . . . . . 65,945 129,809 166,440 46,638 43,014
This manner of payment is a common structure adopted by professionals in Australia forefficient tax management purposes and is not in breach of any applicable laws. As theremuneration payable to Mr. Kenneth Dark was determined by our Remuneration Committeetaking into consideration the remuneration payable to other individuals who occupy the sameposition in companies of the same scale operating in the same industry, this transaction wasentered into at arm’s length.
Upon our listing on the Main Board of the SGX-ST, two other quotations from non-interestedpersons will be obtained (where available) before entering into a transaction with an interestedperson, for comparison to ensure that the interest of minority shareholders are notdisadvantaged. For the avoidance of doubt, the requirement to obtain two other quotations fromnon-interested persons would not be applicable when such transaction relates to the provisionof executive or consultancy services from our Directors. For the transactions with each ofMr. Peter Bond, Mr. Craig Ricato and Mr. Kenneth Dark, upon listing on the Main Board of theSGX-ST, the disclosure requirements pursuant the Listing Manual and the Code of CorporateGovernance 2012 will be complied with. The fee for services shall not be higher than the mostcompetitive price or fee of the two other quotations from non-interested persons. In determiningthe most competitive price or fee, all pertinent factors, including but not limited to quality,delivery time and track record will be taken into consideration.
GUIDELINES AND REVIEW PROCEDURE FOR PRESENT AND ONGOING AND FUTURE
INTERESTED PERSON TRANSACTIONS
All future interested person transactions will be reviewed and approved in accordance withthe threshold limits set out under Chapter 9 of the Listing Manual, to ensure that they arecarried out on normal commercial terms and are not prejudicial to our interests and theinterests of our minority shareholders. In the event that such interested person transactionsrequire the approval of our Board and our Audit and Risk Management Committee, relevantinformation will be submitted to our Board or the Audit and Risk Management Committee forreview. In the event that such interested person transactions require the approval ofshareholders, additional information may be required to be presented to shareholders and anindependent financial adviser may be appointed for an opinion.
209
For
per
sona
l use
onl
y
In the review of all future interested person transactions the following procedures will beapplied:
(a) transactions (either individually or as part of a series or if aggregated with othertransactions involving the same related party during the same financial year) equal toor exceeding S$100,000 in value but below 3.0% of the value of our net tangibleassets will be subject to review by our Audit and Risk Management Committee atregular intervals;
(b) transactions (either individually or as part of a series or if aggregated with othertransactions involving the same related party during the same financial year) equal toor exceeding 3.0% but below 5.0% of the value of our net tangible assets will besubject to the review and prior approval of our Audit and Risk ManagementCommittee. Such approval shall only be given if the transactions are on arm’s lengthcommercial terms and are consistent with similar types of transactions made with non-interested parties; and
(c) transactions (either individually or as part of a series or if aggregated with othertransactions involving the same related party during the same financial year) equal toor exceeding 5.0% of the value of our net tangible assets will be reviewed andapproved by our Audit and Risk Management Committee, prior to such transactionsbeing entered into, which may, as it deems fit, request advice on the transaction fromindependent sources or advisers, including the obtaining of valuations fromindependent professional valuers.
Any interested person transaction will be properly documented in a register (incorporating thebasis, amount and nature, on which they are entered into). Our Audit and Risk ManagementCommittee will review all interested person transactions to ensure that the prevailing rulesand regulations of the SGX-ST (in particular, Chapter 9 of the Listing Manual) are compliedwith. We will also endeavour to comply with the recommendations set out in the Code ofCorporate Governance 2012.
The annual internal audit plan will incorporate a review of all interested person transactionsentered into. Our Audit and Risk Management Committee will review internal audit reports toascertain that the guidelines and procedures established to monitor interested persontransactions have been complied with. In addition, our Audit and Risk ManagementCommittee will also review from time to time such guidelines and procedures to determine ifthey are adequate and/or commercially practicable in ensuring that transactions between usand our interested persons are conducted on arm’s length commercial terms.
Transactions falling within the above categories, if any, will be reviewed quarterly by our Auditand Risk Management Committee to ensure that they are carried out on normal commercialterms and in accordance with the procedures outlined above. All relevant non-quantitativefactors will also be taken into account. Such review includes the examination of thetransaction and its supporting documents or such other data deemed necessary by our Auditand Risk Management Committee. Our Audit and Risk Management Committee will alsoensure that all disclosure, approval and other requirements on interested person transaction,including those required by prevailing legislation, the Listing Manual and relevant accountingstandards, are complied with.
In the event that a member of our Audit and Risk Management Committee is interested in anyinterested person transaction, he will abstain from reviewing that particular transaction. Wewill also disclose the aggregate value of interested person transactions conducted during thecurrent financial year in our annual report.
210
For
per
sona
l use
onl
y
POTENTIAL CONFLICTS OF INTERESTS
In order to manage any potential competition and potential conflicts of interest that may arisebetween Mr. Peter Bond and our Company, on 11 December 2013, Mr. Peter Bond enteredinto a non-compete agreement with our Company (the “Non-Compete Undertaking”),whereby he has agreed not to, and will procure that his associates will not, do or permit to bedone any of the following, without the prior written consent of the Audit and Risk ManagementCommittee:
(a) have a direct interest in 5% or more of the total votes attached to all the voting sharesof a corporation or voting rights of a partnership, as the case may be (“Interest”) in anyother business which competes with the Business of our Group; or
(b) cause or permit any person or company directly or indirectly under his Control(whereby “Control” means the capacity to dominate the decision-making, directly orindirectly, in relation to the financial and operating policies of a company) to do theforegoing (which, for the avoidance of doubt, does not include any fund in which hedoes not exercise investment decisions).
Notwithstanding the above, Mr. Peter Bond, either directly or indirectly through any entity thathe Controls (the “Bond Controlled Entities” and each a “Bond Controlled Entity”), shall beable to have an Interest in any other business that competes with the Business of our Groupprovided that prior to doing so, upon him or any of the Bond Controlled Entities being offeredan opportunity to have an Interest in any other business that competes with the Business ofthe Group (a “Business Opportunity”), he or such Bond Controlled Entity, as the case maybe, shall, provide written notice of such offer to our Company of all relevant details pertainingto the Business Opportunity (the “Business Opportunity Offer”) which our Company mayaccept during the Business Opportunity Offer period (the “Business Opportunity
Acceptance Notice”). The Business Opportunity Offer period begins from the date of theservice of the Business Opportunity Offer and ends the earlier of (i) the serving of the writtennotice to Mr. Peter Bond or the relevant Bond Controlled Entity rejecting the right to pursuethe Business Opportunity (the “Business Opportunity Rejection Notice”) or (ii) 40 calendardays after the Business Opportunity Offer is provided and no acceptance or rejection isreceived by Mr. Peter Bond or the relevant Bond Controlled Entity (a “Business Opportunity
Lapse”).
For the avoidance of doubt,
(a) upon service by our Company of a Business Opportunity Acceptance Notice, we shallhave the right to pursue, and Mr. Peter Bond and the Bond Controlled Entities may notpursue, the Business Opportunity, unless no definitive binding agreement is enteredinto by our Company within 120 days from the date of the Business OpportunityAcceptance Notice, whereupon Mr. Peter Bond or the Bond Controlled Entities maypursue the Business Opportunity;
(b) upon service by us of a Business Opportunity Rejection Notice, Mr. Peter Bond orsuch Bond Controlled Entity shall have the right to pursue the Business Opportunity;and
(c) in the event of a Business Opportunity Lapse, the Director or such Bond ControlledEntity shall have the right to pursue the Business Opportunity.
Further, where Mr. Peter Bond or such Bond Controlled Entity has subsequently acquired theBusiness Opportunity and thereafter proposes to dispose of a portion or the whole of suchBusiness Opportunity, Mr. Peter Bond or such Bond Controlled Entity shall provide writtennotice of such proposed offer of sale (the “Proposed Disposal Offer”) by Mr. Peter Bond orsuch Bond Controlled Entity of its interest in the Business Opportunity (the “Proposed
Disposal”) which our Company may accept during the Proposed Disposal Offer period. Such
211
For
per
sona
l use
onl
y
Proposed Disposal Offer shall include sufficient details of the Proposed Disposal for theCompany to evaluate the Proposed Disposal. The Proposed Disposal Offer period beginsfrom the date of the service of the Proposed Disposal Offer and ends the earlier of (i) theserving of written notice to Mr. Peter Bond or the relevant Bond Controlled Entity rejecting theright to pursue the Proposed Disposal (a “Proposed Disposal Rejection Notice”) or (ii) 40calendar days after the Proposed Disposal Offer is provided and no offer or indication ofinterest (in the form of an offer letter with a clear price and conditions for acceptance beingproposed) (the “Proposed Disposal Indication of Interest”) or Proposed Disposal RejectionNotice is received by Mr. Peter Bond or the relevant Bond Controlled Entity (a “Proposed
Disposal Lapse”).
For the avoidance of doubt,
(a) upon service by our Company of the Proposed Disposal Indication of Interest,Mr. Peter Bond or such Bond Controlled Entity shall not offer the Business Opportunityto third parties unless no definitive binding agreement is entered into by our Companywithin 120 days from the date of the Proposed Disposal Indication of Interest or whereour Company has served written notice to Mr. Peter Bond or the relevant BondControlled Entity rejecting the right to continue to pursue the Proposed Disposal,whereupon Mr. Peter Bond or such Bond Controlled Entity may pursue offering theBusiness Opportunity to third parties;
(b) upon service by us of a Proposed Disposal Rejection Notice, Mr. Peter Bond or suchBond Controlled Entity shall have the right to pursue offering the Business Opportunityto third parties; and
(c) in the event of a Proposed Disposal Lapse, Mr. Peter Bond or such Bond ControlledEntity shall have the right to pursue offering the Business Opportunity to third parties,
provided in each case that Mr. Peter Bond or such Bond Controlled Entities may not divestthe Business Opportunity on price, terms and conditions which are less favourable to ourCompany than those offered by our Company under the Proposed Disposal Indication ofInterest.
“Business” as defined in the Non-Compete Agreement means:
(i) the business of our Company which, as of the date of the Non-Compete Agreement,comprises (a) the conventional oil and gas business division, which consists of theexploration and production of oil and gas in the United States, (b) the unconventionaloil and gas business division, being the clean energy business, which focuses on thecommercialisation of our proprietary technology in underground coal gasification, theprocess of converting coal into underground coal gasification synthetic gas in situ aswell as its shale oil and gas business, which focuses on the exploration for shale oiland gas in Australia, and (c) the coal business division, which consists of a financialasset in the form of a contractual right to receive royalties from coal production overthe Carmichael project in Queensland, Australia as well as our Company’sconventional coal mining business in Australia; and
(ii) such other additional business as our Company may notify to Mr. Peter Bond inwriting.
For the avoidance of doubt, to the extent our Company disposes of or divests any of thebusinesses referred to in (i) and (ii) above, such business will not be included in the definitionof “Business” from the date of disposal or divestment;
The Non-Compete Agreement shall commence on the Listing Date and shall be valid for solong as our Company maintains our primary listing on the Official List of the SGX-ST and
212
For
per
sona
l use
onl
y

Mr. Peter Bond (i) remains a Director, executive officer of our Company or if he has appointedor nominated a director to the board of directors of our Company and (ii) remains aControlling Shareholder of our Company.
As at the Latest Practicable Date, none of our Directors or Controlling Shareholders (includingMr. Peter Bond) or any of their associates:
(a) has had any interest, direct or indirect, in any material transactions to which our Groupwas or is a party;
(b) has any interest, direct or indirect, in any entity carrying on the same business orcarrying on a similar trade as our Group, or dealing in similar products which competesmaterially and directly with the existing business of our Group; and
(c) has any interest, direct or indirect, in any enterprise or company that is a customer orsupplier of goods and services of our Group.
213
For
per
sona
l use
onl
y
TAXATION
The comments below are intended to provide a general summary (only) of the Australian andSingaporean income tax, GST, stamp duty and estate duty implications (to the extent it isrelevant) for Shareholders who hold their Offering Shares on capital account, uponsubscribing for Offering Shares under the Public Offer.
Shareholders who will:
(a) hold Offering Shares as trading stock or otherwise on revenue account; or
(b) are subject to the Taxation of Financial Arrangement (“TOFA”) rules in Australiacontained in Division 230 of the Income Tax Assessment Act 1997 (Cth);
should seek their own professional advice in relation to the tax consequences of investing inOffering Shares.
Shareholders who are resident in jurisdictions other than Australia or Singapore should seektheir own professional advice in relation to their relevant jurisdictions.
These tax comments are provided on the basis that we will (at all applicable times) be aresident of Australia (solely) under the relevant tax laws of Australia and Singapore.
The comments in relation to Australian and Singaporean tax matters below are based on therelevant Australian and Singaporean taxation and stamp duty law, regulations and guidelinesissued by the relevant authorities as at the offering document date. The comments do nottake into account or anticipate changes in Australian or Singaporean taxation law or futurejudicial interpretations of law after this time, nor do they take into account taxation legislationof any countries other than Australia and Singapore.
The discussion is general in nature only and should not be regarded as tax advice as to aparticular Shareholder’s position. Accordingly, all Shareholders should seek their ownprofessional advice from a qualified taxation advisor specific to their own circumstances. It isemphasised that neither us, our Directors nor any other persons involved in this offeringdocument accepts responsibility for any tax effects or liabilities resulting from the subscriptionfor, purchase, holding or disposal of Offering Shares.
This summary does not constitute financial product advice as defined in the (Australian)Corporations Act 2001. This summary is confined to taxation issues and is only one of thematters you need to consider when making a decision about your investments. You shouldconsider taking advice from a licensed adviser, before making a decision about yourinvestments.
Australian Tax Implications
Australian income tax treatment of dividends received by Australian tax resident
Shareholders
Any dividends paid by us to our Australian tax resident Shareholders should be assessableincome in the income year in which the dividends are derived. To the extent franking creditsare attached to a dividend, Shareholders should also be assessable on the amount of thefranking credit.
Where a franking credit is included in a Shareholders assessable income, the Shareholderwill generally be entitled to a corresponding tax offset against tax payable.
To be eligible for the franking credit and tax offset, a Shareholder must satisfy the ‘holdingperiod’ rules, which require that a Shareholder holds the Shares ‘at risk’ for a specified periodof not less than 45 days (not including the date of acquisition and the date of disposal).
214
For
per
sona
l use
onl
y
The holding period rule will not apply to a Shareholder who is an individual and whose taxoffset entitlement (for all franked distributions received by the Shareholder in the income year)does not exceed $5,000 for the income year in which the franked dividend is received.
Generally Shareholders who are Australian tax resident individuals or complyingsuperannuation entities should be entitled to a refund to the extent the franking creditsattached to a dividend exceeds the Shareholder’s income tax liability for the relevant incomeyear.
Shareholders who are Australian tax resident companies may be entitled to convert theexcess of franking credits which cannot be offset against their income tax liability for therelevant year, to a carry forward tax loss. Additionally, for Shareholders who are companiesand who receive franked dividends, a franking credit may arise in the Shareholders, frankingaccount (subject to satisfaction of the holding period rules).
Special rules apply to Shareholders that are trustees of trusts, and for partnerships.
Shareholders are advised to seek their own professional advice in assessing theconsequences of receiving franking credits in their specific circumstances.
Australian income tax treatment of dividends received by non-Australian tax resident
Shareholders
Any dividends paid by us to our non-Australian tax resident Shareholders may be subject towithholding tax in Australia as noted below, but otherwise should not be subject to income taxin Australia.
Fully franked dividends are not subject to Australian dividend withholding tax.
To the extent dividends are unfranked, Australian dividend withholding tax is imposed at arate of 30% unless the Shareholder is a tax resident of a country which has entered into aDouble Taxation Agreement (“DTA”) with Australia. In these circumstances, the rate ofAustralian dividend withholding tax is generally reduced. For example, the withholding tax rateon unfranked dividends paid to tax residents of Singapore by an Australian tax residentcompany (e.g. our Company) may be reduced to 15% under the DTA between Australia andSingapore. Shareholders should seek their own tax advice in relation to the application ofthese rules to their particular circumstances.
Australian implications for Australian tax resident Shareholders disposing of Offering
Shares
Where a Shareholder holds Offering Shares on capital account, the Capital Gains Tax(“CGT”) rules should be applicable in determining the tax consequences of acquiring anddisposing of Offering Shares.
If Shareholders choose to dispose of their Offering Shares in the future, a capital gain shouldarise to the extent the capital proceeds received in respect of the disposal exceeds the costbase of the Shares.
A capital loss will arise to the extent the capital proceeds received are less than the reducedcost base of the Shares. Capital losses can be carried forward and offset against any futurecapital gains, subject to the satisfaction of various carry forward loss and integrity rules.
The cost base of Offering Shares subscribed for under the Public Offer should broadly beequal to the money paid or required to be paid in respect of acquiring the Shares plus anyincidental costs incurred by the Shareholder in respect of acquiring (or disposing) of theShares.
215
For
per
sona
l use
onl
y
As the Offering Shares are denominated in Singaporean dollars, the cost base of the OfferingShares and capital proceeds from disposal of the Offering Shares must be converted to anAustralian dollar equivalent. Generally, the cost base should be converted at the relevantforeign exchange rate applicable at the date of purchase and the capital proceeds should beconverted at the relevant foreign exchange rate applicable at the date of disposal. The capitalgain or loss from disposal of the Offering Shares is then calculated using the Australian dollaramounts. However, this may differ for particular Shareholders depending on theircircumstances. Shareholders should seek their own professional tax advice in relation to theapplication of these rules to their particular circumstances.
If the Shareholder is an Australian tax resident individual, complying superannuation entity, ortrust, they may be eligible to reduce their capital gain (net of any available capital losses) by aCGT discount if they have held their Offering Shares for at least 12 months prior to thedisposal. For individuals and trusts the discount is one half and for complying superannuationentities one third. Shareholders that are companies (or trusts that are taxed under a corporatemodel in Australia) are not entitled to a CGT discount.
Shares held by trustees of trusts that have held the Offering Shares for at least 12 monthsmay be eligible to flow through the CGT discount to non-company beneficiaries of the trust.Shareholders should seek their own professional advice in this regard.
Our Shareholders should not be treated as resident in Australia or carrying on business inAustralia through a permanent establishment solely by reason of the issue, allotment orholding of our Shares. However, each individual Shareholder should obtain their ownindependent tax advice relevant to their particular circumstances as those othercircumstances that may be particular to a Shareholder may influence whether they haveresidency in Australia for tax purposes and/or a permanent establishment presence inAustralia.
Australian income tax implications for non-Australian tax resident Shareholders
disposing of Offering Shares
Where a non-Australian tax resident Shareholder holds Offering Shares on capital account,any capital gain or loss arising from the disposal of Offering Shares should be disregardedprovided the Offering Shares are not taxable Australian property (“TAP”).
If the Offering Shares held by a non-Australian tax resident Shareholder are TAP, then anycapital gain or loss will be taxed in accordance with the CGT rules as outlined above inrelation to Australian tax resident Shareholders disposing of Offering Shares.
Offering Shares may be TAP where:
The non-Australian tax resident Shareholder (together with its associates) owns 10% or moreof the issued Share capital of our Company (including voting, capital and dividend rights) atthe time of the disposal (or has done so for a 12-month period within the 24 months prior todisposal); and
Greater than 50% of our market value of the underlying assets (including interests insubsidiaries) is related to real property interests located in Australia (including mining andexploration rights).
Otherwise, Offering Shares should generally not be TAP for a non-Australian tax residentShareholder.
Shareholders are advised to seek their own professional advice in relation to the applicationof these rules in their specific circumstances.
216
For
per
sona
l use
onl
y
Tax File Numbers (“TFNs”)
An Australian tax resident Shareholder is not required to quote a TFN to our Company.However, if an Australian tax resident Shareholder’s TFN or relevant exemption details arenot provided, Australian tax may be required to be deducted by our Company from certaindistributions (other than fully franked dividends) at the maximum marginal tax rate plusmedicare levy.
A Shareholder that holds Offering Shares as part of an enterprise may quote their AustralianBusiness Number instead of their TFN.
For non-Australian tax resident Shareholders, a TFN will be deemed to have been quoted atthe time a dividend is paid by us, provided Australian dividend withholding tax applies orwould have applied, but for certain dividend withholding tax exclusions (such as the dividendbeing franked).
Australian GST implications
There should be no Australian GST payable by Shareholders in respect of the acquisition ordisposal of Offering Shares.
The extent to which a Shareholder may be entitled to recover Australian GST included incosts relating to the acquisition or disposal of Offering Shares will depend on the particularcircumstances of the Shareholder and whether the acquisition/disposal may be classified asbeing ‘GST-free’ for Australian GST purposes. Shareholders should seek separate advicefrom their financial advisors to confirm their position.
No Australian GST should be payable by Shareholders as a result of dividends distributed byus.
The listing and trading on the SGX-ST should have no direct Australian GST implications forexisting or future Shareholders.
Australian Stamp Duty implications
Shareholders acquiring Offering Shares should not bear any stamp duty liability on theacquisition.
Singapore Tax Implications
Corporate income tax
Corporate taxpayers, whether Singapore tax residents or non-residents, are subject toSingapore income tax on all income accrued in or derived from Singapore and on foreign-sourced income received or deemed received in Singapore from outside Singapore, subjectto certain exceptions.
A company is regarded as a tax resident in Singapore if the control and management of itsbusiness is exercised in Singapore. Normally, control and management of a company isvested in its board of directors and in practice, the place of residence of the company iswhere its board of directors meets to make strategic business and management decisions.For companies which are investment holding companies deriving only passive sources ofincome, more factors will need to be considered to determine where its control andmanagement is exercised and the company’s tax residency status.
Foreign-sourced income in the form of dividends, branch profits and services income receivedor deemed received in Singapore by Singapore tax resident companies are exempt fromSingapore income tax if the following conditions are met:
(i) the income is subject to tax of a similar character to income tax under the law of thejurisdiction from which such income is received;
217
For
per
sona
l use
onl
y

(ii) at the time the income is received in Singapore, the highest rate of tax of a similarcharacter to income tax in the jurisdiction from which the income is received is at least15%; and
(iii) the Comptroller of Income Tax is satisfied that the tax exemption would be beneficial tothe recipient of the foreign-sourced income.
The prevailing corporate tax rate (for both resident and non-resident corporate tax payers) inSingapore is 17%. In addition, partial tax exemption is granted on the first S$300,000 of acompany’s chargeable income arrived as follows:
(i) 75% of up to the first S$10,000 of the company’s chargeable income, and
(ii) 50% of up to the next S$290,000 of a company’s chargeable income.
Non-Singapore Shareholders are advised to consult their own tax advisors to take intoaccount the tax laws of their respective countries of residence and the existence of anydouble taxation agreement which their country of residence may have with Singapore orAustralia (as the case may be).
Individual income tax
In general, for individuals, only income which is sourced in Singapore will be subject toincome tax in Singapore.
Most investment income sourced in Singapore is exempt from income tax in the hands ofindividuals. For individuals, any income arising from sources outside Singapore and receivedin Singapore is generally exempt from income tax unless it is received through a partnershipin Singapore.
For Singapore individual tax purposes, a resident means a person who, in the year precedingthe year of assessment, resides in Singapore except for such temporary absences there-fromas may be reasonable and not inconsistent with a claim by such person to be resident inSingapore, and includes a person who is physically present in Singapore or who exercisesemployment (other than as director of a company) in Singapore for at least 183 days in thecalendar year preceding the year of assessment.
In addition, there is an administrative concession, whereby an individual would be regardedas a tax resident if he is physically present or exercises employment in Singapore for at least183 days, even if it straddles 2 calendar years.
The rate(s) at which tax is then applied to the Singapore sourced income will depend on theindividuals’ residency status.
As a tax resident, the individual will be taxed at progressive tax rates ranging from 0% to 20%and also enjoy the entitlement to claim deductions for personal reliefs.
Where an individual does not meet the conditions for tax residency outlined above, he will beregarded as a non-resident and subject to tax on Singapore sourced taxable investmentincome at a flat rate of 20% except for certain specified income that may be taxed at lowerrates.
Non-Singapore Shareholders are advised to consult their own tax advisors to take intoaccount the tax laws of their respective countries of residence and the existence of anydouble taxation agreement which their country of residence may have with Singapore orAustralia (as the case may be).
218
For
per
sona
l use
onl
y
Dividend distributions
Dividends paid by our Company to our Shareholders would be considered as sourced inAustralia, i.e. foreign sourced for Singapore income tax purposes.
Foreign sourced dividends received in Singapore by individuals, whether Singapore taxresident or non-Singapore tax resident, are not subject to Singapore income tax.
Foreign sourced dividends received in Singapore by corporate Shareholders which areSingapore income tax residents, are exempt from Singapore income tax if the followingconditions are met:
(i) the income is subject to tax of a similar character to income tax under the law of thejurisdiction from which such income is received; and
(ii) at the time the income is received in Singapore, the highest rate of tax of a similarcharacter to income tax in the jurisdiction from which the income is received is at least15%; and the Comptroller of Income Tax is satisfied that the tax exemption would bebeneficial to the recipient of the foreign-sourced income.
For non-Singapore tax resident corporate Shareholders that do not operate in or fromSingapore (including having no trade or business carried on in Singapore), such dividendswould not be subject to Singapore corporate income tax.
Gains on disposals of ordinary Shares
Singapore does not impose tax on capital gains. Generally, if Offering Shares are held asinvestment assets on capital account, any gains arising from subsequent sales of OfferingShares should generally be considered capital gains not subject to Singapore income tax.However, if Offering Shares have been held on trading account, the gains arising from asubsequent sale may be taxed as income at the prevailing tax rate. Additionally, gains of anincome nature may be taxed as income at the prevailing tax rate.
Gains may be construed to be of an income nature and subject to Singapore income tax ifthey arise from or are otherwise connected with the activities of a trade or business carried onin Singapore. The gains may also be liable to tax in the hands of the Shareholders if Shareswere acquired with the intention or purpose of making a profit by sale and not with theintention to be held for long-term investment purposes.
Under Section 13Z of the Income Tax Act (Chapter 134 of Singapore), the gains derived fromthe disposal of ordinary Shares in an investee company during the period 1 June 2012 to31 May 2017 (both dates inclusive) is exempt from income tax if immediately prior to the dateof the Share disposal, the divesting company had legally and beneficially held at least 20% ofthe ordinary Shares in the investee company for a continuous period of at least 24 months.This rule does not apply to a divesting company whose gains or profits from the disposal ofShares are included as part of its income based on the provisions of Section 26 of the IncomeTax Act, or disposal of Shares in an unlisted investee company that is in the business oftrading or holding Singapore immovable properties (other than the business of propertydevelopment).
In addition, corporate Shareholders who adopt the tax treatment to be aligned with theSingapore Financial Reporting Standard 39 Financial Instruments—Recognition andMeasurement (“SFRS 39”) for the purposes of Singapore income tax may be taxed on gainsor losses (not being gains or losses in the nature of capital) even though no sale or disposalof Offering Shares is made.
Because the precise tax status will vary from Shareholder to Shareholder, Shareholdersshould consult their own accounting and tax advisers regarding the Singapore income taxconsequences of their acquisition, holding and disposal of Offering Shares.
219
For
per
sona
l use
onl
y
Singapore stamp duty
No stamp duty is payable on the subscription and issuance of new Shares.
Where existing Shares evidenced in certificated form are acquired in Singapore, stamp duty ispayable on the instrument of transfer of the Shares at the rate of $0.20 for every $100 or anypart thereof of the consideration for or market value of, the Shares, whichever is higher. Thepurchaser is liable for the stamp duty charge, unless otherwise agreed by the parties to thetransaction.
No stamp duty is payable if no instrument of transfer is executed (such as in the case ofscripless Shares, the transfer of which does not require an instrument of transfer to beexecuted) or if the instrument of transfer is executed outside of Singapore. However, stampduty may be payable if the instrument of transfer which is executed outside Singapore issubsequently brought into Singapore.
Singapore estate duty
Singapore estate duty was abolished with effect from 15 February 2008.
Singapore GST
The sale of Offering Shares by a GST-registered investor belonging in Singapore through aSGX-ST member or to another person belonging in Singapore is an exempt supply notsubject to GST.
Any GST (for example, GST on brokerage) incurred by the GST-registered investor inconnection with the making of this exempt supply will generally become an additional cost tothe investor unless the investor satisfies certain conditions prescribed under the GSTlegislation or certain GST concessions.
Where Offering Shares are sold by a GST-registered investor to a person belonging outsideSingapore (and who is outside Singapore at the time of supply), the sale is a taxable supplysubject to GST at zero rate. Consequently, any GST (for example, GST on brokerage)incurred by him in the making of this zero-rated supply for the purpose of his business will,subject to the provisions of the GST legislation, be recoverable as an input tax credit in hisGST returns.
Investors should seek their own tax advice on the recoverability of GST incurred on expensesin connection with the purchase and sale of Offering Shares.
Services such as brokerage and handling services rendered by a GST-registered person toan investor belonging in Singapore in connection with the investor’s purchase or sale ofOffering Shares will be subject to GST at the prevailing rate (currently 7.0%). Similar servicesrendered contractually to an investor belonging outside Singapore are subject to GST at zero-rate provided that the investor is not physically present in Singapore at the time the servicesare performed and the services do not directly benefit a person who belongs in Singapore.
Certain U.S. Federal Income Tax Considerations
ANY DISCUSSION OF TAX ISSUES SET FORTH IN THIS PROSPECTUS WAS WRITTEN
IN CONNECTION WITH THE PROMOTION AND MARKETING OF THE TRANSACTIONS
DESCRIBED IN THIS PROSPECTUS. SUCH DISCUSSION WAS NOT INTENDED TO BE
USED, AND IT CANNOT BE USED, BY ANY PERSON FOR THE PURPOSE OF
AVOIDING ANY TAX PENALTIES THAT MAY BE IMPOSED ON SUCH PERSON. EACH
INVESTOR SHOULD SEEK ADVICE BASED ON ITS PARTICULAR CIRCUMSTANCES
FROM AN INDEPENDENT TAX ADVISOR.
220
For
per
sona
l use
onl
y
The following discussion describes the material U.S. federal tax consequences of thepurchase, ownership and disposition of the Shares to U.S. Holders (as defined below). Thissummary applies only to U.S. Holders that hold the Shares as capital assets (generally,property held for investment). This summary is based upon the U.S. Internal Revenue Codeof 1986, as amended (the “Code”), proposed, temporary and final U.S. Treasury Regulationspromulgated thereunder, administrative rulings and judicial decisions, all as in effect as at thedate of this Prospectus and all of which are subject to change (possibly with retroactive effect)or to differing interpretations. The following discussion does not address any U.S. state orlocal or non-U.S. tax considerations or any U.S. federal estate, gift or alternative minimum taxconsiderations. The following discussion does not address all of the tax consequences thatmay be relevant to a particular investor or to persons subject to special tax treatment underU.S. federal income tax law such as:
‰ banks, insurance companies, and financial institutions;
‰ dealers in securities;
‰ U.S. expatriates;
‰ traders in securities that have elected the mark-to-market method of accounting for theirsecurities;
‰ tax-exempt entities;
‰ persons whose functional currency is not the U.S. dollar;
‰ persons holding Shares as part of a straddle, hedging, conversion or integratedtransaction; or
‰ persons that actually or constructively own 10% or more of the voting stock of ourCompany.
For purposes of this summary, a “U.S. Holder” is a beneficial owner of Shares that is:
‰ an individual who is a U.S. citizen or resident of the United States as determined for U.S.federal income tax purposes;
‰ a corporation, or other entity treated as a corporation for U.S. federal income taxpurposes, created or organised in or under the laws of the United States, any statethereof or the District of Columbia;
‰ an estate that is subject to U.S. federal income tax on its worldwide income; or
‰ a trust if either (i) a U.S. court is able to exercise primary supervision over theadministration of the trust and one or more U.S. persons have the authority to control allsubstantial decisions of the trust or (ii) the trust has a valid election in effect to be treatedas a U.S. person for U.S. federal income tax purposes.
The tax treatment of a partner in a partnership, including any entity treated as a partnershipfor U.S. federal income tax purposes, that holds Shares generally will depend on the status ofthe partner and the activities of the partnership. A partner in a partnership that holds Sharesshould consult its own tax advisors.
PROSPECTIVE PURCHASERS OF THE OFFER SHARES SHOULD CONSULT THEIR
OWN TAX ADVISORS CONCERNING THE PARTICULAR U.S. FEDERAL INCOME TAX
CONSEQUENCES APPLICABLE TO THEM OF THE PURCHASE, OWNERSHIP AND
DISPOSITION OF THE SHARES, AS WELL AS THE CONSEQUENCES ARISING UNDER
THE LAWS OF ANY OTHER TAXING JURISDICTION.
221
For
per
sona
l use
onl
y
Taxation of Distributions on Shares
Subject to the discussion under “PFIC Status” below, distributions made on the Shares,including the amount of any Australian taxes withheld on such distributions, generally will beincluded in the income of a U.S. Holder as dividend income to the extent of the current andaccumulated earnings and profits of our Company, as determined under U.S. federal incometax principles. For U.S. federal income tax purposes, distributions in excess of a corporation’scurrent and accumulated earnings and profits generally are treated first as a return of capitalthat reduces a shareholder’s tax basis in its shares, and then as capital gain from the sale orexchange of such shares. However, we do not expect to calculate our Company’s earningsand profits under U.S. federal income tax principles, and, accordingly, a U.S. Holder shouldexpect that a distribution will generally be reported as a dividend (as discussed above) even ifthat distribution (or a portion thereof) would otherwise be treated as a tax-free return of capitalor as capital gain. A corporate U.S. Holder will not be entitled to the dividends receiveddeduction that is generally available upon the receipt by a U.S. corporation of dividends fromU.S. corporations. Generally, dividends paid to non-corporate U.S. persons, includingindividuals, by a “qualified foreign corporation” may be eligible for reduced rates of taxation ifcertain holding period requirements are satisfied. A qualified foreign corporation includes anon-U.S. corporation that is eligible for the benefits of an income tax treaty with the UnitedStates that includes an exchange of information programme and that the U.S. Department ofthe Treasury has determined is satisfactory for this purpose. The U.S. Department of theTreasury has determined that the income tax treaty between the United States and Australiais satisfactory for this purpose. In addition, in order to be treated as a qualified foreigncorporation, a non-U.S. corporation must not be a passive foreign investment company (a“PFIC”) in the year the dividend is paid or have been a PFIC in the preceding taxable year.Potential purchasers of Shares are urged to consult their tax advisors regarding theapplication of these rules in their particular circumstances.
Dividends generally will be treated as foreign source “passive category income” or, in certaincircumstances, “general category income” for U.S. foreign tax credit purposes. A U.S. Holdermay be entitled to a U.S. foreign tax credit or deduction for any Australian tax withheld.Because of the complexity of the foreign tax credit rules, U.S. Holders should consult theirown tax advisors with respect to the amount of foreign taxes that can be claimed as a credit. Ifany dividends are paid in Australian dollars, the amount includible in gross income will be theU.S. dollar value of such a dividend, calculated by reference to the exchange rate in effect onthe date of receipt of the payment, regardless of whether the payment is actually convertedinto U.S. dollars on that date. If any Australian dollars received are later converted intoU.S. dollars, U.S. Holders may realise gain or loss on the conversion. Gain or loss, if any,realised as a result of currency exchange fluctuations during the period from the date ofinclusion of the payment in income to the date of conversion of the payment into U.S. dollarswill be treated as ordinary income or loss. This gain or loss generally will be from sourceswithin the United States for U.S. foreign tax credit purposes. U.S. Holders should consult theirown tax advisors concerning the possibility of foreign currency gain or loss if any suchcurrency is not converted into U.S. dollars on the date of receipt.
Sale, Exchange, Redemption or Other Disposition of Shares
Subject to the discussion under “PFIC Status” below, upon the sale, exchange, redemption orother disposition of a Share, a U.S. Holder generally will recognise capital gain or loss equalto the difference between (i) the amount of cash proceeds plus the fair market value of anyproperty received upon the sale, exchange, redemption or other disposition and (ii) such U.S.Holder’s adjusted tax basis in the Share. The capital gain or loss will be long-term capital gainor loss if the U.S. Holder’s holding period for the Share is more than one year at the time ofthe sale, exchange, redemption or other disposition. Non-corporate U.S. Holders, includingindividual, are generally eligible for reduced rates of taxation with respect to long-term capital
222
For
per
sona
l use
onl
y
gains. The deductibility of capital losses is subject to limitations. Gain or loss generally will betreated as income or loss from within the United States for U.S. foreign tax credit purposes.
PFIC Status
Based upon the composition of our assets and income, we do not believe that we were aPFIC for our taxable year ended 30 June 2013 and do not anticipate becoming a PFIC for ourcurrent taxable year ending 30 June 2014. The determination of whether or not we are a PFICis made on an annual basis and will depend upon the composition of our income and assetsfrom time to time. Specifically, a non-U.S. corporation is considered to be a PFIC for anytaxable year if either:
‰ 75% or more of its gross income for such year consists of certain types of “passiveincome”; or
‰ 50% or more of the value of its assets (based on an average of the quarterly values ofthe assets during the taxable year) is attributable to assets that produce or are held forthe production of “passive income”.
“Passive income” includes dividends, interest, certain rents and royalties and certain gainsfrom the sale of commodities and securities. In determining whether we are a PFIC, we will betreated as owning our proportionate share of the assets and directly receiving ourproportionate share of the income of any corporation in which we own, directly or indirectly,more than 25% (by value) of the stock. In addition, if any of our subsidiaries are also PFICs, aU.S. Holder will be deemed to own its proportionate share of such subsidiary PFICs, and maybe subject to adverse tax consequences with respect to the shares of such subsidiary PFICsthat the U.S. Holder would be deemed to own.
If we were a PFIC, special tax rules would generally apply with respect to any “excessdistribution” received by such a U.S. Holder with respect to the Shares and to any gainrealised by the U.S. Holder from a sale, exchange, redemption or other disposition of theShares. Distributions received by a U.S. Holder in a taxable year that are greater than 125%of the average annual distributions received by the U.S. Holder during the three precedingtaxable years (or, if shorter, the U.S. Holder’s holding period for the Shares) would be treatedas an excess distribution. Under these special tax rules:
‰ the excess distribution or gain will would allocated rateably over the U.S. Holder’sholding period for the Shares;
‰ the amount allocated to the current taxable year, and to any taxable year prior to the firsttaxable year in which we were a PFIC, would be treated as ordinary income; and
‰ the amount allocated to each other year will be subject to the highest tax rate in effect forthat year and the interest charge generally applicable to underpayments of tax will beimposed on the resulting tax attributable to each such year.
The tax liability for amounts allocated to years prior to the year of the disposition or “excessdistribution” cannot be offset by any net operating losses for such years, and gains (but notlosses) realised on the sale of the stock of a PFIC cannot be treated as capital gains, even ifthe U.S. Holder holds the stock as a capital asset. If we were a PFIC in any year in which aU.S. Holder held Shares, we generally would continue to be treated as a PFIC with respect tothe U.S. Holder for all succeeding years in which the U.S. Holder held the Shares.
In certain circumstances, in lieu of being subject to the excess distribution rules discussedabove, a U.S. shareholder of a PFIC may make an election to include gain on the stock of aPFIC as ordinary income under a mark-to-market method, provided that such stock isregularly traded on a qualified exchange.
223
For
per
sona
l use
onl
y
If a U.S. Holder held Shares in any year in which were a PFIC, such a U.S. Holder wouldgenerally be required to comply with certain information reporting requirements. U.S. Holdersare urged to consult their own tax advisors regarding the application of the PFIC rules to aninvestment in the Shares.
Information Reporting and Backup Withholding
Dividend payments with respect to the Shares and proceeds from the sale, exchange,redemption or other disposition of Shares made within the United States or through certainU.S.-related financial intermediaries may be subject to information reporting and possible U.S.backup withholding at a current rate of 28%. Backup withholding will generally not apply,however, to a U.S. Holder who furnishes a correct taxpayer identification number and makesany other required certification or who is otherwise exempt from backup withholding. Backupwithholding is not an additional tax. Backup withholding is not an additional tax. Any amountwithheld under the backup withholding rules may generally be credited against a U.S.Holder’s U.S. federal income tax liability, provided that the required information is timely filedwith the Internal Revenue Service (the “IRS”). U.S. Holders should consult their own taxadvisors as to their qualification for exemption from backup withholding and the procedure forobtaining such exemption. In addition, certain U.S. Holders that hold certain foreign financialassets (which may include Shares) are required to report information relating to such assets,subject to exceptions (including an exception for assets held in accounts maintained bycertain financial institutions). U.S. Holders are urged to consult their tax advisors regardingthe effect, if any, of this reporting requirement on their ownership and disposition of Shares.
Additional Tax on Net Investment Income
For taxable years beginning after 31 December 2012, a U.S. Holder that is an individual orestate, or a trust that does not fall into a special class of trusts that is exempt from such tax,will be subject to an additional 3.8% tax on the lesser of (1) the U.S. Holder’s “net investmentincome,” which may include all or a portion of their dividends and net gains from thedisposition of Shares, for the relevant taxable year and (2) the excess of the U.S. Holder’smodified adjusted gross income for the taxable year over a certain threshold (which in thecase of individuals is between $125,000 and $250,000, depending on the individual’scircumstances). A U.S. Holder that is an individual, estate or trust should consult its own taxadvisors regarding the applicability of this tax to its income and gains in respect of itsinvestment in the Shares.
224
For
per
sona
l use
onl
y
PLAN OF DISTRIBUTION
THE OFFERING
Credit Suisse (Singapore) Limited, DBS Bank Ltd. and J.P. Morgan (S.E.A.) Limitedare acting as the Joint Bookrunners and Joint Lead Managers. We are issuing an aggregateof 47,850,000 Offering Shares, in respect of the Offering. The Offering consists of: (i) aPlacement of 47,350,000 Offering Shares to qualified institutional buyers in reliance on Rule144A and outside the United States in offshore transactions in reliance on Regulation S and(ii) a Public Offer of 500,000 Offering Shares in Singapore. The Offering Shares may bereallocated between the Placement and the Public Offer, at the discretion of the JointBookrunners and Joint Lead Managers after consultation with us in the event of an excess ofapplications in one and a deficit in the other.
We and the Joint Bookrunners and Joint Lead Managers have entered into a purchaseagreement dated 11 December 2013 (the “Purchase Agreement”) pursuant to which we willissue and each Joint Bookrunners and Joint Lead Managers will severally (but not jointly)agree to subscribe for, or procure subscribers for, subject to certain conditions, the number ofOffering Shares set forth opposite such Joint Bookrunner and Joint Lead Manager’s name inthe following table, at the Offering Price.
Joint Bookrunners and Joint Lead Managers Number of Shares
Credit Suisse (Singapore) Limited . . . . . . . . . . . . . . . . . . . . . . . . . . . . . . . . . . . . . . . . . . . . . . . . . . . . . . . . . . . . . 15,783,334DBS Bank Ltd. . . . . . . . . . . . . . . . . . . . . . . . . . . . . . . . . . . . . . . . . . . . . . . . . . . . . . . . . . . . . . . . . . . . . . . . . . . . . . . . . . . . 15,783,333J.P. Morgan (S.E.A.) Limited . . . . . . . . . . . . . . . . . . . . . . . . . . . . . . . . . . . . . . . . . . . . . . . . . . . . . . . . . . . . . . . . . . . 15,783,333
Total . . . . . . . . . . . . . . . . . . . . . . . . . . . . . . . . . . . . . . . . . . . . . . . . . . . . . . . . . . . . . . . . . . . . . . . . . . . . . . . . . . . . . . . . . . . . . . 47,350,000
The Purchase Agreement may be terminated at any time prior to delivery of the OfferingShares pursuant to the terms of the Purchase Agreement, upon the occurrence of certainevents, including, among other things, certain force majeure events. The closing of theOffering is conditional upon certain events, including the fulfilment, or waiver by the SGX-ST,of all of the conditions contained in the letter of eligibility from the SGX-ST for the listing andquotation of all of our issued Shares, the Offering Shares, the Additional Shares, theEmployee Option Plan Shares, the Performance Rights Plan Shares, the Call Option Sharesand the CN Shares on the Official List of the SGX-ST.
We and the Joint Bookrunners and Joint Lead Managers have also entered into a offeragreement dated 11 December 2013 (the “Offer Agreement” together with PurchaseAgreement, the “Underwriting Agreements”) for the sale of the Offering Shares to the publicin Singapore. Subject to the terms and conditions in the Offer Agreement, and concurrentlywith the sale of 47,350,000 Shares pursuant to the Purchase Agreement, we have agreed toappoint the Joint Bookrunners and Joint Lead Managers to procure subscribers, and the JointBookrunners and Joint Lead Managers severally have agreed to procure subscribers or,failing which, to subscribe for the number of Offering Shares indicated in the following table,at the Offering Price.
Joint Bookrunners and Joint Lead Managers Number of Shares
Credit Suisse (Singapore) Limited . . . . . . . . . . . . . . . . . . . . . . . . . . . . . . . . . . . . . . . . . . . . . . . . . . . . . . . . . . . . . 166,666DBS Bank Ltd. . . . . . . . . . . . . . . . . . . . . . . . . . . . . . . . . . . . . . . . . . . . . . . . . . . . . . . . . . . . . . . . . . . . . . . . . . . . . . . . . . . . 166,667J.P. Morgan (S.E.A.) Limited . . . . . . . . . . . . . . . . . . . . . . . . . . . . . . . . . . . . . . . . . . . . . . . . . . . . . . . . . . . . . . . . . . . 166,667
Total . . . . . . . . . . . . . . . . . . . . . . . . . . . . . . . . . . . . . . . . . . . . . . . . . . . . . . . . . . . . . . . . . . . . . . . . . . . . . . . . . . . . . . . . . . . . . . 500,000
The completion of the Public Offer is conditional upon the completion of the Placement andvice versa, except for where the only outstanding condition is the completion of the otherUnderwriting Agreement.
The Joint Bookrunners and Joint Lead Managers are offering the Offering Shares, subject toprior sale, when, as and if issued or sold to and accepted by them, subject to certain
225
For
per
sona
l use
onl
y

conditions precedent including the receipt by the Joint Bookrunners and Joint Lead Managersof officer’s certificates and legal opinions. The Joint Bookrunners and Joint Lead Managersreserve the right to withdraw, cancel or modify such offers and to reject orders in whole or inpart.
Expenses and Commission
We will pay the Joint Bookrunners and Joint Lead Managers, as compensation for theirservices in connection with the offer and sale of the Offering Shares, a combinedunderwriting, selling and management commission amounting to 3.5% of the total grossproceeds from the sale of Offering Shares and the sale of the Additional Shares (if the Over-allotment Option is exercised).
We may, at our sole discretion, pay one or more of the Joint Bookrunners and Joint LeadManagers an incentive fee of up to S$4 million of the gross proceeds from the offering of theOffering Shares and the Additional Shares. The additional incentive fee, if it is to be paid toany of the Joint Bookrunners and Joint Lead Managers, will amount to up to S$0.08 perOffering Share.
Purchasers of Shares, other than those in the Singapore Public Offer, may be required to payto the Joint Bookrunners and Joint Lead Managers a brokerage fee up to 1.0% of the OfferingPrice at the time of settlement.
Indemnities
We have agreed in the Underwriting Agreements to indemnify the Joint Bookrunners andJoint Lead Managers against certain liabilities. The indemnity provides that where theindemnification is unavailable or insufficient, our Company shall contribute to the amountpayable by the Joint Bookrunners and Joint Lead Managers as a result of any claims againstthem, in such proportion as is appropriate to reflect the relative benefits to be received by ourCompany and the Joint Bookrunners and Joint Lead Managers from the Offering. Where suchallocation is prohibited by applicable law then our Company and the Joint Bookrunners andJoint Lead Managers shall contribute proportionately to reflect both the relative benefits andthe relative fault of us or the Joint Bookrunners and Joint Lead Managers, as the case maybe, in respect of any misstatement or omission which resulted in such claims and any otherrelevant equitable considerations. The relative benefits to be received by us and the JointBookrunners and Joint Lead Managers pursuant to the Offering will be in the same proportionthat the amount of total net proceeds from the Offering (before deducting expenses) to bereceived by our Company bears to the amount of the total underwriting commissions to bereceived by the Joint Bookrunners and Joint Lead Managers in respect of the Offering. Therelative fault is determined by reference to, among other things, whether the misstatement oromission relates to information supplied by our Company or the Joint Bookrunners and JointLead Managers, as the case may be and the respective parties’ relative intent, knowledge,access to information and opportunity to correct or prevent such misstatement or omission.No Joint Bookrunner and Joint Lead Manager is required to contribute any amount in excessof the amount by which the total price at which the Shares underwritten by it under theOffering exceeds the amount of any damages which such Joint Bookrunner and Joint LeadManager has otherwise been required to pay by reason of such untrue or alleged untruestatement or omission or alleged omission.
Agreement among Joint Bookrunners and Joint Lead Managers and Sub-Underwriting
The Joint Bookrunners and Joint Lead Managers will be entering into an agreement amongunderwriters that provides for the coordination of their activities.
The Joint Bookrunners and Joint Lead Managers have entered and may enter into sub-underwriting and/or sub-placement arrangements in respect of their obligations under theUnderwriting Agreements, upon such terms and conditions as they deem fit.
226
For
per
sona
l use
onl
y
Shares are not Being Registered under the U.S. Securities Act
The Joint Bookrunners and Joint Lead Managers, directly or through their affiliates, proposeto offer the Offering Shares for resale in transactions not requiring registration under the U.S.Securities Act or applicable state securities laws, including sales pursuant to Rule 144A andRegulation S. The Joint Bookrunners and Joint Lead Managers will not offer or sell theOffering Shares except:
‰ within the United States to persons they reasonably believe to be qualified institutionalbuyers within the meaning of Rule 144A; or
‰ outside the United States, pursuant to Regulation S.
In addition, until the expiration of 40 days after the commencement of the Offering, an offer orsale of the Offering Shares within the United States by a dealer (whether or not participatingin the Offering) may violate the registration requirements of the U.S. Securities Act if suchoffer or sale is made otherwise than in accordance with Rule 144A or pursuant to anotherexemption from registration under the U.S. Securities Act.
Shares sold pursuant to Regulation S may not be offered or resold within the United States,except under an exemption from the registration requirements of the U.S. Securities Act orunder a registration statement declared effective under the U.S. Securities Act.
Each purchaser of the Offering Shares will be deemed to have made the acknowledgements,representations and agreements as described under “Transfer Restrictions”.
OVER-ALLOTMENT OPTION
In connection with the Offering, we have granted the Stabilising Manager on behalf of theJoint Bookrunners and Joint Lead Managers, an Over-allotment Option to subscribe for up toan aggregate of the Additional Shares at the Offering Price, exercisable in full or in part onone or more occasions, from the Listing Date until the earliest of (i) the date falling 30 daysfrom the Listing Date, (ii) the date when the Stabilising Manager or its appointed agent hasbought on the SGX-ST, an aggregate of 4,000,000 Shares, representing not more than 8.4%of the total Offering Shares, to undertake stabilising actions, or (iii) the date falling 30 daysafter the date of adequate public disclosure of the Offering Price, solely to cover the over-allotment of the Offering Shares, if any subject to any applicable laws and regulations. In theevent the Over-allotment Option is exercised in full, the total number of issued Shares, afterthe completion of the Offering will be increased to 575,150,642 Shares.
SHARE LENDING AGREEMENT
The Stabilising Manager has entered into a share lending agreement with Newtron (the“Share Lending Agreement”) to borrow 4,000,000 Shares from it, which will be borrowedbefore the commencement of trading of our Shares on the SGX-ST, for the purpose offacilitating settlement of over-allotments, if any, in connection with this Offering pendingexercise of the Over-allotment Option and stabilising actions. Any Shares that may beborrowed by the Stabilising Manager under the Share Lending Agreement will be returned bythe Stabilising Manager to Newtron either through the purchase of Shares in the open marketby the Stabilising Manager in the conduct stabilisation activities or through exercise of theOver-allotment Option by the Stabilising Manager on behalf of the Joint Bookrunners andJoint Lead Managers.
PRICE STABILISATION
In connection with the Offering, the Stabilising Manager (or persons acting on its behalf) mayover-allot Shares or effect transactions which may stabilise or maintain the market price of ourShares at levels above those that might otherwise prevail in the open market. Such
227
For
per
sona
l use
onl
y
transactions may be effected on the SGX-ST and in other jurisdictions where it is permissibleto do so, in each case in compliance with all applicable laws and regulations, including theSecurities and Futures Act and any regulations thereunder. However, there is no assurancethat the Stabilising Manager (or persons acting on its behalf) will undertake any suchstabilisation action. Such transactions may commence on or after the Listing Date and, ifcommenced, may be discontinued at any time and shall not be effected after the earliest of(i) the date falling 30 days from the Listing Date, (ii) the date when the Stabilising Manager orits appointed agent has bought on the SGX-ST an aggregate of 4,000,000 Shares,representing not more than 8.4% of the total Offering Shares, to undertake stabilising actions,or (iii) the date falling 30 days after the date of adequate public disclosure of the OfferingPrice.
Neither we nor the Joint Bookrunners and Joint Lead Managers make any representation orprediction as to the direction or magnitude of any effect that the transactions described abovemay have on the price of the Shares. In addition, neither we nor the Joint Bookrunners andJoint Lead Managers make any representation that the Stabilising Manager will engage inthese transactions or that these transactions, once commenced, will not be discontinuedwithout notice (unless such notice is required by law). The Stabilising Manager will also berequired to make a public announcement through the SGX-ST in relation to the cessation ofstabilising actions and the number of Shares in respect of which the Over-allotment Optionhas been exercised not later than 8.30 a.m. (Singapore time) on the trading day of theSGX-ST immediately after the day of cessation of stabilising actions.
LOCK-UP ARRANGEMENTS
Our Company
We have agreed with the Joint Bookrunners and Joint Lead Managers that, from the date of theOffer Agreement until the date falling six months after the Listing Date (both dates inclusive)(the “First Lock-up Period”), we will not, without the prior written consent of the JointBookrunners and Joint Lead Managers (such consent not to be unreasonably withheld):
‰ issue, offer, sell, pledge, contract to pledge, sell any option or contract to purchase,purchase any option or contract to sell, grant any option, right or warrant to purchase,lend, hypothecate or encumber or otherwise transfer or dispose of, directly or indirectly,or file with the U.S. Securities and Exchange Commission a registration statement underthe Securities Act relating to, any Shares or any securities convertible into or exercisableor exchangeable for any Shares;
‰ enter into any swap, hedge or other arrangement that transfers, in whole or in part, anyof the economic consequences of ownership of the Shares or any securities convertibleinto or exercisable or exchangeable for or repayable with Shares or which carry rights tosubscribe for or purchase Shares whether such swap, hedge or transaction is to besettled by delivery of Shares or other securities, in cash or otherwise;
‰ deposit any Shares or any securities convertible into or exchangeable for or which carryrights to subscribe for or purchase Shares in any depository receipt facilities, whetherany such transaction described above is to be settled by delivery of Shares or such othersecurities, in cash or otherwise; or
‰ publicly announce any intention to do any of the above.
These restrictions shall not apply in respect of Shares issued pursuant to the Offering, theAdditional Shares upon the exercise of the Over-allotment Option, the Employee Option PlanShares, the Performance Rights Plan Shares, the Call Option Shares and the CN Shares.
228
For
per
sona
l use
onl
y
Newtron, ISNY and Mr. Peter Bond
Each of Newtron and ISNY has agreed with the Joint Bookrunners and Joint Lead Managersthat, for the First Lock-up Period and the period commencing on the day immediatelyfollowing the expiry of the First Lock-up Period until the date falling 12 months after the ListingDate (both dates inclusive) (the “Second Lock-up Period”), it will not, without the priorwritten consent of the Joint Bookrunners and Joint Lead Managers (such consent not to beunreasonably withheld):
‰ offer, sell, contract to sell, pledge (except for the Pledged Collateral), sell any option orcontract to purchase, purchase any option or contract to sell, grant any option, right orwarrant to purchase, lend, hypothecate or encumber or otherwise transfer or dispose of,directly or indirectly, or file with the U.S. Securities and Exchange Commission aregistration statement under the Securities Act relating to, any Shares or any securitiesconvertible into or exercisable or exchangeable for any Shares;
‰ enter into any swap, hedge or other arrangement that transfers, in whole or in part, anyof the economic consequences of ownership of the Shares or any securities convertibleinto or exercisable or exchangeable for or repayable with Shares or which carry rights tosubscribe for or purchase Shares whether such swap, hedge or transaction is to besettled by delivery of Shares or other securities, in cash or otherwise;
‰ deposit any Shares or any securities convertible into or exchangeable for or which carryrights to subscribe for or purchase Shares in any depository receipt facilities, whetherany such transaction described above is to be settled by delivery of Shares or such othersecurities, in cash or otherwise; or
‰ publicly announce any intention to do any of the above.
In relation to the Pledged Collateral, being the 71,000,000 Shares that had been pledged byNewtron to Equities pursuant to the Master Loan Agreement and the Master PledgeAgreement, Newtron has procured an undertaking from Equities not to exercise its contractualrights to, among others, sell the Pledged Collateral under the relevant terms of the MasterLoan Agreement and the Master Pledge Agreement in respect of 100.0% of the PledgedCollateral during the First Lock-up Period, and in respect of 50.0% of the Pledged Collateralduring the Second Lock-up Period.
These restrictions shall apply to all Shares held by each of Newtron and ISNY as of the dateof the Offer Agreement and any additional Shares that Newtron and/or ISNY may acquirebetween the date of the Offer Agreement and the Listing Date, for the First Lock-up Period.Each of Newtron and ISNY has also agreed with the Joint Bookrunners and Joint LeadManagers that such restrictions shall apply to 50.0% of the Shares held by it as of the ListingDate, for the Second Lock-up Period.
These restrictions shall not, however, apply in respect of the Shares that were or are thesubject matter of the SLA or the New SLA (the “SLA Shares”) (being a number of up to37,453,184 Shares) and the Shares that were the subject matter of the Share LendingAgreement (the “Loan Shares”) (being a number of up to 4,000,000 Shares), provided thatthe foregoing restrictions shall apply to the SLA Shares and the Loan Shares upon the later of(i) the termination of the New SLA and the Share Lending Agreement, as the case may beand (ii) the return of all loans of SLA Shares and the Loan Shares (if there are existing loansof SLA Shares and the Loan Shares at the time of termination of the New SLA and the ShareLending Agreement, as the case may be, during the First Lock-up Period or the Second Lock-up Period).
Mr. Peter Bond, the sole shareholder of Newtron and ISNY, has agreed with the JointBookrunners and Joint Lead Managers that, for the First Lock-up Period and the Second
229
For
per
sona
l use
onl
y
Lock-up Period, he will not, without the prior written consent of the Joint Bookrunners andJoint Lead Managers (such consent not to be unreasonably withheld):
‰ offer, sell, contract to sell, pledge, sell any option or contract to purchase, purchase anyoption or contract to sell, grant any option, right or warrant to purchase, lend,hypothecate or encumber or otherwise transfer or dispose of, directly or indirectly, or filewith the U.S. Securities and Exchange Commission a registration statement under theSecurities Act relating to, any Shares, any Newtron Shares, any ISNY Shares or anysecurities convertible into or exercisable or exchangeable for any Shares, NewtronShares or ISNY Shares;
‰ enter into any swap, hedge or other arrangement that transfers, in whole or in part, anyof the economic consequences of ownership of the Shares, Newtron Shares, ISNYShares or any securities convertible into or exercisable or exchangeable for or repayablewith Shares, Newtron Shares, ISNY Shares or which carry rights to subscribe for orpurchase Shares, Newtron Shares or ISNY Shares whether such swap, hedge ortransaction is to be settled by delivery of Shares, Newtron Shares or ISNY shares orother securities, in cash or otherwise;
‰ deposit any Shares, Newtron Shares, ISNY Shares or any securities convertible into orexchangeable for or which carry rights to subscribe for or purchase Shares, NewtronShares or ISNY Shares in any depository receipt facilities, whether any such transactiondescribed above is to be settled by delivery of Shares, Newtron Shares, ISNY Shares orsuch other securities, in cash or otherwise; or
‰ publicly announce any intention to do any of the above.
These restrictions shall apply to all Newtron Shares and ISNY Shares held by Mr. Peter Bondas of the date of the Offer Agreement and the Listing Date and any Shares that Mr. PeterBond may acquire (the “Peter Bond Shares”) between the date of the Offer Agreement andthe Listing Date, for the First Lock-up Period. Mr. Peter Bond has also agreed with the JointBookrunners and Joint Lead Managers that such restrictions shall apply to all Newtron Sharesand ISNY Shares held by Mr. Peter Bond as of the Listing Date, and 50% of the Peter BondShares as of the Listing Date, for the Second Lock-up Period.
The above-described restrictions in the lock-ups above, granted by each of Newtron, ISNYand Mr. Peter Bond, on Shares held by each of these persons and which are the subject-matter of their respective lock-ups, shall not in any way prevent any of them from acceptinginto a successful takeover bid, under the Corporations Act of Australia, and from allowingsuch Shares held by each of these persons, to be transferred or cancelled as part of a mergerby scheme of arrangement in accordance with the Corporations Act of Australia. A ‘successfultakeover bid’ for this purpose is one where the holders of at least 50% of the bid class Sharesthat are not subject to the Moratorium Arrangements, and to which the offers under the bidrelate, have accepted. In the event that such takeover bid does not become unconditional,then the above-described restrictions shall continue to apply to such Shares.
An interest in favour of each of the Joint Bookrunners and Joint Lead Managers arises underthe Australian Foreign Acquisitions and Takeovers Act 1975 (“FATA”) in relation to the abovelock-ups granted by Newtron, ISNY and Mr. Peter Bond as the Joint Bookrunners and JointLead Managers will each be entitled to control the exercise of a right attached to the Sharesheld by Newtron and ISNY as well as the Newtron Shares, ISNY Shares and/or Peter BondShares, if any, even though none of them will be registered holders of such Shares, NewtronShares, ISNY Shares and/or Peter Bond Shares, if any or have voting rights.
In this regard, the Australian Federal Treasurer has, directly or through the ForeignInvestment Review Board, issued a statement of no objections (“FIRB Approval”) in relationto the above lock-ups granted by Newtron, ISNY and Mr. Peter Bond in favour of the JointBookrunners and Joint Lead Managers as of the date of the Offer Agreement.
230
For
per
sona
l use
onl
y
Persons intending to subscribe for Shares in the Offering
Following the book-building process by agreement between the Joint Bookrunners and JointLead Managers and us, we understand that Genting intends to subscribe for 47,850,000Offering Shares in the Offering.
Except as disclosed above, we are not aware of any person who intends to subscribe formore than 5.0% of the Shares offered pursuant to the Offering.
OTHER RELATIONSHIPS
In addition, some of the Joint Bookrunners and Joint Lead Managers and their affiliates haveengaged in, and may in the future engage in, investment banking and other commercialdealings in the ordinary course of business with us or our affiliates. They have received, ormay in the future receive, customary fees and commissions for these transactions.
In addition, in the ordinary course of their business activities, the Joint Bookrunners and JointLead Managers and their affiliates may make, sell or hold a broad array of investments andactively trade debt and equity securities (or related derivative securities, including but notlimited to equity derivatives, warrants and any other structured instruments) and financialinstruments (including bank loans, derivatives and other securities) for their own account andfor the accounts of their customers. Such investments and securities activities may involvesecurities and/or instruments of our Company or our affiliates. The Joint Bookrunners andJoint Lead Managers and their affiliates may also make investment recommendations and/orpublish or express independent research views in respect of such securities or financialinstruments and may hold, or recommend to clients that they acquire, long and/or shortpositions in such securities and instruments.
For example, as at the Latest Practicable Date, certain affiliates of Credit Suisse (Singapore)Limited hold an aggregate of approximately 9.5% of the issued share capital of our Company,pursuant to the provision of services related to securities activities, and Credit Suisse(Singapore) Limited acted as advisor to our Company in relation to obtaining approval foramendments to our Company’s currently outstanding 2018 Convertible Notes from theholders of these notes, through a meeting of holders, for which it would be paid a fee. Also,37,453,184 Shares indirectly held by Mr. Peter Bond are the subject matter of a securitieslending agreement (“SLA”) entered into between Newtron as lender, and Credit SuisseEquities (Australia) Limited (“CS Equities”) as borrower, to enable CS Equities to carry outhedging transactions in relation to the 2018 Convertible Notes. Prior to the Listing Date, theSLA will be terminated and the New SLA, in substantially similar term to the SLA, will beentered into between Newtron and Credit Suisse Securities (Europe) Limited (“CS Europe”).The New SLA is to enable CS Europe to carry out hedging transactions in relation to the 2018Convertible Notes, in place of CS Equities. As at the date of this offering document, noShares have been borrowed under the SLA. In addition, certain affiliates of J.P. Morgan(S.E.A.) Limited hold an aggregate of approximately 1.1% of the issued share capital of ourCompany, pursuant to investment on their own account and the provision of services relatedto securities activities.
Our Company has also granted an affiliate of Credit Suisse (Singapore) Limited an upsizeoption in relation to the 2018 Convertible Notes to purchase up to an additionalUS$50.0 million in principal amount of notes on or before 10 May 2014.
SELLING RESTRICTIONS
The distribution of this offering document or any offering material and the offering, sale ordelivery of the Shares is restricted by law in certain jurisdictions. Therefore, persons who maycome into possession of this offering document or any offering material are advised to consultwith their own legal advisors as to what restrictions may be applicable to them and to observe
231
For
per
sona
l use
onl
y
such restrictions. This offering document may not be used for the purpose of an offer orinvitation in any circumstances in which such offer or invitation is not authorised.
No action has been or will be taken in any jurisdiction that would permit a public offering of theShares being offered outside Singapore or the possession, circulation or distribution of thisoffering document or any other material relating to us or the Shares in any jurisdiction whereaction for the purpose is required. Accordingly, the Shares may not be offered or sold, directlyor indirectly, and neither this offering document nor any other offering material oradvertisement in connection with the Shares may be distributed or published, in or from anycountry or jurisdiction except under circumstances that will be in compliance with anyapplicable rules or regulations of any such country or jurisdiction.
United States of America
The Offering Shares are being offered or sold (i) within the United States to “qualifiedinstitutional buyers” in reliance on Rule 144A or another exemption from registration under theU.S. Securities Act and (ii) outside the United States in reliance on Regulation S. The OfferingShares have not been and will not be registered under the U.S. Securities Act and may not beoffered, sold, pledged or transferred within the United States except in certain transactionsnot subject to, or pursuant to an exemption, from the registration requirements of the U.S.Securities Act. Terms used in this paragraph have the meanings given to them byRegulation S under the U.S. Securities Act. In addition, until 40 days after the first date uponwhich the securities were bona fide offered to the public, an offer or sale of the OfferingShares within the United States (whether or not as part of the Offering) by a dealer mayviolate the registration requirements of the U.S. Securities Act, if such offer or sale is madeotherwise than in accordance with Rule 144A.
The Offering Shares have not been approved or disapproved by the U.S. Securities andExchange Commission, any state securities commission in the United States or any otherU.S. regulatory authority, nor have any of the foregoing authorities passed upon or endorsedthe merits of the Offering or the accuracy or adequacy of this document relating to theOffering. Any representation to the contrary is a criminal offence in the United States.
Each purchaser of the Shares in the Offering will be deemed to have made theacknowledgements, representations and agreements as described in “Transfer Restrictions”.
Australia
This offering document does not constitute a prospectus or other disclosure document underthe Corporations Act and does not purport to include the information required of a disclosuredocument under the Australian Corporations Act. This offering document has not been lodgedwith the ASIC and no steps have been taken to lodge it as such with ASIC. Any offer inAustralia of the Offering Shares under this offering document may only be made to personswho are “sophisticated investors” (within the meaning of section 708(8) of the CorporationsAct), to “professional investors” (within the meaning of section 708(11) of the CorporationsAct) or otherwise pursuant to one or more exemptions under section 708 of the CorporationsAct so that it is lawful to offer the Offering Shares in Australia without disclosure to investorsunder Part 6D.2 of the Corporations Act.
Any offer of Offering Shares for on-sale that is received in Australia within 12 months aftertheir issue by us, or within 12 months after their sale by a selling shareholder (or a JointBookrunner and Joint Lead Manager) under the Offering, as applicable, is likely to needprospectus disclosure to investors under Part 6D.2 of the Corporations Act, unless such offerfor on-sale in Australia is conducted in reliance on a prospectus disclosure exemption undersection 708 of the Corporations Act or otherwise. Any persons acquiring the Offering Sharesshould observe such Australian on-sale restrictions.
232
For
per
sona
l use
onl
y
Canada
The Offering Shares may only be offered or sold, directly or indirectly, in Canada in theprovinces of Ontario and Québec or to or for the benefit of any resident of such provinces andnot in any other province or territory of Canada. Such offer or sales will be made pursuant toan exemption from the requirement to file a prospectus in the province of Ontario or Québec,or the case may be,, and only by a dealer duly registered under the applicable securities lawsof that province or territory or in accordance with an exemption from the applicable registereddealer requirements.
China
This offering document has not been and will not be circulated or distributed in the People’sRepublic of China, and the Offering Shares may not be offered or sold, and will not be offeredor sold to any person for re-offering or resale, directly or indirectly, to any resident of thePeople’s Republic of China except pursuant to applicable laws and regulations of thePeople’s Republic of China. For the purpose of this paragraph, People’s Republic of Chinadoes not include Taiwan and the special administrative regions of Hong Kong and Macau.
Dubai International Financial Centre
This offering document relates to an Exempt Offer in accordance with the Offered SecuritiesRules of the Dubai Financial Services Authority (“DFSA”). This offering document is intendedfor distribution only to persons of a type specified in the Offered Securities Rules of the DFSA.It must not be delivered to, or relied on by, any other person. The DFSA has no responsibilityfor reviewing or verifying any documents in connection with Exempt Offers. The DFSA hasnot approved this offering document nor taken steps to verify the information set forth hereinand has no responsibility for the offering document. The shares to which this offeringdocument relates may be illiquid and/or subject to restrictions on their resale. Prospectivepurchasers of the shares offered should conduct their own due diligence on the shares. If youdo not understand the contents of this offering document you should consult an authorisedfinancial advisor.
European Economic Area
In relation to each Member State of the European Economic Area which has implemented theProspectus Directive (each, a “Relevant Member State”), an offer to the public of anyOffering Shares may not be made in that Relevant Member State except that an offer to thepublic in that Relevant Member State of any Offering Shares may be made at any time underthe following exemptions under the Prospectus Directive, if they have been implemented inthat Relevant Member State:
(a) to legal entities which are qualified investors as defined under the ProspectusDirective; or
(b) to fewer than 100, or if the Relevant Member State has implemented the relevantprovisions of the 2010 PD Amending Directive, 150, natural or legal persons (otherthan qualified investors as defined in the Prospectus Directive) subject to obtaining theprior consent of the Joint Issuer Managers for any such offer; or
(c) in any other circumstances falling within Article 3(2) of the Prospectus Directive,
provided that no such offer of Offering Shares shall result in a requirement for the publicationby us or the Joint Bookrunners and Joint Lead Managers of a prospectus pursuant to Article 3of the Prospectus Directive or a supplemental prospectus pursuant to Article 16 of theProspectus Directive.
233
For
per
sona
l use
onl
y
For the purposes of this provision, the expression an “offer of shares to the public” in relationto any Offering Shares in any Relevant Member State means the communication in any formand by any means of sufficient information on the terms of the offer and any Offering Sharesto be offered so as to enable an investor to decide to purchase or subscribe for the OfferingShares, as the same may be varied in that Relevant Member State by any measureimplementing the Prospectus Directive in that Relevant Member State; and the expression“Prospectus Directive” means Directive 2003/71/EC (and amendments thereto including“2010 PD Amending Directive” to the extent implemented in the Relevant Member State) andincludes any relevant implementing measure in each Relevant Member State and theexpression the 2010 PD Amending Directive means Directive 2010/73/EU.
Each purchaser of the Offering Shares in the Offering located within a member state of theEuropean Economic Area will be deemed to have represented, acknowledged and agreedthat it is a “qualified investor” within the meaning of Article 2(1)(e) of the Prospectus Directiveand in the case of any Offering Shares acquired by it as a financial intermediary, as that termis used in Article 3(2) of the Prospectus Directive, (i) the Offering Shares acquired by it in theOffering have not been acquired on behalf of, nor have they been acquired with a view to theiroffer or resale to, persons in any Relevant Member State other than qualified investors, asthat term is defined in the Prospectus Directive, or in circumstances in which the prior consentof the Joint Bookrunners and Joint Lead Managers has been given to the offer or resale; or(ii) where Offering Shares have been acquired by it on behalf of persons in any RelevantMember State other than qualified investors, the offer of those Shares to it is not treatedunder the Prospectus Directive as having been made to such persons. We, each JointBookrunner and Joint Lead Manager and their respective affiliates and others will rely uponthe truth and accuracy of the foregoing representation, acknowledgement and agreement.
Hong Kong
We have not been authorised, nor has the contents of this offering document been approvedby any regulatory authority in Hong Kong. You are advised to exercise caution in relation tothe Offering. If you are in any doubt about any of the contents of this offering document, youshould obtain independent professional advice. Accordingly, (i) no Offering Shares may beoffered or sold in Hong Kong by means of this offering document or any other document otherthan to professional investors within the meaning of Part I of Schedule 1 to the Securities andFutures Ordinance of Hong Kong (Cap. 571) (“SFO”) and any rules made thereunder(“professional investor”), or in other circumstances which do not result in the documentbeing a “prospectus” as defined in the Companies Ordinance of Hong Kong (Cap. 32) (“CO”)or which do not constitute an offer or invitation to the public for the purposes of the CO or theSFO, and (ii) no person may issue or have in its possession for the purposes of issue,whether in Hong Kong or elsewhere, this offering document or any other advertisement,invitation or document relating to the Offering Shares which is directed at, or the contents ofwhich are likely to be accessed or read by, the public in Hong Kong (except if permitted to doso under the securities laws of Hong Kong) other than with respect to Offering Shares whichare or are intended to be disposed of only to persons outside Hong Kong or only to“professional investors”.
Indonesia
The Offering is not registered under the Indonesian Capital Market law and its implementingregulations, and is not intended to become a public offering of securities under the Indonesiancapital market law and regulations. Accordingly, this offering document may not be distributedor passed on within Indonesia or to citizens of Indonesia (wherever they are domiciled orlocated) or entities of or residents in Indonesia in a manner which constitutes a public offeringof securities under the Indonesian capital market law and regulations. The Offering Sharesmay not be offered or sold, directly or indirectly, within Indonesia or to Indonesian citizens(wherever they are domiciled or located), entities or residents in a manner which constitutes apublic offering of securities under the Indonesian capital market law and regulations.
234
For
per
sona
l use
onl
y
Japan
The Offering Shares have not been and will not be registered under the Financial Instrumentand Exchange Law of Japan (the “FIEL”). The Offering Shares have not been offered or soldand will not be offered or sold in Japan or to, or for the benefit of, any resident of Japan(which term shall mean any person resident in Japan or any corporation or other entityorganised under the laws of Japan), or to others for reoffering or resale, directly or indirectly,in Japan or to, or for the benefit of, any resident of Japan, except pursuant to an exemptionfrom the registration requirements of, and otherwise in compliance with, the FIEL and otherapplicable laws, regulations and governmental guidelines in Japan.
Malaysia
No prospectus or other offering material or document in connection with the offer and sale ofthe Offering Shares has been or will be registered with the Securities Commission of Malaysia(the “Commission”) pursuant to the Capital Markets and Services Act 2007 and no approvalfor the offering of the Offering Shares has been obtained from the Commission pursuant tothe Capital Markets and Services Act 2007. Accordingly, this offering document and any otherdocument or material in connection with the offer or sale, or invitation for subscription orpurchase, of the Offering Shares may not be circulated or distributed, nor may the OfferingShares be offered or sold, or be made the subject of an invitation for subscription orpurchase, whether directly or indirectly, to persons in Malaysia other than (i) a closed endfund approved by the Commission; (ii) a holder of a Capital Markets Services License whocarries on the business of fund management; (iii) a person who acquires the Offering Shares,as principal, if the aggregate consideration for the acquisition is not less than Ringgit 250,000(or equivalent in a foreign currency); (iv) a corporation with total net assets exceeding Ringgit10 million (or equivalent in a foreign currency) based on the latest audited accounts; (v) alicensed offshore bank as defined under the Offshore Banking Act 1990; (vi) an offshoreinsurer as defined under the Offshore Insurance Act 1990; or (vii) any other person as may bespecified by the Commission in any guideline issued under section 377 of the Capital Marketsand Services Act 2007; provided that, in each of the preceding categories (i) to (vii), thedistribution of the Offering Shares is made by a holder of a Capital Markets Services Licensewho carries on the business of dealing in securities. This offering document does notconstitute and may not be used for the purpose of a public offering or an issue, offer forsubscription or purchase, invitation to subscribe for or purchase any securities requiring theregistration of a prospectus with the Commission under the Capital Markets and Services Act2007.
Switzerland
The Offering Shares may not be publicly offered in Switzerland and will not be listed on theSIX Swiss Exchange (“SIX”) or on any other stock exchange or regulated trading facility inSwitzerland. This offering document has been prepared without regard to the disclosurestandards for issuance prospectuses under Article 652a or Article 1156 of the Swiss Code ofObligations or the disclosure standards for listing prospectuses under Articles 27 ff. of the SIXListing Manual or the listing rules of any other stock exchange or regulated trading facility inSwitzerland. Neither this offering document nor any other offering or marketing materialrelating to the Offering Shares or the Offering may be publicly distributed or otherwise madepublicly available in Switzerland.
Neither this offering document nor any other offering or marketing material relating to theOffering Shares or the Offering or us have been or will be filed with or approved by any Swissregulatory authority. In particular, this offering document will not be filed with, and the Offeringwill not be supervised by, the Swiss Financial Market Supervisory Authority FINMA(“FINMA”), and the Offering has not been and will not be authorised under the Swiss FederalAct on Collective Investment Schemes (“CISA”). The investor protection afforded to acquirers
235
For
per
sona
l use
onl
y
of interests in collective investment schemes under the CISA does not extend to acquirers ofthe Offering Shares.
The Offering Shares are being offered in Switzerland by way of a private placement, i.e., to asmall number of selected investors only, without any public offer and only to investors who donot purchase the Offering Shares with the intention to distribute them to the public. Theinvestors will be individually approached from time to time. This offering document, as well asany other offering or marketing material relating to the Offering Shares, is confidential and it isexclusively for the use of the individually addressed investors in connection with the offer ofthe Offering Shares in Switzerland and it does not constitute an offer to any other person.This offering document may only be used by those investors to whom it has been handed outin connection with the Offering described herein and may neither directly nor indirectly bedistributed or made available to other persons without our express consent. It may not beused in connection with any other offer and shall in particular not be copied and/or distributedto the public in or from Switzerland.
Taiwan
The Offering Shares have not and will not be registered with the Financial SupervisoryCommission of Taiwan or any other governmental authorities of Taiwan, and are not beingoffered or sold and may not be offered or sold, directly or indirectly, in Taiwan or otherwise,to, or for the benefit of, any resident or entity of Taiwan, except (a) pursuant to therequirements of the securities related laws and regulations in Taiwan; and (b) in compliancewith any other applicable requirements of Taiwan laws.
Thailand
No action has been or will be taken by the Company or by or on behalf of the JointBookrunners and Joint Lead Managers which would permit a public offering of any of theOffering Shares or distribution of the offering document, and this offering document is notintended to constitute an offer to sell or the solicitation of an offer to buy the Offering Sharesin Thailand in which the offer or solicitation of the securities would be prohibited. No generalsolicitation has been or will be conducted and no advertisement in whatever form has beenemployed in Thailand and in other countries where the offer or solicitation of the OfferingShares would be prohibited.
United Arab Emirates (other than the Dubai International Financial Centre)
This offering document has not been, and is not intended to be, approved by the UAE CentralBank, the UAE Ministry of Economy, the Emirates Securities and Commodities Authority orany other authority in the United Arab Emirates (the “UAE”), or by the Dubai FinancialServices Authority or any other authority in any of the free zones established and operating inthe UAE (the “Free Zones”). It should not be assumed that any of us, the Joint Bookrunnersand Joint Lead Managers or any placement agent (i) has received any authorisation orlicense from the UAE Central Bank or any other authorities in the UAE or any Free Zone tosell or market the Offering Shares therein; (ii) is a licensed broker, dealer or investmentadviser under the laws applicable in the UAE or any Free Zone; or (iii) advises residents ofthe UAE or any Free Zone as to the appropriateness of investing in or purchasing or sellingsecurities or other financial products.
This offering document does not constitute a public offer of securities in the UAE under theUAE Commercial Companies Law (Federal Law No. 8 of 1984) (as amended) or otherwise.This offering document is being distributed to a limited number of selected institutional andother sophisticated investors in the UAE (a) upon their request and confirmation that theyunderstand that the Offering Shares have not been approved or licensed by or registered withthe UAE Central Bank or any other relevant licensing authorities or governmental agencies inthe UAE and may not be offered or sold directly or indirectly to the public in the UAE; and
236
For
per
sona
l use
onl
y

(b) on the condition that this offering document will not be provided to any person other thanthe original recipient, is not for general circulation in the UAE and may not be reproduced orused for any other purpose. The information contained in this offering document is notintended to lead to the sale of any securities or the consummation of any agreement of anynature within the territory of the UAE.
United Kingdom
Each Joint Bookrunner and Joint Lead Manager has severally represented, warranted andagreed that (i) it has only communicated or caused to be communicated and will onlycommunicate or cause to be communicated an invitation or inducement to engage ininvestment activity (within the meaning of Section 21 of the Financial Services and MarketsAct 2000) (the “FSMA”) received by it in connection with the issue or sale of the OfferingShares in circumstances in which Section 21(1) of the FSMA does not apply to us; and (ii) ithas complied and will comply with all applicable provisions of the FSMA with respect toanything done by it in relation to the Offering Shares in, from or otherwise involving the UnitedKingdom.
Any investment or investment activity to which this offering document relates is directed onlyat, available only to, and will be engaged in only with (i) persons who are outside the UnitedKingdom or (ii) investment professionals falling within Article 19(5) of the Financial Servicesand Markets Act 2000 (Financial Promotion) Order 2005 (the “Order”) or (iii) persons fallingwithin Article 49(2)(a) to (d) (“high net worth companies, unincorporated associations, etc.”) ofthe Order (all such persons together being referred to as “relevant persons”). Persons whoare not relevant persons should not take any action on the basis of this offering document andshould not act or rely on it or any of its contents.
237
For
per
sona
l use
onl
y
CLEARANCE AND SETTLEMENT
Introduction
A letter-of-eligibility has been obtained from the SGX-ST for the listing and quotation of ourShares on the Main Board of the SGX-ST. For the purpose of trading on the SGX-ST, a boardlot for our Shares will comprise 1,000 Shares. Upon listing and quotation on the SGX-ST, ourShares will be traded under the book-entry settlement system of CDP, and all dealings in andtransactions of our Shares through the SGX-ST will be effected in accordance with the termsand conditions for the operation of Securities Accounts with CDP, as amended from time totime.
CDP, a wholly-owned subsidiary of Singapore Exchange Limited, is incorporated under thelaws of Singapore and acts as a depository and clearing organisation. CDP holds securitiesfor its account holders and facilitates the clearance and settlement of securities transactionsbetween account holders through electronic book-entry changes in the Securities Accountsmaintained by such account holders with CDP.
Our Shares will be registered in the name of CDP or its nominees and held by CDP for andon behalf of persons who maintain, either directly or through depository agents, SecuritiesAccounts with CDP. Persons holding Shares through Securities Account with CDP will not betreated, under the Corporations Act and our Constitution, as members of our Company inrespect of the number of Shares credited to their respective Securities Accounts with CDP.CDP depositors and depository agents on whose behalf CDP holds Shares for may not beaccorded the full rights of membership such as voting rights, the rights to appoint proxies, orthe right to receive Shareholders’ circulars, proxy forms, annual reports, prospectuses andtakeover documents. In such an event, CDP depositors and depository agents will beaccorded only such rights as CDP may make available to them pursuant to CDP’s Terms andConditions to act as Depository for foreign securities. All Shares deposited with CDP, forpurposes of determining our foreign shareholding levels, if required, will be regarded as beingheld by CDP, a non-Australian person.
Persons holding our Shares in a securities account with CDP may withdraw the number ofShares they own from the book-entry settlement system in the form of physical sharecertificates. Such share certificates will not, however, be valid for delivery pursuant to tradestransacted on the SGX-ST, although they will be prima facie evidence of title and may betransferred in accordance with the Constitution. A fee of S$10 for each withdrawal of1,000 Shares or less and a fee of S$25 for each withdrawal of more than 1,000 Shares will bepayable upon withdrawing our Shares from the book-entry settlement system and obtainingphysical share certificates. In addition, a fee of up to S$2 (or such other amount as theDirectors may decide) will be payable to our Share Registrar and Share Transfer Agent foreach share certificate issued, and stamp duty of S$10 is also payable where our Shares arewithdrawn in the name of the person withdrawing our Shares, or S$0.20 per S$100 or partthereof of the last transacted price where our Shares are withdrawn in the name of a thirdparty. Persons holding physical share certificates who wish to trade on the SGX-ST mustdeposit with CDP their share certificates together with the duly executed and stampedinstruments of transfer in favour of CDP, and have their respective Securities Accountscredited with the number of Shares deposited before they can effect the desired trades. A feeof S$10 is payable upon the deposit of each instrument of transfer with CDP. The above feemay be subject to such changes as may be in accordance with CDP’s prevailing policies orthe current tax policies that may be in force in Singapore from time to time.
CDP depositors and depository agents on whose behalf CDP holds Shares for may not beaccorded the full rights of membership such as voting rights, the rights to appoint proxies, orthe right to receive Shareholders’ circulars, proxy forms, annual reports, prospectuses andtakeover documents. In such an event, CDP depositors and depository agents will beaccorded only such rights as CDP may make available to them pursuant to CDP’s Terms andConditions to act as Depository for foreign securities.
238
For
per
sona
l use
onl
y
Transactions in our Shares under the book-entry settlement system will be reflected by theseller’s securities account being debited with the number of Shares sold and the buyer’ssecurities account being credited with the number of Shares acquired. No transfer stamp dutyis currently payable for the transfer of Shares that are settled on a book-entry basis.
Shares credited to a Securities Account may be traded on the SGX-ST on the basis of a pricebetween a willing buyer and a willing seller. Shares credited into a Securities Account may betransferred to any other Securities Account with CDP, subject to the terms and conditions forthe operation of Securities Accounts and a S$10 transfer fee payable to CDP. All personstrading in Shares through the SGX-ST should ensure that the relevant Shares have beencredited into their Securities Account, prior to trading in such Shares, since no assurance canbe given that the Shares can be credited into the Securities Account in time for settlementfollowing a dealing. If the Shares have not been credited into the Securities Account by thedue date for the settlement of the trade, the buy-in procedures of the SGX-ST will beimplemented.
A clearing fee for trades in the Shares on the SGX-ST is payable at the rate of 0.04% of thetransaction value, subject to a maximum of S$600 per transaction. The clearing fee andinstrument of transfer deposit fees may be subject to GST of 7%. Dealings in Shares will becarried out in Singapore dollar and will be effected for settlement in CDP on a scripless basis.Settlement of trades on a normal “ready” basis on the SGX-ST generally takes place on thethird Market Day following the transaction date, and payment for the Shares is generallysettled on the following Market Day. CDP holds securities on behalf of investors in SecuritiesAccounts. An investor may open a direct securities account with CDP or a securities sub-account with a depository agent. A depository agent may be a member company of theSGX-ST, bank, merchant bank or trust company.
239
For
per
sona
l use
onl
y
TRANSFER RESTRICTIONS
Because the following restrictions will apply to the International Offering, purchasers areadvised to consult their own legal counsel prior to making any offer, resale, pledge or othertransfer of the Offering Shares.
Rule 144A Shares
Each purchaser of our Offering Shares within the United States pursuant to Rule 144A, byaccepting delivery of this offering document, will be deemed to have represented, agreed andacknowledged that:
(1) It is (a) a qualified institutional buyer within the meaning of Rule 144A, (b) acquiringsuch Offering Shares for its own account or for the account of a qualified institutionalbuyer, and (c) aware, and each beneficial owner has been advised, that the sale ofsuch Offering Shares to it is being made in reliance on Rule 144A.
(2) It understands that our Offering Shares have not been and will not be registered underthe U.S. Securities Act and may not be offered, sold, pledged or otherwise transferredexcept (a) in accordance with Rule 144A to a person that it and any person acting onits behalf reasonably believe is a qualified institutional buyer purchasing for its ownaccount or for the account of a qualified institutional buyer, (b) in an offshoretransaction in accordance with Rule 903 or Rule 904 of Regulation S or (c) pursuant toan exemption from registration under the U.S. Securities Act provided by Rule 144 (ifavailable), in each case in accordance with any applicable securities laws of any Stateof the United States.
(3) It understands that our Offering Shares purchased pursuant to Rule 144A, to theextent they are in certificated form, unless we determine otherwise in accordance withapplicable law, will bear a legend substantially to the following effect:
THESE SHARES HAVE NOT BEEN AND WILL NOT BE REGISTERED UNDER THEU.S. SECURITIES ACT OF 1933 (THE “U.S. SECURITIES ACT”), OR WITH ANYSECURITIES REGULATORY AUTHORITY OF ANY STATE OR OTHERJURISDICTION OF THE UNITED STATES AND MAY NOT BE OFFERED, SOLD,PLEDGED OR OTHERWISE TRANSFERRED EXCEPT (1) IN ACCORDANCE WITHRULE 144A UNDER THE U.S. SECURITIES ACT TO A PERSON THAT THEHOLDER AND ANY PERSON ACTING ON ITS BEHALF REASONABLY BELIEVE ISA QUALIFIED INSTITUTIONAL BUYER WITHIN THE MEANING OF RULE 144APURCHASING FOR ITS OWN ACCOUNT OR FOR THE ACCOUNT OF AQUALIFIED INSTITUTIONAL BUYER, (2) IN AN OFFSHORE TRANSACTION INACCORDANCE WITH RULE 903 OR RULE 904 OF REGULATION S UNDER THEU.S. SECURITIES ACT OR (3) PURSUANT TO AN EXEMPTION FROMREGISTRATION UNDER THE U.S. SECURITIES ACT PROVIDED BY RULE 144THEREUNDER (IF AVAILABLE), IN EACH CASE IN ACCORDANCE WITH ANYAPPLICABLE SECURITIES LAWS OF ANY STATE OF THE UNITED STATES. NOREPRESENTATION CAN BE MADE AS TO THE AVAILABILITY OF THEEXEMPTION PROVIDED BY RULE 144 UNDER THE U.S. SECURITIES ACT FORRESALES OF THESE SHARES.
(4) We, the Joint Bookrunners and Joint Lead Managers and their affiliates, and others willrely upon the truth and accuracy of the foregoing acknowledgements, representationsand agreements and, if any of such acknowledgments, representations or agreementsdeemed to have been made by it through its purchase of our Offering Shares are nolonger accurate, it will promptly notify us. If it is acquiring any Offering Shares for theaccount of one or more qualified institutional buyers, it represents that it has soleinvestment discretion with respect to each such account and that it has full power tomake the foregoing acknowledgements, representations and agreements on behalf ofeach such account.
240
For
per
sona
l use
onl
y
Prospective purchasers are hereby notified that sellers of our Offering Shares may be
relying on the exemption from the provisions of Section 5 of the U.S. Securities Act
provided by Rule 144A.
Regulation S Shares
Each purchaser of our Offering Shares outside the United States pursuant to Regulation S willbe deemed to have represented, agreed and acknowledged that:
(1) It is aware that the Offering Shares have not been and will not be registered under theU.S. Securities Act or with any securities regulatory authority of any state or otherjurisdiction of the United States.
(2) It is purchasing the Offering Shares in an offshore transaction meeting therequirements of Regulation S.
(3) It will not offer, sell, pledge or transfer any Offering Shares, except in accordance withthe U.S. Securities Act and any applicable laws of any state of the United States andany other jurisdiction.
(4) We, the Joint Bookrunners and Joint Lead Managers and their affiliates, and others willrely upon the truth and accuracy of the foregoing acknowledgements, representationsand agreements and, if any of such acknowledgments, representations or agreementsdeemed to have been made by it through its purchase of our Offering Shares are nolonger accurate, it will promptly notify us.
Any resale or other transfer, or attempted resale or other transfer, made other than incompliance with the above-stated restrictions shall not be recognised by our Company.
General
Each purchaser of our Offering Shares in the Offering will be deemed to have representedand agreed that it is relying on this document and not on any other information orrepresentation concerning us or our Offering Shares and none of us nor any other personresponsible for this document or any part of it, nor the Joint Bookrunners and Joint LeadManagers, will have any liability for any such other information or representation.
241
For
per
sona
l use
onl
y

LEGAL MATTERS
Certain matters in connection with the Offering will be passed upon for us byWongPartnership LLP with respect to matters of Singapore Law and by HWL EbsworthLawyers with respect to matters of Australian Law.
Certain legal matters in connection with the Offering will be passed upon for the JointBookrunners and Joint Lead Managers by Allen & Gledhill LLP with respect to matters ofSingapore law and by Shearman & Sterling LLP with respect to matters of U.S. FederalSecurities Law and New York Law.
Each of WongPartnership LLP, HWL Ebsworth Lawyers, Allen & Gledhill LLP and Shearman &Sterling LLP does not make, or purport to make, any statement in this offering document and isnot aware of any statement in this offering document which purports to be based on astatement made by it, and it makes no representation, express or implied, regarding, and takesno responsibility for, any statement in or omission from this offering document.
242
For
per
sona
l use
onl
y

INDEPENDENT AUDITORS
The consolidated financial statements of Linc Energy Ltd as of and for each of the threefinancial years ended 30 June 2013, 2012 and 2011 included in this Offering Document havebeen audited by KPMG Australia, independent auditors, as set forth in their reports thereonincluded herein.
The liability of KPMG, in relation to the performance of their professional services provided toLinc Energy Ltd including, without limitation, KPMG’s audits of Linc Energy Ltd’s consolidatedfinancial statements described above, is limited under the Institute of Chartered Accountantsin Australia (NSW) Scheme approved by the New South Wales Professional StandardsCouncil or such other applicable scheme approved pursuant to the Professional StandardsAct 1994 (NSW), including the Treasury Legislation Amendment (Professional Standards)Act.
243
For
per
sona
l use
onl
y
GENERAL AND STATUTORY INFORMATION
INFORMATION ON DIRECTORS AND EXECUTIVE OFFICERS
1. Except as disclosed below, none of our Directors or Executive Officers is or wasinvolved in any of the following events
(a) during the last 10 years, an application or a petition under any bankruptcy lawsof any jurisdiction was filed against him or against a partnership of which hewas a partner at the time when he was a partner or at any time within two yearsfrom the date he ceased to be a partner;
(b) during the last 10 years, an application or a petition under any law of anyjurisdiction was filed against an entity (not being a partnership) of which he wasa Director or an equivalent person or a key executive, at the time when he wasa director or an equivalent person or a key executive of that entity, for thewinding-up or dissolution of that entity, or where that entity is the trustee of abusiness trust, that business trust, on the ground of insolvency;
(c) any unsatisfied judgements against him;
(d) a conviction of any offence, in Singapore or elsewhere, involving fraud ordishonesty which is punishable with imprisonment, or has been the subject ofany criminal proceedings (including any pending criminal proceedings of whichhe is aware) for such purpose;
(e) a conviction of any offence, in Singapore or elsewhere, involving a breach ofany law or regulatory requirement that relates to the securities or futuresindustry in Singapore or elsewhere, or has been the subject of any criminalproceedings (including pending criminal proceedings of which he is aware) forsuch breach;
(f) during the last 10 years, judgement entered against him in any civil proceedingsin Singapore or elsewhere involving a breach of any law or regulatoryrequirement that relates to the securities or futures industry in Singapore orelsewhere, or a finding of fraud, misrepresentation or dishonesty on his part, orhas been the subject of any civil proceedings (including any pending civilproceedings of which he is aware) involving an allegation of fraud,misrepresentation or dishonesty on his part;
(g) a conviction in Singapore or elsewhere of any offence in connection with theformation or management of any entity or business trust;
(h) disqualification from acting as a Director or an equivalent person of any entity(including the trustee of a business trust), or from taking part directly orindirectly in the management of any entity or business trust;
(i) any order, judgement or ruling of any court, tribunal or governmental bodypermanently or temporarily enjoining him from engaging in any type of businesspractice or activity;
(j) to his knowledge, been concerned with the management or conduct, inSingapore or elsewhere, of affairs of:
(i) any corporation which has been investigated for a breach of any law orregulatory requirement governing corporations in Singapore orelsewhere;
(ii) any entity (not being a corporation) which has been investigated for abreach of any law or regulatory requirement governing such entities inSingapore or elsewhere;
244
For
per
sona
l use
onl
y
(iii) any business trust which has been investigated for a breach of any lawor regulatory requirement governing business trusts in Singapore orelsewhere; or
(iv) any entity or business trust which has been investigated for a breach ofany law or regulatory requirement that relates to the securities or futuresindustry in Singapore or elsewhere, in connection with any matteroccurring or arising during the period when he was so concerned withthe entity or business trust; or
(k) the subject of any current or past investigation or disciplinary proceedings, orhas been reprimanded or issued any warning, by the Authority or any otherregulatory authority, exchange, professional body or government agency,whether in Singapore or elsewhere.
Mr. Peter Bond was a director of Universal Trading Co. Pty Ltd from 23 January 2007 to31 March 2009. Due to the inability of Universal Trading Co. Pty Ltd to raise additional capitalto continue the development of its technology platform following the exit of Mr. Bond as itsmajor investor in March 2009, a liquidator was appointed by the Supreme Court of New SouthWales pursuant to a winding up order made by creditors against Universal Trading Co. PtyLtd in September 2010. A deregistration request was filed in November 2010 and thecompany was subsequently deregistered in January 2011. Mr. Bond was not involved in themanagement of Universal Trading Co. Pty Ltd subsequent to leaving the company in March2009.
Mr. Lim Ah Doo, our Non-Executive Lead Independent Director, was non-executiveIndependent Commissioner of PT Indosat Tbk (“PT Indosat”) from December 2002 to August2008 and chairman of the audit committee from June 2004 to June 2008.
In November 2007, PT Indosat along with 6 other Indonesian telecommunications companieswere investigated by Indonesia’s anti competition authority, KPPU, on allegations of price-fixing of SMS and breach of Anti-monopoly Laws of Indonesia. No violation of Anti-monopolyLaws was found against PT Indosat.
Temasek Holdings Pte Ltd, ST Telemendia Ltd, STT Communications Ltd, Asia MobileHolding Company Pte Ltd, ICL, ICLS, SingTel, SingTel Mobile and PT Indosat wereinvestigated by KPPU on concerns of breaches of Article 27(a) of the Antimonopoly Laws ofIndonesia. There was no finding of breach of law by PT Indosat at the time when Mr. Lim leftPT Indosat.
Mr. Lim was president of RGM International Pte Ltd (which is now known as “RGE Pte. Ltd.”)from October 2003 to June 2007 and the non-executive vice chairman of the RGM Groupfrom June 2007 to November 2008. Mr. Lim was also the acting president of AAA Oils & FatsPte. Ltd. from June 2007 to November 2007 and the non-executive deputy chairman of AAAOils & Fats Pte. Ltd. from November 2007 to November 2008. RGE Pte. Ltd. providesstrategy services and support to a global group of independent companies (the “RGE Group”)operating in the resources development sector. Asian Agri is a member of the RGE Groupand AAA Oils & Fats is a member of Asian Agri. Each business group of the RGE operatesindependently with its own holding company and directors responsible for the operations ofthat group. Certain Indonesian companies of Asian Agri operating in Indonesia, wereinvestigated by the tax authorities of Indonesia in November 2006 for alleged non-payment ofcertain tax. The tax authorities of Indonesia had not confirmed any findings of breach of law atthe time when Mr. Lim left RGE Group in November 2008. Mr. Lim was not a member of theboard nor was he concerned with the management of the companies under investigation.
Mr. Stuart Jones, our Chief Financial Officer, was previously appointed as CFO of privatelyowned Viking Oil & Gas International Ltd (“VOGIL”), based in London, in May 2008. VOGILowned 100% of Viking Field Development Solutions Pte Ltd (“VFDS”) which owned two crude
245
For
per
sona
l use
onl
y
oil trading tankers. Mr. Jones was engaged by VOGIL specifically to seek project financing forthe conversion of one of the two tankers owned by VFDS, into floating production storage andoff-take vessels (“FPSO”). VFDS and another company (the “Customer Co”) entered into amemorandum of understanding (“MOU”) to undertake the conversion whereby Customer Cowould take a long lease over the converted vessel at completion of the works. As there was acasual vacancy on the board of VFDS and the board was inquorate, he was approached byVOGIL shareholders to be appointed as an unpaid director of VFDS in June 2008. In oraround November 2008, Customer Co terminated the MOU which lead to a departure of allVFDS’ senior staff including the Chief Operating Officer and Managing Director. VOGILsought compensation from Customer Co under the MOU and simultaneously entered intodebt restructuring discussions with its banker under a revised strategy to lease the vessels toanother energy company. Due to the Global Financial Crisis, the bankers, who had initiallybeen supportive, refused the restructure plan for their own reasons and exercised theirsecurity over the tankers in July 2009.
Mr. Jones, by way of a resignation letter, resigned from his position as CFO at VOGIL and asdirector of VFDS in July 2009 due to a lack of support from bankers and the VOGILshareholders. Mr. Jones was never paid for his director position at VFDS. Mr. Jonesrequested that the VOGIL remove his directorship from the register of directors. In August2010, a third party commenced compulsory winding up proceedings against VFDS, on thegrounds of insolvency. Mr. Jones was never employed by VFDS and was not involved in theday-to-day operational management of VFDS except by necessity to restore some order afterall senior VFDS executives and employees left.
Mr. Scott Broussard, our President, Oil and Gas, was the chief executive officer and chairmanof the board of directors of Probe Resources Ltd., a Canadian listed company from early 2008to late 2010. As announced in November 2010, due to events such as Hurricane Ike,unprecedented declines in commodity prices, and the mechanical failure of a well, ProbeResources Ltd. faced difficulties accessing affordable capital. Upon the expiration of a debtrestructuring agreement that it was a party to, Probe Resources Ltd. appointed a restructuringagent, and subsequently filed a voluntary petition under the Chapter 11 of the U.S.Bankruptcy Code in December 2010, after Mr. Broussard stepped down from his position asthe chief executive officer and chairman of Probe Resources Ltd. Probe Resources Ltd.subsequently emerged from its voluntary Chapter 11 bankruptcy filing in April 2011.
Mr. Donald Schofield, our President, SAPEX, was a director of White Sands PetroleumLimited (now known as “Triangle Energy (Global) Ltd”) (“White Sands”) from August 2004 toJuly 2008. As at December 2006, the directors of White Sands formed the view that theinvestment to address their liquidity issues might not have come through and appointedJefferson Collins Joiner (“JCJ”) as administrators with effect from 20 December 2006.Pursuant to creditors’ meetings, White Sands entered into a deed of company arrangementwhich was executed on 27 June 2007. On 26 July 2007, White Sands announced a proposalto repay its creditors in full, be recapitalised and have its ordinary shares reinstated forquotation on the ASX. Under the proposal, the administrators executed the deed of companyarrangement which transferred the claims of White Sands’ unsecured creditors to a creditorstrust for repayment over a 12 month period (commencing on completion of restructuring). Itwas also proposed that White Sands would raise up to US$60.0 million from qualified andinstitutional investors and White Sands would acquire Maverick Drilling Company, a contractdrilling company based in Texas, United States. Mr. Schofield, and the directors of WhiteSands, recommended that shareholders support the proposal. On 24 August 2007, WhiteSands changed its name to “Maverick Drilling International Ltd” and carried out the capitalreorganisation. The initial proposal to restructure Maverick Drilling International Ltd andreinstate the company to the official list of the ASX in 2007 was unsuccessful. However, afteranother creditors meeting at the end of 2007, further proposals to recapitalise and relistMaverick Drilling International Ltd were made. On 3 July 2008, the securities of MaverickDrilling International Ltd were reinstated to the official list of the ASX and commenced trading
246
For
per
sona
l use
onl
y
on 7 July 2008. Maverick Drilling International Ltd continues to be listed on the ASX under thename “Triangle Energy (Global) Ltd” at present. Mr. Donald Schofield left the board on 2 July2008.
A class action claim has been commenced by shareholders, who purchased shares in WhiteSands between 28 November 2005 and 20 December 2006 and who sold them at a lossduring that time or who continued to hold the shares on 20 December 2006, against theformer directors of White Sands for alleged misleading statements made in the prospectusdated 29 November 2005 and alleged misleading announcements made on the ASXannouncement platform and/or failure to make proper disclosure to the market. The allegedmisleading disclosures relate to the capabilities of a drill rig which was newly acquired byWhite Sands as well as the reasonableness of the drilling schedule and the forecast cash flowassociated with this drilling rig. In particular, this drill rig was purchased in Norway andtransported to Australia where it underwent the necessary work to be deemed fit for purposeunder Australian regulations. Details of the work required were provided by the rigmanufacturer in Norway prior to the purchase, and the work was undertaken using technicalaudits from two separate experienced independent rig engineering auditors. This workrequired more time and money than which was estimated as disclosed in the prospectus ofWhite Sands due primarily to shortage of supplies as a result of increased demand whichoccurred after the issue of the such prospectus and during the necessary work conducted.The aggregate claim is for the amount of A$3.5 million representing the decrease in totalmarket value of the shares as a result of the restructuring. This matter is currently being heardin the Federal Court of Australia, South Australia.
In relation to the aforementioned, these allegations are being defended and none of theallegations were instituted solely against Mr. Schofield.
Mr. Michael Mapp, our President, Coal, was Operators Representative and General Managerof Integra Coal Operations Pty Ltd (“ICO”) and Glennies Creek Management Pty Ltd(“GCCM”) between December 2005 and May 2007. By virtue of his positions then, heassisted with the investigations where an employee sustained a serious eye injury at theIntegra coal mine site. This incident was investigated by the NSW Department of PrimaryIndustries, and ICO and GCCM were fined pursuant to a breach of the Occupational Health &Safety Act. GCCM was convicted of a breach of section 8(1) and fined A$55,000 and ICOwas convicted of a breach of section 8(2) and fined A$55,000. The employee was able toclaim compensation for his injuries. Mr. Mapp was not the subject of these investigations.
In addition, Mr. Mapp was director of Coal Operations Australia at Vale Australia Pty Ltd.between October 2008 and February 2010. In April 2009, there was a fatality at the Intergracoal mine site and by virtue of his position then, he assisted with the investigations. Thisincident was investigated by the NSW Department of Primary Industries, and ICO and GCCM(being owned by Vale Australia Pty Ltd) were being investigated in connection a breach of theOccupational Health & Safety Act. These matters are still pending hearing. Mr. Mapp was notthe subject of these investigations.
SHARE CAPITAL
2. As at the Latest Practicable Date, there is only one class of Shares in the capital of ourCompany. The rights and privileges attached to our Shares are stated in ourConstitution. There are no founders, management or deferred shares. SubstantialShareholders, Directors and Chief Executive Officer of our Company are not entitled toany different voting rights from the other Shareholders.
3. Save for the Over-allotment Option, the 2018 Convertible Notes, the Genting CallOption and as disclosed in “Share-Based Incentive Plans”, as at the date of thisoffering document, no person (including any Director or Executive Officer) has been, orhas the right to be, given an option to subscribe for or purchase any securities of ourCompany or any of our subsidiaries.
247
For
per
sona
l use
onl
y
WORKING CAPITAL
4. Our Directors are of the reasonable opinion that, after taking into account our cash andbank balance, existing banking facilities, net proceeds raised from the Offering andcash generated from our operating activities, our targeted production schedule, ourplanned capital expenditure for our assets, our working capital as at the date of thisoffering document is sufficient for our present requirements and for 18 months afterListing which includes (i) operating, general and administrative and financing costs;(ii) property holding costs; and (iii) costs of any proposed exploration and/ordevelopment. For a further description of our working capital, see “Management’sDiscussion and Analysis of Financial Condition and Results of Operations—Liquidityand Capital Resources”.
MATERIAL CONTRACTS
5. We have not entered into any material contracts, which are not in the ordinary courseof our business, within the two years preceding the date of lodgement of this offeringdocument.
CONSENTS
6. Credit Suisse (Singapore) Limited, DBS Bank Ltd. and J.P. Morgan (S.E.A.) Limited,named as the Joint Issue Managers, Joint Bookrunners and Joint Lead Managers,have each given, and not withdrawn, their written consent to the issue of this offeringdocument with the inclusion herein of, and all references to, their name and allreferences thereto in the form and context in which they appear in this offeringdocument, and to act in such capacity in relation to this offering document.
7. KPMG Australia as the Independent Auditor with respect to Independent Auditors’Report on the Consolidated Financial Statements for the years ended 30 June 2011,2012 and 2013 has given and has not withdrawn its written consent to the issue of thisoffering document with the inclusion herein of, and all references to its name andreferences thereto in the form and context in which it appears and the inclusion hereinof the section “Appendix F—Independent Auditors’ Report on the ConsolidatedFinancial Statements for the Years Ended 30 June 2011, 2012 and 2013” which wasprepared for purposes of inclusion in this offering document and to act in such capacityin relation to this document.
8. Wood Mackenzie (Australia) Pty Ltd as the Industry Consultant has given and has notwithdrawn its written consent to the issue of this offering document with the inclusionherein of its name and references thereto in the form and context which it appears andthe inclusion herein of the section “Appendix G—Industry Overview” which wasprepared for purposes of inclusion in this offering document and to act in such capacityin relation to this offering document.
9. Haas Petroleum Engineering Services, Inc., the Qualified Person with respect to our oiland gas assets in the Gulf Coast Region, has given and has not withdrawn its writtenconsent to the issue of this offering document with the inclusion herein of its name andreferences thereto in the form and context which it appears and the inclusion herein ofits report titled “Appraisal of Certain Oil and Gas Interests owned by Linc Gulf CoastPetroleum, Inc. located in Louisiana and Texas as of 1 September 2013” in the section“Appendix I—Qualified Persons’ Reports” which was prepared for purposes ofinclusion in this offering document and to act in such capacity in relation to this offeringdocument.
10. Ryder Scott Company, L.P., the Qualified Person with respect to our oil and gasassets in Wyoming and Alaska, has given and has not withdrawn its written consent tothe issue of this offering document with the inclusion herein of its name and references
248
For
per
sona
l use
onl
y
thereto in the form and context which it appears and the inclusion herein of its reportstitled “Competent Person’s Report on Linc Energy Umiat Field, Alaska” and“Competent Person’s Report on Linc Energy Petroleum (Wyoming), Inc” on in thesection “Appendix I—Qualified Persons’ Reports” which was prepared for purposes ofinclusion in this offering document and to act in such capacity in relation to this offeringdocument.
11. DeGolyer and MacNaughton, the Qualified Person with respect to our oil and gasassets in the Arckaringa Basin, Australia, has given and has not withdrawn its writtenconsent to the issue of this offering document with the inclusion herein of its name andreferences thereto in the form and context which it appears and the inclusion herein ofits report titled “Report as of September 15, 2013 on the Prospective Resourcesattributable to Certain Prospects owned by Linc Energy Ltd. in Various License Blocksin the Arckaringa Basin, South Australia” in the section “Appendix I—QualifiedPersons’ Reports” which was prepared for purposes of inclusion in this offeringdocument and to act in such capacity in relation to this offering document.
12. Gustavson Associates LLC, the Qualified Person with respect to our oil and gas assetsin the Arckaringa Basin, Australia, has given and has not withdrawn its written consentto the issue of this offering document with the inclusion herein of its name andreferences thereto in the form and context which it appears and the inclusion herein ofits report titled “Resource and Evaluation Report of the Arckaringa Basin, SouthAustralia” in the section “Appendix I—Qualified Persons’ Reports” which was preparedfor purposes of inclusion in this offering document and to act in such capacity inrelation to this offering document.
13. Snowden Mining Industry Consultant Pty Ltd, the Qualified Person with respect to ourconventional coal mining assets in Queensland, Australia, has given and has notwithdrawn its written consent to the issue of this offering document with the inclusionherein of its name and references thereto in the form and context which it appears andthe inclusion herein of its report titled “Independent Qualified Persons’ Report on theMineral Assets of New Emerald Coal Pty Ltd” in the section “Appendix I—QualifiedPersons’ Reports” which was prepared for purposes of inclusion in this offeringdocument and to act in such capacity in relation to this offering document.
14. Xenith Consulting Pty Ltd the Qualified Person with respect to our conventional coalreserves and resources in the Blair Athol Mine and coal resources in the TeresaProject, has given and has not withdrawn its written consent to the issue of thisoffering document with the inclusion herein of its name and references thereto in theform and context which it appears and the inclusion herein of its reports titled “BlairAthol Reserve QP Report”, “JORC Reserves Estimate Project Bill”, “Blair AtholResource QP Reserve Report”, “New Emerald Coal Pty Ltd Blair Athol Project CoalResource Estimate”, “Teresa Reserve QP Reserve Report”, “New Emerald Coal PtyLtd JORC Resource Estimate Statement Teresa Project”, “Dalby Resource QPReserve Report”, “New Emerald Coal Pty Ltd Independent Geological Appraisal TiptonProject”, “Pentland Resource QP Reserve Report”, and “New Emerald Coal Pty LtdIndependent Geological Appraisal Pentland Project” in the section “Appendix I—Qualified Persons’ Reports” which was prepared for purposes of inclusion in thisoffering document and to act in such capacity in relation to this offering document.
15. MineCraft Consulting Pty Ltd, the Qualified Person with respect to our conventionalcoal reserves in the Teresa Project, has given and has not withdrawn its writtenconsent to the issue of this offering document with the inclusion herein of its name andreferences thereto in the form and context which it appears and the inclusion herein ofits reports titled “Teresa Project JORC Reserves Qualified Persons Report” and “NewEmerald Coal Pty Ltd Independent Geological Appraisal Pentland Project” in the
249
For
per
sona
l use
onl
y
section “Appendix I—Qualified Persons’ Reports” which was prepared for purposes ofinclusion in this offering document and to act in such capacity in relation to this offeringdocument.
16. We are not aware of any matter that has caused us to believe that our Group:
(a) has not obtained all material licences, permits or certificates necessary toconduct our operations from the relevant governmental bodies in thejurisdictions where our Group operates;
(b) is not in compliance with all laws, rules and regulations in all jurisdictions inwhich our Group operates, including but not limited to, the proper incorporationand good standing of any incorporated subsidiary or interest, except wheresuch non-compliance is not material to our Group’s business operations; and
(c) does not possess title to or valid and enforceable rights to any assets (includinglicenses and agreements) as is appropriate to our Company or our Group,except where such lack of, or defect in, such title or rights is not material to ourGroup’s business operations.
RESPONSIBILITY STATEMENT BY THE DIRECTORS
17. Our Directors collectively and individually accept full responsibility for the accuracy ofthe information given in this offering document and confirm after making all reasonableenquiries that, to the best of their knowledge and belief, this offering documentconstitutes full and true disclosure of all material facts about the Offering, ourCompany and our subsidiaries, and our Directors are not aware of any facts theomission of which would make any statement in this offering document misleading.Where information in this offering document has been extracted from published orotherwise publicly available sources or obtained from a named source, the soleresponsibility of our Directors has been to ensure that such information has beenaccurately and correctly extracted from those sources and/or reproduced in thisoffering document in its proper form and context.
DOCUMENTS AVAILABLE FOR INSPECTION
18. Copies of the following documents may be inspected at 50 Raffles Place #32-01,Singapore Land Tower, Singapore 048623 during normal business hours for a periodof six months from the date of registration of this offering document by the Authority(prior appointment would be appreciated):
(a) our Company’s Constitution;
(b) our consolidated financial statements for FY2011, FY2012 and FY2013;
(c) the audited statements of our Company for FY2011, FY2012 and FY2013;
(d) the audited financial statements of SAPEX Limited, Linc Energy (Europe) Ltdand Linc Energy Operations Pty Ltd (being subsidiaries which have auditedfinancial statements) for FY2012;
(e) the letters of consent and reports referred to in paragraphs 6 to 15 above;
(f) the service contracts referred to in the “Management—Directors—ServiceAgreements”; and
(g) the rules of the Employee Option Plan and the Performance Rights Plan.
250
For
per
sona
l use
onl
y
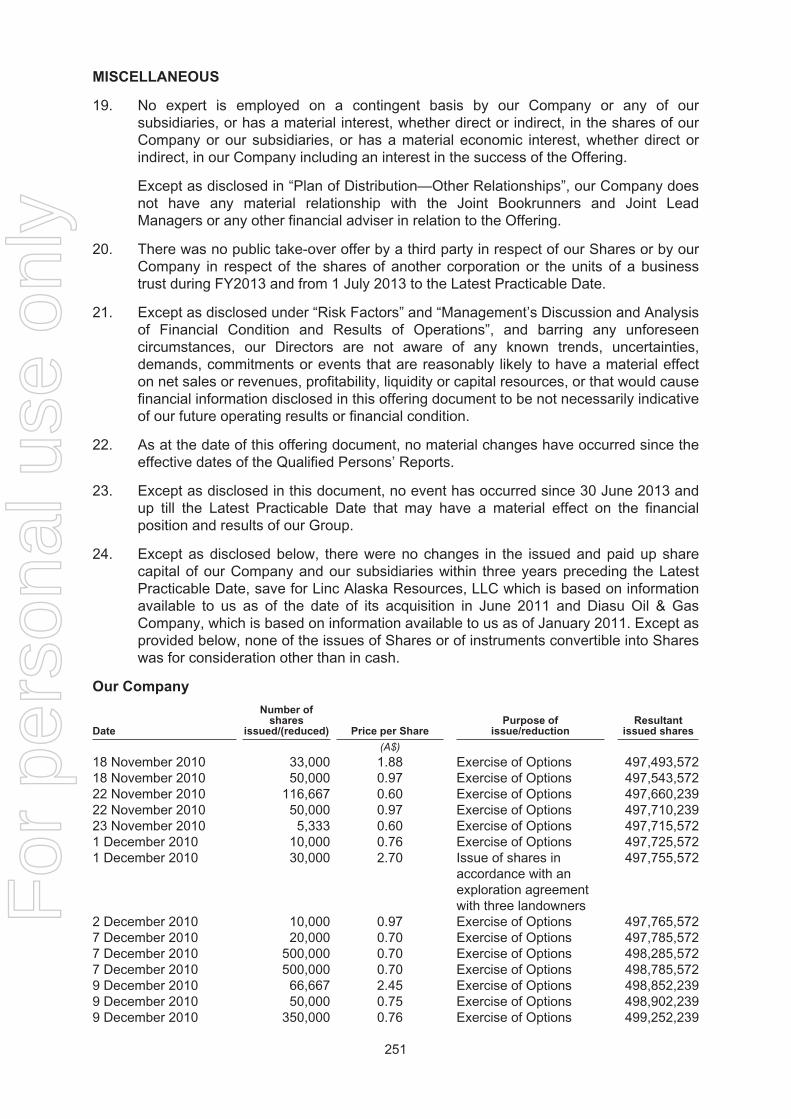
MISCELLANEOUS
19. No expert is employed on a contingent basis by our Company or any of oursubsidiaries, or has a material interest, whether direct or indirect, in the shares of ourCompany or our subsidiaries, or has a material economic interest, whether direct orindirect, in our Company including an interest in the success of the Offering.
Except as disclosed in “Plan of Distribution—Other Relationships”, our Company doesnot have any material relationship with the Joint Bookrunners and Joint LeadManagers or any other financial adviser in relation to the Offering.
20. There was no public take-over offer by a third party in respect of our Shares or by ourCompany in respect of the shares of another corporation or the units of a businesstrust during FY2013 and from 1 July 2013 to the Latest Practicable Date.
21. Except as disclosed under “Risk Factors” and “Management’s Discussion and Analysisof Financial Condition and Results of Operations”, and barring any unforeseencircumstances, our Directors are not aware of any known trends, uncertainties,demands, commitments or events that are reasonably likely to have a material effecton net sales or revenues, profitability, liquidity or capital resources, or that would causefinancial information disclosed in this offering document to be not necessarily indicativeof our future operating results or financial condition.
22. As at the date of this offering document, no material changes have occurred since theeffective dates of the Qualified Persons’ Reports.
23. Except as disclosed in this document, no event has occurred since 30 June 2013 andup till the Latest Practicable Date that may have a material effect on the financialposition and results of our Group.
24. Except as disclosed below, there were no changes in the issued and paid up sharecapital of our Company and our subsidiaries within three years preceding the LatestPracticable Date, save for Linc Alaska Resources, LLC which is based on informationavailable to us as of the date of its acquisition in June 2011 and Diasu Oil & GasCompany, which is based on information available to us as of January 2011. Except asprovided below, none of the issues of Shares or of instruments convertible into Shareswas for consideration other than in cash.
Our Company
Date
Number ofshares
issued/(reduced) Price per SharePurpose of
issue/reductionResultant
issued shares
(A$)
18 November 2010 33,000 1.88 Exercise of Options 497,493,57218 November 2010 50,000 0.97 Exercise of Options 497,543,57222 November 2010 116,667 0.60 Exercise of Options 497,660,23922 November 2010 50,000 0.97 Exercise of Options 497,710,23923 November 2010 5,333 0.60 Exercise of Options 497,715,5721 December 2010 10,000 0.76 Exercise of Options 497,725,5721 December 2010 30,000 2.70 Issue of shares in
accordance with anexploration agreementwith three landowners
497,755,572
2 December 2010 10,000 0.97 Exercise of Options 497,765,5727 December 2010 20,000 0.70 Exercise of Options 497,785,5727 December 2010 500,000 0.70 Exercise of Options 498,285,5727 December 2010 500,000 0.70 Exercise of Options 498,785,5729 December 2010 66,667 2.45 Exercise of Options 498,852,2399 December 2010 50,000 0.75 Exercise of Options 498,902,2399 December 2010 350,000 0.76 Exercise of Options 499,252,239
251
For
per
sona
l use
onl
y
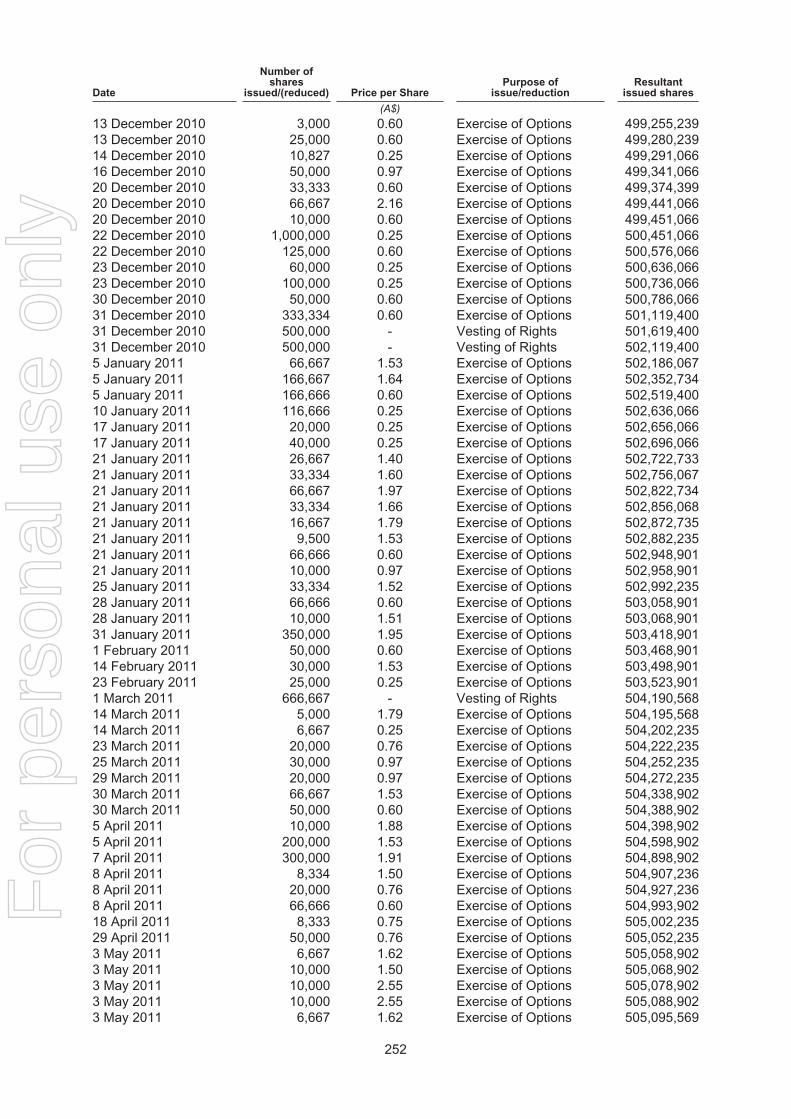
Date
Number ofshares
issued/(reduced) Price per SharePurpose of
issue/reductionResultant
issued shares
(A$)
13 December 2010 3,000 0.60 Exercise of Options 499,255,23913 December 2010 25,000 0.60 Exercise of Options 499,280,23914 December 2010 10,827 0.25 Exercise of Options 499,291,06616 December 2010 50,000 0.97 Exercise of Options 499,341,06620 December 2010 33,333 0.60 Exercise of Options 499,374,39920 December 2010 66,667 2.16 Exercise of Options 499,441,06620 December 2010 10,000 0.60 Exercise of Options 499,451,06622 December 2010 1,000,000 0.25 Exercise of Options 500,451,06622 December 2010 125,000 0.60 Exercise of Options 500,576,06623 December 2010 60,000 0.25 Exercise of Options 500,636,06623 December 2010 100,000 0.25 Exercise of Options 500,736,06630 December 2010 50,000 0.60 Exercise of Options 500,786,06631 December 2010 333,334 0.60 Exercise of Options 501,119,40031 December 2010 500,000 - Vesting of Rights 501,619,40031 December 2010 500,000 - Vesting of Rights 502,119,4005 January 2011 66,667 1.53 Exercise of Options 502,186,0675 January 2011 166,667 1.64 Exercise of Options 502,352,7345 January 2011 166,666 0.60 Exercise of Options 502,519,40010 January 2011 116,666 0.25 Exercise of Options 502,636,06617 January 2011 20,000 0.25 Exercise of Options 502,656,06617 January 2011 40,000 0.25 Exercise of Options 502,696,06621 January 2011 26,667 1.40 Exercise of Options 502,722,73321 January 2011 33,334 1.60 Exercise of Options 502,756,06721 January 2011 66,667 1.97 Exercise of Options 502,822,73421 January 2011 33,334 1.66 Exercise of Options 502,856,06821 January 2011 16,667 1.79 Exercise of Options 502,872,73521 January 2011 9,500 1.53 Exercise of Options 502,882,23521 January 2011 66,666 0.60 Exercise of Options 502,948,90121 January 2011 10,000 0.97 Exercise of Options 502,958,90125 January 2011 33,334 1.52 Exercise of Options 502,992,23528 January 2011 66,666 0.60 Exercise of Options 503,058,90128 January 2011 10,000 1.51 Exercise of Options 503,068,90131 January 2011 350,000 1.95 Exercise of Options 503,418,9011 February 2011 50,000 0.60 Exercise of Options 503,468,90114 February 2011 30,000 1.53 Exercise of Options 503,498,90123 February 2011 25,000 0.25 Exercise of Options 503,523,9011 March 2011 666,667 - Vesting of Rights 504,190,56814 March 2011 5,000 1.79 Exercise of Options 504,195,56814 March 2011 6,667 0.25 Exercise of Options 504,202,23523 March 2011 20,000 0.76 Exercise of Options 504,222,23525 March 2011 30,000 0.97 Exercise of Options 504,252,23529 March 2011 20,000 0.97 Exercise of Options 504,272,23530 March 2011 66,667 1.53 Exercise of Options 504,338,90230 March 2011 50,000 0.60 Exercise of Options 504,388,9025 April 2011 10,000 1.88 Exercise of Options 504,398,9025 April 2011 200,000 1.53 Exercise of Options 504,598,9027 April 2011 300,000 1.91 Exercise of Options 504,898,9028 April 2011 8,334 1.50 Exercise of Options 504,907,2368 April 2011 20,000 0.76 Exercise of Options 504,927,2368 April 2011 66,666 0.60 Exercise of Options 504,993,90218 April 2011 8,333 0.75 Exercise of Options 505,002,23529 April 2011 50,000 0.76 Exercise of Options 505,052,2353 May 2011 6,667 1.62 Exercise of Options 505,058,9023 May 2011 10,000 1.50 Exercise of Options 505,068,9023 May 2011 10,000 2.55 Exercise of Options 505,078,9023 May 2011 10,000 2.55 Exercise of Options 505,088,9023 May 2011 6,667 1.62 Exercise of Options 505,095,569
252
For
per
sona
l use
onl
y
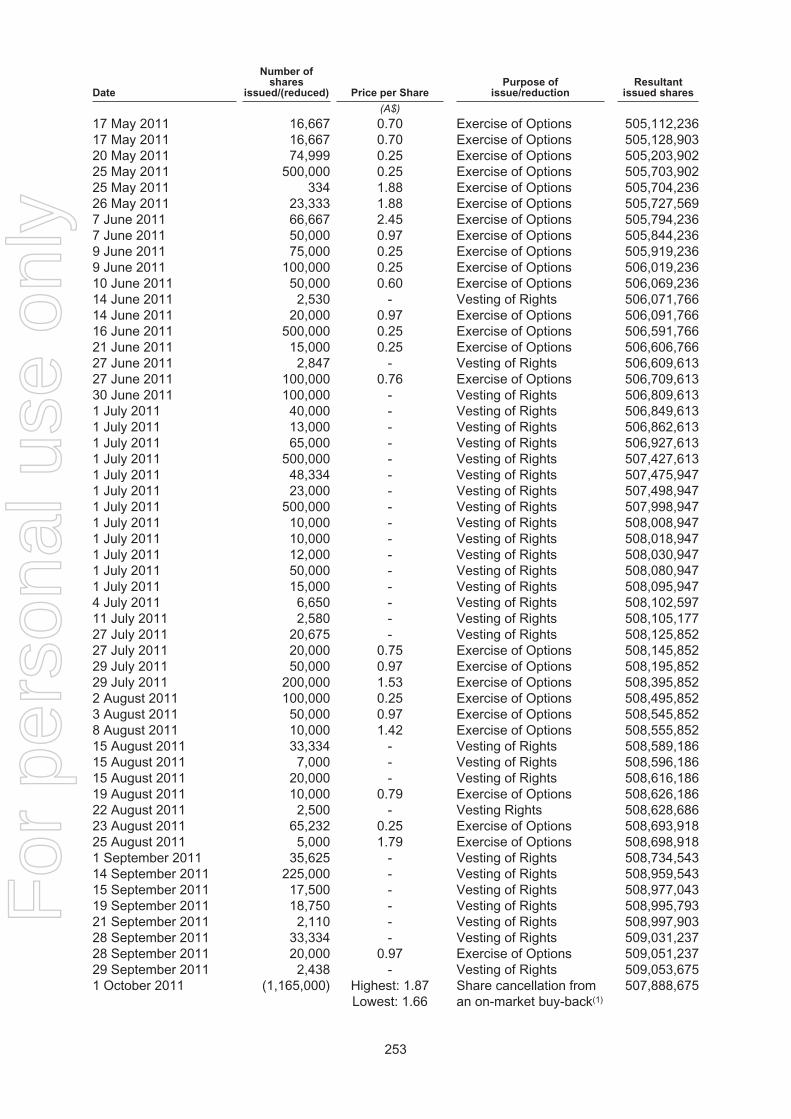
Date
Number ofshares
issued/(reduced) Price per SharePurpose of
issue/reductionResultant
issued shares
(A$)
17 May 2011 16,667 0.70 Exercise of Options 505,112,23617 May 2011 16,667 0.70 Exercise of Options 505,128,90320 May 2011 74,999 0.25 Exercise of Options 505,203,90225 May 2011 500,000 0.25 Exercise of Options 505,703,90225 May 2011 334 1.88 Exercise of Options 505,704,23626 May 2011 23,333 1.88 Exercise of Options 505,727,5697 June 2011 66,667 2.45 Exercise of Options 505,794,2367 June 2011 50,000 0.97 Exercise of Options 505,844,2369 June 2011 75,000 0.25 Exercise of Options 505,919,2369 June 2011 100,000 0.25 Exercise of Options 506,019,23610 June 2011 50,000 0.60 Exercise of Options 506,069,23614 June 2011 2,530 - Vesting of Rights 506,071,76614 June 2011 20,000 0.97 Exercise of Options 506,091,76616 June 2011 500,000 0.25 Exercise of Options 506,591,76621 June 2011 15,000 0.25 Exercise of Options 506,606,76627 June 2011 2,847 - Vesting of Rights 506,609,61327 June 2011 100,000 0.76 Exercise of Options 506,709,61330 June 2011 100,000 - Vesting of Rights 506,809,6131 July 2011 40,000 - Vesting of Rights 506,849,6131 July 2011 13,000 - Vesting of Rights 506,862,6131 July 2011 65,000 - Vesting of Rights 506,927,6131 July 2011 500,000 - Vesting of Rights 507,427,6131 July 2011 48,334 - Vesting of Rights 507,475,9471 July 2011 23,000 - Vesting of Rights 507,498,9471 July 2011 500,000 - Vesting of Rights 507,998,9471 July 2011 10,000 - Vesting of Rights 508,008,9471 July 2011 10,000 - Vesting of Rights 508,018,9471 July 2011 12,000 - Vesting of Rights 508,030,9471 July 2011 50,000 - Vesting of Rights 508,080,9471 July 2011 15,000 - Vesting of Rights 508,095,9474 July 2011 6,650 - Vesting of Rights 508,102,59711 July 2011 2,580 - Vesting of Rights 508,105,17727 July 2011 20,675 - Vesting of Rights 508,125,85227 July 2011 20,000 0.75 Exercise of Options 508,145,85229 July 2011 50,000 0.97 Exercise of Options 508,195,85229 July 2011 200,000 1.53 Exercise of Options 508,395,8522 August 2011 100,000 0.25 Exercise of Options 508,495,8523 August 2011 50,000 0.97 Exercise of Options 508,545,8528 August 2011 10,000 1.42 Exercise of Options 508,555,85215 August 2011 33,334 - Vesting of Rights 508,589,18615 August 2011 7,000 - Vesting of Rights 508,596,18615 August 2011 20,000 - Vesting of Rights 508,616,18619 August 2011 10,000 0.79 Exercise of Options 508,626,18622 August 2011 2,500 - Vesting Rights 508,628,68623 August 2011 65,232 0.25 Exercise of Options 508,693,91825 August 2011 5,000 1.79 Exercise of Options 508,698,9181 September 2011 35,625 - Vesting of Rights 508,734,54314 September 2011 225,000 - Vesting of Rights 508,959,54315 September 2011 17,500 - Vesting of Rights 508,977,04319 September 2011 18,750 - Vesting of Rights 508,995,79321 September 2011 2,110 - Vesting of Rights 508,997,90328 September 2011 33,334 - Vesting of Rights 509,031,23728 September 2011 20,000 0.97 Exercise of Options 509,051,23729 September 2011 2,438 - Vesting of Rights 509,053,6751 October 2011 (1,165,000) Highest: 1.87
Lowest: 1.66Share cancellation froman on-market buy-back(1)
507,888,675
253
For
per
sona
l use
onl
y
Date
Number ofshares
issued/(reduced) Price per SharePurpose of
issue/reductionResultant
issued shares
(A$)
4 October 2011 (30,000) Highest: 1.89Lowest: 1.89
Share cancellation froman on-market buy-back(1)
507,858,675
5 October 2011 (60,280) Highest: 1.96Lowest: 1.83
Share cancellation froman on-market buy-back(1)
507,798,395
6 October 2011 (319,720) Highest: 1.96Lowest: 1.83
Share cancellation froman on-market buy-back(1)
507,478,675
7 October 2011 (95,000) Highest: 1.882Lowest: 1.78
Share cancellation froman on-market buy-back(1)
507,383,675
10 October 2011 (75,000) Highest: 1.835Lowest: 1.805
Share cancellation froman on-market buy-back(1)
507,308,675
11 October 2011 20,000 0.25 Exercise of Options 507,328,67511 October 2011 2,584 - Vesting of Rights 507,331,25913 October 2011 150,000 0.25 Exercise of Options 507,481,25920 October 2011 75,000 0.25 Exercise of Options 507,556,25925 October 2011 20,000 0.25 Exercise of Options 507,576,25925 October 2011 2,500 0.25 Exercise of Options 507,578,75925 October 2011 2,000 0.60 Exercise of Options 507,580,75931 October 2011 (80,000) Highest: 2.12
Lowest: 2.10Share cancellation froman on-market buy-back(1)
507,500,759
31 October 2011 (70,000) Highest: 2.06Lowest: 2.04
Share cancellation froman on-market buy-back(1)
507,430,759
31 October 2011 (50,000) Highest: 2.07Lowest: 2.07
Share cancellation froman on-market buy-back(1)
507,380,759
31 October 2011 (60,000) Highest: 2.07Lowest: 2.06
Share cancellation froman on-market buy-back(1)
507,320,759
31 October 2011 (100,000) Highest: 2.05Lowest: 2.02
Share cancellation froman on-market buy-back(1)
507,220,759
1 November 2011 116,667 - Vesting of Rights 507,337,4262 November 2011 3,000 0.25 Exercise of Options 507,340,4263 November 2011 6,634 - Vesting of Rights 507,347,0603 November 2011 8,203 - Vesting of Rights 507,355,2637 November 2011 2,720 - Vesting of Rights 507,357,9837 November 2011 (140,000) Highest: 1.985
Lowest: 1.96Share cancellation froman on-market buy-back(1)
507,217,983
8 November 2011 (140,000) Highest: 1.97Lowest: 1.90
Share cancellation froman on-market buy-back(1)
507,077,983
9 November 2011 33,334 - Vesting of Rights 507,111,31714 November 2011 10,000 0.25 Exercise of Options 507,121,31715 November 2011 (200,000) Highest: 2.00
Lowest: 1.95Share cancellation froman on-market buy-back(1)
506,921,317
24 November 2011 50,000 0.70 Exercise of Options 506,971,31725 November 2011 375,000 - Vesting of Rights 507,346,31730 November 2011 (1,150,000) Highest: 1.92
Lowest: 1.89Share cancellation froman on-market buy-back(1)
506,196,317
30 November 2011 (1,000,000) Highest: 1.92Lowest: 1.89
Share cancellation froman on-market buy-back(1)
505,196,317
30 November 2011 (800,000) Highest: 1.86Lowest: 1.83
Share cancellation froman on-market buy-back(1)
504,396,317
30 November 2011 8,600 - Vesting of Rights 504,404,9176 December 2011 30,000 0.75 Exercise of Options 504,434,9178 December 2011 50,000 0.70 Exercise of Options 504,484,91714 December 2011 11,407 - Vesting of Rights 504,496,32414 December 2011 6,650 - Vesting of Rights 504,502,97414 December 2011 48,333 0.60 Exercise of Options 504,551,30714 December 2011 20,000 0.97 Exercise of Options 504,571,30716 December 2011 5,000 0.60 Exercise of Options 504,576,30720 December 2011 5,834 - Vesting of Rights 504,582,141
254
For
per
sona
l use
onl
y
Date
Number ofshares
issued/(reduced) Price per SharePurpose of
issue/reductionResultant
issued shares
(A$)
20 December 2011 81,333 0.60 Exercise of Options 504,663,47421 December 2011 67,666 0.25 Exercise of Options 504,731,14021 December 2011 200,000 0.60 Exercise of Options 504,931,14021 December 2011 483,334 0.76 Exercise of Options 505,414,47429 December 2011 2,345 - Vesting of Rights 505,416,81930 December 2011 1,000,000 0.25 Exercise of Options 506,416,81930 December 2011 28,102 0.25 Exercise of Options 506,444,92130 December 2011 100,000 0.25 Exercise of Options 506,544,92130 December 2011 60,001 0.60 Exercise of Options 506,604,92230 December 2011 333,333 0.60 Exercise of Options 506,938,25530 December 2011 100,000 0.60 Exercise of Options 507,038,25530 December 2011 20,000 0.60 Exercise of Options 507,058,25530 December 2011 72,339 - Vesting of Rights 507,130,59431 December 2011 (250,000) Highest: 1.225
Lowest: 1.20Share cancellation froman on-market buy-back(1)
506,880,594
31 December 2011 (250,000) Highest: 1.13Lowest: 1.13
Share cancellation froman on-market buy-back(1)
506,630,594
31 December 2011 (250,000) Highest: 1.135Lowest: 1.065
Share cancellation froman on-market buy-back(1)
506,380,594
31 December 2011 (250,000) Highest: 1.115Lowest: 1.065
Share cancellation froman on-market buy-back(1)
506,130,594
31 December 2011 (300,000) Highest: 1.135Lowest: 1.065
Share cancellation froman on-market buy-back(1)
505,830,594
3 January 2012 33,750 - Vesting of Rights 505,864,3443 January 2012 16,250 - Vesting of Rights 505,880,5943 January 2012 500,000 - Vesting of Rights 506,380,5943 January 2012 500,000 - Vesting of Rights 506,880,5943 January 2012 50,000 - Vesting of Rights 506,930,5943 January 2012 10,000 - Vesting of Rights 506,940,5943 January 2012 25,000 - Vesting of Rights 506,965,5943 January 2012 25,000 - Vesting of Rights 506,990,5943 January 2012 30,000 - Vesting of Rights 507,020,5943 January 2012 25,000 - Vesting of Rights 507,045,5943 January 2012 25,000 - Vesting of Rights 507,070,5943 January 2012 396,861 - Vesting of Rights 507,467,4553 January 2012 25,000 - Vesting of Rights 507,492,4553 January 2012 500,000 - Vesting of Rights 507,992,4556 January 2012 17,875 - Vesting of Rights 508,010,3309 January 2012 (18,657) Highest: 1.13
Lowest: 1.13Share cancellation froman on-market buy-back(1)
507,991,673
13 January 2012 3,029 - Vesting of Rights 507,994,70218 January 2012 8,668 - Vesting of Rights 508,003,37031 January 2012 (75,000) Highest: 1.105
Lowest: 1.075Share Cancellation froman on-market buy-back(1)
507,928,370
31 January 2012 (156,343) Highest: 1.14Lowest: 1.135
Share cancellation froman on-market buy-back(1)
507,772,027
1 February 2012 26,280 - Vesting of Rights 507,798,3073 February 2012 50,000 0.60 Exercise of Options 507,848,3077 February 2012 333,333 0.60 Exercise of Options 508,181,6409 February 2012 50,000 0.70 Exercise of Options 508,231,64015 February 2012 15,000 - Vesting of Rights 508,246,64024 February 2012 50,000 - Vesting of Rights 508,296,6401 March 2012 666,667 - Vesting of Rights 508,963,3071 March 2012 100 - Vesting of Rights 508,963,4071 March 2012 (1,861) - Reversal of Duplicate
Rights Issue508,961,546
5 March 2012 100,000 - Vesting of Rights 509,061,546
255
For
per
sona
l use
onl
y
Date
Number ofshares
issued/(reduced) Price per SharePurpose of
issue/reductionResultant
issued shares
(A$)
5 March 2012 9,822 - Vesting of Rights 509,071,36819 March 2012 2,518 - Vesting of Rights 509,073,88619 March 2012 7,701 - Vesting of Rights 509,081,5872 April 2012 500,000 - Vesting of Rights 509,581,58710 April 2012 18,750 - Vesting of Rights 509,600,33711 April 2012 22,857 - Vesting of Rights 509,623,19418 April 2012 20,714 - Vesting of Rights 509,643,90825 April 2012 2,036 - Vesting of Rights 509,645,94425 April 2012 9,375 - Vesting of Rights 509,655,31930 April 2012 100,001 - Vesting of Rights 509,755,32030 April 2012 31,072 - Vesting of Rights 509,786,39230 April 2012 25,000 - Vesting of Rights 509,811,3921 May 2012 7,000 - Vesting of Rights 509,818,3922 May 2012 2,680 - Vesting of Rights 509,821,0722 May 2012 11,161 - Vesting of Rights 509,832,23311 May 2011 8,594 - Vesting of Rights 509,840,82716 May 2012 (1,892) - Reversal of the issue
and vesting of Rights509,838,935
17 May 2012 1,892 - Vesting of Rights 509,840,82721 May 2012 13,164 - Vesting of Rights 509,853,99121 May 2012 8,040 - Vesting of Rights 509,862,03123 May 2012 2,304 - Vesting of Rights 509,864,33523 May 2012 8,929 - Vesting of Rights 509,873,26428 May 2012 7,589 - Vesting of Rights 509,880,8534 June 2012 37,500 - Vesting of Rights 509,918,35319 June 2012 10,811 - Vesting of Rights 509,929,16421 June 2012 20,675 - Vesting of Rights 509,949,83927 June 2012 2,846 - Vesting of Rights 509,952,6852 July 2012 150,000 - Vesting of Rights 510,102,6852 July 2012 35,000 - Vesting of Rights 510,137,6852 July 2012 13,000 - Vesting of Rights 510,150,6852 July 2012 65,000 - Vesting of Rights 510,215,6852 July 2012 48,333 - Vesting of Rights 510,264,0182 July 2012 23,000 - Vesting of Rights 510,287,0182 July 2012 500,000 - Vesting of Rights 510,787,0182 July 2012 10,000 - Vesting of Rights 510,797,0182 July 2012 10,000 - Vesting of Rights 510,807,0182 July 2012 12,000 - Vesting of Rights 510,819,0182 July 2012 50,000 - Vesting of Rights 510,869,0182 July 2012 15,000 - Vesting of Rights 510,884,0183 July 2012 1,858 - Vesting of Rights 510,885,8763 July 2012 7,000 - Vesting of Rights 510,892,8763 July 2012 6,650 - Vesting of Rights 510,899,5268 July 2012 19,286 - Vesting of Rights 510,918,81210 July 2012 2,580 - Vesting of Rights 510,921,39225 July 2012 5,349 - Vesting of Rights 510,926,74125 July 2012 1,689 - Vesting of Rights 510,928,43029 July 2012 4,224 - Vesting of Rights 510,932,65431 July 2012 20,000 - Vesting of Rights 510,952,65431 July 2012 4,730 - Vesting of Rights 510,957,38431 July 2012 2,130 - Vesting of Rights 510,959,5146 August 2012 13,063 - Vesting of Rights 510,972,57713 August 2012 16,666 - Vesting of Rights 510,989,24313 August 2012 33,333 - Vesting of Rights 511,022,57615 August 2012 100,000 - Vesting of Rights 511,122,57627 August 2012 20,000 - Vesting of Rights 511,142,57630 August 2012 120,963 - Vesting of Rights 511,263,539
256
For
per
sona
l use
onl
y
Date
Number ofshares
issued/(reduced) Price per SharePurpose of
issue/reductionResultant
issued shares
(A$)
29 August 2012 12,162 - Vesting of Rights 511,275,70129 August 2012 6,757 - Vesting of Rights 511,282,4583 September 2012 35,625 - Vesting of Rights 511,318,0836 September 2012 1,284 - Vesting of Rights 511,319,3676 September 2012 27,027 - Vesting of Rights 511,346,3946 September 2012 13,063 - Vesting of Rights 511,359,4577 September 2012 20,270 - Vesting of Rights 511,379,72713 September 2012 5,349 - Vesting of Rights 511,385,07613 September 2012 2,667 - Vesting of Rights 511,387,74314 September 2012 1,859 - Vesting of Rights 511,389,60214 September 2012 14,054 - Vesting of Rights 511,403,65617 September 2012 17,500 - Vesting of Rights 511,421,15617 September 2012 1,966 - Vesting of Rights 511,423,12217 September 2012 1,824 - Vesting of Rights 511,424,94617 September 2012 18,750 - Vesting of Rights 511,443,69617 September 2012 4,955 - Vesting of Rights 511,448,6511 October 2012 2,365 - Vesting of Rights 511,451,0163 October 2012 16,667 - Vesting of Rights 511,467,6833 October 2012 14,865 - Vesting of Rights 511,482,5483 October 2012 1,579 - Vesting of Rights 511,484,12710 October 2012 12,226 - Vesting of Rights 511,496,35310 October 2012 13,514 - Vesting of Rights 511,509,86710 October 2012 4,786 - Vesting of Rights 511,514,65311 October 2012 2,583 - Vesting of Rights 511,517,23615 October 2012 11,757 - Vesting of Rights 511,528,99326 October 2012 5,818 - Vesting of Rights 511,534,81127 October 2012 1,994 - Vesting of Rights 511,536,8055 November 2012 6,633 - Vesting of Rights 511,543,4385 November 2012 6,757 - Vesting of Rights 511,550,1955 November 2012 8,203 - Vesting of Rights 511,558,3989 November 2012 33,333 - Vesting of Rights 511,591,73126 November 2012 5,349 - Vesting of Rights 511,597,08026 November 2012 125,000 - Vesting of Rights 511,722,08029 November 2012 6,082 - Vesting of Rights 511,275,70129 November 2012 27,432 - Vesting of Rights 511,282,4584 December 2012 1,857 - Vesting of Rights 511,318,0836 December 2012 1,774 - Vesting of Rights 511,319,36710 December 2012 30,000 0.75 Exercise of Options 511,346,39412 December 2012 100,000 0.60 Exercise of Options 511,359,45712 December 2012 66,666 0.60 Exercise of Options 511,379,72713 December 2012 30,000 0.97 Exercise of Options 511,385,07613 December 2012 4,505 - Vesting of Rights 511,387,74313 December 2012 66,667 0.59 Exercise of Options 511,389,60213 December 2012 83,333 0.59 Exercise of Options 511,403,65613 December 2012 666,666 0.60 Exercise of Options 511,421,15614 December 2012 50,000 0.70 Exercise of Options 511,423,12214 December 2012 11,407 - Vesting of Rights 511,424,94614 December 2012 6,650 - Vesting of Rights 511,443,69618 December 2012 (27,432) - Reversal of vesting of
Rights511,448,651
18 December 2012 (6,082) - Reversal of vesting ofRights
511,451,016
20 December 2012 500,000 0.70 Exercise of Options 511,467,68320 December 2012 5,833 - Vesting of Rights 511,482,54820 December 2012 75,000 - Vesting of Rights 511,484,12720 December 2012 12,613 - Vesting of Rights 511,496,35320 December 2012 6,475 - Vesting of Rights 511,509,867
257
For
per
sona
l use
onl
y
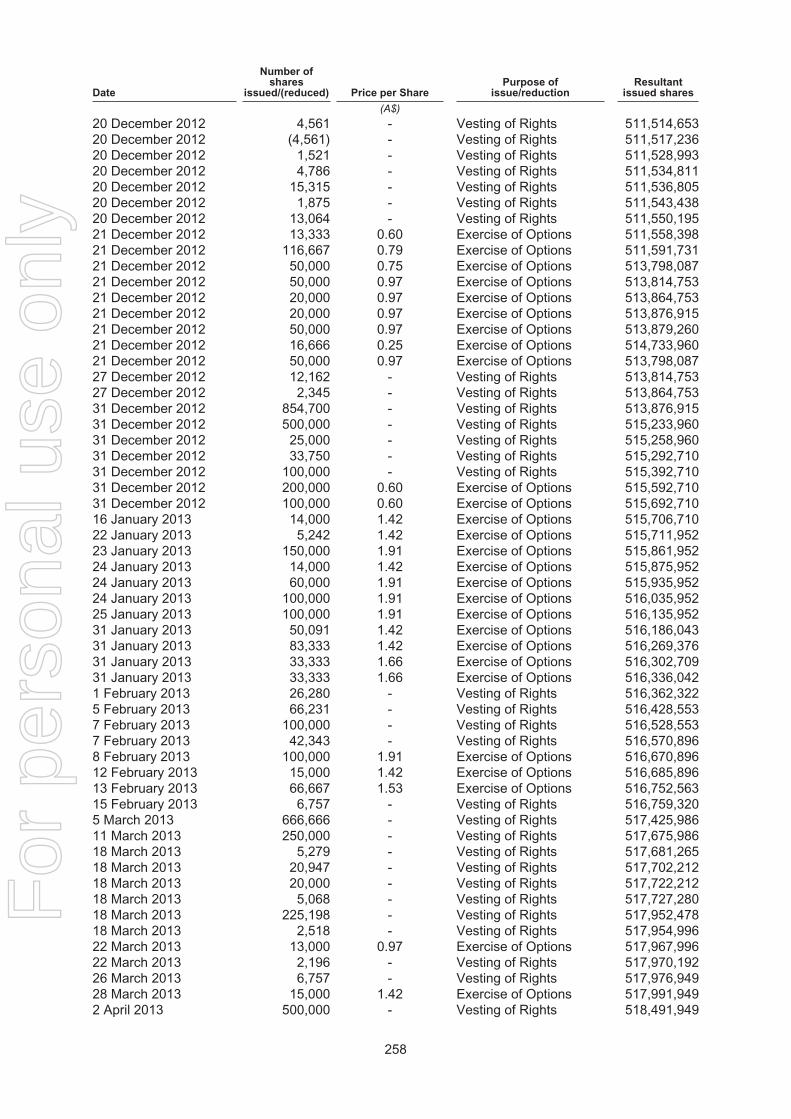
Date
Number ofshares
issued/(reduced) Price per SharePurpose of
issue/reductionResultant
issued shares
(A$)
20 December 2012 4,561 - Vesting of Rights 511,514,65320 December 2012 (4,561) - Vesting of Rights 511,517,23620 December 2012 1,521 - Vesting of Rights 511,528,99320 December 2012 4,786 - Vesting of Rights 511,534,81120 December 2012 15,315 - Vesting of Rights 511,536,80520 December 2012 1,875 - Vesting of Rights 511,543,43820 December 2012 13,064 - Vesting of Rights 511,550,19521 December 2012 13,333 0.60 Exercise of Options 511,558,39821 December 2012 116,667 0.79 Exercise of Options 511,591,73121 December 2012 50,000 0.75 Exercise of Options 513,798,08721 December 2012 50,000 0.97 Exercise of Options 513,814,75321 December 2012 20,000 0.97 Exercise of Options 513,864,75321 December 2012 20,000 0.97 Exercise of Options 513,876,91521 December 2012 50,000 0.97 Exercise of Options 513,879,26021 December 2012 16,666 0.25 Exercise of Options 514,733,96021 December 2012 50,000 0.97 Exercise of Options 513,798,08727 December 2012 12,162 - Vesting of Rights 513,814,75327 December 2012 2,345 - Vesting of Rights 513,864,75331 December 2012 854,700 - Vesting of Rights 513,876,91531 December 2012 500,000 - Vesting of Rights 515,233,96031 December 2012 25,000 - Vesting of Rights 515,258,96031 December 2012 33,750 - Vesting of Rights 515,292,71031 December 2012 100,000 - Vesting of Rights 515,392,71031 December 2012 200,000 0.60 Exercise of Options 515,592,71031 December 2012 100,000 0.60 Exercise of Options 515,692,71016 January 2013 14,000 1.42 Exercise of Options 515,706,71022 January 2013 5,242 1.42 Exercise of Options 515,711,95223 January 2013 150,000 1.91 Exercise of Options 515,861,95224 January 2013 14,000 1.42 Exercise of Options 515,875,95224 January 2013 60,000 1.91 Exercise of Options 515,935,95224 January 2013 100,000 1.91 Exercise of Options 516,035,95225 January 2013 100,000 1.91 Exercise of Options 516,135,95231 January 2013 50,091 1.42 Exercise of Options 516,186,04331 January 2013 83,333 1.42 Exercise of Options 516,269,37631 January 2013 33,333 1.66 Exercise of Options 516,302,70931 January 2013 33,333 1.66 Exercise of Options 516,336,0421 February 2013 26,280 - Vesting of Rights 516,362,3225 February 2013 66,231 - Vesting of Rights 516,428,5537 February 2013 100,000 - Vesting of Rights 516,528,5537 February 2013 42,343 - Vesting of Rights 516,570,8968 February 2013 100,000 1.91 Exercise of Options 516,670,89612 February 2013 15,000 1.42 Exercise of Options 516,685,89613 February 2013 66,667 1.53 Exercise of Options 516,752,56315 February 2013 6,757 - Vesting of Rights 516,759,3205 March 2013 666,666 - Vesting of Rights 517,425,98611 March 2013 250,000 - Vesting of Rights 517,675,98618 March 2013 5,279 - Vesting of Rights 517,681,26518 March 2013 20,947 - Vesting of Rights 517,702,21218 March 2013 20,000 - Vesting of Rights 517,722,21218 March 2013 5,068 - Vesting of Rights 517,727,28018 March 2013 225,198 - Vesting of Rights 517,952,47818 March 2013 2,518 - Vesting of Rights 517,954,99622 March 2013 13,000 0.97 Exercise of Options 517,967,99622 March 2013 2,196 - Vesting of Rights 517,970,19226 March 2013 6,757 - Vesting of Rights 517,976,94928 March 2013 15,000 1.42 Exercise of Options 517,991,9492 April 2013 500,000 - Vesting of Rights 518,491,949
258
For
per
sona
l use
onl
y
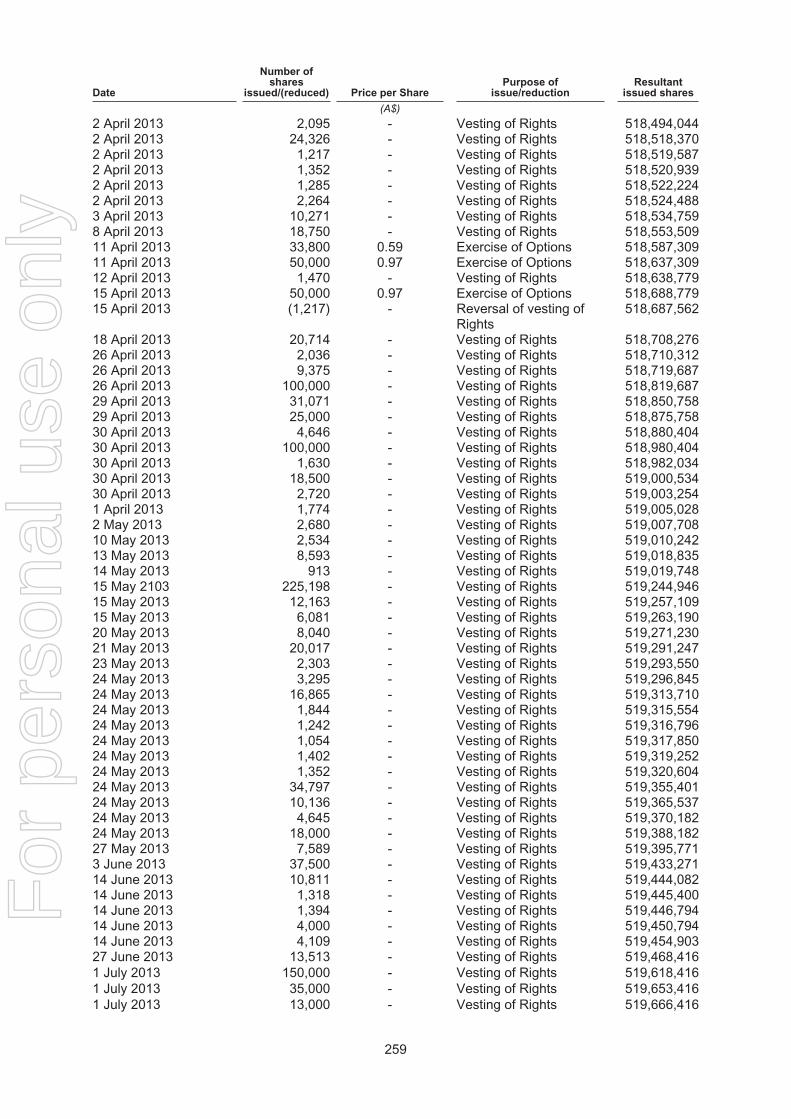
Date
Number ofshares
issued/(reduced) Price per SharePurpose of
issue/reductionResultant
issued shares
(A$)
2 April 2013 2,095 - Vesting of Rights 518,494,0442 April 2013 24,326 - Vesting of Rights 518,518,3702 April 2013 1,217 - Vesting of Rights 518,519,5872 April 2013 1,352 - Vesting of Rights 518,520,9392 April 2013 1,285 - Vesting of Rights 518,522,2242 April 2013 2,264 - Vesting of Rights 518,524,4883 April 2013 10,271 - Vesting of Rights 518,534,7598 April 2013 18,750 - Vesting of Rights 518,553,50911 April 2013 33,800 0.59 Exercise of Options 518,587,30911 April 2013 50,000 0.97 Exercise of Options 518,637,30912 April 2013 1,470 - Vesting of Rights 518,638,77915 April 2013 50,000 0.97 Exercise of Options 518,688,77915 April 2013 (1,217) - Reversal of vesting of
Rights518,687,562
18 April 2013 20,714 - Vesting of Rights 518,708,27626 April 2013 2,036 - Vesting of Rights 518,710,31226 April 2013 9,375 - Vesting of Rights 518,719,68726 April 2013 100,000 - Vesting of Rights 518,819,68729 April 2013 31,071 - Vesting of Rights 518,850,75829 April 2013 25,000 - Vesting of Rights 518,875,75830 April 2013 4,646 - Vesting of Rights 518,880,40430 April 2013 100,000 - Vesting of Rights 518,980,40430 April 2013 1,630 - Vesting of Rights 518,982,03430 April 2013 18,500 - Vesting of Rights 519,000,53430 April 2013 2,720 - Vesting of Rights 519,003,2541 April 2013 1,774 - Vesting of Rights 519,005,0282 May 2013 2,680 - Vesting of Rights 519,007,70810 May 2013 2,534 - Vesting of Rights 519,010,24213 May 2013 8,593 - Vesting of Rights 519,018,83514 May 2013 913 - Vesting of Rights 519,019,74815 May 2103 225,198 - Vesting of Rights 519,244,94615 May 2013 12,163 - Vesting of Rights 519,257,10915 May 2013 6,081 - Vesting of Rights 519,263,19020 May 2013 8,040 - Vesting of Rights 519,271,23021 May 2013 20,017 - Vesting of Rights 519,291,24723 May 2013 2,303 - Vesting of Rights 519,293,55024 May 2013 3,295 - Vesting of Rights 519,296,84524 May 2013 16,865 - Vesting of Rights 519,313,71024 May 2013 1,844 - Vesting of Rights 519,315,55424 May 2013 1,242 - Vesting of Rights 519,316,79624 May 2013 1,054 - Vesting of Rights 519,317,85024 May 2013 1,402 - Vesting of Rights 519,319,25224 May 2013 1,352 - Vesting of Rights 519,320,60424 May 2013 34,797 - Vesting of Rights 519,355,40124 May 2013 10,136 - Vesting of Rights 519,365,53724 May 2013 4,645 - Vesting of Rights 519,370,18224 May 2013 18,000 - Vesting of Rights 519,388,18227 May 2013 7,589 - Vesting of Rights 519,395,7713 June 2013 37,500 - Vesting of Rights 519,433,27114 June 2013 10,811 - Vesting of Rights 519,444,08214 June 2013 1,318 - Vesting of Rights 519,445,40014 June 2013 1,394 - Vesting of Rights 519,446,79414 June 2013 4,000 - Vesting of Rights 519,450,79414 June 2013 4,109 - Vesting of Rights 519,454,90327 June 2013 13,513 - Vesting of Rights 519,468,4161 July 2013 150,000 - Vesting of Rights 519,618,4161 July 2013 35,000 - Vesting of Rights 519,653,4161 July 2013 13,000 - Vesting of Rights 519,666,416
259
For
per
sona
l use
onl
y
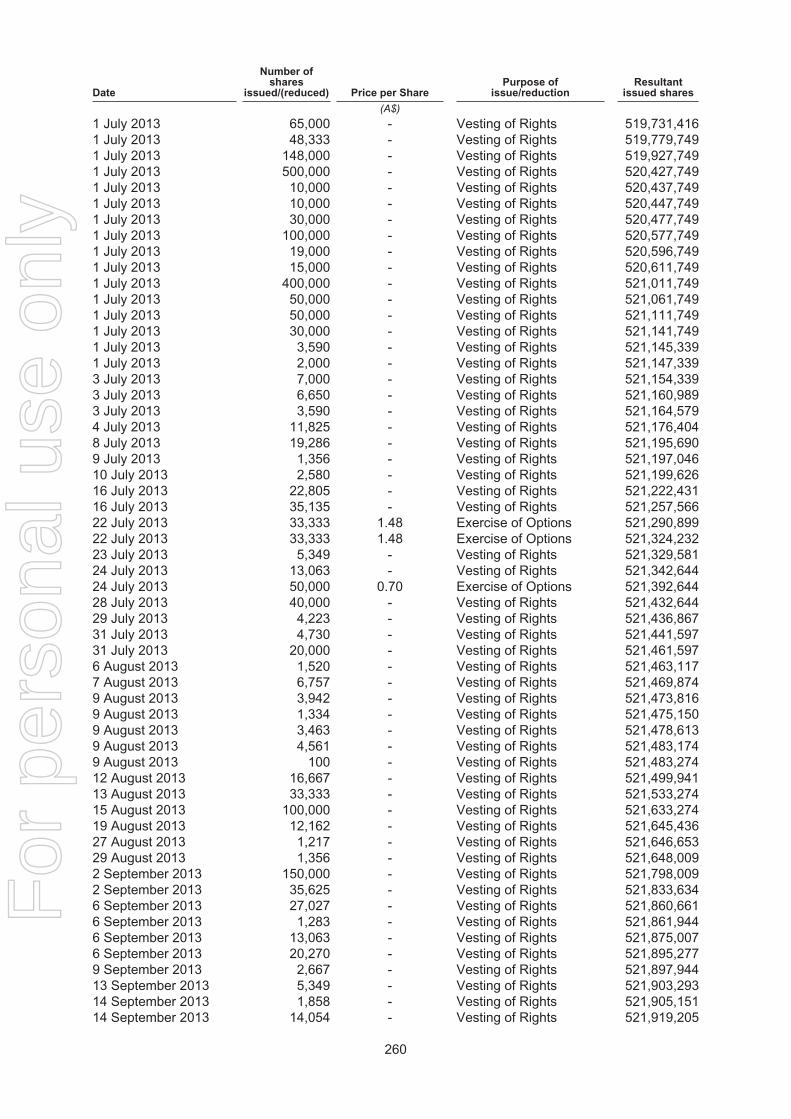
Date
Number ofshares
issued/(reduced) Price per SharePurpose of
issue/reductionResultant
issued shares
(A$)
1 July 2013 65,000 - Vesting of Rights 519,731,4161 July 2013 48,333 - Vesting of Rights 519,779,7491 July 2013 148,000 - Vesting of Rights 519,927,7491 July 2013 500,000 - Vesting of Rights 520,427,7491 July 2013 10,000 - Vesting of Rights 520,437,7491 July 2013 10,000 - Vesting of Rights 520,447,7491 July 2013 30,000 - Vesting of Rights 520,477,7491 July 2013 100,000 - Vesting of Rights 520,577,7491 July 2013 19,000 - Vesting of Rights 520,596,7491 July 2013 15,000 - Vesting of Rights 520,611,7491 July 2013 400,000 - Vesting of Rights 521,011,7491 July 2013 50,000 - Vesting of Rights 521,061,7491 July 2013 50,000 - Vesting of Rights 521,111,7491 July 2013 30,000 - Vesting of Rights 521,141,7491 July 2013 3,590 - Vesting of Rights 521,145,3391 July 2013 2,000 - Vesting of Rights 521,147,3393 July 2013 7,000 - Vesting of Rights 521,154,3393 July 2013 6,650 - Vesting of Rights 521,160,9893 July 2013 3,590 - Vesting of Rights 521,164,5794 July 2013 11,825 - Vesting of Rights 521,176,4048 July 2013 19,286 - Vesting of Rights 521,195,6909 July 2013 1,356 - Vesting of Rights 521,197,04610 July 2013 2,580 - Vesting of Rights 521,199,62616 July 2013 22,805 - Vesting of Rights 521,222,43116 July 2013 35,135 - Vesting of Rights 521,257,56622 July 2013 33,333 1.48 Exercise of Options 521,290,89922 July 2013 33,333 1.48 Exercise of Options 521,324,23223 July 2013 5,349 - Vesting of Rights 521,329,58124 July 2013 13,063 - Vesting of Rights 521,342,64424 July 2013 50,000 0.70 Exercise of Options 521,392,64428 July 2013 40,000 - Vesting of Rights 521,432,64429 July 2013 4,223 - Vesting of Rights 521,436,86731 July 2013 4,730 - Vesting of Rights 521,441,59731 July 2013 20,000 - Vesting of Rights 521,461,5976 August 2013 1,520 - Vesting of Rights 521,463,1177 August 2013 6,757 - Vesting of Rights 521,469,8749 August 2013 3,942 - Vesting of Rights 521,473,8169 August 2013 1,334 - Vesting of Rights 521,475,1509 August 2013 3,463 - Vesting of Rights 521,478,6139 August 2013 4,561 - Vesting of Rights 521,483,1749 August 2013 100 - Vesting of Rights 521,483,27412 August 2013 16,667 - Vesting of Rights 521,499,94113 August 2013 33,333 - Vesting of Rights 521,533,27415 August 2013 100,000 - Vesting of Rights 521,633,27419 August 2013 12,162 - Vesting of Rights 521,645,43627 August 2013 1,217 - Vesting of Rights 521,646,65329 August 2013 1,356 - Vesting of Rights 521,648,0092 September 2013 150,000 - Vesting of Rights 521,798,0092 September 2013 35,625 - Vesting of Rights 521,833,6346 September 2013 27,027 - Vesting of Rights 521,860,6616 September 2013 1,283 - Vesting of Rights 521,861,9446 September 2013 13,063 - Vesting of Rights 521,875,0076 September 2013 20,270 - Vesting of Rights 521,895,2779 September 2013 2,667 - Vesting of Rights 521,897,94413 September 2013 5,349 - Vesting of Rights 521,903,29314 September 2013 1,858 - Vesting of Rights 521,905,15114 September 2013 14,054 - Vesting of Rights 521,919,205
260
For
per
sona
l use
onl
y
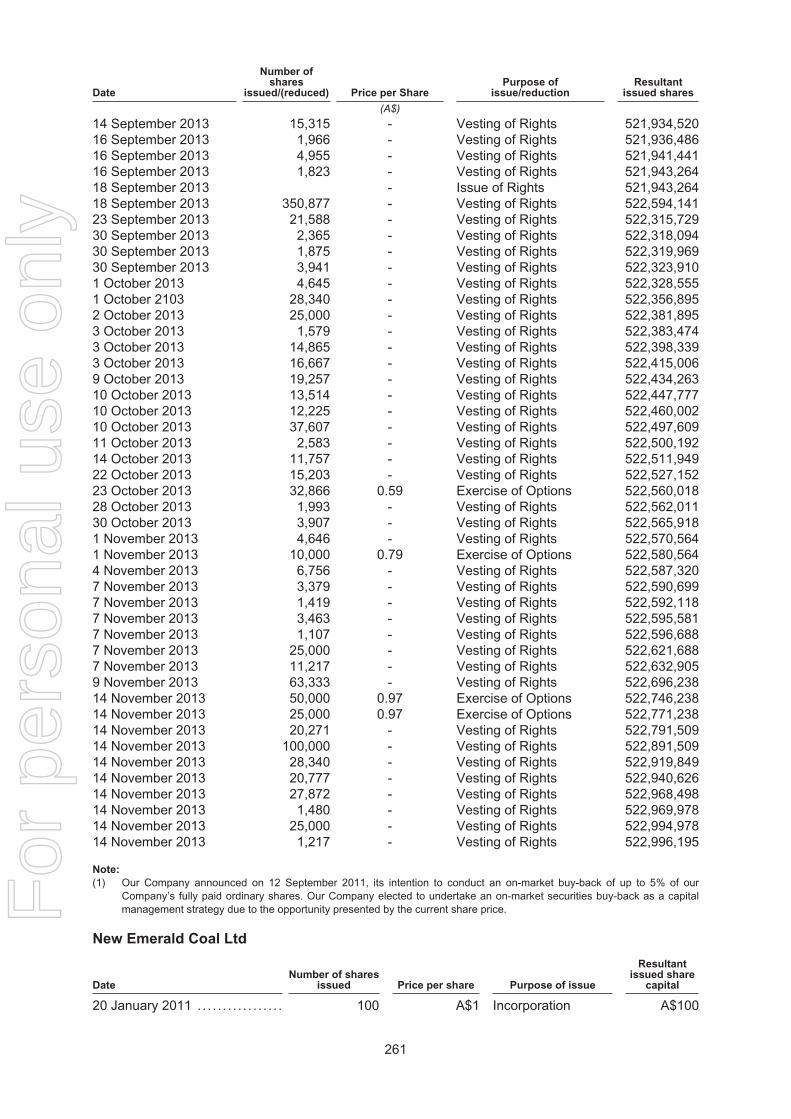
Date
Number ofshares
issued/(reduced) Price per SharePurpose of
issue/reductionResultant
issued shares
(A$)
14 September 2013 15,315 - Vesting of Rights 521,934,52016 September 2013 1,966 - Vesting of Rights 521,936,48616 September 2013 4,955 - Vesting of Rights 521,941,44116 September 2013 1,823 - Vesting of Rights 521,943,26418 September 2013 - Issue of Rights 521,943,26418 September 2013 350,877 - Vesting of Rights 522,594,14123 September 2013 21,588 - Vesting of Rights 522,315,72930 September 2013 2,365 - Vesting of Rights 522,318,09430 September 2013 1,875 - Vesting of Rights 522,319,96930 September 2013 3,941 - Vesting of Rights 522,323,9101 October 2013 4,645 - Vesting of Rights 522,328,5551 October 2103 28,340 - Vesting of Rights 522,356,8952 October 2013 25,000 - Vesting of Rights 522,381,8953 October 2013 1,579 - Vesting of Rights 522,383,4743 October 2013 14,865 - Vesting of Rights 522,398,3393 October 2013 16,667 - Vesting of Rights 522,415,0069 October 2013 19,257 - Vesting of Rights 522,434,26310 October 2013 13,514 - Vesting of Rights 522,447,77710 October 2013 12,225 - Vesting of Rights 522,460,00210 October 2013 37,607 - Vesting of Rights 522,497,60911 October 2013 2,583 - Vesting of Rights 522,500,19214 October 2013 11,757 - Vesting of Rights 522,511,94922 October 2013 15,203 - Vesting of Rights 522,527,15223 October 2013 32,866 0.59 Exercise of Options 522,560,01828 October 2013 1,993 - Vesting of Rights 522,562,01130 October 2013 3,907 - Vesting of Rights 522,565,9181 November 2013 4,646 - Vesting of Rights 522,570,5641 November 2013 10,000 0.79 Exercise of Options 522,580,5644 November 2013 6,756 - Vesting of Rights 522,587,3207 November 2013 3,379 - Vesting of Rights 522,590,6997 November 2013 1,419 - Vesting of Rights 522,592,1187 November 2013 3,463 - Vesting of Rights 522,595,5817 November 2013 1,107 - Vesting of Rights 522,596,6887 November 2013 25,000 - Vesting of Rights 522,621,6887 November 2013 11,217 - Vesting of Rights 522,632,9059 November 2013 63,333 - Vesting of Rights 522,696,23814 November 2013 50,000 0.97 Exercise of Options 522,746,23814 November 2013 25,000 0.97 Exercise of Options 522,771,23814 November 2013 20,271 - Vesting of Rights 522,791,50914 November 2013 100,000 - Vesting of Rights 522,891,50914 November 2013 28,340 - Vesting of Rights 522,919,84914 November 2013 20,777 - Vesting of Rights 522,940,62614 November 2013 27,872 - Vesting of Rights 522,968,49814 November 2013 1,480 - Vesting of Rights 522,969,97814 November 2013 25,000 - Vesting of Rights 522,994,97814 November 2013 1,217 - Vesting of Rights 522,996,195
Note:
(1) Our Company announced on 12 September 2011, its intention to conduct an on-market buy-back of up to 5% of ourCompany’s fully paid ordinary shares. Our Company elected to undertake an on-market securities buy-back as a capitalmanagement strategy due to the opportunity presented by the current share price.
New Emerald Coal Ltd
DateNumber of shares
issued Price per share Purpose of issue
Resultantissued share
capital
20 January 2011 .. . . . . . . . . . . . . . . . 100 A$1 Incorporation A$100
261
For
per
sona
l use
onl
y
New Emerald Coal 1 Pty Ltd
DateNumber of shares
issued Price per share Purpose of issue
Resultantissued share
capital
23 July 2013 .. . . . . . . . . . . . . . . . . . . . . 100 A$1 Incorporation A$100
New Emerald Coal 2 Pty Ltd
DateNumber of shares
issued Price per share Purpose of issue
Resultantissued share
capital
23 July 2013 .. . . . . . . . . . . . . . . . . . . . . 100 A$1 Incorporation A$100
New Emerald Coal Operations Pty Ltd
DateNumber of shares
issued Price per share Purpose of issue
Resultantissued share
capital
18 May 2012 .. . . . . . . . . . . . . . . . . . . . . 100 A$1 Incorporation A$100
New Pentland Coal Pty Ltd
DateNumber of shares
issued Price per share Purpose of issue
Resultantissued share
capital
6 March 2012 .. . . . . . . . . . . . . . . . . . . . 100 A$1 Incorporation A$100
Linc Energy GP1 Pty Ltd
DateNumber of shares
issued Price per share Purpose of issue
Resultantissued share
capital
3 September 2012 .. . . . . . . . . . . . . . 100 A$1 Incorporation A$100
Linc Energy GP2 Pty Ltd
DateNumber of shares
issued Price per share Purpose of issue
Resultantissued share
capital
3 September 2012 .. . . . . . . . . . . . . . 100 A$1 Incorporation A$100
Linc Energy (Africa) Pty Ltd
DateNumber of shares
issued Price per share Purpose of issue
Resultantissued share
capital
3 August 2011 .. . . . . . . . . . . . . . . . . . . 2 A$1 Incorporation A$2
Linc Energy Operations Pty Ltd
DateNumber of shares
issued Price per share Purpose of issue
Resultantissued share
capital
23 February 2011 .. . . . . . . . . . . . . . . 100 A$1 Incorporation A$100
Linc Energy (Europe) Ltd
DateNumber of shares
issued Price per share Purpose of issue
Resultantissued share
capital
27 January 2011 .. . . . . . . . . . . . . . . . 100 £1 Incorporation £100
Linc Energy (Africa) Ltd
DateNumber of shares
issued Price per share Purpose of issue
Resultantissued share
capital
27 January 2011 .. . . . . . . . . . . . . . . . 100 £1 Incorporation £100
262
For
per
sona
l use
onl
y
Linc Energy Operations Ltd
DateNumber of shares
issued Price per share Purpose of issue
Resultantissued share
capital
27 January 2011 .. . . . . . . . . . . . . . . . 100 £1 Incorporation £100
Linc Energy (Poland) (S.p. z.o.o.)
DateNumber of shares
issued Price per share Purpose of issue
Resultantissued share
capital
8 March 2011 .. . . . . . . . . . . . . . . . . . . . 100 50 Polish Zloty Incorporation 5,000 PolishZloty
Linc Energy Operations (Africa) Proprietary Limited
DateNumber of shares
issued Price per share Purpose of issueResultant
issued shares
8 February 2013 .. . . . . . . . . . . . . . . . . . . . 100 ZAR1.00 Incorporation 100
Linc USA GP
DateNumber of shares
issued Price per share Purpose of issue
Resultantissued share
capital
13 September 2012 .. . . . . . . . . . . . . . . . 100 US$1 Formation ofpartnership
US$100
Linc Energy Finance (USA) Inc.
DateNumber of shares
issued Price per share Purpose of issue
Resultantissued share
capital
21 August 2012.. . . . . . . . . . . . . . . . . . . . . 100 US$0.01 Incorporation US$1.00
Linc Energy Petroleum (Wyoming), Inc
DateNumber of shares
issued Price per share Purpose of issue
Resultantissued share
capital
8 December 2010 .. . . . . . . . . . . . . . . . . . 100 US$1.00 Incorporation US$100
Linc Energy Resources, Inc.
DateNumber of shares
issued Price per share Purpose of issueResultant
issued shares
30 June 2012 .. . . . . . . . . . . . . . . . . . . . . . . 100 Shares of LincGulf CoastPetroleum, Inc.
Restructuring 100
30 June 2012 .. . . . . . . . . . . . . . . . . . . . . . . 100 Shares of LincEnergy Petroleum(Louisiana), Inc.
Restructuring 200
30 June 2012 .. . . . . . . . . . . . . . . . . . . . . . . 100 Shares of LincAlaskaResources, Inc.
Restructuring 300
7 July 2012 .. . . . . . . . . . . . . . . . . . . . . . . . . 100 US$1 Restructuring 400
263
For
per
sona
l use
onl
y
Linc Clean Energy, Inc.
DateNumber of shares
issued Price per share Purpose of issue
Resultantissued share
capital
4 June 2012 .. . . . . . . . . . . . . . . . . . . . . . . . 100 US$0.01 Incorporation US$1.007 July 2012 .. . . . . . . . . . . . . . . . . . . . . . . . . 400 Shares of Linc
Energy Alaska,Inc., Linc Energy(Montana), Inc,and Linc Energy(Wyoming), Inc,and Linc Energy(Louisiana)L.L.C.(1)
Restructuring US$301.00
Note:
(1) Linc Energy (Montana), Inc., and Linc Energy (Louisana) L.L.C. have been dissolved.
Linc Energy Operations (Singapore) Pte. Ltd.
DateNumber of shares
issued Price per share Purpose of issue
Resultantissued share
capital
8 November 2013 .. . . . . . . . . . . . . . . . . . 100 S$1 Incorporation S$100
264
For
per
sona
l use
onl
y
DEFINITIONS
The following terms when used in this document shall bear the same meanings as set forthbelow unless otherwise defined herein or the context otherwise requires:
OUR GROUP COMPANIES AND OTHER ENTITIES
Adani : Adani Mining Pty Ltd
Company : Linc Energy Ltd
CS Europe : Credit Suisse (Europe) Limited
DTEK Oil and Gas : DTEK Holdings Limited
Exxaro Resources : Exxaro Resources Limited
Equities : Equities First Holdings, LLC
Genting : Genting Strategic Investments (Singapore) Pte Ltd
Group : Our Company and its Subsidiaries
Gustavson Associates : Gustavson Associates LLC
Haas Petroleum : Haas Petroleum Engineering Services, Inc
Industry Consultant : Wood Mackenzie (Australia) Pty Ltd
Minecraft : Minecraft Consulting Pty Ltd.
New Emerald Coal : New Emerald Coal Ltd formerly known as New EmeraldCoal Pty Ltd and Teresa Coal Pty Ltd
Ryder Scott : Ryder Scott Company, L.P.
Snowden : Snowden Mining Industry Consultant Pty Ltd
Xenith : Xenith Consulting Pty Ltd
GLOSSARY OF TECHNICAL TERMS
1C : Low estimate scenario of contingent resources
1P : Equivalent to proved reserves; denotes low estimatescenario of reserves
2C : Best estimate scenario of contingent resources
2D seismic : Geophysical data that depicts the subsurface strata intwo dimensions
2P : Equivalent to proved plus probable reserves; denotesbest estimate scenario of reserves
3C : High estimate scenario of contingent resources
3D seismic : Geophysical data that depicts the subsurface strata inthree dimensions. 3D seismic typically provides a moredetailed and accurate interpretation of the subsurfacestrata than 2D seismic
265
For
per
sona
l use
onl
y
3P : Equivalent to proved plus probable plus possiblereserves; denotes high estimate scenario of reserves
Ash : Impurities consisting of iron, alumina and otherincombustible matter that are contained in coal. Sinceash increases the weight of coal, it adds to the cost ofhandling and can affect the burning characteristics ofcoal
BBL : One stock tank barrel, or 42 U.S. gallons liquid volume,used in this offering document in reference to oil andother liquid hydrocarbons
BNBOE : Billion barrels of oil equivalent
BOEPD : Barrels of oil equivalent per day, determined using theratio of 6 MCF of gas to one BBL of crude oil,condensate or gas liquids per day
BOPD : BBLs per day
Btu : One British thermal unit
CO2 : Carbon dioxide
calorific value or cv : A coal sample’s energy content measured as the heatreleased on complete combustion in air or oxygen,usually expressed as the amount of heat (measured inkilo calories) per unit weight of coal (measured inkilograms) or (kcal/kg)
coal : A readily combustible black or brownish-black rockusually found in rock strata in layers or veins called coalbeds or coal seams. It is formed from plant remains thathave been compacted, hardened, chemically altered andmetamorphosed by heat and pressure over time
coal seam or seam : Coal deposits occur in layers in a bed of coal lyingbetween a roof and floor with each layer called a “seam”
DCF-10 : Present value of estimated future coal cash flows,discounted at an annual rate of 10%
exit rate : Refers to the rate of production of oil and/or gas as at aspecified date
Equity Interest : In respect of our coal assets refers to our ownershippercentage of the asset. Our rights to a financial returnfrom the assets are in proportion to the equity ownershiponce all other costs of the business have been met
EL or ELs : Exploration licence(s)
Contingent Resources : Those quantities of petroleum estimated, as at a givendate, to be potentially recoverable from knownaccumulations by application of development projects,but which are not currently considered to becommercially recoverable due to one or morecontingencies.
EOR : Enhanced oil recovery
266
For
per
sona
l use
onl
y
EPC or EPCs : Exploration permit(s) for coal
geology : The scientific study of the origin, history and structure ofthe earth
geophysics : Matters concerning the physics of the earth and itsenvironment, including the physics of fields such asmeteorology, oceanography, and seismology. In oil, gasand coal exploration, this refers to geophysical methods ofimaging the subsurface such as gravity, magnetic andseismic
GHG : Greenhouse gas
highwall : An unexcavated face of exposed overburden and coal ina surface mine or bank on the uphill side of a contourmine excavation
indicated resources : That part of a coal resource for which tonnage, densities,shape, physical characteristics, quality and mineralcontent can be estimated with a reasonable level ofconfidence. It is based on detailed and reliableexploration, sampling and testing information gatheredthrough appropriate techniques from locations such asoutcrops, trenches, pits, workings and drill holes. Thelocations are too widely or inappropriately spaced toconfirm geological and/or quality, but are spaced closelyenough for continuity to be assumed
inferred resources : That part of a coal resource for which tonnage, densities,shape, physical characteristics, quality and mineralcontent can be estimated with a low level of confidence.It is inferred from geological evidence and assumed, butnot verified on geological and/or quality continuity. It isbased on information gathered through appropriatetechniques from locations such as outcrops, trenches,puts, workings and drill holes which may be limited or ofuncertain quality and reliability
JORC : The Joint Ore Reserves Committee
JORC Code : The Australasian Code for Reporting of ExplorationResults, Mineral Resources and Ore Reserves (2004Edition or the 2012 Edition, as the case may be)
MBBL : One thousand barrels of oil or other liquid hydrocarbons
MBOE : Thousand barrels of crude oil equivalent, determinedusing the ratio of 6 MCF of gas to one BBL of crude oil,condensate or gas liquids, based on energy value and isnot reflective of its underlying economic value
MMBOE : Million barrels of crude oil equivalent, determined usingthe ratio of 6 MCF of gas to one BBL of crude oil,condensate or gas liquids, based on energy value and isnot reflective of its underlying economic value
MBOPD : One thousand barrels of oil or other liquid hydrocarbonsper day
267
For
per
sona
l use
onl
y

MBOEPD : Thousand barrels of crude oil equivalent, determinedusing the ratio of 6 MCF of gas to one BBL of crude oil,condensate or gas liquids per day
MCF : One thousand cubic feet of gas
measured resource : That part of a coal resource for which tonnage, densities,shape, physical characteristics, quality and mineralcontent can be estimated with a high level of confidence.It is based on detailed and reliable exploration, samplingand testing information gathered through appropriatetechniques from locations such as outcrops, trenches,pits, workings and drill holes. The locations are spacedclosely to confirm geological quality and continuity
MDL or MDLs : Mineral development lease(s)
MDLa or MDLas : Mining development lease application(s)
ML or MLs : Mining lease(s)
MLa or MLas : Mining lease application(s)
MMBBL : Million barrels of oil or other liquid hydrocarbons
MMBtu : One million British thermal units
MMCF : One million cubic feet of gas
Mt : Million tonnes
Mtpa : Million tonnes per annum
Net Revenue Interest : In respect of our conventional and unconventional oil andgas assets refers to our share of production after thegovernment’s interest or petroleum under the relevantlicence, all royalty burdens and interests owned byothers have been deducted
OOIP : Original oil in place
PLa or PLas : Petroleum lease application(s)
Possible reserves : Those additional reserves which analysis of geoscienceand engineering data indicate are less likely to berecoverable than probable reserves
Probable reserves : With regards to oil and gas, those additional reserveswhich analysis of geoscience and engineering dataindicate are less likely to be recovered than provedreserves but more certain to be recovered than possiblereserves or (ii) with regards to coal, the economicallymineable part of an indicated, and in somecircumstances, a measured resource. Assessments andstudies carried out demonstrate at the time of reportingthat extraction is justified.
Prospective resources : Those quantities of petroleum which are estimated, as ata given date, to be potentially recoverable fromundiscovered accumulations
268
For
per
sona
l use
onl
y
Proved developed reserves : Proved oil, gas and coal reserves that can be expectedto be recovered through existing wells, facilities andmines with the existing equipment and under the existingoperating methods
Proved reserves : With regards to oil and gas, those quantities ofpetroleum, which by analysis of geoscience andengineering data, can be estimated with reasonablecertainty to be commercially recoverable, from a givendate forward, from known reservoirs and under definedeconomic conditions, operating methods, andgovernment regulations or (ii) with regards to coal, theeconomically mineable part of a measured resource.Assessments and studies carried out demonstrate at thetime of reporting that extraction is justified
Proved undeveloped
reserves
: Proved oil, gas and coal reserves that are expected to berecovered from future wells, facilities and mines,including future improved recovery projects
PV-10 : Present value of estimated future oil and gas revenues,net of estimated direct expenses, discounted at anannual rate of 10%
Recompletion : Completion for production of an existing well bore inanother formation from that in which the well has beenpreviously completed
Reserves : With regards to oil and gas, those quantities of petroleumanticipated to be commercially recoverable byapplication of development projects to knownaccumulations from a given date forward under definedconditions or (ii) with regards to coal, the economicallymineable part of a resource. It includes diluting materialsand allowances for losses which may occur when thematerial is mined. Appropriate assessments and studieshave been carried out, and include considerations of andmodification by realistically assumed mining,metallurgical, economic, marketing, legal, environmental,social and governmental factors
Resources : With regards to oil and gas, all quantities of petroleum(recoverable and unrecoverable) naturally occurring onor within the earth’s crust, discovered and undiscovered,plus those quantities already produced or (ii) withregards to coal, a concentration or occurrence ofmaterial of intrinsic economic interest in or on the earth’scrust in such form, quality and quantity that there arereasonable prospects for economic extraction. Thelocation, quality, grade, geological characteristics andcontinuity of a resource are known estimated orinterpreted from specific geological evidence andknowledge
ROM : Run-of-mine
269
For
per
sona
l use
onl
y
sulphur : One of the elements present, in varying quantities, incoal that contributes to environmental degradation whencoal is burned. Sulphur dioxide is produced as agaseous by-product of coal combustion
sulphur content : Coal is commonly described by its sulphur content due tothe importance of sulphur to customers concerned aboutcompliance with environmental regulations. “Lowsulphur” coal has a variety of definitions, but typically isused to describe coal consisting of 1.0% or less sulphur
syngas : Synthetics gas
TCF : One trillion cubic feet of gas
thermal coal : Coal used in thermal plants to generate electricity
UCG : Underground coal gasification
VALMIN Code : Code for the Technical Assessment and Valuation ofMineral and Petroleum Assets and Securities forIndependent Expert Reports 2005 Edition, prepared bythe VALMIN Committee, a joint committee of theAustralasian Institute of Mining and Metallurgy, theAustralian Institute of Geoscientists and the MineralIndustry Consultants Association with the participation ofthe Australian Securities and Investment Commission,the Australian Stock Exchange Limited, the MineralsCouncil of Australia, the Petroleum Exploration Societyof Australia, the Securities Association of Australia andrepresentatives from the Australian finance sector
wash : The removal or reduction of impurities from coal
Working Interest : An interest in an oil and gas lease that gives the ownerof the interest the right to drill for and produce oil and gason the leased acreage and requires the owner to pay ashare of the costs of drilling and production operations
GENERAL
Application Forms : The Public Offer Shares Application Forms and thePlacement Shares Application Forms
Application List : The list of applications for subscriptions of the OfferingShares
Associate : (a) in relation to any director, chief executive officer,substantial shareholder or controlling shareholderof a corporation (being an individual) means:
(i) his immediate family;
(ii) a trustee, acting in his capacity as suchtrustee, of any trust of which the individualor his immediate family is a beneficiary or,in the case of a discretionary trust, is adiscretionary object; and
270
For
per
sona
l use
onl
y
(iii) any corporation in which he and hisimmediate family together (directly orindirectly) have an interest of 30% or more;
(b) in relation to a substantial shareholder orcontrolling shareholder of a corporation (being acorporation) any other corporation which is itssubsidiary or holding company or is a subsidiaryof such holding company or one in the equity ofwhich it and/or such other company or companiestaken together (directly or indirectly) have aninterest of 30% or more
ASX : Australian Securities Exchange
ATM : Automated teller machine
ATM Electronic Applications : Applications for the Public Offer Shares made through anATM of one of the Participating Banks in accordancewith the terms and conditions of this Prospectus
Authority : Monetary Authority of Singapore
Australia : The Commonwealth of Australia
Board or Board of Directors : The Board of Directors of our Company or committeeconstituted thereof
Blair Athol Joint Venture
Party
: The vendor of the Blair Athol Mine, comprisingQueensland Coal Pty Limited, Leichhardt Coal PtyLimited, J-Power Australia Pty Ltd and JCD Australia PtyLtd
Call Option Shares : Up to 10,750,000 new Shares to be issued by ourCompany pursuant to the Genting Call Option
Carmichael Project : The mining of coal by Adani from its Carmichael coaltenement further to the transaction described in thesection titled “Management’s Discussion and Analysis ofFinancial Conditions and Results of Operations—Factorsaffecting our Results of Operations—Acquisitions anddisposal of our assets”
Clermont Joint Venture
Party
: The owner of the Clermont Mine comprising MitsubishiDevelopment Pty Ltd, Queensland Coal Pty Ltd, J-PowerAustralia Pty Ltd and J.C.D. Australia Pty Ltd
Constitution : The constitution of our Company, as amended,supplemented or modified from time to time
Controlling Shareholder : In relation to a corporation, means a person who:
(A) holds directly or indirectly 15.0% or more of thetotal number of issued shares excluding treasuryshares in the corporation; or
(B) in fact exercises control over the corporation
271
For
per
sona
l use
onl
y
Conventional Coal Mining
Assets
: Interest in the mining tenements comprising eight coalmining assets held by us as at the date of this offeringdocument
Corporations Act : Australian Corporations Act 2001 (Cth)
CDP : The Central Depository (Pte) Ltd
CN Shares : The new Shares issued pursuant to the conversion of the2018 Convertible Notes
Director(s) : The director(s) on the Board of our Company
Electronic Applications : ATM Electronic Applications and Internet ElectronicApplications
EBITDAX : Net profit (loss) before income tax, non-controllinginterest, interest income, finance costs, depreciation,depletion and amortisation, loss on sales of assets,impairment expense, accretion expense, unrealisedcommodity derivative loss, plug and abandonment andbad debt expense
EGM : Extraordinary General Meeting
Employee Option Plan
Share
: Share upon conversion from the Option
EPS : Earnings Per Share
Executive Director : A Director of our Group who performs an executivefunction
Existing ASX Shareholders : The registered owners of Shares as at such booksclosure date to be determined, in connection with thedelisting of our Company from ASX as described in thesection titled “Share Ownership—Delisting from ASX” ofthis offering document
Financial Year or FY : Financial year ended or, as the case may be, ending30 June
GDP : Gross domestic product
Genting Call Option : The call option granted to Genting to subscribe for up to10,750,000 Shares
Goods and Services Tax Act : The Goods and Services Tax Act, Chapter 117A ofSingapore, as amended, supplemented or modified fromtime to time
Gulf Coast Region : The Gulf Coast region of Texas and Louisiana
Internet Electronic
Applications
: Applications for the Public Offer Shares made throughthe internet banking websites of the relevantParticipating Banks
IFRS : International Financial Reporting Standards
Joint Issue Managers orJoint Bookrunners and Joint
Lead Managers
: Credit Suisse (Singapore) Limited, DBS Bank Ltd. andJ.P. Morgan (S.E.A.) Limited
272
For
per
sona
l use
onl
y

Latest Practicable Date : 15 November 2013 being the latest practicable date priorto the lodgement of this Prospectus with the Authority
Listing Date
:The date trading of the Shares on the SGX-STcommences
Listing Manual : The listing manual of the SGX-ST
Lock-up Shares : The Shares which are held by the Newtron Pty Ltd, anentity which Mr. Peter Bond is the sole shareholder of,which are subject to the lock-up arrangement
Market Day : A day on which the SGX-ST is open for trading insecurities
NAV : Net asset value
Non-Executive Director : A Director of our Group who is not an Executive Director(including a Non-Executive Independent Director)
Non-Executive Independent
Directors
: The non-executive independent Directors of ourCompany
NTA : Net tangible assets
Offer Agreement : The offer agreement dated the date of this offeringdocument, entered into between ourselves and the JointBookrunners and Joint Lead Managers in relation to thePublic Offer
Offering : The Placement and Public Offer
Offering Price : The Offering price of S$1.20 per Offering Share
Offering Shares : The 47,850,000 Offering Shares
Participating banks : DBS Bank Ltd. (including POSB) (“DBS”), Oversea-Chinese Banking Corporation Limited (“OCBC”) andUnited Overseas Bank Limited and its subsidiary, FarEastern Bank Limited (the “UOB Group”)
Performance Rights Plan
Share
: Share upon vesting of Right
Placement : The international placement of Offering Shares toinvestors, including institutional and other investors inSingapore
Public Offer : An offering of Offering Shares to the public in Singapore
Public Offer Shares
Application Forms
: The Public Offer Shares application forms issuedtogether with this Prospectus in respect of the OfferingShares which are the subject of the Public Offer
Purchase Agreement : The purchase agreement dated the date of this offeringdocument entered into between ourselves and the JointBookrunners and Joint Lead Managers in relation to thePlacement
273
For
per
sona
l use
onl
y

Options : The options granted under our Employee Option Planwhich was adopted
qualified institutional buyers : Has the meaning as ascribed to it under Rule 144A
Qualified Persons : Haas Petroleum Engineering Services, Inc, Ryder ScottCompany, L.P., DeGolyer and MacNaughton, GustavsonAssociates, Snowden Mining Industry Consultant PtyLtd, Xenith Consulting Pty Ltd and MineCraft ConsultingPty Ltd
Qualified Persons’
Reports
: The summary of an estimate of our reserves andcontingent and prospective resources prepared by theQualified Persons and set out in Appendix I of thisoffering document
Regulation S : Regulation S under the U.S. Securities Act
Rights : The Rights issued the Performance Rights Planapproved by our Shareholders at our annual generalmeeting dated 26 November 2009
Rule 144A : Rule 144A under the U.S. Securities Act
Securities and Futures Act : The Securities and Futures Act, Chapter 289 ofSingapore, as amended from time to time
Securities Act : The U.S. Securities Act of 1933, as amended
Shareholders : The registered holders of our Shares
Shares : Fully paid ordinary shares of our Company
Singapore Companies Act : The Companies Act, Chapter 50 of Singapore, asamended from time to time
Singapore Take-over Code : The Singapore Code on Take-overs and Mergers
Singapore Take-over and
Merger Laws and
Regulations
: Sections 138, 139 and 140 of the Securities and FuturesAct and the Singapore Take-over Code
Substantial Shareholder : A person who has an interest or interests in the Shares,where the total votes attached to those Shares is notless than 5% of the total votes attached to all Shares
SFR : Securities and Futures (Offers of Investments) (Sharesand Debentures) Regulations 2005
Underwriting Agreements : Purchase Agreement and Offer Agreement
United States : United States of America
U.S. GAAP : United States Generally Accepted Accounting Principles
U.S. Securities Act : U.S. Securities Act of 1933, as amended
VAT : Value added tax
274
For
per
sona
l use
onl
y
CURRENCIES AND MEASUREMENTS
A$ or Australian dollar orAustralian cent
: The lawful currency of the Commonwealth of Australia
S$ or Singapore dollar : The lawful currency of the Republic of Singapore
sq km : square kilometres
US$ or United States dollar
or United States cent
:The lawful currency of the United States
The terms “depositor”, “depository agent” and “depository register” have the meaningsascribed to them respectively in Section 130A of the Singapore Companies Act.
Words importing the singular include, where applicable, the plural and vice versa, and wordsimporting the masculine gender include, where applicable, the feminine and neuter gender.
Any reference in this document to any legislation or enactment refers to the legislation orenactment as amended or re-enacted unless the context otherwise requires.
Unless we specify otherwise or the context otherwise requires, all references to our “Shares”refer to ordinary shares in the capital of our Company.
References herein to “this document” should be construed as being references to the “offeringdocument” in the context of the offering circular distributed outside Singapore or the“Singapore Prospectus” or the “Prospectus” in the context of the prospectus registered by theAuthority and distributed in Singapore.
275
For
per
sona
l use
onl
y

[THIS PAGE INTENTIONALLY LEFT BLANK]
For
per
sona
l use
onl
y
APPENDIX A—REGULATIONS
SUMMARY OF RELEVANT U.S. LAWS AND REGULATIONS
The oil and gas industry is extensively regulated by numerous federal, state and localauthorities. Oil and gas production and related operations are, or have been, subject to pricecontrols, taxes and numerous other laws and regulations. All of the jurisdictions in which theCompany owns or operate properties for oil and gas production are subject to statutoryprovisions regulating the exploration for and production of oil and gas, including provisionsrelated to permits for the drilling of wells, bonding requirements to drill or operate wells, thelocation of wells, the method of drilling and casing wells, the surface use and restoration ofproperties upon which wells are drilled, sourcing and disposal of water used in the drilling andcompletion process and regulations addressing the abandonment of wells. The Company’sproperties and operations are also subject to various conservation laws and regulations.These include regulation of the size of drilling and spacing units or proration units, the numberof wells that may be drilled in an area, and the unitisation or pooling of oil and gas wells andproperties, as well as regulations that generally prohibit the venting or flaring of gas and incertain cases may impose requirements regarding the rateability or fair apportionment ofproduction from fields and individual wells.
Failure to comply with applicable laws and regulations can result in substantial penalties. Theregulatory burden on the industry increases the cost of doing business and affectsprofitability. The Company believes that it is in substantial compliance with currentlyapplicable laws relating to environmental protection, health and safety, and resourceconservation and is undertaking corrective actions where noncompliance has been identified.Where appropriate, the Company is developing a plan to achieve and maintain substantialcompliance with such laws and regulations. Further, the Company believes that ongoingsubstantial compliance with existing requirements should not have a material adverse effecton the Company’s financial condition, results of operations or cash flows. Nevertheless, suchlaws and regulations are frequently amended or reinterpreted. Therefore, the Company isunable to predict the future costs or impact of compliance. Additional proposals andproceedings that affect the oil and gas industry are regularly considered by the United StatesCongress, the states, the Federal Energy Regulatory Commission (“FERC”) and the courts.We cannot predict when or whether any such proposals may become effective.
Drilling and Production
The Company’s operations and properties are subject to various types of regulation at thefederal, state and local levels. As noted above, these types of regulation typically includerequiring permits for the drilling of wells, drilling bonds and ongoing reports concerningoperations. In addition, the states and some counties and municipalities in which theCompany operates also regulate one or more of the following:
‰ the location of wells;
‰ the method of drilling and casing wells;
‰ the surface use and restoration of properties upon which wells are drilled; and
‰ the plugging and abandoning of wells.
State and federal laws and regulations prescribe the size and shape of drilling and spacingunits or proration units and govern the pooling of oil and gas properties. Some states allowforced pooling or integration of tracts to facilitate exploitation while other states, such asTexas, generally rely on voluntary pooling of lands and leases. In some instances, forcedpooling or unitisation may be implemented by third parties and may reduce the Company’sinterest in the unitised properties. In addition, state conservation laws can establish maximumrates of production from oil and gas wells, generally prohibit the venting or flaring of gas and
A-1
For
per
sona
l use
onl
y
impose requirements regarding the ratability of production. These laws and regulations maylimit the amount of oil and gas the Company can produce from the Company’s wells or limitthe number of wells or the locations at which the Company can drill. Moreover, each stategenerally imposes a production or severance tax with respect to the production and sale of oiland gas within its jurisdiction.
The Company does not control the availability of transportation and processing facilities usedin the marketing of its production. For example, the Company may have to shut in aproductive gas well because of a lack of available gas gathering or transportation facilities.
The Company conducts operations on state oil and gas leases and these operations mustcomply with numerous regulatory restrictions, including royalty and related valuationrequirements, and certain of these operations must be conducted pursuant to certain specificregulations and other appropriate permits issued by the appropriate federal or state agencies
The Company’s sales of oil are affected by the availability, terms and cost of transportation.The transportation of oil in common carrier pipelines is also subject to rate and serviceregulation. The FERC regulates interstate oil pipeline transportation rates under the InterstateCommerce Act. In general, interstate oil pipeline rates must be cost-based, althoughsettlement rates agreed to by all shippers are permitted and market based rates may bepermitted in certain circumstances. Effective 1 January 1995, the FERC implementedregulations establishing an indexing system (based on inflation) for transportation rates for oilthat, on an annual basis, allows for an increase or decrease in the cost of transporting oil tothe shipper. Following the FERC’s most recent five-year review of the indexing methodology,the FERC issued orders in 2011 and 2012 revising the methodology and increasing theannual index ceilings, the most recent of which became effective July 2012. The FERC’srevised indexing methodology is the subject of pending appeals by several shippers and anassociation of Canadian oil producers.
Intrastate oil pipeline transportation rates are subject to regulation by state regulatorycommissions. The basis for intrastate oil pipeline regulation, and the degree of regulatoryoversight and scrutiny given to intrastate oil pipeline rates, varies from state to state. Insofaras effective interstate and intrastate rates are equally applicable to all comparable shippers,the Company believes that the regulation of oil transportation rates will not affect theCompany’s operations in any way that is of material difference from those of the Company’scompetitors who are similarly situated.
Further, interstate and intrastate common carrier oil pipelines must provide service on a non-discriminatory basis. Under this statutory standard, common carriers must offer service to allsimilarly situated shippers requesting service on the same terms and under the same rates.When oil pipelines operate at full capacity, access is governed by prorationing provisions setforth in the pipelines’ published tariffs. Accordingly, the Company believes that access to oilpipeline transportation services generally will be available to the Company to the same extentas to the Company’s similarly situated competitors.
Transport and Sale of Gas
Historically, the transportation and sale for resale of gas in interstate commerce have beenregulated by the FERC under the Natural Gas Act of 1938 (“NGA”), the Natural Gas PolicyAct of 1978 (“NGPA”), and regulations issued under those statutes. In the past, the federalgovernment has regulated the prices at which gas could be sold. While sales by producers ofgas can currently be made at market prices, the United State Congress could reenact pricecontrols in the future. Deregulation of wellhead gas sales began with the enactment of theNGPA and culminated in adoption of the Natural Gas Wellhead Decontrol Act, which removedall price controls affecting wellhead sales of gas effective 1 January 1993.
FERC regulates interstate gas transportation rates, and terms and conditions of service,which affects the marketing of gas that the Company produce, as well as the revenues the
A-2
For
per
sona
l use
onl
y
Company receive for sales of the Company’s gas. Since 1985, the FERC has endeavored tomake gas transportation more accessible to gas buyers and sellers on an open andnon-discriminatory basis. The FERC has stated that open access policies are necessary toimprove the competitive structure of the interstate gas pipeline industry and to create aregulatory framework that will put gas sellers into more direct contractual relations with gasbuyers by, among other things, unbundling the sale of gas from the sale of transportation andstorage services. Beginning in 1992, the FERC issued a series of orders, beginning withOrder No. 636, to implement its open access policies. As a result, the interstate pipelines’traditional role of providing the sale and transportation of gas as a single service has beeneliminated and replaced by a structure under which pipelines provide transportation andstorage service on an open access basis to others who buy and sell gas. Although theFERC’s orders do not directly regulate gas producers, they are intended to foster increasedcompetition within all phases of the gas industry.
Beginning in 2000, the FERC issued Order No. 637 and subsequent orders, which imposed anumber of additional reforms designed to enhance competition in gas markets. Among otherthings, these orders revised the FERC’s pricing policy by waiving price ceilings for short-termreleased capacity, and effected changes in the FERC regulations relating to schedulingprocedures, capacity segmentation, penalties, rights of first refusal and information reporting.
The gas industry historically has been very heavily regulated. Therefore, the Company cannotprovide any assurance that the less stringent regulatory approach recently established by theFERC will continue. However, the Company does not believe that any action taken will affectthe Company in a way that materially differs from the way it affects other gas producers.
The price at which the Company sells gas is not currently subject to federal rate regulationand, for the most part, is not subject to state regulation. However, with regard to theCompany’s physical sales of these energy commodities, the Company is required to observeanti-market manipulation laws and related regulations enforced by the FERC and/or theCommodity Futures Trading Commission, or the CFTC. Should the Company violate the anti-market manipulation laws and regulations, the Company could also be subject to related thirdparty damage claims by, among others, sellers, royalty owners and taxing authorities. Inaddition, pursuant to Order No. 704, some of the Company’s operations may be required toannually report to the FERC on May 1 of each year for the previous calendar year. Currently,Order No. 704 requires certain gas market participants to report information regarding theirreporting of transactions to price index publishers and their blanket sales certificate status, aswell as certain information regarding their wholesale, physical gas transactions for theprevious calendar year depending on the volume of gas transacted.
Gathering services, which occur upstream of jurisdictional transmission services, areregulated by the states. Although the FERC has set forth a general test for determiningwhether facilities perform a non-jurisdictional gathering function or a jurisdictionaltransmission function, the FERC’s determinations as to the classification of facilities are doneon a case by case basis. To the extent that the FERC issues an order that reclassifiestransmission facilities as gathering facilities, and depending on the scope of that decision, theCompany’s costs of getting gas to point of sale locations may increase. State regulation ofgas gathering facilities generally include various safety, environmental and, in somecircumstances, nondiscriminatory take requirements. Although such regulation has notgenerally been affirmatively applied by state agencies, gas gathering may receive greaterregulatory scrutiny in the future.
Intrastate gas transportation and facilities are also subject to regulation by state regulatoryagencies, and certain transportation services provided by intrastate pipelines are alsoregulated by the FERC. The basis for intrastate regulation of gas transportation and thedegree of regulatory oversight and scrutiny given to intrastate gas pipeline rates and servicesvaries from state to state. Insofar as such regulation within a particular state will generallyaffect all intrastate gas shippers within the state on a comparable basis, the Company
A-3
For
per
sona
l use
onl
y
market demand or resource conservation, or both. Texas does not regulate wellhead prices orengage in other similar direct economic regulation, but there can be no assurance that it willnot do so in the future. The effect of these regulations may be to limit the amounts ofhydrocarbons that may be produced from the Company’s wells and to limit the number ofwells or locations the Company can drill.
The primary regulatory agencies within the State of Texas which impact the Company’s oiland gas operations are the Railroad Commission of Texas (“RRC”) and the TexasCommission on Environmental Quality (“TCEQ”). The RRC regulates the exploration for andproduction of oil and natural gas within the State. As generally discussed above, RRCregulations control where and how oil and gas wells may be drilled and require monthlyproduction reporting. Additionally, the RRC rules specify requirements for the plugging andabandonment of wells and the clean-up of facilities. In this regard, the RRC recently passed arule to strengthen the construction of oil and gas wells. The rule, known as the “well-integrityrule,” will take effect next January, and will update the RRC’s requirements for the process ofdrilling wells, putting pipe down them and cementing things in place.
The TCEQ is charged with implementing U.S. law and regulation on protection of theenvironment, including air emissions controls. In this regard, the TCEQ requires emissionsinventories of oil and gas facilities and has implemented a hierarchical system of permittingrequirements, beginning with permit by rule for sources producing minimal emissions andincreasing in detail and severity thereafter. The TCEQ recently adopted requirements forreporting, permitting and control of emissions from planned maintenance, startup or shutdown(“MSS”) of facilities which will be effective in 2014. The Company is in the process ofanalysing these rules to ensure its compliance with them.
State of Wyoming Oil and Gas Regulation
The State of Wyoming regulates the drilling for, and the production, gathering and sale of, oiland gas, including imposing severance taxes and requirements for obtaining drilling permits.The State of Wyoming also regulates the method of developing new fields, the spacing andoperation of wells and the prevention of waste of oil and gas resources, and may regulaterates of production and may establish maximum daily production allowables from wells basedon market demand or resource conservation, or both. Wyoming does not regulate wellheadprices or engage in other similar direct economic regulation, but there can be no assurancethat it will not do so in the future. The effect of these regulations may be to limit the amountsof hydrocarbons that may be produced from the Company’s wells and to limit the number ofwells or locations the Company can drill.
The primary regulatory agencies within the State of Wyoming which impact the Company’s oiland gas operations are the Wyoming Oil and Gas Commission (“WOGCC”), Bureau of LandManagement (“BLM”), Office of State Lands and Investments (“OSLI”), and the WyomingDepartment of Environment Quality (“WDEQ”). The WOGCC regulates the exploration for andproduction of oil and natural gas within the State. The WOGCC controls and regulates allaspects of the Oil and Gas industry in Wyoming. Drilling approvals, completions, productionfiling, well spacing, conservation tax remittal, and sundry notices are controlled by theWOGCC. Additionally, the WOGCC rules specify requirements for the plugging andabandonment of wells, clean-up of facilities, baseline water testing, and new fracking rules.The WOGCC is the liaison between the oil and gas industry and the State of Wyominggovernmental agencies.
The BLM and OSLI control roughly 75% of the mineral acreage within our Glenrock assets.Both the OSLI and the BLM work closely with the WOGCC to promote federal and stateacreage. Both entities require monthly submittal of production, surface and mineral rentalsand yearly Plan of Developments for all units.
The WDEQ is charged with implementing U.S. law and regulation on protection of theenvironment, including air emissions controls. In this regard, the WDEQ requires emissions
A-8
For
per
sona
l use
onl
y
believes that the regulation of similarly situated intrastate gas transportation in any states inwhich the Company operate and ship gas on an intrastate basis will not affect the Company’soperations in any way that is of material difference from those of the Company’s competitors.Like the regulation of interstate transportation rates, the regulation of intrastate transportationrates affects the marketing of gas that the Company produce, as well as the revenues theCompany receive for sales of the Company’s gas.
Environment
Federal and state environmental laws can affect the operations which may be conducted onthe Company’s properties. State conservation laws will have a similar effect. Morespecifically, the Company’s operations and properties are subject to numerous federal,regional, state, and local, laws and regulations governing the release of pollutants orotherwise relating to environmental protection. These laws and regulations govern thefollowing, among other things:
‰ issuance of permits in connection with exploration, drilling and production activities;
‰ protection of endangered species;
‰ amounts and types of emissions and discharges;
‰ generation, management, and disposition of waste materials;
‰ reclamation and abandonment of wells and facility sites; and
‰ remediation of contaminated sites.
Air
One of the most significant laws affecting the Company’s operations is the Clean Air Act(“CAA”) which was first passed as the 1967 Air Quality Act. The 1967 Act established theconcept of air quality control regions. Under the Act, the federal government developed airquality criteria for selected pollutants (e.g., SO2, NOx, and particulate matter) reflecting thelatest scientific knowledge about air pollutants. The states, in turn, were to use the criteria asthe basis for air quality standards for the designated regions.
The CAA was amended in 1970 to give the federal government a more central role andestablished the basic regulatory structure that exists today. Under the 1970 amendments, thenewly created Environmental Protection Agency (“EPA”) was directed to establish nationalambient air quality standards (“NAAQS”) for the criteria pollutants. The NAAQS were to beused by states as the basis for individual source emission limitations in state implementationplans (“SIPs”). SIPs remain the principal CAA tool for control of criteria pollutant emissionsfrom existing stationary sources. The 1970 amendments also contained provisions to regulatehazardous air pollutants and to establish a special set of standards for certain new sources(i.e., New Source Performance Standards).
The CAA was amended again in 1977, and established the prevention of significantdeterioration (“PSD”) programme, added nonattainment provisions applicable to areas notmeeting the NAAQS, expanded the programme for hazardous air pollutants to include certainspecific pollutants, and required EPA to review the air quality criteria and NAAQS every fiveyears.
The most recent legislative action, the 1990 CAA amendments added many substantiveprovisions to the CAA while leaving in place much of the pre-existing system of air pollutioncontrol. Specifically, the 1990 amendments contained, among other provisions, newrequirements for areas that do not meet ambient air quality standards, tightened mobilesource emission standards, significantly altered the approach for regulation of hazardous airpollutants and established a new operating permit programme.
A-4
For
per
sona
l use
onl
y
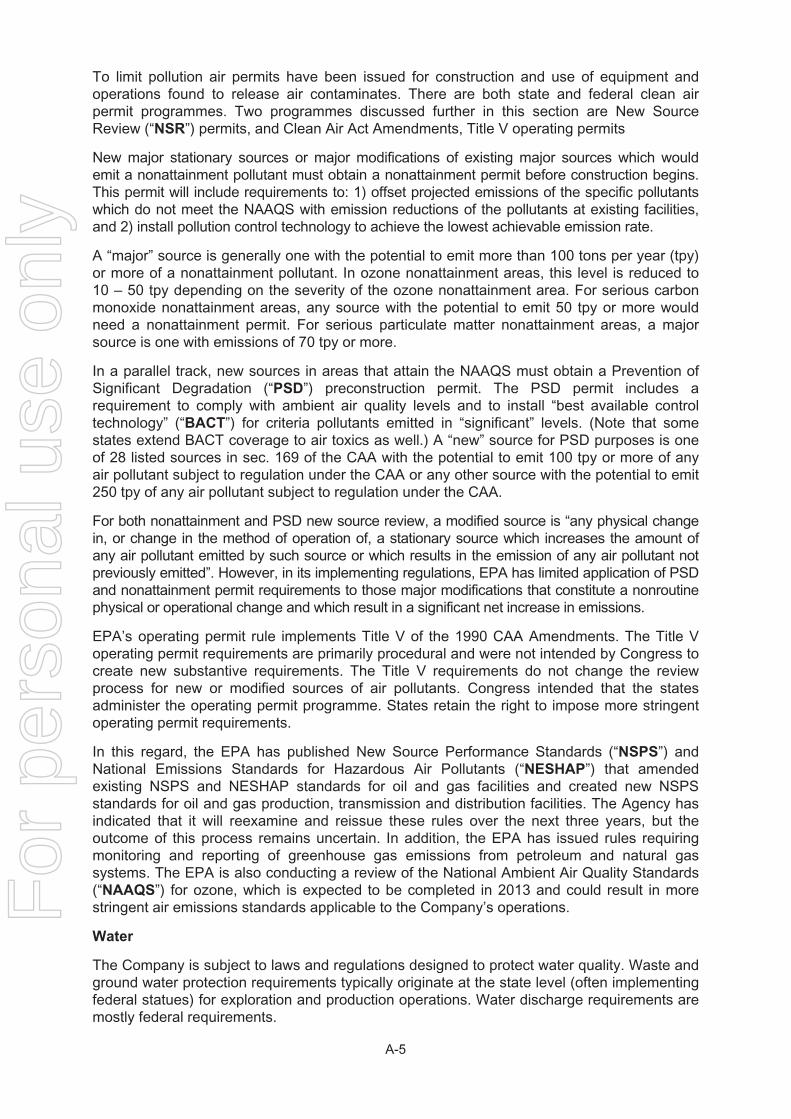
To limit pollution air permits have been issued for construction and use of equipment andoperations found to release air contaminates. There are both state and federal clean airpermit programmes. Two programmes discussed further in this section are New SourceReview (“NSR”) permits, and Clean Air Act Amendments, Title V operating permits
New major stationary sources or major modifications of existing major sources which wouldemit a nonattainment pollutant must obtain a nonattainment permit before construction begins.This permit will include requirements to: 1) offset projected emissions of the specific pollutantswhich do not meet the NAAQS with emission reductions of the pollutants at existing facilities,and 2) install pollution control technology to achieve the lowest achievable emission rate.
A “major” source is generally one with the potential to emit more than 100 tons per year (tpy)or more of a nonattainment pollutant. In ozone nonattainment areas, this level is reduced to10 – 50 tpy depending on the severity of the ozone nonattainment area. For serious carbonmonoxide nonattainment areas, any source with the potential to emit 50 tpy or more wouldneed a nonattainment permit. For serious particulate matter nonattainment areas, a majorsource is one with emissions of 70 tpy or more.
In a parallel track, new sources in areas that attain the NAAQS must obtain a Prevention ofSignificant Degradation (“PSD”) preconstruction permit. The PSD permit includes arequirement to comply with ambient air quality levels and to install “best available controltechnology” (“BACT”) for criteria pollutants emitted in “significant” levels. (Note that somestates extend BACT coverage to air toxics as well.) A “new” source for PSD purposes is oneof 28 listed sources in sec. 169 of the CAA with the potential to emit 100 tpy or more of anyair pollutant subject to regulation under the CAA or any other source with the potential to emit250 tpy of any air pollutant subject to regulation under the CAA.
For both nonattainment and PSD new source review, a modified source is “any physical changein, or change in the method of operation of, a stationary source which increases the amount ofany air pollutant emitted by such source or which results in the emission of any air pollutant notpreviously emitted”. However, in its implementing regulations, EPA has limited application of PSDand nonattainment permit requirements to those major modifications that constitute a nonroutinephysical or operational change and which result in a significant net increase in emissions.
EPA’s operating permit rule implements Title V of the 1990 CAA Amendments. The Title Voperating permit requirements are primarily procedural and were not intended by Congress tocreate new substantive requirements. The Title V requirements do not change the reviewprocess for new or modified sources of air pollutants. Congress intended that the statesadminister the operating permit programme. States retain the right to impose more stringentoperating permit requirements.
In this regard, the EPA has published New Source Performance Standards (“NSPS”) andNational Emissions Standards for Hazardous Air Pollutants (“NESHAP”) that amendedexisting NSPS and NESHAP standards for oil and gas facilities and created new NSPSstandards for oil and gas production, transmission and distribution facilities. The Agency hasindicated that it will reexamine and reissue these rules over the next three years, but theoutcome of this process remains uncertain. In addition, the EPA has issued rules requiringmonitoring and reporting of greenhouse gas emissions from petroleum and natural gassystems. The EPA is also conducting a review of the National Ambient Air Quality Standards(“NAAQS”) for ozone, which is expected to be completed in 2013 and could result in morestringent air emissions standards applicable to the Company’s operations.
Water
The Company is subject to laws and regulations designed to protect water quality. Waste andground water protection requirements typically originate at the state level (often implementingfederal statues) for exploration and production operations. Water discharge requirements aremostly federal requirements.
A-5
For
per
sona
l use
onl
y
Every facility that drills, produces, refines, handles, processes, and/or stores oil hasdeveloped a spill prevention, control, and countermeasure (“SPCC”) plan, documenting thatfacility’s procedures and equipment for spill prevention. Equipment for spill preventionincludes dikes, terms, or other forms of secondary containment installed around tanks andother processing vessels, to retain oil in the event of a release. Spill prevention proceduresinclude tank integrity testing and leak testing to ensure that oil storage and process vesselsare in sound operating condition. In addition, each facility, platform and pipeline must developa plan that identifies the personnel, equipment and materials it needs to deal with a spill.
In addition, certain of the Company’s properties are located on or near “wetlands”, which aregenerally described as lands where saturation with water is the dominant factor determiningthe nature of soil development and the types of plant and animal communities living in the soiland on its surface. Operations on “wetlands” are subject to regulation by the EPA and theU.S. Army Corps of Engineers, and permits are generally required before operations may beconducted, or facilities constructed, in wetlands areas.
Health and Safety
The Company’s operations are subject to health and safety regulation, including regulation bythe U.S. Occupational Health and Safety Administration (“OSHA”). Employers must protectthe safety and health of workers involved in oil and gas operations according to:
‰ OSHA’s General Industry Standards (29 CFR 1910)
‰ OSHA’s Construction Standards (29 CFR 1926)
‰ General Duty Clause of the Occupational Safety and Health (OSH) Act
Future Regulation
There are numerous additional statutory and regulatory requirements which may or will affectthe operations of our Company and our properties. For example, federal and state legislationand regulatory initiatives relating to hydraulic fracturing could result in increased costs andadditional operating restrictions or delays. Hydraulic fracturing involves the injection of water,sand or other propping agents and chemicals under pressure into rock formations to stimulateoil and natural gas production. Although our Company does not currently utilise “hydraulicfracturing”, as that term is normally interpreted, recent developments and controversy couldnevertheless impact our Company. The EPA is conducting a comprehensive research studyon the potential adverse impacts that hydraulic fracturing may have on drinking water andgroundwater. A progress report was released in December 2012, with final results expected in2014. Consequently, even if federal legislation is not adopted soon or at all, the performanceof the hydraulic fracturing study by the EPA could spur further action towards federallegislation and regulation of hydraulic fracturing or similar production operations. Also at thefederal level, the U. S. Bureau of Land Management “BLM” has indicated that it is consideringproposed rules to regulate hydraulic fracturing on federal lands. Additionally, the EPA hasannounced an initiative under the Toxic Substances Control Act to develop regulationsgoverning the disclosure of hydraulic fracturing chemicals.
In addition, a number of states and local regulatory authorities are considering or haveimplemented more stringent regulatory requirements applicable to hydraulic fracturing, whichcould include a moratorium on drilling and effectively prohibit further production of oil andnatural gas through the use of hydraulic fracturing or similar operations. Texas and Wyominghave adopted legislation that requires the disclosure of information regarding the substancesused in the hydraulic fracturing process. This legislation and any implementing regulationscould increase the Company’s costs of compliance and doing business.
The adoption of new laws or regulations imposing reporting obligations on, or otherwiselimiting, the hydraulic fracturing process could make it more difficult to complete oil and
A-6
For
per
sona
l use
onl
y
natural gas wells in unconventional resource plays. In addition, if hydraulic fracturingbecomes regulated at the federal level as a result of federal legislation or regulatory initiativesby the EPA, hydraulic fracturing activities could become subject to additional permittingrequirements, and also to attendant permitting delays and potential increases in cost, whichcould adversely affect the Company’s business and results of operations.
Legislation or regulations restricting emissions of greenhouse gases could result in increasedoperating costs. The EPA has published its final findings that emissions of CO2, methane andother greenhouse gases present an endangerment to public health and welfare becauseemissions of such gases are, according to the EPA, contributing to the warming of the earth’satmosphere and other climatic changes. Accordingly, the EPA has adopted rules under theCAA for the permitting of greenhouse gas emissions from stationary sources under thePrevention of Significant Deterioration (“PSD”) and Title V permitting programmes. The EPAhas adopted a multi-tiered approach to this permitting, with the largest sources first subject topermitting. In addition, on 30 October 2009, the EPA published a final rule requiring thereporting of greenhouse gas emissions from specified large greenhouse gas emissionsources in the United States beginning in 2011 for emissions occurring in 2010. On30 November 2010, the EPA released a final rule that expands its rule on reporting ofgreenhouse gas emissions to include owners and operators of petroleum and natural gassystems. Monitoring of those newly covered emissions commenced on 1 January 2011, withthe first annual reports filed in 2012.
New regulations on all emissions from operations could cause the Company to incursignificant costs. On 17 April 2012, the EPA issued final rules to subject oil and natural gasoperations to regulation under the NSPS and NESHAPS, programmes under the CAA, and toimpose new and amended requirements under both programmes. The EPA rules includeNSPS standards for completions of hydraulically fractured natural gas wells. Before 1 January2015, these standards require owners/operators to reduce volatile organic compound (“VOC”)emissions from natural gas not sent to the gathering line during well completion either byflaring using a completion combustion device or by capturing the natural gas using greencompletions with a completion combustion device. Beginning 1 January 2015, operators mustcapture the natural gas and make it available for use or sale, which can be done through theuse of green completions. The standards are applicable to new hydraulically fractured wellsand also existing wells that are refractured. As noted above, the Company does not currentlyutilise hydraulic fracturing in its oil and gas operations. However, the finalised regulations alsoestablish specific new requirements, effective in 2012, for emissions from compressors,controllers, dehydrators, storage tanks, natural gas processing plants and certain otherequipment which is used by the Company. These rules may require changes to theCompany’s operations, including the installation of new equipment to control emissions. TheCompany is currently evaluating the effect these rules will have on the Company’s business.
The adoption and implementation of any regulations imposing reporting obligations on, orlimiting emissions of greenhouse gases from, the Company’s equipment and operations couldrequire the Company to incur costs to reduce emissions of greenhouse gases associated withthe Company’s operations. There were attempts at comprehensive federal legislationestablishing a cap and trade programme, but that legislation did not pass. Further, variousstates have considered or adopted legislation that seeks to control or reduce emissions ofgreenhouse gases from a wide range of sources. Any such legislation could adversely affectdemand for the oil, natural gas and natural gas liquids that the Company produces.
State of Texas Oil and Gas Regulation
The State of Texas regulates the drilling for, and the production, gathering and sale of, oil andgas, including imposing severance taxes and requirements for obtaining drilling permits. TheState of Texas also regulates the method of developing new fields, the spacing and operationof wells and the prevention of waste of oil and gas resources, and may regulate rates ofproduction and may establish maximum daily production allowables from wells based on
A-7
For
per
sona
l use
onl
y
inventories of oil and gas facilities and has implemented a hierarchical system of permittingrequirements, beginning with permit by rule for sources producing minimal emissions andincreasing in detail and severity thereafter.
State of Louisiana Oil and Gas Regulation
The State of Louisiana regulates the drilling for, and the production, gathering and sale of, oiland gas, including imposing severance taxes and requirements for obtaining drilling permits.
The State of Louisiana also regulates the method of developing new fields, the spacing andoperation of wells and the prevention of waste of oil and gas resources, and may regulaterates of production and may establish maximum daily production allowables from wells basedon market demand or resource conservation, or both. Louisiana does not regulate wellheadprices or engage in other similar direct economic regulation, but there can be no assurancethat it will not do so in the future. The effect of these regulations may be to limit the amountsof hydrocarbons that may be produced from the Company’s wells and to limit the number ofwells or locations the Company can drill.
Louisiana’s resources of oil and gas are overseen by the Office of Conservation and theOffice of Mineral Resources of the Louisiana Department of Natural Resources. Similar to theRRC, the Office of Conservation regulates the exploration for and production of oil and naturalgas within the State and control where and how oil and gas wells may be drilled and requiresmonthly production reporting. In Louisiana, the Louisiana Department of EnvironmentalQuality (“LDEQ”) is responsible for, among other matters, air emission controls.
State of Alaska Oil and Gas Regulation
The State of Alaska regulates the drilling for, and the production, gathering and sale of, oiland gas, including imposing severance taxes and requirements for obtaining drilling permits.The State of Alaska also regulates the method of developing new fields, the spacing andoperation of wells and the prevention of waste of oil and gas resources, and may regulaterates of production and may establish maximum daily production allowables from wells basedon market demand or resource conservation, or both. Alaska does not regulate wellheadprices or engage in other similar direct economic regulation, but there can be no assurancethat it will not do so in the future. The effect of these regulations may be to limit the amountsof hydrocarbons that may be produced from our wells and to limit the number of wells orlocations we can drill in.
The primary regulatory agencies within the State of Alaska which impact the Company’s oiland gas operations are the Bureau of Land Management (“BLM”), the Alaska Department ofEnvironmental Conservation (“ADEC”), the Alaska Department of Fish and Game (“ADF&G”),the Alaska Oil and Gas Conservation Commission (“AOGCC”) and the Alaska Department ofNatural Resources. In the case of Umiat, the BLM is the leaseholder and specific leasestipulations and required operating procedures regarding the exploration for and developmentof their oil and gas leases. The ADEC controls water, land, and air pollution within the State ofAlaska. Waste generation, water discharges and air discharges associated with oil and gasexploration and production are permitted through ADEC. The ADF&G manages Alaska’s fish,game, and aquatic plant resources. The AOGCC is an independent, quasi-judicial agency ofthe State of Alaska. The Commission oversees oil and gas drilling, development andproduction, reservoir depletion and metering operations on all lands subject to Alaska’s policepowers. The ADNR manages all state-owned land, water and natural resources, except forfish and game. Within ADNR, the Division of Oil and Gas develops and manages Alaska’s oiland gas leasing programmes. The Oil & Gas division staff identifies prospective lease areas;performs geologic, economic, environmental and social analyses, develops a five-yearleasing schedule, and conducts public review of proposed sales. The division conductscompetitive oil and gas lease sales and monitors collection of all funds resulting from itsprogrammes.
A-9
For
per
sona
l use
onl
y
SUMMARY OF RELEVANT AUSTRALIAN LAWS AND REGULATIONS
Native Title
Commonwealth Native Title Legislation
Native Title Act 1993
The Native Title Act 1993 (“NTA”) is intended to:
(a) provide for the recognition and protection of native title;
(b) establish ways in which future dealings affecting native title may proceed and to setstandards for those dealings;
(c) establish a mechanism for determining claims to native title;
(d) provide for, or permit, the validation of past acts, and intermediate period acts,invalidated because of the existence of native title; and
(e) confirm that certain dealings have extinguished native title.
The NTA established the National Native Title Tribunal, which administers a wide range offunctions and delivers a range of services pursuant to the NTA whilst the Federal Court ofAustralia is responsible for the management of all applications made under the NTA, beingapplications for determinations of native title, non-claimant applications and/or compensationapplications for the loss or impairment of native title.
The NTA makes provision for the States and Territories to enact complimentary legislation tovalidate certain acts done by the relevant State or Territory that took place before 1 January1994 or 23 December 1996, depending on the nature of the act, that would otherwise beinvalid because of native title. The NTA also confirms the past extinguishment of native titleby previous exclusive possession acts and previous non-exclusive possession acts.
Queensland Native Title Legislation
Native Title (Queensland) Act 1993
The Native Title (Queensland) Act 1993 (“NTQA”) is intended to:
(a) validate (in accordance with the NTA) past acts and intermediate period acts that wereinvalidated because of the existence of native title and to confirm certain rights;
(b) confirm (in accordance with the NTA) the past extinguishment of native title byprevious exclusive possession acts and previous non-exclusive possession acts thatwere done by the State; and
(c) to ensure that Queensland law is consistent with standards set by the NTA for futuredealings affecting native title.
The Queensland Department of Natural Resources and Mines (DNRM) is responsible foradministering the NTQA as well as having primary responsibility for implementing the NTA inQueensland.
South Australian Native Title Legislation
Native Title (South Australia) Act 1994
The Native Title (South Australia) Act 1994 (“NTSA”) is administered by the Crown Solicitor’soffice of the South Australian Attorney-General’s department.
A-10
For
per
sona
l use
onl
y

The NTSA:
(a) in accordance with the NTA, validates past and intermediate period acts in accordancewith the terms and requirements of the NTA;
(b) in accordance with the NTA, confirms the past extinguishment of native title by certainpast acts that were done by the State, including previous exclusive possession acts;and
(c) confirms South Australia’s existing ownership of any natural resources, existing rightsto use, control and regulate the flow of water, existing fishing access rights andexisting public access to waterways and public places.
Cultural Heritage
Commonwealth Cultural Heritage Legislation
Aboriginal and Torres Strait Islander Heritage Protection Act 1994
The Aboriginal and Torres Strait Islander Heritage Protection Act 1994 (“ATSIHP Act”) isregulated by the Commonwealth Department of Sustainability, Environment, Water,Population and Communities (“SEWPAC”).
The purpose of the ATSIHP Act is the protection and preservation of areas that are ofheritage significant to Aboriginal and Torres Strait Islander people in accordance with theirtraditions.
If it appears that state or territory laws have not provided effective protection, then under theATSIHP Act, the Australian Government can make declarations to protect significantAboriginal areas and objects from threats of injury or desecration.
However, the Australian Government can only make a declaration if an Aboriginal or TorresStrait Islander person has requested it and has provided satisfactory evidence of a body oftraditions, customs, observances and beliefs that explains, firstly, why there is a threat ofinjury or desecration and, secondly, why the area, object or class of objects is of particularsignificance to Aboriginal or Torres Strait Islander people.
Queensland Cultural Heritage Legislation
Aboriginal Cultural Heritage Act 2003
The Aboriginal Cultural Heritage Act 2003 (“ACH Act”) is administered by the QueenslandDepartment of Aboriginal and Torres Strait Islander and Multicultural Affairs (“DATSIMA”).
The ACH Act’s main purpose is to provide effective recognition, protection and conservationof Aboriginal cultural heritage by providing for, among other things, the establishment of:
(a) a duty of care for activities that may harm Aboriginal cultural heritage;
(b) powers of protection, investigation and enforcement; and
(c) processes for the timely and efficient management of activities to avoid or minimiseharm to Aboriginal cultural heritage.
Maximum penalties for contravening the cultural heritage duty of care are $100,000 for anindividual and $1,000,000 for a corporation.
South Australian Cultural Heritage Legislation
Aboriginal Heritage Act 1988
The Aboriginal Heritage Act 1988 (“AHA”) is administered by the South Australian AboriginalAffairs and Reconciliation Division (“AARD”).
A-11
For
per
sona
l use
onl
y
The AHA aims to protect and preserve Aboriginal heritage sites, objects and remains by,among other things:
(a) requiring an owner or occupier of private land who discovers an Aboriginal site, objector remains to notify the Minister about the nature and location of the site and take anyprotection action directed by the Minister; and
(b) preventing a person from interfering with, damaging or disturbing an Aboriginal site,damaging an Aboriginal object or disturbing, interfering or removing an Aboriginalobject or remains without Ministerial approval.
The penalty for breaching the above provisions is $50,000 for a company and $10,000 or sixmonths imprisonment for a person.
Aboriginal and Torres Strait Islander Land
Queensland Aboriginal and Torres Strait Islander Land Legislation
Aboriginal Land Act 1991 and Torres Strait Islander Land Act 1991
The Aboriginal Land Act 1991 and Torres Strait Islander Land Act 1991 (“the Acts”) wereintroduced to allow for the transfer or grant of certain land (including the existing communitylands and some lands reserved for particular purposes) to Aboriginal or Torres Strait Islanderpeople to enable them to manage the land according to their tradition or custom.
Whilst the land that had been granted or transferred was originally handed over to a land trustthat was established to hold the land in trust for the benefit of certain Aboriginal or TorresStrait Islander people, recent amendments have resulted in the relevant land now beinggranted to Indigenous corporations registered under the Commonwealth Government’sCorporations (Aboriginal and Torres Strait Islander) Act 2006 which is administered by theCommonwealth Office of the Registrar of Indigenous Corporations.
The DNRM is responsible for transferring and granting land under the Acts on behalf of theMinister as well as for administering all existing land trusts.
Aboriginal and Torres Strait Islander Land Holding Act 2013
The Aboriginal and Torres Strait Islander Land Holding Act 2013 (“ATSILH Act”) receivedassent on 19 February 2013 and, upon proclamation (which is expected to occur by late2013), will repeal the Aborigines and Torres Strait Islanders (Land Holding) Act 1985, whichwas established to enable residents of Queensland’s Aboriginal and Torres Strait IslanderDeed of Grant in Trust and reserve communities to obtain perpetual leases for residentialpurposes and term leases for other purposes.
The ATSILH Act aligns with the Acts, protects and continues leases and lease entitlementsunder the repealed act and provides a number of mechanisms to facilitate resolution ofoutstanding issues by agreement.
DATSIMA is responsible for resolving technical issues around granted leases and leaseentitlements, including boundary alignments and identifying beneficiaries of deceased leaseand lease entitlement holders.
Energy and Resources
Commonwealth Energy and Resources Legislation
Petroleum Resource Rent Tax Assessment Act 1987
The Petroleum Resource Rent Tax Assessment Act 1987 is the enabling legislation for thePetroleum Resources Rent Tax (“PRRT”), which is profit-based tax that is levied on apetroleum project.
A-12
For
per
sona
l use
onl
y
From 1 July 2012, the PRRT became a compulsory tax applied to all Australian onshore andoffshore oil and gas projects, including the North West Shelf, oil shale and coal seam gasprojects.
Each entity with an interest in a PRRT liable project will be liable for that PRRT. A ‘project’consists of facilities in the project title area and any facilities outside that area necessary forthe production and initial storage of marketable petroleum commodities such as stabilisedcrude oil, condensate, natural gas, liquefied petroleum gas and ethane (but excluding valueadded projects such as LNG).
PRRT is levied at a rate of 40% of a project’s taxable profit, which is the project’s income afterall project and ‘other’ exploration expenditures (including a compounded amount for carriedforward expenditures) have been deducted from all assessable receipts.
The Australian Taxation Office (“ATO”) administers the PRRT.
Mineral Resources Rent Tax Act 2012
The Mineral Resources Rent Tax Act 2012 outlines the process for calculating the MineralResources Rent Tax (“MRRT”) imposed on mining profits derived from the extraction of ironore, coal or coal seam gas.
Each financial year, an entity with mining project interests (ie. an entitlement to extract ironore, coal or coal seam gas or a right to share in the output of an undertaking with the purposeof performing such extraction) is liable to pay MRRT equal to the sum of its MRRT liabilitiesfor each of its mining project interests.
Only companies with profits above $75 million will incur an MRRT liability.
The MRRT liability for a mining project interest is calculated according to the formula:
“MRRT rate multiplied by (mining profit—MRRT allowances)”
The MRRT rate is 22.5% (ie. a nominal rate of 30% less a 25% extraction allowance torecognise the use of specialist skills).
Mining profit is calculated by reference to ‘mining revenue’ less ‘mining expenditure’, whilstroyalties paid under Commonwealth, state and territory laws are taken into account as MRRTallowances.
The ATO administers the MRRT.
Queensland Energy and Resources Legislation
Mineral Resources Act 1989
The Mineral Resources Act 1989 (“MRA”) is administered by DNRM and provides thelegislative framework for exploration, development and mining tenure in Queensland. Inaccordance with the MRA, Queensland is the beneficiary of all mineral resources and assuch, these resources can only be mined or extracted by a holder of a mining tenementissued in accordance with the MRA.
The types of mining tenements that are granted and administered under the MRA areprospecting permits, exploration permits, mineral development licences, mining claims andmining leases.
The MRA also:
(a) clarifies the rights under the MRA to mine coal seam gas;
(b) outlines the additional native title requirements (including compensation requirements)that apply for certain grants, renewals and variations of, and certain other actsconcerning, mining tenements;
A-13
For
per
sona
l use
onl
y

(c) administers various other administrative and miscellaneous matters; and
(d) outlines the penalties for contravention of any of the provisions of the MRA.
Petroleum and Gas (Production & Safety) Act 2004
The Petroleum and Gas (Production & Safety) Act 2004 (“PAG Act”) is administered byDNRM and, together with the Petroleum Act 1923, provides the framework for accessing landto explore and develop petroleum and coal seam gas resources in Queensland. The PAG Actaddresses the grant and management of petroleum authorities, coal seam gas, undergroundstorage and safety and landholder issues (including compensation).
In accordance with the PAG Act, Queensland is the beneficiary of all petroleum and as such,petroleum can only be produced by a holder of a petroleum authority issued in accordancewith the PAG Act.
The types of petroleum authorities that are granted and administered under the PAG Act areauthorities to prospect, petroleum leases, petroleum pipeline licences, petroleum facilitylicences, petroleum survey licences, data acquisition authorities and water monitoringauthorities.
Coal Mining Safety and Health Act 1999
The Coal Mining Safety and Health Act 1999 (“CMSH Act”) is administered by DNRM andregulates the operation of coal mines in order to protect the safety and health of persons atcoal mines and persons who may be affected by coal mining operations.
The CMSH Act sets the framework for mining legislation and incorporates ‘duty of care’obligations encompassed in modern Workplace Health and Safety Acts.
Mining tenure
Mining Legislation
Mineral Resources Act 1989
The MRA sets out (amongst others) the following types of tenures:
(a) Exploration Permits (“EP”);
(b) Mineral Development Licences (“MDL”); and
(c) Mining Leases (“ML”)
Exploration Permits
The holder of an EP may enter:
(a) any part of the area of the EP that is not the surface area of a reserve; and
(b) with the consent of the owner, or the consent of the Governor in Council, any part ofthe area of the exploration permit that is the surface area of a reserve,
for the purposes of facilitating exploration of the mineral the subject of the permit.
A reserve is defined under the MRA as a road, State forest or timber reserve, resourcesreserve, Aboriginal land or Torres Strait Islander land.
The area of an EP comprises specified sub-blocks of land. Each sub-block must have at least1 side in common with another sub-block within the subject land.
A sub-block is a subdivision of a block which is defined under the MRA as the land containedwithin 2 meridians 5’ of longitude apart each meridian being a multiple of 5’ of longitude from
A-14
For
per
sona
l use
onl
y

the meridian of Greenwich and within 2 parallels of latitude 5’ apart each parallel of latitudebeing a multiple of 5’ of latitude from the equator. A block is divided into 25 sub-blocks eachsub-block being bounded by 2 meridians 1’ of longitude apart and 2 parallels of latitude and1’ of latitude apart.
A holder of an EP may be considered, in priority to all other persons, for a grant of MDL or MLfor all or part of the area of the permit. EPs may be granted with respect to coal (“EPC”) andfor minerals other than coal (“EPM”). The holder of an EP must pay annual rental for thepermit. The annual rental amount prescribed under the regulation for the current financial yearis $135.90 for each sub-block. An EP is, unless the Minister otherwise decides, is subject to astatutory reduction of its area as follows:
(a) by 40% by the end of the first 3 years after the permit is granted; and
(b) by a further 50% of the remaining area of the permit by the end of the first 5 years afterthe permit is granted;
and, each time the permit is renewed:
(c) by a further 40% of the remaining area of the permit by the end of the first 3 years afterthe day the renewed permit started; and
(d) by a further 50% of the remaining area of the permit by the end of the first 5 years afterthe day the renewed permit started.
The holder of an EP must:
(a) comply with the mandatory provisions of the land access code and the provisions onaccess and compensation set out in Schedule 1 of the MRA;
(b) carry out such work programmes and studies required under the permit;
(c) remove plant and equipment at termination of the permit;
(d) provide reports to the Minister in relation to its activities;
(amongst other obligations).
The Minister may require, taking into consideration the activities to be carried out by theholder of an EP, a security for compliance with the conditions of the permit and the MRA,rectification of damages and amounts payable to the State. The initial terms of an EP is5 years except in the case of EPs granted in response to a call for a tender in which case theinitial term will be the period that the call states is the period for which the programme mustapply. An EP may be renewed for further terms of not more than 5 years. The holder of an EPmust, within 14 days after discovery of any mineral of commercial value in what appears to bepayable quantities within the area specified in the EP, report to the Minister the fact of thatdiscovery.
Mineral Development Licences
A MDL may be applied by the holder of an EP or a MDL with respect to the land the subject ofthe MDL application and in connection with the same mineral. The holder of a MDL may carryout those activities specified in the licence and the Minister may specify also such otheractivities leading to the evaluation and economic development of an ore body by or on behalfof the holder. The holder of a MDL may enter:
(a) any part of the area of the mineral development licence that is not the surface area ofa reserve; and
(b) with the consent of the owner, or the consent of the Governor in Council, any part ofthe area of the mineral development licence that is the surface area of a reserve,
for any purpose permitted or required under the licence or by the MRA.
A-15
For
per
sona
l use
onl
y
The holder of a MDL may be considered for grant, in priority to all other persons, any numberof MDLs and MLs relating to any minerals specified in the MDL in respect of any land in thearea of the MDL. The Minister may require security from the holder of a MDL for compliancewith the conditions of the licence and the MRA, for rectification of damages and for amountspayable to the State. Annual rental is payable by the holder with respect to MDLs. The initialterm of a MDL is 5 years. An MDL may be renewed for the further term of not more than5 years. The holder of a MDL must:
(a) comply with the mandatory provisions of the land access code and the provisions onaccess and compensation set out in Schedule 1 of the MRA;
(b) carry out improvement restoration for the MDL;
(c) on termination of the licence, remove all plant and equipment; and
(d) provide reports to the Minister on the activities carried out on the area of the licence;
Where the holder of a MDL discovers or takes any mineral does not thereby acquire propertytherein and must not dispose of any such mineral except with the consent of the Ministerwhose consent may be subject to such terms and conditions as the Minister thinks fit.
Mining Lease
The holder of a ML may:
(a) enter and be:
(i) within the area of the mining lease; and
(ii) upon the surface area comprised in the mining lease;
for any purpose for which the mining lease is granted or for any purpose permitted or requiredunder the lease or by the MRA; and
(b) may do all such things as are permitted or required under the lease or by the MRA.
The holder of a ML must:
(a) use the area of the mining lease bona fide for the purpose for which the ML wasgranted and in accordance with the MRA and the conditions of the mining lease andfor no other purpose;
(b) on termination of the lease, remove all equipment and plant;
(c) carry out improvement restoration for the ML;
(d) pay compensation to landholders as determined under the MRA;
(e) pay annual rental;
(f) pay royalty as set out in the MRA
The holder of a ML must pay annual rental for the licence. The annual rental for the currentfinancial year is $52.50 for each hectare to which the ML relates. The initial term of a ML isthe period approved by the Minister. The holder of a ML may apply for renewal for anappropriate term. All minerals lawfully mined under the authority of a ML cease to be theproperty of the Crown or person who had property therein and become the property of theholder of the ML holder subject to the payment of royalty under the MRA.
A-16
For
per
sona
l use
onl
y
South Australia Energy and Resources Legislation
Mining Act 1971
Exploration for minerals and mining in South Australia cannot be undertaken (either on Crownor private land) unless it is done so in accordance with (among other acts) the provisions ofthe Mining Act 1971 (“MA”), which is administered by the Department for Manufacturing,Innovation, Trade, Resources and Energy (“DMITRE”).
The MA and the regulations made under the MA:
(a) provide that all minerals are the property of the Crown;
(b) provide for the issue of mineral tenements that give rights with respect to mineralexploration and production;
(c) establish landholder and licensee rights with regard to access to land and provide forcompensation for any resulting damage;
(d) provide for the regulation of operations within tenements;
(e) provide for the collection of royalties on production plus a range of fees for requiredapprovals, annual tenement fees and penalties for breaches of the legislation; and
(f) provide for the appointment of inspectors and authorised persons to have access totenements.
The types of mineral tenements that are granted and administered under the MA are (interalia) general rights to prospect, exploration licences, retention leases, mineral claims andmining leases.
Petroleum and Geothermal Energy Act 2000
The Petroleum and Geothermal Energy Act 2000 (“PGE Act”) is administered by DMITREand covers all exploration and production activities for petroleum, gas storage and geothermalresources for onshore South Australia, as well as the construction and operation oftransmission pipelines for conveying petroleum and other regulated substances such as CO2.The key objects of the PGE Act include:
(a) providing security of tenure to licensees for the resources covered by the PGE Act;
(b) protecting the environment and public from the inherent risks associated with theactivities undertaken to explore these resources;
(c) enabling appropriate consultative processes involving people directly affected byregulated activities;
(d) where relevant, ensuring appropriate levels of security of natural gas supply areprovided for; and
(e) promoting and facilitating competitive development of South Australia’s petroleum, gasstorage and geothermal resources through the acquisition and release of relevantgeotechnical and engineering data and information.
Petroleum tenure
South Australian Petroleum Legislation
Petroleum and Geothermal Energy Act 2000
The PGE Act sets out (amongst others) the following types of petroleum tenures:
(a) Petroleum Exploration Licences (“PEL”);
A-17
For
per
sona
l use
onl
y
(b) Petroleum Retention Licences (“PRL”); and
(c) Petroleum Production Licences (“PPL”).
Petroleum is defined in the PGE Act as a naturally occurring substance consisting of ahydrocarbon or mixture of hydrocarbons in gaseous, liquid or solid state but does not includecoal or shale unless occurring in circumstances in which the use of techniques for coal seammethane production or in situ gasification would be appropriate or unless constituting aproduct of coal gasification (whether produced below or above the ground) for the purposes ofthe production of synthetic petroleum.
Petroleum Exploration Licences
The holder of a PEL is authorised under the PGE Act to carry out in the licence area thefollowing activities:
(a) exploratory operations for petroleum;
(b) establish the nature and extent of a discovery of petroleum; and
(c) establish the feasibility of production and appropriate production techniques.
It is a mandatory condition of a PEL that the licence holder must carry out a work programmein the licence area in accordance with the conditions of the licence set out by the Minister.
The total licence area cannot exceed 10,000 square kilometres.
The term of a PEL is 5 years and it may be renewed for a further term or 2 further terms. APEL that is renewable for one further term must provide for the excision, on renewal, of anarea equal to at least 50% of the original licence area and a licence that is renewable for2 further terms must provide for the excision, on each renewal, of an area equal to at least331⁄3% of the original licence area.
The holder of a PEL is entitled to the grant of a corresponding PRL or PPL for petroleumdiscovered in the licence area.
Petroleum Retention Licences
A PRL is intended to protect the interest of a licensee in connection with the followingpurposes:
(a) facilitate proper evaluation of a discovery;
(b) carry the necessary work to bring the discovery to production;
(c) protect interest of a licensee until commercial production is feasible; or
(d) facilitate other activities considered appropriate by the Minister.
The holder of a PRL may carry out:
(a) activities to determine the nature and extent of a discovery;
(b) operations to establish the commercial feasibility of a discovery; and
(c) other regulated activities specified in the licence.
Subject to the PEG Act, a person is entitled to the grant of a PRL if:
(a) petroleum has been discovered in the area the subject of the application;
A-18
For
per
sona
l use
onl
y
(b) the person holds a PEL or a PPL over the area of the application;
(c) the Minister is satisfied that petroleum production is not currently feasible but it is morelikely than not to become feasible within 15 years.
The area of a PRL must not exceed either twice the area under which the discovery is likely toextend or 100 square kilometres.
The term of a PRL is 5 years, renewable from time to time if the Minister is satisfied thatpetroleum production is not currently feasible but it is more likely than not to become feasiblewithin 15 years.
A PRL may include a work programme approved by the Minister to establish the nature andextent of the commercial discovery and the commercial feasibility of production andappropriate production techniques.
Petroleum Production Licences
A PPL authorises the holder to carry out:
(a) operations for the recovery of petroleum from the ground including:
(i) operations involving the injection of petroleum or another substance into anatural reservoir for the recovery (or enhanced recovery) of petroleum; and
(ii) if the licence so provides, the extraction of petroleum by an artificial meanssuch as in situ gasification or the techniques used to recover coal seammethane;
(b) operations for the processing of petroleum;
(c) operations for the storage or withdrawal of petroleum for the prudent supply or deliveryof the petroleum or other regulated substance to the market.
Subject to the PEG Act, a person is entitled to the grant of a PPL if:
(a) petroleum exists in the area the subject of the application;
(b) the person holds at the time of the application a PEL, PRL, or a mining tenementgranted under the Mining Act 1971 (SA) (but for the purpose of in situ gasification orcoal seam production) in relation to the area the subject of the application;
(c) production is commercially feasible or is more likely than not to become commerciallyfeasible within the next 24 months.
The area of a PPL must not exceed either the area under which the discovery is more likelythan not to extend or 100 square kilometres.
A PPL may include a work programme for the development of the licence area and theproduction of petroleum.
A PPL is granted for an unlimited term.
Environment
Commonwealth Environment Legislation
Environment Protection and Biodiversity Conservation Act 1999
The Environment Protection and Biodiversity Conservation Act 1999 (“EPBC Act”) isadministered by SEWPAC and is the Australian Government’s key piece of environmentallegislation.
A-19
For
per
sona
l use
onl
y
The objectives of the EPBC Act are to:
(a) provide for the protection of the environment, especially matters of nationalenvironmental significance;
(b) conserve Australian biodiversity;
(c) provide a streamlined national environmental assessment and approvals process;
(d) enhance the protection and management of important natural and cultural places;
(e) control the international movement of wildlife, wildlife specimens and products made orderived from wildlife; and
(f) promote ecologically sustainable development through the conservation andecologically sustainable use of natural resources.
Any action that has a significant impact on matters of national environmental significance aretermed ‘controlled actions’ and require approval under the EPBC Act. An ‘action’ under theEPBC Act is a physical activity or series of activities such as the construction and operation ofa mine, dam or factory. Under the EPBC Act a ‘significant impact’ is an impact that isimportant, notable or of consequence having regard to its context or intensity.
Recent amendments to the EPBC Act have classified water resources that relate to coalseam gas and large coal mining developments as a matter of national environmentalsignificance. Whilst before this amendment was made projects with water related risks couldonly be regulated if they had flow on impacts to existing matters of national environmentalsignificance (eg. nationally endangered plants and animals), these recent amendments meanthat such projects will (regardless of their flow on impacts) require federal assessment andapproval to ensure the protection of water resources.
Water Act 2007
The Water Act 2007 establishes joint control of the Murray-Darling River Basin and is jointlyadministered by SEWPAC, the National Water Commission and the Murray Darling BasinCommission.
Several river systems in southern Queensland (Condamine-Balonne, Warrego and MacIntyreRivers) all form part of the Murray-Darling River Basin.
The act is intended to operate concurrently with State water laws (including the Water Act2000 (Qld)) and establishes a framework for water charges, water trading and a water marketwithin the Murray-Darling River Basin. It aims, in particular, to address over-allocation ofwater to irrigation.
Queensland Environment Legislation
Environmental Protection Act 1994
The Environmental Protection Act 1994 (Qld) (“EPA”) is administered by the Department ofEnvironment and Heritage Protection (“DEHP”) and is a major component of the Queenslandenvironmental legal system.
The EPA’s object is environmental protection within the context of ecologically sustainabledevelopment and provides for (among other things):
(a) environmental protection policies;
(b) an environmental impact statement process for mining and petroleum activities;
A-20
For
per
sona
l use
onl
y
(c) a system for development approvals integrated into the Sustainable Planning Act 2009(Qld) for environmentally relevant activities;
(d) environmental authorities for mining and petroleum activities;
(e) environmental authorities for greenhouse gas storage and petroleum exploration,extraction and pipelines (including petroleum in both liquid and gas forms);
(f) a general environmental duty and a duty to notify of environmental harm;
(g) environmental evaluations and audits;
(h) environmental protection orders;
(i) a system for managing contaminated land;
(j) environmental offences and executive officer liability;
(k) investigative powers of authorised officers including power to give an emergencydirection; and
(l) civil enforcement provisions to restrain breaches of the EPA.
Under the EPA, an activity that causes serious or material environmental harm orenvironmental nuisance is unlawful unless it is approved under the EPA or the generalenvironmental duty is complied with.
Water Act 2000
The Water Act 2000 is administered by DEHP in conjunction with the Queensland WaterCommission, water authorities and local governments.
The act provides a framework for the planning and regulation of the use and control of waterin Queensland, including the regulation both of major water impoundments (dams, weirs andbarrages) and extraction by pumping for irrigation and other uses.
The act also provides a wide range of tools for the regulation of in-stream (ie. watercourses,lakes and springs) and overland water flow and groundwater within the context of sustainablemanagement and efficient use of water.
The act provides for Water Resource Plans, generally on a catchment-by-catchment basis, tobe prepared through a consultative process. These plans are meant to balance waterallocations (ie. human use) with environmental flows (ie. leaving water in a watercourse tomaintain natural processes). Resource Operations Plans provide practical operational detailsof the implementation of a Water Resource Plan under which Resources OperationsLicences, Water Allocations, Water Licences and Water Permits may be granted.
Wild Rivers Act 2005
The Wild Rivers Act 2005 (“WRA”) is administered by DEHP and provides an additional layerof protection for undeveloped river systems in Queensland by establishing a process for thedeclaration of wild rivers and prohibition of the carrying out of prescribed activities withinthese declared wild river areas.
A declared wild river area will or may include high preservation areas, preservation areas,floodplain management areas, special floodplain management areas and/or subartesianmanagement areas. These management areas dictate the type of mining or explorationactivities that may be conducted within them.
To date, wild river areas have been declared over the Fraser, Gregory, Hinchinbrook, MorningInlet, Settlement, Staaten, Lockhart, Stewart, Archer, Wenlock Basin, Georgina andDiamantina Basin and Cooper Creek Basin rivers.
A-21
For
per
sona
l use
onl
y
Strategic Cropping Land Act 2011
The Strategic Cropping Land Act 2011 (“SCL Act”) is administered by DNRM and aims to:
(a) protect land that is highly suitable for cropping;
(b) manage the impacts of development on that land; and
(c) preserve the productive capacity of that land for future generations.
To achieve this aim, the SCL Act outlines processes for:
(a) identifying potential strategic cropping land;
(b) providing criteria to decide whether or not land is strategic cropping land;
(c) establishing protection and management areas;
(d) providing for development assessment;
(e) imposing conditions on development;
(f) preventing permanent impacts on strategic cropping land in protection areas (unlessthe development is in exceptional circumstances); and
(g) requiring mitigation to be paid by developers if strategic cropping land is permanentlyimpacted in the management area, or by a development in exceptional circumstances.
South Australia Environment Legislation
Environment Protection Act 1993
The Environment Protection Act 1993 is administered by the Environment Protection Authorityof South Australia and provides the regulatory framework (through a suite of legislative andnon-legislative policies and regulatory tools) to protect South Australia’s environment,including land, air and water.
Regulatory tools available to the Environment Protection Authority under the act includeEnvironment Protection Policies, Codes of Practice, National Environment ProtectionMeasures, Guidelines and Position Statements.
Environment Protection Policies issued under the act have the force of a standard imposed byParliament, may impose mandatory provisions with penalties and are developed for a specificarea (eg. waste, water, air, noise).
Codes of Practice regulate a specific activity and are enforceable via an EnvironmentProtection Order or mandatory provisions of an Environment Protection Policy. They providedirection and control over an industry, set measurable outcomes and require extensiveconsultation in development and alteration.
National Environment Protection Measures are broad framework-setting statutory instrumentsthat outline agreed national objectives for protecting or managing particular aspects of theenvironment. National Environment Protection Measures may relate to any one or more of thefollowing:
(a) ambient air quality;
(b) ambient marine, estuarine and fresh water quality;
(c) the protection of amenity in relation to noise (but only if differences in markets forgoods & services);
A-22
For
per
sona
l use
onl
y
(d) general guidelines for the assessment of site contamination;
(e) environmental impacts associated with hazardous wastes; and
(f) the re-use and recycling of used materials.
Natural Resources Management Act 2004
The Natural Resources Management Act 2004 (“NRM Act”) is administered by theDepartment of Environment, Water and Natural Resources and aims to assist in theachievement of ecologically sustainable development in South Australia by establishing anintegrated scheme to promote the use and management of natural resources in a manner that(among other things):
(a) recognises and protects the intrinsic values of natural resources;
(b) seeks to protect biological diversity and, insofar as is reasonably practicable, tosupport and encourage the restoration or rehabilitation of ecological systems andprocesses that have been lost or degraded; and
(c) provides for the protection and management of catchments and the sustainable use ofland and water resources and, insofar as is reasonably practicable, seeks to enhanceand restore or rehabilitate land and water resources that have been degraded.
The NRM Council was established under the NRM Act and provides advice to the Minister forSustainability, Environment and Conservation primarily through the development of the SouthAustralian Natural Resources Management Plan (“Plan”).
The Plan contains strategic policy at a state level for managing South Australia’s naturalresources, fulfilling obligations under several Commonwealth-South Australian Governmentbilateral agreements as well as providing a framework for all natural resources managementinitiatives (including regional Natural Resource Management Plans and agency activities).
South Australia has eight Natural Resource Management regions: Adelaide and Mount LoftyRanges, Alinytjara Wilurara (taking in the Aboriginal lands of the far west), Eyre Peninsula,Kangaroo Island, Northern and Yorke, South Australian Arid Lands (covering the outback andfar north), South Australian Murray-Darling Basin and the South East.
A-23
For
per
sona
l use
onl
y

[THIS PAGE INTENTIONALLY LEFT BLANK]
For
per
sona
l use
onl
y
APPENDIX B—SUMMARY OF CERTAIN PROVISIONS OF THE AUSTRALIA
CORPORATIONS LAW AND THE CONSTITUTION OF OUR COMPANY
REGISTRATION NUMBER
The Company was incorporated on 29 October 1996. The Company’s registration number isACN 076 157 045.
SUMMARY OF CERTAIN PROVISIONS OF THE CORPORATIONS ACT
Our Company is incorporated in the Commonwealth of Australia and is subject to theCorporations Act and therefore, operates subject to Australian law. Set out below is asummary of certain provisions of the Corporations Act, although this does not purport tocontain all applicable qualifications and exceptions to or be a complete review of all matters ofAustralian corporations law and taxation, which may differ from equivalent provisions injurisdictions with which interested parties may be more familiar.
Operations
The Corporations Act does not require a company to detail its scope of operations in itsConstitution nor does it limit the conduct of its operations to any particular jurisdiction.
Share Capital
Under Australian law, there is no such thing as ‘par value’ or ‘authorised share capital’. InAustralia a company increases its share capital by issuing additional shares.
Under the Corporations Act, the directors have the power to issue shares, or grant options inrespect of further shares, on such terms and conditions as the Directors decide by resolution.This includes the power to issue:
(a) bonus shares (shares for whose issue no consideration is payable to the company);
(b) preference shares (including redeemable preference shares); and
(c) partly-paid shares.
Under Australian law shareholder general authorisation (including a general mandate) is notrequired for the issue of further shares.
Under the Australian law, the power of directors to issue shares in a company is subject to:
(a) the takeover provisions of the Corporations Act;
(b) any rights and restrictions attached to a class of shares expressed or implied in theconstitution of the company;
(c) restrictions with respect to preference shares; and
(d) the provisions in the Corporations Act dealing with the issue of shares and othersecurities to related parties of the company.
A company may issue preference shares under the Corporations Act only if the rightsattached to the preference shares are set out in the company’s constitution or have beenapproved by way of a special resolution (75.0% approval) of the company’s shareholders.
Any share issue which will fall within the above restrictions will be subject to the procedurescontained in the Corporations Act, which may include Shareholder approval in generalmeeting.
Share Consolidations, Subdivisions and Reductions
The Corporations Act governs share consolidations, share subdivisions and reductions inshare capital.
B-1
For
per
sona
l use
onl
y
Under the Corporations Act, a company may consolidate or subdivide its shares if theconsolidation is approved by an ordinary resolution of shareholders at a general meeting. Theconsolidation or subdivision (as the case may be) takes effect on the latter of the day theresolution is passed or the date specified in the resolution.
A reduction of share capital occurs when any money paid to a company in respect of amember’s share is returned to the member. The Corporations Act provides that a companymay reduce its share capital in a way that is not otherwise authorised by the Corporations Actif the reduction:
(a) is fair and reasonable to the company’s members as a whole;
(b) does not materially prejudice the company’s ability to pay its creditors; and
(c) is approved by members.
The reduction is either an equal reduction or a selective reduction.
An equal reduction must meet the following three conditions:
(a) It relates only to ordinary shares.
(b) It applies to each holder of ordinary shares in proportion to the number of ordinaryshares they hold.
(c) The terms of the reduction are the same for each holder of ordinary shares.
If any of these three conditions do not apply, it must be a selective reduction.
If the reduction is an equal reduction, it must be approved by an ordinary resolution ofshareholders at a general meeting. If the reduction is a selective reduction, the reduction mustbe approved by either:
(a) a special resolution with no votes being cast in favour of the resolution by any personwho is to receive consideration as part of the reduction or whose liability to payamounts unpaid on shares is to be reduced, or by their associates; or
(b) an ordinary resolution of shareholders agreed to by all ordinary members.
If the selective reduction involves the cancellation of shares the reduction must also beapproved by a special resolution passed at a separate meeting of the members whose sharesare to be cancelled.
Related party transactions
Chapter 2E of the Corporations Act covers ‘related party benefits’—designed to protect theinterests of a company’s shareholders as a whole, by requiring shareholder approval beforegiving financial benefits which could otherwise endanger those interests.
The Corporations Act requires, for a public company, that:
(a) shareholder approval must be obtained before giving a financial benefit to a relatedparty; or
(b) the benefit must fall within a specified exception.
The most relevant exception provides that:
(a) where any benefit would be reasonable in the circumstances if the public company andthe director/related party were dealing at arm’s length and/or on commercial terms; or
(b) the terms are less favourable to the director/related party than the terms referred toabove,
then shareholder approval is not required.
B-2
For
per
sona
l use
onl
y
Other exceptions include reasonable remuneration payments to directors, director insurance,and small amounts given to directors/related parties.
‘Related party’ is defined in the Corporations Act to include:
(a) a director of the company and any controlling entity;
(b) the spouse of a director;
(c) parents and children (of both directors and/or spouses);
(d) an entity controlled by any of the above; or
(e) any other entity acting in concert with a related party.
Removal of directors
The Corporations Act contains various provisions regarding resignation, removal andretirement of directors.
The Corporations Act provides that a director may be removed by resolution at a generalmeeting, subject to a company receiving at least two months’ notice of the intention to movethe resolution and notifying the relevant director as soon as possible after receiving notice ofthat intention.
The Corporations Act also provides what is termed the ‘two-strikes’ law which is designed tohold directors accountable for executive salaries and bonuses. It means an entire companyboard can face re-election if shareholders disagree with how much executives are being paid.
The ‘first strike’ occurs when a company’s remuneration report—which outlines eachdirector’s individual salary and bonus—receives a ‘no’ vote of 25 per cent or more byshareholders at the company’s annual general meeting.
The ‘second strike’ occurs when a company’s subsequent remuneration report also receivesa ‘no’ vote of 25 per cent or more.
When a ‘second strike’ occurs, the shareholders will vote at the same AGM to determinewhether all the directors will need to stand for re-election. If this ‘spill’ resolution passes with50 per cent or more of eligible votes cast, then a ‘spill meeting’ will take place within 90 days.
At the spill meeting, those individuals who were directors when the directors’ report wasconsidered at the most recent Annual General Meeting will be required to stand for re-election(other than the managing director, who is permitted to continue to run the company).
Directors’ duties
The laws governing directors’ duties and responsibilities come from four areas, namely; thecommon law (judge-made law), statute law, under the Corporations Act, a company’sconstitution and such other duties as are expressed or implied in the contractual arrangementunder which the director is employed or appointed. The duties of directors are owed to thecompany, which is made up of its members.
Common law duties include:
(a) Duty to act bona fide (In good faith) in the interests of the company as a whole;
(b) Duty not to act for an improper purpose;
(c) Duties of care and Diligence;
(d) Duty to retain Discretion;
(e) Duty to avoid conflicts of interest;
B-3
For
per
sona
l use
onl
y
(f) Duty not to disclose confidential information; and
(g) Duty not to abuse corporate opportunities.
Statutory duties include:
(a) Duty of care and diligence and the business judgment rule;
(b) Duty of good faith;
(c) Duty not to make improper use of position;
(d) Duty not to make improper use of information;
(e) Duty not to trade while insolvent;
(f) Duty to disclose material personal interests;
(g) Duty not to provide financial benefits to related parties of public companies; and
(h) Duty to ensure all financial reporting is completed.
Membership
Under the Corporations Act, only those persons who agree to become members of anAustralian company and whose names are entered into the register of members of suchcompany are considered members. An Australian company is not bound to see to theexecution of any trust, whether express, implied or constructive, to which any of its shares aresubject and whether or not the company had notice of such trust. Accordingly, personsholding shares through a trustee, nominee or depository will not be recognised as membersof an Australian company under Australian law and may only have the benefits of rightsattached to the shares or remedies conferred by law on members through or with theassistance of the trustee, nominee or depository.
Financial Assistance to Purchase Shares of a Company or its Holding Company
The Corporations Act prohibits a company from providing financial assistance to a person toacquire shares in the company or in its holding company unless either:
(a) The giving of the financial assistance does not materially prejudice the interests of thecompany or its shareholders or the company’s ability to pay its creditors; or
(b) The assistance is approved by shareholders; or
(c) The assistance is exempted under the provisions of the Corporations Act.
Breach of the provision does not invalidate the giving of the financial assistance nor is thecompany guilty of an offence. However, a person who is involved in a company’scontravention of the restriction contravenes the Corporations Act and, if their involvement isdishonest, the person commits an offence under the Corporations Act. The breach of therestriction is a civil penalty provision which may result in orders to compensate a corporationfor damage suffered by the corporation as a result of a contravention. In addition, if thecontravention materially prejudices the interests of the corporation or its members, ormaterially prejudices the corporation’s ability to pay its creditors or is serious, the Court mayorder a pecuniary penalty be paid.
Purchase of Shares by a Company
Under the Corporations Act, a company can either:
(a) purchase shares in itself on the terms on which they are issued (for instanceredeemable preference shares); or
B-4
For
per
sona
l use
onl
y
(b) purchase shares in itself by way of a regulated share buy-back.
With respect to redeemable preference shares, With respect to preference shares, under theCorporations Act a company can issue redeemable preference shares only if the rightsattached to the preference shares are set out in the company’s constitution or have beenapproved by way of a special resolution (75% approval) of the company’s shareholders.
With respect to the buy-back of shares, the Corporations Act empowers a company to buyback its shares if the buy-back does not materially prejudice the company’s ability to pay itscreditors, and the company follows the procedures laid down in the Corporations Act.
Under Australian law a subsidiary can never hold shares in its holding company.
See “Appendix D—Description of our Shares—Purchase by our Company of our own Shares”for further details.
Dividends
See “Appendix D—Description of our Shares—Dividends” for further details.
Protection of Minorities
The Corporations Act contains provisions to protect minority shareholders. These statutoryrights include:
(a) being able to bring legal proceedings in the name of the company (e.g. againstdirectors) with the court’s permission;
(b) being able to inspect the company’s books, with the court’s permission;
(c) being able to seek court orders (including orders to wind up the company or for a saleof a shareholder’s shares) where the company has been run in a way which is unfairlyprejudicial to a member or not in the interest of all members as a whole;
(d) the right to approve some transactions between public companies and their relatedparties (such as majority shareholders and directors); and
(e) being able to call shareholder meetings or require the company to put a resolution(e.g. to appoint or remove a director) to shareholders for approval.
See “Appendix D—Description of our Shares—Minority Rights”.
Accounting and Auditing Requirements
Under Australian law, the Company is required to compile and lodge with ASIC its financialstatements for each half year and each full year. The financial statements consist of theCompany’s statement of profit or loss and comprehensive income, statement of financialposition and cashflow statement. The annual financial statements along with the Directors’Report on the operations of the Company must be presented to Shareholders forconsideration at each annual general meeting. The annual general meeting must be held notlater than five months after the end of its financial year.
Exchange Control
There are no exchange controls or currency restrictions in Australia
Stamp Duty on Transfers
No stamp duty is payable in Australia on transfers of shares in a Queensland registeredcompany which is admitted to the official list of a “recognised stock exchange”. This includesan exchange that is a member of the World Federation of Exchanges which includes theSGX-ST.
B-5
For
per
sona
l use
onl
y
Loans to Directors
The making of loans by a company to any of its directors is restricted by Chapter 2E of theCorporations Act which covers ‘related party benefits’. This Chapter is designed to protect theinterests of a company’s shareholders as a whole, by requiring shareholder approval beforegiving financial benefits which could otherwise endanger those interests.
The Corporations Act requires that shareholder approval must be obtained before a publiccompany gives a financial benefit to a related party (which includes directors) unless:
(a) the benefit would be reasonable in the circumstances if the public company and thedirector/related party were dealing at arm’s length and/or on commercial terms; or
(b) the terms are less favourable to the director/related party than the terms referred toabove.
Inspection of Corporate Records
The Corporations Act requires a corporation to file various documents with ASIC, including itsaccounts, notification of changes to its constitution and notifications regarding changes to thedirector, secretary and share capital.
Documents filed with ASIC are available to the public.
The Corporations Act also provides that anyone may inspect the register of a company andrequest a copy following the provision of an application made to the company in the correctform.
Winding Up—solvent companies
A company remains registered as a company even after it ceases trading. While registered itis still subject to the legal requirements of a registered company, including payment of theannual review fee each year.
If the company is no longer required and it is not in financial difficulty or insolvent, thecompany may be deregistered.
A company ceases to exist on deregistration. There are two ways you can deregister acompany:
(a) through a members’ voluntary winding-up. This is a procedure for solvent companiesinitiated by the company’s members and involves the orderly winding-up of thecompany’s affairs, the appointment of a liquidator to manage the process of realisingthe company’s assets, ceasing or sale of its operations, payment of its debts (if any)and distribution of surplus assets (if any) among its members.
(b) by applying to ASIC to voluntarily deregister a company assuming it meets certainlegal requirements.
To commence a members’ voluntary winding-up, the majority of the directors must make awritten declaration that they have made an inquiry into the affairs of the company and that ata meeting of directors they have formed the opinion that the company will be able to pay itsdebts in full within 12 months after the commencement of the winding-up. This is oftenreferred to as a solvency declaration.
After the solvency declaration the members of the company must make a special resolution towind up the company. All members must be given at least 21 days notice in writing of thespecial resolution and at the meeting at least 75% of the votes cast by members entitled tovote on a special resolution must be in favour of the resolution for it to be passed.
Notice of the resolution must be published on the Insolvency notices website within 21 daysafter the date of the resolution being passed.
B-6
For
per
sona
l use
onl
y
Where the company has been under no other form of external administration, the winding-upcommences from the time the special resolution is passed.
The advantage of a members’ voluntary winding-up is that the members can choose theliquidator to take control of the affairs of the company, fix the remuneration of the liquidator,and in general terms, supervise their conduct.
During the course of a members’ voluntary winding-up, a creditor or a member may ask acourt to determine any question arising in the winding-up, review the liquidator’s remunerationor exercise any power that a court possesses in a compulsory winding-up, such as choosinga liquidator.
The leave of a court must be obtained before a company can be voluntarily wound up if anapplication for the company to be wound up as insolvent has been filed in a court, or if a courthas already ordered that the company be wound up.
If at any time during a members’ voluntary winding-up the liquidator forms the opinion that thecompany will be unable to pay its debts in full, then the liquidator must either apply to thecourt for the company to be wound up in insolvency, appoint an administrator or convene ameeting of creditors.
Winding Up—insolvent companies
Where the company is insolvent, unless it is possible to promptly restructure, refinance orobtain equity funding to recapitalise the company, the only options under Australian law are toappoint a voluntary administrator or a liquidator.
Administrator
Voluntary administration is designed to resolve the company’s future direction quickly. Anindependent and suitably qualified person (the voluntary administrator) takes full control of thecompany to try to work out a way to save either the company or the company’s business.
If it isn’t possible to save the company or its business, the aim is to administer the affairs ofthe company in a way that results in a better return to creditors than they would have receivedif the company had instead been placed straight into liquidation.
A mechanism for achieving these aims is a deed of company arrangement.
Putting a company into voluntary administration can be done by the board of the companyresolving that the company is insolvent, or likely to become insolvent, and an administratorshould be appointed. The directors also need to obtain the written consent of a registeredliquidator to act as voluntary administrator.
Liquidator
The purpose of liquidation of an insolvent company is to have an independent and suitablyqualified person (the liquidator) take control of the company so that its affairs can be woundup in an orderly and fair way for the benefit of its creditors.
Generally, a director-initiated liquidation involves calling a meeting of members to vote onwinding up the company and the appointment of a liquidator or applying to Court to wind upthe company.
A company most commonly goes into receivership when a receiver is appointed by a securedcreditor who holds security over some or all of the company’s assets. The receiver’s primaryrole is to collect and sell sufficient of the company’s charged assets to repay the debt owed tothe secured creditor.
B-7
For
per
sona
l use
onl
y
Reconstructions and Takeovers
For detail on the takeover provisions of the Corporations Act, see “Appendix D—Descriptionof our Shares—Takeovers”.
With respect to reconstructions, the Corporations Act contains statutory provisions whichfacilitate reconstructions and amalgamations approved by a special resolution (75.0%approval) and thereafter approved by either the Australian Federal Court or a State SupremeCourt. These are generally referred to as ‘schemes of arrangement’. While a dissentingshareholder would have the right to express to the Court his or her view that the transactionfor which approval is sought would not provide the shareholders with a fair value for theirshares, the Court is unlikely to disapprove the transaction on that ground alone in theabsence of evidence of fraud or bad faith on behalf of management.
Mergers and Consolidations
With respect to mergers or consolidations, the Corporations Act contains statutory provisionswhich facilitate mergers or consolidations approved by a special resolution (75% approval)and thereafter approved by either the Australian Federal Court or a State Supreme Court.These are also generally referred to as ‘schemes of arrangement’. While a dissentingshareholder would have the right to express to the Court his or her view that the transactionfor which approval is sought would not provide the shareholders with a fair value for theirshares, the Court is unlikely to disapprove the transaction on that ground alone in theabsence of evidence of fraud or bad faith on behalf of management.
Directors in forming of a view on whether to proceed with a merger or a consolidation need tobe aware, however, of the following:
(a) Their director’s duties under the Corporations Act (see “Appendix D—Summary ofCertain Provision of the Australia Corporations Law and Constitution of ourCompany—Summary of Certain Provisions of the Corporations Act—Directors’ duties”for information on director’s duties)
(b) The restrictions with respect to related party transactions (see “Appendix D—Summaryof Certain Provision of the Australia Corporations Law and Constitution of ourCompany—Summary of Certain Provisions of the Corporations Act—Related partytransactions” for information on related party transactions).
Further, where an Australian company mergers or consolidates with a foreign entity and thatforeign entity could be deemed to be ‘carrying on a business in Australia’ there may be arequirement for the foreign entity to register as an Australian business with ASIC. Registeringas an Australian business requires the lodgement of company details and financialinformation with ASIC on an annual basis.
Application of the FATA to Takeovers, Reconstructions and Mergers and
Consolidations
Prior to the commencement of a takeover, reconstruction, merger or consolidation, theimplications of the Foreign Acquisitions and Takeovers Act 1975 (“FATA”) must always beconsidered. For detail on ownership restrictions under the FATA, see “Appendix D—Description of Our Shares—Ownership Restrictions” of this offering document.
Compulsory Acquisition
In certain circumstances a shareholder who holds/controls at least 90% of the shares in acompany (“Major Shareholder”)—acquired or obtained in any way, not necessarily through atakeover bid—may move to compulsorily acquire the balance of shares not held by him or her.
B-8
For
per
sona
l use
onl
y
The procedures and requirements governing the compulsory acquisition of shares in acompany are detailed in the Corporations Act. The Corporations Act contains provisionsdesigned to protect shareholders (in a target company) who are having their sharescompulsorily acquired to ensure that they receive adequate information and a fair price fortheir shares.
The process is essentially as follows:
(a) The Major Shareholder must take action within six months of reaching the 90.0% level.
(b) The Acquisition consideration must be cash only and the same price paid for allshares.
(c) The Major Shareholder must arrange an expert’s report on the fair value of the shares.The expert must be approved by ASIC. The report must state whether, in the expert’sopinion, the terms proposed for the compulsory acquisition give a fair value for theshares concerned and set out the reasons for forming that opinion.
(d) The Major Shareholder must lodge a Notice of Compulsory Acquisition (including theexpert’s report and an objection form) with ASIC and then send it to all shareholders.
(e) if objections are received from holders of less than 10% of the shares within theobjection period (being at least 1 month), the Major Shareholder may proceed with thecompulsory acquisition.
(f) if objections are received from holders of at least 10% of the shares apply, within1 month (of the end of the objection period), the Major Shareholder may apply to theCourt for approval.
Indemnification
The Corporations Act prohibits a company from indemnifying its officers against:
(a) liabilities owed to the company or to a related body corporate;
(b) liabilities for certain pecuniary penalty orders or compensation orders under theCorporations Act; and
(c) liabilities owed to third parties which did not arise out of conduct in good faith.
The Corporations Act also prohibits a company from indemnifying its officers against legalcosts incurred in defending claims in certain circumstances, such as:
(a) proceedings in which the officer is found to have a liability for which they could not beindemnified (as above);
(b) criminal proceedings in which the director is found guilty; and
(c) proceedings brought by ASIC or a liquidator for orders where grounds for making theorder are established.
SUMMARY OF CERTAIN PROVISIONS OF THE CONSTITUTION
This summary provides information about certain provisions of our Constitution and certainaspects of the Corporations Act, and is qualified in its entirety by reference to our Constitutionand the Corporations Act.
Registration number and Constitution
The registration number with which our Company was incorporated is 076 157 054. Theliability of our Shareholders is limited.
B-9
For
per
sona
l use
onl
y
Directors
Ability of Interested Directors to Vote (Rule 13.6)
No Director may as a Director vote in respect of any contract or arrangement in which ourDirector has directly or indirectly any material interest and if our Director does vote his votemay not be counted nor shall our Director be counted in the quorum present at the meeting. ADirector, whose remuneration (including pension or other benefits) for himself is the subject ofa resolution tabled at a meeting of our Board, shall not be entitled to vote on the resolution ashe shall be taken to have a personal material interest in the matter and if he does vote hisvote may not be counted nor shall such Director be counted in the quorum present at themeeting. Other Directors of our Company will not be prohibited by our Constitution from votingon that resolution so long as they do not have any direct or indirect personal material interestin the subject matter of the said resolution.
Remuneration (Rule 13.3)
Our Directors are to be paid out of the funds of our Company as remuneration for theirservices as Directors, such sum accruing from day to day as our Company in general meetingdetermines to be divided among them in such proportion and manner as they agree or indefault of agreement equally. This rule does not limit the remuneration that may be paid to ourManaging Director or Executive Directors.
Our Directors’ remuneration for their services as Directors is by fixed sum and not acommission on or percentage of profits or turnover and may not be increased except at ageneral meeting where notice of the proposed increase has been given to the shareholders inthe notice convening the meeting.
Borrowing Powers (Rule 19.1 and Rule 19.2)
The management and control of the business and affairs of our Company are vested in ourBoard, which (in addition to the powers and authorities conferred upon them by these rules)may exercise all powers and do all things as are within the power of our Company and are notby these rules or by the Corporations Act directed or required to be exercised or done by ourCompany in general meeting.
Subject to the Rule 19.1 above, our Directors may exercise all the powers of our Company toraise or borrow money, may guarantee the debts or obligations of any person and may enterinto any other financing arrangement, in each case in the manner and on the terms it thinksfit.
Retirement Age Limit
There are no provisions relating to retirement of Directors upon reaching any age limit.
Shareholding Qualification
There shall be no shareholding qualification for Directors unless determined otherwise byOrdinary Resolution.
Share Rights and Restrictions
Our Company currently has only one class of Shares, which will be designated as ordinaryshares.
Dividends (Rule 23)
Subject to the Corporations Act and/or the Listing Manual, our Directors may from time to timeeither determine or declare that a dividend is payable to our Shareholders and fix the amount
B-10
For
per
sona
l use
onl
y
of the dividend, the time for payment and the method of payment. The dividend is (subject tothe rights of, or any restrictions on, the holders of shares created or raised under any specialarrangement as to dividend) payable on all Shares pro rata to the total amount for the timebeing paid, but not credited as paid, in respect of the Shares as a proportion of the total of theamounts then paid and payable thereon, excluding amounts credited, and may be paid at arate per annum in respect of a specified period provided that (for the purposes of this rule) noamount paid on a Share in advance of calls is to be treated as paid on that Share.
All unclaimed dividends may be invested or otherwise made use of by our Directors for thebenefit of our Company until claimed or otherwise disposed of according to law. There is notime limit before our Company can dispose of such unclaimed dividends.
Call on Shares (Rule 5.1)
Subject to the terms upon which any shares may have been issued and the Listing Rules, ourDirectors may make calls from time to time upon the shareholders in respect of all moneysunpaid on their shares. Each Shareholder is liable to pay the amount of each call in themanner, at the time and at the place specified by our Directors. Calls may be made payableby instalments.
Redemption Provisions (Rule 3.8)
Subject to the Corporations Act, any preference shares may be issued on the terms that theyare, or at the option of our Company, are liable, to be redeemed and otherwise on such termsand in such manner as our Board determines before the issue, provided that the rightsattaching to Shares of a class other than ordinary shares shall be expressed in the specialresolution creating the same or in the provisions of these rules.
Variation of Rights of Existing Shares or Classes of Shares (Rule 3.9)
If at any time the share capital is divided into different classes of shares, the rights attached toany class (unless otherwise provided by the terms of issue of shares of that class) may,whether or not our Company is being wound up, and subject to the Listing Rules and rules inthe Constitution, be varied with the consent in writing of Shareholders with at least 75.0% ofthe votes in the class, or with the sanction of a special resolution passed at a separatemeeting of the holders of the shares of that class.
The repayment of preference capital other than redeemable preference capital, or anyalteration of preference shareholders’ rights, may only be made pursuant to a specialresolution of the preference shareholders concerned, provided always that where thenecessary majority for such a special resolution is not obtained at the general meeting,consent in writing if obtained from holders of three-fourths of the preference sharesconcerned within two months of the general meeting, shall be as valid and effectual as aspecial resolution carried at the general meeting.
Changes in capital—Rule 3.11
Subject to any direction given by the Company in a general meeting or except as permittedunder the Listing Rules, all new Shares must, before issue, be offered to such persons whoas at the date of the offer are entitled to receive notices from the Company of generalmeetings in proportion to the amount of the existing Shares to which they are entitled.
The offer shall be made by notice specifying the number of Shares offered, and limiting a timewithin which the offer, if not accepted, will be deemed to be declined. After the expiration ofthat time, or on the notification from the person to whom the offer is made that he or shedeclines to accept the Shares offered, the Board may dispose of those Shares in suchmanner as they think most beneficial to the Company. The Board may likewise so dispose ofany new Shares which (by reason of the ratio which the new shares bear to shares held by
B-11
For
per
sona
l use
onl
y
persons entitled to an offer of new shares) cannot, in the opinion of the Board, beconveniently offered.
See “Appendix B—Summary of Certain Provision of the Australia Corporations Law and theConstitution of our Company—Summary of Certain Provisions of the Corporations Act—Purchase of Shares by a Company” and “Appendix D—Description of our Shares—GeneralMeeting of Shareholders” and for further details.
General Meetings (Rule 9.1)
See “Appendix D—Description of our Shares—General Meeting of Shareholders” for furtherdetails.
Voting Rights (Rule 10.8)
See “Appendix D—Description of our Shares—Voting Rights” for further details.
Share in surplus upon Winding Up (Rule 25)
In the event our Company is being wound up and the assets available for distribution amongshareholders (the “surplus assets”) are insufficient to repay the whole of the paid up capital,the surplus assets must be distributed as follows:
(a) the surplus assets must be applied first in repayment of the capital paid up on allshares that are not at the commencement of the winding up so that, if the surplusassets are insufficient to repay the whole of the capital paid up on those shares, thelosses are borne by the holders of those shares, as nearly as may be, in proportion tothe capital paid up or which ought to have been paid up at the commencement of thewinding up on such of those shares as are held by them respectively; and
the remainder (if any) of the surplus assets must be applied in repayment of the capital paidup on all shares that are, at the commencement of the winding up, so that the losses areborne by the holders of those shares, as nearly as may be, in proportion to the capital paid upor which ought to have been paid up at the commencement of the winding up on such ofthose shares as are held by them respectively.
B-12
For
per
sona
l use
onl
y

APPENDIX C—SUMMARY RULES OF THE PERFORMANCE RIGHTS PLAN
The object of the Plan is to:
(a) provide Participants with an incentive plan which recognises ongoing contribution tothe achievement by the Company of long term strategic goals;
(b) establish an employee incentive scheme within the meaning of Class Order 03/184issued by the Australian Securities and Investments Commission;
(c) align the interests of Participants with Security Holders through the sharing of apersonal interest in the future growth and development of the Company asrepresented in the price of the Company’s Securities; and
(d) provide a means of attracting and retaining skilled and experienced employees.
Eligibility
Under the Plan, the Board may grant rights to an employee or executive director of theCompany or any wholly owned subsidiary or controlled entity of the Company whom theBoard decides in its absolute discretion is eligible to be invited to receive a grant of Rights inthe Plan from time-to-time and who is not prohibited from participating in the Plan under theterms and conditions of the Plan.
Awards
Mandatory vesting of Rights will occur when the specified conditions and performancemeasures are satisfied. Each Right, when vested, will automatically convert to one fully paidordinary share in the Company.
Timing
The Rights are generally granted to vest in equal instalments over a period of between threeand five years.
Special Provisions
The Company may acquire fully paid ordinary shares on market and transfer, or issue newshares, to holders on vesting of Rights. The Company will not apply for ASX quotation of anyrights issued under the Plan. The Rights are not assignable.
Any shares issued or transferred as a result of the vesting of Rights issued under the Plan willrank equally with existing fully paid ordinary shares in the Company, in all respects includingvoting rights, entitlements to dividends and future entitlement issues.
Size and duration of Performance Rights Plan
The number or value of Rights to which an invitation relates is at the determination of the LincEnergy Chief Executive Officer.
In setting the number or value of Rights to which any specific invitation relates, the LincEnergy Chief Executive Officer will have regard to appropriate peer companies and to apercentage of base salary per employee pay band that reflects current market practice whenmaking his/her determination of the Eligible Employee’s entitlement.
If an Eligible Employee leaves before the Vesting Date of any tranche of Rights then anyunvested Rights will lapse except in the following cases:
‰ Death and Total Permanent Disability: in this case current granted and unvested Rightsentitlements will vest and there will be no further entitlements to future Rights awards;
C-1
For
per
sona
l use
onl
y

‰ Redundancy: in this case the Chief Executive Officer will consider on a case by casebase whether the current granted and unvested Rights entitlements will vest and howmany, if any, vest.
Operation of Performance Rights Plan
The Board may from time to time invite an Eligible Employee to participate in the Plan andgrant Rights to an Eligible Employee, as part of the Eligible Employee’s remuneration.
Securities delivered under the Plan (upon conversion of Rights) will rank equally with allexisting Securities on and from the Date of Registration in respect of all Security holderentitlements (including rights issues, bonus issues and dividends) which have a record datefor determining entitlements on or after the Date of Registration.
Rights will not be quoted on the SGX or any other publicly traded exchange.
Adjustment events
In the event of any reconstruction (including consolidation, subdivision, reduction, capitalreturn, buy back or cancellation) of the capital of the Company, the number of Securities thatmay be acquired by each Participant must be reconstructed accordingly, in a manner thatdoes not result in any additional benefits being conferred on Participants that are notconferred on Security holders of the Company. However in all other respects, the Rights willremain unchanged.
If there is a Control Event, the Board may give written notice to Participants of the ControlEvent and convert all or any of the Participant’s Rights to Securities whether or not thePerformance Conditions have been met.
Modifications or alterations to the Performance Rights Plan
The terms and conditions of the Plan may be amended at any time and from time-to-time bythe Board.
C-2
For
per
sona
l use
onl
y
APPENDIX D—DESCRIPTION OF OUR SHARES
The following statements are brief summaries of certain rights and privileges of shareholdersconferred by the Corporations Act and our Constitution. The description below is only asummary and is qualified in its entirety by reference to our Constitution and the CorporationsAct.
Share Capital
As at the Latest Practicable Date, we have 522,996,195 Shares on issue all of which are fullypaid-up.
Under Australian law, there is no such thing as ‘‘par value’’ or ‘‘authorised share capital’’. InAustralia a company increases its share capital by issuing additional shares.
Under the Corporations Act, the directors have the power to issue shares, or grant options inrespect of further shares, on such terms and conditions as the Directors decide by resolution.This includes the power to issue:
(a) bonus shares (shares for whose issue no consideration is payable to the company);
(b) preference shares (including redeemable preference shares); and
(c) partly-paid shares.
Under Australian law, shareholder general authorisation (including a general mandate) is notrequired for the issue of further shares.
Under Australian law, the power of directors to issue shares in a company is subject to:
(a) the takeover provisions of the Corporations Act;
(b) any rights and restrictions attached to a class of shares expressed or implied in theconstitution of the company;
(c) restrictions with respect to preference shares; and
(d) the provisions in the Corporations Act dealing with the issue of shares and othersecurities to related parties of the company.
A company may issue preference shares under the Corporations Act only if the rightsattached to the preference shares are set out in the company’s constitution or have beenapproved by way of a special resolution (75.0% approval) of the company’s shareholders.
As an entity admitted to the official list of SGX-ST, the issue of further shares in the Companywill be also be subject to, among others, the restrictions contained within the following:
(a) the SGX-ST; and
(b) the Singapore Take-Over code.
Any share issue which will fall within the above restrictions will be subject to the procedurescontained in the Corporations Act and the Listing Rules, which shall include Shareholderapproval in general meeting.
Purchase by our Company of our Shares
A company can either acquire its own shares pursuant to the terms on which they wereissued (i.e. for redeemable preference shares) or pursuant to a regulated share buy-backunder the Corporations Act.
D-1
For
per
sona
l use
onl
y
The Corporations Act empowers a company to buy back its shares if the buy-back does notmaterially prejudice the company’s ability to pay its creditors, and the company follows theprocedures laid down in the Corporations Act.
A company buys back its shares when it acquires shares in itself from a shareholder under anagreement between the company and that shareholder. It is of the essence of a buy-back thatany shareholder to whom the company makes an offer to buy back may decide whether ornot to sell.
The Corporations Act regulates five types of buy-back:
(a) equal access schemes applicable only to ordinary shares—the company makesuniform offers to each shareholder to buy back a uniform percentage of eachshareholder’s ordinary shares;
(b) on-market buy-backs—a company listed on a securities exchange buys its shares inthe ordinary course of trading on the stock exchange in compliance with theexchange’s listing rules as well as the Corporations Act;
(c) minimum holding (odd-lot) buy-backs—a company listed on a securities exchangebuys small parcels of shares which are not marketable parcels on the exchange;
(d) employee share scheme buy-backs—a company buys shares held by, or for thebenefit of, current or former employees, including executive directors, under anexisting employee share acquisition scheme that has been approved by the companyin general meeting;
(e) selective buy-backs—the company buys back from a particular member, otherwisethan in any of the first four modes.
A selective buy-back must be approved by a special resolution (75% approval) of thecompany in general meeting. That requirement is for protection of other shareholders whocould be prejudiced by a buy-back which:
(a) unduly favours a particular shareholder who is bought out at an improper premium tomarket value; or
(b) would enable particular remaining shareholders to increase their control.
Other forms of buy-back do not require approval in a general meeting unless, in an employeeshare scheme buy-back, an on-market buy-back or an equal access scheme, the buy-backwould exceed the limit on volume of “10% in 12 months”. Approval by ordinary resolution isrequired for any such buy-back which exceeds the limit.
Shareholders
We maintain a register of members which contains the particulars required under theCorporations Act, and only recognise as shareholders of our Company such persons who areholders of Shares and who are registered on the register of members. The register ofmembers must contain the address of a member for the purposes of determining whetherthey are a foreign shareholder.
As required by the Corporations Act, the principal register of members is contained inAustralia. A local register of members is maintained in Singapore which mirrors the Australianregister of members.
If any Share stands jointly in the names of two or more persons, the person first named in theregister shall as regards service of notices and, subject to the provisions of the Constitution,all or any other matters connected with our Company, except with respect to the transfer ofShares, be deemed the sole holder of those Shares.
D-2
For
per
sona
l use
onl
y
Subject to the terms and conditions of any application of Shares, we must allot Shares anddespatch certificates within ten Market Days of the closing date for applications to subscribefor a new issue of securities (or such other period as may be approved by the SGX-ST).
We may close the register of shareholders for any time or times if we provide the SGX-STwith at least five clear Market Days’ notice (excluding the date of announcement and the bookclosure date). However, the register may not be closed for more than 30 days in aggregate inany calendar year. We would typically close the register to determine shareholders’entitlement to receive dividends and other distributions.
Transfer of Shares
Subject to our Constitution, any shareholder may transfer all or any of their Shares by a dulysigned instrument of transfer in the form acceptable to our Board provided always that ourCompany shall accept for registration an instrument of transfer in a form approved by theSGX-ST.
Save as provided in the:
(a) Constitution;
(b) the takeover provisions of the Corporations Act and the Singapore Take-Over code;and
(c) the provisions of the Foreign Acquisitions and Takeovers Act 1975 (FATA),
there will be no restriction on the transfer of fully paid up Shares (except where required bylaw or the rules or regulations of the SGX-ST).
For details on the takeover provisions of the Corporations Act and the Singapore Take-Overcode, see “Appendix D—Description of Our Shares—Take-overs” of this offering document.For detail on ownership restrictions under the FATA, see “Appendix D—Description of OurShares—Ownership Restrictions” of this offering document.
Our Board may decline to register a transfer of any Share which is not fully paid or on whichour Company has a lien. Our Board may also decline to recognise any instrument of transferunless, among other things, it is duly stamped and is presented for registration together withthe share certificate and such other evidence as our Board may reasonably require, and a feeof such sum (not exceeding two Singapore dollar (S$2.00) or such other maximum sum asthe SGX-ST may determine to be payable) as our Board may from time to time require is paidto our Company in respect thereof.
General Meeting of Shareholders
The Directors may convene a general meeting of Shareholders at their absolute discretion bygiving not less than 21 days’ notice in writing, excluding the day of posting of the notice andthe day on which the general meeting is held, to each Shareholder for the passing of anordinary or special resolution. The written notice must set out:
(a) the place, date and time of the meeting;
(b) the general nature of the meeting’s business;
(c) the resolutions to be put to Shareholders for consideration and vote; and
(d) a proxy form stating that the Shareholder is entitled to appoint a proxy to attend themeeting and vote on the shareholder’s behalf and at the shareholder’s direction.
Under Australian law, the Company is required to present its accounts to Shareholders forapproval at an annual general meeting not later than five months after the end of its financial year.
D-3
For
per
sona
l use
onl
y
As the Company is incorporated in Australia, please note that the time requirements for thegiving of notice of general meeting and for the presentation of accounts differ from aSingapore-incorporated company.
Shareholders are entitled to be present in person, or by proxy, attorney or representative toattend and vote at general meetings of the Company. A quorum of one Shareholder isrequired to be present at the general meeting before any business may be transacted.
A Shareholder/s who holds in excess of 5% of the votes that may be cast at the generalmeeting may requisition a general meeting of the Company in accordance with the provisionsof the Corporations Act.
In accordance with Rule 12.3(e) of our Constitution, unless CDP specifies otherwise in awritten notice to our Company, CDP shall be deemed to have appointed as CDP’s proxieseach of the Depositors (as defined in the Singapore Companies Act) who are individuals andwhose names are shown in the records of CDP, as at a time not earlier than 48 hours prior tothe time of the relevant general meeting, supplied by CDP to our Company. Therefore,Depositors who are individuals can attend and vote at the general meetings of our Companywithout the lodgement of any proxy form. Depositors who cannot attend a meeting personallymay enable their nominees to attend as CDP’s proxies. Depositors who are not individualscan only be represented at a general meeting of our Company if their nominees are appointedby CDP as CDP’s proxies. Proxy forms appointing nominees of Depositors as proxies of CDPwould need to be executed by CDP as member and must be deposited at the specified placeand within the specified time frame to enable the nominees to attend and vote at the relevantgeneral meeting of our Company.
Voting Instructions
Investors who hold Shares through CDP may instruct CDP to exercise the voting rights for thedeposited Shares in accordance with the terms and conditions for the operation of SecuritiesAccounts with CDP, as amended from time to time. However, as a matter of Australian law,CDP will be recognised as the only registered owner of these Shares and, accordingly,Depositors and Depository Agents on whose behalf CDP holds Shares will not be accordedthe full rights of membership, such as voting rights, the right to appoint proxies, or the right toreceive annual reports, notices of meeting and takeover documents. We will mail toDepositors any notice of shareholders’ meeting and such other documents issued by us toour shareholders (including annual reports and circulars).
If a meeting of our Shareholders is convened, we will despatch to persons with Sharesstanding to the credit of their CDP Securities Account Voting Instructions Forms. Suchpersons will be required to return the Voting Instructions Forms on or before the datespecified by CDP for that purpose (the “Specified Date”). The Voting Instructions Form willset out such details as the resolutions to be considered at the Shareholders’ meeting. TheVoting Instructions Form, duly completed, must be returned by such persons to CDP no laterthan the Specified Date. In the event that CDP does not receive the duly completed VotingInstructions Form from a person with Shares standing to the credit of a CDP securitiesaccount on or before the Specified Date, or if the Voting Instructions Form has not been dulycompleted or is invalid for any reason, CDP will not vote or take any action in respect of theShares standing to the credit of this CDP securities account. CDP or any of its nominees may,at its absolute discretion and upon such terms and conditions as it may think fit, accept thewritten instructions of the person holding the CDP Securities Account to which the relevantShares have been credited to vote, or appoint a proxy to vote, at any shareholders’ meeting inrespect of Shares standing to the credit of such CDP Securities Account.
However, except as provided in the foregoing, neither CDP nor any of its nominees willexercise any right to attend, speak or vote at any shareholders’ meeting in respect of Sharesdeposited with CDP. The operation of a CDP securities account is subject to the terms andconditions for the operation of securities accounts with CDP, as amended from time to time.
D-4
For
per
sona
l use
onl
y
Voting Rights
Subject to any special rights or restrictions as to voting for the time being attached to anyshares by or in accordance with our Constitution, at any general meeting:
(a) on a show of hands—every shareholder present in person (or being a corporation, ispresent by a representative duly authorised under Rules 12.4 of the Constitution) or byproxy shall have one vote and the chairman of the meeting shall determine whichproxy shall be entitled to vote where a shareholder (other than CDP) is represented bytwo proxies; and
(b) on a poll—every shareholder present in person or by proxy or, in the case of ashareholder being a corporation, by its duly authorised representative shall have onevote for every fully paid share of which they are the holder or which they representsand in respect of which all calls due to our Company have been paid, but so that noamount paid up or credited as paid up on a share in advance of calls or instalments istreated for the foregoing purposes as paid up on the share.
If the shareholder is CDP, CDP may appoint more than two proxies to attend and vote at thesame general meeting and each proxy shall be entitled to exercise the same powers onbehalf of CDP as CDP could exercise, including the right to vote individually on a show ofhands.
Dividends
Subject to the Corporations Act, the Constitution and the terms or rights of any shares withspecial rights to dividends, our Board may from time to time resolve to pay dividends toShareholders of the Company and fix the amount of the dividend, the time for determiningentitlements to the dividend and the timing and method of payment.
Under the Corporations Act, our Board must not pay a dividend unless:
(a) our assets exceed our liabilities immediately before the dividend is declared and theexcess is sufficient for the payment of the dividend;
(b) the payment of the dividend is fair and reasonable to our Shareholders as a whole;and
(c) the payment of the dividend does not materially prejudice our ability to pay ourcreditors.
For further information in respect of the Company’s proposed dividend policy, see “DividendPolicy “.
Variation of share class rights
At present, the Company’s only class of shares on issue is ordinary shares. Subject to theCorporations Act and the terms of issue of a class of shares, the rights attaching to any classof shares may be varied or cancelled:
(a) with the consent in writing of the holders of three-quarters of the issued sharesincluded in that class; or
(b) by a special resolution passed at a separate meeting of the holders of those shares.
In either case, the holders of not less than 10% of the votes in the class of shares, the rightsof which have been varied or cancelled, may apply to a court of competent jurisdiction toexercise its discretion to set aside such a variation or cancellation.
D-5
For
per
sona
l use
onl
y
Take-overs
Singaporean takeover provisions
Under the Singapore Take-Over code
Our Company is subject to the Securities and Futures Act and the Singapore Take-OverCode notwithstanding that we are a corporation incorporated in Australia.
Under the Singapore Take-Over Code, issued by the Authority pursuant to Section 321 of theSecurities and Futures Act, any person acquiring an interest, either on his own or togetherwith parties acting in concert with him, in 30.0% or more of the voting Shares must extend atakeover offer for the remaining voting Shares in accordance with the provisions of theSingapore Take-Over Code. In addition, a mandatory takeover offer is also required to bemade if a person holding, either on his own or together with parties acting in concert with him,between 30.0% and 50.0% of the voting shares acquires additional voting sharesrepresenting more than 1.0% of the voting shares in any six-month period. Under theSingapore Take-Over Code, the following individuals and companies will be presumed to bepersons acting in concert with each other unless the contrary is established:
(a) the following companies:
(i) a company;
(ii) the parent company of (i);
(iii) the subsidiaries of (i);
(iv) the fellow subsidiaries of (i);
(v) the associated companies of (i), (ii), (iii) or (iv); and
(vi) companies whose associated companies include any of (i), (ii), (iii), (iv) or (v);and
(vii) any person who has provided financial assistance (other than a bank in theordinary course of business) to any of the above for the purchase of votingrights;
(b) a company with any of its directors (together with their close relatives, related trusts aswell as companies controlled by any of the directors, their close relatives and relatedtrusts);
(c) a company with any of its pension funds and employee share schemes;
(d) a person with any investment company, unit trust or other fund whose investment suchperson manages on a discretionary basis, but only in respect of the investmentaccount which such person manages;
(e) a financial or other professional adviser, including a stockbroker, with its customer inrespect of the shareholdings of:
(i) the adviser and persons controlling, controlled by or under the same control asthe adviser; and
(ii) all the funds which the adviser manages on a discretionary basis, where theshareholdings of the adviser and any of those funds in the customer total10.0 per cent. or more of the customer’s equity share capital;
(f) directors of a company (together with their close relatives, related trusts andcompanies controlled by any of such directors, their close relatives and related trusts)which is subject to an offer or where the directors have reason to believe a bona fideoffer for their company may be imminent;
D-6
For
per
sona
l use
onl
y
(g) partners; and
(h) the following persons and entities:
(i) an individual;
(ii) the close relatives of (i);
(iii) the related trusts of (i);
(iv) any person who is accustomed to act in accordance with the instructions of (i);
(v) companies controlled by any of (i), (ii), (iii) or (iv); and
(vi) any person who has provided financial assistance (other than a bank in theordinary course of business) to any of the above for the purchase of votingrights.
Under the Singapore Take-Over Code, a mandatory offer made with consideration other thancash must be accompanied by a cash alternative at not less than the highest price paid by theofferor or any person acting in concert within the preceding six months.
Australian takeover provisions
Under the takeover provisions of the Corporations Act, corporate takeovers are regulated byChapter 6 of the Corporations Act. A takeover involves the acquisition by one company(bidder) of a sufficient number of shares in another company (target) to obtain control of thefinances and operations of the target.
The Corporations Act prohibits an entity from acquiring an interest in voting shares in acompany, where:
(a) the company is either a listed company, or an unlisted company with more than50 members;
(b) the interest is acquired through a transaction in relation to securities entered into by oron behalf of the person who acquires the interest; and
(c) because of the transaction, that person’s voting power in the company increases from20% or below to more than 20%, or increases from a starting point that is above 20%and below 90%.
The Corporations Act provides a number of exceptions to this general prohibition including:
(a) acquisitions resulting from the acceptance of an offer under a takeover bid;
(b) an acquisition approved by shareholders;
(c) increased shareholding under a pro rata issue; and
(d) “creeping” provisions, which allows a person to acquire a relevant interest in excess of20% of the voting shares in a company if (i) throughout the 6 months before theacquisition, that person had voting power of at least 19% in the company; and (ii) as aresult of the acquisition, that person’s voting power in the company does not increaseby more than 3% from the voting power held by the person 6 months before theacquisition. However, for every 1% change, a substantial holding notice must belodged with the company and the ASX.
A takeover may proceed by way of an off-market bid or an on-market bid. All offers to securityholders in the bid class must be the same and the consideration offered must equal or exceedthe maximum consideration that the bidder or an associate of the bidder provided for asecurity in the bid class in the four months prior to the announcement of the takeover bid.
D-7
For
per
sona
l use
onl
y
A bidder making a takeover bid will be permitted to compulsorily acquire the remainingsecurities in the bid class if during or at the end of the offer period:
(a) the bidder and its associates have relevant interests in at least 90% (by number) of thesecurities in the bid class; and
(b) the bidder and its associates have acquired at least 75% (by number) of the securitiesthat the bidder offered to acquire under the bid (other than securities in which thebidder had a relevant interest in at the start of the offer period).
Substantial Shareholders
The Securities and Futures Act requires our substantial shareholders to give notice to us ofcertain information as prescribed by the Authority, including particulars of their interest, withintwo business days of becoming aware of being our Substantial Shareholders, being aware ofany change in the percentage level of their interest and being aware of ceasing to be aSubstantial Shareholder. “Percentage level”, in relation to a substantial shareholder, is thepercentage figure ascertained by expressing the aggregate of the votes attached to all thevoting shares in which the substantial shareholder has an interest (or interests) immediatelybefore or (as the case may be) immediately after the relevant time as a percentage of thetotal votes attached to all of the voting shares, and if it is not a whole number, rounding thatfigure down to the next whole number. Under the Securities and Futures Act, a person has asubstantial shareholding in us if he has an interest (or interests) in one or more of our votingshares and the total votes attached to those shares are not less than 5.0% of the aggregateof the total votes attached to all of our voting shares (excluding treasury shares).
Liquidation
If the Company is wound up, the liquidator may (with the sanction of a special resolution):
(a) distribute the whole or any part of the Company’s assets in kind among some or all ofthe shareholders as the liquidator considers fair and can determine how thedistribution is to be carried out as between different shareholders or different classesof shareholders; and
(b) vest the whole or any part of the Company’s assets in trustees on such trusts for thebenefit of some or all of the shareholders or some or all of any class of shareholdersas are approved by the special resolution, but a shareholder may not be compelled toaccept any shares in a body corporate or other securities in respect of which there is aliability.
Indemnity
The Company, to the extent permitted by law, may indemnify a current or former Director orofficer against any liability incurred by that person as a Director or officer of the Company,and legal costs incurred by that person in defending an action for a liability of that person.
The Company, to the extent permitted by law, may pay, or agree to pay, a premium for acontract insuring a former or current Director or officer against any liability incurred by thatperson in that capacity, including liability for legal costs.
The Company, to the extent permitted by law, may enter into an agreement or deed with aperson who is, or has been, a Director or officer of the Company in relation to the mattersabove. Such an agreement may include provisions relating to rights of access to theCompany’s books conferred by the Corporations Act or otherwise by law.
Ownership Restrictions
The acquisition of interests in our Company is regulated by the FATA.
D-8
For
per
sona
l use
onl
y
Where a “foreign person” proposes acquiring certain interests in our Company (includingShares), the FATA gives the Treasurer of the Commonwealth of Australia (the “Treasurer”)power to make a prohibition order or a divestment order in respect of such an acquisition, if asa consequence of that acquisition a single foreign person (alone or together with itsassociates) would have an interest in 15.0% or more of our Shares, votes or potential votes(including through interests in Shares such as notes and options) of our Company, or anumber of foreign persons (alone or together with their respective associates) would have inaggregate an interest in 40.0% or more of our Shares, votes or potential votes of ourCompany (including through interests in Shares such as notes and options) and the Treasurerconsiders the proposal to be contrary to Australia’s national interest. The FATA requires (withthe sanction of penalties) that prior notice of the acquisition be given to the Treasurer by aforeign person (alone or together with its associates) that would have an interest in 15.0% ormore of the Shares, votes or potential votes (including through interests in Shares such asnotes and options) of our Company. In response to such notice the Treasurer may prohibit theproposal or state that there are no objections to the acquisition (with or without conditions) ora statutory period may expire without the Treasurer responding in which case the Treasurer’spower to make orders lapses. The issue of a statement of no objections (with or withoutconditions) removes the Treasurer’s ability to make orders in respect to the proposal.
The requirements and powers under FATA apply equally to acquisitions of interests throughissuance or transfer of interests.
Investors requiring further information as to whether notification under FATA to the Treasurer(through the Foreign Investment and Review Board) is required in respect of a proposedinvestment or further investment in the Company should consult their professional advisor.
Investors that have foreign governments or their agencies in their ownership should alsoconsult their professional adviser to ascertain whether notice under Australia’s ForeignInvestment Policy is required in addition to notice under FATA.
Minority Rights
The Corporations Act has various provisions allowing for application for a court order foroppressive conduct of a company’s affairs, allowing for derivative actions and permitting theinspection of a company’s books. A winding up may also be sought on just and equitablegrounds.
Dividend Reinvestment Plan / Scrip Dividend Schemes
Our Constitution authorises our Directors, on any terms and at their discretion, to establish adividend reinvestment plan (under which any member may elect that the dividends payable byus be reinvested by a subscription for securities).
Subject to the rules contained within the Listing Manual, our Company may also adopt a scripdividend scheme entitling Shareholders to elect to receive Shares in lieu of cash amount inrespect of any dividend paid.
D-9
For
per
sona
l use
onl
y

[THIS PAGE INTENTIONALLY LEFT BLANK]
For
per
sona
l use
onl
y
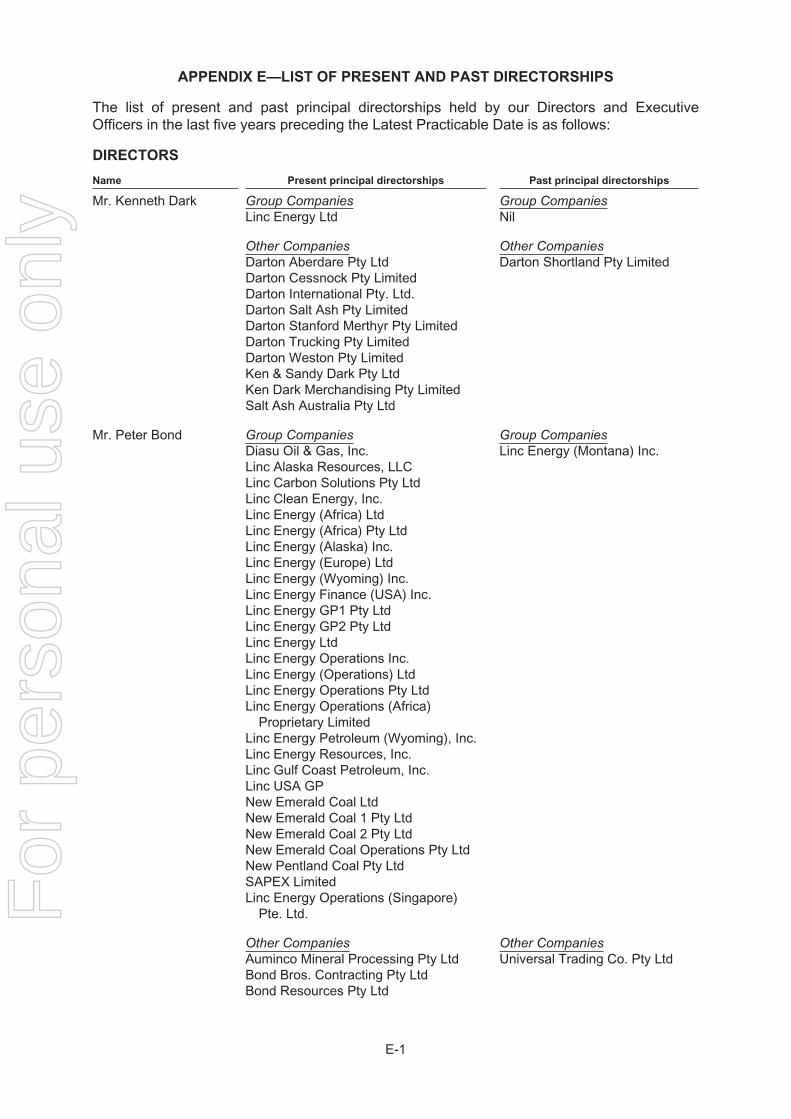
APPENDIX E—LIST OF PRESENT AND PAST DIRECTORSHIPS
The list of present and past principal directorships held by our Directors and ExecutiveOfficers in the last five years preceding the Latest Practicable Date is as follows:
DIRECTORS
Name Present principal directorships Past principal directorships
Mr. Kenneth Dark Group Companies Group CompaniesLinc Energy Ltd Nil
Other Companies Other CompaniesDarton Aberdare Pty Ltd Darton Shortland Pty LimitedDarton Cessnock Pty LimitedDarton International Pty. Ltd.Darton Salt Ash Pty LimitedDarton Stanford Merthyr Pty LimitedDarton Trucking Pty LimitedDarton Weston Pty LimitedKen & Sandy Dark Pty LtdKen Dark Merchandising Pty LimitedSalt Ash Australia Pty Ltd
Mr. Peter Bond Group Companies Group CompaniesDiasu Oil & Gas, Inc. Linc Energy (Montana) Inc.Linc Alaska Resources, LLCLinc Carbon Solutions Pty LtdLinc Clean Energy, Inc.Linc Energy (Africa) LtdLinc Energy (Africa) Pty LtdLinc Energy (Alaska) Inc.Linc Energy (Europe) LtdLinc Energy (Wyoming) Inc.Linc Energy Finance (USA) Inc.Linc Energy GP1 Pty LtdLinc Energy GP2 Pty LtdLinc Energy LtdLinc Energy Operations Inc.Linc Energy (Operations) LtdLinc Energy Operations Pty LtdLinc Energy Operations (Africa)
Proprietary LimitedLinc Energy Petroleum (Wyoming), Inc.Linc Energy Resources, Inc.Linc Gulf Coast Petroleum, Inc.Linc USA GPNew Emerald Coal LtdNew Emerald Coal 1 Pty LtdNew Emerald Coal 2 Pty LtdNew Emerald Coal Operations Pty LtdNew Pentland Coal Pty LtdSAPEX LimitedLinc Energy Operations (Singapore)
Pte. Ltd.
Other Companies Other CompaniesAuminco Mineral Processing Pty Ltd Universal Trading Co. Pty LtdBond Bros. Contracting Pty LtdBond Resources Pty Ltd
E-1
For
per
sona
l use
onl
y
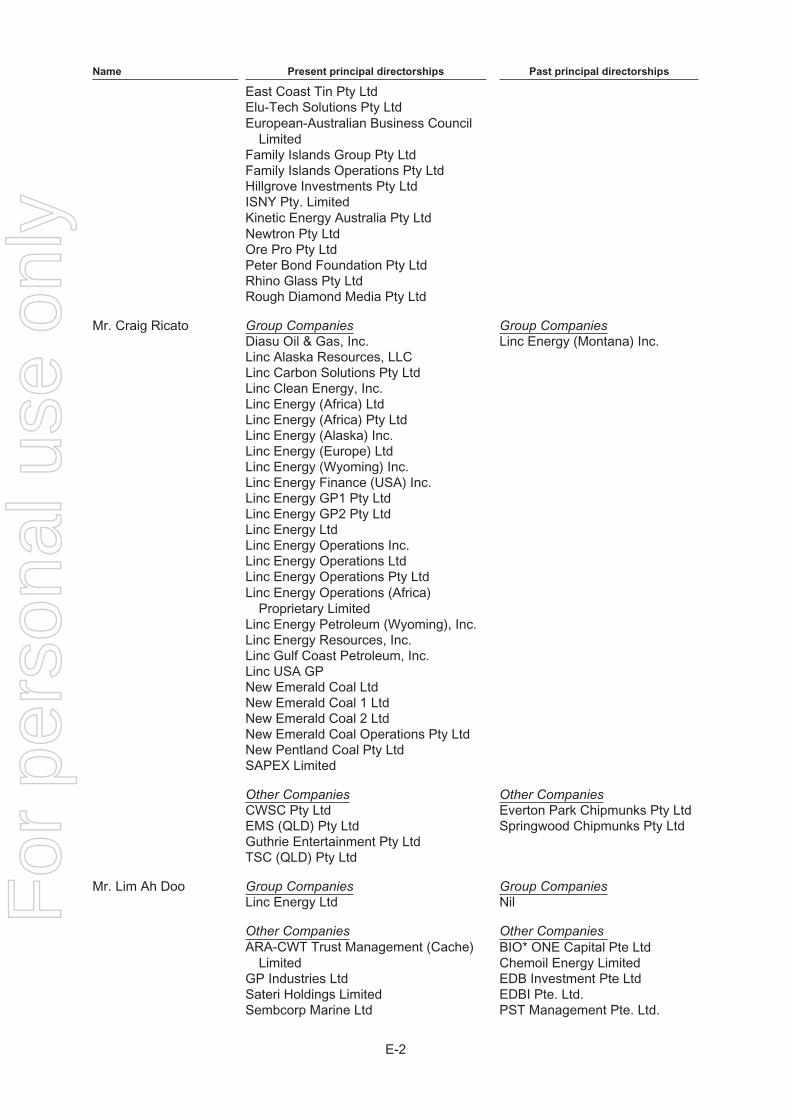
Name Present principal directorships Past principal directorships
East Coast Tin Pty LtdElu-Tech Solutions Pty LtdEuropean-Australian Business Council
LimitedFamily Islands Group Pty LtdFamily Islands Operations Pty LtdHillgrove Investments Pty LtdISNY Pty. LimitedKinetic Energy Australia Pty LtdNewtron Pty LtdOre Pro Pty LtdPeter Bond Foundation Pty LtdRhino Glass Pty LtdRough Diamond Media Pty Ltd
Mr. Craig Ricato Group Companies Group CompaniesDiasu Oil & Gas, Inc. Linc Energy (Montana) Inc.Linc Alaska Resources, LLCLinc Carbon Solutions Pty LtdLinc Clean Energy, Inc.Linc Energy (Africa) LtdLinc Energy (Africa) Pty LtdLinc Energy (Alaska) Inc.Linc Energy (Europe) LtdLinc Energy (Wyoming) Inc.Linc Energy Finance (USA) Inc.Linc Energy GP1 Pty LtdLinc Energy GP2 Pty LtdLinc Energy LtdLinc Energy Operations Inc.Linc Energy Operations LtdLinc Energy Operations Pty LtdLinc Energy Operations (Africa)
Proprietary LimitedLinc Energy Petroleum (Wyoming), Inc.Linc Energy Resources, Inc.Linc Gulf Coast Petroleum, Inc.Linc USA GPNew Emerald Coal LtdNew Emerald Coal 1 LtdNew Emerald Coal 2 LtdNew Emerald Coal Operations Pty LtdNew Pentland Coal Pty LtdSAPEX Limited
Other Companies Other CompaniesCWSC Pty Ltd Everton Park Chipmunks Pty LtdEMS (QLD) Pty Ltd Springwood Chipmunks Pty LtdGuthrie Entertainment Pty LtdTSC (QLD) Pty Ltd
Mr. Lim Ah Doo Group Companies Group CompaniesLinc Energy Ltd Nil
Other Companies Other CompaniesARA-CWT Trust Management (Cache)
LimitedBIO* ONE Capital Pte LtdChemoil Energy Limited
GP Industries Ltd EDB Investment Pte LtdSateri Holdings Limited EDBI Pte. Ltd.Sembcorp Marine Ltd PST Management Pte. Ltd.
E-2
For
per
sona
l use
onl
y
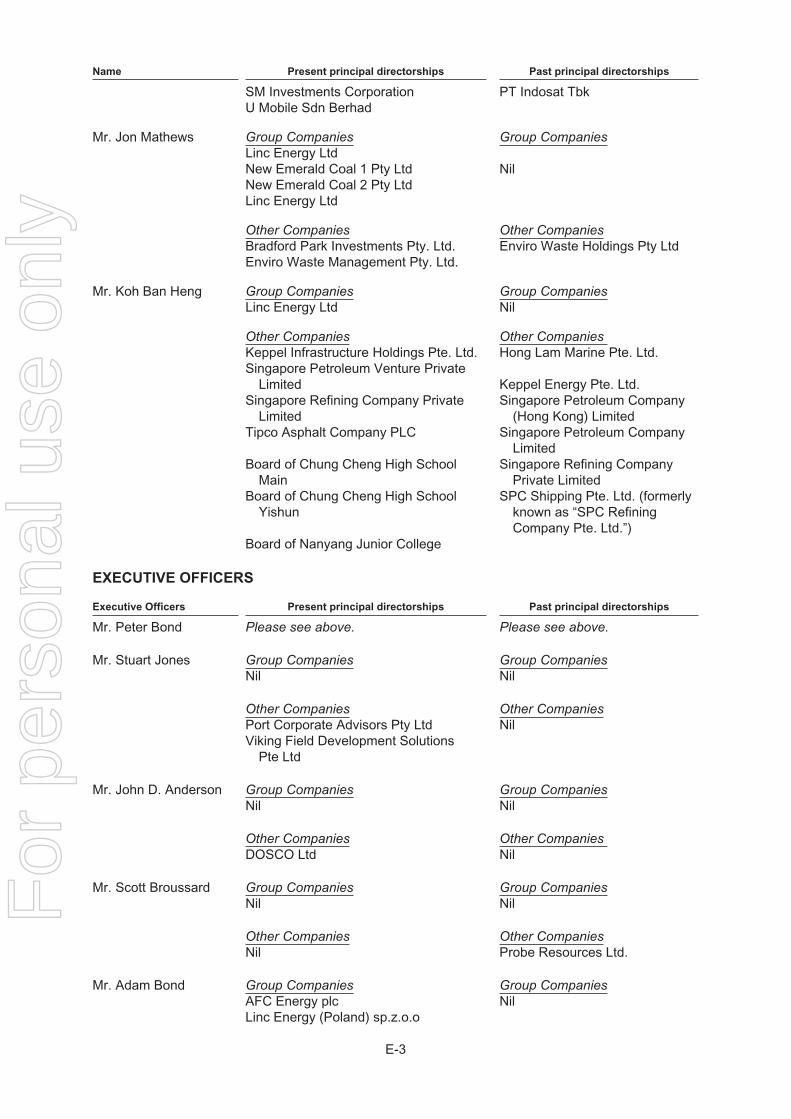
Name Present principal directorships Past principal directorships
SM Investments Corporation PT Indosat TbkU Mobile Sdn Berhad
Mr. Jon Mathews Group Companies Group CompaniesLinc Energy LtdNew Emerald Coal 1 Pty Ltd NilNew Emerald Coal 2 Pty LtdLinc Energy Ltd
Other Companies Other CompaniesBradford Park Investments Pty. Ltd. Enviro Waste Holdings Pty LtdEnviro Waste Management Pty. Ltd.
Mr. Koh Ban Heng Group Companies Group CompaniesLinc Energy Ltd Nil
Other Companies Other CompaniesKeppel Infrastructure Holdings Pte. Ltd. Hong Lam Marine Pte. Ltd.Singapore Petroleum Venture Private
Limited Keppel Energy Pte. Ltd.Singapore Refining Company Private
LimitedSingapore Petroleum Company
(Hong Kong) LimitedTipco Asphalt Company PLC Singapore Petroleum Company
LimitedBoard of Chung Cheng High School
MainSingapore Refining Company
Private LimitedBoard of Chung Cheng High School
YishunSPC Shipping Pte. Ltd. (formerly
known as “SPC RefiningCompany Pte. Ltd.”)
Board of Nanyang Junior College
EXECUTIVE OFFICERS
Executive Officers Present principal directorships Past principal directorships
Mr. Peter Bond Please see above. Please see above.
Mr. Stuart Jones Group Companies Group CompaniesNil Nil
Other Companies Other CompaniesPort Corporate Advisors Pty Ltd NilViking Field Development Solutions
Pte Ltd
Mr. John D. Anderson Group Companies Group CompaniesNil Nil
Other Companies Other CompaniesDOSCO Ltd Nil
Mr. Scott Broussard Group Companies Group CompaniesNil Nil
Other Companies Other CompaniesNil Probe Resources Ltd.
Mr. Adam Bond Group Companies Group CompaniesAFC Energy plc NilLinc Energy (Poland) sp.z.o.o
E-3
For
per
sona
l use
onl
y
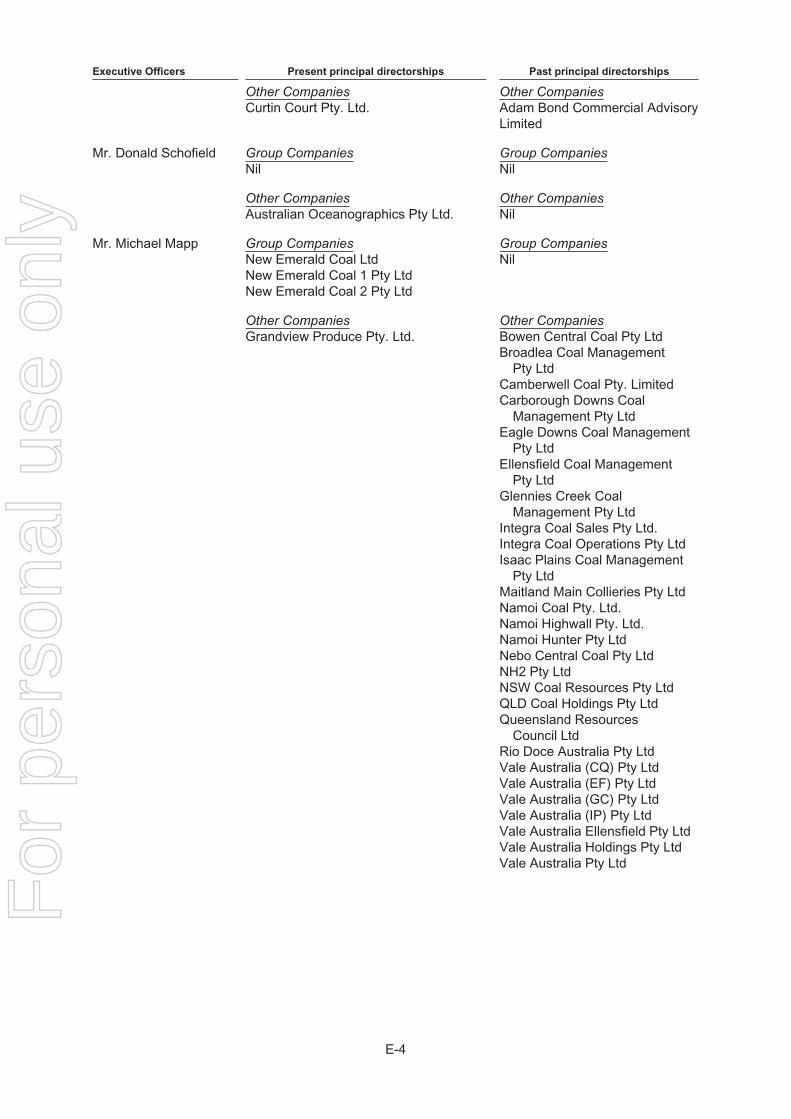
Executive Officers Present principal directorships Past principal directorships
Other Companies Other CompaniesCurtin Court Pty. Ltd. Adam Bond Commercial Advisory
Limited
Mr. Donald Schofield Group Companies Group CompaniesNil Nil
Other Companies Other CompaniesAustralian Oceanographics Pty Ltd. Nil
Mr. Michael Mapp Group Companies Group CompaniesNew Emerald Coal Ltd NilNew Emerald Coal 1 Pty LtdNew Emerald Coal 2 Pty Ltd
Other Companies Other CompaniesGrandview Produce Pty. Ltd. Bowen Central Coal Pty Ltd
Broadlea Coal ManagementPty Ltd
Camberwell Coal Pty. LimitedCarborough Downs Coal
Management Pty LtdEagle Downs Coal Management
Pty LtdEllensfield Coal Management
Pty LtdGlennies Creek Coal
Management Pty LtdIntegra Coal Sales Pty Ltd.Integra Coal Operations Pty LtdIsaac Plains Coal Management
Pty LtdMaitland Main Collieries Pty LtdNamoi Coal Pty. Ltd.Namoi Highwall Pty. Ltd.Namoi Hunter Pty LtdNebo Central Coal Pty LtdNH2 Pty LtdNSW Coal Resources Pty LtdQLD Coal Holdings Pty LtdQueensland Resources
Council LtdRio Doce Australia Pty LtdVale Australia (CQ) Pty LtdVale Australia (EF) Pty LtdVale Australia (GC) Pty LtdVale Australia (IP) Pty LtdVale Australia Ellensfield Pty LtdVale Australia Holdings Pty LtdVale Australia Pty Ltd
E-4
For
per
sona
l use
onl
y
Linc Energy Ltd Financial Report
ABN 60 076 157 045
for the years ended 30 June 2013, 30 June 2012 and 30 June 2011
APPENDIX F — INDEPENDENT AUDITORS' REPORT ON THE CONSOLIDATED FINANCIAL STATEMENTS FOR THE YEARS ENDED 30 JUNE 2011, 2012 AND 2013
F-1
For
per
sona
l use
onl
y
2
Linc Energy Ltd ABN 60 076 157 045 Financial Reports - 30 June 2013, 2012 and 2011
Page Financial report
Consolidated statements of profit or loss and other comprehensive income 3 Consolidated statements of financial position 4 Consolidated statements of changes in equity 5 Consolidated cash flow statements 8 Notes to the consolidated financial statements 9
Directors' declaration 67 Independent auditor’s report 68
This financial report contains the consolidated financial statements for the consolidated entity consisting of Linc Energy Ltd and its subsidiaries (the Group) for the years ended 30 June 2013, 30 June 2012 and 30 June 2011. The financial report is presented in Australian Dollars. Linc Energy Ltd is a company limited by shares, incorporated and domiciled in Australia. Its registered office and principal place of business is 32 Edward Street, Brisbane, Qld 4000.
F-2
For
per
sona
l use
onl
y
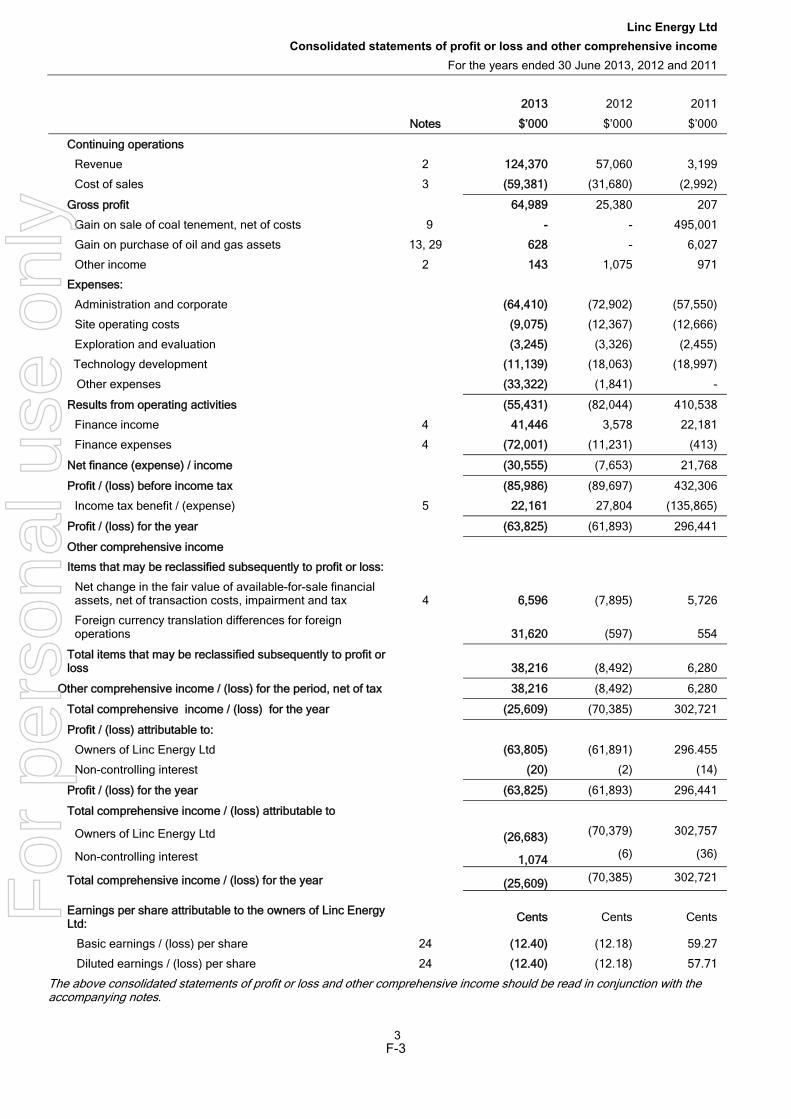
Linc Energy Ltd Consolidated statements of profit or loss and other comprehensive income
For the years ended 30 June 2013, 2012 and 2011
3
22013 2012 2011
NNotes $’000 $’000 $’000
Continuing operations
Revenue 2 1124,370 57,060 3,199
Cost of sales 3 ((59,381) (31,680) (2,992)
Gross profit 64,989 25,380 207
Gain on sale of coal tenement, net of costs 9 - - 495,001
Gain on purchase of oil and gas assets 13, 29 6628 - 6,027
Other income 2 1143 1,075 971
Expenses:
Administration and corporate ((64,410) (72,902) (57,550)
Site operating costs ((9,075) (12,367) (12,666)
Exploration and evaluation ((3,245) (3,326) (2,455)
Technology development ((11,139) (18,063) (18,997)
Other expenses ((33,322) (1,841) -
Results from operating activities ((55,431) (82,044) 410,538
Finance income 4 441,446 3,578 22,181
Finance expenses 4 ((72,001) (11,231) (413)
Net finance (expense) / income ((30,555) (7,653) 21,768
Profit / (loss) before income tax ((85,986) (89,697) 432,306
Income tax benefit / (expense) 5 222,161 27,804 (135,865)
Profit / (loss) for the year ((63,825) (61,893) 296,441
Other comprehensive income
Items that may be reclassified subsequently to profit or loss:
Net change in the fair value of available-for-sale financial assets, net of transaction costs, impairment and tax 4 66,596
(7,895)
5,726
Foreign currency translation differences for foreign operations 331,620 (597) 554
Total items that may be reclassified subsequently to profit or loss 338,216 (8,492) 6,280
Other comprehensive income / (loss) for the period, net of tax 338,216 (8,492) 6,280
Total comprehensive income / (loss) for the year ((25,609) (70,385) 302,721
Profit / (loss) attributable to:
Owners of Linc Energy Ltd ((63,805) (61,891) 296.455
Non-controlling interest ((20) (2) (14)
Profit / (loss) for the year ((63,825) (61,893) 296,441
Total comprehensive income / (loss) attributable to
Owners of Linc Energy Ltd (26,683) (70,379) 302,757
Non-controlling interest 1,074 (6) (36)
Total comprehensive income / (loss) for the year (25,609) (70,385) 302,721
Earnings per share attributable to the owners of Linc Energy Ltd: Cents Cents Cents
Basic earnings / (loss) per share 24 ((12.40) (12.18) 59.27
Diluted earnings / (loss) per share 24 ((12.40) (12.18) 57.71
The above consolidated statements of profit or loss and other comprehensive income should be read in conjunction with the accompanying notes.
F-3
For
per
sona
l use
onl
y
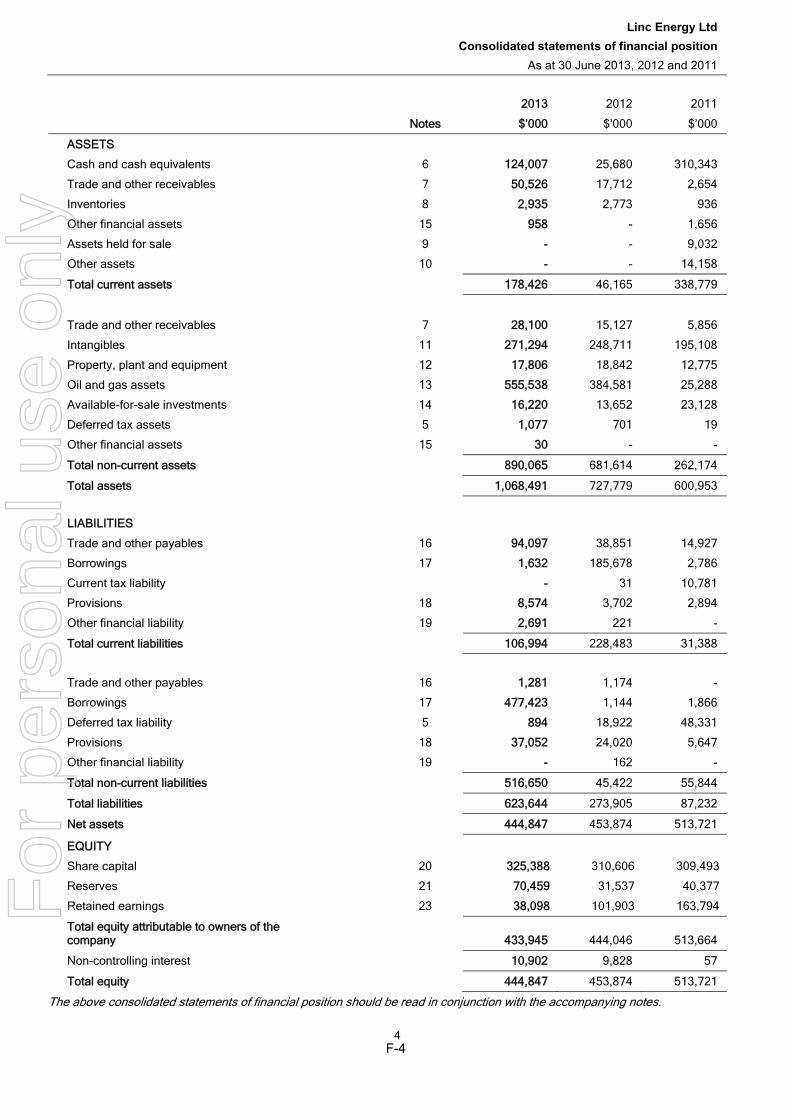
Linc Energy Ltd Consolidated statements of financial position
As at 30 June 2013, 2012 and 2011
4
22013 2012 2011
Notes $’000 $’000 $’000
ASSETS
Cash and cash equivalents 6 1124,007 25,680 310,343
Trade and other receivables 7 550,526 17,712 2,654
Inventories 8 22,935 2,773 936
Other financial assets 15 9958 - 1,656
Assets held for sale 9 -- - 9,032
Other assets 10 -- - 14,158
Total current assets 1178,426 46,165 338,779
Trade and other receivables 7 228,100 15,127 5,856
Intangibles 11 2271,294 248,711 195,108
Property, plant and equipment 12 117,806 18,842 12,775
Oil and gas assets 13 5555,538 384,581 25,288
Available-for-sale investments 14 116,220 13,652 23,128
Deferred tax assets 5 11,077 701 19
Other financial assets 15 330 - -
Total non-current assets 8890,065 681,614 262,174
Total assets 11,068,491 727,779 600,953
LIABILITIES
Trade and other payables 16 994,097 38,851 14,927
Borrowings 17 11,632 185,678 2,786
Current tax liability -- 31 10,781
Provisions 18 88,574 3,702 2,894
Other financial liability 19 22,691 221 -
Total current liabilities 1106,994 228,483 31,388
Trade and other payables 16 11,281 1,174 -
Borrowings 17 4477,423 1,144 1,866
Deferred tax liability 5 8894 18,922 48,331
Provisions 18 337,052 24,020 5,647
Other financial liability 19 -- 162 -
Total non-current liabilities 5516,650 45,422 55,844
Total liabilities 6623,644 273,905 87,232
Net assets 4444,847 453,874 513,721
EQUITY Share capital 20 3325,388 310,606 309,493
Reserves 21 770,459 31,537 40,377
Retained earnings 23 338,098 101,903 163,794
Total equity attributable to owners of the company 433,945 444,046 513,664
Non-controlling interest 110,902 9,828 57
Total equity 4444,847 453,874 513,721
The above consolidated statements of financial position should be read in conjunction with the accompanying notes.
F-4
For
per
sona
l use
onl
y
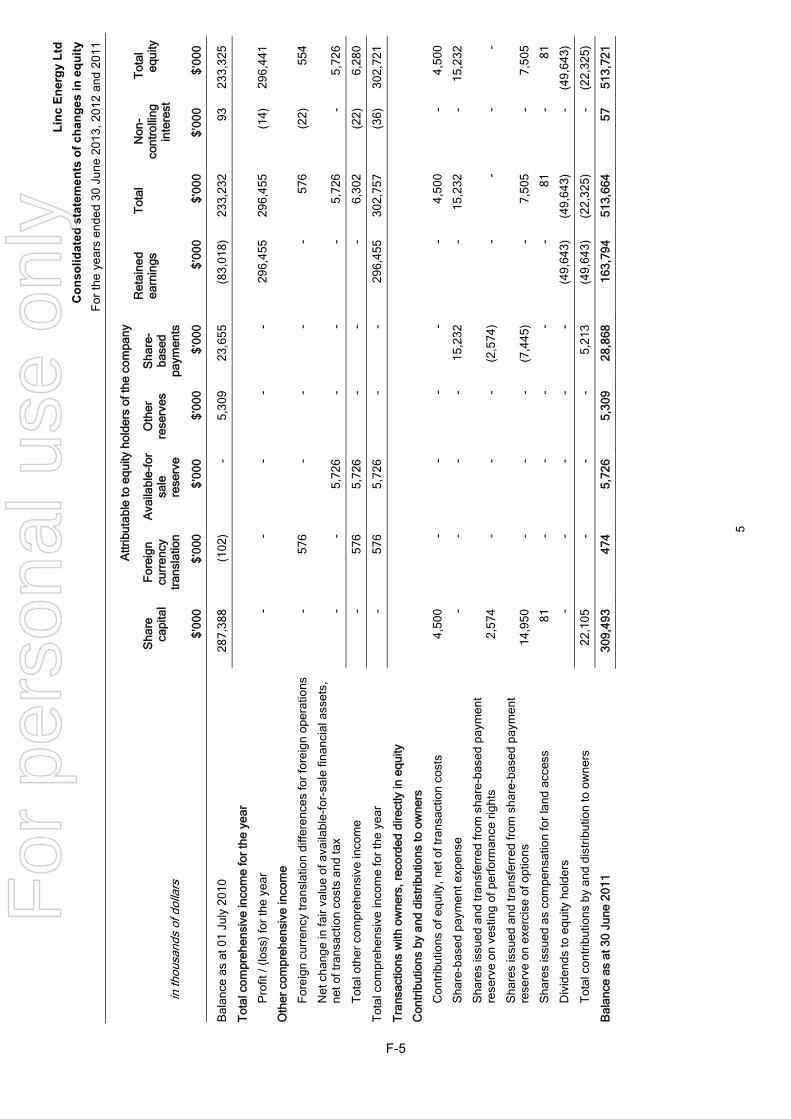
Linc
Ene
rgy
Ltd
Con
solid
ated
sta
tem
ents
of c
hang
es in
equ
ity
For t
he y
ears
end
ed 3
0 Ju
ne 2
013,
201
2 an
d 20
11
5
Attr
ibut
able
to e
quity
hol
ders
of t
he c
ompa
ny
in th
ousa
nds
of d
olla
rs
Sha
re
capi
tal
For
eign
cu
rren
cy
trans
latio
n
Ava
ilabl
e-fo
r sa
le
rese
rve
Oth
er
rese
rves
S
hare
-ba
sed
paym
ents
Ret
aine
d ea
rnin
gs
Tot
al
Non
-co
ntro
lling
in
tere
st
Tot
al
equi
ty
$$’
000
$’00
0 $’
000
$’00
0 $’
000
$’00
0 $’
000
$’00
0 $’
000
Bal
ance
as
at 0
1 Ju
ly 2
010
287,
388
(102
) -
5,30
9 23
,655
(8
3,01
8)
233,
232
93
233,
325
Tot
al c
ompr
ehen
sive
inco
me
for t
he y
ear
Pro
fit /
(loss
) for
the
year
-
- -
- -
296,
455
296,
455
(14)
29
6,44
1
Oth
er c
ompr
ehen
sive
inco
me
For
eign
cur
renc
y tr
ansl
atio
n di
ffere
nces
for f
orei
gn o
pera
tions
-
576
- -
- -
576
(22)
55
4
Net
cha
nge
in fa
ir va
lue
of a
vaila
ble-
for-
sale
fina
ncia
l ass
ets,
ne
t of t
rans
actio
n co
sts
and
tax
- -
5,72
6 -
- -
5,72
6-
5,72
6
Tot
al o
ther
com
preh
ensi
ve in
com
e -
576
5,72
6 -
- -
6,30
2(2
2)
6,28
0
Tot
al c
ompr
ehen
sive
inco
me
for t
he y
ear
- 57
6 5,
726
- -
296,
455
302,
757
(36)
30
2,72
1
Tra
nsac
tions
with
ow
ners
, rec
orde
d di
rect
ly in
equ
ity
Con
tribu
tions
by
and
dist
ribut
ions
to o
wne
rs
Con
trib
utio
ns o
f equ
ity, n
et o
f tra
nsac
tion
cost
s 4,
500
- -
- -
- 4,
500
- 4,
500
Sha
re-b
ased
pay
men
t exp
ense
-
- -
- 15
,232
-
15,2
32-
15,2
32
Sha
res
issu
ed a
nd tr
ansf
erre
d fr
om s
hare
-bas
ed p
aym
ent
rese
rve
on v
estin
g of
per
form
ance
righ
ts
2,57
4 -
- -
(2,5
74)
- -
- -
Sha
res
issu
ed a
nd tr
ansf
erre
d fr
om s
hare
-bas
ed p
aym
ent
rese
rve
on e
xerc
ise
of o
ptio
ns
14,9
50
- -
- (7
,445
) -
7,50
5-
7,50
5
Sha
res
issu
ed a
s co
mpe
nsat
ion
for l
and
acce
ss
81
- -
- -
- 81
- 81
Div
iden
ds to
equ
ity h
olde
rs
- -
- -
- (4
9,64
3)
(49,
643)
- (4
9,64
3)
Tot
al c
ontr
ibut
ions
by
and
dist
ribut
ion
to o
wne
rs
22,1
05
- -
- 5,
213
(49,
643)
(2
2,32
5)-
(22,
325)
Bal
ance
as
at 3
0 Ju
ne 2
011
309,
493
4474
5,72
6 5,
309
228,8
68
1163,
794
5513,
664
57
513,
721
F-5
For
per
sona
l use
onl
y
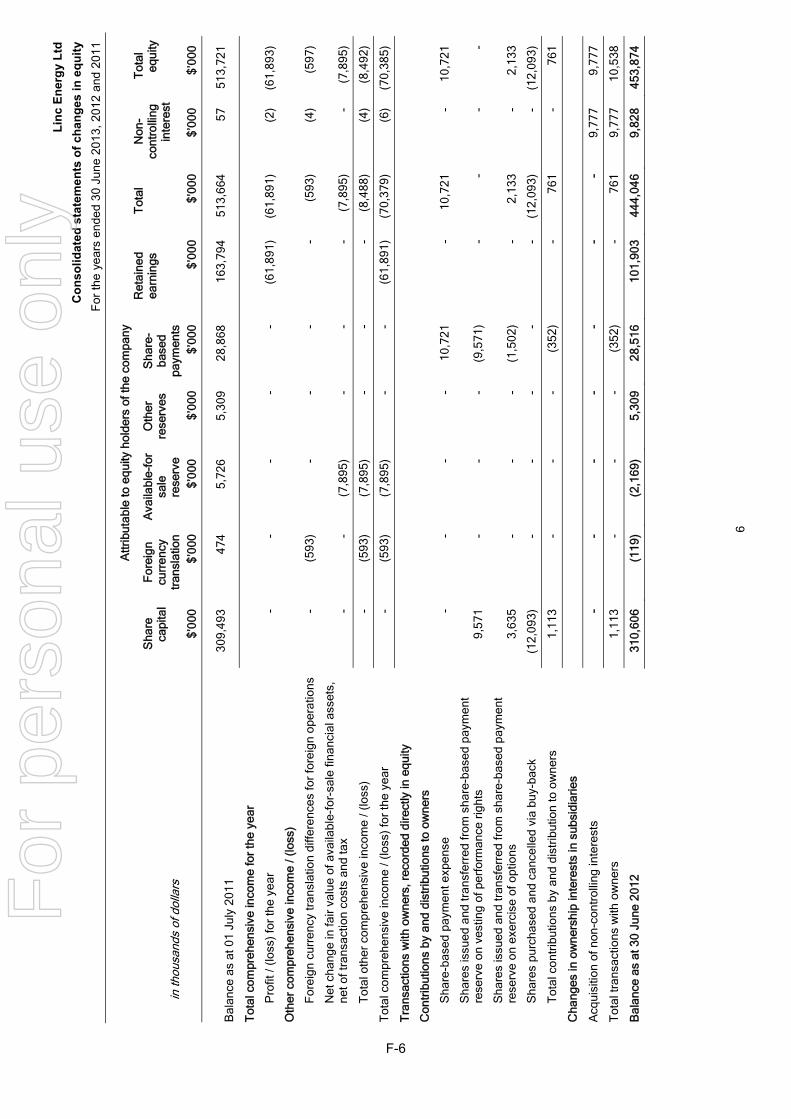
Linc
Ene
rgy
Ltd
Con
solid
ated
sta
tem
ents
of c
hang
es in
equ
ity
For t
he y
ears
end
ed 3
0 Ju
ne 2
013,
201
2 an
d 20
11
6
Attr
ibut
able
to e
quity
hol
ders
of t
he c
ompa
ny
in th
ousa
nds
of d
olla
rs
Sha
re
capi
tal
For
eign
cu
rren
cy
trans
latio
n
Ava
ilabl
e-fo
r sa
le
rese
rve
Oth
er
rese
rves
S
hare
-ba
sed
paym
ents
Ret
aine
d ea
rnin
gs
Tot
al
Non
-co
ntro
lling
in
tere
st
Tot
al
equi
ty
$$’
000
$’00
0 $’
000
$’00
0 $’
000
$’00
0 $’
000
$’00
0 $’
000
Bal
ance
as
at 0
1 Ju
ly 2
011
309,
493
474
5,72
6 5,
309
28,8
68
163,
794
513,
664
57
513,
721
Tot
al c
ompr
ehen
sive
inco
me
for t
he y
ear
Pro
fit /
(loss
) for
the
year
-
- -
- -
(61,
891)
(6
1,89
1)
(2)
(61,
893)
Oth
er c
ompr
ehen
sive
inco
me
/ (lo
ss)
For
eign
cur
renc
y tra
nsla
tion
diffe
renc
es fo
r for
eign
ope
ratio
ns
- (5
93)
- -
- -
(593
)(4
) (5
97)
Net
cha
nge
in fa
ir va
lue
of a
vaila
ble-
for-
sale
fina
ncia
l ass
ets,
ne
t of t
rans
actio
n co
sts
and
tax
- -
(7,8
95)
- -
- (7
,895
)-
(7,8
95)
Tot
al o
ther
com
preh
ensi
ve in
com
e / (
loss
) -
(593
) (7
,895
) -
- -
(8,4
88)
(4)
(8,4
92)
Tot
al c
ompr
ehen
sive
inco
me
/ (lo
ss) f
or th
e ye
ar
- (5
93)
(7,8
95)
- -
(61,
891)
(7
0,37
9)(6
) (7
0,38
5)
Tra
nsac
tions
with
ow
ners
, rec
orde
d di
rect
ly in
equ
ity
Con
tribu
tions
by
and
dist
ribut
ions
to o
wne
rs
Sha
re-b
ased
pay
men
t exp
ense
-
- -
- 10
,721
-
10,7
21-
10,7
21
Sha
res
issu
ed a
nd tr
ansf
erre
d fr
om s
hare
-bas
ed p
aym
ent
rese
rve
on v
estin
g of
per
form
ance
righ
ts
9,57
1 -
- -
(9,5
71)
- -
- -
Sha
res
issu
ed a
nd tr
ansf
erre
d fr
om s
hare
-bas
ed p
aym
ent
rese
rve
on e
xerc
ise
of o
ptio
ns
3,63
5 -
- -
(1,5
02)
- 2,
133
- 2,
133
Sha
res
purc
hase
d an
d ca
ncel
led
via
buy-
back
(1
2,09
3)
- -
- -
- (1
2,09
3)-
(12,
093)
Tot
al c
ontr
ibut
ions
by
and
dist
ribut
ion
to o
wne
rs
1,11
3 -
- -
(352
) -
761
- 76
1
Cha
nges
in o
wne
rshi
p in
tere
sts
in s
ubsi
diar
ies
Acq
uisi
tion
of n
on-c
ontr
ollin
g in
tere
sts
-- -
- -
- -
- 9,
777
9,77
7
Tot
al tr
ansa
ctio
ns w
ith o
wne
rs
1,11
3 -
- -
(352
) -
761
9,77
7 10
,538
Bal
ance
as
at 3
0 Ju
ne 2
012
310,
606
((119
) (2
,169
) 5,
309
228,5
16
1101,
903
4444,
046
9,82
8 45
3,87
4
F-6
For
per
sona
l use
onl
y
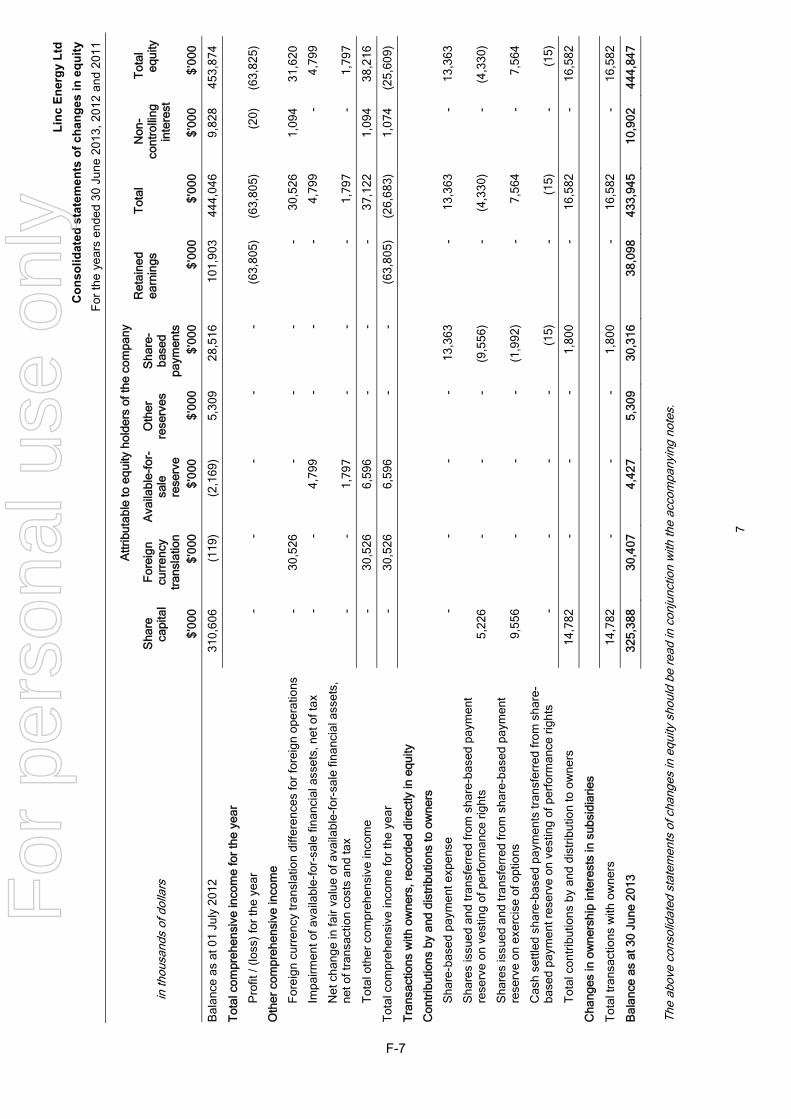
Linc
Ene
rgy
Ltd
Con
solid
ated
sta
tem
ents
of c
hang
es in
equ
ity
For t
he y
ears
end
ed 3
0 Ju
ne 2
013,
201
2 an
d 20
11
7
Attr
ibut
able
to e
quity
hol
ders
of t
he c
ompa
ny
in th
ousa
nds
of d
olla
rs
Sha
re
capi
tal
For
eign
cu
rren
cy
trans
latio
n
Ava
ilabl
e-fo
r-sa
le
rese
rve
Oth
er
rese
rves
S
hare
-ba
sed
paym
ents
Ret
aine
d ea
rnin
gs
Tot
al
Non
-co
ntro
lling
in
tere
st
Tot
al
equi
ty
$$’
000
$’00
0 $’
000
$’00
0 $’
000
$’00
0 $’
000
$’00
0 $’
000
Bal
ance
as
at 0
1 Ju
ly 2
012
310,
606
(119
) (2
,169
) 5,
309
28,5
16
101,
903
444,
046
9,82
8 45
3,87
4
Tot
al c
ompr
ehen
sive
inco
me
for t
he y
ear
Pro
fit /
(loss
) for
the
year
-
- -
- -
(63,
805)
(6
3,80
5)
(20)
(6
3,82
5)
Oth
er c
ompr
ehen
sive
inco
me
For
eign
cur
renc
y tr
ansl
atio
n di
ffere
nces
for f
orei
gn o
pera
tions
-
30,5
26
- -
- -
30,5
261,
094
31,6
20
Impa
irmen
t of a
vaila
ble-
for-
sale
fina
ncia
l ass
ets,
net
of t
ax
- -
4,79
9 -
- -
4,79
9-
4,79
9
Net
cha
nge
in fa
ir va
lue
of a
vaila
ble-
for-
sale
fina
ncia
l ass
ets,
ne
t of t
rans
actio
n co
sts
and
tax
- -
1,79
7 -
- -
1,79
7-
1,79
7
Tot
al o
ther
com
preh
ensi
ve in
com
e -
30,5
26
6,59
6 -
- -
37,1
221,
094
38,2
16
Tot
al c
ompr
ehen
sive
inco
me
for t
he y
ear
- 30
,526
6,
596
- -
(63,
805)
(2
6,68
3)1,
074
(25,
609)
Tra
nsac
tions
with
ow
ners
, rec
orde
d di
rect
ly in
equ
ity
Con
tribu
tions
by
and
dist
ribut
ions
to o
wne
rs
Sha
re-b
ased
pay
men
t exp
ense
-
- -
- 13
,363
-
13,3
63-
13,3
63
Sha
res
issu
ed a
nd tr
ansf
erre
d fr
om s
hare
-bas
ed p
aym
ent
rese
rve
on v
estin
g of
per
form
ance
righ
ts
5,22
6 -
- -
(9,5
56)
- (4
,330
)-
(4,3
30)
Sha
res
issu
ed a
nd tr
ansf
erre
d fr
om s
hare
-bas
ed p
aym
ent
rese
rve
on e
xerc
ise
of o
ptio
ns
9,55
6 -
- -
(1,9
92)
- 7,
564
-
7,
564
Cas
h se
ttled
sha
re-b
ased
pay
men
ts tr
ansf
erre
d fr
om s
hare
-ba
sed
paym
ent r
eser
ve o
n ve
stin
g of
per
form
ance
righ
ts
- -
- -
(15)
-
(15)
- (1
5)
Tot
al c
ontr
ibut
ions
by
and
dist
ribut
ion
to o
wne
rs
14,7
82
- -
- 1,
800
- 16
,582
- 16
,582
Cha
nges
in o
wne
rshi
p in
tere
sts
in s
ubsi
diar
ies
Tot
al tr
ansa
ctio
ns w
ith o
wne
rs
14,7
82
- -
- 1,
800
- 16
,582
- 16
,582
Bal
ance
as
at 3
0 Ju
ne 2
013
325,
388
330,4
07
4,42
7 5,
309
330,3
16
338,0
98
4433,
945
10,9
02
444,
847
The
abov
e co
nsol
idat
ed s
tate
men
ts o
f cha
nges
in e
quity
sho
uld
be re
ad in
con
junc
tion
with
the
acco
mpa
nyin
g no
tes.
F-7
For
per
sona
l use
onl
y
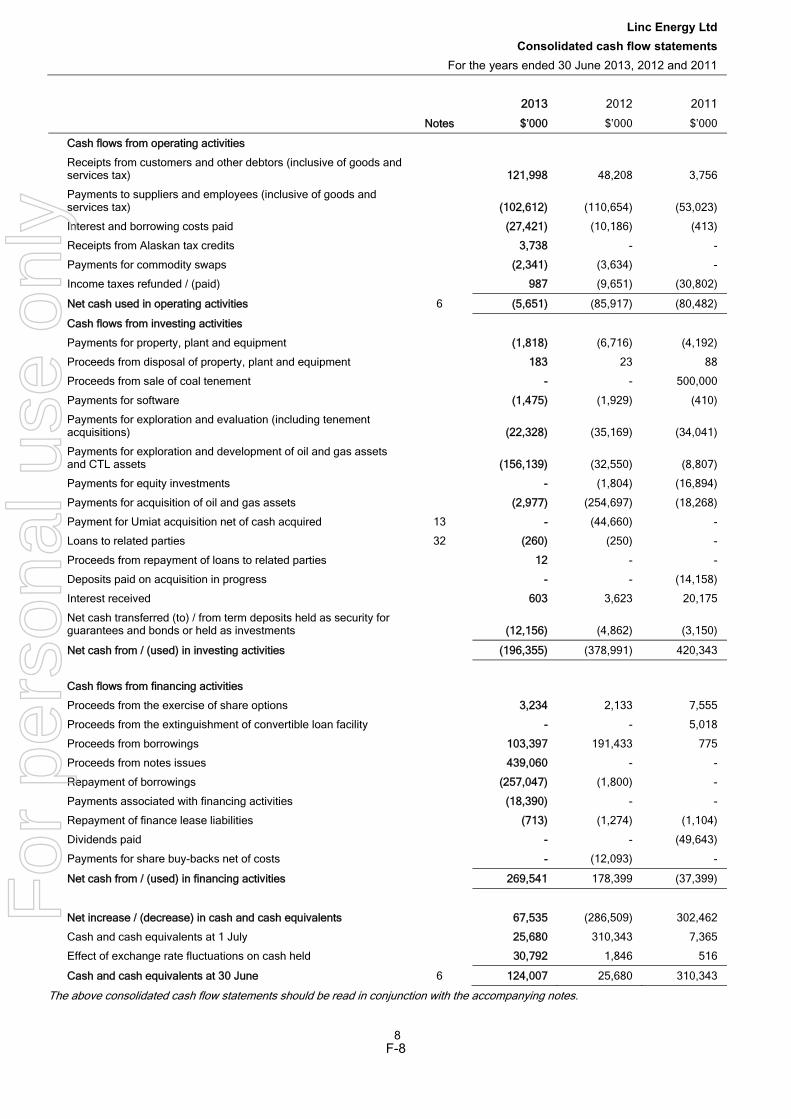
Linc Energy Ltd Consolidated cash flow statements
For the years ended 30 June 2013, 2012 and 2011
8
22013 2012 2011
Notes $’000 $’000 $’000
Cash flows from operating activities
Receipts from customers and other debtors (inclusive of goods and services tax) 1121,998 48,208 3,756
Payments to suppliers and employees (inclusive of goods and services tax) ((102,612) (110,654) (53,023)
Interest and borrowing costs paid ((27,421) (10,186) (413)
Receipts from Alaskan tax credits 33,738 - -
Payments for commodity swaps ((2,341) (3,634) -
Income taxes refunded / (paid) 9987 (9,651) (30,802)
Net cash used in operating activities 6 ((5,651) (85,917) (80,482)
Cash flows from investing activities
Payments for property, plant and equipment ((1,818) (6,716) (4,192)
Proceeds from disposal of property, plant and equipment 1183 23 88
Proceeds from sale of coal tenement -- - 500,000
Payments for software ((1,475) (1,929) (410)
Payments for exploration and evaluation (including tenement acquisitions) ((22,328) (35,169) (34,041)
Payments for exploration and development of oil and gas assets and CTL assets ((156,139) (32,550) (8,807)
Payments for equity investments -- (1,804) (16,894)
Payments for acquisition of oil and gas assets ((2,977) (254,697) (18,268)
Payment for Umiat acquisition net of cash acquired 13 -- (44,660) -
Loans to related parties 32 ((260) (250) -
Proceeds from repayment of loans to related parties 112 - -
Deposits paid on acquisition in progress -- - (14,158)
Interest received 6603 3,623 20,175
Net cash transferred (to) / from term deposits held as security for guarantees and bonds or held as investments ((12,156) (4,862) (3,150)
Net cash from / (used) in investing activities ((196,355) (378,991) 420,343
Cash flows from financing activities
Proceeds from the exercise of share options 33,234 2,133 7,555
Proceeds from the extinguishment of convertible loan facility -- - 5,018
Proceeds from borrowings 1103,397 191,433 775
Proceeds from notes issues 4439,060 - -
Repayment of borrowings ((257,047) (1,800) -
Payments associated with financing activities ((18,390) - -
Repayment of finance lease liabilities ((713) (1,274) (1,104)
Dividends paid -- - (49,643)
Payments for share buy-backs net of costs -- (12,093) -
Net cash from / (used) in financing activities 2269,541 178,399 (37,399)
Net increase / (decrease) in cash and cash equivalents 667,535 (286,509) 302,462
Cash and cash equivalents at 1 July 225,680 310,343 7,365
Effect of exchange rate fluctuations on cash held 330,792 1,846 516
Cash and cash equivalents at 30 June 6 1124,007 25,680 310,343
The above consolidated cash flow statements should be read in conjunction with the accompanying notes.
F-8
For
per
sona
l use
onl
y
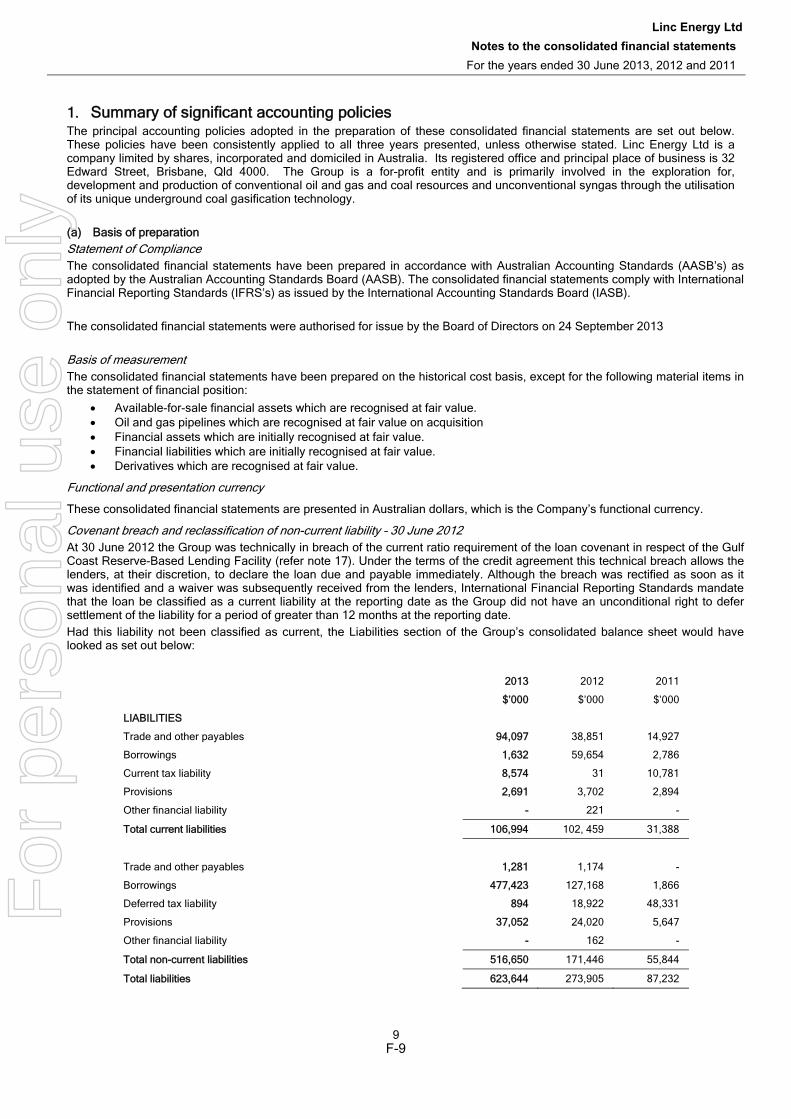
Linc Energy LtdNotes to the consolidated financial statements
For the years ended 30 June 2013, 2012 and 2011
9
1. Summary of significant accounting policies The principal accounting policies adopted in the preparation of these consolidated financial statements are set out below. These policies have been consistently applied to all three years presented, unless otherwise stated. Linc Energy Ltd is a company limited by shares, incorporated and domiciled in Australia. Its registered office and principal place of business is 32 Edward Street, Brisbane, Qld 4000. The Group is a for-profit entity and is primarily involved in the exploration for, development and production of conventional oil and gas and coal resources and unconventional syngas through the utilisation of its unique underground coal gasification technology.
(a) Basis of preparation Statement of Compliance The consolidated financial statements have been prepared in accordance with Australian Accounting Standards (AASB’s) as adopted by the Australian Accounting Standards Board (AASB). The consolidated financial statements comply with International Financial Reporting Standards (IFRS’s) as issued by the International Accounting Standards Board (IASB). The consolidated financial statements were authorised for issue by the Board of Directors on 24 September 2013 Basis of measurement The consolidated financial statements have been prepared on the historical cost basis, except for the following material items in the statement of financial position:
Available-for-sale financial assets which are recognised at fair value. Oil and gas pipelines which are recognised at fair value on acquisition Financial assets which are initially recognised at fair value. Financial liabilities which are initially recognised at fair value. Derivatives which are recognised at fair value.
Functional and presentation currency
These consolidated financial statements are presented in Australian dollars, which is the Company’s functional currency.
Covenant breach and reclassification of non-current liability – 30 June 2012 At 30 June 2012 the Group was technically in breach of the current ratio requirement of the loan covenant in respect of the Gulf Coast Reserve-Based Lending Facility (refer note 17). Under the terms of the credit agreement this technical breach allows the lenders, at their discretion, to declare the loan due and payable immediately. Although the breach was rectified as soon as it was identified and a waiver was subsequently received from the lenders, International Financial Reporting Standards mandate that the loan be classified as a current liability at the reporting date as the Group did not have an unconditional right to defer settlement of the liability for a period of greater than 12 months at the reporting date. Had this liability not been classified as current, the Liabilities section of the Group’s consolidated balance sheet would have looked as set out below:
2013 2012 2011
$’000 $’000 $’000
LIABILITIES
Trade and other payables 994,097 38,851 14,927
Borrowings 11,632 59,654 2,786
Current tax liability 88,574 31 10,781
Provisions 22,691 3,702 2,894
Other financial liability -- 221 -
Total current liabilities 106,994 102, 459 31,388
Trade and other payables 1,281 1,174 -
Borrowings 4477,423 127,168 1,866
Deferred tax liability 8894 18,922 48,331
Provisions 337,052 24,020 5,647
Other financial liability - 162 -
Total non-current liabilities 516,650 171,446 55,844
Total liabilities 623,644 273,905 87,232
F-9
For
per
sona
l use
onl
y
Linc Energy LtdNotes to the consolidated financial statements
For the years ended 30 June 2013, 2012 and 2011
10
1. Summary of significant accounting policies (continued) Basis of preparation
The consolidated financial statements have been prepared on the going concern basis which assumes the continuity of normal business activities and the realisation of assets and the settlement of liabilities in the ordinary course of business.
The Directors are confident that there is significant flexibility and levers available to Linc management to ensure that cash balances will be maintained positively for at least 12 months. The flexibility to manage this position could be via one or a combination of the following, if necessary:-
drawing on existing cash balances, partial use of cash flows from the Gulf Coast oil assets, ongoing commercial negotiations for the divestment of non-core assets, entry into joint venture arrangements for a combination of cash and/or carry of costs potential commercial UCG agreements, the potential capacity to raise further funds the ability of the Group to reduce discretionary project expenditure and overheads
In summary, the Directors are satisfied that the use of the going concern assumption is appropriate in the preparation of the consolidated financial statements at 30 June 2013, 30 June 2012 and 30 June 2011.
Should the above flexibility and levers not be subsequently available to the group, the use of the going concern assumption may not be appropriate, and material adjustments may be necessary to the carrying amount and/or classification of asset or liabilities within this financial report.
Rounding of amounts
Amounts in these consolidated financial statements have been rounded off to the nearest thousand dollars, or in certain cases, the nearest dollar.
Use of estimates and judgements The preparation of the consolidated financial statements in conformity with IFRS requires management to make judgements, estimates and assumptions that affect the application of accounting policies and the reported amounts of assets, liabilities, income and expenses. Actual results may differ from these estimates. Estimates and underlying assumptions are reviewed on an ongoing basis. Revisions to accounting estimates are recognised in the period in which the estimates are revised and in any future periods affected. Information about critical judgements in applying accounting policies that have the most significant effect on the amounts recognised in the consolidated financial statements is included in the following notes:
Note 5 - Income tax Note 11 – Intangibles, including carrying value of goodwill, coal-to-liquids technology development costs and exploration and evaluation costs Note 13 – Oil and gas assets, including classification of assets and recoverability of assets Note 17 – Borrowings, determination of fair value of embedded derivatives Note 18 – Provisions Note 28 – Contingent assets and liabilities
The areas involving a higher degree of judgement or complexity, or areas where assumptions and estimates are significant to the financial statements are disclosed in note 1(bb). Accounting policies Presentation of transactions recognised in other comprehensive income The Group has early adopted amendments to AASB 101 Presentation of Financial Statements outlined in AASB 2011-9 Amendments to Australian Accounting Standards – Presentation of Items of Other Comprehensive Income / Amendments to IAS1 Presentation of Items of Other Comprehensive Income from 1 July 2010. The change in accounting policy only relates to disclosures and has had no impact on consolidated earnings per share or net income. The changes have been applied retrospectively and require the Group to separately present these items of other comprehensive income that may be reclassified to profit or loss in the future from these that will never be reclassified to profit or loss. These changes are included in the statement of comprehensive income.
F-10
For
per
sona
l use
onl
y
Linc Energy LtdNotes to the consolidated financial statements
For the years ended 30 June 2013, 2012 and 2011
11
1. Summary of significant accounting policies (continued)
Basis of consolidation Business combinations Business combinations are accounted for using the acquisition method as at the acquisition date, which is the date on which control is transferred to the Group. Control is the power to govern the financial and operating policies of an entity so as to obtain benefits from its activities. In assessing control, the Group takes into consideration potential voting rights that currently are exercisable. The acquisition date is the date on which control is transferred to the acquirer. Judgement is applied in determining the acquisition date and determining whether control is transferred from one party to another. The Group measures goodwill at acquisition date as the fair value of the consideration transferred including the recognised amount of any non-controlling interest in the acquiree, less the net recognised amount (generally fair value) of the identifiable assets acquired and liabilities assumed, all measured as of the acquisition date. Consideration transferred includes the fair values of the assets transferred, liabilities incurred by the Group to the previous owners of the acquiree, and equity interests issued by the Group. Consideration transferred also includes the fair value of any contingent consideration and share-based payment awards of the acquiree that are replaced mandatorily in the business combination. The Group recognises a bargain purchase gain in the statement of comprehensive income if the cost of an acquisition is less than the Group’s share of the net fair value of the identifiable net assets acquired. Transaction costs that the Group incurs in connection with a business combination, such as finder’s fees, legal fees, due diligence fees, and other professional and consulting fees, are expensed as incurred. A contingent liability of the acquiree is assumed in a business combination only if such a liability represents a present obligation and arises from a past event, and its fair value can be measured reliably. Non-controlling interest Acquisitions of non-controlling interests are accounted for as transactions with owners in their capacity as owners and therefore no goodwill is recognised. The Group measures any non-controlling interest at its proportionate interest in the identifiable net assets of the acquiree. Subsidiaries Subsidiaries are entities controlled by the Group. The financial statements of subsidiaries are included in the consolidated financial statements from the date that control commences until the date that control ceases. The accounting policies of subsidiaries have been changed when necessary to align them with the policies adopted by the Group. Transactions eliminated on consolidation Intra-group balances and transactions, and any unrealised income and expenses arising from intra-group transactions with the exception of unrealised foreign exchange gains or losses on intercompany receivables and payables, are eliminated in preparing the consolidated financial statements. (b) Revenue recognition Revenue is measured at the fair value of the consideration received or receivable. Amounts disclosed as revenue are net of returns, trade allowances and amounts collected on behalf of third parties. Revenue is recognised for the major business activities as follows: Gas sales revenue The Group has entered into a gas sales contract with its customer containing a take or pay arrangement. Revenue from the sale of gas is recognised when the gas is delivered to the customer. If the contracted minimum volume of gas is not taken, the customer must pay for the minimum contracted volume. Oil sales revenue Revenue is recognised when the significant risks and rewards of ownership of the goods have passed to the buyer and can be measured reliably. Risks and rewards are considered passed to the buyer at the time of physical delivery of the goods to the customer. Revenue from oil sales is recognised on the basis of the Group’s net interest in a producing field. Consulting services revenue Revenue from consulting services is recognised in the accounting period in which the services are rendered. For fixed price contracts, revenue is measured under the percentage of completion method, based on actual milestones met under the contract conditions as a proportion of the total services to be provided. Rental income Rental income from the lease of the Group’s Coil Tubing Unit drilling rig is recognised in profit or loss on a straight line basis over the term of the lease.
F-11
For
per
sona
l use
onl
y
Linc Energy LtdNotes to the consolidated financial statements
For the years ended 30 June 2013, 2012 and 2011
12
1. Summary of significant accounting policies (continued) (c) Finance income and finance expenses Finance income comprises interest income on bank accounts and term deposit and gains on derivative financial instruments. Interest income is recognised as it accrues in profit and loss, using the effective interest method. Finance expenses comprise of interest expense on borrowings, borrowing costs, losses on derivative financial instruments, impairment losses recognised on available-for-sale investments and unwinding of discounts. All borrowing costs are recognised in profit and loss using the effective interest method. (d) Income tax The income tax benefit/expense comprises current and deferred tax. Current and deferred tax is recognised in profit or loss except to the extent that it relates to a business combination, or items recognised directly in equity or in other comprehensive income. Current tax is the expected tax payable or receivable on the taxable income or loss for the year, using tax rates enacted or substantively enacted at the reporting date, and any adjustment to tax payable in respect of previous years. Current tax payable also includes any tax liability arising from the declaration of dividends. Deferred tax is recognised in respect of temporary differences between the carrying amounts of assets and liabilities for financial reporting purposes and the amounts used for taxation purposes. Deferred tax is not recognised for the following temporary differences: the initial recognition of assets or liabilities in a transaction that is not a business combination and that affects neither accounting nor taxable profit or loss, differences relating to investments in subsidiaries and associates and jointly controlled entities to the extent that it is probable that they will not reverse in the foreseeable future and difference arising on the initial recognition of goodwill. The measurement of deferred tax reflects the tax consequences that would follow the manner in which the Group expects, at the end of the reporting period, to recover or settle the carrying amount of its and assets and liabilities. Deferred tax is measured at the tax rates that are expected to be applied to temporary differences when they reverse, using tax rates enacted or substantively enacted at the reporting date. Deferred tax assets and liabilities are offset if there is a legally enforceable right to offset current tax liabilities and assets, and they relate to income taxes levied by the same tax authority on the same taxable entity, or on different tax entities, but they intend to settle current tax liabilities and assets on a net basis or their tax assets and liabilities will be realised simultaneously. A deferred tax asset is recognised for unused tax losses, tax credits and deductible temporary differences, to the extent that it is probable that future taxable profits will be available against which they can be utilised. Deferred tax assets are reviewed at each reporting date and are reduced to the extent that it is no longer probable that the related tax benefit will be realised. Additional income tax expenses that arise from the distribution of cash dividends are recognised at the same time that the liability to pay the related dividend is recognised. The Group does not distribute non-cash assets as dividends to its shareholders. In determining the amount of current and deferred tax the group takes into account the impact of uncertain tax positions and whether additional taxes and interest may be due. The assessment relies on estimates and assumptions and may involve a series of judgements about future events. New information may become available that causes the Group to change its judgement regarding the adequacy of existing tax liabilities; such changes to tax liabilities will impact tax expense in the period that such a determination is made. The Company and its wholly owned Australian resident entities are part of a tax consolidated group. As a consequence, all members of the tax consolidated group are treated as a single entity. The head entity within the tax-consolidated group is Linc Energy Ltd.
The Company, in conjunction with other members of the tax-consolidated group, has entered into a tax funding arrangement to set out the funding obligations of members of the tax-consolidated group in respect of tax amounts. The tax funding arrangements require payments to/from the head entity equal to the current tax liability/(asset) assumed by the head entity and any tax-loss deferred tax assets assumed by the head entity , resulting in the Company recognising an inter-entity payable / (receivable) equal in amount to the tax liability / (asset) assumed. The inter-entity payable / (receivable) is at call. Contributions to fund the current tax liabilities are payable as per the tax funding arrangement and reflect the timing of the head entity’s obligation to make payment for tax liabilities to the relevant tax authorities.
The Company, in conjunction with other members of the tax-consolidated group, has also entered into a tax sharing agreement. The tax sharing agreement provides for the determination of the allocation of income tax liabilities between the entities should the head entity default on its tax payment obligations. No amounts have been recognised in the financial statements in respect of this agreement as payment of any amounts under the tax sharing agreement is considered remote.
F-12
For
per
sona
l use
onl
y
Linc Energy LtdNotes to the consolidated financial statements
For the years ended 30 June 2013, 2012 and 2011
13
1. Summary of significant accounting policies (continued) (e) Earnings per share Basic earnings per share Basic earnings per share is calculated by dividing the profit attributable to equity holders of the Company by the weighted average number of ordinary shares outstanding during the financial year. Diluted earnings per share Diluted earnings per share adjusts the figures used in the determination of basic earnings per share to take into account the after income tax effect of interest and other financing costs associated with dilutive potential ordinary shares and the weighted average number of shares assumed to have been issued for no consideration in relation to dilutive potential ordinary shares. (f) Cash and cash equivalents Cash and cash equivalents includes cash on hand, deposits held at call with financial institutions and other short-term, highly liquid investments with original maturities of three months or less that are readily convertible to known amounts of cash and which are subject to an insignificant risk of changes in value. (g) Trade and other receivables Trade and other receivables are recognised initially at fair value and subsequently measured at amortised cost, less provision for doubtful debts. Trade receivables are due for settlement generally within 30-90 day terms. Collectability of trade receivables is reviewed on an ongoing basis. Debts which are known to be uncollectible are written off. A provision for doubtful receivables is established when there is objective evidence amounts will not be able to be collected according to the original terms of receivables. The amount of the provision is the difference between the asset’s carrying amount and the present value of estimated future cash flows, discounted at the original effective interest rate. Cash flows relating to short-term receivables are not discounted if the effect of discounting is immaterial. The amount of the provision is recognised in the statement of comprehensive income. Government grants in relation to capital expenditures and investments are recognised initially as an adjustment to the cost of the assets when there is reasonable assurance that they will be received and that the Group will comply with the conditions associated with the grant. (h) Inventories Oil, raw materials and stores Oil in tanks, raw materials and stores are stated at the lower of cost and net realisable value. The cost of inventories is based on the first-in first-out principle, and includes expenditure incurred in acquiring the inventories, production or conversion costs and other costs incurred in bringing them to their existing location and condition. Net realisable value is the estimated selling price in the ordinary course of business, less the estimated costs of completion and selling expenses. (i) Assets held for sale Non-current assets are classified as held for sale if their carrying amount will be recovered principally through a sale transaction rather than through continuing use within the next twelve months. They are measured at the lower of their carrying amount and fair value less costs to sell. These assets are not depreciated but are tested annually for impairment or more frequently if events or changes in circumstances indicate that they might be impaired. (j) Intangibles Coal-to-liquids development costs Costs incurred on coal-to-liquids development projects (relating to the design and testing of the Group’s coal-to-liquids technology) are recognised as intangible assets when it is probable that the project will, after considering its commercial and technical feasibility, be completed and generate future economic benefits and its costs can be measured reliably. The expenditure capitalised comprises all directly attributable costs, including costs of materials, services, direct labour and an appropriate proportion of overheads. Other development expenditures that do not meet these criteria are recognised as an expense as incurred. Development costs previously recognised as an expense are not recognised as an asset in a subsequent period. Capitalised development costs are recorded as intangible assets and amortised from the point at which the asset is ready for use on a straight-line basis over its useful life. The useful life of capitalised coal-to-liquids development costs for the year ended 30 June 2011 was between two and five years with an average of three years remaining on the majority of assets. Following the successful commissioning and operation of Gasifier 5, which is considered to be the basis of Linc’s commercial UCG technology, and in conjunction with business development activities including commercial projects, a review of the coal-to-liquids intangible asset resulted in a reassessment of the components of the asset and an extension of their useful lives during the year ended 30 June 2012. The components of the coal-to-liquid intangible asset were been componentised into UCG technology with a 10 year useful life and the GTL technology which will be amortised once ready for use. The effect of this change resulted in a decrease in amortisation expense of $7,000,000 in the consolidated statement of comprehensive income during the year ended 30 June 2012.
F-13
For
per
sona
l use
onl
y
Linc Energy LtdNotes to the consolidated financial statements
For the years ended 30 June 2013, 2012 and 2011
14
1. Summary of significant accounting policies (continued)
(i) Intangibles (continued) Exploration and evaluation Exploration and evaluation expenditure incurred is either written off as incurred or accumulated in respect of each identifiable area of interest. Costs are only carried forward to the extent that they are expected to be recouped through the successful development of the area, sale of the respective areas of interest or where activities in the area have not yet reached a stage which permits reasonable assessment of the existence of economically recoverable reserves and the Group continues to hold the rights to the tenement. Accumulated costs in relation to an abandoned area are written off in full to the statement of comprehensive income in the year in which the decision to abandon the area is made. When production commences, the accumulated costs for the relevant area of interest are tested for impairment and transferred to development costs or to oil and gas properties depending on the nature of the resource and amortised over the life of the area of interest according to the rate of depletion of the economically recoverable reserves. A regular review is undertaken of each area of interest to determine the appropriateness of continuing to carry forward costs in relation to that area of interest. Restoration, rehabilitation and environmental costs necessitated by exploration and evaluation activities are expensed as incurred and treated as exploration and evaluation expenditure (see note 1(t)).
Goodwill
Goodwill represents the excess of the cost of an acquisition over the fair value of the Group’s share of the net identifiable assets of the acquired subsidiary at the date of acquisition. Goodwill on acquisitions of subsidiaries is included in intangible assets. Goodwill is not amortised. Instead, goodwill is tested for impairment annually or more frequently if events or changes in circumstances indicate that it might be impaired and is carried at cost less accumulated impairment losses. Gains and losses on the disposal of an entity include the carrying amount of goodwill relating to the entity sold.
Goodwill is allocated to cash-generating units for the purpose of impairment testing. Each of those cash-generating units represents the Group’s investment in each country of operation by each primary reporting segment. (j) Research and development expenditure The Group classifies the entire coal-to-liquids demonstration facility (pilot plant) and ongoing technology development at the site as research and development expenditure. Costs incurred in constructing the Group’s coal-to-liquids demonstration facility have been capitalised and included within intangibles in the statement of financial position (refer note 1(j)). Costs that do not meet the recognition criteria of an intangible asset have been recognised in the statement of comprehensive income. (k) Property, plant and equipment Items of property, plant and equipment are stated at historical cost less accumulated depreciation. Historical cost includes expenditure that is directly attributable to the acquisition of the items. Subsequent costs are included in the asset’s carrying amount or recognised as a separate asset, as appropriate, only when it is probable that future economic benefits associated with the item will flow to the Group and the cost of the item can be measured reliably. All other repairs and maintenance are charged to the statement of comprehensive income during the financial period in which they are incurred. Land is not depreciated. Depreciation on other assets is calculated using the diminishing value method to allocate their cost or re-valued amounts, net of their residual values, over their estimated useful lives, as follows:
Buildings 40 years
Motor vehicles 5 years
Office equipment and furniture 2 to 5 years
Plant and equipment 5 years
The assets’ residual values and useful lives are reviewed, and adjusted if appropriate, at each reporting date. An asset’s carrying amount is written down immediately to its recoverable amount if the asset’s carrying amount is greater than its estimated recoverable amount (note 1(n)). Gains and losses on disposals are determined by comparing proceeds with carrying amount. These are included in the statement of comprehensive income.
F-14
For
per
sona
l use
onl
y
Linc Energy LtdNotes to the consolidated financial statements
For the years ended 30 June 2013, 2012 and 2011
15
1. Summary of significant accounting policies (continued) (l) Oil and gas assets Oil and gas assets include the initial cost of acquisition, together with the cost of construction, installation or completion of infrastructure facilities such as pipelines or processing plants, transferred exploration and evaluation costs, and the cost of development wells. Subsequent costs are included in the asset’s carrying amount or recognised as a separate asset, as appropriate, only when it is probable that future economic benefits associated with the item will flow to the Group and the cost of the item can be measured reliably. All other repairs and maintenance are charged to the statement of comprehensive income during the financial period in which they are incurred. Oil and gas assets other than land are depreciated to their residual values on a unit of production basis over the economically recoverable proved and probable hydrocarbon reserves. The assets’ residual values and useful lives are reviewed, and adjusted if appropriate, at each reporting date. An asset’s carrying amount is written down immediately to its recoverable amount if the asset’s carrying amount is greater than its estimated recoverable amount (note 1(n)). Gains and losses on disposals are determined by comparing proceeds with carrying amount. These are included in the statement of comprehensive income. (m) Impairment of assets Goodwill and intangible assets that have an indefinite useful life are not subject to amortisation but are tested annually for impairment or more frequently if events or changes in circumstances indicate that they might be impaired. Other assets are reviewed for impairment whenever events or changes in circumstances indicate that the carrying amount may not be recoverable. An impairment loss is recognised for the amount by which the asset’s carrying amount exceeds its recoverable amount. The recoverable amount is the higher of an asset’s fair value less costs to sell and value in use. For the purposes of assessing impairment, assets are grouped at the lowest levels for which there are separately identifiable cash inflows which are largely independent of the cash inflows from other assets or groups of assets (cash-generating units). In relation to oil and gas assets, SAPEX, and coal segments, these are all assessed on an area of interest basis. The clean energy segment is assessed on a cash-generating basis. Non-financial assets other than goodwill that have previously suffered impairment are reviewed for possible reversal at each reporting date. (n) Available-for-sale assets Available-for-sale financial assets are non-derivative financial assets that are designated as available-for-sale. The Group’s investments in equity securities are classified as available-for-sale financial assets and recognised at fair value which is determined by reference to the stock exchange closing share price at reporting date. Subsequent to initial recognition, changes in fair value, other than impairment losses, are recognised in other comprehensive income and presented within equity in the available-for-sale reserve. When an investment is disposed of or impaired, the cumulative gain or loss in equity is transferred to profit and loss. (o) Trade and other payables These amounts represent liabilities for goods and services provided to the Group prior to the end of financial year which are unpaid. The amounts are unsecured and are usually paid within 30 days of recognition. (p) Borrowings Borrowings are initially recognised at fair value, net of transaction costs incurred. Borrowings are subsequently measured at amortised cost. Any difference between the proceeds (net of transaction costs) and the redemption amount is recognised in the statement of comprehensive income over the period of the borrowings using the effective interest method. Fees paid on the establishment of loan facilities, which are incremental costs relating to the facility, are offset against the liability and amortised on an effective interest basis over the term of the facility.
(q) Compound financial instruments Compound financial instruments issued by the Group comprise of convertible notes that can be converted to share capital at the option of the holder. The Group can settle the conversion by making a cash payment to the note holder or settle by the issue of shares. The liability component of the note is initially recognised at fair value and subsequently recognised at amortised cost using the effective interest rate method. The embedded derivative component is initially measured at fair value and subsequently measured at fair value through profit or loss at the end of each reporting period. Both the note liability and embedded derivative component are recognised as a part of borrowings in the statement of financial position.
(r) Derivative financial instruments
The Group uses derivative financial instruments to hedge its exposure to commodity price risk and foreign currency risk. The principal derivatives used are commodity oil price swap agreements and put and call options.
The Group records all derivative instruments as either assets or liabilities at fair value. The Group has not elected to designate its derivative instruments in a hedge relationship and, therefore, recognises all changes in fair value of its derivative financial instruments immediately through finance expenses in profit and loss.
F-15
For
per
sona
l use
onl
y
Linc Energy LtdNotes to the consolidated financial statements
For the years ended 30 June 2013, 2012 and 2011
16
1. Summary of significant accounting policies (continued) (s) Provisions Provisions are recognised when the Group has a present legal or constructive obligation as a result of past events and it is probable that an outflow of resources will be required to settle the obligation and the amount has been reliably estimated. Provisions are not recognised for future operating losses. Where there are a number of similar obligations, the likelihood that an outflow will be required in settlement is determined by considering the class of obligations as a whole. A provision is recognised even if the likelihood of an outflow with respect to any one item included in the same class of obligations may be small. If the effect is material, provisions are measured at the present value of management’s best estimate of the expenditure required to settle the present obligation at the end of the reporting period. The discount rate used to determine the present value reflects current market assessments of the time value of money and the risks specific to the liability. The increase in the provision due to the passage of time is recognised as finance expense. Site restoration and rehabilitation In accordance with its environmental obligations the Group recognises a provision for the cost of decommissioning its coal-to-liquids demonstration facility, rehabilitating its exploration drill holes and decommissioning and rehabilitating its oil and gas wells, pipelines and processing infrastructure. A provision for decommissioning and/or restoration and the related expense is recognised when an area is disturbed as a result of the Group’s activities. A provision for rehabilitation and the related expense is recognised when a drilling program is completed. Increases in decommissioning and rehabilitation provisions in respect of oil and gas activities are capitalised to oil & gas assets and amortised using the units of production basis over the economically recoverable reserves in the relevant area. (t) Leases Leases in which the Group assumes substantially all the risks and rewards of ownership are classified as finance leases. Finance leases are capitalised at the lease’s inception at the lower of the fair value and the present value of the minimum lease payments. The corresponding rental obligations, net of finance charges, are included in borrowings. Each lease payment is allocated between the liability and finance cost. The finance cost is charged to the statement of comprehensive income over the lease period so as to produce a constant periodic rate of interest on the remaining balance of the liability for each period. The property, plant and equipment acquired under finance leases is depreciated over the shorter of the asset’s useful life and the lease term. Leases in which a significant portion of the risks and rewards of ownership are retained by the lessor are classified as operating leases. Payments made under operating leases (net of any incentives received from the lessor) are charged to the statement of comprehensive income on a straight-line basis over the period of the lease. (u) Employee benefits Share-based payments Share-based compensation benefits are provided to employees via the Group’s Performance Rights Plan and the previous Employee Option Plan. Information relating to these schemes is set out in note 31. The fair value of rights granted under the Performance Rights Plan and options granted under the Employee Option Plan are recognised as an employee benefit expense with a corresponding increase in equity. The fair value is measured at grant date and recognised over the period during which the employees become unconditionally entitled to the options (the “vesting period”). The fair value at grant date for performance rights is calculated based on the closing share price of Linc Energy Ltd on grant date. The fair value at grant date for options is independently determined using a Black-Scholes option pricing model that takes into account the exercise price, the term of the option, the impact of the dilution, the share price at grant date and expected price volatility of the underlying share, the expected dividend yield and the risk free interest rate for the term of the option. The fair value of the options granted excludes the impact of any non-market vesting conditions, as these are included in assumptions about the number of options that are expected to become exercisable. At each reporting date the entity revises its estimate of the number of options that are expected to become exercisable. The employee benefit expense recognised each period takes into account the most recent estimate. Wages and salaries, annual leave and sick leave Liabilities for wages and salaries, including non-monetary benefits, annual leave and accumulating sick leave expected to be settled within twelve months of the reporting date are recognised in other payables or provisions in respect of employees' services up to the reporting date and are measured at the amounts expected to be paid when the liabilities are settled.
F-16
For
per
sona
l use
onl
y
Linc Energy LtdNotes to the consolidated financial statements
For the years ended 30 June 2013, 2012 and 2011
17
1. Summary of significant accounting policies (continued) (u) Employee benefits (continued) Retirement benefit obligations The Group contributes to defined contribution superannuation plans for all employees in accordance with relevant legislation. The Group makes fixed contributions at the current rate of nine per cent of gross salary and the Group’s obligations are limited to these contributions. Contributions are recognised as an expense as they become payable. Long service leave The liability for long service leave is recognised in the provision for employee benefits and measured as the present value of expected future payments to be made in respect of services provided by employees up to the reporting date using the projected unit credit method. Consideration is given to future expected wage and salary levels, experience of employee departures and periods of service. Expected future payments are discounted using market yields at the reporting date on national government bonds with terms to maturity that match the estimated future cash outflows. (v) Non-employee share based payments The Group has granted shares and share options to suppliers as compensation for the provision of services and finance facilities or for access to private property for exploration drilling. Information relating to these grants is set out in note 31. The fair value of options granted to suppliers is recognised as an expense or, where appropriate, is capitalised in accordance with the Group’s capitalisation policy with a corresponding increase in equity. The fair value is measured at grant date and recognised over the period during which the services are rendered or when the supplier becomes unconditionally entitled to the options (the “vesting period”). The fair value at grant date is determined using a Black-Scholes option pricing model that takes into account the exercise price, the term of the option, the share price at grant date and expected price volatility of the underlying share, the expected dividend yield and the risk free interest rate for the term of the option. (w) Share capital Ordinary shares are classified as equity. Incremental costs directly attributable to the issue of new shares or options are shown in equity as a deduction. When share capital recognised as equity is repurchased, the amount of consideration paid, including directly attributable costs, net of any tax effects is recognised as a deduction in equity. Dividends are recognised as a liability in the period in which they are declared. (x) Foreign currency translation
Transactions and balances
Foreign currency transactions are translated into the functional currency using the exchange rates prevailing at the dates of the transaction. Foreign exchange gains and losses resulting from the settlement of such transactions and from the translation at year-end exchange rates of monetary assets and liabilities denominated in foreign currencies are recognised in the statement of comprehensive income.
Foreign exchange gains and losses that relate to borrowings are presented in the profit or loss within finance costs. All other foreign exchange gains and losses are presented in the profit or loss on a net basis within other income or administration and corporate expenses.
Group companies
The results and financial position of all Group entities that have a functional currency different from the presentation currency are translated into the presentation currency as follows:
Assets and liabilities are translated at the closing rate at the date of the Statement of Financial Position
Income and expenses are translated at the exchange rate at the date of the transaction (or an average annual rate where not materially different), and
All resulting exchange differences are recognised as a separate component of equity.
(y) Goods and Services Tax (GST) Revenues, expenses and assets are recognised net of the amount of associated GST, unless the GST incurred is not recoverable from the taxation authority. In this case it is recognised as part of the cost of acquisition of the asset or as part of the expense. Receivables and payables are stated inclusive of the amount of GST receivable or payable. The net amount of GST recoverable from, or payable to, the taxation authority is included with other receivables or payables in the balance sheet. Cash flows are presented on a gross basis. The GST components of cash flows arising from investing or financing activities which are recoverable from, or payable to the taxation authority, are presented as operating cash flows.
F-17
For
per
sona
l use
onl
y
Linc Energy LtdNotes to the consolidated financial statements
For the years ended 30 June 2013, 2012 and 2011
18
1. Summary of significant accounting policies (continued)
(z) Fair value estimation
The fair value of financial assets and financial liabilities must be estimated for recognition and measurement or for disclosure purposes. The fair value of financial instruments traded in active markets (such as available-for-sale securities and financial assets at fair value through profit and loss) is based on quoted market prices at the end of the reporting period. The quoted market price used for financial assets held by the Group is the current bid price, while the current ask price is used for financial liabilities. The nominal value less estimated credit adjustments of trade receivables and payables are assumed to approximate their fair values. Where applicable, information about the assumptions made in determining fair values is disclosed in the notes specific to that assets or liability.
(aa) Critical accounting estimates, judgements and assumptions Estimates, judgements and assumptions are continually evaluated and are based on historical experience and other factors, including expectations of future events that may have a financial impact on the entity and that are believed to be reasonable under the circumstances. Actual results may differ from those estimates, judgements and assumptions. The estimates, judgements and assumptions that have a significant risk of causing a material adjustment to the carrying amounts of assets and liabilities within the next financial year are discussed below. Impairment of assets In the absence of quoted market prices, estimates of the recoverable amounts of assets are based on the present value of future cash flows. For oil and gas assets, expected future cash flows are based on reserves, future production profiles, commodity prices and costs. Exploration and evaluation The Group currently capitalises exploration costs. The Group’s policy for exploration and evaluation assets is set out in note 1(k) and requires certain estimates and assumptions as to future events and circumstances, particularly in relation to the assessments of whether economic quantities of reserves have been found. Estimates and assumptions may change as new information becomes available. If, after capitalising expenditure, management concludes that it is unlikely to recover expenditure through future exploitation or sale, then the relevant capitalised amount will be written off the statement of comprehensive income. Income tax – research and development The Group provides for the amount of tax payable on its estimated assessable income for the year. A significant component in determining the amount payable is the estimate of research and development expenditure deductible in respect of current and prior years. Oil and gas assets – reserve estimation The amount of proved and probable reserves is reassessed at each reporting date for the purposes of assessing possible impairment of assets and calculating depletion of acquired oil and gas assets and capitalised exploration, evaluation and development costs. Reserves are determined by independent third party reserve certification consultants and conform to guidelines issued by the Society of Petroleum Engineers. Estimated reserve quantities incorporate assumptions about future development and production costs and expected oil commodity prices. These estimates can change from period to period due to changes in these assumptions and as additional geological data is generated through drilling operations. Provision for site restoration The Group has provided for site restoration costs to allow for any necessary decommissioning and rehabilitation work at its coal-to-liquids technology development sites in Chinchilla and Wyoming, in the event of cessation of all activities at these sites. This provision is based on the Directors’ best estimate of the costs of this work, which is consistent with estimates submitted to and approved by the relevant regulatory authorities in each jurisdiction. The Group has also provided for the costs associated with rehabilitating disturbance caused by its exploration drilling in prior years. This provision is based on quotes received from third parties to undertake the required work. The Group has also provided for the costs associated with rehabilitation and decommissioning in respect of its US oil production activities. Increases in the provision are capitalised to Oil & Gas Assets and amortised over the life of the field using the units of production method based on economically recoverable reserves. Business combinations Acquired assets and liabilities are initially recognised at fair value. The fair value of acquired oil and gas assets is determined by independent third party reserve certification consultants and incorporates assumptions including the quantity of proved oil reserves, future development costs and expected oil prices.
F-18
For
per
sona
l use
onl
y
Linc Energy LtdNotes to the consolidated financial statements
For the years ended 30 June 2013, 2012 and 2011
19
1. Summary of significant accounting policies (continued) (bb) Segment reporting Operating segments are reported in a manner consistent with the internal reporting provided to the CEO, who is the Group’s chief operating decision maker. An operating segment is a component of the Group that engages in business activities from which it may earn revenues and incur expenses, including revenues and expenses that relate to transactions with any of the Group’s other components. All operating segments’ operating results are regularly reviewed by the Group’s CEO to make strategic decisions about resources to be allocated to the segment and assess its performance, and for which discrete financial information is available. Segment capital expenditure is the total cost incurred during the period to acquire property, plant and equipment, and intangible assets other than goodwill. (cc) New accounting standards and interpretations not yet adopted A number of new standards, amendments to standards and interpretations are effective for annual reporting periods beginning on or after 1 July 2012. The amendments to AASB 10 ‘Presentation of Financial Statements’ have been adopted in the current year. AASB 2011-9 ‘Amendments to Australian Accounting Standards – Presentation of Items of Other Comprehensive Income’ introduces new terminology for the statement of comprehensive income and income statement. Under the adoption of this amendment the statement of comprehensive income has been renamed as a statement of profit and loss and other comprehensive income. The amendment resulted in the grouping of items of other comprehensive income into two categories in the other comprehensive income section: (a) items that will not be reclassified subsequently to profit and loss and (b) items that may be reclassified subsequently to profit and loss when specific conditions are met. The amendments have been applied retrospectively however the nature of the items of other comprehensive income sees them all presented as items that may be classified subsequently to profit and loss and therefore the modification is not significant and does not result in any impact on profit or loss, other comprehensive income and total comprehensive income. A number of Australia Accounting Standards and Interpretations are in issue but not effective for the current period financial statements. The Group does not plan to adopt any of the standards early. The following standards will be effective for the Group’s 30 June 2014 financial statements. AASB 10 Consolidated Financial Statements; AASB 11 Joint Arrangements; AASB 12 Disclosure of Interests in Other Entities; AASB 13 Fair Value Measurement; AASB 127 Separate Financial Statements; and AASB 128 Investments in Associates and Joint Ventures.
It is not anticipated that these standards will have a significant impact on application as the Group currently consolidates all its subsidiaries and has no associates or joint arrangements. The main result of application will be the more extensive disclosures required around interest in subsidiaries and associates under AASB 12 and disclosures around fair value measurement under AASB 13. AASB 9 Financial Instruments becomes mandatory for the Group’s 2016 consolidated financial statements and will be adopted for that period. This amendment requires that all recognised financial assets that are within the scope of AASB 139 ‘Financial Instruments: Recognition and Measurement’ to be subsequently measured at amortised cost or fair value. The Group currently recognises a number of financial assets and liabilities. All of these except for the available-for-sale financial assets are currently recognised at fair value or amortised cost. However, all of the available-for-sale assets are listed equity securities which are currently recognised at their fair value based on the last trading price of the period. Any movement in the fair value of the available-for–sale-assets will be reflected in the profit and loss or other comprehensive income rather than the available-for-sale reserve. The impact of this may be significant depending on the change in value of these assets during future periods.
F-19
For
per
sona
l use
onl
y
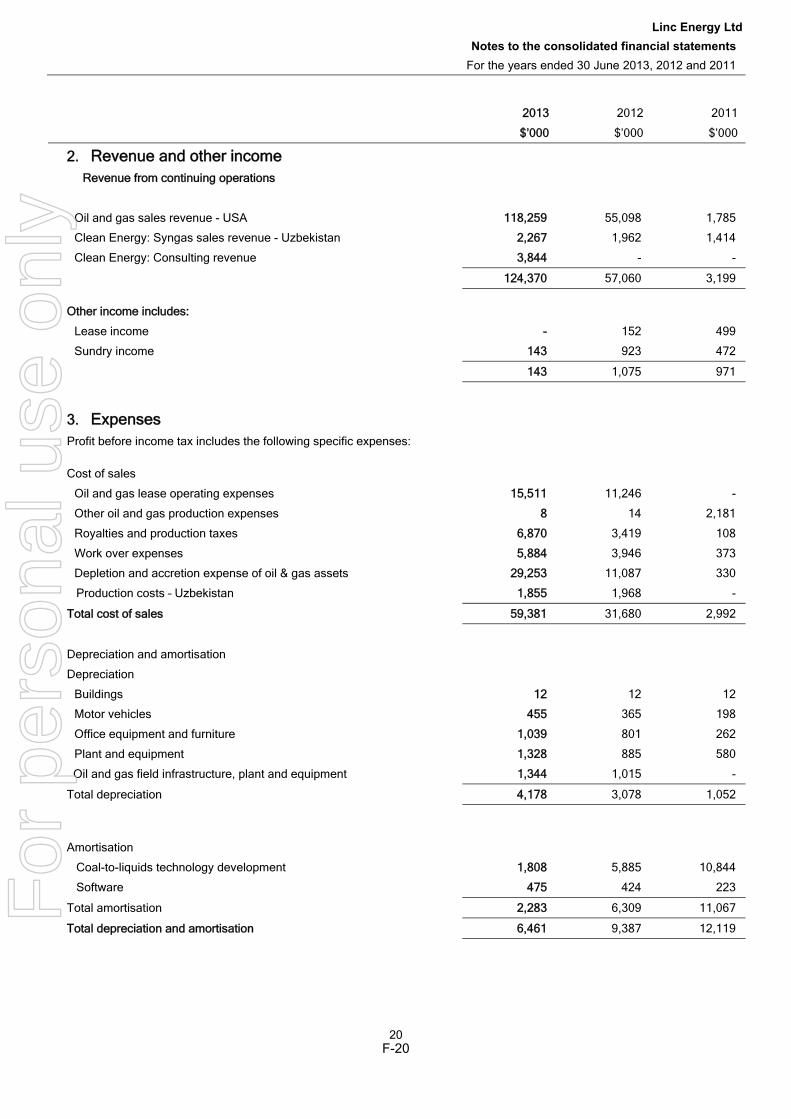
Linc Energy LtdNotes to the consolidated financial statements
For the years ended 30 June 2013, 2012 and 2011
20
2013 2012 2011
$’000 $’000 $’000
2. Revenue and other income Revenue from continuing operations
Oil and gas sales revenue - USA 1118,259 55,098 1,785
Clean Energy: Syngas sales revenue - Uzbekistan 22,267 1,962 1,414
Clean Energy: Consulting revenue 33,844 - -
124,370 57,060 3,199
Other income includes:
Lease income - 152 499
Sundry income 1143 923 472
143 1,075 971
3. Expenses Profit before income tax includes the following specific expenses:
Cost of sales
Oil and gas lease operating expenses 115,511 11,246 -
Other oil and gas production expenses 88 14 2,181
Royalties and production taxes 66,870 3,419 108
Work over expenses 55,884 3,946 373
Depletion and accretion expense of oil & gas assets 229,253 11,087 330
Production costs – Uzbekistan 1,855 1,968 -
Total cost of sales 59,381 31,680 2,992
Depreciation and amortisation
Depreciation
Buildings 12 12 12
Motor vehicles 4455 365 198
Office equipment and furniture 11,039 801 262
Plant and equipment 11,328 885 580
Oil and gas field infrastructure, plant and equipment 11,344 1,015 -
Total depreciation 44,178 3,078 1,052
Amortisation
Coal-to-liquids technology development 11,808 5,885 10,844
Software 475 424 223
Total amortisation 22,283 6,309 11,067
Total depreciation and amortisation 6,461 9,387 12,119
F-20
For
per
sona
l use
onl
y
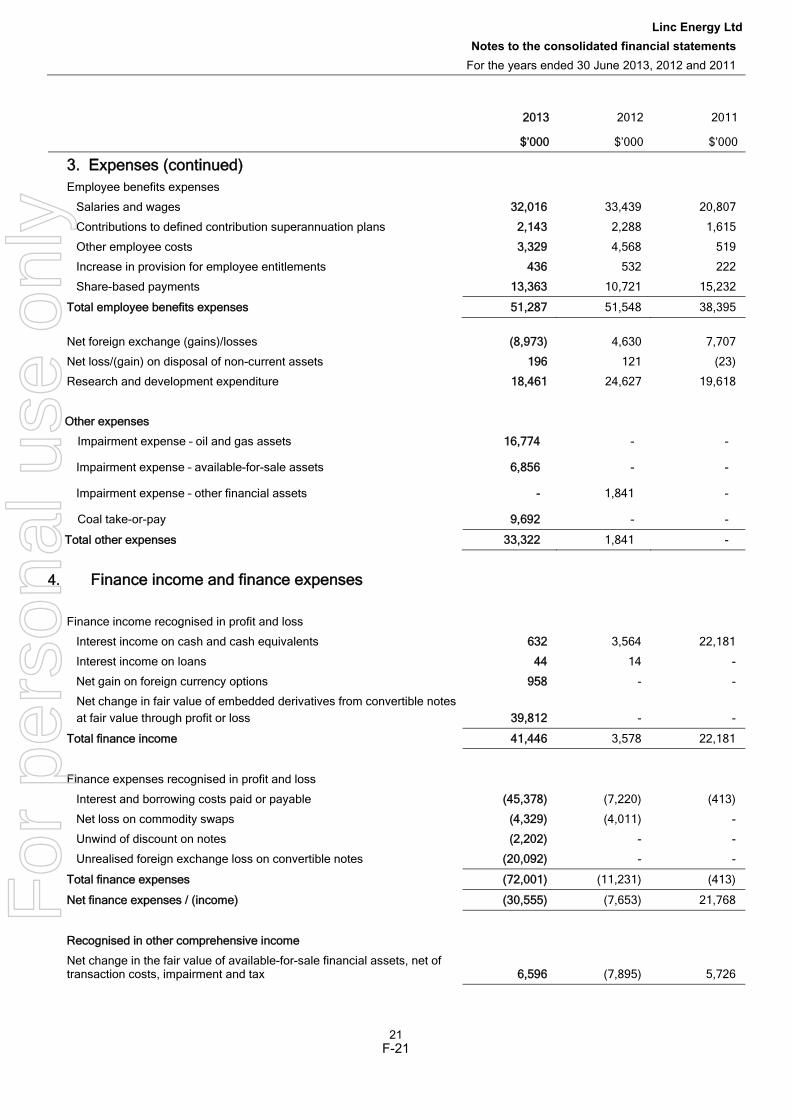
Linc Energy LtdNotes to the consolidated financial statements
For the years ended 30 June 2013, 2012 and 2011
21
2013 2012 2011
$’000 $’000 $’000
3. Expenses (continued)
Employee benefits expenses
Salaries and wages 332,016 33,439 20,807
Contributions to defined contribution superannuation plans 22,143 2,288 1,615
Other employee costs 33,329 4,568 519
Increase in provision for employee entitlements 4436 532 222
Share-based payments 113,363 10,721 15,232
Total employee benefits expenses 51,287 51,548 38,395
Net foreign exchange (gains)/losses ((8,973) 4,630 7,707
Net loss/(gain) on disposal of non-current assets 1196 121 (23)
Research and development expenditure 118,461 24,627 19,618
Other expenses
Impairment expense – oil and gas assets 116,774 - -
Impairment expense – available-for-sale assets 66,856 - -
Impairment expense – other financial assets -- 1,841 -
Coal take-or-pay 99,692 - -
Total other expenses 33,322 1,841 -
4. Finance income and finance expenses
Finance income recognised in profit and loss
Interest income on cash and cash equivalents 6632 3,564 22,181
Interest income on loans 444 14 -
Net gain on foreign currency options 9958 - -
Net change in fair value of embedded derivatives from convertible notes at fair value through profit or loss 39,812 - -
Total finance income 41,446 3,578 22,181
Finance expenses recognised in profit and loss
Interest and borrowing costs paid or payable ((45,378) (7,220) (413)
Net loss on commodity swaps ((4,329) (4,011) -
Unwind of discount on notes ((2,202) - -
Unrealised foreign exchange loss on convertible notes ((20,092) - -
Total finance expenses (72,001) (11,231) (413)
Net finance expenses / (income) (30,555) (7,653) 21,768
Recognised in other comprehensive income
Net change in the fair value of available-for-sale financial assets, net of transaction costs, impairment and tax 66,596 (7,895) 5,726
F-21
For
per
sona
l use
onl
y
Linc Energy LtdNotes to the consolidated financial statements
For the years ended 30 June 2013, 2012 and 2011
22
2013 2012 2011
$’000 $’000 $’000
5. Income tax
(a) Income tax (benefit) / expense
The major components of income tax (benefit) / expense are:
Current income tax
Current income tax charge ((34,379) (23,790) 41,583
Adjustments in respect of current income tax of previous years 5515 (1,772) -
Deferred income tax
Relating to origination and reversal of temporary differences 99,646 (2,242) 93,831
Adjustments in respect of deferred tax on previous years 22,057 - 451
Income tax (benefit) / expense reported in the statement of comprehensive income ((22,161) (27,804) 135,865
(b) Amounts charged or credited directly to equity
Deferred income tax related to items charged / (credited) directly to equity:
Available-for-sale investment reserve 22,827 3,384 (2,454)
Income tax expense / (credit) reported in equity 22,827 3,384 (2,454)
(c) Numerical reconciliation between aggregate tax expense / (benefit) recognised in the statement of comprehensive income and income tax expense / (benefit) calculated per the statutory income tax rate
A reconciliation between tax expense / (benefit) and the product of accounting profit before income tax multiplied by the Group’s applicable income tax rate is as follows:
Accounting (loss) / profit before tax ((85,986) (89,697) 432,306
At the parent entity’s statutory income tax rate of 30% (2012: 30%) (2011: 30%) (25,796) (26,909) 129,692
Amounts not deductible / (taxable) in calculating taxable income:
Share-based payments (equity settled) 44,009 3,216 4,570
Under/over provision from prior years 44,552 (1,772) (586)
Research and development 55,538 7,388 (1,471)
Foreign tax rate differential ((1,071) (225) (506)
Research and development tax incentive ((7,384) (9,851) -
Finance costs ((8,141) - -
Other (1,275) (7,369) 376
Tax losses (not previously) / not recognised
Current year 7,407 7,718 4,241
Prior year - - (451)
Income tax (benefit) / expense from continuing operations ((22,161) (27,804) 135,865
F-22
For
per
sona
l use
onl
y
Linc Energy LtdNotes to the consolidated financial statements
For the years ended 30 June 2013, 2012 and 2011
23
5. Income tax (continued)
2013 2012 2011
$’000 $’000 $’000
Deferred income tax at 30 June relates to the following: (i) Deferred tax assets
Temporary differences attributable to:
Share issue expenses 1151 302 723
Provisions 1,563 1,542 1,597
Accruals 228 - -
Property, plant and equipment 99,334 - -
Borrowing costs - 16 -
Other 5,733 862 407
Research and development tax offset 222,077 9,851 -
Tax losses 118,994 25,048 -
Total deferred tax assets 1158,080 37,620 2,727
Set-off of deferred tax liabilities pursuant to set-off provisions ((157,003) (36,919) (2,708)
Net deferred tax assets 1,077 701 19
(ii) Deferred tax liabilities
Temporary differences attributable to:
Exploration capitalised 1120,938 28,280 48,555
Accrued revenue 1 8 30
Investments 28,310 27,540 -
Finance costs 4,667 - -
Unrealised foreign exchange 33,959 - -
Other 22 13 2,454
Total deferred tax liabilities 1157,897 55,841 51,039
Set-off of deferred tax liabilities pursuant to set-off provisions ((157,003) (36,919) (2,708)
Net deferred tax liabilities 894 18,922
48,331
(d) Tax losses
A deferred tax asset has been recognised in respect of tax losses, tax credits and deductible temporary differences, as it is probable that future taxable profits will be available against which they can be utilised. The deferred tax assets have been offset against the deferred tax liabilities to the extent that they relate to income taxes levied by the same tax authority.
(e) Unrecognised tax losses
At 30 June 2013, we do not recognise US tax losses of USD$13,800,000 (2012: USD$7,000,000) (2011: Nil). In Australia there are no temporary differences that have not been recognised. In particular, there are no unrecognised temporary differences associated with the Group's investments in subsidiaries, associates or joint ventures, as there were no undistributed earnings ofGroup subsidiaries, associates or joint ventures. (2012: Nil) (2011: Nil).
(f) Franking credits At 30 June 2013 the Australian tax consolidated group has $18,190,166 (2012: $19,285,449) (2011: $9,526,061) imputation credits available for use in future periods resulting from payments of Australian federal income tax in 2012/13.
F-23
For
per
sona
l use
onl
y
Linc Energy LtdNotes to the consolidated financial statements
For the years ended 30 June 2013, 2012 and 2011
24
2013 2012 2011
$’000 $’000 $’000
6. Cash and cash equivalents
Cash at bank and on hand 1124,007 25,680 310,343
124,007 25,680 310,343
Reconciliation of profit / (loss) after income tax to net cash outflow from operating activities
Profit / (loss) for the year ((63,825) (61,893) 296,441
Finance income ((41,446) (3,578) (20,226)
Finance expense 220,229 (912) 413
Net (gain) or loss on sale of assets held for sale -- - (495,001)
Net (gain) or loss on settlement of financial instruments 11,988 377 (1,954)
Net (gain) or loss on sale of non-current assets 2296 72 (23)
Net (gain) or loss on purchase of oil and gas assets ((628) - (6,027)
Net (gain) or loss on foreign exchange ((4,903) (4,845) 3,312
Depreciation, amortisation, accretion and depletion 336,056 20,474 12,449
Bad debt expense 5526 - -
Non cash employee benefits (share-based payments) 113,348 10,721 15,232
Recognition of deferred tax on items directly in equity ((2,828) 3,384 (2,454)
Fair value loss on financial asset through profit and loss -- 1,841 90
Unrealised foreign exchange loss on convertible notes 220,092 - -
Impairment on available-for-sale-financial assets 66,856 - -
Impairment on oil and gas assets 116,774 - -
Changes in operating assets
Decrease / (increase) in receivables ((560) (8,329) (987)
Decrease / (increase) in prepayments 331 (232) (640)
Decrease / (increase) in inventories 886 (1,816) (458)
Increase / (decrease) in trade creditors 110,766 (708) 6,898
Increase / (decrease) in other payables ((434) (10,474) 13,448
(Decrease) / increase in other provisions 3329 91 2,269
(Increase) / decrease in deferred tax assets ((120,460) (34,211) 99,293
(Decrease) / increase in deferred tax liabilities 1102,056 4,121 (2,557)
Net cash outflow from operating activities ((5,651) (85,917) (80,482)
Non-cash investing and financing activities
Acquisition of assets by finance lease -- 950 161
Shares issued in repayment of convertible equity tranches -- - 4,500
- 950 4,661
F-24
For
per
sona
l use
onl
y
Linc Energy LtdNotes to the consolidated financial statements
For the years ended 30 June 2013, 2012 and 2011
25
2013 2012 2011
$’000 $’000 $’000
7. Trade and other receivables
Current
Trade receivables 113,583 13,998 119
Alaskan tax rebate (a) 332,597 - -
Other receivables (b) 11,817 1,406 1,399
Prepayments 717 876 729
Deposits (c) 1,812 1,432 407
Total current trade and other receivables 50,526 17,712 2,654
Non-current
Deposits (d) 9,934 9,319 1,442
Term deposits (e) 117,020 4,933 3,944
Loans to related parties (f) 4498 250 -
Other receivable 648 625 470
Total non-current trade and other receivables 28,100 15,127 5,856
None of the trade and other receivables are impaired or past due but not impaired. Due to the short-term nature of current receivables, their carrying amount is assumed to approximate their fair value. The fair values of non-current receivables are consistent with their carrying amounts. The Group’s exposure to risk is discussed in note 26.
(a) During the year ended 30 June 2013, the Company qualified for credits under Alaska Statutes. A receivable is recognised when the amount of the credit is reasonably estimable and receipts is probable. For expenditure and exploration based credits. The credit is recorded as a reduction to the related assets.
(b) Current other receivables are amounts generally arising from Business Activity Statement refunds, accrued interest on deposits and amounts receivable from employees.
(c) Current deposits relate to normal trade deposits for example rental bonds on property leases. Included in current deposits at 30 June 2013 was an amount of $1,812,000 placed in escrow to secure access to equipment required for the upcoming Umiat winter drilling activities. (2012: $1,432,000) (2011: 407,000).
(d) Non-current deposits relate to security held in relation to mining tenements. These deposits are returned on relinquishment of a tenement subject to satisfactory compliance with environmental and other regulatory requirements.
(e) Term deposits are held by banking institutions as security against guarantees and credit card facilities of the Group. These funds are not available for general use as working capital.
(f) Loans made to related parties are detailed in note 32.
2013 $’000
2012 $’000
2011 $’000
8. Inventories Raw materials and stores – at cost 22,935 2,773 936
2,935 2,773 936
F-25
For
per
sona
l use
onl
y
Linc Energy LtdNotes to the consolidated financial statements
For the years ended 30 June 2013, 2012 and 2011
26
9. Assets held for sale 2013 $’000
2012 $’000
2011 $’000
Intangible assets Exploration and evaluation – at cost -- - 9,032
- - 9,032
Given the significant increase in development activity at the Teresa mine and the length of time that both the Teresa (Bowen Basin) and Pentland (Galilee Basin) tenements had been classified as ‘held for sale’ these assets totalling $9,032,000 were reclassified back to Exploration and Evaluation Intangible Assets in 2012.
On 3 August 2010 Linc Energy announced that it had entered into a contract with Adani Mining Pty Ltd (“Adani”), a subsidiary of Adani Enterprises of India, to sell the non-core Galilee coal tenement for $500,000,000. The Company also entered into an agreement with Adani entitling it to receive A$2.00 per tonne, indexed to inflation, for the first 20 years of production from the tenement.
The sale was completed on 10 August 2010 and $500,000,000 was received. No amount has been recognised in the financial statements in respect of the contingent royalty asset (see note 28). The net gain on disposal of the tenement is calculated as follows:
2013 $‘000
2012 $‘000
2011 $‘000
Proceeds from sale of tenement - - 500,000 Less carrying value of Galilee tenement - - (4,831) Less costs of sale - - (168) Net gain on disposal of tenement - - 495,001
2013 $’000
2012 $’000
2011 $’000
10. Other assets
Deposits on acquisitions -- - 14,158
On 6 June 2011, Linc Energy entered into an agreement to acquire oil fields in Texas and Louisiana, USA, from ERG Resources LLC (“ERG”), at a purchase price of USD$236,000,000. The acquisition included 14 Oil fields consisting of 156 leases covering approximately 13,400 acres. A deposit was paid to ERG to the value of USD$10,000,000 ($9,439,000).
On 16 June 2011, Linc Energy entered into an agreement to acquire a controlling interest in the ‘Umiat’ Oil Field in Alaska, USA, via the purchase of an 84.5% interest in Renaissance Umiat LLC (which owns a 100% working interest and 80% net revenue interest in the Umiat Project) for USD$50,000,000 plus working capital adjustments. A deposit was paid to Renaissance Umiat LLC of USD$5,000,000 ($4,719,000).
F-26
For
per
sona
l use
onl
y
Linc Energy LtdNotes to the consolidated financial statements
For the years ended 30 June 2013, 2012 and 2011
27
11. Intangibles
Coal-to-liquids technology development (c)
Exploration and evaluation (b)
Software (c) Goodwill Technology licences
Total
$’000 $$’000 $$’000 $$’000 $$’000 $’000
Year ended 30 June 2013
Cost
Opening balance 885,053 210,349 3,629 1,292 197 300,520
Additions (at cost) -- 19,251 819 - - 20,070
Disposals -- - (710) - - (710)
Exchange rate movements -- 5,470 45 - - 5,515
Closing balance 85,053 235,070 3,783 1,292 197 325,395
Amortisation and impairment losses
Opening balance ((50,644) - (968) - (197) (51,809)
Amortisation ((1,808) - (475) - - (2,283)
Exchange rate movements -- - (9) - - (9)
Closing balance (52,452) - (1,452) - (197) (54,101)
Closing net book amount 32,601 235,070 2,331 1,292 - 271,294
Year ended 30 June 2012
Cost
Opening balance 79,505 158,339 1,076 1,292 199 240,411
Additions (at cost) 12,609 34,192 2,553 - - 49,354
Transfer between intangible assets (a) (7,364) 7,364 - - - -
Transfer from assets classified as held for sale
- 9,032 - - - 9,032
Exchange rate movements 303 1,422 - - (2) 1,723
Closing balance 85,053 210,349 3,629 1,292 197 300,520
Amortisation and impairment losses
Opening balance (44,759) - (544) - - (45,303)
Amortisation (5,885) - (424) - - (6,309)
Impairment loss - - - - (197) (197)
Closing balance (50,644) - (968) - (197) (51,809)
Closing net book amount 34,409 210,349 2,661 1,292 - 248,711
F-27
For
per
sona
l use
onl
y
Linc Energy LtdNotes to the consolidated financial statements
For the years ended 30 June 2013, 2012 and 2011
28
11. Intangibles (continued)
Coal-to-liquids technology development (c)
Exploration and evaluation (b)
Software (c) Goodwill Technology licences
Total
$’000 $$’000 $$’000 $$’000 $$’000 $$’000
Year ended 30 June 2011
Cost
Opening balance 70,026 144,245 636 1,292 - 216,199
Additions (at cost) 9,479 19,981 440 - 199 30,099
Exchange rate movements - (5,887) - - - (5,887)
Closing balance 79,505 158,339 1,076 1,292 199 240,411
Amortisation and impairment losses
Opening balance (33,915) - (321) - - (34,236)
Amortisation (10,844) - (223) - - (11,067)
Impairment loss - - - - - -
Closing balance (44,759) - (544) - - (45,303)
Closing net book amount 34,746 158,339 532 1,292 199 195,108
Impairment tests for goodwill
Goodwill is allocated to the Group’s cash-generating units identified according to reportable business segment and region of operation:
2013 2012 2011
$000 $000 $000
Asia
Syngas 1,292 1,292 1,292
Total 1,292 1,292 1,292
Recoverable amount of Goodwill with an indefinite life The recoverable amount of Goodwill is determined based on fair value less costs to sell. Fair value is determined as the amount for which the underlying asset (equity securities of JSPC Yerostigaz) could be exchanged between willing parties in an arm’s length transaction. UCG technology and know-how has become increasingly sought after by Governments and corporations around the world during recent years. This is demonstrated by the recent commercial agreement with Exxaro Resources in South Africa of which $3,000,000 has already been received and $20,000,00 is due upon successful completion of the specified conditions and further UCG project opportunities being investigated and planned in the USA, UK, Vietnam, China, India, Canada, Poland, Hungary and Russia. As UCG becomes more accepted as an economically and environmentally viable production process for energy and petroleum products, the value of companies and their personnel with UCG technology and experience is increasing. The investment in Yerostigaz represents a controlling stake in the only commercially operating UCG business in the world. The controlling stake provides access to a pool of UCG technical specialists and to 50 years of accumulated knowledge and UCG intellectual property of Yerostigaz. It also restricts competitors of the Group from accessing the technology, providing the Group with both a valuable competitive advantage and a valuable product in itself in terms of the ability to generate revenue through consulting and other commercial avenues which further supports a fair value in excess of the carrying value of the goodwill. The Directors’ believe that the recoverable amount of Yerostigaz exceeds the carrying value of goodwill.
(a) During 2012 amounts capitalised in respect of the Gasifier 6 project being constructed in Wyoming were transferred to exploration and evaluation intangible asset.
(b) The recoverability of the carrying amount of the exploration and evaluation assets is dependent on the successfuldevelopment and commercial exploitation or sale of the respective areas of interest. Costs are transferred to oil and gas assets or to other development assets once oil or coal reserves are certified and the Group commences development of the resource.
(c) Amortisation of the coal-to-liquids technology development and intangible software costs are included within administration and corporate expenses in the statement of comprehensive income.
F-28
For
per
sona
l use
onl
y
Linc Energy LtdNotes to the consolidated financial statements
For the years ended 30 June 2013, 2012 and 2011
29
12. Property, plant and equipment
Land and buildings
Motor vehicles
Office equip and furniture
Plant and equipment Total
$’000 $$’000 $$’000 $$’000 $$’000
Year ended 30 June 2013
Cost
Opening balance 44,759 2,892 4,784 11,854 24,289
Additions -- 383 348 886 1,597
Disposals -- (287) (298) (45) (630)
Exchange rate movements 114 138 390 379 921
Closing balance 4,773 3,126 5,223 13,054 26,176
Accumulated depreciation
Opening balance ((67) (1,022) (1,374) (2,984) (5,447)
Depreciation charge ((12) ((455) (1,039) ((1,328) (2,834)
Exchange rate movements -- (21) (47) (20) (88)
Closing balance (79) (1,498) (2,460) (4,332) (8,369)
Closing net book amount 4,694 1,628 2,763 8,721 17,806
Year ended 30 June 2012
Cost
Opening balance 4,754 1,932 2,441 7,023 16,150
Additions - 845 2,395 4,845 8,085
Acquisitions - 106 147 - 253
Disposals - - (172) - (172)
Exchange rate movements 5 9 (27) (14) (27)
Closing Balance 4,759 2,892 4,784 11,854 24,289
Accumulated depreciation
Opening balance (55) (656) (632) (2,032) (3,375)
Depreciation charge (12) (366) (801) (885) (2,064)
Exchange rate movements 59 (67) (8)
Closing balance (67) (1,022) (1,374) (2,984) (5,447)
Closing net book amount 4,692 1,870 3,410 8,870 18,842
Year ended 30 June 2011
Cost
Opening balance 4,080 1,416 794 5,432 11,722
Additions 702 557 1,605 1,751 4,615
Acquisitions 26 51 13 90
Disposals (93) (5) (98)
Exchange rate movements (28) 26 (4) (173) (179)
Closing Balance 4,754 1,932 2,441 7,023 16,150
Accumulated depreciation
Opening balance (43) (458) (370) (1,452) (2,323)
Depreciation charge (12) (198) (262) (580) (1,052)
Closing balance (55) (656) (632) (2,032) (3,375)
Closing net book amount 4,699 1,276 1,809 4,991 12,775
Assets held under finance leases have a net book value of $1,747,000 (2012: $2,352,000) (2011: $2,713,000).
F-29
For
per
sona
l use
onl
y
Linc Energy LtdNotes to the consolidated financial statements
For the years ended 30 June 2013, 2012 and 2011
30
13. Oil and gas assets
Undeveloped In
development Producing
Field infrastructure,
plant and equipment Total
$’000 $$’000 $$’000 $$’000 $$’000
Year ended 30 June 2013
Cost
Opening balance 667,975 2,973 308,136 17,047 396,131
Additions 99,028 57,186 103,202 - 169,416
Acquisitions -- - - - -
Transfers ((158) 7,032 (6,874) - -
Provision for closure costs -- - 15,168 - 15,168
Disposals ((9) - (3,561) - (3,570)
Exchange rate movements 77,637 334 34,650 1,916 44,537
Closing balance 884,473 67,525 450,721 18,963 621,682
Accumulated depreciation, depletion
Opening balance -- - (10,535) (1,015) (11,550)
Accumulated depreciation, depletion -- - (29,253) (1,344) (30,597)
Impairment -- - (16,774) - (16,774)
Exchange rate movements -- - (6,942) (281) (7,223)
Closing balance -- - (63,504) (2,640) (66,144)
Closing net book amount 84,473 67,525 387,217 16,323 555,538
Year ended 30 June 2012
Cost
Opening balance 7,768 - 17,520 - 25,288
Additions 1,137 3,974 30,850 - 35,961
Acquisitions 55,560 - 261,132 17,509 334,201
Transfers - (1,001) 1,001 - -
Provision for closure costs - - 3,345 - 3,345
Exchange rate movements 3,510 - (5,712) (462) (2,663)
Closing balance 67,975 2,973 308,136 17,047 396,131
Accumulated depreciation, depletion
Opening balance - - (330) - (330)
Accumulated depreciation, depletion - - (10,205) (1,015) (11,220)
Closing balance - - (10,535) (1,015) (11,550)
Closing net book amount 67,975 2,973 297,601 16,032 384,581
F-30
For
per
sona
l use
onl
y
Linc Energy LtdNotes to the consolidated financial statements
For the years ended 30 June 2013, 2012 and 2011
31
13. Oil and gas assets (continued)
Year ended 30 June 2011 Undeveloped In
development Producing
Field infrastructure,
plant and equipment Total
$’000 $$’000 $$’000 $$’000 $$’000
Cost
Opening balance - - - - -
Additions 9 - - - 9
Acquisitions 8,250 - 16,176 - 24,426
Transfers
Provision for closure costs - - 2,616 - 2,616
Exchange rate movements (491) - (942) - (1,433)
Closing balance 7,768 - 17,850 - 25,618
Accumulated depreciation, depletion
Opening balance - - - - -
Accumulated depreciation, depletion - - (330) - (330)
Closing balance - - (330) - (330)
Closing net book amount 7,768 - 17,520 - 25,288
The ultimate recoupment of costs carried forward for oil & gas assets is dependent on the successful development and commercial exploitation or sale of the respective areas. Undeveloped oil & gas assets represent the costs associated with the Umiat oil field. Oil & gas assets in development represent costs associated with the CO2 enhanced oil recovery project in Wyoming. All exploration and evaluation costs carried forward in respect of tenements prospective for oil & gas are disclosed separately in note 13. These costs are transferred to oil & gas assets only once proven or probable reserves have been certified.
Gasrock Acquisition
On 18 July 2012 Linc Energy USA Inc. purchased the Gasrock Net Profit Interest (NPI) of 10% in exchange for a 0.5% Over Riding Royalty Interest (ORRI) for $2,977,000 (USD$3,060,000). The net profit interest covers selected leases in the Group’s Glenrock field in Wyoming. The net worth of the Gasrock NPI was estimated at $3,605,000 (USD$3,706,000) based on an economic reserve analysis report. As the estimated value of the 10% NPI received was in excess of the cash consideration paid, the difference resulted in a bargain purchase gain of $628,000 (USD$646,000).
Umiat Acquisition (asset acquisition)
On 8 July 2011, Linc Energy acquired a 100% interest in Linc Alaska resources, LLC (formerly Renaissance Alaska, LLC) which holds an 84.5% membership and voting interest in Renaissance Umiat. Total consideration for the acquisition was $52,529,000 (USD$56,416,000) of which $44,660,000 net of cash acquired (USD$47,965,000) was paid during 2012 to complete the acquisition (following working capital adjustments at closing). Renaissance Umiat holds 19,358 undeveloped acres leased in the Umiat Oil Field, which is located in the National Petroleum Reserve, Alaska. Renaissance Umiat owns a 100% working interest and 80% net revenue interest in the Umiat lease position.
The acquisition was treated as an asset acquisition as the acquired entities did not meet the definition of a business as described by the relevant accounting standard (AASB 3 Business Combinations). Linc Energy recorded the fair value of the 15.5% non-controlling interest in Renaissance Umiat on the date of close of $9,038,000 (USD$9,707,000).
There are no known contingent assets or liabilities and no further contingent consideration is payable to the seller. The Group does not expect any material changes to the amounts disclosed in the table on the next page.
F-31
For
per
sona
l use
onl
y
Linc Energy LtdNotes to the consolidated financial statements
For the years ended 30 June 2013, 2012 and 2011
32
13. Oil and gas assets (continued)
Assets acquired
Carrying amount Fair value adjustments Fair value
$’000 $’000 $’000
Cash 4,383 - 4,383
Accounts receivable (net of allowance) 261 - 261
Unproved oil and gas properties 55,560 - 55,560
Equipment inventory 954 - 954
Property, plant, and equipment 31 - 31
Bonds 498 - 498
Other assets 41 41
Liabilities (accounts payable) (161) - (161)
Net identifiable assets 61,567 61,567
Purchase consideration paid in cash (52,529)
Non-controlling interest (9,038)
2013 2012 2011
$’000 $’000 $’000
14. Available-for-sale investments Listed securities
Equity securities 16,220 13,652 23,128
16,220 13,652 23,128
The carrying amount of listed securities is equal to their fair value. The fair value of listed securities has been calculated using prices quoted on the Australian Securities Exchange and AIM London Stock Exchange at balance date or the last trading date during the period. The Group’s exposure to risk is discussed in note 26. At 30 June 2013, two of the listed securities are considered impaired as their fair values have declined significantly below their acquisition cost. An impairment of $6,857,000 was reclassified from equity within the available-for-sale reserve to the statement of profit or loss and other comprehensive income and is included as part of other expenses.
15. Other financial assets 2013 2012 2011 $’000 $’000 $’000 Current
Foreign currency options 9958 - -
Option ot acquire shares (a) -- - 1,656
958 - 1,656 Non-current Commodity swap contracts (oil hedges) 330 - -
30 - -
(a) On 11 March 2011, Linc Energy announced the purchase of a ten percent interest in Powerhouse Energy Plc for USD$6,000,000. The purchase price also included options to acquire an additional USD$6,000,000 of shares in the future at a discount to the market price. These options were recognised as financial assets and re-valued at each reporting date with gains and losses being recognised in the statement of comprehensive income. At 30 June 2012 the value of the option to acquire additional shares in Powerhouse was written down to nil.
F-32
For
per
sona
l use
onl
y
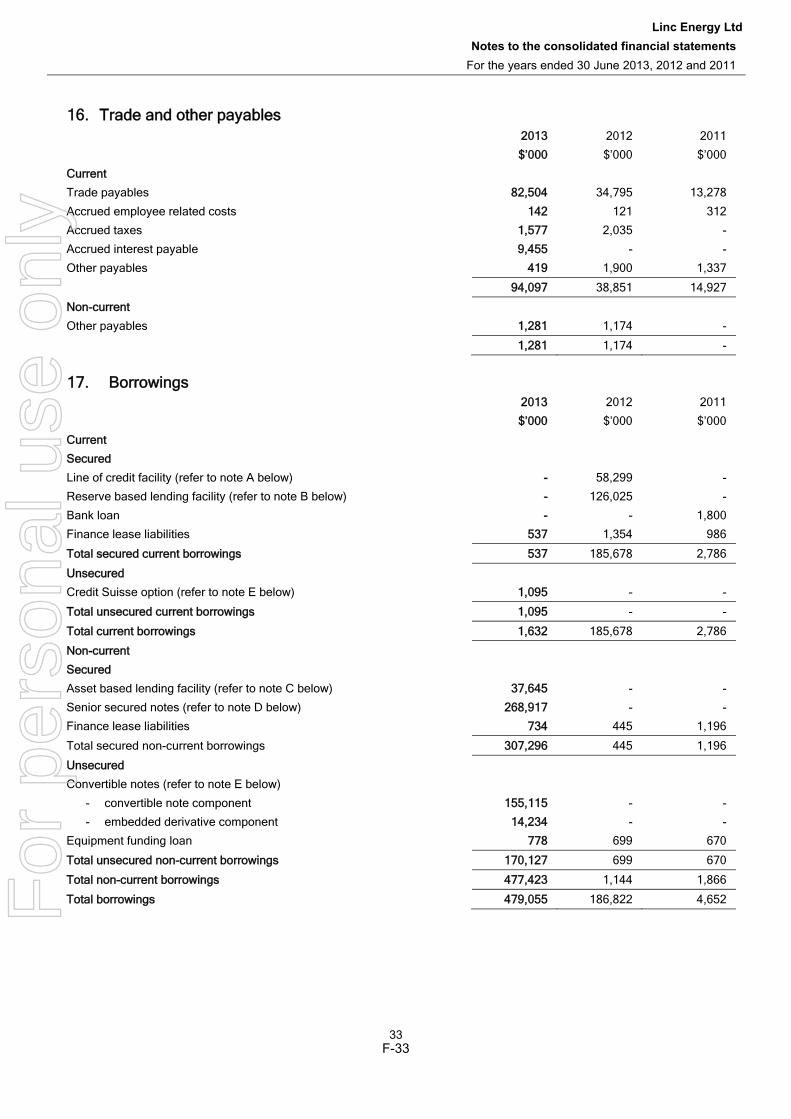
Linc Energy LtdNotes to the consolidated financial statements
For the years ended 30 June 2013, 2012 and 2011
33
16. Trade and other payables 2013 2012 2011
$’000 $’000 $’000
Current
Trade payables 882,504 34,795 13,278
Accrued employee related costs 1142 121 312
Accrued taxes 11,577 2,035 -
Accrued interest payable 99,455 - -
Other payables 4419 1,900 1,337
94,097 38,851 14,927
Non-current
Other payables 11,281 1,174 -
1,281 1,174 -
17. Borrowings 2013 2012 2011
$’000 $’000 $’000
Current
Secured
Line of credit facility (refer to note A below) -- 58,299 -
Reserve based lending facility (refer to note B below) -- 126,025 -
Bank loan - - 1,800
Finance lease liabilities 5537 1,354 986
Total secured current borrowings 537 185,678 2,786
Unsecured
Credit Suisse option (refer to note E below) 11,095 - -
Total unsecured current borrowings 1,095 - -
Total current borrowings 1,632 185,678 2,786
Non-current
Secured
Asset based lending facility (refer to note C below) 337,645 - -
Senior secured notes (refer to note D below) 2268,917 - -
Finance lease liabilities 7734 445 1,196
Total secured non-current borrowings 3307,296 445 1,196
Unsecured
Convertible notes (refer to note E below)
- convertible note component 1155,115 - -
- embedded derivative component 114,234 - -
Equipment funding loan 7778 699 670
Total unsecured non-current borrowings 170,127 699 670
Total non-current borrowings 477,423 1,144 1,866
Total borrowings 479,055 186,822 4,652
F-33
For
per
sona
l use
onl
y
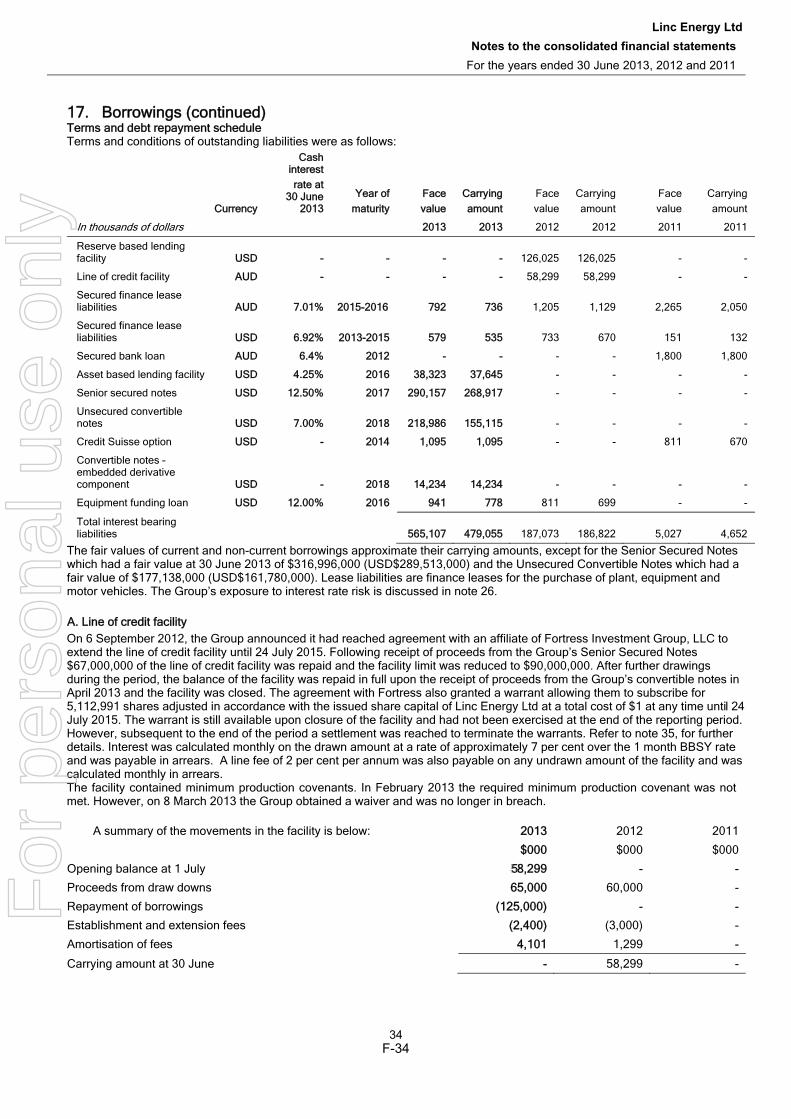
Linc Energy LtdNotes to the consolidated financial statements
For the years ended 30 June 2013, 2012 and 2011
34
17. Borrowings (continued) Terms and debt repayment schedule Terms and conditions of outstanding liabilities were as follows:
Currency
Cash interest rate at
30 June 2013
Year of maturity
Face value
Carrying amount
Face value
Carrying amount
Face value
Carrying amount
In thousands of dollars 2013 2013 2012 2012 2011 2011
Reserve based lending facility UUSD - - - - 126,025 126,025 - -
Line of credit facility AAUD - - - - 58,299 58,299 - -
Secured finance lease liabilities AAUD 7.01% 2015-2016 792 736 1,205 1,129 2,265 2,050
Secured finance lease liabilities UUSD 6.92% 2013-2015 579 535 733 670 151 132
Secured bank loan AAUD 6.4% 2012 - - - - 1,800 1,800
Asset based lending facility UUSD 4.25% 2016 38,323 37,645 - - - -
Senior secured notes UUSD 12.50% 2017 290,157 268,917 - - - -
Unsecured convertible notes UUSD 7.00% 2018 218,986 155,115 - - - -
Credit Suisse option UUSD - 2014 1,095 1,095 - - 811 670
Convertible notes – embedded derivative component UUSD - 2018 14,234 14,234 - - - -
Equipment funding loan UUSD 12.00% 2016 941 778 811 699 - -
Total interest bearing liabilities 565,107 479,055 187,073 186,822 5,027 4,652
The fair values of current and non-current borrowings approximate their carrying amounts, except for the Senior Secured Notes which had a fair value at 30 June 2013 of $316,996,000 (USD$289,513,000) and the Unsecured Convertible Notes which had a fair value of $177,138,000 (USD$161,780,000). Lease liabilities are finance leases for the purchase of plant, equipment and motor vehicles. The Group’s exposure to interest rate risk is discussed in note 26. A. Line of credit facility On 6 September 2012, the Group announced it had reached agreement with an affiliate of Fortress Investment Group, LLC to extend the line of credit facility until 24 July 2015. Following receipt of proceeds from the Group’s Senior Secured Notes $67,000,000 of the line of credit facility was repaid and the facility limit was reduced to $90,000,000. After further drawings during the period, the balance of the facility was repaid in full upon the receipt of proceeds from the Group’s convertible notes in April 2013 and the facility was closed. The agreement with Fortress also granted a warrant allowing them to subscribe for 5,112,991 shares adjusted in accordance with the issued share capital of Linc Energy Ltd at a total cost of $1 at any time until 24 July 2015. The warrant is still available upon closure of the facility and had not been exercised at the end of the reporting period. However, subsequent to the end of the period a settlement was reached to terminate the warrants. Refer to note 35, for further details. Interest was calculated monthly on the drawn amount at a rate of approximately 7 per cent over the 1 month BBSY rate and was payable in arrears. A line fee of 2 per cent per annum was also payable on any undrawn amount of the facility and was calculated monthly in arrears. The facility contained minimum production covenants. In February 2013 the required minimum production covenant was not met. However, on 8 March 2013 the Group obtained a waiver and was no longer in breach.
A summary of the movements in the facility is below: 22013 2012 2011
$000 $000 $000
Opening balance at 1 July 558,299 - -
Proceeds from draw downs 665,000 60,000 -
Repayment of borrowings ((125,000) - -
Establishment and extension fees ((2,400) (3,000) -
Amortisation of fees 44,101 1,299 -
Carrying amount at 30 June -- 58,299 -
F-34
For
per
sona
l use
onl
y
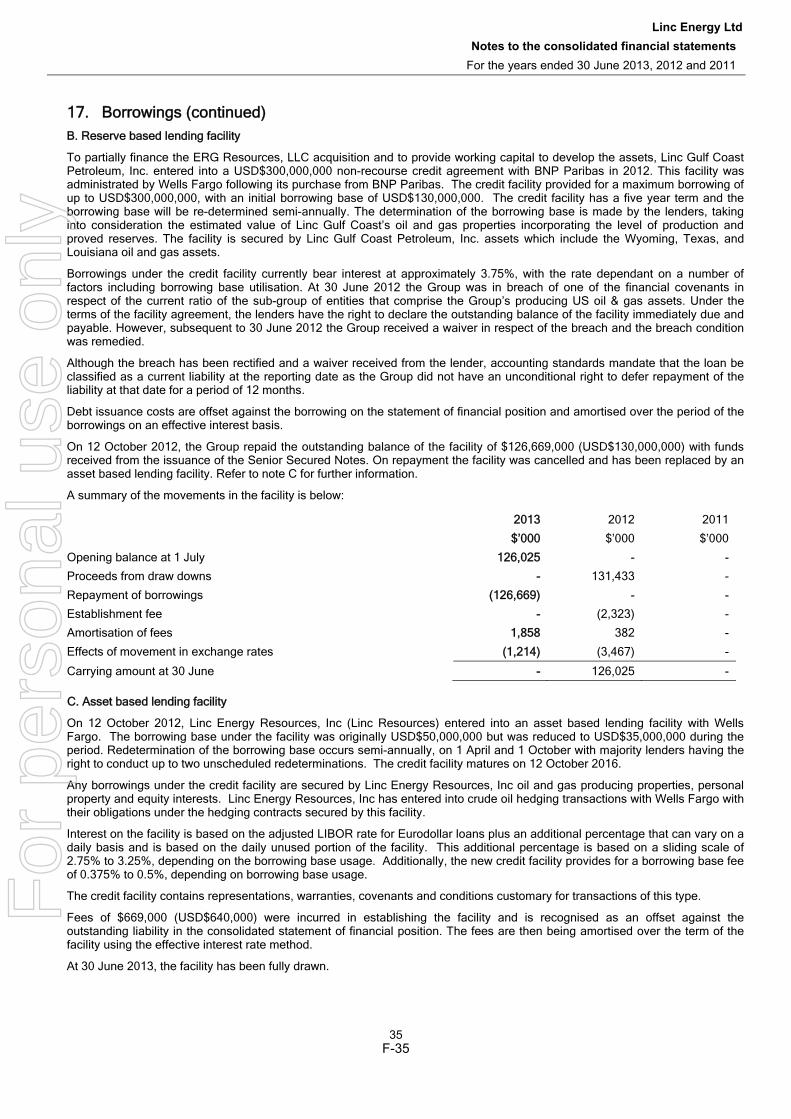
Linc Energy LtdNotes to the consolidated financial statements
For the years ended 30 June 2013, 2012 and 2011
35
17. Borrowings (continued) B. Reserve based lending facility
To partially finance the ERG Resources, LLC acquisition and to provide working capital to develop the assets, Linc Gulf Coast Petroleum, Inc. entered into a USD$300,000,000 non-recourse credit agreement with BNP Paribas in 2012. This facility was administrated by Wells Fargo following its purchase from BNP Paribas. The credit facility provided for a maximum borrowing of up to USD$300,000,000, with an initial borrowing base of USD$130,000,000. The credit facility has a five year term and the borrowing base will be re-determined semi-annually. The determination of the borrowing base is made by the lenders, taking into consideration the estimated value of Linc Gulf Coast’s oil and gas properties incorporating the level of production and proved reserves. The facility is secured by Linc Gulf Coast Petroleum, Inc. assets which include the Wyoming, Texas, and Louisiana oil and gas assets.
Borrowings under the credit facility currently bear interest at approximately 3.75%, with the rate dependant on a number of factors including borrowing base utilisation. At 30 June 2012 the Group was in breach of one of the financial covenants in respect of the current ratio of the sub-group of entities that comprise the Group’s producing US oil & gas assets. Under the terms of the facility agreement, the lenders have the right to declare the outstanding balance of the facility immediately due and payable. However, subsequent to 30 June 2012 the Group received a waiver in respect of the breach and the breach condition was remedied.
Although the breach has been rectified and a waiver received from the lender, accounting standards mandate that the loan be classified as a current liability at the reporting date as the Group did not have an unconditional right to defer repayment of the liability at that date for a period of 12 months.
Debt issuance costs are offset against the borrowing on the statement of financial position and amortised over the period of the borrowings on an effective interest basis.
On 12 October 2012, the Group repaid the outstanding balance of the facility of $126,669,000 (USD$130,000,000) with funds received from the issuance of the Senior Secured Notes. On repayment the facility was cancelled and has been replaced by an asset based lending facility. Refer to note C for further information.
A summary of the movements in the facility is below:
2013 2012 2011
$’000 $’000 $’000
Opening balance at 1 July 1126,025 - -
Proceeds from draw downs -- 131,433 -
Repayment of borrowings ((126,669) - -
Establishment fee -- (2,323) -
Amortisation of fees 11,858 382 -
Effects of movement in exchange rates ((1,214) (3,467) -
Carrying amount at 30 June -- 126,025 - C. Asset based lending facility
On 12 October 2012, Linc Energy Resources, Inc (Linc Resources) entered into an asset based lending facility with Wells Fargo. The borrowing base under the facility was originally USD$50,000,000 but was reduced to USD$35,000,000 during the period. Redetermination of the borrowing base occurs semi-annually, on 1 April and 1 October with majority lenders having the right to conduct up to two unscheduled redeterminations. The credit facility matures on 12 October 2016.
Any borrowings under the credit facility are secured by Linc Energy Resources, Inc oil and gas producing properties, personal property and equity interests. Linc Energy Resources, Inc has entered into crude oil hedging transactions with Wells Fargo with their obligations under the hedging contracts secured by this facility.
Interest on the facility is based on the adjusted LIBOR rate for Eurodollar loans plus an additional percentage that can vary on a daily basis and is based on the daily unused portion of the facility. This additional percentage is based on a sliding scale of 2.75% to 3.25%, depending on the borrowing base usage. Additionally, the new credit facility provides for a borrowing base fee of 0.375% to 0.5%, depending on borrowing base usage.
The credit facility contains representations, warranties, covenants and conditions customary for transactions of this type.
Fees of $669,000 (USD$640,000) were incurred in establishing the facility and is recognised as an offset against the outstanding liability in the consolidated statement of financial position. The fees are then being amortised over the term of the facility using the effective interest rate method.
At 30 June 2013, the facility has been fully drawn.
F-35
For
per
sona
l use
onl
y
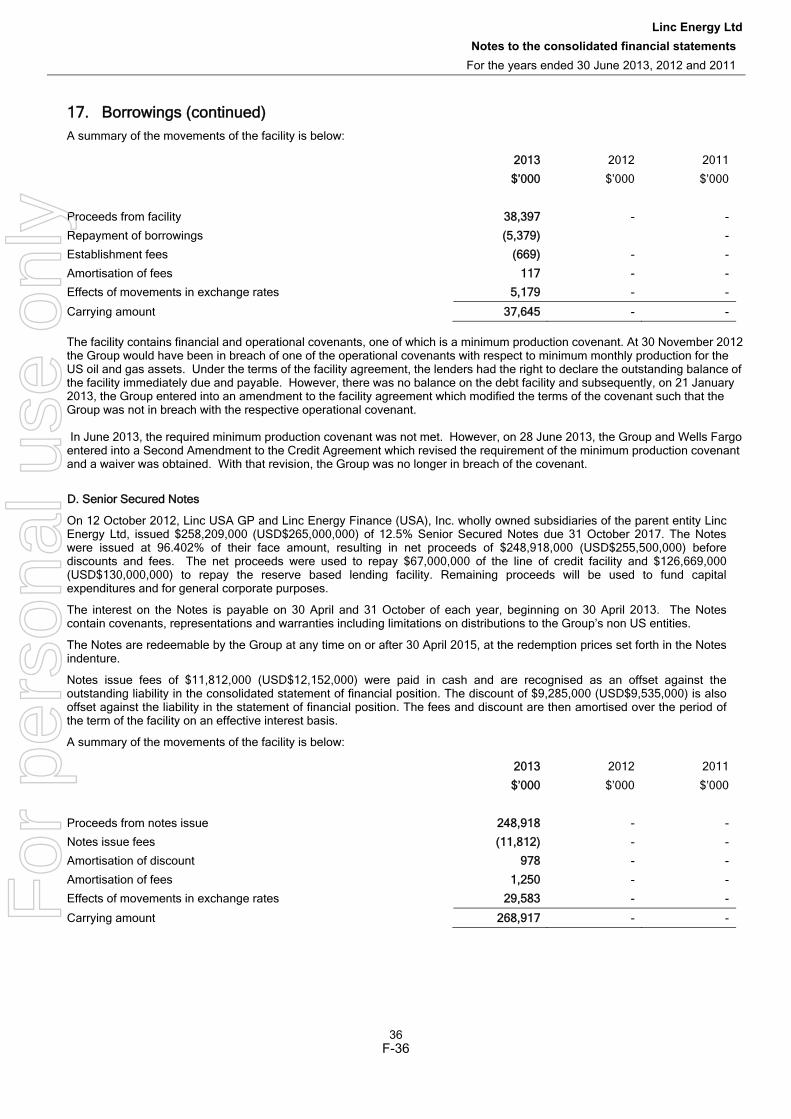
Linc Energy LtdNotes to the consolidated financial statements
For the years ended 30 June 2013, 2012 and 2011
36
17. Borrowings (continued) A summary of the movements of the facility is below:
2013 2012 2011
$’000 $’000 $’000
Proceeds from facility 338,397 - -
Repayment of borrowings ((5,379) -
Establishment fees ((669) - -
Amortisation of fees 1117 - -
Effects of movements in exchange rates 55,179 - -
Carrying amount 337,645 - - The facility contains financial and operational covenants, one of which is a minimum production covenant. At 30 November 2012 the Group would have been in breach of one of the operational covenants with respect to minimum monthly production for the US oil and gas assets. Under the terms of the facility agreement, the lenders had the right to declare the outstanding balance of the facility immediately due and payable. However, there was no balance on the debt facility and subsequently, on 21 January 2013, the Group entered into an amendment to the facility agreement which modified the terms of the covenant such that the Group was not in breach with the respective operational covenant. In June 2013, the required minimum production covenant was not met. However, on 28 June 2013, the Group and Wells Fargo entered into a Second Amendment to the Credit Agreement which revised the requirement of the minimum production covenant and a waiver was obtained. With that revision, the Group was no longer in breach of the covenant.
D. Senior Secured Notes
On 12 October 2012, Linc USA GP and Linc Energy Finance (USA), Inc. wholly owned subsidiaries of the parent entity Linc Energy Ltd, issued $258,209,000 (USD$265,000,000) of 12.5% Senior Secured Notes due 31 October 2017. The Notes were issued at 96.402% of their face amount, resulting in net proceeds of $248,918,000 (USD$255,500,000) before discounts and fees. The net proceeds were used to repay $67,000,000 of the line of credit facility and $126,669,000 (USD$130,000,000) to repay the reserve based lending facility. Remaining proceeds will be used to fund capital expenditures and for general corporate purposes.
The interest on the Notes is payable on 30 April and 31 October of each year, beginning on 30 April 2013. The Notes contain covenants, representations and warranties including limitations on distributions to the Group’s non US entities.
The Notes are redeemable by the Group at any time on or after 30 April 2015, at the redemption prices set forth in the Notes indenture.
Notes issue fees of $11,812,000 (USD$12,152,000) were paid in cash and are recognised as an offset against the outstanding liability in the consolidated statement of financial position. The discount of $9,285,000 (USD$9,535,000) is also offset against the liability in the statement of financial position. The fees and discount are then amortised over the period of the term of the facility on an effective interest basis.
A summary of the movements of the facility is below:
2013 2012 2011
$’000 $’000 $’000
Proceeds from notes issue 2248,918 - -
Notes issue fees ((11,812) - -
Amortisation of discount 9978 - -
Amortisation of fees 11,250 - -
Effects of movements in exchange rates 229,583 - -
Carrying amount 2268,917 - -
F-36
For
per
sona
l use
onl
y
Linc Energy LtdNotes to the consolidated financial statements
For the years ended 30 June 2013, 2012 and 2011
37
17. Borrowings (continued) E. Convertible Notes
On 10 April 2013, Linc Energy Ltd raised $190,142,000 (USD$200,000,000) through the issue of Unsecured Convertible Notes due 10 April 2018. A portion of the proceeds were used to repay the Fortress Line of Credit Facility.
The Notes are convertible into ordinary shares of Linc Energy Ltd at the election of note holders at any time on or after 21 May 2013 and ten days prior to 10 April 2018 and are non-callable by the Group for a period of two years. From 21 May 2013 to 21 May 2015, Linc can only settle the conversion of the notes by issuing ordinary shares. After 21 May 2015, Linc can settle the conversion of the notes by issuing ordinary shares or making cash payment as prescribed by a predefined formula.
The Notes bear cash interest at 7% per annum, payable semi-annually in arrears on 10 April and 10 October of each year beginning on 10 October 2013.
Linc has also granted Credit Suisse (Hong Kong) Limited an upsize option to purchase up to an additional $54,747,000 (USD$50,000,000) in principal amount of the Notes, on or before 10 May 2014. The option has been valued at inception using a Monte-Carlo valuation tool at a fair value of $6,655,000 (USD$7,000,000) and forms part of current borrowings. The offset has been recognised as a transaction cost and is offset against the convertible note. The option is subsequently re-valued each reporting period to fair value with any change recognised as part of finance income in profit and loss. At 30 June 2013, the options has been valued at $1,095,000 (USD$1,000,000).
Notes issue fees of $12,136,000 (USD$12,757,000) which include the Credit Suisse capitalised fees are recognised as an offset against the outstanding liability in the consolidated statement of financial position. The fees are amortised over the period of the term of the facility on an effective interest basis.
A summary of the movements of the convertibles notes facility is below: 2013 2012 2011
$’000 $’000 $’000
Proceeds from note issue 1190,142 - -
Notes issue fees ((12,136) - -
Recognise embedded derivative ((48,486) - -
Unwind of notes 11,856 - -
Amortisation of fees 33,646 - -
Difference relating to exchange rate fluctuations 220,093 - -
Carrying amount 1155,115 - -
The convertible notes can be converted to share capital at the option of the holder and the Group can settle the conversion by making either a cash payment to the note holder or settle by the issue of shares. This is known as an embedded derivative and on inception of the note, a Monte-Carlo valuation was performed to determine the note liability component and embedded derivative component.
The liability component of the note is initially recognised at fair value and subsequently recognised at amortised cost using the effective interest rate method. The embedded derivative component is initially measured at fair value and subsequently measured at fair value through profit or loss at the end of each reporting period.
The embedded derivative component was recognised on inception at a fair value of $48,486,000 (USD$51,000,000) and re-valued at the end of the reporting period to fair value of $14,234,000 (USD$13,000,000) using the Monte-Carlo valuation model. The decrease in fair value of $34,252,000 (USD$38,000,000) has been recognised as part of finance income in profit and loss.
A summary of the movements of the embedded derivative liabilities is below:
Notes derivative Credit Suisse option derivative
$’000 $’000
Embedded derivative recognised on inception 448,486 6,655
Fair value through profit and loss adjustment (excluding tax) ((34,252) (5,560)
Closing fair value balance 14,234 1,095
F-37
For
per
sona
l use
onl
y
Linc
Ene
rgy
Not
es to
the
cons
olid
ated
fina
ncia
l sta
tem
ents
Fo
r the
yea
r end
ed 3
0 Ju
ne 2
013
38
17.
Bor
row
ings
(con
tinue
d)
Fina
nce
leas
e lia
bilit
ies
Fina
nce
leas
e lia
bilit
ies
of th
e G
roup
are
pay
able
as
follo
ws:
P
rese
nt
Pre
sent
P
rese
nt
FF
utur
e
Val
ue o
f F
utur
e
Val
ue o
f F
utur
e
Val
ue o
f
mm
inim
um
m
inim
um
min
imum
min
imum
m
inim
um
m
inim
um
lle
ase
le
ase
leas
e
leas
e le
ase
le
ase
ppa
ymen
ts
Inte
rest
pa
ymen
ts
paym
ents
In
tere
st
paym
ents
pa
ymen
ts
Inte
rest
pa
ymen
ts
220
13
2013
20
13
2012
20
12
2012
20
11
2011
20
11
$$’
000
$’00
0 $’
000
$’00
0 $’
000
$’00
0 $’
000
$’00
0 $’
000
Less
than
one
yea
r 776
8 73
69
5 1,
457
102
1,35
5 1,
139
153
986
Bet
wee
n on
e an
d fiv
e ye
ars
6604
27
577
481
36
445
1,27
7 81
1,
196
11,
372
100
1,27
2 1,
938
138
1,80
0 2,
416
234
2,18
2
F-38
For
per
sona
l use
onl
y
Linc Energy Notes to the consolidated financial statements
For the year ended 30 June 2013
39
18. Provisions
Site rehabilitation –
drilling activities
Decommissioning and site
restoration
Oil & gas rehabilitation
Employee entitlements
Total
$’000 $’000 $’000 $’000 $’000
Balance at 1 July 2010 585 1,826 - 1,229 3,640
Provisions utilised during the period (572) - - - (572)
Provisions recognised during the period 142 1,786 2,617 928 5,473
Effect of exchange rate movements - - - - -
Balance at 30 June 2011 155 3,612 2,617 2,157 8,541
Balance at 1 July 2011 155 3,612 2,617 2,157 8,541
Provisions utilised during the period (15) (412) 19,077 - 18,650
Provisions recognised during the period 100 - (81) 532 551
Provision no longer required (141) - - - (141)
Exchange rate movement 1 - 111 9 121
Balance at 1 July 2012 100 3,200 21,724 2,698 27,722
Balance at 1 July 2012 100 3,200 21,724 2,698 27,722
Provisions utilised during the period - - (1,447) - (1,447)
Provisions recognised during the period - (189) 16,615 436 16,862
Effect of exchange rate movements - - 2,441 48 2,489
Balance at 30 June 2013 100 3,011 39,333 3,182 45,626
-
Current 100 - 5,853 2,621 8,574
Non-current - 3,011 33,480 561 37,052
Exploration drilling rehabilitation The current site rehabilitation provision relates to rehabilitation work at the Group’s exploration drilling sites in the Eromanga Basin in North Queensland during the year. Decommissioning and site restoration The non-current site restoration provision allows for the decommissioning and restoration of the Group’s coal-to-liquids technology development facility at Chinchilla on cessation of all activity at that site. Oil and gas rehabilitation The provision relates to the cost of rehabilitating and decommissioning oil field assets and infrastructure such as wells, pipelines and processing facilities. Employee entitlements The current employee entitlements provision relates to accrued wages at 30 June 2013 and accrued annual leave and sick leave entitlements. The non-current provision relates to long service leave entitlements.
F-39
For
per
sona
l use
onl
y
Linc Energy Notes to the consolidated financial statements
For the year ended 30 June 2013
40
19. Other financial liabilities 2013 2012 2011
$’000 $’000 $’000
Current
Commodity swap contracts (oil hedges) 22,691 221 -
Non-current
Commodity swap contracts (oil hedges) -- 162 -
Total other financial liabilities 2,691 383 -
20. Share Capital 22013 2012 2011 22013 2012 2011
NNumber Number Number $’000 $’000 $’000
Share capital
Ordinary shares – fully paid 5519,468,416 509,952,685 506,809,613 3325,388 310,606 309,493
Movements:
Ordinary shares
Opening Balance 5509,952,685 506,809,613 489,674,970 3310,606 309,493 287,388
Shares issued on exercise of options (a) 33,266,797 3,923,167 10,679,337 55,226 3,635 14,950
Shares issued on vesting of performance rights (b) 66,248,934 6,304,905 1,997,044 99,556 9,571 2,574
Shares issued as compensation for drilling activities (c) -- - 30,000 -- - 81
Shares issued in repayment of convertible equity tranches (d) -- - 4,428,262 -- - 4,500
Cancellation of shares from share buy-back (e) -- (7,085,000) - -- (12,093) -
Closing Balance 5519,468,416 509,952,685 506,809,613 3325,388 310,606 309,493
(a) Information relating to the Linc Energy Ltd Employee Option Plan, including details of options issued, exercised and lapsed during the financial year and options outstanding at the end of the financial year, is set out in note 31.
(b) Information relating to the Linc Energy Ltd Performance Rights Plan, including details of rights granted, vested and lapsed during the financial year and rights outstanding at the end of the financial year, is set out in note 31.
(c) In 2011, the Group issued shares to landowners as compensation for drilling activities. (d) The Group entered into a convertible equity facility during the 2010 year. Under the facility, tranches were drawn down
and repaid in shares 31 days later based on the average of the five lowest daily VWAP’s during the tranche period. The final tranche was repaid on the 27 July 2010 via the issue of 4,428,262 shares. The facility was terminated in October 2010 with no tranche outstanding.
(e) On 12 September 2011, Linc Energy Ltd announced its intention to conduct an on-market buy-back of up to five per cent of the Company’s fully paid ordinary shares as part of its capital management strategy due to the opportunity presented by the Company’s share price at the time. The buy-back commenced on 26 September 2011 and concluded on 26 September 2012. 7,085,000 shares were bought back and cancelled during the 2012 financial year for a total consideration of $12,093,000. No further shares were bought back during the 2013 financial year.
Ordinary shares Ordinary shares entitle the holder to participate in dividends and then proceeds on winding up of the Company in proportion to the number of and amounts paid on the shares held. On a show of hands every holder of ordinary shares present at a meeting in person or by proxy, is entitled to one vote, and upon a poll each share is entitled to one vote. The Company does not have authorised capital and ordinary shares have no par value.
F-40
For
per
sona
l use
onl
y
Linc Energy Notes to the consolidated financial statements
For the year ended 30 June 2013
41
20. Share Capital (continued)
Capital risk management The Group’s objectives when managing its ordinary share capital are to ensure its ability to continue as a going concern and to maintain an optimal capital structure and cost of capital appropriate to the stage of development of the Group’s business. The Group is currently seeking to raise additional debt finance and to dispose of part or all of its interests in certain non-core assets to provide for its future funding requirements. There are no externally imposed capital requirements on Linc Energy Ltd, however the Company’s subsidiary located in Uzbekistan, JSPC Yerostigaz is intermittently subject to government mandated recapitalisation programs for foreign controlled companies. Linc Energy fully participates in these recapitalisations to ensure it maintains or increases its ownership interest in the company. There were no recapitalisations this reporting period (2012: Nil) (2011: Nil). Shares issued on exercise of options 3,266,797 shares were issued during the year as a result of the exercise of options (2012: 3,923,167) (2011: 10,679,337). The total cash received by the Group from the exercise of options was $3,234,316 (2012: $2,133,058) (2011: $7,555,145). Since the end of the financial year no shares have been issued as a result of the exercise of options.
Shares issued on vesting of performance rights 6,248,934 shares were issued during the year as a result of vested performance rights (2012: 6,304,905) (2011: 1,997,044). No consideration was received. Since the end of the financial year 2,825,725 shares have been issued as a result of the vesting of performance rights.
2013 2012 2011
$’000 $’000 $’000
21. Reserves Share-based payments reserve 330,316 28,516 28,868
Other reserves 55,309 5,309 5,309
Available-for-sale reserve 44,427 (2,169) 5,726
Foreign currency translation reserve 330,407 (119) 474
70,459 31,537 40,377
Nature and purpose of reserves
Share-based payments reserve
The share-based payment reserve is used to recognise the fair value of options granted to employees and suppliers. It also recognises the fair value of performance rights issued to employees but not yet vested.
Other reserves The other reserve represents amounts recognised directly in equity in respect of transactions with other shareholders in Group companies. In 2010, Linc Energy Ltd increased its interest in subsidiary JSPC Yerostigaz from 73% to 91.6% through the purchase of new shares with a total cost of $521,601. The transactions with other shareholders amount in the other reserve balance represents the relative transfer of value to / from the non-controlling interest as a result of the transaction. The other reserve account also contains the remaining balance transferred from the convertible note reserve following the termination of the convertible note facility and the redemption of all outstanding notes. This amount will remain in other reserves indefinitely. Available-for-sale reserve The available-for-sale reserve represents changes in the fair value and exchange differences arising on translation of investments, such as equities, classified as available-for-sale financial assets. The amounts will only be recognised in profit and loss when the associated assets are sold or impaired.
Foreign currency translation
Exchange differences arising on translation of the foreign controlled entity are taken to the foreign currency translation reserve, as described in note 1(x). The reserve is recognised in profit and loss when the net investment is disposed of.
22. Dividends No dividends were declared or paid in the reporting period. (2012: No dividend declared or paid) (2011: The special dividend was fully franked at a rate of 30% at 10 cents per share. The total amount of $49,642,674 was paid on 8 October 2010. No dividends were paid by the Company in the prior year.)
F-41
For
per
sona
l use
onl
y
Linc Energy Notes to the consolidated financial statements
For the year ended 30 June 2013
42
23. Retained earnings Movements in retained earnings were as follows:
2013 2012 2011
$’000 $’000 $’000
Balance at start of the year 101,903 163,794 (83,018)
Dividends paid -- - (49,643)
Net profit / (loss) for the year ((63,805) (61,891) 296,455
Balance at the end of the year 338,098 101,903 163,794
24. Earnings per share
22013 2012 2011
Cents Cents Cents Basic earnings per share
Profit (loss) attributable to the ordinary equity holders of the Company ((12.40) (12.18) 59.27
Diluted earnings per share
Profit (loss) attributable to the ordinary equity holders of the Company (12.40) (12.18) 57.71
Number Number Number
Weighted average number of ordinary shares
Issued shares at 1 July 5509,952,685 506,809,613 489,674,970
Effect of shares issued during the period 44,759,783 1,333,519 10,529,277
Weighted average number of ordinary shares at 30 June 5514,712,468 508,143,132 500,204,247
Weighted average number of ordinary shares (diluted)
Weighted average number of ordinary shares at 30 June 5514,712,468 508,143,132 500,204,247
Effect of conversion of share options on issue -- - 6,127,776
Effect of conversion of share rights on issue -- - 7,385,508
Weighted average number of ordinary shares (diluted) at 30 June 5514,712,468 508,143,132 513,717,531
2013 $’000
2012 $’000
2011 $’000
Profit / (loss) from continuing operations attributable to ordinary shareholders (basic) (63,805) (61,891) 296,455
Profit / (loss) from continuing operations attributable to ordinary shareholders (diluted) (63,805) (61,891) 296,455
Impact of transactions subsequent to year end Subsequent to the end of each financial year, the Company issued 2,825,725 shares (2012: 1,495,966) (2011: 1,678,058) from the vesting of performance rights. The Company also granted a further 510,921 (2012: 1,782,079) (2011: 1,772,821) rights under the Performance Rights Plan to new and existing employees of the Group. These ordinary share transactions and potential ordinary share transactions would have changed the number of ordinary shares and potential ordinary shares outstanding at the end of the financial year if those transactions had occurred before the end of the reporting period each year.
F-42
For
per
sona
l use
onl
y
Linc Energy Notes to the consolidated financial statements
For the year ended 30 June 2013
43
25. Commitments and operating leases
Capital expenditure
Capital commitments of $5,319,000 (2012: $5,728,000) (2011: $15,403,000) are payable within one year of balance date and relate to contractual expenditure for exploration and evaluation or coal-to-liquids technology development committed but not yet incurred. In addition, the Group has certain obligations to conduct exploration activities in its coal and petroleum tenements (see below).
Operating lease commitments as lessee
Lease commitments contracted but not recognised as liabilities are for non-cancellable operating leases of office premises and office equipment. All finance leases have been recognised in both Current and Non-Current Liabilities. Refer to note 16 for further details.
Commitments in relation to operating leases contracted for at the reporting date but not recognised as liabilities payable:
2013 2012 2011
$’000 $’000 $’000
Within one year 11,369 1,977 1,918
Later than one year but not later than five years 11,171 3,117 4,504
Later than five years 6686 746 -
3,226 5,840 6,422
The Group leases a number of office premises under operating leases. Leases typically run for between two and six years with an option to renew for a similar term. The leases generally provide for additional rental payments that are based on CPI or market reviews with minimum escalation rates.
Tenement commitments
Tenement commitments relate to the rental and expenditure components of the agreements.
2013 2012 2011
$’000 $’000 $’000
Within one year 33,614 4,196 4,492
Later than one year but not later than five years 226,025 24,849 10,189
Later than five years 3386 592 296
30,025 29,637 14,977
Tenement commitments are not contractual obligations and may be subject to negotiation, deferment or modification. Failure to meet tenement activity or spending commitments within permitted timeframes may result in the relinquishment of parts of, or all of, a tenement.
Port commitments
Port commitments that relate to the take or pay arrangement with Gladstone Port Corporation contracted for at the reporting date but not recognised as liabilities and payable:
2013 2012 2011
$’000 $’000 $’000
Within one year 114,537 - -
Later than one year but not later than five years 553,875 - -
Later than five years 1115,447 - -
183,859 - -
F-43
For
per
sona
l use
onl
y
Linc Energy Notes to the consolidated financial statements
For the year ended 30 June 2013
44
26. Financial instruments Overview Overall responsibility for financial risk management rests with the Audit and Risk Management Committee of the Board of Directors. This committee has responsibility for ensuring the effectiveness of the organisation’s financial risk management system, including the approval of associated policies. The Finance group is responsible for the development of policy and the implementation of practices and processes for the management of financial risk. Credit risk Credit risk arises mainly from cash and cash equivalents, deposits with banks and financial institutions and trade and other receivables. This risk is managed by depositing funds with credible and independently rated institutions with a minimum S&P credit rating of AA and maximum thresholds for the proportion of investable funds to be held with any one institution. None of the trade and other receivables or other financial assets are deemed to be impaired. Exposure to credit risk The carrying amount of financial assets represents the maximum credit exposure. The maximum exposure to credit risk at the reporting date was:
Carrying amount
2013 2012 2011
NNote $$’000 $’000 $’000
Cash and cash equivalents 6 1124,007 25,680 310,343
Trade and other receivables 7 778,626 32,839 8,510
Other financial assets 15 9988 - 1,656
2203,621 58,519 320,509
The maximum exposure to credit risk for cash and cash equivalents at the reporting date held by geographic region was:
Carrying amount
2013 2012 2011
$$’000 $’000 $’000
Australia 1118,330 18,956 199,815
USA 55,293 6,583 110,236
Europe 3348 91 271
Asia 336 50 21
Total cash and cash equivalents 1124,007 25,680 310,343
The majority of cash and cash equivalents (2013: $118,314,000) (2012: $18,953,000) (2011: $199,808,000) is being held by two of the Big Four Banks in Australia who have AA credit ratings. The maximum exposure to credit risk for trade and other receivables at the reporting date held by geographic region was:
Carrying amount
2013 2012 2011
$$’000 $’000 $’000
Australia 119,049 6,038 5,610
USA 558,889 26,420 2,394
Europe 3384 239 226
Asia 3304 142 280
Total trade and other receivables 778,626 32,839 8,510
Trade and other receivables is predominately comprised of US receivables of $58,900,000 of which $32,597,000 is due from the Alaskan Government for tax credits arising from the winter Umiat drilling program. The remaining balance of US receivables is primarily from oil and gas revenue which is paid in the following month after delivery. There are no known significant past due or impaired assets as at 30 June 2013 (2012: Nil) (2011: Nil).
F-44
For
per
sona
l use
onl
y
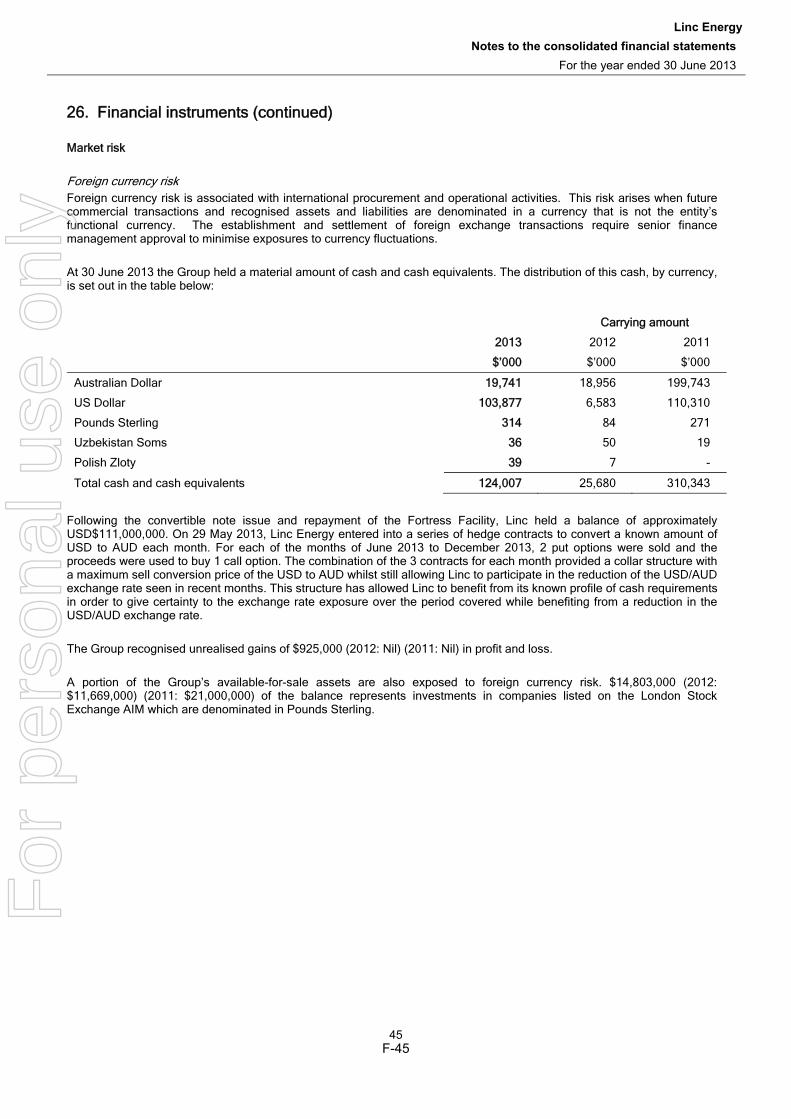
Linc Energy Notes to the consolidated financial statements
For the year ended 30 June 2013
45
26. Financial instruments (continued) Market risk Foreign currency risk Foreign currency risk is associated with international procurement and operational activities. This risk arises when future commercial transactions and recognised assets and liabilities are denominated in a currency that is not the entity’s functional currency. The establishment and settlement of foreign exchange transactions require senior finance management approval to minimise exposures to currency fluctuations. At 30 June 2013 the Group held a material amount of cash and cash equivalents. The distribution of this cash, by currency, is set out in the table below:
Carrying amount
2013 2012 2011
$$’000 $’000 $’000
Australian Dollar 119,741 18,956 199,743
US Dollar 1103,877 6,583 110,310
Pounds Sterling 3314 84 271
Uzbekistan Soms 336 50 19
Polish Zloty 339 7 -
Total cash and cash equivalents 1124,007 25,680 310,343
Following the convertible note issue and repayment of the Fortress Facility, Linc held a balance of approximately USD$111,000,000. On 29 May 2013, Linc Energy entered into a series of hedge contracts to convert a known amount of USD to AUD each month. For each of the months of June 2013 to December 2013, 2 put options were sold and the proceeds were used to buy 1 call option. The combination of the 3 contracts for each month provided a collar structure with a maximum sell conversion price of the USD to AUD whilst still allowing Linc to participate in the reduction of the USD/AUD exchange rate seen in recent months. This structure has allowed Linc to benefit from its known profile of cash requirements in order to give certainty to the exchange rate exposure over the period covered while benefiting from a reduction in the USD/AUD exchange rate. The Group recognised unrealised gains of $925,000 (2012: Nil) (2011: Nil) in profit and loss. A portion of the Group’s available-for-sale assets are also exposed to foreign currency risk. $14,803,000 (2012: $11,669,000) (2011: $21,000,000) of the balance represents investments in companies listed on the London Stock Exchange AIM which are denominated in Pounds Sterling.
F-45
For
per
sona
l use
onl
y
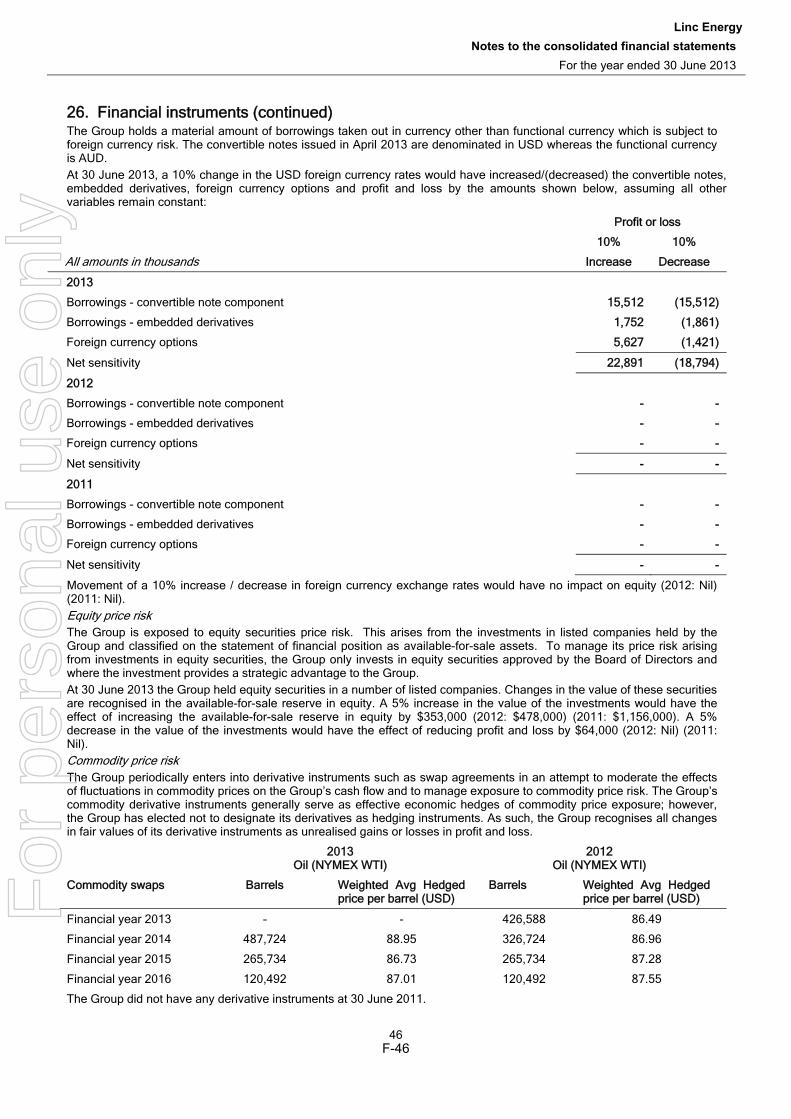
Linc Energy Notes to the consolidated financial statements
For the year ended 30 June 2013
46
26. Financial instruments (continued) The Group holds a material amount of borrowings taken out in currency other than functional currency which is subject to foreign currency risk. The convertible notes issued in April 2013 are denominated in USD whereas the functional currency is AUD. At 30 June 2013, a 10% change in the USD foreign currency rates would have increased/(decreased) the convertible notes, embedded derivatives, foreign currency options and profit and loss by the amounts shown below, assuming all other variables remain constant:
Profit or loss
10% 10%
All amounts in thousands Increase Decrease
2013
Borrowings - convertible note component 115,512 (15,512)
Borrowings - embedded derivatives 11,752 (1,861)
Foreign currency options 5,627 (1,421)
Net sensitivity 22,891 (18,794)
2012
Borrowings - convertible note component -- -
Borrowings - embedded derivatives -- -
Foreign currency options - -
Net sensitivity - -
2011
Borrowings - convertible note component -- -
Borrowings - embedded derivatives -- -
Foreign currency options - -
Net sensitivity - -
Movement of a 10% increase / decrease in foreign currency exchange rates would have no impact on equity (2012: Nil) (2011: Nil). Equity price risk The Group is exposed to equity securities price risk. This arises from the investments in listed companies held by the Group and classified on the statement of financial position as available-for-sale assets. To manage its price risk arising from investments in equity securities, the Group only invests in equity securities approved by the Board of Directors and where the investment provides a strategic advantage to the Group. At 30 June 2013 the Group held equity securities in a number of listed companies. Changes in the value of these securities are recognised in the available-for-sale reserve in equity. A 5% increase in the value of the investments would have the effect of increasing the available-for-sale reserve in equity by $353,000 (2012: $478,000) (2011: $1,156,000). A 5% decrease in the value of the investments would have the effect of reducing profit and loss by $64,000 (2012: Nil) (2011: Nil). Commodity price risk The Group periodically enters into derivative instruments such as swap agreements in an attempt to moderate the effects of fluctuations in commodity prices on the Group’s cash flow and to manage exposure to commodity price risk. The Group’s commodity derivative instruments generally serve as effective economic hedges of commodity price exposure; however, the Group has elected not to designate its derivatives as hedging instruments. As such, the Group recognises all changes in fair values of its derivative instruments as unrealised gains or losses in profit and loss.
2013 Oil (NYMEX WTI)
2012 Oil (NYMEX WTI)
Commodity swaps Barrels Weighted Avg Hedged price per barrel (USD)
Barrels Weighted Avg Hedged price per barrel (USD)
Financial year 2013 - - 426,588 86.49
Financial year 2014 487,724 88.95 326,724 86.96
Financial year 2015 265,734 86.73 265,734 87.28
Financial year 2016 120,492 87.01 120,492 87.55
The Group did not have any derivative instruments at 30 June 2011.
F-46
For
per
sona
l use
onl
y
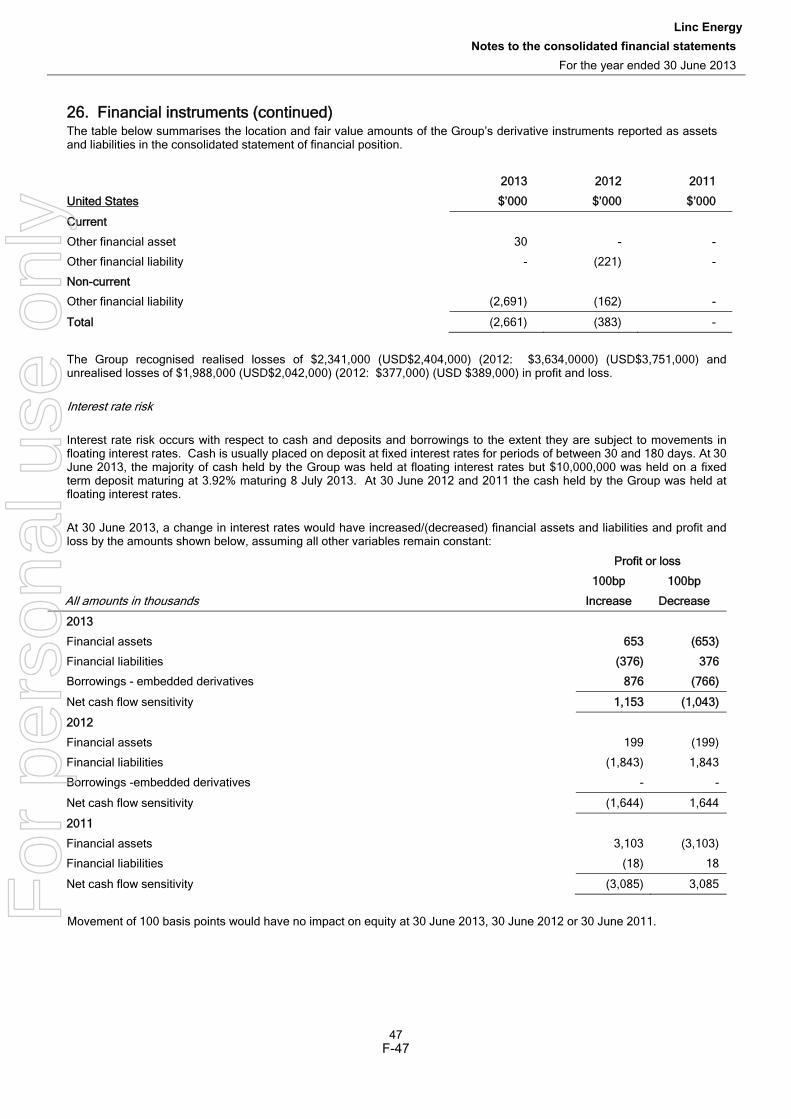
Linc Energy Notes to the consolidated financial statements
For the year ended 30 June 2013
47
26. Financial instruments (continued) The table below summarises the location and fair value amounts of the Group’s derivative instruments reported as assets and liabilities in the consolidated statement of financial position.
2013 2012 2011
United States $’000 $’000 $’000
Current
Other financial asset 30 - -
Other financial liability - (221) -
Non-current
Other financial liability (2,691) (162) -
Total (2,661) (383) -
The Group recognised realised losses of $2,341,000 (USD$2,404,000) (2012: $3,634,0000) (USD$3,751,000) and unrealised losses of $1,988,000 (USD$2,042,000) (2012: $377,000) (USD $389,000) in profit and loss. Interest rate risk Interest rate risk occurs with respect to cash and deposits and borrowings to the extent they are subject to movements in floating interest rates. Cash is usually placed on deposit at fixed interest rates for periods of between 30 and 180 days. At 30 June 2013, the majority of cash held by the Group was held at floating interest rates but $10,000,000 was held on a fixed term deposit maturing at 3.92% maturing 8 July 2013. At 30 June 2012 and 2011 the cash held by the Group was held at floating interest rates. At 30 June 2013, a change in interest rates would have increased/(decreased) financial assets and liabilities and profit and loss by the amounts shown below, assuming all other variables remain constant:
Profit or loss
100bp 100bp
All amounts in thousands Increase Decrease
2013
Financial assets 653 (653)
Financial liabilities (376) 376
Borrowings - embedded derivatives 8876 (766)
Net cash flow sensitivity 1,153 (1,043)
2012
Financial assets 199 (199)
Financial liabilities (1,843) 1,843
Borrowings -embedded derivatives - -
Net cash flow sensitivity (1,644) 1,644
2011
Financial assets 3,103 (3,103)
Financial liabilities (18) 18
Net cash flow sensitivity (3,085) 3,085
Movement of 100 basis points would have no impact on equity at 30 June 2013, 30 June 2012 or 30 June 2011.
F-47
For
per
sona
l use
onl
y
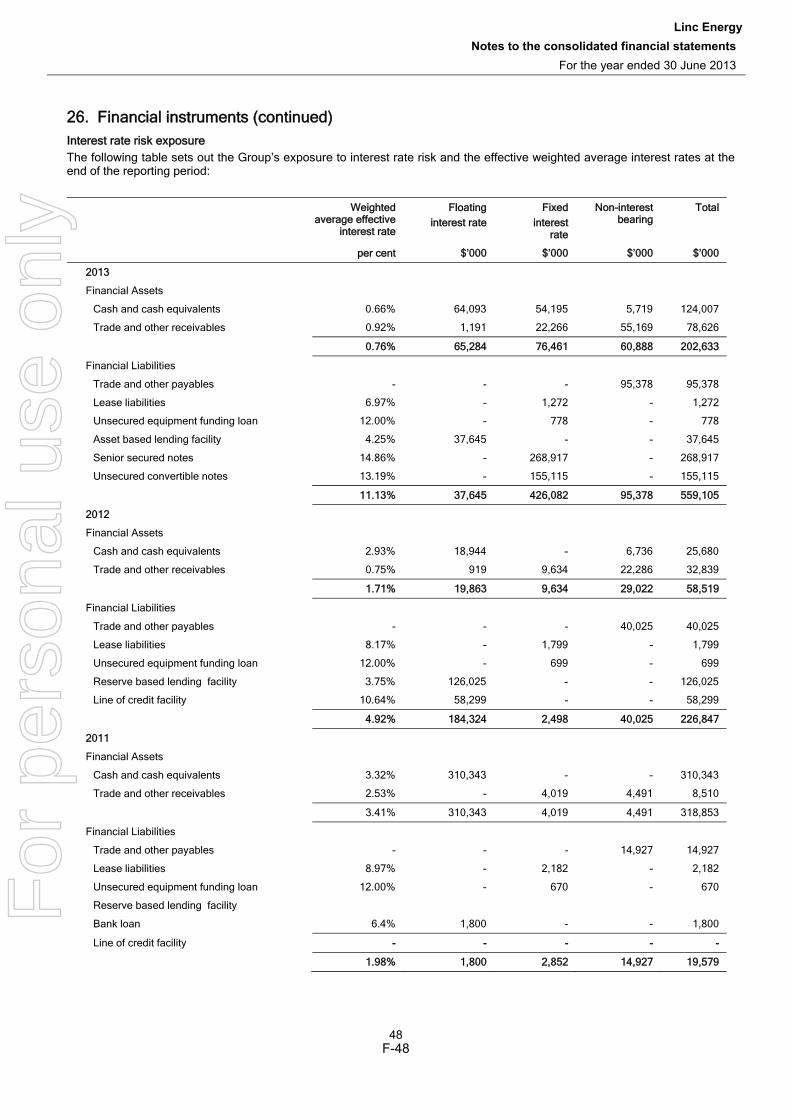
Linc Energy Notes to the consolidated financial statements
For the year ended 30 June 2013
48
26. Financial instruments (continued) Interest rate risk exposure The following table sets out the Group’s exposure to interest rate risk and the effective weighted average interest rates at the end of the reporting period:
Weighted average effective
interest rate
Floating interest rate
Fixed interest
rate
Non-interest bearing
Total
per cent $’000 $’000 $’000 $’000
2013
Financial Assets
Cash and cash equivalents 0.66% 64,093 54,195 5,719 124,007
Trade and other receivables 0.92% 1,191 22,266 55,169 78,626
00.76% 65,284 76,461 60,888 202,633
Financial Liabilities
Trade and other payables - - - 95,378 95,378
Lease liabilities 6.97% - 1,272 - 1,272
Unsecured equipment funding loan 12.00% - 778 - 778
Asset based lending facility 4.25% 37,645 - - 37,645
Senior secured notes 14.86% - 268,917 - 268,917
Unsecured convertible notes 13.19% - 155,115 - 155,115
111.13% 337,645 426,082 95,378 559,105
2012
Financial Assets
Cash and cash equivalents 2.93% 18,944 - 6,736 25,680
Trade and other receivables 0.75% 919 9,634 22,286 32,839
11.71% 19,863 9,634 29,022 58,519
Financial Liabilities
Trade and other payables - - - 40,025 40,025
Lease liabilities 8.17% - 1,799 - 1,799
Unsecured equipment funding loan 12.00% - 699 - 699
Reserve based lending facility 3.75% 126,025 - - 126,025
Line of credit facility 10.64% 58,299 - - 58,299
44.92% 1184,324 2,498 40,025 226,847
2011
Financial Assets
Cash and cash equivalents 3.32% 310,343 - - 310,343
Trade and other receivables 2.53% - 4,019 4,491 8,510
3.41% 310,343 4,019 4,491 318,853
Financial Liabilities
Trade and other payables - - - 14,927 14,927
Lease liabilities 8.97% - 2,182 - 2,182
Unsecured equipment funding loan 12.00% - 670 - 670
Reserve based lending facility
Bank loan 6.4% 1,800 - - 1,800
Line of credit facility -- - - - -
11.98% 1,800 2,852 14,927 19,579
F-48
For
per
sona
l use
onl
y
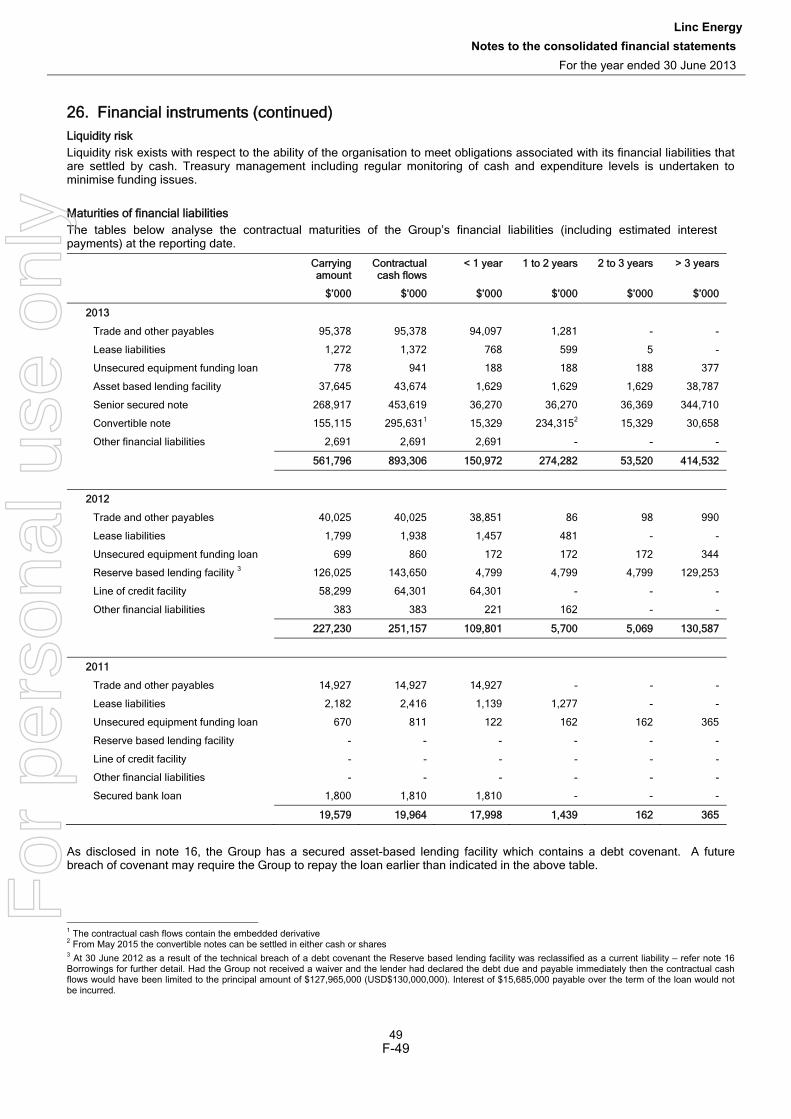
Linc Energy Notes to the consolidated financial statements
For the year ended 30 June 2013
49
26. Financial instruments (continued) Liquidity risk Liquidity risk exists with respect to the ability of the organisation to meet obligations associated with its financial liabilities that are settled by cash. Treasury management including regular monitoring of cash and expenditure levels is undertaken to minimise funding issues. Maturities of financial liabilities The tables below analyse the contractual maturities of the Group’s financial liabilities (including estimated interest payments) at the reporting date.
Carrying amount
Contractual cash flows
< 1 year 1 to 2 years 2 to 3 years > 3 years
$’000 $’000 $’000 $’000 $’000 $’000
2013
Trade and other payables 95,378 95,378 94,097 1,281 - -
Lease liabilities 1,272 1,372 768 599 5 -
Unsecured equipment funding loan 778 941 188 188 188 377
Asset based lending facility 37,645 43,674 1,629 1,629 1,629 38,787
Senior secured note 268,917 453,619 36,270 36,270 36,369 344,710
Convertible note 155,115 295,6311 15,329 234,3152 15,329 30,658
Other financial liabilities 2,691 2,691 2,691 - - -
5561,796 893,306 150,972 274,282 53,520 414,532
2012
Trade and other payables 40,025 40,025 38,851 86 98 990
Lease liabilities 1,799 1,938 1,457 481 - -
Unsecured equipment funding loan 699 860 172 172 172 344
Reserve based lending facility 3 126,025 143,650 4,799 4,799 4,799 129,253
Line of credit facility 58,299 64,301 64,301 - - -
Other financial liabilities 383 383 221 162 - -
2227,230 251,157 109,801 5,700 5,069 130,587
2011
Trade and other payables 14,927 14,927 14,927 - - -
Lease liabilities 2,182 2,416 1,139 1,277 - -
Unsecured equipment funding loan 670 811 122 162 162 365
Reserve based lending facility - - - - - -
Line of credit facility - - - - - -
Other financial liabilities - - - - - -
Secured bank loan 1,800 1,810 1,810 - - -
119,579 19,964 17,998 1,439 162 365
As disclosed in note 16, the Group has a secured asset-based lending facility which contains a debt covenant. A future breach of covenant may require the Group to repay the loan earlier than indicated in the above table.
1 The contractual cash flows contain the embedded derivative 2 From May 2015 the convertible notes can be settled in either cash or shares 3 At 30 June 2012 as a result of the technical breach of a debt covenant the Reserve based lending facility was reclassified as a current liability – refer note 16 Borrowings for further detail. Had the Group not received a waiver and the lender had declared the debt due and payable immediately then the contractual cash flows would have been limited to the principal amount of $127,965,000 (USD$130,000,000). Interest of $15,685,000 payable over the term of the loan would not be incurred.
F-49
For
per
sona
l use
onl
y
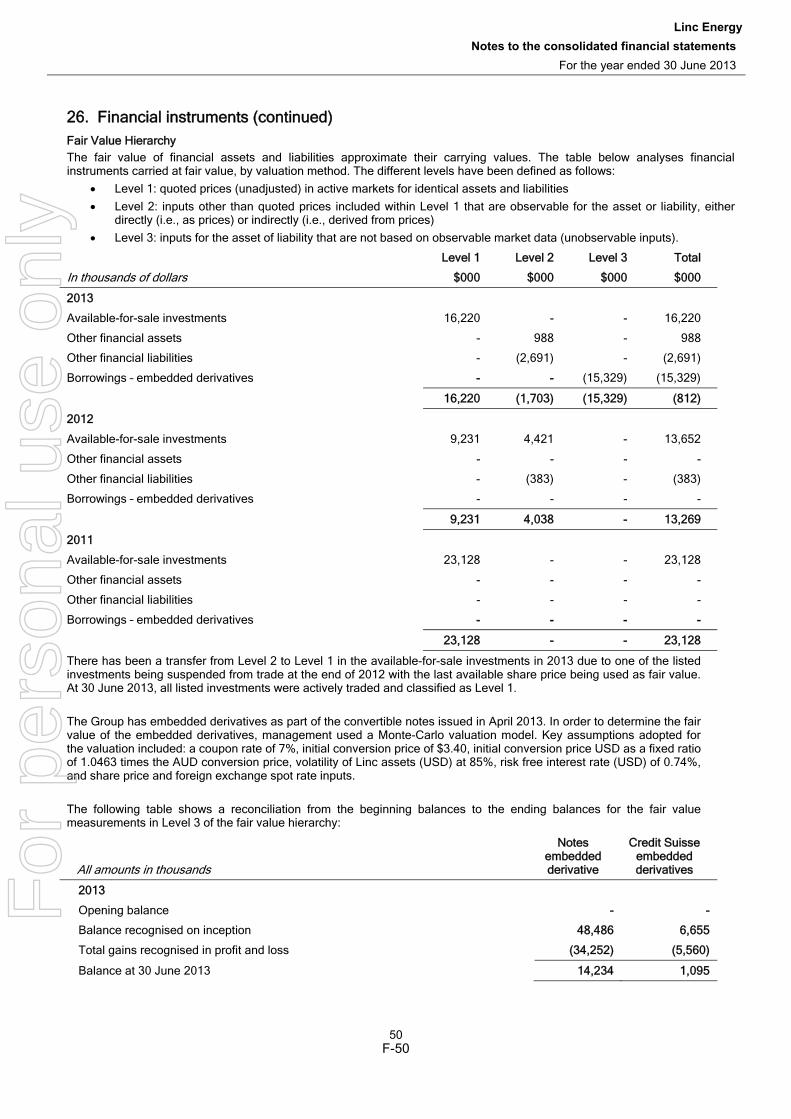
Linc Energy Notes to the consolidated financial statements
For the year ended 30 June 2013
50
26. Financial instruments (continued) Fair Value Hierarchy The fair value of financial assets and liabilities approximate their carrying values. The table below analyses financial instruments carried at fair value, by valuation method. The different levels have been defined as follows:
Level 1: quoted prices (unadjusted) in active markets for identical assets and liabilities Level 2: inputs other than quoted prices included within Level 1 that are observable for the asset or liability, either directly (i.e., as prices) or indirectly (i.e., derived from prices) Level 3: inputs for the asset of liability that are not based on observable market data (unobservable inputs).
LLevel 1 Level 2 Level 3 Total
In thousands of dollars $000 $000 $000 $000
2013
Available-for-sale investments 16,220 - - 16,220
Other financial assets - 988 - 988
Other financial liabilities - (2,691) - (2,691)
Borrowings – embedded derivatives -- - (15,329) (15,329)
116,220 (1,703) (15,329) (812)
2012
Available-for-sale investments 9,231 4,421 - 13,652
Other financial assets - - - -
Other financial liabilities - (383) - (383)
Borrowings – embedded derivatives - - - -
99,231 4,038 - 13,269
2011
Available-for-sale investments 23,128 - - 23,128
Other financial assets - - - -
Other financial liabilities - - - -
Borrowings – embedded derivatives -- - - -
223,128 - - 23,128
There has been a transfer from Level 2 to Level 1 in the available-for-sale investments in 2013 due to one of the listed investments being suspended from trade at the end of 2012 with the last available share price being used as fair value. At 30 June 2013, all listed investments were actively traded and classified as Level 1. The Group has embedded derivatives as part of the convertible notes issued in April 2013. In order to determine the fair value of the embedded derivatives, management used a Monte-Carlo valuation model. Key assumptions adopted for the valuation included: a coupon rate of 7%, initial conversion price of $3.40, initial conversion price USD as a fixed ratio of 1.0463 times the AUD conversion price, volatility of Linc assets (USD) at 85%, risk free interest rate (USD) of 0.74%, and share price and foreign exchange spot rate inputs. The following table shows a reconciliation from the beginning balances to the ending balances for the fair value measurements in Level 3 of the fair value hierarchy:
All amounts in thousands
Notes embedded derivative
Credit Suisse embedded derivatives
2013
Opening balance - -
Balance recognised on inception 448,486 6,655
Total gains recognised in profit and loss ((34,252) (5,560)
Balance at 30 June 2013 114,234 1,095
F-50
For
per
sona
l use
onl
y

Linc Energy Notes to the consolidated financial statements
For the year ended 30 June 2013
51
27. Operating segments Reportable segments The Group’s operating segments were restructured in 2012 to provide better strategic focus going forward. This restructure resulted in four reportable segments, each being led by a divisional president. The Group’s has four reportable segments, each being led by a divisional president. The reportable segments are:
Oil and Gas – exploration, development and production of traditional oil and gas assets in North America. Coal – acquisition, exploration and development of the Group’s significant coal resources. Clean Energy – development and commercialisation of Coal-to-Liquids (CTL) processes through the combined utilisation of Underground Coal Gasification (UCG) and Gas to Liquids (GTL) technologies. SAPEX – exploration of the Group’s petroleum exploration tenements in South Australia.
The divisional presidents are accountable for their division’s financial performance and maintain regular contact with the chief operating decision maker (CODM). The Group’s Chief Executive Officer who is the chief operating decision maker reviews internally generated management reports on at least a monthly basis. Information regarding the results of each reportable segment is included in the table on the following page.
F-51
For
per
sona
l use
onl
y
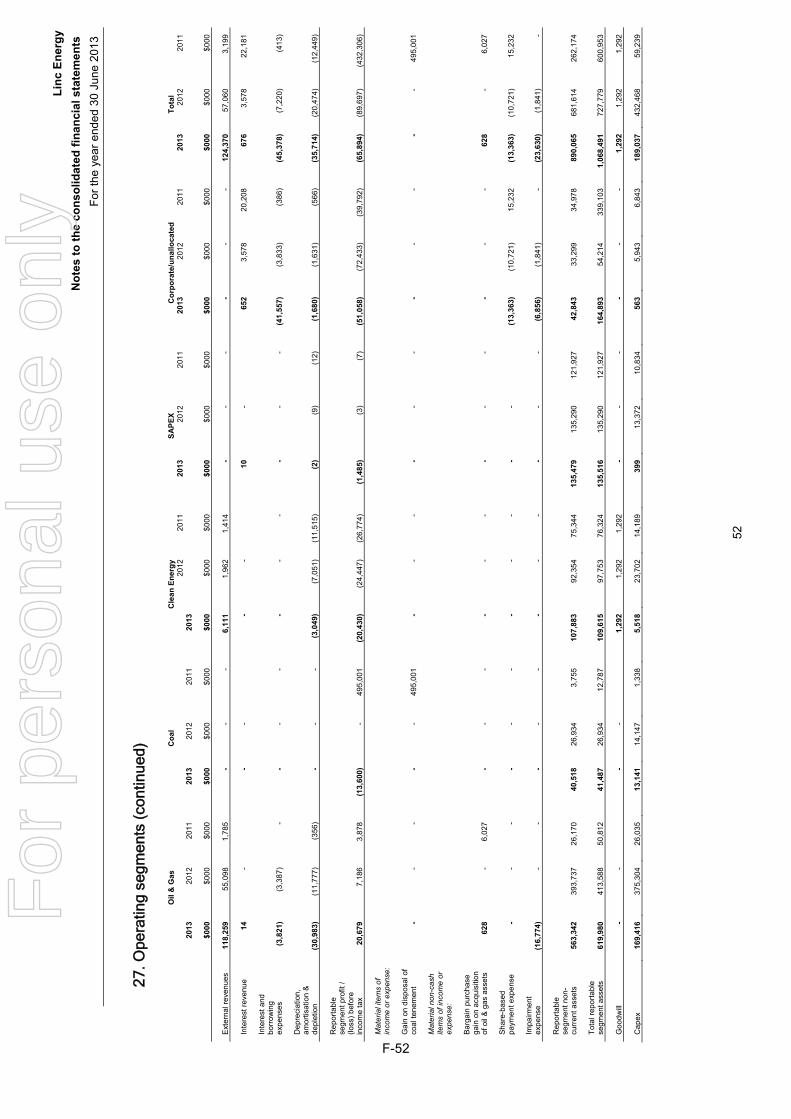
Linc
Ene
rgy
Not
es to
the
cons
olid
ated
fina
ncia
l sta
tem
ents
Fo
r the
yea
r end
ed 3
0 Ju
ne 2
013
52
27. O
pera
ting
segm
ents
(con
tinue
d)
Oil
& G
asC
oal
Cle
an E
nerg
ySA
PEX
Cor
pora
te/u
nallo
cate
dTo
tal
2013
20
12
2011
20
13
2012
20
11
2013
20
12
2011
20
13
2012
20
11
2013
2012
20
11
2013
2012
20
11
$000
$0
00
$000
$0
00
$000
$0
00
$000
$0
00
$000
$0
00
$000
$0
00
$000
$0
00
$000
$0
00
$000
$0
00
Ext
erna
l rev
enue
s 11
8,25
9 55
,098
1,
785
--
- 6,
111
1,96
2 1,
414
--
- -
- -
124,
370
57,0
60
3,19
9
Inte
rest
reve
nue
14
--
--
-10
-
652
3,57
8 20
,208
67
6 3,
578
22,1
81
Inte
rest
and
bo
rrow
ing
expe
nses
(3
,821
) (3
,387
) -
--
- -
- -
--
- (4
1,55
7)
(3,8
33)
(386
) (4
5,37
8)
(7,2
20)
(413
)
Dep
reci
atio
n,
amor
tisat
ion
&
depl
etio
n (3
0,98
3)
(11,
777)
(3
56)
--
- (3
,049
) (7
,051
) (1
1,51
5)
(2)
(9)
(12)
(1
,680
) (1
,631
) (5
66)
(35,
714)
(2
0,47
4)
(12,
449)
Rep
orta
ble
segm
ent p
rofit
/ (lo
ss) b
efor
e in
com
e ta
x 20
,679
7,
186
3,87
8 (1
3,60
0)
-49
5,00
1 (2
0,43
0)
(24,
447)
(2
6,77
4)
(1,4
85)
(3)
(7)
(51,
058)
(7
2,43
3)
(39,
792)
(6
5,89
4)
(89,
697)
(4
32,3
06)
Mat
eria
l ite
ms
of
inco
me
or e
xpen
se:
Gai
n on
dis
posa
l of
coal
tene
men
t -
- -
--
495,
001
--
- -
- -
--
- -
- 49
5,00
1
Mat
eria
l non
-cas
h ite
ms
of in
com
e or
ex
pens
e:
Bar
gain
pur
chas
e ga
in o
n ac
quis
ition
of
oil
& ga
s as
sets
62
8 -
6,02
7 -
- -
--
- -
- -
--
- 62
8 -
6,02
7
Sha
re-b
ased
pa
ymen
t exp
ense
-
- -
--
- -
- -
--
(13,
363)
(1
0,72
1)
15,2
32
(13,
363)
(1
0,72
1)
15,2
32
Impa
irmen
t ex
pens
e (1
6,77
4)
- -
--
- -
- -
--
- (6
,856
) (1
,841
) -
(23,
630)
(1
,841
) -
Rep
orta
ble
segm
ent n
on-
curr
ent a
sset
s 56
3,34
2 39
3,73
7 26
,170
40
,518
26
,934
3,
755
107,
883
92,3
54
75,3
44
135,
479
135,
290
121,
927
42,8
43
33,2
99
34,9
78
890,
065
681,
614
262,
174
Tota
l rep
orta
ble
segm
ent a
sset
s 61
9,98
0 41
3,58
8 50
,812
41
,487
26
,934
12
,787
10
9,61
5 97
,753
76
,324
13
5,51
6 13
5,29
0 12
1,92
7 16
4,89
3 54
,214
33
9,10
3 1,
068,
491
727,
779
600,
953
Goo
dwill
-
--
-1,
292
1,29
2 1,
292
--
- -
- -
1,29
2 1,
292
1,29
2
Cap
ex
169,
416
375,
304
26,0
35
13,1
41
14,1
47
1,33
8 5,
518
23,7
02
14,1
89
399
13,3
72
10,8
34
563
5,94
3 6,
843
189,
037
432,
468
59,2
39
F-52
For
per
sona
l use
onl
y
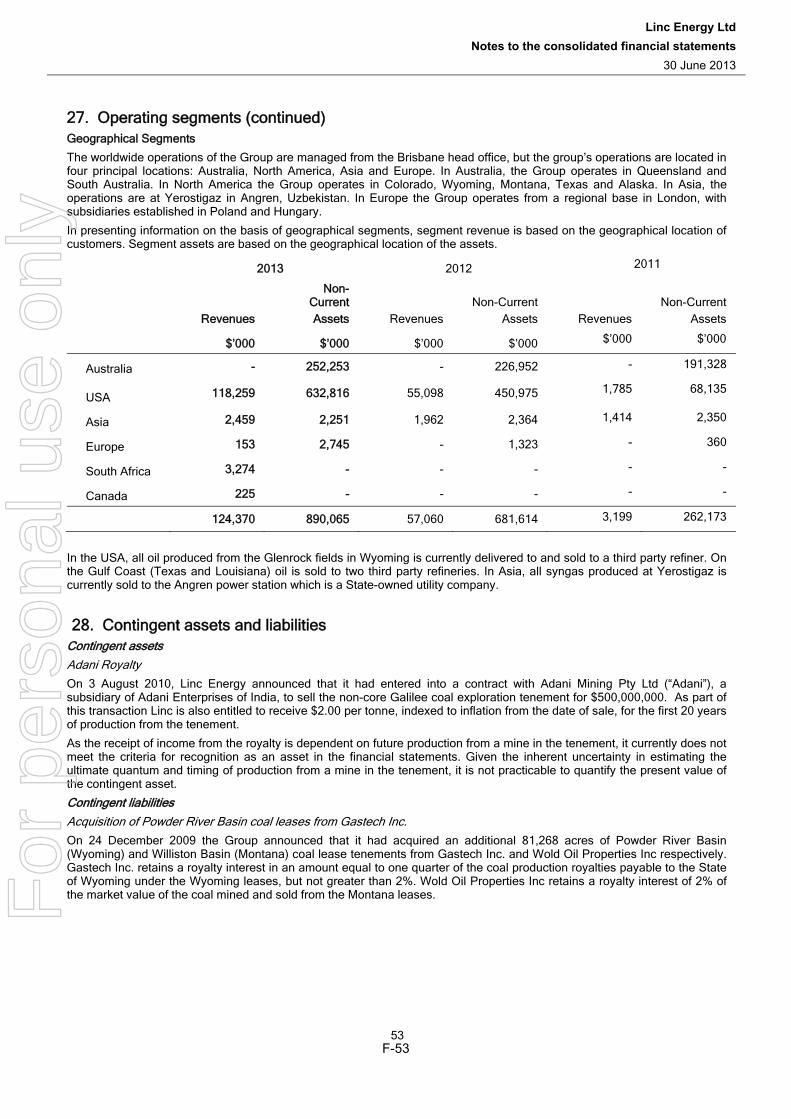
Linc Energy Ltd Notes to the consolidated financial statements
30 June 2013
53
27. Operating segments (continued) Geographical Segments
The worldwide operations of the Group are managed from the Brisbane head office, but the group’s operations are located in four principal locations: Australia, North America, Asia and Europe. In Australia, the Group operates in Queensland and South Australia. In North America the Group operates in Colorado, Wyoming, Montana, Texas and Alaska. In Asia, the operations are at Yerostigaz in Angren, Uzbekistan. In Europe the Group operates from a regional base in London, with subsidiaries established in Poland and Hungary.
In presenting information on the basis of geographical segments, segment revenue is based on the geographical location of customers. Segment assets are based on the geographical location of the assets.
2013 2012 2011
Revenues
Non-Current Assets Revenues
Non-Current Assets Revenues
Non-Current Assets
$’000 $’000 $’000 $’000 $’000 $’000
Australia - 252,253 - 226,952 - 191,328
USA 118,259 632,816 55,098 450,975 1,785 68,135
Asia 2,459 2,251 1,962 2,364 1,414 2,350
Europe 153 2,745 - 1,323 - 360
South Africa 3,274 - - - - -
Canada 225 - - - - -
124,370 890,065 57,060 681,614 3,199 262,173
In the USA, all oil produced from the Glenrock fields in Wyoming is currently delivered to and sold to a third party refiner. On the Gulf Coast (Texas and Louisiana) oil is sold to two third party refineries. In Asia, all syngas produced at Yerostigaz is currently sold to the Angren power station which is a State-owned utility company.
28. Contingent assets and liabilities Contingent assets Adani Royalty On 3 August 2010, Linc Energy announced that it had entered into a contract with Adani Mining Pty Ltd (“Adani”), a subsidiary of Adani Enterprises of India, to sell the non-core Galilee coal exploration tenement for $500,000,000. As part of this transaction Linc is also entitled to receive $2.00 per tonne, indexed to inflation from the date of sale, for the first 20 years of production from the tenement.
As the receipt of income from the royalty is dependent on future production from a mine in the tenement, it currently does not meet the criteria for recognition as an asset in the financial statements. Given the inherent uncertainty in estimating the ultimate quantum and timing of production from a mine in the tenement, it is not practicable to quantify the present value of the contingent asset.
Contingent liabilities Acquisition of Powder River Basin coal leases from Gastech Inc. On 24 December 2009 the Group announced that it had acquired an additional 81,268 acres of Powder River Basin (Wyoming) and Williston Basin (Montana) coal lease tenements from Gastech Inc. and Wold Oil Properties Inc respectively. Gastech Inc. retains a royalty interest in an amount equal to one quarter of the coal production royalties payable to the State of Wyoming under the Wyoming leases, but not greater than 2%. Wold Oil Properties Inc retains a royalty interest of 2% of the market value of the coal mined and sold from the Montana leases.
F-53
For
per
sona
l use
onl
y
Linc Energy Ltd Notes to the consolidated financial statements
30 June 2013
54
28. Contingent assets and liabilities (continued) Acquisition of Alaskan oil and gas leases from GeoPetro Alaska LLC
On 2 March 2010 the Group acquired 123,000 acres of oil & gas leases in the Cook Inlet Basin in Alaska from GeoPetro Alaska LLC. An additional $3,937,000 (USD$4,000,000) will be payable from the proceeds of any successful production from the acquired leases. Following payment GeoPetro will also be entitled to an overriding royalty of between 7 to 10 per cent of the value of commercial production from the leases.
Legal claims and other assets or liabilities As at 30 June 2013 there was one legal claim pending against the Group in relation to the assets acquired from ERG Resources LLC (“ERG”). ERG alleges certain breaches of the acquisition agreement. Linc Energy has filed a counterclaim. Linc Energy considers that the legal claim will not result in a material liability to the Group. The directors are not aware of any other contingent assets or liabilities. As at 30 June 2013, the maximum amount quantifiable in relation to litigation and associated legal fees that had not already been provided or accrued for in the financial statements was $Nil (2012: $Nil) (2011: $Nil).
29. Business combinations Rancher Energy Corp On 15 March 2011, Linc Energy Petroleum (Wyoming), Inc, a wholly owned subsidiary of Linc Energy Ltd, acquired three producing oil fields along with certain employees and related assets from Rancher Energy Corp, securing immediate oil production. The total consideration for the acquisition was US$18,203,000 ($18,268,000) while the fair value of the net identifiable assets acquired was US$24,208,000 ($24,295,000). This resulted in a bargain purchase gain of US$6,005,461 ($6,027,000). This gain resulted from the fair value of unproved oil & gas properties previously written off by the vendor who was in bankruptcy. The fair value of proved oil & gas properties was based on an independent third party reserve analysis prepared by Ryder Scott Company, while unproved reserves were valued per acre based on comparable transactions in Wyoming in 2011.
2011 Assets acquired
Carrying amount $’000s
Fair value adjustments
$’000s
Fair value $’000
Inventory 746 (328) 418
Property, plant and equipment 83 - 83
Oil and gas plant and equipment 13 - 13
Oil and gas assets 15,808 8,618 24,426
Liabilities (Rehabilitation provision, other payables) (394) (251) (645)
Net identifiable assets 16,256 8,039 24,295
Purchase consideration paid in cash (18,268)
Bargain purchase gain (6,027)
Had the assets been acquired at 1 July 2010 and held for the full year to 30 June 2011, the estimated impact on the Group’s revenue from oil sales would have been an increase of $3,700,000, with a resulting increase in operating profit of $1,400,000. Linc incurred transaction costs of $334,784 which have been recognised in profit and loss in accordance with AASB 3 Business Combinations. ERG Resources LLC
On 11 October 2011, Linc Gulf Coast Petroleum, Inc. a wholly owned subsidiary of Linc Energy USA, acquired thirteen oil and gas fields in Texas and Louisiana along with related assets and certain employees from ERG Resources LLC, securing immediate oil production. The effective date of the purchase was 1 October 2011.
Total consideration for the acquisition was $264,230,000 (USD$261,350,000) of which $254,697,000 (USD$251,920,000) was paid during the current period to complete the acquisition. The fair value of the proved oil and gas properties was based on comparable Gulf Coast transactions and a risk adjusted third party reserve report prepared by Haas Petroleum Engineering Services, Inc. The fair value of the related oil and gas assets such as compression, transportation, and processing facilities was based on a third party valuation analysis prepared by WCG Consulting, LLC.
The Group has accrued $217,954 (USD$221,419) for potential claims associated with unpaid vendors who performed services prior to the acquisition date on behalf of ERG Resources, LLC. While the Group has been indemnified against all such claims and judgments by the seller, it may be required to settle future claims for continued operational purposes. Also, in accordance with the purchase and sale agreement, Linc Gulf Coast Petroleum, Inc. is required to reimburse ERG Resources, LLC for costs related to the Higgins #18 well which was drilled and completed by ERG Resources, LLC prior to the close date on behalf of Linc Gulf Coast Petroleum, Inc. The Group accrued $1,445,383 (USD$1,468,365) for the expected costs at 30 June 2012.
F-54
For
per
sona
l use
onl
y
Linc Energy Ltd Notes to the consolidated financial statements
30 June 2013
55
29. Business combinations (continued)
2012 Assets acquired
Carrying amount $’000s
Fair value adjustments
$’000s
Fair value $’000
Property, plant and equipment 222 - 222 Oil and gas plant and equipment 17,509 - 17,509 Oil and gas assets (producing) 261,132 - 261,132
Other assets 3,883 - 3,883
Liabilities (2,443) - (2,443)
Asset retirement obligation (16,073) - (16,073) Net identifiable assets 264,230 - 264,230 Purchase consideration paid in cash - (264,230)
Had the assets been acquired at 1 July 2011, the estimated impact on the Group’s revenue for 2012 from oil sales would have been an increase of $12,593,238, with a resulting increase in net profit of $9,202,751. Transaction costs of $1,948,924 (USD$2,011,874) were incurred which have been recognised in profit and loss in accordance with AASB 3 Business Combinations.
No acquisitions occurred during the year ended 30 June 2013.
F-55
For
per
sona
l use
onl
y
Linc Energy Ltd Notes to the consolidated financial statements
30 June 2013
56
1 Companies incorporated in Uzbekistan must have a balance date of 31 December. # (formerly Renaissance Alaska, LLC)
30. Subsidiaries The consolidated financial statements incorporate the assets, liabilities and results of the following subsidiaries:
Entity Balance Date Country of
incorporation Class of
shares 2013
% 2012
% 2011
%
JSPC Yerostigaz 31 December1 Uzbekistan Ordinary 91.6 91.6 91.6
Better Air LLC 31 December1 Uzbekistan Ordinary 100 100 100
SAPEX Limited 30 June Australia Ordinary 100 100 100
Linc Carbon Solutions Pty Ltd 30 June Australia Ordinary 100 100 100
Linc Energy Operations Pty Ltd 30 June Australia Ordinary 100 100 100
New Emerald Coal Ltd (formerly Teresa Coal Pty Ltd) 30 June Australia Ordinary 100 100 100
New Emerald Coal Operations Pty Ltd 30 June Australia Ordinary 100 100 -
New Pentland Coal Pty Ltd 30 June Australia Ordinary 100 100 -
Linc Energy (Africa) Pty Ltd (formerly Linc Energy Property Pty Ltd) 30 June Australia Ordinary 100 100 -
Linc Energy GP1 Pty Ltd 30 June Australia Ordinary 100 - -
Linc Energy GP2 Pty Ltd 30 June Australia Ordinary 100 - -
Linc Energy Operations (Africa) Proprietary Limited 28 Feb Africa Ordinary 100 - -
Linc USA Inc. 30 June USA Ordinary - 100 100
Linc USA GP 30 June USA Ordinary 100 - -
Linc Energy Finance (USA), Inc 30 June USA Ordinary 100 - -
Linc Energy Resources, Inc 30 June USA Ordinary 100 100 -
Linc Clean Energy, Inc 30 June USA Ordinary 100 100 100
Linc Energy (Wyoming), Inc 30 June USA Ordinary 100 100 100
Linc Energy (Montana), Inc 30 June USA Ordinary 100 100 100
Linc Energy (Alaska), Inc 30 June USA Ordinary 100 100 100
Linc Energy Operations Inc. 30 June USA Ordinary 100 100 100
Linc Energy Petroleum (Wyoming), Inc 30 June USA Ordinary 100 100 100
Linc Gulf Coast Petroleum, Inc 30 June USA Ordinary 100 100 100
Pean Insula, LLC 30 June USA Ordinary 100 100 -
Diasu Holdings, LLC 30 June USA Ordinary 100 100 -
Diasu Oil & Gas, Inc 30 June USA Ordinary 100 100 -
Linc Energy Petroleum Lousiana, LLC 30 June USA Ordinary 100 100 -
Linc Energy Lousiana, LLC 30 June USA Ordinary 100 100 -
Linc Alaska Resources, LLC (formerly Renaissance Alaska, LLC)# 30 June USA Ordinary 100 100 -
Renaissance Umiat, LLC 30 June USA Ordinary 84.5 84.5 -
Linc Energy (Europe) Ltd 30 June United Kingdom Ordinary 100 100 100
Linc Energy Operations Ltd 30 June United Kingdom Ordinary 100 100 100
Linc Energy (Africa) Ltd (formerly Linc Energy (UK) Ltd) 30 June United Kingdom Ordinary 100 100 100
Linc Energy (Poland) (sp.z.o.o.) 30 June Poland Ordinary 100 100 100
Linc Energy (Asia) Pte Ltd 30 June Singapore Ordinary 100 100 100
Linc Energy (Asia) 2 Pte Ltd 30 June Singapore Ordinary 100 100 100
F-56
For
per
sona
l use
onl
y
Linc Energy Ltd Notes to the consolidated financial statements
30 June 2013
57
31. Share-based payments
Employee option plan
The establishment of the Linc Energy Ltd Employee Option Plan was approved by Shareholders at the 2005 Annual General Meeting. This plan was replaced by the Performance Rights Plan with effect from the 2009 Annual General Meeting. However the option plan continues to operate until all outstanding options have vested. Options were granted at the discretion of the Board in accordance with the rules of the plan and all staff employed by the Company or its subsidiaries were eligible to participate in the plan.
As determined by the Board, a minimum continuous period of employment (usually twelve months) with the Company or any of its subsidiaries must be served prior to the first exercise date, which falls on 31st December annually. The option exercise price is set at the discretion of the Board, but is generally the ten day volume weighted average price (VWAP) of Linc Energy Ltd shares traded on the ASX following commencement of employment with the Group. Subject to ongoing employment by the Company or any of its subsidiaries, options are exercisable over three consecutive years from the initial exercise date, with one-third of the total options awarded exercisable each year.
Options granted under the plan carry no dividend or voting rights. When exercisable, each option is convertible into one ordinary share.
The assessed fair value at grant date was independently determined using a Black-Scholes option pricing model that took into account the exercise price, the term of the option, the share price at grant date and expected price volatility of the underlying share, the expected dividend yield and the risk free interest rate for the term of the option.
No options were granted during the reporting period.
Financial year of grant
Expiry date Exercise price range
Balance at start of year
Granted Exercised or transferred
Forfeited1 Balance at end of year
Exercisable at end of the
year
2013 $ Number Number Number Number Number Number
30 Jun 2010 31 Dec 14 1.45 to 1.79 2,672,164 - (163,333) (1,935,500) 573,331 573,331
30 Jun 2009 31 Dec 14 0.59 to 3.16 3,564,662 - (777,133) (1,668,335) 1,119,194 1,119,194
30 Jun 2008 31 Dec 13 0.60 to 2.55 2,663,331 - (2,046,333) (129,999) 486,999 486,999
30 Jun 2007 31 Dec 12 0.25 to 0.60 279,998 - (279,998) - - -
Total 9,180,155 - (3,266,797) (3,733,834) 2,179,524 2,179,524
Weighted average exercise price $ 1.52 0.00 0.99 1.79 1.86 1.86 1Forfeited includes options that have lapsed or cancelled due to termination
Financial year of grant
Expiry date Exercise price range
Balance at start of year
Granted Exercised or transferred
Forfeited1 Balance at end of year
Exercisable at end of the
year
2012 $ Number Number Number Number Number Number
30 Jun 2010 31 Dec 14 1.45 to 1.79 6,540,497 - (205,000) (3,663,333) 2,672,164 1,625,501
30 Jun 2009 31 Dec 14 0.59 to 3.16 8,267,999 - (255,000) (4,448,337) 3,564,662 3,385,996
30 Jun 2008 31 Dec 13 0.60 to 2.55 3,803,333 - (1,133,334) (6,668) 2,663,331 2,663,331
30 Jun 2007 31 Dec 12 0.25 to 0.60 2,609,831 - (2,329,833) - 279,998 279,998
Total 21,221,660 - (3,923,167) (8,118,338) 9,180,155 7,954,826
Weighted average exercise price $ 1.66 0.00 0.53 2.35 1.53 1.53 1Forfeited includes options that have lapsed or cancelled due to termination.
F-57
For
per
sona
l use
onl
y
Linc Energy Ltd Notes to the consolidated financial statements
30 June 2013
58
31. Share-based payments (continued)
Financial year of grant
Expiry date Exercise price range
Balance at start of year
Granted Exercised or transferred
Forfeited1 Balance at end of year
Exercisable at end of the
year
2011 $ Number Number Number Number Number Number
30 Jun 2011 27 May 13 0.25 - 500,000 (500,000) - - -
30 Jun 2010 31 Dec 15 0.66 to 1.95 8,348,365 - (1,056,171) (751,697) 6,540,497 3,873,836
30 Jun 2009 31 Dec 14 0.25 to 3.16 11,514,668 - (1,948,336) (1,298,333) 8,267,999 5,960,674
30 Jun 2008 31 Dec 13 0.60 to 2.55 6,601,666 - (2,771,667) (26,666) 3,803,333 3,150,001
30 Jun 2007 31 Dec 12 0.25 to 0.60 7,012,996 - (4,403,163) (2) 2,609,831 2,609,831
Total 33,477,695 500,000 (10,679,337) (2,076,698) 21,221,660 15,594,342
Weighted average exercise price $ 0.96 0.25 0.69 1.89 1.66 1.62 1Forfeited includes options that have lapsed or cancelled due to termination.
During 2013 3,266,797 (2012: 3,923,167) (2011: 10,679,337) options were exercised. The weighted average share price at the dates of exercise was $0.99 (2012: $0.53) (2011: $0.69).
On 6 September 2012, FCCD (Australia) Pty Limited were granted 5,112,991 warrants as part of changes to the terms of the Fortress Line of Credit Facility. The fair value of the warrants on this day, totalling $3,016,663.69, has been recognised as an expense.
During the year ended 30 June 2011, in addition to options granted to employees under the Employee Option Plan, the following share based payment transactions occurred during the reporting period:
Shares issued as compensation for drilling activities The Group negotiates access to landholders’ property in accordance with government guidelines on the payment of compensation to land owners for disturbance. Linc Energy offers land owners a choice as to how they receive their compensation - either $1,000 cash or Linc Energy shares to the value of $2,000. The number of shares issued is based on the market price on the date of completion of drilling. 30,000 (2010: 2,063) shares with a fair value of $81,000 (2010: $4,000) were issued to landowners during the year.
Performance Rights Plan
The establishment of the Linc Energy Employee Performance Rights Plan was approved by Shareholders at the 2009 Annual General Meeting. Under the Plan, the Board may from time to time invite a full time employee or executive director of the Company or any wholly owned subsidiary or controlled entity of the Company whom the Board decides in its absolute discretion is eligible to be invited to receive a grant of Rights in the Plan, to participate in the Plan and grant the eligible employee a right to acquire fully paid ordinary shares in the Company on conversion of the right as part of the eligible employee’s remuneration.
Rights typically vest in either three or four equal tranches over a period of three and half to four and half years with the first tranche vesting twelve months from the successful completion of an employee’s six month probation period. The number of Rights granted to an employee is determined at the discretion of the Board and is generally based on a formula taking into account an employee’s base salary and the Company’s share price at the time of grant. Rights are granted to employees at no cost but may include non-market-based performance conditions. Rights automatically convert to shares on the vesting dates provided all vesting conditions have been met.
The fair value of the rights is determined based on Linc’s closing share price at the date of grant.
Rights granted under the plan carry no dividend or voting rights until they convert to ordinary shares. 9,123,603 Performance Rights were granted during the period (2012: 6,543,756) (2011: 13,790,899).
Share rights were issued to a fixed term contractor during the financial year, with the option to be settled via equity or cash, dependent upon the employment status at the time of vesting. The first tranche vested during the period and were cash settled due to the individual’s employment status remaining as a contractor. The employment status has now changed to permanent employee and the remaining two tranches will be equity settled.
F-58
For
per
sona
l use
onl
y
Linc Energy Ltd Notes to the consolidated financial statements
30 June 2013
59
31. Share-based payments (continued) Performance rights granted Set out below is a summary of performance rights granted during the year:
Financial year of grant
Financial year of vesting date
Balance at start of year
Granted Vested and converted into
equity
Vested and paid in cash
Forfeited1 Balance at end of year
Number Number Number Number Number Number
2013
30 June 2013 30 June 2013 - 1,130,936 (1,095,010) (8,392) - 27,534
30 June 2014 - 2,207,659 - - (33,308) 2,174,351
30 June 2015 - 1,885,063 - - (37,740) 1,847,323
30 June 2016 - 1,709,495 - - (37,740) 1,671,755
30 June 2017 - 1,462,809 - - (37,740) 1,425,069
30 June 2018 - 717,404 - - (4,432) 712,972
30 June 2012 30 June 2012 50,000 - (50,000) - - -
30 June 2013 989,561 10,237 (744,009) - (128,812) 126,977
30 June 2014 1,458,225 - (6,757) - (237,786) 1,213,682
30 June 2015 1,108,216 - (6,756) - (237,780) 863,680
30 June 2016 828,040 - - - (139,319) 688,721
30 June 2017 374,459 - - - (106,355) 268,104
30 Jun 2011 30 June 2012 100,000 - (100,000) - - -
30 June 2013 3,008,140 - (2,791,617) - (112,582) 103,941
30 June 2014 1,741,066 - - - (153,196) 1,587,870
30 June 2015 671,036 - - - (95,181) 575,855
30 Jun 2010 30 June 2013 1,468,543 - (1,454,785) - (13,758) -
30 June 2014 216,104 - - - (63,969) 152,135
Total 12,013,390 9,123,603 (6,248,934) (8,392) (1,439,698) 13,439,969 1Forfeited rights are due to employees ceasing employment.
2012
30 June 2012 30 June 2012 - 1,066,333 (1,016,333) - - 50,000
30 June 2013 - 1,178,221 - - (190,433) 987,788
30 June 2014 - 1,651,858 - - (193,633) 1,458,225
30 June 2015 - 1,301,844 - - (193,628) 1,108,216
30 June 2016 - 936,067 - - (108,027) 828,040
30 June 2017 - 409,433 - - (33,201) 376,232
30 Jun 2011 30 June 2012 4,324,524 - (3,977,481) - (247,043) 100,000
30 June 2013 4,117,871 - (10,811) - (1,098,920) 3,008,140
30 June 2014 2,850,797 - - - (1,109,731) 1,741,066
30 June 2015 1,170,354 - - - (499,318) 671,036
30 Jun 2010 30 June 2012 1,458,379 - (1,279,605) - (178,774) -
30 June 2013 1,708,372 - (20,675) - (219,154) 1,468,543
30 June 2014 453,401 - - - (237,297) 216,104
Total 16,083,698 6,543,756 (6,304,905) - (4,309,159) 12,013,390
F-59
For
per
sona
l use
onl
y
Linc Energy Ltd Notes to the consolidated financial statements
30 June 2013
60
31. Share-based payments (continued)
Financial year of grant
Financial year of vesting date
Balance at start of year
Granted Vested and converted
Vested and paid in cash
Forfeited1 Balance at end of year
2011
30 June 2011 30 June 2011 - 992,075 (992,075) - - -
30 June 2012 - 4,444,290 - - (119,766) 4,324,524
30 June 2013 - 4,224,631 - - (106,759) 4,117,872
30 June 2014 - 2,957,631 - - (106,759) 2,850,872
30 June 2015 - 1,172,348 - - (1,993) 1,170,355
30 Jun 2010 30 June 2011 1,019,969 - (1,004,969) - (15,000) -
30 June 2012 1,934,606 - - - (476,227) 1,458,379
30 June 2013 2,184,599 - - - (476,227) 1,708,372
30 June 2014 914,627 - - - (461,226) 453,401
Total 6,053,801 13,790,975 (1,997,044) - (1,763,957) 16,083,775
Expenses arising from share-based payment transactions
Expenses arising from share-based payment transactions recognised during the period totalled $13,363,000 (2012: $10,721,270) (2011: $15,232,470).
32. Related party transactions 2013 2012 2011
$ $ $
Key management personnel compensation
Short-term employee benefits 44,581,905 4,135,460 2,738,776
Post-employment benefits 3365,509 314,709 217,861
Long-term benefits 119,091 30,390 13,102
Share-based payments 33,496,786 5,000,008 5,881,202
8,463,291 9,480,567 8,850,941
Loans to key management personnel
On 16 December 2011, a loan of $250,000 was provided to Ken Dark, a Non-Executive Independent Director, for the purposes of exercising options granted under the Employee Share Plan. The loan was provided on commercial terms, with interest calculated monthly at a current rate of 10.08 per cent. The loan is repayable no later than four years from the date of the loan and is secured by a holding lock over the shares. As at 30 June 2013 the outstanding balance of the loan is $238,220 (2012: $250,000) (2011: $Nil).
On 22 August 2012, an agreement was entered into to provide a loan of up to $249,917 (£150,000) to Hillgrove Pty Ltd, a company controlled by Managing Director Peter Bond, for the purposes of providing short term funding to Powerhouse Energy Plc. During the reporting period an amendment was made to the original contract, extending the amount of the loan by an additional $16,661 (£10,000). The loan was provided on commercial terms, with interest calculated monthly at a current rate of 10.08 per cent. The loan is repayable no later than four years from the date of the loan. Linc Energy retains the right to take over this loan from Hillgrove Pty Ltd. At the end of the reporting period the outstanding balance of the loan including interest is $284,708 (£170,882).
Transactions with key management personnel and directors Directors, Mr P. Bond, Mr C Ricato, and Mr K. Dark, and Key Management Personnel Mr D. Smith, hold positions in other entities that result in them having control or significant influence over the financial and operating policies of those entities. These entities have transacted with the Group in the reporting period. The terms and conditions of the transactions with these entities were no more favourable than those available, or which might reasonably be expected to be available, on similar transactions to non-key management personnel related entities on an arm’s length basis. The aggregate value of transactions and outstanding balances relating to key management personnel and entities over which they have control of significant influence were as follows:
F-60
For
per
sona
l use
onl
y
Linc
Ene
rgy
Ltd
Not
es to
the
cons
olid
ated
fina
ncia
l sta
tem
ents
30
Jun
e 20
13
61
32.
Rel
ated
par
ty tr
ansa
ctio
ns (c
ontin
ued)
P
ayab
le tr
ansa
ctio
ns w
ith k
ey m
anag
emen
t per
sonn
el a
nd d
irect
ors
T
rans
actio
ns v
alue
yea
r end
ed 3
0 Ju
ne
Bal
ance
out
stan
ding
as
at 3
0 Ju
ne
Key
M
anag
emen
t P
erso
n R
elat
ed p
arty
ent
ity
Tra
nsac
tion
2013
$ 20
12 $
2011
$ 20
13
$
2012
$ 20
11 $
Pet
er B
ond
Bon
d B
ros
Con
trac
ting
Pty
Lt
d E
xecu
tive
serv
ices
1,
008,
333
824,
633
583,
000
-- -
-
B
ond
Air
Cha
rter
s P
ty L
td
Cha
rter
ed fl
ight
s 117
3,20
1 48
0,18
8 25
9,14
0 22,
067
42,8
95
2,58
4
R
ough
Dia
mon
d M
edia
Pty
Lt
d D
ocum
enta
ry fi
lm
2,91
3 67
,897
50
,000
--
- 50
,000
A
ustr
alia
n S
ynga
s A
ssoc
iatio
n M
embe
rshi
p
44,0
00
11,0
00
11,0
00
-- -
-
Cra
ig R
icat
o E
xecu
tive
Man
agem
ent
Ser
vice
s D
iscr
etio
nary
Tru
st
Exe
cutiv
e se
rvic
es
633,
072
555,
940
297,
713
-- -
-
Bria
n Jo
hnso
n F
erro
us M
etal
s P
ty L
td
Dire
ctor
s fe
es
-- -
4,16
7 --
- -
F
erro
us M
etal
s P
ty L
td
Rei
mbu
rsem
ent o
f exp
ense
s --
- 76
3 --
- -
Ken
Dar
k K
E &
SL
Dar
k E
xecu
tive
serv
ices
116
6,44
0 12
9,80
9 -
114,2
38
65,6
81
-
K
E &
SL
Dar
k R
eim
burs
emen
t of e
xpen
ses
-- 12
,369
-
-- -
-
Dav
id S
mith
D
ame
Con
sulti
ng
Exe
cutiv
e se
rvic
es
4412,
500
378,
125
- 334
,375
34
,375
-
* A
ll V
alue
s ar
e G
ST
Incl
usiv
e
Rec
eiva
ble
tran
sact
ions
with
key
man
agem
ent p
erso
nnel
and
dire
ctor
s
Key
M
anag
emen
t P
erso
n R
elat
ed p
arty
ent
ity
Tra
nsac
tion
2013
$ 20
12 $
2011
$ 20
13
$
2012
$ 20
11 $
Pet
er B
ond
Pet
er B
ond
Rei
mbu
rsem
ent o
f exp
ense
s 661
,931
32
,408
333
,447
-
76,6
81
44,2
73
B
ond
Bro
s C
ontr
actin
g P
ty
Ltd
Rei
mbu
rsem
ent o
f exp
ense
s -
- --
3,20
0 3,
200
3,20
0
Ken
Dar
k K
E &
SL
Dar
k Lo
an
-- 25
0,00
0 --
238,
220
250,
000
-
Don
Sch
ofie
ld
Don
Sch
ofie
ld
Rei
mbu
rsem
ent o
f exp
ense
s 224
,337
-
26
,056
1,
719
Pet
er B
ond
Hill
grov
e P
ty L
td
Loan
228
4,70
8 -
-- 28
4,70
8 -
-
* A
ll V
alue
s ar
e G
ST
Incl
usiv
e
F-61
For
per
sona
l use
onl
y
Linc Energy Ltd Notes to the consolidated financial statements
30 June 2013
62
32. Related party transactions (continued) Options over equity instruments The movement during the reporting period in the number of options over ordinary shares in Linc Energy Ltd held, directly, indirectly or beneficially, by each key management person, including their related parties, is as follows:
Name Expiry date 1 Exercise price
Balance at start of year3
Granted Exercised Disposed 2 Forfeited/ expired
Balance at end of year4
$ Number Number Number Number Number Number
2013
C. Ricato 31 Dec 2012 0.70 500,000 - (500,000) - - -
A. Rohner 31 Dec 2014 1.53 1,533,333 - - - (1,533,333) -
K. Terblanche 31 Dec 2013 1.91 1,333,333 - (360,000) (150,000) (666,667) 156,666
D. Smith 31 Dec 2013 2.98 400,000 - - - (200,000) 200,000
D. Schofield 31 Dec 2014 0.76 666,666 - - (666,666) - -
J. Van de Velde
31 Dec 2012 0.60 200,000 - - (200,000) - -
J. Van de Velde
31 Dec 2013 3.16 100,000 - - - - 100,000
44,733,332 - (860,000) (1,016,666) (2,400,000) 456,666
Weighted average exercise price $ 1.58 - 1.21 0.90 1.76 2.65
2012
K. Dark 31 Dec 2011 0.25 1,000,000 - (1,000,000) - - -
C. Ricato 31 Dec 2012 0.70 500,000 - - - - 500,000
A. Rohner 31 Dec 2014 1.53 1,733,333 - - (200,000) - 1,533,333
K. Terblanche 31 Dec 2013 1.91 1,700,000 - - - (366,667) 1,333,333
D. Smith 31 Dec 2013 2.98 600,000 - - - (200,000) 400,000
D. Schofield 31 Dec 2014 0.76 1,150,000 - - (483,334) - 666,666
J. Van de Velde
31 Dec 2011 0.25 193,166 - (125,500) (67,600) - -
J. Van de Velde
31 Dec 2012 0.60 400,000 - - (200,000) - 200,000
J. Van de Velde
31 Dec 2013 3.16 100,000 - - - - 100,000
77,376,499 - (1,125,500) (950,934) (566,667) 4,607,332
Weighted average exercise price $ 1.32 0.00 0.25 0.85 2.29 1.56
F-62
For
per
sona
l use
onl
y
Linc Energy Ltd Notes to the consolidated financial statements
30 June 2013
63
32. Related party transactions (continued)
Name Expiry date 1 Exercise price
Balance at start of year3
Granted Exercised Disposed 2 Forfeited/ expired
Balance at end of year4
$ Number Number Number Number Number Number
2011
K. Dark 31 Dec 2011 0.25 2,000,000 - (1,000,000) - - 1,000,000
C. Ricato 31 Dec 2012 0.70 1,500,000 - - (1,000,000) - 500,000
A. Rohner 31 Dec 2014 1.53 2,000,000 - - (266,667) - 1,733,333
K. Terblanche 31 Dec 2013 1.91 2,000,000 - - (300,000) - 1,700,000
D. Smith 31 Dec 2013 2.98 600,000 - - - - 600,000
D. Schofield 31 Dec 2014 0.76 1,800,000 - - (650,000) - 1,150,000
99,900,000 - (1,000,000) (2,216,667) - 6,683,333
Weighted average exercise price $ 1.17 0.00 0.25 0.98 0.00 1.48 1 Options vest and are exercisable over three consecutive years from the initial exercise date, with one-third of the total options awarded vesting and exercisable at 31 December each year following completion of a minimum service period, usually twelve months. The expiry date disclosed is the expiry date of the third and final tranche of options. Where an employee has been employed for greater than three years, an additional award of options may be granted at the discretion of the Board in the employee’s fourth or later year. 2 In accordance with a resolution of the Board, directors and employees may dispose of their vested options to a third party. The third party remains subject to the employee option plan rules in respect of options held and have exercised these options during the period. 3 Or date commenced as a key management person. 4 Or date ceased as a key management person.
Rights over equity instruments The movement during the reporting period in the number of rights to ordinary shares in Linc Energy Ltd held, directly, indirectly or beneficially, by each key management person, including their related parties, is as follows:
Name Balance at start of year1
Number of rights granted as compensation
during year
Vested during the year
Unvested balance at
end of the year2
Number Number Number Number
2013
P. Bond3 - 11,824 - 11,824
J. Mathews 375,000 - (125,000) 250,000
C. Ricato 750,000 354,700 (1,104,700) -
K. Terblanche 666,666 - (666,666) -
D. Smith 1,000,000 - (500,000) 500,000
J. Van de Velde 50,000 - (50,000) -
S. Broussard 400,000 600,000 (100,000) 900,000
A. Bond 400,000 600,000 (100,000) 900,000
M, Mapp 1,000,000 - - 1,000,000
S. Jones - 800,000 - 800,000
4,641,666 2,366,524 (2,646,366) 4,361,824
2012
J. Mathews 500,000 - (125,000) 375,000
C. Ricato 1,250,000 396,861 (896,861) 750,000
O. Yates 1,000,000 - (250,000) 750,000
K. Terblanche 1,333,333 - (666,667) 666,666
D. Smith 1,500,000 - (500,000) 1,000,000
D. Schofield - 500,000 (500,000) -
J. Van de Velde 225,000 53,851 (228,851) 50,000
S. Broussard - 400,000 - 400,000
A. Bond - 400,000 - 400,000
M. Mapp - 1,000,000 - 1,000,000
5,808,333 2,750,712 (3,167,379) 5,391,666
F-63
For
per
sona
l use
onl
y
Linc Energy Ltd Notes to the consolidated financial statements
30 June 2013
64
32. Related party transactions (continued) Name Balance at
start of year1 Number of rights granted
as compensation during year
Vested during the year
Unvested balance at
end of the year2
Number Number Number Number
2011
J. Mathews - 500,000 - 500,000
C. Ricato 1,750,000 - (500,000) 1,250,000
O. Yates - 1,000,000 - 1,000,000
K. Terblanche - 2,000,000 (666,667) 1,333,333
D. Smith - 1,500,000 - 1,500,000
1,750,000 5,000,000 (1,166,667) 5,583,333 1 Or date commenced as a key management person. 2 Or date ceased to be a key management person 3 Mr Bond’s shares are held by related parties.
Movements in shares The movement during the reporting period in the number of ordinary shares in Linc Energy Ltd held, directly, indirectly or beneficially, by each key management person, including their related parties, is as follows:
Name Balance at the start of the year4
Additions Disposals Balance at the end of the year5
Number Number Number Number Ordinary shares 2013 K. Dark 1 2,079,250 - - 2,079,250 P. Bond 2 202,121,028 500,000 - 202,621,028 J. Mathews 125,000 125,000 - 250,000 C. Ricato 1,396,861 1,104,700 - 2,501,561 K. Terblanche 766,668 866,666 (1,446,893) 186,441 D. Smith3 500,000 500,000 (786,535) 213,465 D. Schofield 500,000 666,666 (836,666) 330,000 J. Van de Velde 145,673 76,190 (37,000) 184,863 S. Broussard - 100,000 - 100,000 A. Bond - 100,000 - 100,000 2207,634,480 4,039,222 (3,107,094) 208,566,608 2012 K. Dark 1,079,250 1,000,000 - 2,079,250 P. Bond 2 202,121,028 - - 202,121,028 J. Mathews - 125,000 - 125,000 C. Ricato 500,000 896,861 - 1,396,861 O. Yates 1,000,000 - (250,000) 750,000 K. Terblanche 315,001 666,667 (215,000) 766,668 D. Smith3 18,143 500,000 (18,143) 500,000 D. Schofield - 500,000 - 500,000 J. Van de Velde 365,000 354,351 (573,678) 145,673 2205,398,422 4,042,879 (1,056,821) 208,384,480 2011 B. Johnson6 1,000,000 - (1,000,000) - P. Bond2 200,923,904 1,197,124 - 202,121,028 K. Dark 597,503 1,000,000 (580,503) 1,079,250 O. Yates - 278,551 - 278,551 C. Ricato - 500,000 - 500,000 K. Terblanche - 666,667 (351,666) 315,001 D. Smith3 28,143 - (10,000) 18,143 D. Schofield - 750,000 (750,000) - 202,549,550 4,392,342 (2,692,169) 204,311,973
1 A portion of Mr Dark’s shares are held by related parties. 2 Mr Bond’s shares are held via Newtron Pty Ltd or its nominees. 3 Mr Smith’s shares are held via a related party. 4 Or date commenced being a key management person 5 Or date ceased to be a key management person 6 Mr Johnson’s shares are held via Moon Star Investments Pty Ltd atf The Pemberley Trust
F-64
For
per
sona
l use
onl
y
Linc Energy Ltd Notes to the consolidated financial statements
30 June 2013
65
32. Related party transactions (continued) Other related party interests Hillgrove Pty Ltd, a company controlled by Managing Director, Peter Bond owns a 7.03 per cent interest in Powerhouse Energy Group plc, an entity Linc Energy Ltd also holds a 9.96 per cent interest in. Mr P. Bond is not involved in discussions or board decisions relating to the Company’s investment in Powerhouse Energy. On 6 November 2012, an agreement was entered into with Powerhouse Energy Group plc, granting a license to occupy office space in Linc Energy’s London Office. The loan was provided on the basis of PowerHouse being entitled to occupy one desk, for up to ten days per month, along with reasonable access during that period to Linc Energy’s photocopying, printing and other administrative facilities. The monthly rent payment of £1,000 will compensate Linc Energy for the provision of such office space and other administrative facilities. Linc Energy will accrue the monthly rent payment until such time as PowerHouse is capitalised in the amount of £2,000,000 or higher, upon which all rent payments incurred will become due and payable. If any charges outside of the above mentioned are incurred by Linc Energy on behalf of PowerHouse, these charges are invoiced on a monthly basis. At the end of the reporting period the total rent accrued is $13,329 (£8,000).
Company
2013 2012 2011
$’000 $’000 $’000
33. Parent entity disclosures As at and throughout the financial year ended 30 June 2013 the parent entity of the Group was Linc Energy Ltd:
Result of the parent entity
Profit/(loss) for the period ((32,502) (55,630) 307,119
Other comprehensive income 66,596 (7,895) 5,726
Total comprehensive income / (loss) for the period (25,906) (63,525) 312,845
Financial position of the parent entity at year end
Current assets 1120,586 20,411 201,189
Total assets 7705,015 545,138 604,691
Current liabilities 222,180 70,563 23,310
Total liabilities 2250,426 81,226 79,110
Total equity of the parent entity comprising of:
Share capital 3325,388 310,606 309,493
Share-based payment reserve 330,316 28,516 28,868
Available-for-sale reserve 44,427 (2,169) 5,726
Other reserves 55,274 5,274 5,274
Retained earnings 889,184 121,685 176,220
Total Equity 454,589 463,912 525,581
Parent entity contingencies As at the balance sheet date there are no legal claims pending against the parent and the Directors are not aware of any other contingent liabilities other than as set out in note 26.
Parent entity capital commitments for the acquisition of intangible assets or property, plant and equipment As at the balance sheet date the parent entity had capital commitments totalling $1,034,000 (2012: $4,310,000) (2011: $12,386,000) for the acquisition of tangible and intangible assets.
Parent entity guarantees in respect of debts of its subsidiaries The parent entity does not guarantee the debts of its subsidiaries (30 June 2012: Nil). The Parent entity has provided a letter of financial support to the Directors of SAPEX Limited, New Emerald Coal and Linc’s US subsidiaries.
F-65
For
per
sona
l use
onl
y
Linc Energy Ltd Notes to the consolidated financial statements
30 June 2013
66
34. Remuneration of auditors
During the year the following fees were paid or payable for services provided by the auditor of the Group.
Consolidated
2013 2012 2011
$ $ $
Audit services
KPMG Australia 3370,900 326,650 293,000
Overseas KPMG firms 3382,678 233,701 121,853 753,578 560,351 414,853
Services other than statutory audit:
KPMG Australia:
Taxation advisory services -- - 49,900
IT advisory services 111,135 180,491 54,797
Forensic advisory services -- 39,000 -
Other assurance services 220,000 - -
31,135 219,491 104,697
35. Subsequent events Matters subsequent to the end of the financial year were as follows:
Fortress Warrants Termination - On 25 July 2013, the Group and FCCD (Australia) Pty Limited agreed to terminate the Warrant Deed entered into on 6 September 2012 for a cash settlement of $9,790,586. On 26 July 2013, the amount was paid by the Group and the warrants were immediately cancelled. Alaskan Tax credit rebate sale – On 20 August 2013, the Group sold its rights to certain oil and gas tax credits to Apollo Investment Corporation for USD$24,740,122 with net proceeds received of $USD24,560,122. The proceeds have been applied against US oil and gas costs including Alaska and the Gulf Coast.
F-66
For
per
sona
l use
onl
y
Linc Energy Ltd Directors’ declaration
30 June 2013
67
In the Directors’ opinion:
1. The financial report projects presents fairly the state of affairs and the results of the group;
2. There are reasonable grounds to believe that the group will be able to pay its debts as and when they fall due;
3. The company and its controlled entities have kept such accounting records to correctly record and explain their transactions and financial position;
4. The company and its controlled entities have kept accounting records so that a true and fair financial report of the group can be prepared from time to time; and
5. The directors draw attention to Note 1(a) to the consolidated financial statements, which includes a statement of compliance with International Financial Reporting Standards.
This declaration is made in accordance with a resolution of the Directors.
Peter Bond Managing Director Brisbane 25 September 2013
F-67
For
per
sona
l use
onl
y
68
Liability limited by a scheme approved under Professional Standards Legislation.
KPMG, an Australian partnership and a member firm of the KPMG network of independent member firms affiliated with KPMG International Cooperative (“KPMG International”), a Swiss entity.
The Board of Directors Linc Energy Ltd Smellie & Co. Building 32 Edward Street Brisbane Qld 4000
Independent auditor’s report to the Board of Directors of Linc Energy Ltd on the Consolidated Financial Statements
We have audited the accompanying financial report of Linc Energy Ltd (the Company), which comprises the consolidated statements of financial position as at 30 June 2013, 30 June 2012 and 30 June 2011, and consolidated statements of profit and loss and other comprehensive income, consolidated statements of changes in equity and consolidated statements of cash flows for the years ended on those dates, notes 1 to 35 comprising a summary of significant accounting policies and other explanatory information of the Group comprising the Company and the entities it controlled at the year’s end or from time to time during the financial years (“Consolidated Financial Statements”).
The Consolidated Financial Statements have been prepared in accordance with the requirements of Rule 246(9) of the Singapore Exchange Securities Trading Limited (“SGX-ST’) Listing Manual and in connection with the proposed listing of the Company on the SGX-ST. This report has been prepared for the Board of Directors of the Company for inclusion in the Offering Document of the Company in connection with the initial public offering of the shares of the Company.
Directors’ responsibility for the financial report
The directors of the Company are responsible for the preparation and fair presentation of the Consolidated Financial Report in accordance with Australian Accounting Standards and for such internal control as the directors determine is necessary to enable the preparation of the financial report that is free from material misstatement whether due to fraud or error. In Note 1, the directors also state, in accordance with Australian Accounting Standard AASB 101 Presentation of Financial Statements, that the financial statements of the Group comply with International Financial Reporting Standards.
Auditors’ responsibility
Our responsibility is to express an opinion on the Consolidated Financial Report based on our audits. We conducted our audits in accordance with International Standards on Auditing. These Auditing Standards require that we comply with relevant ethical requirements relating to audit engagements and plan and perform the audit to obtain reasonable assurance whether the financial report is free from material misstatement.
An audit involves performing procedures to obtain audit evidence about the amounts and disclosures in the financial report. The procedures selected depend on the auditor’s judgement, including the assessment of the risks of material misstatement of the financial report, whether due to fraud or error. In making those risk assessments, the auditor considers internal control relevant to the entity’s preparation and fair presentation of the financial report in order to design audit procedures that are appropriate in the circumstances, but not for the purpose of expressing an opinion on the effectiveness of the entity’s internal control. An audit also includes evaluating the appropriateness of accounting policies used and the reasonableness of accounting estimates made by the directors, as well as evaluating the overall presentation of the financial report.
F-68
For
per
sona
l use
onl
y
69
We performed the procedures to assess whether in all material respects the Consolidated Financial Report is presented fairly in accordance with Australian Accounting Standards, so as to present a view which is consistent with our understanding of the Group’s financial position, and of its performance and cash flows.
We believe that the audit evidence we have obtained is sufficient and appropriate to provide a basis for our audit opinion.
Independence
In conducting our audits, we have complied with the independence requirements of the International Ethics Standards Board for Accountants’ Code of Ethics for Professional Accountants (IESBA Code).
Auditor’s opinion
In our opinion:
(a) the Consolidated Financial Report presents fairly, in all material respects, the financial position of Linc Energy Ltd and its controlled entities as of 30 June 2013, 30 June 2012 and 30 June 2011 and of its financial performance and its cash flows for each of the years then ended in accordance with the Australian Accounting Standards; and
(b) the Consolidated Financial Report also complies with International Financial Reporting Standards as disclosed in Note 1.
Other matter
Linc Energy Ltd has prepared a separate financial report for each of the years ended 30 June 2013, 30 June 2012 and 30 June 2011 in accordance with the Corporations Act 2001, Australian Accounting Standards and the Corporations Regulations 2001 on which we issued separate auditor’s reports conducted in accordance with the Corporations Act 2001 and Australian Auditing Standards to the members of Linc Energy Ltd, dated 24 September 2013, 28 September 2012 and 27 September 2011 respectively.
No audited financial statements of the Company or its controlled entities have been prepared for any period subsequent to 30 June 2013.
KPMG
Brisbane 25 September 2013
F-69
For
per
sona
l use
onl
y

[THIS PAGE INTENTIONALLY LEFT BLANK]
For
per
sona
l use
onl
y
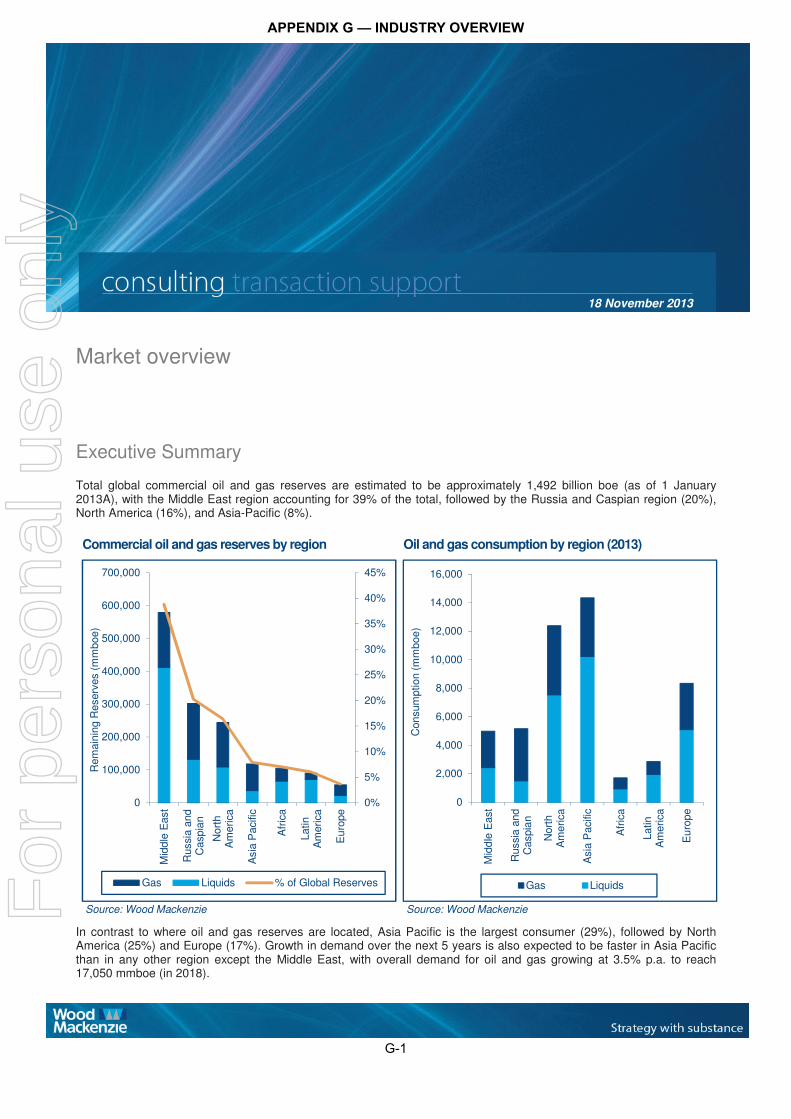
Market overview
Executive Summary
Total global commercial oil and gas reserves are estimated to be approximately 1,492 billion boe (as of 1 January 2013A), with the Middle East region accounting for 39% of the total, followed by the Russia and Caspian region (20%), North America (16%), and Asia-Pacific (8%).
Commercial oil and gas reserves by region
Source: Wood Mackenzie
Oil and gas consumption by region (2013) .
Source: Wood Mackenzie
In contrast to where oil and gas reserves are located, Asia Pacific is the largest consumer (29%), followed by North America (25%) and Europe (17%). Growth in demand over the next 5 years is also expected to be faster in Asia Pacific than in any other region except the Middle East, with overall demand for oil and gas growing at 3.5% p.a. to reach 17,050 mmboe (in 2018).
0%
5%
10%
15%
20%
25%
30%
35%
40%
45%
0
100,000
200,000
300,000
400,000
500,000
600,000
700,000
Mid
dle
Eas
t
Rus
sia
and
Cas
pian
Nor
thA
mer
ica
Asi
a P
acifi
c
Afr
ica
Latin
Am
eric
a
Eur
ope
Rem
aini
ng R
eser
ves
(mm
boe)
Gas Liquids % of Global Reserves
0
2,000
4,000
6,000
8,000
10,000
12,000
14,000
16,000
Mid
dle
Eas
t
Rus
sia
and
Cas
pian
Nor
thA
mer
ica
Asi
a P
acifi
c
Afr
ica
Latin
Am
eric
a
Eur
ope
Con
sum
ptio
n (m
mbo
e)
Gas Liquids
18 November 2013
G-1
APPENDIX G — INDUSTRY OVERVIEW
For
per
sona
l use
onl
y
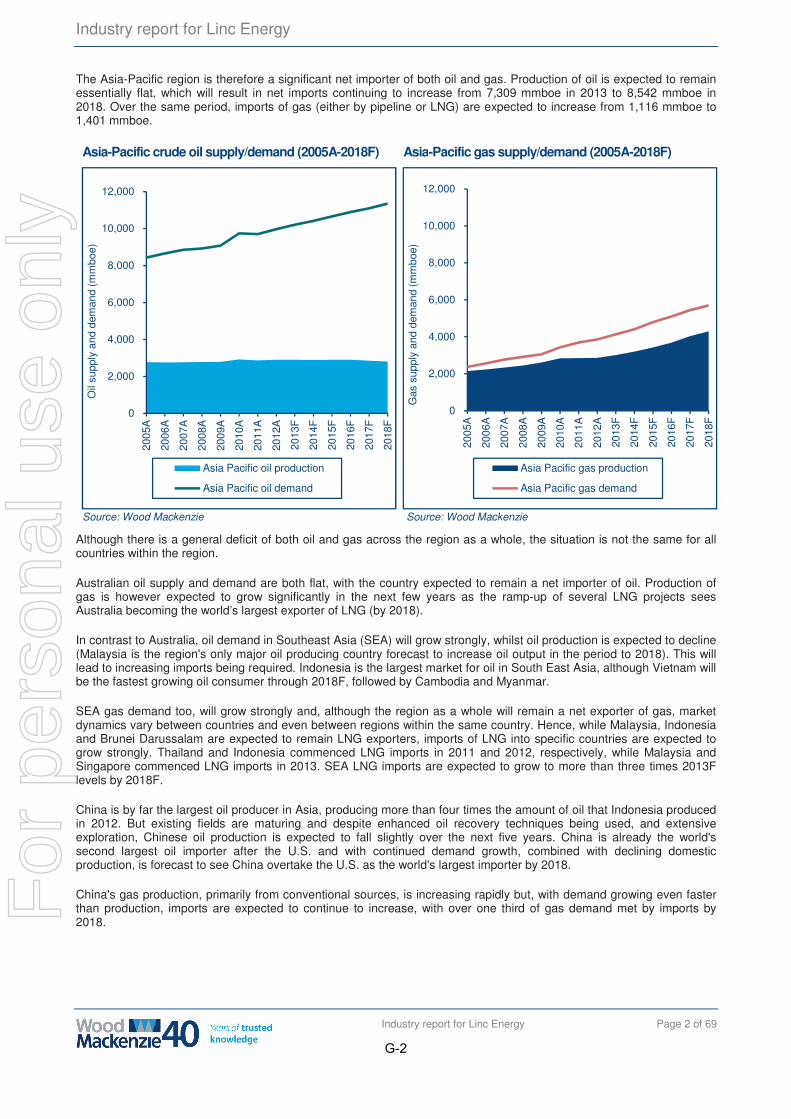
Industry report for Linc Energy
Industry report for Linc Energy Page 2 of 69
The Asia-Pacific region is therefore a significant net importer of both oil and gas. Production of oil is expected to remain essentially flat, which will result in net imports continuing to increase from 7,309 mmboe in 2013 to 8,542 mmboe in 2018. Over the same period, imports of gas (either by pipeline or LNG) are expected to increase from 1,116 mmboe to 1,401 mmboe.
Asia-Pacific crude oil supply/demand (2005A-2018F)
Source: Wood Mackenzie
Asia-Pacific gas supply/demand (2005A-2018F) .
Source: Wood Mackenzie
Although there is a general deficit of both oil and gas across the region as a whole, the situation is not the same for all countries within the region.
Australian oil supply and demand are both flat, with the country expected to remain a net importer of oil. Production of gas is however expected to grow significantly in the next few years as the ramp-up of several LNG projects sees Australia becoming the world’s largest exporter of LNG (by 2018).
In contrast to Australia, oil demand in Southeast Asia (SEA) will grow strongly, whilst oil production is expected to decline (Malaysia is the region's only major oil producing country forecast to increase oil output in the period to 2018). This will lead to increasing imports being required. Indonesia is the largest market for oil in South East Asia, although Vietnam will be the fastest growing oil consumer through 2018F, followed by Cambodia and Myanmar.
SEA gas demand too, will grow strongly and, although the region as a whole will remain a net exporter of gas, market dynamics vary between countries and even between regions within the same country. Hence, while Malaysia, Indonesia and Brunei Darussalam are expected to remain LNG exporters, imports of LNG into specific countries are expected to grow strongly. Thailand and Indonesia commenced LNG imports in 2011 and 2012, respectively, while Malaysia and Singapore commenced LNG imports in 2013. SEA LNG imports are expected to grow to more than three times 2013F levels by 2018F.
China is by far the largest oil producer in Asia, producing more than four times the amount of oil that Indonesia produced in 2012. But existing fields are maturing and despite enhanced oil recovery techniques being used, and extensive exploration, Chinese oil production is expected to fall slightly over the next five years. China is already the world's second largest oil importer after the U.S. and with continued demand growth, combined with declining domestic production, is forecast to see China overtake the U.S. as the world's largest importer by 2018.
China's gas production, primarily from conventional sources, is increasing rapidly but, with demand growing even faster than production, imports are expected to continue to increase, with over one third of gas demand met by imports by 2018.
0
2,000
4,000
6,000
8,000
10,000
12,000
2005
A
2006
A
2007
A
2008
A
2009
A
2010
A
2011
A
2012
A
2013
F
2014
F
2015
F
2016
F
2017
F
2018
F
Oil
supp
ly a
nd d
eman
d (m
mbo
e)
Asia Pacific oil production
Asia Pacific oil demand
0
2,000
4,000
6,000
8,000
10,000
12,000
2005
A
2006
A
2007
A
2008
A
2009
A
2010
A
2011
A
2012
A
2013
F
2014
F
2015
F
2016
F
2017
F
2018
F
Gas
sup
ply
and
dem
and
(mm
boe)
Asia Pacific gas production
Asia Pacific gas demand
G-2
For
per
sona
l use
onl
y
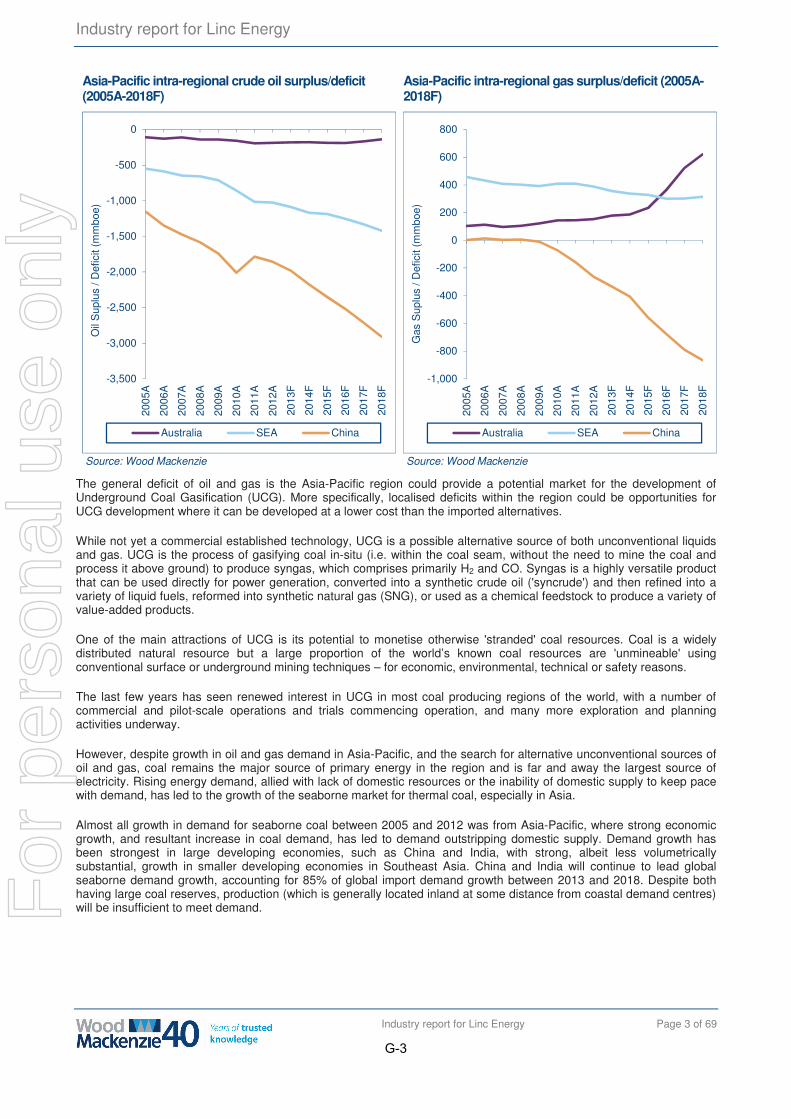
Industry report for Linc Energy
Industry report for Linc Energy Page 3 of 69
Asia-Pacific intra-regional crude oil surplus/deficit (2005A-2018F)
Source: Wood Mackenzie
Asia-Pacific intra-regional gas surplus/deficit (2005A-2018F) .
Source: Wood Mackenzie
The general deficit of oil and gas is the Asia-Pacific region could provide a potential market for the development of Underground Coal Gasification (UCG). More specifically, localised deficits within the region could be opportunities for UCG development where it can be developed at a lower cost than the imported alternatives.
While not yet a commercial established technology, UCG is a possible alternative source of both unconventional liquids and gas. UCG is the process of gasifying coal in-situ (i.e. within the coal seam, without the need to mine the coal and process it above ground) to produce syngas, which comprises primarily H2 and CO. Syngas is a highly versatile product that can be used directly for power generation, converted into a synthetic crude oil ('syncrude') and then refined into a variety of liquid fuels, reformed into synthetic natural gas (SNG), or used as a chemical feedstock to produce a variety of value-added products.
One of the main attractions of UCG is its potential to monetise otherwise 'stranded' coal resources. Coal is a widely distributed natural resource but a large proportion of the world’s known coal resources are 'unmineable' using conventional surface or underground mining techniques – for economic, environmental, technical or safety reasons.
The last few years has seen renewed interest in UCG in most coal producing regions of the world, with a number of commercial and pilot-scale operations and trials commencing operation, and many more exploration and planning activities underway.
However, despite growth in oil and gas demand in Asia-Pacific, and the search for alternative unconventional sources of oil and gas, coal remains the major source of primary energy in the region and is far and away the largest source of electricity. Rising energy demand, allied with lack of domestic resources or the inability of domestic supply to keep pace with demand, has led to the growth of the seaborne market for thermal coal, especially in Asia.
Almost all growth in demand for seaborne coal between 2005 and 2012 was from Asia-Pacific, where strong economic growth, and resultant increase in coal demand, has led to demand outstripping domestic supply. Demand growth has been strongest in large developing economies, such as China and India, with strong, albeit less volumetrically substantial, growth in smaller developing economies in Southeast Asia. China and India will continue to lead global seaborne demand growth, accounting for 85% of global import demand growth between 2013 and 2018. Despite both having large coal reserves, production (which is generally located inland at some distance from coastal demand centres) will be insufficient to meet demand.
-3,500
-3,000
-2,500
-2,000
-1,500
-1,000
-500
020
05A
2006
A
2007
A
2008
A
2009
A
2010
A
2011
A
2012
A
2013
F
2014
F
2015
F
2016
F
2017
F
2018
F
Oil
Sup
lus
/ Def
icit
(mm
boe)
Australia SEA China
-1,000
-800
-600
-400
-200
0
200
400
600
800
2005
A
2006
A
2007
A
2008
A
2009
A
2010
A
2011
A
2012
A
2013
F
2014
F
2015
F
2016
F
2017
F
2018
F
Gas
Sup
lus
/ Def
icit
(mm
boe)
Australia SEA China
G-3
For
per
sona
l use
onl
y
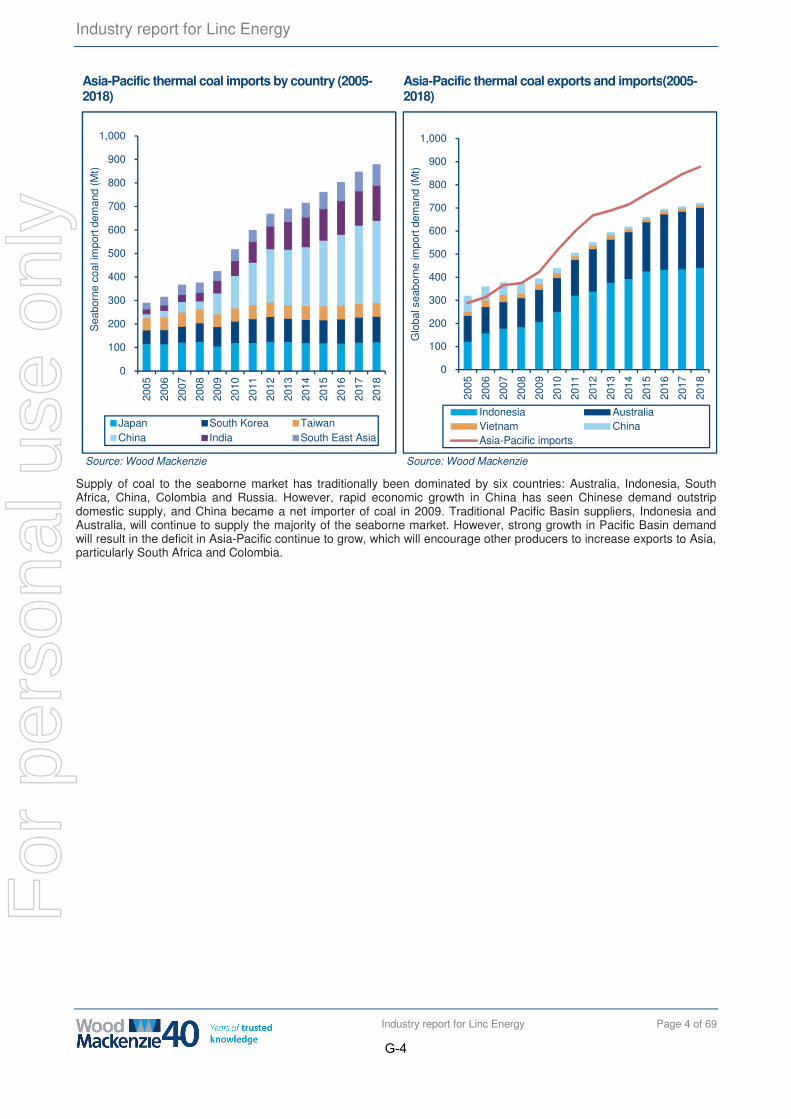
Industry report for Linc Energy
Industry report for Linc Energy Page 4 of 69
Asia-Pacific thermal coal imports by country (2005-2018)
Source: Wood Mackenzie
Asia-Pacific thermal coal exports and imports(2005-2018) .
Source: Wood Mackenzie
Supply of coal to the seaborne market has traditionally been dominated by six countries: Australia, Indonesia, South Africa, China, Colombia and Russia. However, rapid economic growth in China has seen Chinese demand outstrip domestic supply, and China became a net importer of coal in 2009. Traditional Pacific Basin suppliers, Indonesia and Australia, will continue to supply the majority of the seaborne market. However, strong growth in Pacific Basin demand will result in the deficit in Asia-Pacific continue to grow, which will encourage other producers to increase exports to Asia, particularly South Africa and Colombia.
0
100
200
300
400
500
600
700
800
900
1,00020
05
2006
2007
2008
2009
2010
2011
2012
2013
2014
2015
2016
2017
2018
Sea
born
e co
al im
port
dem
and
(Mt)
Japan South Korea TaiwanChina India South East Asia
0
100
200
300
400
500
600
700
800
900
1,000
2005
2006
2007
2008
2009
2010
2011
2012
2013
2014
2015
2016
2017
2018
Glo
bal s
eabo
rne
impo
rt d
eman
d (M
t)Indonesia AustraliaVietnam ChinaAsia-Pacific imports
G-4
For
per
sona
l use
onl
y
Industry report for Linc Energy
Industry report for Linc Energy Page 5 of 69
Contents
1 Oil and gas market review ................................................................................ 10
1.1 Global and regional oil & gas reserves ......................................................................... 10
1.2 Global oil and gas demand ............................................................................................. 10
1.2.1 Crude oil demand by region ................................................................................................ 10
1.2.2 Gas demand by region ........................................................................................................ 12
1.3 Global oil and gas production ........................................................................................ 14
1.3.1 Crude oil production by region ............................................................................................ 14
1.3.2 Gas production by region .................................................................................................... 15
2 Crude oil and natural gas pricing .................................................................... 17
2.1 Crude oil pricing .............................................................................................................. 17
2.1.1 Key global benchmarks ....................................................................................................... 17
2.2 Natural gas pricing .......................................................................................................... 19
2.2.1 Overview of regional pricing dynamics ................................................................................ 19
3 Overview of Key Countries’ Oil and Gas Industry ......................................... 22
3.1 United States of America (“U.S.”) .................................................................................. 22
3.1.1 Overview ............................................................................................................................. 22
3.1.2 Oil and gas reserves/resources ........................................................................................... 22
3.1.3 Unconventional oil and gas reserves/resources .................................................................. 23
3.1.4 Prospectivity and recent discoveries ................................................................................... 24
3.1.5 Historical and forecast oil and gas demand and production ................................................ 25
3.1.6 Indicative crude oil and natural gas pricing ......................................................................... 26
3.2 Australia ........................................................................................................................... 27
3.2.1 Overview ............................................................................................................................. 27
3.2.2 Oil and gas reserves/resources ........................................................................................... 28
3.2.3 Unconventional oil and gas reserves/resources .................................................................. 28
3.2.4 Prospectivity and recent discoveries ................................................................................... 31
3.2.5 Historical and forecast oil and gas demand and production ................................................ 32
3.2.6 Indicative crude oil and natural gas pricing ......................................................................... 33
3.3 South East Asia (SEA) .................................................................................................... 34
3.3.1 Overview ............................................................................................................................. 34
3.3.2 Oil and gas reserves/resources ........................................................................................... 35
3.3.3 Unconventional oil and gas reserves/resources .................................................................. 35
3.3.4 Prospectivity and recent discoveries ................................................................................... 36
3.3.5 Historical and forecast oil and gas demand and production ................................................ 37
3.3.6 Indicative crude oil and natural gas pricing ......................................................................... 38
3.4 China ................................................................................................................................. 39
3.4.1 Overview ............................................................................................................................. 39
3.4.2 Oil and gas reserves/resources ........................................................................................... 40
3.4.3 Unconventional oil and gas reserves/resources .................................................................. 40
3.4.4 Prospectivity and recent discoveries ................................................................................... 41
G-5
For
per
sona
l use
onl
y
Industry report for Linc Energy Page 6 of 69
3.4.5 Historical and forecast oil and gas demand and production ................................................ 42
3.4.6 Indicative crude oil and natural gas pricing ......................................................................... 44
4 Underground coal gasification ........................................................................ 45
4.1 UCG technology overview .............................................................................................. 45
4.1.1 UCG process fundamentals ................................................................................................ 45
4.1.2 UCG operational issues & site selection ............................................................................. 46
4.1.3 UCG technologies & techniques ......................................................................................... 47
4.1.4 Coal resources suitable for UCG ......................................................................................... 48
4.1.5 Comparative resource recovery efficiency .......................................................................... 49
4.2 UCG value chain & applications .................................................................................... 49
4.2.1 Syngas utilisation options .................................................................................................... 50
4.2.2 CO2 utilisation options ......................................................................................................... 51
4.3 UCG industry overview ................................................................................................... 52
4.3.1 Historical development of UCG ........................................................................................... 52
4.3.2 Current UCG activities......................................................................................................... 53
4.4 UCG SWOT analysis ........................................................................................................ 56
5 Coal market review ........................................................................................... 57
5.1 Summary .......................................................................................................................... 57
5.2 Coal market fundamentals ............................................................................................. 57
5.3 Global seaborne thermal coal demand ......................................................................... 59
5.3.1 Historical thermal coal demand ........................................................................................... 59
5.3.2 Forecast thermal coal demand ............................................................................................ 60
5.3.3 Overview of key demand countries ..................................................................................... 61
5.4 Global seaborne thermal coal supply ........................................................................... 62
5.4.1 Historical thermal coal supply .............................................................................................. 62
5.4.2 Forecast thermal coal supply .............................................................................................. 63
5.4.3 Overview of key supply countries ........................................................................................ 64
5.4.4 Cost Competitivness ........................................................................................................... 65
5.5 Seaborne thermal coal prices ........................................................................................ 67
G-6
For
per
sona
l use
onl
y
Industry report for Linc Energy Page 7 of 69
List of figures
Figure 1.1 Commercial oil and gas reserves by region .................................................................................................... 10
Figure 1.2 Crude oil consumption by region (2005A – 2018F) ......................................................................................... 11
Figure 1.3 Asia-Pacific crude oil consumption by country (2005A – 2018F) .................................................................... 11
Figure 1.4 Asia-Pacific crude oil supply/demand (2005A – 2018F) .................................................................................. 12
Figure 1.5 Gas consumption by region (2005A – 2018F) ................................................................................................. 12
Figure 1.6 Asia-Pacific gas consumption by country (2005A – 2018F) ............................................................................ 13
Figure 1.7 Asia-Pacific gas supply/demand (2005A – 2018F) ......................................................................................... 13
Figure 1.8 Crude oil production by region (2005A – 2018F) ............................................................................................ 14
Figure 1.9 Asia-Pacific crude oil production by country (2005A – 2018F) ........................................................................ 14
Figure 1.10 Gas production by region (2005A – 2018F) .................................................................................................. 15
Figure 1.11 Asia-Pacific gas production by country (2005A – 2018F) ............................................................................. 16
Figure 2.1 Brent crude price (2005A – 2018F) ................................................................................................................. 17
Figure 2.2 WTI crude price (2005A – 2018F) ................................................................................................................... 18
Figure 2.3 Dubai crude price (2005A – 2018F) ................................................................................................................ 19
Figure 2.4 Global gas spot prices (2005A – 2018F, 2013 US$ real) ................................................................................ 20
Figure 2.5 Global gas spot prices (2005A – 2018F, US$ nominal) .................................................................................. 21
Figure 3.1 U.S. (and southern Canadian) oil & gas basins map ...................................................................................... 22
Figure 3.2 U.S. commercial and technical oil and gas reserves (mmboe, 2012A) ........................................................... 23
Figure 3.3 Reserves and unconventional resource potential ........................................................................................... 23
Figure 3.4 Unconventional resource potential by region . ............................................................................................. 23
Figure 3.5 U.S. yet-to-find and technical reserve volumes ............................................................................................... 24
Figure 3.6 U.S. recent discoveries (2005A – 2012A) ....................................................................................................... 25
Figure 3.7 U.S. oil supply-demand (2005A – 2018F) ....................................................................................................... 25
Figure 3.8 U.S. gas supply-demand (2005A – 2018F) ..................................................................................................... 26
Figure 3.9 Australia commercial and technical oil and gas reserves (mmboe, 2012A) .................................................... 28
Figure 3.10 Reserves and unconventional resource potential ......................................................................................... 29
Figure 3.11 Unconventional resource potential by region . . ........................................................................................ 29
Figure 3.12 Production profile development curve (mmboe) ............................................................................................ 30
Figure 3.13 Australia yet-to-find and technical reserve volumes ...................................................................................... 31
Figure 3.14 Australia recent discoveries (2005A – 2012A) .............................................................................................. 32
Figure 3.15 Australia oil supply-demand (2005A – 2018F) .............................................................................................. 32
Figure 3.16 Australia gas supply-demand (2005A – 2018F) ............................................................................................ 33
Figure 3.17 SEA commercial and technical oil and gas reserves (mmboe, 2012A) ......................................................... 35
Figure 3.18 SEA yet-to-find and technical reserve volumes ............................................................................................. 36
Figure 3.19 SEA recent discoveries (2005A – 2012A) ..................................................................................................... 36
Figure 3.20 SEA oil supply-demand (2005A – 2018F) ..................................................................................................... 37
Figure 3.21 SEA gas supply-demand (2005A – 2018F) ................................................................................................... 38
Figure 3.22 Chinese oil & gas basins map ....................................................................................................................... 39
Figure 3.23 China commercial and technical oil and gas reserves (mmboe, 2012A) ....................................................... 40
Figure 3.24 China reserves and unconventional resource potential ................................................................................ 41
Figure 3.25 Unconventional resource potential by region . ............................................................................................ 41
G-7
For
per
sona
l use
onl
y
Industry report for Linc Energy Page 8 of 69
Figure 3.26 China yet-to-find and technical reserve volumes .......................................................................................... 41
Figure 3.27 China recent discoveries (2005A – 2012A) ................................................................................................... 42
Figure 3.28 China oil supply-demand (2005A – 2018F) ................................................................................................... 43
Figure 3.29 China gas supply-demand (2005A – 2018F) ................................................................................................. 43
Figure 4.1 Overview of the UCG process ......................................................................................................................... 45
Figure 4.2 Example of the CRIP technique ...................................................................................................................... 47
Figure 4.3 Simplified UCG value chain, applications & products ..................................................................................... 50
Figure 5.1 Marketable thermal coal reserves by country .................................................................................................. 58
Figure 5.2 Global coal production by market and end-use ............................................................................................... 58
Figure 5.3 Atlantic and Pacific basins .............................................................................................................................. 59
Figure 5.4 Historical and forecast seaborne thermal coal import demand by key country and region (2005–2018) ........ 60
Figure 5.5 Forecast seaborne thermal coal import demand by coal type (2013–2018) ................................................... 60
Figure 5.6 Historical and forecast Chinese demand and domestic supply of thermal coal (2013–2018) ......................... 61
Figure 5.7 Historical and forecast seaborne thermal coal export supply by key country and region (2005–2018) ........... 63
Figure 5.8 Forecast seaborne thermal coal export supply by coal type (2013-2018) ....................................................... 64
Figure 5.9 Australian seaborne thermal coal FOB supply cost curve (2014, energy adjusted) ........................................ 66
Figure 5.10 Global seaborne thermal coal FOB supply cost curve (2014, energy adjusted) ............................................ 66
Figure 5.11 Historical and forecast FOB prices for key thermal coal brands (nominal, 2008–2018) ................................ 68
List of tables
Table 4.1 Overview of global UCG activities .................................................................................................................... 54
Table 4.2 UCG SWOT analysis ....................................................................................................................................... 56
G-8
For
per
sona
l use
onl
y
Industry report for Linc Energy Page 9 of 69
Nomenclature
A Actual
ACG Aboveground coal gasification
API American Petroleum Institute
APLNG Australia Pacific LNG
b/d Barrels per day
bbl Barrel
bnboe Billion barrels of oil equivalent
boe Barrels of oil equivalent
boe/d Barrels of oil equivalent per day
Bt Billion tonnes
CAGR Compound annual growth rate
CBM Coal bed methane
CCGT Combined cycle gas turbine
CCS Carbon capture and storage
CH4 Methane
CO Carbon monoxide
CO2 Carbon dioxide
CPI Consumer price index
CRIP Controlled retracting injection point
CSG Coal seam gas
CTG Coal-to-gas
CTL Coal-to-liquids
DMO Domestic Market Obligation
ECBM Enhanced coal bed methane
EIA The U.S. Energy Information Administration
EOR Enhanced oil recovery
F Forecast
FLNG Floating LNG
FOB Free-on-board
FSU Former Soviet Union
FT Fischer-Tropsch
GAR Gross as received
GDP Gross domestic product
GHG Greenhouse gas
GLNG Gladstone LNG
GSA Gas sales agreement
GTL Gas-to-liquids
GW Gigawatt
H2 Hydrogen
H2S Hydrogen sulphide
HBA Harga Batubara Acuan
HH Henry Hub
HSFO High sulphur fuel oil
IGCC Integrated gasification combined cycle
JFY Japanese Financial Year
JORC Joint Ore Reserves Committee
JPU Japanese Power Utilities
kcal Kilocalories
kg Kilogram
LNG Liquefied natural gas
LPG Liquefied petroleum gas
MCC Microbial coal conversion
mmboe Million barrels of oil equivalent
MRRT Minerals Resource Rent Tax
Mt Million tonnes
MWh Megawatt hour
NAR Net as received
NBP National Balancing Point
NDRC National Development and Reform Commission
NGL Natural gas liquids
NOX Nitrogen oxides
NSW New South Wales
OPEC Organization of Petroleum Exporting Countries
PCI Pulverised coal injection
PF Pulverised fuel
PRB Powder River Basin
QCLNG Queensland Curtis LNG
QLD Queensland
RoW Rest of World
SEA South East Asia
SNG Synthetic (or substitute) natural gas
SOX Sulphur oxides
t Tonne
tcf Trillion cubic feet
U.S. United States
UCG Underground coal gasification
UMPP Ultra Mega Power Project
WGS Water-gas-shift
WM Wood Mackenzie
WTI West Texas Intermediate
YTF Yet-to-find
G-9
For
per
sona
l use
onl
y
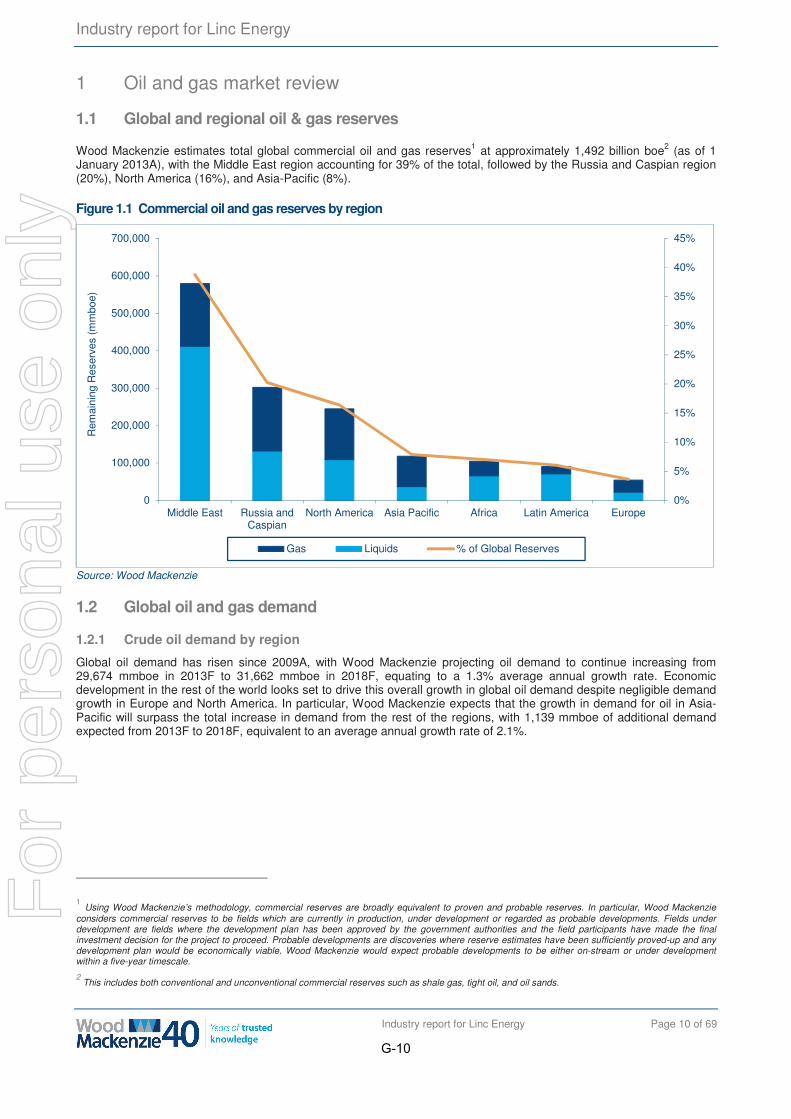
Industry report for Linc Energy
Industry report for Linc Energy Page 10 of 69
1 Oil and gas market review
1.1 Global and regional oil & gas reserves
Wood Mackenzie estimates total global commercial oil and gas reserves1 at approximately 1,492 billion boe2 (as of 1 January 2013A), with the Middle East region accounting for 39% of the total, followed by the Russia and Caspian region (20%), North America (16%), and Asia-Pacific (8%).
Figure 1.1 Commercial oil and gas reserves by region
Source: Wood Mackenzie
1.2 Global oil and gas demand
1.2.1 Crude oil demand by region
Global oil demand has risen since 2009A, with Wood Mackenzie projecting oil demand to continue increasing from 29,674 mmboe in 2013F to 31,662 mmboe in 2018F, equating to a 1.3% average annual growth rate. Economic development in the rest of the world looks set to drive this overall growth in global oil demand despite negligible demand growth in Europe and North America. In particular, Wood Mackenzie expects that the growth in demand for oil in Asia-Pacific will surpass the total increase in demand from the rest of the regions, with 1,139 mmboe of additional demand expected from 2013F to 2018F, equivalent to an average annual growth rate of 2.1%.
1 Using Wood Mackenzie’s methodology, commercial reserves are broadly equivalent to proven and probable reserves. In particular, Wood Mackenzie considers commercial reserves to be fields which are currently in production, under development or regarded as probable developments. Fields under development are fields where the development plan has been approved by the government authorities and the field participants have made the final investment decision for the project to proceed. Probable developments are discoveries where reserve estimates have been sufficiently proved-up and any development plan would be economically viable. Wood Mackenzie would expect probable developments to be either on-stream or under development within a five-year timescale. 2 This includes both conventional and unconventional commercial reserves such as shale gas, tight oil, and oil sands.
0%
5%
10%
15%
20%
25%
30%
35%
40%
45%
0
100,000
200,000
300,000
400,000
500,000
600,000
700,000
Middle East Russia andCaspian
North America Asia Pacific Africa Latin America Europe
Rem
aini
ng R
eser
ves
(mm
boe)
Gas Liquids % of Global Reserves
G-10
For
per
sona
l use
onl
y
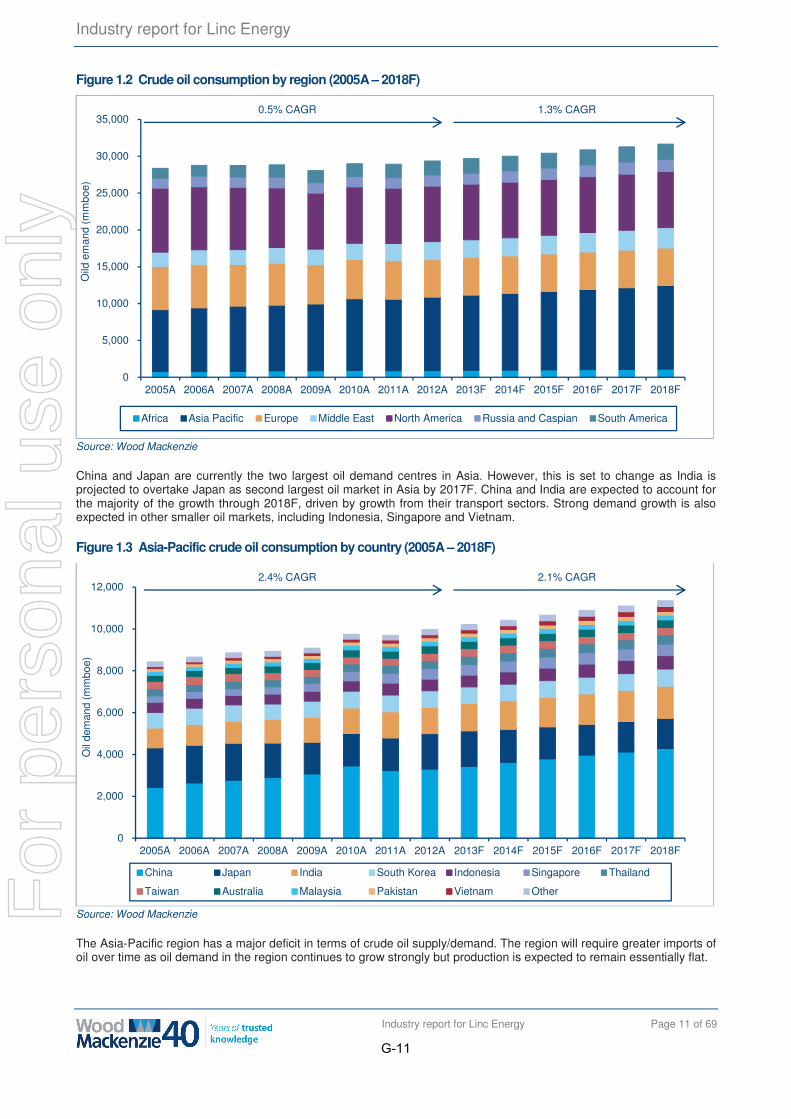
Industry report for Linc Energy
Industry report for Linc Energy Page 11 of 69
Figure 1.2 Crude oil consumption by region (2005A – 2018F)
Source: Wood Mackenzie
China and Japan are currently the two largest oil demand centres in Asia. However, this is set to change as India is projected to overtake Japan as second largest oil market in Asia by 2017F. China and India are expected to account for the majority of the growth through 2018F, driven by growth from their transport sectors. Strong demand growth is also expected in other smaller oil markets, including Indonesia, Singapore and Vietnam.
Figure 1.3 Asia-Pacific crude oil consumption by country (2005A – 2018F)
Source: Wood Mackenzie
The Asia-Pacific region has a major deficit in terms of crude oil supply/demand. The region will require greater imports of oil over time as oil demand in the region continues to grow strongly but production is expected to remain essentially flat.
0
5,000
10,000
15,000
20,000
25,000
30,000
35,000
2005A 2006A 2007A 2008A 2009A 2010A 2011A 2012A 2013F 2014F 2015F 2016F 2017F 2018F
Oild
em
and
(mm
boe)
Africa Asia Pacific Europe Middle East North America Russia and Caspian South America
0.5% CAGR 1.3% CAGR
0
2,000
4,000
6,000
8,000
10,000
12,000
2005A 2006A 2007A 2008A 2009A 2010A 2011A 2012A 2013F 2014F 2015F 2016F 2017F 2018F
Oil
dem
and
(mm
boe)
China Japan India South Korea Indonesia Singapore Thailand
Taiwan Australia Malaysia Pakistan Vietnam Other
2.4% CAGR 2.1% CAGR
G-11
For
per
sona
l use
onl
y
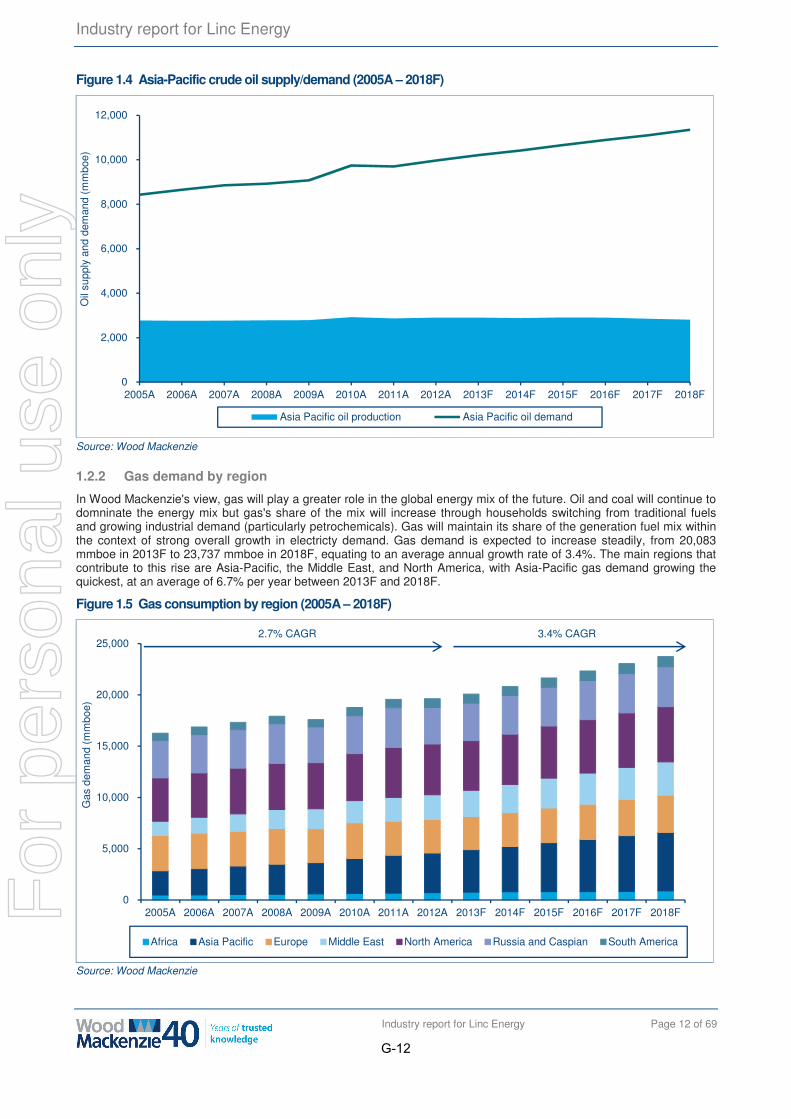
Industry report for Linc Energy
Industry report for Linc Energy Page 12 of 69
Figure 1.4 Asia-Pacific crude oil supply/demand (2005A – 2018F)
Source: Wood Mackenzie
1.2.2 Gas demand by region
In Wood Mackenzie's view, gas will play a greater role in the global energy mix of the future. Oil and coal will continue to domninate the energy mix but gas's share of the mix will increase through households switching from traditional fuels and growing industrial demand (particularly petrochemicals). Gas will maintain its share of the generation fuel mix within the context of strong overall growth in electricty demand. Gas demand is expected to increase steadily, from 20,083 mmboe in 2013F to 23,737 mmboe in 2018F, equating to an average annual growth rate of 3.4%. The main regions that contribute to this rise are Asia-Pacific, the Middle East, and North America, with Asia-Pacific gas demand growing the quickest, at an average of 6.7% per year between 2013F and 2018F.
Figure 1.5 Gas consumption by region (2005A – 2018F)
Source: Wood Mackenzie
0
2,000
4,000
6,000
8,000
10,000
12,000
2005A 2006A 2007A 2008A 2009A 2010A 2011A 2012A 2013F 2014F 2015F 2016F 2017F 2018F
Oil
supp
ly a
nd d
eman
d (m
mbo
e)
Asia Pacific oil production Asia Pacific oil demand
0
5,000
10,000
15,000
20,000
25,000
2005A 2006A 2007A 2008A 2009A 2010A 2011A 2012A 2013F 2014F 2015F 2016F 2017F 2018F
Gas
dem
and
(mm
boe)
Africa Asia Pacific Europe Middle East North America Russia and Caspian South America
2.7% CAGR 3.4% CAGR
G-12
For
per
sona
l use
onl
y
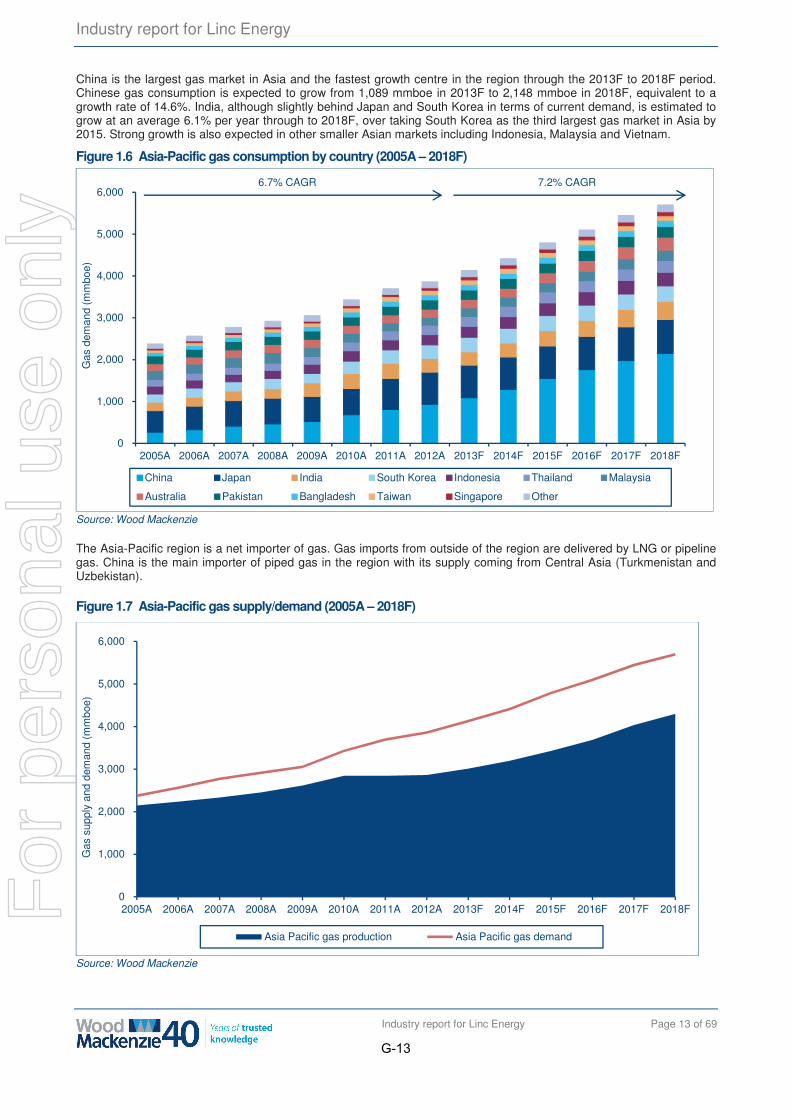
Industry report for Linc Energy
Industry report for Linc Energy Page 13 of 69
China is the largest gas market in Asia and the fastest growth centre in the region through the 2013F to 2018F period. Chinese gas consumption is expected to grow from 1,089 mmboe in 2013F to 2,148 mmboe in 2018F, equivalent to a growth rate of 14.6%. India, although slightly behind Japan and South Korea in terms of current demand, is estimated to grow at an average 6.1% per year through to 2018F, over taking South Korea as the third largest gas market in Asia by 2015. Strong growth is also expected in other smaller Asian markets including Indonesia, Malaysia and Vietnam.
Figure 1.6 Asia-Pacific gas consumption by country (2005A – 2018F)
Source: Wood Mackenzie
The Asia-Pacific region is a net importer of gas. Gas imports from outside of the region are delivered by LNG or pipeline gas. China is the main importer of piped gas in the region with its supply coming from Central Asia (Turkmenistan and Uzbekistan).
Figure 1.7 Asia-Pacific gas supply/demand (2005A – 2018F)
Source: Wood Mackenzie
0
1,000
2,000
3,000
4,000
5,000
6,000
2005A 2006A 2007A 2008A 2009A 2010A 2011A 2012A 2013F 2014F 2015F 2016F 2017F 2018F
Gas
dem
and
(mm
boe)
China Japan India South Korea Indonesia Thailand Malaysia
Australia Pakistan Bangladesh Taiwan Singapore Other
6.7% CAGR 7.2% CAGR
0
1,000
2,000
3,000
4,000
5,000
6,000
2005A 2006A 2007A 2008A 2009A 2010A 2011A 2012A 2013F 2014F 2015F 2016F 2017F 2018F
Gas
sup
ply
and
dem
and
(mm
boe)
Asia Pacific gas production Asia Pacific gas demand
G-13
For
per
sona
l use
onl
y
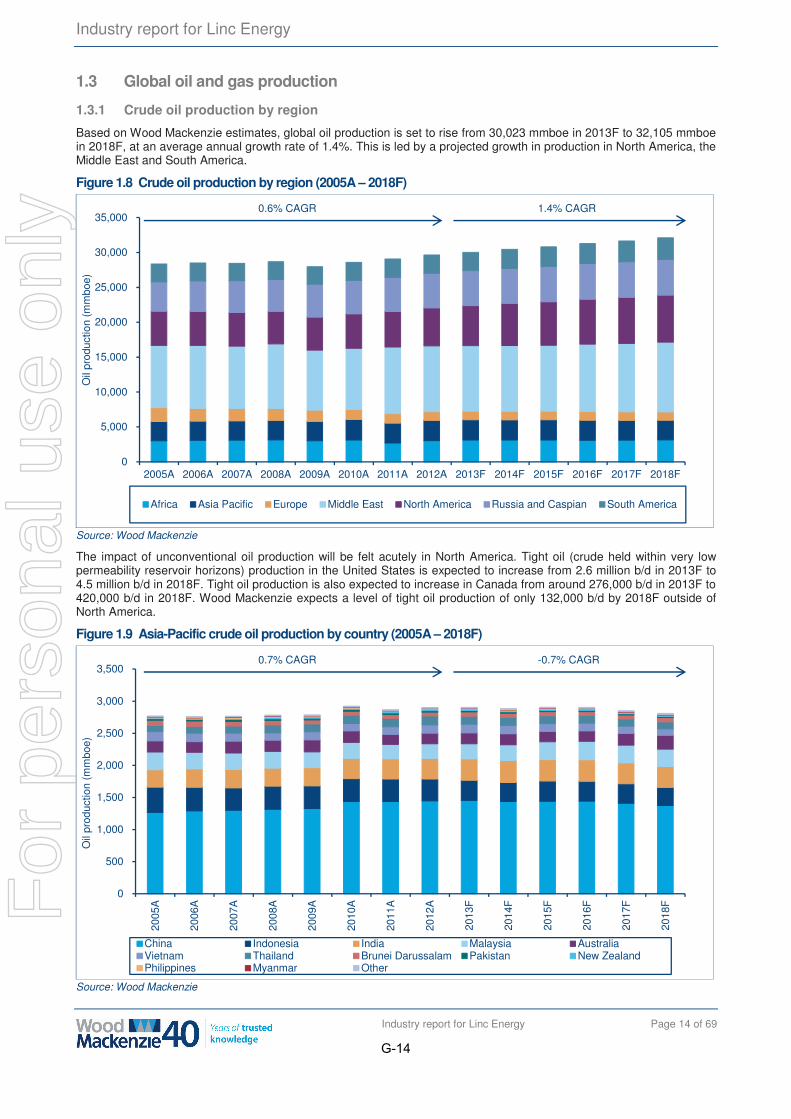
Industry report for Linc Energy
Industry report for Linc Energy Page 14 of 69
1.3 Global oil and gas production
1.3.1 Crude oil production by region
Based on Wood Mackenzie estimates, global oil production is set to rise from 30,023 mmboe in 2013F to 32,105 mmboe in 2018F, at an average annual growth rate of 1.4%. This is led by a projected growth in production in North America, the Middle East and South America.
Figure 1.8 Crude oil production by region (2005A – 2018F)
Source: Wood Mackenzie
The impact of unconventional oil production will be felt acutely in North America. Tight oil (crude held within very low permeability reservoir horizons) production in the United States is expected to increase from 2.6 million b/d in 2013F to 4.5 million b/d in 2018F. Tight oil production is also expected to increase in Canada from around 276,000 b/d in 2013F to 420,000 b/d in 2018F. Wood Mackenzie expects a level of tight oil production of only 132,000 b/d by 2018F outside of North America.
Figure 1.9 Asia-Pacific crude oil production by country (2005A – 2018F)
Source: Wood Mackenzie
0
5,000
10,000
15,000
20,000
25,000
30,000
35,000
2005A 2006A 2007A 2008A 2009A 2010A 2011A 2012A 2013F 2014F 2015F 2016F 2017F 2018F
Oil
prod
uctio
n (m
mbo
e)
Africa Asia Pacific Europe Middle East North America Russia and Caspian South America
0.6% CAGR 1.4% CAGR
0
500
1,000
1,500
2,000
2,500
3,000
3,500
2005
A
2006
A
2007
A
2008
A
2009
A
2010
A
2011
A
2012
A
2013
F
2014
F
2015
F
2016
F
2017
F
2018
F
Oil
prod
uctio
n (m
mbo
e)
China Indonesia India Malaysia AustraliaVietnam Thailand Brunei Darussalam Pakistan New ZealandPhilippines Myanmar Other
0.7% CAGR -0.7% CAGR
G-14
For
per
sona
l use
onl
y
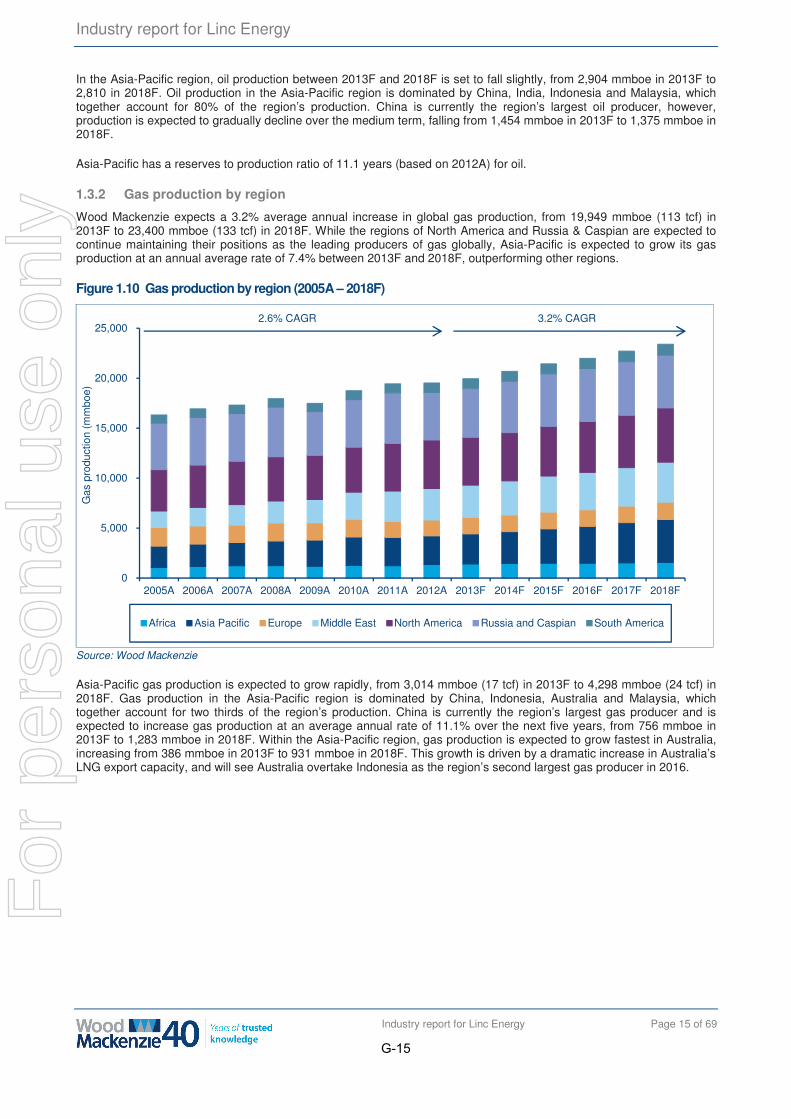
Industry report for Linc Energy
Industry report for Linc Energy Page 15 of 69
In the Asia-Pacific region, oil production between 2013F and 2018F is set to fall slightly, from 2,904 mmboe in 2013F to 2,810 in 2018F. Oil production in the Asia-Pacific region is dominated by China, India, Indonesia and Malaysia, which together account for 80% of the region’s production. China is currently the region’s largest oil producer, however, production is expected to gradually decline over the medium term, falling from 1,454 mmboe in 2013F to 1,375 mmboe in 2018F.
Asia-Pacific has a reserves to production ratio of 11.1 years (based on 2012A) for oil.
1.3.2 Gas production by region
Wood Mackenzie expects a 3.2% average annual increase in global gas production, from 19,949 mmboe (113 tcf) in 2013F to 23,400 mmboe (133 tcf) in 2018F. While the regions of North America and Russia & Caspian are expected to continue maintaining their positions as the leading producers of gas globally, Asia-Pacific is expected to grow its gas production at an annual average rate of 7.4% between 2013F and 2018F, outperforming other regions.
Figure 1.10 Gas production by region (2005A – 2018F)
Source: Wood Mackenzie
Asia-Pacific gas production is expected to grow rapidly, from 3,014 mmboe (17 tcf) in 2013F to 4,298 mmboe (24 tcf) in 2018F. Gas production in the Asia-Pacific region is dominated by China, Indonesia, Australia and Malaysia, which together account for two thirds of the region’s production. China is currently the region’s largest gas producer and is expected to increase gas production at an average annual rate of 11.1% over the next five years, from 756 mmboe in 2013F to 1,283 mmboe in 2018F. Within the Asia-Pacific region, gas production is expected to grow fastest in Australia, increasing from 386 mmboe in 2013F to 931 mmboe in 2018F. This growth is driven by a dramatic increase in Australia’s LNG export capacity, and will see Australia overtake Indonesia as the region’s second largest gas producer in 2016.
0
5,000
10,000
15,000
20,000
25,000
2005A 2006A 2007A 2008A 2009A 2010A 2011A 2012A 2013F 2014F 2015F 2016F 2017F 2018F
Gas
pro
duct
ion
(mm
boe)
Africa Asia Pacific Europe Middle East North America Russia and Caspian South America
2.6% CAGR 3.2% CAGR
G-15
For
per
sona
l use
onl
y
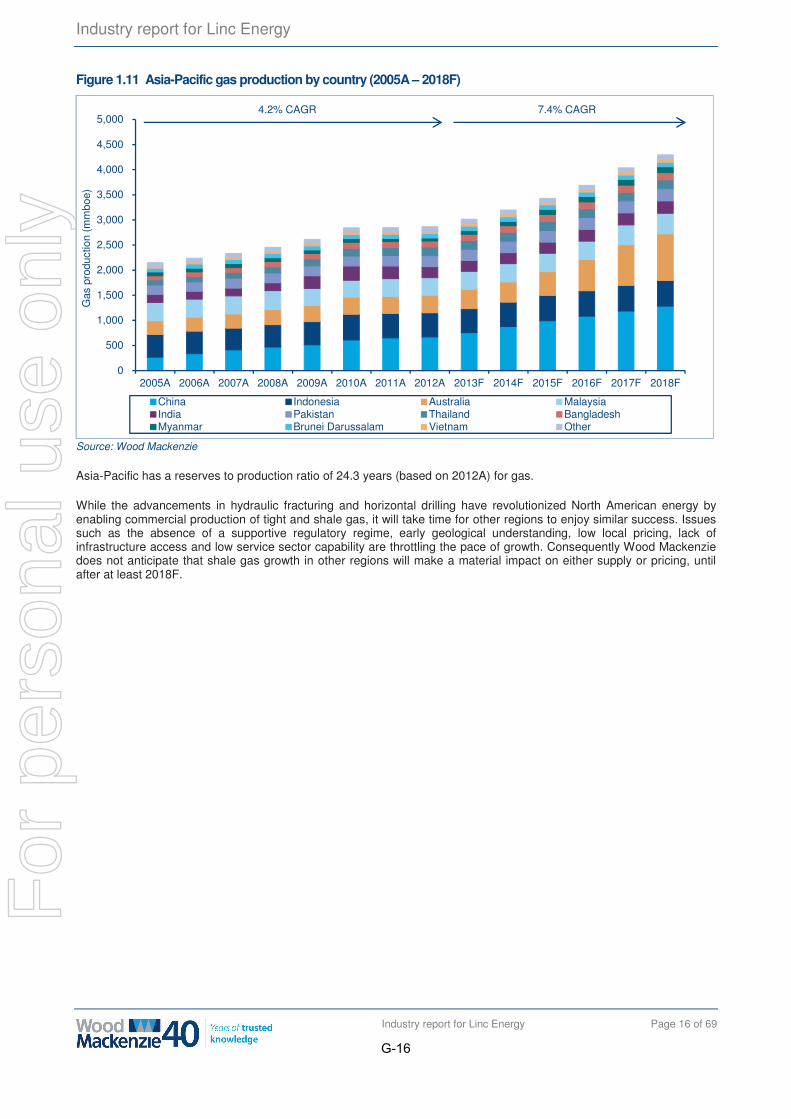
Industry report for Linc Energy
Industry report for Linc Energy Page 16 of 69
Figure 1.11 Asia-Pacific gas production by country (2005A – 2018F)
Source: Wood Mackenzie
Asia-Pacific has a reserves to production ratio of 24.3 years (based on 2012A) for gas.
While the advancements in hydraulic fracturing and horizontal drilling have revolutionized North American energy by enabling commercial production of tight and shale gas, it will take time for other regions to enjoy similar success. Issues such as the absence of a supportive regulatory regime, early geological understanding, low local pricing, lack of infrastructure access and low service sector capability are throttling the pace of growth. Consequently Wood Mackenzie does not anticipate that shale gas growth in other regions will make a material impact on either supply or pricing, until after at least 2018F.
0
500
1,000
1,500
2,000
2,500
3,000
3,500
4,000
4,500
5,000
2005A 2006A 2007A 2008A 2009A 2010A 2011A 2012A 2013F 2014F 2015F 2016F 2017F 2018F
Gas
pro
duct
ion
(mm
boe)
China Indonesia Australia MalaysiaIndia Pakistan Thailand BangladeshMyanmar Brunei Darussalam Vietnam Other
4.2% CAGR 7.4% CAGR
G-16
For
per
sona
l use
onl
y
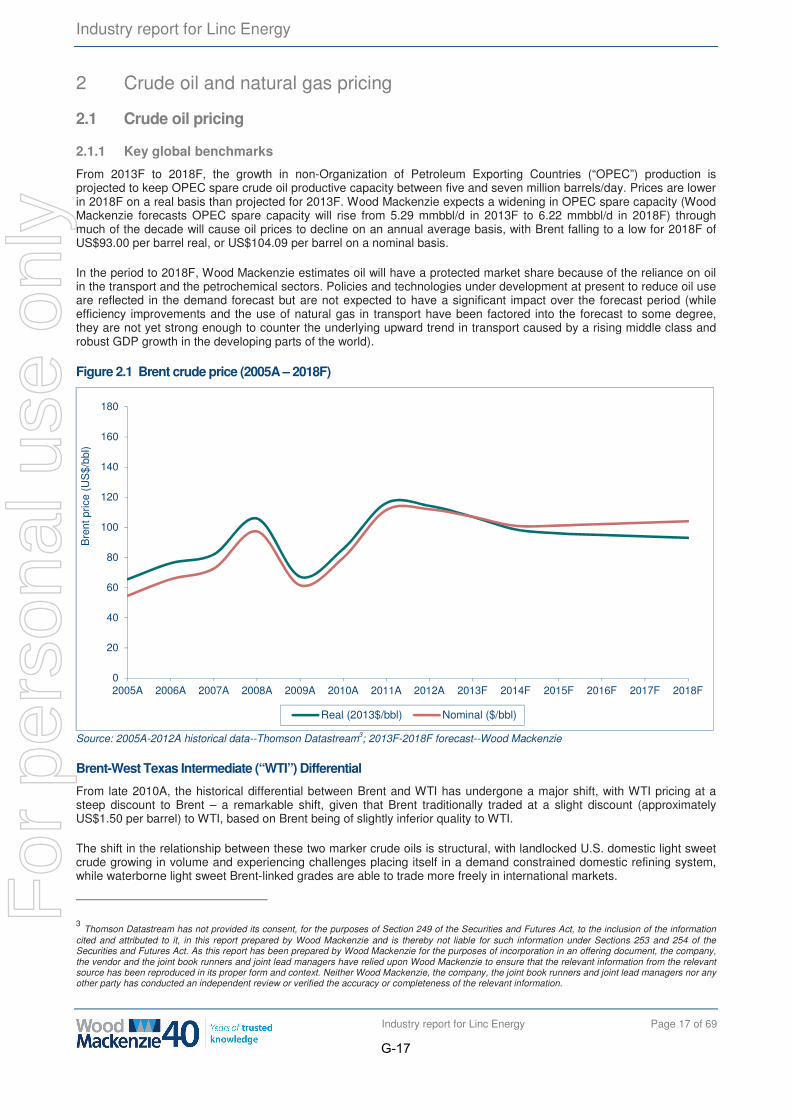
Industry report for Linc Energy
Industry report for Linc Energy Page 17 of 69
2 Crude oil and natural gas pricing
2.1 Crude oil pricing
2.1.1 Key global benchmarks
From 2013F to 2018F, the growth in non-Organization of Petroleum Exporting Countries (“OPEC”) production is projected to keep OPEC spare crude oil productive capacity between five and seven million barrels/day. Prices are lower in 2018F on a real basis than projected for 2013F. Wood Mackenzie expects a widening in OPEC spare capacity (Wood Mackenzie forecasts OPEC spare capacity will rise from 5.29 mmbbl/d in 2013F to 6.22 mmbbl/d in 2018F) through much of the decade will cause oil prices to decline on an annual average basis, with Brent falling to a low for 2018F of US$93.00 per barrel real, or US$104.09 per barrel on a nominal basis.
In the period to 2018F, Wood Mackenzie estimates oil will have a protected market share because of the reliance on oil in the transport and the petrochemical sectors. Policies and technologies under development at present to reduce oil use are reflected in the demand forecast but are not expected to have a significant impact over the forecast period (while efficiency improvements and the use of natural gas in transport have been factored into the forecast to some degree, they are not yet strong enough to counter the underlying upward trend in transport caused by a rising middle class and robust GDP growth in the developing parts of the world).
Figure 2.1 Brent crude price (2005A – 2018F)
Source: 2005A-2012A historical data--Thomson Datastream3; 2013F-2018F forecast--Wood Mackenzie
Brent-West Texas Intermediate (“WTI”) Differential
From late 2010A, the historical differential between Brent and WTI has undergone a major shift, with WTI pricing at a steep discount to Brent – a remarkable shift, given that Brent traditionally traded at a slight discount (approximately US$1.50 per barrel) to WTI, based on Brent being of slightly inferior quality to WTI.
The shift in the relationship between these two marker crude oils is structural, with landlocked U.S. domestic light sweet crude growing in volume and experiencing challenges placing itself in a demand constrained domestic refining system, while waterborne light sweet Brent-linked grades are able to trade more freely in international markets.
3 Thomson Datastream has not provided its consent, for the purposes of Section 249 of the Securities and Futures Act, to the inclusion of the information cited and attributed to it, in this report prepared by Wood Mackenzie and is thereby not liable for such information under Sections 253 and 254 of the Securities and Futures Act. As this report has been prepared by Wood Mackenzie for the purposes of incorporation in an offering document, the company, the vendor and the joint book runners and joint lead managers have relied upon Wood Mackenzie to ensure that the relevant information from the relevant source has been reproduced in its proper form and context. Neither Wood Mackenzie, the company, the joint book runners and joint lead managers nor any other party has conducted an independent review or verified the accuracy or completeness of the relevant information.
0
20
40
60
80
100
120
140
160
180
2005A 2006A 2007A 2008A 2009A 2010A 2011A 2012A 2013F 2014F 2015F 2016F 2017F 2018F
Bre
nt p
rice
(US
$/bb
l)
Real (2013$/bbl) Nominal ($/bbl)
G-17
For
per
sona
l use
onl
y
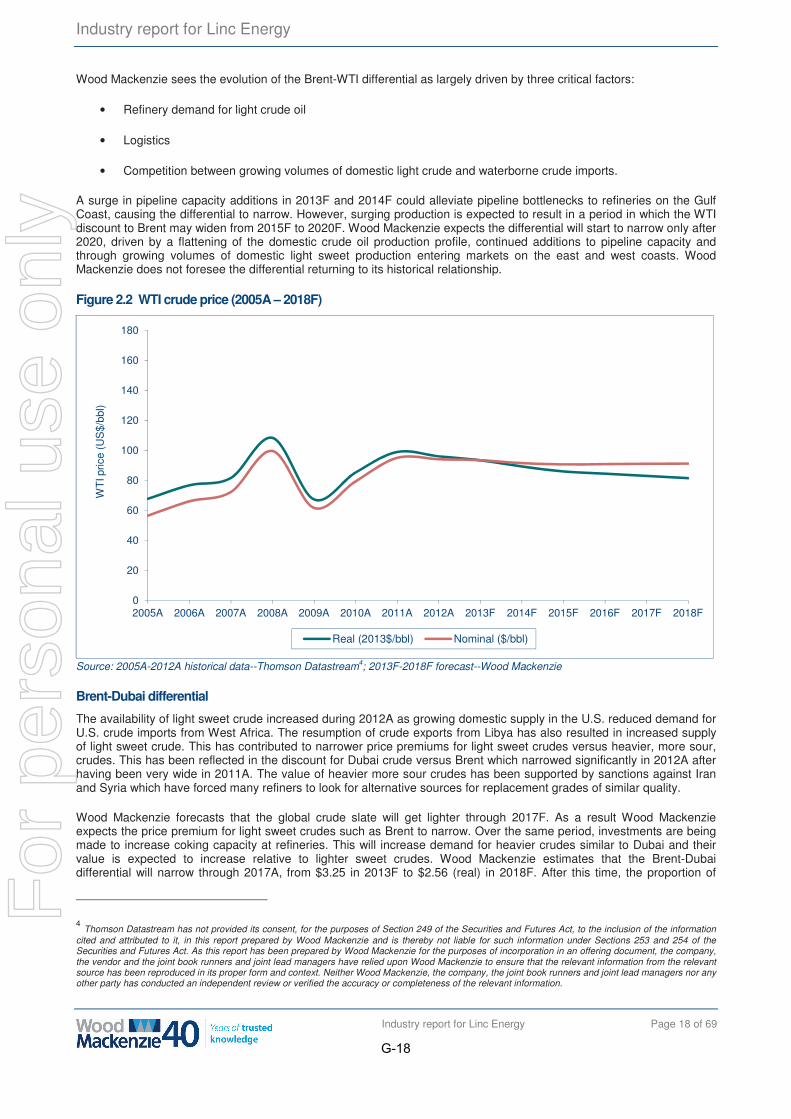
Industry report for Linc Energy
Industry report for Linc Energy Page 18 of 69
Wood Mackenzie sees the evolution of the Brent-WTI differential as largely driven by three critical factors:
• Refinery demand for light crude oil
• Logistics
• Competition between growing volumes of domestic light crude and waterborne crude imports.
A surge in pipeline capacity additions in 2013F and 2014F could alleviate pipeline bottlenecks to refineries on the Gulf Coast, causing the differential to narrow. However, surging production is expected to result in a period in which the WTI discount to Brent may widen from 2015F to 2020F. Wood Mackenzie expects the differential will start to narrow only after 2020, driven by a flattening of the domestic crude oil production profile, continued additions to pipeline capacity and through growing volumes of domestic light sweet production entering markets on the east and west coasts. Wood Mackenzie does not foresee the differential returning to its historical relationship.
Figure 2.2 WTI crude price (2005A – 2018F)
Source: 2005A-2012A historical data--Thomson Datastream4; 2013F-2018F forecast--Wood Mackenzie
Brent-Dubai differential
The availability of light sweet crude increased during 2012A as growing domestic supply in the U.S. reduced demand for U.S. crude imports from West Africa. The resumption of crude exports from Libya has also resulted in increased supply of light sweet crude. This has contributed to narrower price premiums for light sweet crudes versus heavier, more sour, crudes. This has been reflected in the discount for Dubai crude versus Brent which narrowed significantly in 2012A after having been very wide in 2011A. The value of heavier more sour crudes has been supported by sanctions against Iran and Syria which have forced many refiners to look for alternative sources for replacement grades of similar quality.
Wood Mackenzie forecasts that the global crude slate will get lighter through 2017F. As a result Wood Mackenzie expects the price premium for light sweet crudes such as Brent to narrow. Over the same period, investments are being made to increase coking capacity at refineries. This will increase demand for heavier crudes similar to Dubai and their value is expected to increase relative to lighter sweet crudes. Wood Mackenzie estimates that the Brent-Dubai differential will narrow through 2017A, from $3.25 in 2013F to $2.56 (real) in 2018F. After this time, the proportion of
4 Thomson Datastream has not provided its consent, for the purposes of Section 249 of the Securities and Futures Act, to the inclusion of the information cited and attributed to it, in this report prepared by Wood Mackenzie and is thereby not liable for such information under Sections 253 and 254 of the Securities and Futures Act. As this report has been prepared by Wood Mackenzie for the purposes of incorporation in an offering document, the company, the vendor and the joint book runners and joint lead managers have relied upon Wood Mackenzie to ensure that the relevant information from the relevant source has been reproduced in its proper form and context. Neither Wood Mackenzie, the company, the joint book runners and joint lead managers nor any other party has conducted an independent review or verified the accuracy or completeness of the relevant information.
0
20
40
60
80
100
120
140
160
180
2005A 2006A 2007A 2008A 2009A 2010A 2011A 2012A 2013F 2014F 2015F 2016F 2017F 2018F
WT
I pric
e (U
S$/
bbl)
Real (2013$/bbl) Nominal ($/bbl)
G-18
For
per
sona
l use
onl
y
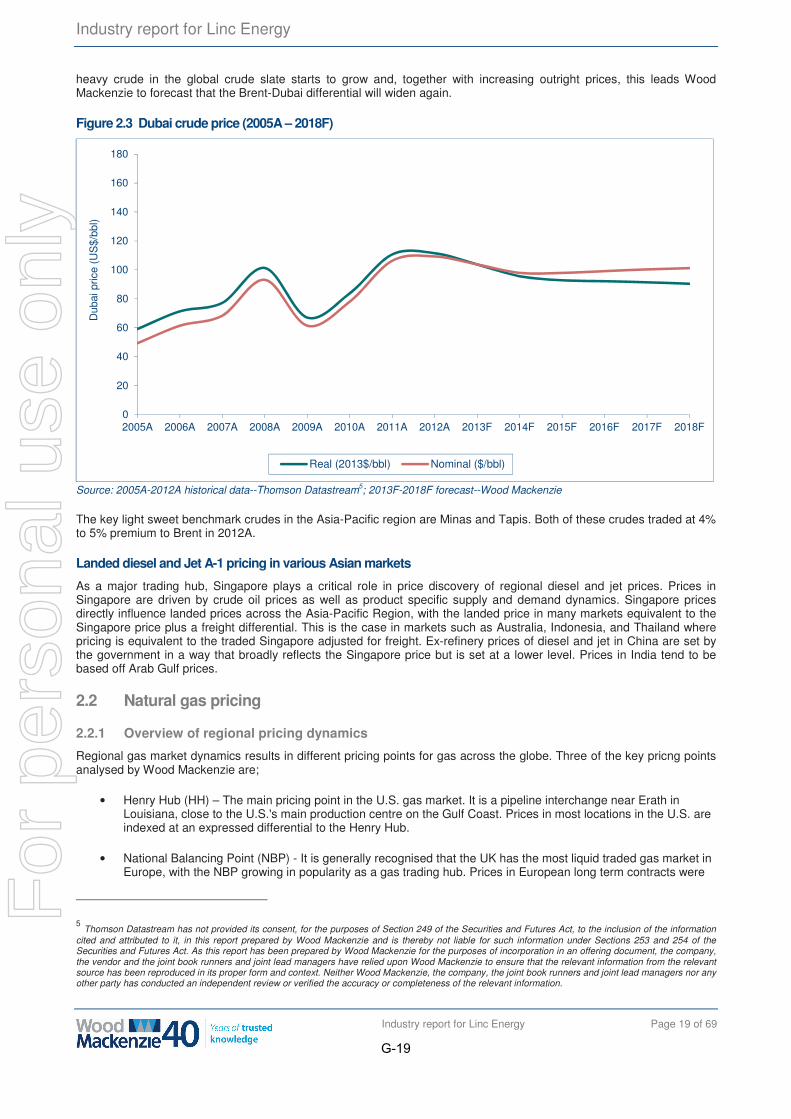
Industry report for Linc Energy
Industry report for Linc Energy Page 19 of 69
heavy crude in the global crude slate starts to grow and, together with increasing outright prices, this leads Wood Mackenzie to forecast that the Brent-Dubai differential will widen again.
Figure 2.3 Dubai crude price (2005A – 2018F)
Source: 2005A-2012A historical data--Thomson Datastream5; 2013F-2018F forecast--Wood Mackenzie
The key light sweet benchmark crudes in the Asia-Pacific region are Minas and Tapis. Both of these crudes traded at 4% to 5% premium to Brent in 2012A.
Landed diesel and Jet A-1 pricing in various Asian markets
As a major trading hub, Singapore plays a critical role in price discovery of regional diesel and jet prices. Prices in Singapore are driven by crude oil prices as well as product specific supply and demand dynamics. Singapore prices directly influence landed prices across the Asia-Pacific Region, with the landed price in many markets equivalent to the Singapore price plus a freight differential. This is the case in markets such as Australia, Indonesia, and Thailand where pricing is equivalent to the traded Singapore adjusted for freight. Ex-refinery prices of diesel and jet in China are set by the government in a way that broadly reflects the Singapore price but is set at a lower level. Prices in India tend to be based off Arab Gulf prices.
2.2 Natural gas pricing
2.2.1 Overview of regional pricing dynamics
Regional gas market dynamics results in different pricing points for gas across the globe. Three of the key pricng points analysed by Wood Mackenzie are;
• Henry Hub (HH) – The main pricing point in the U.S. gas market. It is a pipeline interchange near Erath in Louisiana, close to the U.S.'s main production centre on the Gulf Coast. Prices in most locations in the U.S. are indexed at an expressed differential to the Henry Hub.
• National Balancing Point (NBP) - It is generally recognised that the UK has the most liquid traded gas market in Europe, with the NBP growing in popularity as a gas trading hub. Prices in European long term contracts were
5 Thomson Datastream has not provided its consent, for the purposes of Section 249 of the Securities and Futures Act, to the inclusion of the information cited and attributed to it, in this report prepared by Wood Mackenzie and is thereby not liable for such information under Sections 253 and 254 of the Securities and Futures Act. As this report has been prepared by Wood Mackenzie for the purposes of incorporation in an offering document, the company, the vendor and the joint book runners and joint lead managers have relied upon Wood Mackenzie to ensure that the relevant information from the relevant source has been reproduced in its proper form and context. Neither Wood Mackenzie, the company, the joint book runners and joint lead managers nor any other party has conducted an independent review or verified the accuracy or completeness of the relevant information.
0
20
40
60
80
100
120
140
160
180
2005A 2006A 2007A 2008A 2009A 2010A 2011A 2012A 2013F 2014F 2015F 2016F 2017F 2018F
Dub
ai p
rice
(US
$/bb
l)
Real (2013$/bbl) Nominal ($/bbl)
G-19
For
per
sona
l use
onl
y
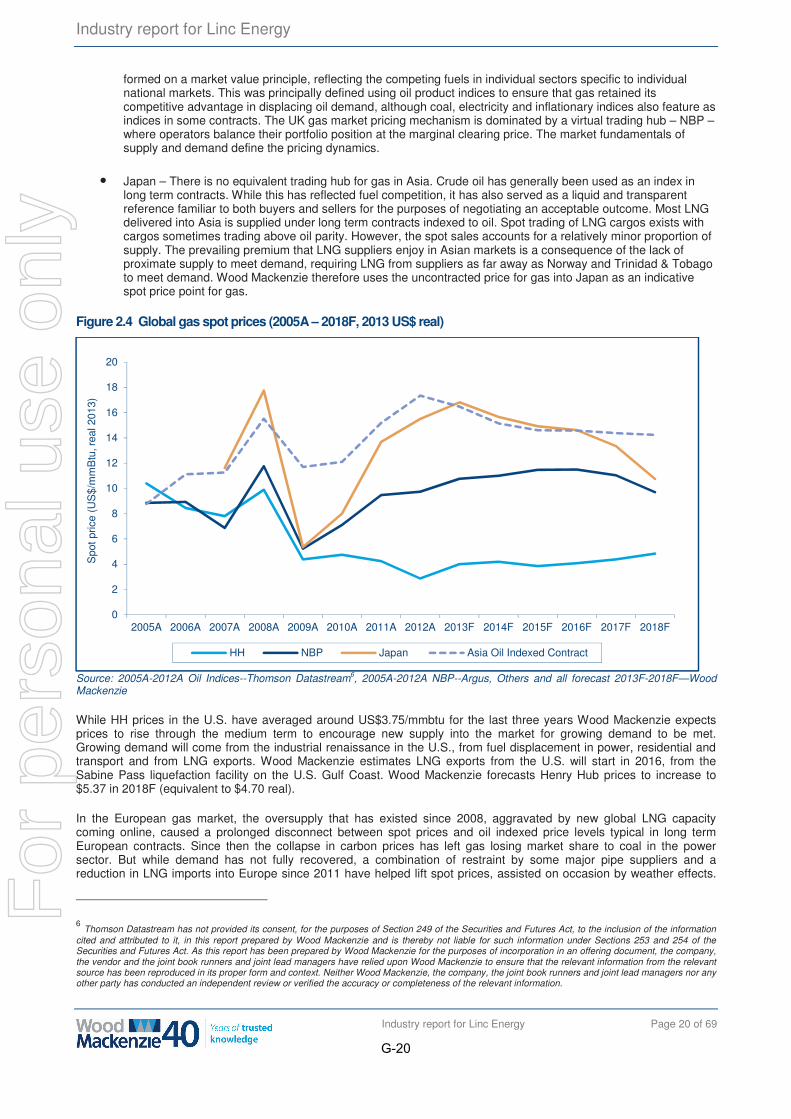
Industry report for Linc Energy
Industry report for Linc Energy Page 20 of 69
formed on a market value principle, reflecting the competing fuels in individual sectors specific to individual national markets. This was principally defined using oil product indices to ensure that gas retained its competitive advantage in displacing oil demand, although coal, electricity and inflationary indices also feature as indices in some contracts. The UK gas market pricing mechanism is dominated by a virtual trading hub – NBP – where operators balance their portfolio position at the marginal clearing price. The market fundamentals of supply and demand define the pricing dynamics.
• Japan – There is no equivalent trading hub for gas in Asia. Crude oil has generally been used as an index in long term contracts. While this has reflected fuel competition, it has also served as a liquid and transparent reference familiar to both buyers and sellers for the purposes of negotiating an acceptable outcome. Most LNG delivered into Asia is supplied under long term contracts indexed to oil. Spot trading of LNG cargos exists with cargos sometimes trading above oil parity. However, the spot sales accounts for a relatively minor proportion of supply. The prevailing premium that LNG suppliers enjoy in Asian markets is a consequence of the lack of proximate supply to meet demand, requiring LNG from suppliers as far away as Norway and Trinidad & Tobago to meet demand. Wood Mackenzie therefore uses the uncontracted price for gas into Japan as an indicative spot price point for gas.
Figure 2.4 Global gas spot prices (2005A – 2018F, 2013 US$ real)
Source: 2005A-2012A Oil Indices--Thomson Datastream6, 2005A-2012A NBP--Argus, Others and all forecast 2013F-2018F—Wood Mackenzie
While HH prices in the U.S. have averaged around US$3.75/mmbtu for the last three years Wood Mackenzie expects prices to rise through the medium term to encourage new supply into the market for growing demand to be met. Growing demand will come from the industrial renaissance in the U.S., from fuel displacement in power, residential and transport and from LNG exports. Wood Mackenzie estimates LNG exports from the U.S. will start in 2016, from the Sabine Pass liquefaction facility on the U.S. Gulf Coast. Wood Mackenzie forecasts Henry Hub prices to increase to $5.37 in 2018F (equivalent to $4.70 real).
In the European gas market, the oversupply that has existed since 2008, aggravated by new global LNG capacity coming online, caused a prolonged disconnect between spot prices and oil indexed price levels typical in long term European contracts. Since then the collapse in carbon prices has left gas losing market share to coal in the power sector. But while demand has not fully recovered, a combination of restraint by some major pipe suppliers and a reduction in LNG imports into Europe since 2011 have helped lift spot prices, assisted on occasion by weather effects.
6 Thomson Datastream has not provided its consent, for the purposes of Section 249 of the Securities and Futures Act, to the inclusion of the information cited and attributed to it, in this report prepared by Wood Mackenzie and is thereby not liable for such information under Sections 253 and 254 of the Securities and Futures Act. As this report has been prepared by Wood Mackenzie for the purposes of incorporation in an offering document, the company, the vendor and the joint book runners and joint lead managers have relied upon Wood Mackenzie to ensure that the relevant information from the relevant source has been reproduced in its proper form and context. Neither Wood Mackenzie, the company, the joint book runners and joint lead managers nor any other party has conducted an independent review or verified the accuracy or completeness of the relevant information.
0
2
4
6
8
10
12
14
16
18
20
2005A 2006A 2007A 2008A 2009A 2010A 2011A 2012A 2013F 2014F 2015F 2016F 2017F 2018F
Spo
t pric
e (U
S$/
mm
Btu
, rea
l 201
3)
HH NBP Japan Asia Oil Indexed Contract
G-20
For
per
sona
l use
onl
y
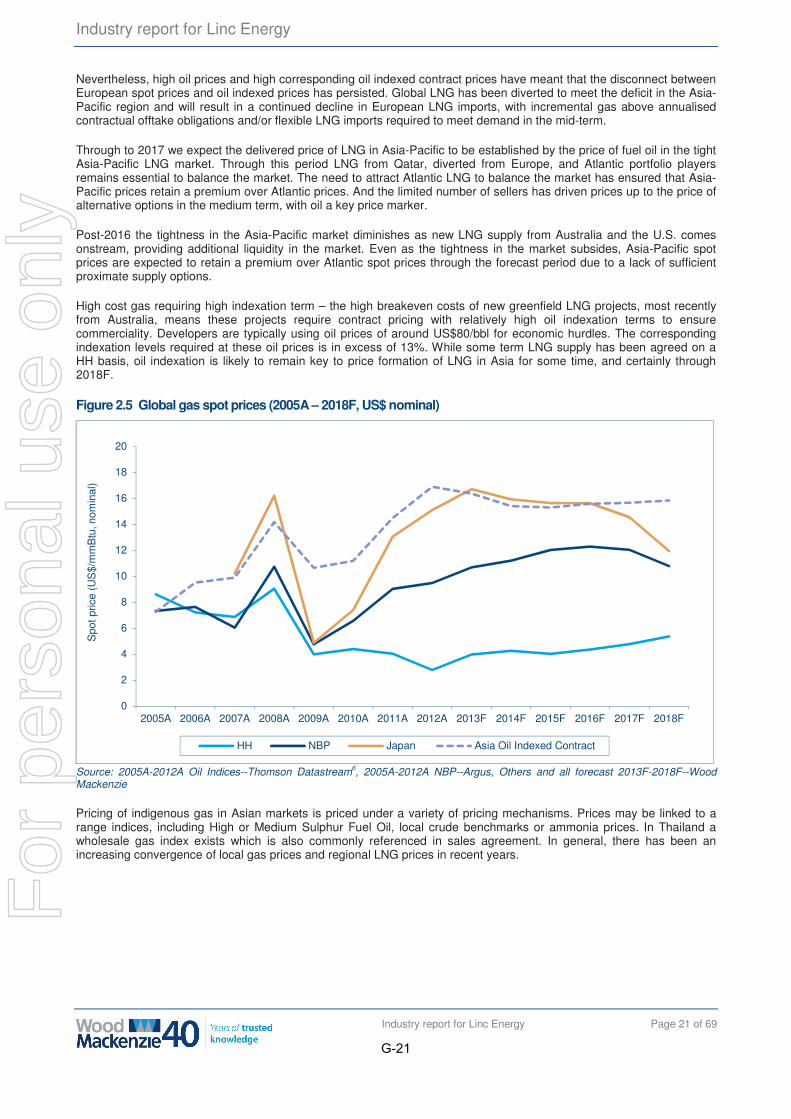
Industry report for Linc Energy
Industry report for Linc Energy Page 21 of 69
Nevertheless, high oil prices and high corresponding oil indexed contract prices have meant that the disconnect between European spot prices and oil indexed prices has persisted. Global LNG has been diverted to meet the deficit in the Asia-Pacific region and will result in a continued decline in European LNG imports, with incremental gas above annualised contractual offtake obligations and/or flexible LNG imports required to meet demand in the mid-term.
Through to 2017 we expect the delivered price of LNG in Asia-Pacific to be established by the price of fuel oil in the tight Asia-Pacific LNG market. Through this period LNG from Qatar, diverted from Europe, and Atlantic portfolio players remains essential to balance the market. The need to attract Atlantic LNG to balance the market has ensured that Asia-Pacific prices retain a premium over Atlantic prices. And the limited number of sellers has driven prices up to the price of alternative options in the medium term, with oil a key price marker.
Post-2016 the tightness in the Asia-Pacific market diminishes as new LNG supply from Australia and the U.S. comes onstream, providing additional liquidity in the market. Even as the tightness in the market subsides, Asia-Pacific spot prices are expected to retain a premium over Atlantic spot prices through the forecast period due to a lack of sufficient proximate supply options.
High cost gas requiring high indexation term – the high breakeven costs of new greenfield LNG projects, most recently from Australia, means these projects require contract pricing with relatively high oil indexation terms to ensure commerciality. Developers are typically using oil prices of around US$80/bbl for economic hurdles. The corresponding indexation levels required at these oil prices is in excess of 13%. While some term LNG supply has been agreed on a HH basis, oil indexation is likely to remain key to price formation of LNG in Asia for some time, and certainly through 2018F.
Figure 2.5 Global gas spot prices (2005A – 2018F, US$ nominal)
Source: 2005A-2012A Oil Indices--Thomson Datastream6, 2005A-2012A NBP--Argus, Others and all forecast 2013F-2018F--Wood Mackenzie
Pricing of indigenous gas in Asian markets is priced under a variety of pricing mechanisms. Prices may be linked to a range indices, including High or Medium Sulphur Fuel Oil, local crude benchmarks or ammonia prices. In Thailand a wholesale gas index exists which is also commonly referenced in sales agreement. In general, there has been an increasing convergence of local gas prices and regional LNG prices in recent years.
0
2
4
6
8
10
12
14
16
18
20
2005A 2006A 2007A 2008A 2009A 2010A 2011A 2012A 2013F 2014F 2015F 2016F 2017F 2018F
Spo
t pric
e (U
S$/
mm
Btu
, nom
inal
)
HH NBP Japan Asia Oil Indexed Contract
G-21
For
per
sona
l use
onl
y
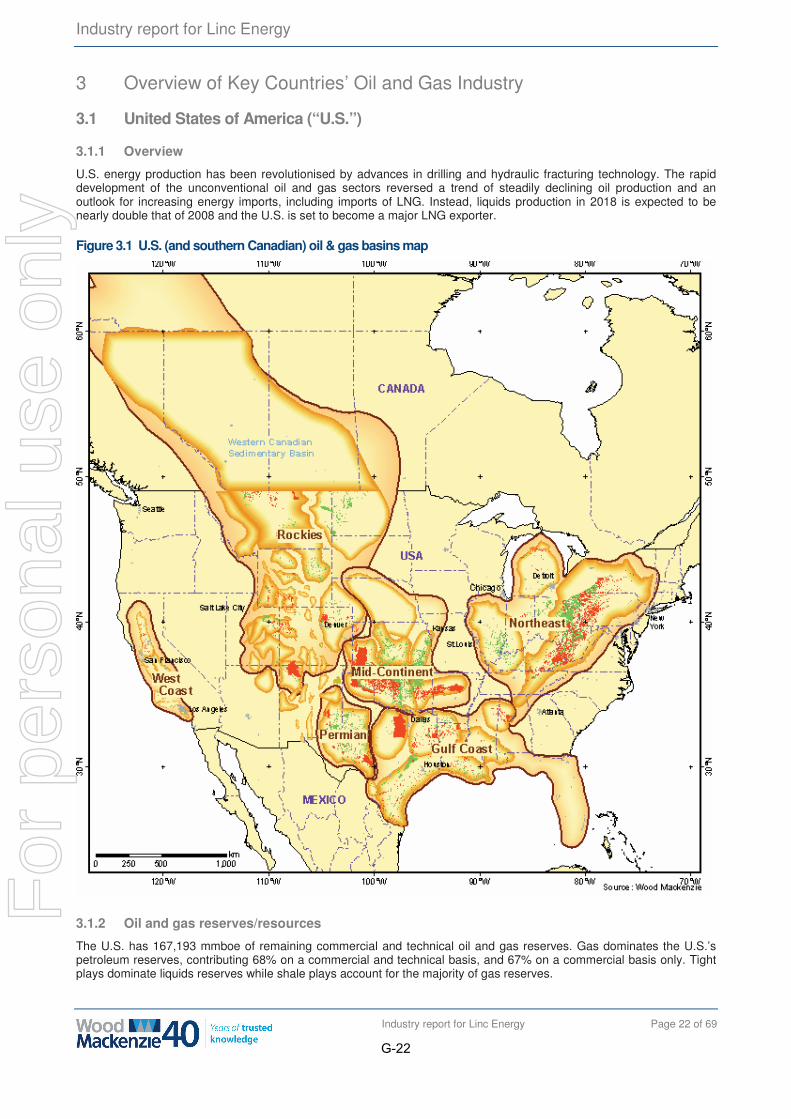
Industry report for Linc Energy
Industry report for Linc Energy Page 22 of 69
3 Overview of Key Countries’ Oil and Gas Industry
3.1 United States of America (“U.S.”)
3.1.1 Overview
U.S. energy production has been revolutionised by advances in drilling and hydraulic fracturing technology. The rapid development of the unconventional oil and gas sectors reversed a trend of steadily declining oil production and an outlook for increasing energy imports, including imports of LNG. Instead, liquids production in 2018 is expected to be nearly double that of 2008 and the U.S. is set to become a major LNG exporter.
Figure 3.1 U.S. (and southern Canadian) oil & gas basins map
3.1.2 Oil and gas reserves/resources
The U.S. has 167,193 mmboe of remaining commercial and technical oil and gas reserves. Gas dominates the U.S.’s petroleum reserves, contributing 68% on a commercial and technical basis, and 67% on a commercial basis only. Tight plays dominate liquids reserves while shale plays account for the majority of gas reserves.
G-22
For
per
sona
l use
onl
y
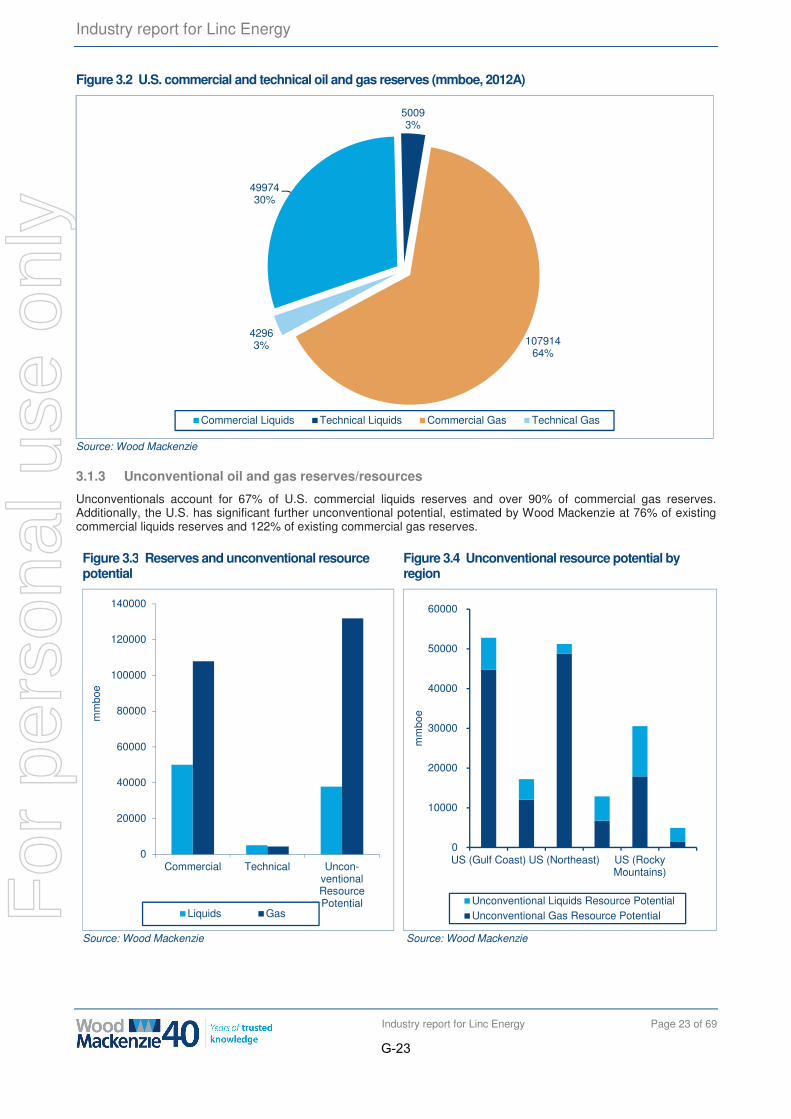
Industry report for Linc Energy
Industry report for Linc Energy Page 23 of 69
Figure 3.2 U.S. commercial and technical oil and gas reserves (mmboe, 2012A)
Source: Wood Mackenzie
3.1.3 Unconventional oil and gas reserves/resources
Unconventionals account for 67% of U.S. commercial liquids reserves and over 90% of commercial gas reserves. Additionally, the U.S. has significant further unconventional potential, estimated by Wood Mackenzie at 76% of existing commercial liquids reserves and 122% of existing commercial gas reserves.
Figure 3.3 Reserves and unconventional resource potential
Source: Wood Mackenzie
Figure 3.4 Unconventional resource potential by region .
Source: Wood Mackenzie
4997430%
50093%
10791464%
42963%
Commercial Liquids Technical Liquids Commercial Gas Technical Gas
0
20000
40000
60000
80000
100000
120000
140000
Commercial Technical Uncon-ventionalResourcePotential
mm
boe
Liquids Gas
0
10000
20000
30000
40000
50000
60000
US (Gulf Coast) US (Northeast) US (RockyMountains)
mm
boe
Unconventional Liquids Resource PotentialUnconventional Gas Resource Potential
G-23
For
per
sona
l use
onl
y
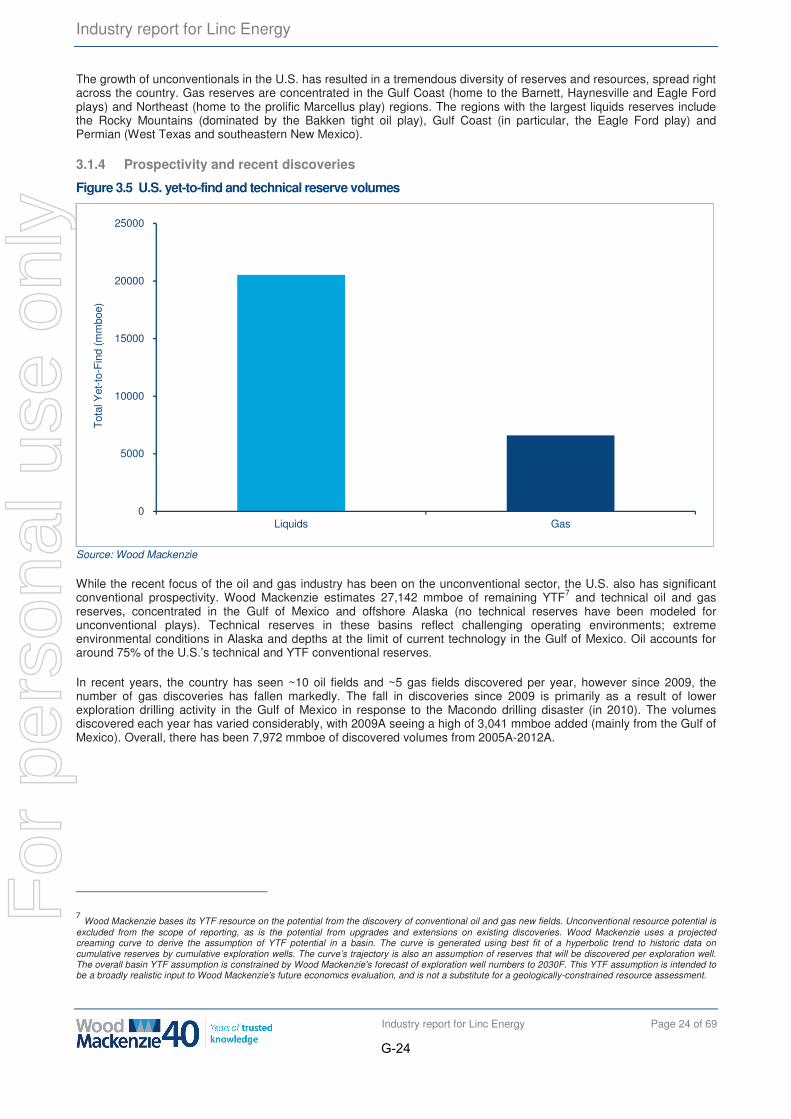
Industry report for Linc Energy
Industry report for Linc Energy Page 24 of 69
The growth of unconventionals in the U.S. has resulted in a tremendous diversity of reserves and resources, spread right across the country. Gas reserves are concentrated in the Gulf Coast (home to the Barnett, Haynesville and Eagle Ford plays) and Northeast (home to the prolific Marcellus play) regions. The regions with the largest liquids reserves include the Rocky Mountains (dominated by the Bakken tight oil play), Gulf Coast (in particular, the Eagle Ford play) and Permian (West Texas and southeastern New Mexico).
3.1.4 Prospectivity and recent discoveries
Figure 3.5 U.S. yet-to-find and technical reserve volumes
Source: Wood Mackenzie
While the recent focus of the oil and gas industry has been on the unconventional sector, the U.S. also has significant conventional prospectivity. Wood Mackenzie estimates 27,142 mmboe of remaining YTF7 and technical oil and gas reserves, concentrated in the Gulf of Mexico and offshore Alaska (no technical reserves have been modeled for unconventional plays). Technical reserves in these basins reflect challenging operating environments; extreme environmental conditions in Alaska and depths at the limit of current technology in the Gulf of Mexico. Oil accounts for around 75% of the U.S.’s technical and YTF conventional reserves.
In recent years, the country has seen ~10 oil fields and ~5 gas fields discovered per year, however since 2009, the number of gas discoveries has fallen markedly. The fall in discoveries since 2009 is primarily as a result of lower exploration drilling activity in the Gulf of Mexico in response to the Macondo drilling disaster (in 2010). The volumes discovered each year has varied considerably, with 2009A seeing a high of 3,041 mmboe added (mainly from the Gulf of Mexico). Overall, there has been 7,972 mmboe of discovered volumes from 2005A-2012A.
7 Wood Mackenzie bases its YTF resource on the potential from the discovery of conventional oil and gas new fields. Unconventional resource potential is excluded from the scope of reporting, as is the potential from upgrades and extensions on existing discoveries. Wood Mackenzie uses a projected creaming curve to derive the assumption of YTF potential in a basin. The curve is generated using best fit of a hyperbolic trend to historic data on cumulative reserves by cumulative exploration wells. The curve’s trajectory is also an assumption of reserves that will be discovered per exploration well. The overall basin YTF assumption is constrained by Wood Mackenzie's forecast of exploration well numbers to 2030F. This YTF assumption is intended to be a broadly realistic input to Wood Mackenzie's future economics evaluation, and is not a substitute for a geologically-constrained resource assessment.
0
5000
10000
15000
20000
25000
Liquids Gas
Tot
al Y
et-t
o-F
ind
(mm
boe)
G-24
For
per
sona
l use
onl
y
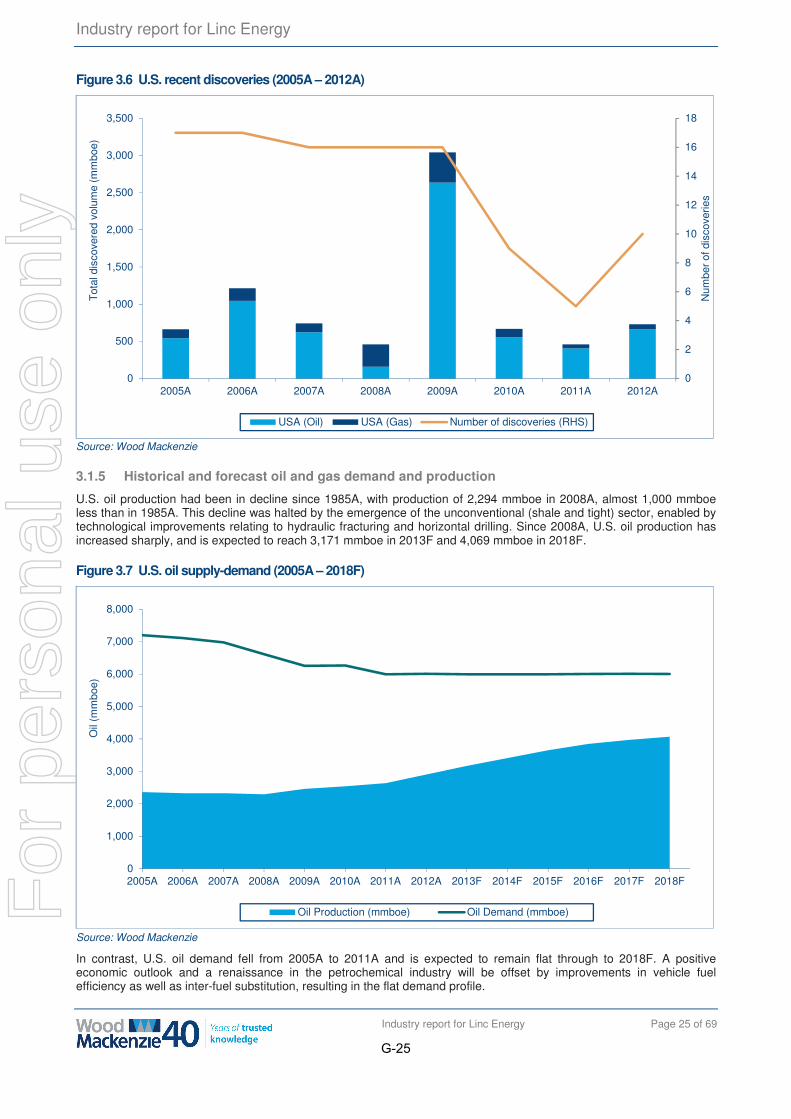
Industry report for Linc Energy
Industry report for Linc Energy Page 25 of 69
Figure 3.6 U.S. recent discoveries (2005A – 2012A)
Source: Wood Mackenzie
3.1.5 Historical and forecast oil and gas demand and production
U.S. oil production had been in decline since 1985A, with production of 2,294 mmboe in 2008A, almost 1,000 mmboe less than in 1985A. This decline was halted by the emergence of the unconventional (shale and tight) sector, enabled by technological improvements relating to hydraulic fracturing and horizontal drilling. Since 2008A, U.S. oil production has increased sharply, and is expected to reach 3,171 mmboe in 2013F and 4,069 mmboe in 2018F.
Figure 3.7 U.S. oil supply-demand (2005A – 2018F)
Source: Wood Mackenzie
In contrast, U.S. oil demand fell from 2005A to 2011A and is expected to remain flat through to 2018F. A positive economic outlook and a renaissance in the petrochemical industry will be offset by improvements in vehicle fuel efficiency as well as inter-fuel substitution, resulting in the flat demand profile.
0
2
4
6
8
10
12
14
16
18
0
500
1,000
1,500
2,000
2,500
3,000
3,500
2005A 2006A 2007A 2008A 2009A 2010A 2011A 2012A
Num
ber
of d
isco
verie
s
Tot
al d
isco
vere
d vo
lum
e (m
mbo
e)
USA (Oil) USA (Gas) Number of discoveries (RHS)
0
1,000
2,000
3,000
4,000
5,000
6,000
7,000
8,000
2005A 2006A 2007A 2008A 2009A 2010A 2011A 2012A 2013F 2014F 2015F 2016F 2017F 2018F
Oil
(mm
boe)
Oil Production (mmboe) Oil Demand (mmboe)
G-25
For
per
sona
l use
onl
y
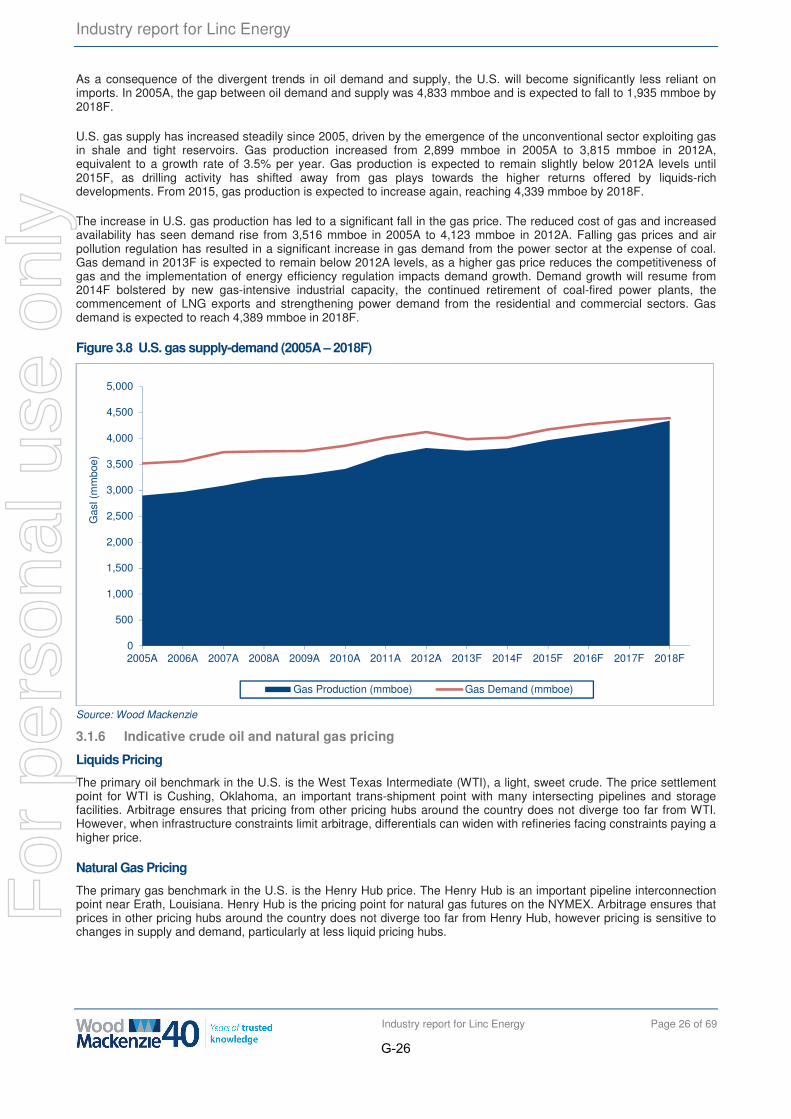
Industry report for Linc Energy
Industry report for Linc Energy Page 26 of 69
As a consequence of the divergent trends in oil demand and supply, the U.S. will become significantly less reliant on imports. In 2005A, the gap between oil demand and supply was 4,833 mmboe and is expected to fall to 1,935 mmboe by 2018F.
U.S. gas supply has increased steadily since 2005, driven by the emergence of the unconventional sector exploiting gas in shale and tight reservoirs. Gas production increased from 2,899 mmboe in 2005A to 3,815 mmboe in 2012A, equivalent to a growth rate of 3.5% per year. Gas production is expected to remain slightly below 2012A levels until 2015F, as drilling activity has shifted away from gas plays towards the higher returns offered by liquids-rich developments. From 2015, gas production is expected to increase again, reaching 4,339 mmboe by 2018F.
The increase in U.S. gas production has led to a significant fall in the gas price. The reduced cost of gas and increased availability has seen demand rise from 3,516 mmboe in 2005A to 4,123 mmboe in 2012A. Falling gas prices and air pollution regulation has resulted in a significant increase in gas demand from the power sector at the expense of coal. Gas demand in 2013F is expected to remain below 2012A levels, as a higher gas price reduces the competitiveness of gas and the implementation of energy efficiency regulation impacts demand growth. Demand growth will resume from 2014F bolstered by new gas-intensive industrial capacity, the continued retirement of coal-fired power plants, the commencement of LNG exports and strengthening power demand from the residential and commercial sectors. Gas demand is expected to reach 4,389 mmboe in 2018F.
Figure 3.8 U.S. gas supply-demand (2005A – 2018F)
Source: Wood Mackenzie
3.1.6 Indicative crude oil and natural gas pricing
Liquids Pricing
The primary oil benchmark in the U.S. is the West Texas Intermediate (WTI), a light, sweet crude. The price settlement point for WTI is Cushing, Oklahoma, an important trans-shipment point with many intersecting pipelines and storage facilities. Arbitrage ensures that pricing from other pricing hubs around the country does not diverge too far from WTI. However, when infrastructure constraints limit arbitrage, differentials can widen with refineries facing constraints paying a higher price.
Natural Gas Pricing
The primary gas benchmark in the U.S. is the Henry Hub price. The Henry Hub is an important pipeline interconnection point near Erath, Louisiana. Henry Hub is the pricing point for natural gas futures on the NYMEX. Arbitrage ensures that prices in other pricing hubs around the country does not diverge too far from Henry Hub, however pricing is sensitive to changes in supply and demand, particularly at less liquid pricing hubs.
0
500
1,000
1,500
2,000
2,500
3,000
3,500
4,000
4,500
5,000
2005A 2006A 2007A 2008A 2009A 2010A 2011A 2012A 2013F 2014F 2015F 2016F 2017F 2018F
Gas
l (m
mbo
e)
Gas Production (mmboe) Gas Demand (mmboe)
G-26
For
per
sona
l use
onl
y
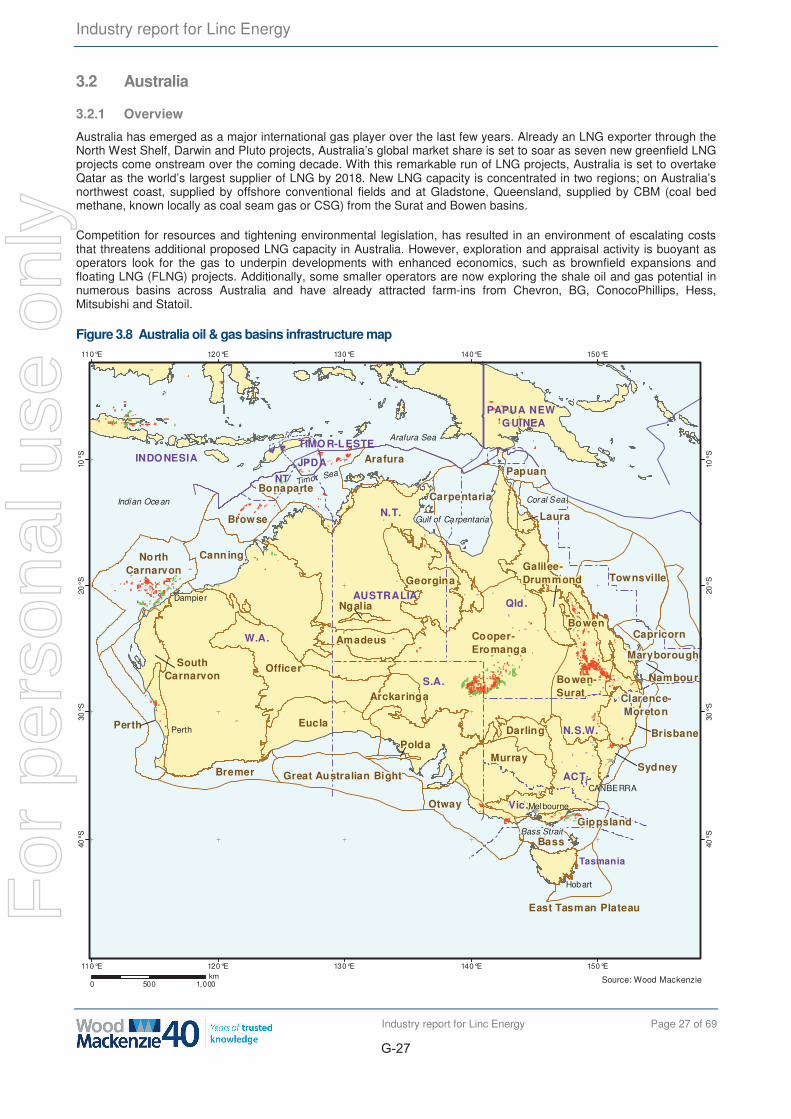
Industry report for Linc Energy
Industry report for Linc Energy Page 27 of 69
3.2 Australia
3.2.1 Overview
Australia has emerged as a major international gas player over the last few years. Already an LNG exporter through the North West Shelf, Darwin and Pluto projects, Australia’s global market share is set to soar as seven new greenfield LNG projects come onstream over the coming decade. With this remarkable run of LNG projects, Australia is set to overtake Qatar as the world’s largest supplier of LNG by 2018. New LNG capacity is concentrated in two regions; on Australia’s northwest coast, supplied by offshore conventional fields and at Gladstone, Queensland, supplied by CBM (coal bed methane, known locally as coal seam gas or CSG) from the Surat and Bowen basins.
Competition for resources and tightening environmental legislation, has resulted in an environment of escalating costs that threatens additional proposed LNG capacity in Australia. However, exploration and appraisal activity is buoyant as operators look for the gas to underpin developments with enhanced economics, such as brownfield expansions and floating LNG (FLNG) projects. Additionally, some smaller operators are now exploring the shale oil and gas potential in numerous basins across Australia and have already attracted farm-ins from Chevron, BG, ConocoPhillips, Hess, Mitsubishi and Statoil.
Figure 3.8 Australia oil & gas basins infrastructure map
S.A.
N.T.
W.A.
Qld.
N.S.W.
Vic.
Tasmania
Bass Strait
Indian Ocean
Perth
PAPUA NEW GUINEA
INDONESIATIMO R-LESTE
Melbourne
CANBERRAACT
Dampier
JPDA
AUSTRALIA
Timor Sea
Gulf of Carpentaria
Coral Sea
Arafura Sea
Hobart
NT
Browse
NorthCarnarvon
Bonaparte
Otway
Bass
Sydney
Clarence-Moreton
Carpentaria
Murray
Great Australian Bight
Cooper-Eromanga
Galilee-Drummond
Bowen
Amadeus
Georgina
Canning
Townsville
Perth
SouthCarnarvon
Officer
Eucla
Gippsland
East Tasman Plateau
Maryborough
Nambour
Brisbane
Arafura
Ngalia
Capricorn
Laura
Papuan
Arckaringa
Darling
Bremer
Bowen-Surat
Polda
150°E
150°E
140°E
140°E
130°E
130°E
120°E
120°E
110°E
110°E
10°S
10°S
20°S
20°S
30°S
30°S
40°S
40°S
0 500 1,000km Source: Wood Mackenzie
G-27
For
per
sona
l use
onl
y
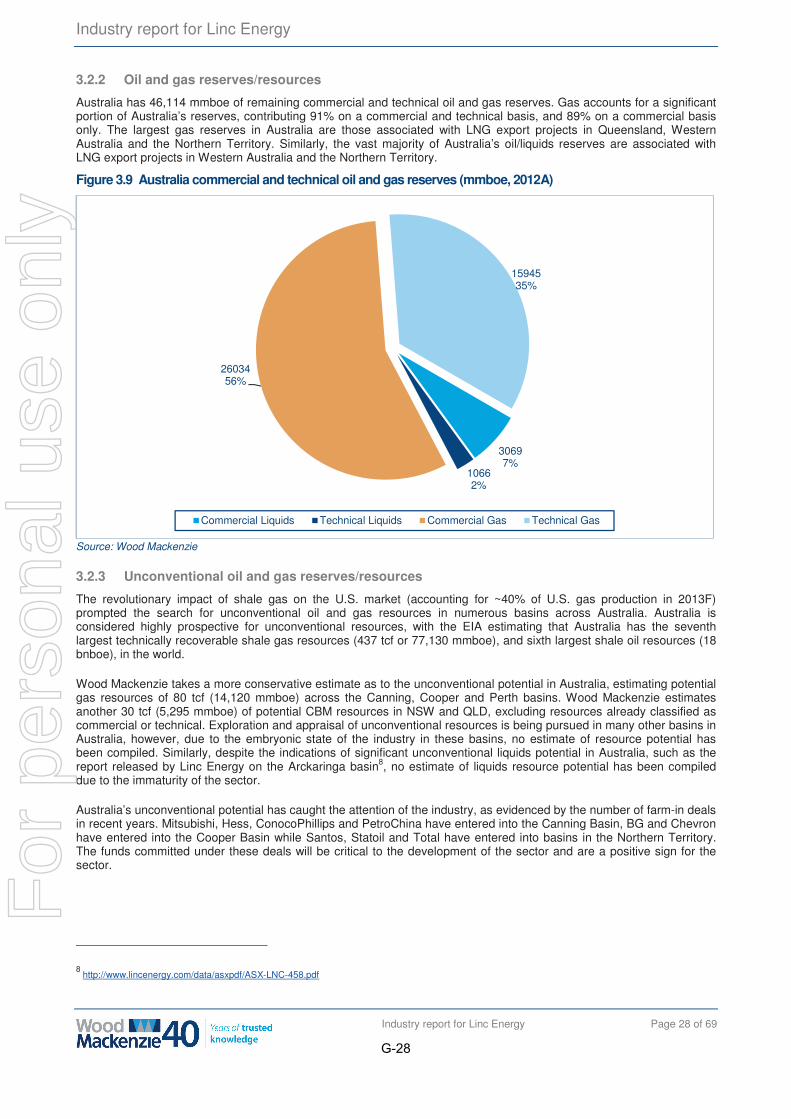
Industry report for Linc Energy
Industry report for Linc Energy Page 28 of 69
3.2.2 Oil and gas reserves/resources
Australia has 46,114 mmboe of remaining commercial and technical oil and gas reserves. Gas accounts for a significant portion of Australia’s reserves, contributing 91% on a commercial and technical basis, and 89% on a commercial basis only. The largest gas reserves in Australia are those associated with LNG export projects in Queensland, Western Australia and the Northern Territory. Similarly, the vast majority of Australia’s oil/liquids reserves are associated with LNG export projects in Western Australia and the Northern Territory.
Figure 3.9 Australia commercial and technical oil and gas reserves (mmboe, 2012A)
Source: Wood Mackenzie
3.2.3 Unconventional oil and gas reserves/resources
The revolutionary impact of shale gas on the U.S. market (accounting for ~40% of U.S. gas production in 2013F) prompted the search for unconventional oil and gas resources in numerous basins across Australia. Australia is considered highly prospective for unconventional resources, with the EIA estimating that Australia has the seventh largest technically recoverable shale gas resources (437 tcf or 77,130 mmboe), and sixth largest shale oil resources (18 bnboe), in the world.
Wood Mackenzie takes a more conservative estimate as to the unconventional potential in Australia, estimating potential gas resources of 80 tcf (14,120 mmboe) across the Canning, Cooper and Perth basins. Wood Mackenzie estimates another 30 tcf (5,295 mmboe) of potential CBM resources in NSW and QLD, excluding resources already classified as commercial or technical. Exploration and appraisal of unconventional resources is being pursued in many other basins in Australia, however, due to the embryonic state of the industry in these basins, no estimate of resource potential has been compiled. Similarly, despite the indications of significant unconventional liquids potential in Australia, such as the report released by Linc Energy on the Arckaringa basin8, no estimate of liquids resource potential has been compiled due to the immaturity of the sector.
Australia’s unconventional potential has caught the attention of the industry, as evidenced by the number of farm-in deals in recent years. Mitsubishi, Hess, ConocoPhillips and PetroChina have entered into the Canning Basin, BG and Chevron have entered into the Cooper Basin while Santos, Statoil and Total have entered into basins in the Northern Territory. The funds committed under these deals will be critical to the development of the sector and are a positive sign for the sector.
8 http://www.lincenergy.com/data/asxpdf/ASX-LNC-458.pdf
30697%
10662%
2603456%
1594535%
Commercial Liquids Technical Liquids Commercial Gas Technical Gas
G-28
For
per
sona
l use
onl
y
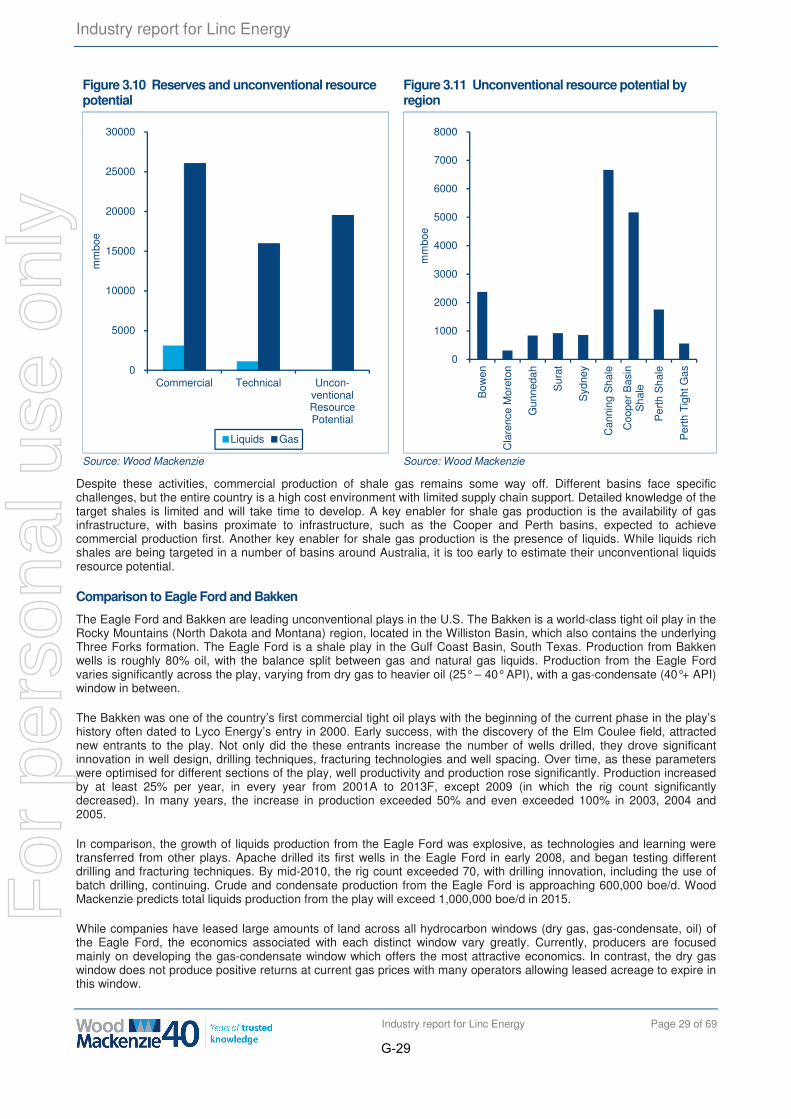
Industry report for Linc Energy
Industry report for Linc Energy Page 29 of 69
Figure 3.10 Reserves and unconventional resource potential
Source: Wood Mackenzie
Figure 3.11 Unconventional resource potential by region . .
Source: Wood Mackenzie
Despite these activities, commercial production of shale gas remains some way off. Different basins face specific challenges, but the entire country is a high cost environment with limited supply chain support. Detailed knowledge of the target shales is limited and will take time to develop. A key enabler for shale gas production is the availability of gas infrastructure, with basins proximate to infrastructure, such as the Cooper and Perth basins, expected to achieve commercial production first. Another key enabler for shale gas production is the presence of liquids. While liquids rich shales are being targeted in a number of basins around Australia, it is too early to estimate their unconventional liquids resource potential.
Comparison to Eagle Ford and Bakken
The Eagle Ford and Bakken are leading unconventional plays in the U.S. The Bakken is a world-class tight oil play in the Rocky Mountains (North Dakota and Montana) region, located in the Williston Basin, which also contains the underlying Three Forks formation. The Eagle Ford is a shale play in the Gulf Coast Basin, South Texas. Production from Bakken wells is roughly 80% oil, with the balance split between gas and natural gas liquids. Production from the Eagle Ford varies significantly across the play, varying from dry gas to heavier oil (25° – 40° API), with a gas-condensate (40°+ API) window in between.
The Bakken was one of the country’s first commercial tight oil plays with the beginning of the current phase in the play’s history often dated to Lyco Energy’s entry in 2000. Early success, with the discovery of the Elm Coulee field, attracted new entrants to the play. Not only did the these entrants increase the number of wells drilled, they drove significant innovation in well design, drilling techniques, fracturing technologies and well spacing. Over time, as these parameters were optimised for different sections of the play, well productivity and production rose significantly. Production increased by at least 25% per year, in every year from 2001A to 2013F, except 2009 (in which the rig count significantly decreased). In many years, the increase in production exceeded 50% and even exceeded 100% in 2003, 2004 and 2005.
In comparison, the growth of liquids production from the Eagle Ford was explosive, as technologies and learning were transferred from other plays. Apache drilled its first wells in the Eagle Ford in early 2008, and began testing different drilling and fracturing techniques. By mid-2010, the rig count exceeded 70, with drilling innovation, including the use of batch drilling, continuing. Crude and condensate production from the Eagle Ford is approaching 600,000 boe/d. Wood Mackenzie predicts total liquids production from the play will exceed 1,000,000 boe/d in 2015.
While companies have leased large amounts of land across all hydrocarbon windows (dry gas, gas-condensate, oil) of the Eagle Ford, the economics associated with each distinct window vary greatly. Currently, producers are focused mainly on developing the gas-condensate window which offers the most attractive economics. In contrast, the dry gas window does not produce positive returns at current gas prices with many operators allowing leased acreage to expire in this window.
0
5000
10000
15000
20000
25000
30000
Commercial Technical Uncon-ventionalResourcePotential
mm
boe
Liquids Gas
0
1000
2000
3000
4000
5000
6000
7000
8000
Bow
en
Cla
renc
e M
oret
on
Gun
neda
h
Sur
at
Syd
ney
Can
ning
Sha
le
Coo
per
Bas
inS
hale
Per
th S
hale
Per
th T
ight
Gas
mm
boe
G-29
For
per
sona
l use
onl
y
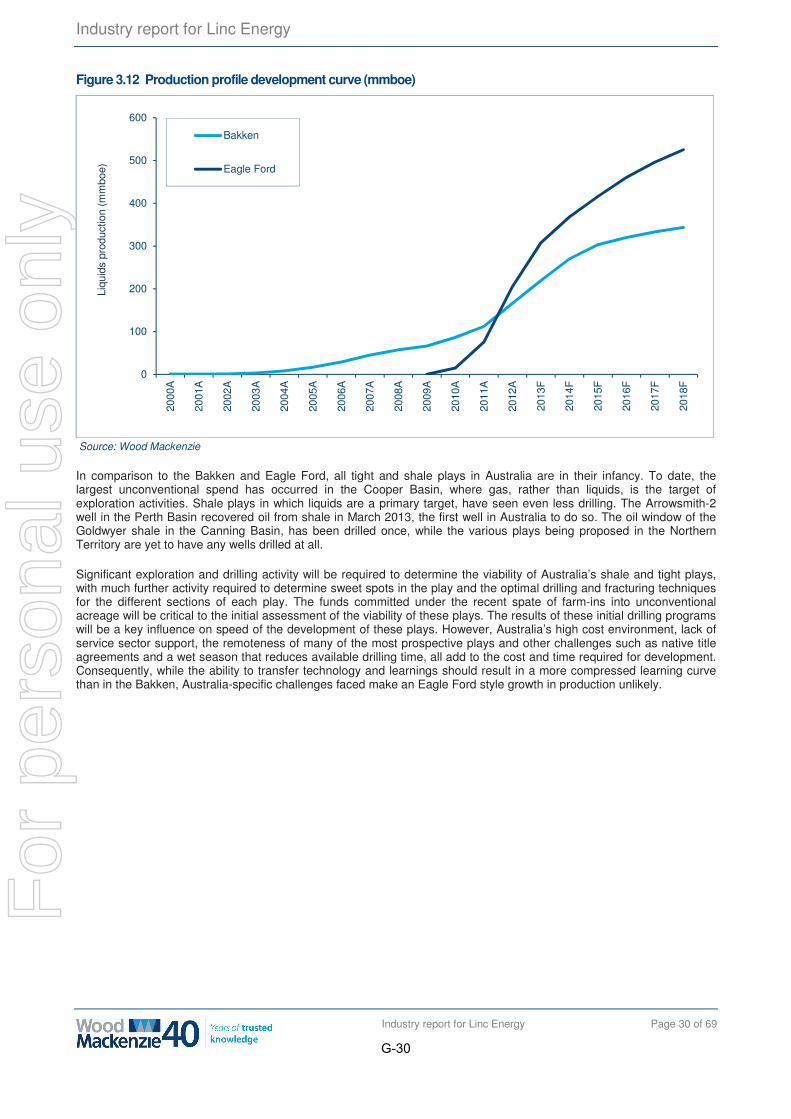
Industry report for Linc Energy
Industry report for Linc Energy Page 30 of 69
Figure 3.12 Production profile development curve (mmboe)
Source: Wood Mackenzie
In comparison to the Bakken and Eagle Ford, all tight and shale plays in Australia are in their infancy. To date, the largest unconventional spend has occurred in the Cooper Basin, where gas, rather than liquids, is the target of exploration activities. Shale plays in which liquids are a primary target, have seen even less drilling. The Arrowsmith-2 well in the Perth Basin recovered oil from shale in March 2013, the first well in Australia to do so. The oil window of the Goldwyer shale in the Canning Basin, has been drilled once, while the various plays being proposed in the Northern Territory are yet to have any wells drilled at all.
Significant exploration and drilling activity will be required to determine the viability of Australia’s shale and tight plays, with much further activity required to determine sweet spots in the play and the optimal drilling and fracturing techniques for the different sections of each play. The funds committed under the recent spate of farm-ins into unconventional acreage will be critical to the initial assessment of the viability of these plays. The results of these initial drilling programs will be a key influence on speed of the development of these plays. However, Australia’s high cost environment, lack of service sector support, the remoteness of many of the most prospective plays and other challenges such as native title agreements and a wet season that reduces available drilling time, all add to the cost and time required for development. Consequently, while the ability to transfer technology and learnings should result in a more compressed learning curve than in the Bakken, Australia-specific challenges faced make an Eagle Ford style growth in production unlikely.
0
100
200
300
400
500
600
2000
A
2001
A
2002
A
2003
A
2004
A
2005
A
2006
A
2007
A
2008
A
2009
A
2010
A
2011
A
2012
A
2013
F
2014
F
2015
F
2016
F
2017
F
2018
F
Liqu
ids
prod
uctio
n (m
mbo
e)
Bakken
Eagle Ford
G-30
For
per
sona
l use
onl
y
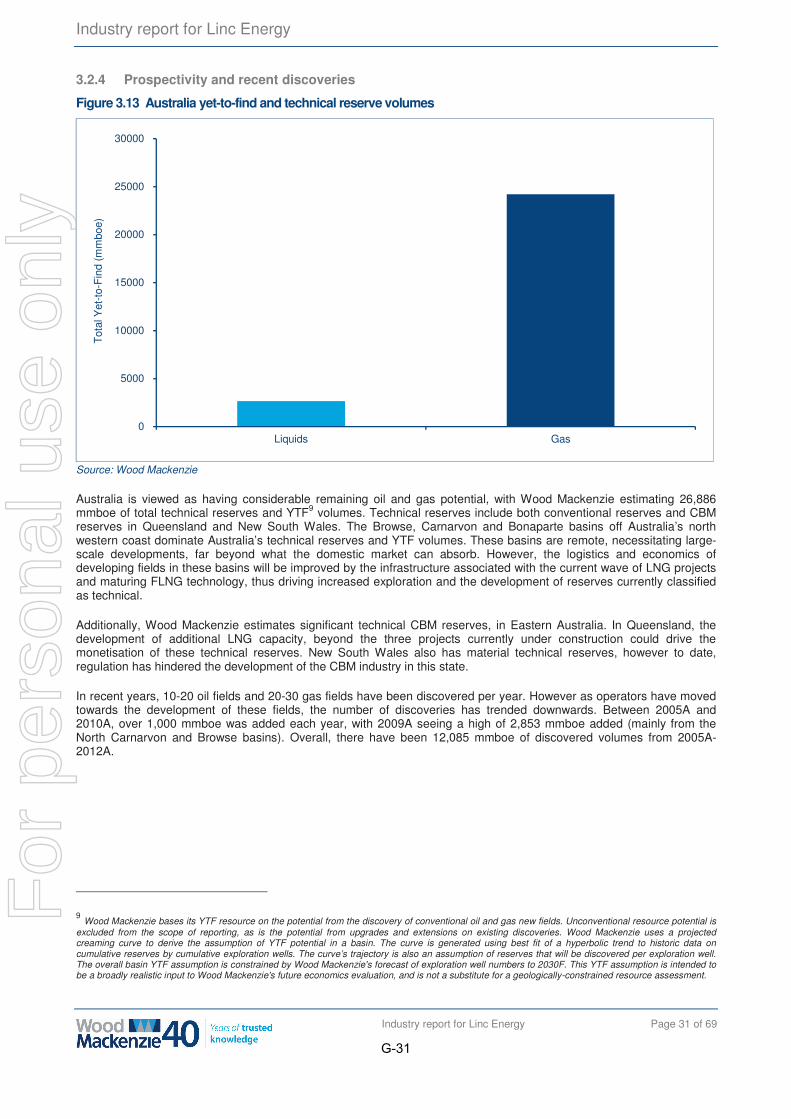
Industry report for Linc Energy
Industry report for Linc Energy Page 31 of 69
3.2.4 Prospectivity and recent discoveries
Figure 3.13 Australia yet-to-find and technical reserve volumes
Source: Wood Mackenzie
Australia is viewed as having considerable remaining oil and gas potential, with Wood Mackenzie estimating 26,886 mmboe of total technical reserves and YTF9 volumes. Technical reserves include both conventional reserves and CBM reserves in Queensland and New South Wales. The Browse, Carnarvon and Bonaparte basins off Australia’s north western coast dominate Australia’s technical reserves and YTF volumes. These basins are remote, necessitating large-scale developments, far beyond what the domestic market can absorb. However, the logistics and economics of developing fields in these basins will be improved by the infrastructure associated with the current wave of LNG projects and maturing FLNG technology, thus driving increased exploration and the development of reserves currently classified as technical.
Additionally, Wood Mackenzie estimates significant technical CBM reserves, in Eastern Australia. In Queensland, the development of additional LNG capacity, beyond the three projects currently under construction could drive the monetisation of these technical reserves. New South Wales also has material technical reserves, however to date, regulation has hindered the development of the CBM industry in this state.
In recent years, 10-20 oil fields and 20-30 gas fields have been discovered per year. However as operators have moved towards the development of these fields, the number of discoveries has trended downwards. Between 2005A and 2010A, over 1,000 mmboe was added each year, with 2009A seeing a high of 2,853 mmboe added (mainly from the North Carnarvon and Browse basins). Overall, there have been 12,085 mmboe of discovered volumes from 2005A-2012A.
9 Wood Mackenzie bases its YTF resource on the potential from the discovery of conventional oil and gas new fields. Unconventional resource potential is excluded from the scope of reporting, as is the potential from upgrades and extensions on existing discoveries. Wood Mackenzie uses a projected creaming curve to derive the assumption of YTF potential in a basin. The curve is generated using best fit of a hyperbolic trend to historic data on cumulative reserves by cumulative exploration wells. The curve’s trajectory is also an assumption of reserves that will be discovered per exploration well. The overall basin YTF assumption is constrained by Wood Mackenzie's forecast of exploration well numbers to 2030F. This YTF assumption is intended to be a broadly realistic input to Wood Mackenzie's future economics evaluation, and is not a substitute for a geologically-constrained resource assessment.
0
5000
10000
15000
20000
25000
30000
Liquids Gas
Tot
al Y
et-t
o-F
ind
(mm
boe)
G-31
For
per
sona
l use
onl
y
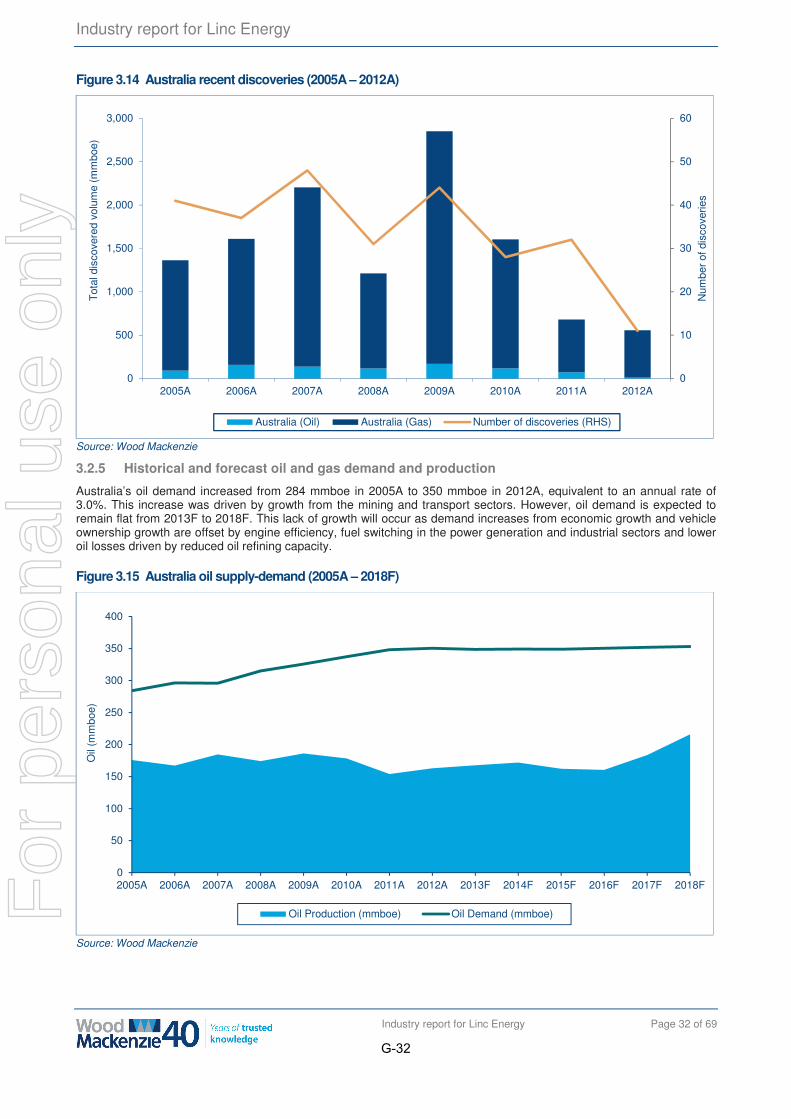
Industry report for Linc Energy
Industry report for Linc Energy Page 32 of 69
Figure 3.14 Australia recent discoveries (2005A – 2012A)
Source: Wood Mackenzie
3.2.5 Historical and forecast oil and gas demand and production
Australia’s oil demand increased from 284 mmboe in 2005A to 350 mmboe in 2012A, equivalent to an annual rate of 3.0%. This increase was driven by growth from the mining and transport sectors. However, oil demand is expected to remain flat from 2013F to 2018F. This lack of growth will occur as demand increases from economic growth and vehicle ownership growth are offset by engine efficiency, fuel switching in the power generation and industrial sectors and lower oil losses driven by reduced oil refining capacity.
Figure 3.15 Australia oil supply-demand (2005A – 2018F)
Source: Wood Mackenzie
0
10
20
30
40
50
60
0
500
1,000
1,500
2,000
2,500
3,000
2005A 2006A 2007A 2008A 2009A 2010A 2011A 2012A
Num
ber
of d
isco
verie
s
Tot
al d
isco
vere
d vo
lum
e (m
mbo
e)
Australia (Oil) Australia (Gas) Number of discoveries (RHS)
0
50
100
150
200
250
300
350
400
2005A 2006A 2007A 2008A 2009A 2010A 2011A 2012A 2013F 2014F 2015F 2016F 2017F 2018F
Oil
(mm
boe)
Oil Production (mmboe) Oil Demand (mmboe)
G-32
For
per
sona
l use
onl
y
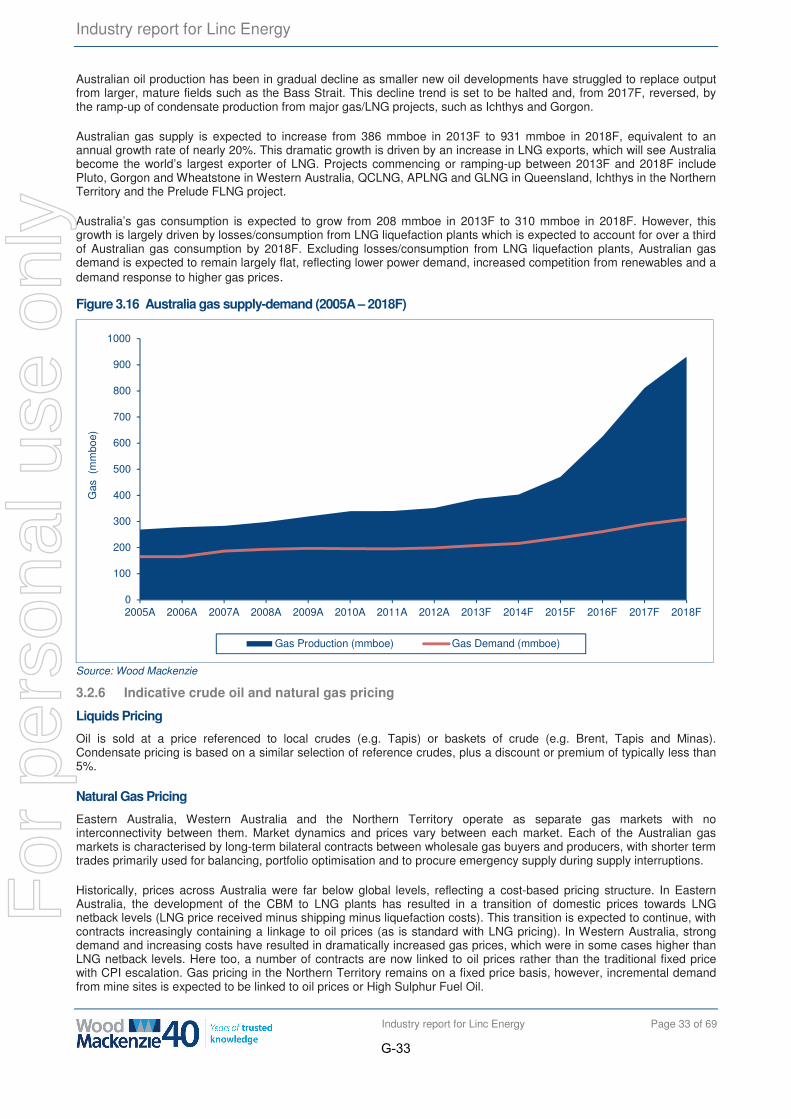
Industry report for Linc Energy
Industry report for Linc Energy Page 33 of 69
Australian oil production has been in gradual decline as smaller new oil developments have struggled to replace output from larger, mature fields such as the Bass Strait. This decline trend is set to be halted and, from 2017F, reversed, by the ramp-up of condensate production from major gas/LNG projects, such as Ichthys and Gorgon.
Australian gas supply is expected to increase from 386 mmboe in 2013F to 931 mmboe in 2018F, equivalent to an annual growth rate of nearly 20%. This dramatic growth is driven by an increase in LNG exports, which will see Australia become the world’s largest exporter of LNG. Projects commencing or ramping-up between 2013F and 2018F include Pluto, Gorgon and Wheatstone in Western Australia, QCLNG, APLNG and GLNG in Queensland, Ichthys in the Northern Territory and the Prelude FLNG project.
Australia’s gas consumption is expected to grow from 208 mmboe in 2013F to 310 mmboe in 2018F. However, this growth is largely driven by losses/consumption from LNG liquefaction plants which is expected to account for over a third of Australian gas consumption by 2018F. Excluding losses/consumption from LNG liquefaction plants, Australian gas demand is expected to remain largely flat, reflecting lower power demand, increased competition from renewables and a demand response to higher gas prices.
Figure 3.16 Australia gas supply-demand (2005A – 2018F)
Source: Wood Mackenzie
3.2.6 Indicative crude oil and natural gas pricing
Liquids Pricing
Oil is sold at a price referenced to local crudes (e.g. Tapis) or baskets of crude (e.g. Brent, Tapis and Minas). Condensate pricing is based on a similar selection of reference crudes, plus a discount or premium of typically less than 5%.
Natural Gas Pricing
Eastern Australia, Western Australia and the Northern Territory operate as separate gas markets with no interconnectivity between them. Market dynamics and prices vary between each market. Each of the Australian gas markets is characterised by long-term bilateral contracts between wholesale gas buyers and producers, with shorter term trades primarily used for balancing, portfolio optimisation and to procure emergency supply during supply interruptions.
Historically, prices across Australia were far below global levels, reflecting a cost-based pricing structure. In Eastern Australia, the development of the CBM to LNG plants has resulted in a transition of domestic prices towards LNG netback levels (LNG price received minus shipping minus liquefaction costs). This transition is expected to continue, with contracts increasingly containing a linkage to oil prices (as is standard with LNG pricing). In Western Australia, strong demand and increasing costs have resulted in dramatically increased gas prices, which were in some cases higher than LNG netback levels. Here too, a number of contracts are now linked to oil prices rather than the traditional fixed price with CPI escalation. Gas pricing in the Northern Territory remains on a fixed price basis, however, incremental demand from mine sites is expected to be linked to oil prices or High Sulphur Fuel Oil.
0
100
200
300
400
500
600
700
800
900
1000
2005A 2006A 2007A 2008A 2009A 2010A 2011A 2012A 2013F 2014F 2015F 2016F 2017F 2018F
Gas
(m
mbo
e)
Gas Production (mmboe) Gas Demand (mmboe)
G-33
For
per
sona
l use
onl
y
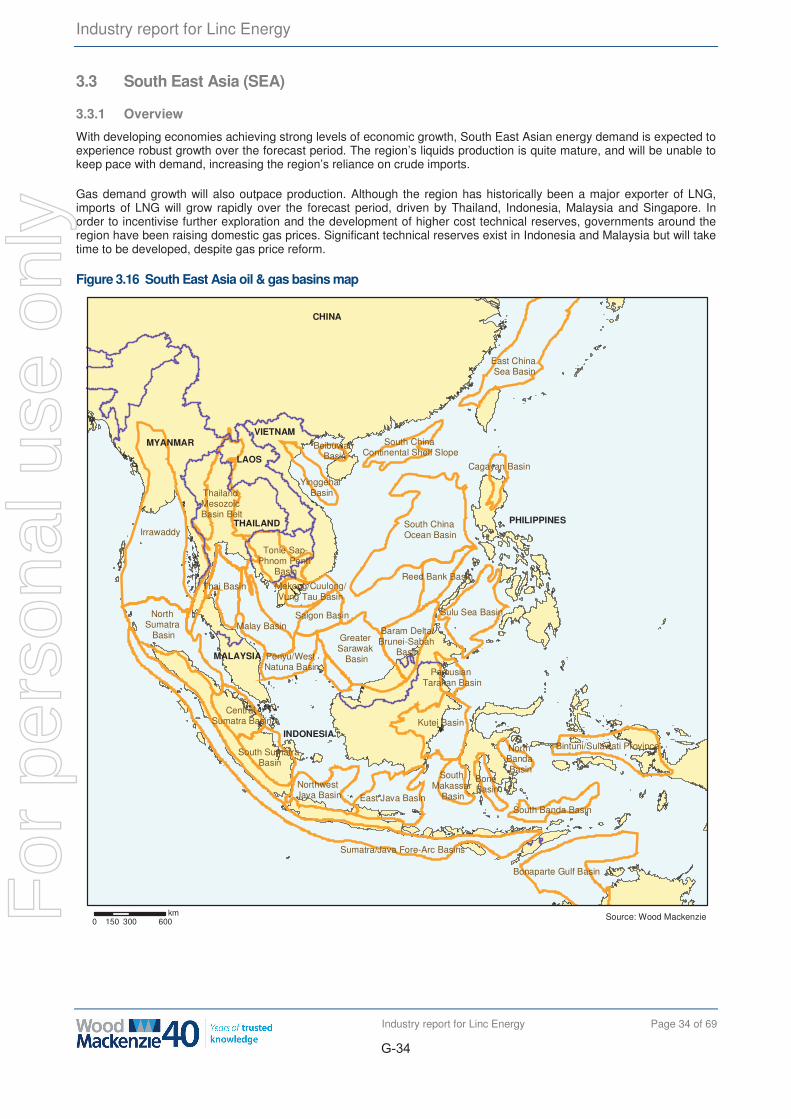
Industry report for Linc Energy
Industry report for Linc Energy Page 34 of 69
3.3 South East Asia (SEA)
3.3.1 Overview
With developing economies achieving strong levels of economic growth, South East Asian energy demand is expected to experience robust growth over the forecast period. The region’s liquids production is quite mature, and will be unable to keep pace with demand, increasing the region’s reliance on crude imports.
Gas demand growth will also outpace production. Although the region has historically been a major exporter of LNG, imports of LNG will grow rapidly over the forecast period, driven by Thailand, Indonesia, Malaysia and Singapore. In order to incentivise further exploration and the development of higher cost technical reserves, governments around the region have been raising domestic gas prices. Significant technical reserves exist in Indonesia and Malaysia but will take time to be developed, despite gas price reform.
Figure 3.16 South East Asia oil & gas basins map
MYANMAR
LAOS
CHINA
Irrawaddy
North Sumatra
Basin
South China Ocean Basin
South China Continental Shelf Slope
Greater Sarawak
Basin
East China Sea Basin
Bonaparte Gulf Basin
Sulu Sea Basin
Baram Delta/Brunei-Sabah
Basin
Yinggehai Basin
Beibuwan Basin
Tonle Sap-Phnom Penh
Basin
Thailand Mesozoic Basin Belt
Reed Bank Basin
Kutei Basin
Pamusian Tarakan Basin
East Java Basin
Northwest Java Basin
South Sumatra Basin
Central Sumatra Basin
Sumatra/Java Fore-Arc Basins
Bintuni/Sulawati Province
South Banda Basin
Penyu/West Natuna Basin
Malay BasinSaigon Basin
Mekong/Cuulong/Vung Tau Basin
Cagayan Basin
Thai Basin
South Makassar
Basin
North Banda Basin
Bone Basin
INDONESIA
PHILIPPINESTHAILAND
VIETNAM
MALAYSIA
0 300 600150km Source: Wood Mackenzie
G-34
For
per
sona
l use
onl
y
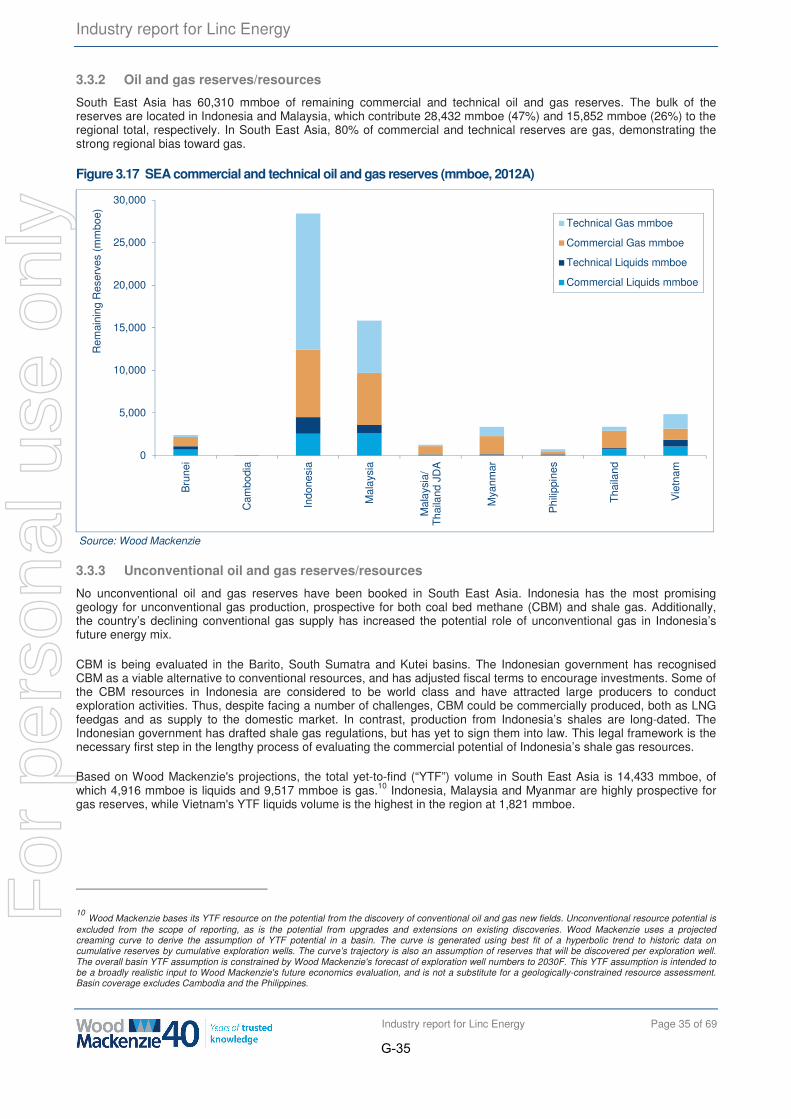
Industry report for Linc Energy
Industry report for Linc Energy Page 35 of 69
3.3.2 Oil and gas reserves/resources
South East Asia has 60,310 mmboe of remaining commercial and technical oil and gas reserves. The bulk of the reserves are located in Indonesia and Malaysia, which contribute 28,432 mmboe (47%) and 15,852 mmboe (26%) to the regional total, respectively. In South East Asia, 80% of commercial and technical reserves are gas, demonstrating the strong regional bias toward gas.
Figure 3.17 SEA commercial and technical oil and gas reserves (mmboe, 2012A)
Source: Wood Mackenzie
3.3.3 Unconventional oil and gas reserves/resources
No unconventional oil and gas reserves have been booked in South East Asia. Indonesia has the most promising geology for unconventional gas production, prospective for both coal bed methane (CBM) and shale gas. Additionally, the country’s declining conventional gas supply has increased the potential role of unconventional gas in Indonesia’s future energy mix.
CBM is being evaluated in the Barito, South Sumatra and Kutei basins. The Indonesian government has recognised CBM as a viable alternative to conventional resources, and has adjusted fiscal terms to encourage investments. Some of the CBM resources in Indonesia are considered to be world class and have attracted large producers to conduct exploration activities. Thus, despite facing a number of challenges, CBM could be commercially produced, both as LNG feedgas and as supply to the domestic market. In contrast, production from Indonesia’s shales are long-dated. The Indonesian government has drafted shale gas regulations, but has yet to sign them into law. This legal framework is the necessary first step in the lengthy process of evaluating the commercial potential of Indonesia’s shale gas resources.
Based on Wood Mackenzie's projections, the total yet-to-find (“YTF”) volume in South East Asia is 14,433 mmboe, of which 4,916 mmboe is liquids and 9,517 mmboe is gas.10 Indonesia, Malaysia and Myanmar are highly prospective for gas reserves, while Vietnam's YTF liquids volume is the highest in the region at 1,821 mmboe.
10 Wood Mackenzie bases its YTF resource on the potential from the discovery of conventional oil and gas new fields. Unconventional resource potential is excluded from the scope of reporting, as is the potential from upgrades and extensions on existing discoveries. Wood Mackenzie uses a projected creaming curve to derive the assumption of YTF potential in a basin. The curve is generated using best fit of a hyperbolic trend to historic data on cumulative reserves by cumulative exploration wells. The curve’s trajectory is also an assumption of reserves that will be discovered per exploration well. The overall basin YTF assumption is constrained by Wood Mackenzie's forecast of exploration well numbers to 2030F. This YTF assumption is intended to be a broadly realistic input to Wood Mackenzie's future economics evaluation, and is not a substitute for a geologically-constrained resource assessment. Basin coverage excludes Cambodia and the Philippines.
0
5,000
10,000
15,000
20,000
25,000
30,000
Bru
nei
Cam
bodi
a
Indo
nesi
a
Mal
aysi
a
Mal
aysi
a/T
haila
nd J
DA
Mya
nmar
Phi
lippi
nes
Tha
iland
Vie
tnam
Rem
aini
ng R
eser
ves
(mm
boe)
Technical Gas mmboe
Commercial Gas mmboe
Technical Liquids mmboe
Commercial Liquids mmboe
G-35
For
per
sona
l use
onl
y
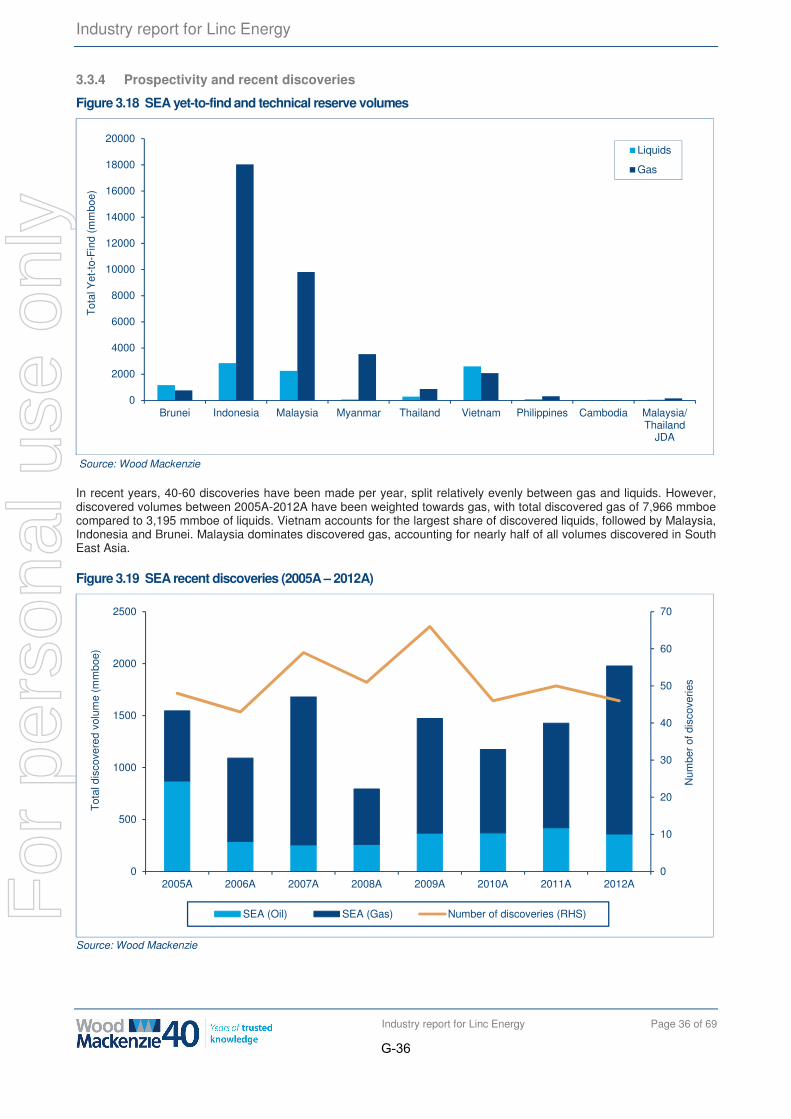
Industry report for Linc Energy
Industry report for Linc Energy Page 36 of 69
3.3.4 Prospectivity and recent discoveries
Figure 3.18 SEA yet-to-find and technical reserve volumes
Source: Wood Mackenzie
In recent years, 40-60 discoveries have been made per year, split relatively evenly between gas and liquids. However, discovered volumes between 2005A-2012A have been weighted towards gas, with total discovered gas of 7,966 mmboe compared to 3,195 mmboe of liquids. Vietnam accounts for the largest share of discovered liquids, followed by Malaysia, Indonesia and Brunei. Malaysia dominates discovered gas, accounting for nearly half of all volumes discovered in South East Asia.
Figure 3.19 SEA recent discoveries (2005A – 2012A)
Source: Wood Mackenzie
0
2000
4000
6000
8000
10000
12000
14000
16000
18000
20000
Brunei Indonesia Malaysia Myanmar Thailand Vietnam Philippines Cambodia Malaysia/Thailand
JDA
Tot
al Y
et-t
o-F
ind
(mm
boe)
Liquids
Gas
0
10
20
30
40
50
60
70
0
500
1000
1500
2000
2500
2005A 2006A 2007A 2008A 2009A 2010A 2011A 2012A
Num
ber
of d
isco
verie
s
Tot
al d
isco
vere
d vo
lum
e (m
mbo
e)
SEA (Oil) SEA (Gas) Number of discoveries (RHS)
G-36
For
per
sona
l use
onl
y
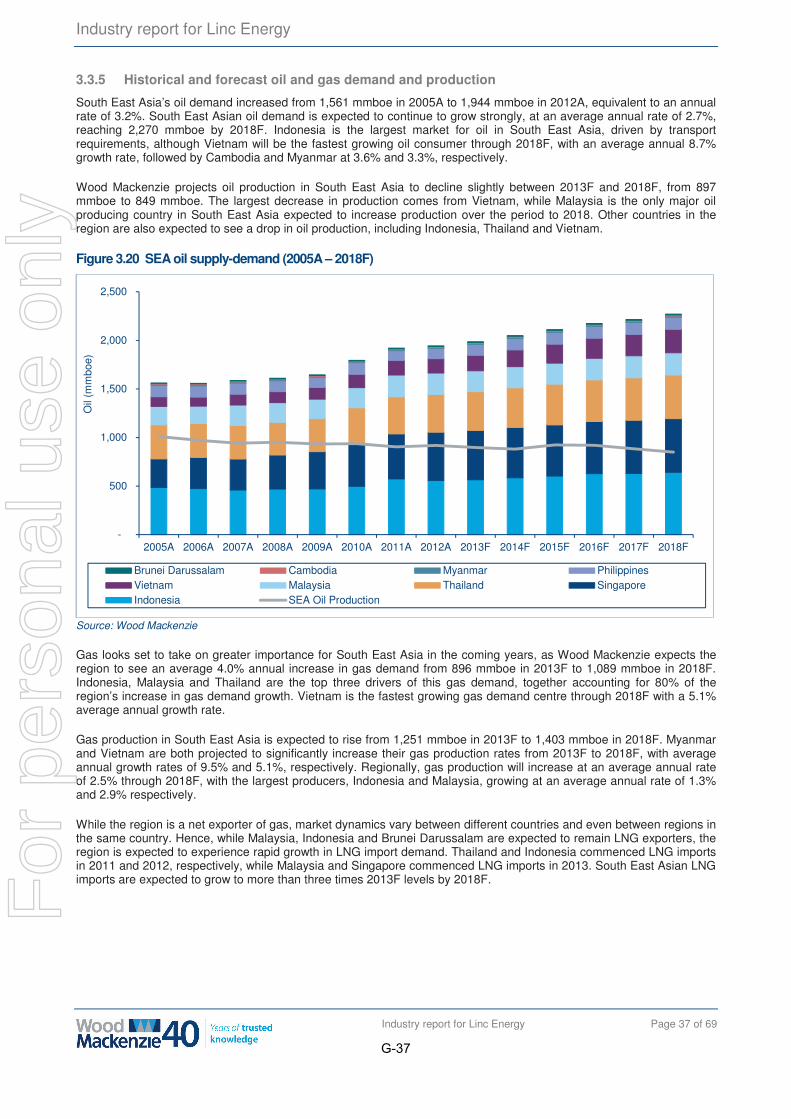
Industry report for Linc Energy
Industry report for Linc Energy Page 37 of 69
3.3.5 Historical and forecast oil and gas demand and production
South East Asia’s oil demand increased from 1,561 mmboe in 2005A to 1,944 mmboe in 2012A, equivalent to an annual rate of 3.2%. South East Asian oil demand is expected to continue to grow strongly, at an average annual rate of 2.7%, reaching 2,270 mmboe by 2018F. Indonesia is the largest market for oil in South East Asia, driven by transport requirements, although Vietnam will be the fastest growing oil consumer through 2018F, with an average annual 8.7% growth rate, followed by Cambodia and Myanmar at 3.6% and 3.3%, respectively.
Wood Mackenzie projects oil production in South East Asia to decline slightly between 2013F and 2018F, from 897 mmboe to 849 mmboe. The largest decrease in production comes from Vietnam, while Malaysia is the only major oil producing country in South East Asia expected to increase production over the period to 2018. Other countries in the region are also expected to see a drop in oil production, including Indonesia, Thailand and Vietnam.
Figure 3.20 SEA oil supply-demand (2005A – 2018F)
Source: Wood Mackenzie
Gas looks set to take on greater importance for South East Asia in the coming years, as Wood Mackenzie expects the region to see an average 4.0% annual increase in gas demand from 896 mmboe in 2013F to 1,089 mmboe in 2018F. Indonesia, Malaysia and Thailand are the top three drivers of this gas demand, together accounting for 80% of the region’s increase in gas demand growth. Vietnam is the fastest growing gas demand centre through 2018F with a 5.1% average annual growth rate.
Gas production in South East Asia is expected to rise from 1,251 mmboe in 2013F to 1,403 mmboe in 2018F. Myanmar and Vietnam are both projected to significantly increase their gas production rates from 2013F to 2018F, with average annual growth rates of 9.5% and 5.1%, respectively. Regionally, gas production will increase at an average annual rate of 2.5% through 2018F, with the largest producers, Indonesia and Malaysia, growing at an average annual rate of 1.3% and 2.9% respectively.
While the region is a net exporter of gas, market dynamics vary between different countries and even between regions in the same country. Hence, while Malaysia, Indonesia and Brunei Darussalam are expected to remain LNG exporters, the region is expected to experience rapid growth in LNG import demand. Thailand and Indonesia commenced LNG imports in 2011 and 2012, respectively, while Malaysia and Singapore commenced LNG imports in 2013. South East Asian LNG imports are expected to grow to more than three times 2013F levels by 2018F.
-
500
1,000
1,500
2,000
2,500
2005A 2006A 2007A 2008A 2009A 2010A 2011A 2012A 2013F 2014F 2015F 2016F 2017F 2018F
Oil
(mm
boe)
Brunei Darussalam Cambodia Myanmar PhilippinesVietnam Malaysia Thailand SingaporeIndonesia SEA Oil Production
G-37
For
per
sona
l use
onl
y
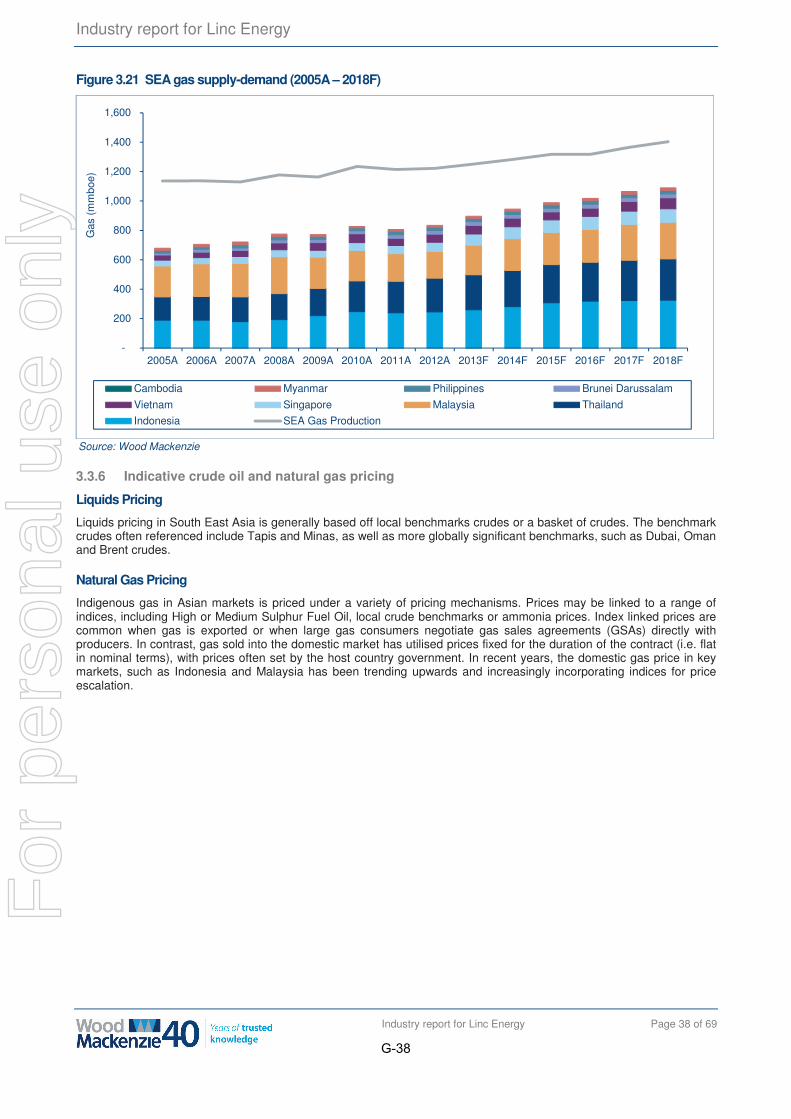
Industry report for Linc Energy
Industry report for Linc Energy Page 38 of 69
Figure 3.21 SEA gas supply-demand (2005A – 2018F)
Source: Wood Mackenzie
3.3.6 Indicative crude oil and natural gas pricing
Liquids Pricing
Liquids pricing in South East Asia is generally based off local benchmarks crudes or a basket of crudes. The benchmark crudes often referenced include Tapis and Minas, as well as more globally significant benchmarks, such as Dubai, Oman and Brent crudes.
Natural Gas Pricing
Indigenous gas in Asian markets is priced under a variety of pricing mechanisms. Prices may be linked to a range of indices, including High or Medium Sulphur Fuel Oil, local crude benchmarks or ammonia prices. Index linked prices are common when gas is exported or when large gas consumers negotiate gas sales agreements (GSAs) directly with producers. In contrast, gas sold into the domestic market has utilised prices fixed for the duration of the contract (i.e. flat in nominal terms), with prices often set by the host country government. In recent years, the domestic gas price in key markets, such as Indonesia and Malaysia has been trending upwards and increasingly incorporating indices for price escalation.
-
200
400
600
800
1,000
1,200
1,400
1,600
2005A 2006A 2007A 2008A 2009A 2010A 2011A 2012A 2013F 2014F 2015F 2016F 2017F 2018F
Gas
(m
mbo
e)
Cambodia Myanmar Philippines Brunei Darussalam
Vietnam Singapore Malaysia Thailand
Indonesia SEA Gas Production
G-38
For
per
sona
l use
onl
y

Industry report for Linc Energy
Industry report for Linc Energy Page 39 of 69
3.4 China
3.4.1 Overview
China’s oil and gas production is unable to keep pace with demand growth, resulting in an increasing reliance on imports. China’s oil sector is relatively mature, with production expected to peak in 2013F. In the short-term, the performance of secondary and tertiary oil recovery projects at major mature fields will determine the level of Chinese liquids production. However, in the longer term, the level of production will depend upon the success of exploration efforts in the frontier basins, located in the northwest of the country and in the deep waters of the South China Sea.
In contrast, the gas sector is relatively immature and is expected to experience rapid growth. This growth is expected to come primarily from onshore conventional production over the forecast period (i.e. before 2018), with material shale gas production unlikely during this period.
Despite this rapid growth in production, China will become increasingly reliant on energy imports. China is expected to overtake the U.S. as the world’s largest importer of crude by around 2017 and will also become increasingly reliant on gas imports, consisting of piped gas from Central Asia and LNG.
Figure 3.22 Chinese oil & gas basins map
G-39
For
per
sona
l use
onl
y
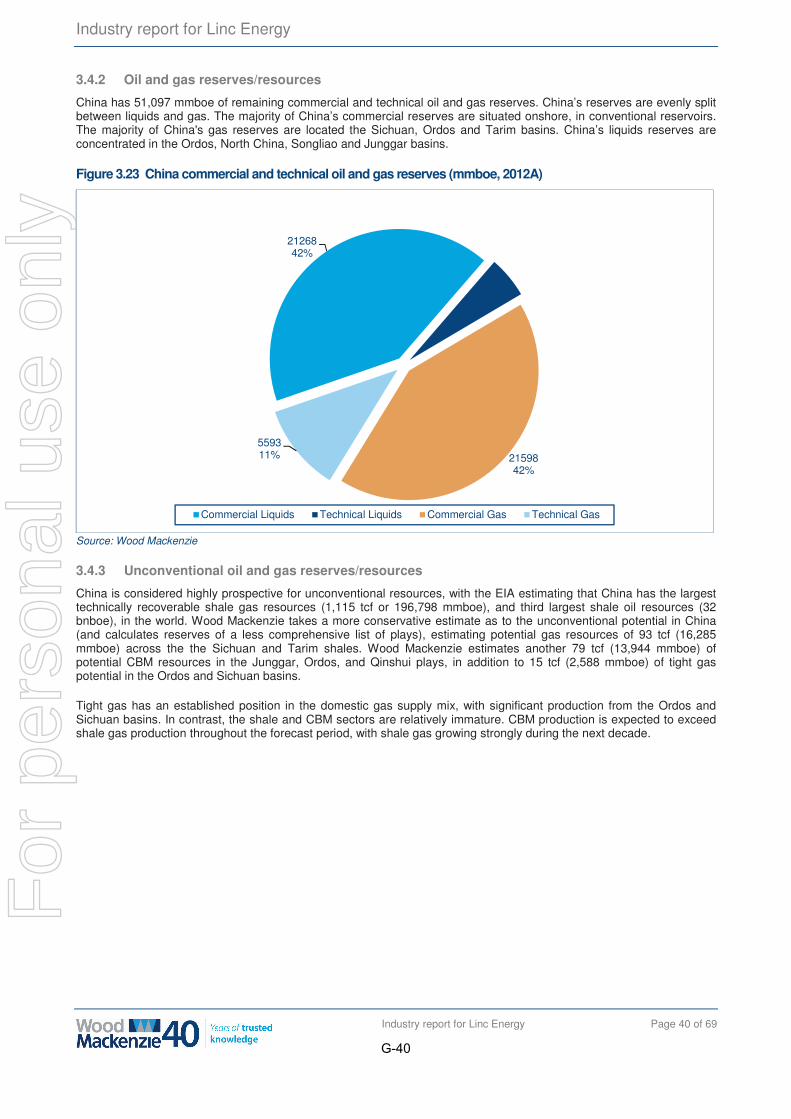
Industry report for Linc Energy
Industry report for Linc Energy Page 40 of 69
3.4.2 Oil and gas reserves/resources
China has 51,097 mmboe of remaining commercial and technical oil and gas reserves. China’s reserves are evenly split between liquids and gas. The majority of China’s commercial reserves are situated onshore, in conventional reservoirs. The majority of China's gas reserves are located the Sichuan, Ordos and Tarim basins. China’s liquids reserves are concentrated in the Ordos, North China, Songliao and Junggar basins.
Figure 3.23 China commercial and technical oil and gas reserves (mmboe, 2012A)
Source: Wood Mackenzie
3.4.3 Unconventional oil and gas reserves/resources
China is considered highly prospective for unconventional resources, with the EIA estimating that China has the largest technically recoverable shale gas resources (1,115 tcf or 196,798 mmboe), and third largest shale oil resources (32 bnboe), in the world. Wood Mackenzie takes a more conservative estimate as to the unconventional potential in China (and calculates reserves of a less comprehensive list of plays), estimating potential gas resources of 93 tcf (16,285 mmboe) across the the Sichuan and Tarim shales. Wood Mackenzie estimates another 79 tcf (13,944 mmboe) of potential CBM resources in the Junggar, Ordos, and Qinshui plays, in addition to 15 tcf (2,588 mmboe) of tight gas potential in the Ordos and Sichuan basins.
Tight gas has an established position in the domestic gas supply mix, with significant production from the Ordos and Sichuan basins. In contrast, the shale and CBM sectors are relatively immature. CBM production is expected to exceed shale gas production throughout the forecast period, with shale gas growing strongly during the next decade.
2126842%
26385%
2159842%
559311%
Commercial Liquids Technical Liquids Commercial Gas Technical Gas
G-40
For
per
sona
l use
onl
y
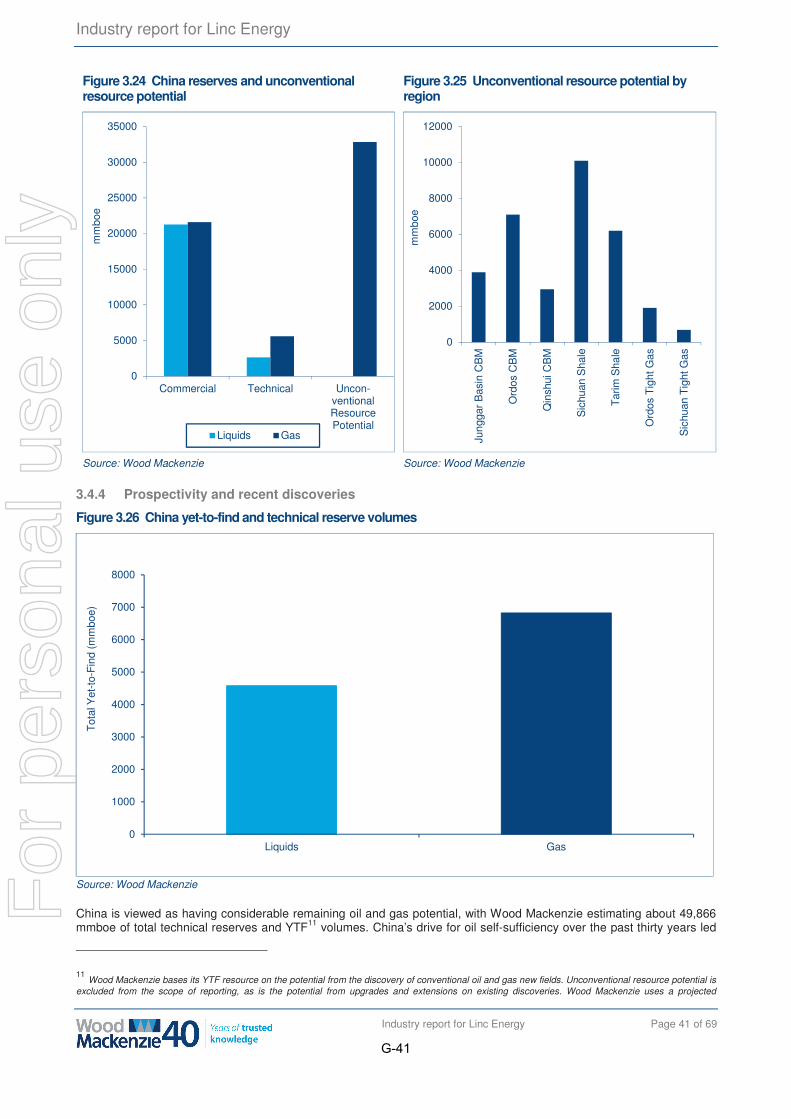
Industry report for Linc Energy
Industry report for Linc Energy Page 41 of 69
Figure 3.24 China reserves and unconventional resource potential
Source: Wood Mackenzie
Figure 3.25 Unconventional resource potential by region .
Source: Wood Mackenzie
3.4.4 Prospectivity and recent discoveries
Figure 3.26 China yet-to-find and technical reserve volumes
Source: Wood Mackenzie
China is viewed as having considerable remaining oil and gas potential, with Wood Mackenzie estimating about 49,866 mmboe of total technical reserves and YTF11 volumes. China’s drive for oil self-sufficiency over the past thirty years led
11 Wood Mackenzie bases its YTF resource on the potential from the discovery of conventional oil and gas new fields. Unconventional resource potential is excluded from the scope of reporting, as is the potential from upgrades and extensions on existing discoveries. Wood Mackenzie uses a projected
0
5000
10000
15000
20000
25000
30000
35000
Commercial Technical Uncon-ventionalResourcePotential
mm
boe
Liquids Gas
0
2000
4000
6000
8000
10000
12000
Jung
gar
Bas
in C
BM
Ord
os C
BM
Qin
shui
CB
M
Sic
huan
Sha
le
Tar
im S
hale
Ord
os T
ight
Gas
Sic
huan
Tig
ht G
as
mm
boe
0
1000
2000
3000
4000
5000
6000
7000
8000
Liquids Gas
Tot
al Y
et-t
o-F
ind
(mm
boe)
G-41
For
per
sona
l use
onl
y
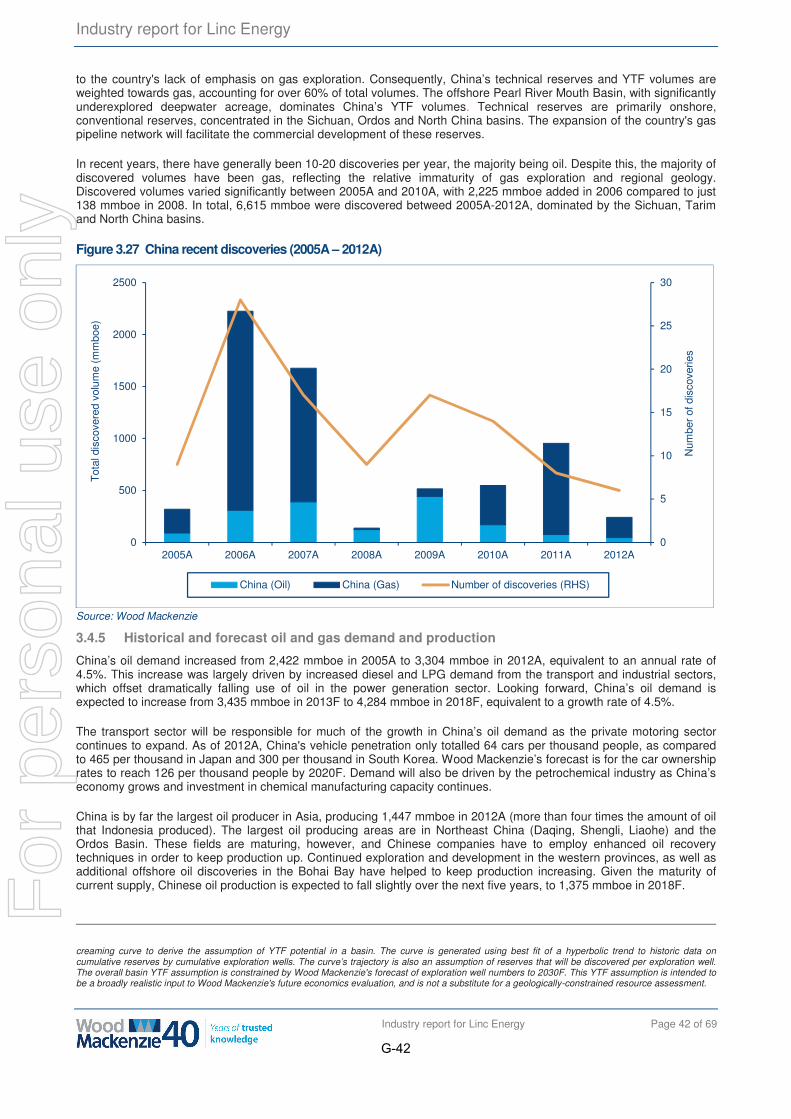
Industry report for Linc Energy
Industry report for Linc Energy Page 42 of 69
to the country's lack of emphasis on gas exploration. Consequently, China’s technical reserves and YTF volumes are weighted towards gas, accounting for over 60% of total volumes. The offshore Pearl River Mouth Basin, with significantly underexplored deepwater acreage, dominates China’s YTF volumes. Technical reserves are primarily onshore, conventional reserves, concentrated in the Sichuan, Ordos and North China basins. The expansion of the country's gas pipeline network will facilitate the commercial development of these reserves.
In recent years, there have generally been 10-20 discoveries per year, the majority being oil. Despite this, the majority of discovered volumes have been gas, reflecting the relative immaturity of gas exploration and regional geology. Discovered volumes varied significantly between 2005A and 2010A, with 2,225 mmboe added in 2006 compared to just 138 mmboe in 2008. In total, 6,615 mmboe were discovered betweed 2005A-2012A, dominated by the Sichuan, Tarim and North China basins.
Figure 3.27 China recent discoveries (2005A – 2012A)
Source: Wood Mackenzie
3.4.5 Historical and forecast oil and gas demand and production
China’s oil demand increased from 2,422 mmboe in 2005A to 3,304 mmboe in 2012A, equivalent to an annual rate of 4.5%. This increase was largely driven by increased diesel and LPG demand from the transport and industrial sectors, which offset dramatically falling use of oil in the power generation sector. Looking forward, China’s oil demand is expected to increase from 3,435 mmboe in 2013F to 4,284 mmboe in 2018F, equivalent to a growth rate of 4.5%.
The transport sector will be responsible for much of the growth in China’s oil demand as the private motoring sector continues to expand. As of 2012A, China's vehicle penetration only totalled 64 cars per thousand people, as compared to 465 per thousand in Japan and 300 per thousand in South Korea. Wood Mackenzie’s forecast is for the car ownership rates to reach 126 per thousand people by 2020F. Demand will also be driven by the petrochemical industry as China’s economy grows and investment in chemical manufacturing capacity continues.
China is by far the largest oil producer in Asia, producing 1,447 mmboe in 2012A (more than four times the amount of oil that Indonesia produced). The largest oil producing areas are in Northeast China (Daqing, Shengli, Liaohe) and the Ordos Basin. These fields are maturing, however, and Chinese companies have to employ enhanced oil recovery techniques in order to keep production up. Continued exploration and development in the western provinces, as well as additional offshore oil discoveries in the Bohai Bay have helped to keep production increasing. Given the maturity of current supply, Chinese oil production is expected to fall slightly over the next five years, to 1,375 mmboe in 2018F.
creaming curve to derive the assumption of YTF potential in a basin. The curve is generated using best fit of a hyperbolic trend to historic data on cumulative reserves by cumulative exploration wells. The curve’s trajectory is also an assumption of reserves that will be discovered per exploration well. The overall basin YTF assumption is constrained by Wood Mackenzie's forecast of exploration well numbers to 2030F. This YTF assumption is intended to be a broadly realistic input to Wood Mackenzie's future economics evaluation, and is not a substitute for a geologically-constrained resource assessment.
0
5
10
15
20
25
30
0
500
1000
1500
2000
2500
2005A 2006A 2007A 2008A 2009A 2010A 2011A 2012A
Num
ber
of d
isco
verie
s
Tot
al d
isco
vere
d vo
lum
e (m
mbo
e)
China (Oil) China (Gas) Number of discoveries (RHS)
G-42
For
per
sona
l use
onl
y
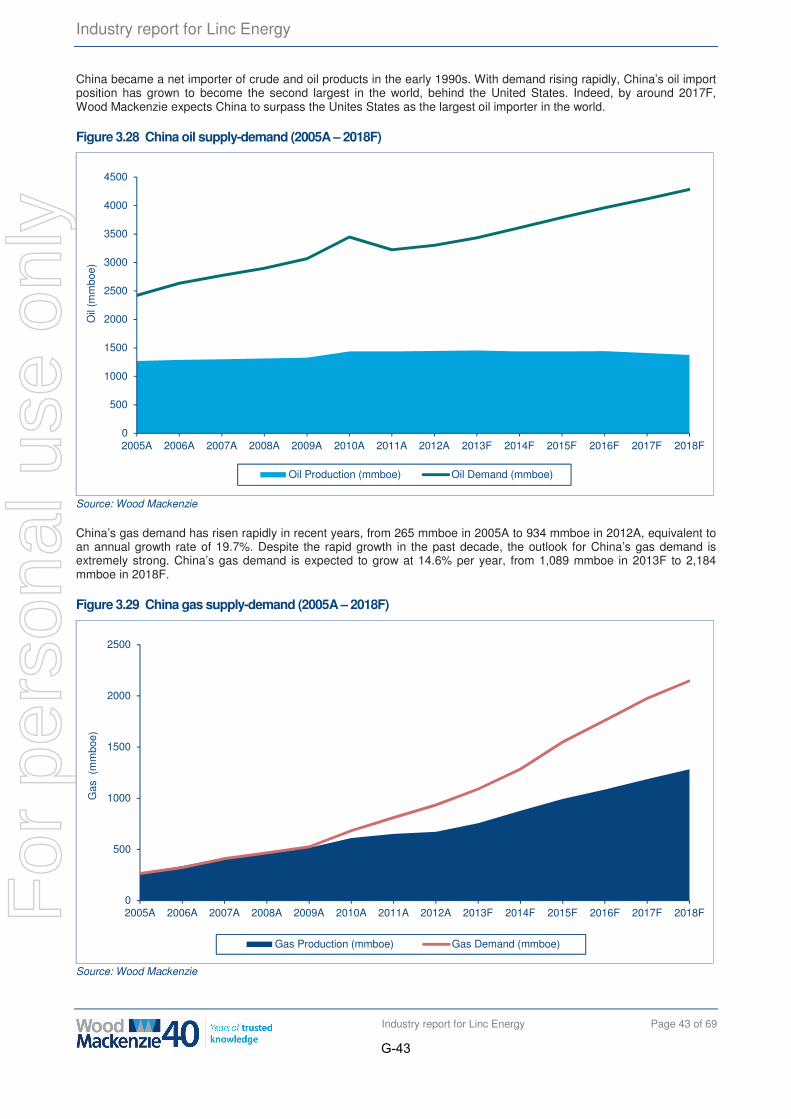
Industry report for Linc Energy
Industry report for Linc Energy Page 43 of 69
China became a net importer of crude and oil products in the early 1990s. With demand rising rapidly, China’s oil import position has grown to become the second largest in the world, behind the United States. Indeed, by around 2017F, Wood Mackenzie expects China to surpass the Unites States as the largest oil importer in the world.
Figure 3.28 China oil supply-demand (2005A – 2018F)
Source: Wood Mackenzie
China’s gas demand has risen rapidly in recent years, from 265 mmboe in 2005A to 934 mmboe in 2012A, equivalent to an annual growth rate of 19.7%. Despite the rapid growth in the past decade, the outlook for China’s gas demand is extremely strong. China’s gas demand is expected to grow at 14.6% per year, from 1,089 mmboe in 2013F to 2,184 mmboe in 2018F.
Figure 3.29 China gas supply-demand (2005A – 2018F)
Source: Wood Mackenzie
0
500
1000
1500
2000
2500
3000
3500
4000
4500
2005A 2006A 2007A 2008A 2009A 2010A 2011A 2012A 2013F 2014F 2015F 2016F 2017F 2018F
Oil
(mm
boe)
Oil Production (mmboe) Oil Demand (mmboe)
0
500
1000
1500
2000
2500
2005A 2006A 2007A 2008A 2009A 2010A 2011A 2012A 2013F 2014F 2015F 2016F 2017F 2018F
Gas
(m
mbo
e)
Gas Production (mmboe) Gas Demand (mmboe)
G-43
For
per
sona
l use
onl
y

Industry report for Linc Energy
Industry report for Linc Energy Page 44 of 69
While industrial demand has traditionally been the dominant gas-consuming sector, Wood Mackenzie’s demand growth forecast is not solely dependent the strength of the Chinese economy. With only 14% of China’s 1.35 billion population having access to piped gas, significant latent demand exists. As gas infrastructure is developed, access to gas, and therefore gas demand, will increase, displacing oil products.
China’s gas output is also increasing rapidly. Production is forecast to increase from 756 mmboe in 2013F to 1,283 mmboe in 2018F, an average increase of 14.1% per year. The majority of China's gas production comes from the Sichuan, Ordos and Tarim basins, with the gas routed via long-distance cross-country pipelines to the main economic centres along the eastern coast. Conventional production is expected to continue to dominate production over the forecast period.
China became a gas importer in 2006, with its first LNG regasification terminal constructed to help meet demand in South China and Hong Kong. China also imports piped gas from Central Asia through the Trans-Asia pipeline, commissioned in late 2009. China’s reliance on gas imports is expected to increase over the forecast period, and will import over one-third of its gas requirements by 2018F.
3.4.6 Indicative crude oil and natural gas pricing
Liquids Pricing
Oil produced in China is typically sold at prices linked to Dubai or Duri benchmark prices.
Natural Gas Pricing
From 10 July, 2013, a new gas pricing structure became effective in China. Reflecting cost of supply increases and the growing volumes of oil-linked imports, the reforms will raise gas prices for all sectors excluding residential and will create a two-tier pricing structure across China.
The National Development and Reform Commission (NDRC), the country's macroeconomic management agency, will set city gate prices based on the oil-indexed formula but will retain the authority to adapt the pricing index and to assess the timing and scale of the rollout of incremental pricing across the country. Under the new pricing structure, the NDRC will set gas prices nationwide at the city gate instead of at the wellhead, which will shift China away from the historical cost-plus system for onshore gas prices to a net-back mechanism. Two city-gate prices will be set; one for existing supply and one for incremental supply. Existing supply, defined as China’s 2012 onshore and piped import gas consumption of 112 bcm, will receive the lower of the published prices. Incremental supply above 2012 contracted volumes will link to imported LPG/HSFO prices. The government aims to unify city gate prices for existing and incremental supply by the end of 2015.
G-44
For
per
sona
l use
onl
y
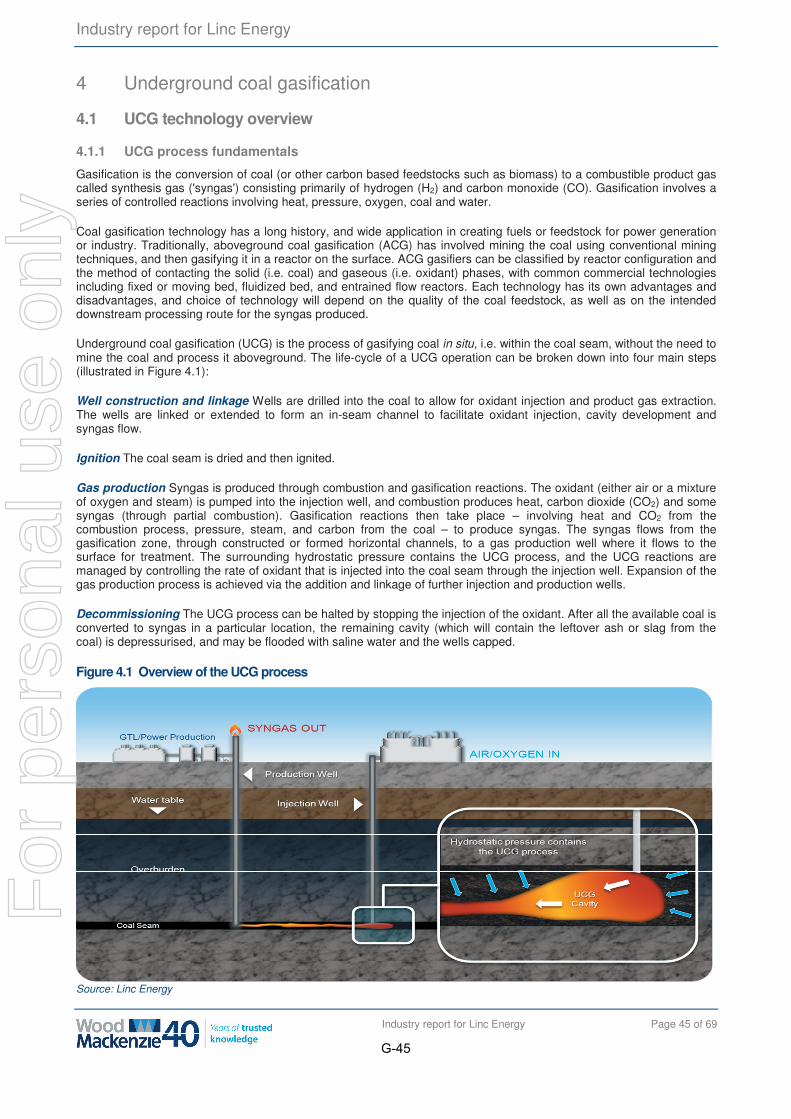
Industry report for Linc Energy
Industry report for Linc Energy Page 45 of 69
4 Underground coal gasification
4.1 UCG technology overview
4.1.1 UCG process fundamentals
Gasification is the conversion of coal (or other carbon based feedstocks such as biomass) to a combustible product gas called synthesis gas ('syngas') consisting primarily of hydrogen (H2) and carbon monoxide (CO). Gasification involves a series of controlled reactions involving heat, pressure, oxygen, coal and water.
Coal gasification technology has a long history, and wide application in creating fuels or feedstock for power generation or industry. Traditionally, aboveground coal gasification (ACG) has involved mining the coal using conventional mining techniques, and then gasifying it in a reactor on the surface. ACG gasifiers can be classified by reactor configuration and the method of contacting the solid (i.e. coal) and gaseous (i.e. oxidant) phases, with common commercial technologies including fixed or moving bed, fluidized bed, and entrained flow reactors. Each technology has its own advantages and disadvantages, and choice of technology will depend on the quality of the coal feedstock, as well as on the intended downstream processing route for the syngas produced.
Underground coal gasification (UCG) is the process of gasifying coal in situ, i.e. within the coal seam, without the need to mine the coal and process it aboveground. The life-cycle of a UCG operation can be broken down into four main steps (illustrated in Figure 4.1):
Well construction and linkage Wells are drilled into the coal to allow for oxidant injection and product gas extraction. The wells are linked or extended to form an in-seam channel to facilitate oxidant injection, cavity development and syngas flow.
Ignition The coal seam is dried and then ignited.
Gas production Syngas is produced through combustion and gasification reactions. The oxidant (either air or a mixture of oxygen and steam) is pumped into the injection well, and combustion produces heat, carbon dioxide (CO2) and some syngas (through partial combustion). Gasification reactions then take place – involving heat and CO2 from the combustion process, pressure, steam, and carbon from the coal – to produce syngas. The syngas flows from the gasification zone, through constructed or formed horizontal channels, to a gas production well where it flows to the surface for treatment. The surrounding hydrostatic pressure contains the UCG process, and the UCG reactions are managed by controlling the rate of oxidant that is injected into the coal seam through the injection well. Expansion of the gas production process is achieved via the addition and linkage of further injection and production wells.
Decommissioning The UCG process can be halted by stopping the injection of the oxidant. After all the available coal is converted to syngas in a particular location, the remaining cavity (which will contain the leftover ash or slag from the coal) is depressurised, and may be flooded with saline water and the wells capped.
Figure 4.1 Overview of the UCG process
Source: Linc Energy
G-45
For
per
sona
l use
onl
y
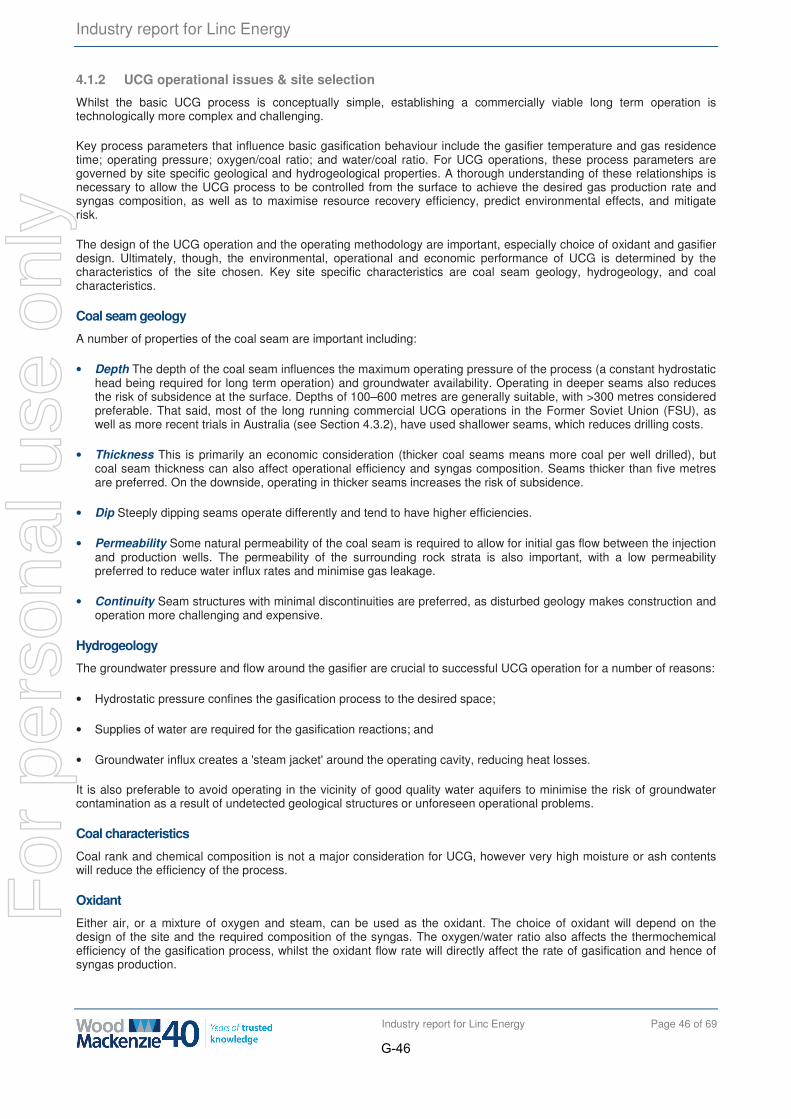
Industry report for Linc Energy
Industry report for Linc Energy Page 46 of 69
4.1.2 UCG operational issues & site selection
Whilst the basic UCG process is conceptually simple, establishing a commercially viable long term operation is technologically more complex and challenging.
Key process parameters that influence basic gasification behaviour include the gasifier temperature and gas residence time; operating pressure; oxygen/coal ratio; and water/coal ratio. For UCG operations, these process parameters are governed by site specific geological and hydrogeological properties. A thorough understanding of these relationships is necessary to allow the UCG process to be controlled from the surface to achieve the desired gas production rate and syngas composition, as well as to maximise resource recovery efficiency, predict environmental effects, and mitigate risk.
The design of the UCG operation and the operating methodology are important, especially choice of oxidant and gasifier design. Ultimately, though, the environmental, operational and economic performance of UCG is determined by the characteristics of the site chosen. Key site specific characteristics are coal seam geology, hydrogeology, and coal characteristics.
Coal seam geology
A number of properties of the coal seam are important including:
• Depth The depth of the coal seam influences the maximum operating pressure of the process (a constant hydrostatic head being required for long term operation) and groundwater availability. Operating in deeper seams also reduces the risk of subsidence at the surface. Depths of 100–600 metres are generally suitable, with >300 metres considered preferable. That said, most of the long running commercial UCG operations in the Former Soviet Union (FSU), as well as more recent trials in Australia (see Section 4.3.2), have used shallower seams, which reduces drilling costs.
• Thickness This is primarily an economic consideration (thicker coal seams means more coal per well drilled), but coal seam thickness can also affect operational efficiency and syngas composition. Seams thicker than five metres are preferred. On the downside, operating in thicker seams increases the risk of subsidence.
• Dip Steeply dipping seams operate differently and tend to have higher efficiencies.
• Permeability Some natural permeability of the coal seam is required to allow for initial gas flow between the injection and production wells. The permeability of the surrounding rock strata is also important, with a low permeability preferred to reduce water influx rates and minimise gas leakage.
• Continuity Seam structures with minimal discontinuities are preferred, as disturbed geology makes construction and operation more challenging and expensive.
Hydrogeology
The groundwater pressure and flow around the gasifier are crucial to successful UCG operation for a number of reasons:
• Hydrostatic pressure confines the gasification process to the desired space;
• Supplies of water are required for the gasification reactions; and
• Groundwater influx creates a 'steam jacket' around the operating cavity, reducing heat losses.
It is also preferable to avoid operating in the vicinity of good quality water aquifers to minimise the risk of groundwater contamination as a result of undetected geological structures or unforeseen operational problems.
Coal characteristics
Coal rank and chemical composition is not a major consideration for UCG, however very high moisture or ash contents will reduce the efficiency of the process.
Oxidant
Either air, or a mixture of oxygen and steam, can be used as the oxidant. The choice of oxidant will depend on the design of the site and the required composition of the syngas. The oxygen/water ratio also affects the thermochemical efficiency of the gasification process, whilst the oxidant flow rate will directly affect the rate of gasification and hence of syngas production.
G-46
For
per
sona
l use
onl
y
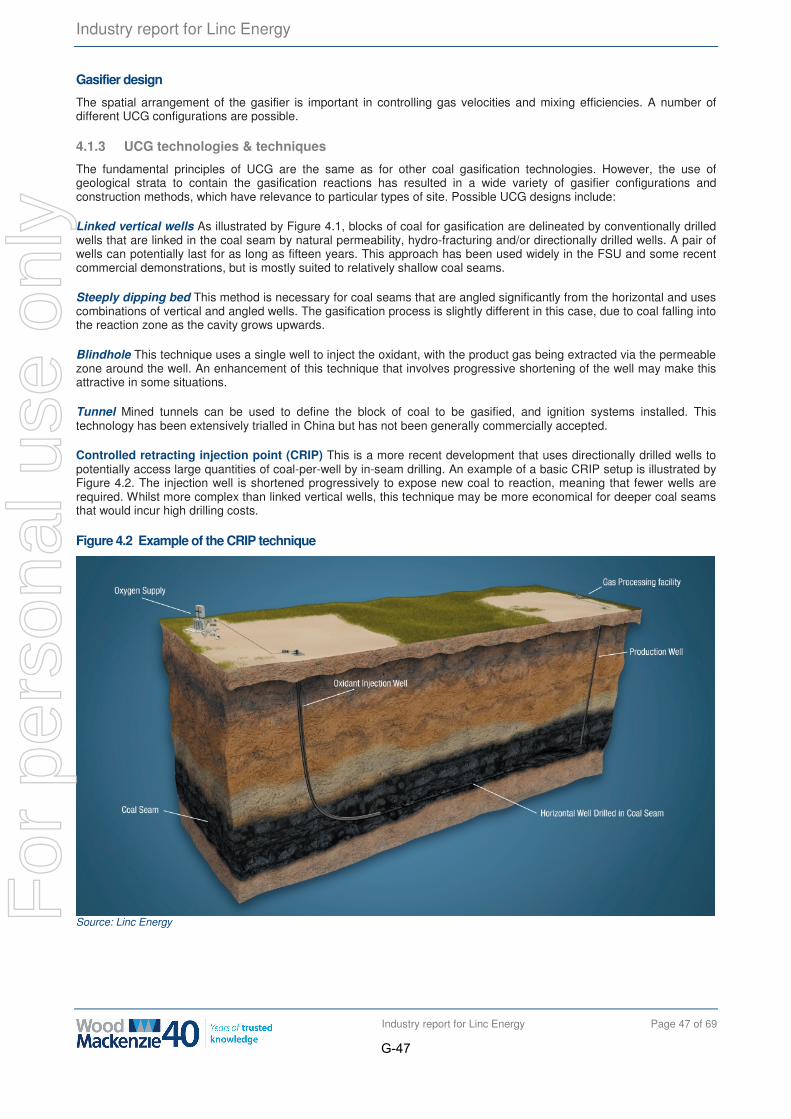
Industry report for Linc Energy
Industry report for Linc Energy Page 47 of 69
Gasifier design
The spatial arrangement of the gasifier is important in controlling gas velocities and mixing efficiencies. A number of different UCG configurations are possible.
4.1.3 UCG technologies & techniques
The fundamental principles of UCG are the same as for other coal gasification technologies. However, the use of geological strata to contain the gasification reactions has resulted in a wide variety of gasifier configurations and construction methods, which have relevance to particular types of site. Possible UCG designs include:
Linked vertical wells As illustrated by Figure 4.1, blocks of coal for gasification are delineated by conventionally drilled wells that are linked in the coal seam by natural permeability, hydro-fracturing and/or directionally drilled wells. A pair of wells can potentially last for as long as fifteen years. This approach has been used widely in the FSU and some recent commercial demonstrations, but is mostly suited to relatively shallow coal seams.
Steeply dipping bed This method is necessary for coal seams that are angled significantly from the horizontal and uses combinations of vertical and angled wells. The gasification process is slightly different in this case, due to coal falling into the reaction zone as the cavity grows upwards.
Blindhole This technique uses a single well to inject the oxidant, with the product gas being extracted via the permeable zone around the well. An enhancement of this technique that involves progressive shortening of the well may make this attractive in some situations.
Tunnel Mined tunnels can be used to define the block of coal to be gasified, and ignition systems installed. This technology has been extensively trialled in China but has not been generally commercially accepted.
Controlled retracting injection point (CRIP) This is a more recent development that uses directionally drilled wells to potentially access large quantities of coal-per-well by in-seam drilling. An example of a basic CRIP setup is illustrated by Figure 4.2. The injection well is shortened progressively to expose new coal to reaction, meaning that fewer wells are required. Whilst more complex than linked vertical wells, this technique may be more economical for deeper coal seams that would incur high drilling costs.
Figure 4.2 Example of the CRIP technique
Source: Linc Energy
G-47
For
per
sona
l use
onl
y
Industry report for Linc Energy
Industry report for Linc Energy Page 48 of 69
4.1.4 Coal resources suitable for UCG
Coal is a widely distributed natural resource, as illustrated by Map 4.1, but a large proportion of the world’s known coal resources are 'unmineable' using conventional surface or underground mining techniques – for economic, environmental, technical or safety reasons. One of the major benefits of UCG is that it can potentially access a portion of this otherwise 'stranded' coal resource.
Map 4.1 Global coal basins
Source: Wood Mackenzie
UCG has the ability to utilise coal that is poor quality (e.g. lignite), inaccessible (e.g. deep or offshore coal seams), or otherwise difficult to mine (e.g. coal seams with unfavourable geology). In targeting such inaccessible or poor quality coal, UCG could serve to substantially increase global energy reserves. There have been several attempts to establish criteria for categorising coal reserves according to suitability for UCG operations. However, whilst the potential certainly appears to be there, the precise extent to which UCG could increase accessible reserves has not, as yet, been determined12.
Trials to date have indicated that UCG appears to be a relatively versatile technique. Coal deposits with obstacles to mining such as high fault frequency, volcanic intrusions and other complex depositional and tectonic features, potentially form a part of the UCG resource base. That said, there are some preferred resource requirements, and site selection is key to establishing a commercially viable operation. A number of coal seams may not be suitable for UCG because of geologic or hydrologic conditions, particularly at relatively shallow depths.
In some locations, UCG could in theory access the same coal resources that could alternatively be mined using conventional underground mining techniques, such as longwall or bord-and-pillar. To date, the small scale of the UCG industry, and the targeting of low quality coals by UCG companies, has tended to minimise competition with traditional miners, as these resources tend not to be targets for conventional mining due to poor financial returns. This may change in future, however, if the UCG sector expands or underground mining techniques develop.
12 The most cited assessment to-date is that from the 2007 Survey of Energy Resources by the World Energy Council (http://www.worldenergy.org/documents/ser2007_final_online_version_1.pdf), which suggests that UCG could increase coal reserves by as much as 600 Bt, or more than 60%. This survey looked at economically recoverable reserves in selected jurisdictions only (USA, Europe, Russia, China, India, South Africa and Australia), so the total potential resource base could be much larger. Note that details of the methodology used to derive these figures were not provided, and these estimates have not been independently verified by WM.
G-48
For
per
sona
l use
onl
y
Industry report for Linc Energy
Industry report for Linc Energy Page 49 of 69
UCG resources could also potentially be the target for coal bed methane (CBM) extraction13. It is therefore worth briefly comparing the three main resource conversion pathways – conventional mining, UCG, and CBM extraction – in terms of resource recovery efficiency.14
4.1.5 Comparative resource recovery efficiency
Extraction efficiencies for underground mining can vary dramatically from mine to mine depending on local conditions, but extraction efficiencies of 50–60% of the deposit for bord & pillar operations, and 75% or more for longwalls, are typical. Whilst the reported extraction efficiencies from UCG trials are less reliable, reported efficiencies in the range of 80–90% suggest that UCG extraction efficiency is likely to be high relative to conventional underground mining techniques, in particular for thick coal seams. For conventional mining, regardless of the mining technique used the raw coal must often be washed and processed to produce a marketable product, further reducing the overall resource recovery efficiency relative to UCG.
Of course, this is not a like-for-like comparison, as the primary product of UCG is syngas rather than marketable product coal in its solid form. A more comprehensive analysis would compare the energy recovery efficiency across the entire value-chain to the end user; necessitating various assumptions regarding subsequent processing and utilisation (see Section 4.2). CBM extraction on the other hand recovers only a small fraction of the energy recovered by either conventional mining or UCG, because by definition it recovers only the energy from the methane (CH4) contained in the coal seam, without utilising any of the energy in the coal itself.
There are also other apparent benefits of UCG over alternative resource conversion pathways. Compared to conventional mining, there is a reduction in the scale of the surface environmental footprint of the operation, and an elimination of human safety hazards associated with underground mining. Further, in the UCG process solid waste such as ash remains in the depleted coal seam, mitigating the need for surface disposal. Depending on the subsequent utilisation of the syngas, UCG may also lead to a reduction in greenhouse gas emissions – relative to conventional mining combined with coal-fired power generation in a conventional subcritical pulverised fuel (PF) power station – and could therefore be characterised as a 'clean coal' technology.
When compared to CBM extraction, the key benefits of UCG relate to the role that water plays in the two processes. CBM extraction requires that most of the water be drained from the coal in order to relieve the pressure and allow the CBM to be released from the coal. CBM extraction therefore produces large volumes of saline wastewater that must be treated at the surface. Conversely, UCG requires that water remains in the coal and adjacent environment to provide the hydrostatic pressure needed to contain the gasification reaction and ensure that the syngas produced flows to the surface under pressure via the production well; only a relatively small portion of the water takes part in the reaction to produce syngas, and groundwater quality is thereby maintained.
4.2 UCG value chain & applications
The primary product of the UCG process is syngas. Syngas consists primarily of H2 and CO, and will also contain smaller amounts of CO2, CH4, nitrogen, water, and impurities such as sulphur.
Syngas is a highly versatile product that can be used directly for power generation, converted into a synthetic crude oil ('syncrude') and then refined into a variety of liquid fuels, reformed into synthetic natural gas (SNG), or used as a chemical feedstock to produce a variety of value-added products. Figure 4.3 outlines the UCG value chain and illustrates some of the major downstream processing options, and potential applications and products.
13 CBM (also referred to as coal seam gas (CSG)) is formed as a by-product of the coalification process. About 1,300 cubic metres of gas is produced per tonne of coal formed. Most of the gas produced escapes during coalification, but a small amount is retained in the coal seam, either as 'free gas' in fractures, adsorbed in pores in the coal, or in adjacent rock strata. The final gas content is up to 25 cubic metres per tonne of coal. In general, the higher the rank of the coal, the deeper the coal seam, and the lower the moisture content, the greater the volume of gas. This residual methane is released when the pressure within the coal seam is reduced.
CBM extraction involves drilling a well into the seam and employing techniques to increase the local gas permeability of the seam (e.g. the seam is hydraulically fractured ('fraccing') by injecting a suitable fluid at high pressure). Groundwater is then pumped out, which lowers the hydrostatic pressure in the seam and allows the CBM to release from the coal, move to the well, and be brought to the surface for processing. The recovered CBM is typically 95% to 99% methane and is relatively easy to process. CBM extraction has now become a major industry in a number of locations.
14 Another alternative worth mentioning, though still at an early stage of research and development, is microbial coal conversion (MCC). MCC technology has been developed by U.S. biotechnology company Arctech Incorporated and its commercialisation is being promoted by Australian company Mitchell Energy. Similar to UCG, MCC is a process for coal conversion in situ. It involves the use of microbes to convert the coal to acetic acid underground; this is then extracted and converted to methane at the surface.
G-49
For
per
sona
l use
onl
y
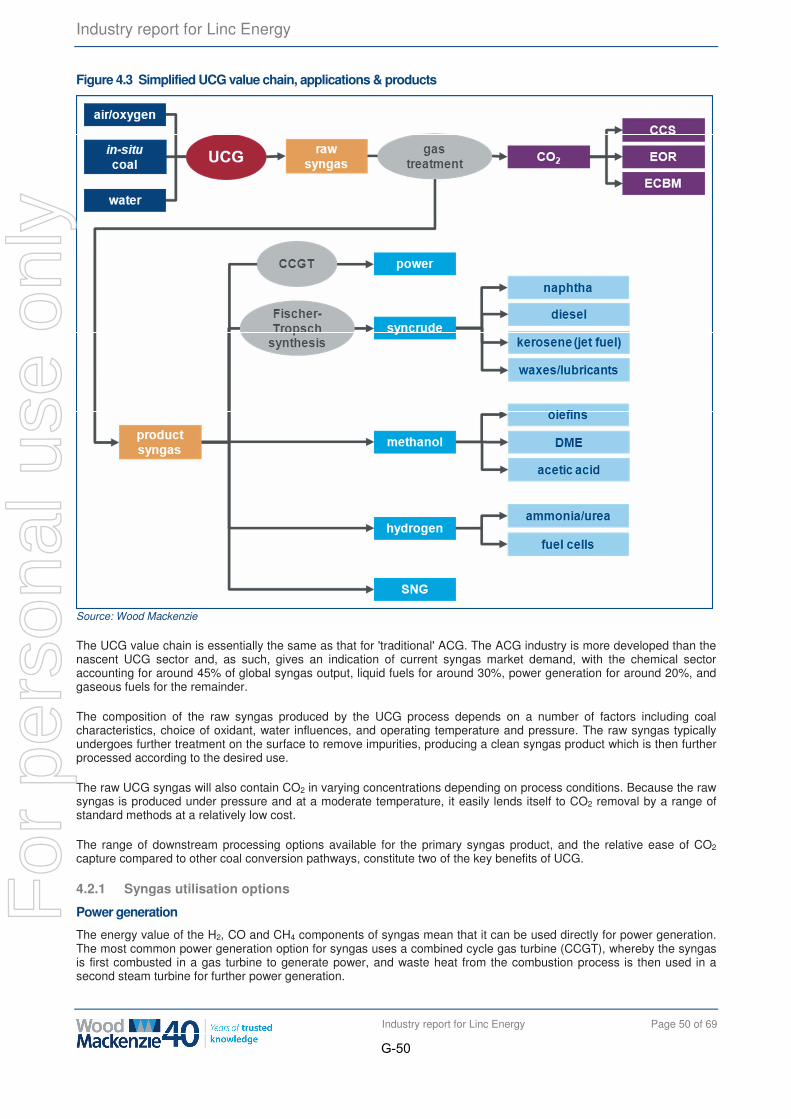
Industry report for Linc Energy
Industry report for Linc Energy Page 50 of 69
Figure 4.3 Simplified UCG value chain, applications & products
Source: Wood Mackenzie
The UCG value chain is essentially the same as that for 'traditional' ACG. The ACG industry is more developed than the nascent UCG sector and, as such, gives an indication of current syngas market demand, with the chemical sector accounting for around 45% of global syngas output, liquid fuels for around 30%, power generation for around 20%, and gaseous fuels for the remainder.
The composition of the raw syngas produced by the UCG process depends on a number of factors including coal characteristics, choice of oxidant, water influences, and operating temperature and pressure. The raw syngas typically undergoes further treatment on the surface to remove impurities, producing a clean syngas product which is then further processed according to the desired use.
The raw UCG syngas will also contain CO2 in varying concentrations depending on process conditions. Because the raw syngas is produced under pressure and at a moderate temperature, it easily lends itself to CO2 removal by a range of standard methods at a relatively low cost.
The range of downstream processing options available for the primary syngas product, and the relative ease of CO2 capture compared to other coal conversion pathways, constitute two of the key benefits of UCG.
4.2.1 Syngas utilisation options
Power generation
The energy value of the H2, CO and CH4 components of syngas mean that it can be used directly for power generation. The most common power generation option for syngas uses a combined cycle gas turbine (CCGT), whereby the syngas is first combusted in a gas turbine to generate power, and waste heat from the combustion process is then used in a second steam turbine for further power generation.
G-50
For
per
sona
l use
onl
y
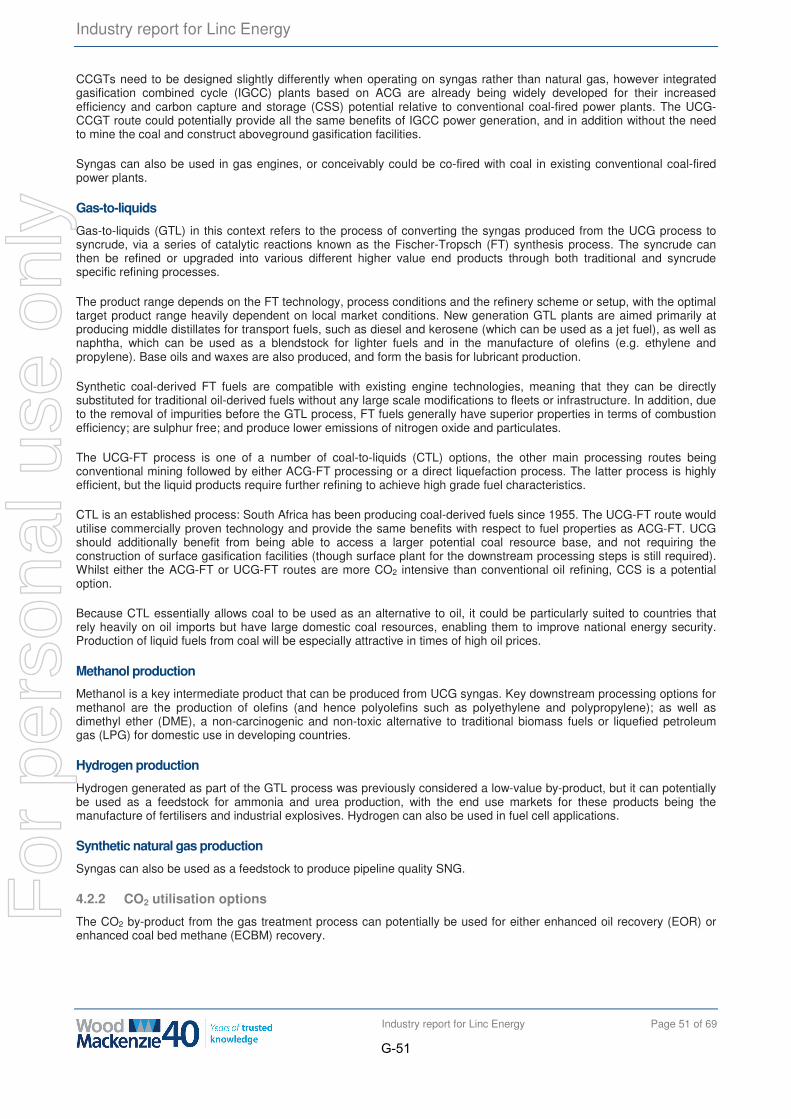
Industry report for Linc Energy
Industry report for Linc Energy Page 51 of 69
CCGTs need to be designed slightly differently when operating on syngas rather than natural gas, however integrated gasification combined cycle (IGCC) plants based on ACG are already being widely developed for their increased efficiency and carbon capture and storage (CSS) potential relative to conventional coal-fired power plants. The UCG-CCGT route could potentially provide all the same benefits of IGCC power generation, and in addition without the need to mine the coal and construct aboveground gasification facilities.
Syngas can also be used in gas engines, or conceivably could be co-fired with coal in existing conventional coal-fired power plants.
Gas-to-liquids
Gas-to-liquids (GTL) in this context refers to the process of converting the syngas produced from the UCG process to syncrude, via a series of catalytic reactions known as the Fischer-Tropsch (FT) synthesis process. The syncrude can then be refined or upgraded into various different higher value end products through both traditional and syncrude specific refining processes.
The product range depends on the FT technology, process conditions and the refinery scheme or setup, with the optimal target product range heavily dependent on local market conditions. New generation GTL plants are aimed primarily at producing middle distillates for transport fuels, such as diesel and kerosene (which can be used as a jet fuel), as well as naphtha, which can be used as a blendstock for lighter fuels and in the manufacture of olefins (e.g. ethylene and propylene). Base oils and waxes are also produced, and form the basis for lubricant production.
Synthetic coal-derived FT fuels are compatible with existing engine technologies, meaning that they can be directly substituted for traditional oil-derived fuels without any large scale modifications to fleets or infrastructure. In addition, due to the removal of impurities before the GTL process, FT fuels generally have superior properties in terms of combustion efficiency; are sulphur free; and produce lower emissions of nitrogen oxide and particulates.
The UCG-FT process is one of a number of coal-to-liquids (CTL) options, the other main processing routes being conventional mining followed by either ACG-FT processing or a direct liquefaction process. The latter process is highly efficient, but the liquid products require further refining to achieve high grade fuel characteristics.
CTL is an established process: South Africa has been producing coal-derived fuels since 1955. The UCG-FT route would utilise commercially proven technology and provide the same benefits with respect to fuel properties as ACG-FT. UCG should additionally benefit from being able to access a larger potential coal resource base, and not requiring the construction of surface gasification facilities (though surface plant for the downstream processing steps is still required). Whilst either the ACG-FT or UCG-FT routes are more CO2 intensive than conventional oil refining, CCS is a potential option.
Because CTL essentially allows coal to be used as an alternative to oil, it could be particularly suited to countries that rely heavily on oil imports but have large domestic coal resources, enabling them to improve national energy security. Production of liquid fuels from coal will be especially attractive in times of high oil prices.
Methanol production
Methanol is a key intermediate product that can be produced from UCG syngas. Key downstream processing options for methanol are the production of olefins (and hence polyolefins such as polyethylene and polypropylene); as well as dimethyl ether (DME), a non-carcinogenic and non-toxic alternative to traditional biomass fuels or liquefied petroleum gas (LPG) for domestic use in developing countries.
Hydrogen production
Hydrogen generated as part of the GTL process was previously considered a low-value by-product, but it can potentially be used as a feedstock for ammonia and urea production, with the end use markets for these products being the manufacture of fertilisers and industrial explosives. Hydrogen can also be used in fuel cell applications.
Synthetic natural gas production
Syngas can also be used as a feedstock to produce pipeline quality SNG.
4.2.2 CO2 utilisation options
The CO2 by-product from the gas treatment process can potentially be used for either enhanced oil recovery (EOR) or enhanced coal bed methane (ECBM) recovery.
G-51
For
per
sona
l use
onl
y
Industry report for Linc Energy
Industry report for Linc Energy Page 52 of 69
Enhanced oil recovery
EOR involves the injection of CO2 into depleted oil fields in order to increase reservoir pressure and oil fluidity, thus enabling oil to escape from rock pores and flow more easily towards production wells. Successful application of EOR can extend the productive life of mature oil reservoirs. Any CO2 that comes to the surface with the recovered oil is captured and recycled at the end of the EOR process to be stored permanently underground.
EOR using CO2 has been demonstrated at a commercial scale for over 30 years in the Permian Basin in Texas and New Mexico, with oil (and gas) recovered using EOR accounting for around a third of production in this region. Until recently, most of the CO2 used for EOR has come from naturally occurring underground reservoirs. Capturing and sequestering anthropogenic CO2 from applications such as UCG is a more recent development. Historically, the cost of CO2 capture and the lack of existing pipelines have made it less attractive than the use of natural CO2, but high oil prices, combined with the positive environmental aspects of CCS have made this option more appealing in recent years. The proportion of CO2 from anthropogenic sources will likely grow as the necessary infrastructure is developed and natural CO2 reservoirs are depleted.
Thus far, EOR using CO2 has primarily been applied in North America, but it is feasible that the process could be expanded globally.
Enhanced coal bed methane recovery
ECBM recovery is a new technique being researched by the CBM industry, and involves sweeping the coal seam with CO2. The CO2 preferentially adsorbs in the pores of the coal, and the CH4 is displaced, thus allowing the CH4 to be recovered whilst simultaneously sequestering the CO2.
Carbon capture and storage
As well as providing an additional revenue stream, each of the above approaches constitutes a commercially attractive means of CCS, whereby the CO2 is permanently sequestered underground.
There are also potential synergies between CCS and the UCG process itself, in that UCG creates a cavity that could potentially sequester its own CO2. It has been suggested that the remnant coal and ash would increase the available surface area for CO2 adsorption, though further investigation is required to demonstrate this. Further, the necessary infrastructure and wells would already be in place. Not all UCG sites would be suitable though, with some seams too shallow to allow for permanent CO2 storage.
4.3 UCG industry overview
4.3.1 Historical development of UCG
Whilst UCG is not yet commercially established, neither is it a new technology. The process has existed for over 100 years, and has been researched, piloted and trialled by a number of companies and organisations, including research organisations such as the Lawrence Livermore National Laboratory in the U.S. and the Commonwealth Scientific and Industrial Research Organisation (CSIRO) in Australia. UCG has also seen long term operation on a commercial scale in the FSU.
UCG was first envisaged in the late 19th century, and a number of trials were conducted in the early 20th century in the UK, before development was halted by the onset of World War I. The first significant research program was commenced in the FSU during the 1930s, which led to the implementation of a number of industrial scale UCG plants, commencing in 1937 and continuing into the 1950s. Whilst many of these were shut down after the discovery of Siberian natural gas reserves in the 1960s, at least one site in Uzbekistan is still in operation today.
The success of the Soviet projects briefly reignited interest in UCG technology in Western Europe in the 1950s, before low oil and gas prices in the 1960s resulted in most programs being abandoned. During the 1970s and 1980s additional technological development and trials occurred in the U.S. However, significant environmental problems at two sites – due to operational mistakes and poor site selection – combined with low natural gas prices in the 1990s, again halted development.
Historically, interest in UCG has been driven by a number of factors at various times, including high mortality rates in underground mines, national energy security, high energy prices, and an undersupply of conventional oil and gas. In recent years, a combination of high oil prices, increasing global energy demand, a focus on environmental issues related to conventional fossil fuel use, and technological improvements – especially in directional drilling and remote monitoring techniques – has interest in UCG increasing.
G-52
For
per
sona
l use
onl
y
Industry report for Linc Energy
Industry report for Linc Energy Page 53 of 69
Since the 1930s there have been over 50 UCG trials or pilot operations worldwide, and indications are that the technology is now sufficiently well advanced to allow for the commercial development of a global UCG industry – should economic conditions be favourable.
4.3.2 Current UCG activities
The last few years has seen renewed interest in UCG in most coal producing regions of the world, with a number of commercial and pilot-scale operations and trials commencing operation, and many more exploration and planning activities underway. Table 4.1 provides an overview of global UCG projects and exploration activity.
The Yerostigaz operation at Angren in Uzbekistan is the world's oldest UCG site, having been operational for more than 50 years. Yerostigaz is now majority owned by Linc Energy. Linc Energy is also actively engaged in a number of other UCG activities. Foremost amongst these is the Chinchilla demonstration facility in Queensland. Chinchilla has been operational since 1999 and is currently the only operating UCG-GTL facility in the world. Linc Energy is also exploring commercial opportunities with local partners in Asia (Siberian Russia, China, Mongolia, Indonesia and Vietnam); Europe (Poland and the UK); North America (Canada and the US); and sub-Saharan Africa (Botswana and South Africa). Linc Energy's business model is based on revenue from licensing, royalty and technical consulting fees; as well as equity participation in JV arrangements in some cases.
Carbon Energy is another Australian company that has been increasingly active in the UCG sector. Carbon Energy was formed in 2006 following a JV between Metex and the CSIRO to develop and commercialise the CRIP UCG technique. A proof-of-concept demonstration of the technology at the Bloodwood Creek project in Queensland is reported to have been successful, and Carbon Energy is now pursuing further opportunities in South America (Argentina and Chile), China and Turkey.
Cougar Energy is the third key Australian UCG player. However, the company's Kingaroy demonstration facility in Queensland was forced to shut down in 2010 by the Queensland Department of Environment and Resource Management (DERM), due to concerns about groundwater being contaminated by benzene and toluene. As a result, Cougar Energy is now focussing its business development activities in Asia, particularly Indonesia, China and Mongolia.
Another key player in the global UCG sector is Canadian based Ergo Exergy Technologies. Ergo Exergy was formed in 1994 and is an experienced UCG technology provider. The company offers several types of licences for its UCG technology and technical services, and has an extensive international portfolio of projects with various local partners.
One of Ergo Exergy's key partners is the South African power utility Eskom. Eskom's UCG operation at the Majuba mine has been operating since 2010, with the syngas produced co-fired with coal at the adjacent Majuba power plant. Majuba is the first commercial UCG operation outside of the FSU, and Eskom has recently signed a research agreement with Sasol to jointly explore further UCG technology development in South Africa.
Though not represented in the list of projects in Table 4.1, Russia has a long history of UCG activity, as well as a number of current projects. China also has an active UCG research program, and it's estimated that there are now around 30 UCG projects at different stages of development in China. Other important regions of activity include India (which has huge lignite resources), Indonesia, Eastern Europe, and the UK (which has a number of offshore coal seams).
G-53
For
per
sona
l use
onl
y
Indu
stry
rep
ort f
or L
inc
Ene
rgy
Indu
stry
rep
ort f
or L
inc
Ene
rgy
Pag
e 54
of 6
9
Tabl
e 4.
1 O
verv
iew
of g
loba
l UC
G a
ctiv
ities
Co
un
try
Par
tici
pan
t(s)
P
roje
ct n
ame
& lo
cati
on
D
evel
op
men
t st
atu
s C
om
men
ts
Do
wn
stre
am p
roce
ssin
g
Arg
entin
a C
arbo
n E
nerg
y;
Del
mo
Gro
up
Cla
rom
eco
Coa
l Bas
in
Exp
lora
tion/
plan
ning
S
igne
d M
OU
; Ove
r 60
0,00
0 he
ctar
es o
f coa
l exp
lora
tion
right
s P
ower
gen
erat
ion
Aus
tral
ia
Linc
Ene
rgy
Chi
nchi
lla (
Sur
at B
asin
, Q
ueen
slan
d)
Dem
onst
ratio
n fa
cilit
y (o
pera
tiona
l sin
ce 1
999)
W
orld
's o
nly
oper
atin
g U
CG
-GT
L fa
cilit
y; 8
0,80
3 ac
res
of
coal
tene
men
ts
GT
L;
EO
R
Aus
tral
ia
Linc
Ene
rgy
Wal
low
ay a
nd A
rcka
ringa
ba
sins
(S
outh
Aus
tral
ia)
Exp
lora
tion/
plan
ning
90
4,40
2 ac
res
of c
oal t
enem
ents
G
TL
Aus
tral
ia
Car
bon
Ene
rgy
Blo
odw
ood
Cre
ek (
Sur
at B
asin
, Q
ueen
slan
d)
Pilo
t-sc
ale
dem
onst
ratio
n fa
cilit
y (o
pera
tiona
l sin
ce 2
011)
Pro
of-o
f-co
ncep
t dem
onst
ratio
n of
oxy
gen
inje
cted
CR
IP
tech
niqu
e; 4
32 P
J of
2P
cer
tifie
d sy
ngas
res
ourc
e P
ower
gen
erat
ion
Aus
tral
ia
Cou
gar
Ene
rgy;
E
rgo
Exe
rgy
Kin
garo
y (S
urat
Bas
in,
Que
ensl
and)
D
emon
stra
tion
faci
lity
(cea
sed
oper
atio
n)
Shu
t dow
n in
201
0 by
Que
ensl
and
Dep
artm
ent o
f E
nviro
nmen
t and
Res
ourc
e M
anag
emen
t (D
ER
M)
due
to
conc
erns
abo
ut g
roun
dwat
er b
eing
con
tam
inat
ed b
y be
nzen
e an
d to
luen
e
-
Can
ada
Laur
us E
nerg
y;
Erg
o E
xerg
y D
rayt
on V
alle
y, w
est c
entr
al
Alb
erta
E
xplo
ratio
n/pl
anni
ng
Coa
l lea
ses
Pow
er g
ener
atio
n (c
o-fir
ed w
ith c
oal/
petc
oke)
Can
ada
Sw
an H
ills
Syn
fuel
s A
lber
ta
Exp
lora
tion/
plan
ning
-
-
Chi
le
Car
bon
Ene
rgy;
A
ntof
agas
ta M
iner
als
SA
M
ulpu
n E
xplo
ratio
n/pl
anni
ng
Sig
ned
agre
emen
t to
join
tly a
sses
s an
d de
velo
p th
e de
posi
t in
200
9 -
Chi
na
Car
bon
Ene
rgy;
Z
heng
xhou
Coa
l Ind
ustr
y G
roup
Hao
qin
Coa
l Fie
ld (
Inne
r M
ongo
lia)
Exp
lora
tion/
plan
ning
S
igne
d T
echn
olog
y Li
cenc
e A
gree
men
t (T
LA)
in J
une
2013
-
Indo
nesi
a C
ouga
r E
nerg
y;
Med
coE
nerg
i S
outh
Sum
atra
& E
ast
Kal
iman
tan
Exp
lora
tion/
plan
ning
S
igne
d M
OU
in 2
011
to jo
intly
ass
ess
the
oppo
rtun
ity to
in
trod
ucin
g C
SG
tech
nolo
gy in
to In
done
sia
and
set u
p a
JV
once
sui
tabl
e si
tes
have
bee
n id
entif
ied
Pow
er g
ener
atio
n;
SN
G p
rodu
ctio
n;
met
hano
l, et
hano
l or
urea
pr
oduc
tion
New
Zea
land
S
olid
Ene
rgy;
E
rgo
Exe
rgy
Hun
tley
Coa
l Fie
ld (
Nor
th
Isla
nd)
Pilo
t-sc
ale
dem
onst
ratio
n fa
cilit
y (o
pera
tiona
l sin
ce 2
012)
- -
Pol
and
Linc
Ene
rgy
Pol
anka
-Wie
lki D
rogi
(P
WD
) (U
pper
Sile
sian
Coa
l Bas
in)
Exp
lora
tion/
plan
ning
53
,374
acr
es o
f coa
l exp
lora
tion
leas
es
-
Rus
sia
Linc
Ene
rgy;
LL
C Y
akut
Min
eral
s C
huko
tka
(Sib
eria
) E
xplo
ratio
n/pl
anni
ng
Sig
ned
agre
emen
t in
June
201
3 G
TL
Sou
th A
fric
a E
skom
; E
rgo
Exe
rgy
Maj
uba
Com
mer
cial
ope
ratio
n (o
pera
tiona
l sin
ce 2
010)
F
irst c
omm
erci
al o
pera
tion
outs
ide
of th
e F
SU
P
ower
gen
erat
ion
(co-
fired
with
coa
l)
G-54
For
per
sona
l use
onl
y
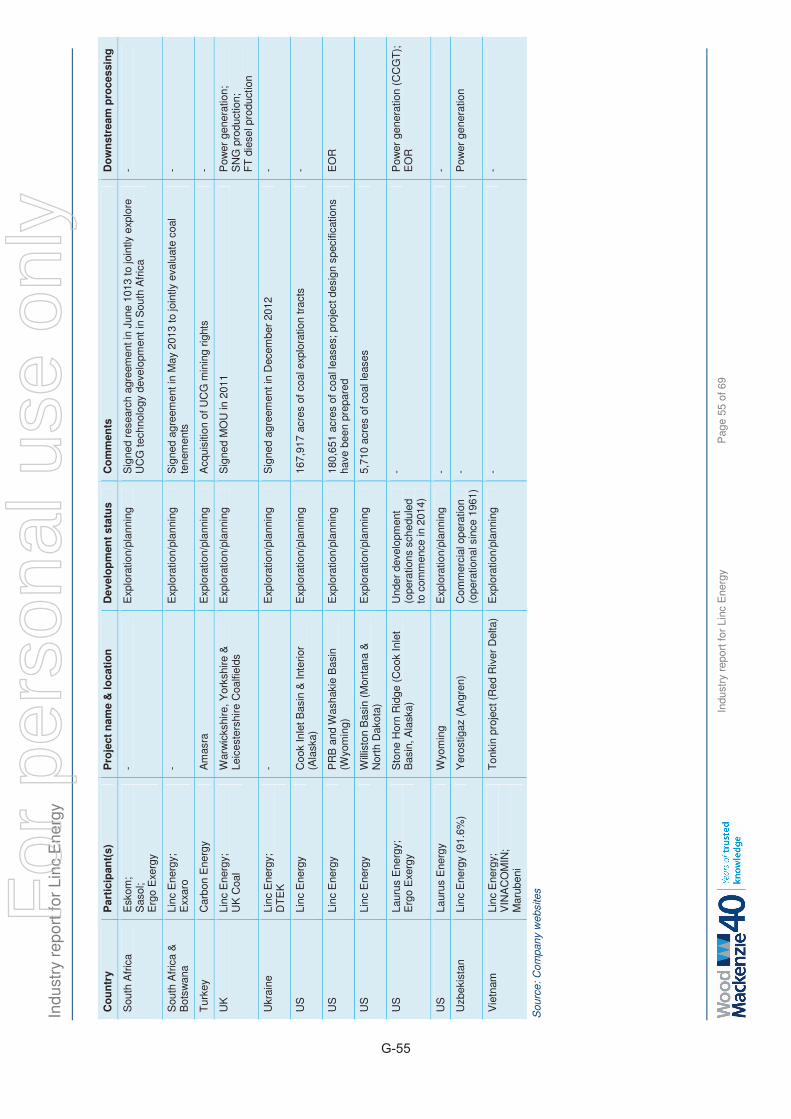
Indu
stry
rep
ort f
or L
inc
Ene
rgy
Indu
stry
rep
ort f
or L
inc
Ene
rgy
Pag
e 55
of 6
9
Co
un
try
Par
tici
pan
t(s)
P
roje
ct n
ame
& lo
cati
on
D
evel
op
men
t st
atu
s C
om
men
ts
Do
wn
stre
am p
roce
ssin
g
Sou
th A
fric
a E
skom
; S
asol
; E
rgo
Exe
rgy
- E
xplo
ratio
n/pl
anni
ng
Sig
ned
rese
arch
agr
eem
ent i
n Ju
ne 1
013
to jo
intly
exp
lore
U
CG
tech
nolo
gy d
evel
opm
ent i
n S
outh
Afr
ica
-
Sou
th A
fric
a &
B
otsw
ana
Linc
Ene
rgy;
E
xxar
o -
Exp
lora
tion/
plan
ning
S
igne
d ag
reem
ent i
n M
ay 2
013
to jo
intly
eva
luat
e co
al
tene
men
ts
-
Tur
key
Car
bon
Ene
rgy
Am
asra
E
xplo
ratio
n/pl
anni
ng
Acq
uisi
tion
of U
CG
min
ing
right
s -
UK
Li
nc E
nerg
y;
UK
Coa
l W
arw
icks
hire
, Yor
kshi
re &
Le
ices
ters
hire
Coa
lfiel
ds
Exp
lora
tion/
plan
ning
S
igne
d M
OU
in 2
011
Pow
er g
ener
atio
n;
SN
G p
rodu
ctio
n;
FT
die
sel p
rodu
ctio
n
Ukr
aine
Li
nc E
nerg
y;
DT
EK
-
Exp
lora
tion/
plan
ning
S
igne
d ag
reem
ent i
n D
ecem
ber
2012
-
US
Li
nc E
nerg
y C
ook
Inle
t Bas
in &
Inte
rior
(Ala
ska)
E
xplo
ratio
n/pl
anni
ng
167,
917
acre
s of
coa
l exp
lora
tion
trac
ts
-
US
Li
nc E
nerg
y P
RB
and
Was
haki
e B
asin
(W
yom
ing)
E
xplo
ratio
n/pl
anni
ng
180,
651
acre
s of
coa
l lea
ses;
pro
ject
des
ign
spec
ifica
tions
ha
ve b
een
prep
ared
E
OR
US
Li
nc E
nerg
y W
illis
ton
Bas
in (
Mon
tana
&
Nor
th D
akot
a)
Exp
lora
tion/
plan
ning
5,
710
acre
s of
coa
l lea
ses
US
La
urus
Ene
rgy;
E
rgo
Exe
rgy
Sto
ne H
orn
Rid
ge (
Coo
k In
let
Bas
in, A
lask
a)
Und
er d
evel
opm
ent
(ope
ratio
ns s
ched
uled
to
com
men
ce in
201
4)
- P
ower
gen
erat
ion
(CC
GT
);
EO
R
US
La
urus
Ene
rgy
Wyo
min
g E
xplo
ratio
n/pl
anni
ng
- -
Uzb
ekis
tan
Linc
Ene
rgy
(91.
6%)
Yer
ostig
az (
Ang
ren)
C
omm
erci
al o
pera
tion
(ope
ratio
nal s
ince
196
1)
- P
ower
gen
erat
ion
Vie
tnam
Li
nc E
nerg
y;
VIN
AC
OM
IN;
Mar
uben
i
Ton
kin
proj
ect (
Red
Riv
er D
elta
) E
xplo
ratio
n/pl
anni
ng
- -
Sou
rce:
Com
pany
web
site
s
G-55
For
per
sona
l use
onl
y
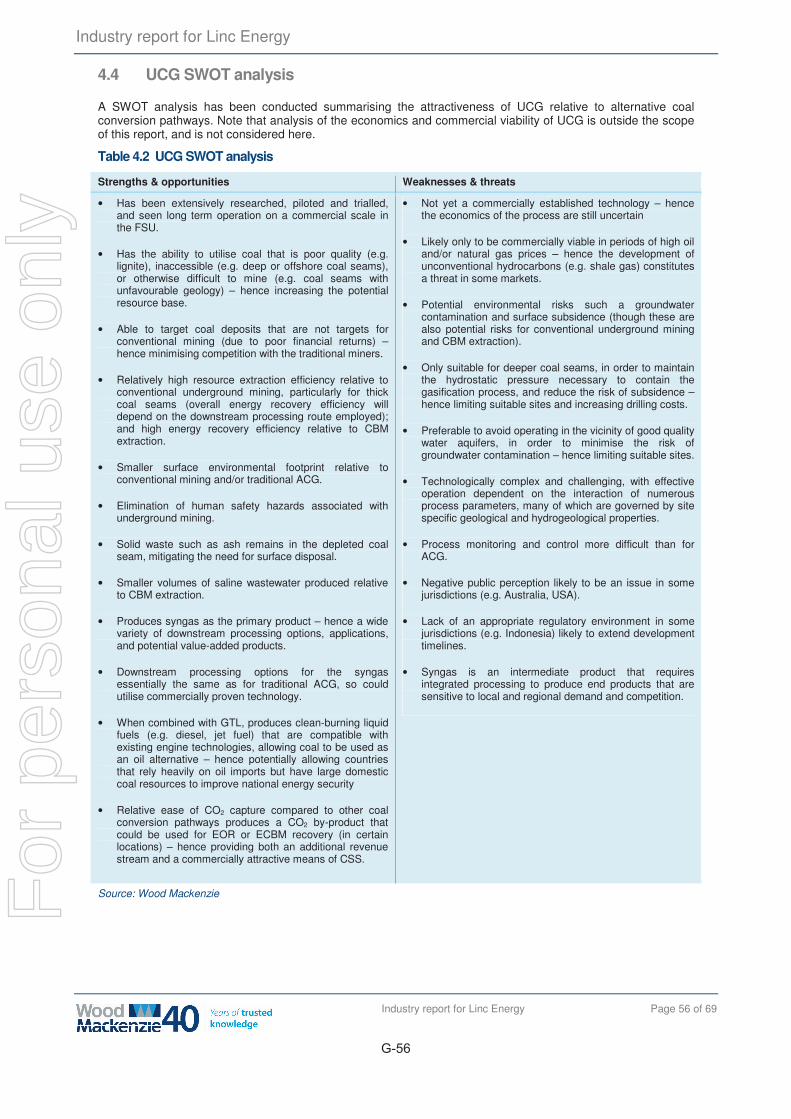
4.4 UCG SWOT analysis
A SWOT analysis has been conducted summarising the attractiveness of UCG relative to alternative coal conversion pathways. Note that analysis of the economics and commercial viability of UCG is outside the scope of this report, and is not considered here.
Table 4.2 UCG SWOT analysis
Strengths & opportunities Weaknesses & threats
• Has been extensively researched, piloted and trialled, and seen long term operation on a commercial scale in the FSU.
• Has the ability to utilise coal that is poor quality (e.g. lignite), inaccessible (e.g. deep or offshore coal seams), or otherwise difficult to mine (e.g. coal seams with unfavourable geology) – hence increasing the potential resource base.
• Able to target coal deposits that are not targets for conventional mining (due to poor financial returns) – hence minimising competition with the traditional miners.
• Relatively high resource extraction efficiency relative to conventional underground mining, particularly for thick coal seams (overall energy recovery efficiency will depend on the downstream processing route employed); and high energy recovery efficiency relative to CBM extraction.
• Smaller surface environmental footprint relative to conventional mining and/or traditional ACG.
• Elimination of human safety hazards associated with underground mining.
• Solid waste such as ash remains in the depleted coal seam, mitigating the need for surface disposal.
• Smaller volumes of saline wastewater produced relative to CBM extraction.
• Produces syngas as the primary product – hence a wide variety of downstream processing options, applications, and potential value-added products.
• Downstream processing options for the syngas essentially the same as for traditional ACG, so could utilise commercially proven technology.
• When combined with GTL, produces clean-burning liquid fuels (e.g. diesel, jet fuel) that are compatible with existing engine technologies, allowing coal to be used as an oil alternative – hence potentially allowing countries that rely heavily on oil imports but have large domestic coal resources to improve national energy security
• Relative ease of CO2 capture compared to other coal conversion pathways produces a CO2 by-product that could be used for EOR or ECBM recovery (in certain locations) – hence providing both an additional revenue stream and a commercially attractive means of CSS.
• Not yet a commercially established technology – hence the economics of the process are still uncertain
• Likely only to be commercially viable in periods of high oil and/or natural gas prices – hence the development of unconventional hydrocarbons (e.g. shale gas) constitutes a threat in some markets.
• Potential environmental risks such a groundwater contamination and surface subsidence (though these are also potential risks for conventional underground mining and CBM extraction).
• Only suitable for deeper coal seams, in order to maintain the hydrostatic pressure necessary to contain the gasification process, and reduce the risk of subsidence – hence limiting suitable sites and increasing drilling costs.
• Preferable to avoid operating in the vicinity of good quality water aquifers, in order to minimise the risk of groundwater contamination – hence limiting suitable sites.
• Technologically complex and challenging, with effective operation dependent on the interaction of numerous process parameters, many of which are governed by site specific geological and hydrogeological properties.
• Process monitoring and control more difficult than for ACG.
• Negative public perception likely to be an issue in some jurisdictions (e.g. Australia, USA).
• Lack of an appropriate regulatory environment in some jurisdictions (e.g. Indonesia) likely to extend development timelines.
• Syngas is an intermediate product that requires integrated processing to produce end products that are sensitive to local and regional demand and competition.
Source: Wood Mackenzie
Industry report for Linc Energy
G-56
Industry report for Linc Energy Page 56 of 69
For
per
sona
l use
onl
y
Industry report for Linc Energy
Industry report for Linc Energy Page 57 of 69
5 Coal market review
5.1 Summary
Demand for seaborne thermal coal is expected to increase from 936 Mt in 2013 to 1,122 Mt in 2018 (a compound annual growth rate (CAGR) of 3.7%) with the majority of growth a result of increased coal demand in Asia. Large developing economies in the region, such as China and India, will need significant volumes of coal to support their coal-fired power generation requirements. Whilst both countries have significant domestic reserves, production growth will be unable to meet total demand, resulting in rising import demand.
Traditional thermal coal suppliers, Indonesia and Australia, are expected to meet the bulk of incremental growth in demand due, in large part, to their freight advantage into Asia. However, increasing volumes of coal from regions that have typically supplied the European market, such as Colombia, will increasingly be diverted towards the high growth Asian markets.
Australia is the largest supplier of high energy, low sulphur thermal coal traded on the seaborne market. Short term growth in exports will be derived from brownfield expansions and greenfield projects in established thermal coal mining basins, although there will also be increasing production from emerging basins in both New South Wales and Queensland. Whilst Australian export growth has been constrained by infrastructure in recent years, significant investment in infrastructure has alleviated existing bottlenecks. Additional investment in export infrastructure will be required to unlock developing coal supply regions. Australian costs have risen substantially in recent years but producers are now focussed on productivity improvements and cost reductions. Australia is expected to continue to supply traditional markets in Northeast Asia whilst increasing exports of lower quality coals to China.
Thermal coal prices have experienced significant volatility in the past few years as demand has, at times, outstripped supply capability. Producers have responded by increasing supply capacity and the market is now oversupplied. In response to subsequently falling prices, producers have continued to supply the market in an effort to lower unit production costs and extract some margin, further suppressing prices. Market balance is expected to return around 2018 as rising coal demand absorbs excess production.
5.2 Coal market fundamentals
Coal is a widely distributed natural resource that is produced in numerous countries worldwide. Most coal is used in the country in which it was mined. China and the U.S. in particular – the world’s two largest coal producers – consume the majority of their coal domestically.
The coal market can be divided into two major sub-markets, thermal and metallurgical, based on the end-use of the coal:
Thermal coal is used in combustion processes to produce steam for power generation, heating, and industrial applications such as cement manufacture. Thermal coal can be further sub-divided into different market tiers based on energy content. The following energy-based classifications for thermal coal are used in this report:
• Bituminous Specific energy > 5,400 kcal/kg (gar)
• Sub-bituminous Specific energy 4,500–5,400 kcal/kg (gar)
• Low rank Specific energy <4,500 kcal/kg (gar)
Wood Mackenzie estimates that the majority of marketable15 thermal coal reserves are located in China. Other countries with significant thermal coal reserves are the U.S., Indonesia, Australia, South Africa, Russia and Colombia.
15 The reserves data in this report is based on Wood Mackenzie’s view of likely future commercial production, rather than JORC (or equivalent) compliant
reserves estimates. Marketable reserves are defined as the total forecast of future marketable coal production over the life of each identified mine and project.
G-57
For
per
sona
l use
onl
y
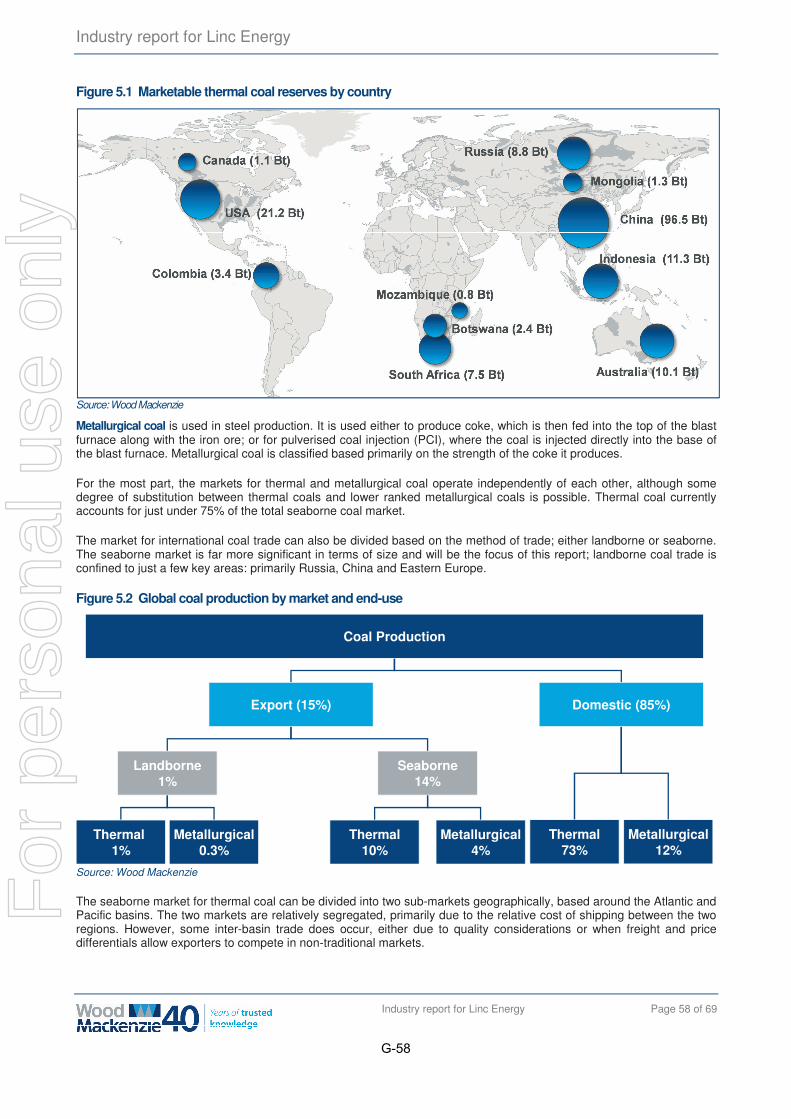
Industry report for Linc Energy
Industry report for Linc Energy Page 58 of 69
Figure 5.1 Marketable thermal coal reserves by country
Source: Wood Mackenzie
Metallurgical coal is used in steel production. It is used either to produce coke, which is then fed into the top of the blast furnace along with the iron ore; or for pulverised coal injection (PCI), where the coal is injected directly into the base of the blast furnace. Metallurgical coal is classified based primarily on the strength of the coke it produces.
For the most part, the markets for thermal and metallurgical coal operate independently of each other, although some degree of substitution between thermal coals and lower ranked metallurgical coals is possible. Thermal coal currently accounts for just under 75% of the total seaborne coal market.
The market for international coal trade can also be divided based on the method of trade; either landborne or seaborne. The seaborne market is far more significant in terms of size and will be the focus of this report; landborne coal trade is confined to just a few key areas: primarily Russia, China and Eastern Europe.
Figure 5.2 Global coal production by market and end-use
Source: Wood Mackenzie
The seaborne market for thermal coal can be divided into two sub-markets geographically, based around the Atlantic and Pacific basins. The two markets are relatively segregated, primarily due to the relative cost of shipping between the two regions. However, some inter-basin trade does occur, either due to quality considerations or when freight and price differentials allow exporters to compete in non-traditional markets.
Coal Production
Export (15%) Domestic (85%)
Seaborne14%
Landborne1%
Thermal10%
Metallurgical4%
Thermal 1%
Metallurgical0.3%
Thermal73%
Metallurgical12%
G-58
For
per
sona
l use
onl
y
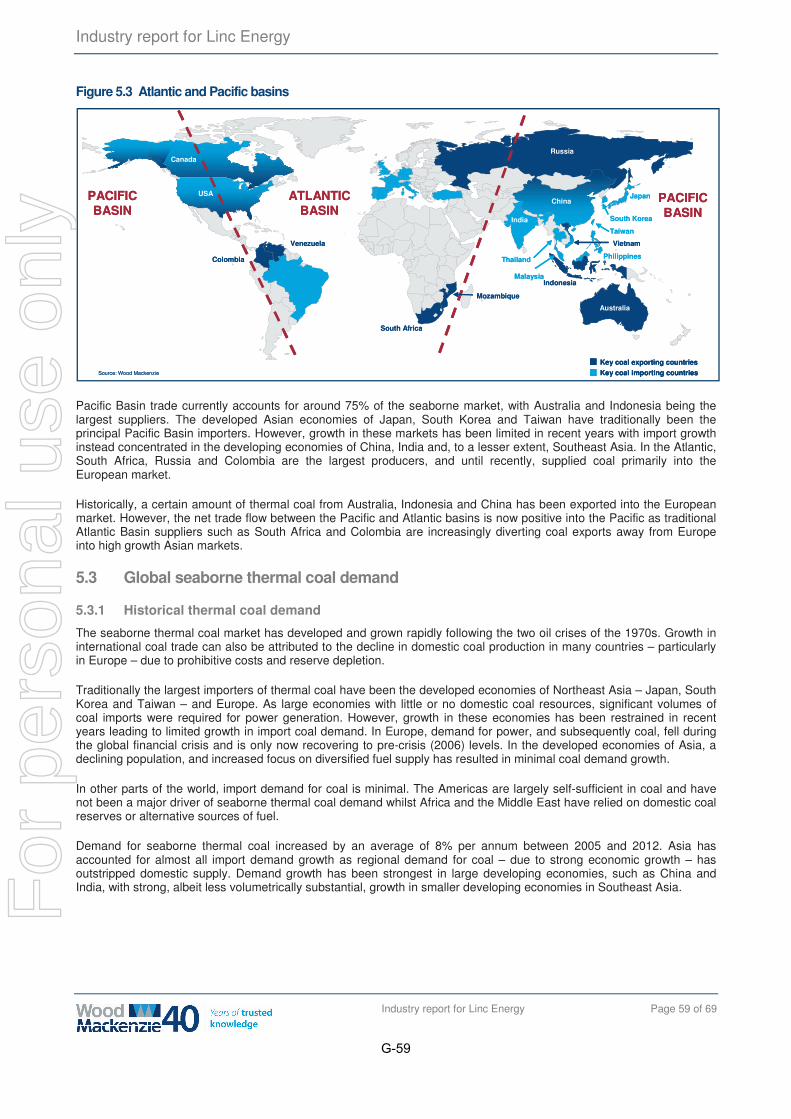
Industry report for Linc Energy
Industry report for Linc Energy Page 59 of 69
Figure 5.3 Atlantic and Pacific basins
Pacific Basin trade currently accounts for around 75% of the seaborne market, with Australia and Indonesia being the largest suppliers. The developed Asian economies of Japan, South Korea and Taiwan have traditionally been the principal Pacific Basin importers. However, growth in these markets has been limited in recent years with import growth instead concentrated in the developing economies of China, India and, to a lesser extent, Southeast Asia. In the Atlantic, South Africa, Russia and Colombia are the largest producers, and until recently, supplied coal primarily into the European market.
Historically, a certain amount of thermal coal from Australia, Indonesia and China has been exported into the European market. However, the net trade flow between the Pacific and Atlantic basins is now positive into the Pacific as traditional Atlantic Basin suppliers such as South Africa and Colombia are increasingly diverting coal exports away from Europe into high growth Asian markets.
5.3 Global seaborne thermal coal demand
5.3.1 Historical thermal coal demand
The seaborne thermal coal market has developed and grown rapidly following the two oil crises of the 1970s. Growth in international coal trade can also be attributed to the decline in domestic coal production in many countries – particularly in Europe – due to prohibitive costs and reserve depletion.
Traditionally the largest importers of thermal coal have been the developed economies of Northeast Asia – Japan, South Korea and Taiwan – and Europe. As large economies with little or no domestic coal resources, significant volumes of coal imports were required for power generation. However, growth in these economies has been restrained in recent years leading to limited growth in import coal demand. In Europe, demand for power, and subsequently coal, fell during the global financial crisis and is only now recovering to pre-crisis (2006) levels. In the developed economies of Asia, a declining population, and increased focus on diversified fuel supply has resulted in minimal coal demand growth.
In other parts of the world, import demand for coal is minimal. The Americas are largely self-sufficient in coal and have not been a major driver of seaborne thermal coal demand whilst Africa and the Middle East have relied on domestic coal reserves or alternative sources of fuel.
Demand for seaborne thermal coal increased by an average of 8% per annum between 2005 and 2012. Asia has accounted for almost all import demand growth as regional demand for coal – due to strong economic growth – has outstripped domestic supply. Demand growth has been strongest in large developing economies, such as China and India, with strong, albeit less volumetrically substantial, growth in smaller developing economies in Southeast Asia.
Key coal exporting countriesKey coal importing countries
South Africa
Indonesia
Russia
Australia
Colombia
China
India
Taiwan
South Korea
Japan
Venezuela
Philippines
Malaysia
PACIFICBASIN
PACIFICBASIN
ATLANTICBASIN
Canada
USA
Mozambique
Thailand
Vietnam
Source: Wood Mackenzie
Key coal exporting countriesKey coal importing countriesKey coal exporting countriesKey coal importing countries
South Africa
Indonesia
Russia
Australia
Colombia
China
India
Taiwan
South Korea
Japan
Venezuela
Philippines
Malaysia
PACIFICBASIN
PACIFICBASIN
ATLANTICBASIN
Canada
USA
Mozambique
Thailand
Vietnam
Source: Wood Mackenzie
G-59
For
per
sona
l use
onl
y
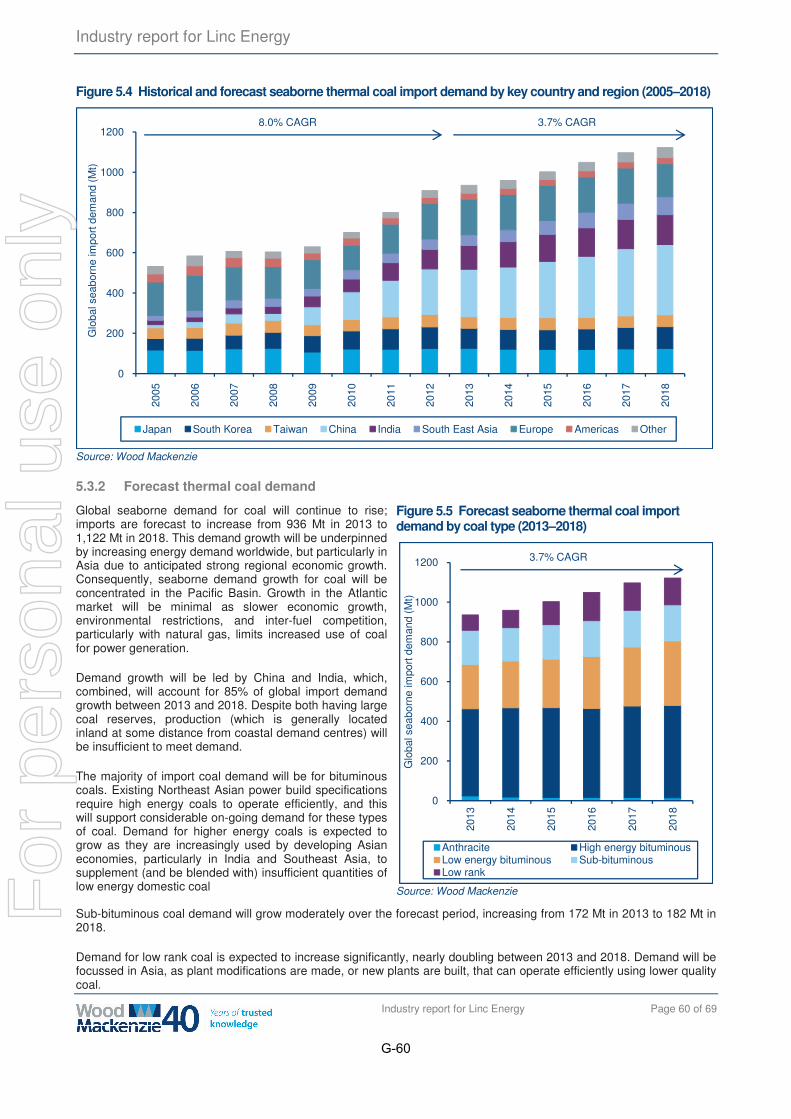
Industry report for Linc Energy
Industry report for Linc Energy Page 60 of 69
Figure 5.4 Historical and forecast seaborne thermal coal import demand by key country and region (2005–2018)
Source: Wood Mackenzie
5.3.2 Forecast thermal coal demand
Global seaborne demand for coal will continue to rise; imports are forecast to increase from 936 Mt in 2013 to 1,122 Mt in 2018. This demand growth will be underpinned by increasing energy demand worldwide, but particularly in Asia due to anticipated strong regional economic growth. Consequently, seaborne demand growth for coal will be concentrated in the Pacific Basin. Growth in the Atlantic market will be minimal as slower economic growth, environmental restrictions, and inter-fuel competition, particularly with natural gas, limits increased use of coal for power generation.
Demand growth will be led by China and India, which, combined, will account for 85% of global import demand growth between 2013 and 2018. Despite both having large coal reserves, production (which is generally located inland at some distance from coastal demand centres) will be insufficient to meet demand.
The majority of import coal demand will be for bituminous coals. Existing Northeast Asian power build specifications require high energy coals to operate efficiently, and this will support considerable on-going demand for these types of coal. Demand for higher energy coals is expected to grow as they are increasingly used by developing Asian economies, particularly in India and Southeast Asia, to supplement (and be blended with) insufficient quantities of low energy domestic coal
Figure 5.5 Forecast seaborne thermal coal import demand by coal type (2013–2018)
Source: Wood Mackenzie
Sub-bituminous coal demand will grow moderately over the forecast period, increasing from 172 Mt in 2013 to 182 Mt in 2018.
Demand for low rank coal is expected to increase significantly, nearly doubling between 2013 and 2018. Demand will be focussed in Asia, as plant modifications are made, or new plants are built, that can operate efficiently using lower quality coal.
0
200
400
600
800
1000
1200
2005
2006
2007
2008
2009
2010
2011
2012
2013
2014
2015
2016
2017
2018
Glo
bal s
eabo
rne
impo
rt d
eman
d (M
t)
Japan South Korea Taiwan China India South East Asia Europe Americas Other
8.0% CAGR 3.7% CAGR
0
200
400
600
800
1000
1200
2013
2014
2015
2016
2017
2018
Glo
bal s
eabo
rne
impo
rt d
eman
d (M
t)
Anthracite High energy bituminousLow energy bituminous Sub-bituminousLow rank
3.7% CAGR
G-60
For
per
sona
l use
onl
y
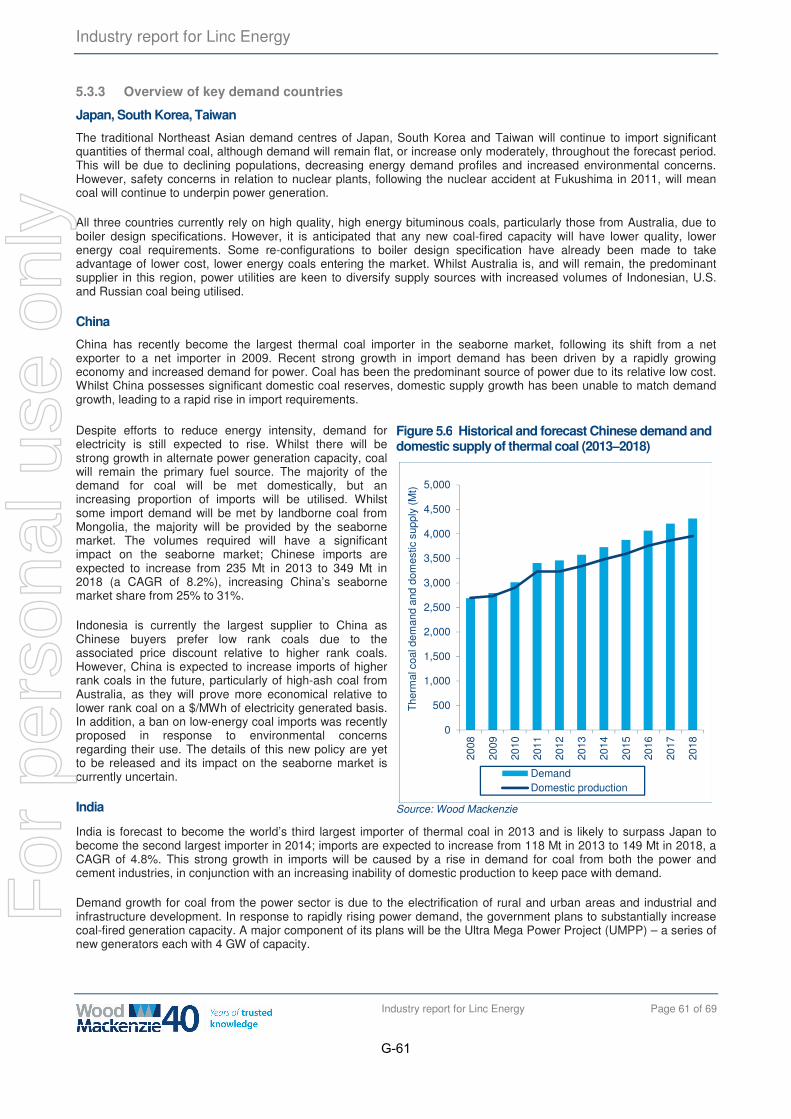
Industry report for Linc Energy
Industry report for Linc Energy Page 61 of 69
5.3.3 Overview of key demand countries
Japan, South Korea, Taiwan
The traditional Northeast Asian demand centres of Japan, South Korea and Taiwan will continue to import significant quantities of thermal coal, although demand will remain flat, or increase only moderately, throughout the forecast period. This will be due to declining populations, decreasing energy demand profiles and increased environmental concerns. However, safety concerns in relation to nuclear plants, following the nuclear accident at Fukushima in 2011, will mean coal will continue to underpin power generation.
All three countries currently rely on high quality, high energy bituminous coals, particularly those from Australia, due to boiler design specifications. However, it is anticipated that any new coal-fired capacity will have lower quality, lower energy coal requirements. Some re-configurations to boiler design specification have already been made to take advantage of lower cost, lower energy coals entering the market. Whilst Australia is, and will remain, the predominant supplier in this region, power utilities are keen to diversify supply sources with increased volumes of Indonesian, U.S. and Russian coal being utilised.
China
China has recently become the largest thermal coal importer in the seaborne market, following its shift from a net exporter to a net importer in 2009. Recent strong growth in import demand has been driven by a rapidly growing economy and increased demand for power. Coal has been the predominant source of power due to its relative low cost. Whilst China possesses significant domestic coal reserves, domestic supply growth has been unable to match demand growth, leading to a rapid rise in import requirements.
Despite efforts to reduce energy intensity, demand for electricity is still expected to rise. Whilst there will be strong growth in alternate power generation capacity, coal will remain the primary fuel source. The majority of the demand for coal will be met domestically, but an increasing proportion of imports will be utilised. Whilst some import demand will be met by landborne coal from Mongolia, the majority will be provided by the seaborne market. The volumes required will have a significant impact on the seaborne market; Chinese imports are expected to increase from 235 Mt in 2013 to 349 Mt in 2018 (a CAGR of 8.2%), increasing China’s seaborne market share from 25% to 31%.
Indonesia is currently the largest supplier to China as Chinese buyers prefer low rank coals due to the associated price discount relative to higher rank coals. However, China is expected to increase imports of higher rank coals in the future, particularly of high-ash coal from Australia, as they will prove more economical relative to lower rank coal on a $/MWh of electricity generated basis. In addition, a ban on low-energy coal imports was recently proposed in response to environmental concerns regarding their use. The details of this new policy are yet to be released and its impact on the seaborne market is currently uncertain.
India
Figure 5.6 Historical and forecast Chinese demand and domestic supply of thermal coal (2013–2018)
Source: Wood Mackenzie
India is forecast to become the world’s third largest importer of thermal coal in 2013 and is likely to surpass Japan to become the second largest importer in 2014; imports are expected to increase from 118 Mt in 2013 to 149 Mt in 2018, a CAGR of 4.8%. This strong growth in imports will be caused by a rise in demand for coal from both the power and cement industries, in conjunction with an increasing inability of domestic production to keep pace with demand.
Demand growth for coal from the power sector is due to the electrification of rural and urban areas and industrial and infrastructure development. In response to rapidly rising power demand, the government plans to substantially increase coal-fired generation capacity. A major component of its plans will be the Ultra Mega Power Project (UMPP) – a series of new generators each with 4 GW of capacity.
0
500
1,000
1,500
2,000
2,500
3,000
3,500
4,000
4,500
5,000
2008
2009
2010
2011
2012
2013
2014
2015
2016
2017
2018
The
rmal
coa
l dem
and
and
dom
estic
sup
ply
(Mt)
DemandDomestic production
G-61
For
per
sona
l use
onl
y
Industry report for Linc Energy
Industry report for Linc Energy Page 62 of 69
Demand for coal from non-power sources, particularly cement, is also expected to increase. Indian cement plants will rely heavily on imports to meet their coal demand requirements as they are generally located on the coast, far from domestic mines.
Like China, India possesses significant thermal coal resources but development has been unable to keep pace with rising demand, leading to an increased import requirement. Inadequate domestic production has been caused by a variety of issues including; legal issues (e.g. environmental constraints, land use conflict), bureaucratic delays, depleted reserves, and declining coal quality.
A number of other factors will underpin increased imports including; the need to blend high quality coal with lower quality domestic coal; the geographic separation between new power plant build along the coast and inland domestic coal production; and equity ownership by Indian power companies in coal mines abroad.
India will import both high and low energy thermal coal. The former to inland power plants as part of a blend to overcome low energy domestic coal, and the latter to coastal power plants that have limited access to domestic supply. Indonesia is currently the largest supplier of thermal to India followed by South Africa. These two countries will continue to dominate India’s import market through to 2018.
Southeast Asia
Import demand from developing Southeast Asian economies (particularly Malaysia, Thailand, the Philippines and Vietnam) is expected to grow rapidly, albeit from a smaller base than the larger Asian economies of China and India. Total seaborne imports are expected to increase from 53 Mt in 2013 to 88 Mt in 2018, a CAGR of 10.7%.
These Southeast Asian countries are at different stages in the development cycle but are all fast growing economies characterised by growing manufacturing and/or construction industries. To support aggressive GDP growth targets, power consumption will increase substantially. As domestic gas reserves are depleted, coal-fired generation is expected to increase its share of the fuel mix as the cheapest form of electricity production. Thailand has placed greater emphasis on meeting energy requirements via alternative fuels due to strong anti-coal sentiment. However, the pressure to reduce fuel costs will mean Thailand has few alternatives but to use coal-fired generation in the longer term to meet power demand growth.
The Southeast Asian economies will utilise domestic coal reserves but production will be inadequate to meet demand growth. Due to its close proximity and relative freight advantage, Indonesia is the primary supplier to the region. The majority of imports are sub-bituminous coals but there will be increasing volumes of higher energy coals from Indonesia, Australia and South Africa.
Europe
In Europe, low economic growth coupled with decreasing energy intensity, will translate into minimal growth in energy demand and declining coal demand for power generation. Whilst small increases in the use of coal in Turkey and Germany are forecast, developed European economies are transitioning away from the use of thermal coal in response to increasing anti-coal sentiment. Increased regulations that reduce the cost incentives for new coal-fired build – based on sulphur and carbon dioxide – and concurrent financial support for the development of renewable energy sources will be common. This will result in a steady decline in installed coal-fired generation capacity as existing plants retire and are replaced by alternative sources of power generation such as gas and renewables.
5.4 Global seaborne thermal coal supply
5.4.1 Historical thermal coal supply
Supply of coal to the seaborne market has traditionally been dominated by six countries: Australia, Indonesia, South Africa, China, Colombia and Russia. However, rampant economic growth in China has seen Chinese demand outstrip domestic supply, and China became a net importer of coal in 2009.
Seaborne thermal coal supply has increased in line with demand over the past eight years, supported largely by increased production from the Pacific Basin suppliers Indonesia and Australia.
Indonesia has been the largest exporter of thermal coal since 2005 and strong growth of nearly 16% per annum has seen it consolidate its market share from 23% in 2005 to 37% in 2012. This expansion has partly been the result of strong demand growth for lower energy coals – of which Indonesia has abundant reserves – from the developing Asian market.
G-62
For
per
sona
l use
onl
y
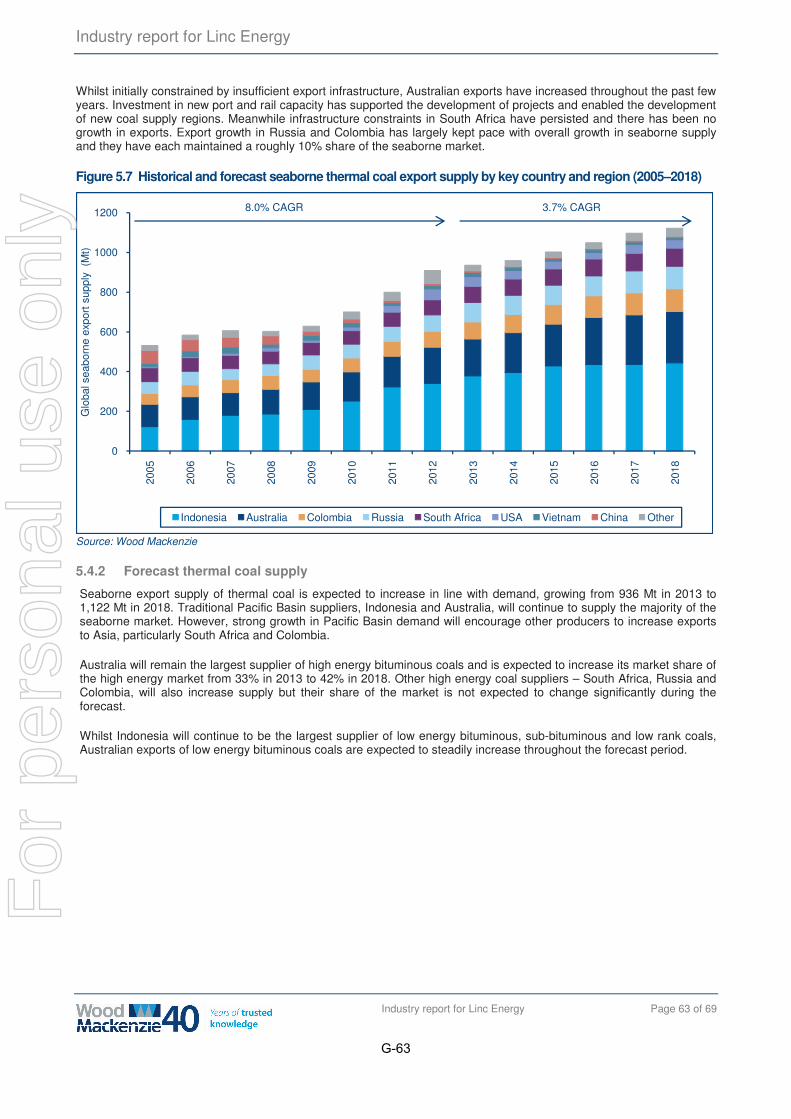
Industry report for Linc Energy
Industry report for Linc Energy Page 63 of 69
Whilst initially constrained by insufficient export infrastructure, Australian exports have increased throughout the past few years. Investment in new port and rail capacity has supported the development of projects and enabled the development of new coal supply regions. Meanwhile infrastructure constraints in South Africa have persisted and there has been no growth in exports. Export growth in Russia and Colombia has largely kept pace with overall growth in seaborne supply and they have each maintained a roughly 10% share of the seaborne market.
Figure 5.7 Historical and forecast seaborne thermal coal export supply by key country and region (2005–2018)
Source: Wood Mackenzie
5.4.2 Forecast thermal coal supply
Seaborne export supply of thermal coal is expected to increase in line with demand, growing from 936 Mt in 2013 to 1,122 Mt in 2018. Traditional Pacific Basin suppliers, Indonesia and Australia, will continue to supply the majority of the seaborne market. However, strong growth in Pacific Basin demand will encourage other producers to increase exports to Asia, particularly South Africa and Colombia.
Australia will remain the largest supplier of high energy bituminous coals and is expected to increase its market share of the high energy market from 33% in 2013 to 42% in 2018. Other high energy coal suppliers – South Africa, Russia and Colombia, will also increase supply but their share of the market is not expected to change significantly during the forecast.
Whilst Indonesia will continue to be the largest supplier of low energy bituminous, sub-bituminous and low rank coals, Australian exports of low energy bituminous coals are expected to steadily increase throughout the forecast period.
0
200
400
600
800
1000
1200
2005
2006
2007
2008
2009
2010
2011
2012
2013
2014
2015
2016
2017
2018
Glo
bal s
eabo
rne
expo
rt s
uppl
y (
Mt)
Indonesia Australia Colombia Russia South Africa USA Vietnam China Other
8.0% CAGR 3.7% CAGR
G-63
For
per
sona
l use
onl
y
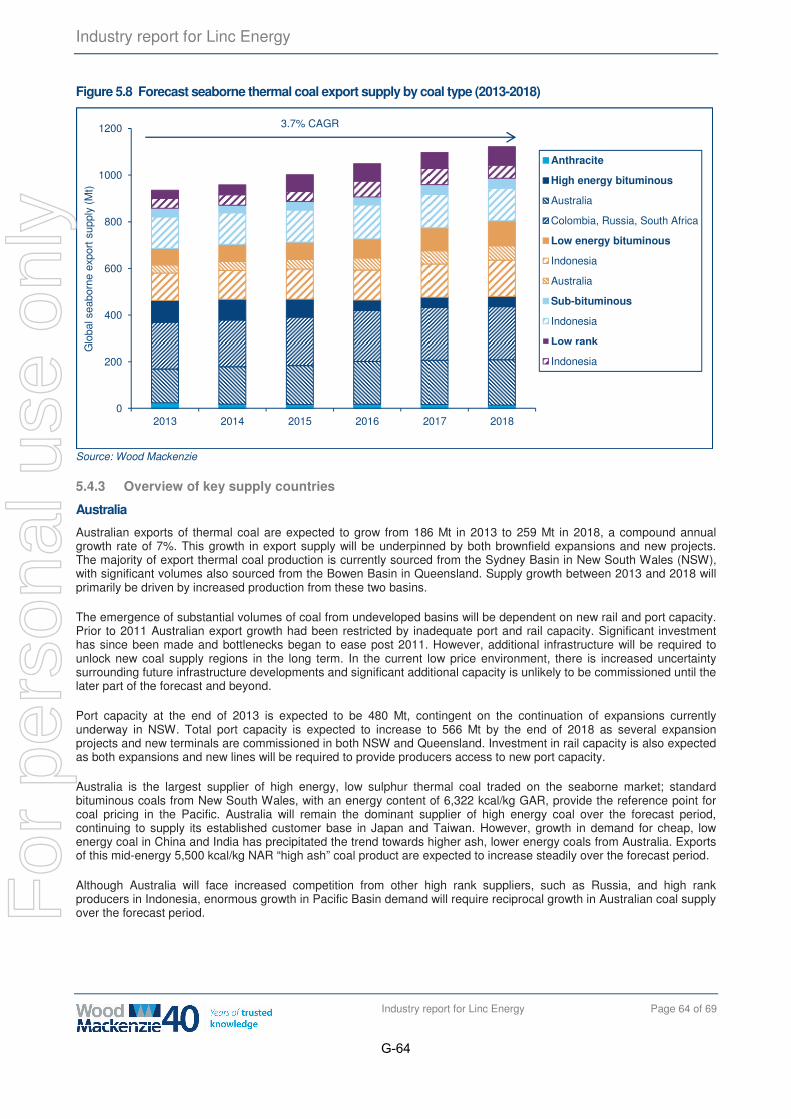
Industry report for Linc Energy
Industry report for Linc Energy Page 64 of 69
Figure 5.8 Forecast seaborne thermal coal export supply by coal type (2013-2018)
Source: Wood Mackenzie
5.4.3 Overview of key supply countries
Australia
Australian exports of thermal coal are expected to grow from 186 Mt in 2013 to 259 Mt in 2018, a compound annual growth rate of 7%. This growth in export supply will be underpinned by both brownfield expansions and new projects. The majority of export thermal coal production is currently sourced from the Sydney Basin in New South Wales (NSW), with significant volumes also sourced from the Bowen Basin in Queensland. Supply growth between 2013 and 2018 will primarily be driven by increased production from these two basins.
The emergence of substantial volumes of coal from undeveloped basins will be dependent on new rail and port capacity. Prior to 2011 Australian export growth had been restricted by inadequate port and rail capacity. Significant investment has since been made and bottlenecks began to ease post 2011. However, additional infrastructure will be required to unlock new coal supply regions in the long term. In the current low price environment, there is increased uncertainty surrounding future infrastructure developments and significant additional capacity is unlikely to be commissioned until the later part of the forecast and beyond.
Port capacity at the end of 2013 is expected to be 480 Mt, contingent on the continuation of expansions currently underway in NSW. Total port capacity is expected to increase to 566 Mt by the end of 2018 as several expansion projects and new terminals are commissioned in both NSW and Queensland. Investment in rail capacity is also expected as both expansions and new lines will be required to provide producers access to new port capacity.
Australia is the largest supplier of high energy, low sulphur thermal coal traded on the seaborne market; standard bituminous coals from New South Wales, with an energy content of 6,322 kcal/kg GAR, provide the reference point for coal pricing in the Pacific. Australia will remain the dominant supplier of high energy coal over the forecast period, continuing to supply its established customer base in Japan and Taiwan. However, growth in demand for cheap, low energy coal in China and India has precipitated the trend towards higher ash, lower energy coals from Australia. Exports of this mid-energy 5,500 kcal/kg NAR “high ash” coal product are expected to increase steadily over the forecast period.
Although Australia will face increased competition from other high rank suppliers, such as Russia, and high rank producers in Indonesia, enormous growth in Pacific Basin demand will require reciprocal growth in Australian coal supply over the forecast period.
0
200
400
600
800
1000
1200
2013 2014 2015 2016 2017 2018
Glo
bal s
eabo
rne
expo
rt s
uppl
y (M
t)
Anthracite
High energy bituminous
Australia
Colombia, Russia, South Africa
Low energy bituminous
Indonesia
Australia
Sub-bituminous
Indonesia
Low rank
Indonesia
3.7% CAGR
G-64
For
per
sona
l use
onl
y
Industry report for Linc Energy
Industry report for Linc Energy Page 65 of 69
Indonesia
Indonesia will remain the largest supplier of thermal coal throughout the forecast period, accounting for around 40% of the seaborne market. Growth in Indonesian exports will be driven by lower energy coal types, with most low rank coal exports destined for China and India, and smaller but increasing volumes shipped to other developing Asian countries.
Short term growth in Indonesian exports will be supported by their low cost structure on both an FOB and a delivered basis. In the longer term, as new supply regions are developed further inland, producers will face higher mining and transport costs and the competitive edge of some Indonesian producers will be lost.
Besides changes in seaborne trade flows, Indonesian export capability could also be limited by growth in domestic coal consumption and regulation. Regulatory issues have always plagued the Indonesian coal industry and there has been on-going ambiguity about the potential introduction of a low rank coal export ban. Whilst the government has clarified that there will not be an export ban, they have not ruled out introducing production quotas instead. In addition, the government has acknowledged the importance of a reliable domestic coal supply and requires coal producers to set aside a portion of their production for domestic sales. This is known as the Domestic Market Obligation (DMO). Wood Mackenzie does not expect that domestic demand will impede Indonesian exports in the near term but as domestic demand grows, and DMO increases in-line with demand, potential export growth may be restricted.
South Africa
South Africa contains vast thermal coal resources, however, significant challenges exist in financing and providing infrastructure to monetise these resources. South African exports have historically been constrained by inadequate rail infrastructure, leaving ports underutilised – particularly Richards Bay. This situation is expected to improve in the short term and it is anticipated that exports will increase from 82 Mt in 2013 to 91 Mt in 2018. Exports will be increasingly oriented away from Europe towards the Pacific market, particularly to India.
Colombia
Colombia is expected to maintain a 10% share of the seaborne market as export production increases from 87 Mt in 2013 to 115 Mt in 2018. Given the ambiguous nature of Colombia’s mining policy, it will be difficult for companies to obtain new mining licences and environmental permits. Consequently, the majority of future growth will be sourced from expansions at existing mines. These operations are located inland and expansion of transport and port infrastructure capacity will be required to accommodate the forecast supply growth. Whilst the government has provided support to mining projects, additional infrastructure capacity will most likely be developed without financial assistance. Europe and South America will continue to be the main destinations for high energy Colombian coal. However, due to their low production costs, and a continuation of low freight costs, shipments to Asia will continue to increase
Russia
Russia is the third largest thermal coal exporter globally, and exports predominantly high energy coal. The majority of reserves are located in south central Russia but only around 36% of its exports enter the Pacific Basin; the rest supplies the European market. An expansion of eastern port capacity will be required to increase access to the growing Asian market. Russian export production growth will be restricted by infrastructure capacity constraints but also reduced investment in projects and increased domestic demand. Due to large transport distances, Russia is a high cost seaborne supplier and capital expenditure on new projects has diminished in response to global economic conditions and lower thermal coal prices.
U.S.
The U.S. is the world’s second largest coal producer, but most of this is consumed domestically. Distance from Asia historically priced U.S. coal out of the Pacific market, but as Asian demand rises beyond the supply capacity of traditional coal exporters, the U.S. could emerge as a major supplier. To do so, the U.S. would need to put in place new West coast rail and port connectivity, enabling large volumes of sub-bituminous coal from the PRB to reach the Pacific market. Given on-going delays in port permitting, a significant increase in exports is not considered possible until after 2018.
5.4.4 Cost Competitivness
Seaborne coal costs16 of production are typically compared on a Free-on-Board (FOB) basis as this is most commonly the point of sale. The ninetieth percentile on the supply curve is often used as a proxy for the marginal cost of production, representing a price floor below which supply can be expected to ultimately drop out of the market if the low price persists.
16 FOB costs include: mining, coal preparation, transport, overheads, port charges, taxes and royalties.
G-65
For
per
sona
l use
onl
y
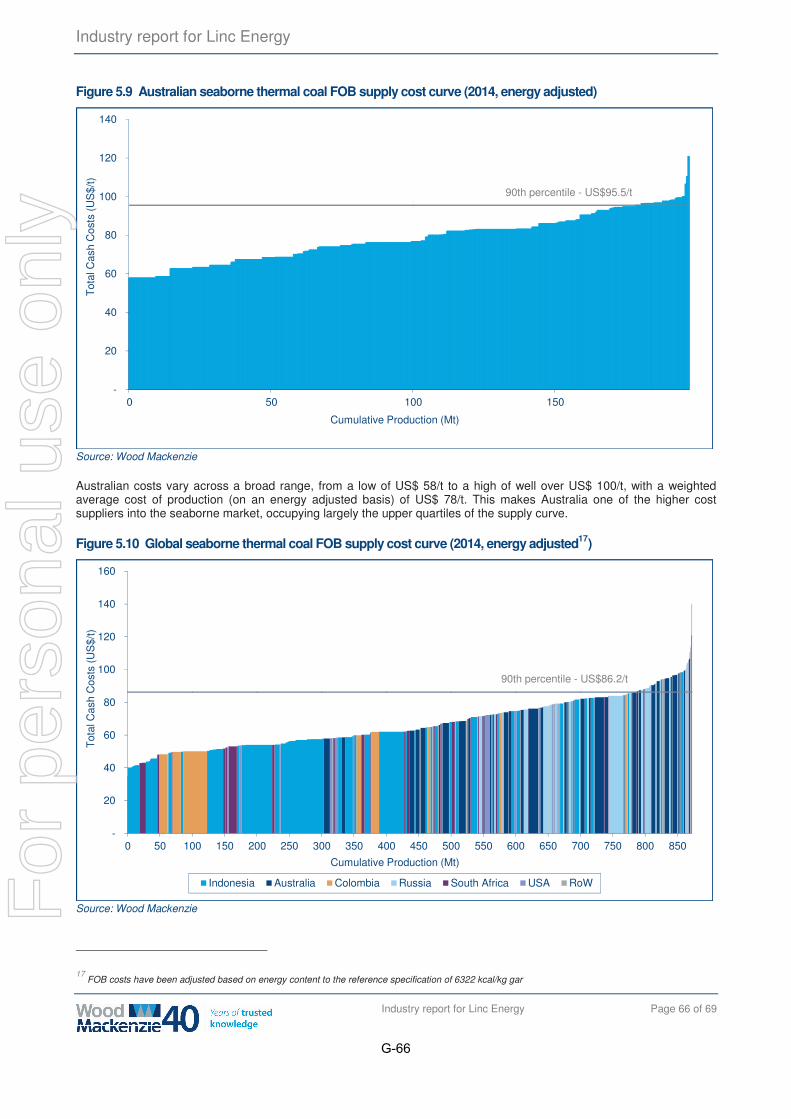
Industry report for Linc Energy
Industry report for Linc Energy Page 66 of 69
Figure 5.9 Australian seaborne thermal coal FOB supply cost curve (2014, energy adjusted)
Source: Wood Mackenzie
Australian costs vary across a broad range, from a low of US$ 58/t to a high of well over US$ 100/t, with a weighted average cost of production (on an energy adjusted basis) of US$ 78/t. This makes Australia one of the higher cost suppliers into the seaborne market, occupying largely the upper quartiles of the supply curve.
Figure 5.10 Global seaborne thermal coal FOB supply cost curve (2014, energy adjusted17)
Source: Wood Mackenzie
17 FOB costs have been adjusted based on energy content to the reference specification of 6322 kcal/kg gar
-
20
40
60
80
100
120
140
0 50 100 150
Tot
al C
ash
Cos
ts (
US
$/t)
Cumulative Production (Mt)
90th percentile - US$95.5/t
-
20
40
60
80
100
120
140
160
0 50 100 150 200 250 300 350 400 450 500 550 600 650 700 750 800 850
Tot
al C
ash
Cos
ts (
US
$/t)
Cumulative Production (Mt)
Indonesia Australia Colombia Russia South Africa USA RoW
90th percentile - US$86.2/t
G-66
For
per
sona
l use
onl
y
Industry report for Linc Energy
Industry report for Linc Energy Page 67 of 69
The competitiveness of Australian coal production has been impacted by high margins in recent years which provided few incentives for scrutiny of mining practices and cost control. Producers instead sought to maximise production to take advantage of high prices. Allied with a boom across the resource sector, this resulted in extreme competition for labour, materials and mining services, which, compounded by a high Australian dollar, caused mining costs to rise substantially. In addition, record levels of capital spending were witnessed in 2011 and 2012 as new projects were commissioned to expand export production capacity.
As prices have fallen and margins have shrunk, operators have been prompted to review costs and have been introducing various cost saving initiatives over the last few months. This has resulted in the closure of some high cost mines, mine plan revisions and expansion delays to preserve capital. Australia’s mines have a relatively high fixed cost structure, with take or pay commitments likely to be a key driver of costs in the short term as mines are forced to pay higher transport and port costs when output volumes fall below capacity or planned expansion levels. Unit cost reductions will be largely achieved by production increases, in an effort to improve returns to scale, but an expected continued depreciation of the Australia dollar will improve the cost competitiveness of Australian coals.
Australian producers have also faced increased regulatory pressures following the introduction of the carbon tax, the Mineral Resources Rent Tax (MRRT) and increased royalty payments as State and Federal Governments sought to increase the returns to taxpayers from the mining boom. The carbon tax, designed to reduce the country’s carbon emissions, has been in operation since July 2012. The impact on most coal mines has been small with gassy underground mines in NSW the most affected. The MRRT is a federal tax based on the profit achieved by the companies and it targets the ‘upstream’ profit from the extraction of the coal prior to processing and transport. The payments under MRRT are highly sensitive to future coal price assumptions and, given the presently subdued margins, the MRRT is unlikely to have a material impact in the short- to mid-term.
Indonesian mines tend to occupy the low quartiles of the global supply curve, even after costs are adjusted for energy content. Their competitiveness is based on a combination of factors: inexpensive surface mining operations, an extensive system of natural inland waterways enabling low cost-barging from mine to port, the use of transhipment facilities that have lower capital and operating costs than coal terminals and low labour costs compared to other Pacific Basin producers. U.S. and Russian mines are largely in the fourth quartile, indicative of often very high transportation costs.
5.5 Seaborne thermal coal prices
The seaborne thermal coal market is reasonably transparent, with prices generally related to agreed reference prices or indices. The reference price for term contracts in the Pacific market have traditionally been based on the prices settled between Australian exporters and the Japanese Power Utilities (JPU). The JPU reference price applies to bituminous coal of “Newcastle benchmark” quality, with a specific energy of 6,322 kcal/kg (gar).
Prior to 2004, the seaborne thermal coal market was closely balanced and buyers had the greater negotiating power. Long term contracts were therefore common – with suppliers willing to discount prices in exchange for off-take security – and there was negligible spot trade. This period was characterised by regular prices cycles within a narrow band of around US$25 to 40/tonne (FOB) for Newcastle benchmark coal, with prices related to the marginal cost of production. In 2004 the market entered a period of unprecedented volatility due to increased demand coupled with a slow supply-side response, and the emergence of significant spot trading. Spot prices reached unprecedented highs of almost US$ 180/t in 2008 and US$ 130/t in early 2011 following flooding in Queensland, Australia. With the advent of published spot price indices for thermal coal, index-linked pricing for both spot and term contracts has now become common practice and there is a growing financial market for coal products. However, the volume of coal traded on the thermal coal spot market remains small in comparison to the contracted market.
Prices for Indonesian sub-bituminous and low rank coal are linked to the Newcastle benchmark price and domestic coastal Chinese prices. Since the introduction of Indonesia’s new mining law in 2009, the Indonesian government also publishes its own monthly coal reference price, the Harga Batubara Acuan (HBA). The ‘headline’ HBA for Newcastle benchmark quality coal is calculated based on a basket of spot price indices, with minimum prices for Indonesian export brands then calculated by applying quality-based adjustments for energy, moisture, ash and sulphur. These minimum prices are used to calculate the royalty payments for each producer. The aim of the regulation is to protect the government’s royalty take by preventing transfer pricing (selling to a subsidiary at below market price). In theory this market-driven approach should also mean that producers are more or less indifferent to selling into either domestic or export markets, guaranteeing more secure access to supply for domestic consumers.
Following the recent rise in demand, particularly by Chinese and Indian buyers, for low cost coals, there has been increased interest in mid-energy coals produced in Australia. A “high ash” 5,500 kcal/kg NAR benchmark has emerged and has rapidly become a key price indicator as exports of this non-traditional coal have increased.
G-67
For
per
sona
l use
onl
y
Industry report for Linc Energy
Industry report for Linc Energy Page 68 of 69
Figure 5.11 Historical and forecast FOB prices for key thermal coal brands (nominal, 2008–2018)
Source: Wood Mackenzie
The JPU settlement price in April 2013 was US$95/t, US$20/t lower than the JFY 2012–2013 settlement price. Whilst demand for coal has been growing continuously, especially in the Pacific Basin, there has been an excess of thermal coal supply in many regions of the world. In Australia this has been the result of additional capacity coming on line and enforced take-or-pay contracts which are causing some miners to elect to produce large volumes in order to increase productivity and lower costs. In Indonesia, low rank coal producers are reluctant to give up even very low margin potential by lowering production, whilst producers in the U.S. are also aggressively exploring export opportunities as domestic regulations force the closure of numerous coal-fired power plants.
Global oversupply is expected to peak by 2017, as slowing export growth coupled with continued Asian demand growth, act together to reduce the supply surplus, with a modest recovery in price ensuing. Although the reduction in oversupply will be significant, the market will remain in excess, meaning that prices are not expected to recover to 2011 levels (in real terms) until well beyond 2018.
For and on behalf of
Wood Mackenzie (Australia) Pty Ltd
_________________________
18 November 2013
Gero Farruggio
Director
$0
$20
$40
$60
$80
$100
$120
$140
2005
2006
2007
2008
2009
2010
2011
2012
2013
2014
2015
2016
2017
2018
US
$/t
FOB Newcastle @ 6,322 kcal/kg GAR FOB HA Newcastle@ 5,500 kcal/kg NAR
FOB Indonesia EnviroCoal @ 5,000 kcal/kg GAR FOB Indonesia EcoCoal @ 4,200 kcal/kg GAR
Historical Forecast
G-68
For
per
sona
l use
onl
y
Industry report for Linc Energy
Industry report for Linc Energy Page 69 of 69
All the information and data presented in this section, including the analysis of the global oil and gas market, underground coal gasification, and seaborne thermal coal market has been provided by our energy industry consultant, Wood Mackenzie. Wood Mackenzie has advised that the statistical and graphical information contained herein is drawn from its database and other publicly available sources. In connection therewith, Wood Mackenzie has advised that:
(i) certain information in Wood Mackenzie’s database is derived from estimates or subjective judgments; (ii) the information in the databases of other data collection agencies may differ from the information in
Wood Mackenzie’s database; and (iii) while Wood Mackenzie has taken reasonable care in the compilation of the statistical and graphical
information and believes it to be accurate and correct, data compilation is subject to limited audit and validation procedures.
Wood Mackenzie’s methodologies for collection of information and data are proprietary, and therefore the information discussed in this section, may differ from that of other sources. The information and data presented in this section has not been independently verified and neither we nor the Joint Issue Managers, Global Coordinators, Bookrunners and Underwriters make any representation as to the accuracy or completeness of such data or any assumptions relied upon thereon. See “Forward-Looking Statements” and “Experts” which are included elsewhere in this offering document.
G-69
For
per
sona
l use
onl
y

[THIS PAGE INTENTIONALLY LEFT BLANK]
For
per
sona
l use
onl
y
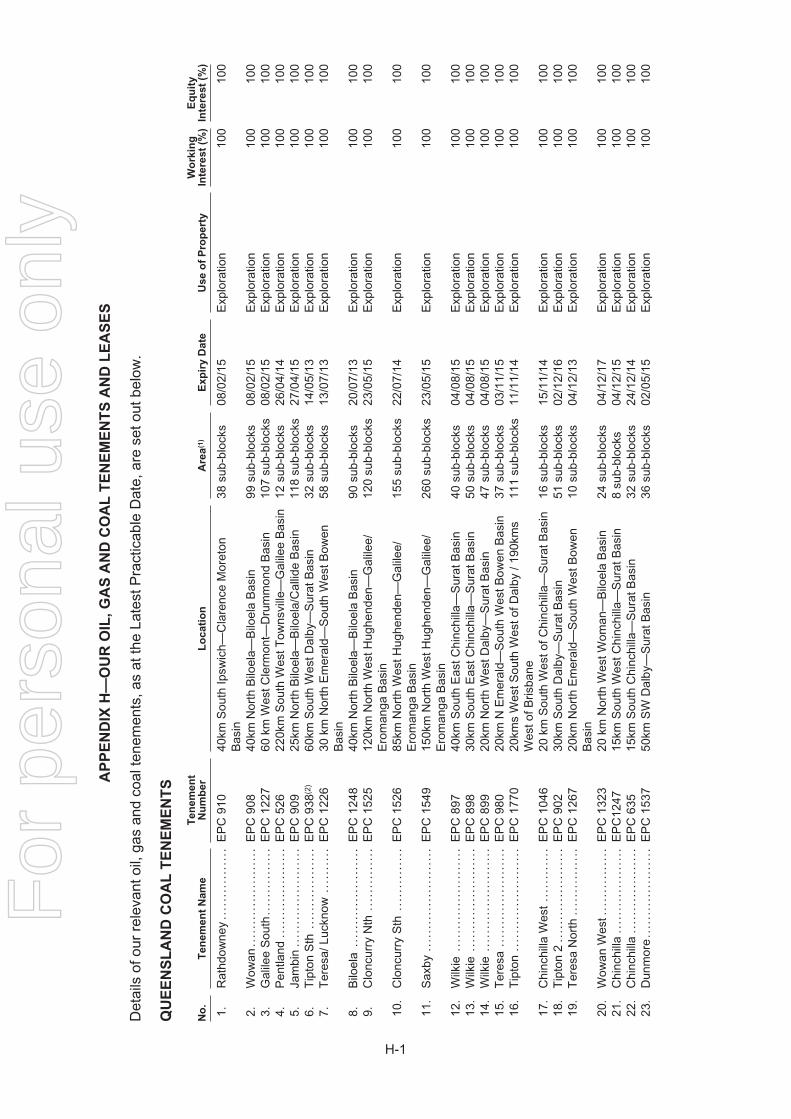
AP
PE
ND
IXH
—O
UR
OIL
,G
AS
AN
DC
OA
LT
EN
EM
EN
TS
AN
DL
EA
SE
S
Det
ails
ofou
rre
leva
ntoi
l,ga
san
dco
alte
nem
ents
,as
atth
eLa
test
Pra
ctic
able
Dat
e,ar
ese
tout
belo
w.
QU
EE
NS
LA
ND
CO
AL
TE
NE
ME
NT
S
No
.T
en
em
en
tN
am
eT
en
em
en
tN
um
ber
Lo
cati
on
Are
a(1
)E
xp
iry
Date
Use
of
Pro
pert
yW
ork
ing
Inte
rest
(%)
Eq
uit
yIn
tere
st
(%)
1.R
athd
owne
y..
....
....
....
..E
PC
910
40km
Sou
thIp
swic
h—C
lare
nce
Mor
eton
Bas
in38
sub-
bloc
ks08
/02/
15E
xplo
ratio
n10
010
0
2.W
owan
....
....
....
....
....
..E
PC
908
40km
Nor
thB
iloel
a—B
iloel
aB
asin
99su
b-bl
ocks
08/0
2/15
Exp
lora
tion
100
100
3.G
alile
eS
outh
....
....
....
...
EP
C12
2760
kmW
estC
lerm
ont—
Dru
mm
ond
Bas
in10
7su
b-bl
ocks
08/0
2/15
Exp
lora
tion
100
100
4.P
entla
nd..
....
....
....
....
..E
PC
526
220k
mS
outh
Wes
tTow
nsvi
lle—
Gal
ilee
Bas
in12
sub-
bloc
ks26
/04/
14E
xplo
ratio
n10
010
05.
Jam
bin
....
....
....
....
....
..E
PC
909
25km
Nor
thB
iloel
a—B
iloel
a/C
allid
eB
asin
118
sub-
bloc
ks27
/04/
15E
xplo
ratio
n10
010
06.
Tip
ton
Sth
....
....
....
....
..E
PC
938(
2)60
kmS
outh
Wes
tDal
by—
Sur
atB
asin
32su
b-bl
ocks
14/0
5/13
Exp
lora
tion
100
100
7.T
eres
a/Lu
ckno
w..
....
....
EP
C12
2630
kmN
orth
Em
eral
d—S
outh
Wes
tBow
enB
asin
58su
b-bl
ocks
13/0
7/13
Exp
lora
tion
100
100
8.B
iloel
a..
....
....
....
....
....
EP
C12
4840
kmN
orth
Bilo
ela—
Bilo
ela
Bas
in90
sub-
bloc
ks20
/07/
13E
xplo
ratio
n10
010
09.
Clo
ncur
ryN
th..
....
....
....
EP
C15
2512
0km
Nor
thW
estH
ughe
nden
—G
alile
e/E
rom
anga
Bas
in12
0su
b-bl
ocks
23/0
5/15
Exp
lora
tion
100
100
10.
Clo
ncur
ryS
th..
....
....
....
EP
C15
2685
kmN
orth
Wes
tHug
hend
en—
Gal
ilee/
Ero
man
gaB
asin
155
sub-
bloc
ks22
/07/
14E
xplo
ratio
n10
010
0
11.
Sax
by..
....
....
....
....
....
.E
PC
1549
150k
mN
orth
Wes
tHug
hend
en—
Gal
ilee/
Ero
man
gaB
asin
260
sub-
bloc
ks23
/05/
15E
xplo
ratio
n10
010
0
12.
Wilk
ie..
....
....
....
....
....
.E
PC
897
40km
Sou
thE
astC
hinc
hilla
—S
urat
Bas
in40
sub-
bloc
ks04
/08/
15E
xplo
ratio
n10
010
013
.W
ilkie
....
....
....
....
....
...
EP
C89
830
kmS
outh
Eas
tChi
nchi
lla—
Sur
atB
asin
50su
b-bl
ocks
04/0
8/15
Exp
lora
tion
100
100
14.
Wilk
ie..
....
....
....
....
....
.E
PC
899
20km
Nor
thW
estD
alby
—S
urat
Bas
in47
sub-
bloc
ks04
/08/
15E
xplo
ratio
n10
010
015
.T
eres
a..
....
....
....
....
....
EP
C98
020
kmN
Em
eral
d—S
outh
Wes
tBow
enB
asin
37su
b-bl
ocks
03/1
1/15
Exp
lora
tion
100
100
16.
Tip
ton
....
....
....
....
....
...
EP
C17
7020
kms
Wes
tSou
thW
esto
fDal
by/1
90km
sW
esto
fBris
bane
111
sub-
bloc
ks11
/11/
14E
xplo
ratio
n10
010
0
17.
Chi
nchi
llaW
est
....
....
....
EP
C10
4620
kmS
outh
Wes
tofC
hinc
hilla
—S
urat
Bas
in16
sub-
bloc
ks15
/11/
14E
xplo
ratio
n10
010
018
.T
ipto
n2
....
....
....
....
....
.E
PC
902
30km
Sou
thD
alby
—S
urat
Bas
in51
sub-
bloc
ks02
/12/
16E
xplo
ratio
n10
010
019
.T
eres
aN
orth
....
....
....
...
EP
C12
6720
kmN
orth
Em
eral
d—S
outh
Wes
tBow
enB
asin
10su
b-bl
ocks
04/1
2/13
Exp
lora
tion
100
100
20.
Wow
anW
est.
....
....
....
..E
PC
1323
20km
Nor
thW
estW
oman
—B
iloel
aB
asin
24su
b-bl
ocks
04/1
2/17
Exp
lora
tion
100
100
21.
Chi
nchi
lla..
....
....
....
....
.E
PC
1247
15km
Sou
thW
estC
hinc
hilla
—S
urat
Bas
in8
sub-
bloc
ks04
/12/
15E
xplo
ratio
n10
010
022
.C
hinc
hilla
....
....
....
....
...
EP
C63
515
kmS
outh
Chi
nchi
lla—
Sur
atB
asin
32su
b-bl
ocks
24/1
2/14
Exp
lora
tion
100
100
23.
Dun
mor
e..
....
....
....
....
..E
PC
1537
50km
SW
Dal
by—
Sur
atB
asin
36su
b-bl
ocks
02/0
5/15
Exp
lora
tion
100
100
H-1
For
per
sona
l use
onl
y
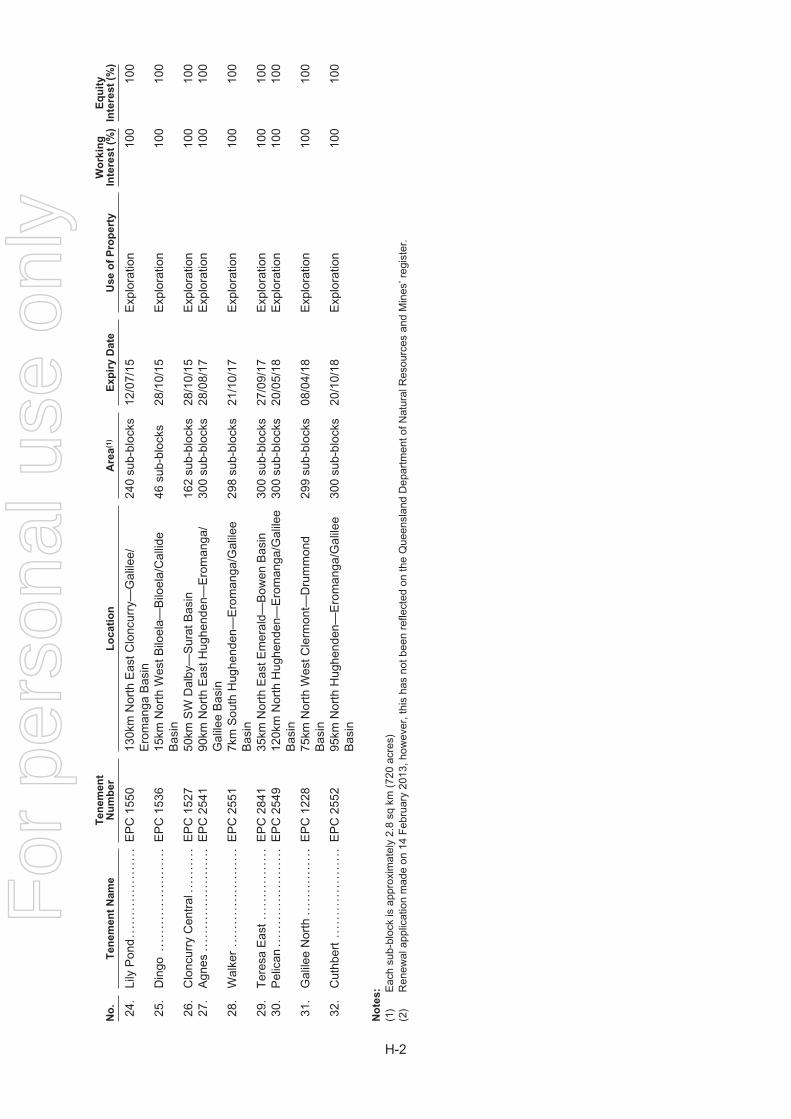
No
.T
en
em
en
tN
am
eT
en
em
en
tN
um
ber
Lo
cati
on
Are
a(1
)E
xp
iry
Date
Use
of
Pro
pert
yW
ork
ing
Inte
rest
(%)
Eq
uit
yIn
tere
st
(%)
24.
Lily
Pon
d..
....
....
....
....
..E
PC
1550
130k
mN
orth
Eas
tClo
ncur
ry—
Gal
ilee/
Ero
man
gaB
asin
240
sub-
bloc
ks12
/07/
15E
xplo
ratio
n10
010
0
25.
Din
go..
....
....
....
....
....
.E
PC
1536
15km
Nor
thW
estB
iloel
a—B
iloel
a/C
allid
eB
asin
46su
b-bl
ocks
28/1
0/15
Exp
lora
tion
100
100
26.
Clo
ncur
ryC
entr
al..
....
....
EP
C15
2750
kmS
WD
alby
—S
urat
Bas
in16
2su
b-bl
ocks
28/1
0/15
Exp
lora
tion
100
100
27.
Agn
es..
....
....
....
....
....
.E
PC
2541
90km
Nor
thE
astH
ughe
nden
—E
rom
anga
/G
alile
eB
asin
300
sub-
bloc
ks28
/08/
17E
xplo
ratio
n10
010
0
28.
Wal
ker
....
....
....
....
....
..E
PC
2551
7km
Sou
thH
ughe
nden
—E
rom
anga
/Gal
ilee
Bas
in29
8su
b-bl
ocks
21/1
0/17
Exp
lora
tion
100
100
29.
Ter
esa
Eas
t..
....
....
....
..E
PC
2841
35km
Nor
thE
astE
mer
ald—
Bow
enB
asin
300
sub-
bloc
ks27
/09/
17E
xplo
ratio
n10
010
030
.P
elic
an..
....
....
....
....
....
EP
C25
4912
0km
Nor
thH
ughe
nden
—E
rom
anga
/Gal
ilee
Bas
in30
0su
b-bl
ocks
20/0
5/18
Exp
lora
tion
100
100
31.
Gal
ilee
Nor
th..
....
....
....
.E
PC
1228
75km
Nor
thW
estC
lerm
ont—
Dru
mm
ond
Bas
in29
9su
b-bl
ocks
08/0
4/18
Exp
lora
tion
100
100
32.
Cut
hber
t..
....
....
....
....
..E
PC
2552
95km
Nor
thH
ughe
nden
—E
rom
anga
/Gal
ilee
Bas
in30
0su
b-bl
ocks
20/1
0/18
Exp
lora
tion
100
100
No
tes
:
(1)
Eac
hsu
b-bl
ock
isap
prox
imat
ely
2.8
sqkm
(720
acre
s)(2
)R
enew
alap
plic
atio
nm
ade
on14
Feb
ruar
y20
13,h
owev
er,t
his
has
notb
een
refle
cted
onth
eQ
ueen
slan
dD
epar
tmen
tofN
atur
alR
esou
rces
and
Min
es’r
egis
ter.
H-2
For
per
sona
l use
onl
y
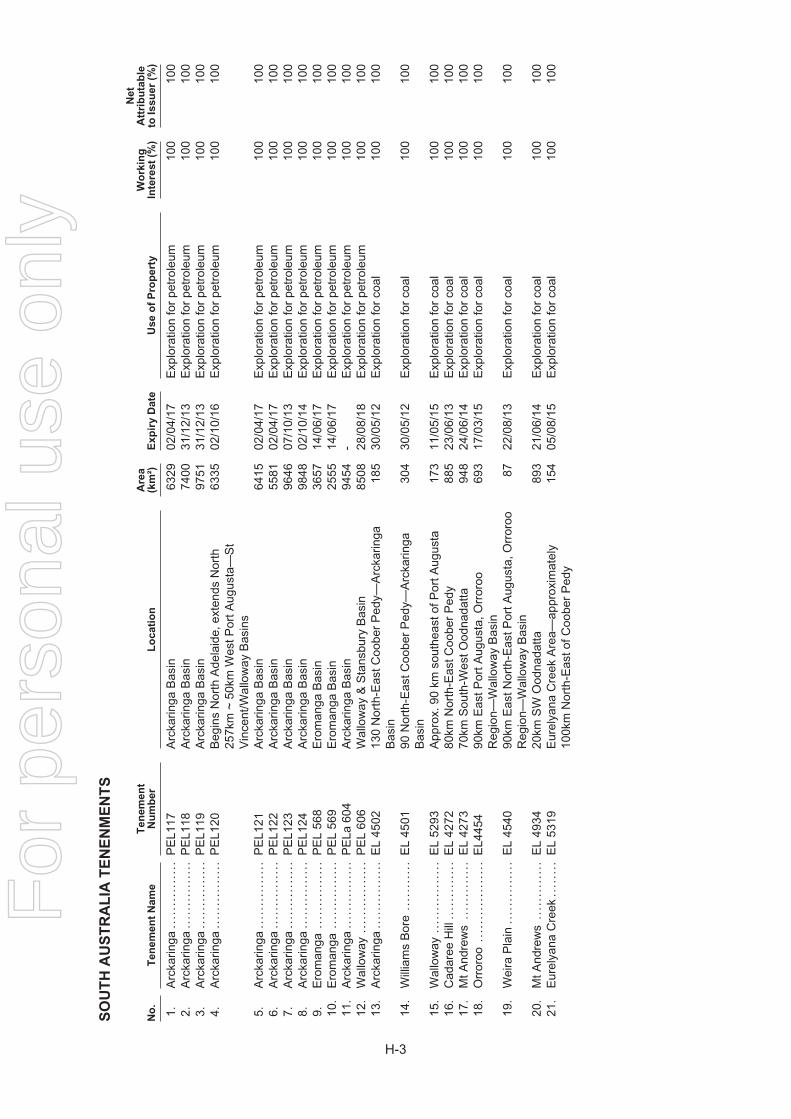
SO
UT
HA
US
TR
AL
IAT
EN
EN
ME
NT
S
No
.T
en
em
en
tN
am
eT
en
em
en
tN
um
ber
Lo
cati
on
Are
a(k
m²)
Ex
pir
yD
ate
Use
of
Pro
pert
yW
ork
ing
Inte
rest
(%)
Net
Att
rib
uta
ble
toIs
su
er
(%)
1.A
rcka
ringa
....
....
....
...
PE
L117
Arc
karin
gaB
asin
6329
02/0
4/17
Exp
lora
tion
for
petr
oleu
m10
010
02.
Arc
karin
ga..
....
....
....
.P
EL1
18A
rcka
ringa
Bas
in74
0031
/12/
13E
xplo
ratio
nfo
rpe
trol
eum
100
100
3.A
rcka
ringa
....
....
....
...
PE
L119
Arc
karin
gaB
asin
9751
31/1
2/13
Exp
lora
tion
for
petr
oleu
m10
010
04.
Arc
karin
ga..
....
....
....
.P
EL1
20B
egin
sN
orth
Ade
laid
e,ex
tend
sN
orth
257k
m~
50km
Wes
tPor
tAug
usta
—S
tV
ince
nt/W
allo
way
Bas
ins
6335
02/1
0/16
Exp
lora
tion
for
petr
oleu
m10
010
0
5.A
rcka
ringa
....
....
....
...
PE
L121
Arc
karin
gaB
asin
6415
02/0
4/17
Exp
lora
tion
for
petr
oleu
m10
010
06.
Arc
karin
ga..
....
....
....
.P
EL1
22A
rcka
ringa
Bas
in55
8102
/04/
17E
xplo
ratio
nfo
rpe
trol
eum
100
100
7.A
rcka
ringa
....
....
....
...
PE
L123
Arc
karin
gaB
asin
9646
07/1
0/13
Exp
lora
tion
for
petr
oleu
m10
010
08.
Arc
karin
ga..
....
....
....
.P
EL1
24A
rcka
ringa
Bas
in98
4802
/10/
14E
xplo
ratio
nfo
rpe
trol
eum
100
100
9.E
rom
anga
....
....
....
...
PE
L56
8E
rom
anga
Bas
in36
5714
/06/
17E
xplo
ratio
nfo
rpe
trol
eum
100
100
10.
Ero
man
ga..
....
....
....
.P
EL
569
Ero
man
gaB
asin
2555
14/0
6/17
Exp
lora
tion
for
petr
oleu
m10
010
011
.A
rcka
ringa
....
....
....
...
PE
La60
4A
rcka
ringa
Bas
in94
54-
Exp
lora
tion
for
petr
oleu
m10
010
012
.W
allo
way
....
....
....
....
PE
L60
6W
allo
way
&S
tans
bury
Bas
in85
0828
/08/
18E
xplo
ratio
nfo
rpe
trol
eum
100
100
13.
Arc
karin
ga..
....
....
....
.E
L45
0213
0N
orth
-Eas
tCoo
ber
Ped
y—A
rcka
ringa
Bas
in18
530
/05/
12E
xplo
ratio
nfo
rco
al10
010
0
14.
Will
iam
sB
ore
....
....
...
EL
4501
90N
orth
-Eas
tCoo
ber
Ped
y—A
rcka
ringa
Bas
in30
430
/05/
12E
xplo
ratio
nfo
rco
al10
010
0
15.
Wal
low
ay..
....
....
....
..E
L52
93A
ppro
x.90
kmso
uthe
asto
fPor
tAug
usta
173
11/0
5/15
Exp
lora
tion
for
coal
100
100
16.
Cad
aree
Hill
....
....
....
.E
L42
7280
kmN
orth
-Eas
tCoo
ber
Ped
y88
523
/06/
13E
xplo
ratio
nfo
rco
al10
010
017
.M
tAnd
rew
s..
....
....
...
EL
4273
70km
Sou
th-W
estO
odna
datta
948
24/0
6/14
Exp
lora
tion
for
coal
100
100
18.
Orr
oroo
....
....
....
....
..E
L445
490
kmE
astP
ortA
ugus
ta,O
rror
ooR
egio
n—W
allo
way
Bas
in69
317
/03/
15E
xplo
ratio
nfo
rco
al10
010
0
19.
Wei
raP
lain
....
....
....
..E
L45
4090
kmE
astN
orth
-Eas
tPor
tAug
usta
,Orr
oroo
Reg
ion—
Wal
low
ayB
asin
8722
/08/
13E
xplo
ratio
nfo
rco
al10
010
0
20.
MtA
ndre
ws
....
....
....
.E
L49
3420
kmS
WO
odna
datta
893
21/0
6/14
Exp
lora
tion
for
coal
100
100
21.
Eur
elya
naC
reek
....
....
EL
5319
Eur
elya
naC
reek
Are
a—ap
prox
imat
ely
100k
mN
orth
-Eas
tofC
oobe
rP
edy
154
05/0
8/15
Exp
lora
tion
for
coal
100
100
H-3
For
per
sona
l use
onl
y
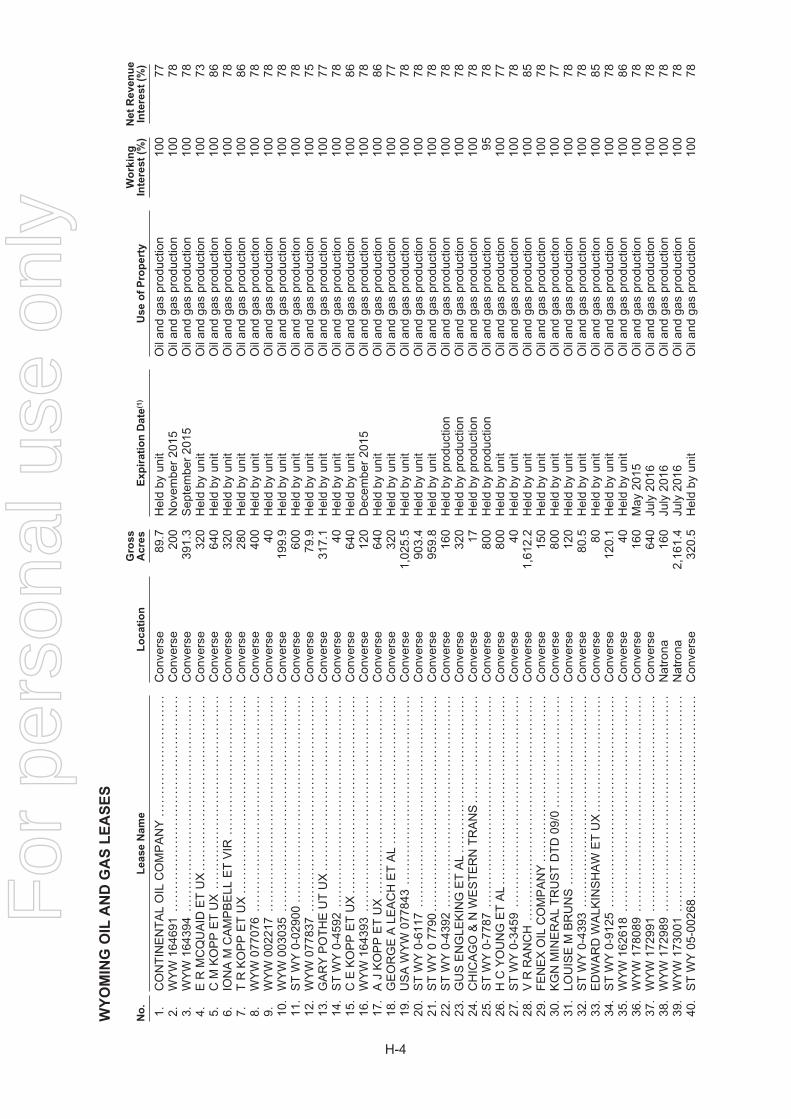
WY
OM
ING
OIL
AN
DG
AS
LE
AS
ES
No
.L
ease
Nam
eL
ocati
on
Gro
ss
Acre
sE
xp
irati
on
Date
(1)
Use
of
Pro
pert
yW
ork
ing
Inte
rest
(%)
Net
Reven
ue
Inte
rest
(%)
1.C
ON
TIN
EN
TA
LO
ILC
OM
PA
NY
....
....
....
....
....
....
...
Con
vers
e89
.7H
eld
byun
itO
ilan
dga
spr
oduc
tion
100
772.
WY
W16
4691
....
....
....
....
....
....
....
....
....
....
....
....
Con
vers
e20
0N
ovem
ber
2015
Oil
and
gas
prod
uctio
n10
078
3.W
YW
1643
94..
....
....
....
....
....
....
....
....
....
....
....
..C
onve
rse
391.
3S
epte
mbe
r20
15O
ilan
dga
spr
oduc
tion
100
784.
ER
MC
QU
AID
ET
UX
....
....
....
....
....
....
....
....
....
...
Con
vers
e32
0H
eld
byun
itO
ilan
dga
spr
oduc
tion
100
735.
CM
KO
PP
ET
UX
....
....
....
....
....
....
....
....
....
....
...
Con
vers
e64
0H
eld
byun
itO
ilan
dga
spr
oduc
tion
100
866.
ION
AM
CA
MP
BE
LLE
TV
IR..
....
....
....
....
....
....
....
.C
onve
rse
320
Hel
dby
unit
Oil
and
gas
prod
uctio
n10
078
7.T
RK
OP
PE
TU
X..
....
....
....
....
....
....
....
....
....
....
..C
onve
rse
280
Hel
dby
unit
Oil
and
gas
prod
uctio
n10
086
8.W
YW
0770
76..
....
....
....
....
....
....
....
....
....
....
....
..C
onve
rse
400
Hel
dby
unit
Oil
and
gas
prod
uctio
n10
078
9.W
YW
0022
17..
....
....
....
....
....
....
....
....
....
....
....
..C
onve
rse
40H
eld
byun
itO
ilan
dga
spr
oduc
tion
100
7810
.W
YW
0030
35..
....
....
....
....
....
....
....
....
....
....
....
..C
onve
rse
199.
9H
eld
byun
itO
ilan
dga
spr
oduc
tion
100
7811
.S
TW
Y0-
0290
0..
....
....
....
....
....
....
....
....
....
....
....
Con
vers
e60
0H
eld
byun
itO
ilan
dga
spr
oduc
tion
100
7812
.W
YW
0778
37..
....
....
....
....
....
....
....
....
....
....
....
..C
onve
rse
79.9
Hel
dby
unit
Oil
and
gas
prod
uctio
n10
075
13.
GA
RY
PO
TH
EU
TU
X..
....
....
....
....
....
....
....
....
....
.C
onve
rse
317.
1H
eld
byun
itO
ilan
dga
spr
oduc
tion
100
7714
.S
TW
Y0-
4592
....
....
....
....
....
....
....
....
....
....
....
...
Con
vers
e40
Hel
dby
unit
Oil
and
gas
prod
uctio
n10
078
15.
CE
KO
PP
ET
UX
....
....
....
....
....
....
....
....
....
....
....
Con
vers
e64
0H
eld
byun
itO
ilan
dga
spr
oduc
tion
100
8616
.W
YW
1643
93..
....
....
....
....
....
....
....
....
....
....
....
..C
onve
rse
120
Dec
embe
r20
15O
ilan
dga
spr
oduc
tion
100
7817
.A
JK
OP
PE
TU
X..
....
....
....
....
....
....
....
....
....
....
..C
onve
rse
640
Hel
dby
unit
Oil
and
gas
prod
uctio
n10
086
18.
GE
OR
GE
ALE
AC
HE
TA
L..
....
....
....
....
....
....
....
...
Con
vers
e32
0H
eld
byun
itO
ilan
dga
spr
oduc
tion
100
7719
.U
SA
WY
W07
7843
....
....
....
....
....
....
....
....
....
....
..C
onve
rse
1,02
5.5
Hel
dby
unit
Oil
and
gas
prod
uctio
n10
078
20.
ST
WY
0-61
17..
....
....
....
....
....
....
....
....
....
....
....
.C
onve
rse
903.
4H
eld
byun
itO
ilan
dga
spr
oduc
tion
100
7821
.S
TW
Y0
7790
....
....
....
....
....
....
....
....
....
....
....
....
Con
vers
e95
9.8
Hel
dby
unit
Oil
and
gas
prod
uctio
n10
078
22.
ST
WY
0-43
92..
....
....
....
....
....
....
....
....
....
....
....
.C
onve
rse
160
Hel
dby
prod
uctio
nO
ilan
dga
spr
oduc
tion
100
7823
.G
US
EN
GLE
KIN
GE
TA
L..
....
....
....
....
....
....
....
....
.C
onve
rse
320
Hel
dby
prod
uctio
nO
ilan
dga
spr
oduc
tion
100
7824
.C
HIC
AG
O&
NW
ES
TE
RN
TR
AN
S..
....
....
....
....
....
..C
onve
rse
17H
eld
bypr
oduc
tion
Oil
and
gas
prod
uctio
n10
078
25.
ST
WY
0-77
87..
....
....
....
....
....
....
....
....
....
....
....
.C
onve
rse
800
Hel
dby
prod
uctio
nO
ilan
dga
spr
oduc
tion
9578
26.
HC
YO
UN
GE
TA
L..
....
....
....
....
....
....
....
....
....
....
Con
vers
e80
0H
eld
byun
itO
ilan
dga
spr
oduc
tion
100
7727
.S
TW
Y0-
3459
....
....
....
....
....
....
....
....
....
....
....
...
Con
vers
e40
Hel
dby
unit
Oil
and
gas
prod
uctio
n10
078
28.
VR
RA
NC
H..
....
....
....
....
....
....
....
....
....
....
....
....
Con
vers
e1,
612.
2H
eld
byun
itO
ilan
dga
spr
oduc
tion
100
8529
.F
EN
EX
OIL
CO
MP
AN
Y..
....
....
....
....
....
....
....
....
...
Con
vers
e15
0H
eld
byun
itO
ilan
dga
spr
oduc
tion
100
7830
.K
GN
MIN
ER
AL
TR
US
TD
TD
09/0
....
....
....
....
....
....
.C
onve
rse
800
Hel
dby
unit
Oil
and
gas
prod
uctio
n10
077
31.
LOU
ISE
MB
RU
NS
....
....
....
....
....
....
....
....
....
....
..C
onve
rse
120
Hel
dby
unit
Oil
and
gas
prod
uctio
n10
078
32.
ST
WY
0-43
93..
....
....
....
....
....
....
....
....
....
....
....
.C
onve
rse
80.5
Hel
dby
unit
Oil
and
gas
prod
uctio
n10
078
33.
ED
WA
RD
WA
LKIN
SH
AW
ET
UX
....
....
....
....
....
....
..C
onve
rse
80H
eld
byun
itO
ilan
dga
spr
oduc
tion
100
8534
.S
TW
Y0-
9125
....
....
....
....
....
....
....
....
....
....
....
...
Con
vers
e12
0.1
Hel
dby
unit
Oil
and
gas
prod
uctio
n10
078
35.
WY
W16
2618
....
....
....
....
....
....
....
....
....
....
....
....
Con
vers
e40
Hel
dby
unit
Oil
and
gas
prod
uctio
n10
086
36.
WY
W17
8089
....
....
....
....
....
....
....
....
....
....
....
....
Con
vers
e16
0M
ay20
15O
ilan
dga
spr
oduc
tion
100
7837
.W
YW
1729
91..
....
....
....
....
....
....
....
....
....
....
....
..C
onve
rse
640
July
2016
Oil
and
gas
prod
uctio
n10
078
38.
WY
W17
2989
....
....
....
....
....
....
....
....
....
....
....
....
Nat
rona
160
July
2016
Oil
and
gas
prod
uctio
n10
078
39.
WY
W17
3001
....
....
....
....
....
....
....
....
....
....
....
....
Nat
rona
2,16
1.4
July
2016
Oil
and
gas
prod
uctio
n10
078
40.
ST
WY
05-0
0268
....
....
....
....
....
....
....
....
....
....
....
.C
onve
rse
320.
5H
eld
byun
itO
ilan
dga
spr
oduc
tion
100
78
H-4
For
per
sona
l use
onl
y
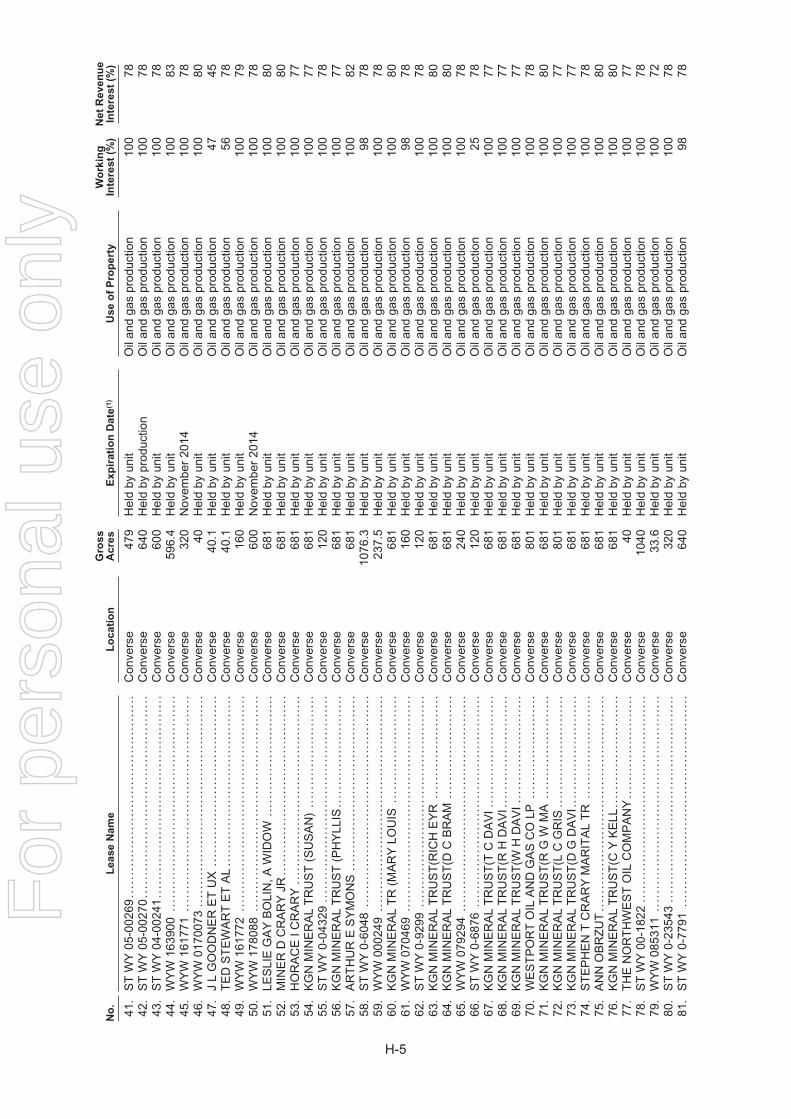
No
.L
ease
Nam
eL
ocati
on
Gro
ss
Acre
sE
xp
irati
on
Date
(1)
Use
of
Pro
pert
yW
ork
ing
Inte
rest
(%)
Net
Reven
ue
Inte
rest
(%)
41.
ST
WY
05-0
0269
....
....
....
....
....
....
....
....
....
....
....
.C
onve
rse
479
Hel
dby
unit
Oil
and
gas
prod
uctio
n10
078
42.
ST
WY
05-0
0270
....
....
....
....
....
....
....
....
....
....
....
.C
onve
rse
640
Hel
dby
prod
uctio
nO
ilan
dga
spr
oduc
tion
100
7843
.S
TW
Y04
-002
41..
....
....
....
....
....
....
....
....
....
....
...
Con
vers
e60
0H
eld
byun
itO
ilan
dga
spr
oduc
tion
100
7844
.W
YW
1639
00..
....
....
....
....
....
....
....
....
....
....
....
..C
onve
rse
596.
4H
eld
byun
itO
ilan
dga
spr
oduc
tion
100
8345
.W
YW
1617
71..
....
....
....
....
....
....
....
....
....
....
....
..C
onve
rse
320
Nov
embe
r20
14O
ilan
dga
spr
oduc
tion
100
7846
.W
YW
0170
073
....
....
....
....
....
....
....
....
....
....
....
...
Con
vers
e40
Hel
dby
unit
Oil
and
gas
prod
uctio
n10
080
47.
JL
GO
OD
NE
RE
TU
X..
....
....
....
....
....
....
....
....
....
Con
vers
e40
.1H
eld
byun
itO
ilan
dga
spr
oduc
tion
4745
48.
TE
DS
TE
WA
RT
ET
AL
....
....
....
....
....
....
....
....
....
..C
onve
rse
40.1
Hel
dby
unit
Oil
and
gas
prod
uctio
n56
7849
.W
YW
1617
72..
....
....
....
....
....
....
....
....
....
....
....
..C
onve
rse
160
Hel
dby
unit
Oil
and
gas
prod
uctio
n10
079
50.
WY
W17
8088
....
....
....
....
....
....
....
....
....
....
....
....
Con
vers
e60
0N
ovem
ber
2014
Oil
and
gas
prod
uctio
n10
078
51.
LES
LIE
GA
YB
OLI
N,A
WID
OW
....
....
....
....
....
....
...
Con
vers
e68
1H
eld
byun
itO
ilan
dga
spr
oduc
tion
100
8052
.M
INE
RD
CR
AR
YJR
....
....
....
....
....
....
....
....
....
....
Con
vers
e68
1H
eld
byun
itO
ilan
dga
spr
oduc
tion
100
8053
.H
OR
AC
EIC
RA
RY
....
....
....
....
....
....
....
....
....
....
..C
onve
rse
681
Hel
dby
unit
Oil
and
gas
prod
uctio
n10
077
54.
KG
NM
INE
RA
LT
RU
ST
(SU
SA
N)
....
....
....
....
....
....
.C
onve
rse
681
Hel
dby
unit
Oil
and
gas
prod
uctio
n10
077
55.
ST
WY
0-04
329
....
....
....
....
....
....
....
....
....
....
....
..C
onve
rse
120
Hel
dby
unit
Oil
and
gas
prod
uctio
n10
078
56.
KG
NM
INE
RA
LT
RU
ST
(PH
YLL
IS..
....
....
....
....
....
...
Con
vers
e68
1H
eld
byun
itO
ilan
dga
spr
oduc
tion
100
7757
.A
RT
HU
RE
SY
MO
NS
....
....
....
....
....
....
....
....
....
...
Con
vers
e68
1H
eld
byun
itO
ilan
dga
spr
oduc
tion
100
8258
.S
TW
Y0-
6048
....
....
....
....
....
....
....
....
....
....
....
...
Con
vers
e10
76.3
Hel
dby
unit
Oil
and
gas
prod
uctio
n98
7859
.W
YW
0002
49..
....
....
....
....
....
....
....
....
....
....
....
..C
onve
rse
237.
5H
eld
byun
itO
ilan
dga
spr
oduc
tion
100
7860
.K
GN
MIN
ER
AL
TR
(MA
RY
LOU
IS..
....
....
....
....
....
..C
onve
rse
681
Hel
dby
unit
Oil
and
gas
prod
uctio
n10
080
61.
WY
W07
0469
....
....
....
....
....
....
....
....
....
....
....
....
Con
vers
e16
0H
eld
byun
itO
ilan
dga
spr
oduc
tion
9878
62.
ST
WY
0-92
99..
....
....
....
....
....
....
....
....
....
....
....
.C
onve
rse
120
Hel
dby
unit
Oil
and
gas
prod
uctio
n10
078
63.
KG
NM
INE
RA
LT
RU
ST
(RIC
HE
YR
....
....
....
....
....
...
Con
vers
e68
1H
eld
byun
itO
ilan
dga
spr
oduc
tion
100
8064
.K
GN
MIN
ER
AL
TR
US
T(D
CB
RA
M..
....
....
....
....
....
.C
onve
rse
681
Hel
dby
unit
Oil
and
gas
prod
uctio
n10
080
65.
WY
W07
9294
....
....
....
....
....
....
....
....
....
....
....
....
Con
vers
e24
0H
eld
byun
itO
ilan
dga
spr
oduc
tion
100
7866
.S
TW
Y0-
6876
....
....
....
....
....
....
....
....
....
....
....
...
Con
vers
e12
0H
eld
byun
itO
ilan
dga
spr
oduc
tion
2578
67.
KG
NM
INE
RA
LT
RU
ST
(TC
DA
VI.
....
....
....
....
....
....
Con
vers
e68
1H
eld
byun
itO
ilan
dga
spr
oduc
tion
100
7768
.K
GN
MIN
ER
AL
TR
US
T(R
HD
AV
I...
....
....
....
....
....
..C
onve
rse
681
Hel
dby
unit
Oil
and
gas
prod
uctio
n10
077
69.
KG
NM
INE
RA
LT
RU
ST
(WH
DA
VI
....
....
....
....
....
....
Con
vers
e68
1H
eld
byun
itO
ilan
dga
spr
oduc
tion
100
7770
.W
ES
TP
OR
TO
ILA
ND
GA
SC
OLP
....
....
....
....
....
...
Con
vers
e80
1H
eld
byun
itO
ilan
dga
spr
oduc
tion
100
7871
.K
GN
MIN
ER
AL
TR
US
T(R
GW
MA
....
....
....
....
....
...
Con
vers
e68
1H
eld
byun
itO
ilan
dga
spr
oduc
tion
100
8072
.K
GN
MIN
ER
AL
TR
US
T(L
CG
RIS
....
....
....
....
....
....
.C
onve
rse
801
Hel
dby
unit
Oil
and
gas
prod
uctio
n10
077
73.
KG
NM
INE
RA
LT
RU
ST
(DG
DA
VI.
....
....
....
....
....
....
Con
vers
e68
1H
eld
byun
itO
ilan
dga
spr
oduc
tion
100
7774
.S
TE
PH
EN
TC
RA
RY
MA
RIT
AL
TR
....
....
....
....
....
...
Con
vers
e68
1H
eld
byun
itO
ilan
dga
spr
oduc
tion
100
7875
.A
NN
OB
RZ
UT
....
....
....
....
....
....
....
....
....
....
....
....
Con
vers
e68
1H
eld
byun
itO
ilan
dga
spr
oduc
tion
100
8076
.K
GN
MIN
ER
AL
TR
US
T(C
YK
ELL
....
....
....
....
....
....
.C
onve
rse
681
Hel
dby
unit
Oil
and
gas
prod
uctio
n10
080
77.
TH
EN
OR
TH
WE
ST
OIL
CO
MP
AN
Y..
....
....
....
....
....
.C
onve
rse
40H
eld
byun
itO
ilan
dga
spr
oduc
tion
100
7778
.S
TW
Y00
-182
2..
....
....
....
....
....
....
....
....
....
....
....
Con
vers
e10
40H
eld
byun
itO
ilan
dga
spr
oduc
tion
100
7879
.W
YW
0853
11..
....
....
....
....
....
....
....
....
....
....
....
..C
onve
rse
33.6
Hel
dby
unit
Oil
and
gas
prod
uctio
n10
072
80.
ST
WY
0-23
543
....
....
....
....
....
....
....
....
....
....
....
..C
onve
rse
320
Hel
dby
unit
Oil
and
gas
prod
uctio
n10
078
81.
ST
WY
0-77
91..
....
....
....
....
....
....
....
....
....
....
....
.C
onve
rse
640
Hel
dby
unit
Oil
and
gas
prod
uctio
n98
78
H-5
For
per
sona
l use
onl
y
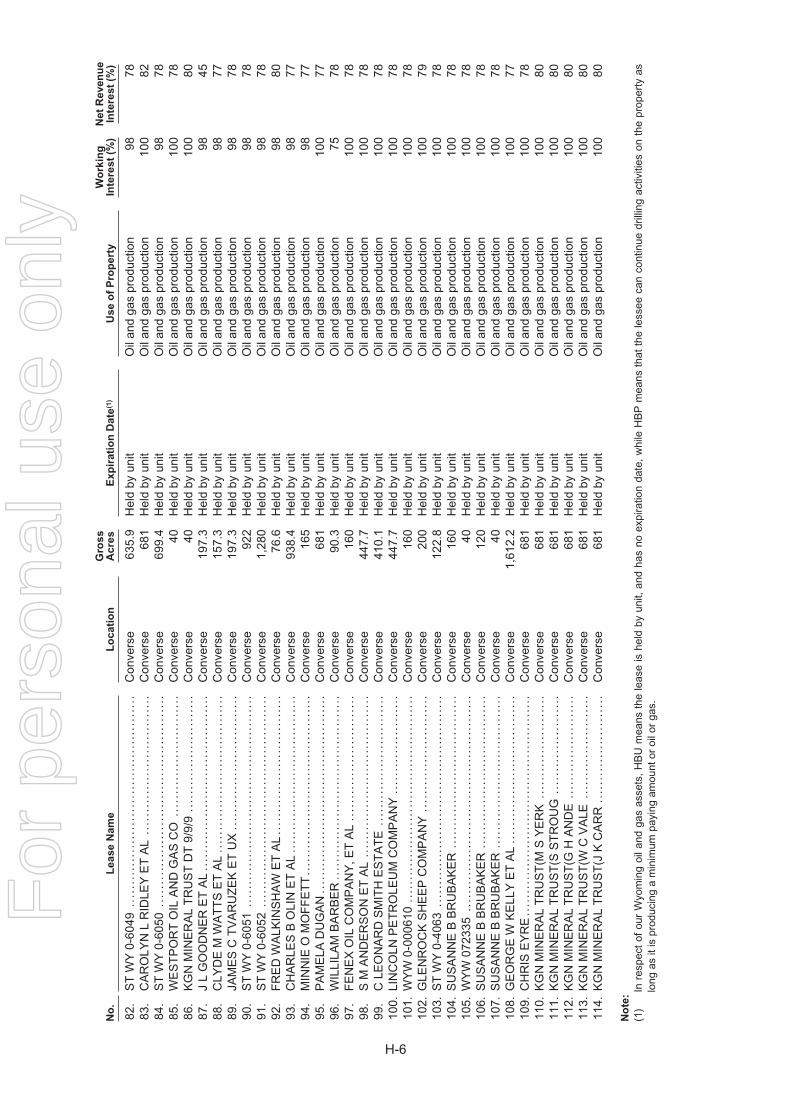
No
.L
ease
Nam
eL
ocati
on
Gro
ss
Acre
sE
xp
irati
on
Date
(1)
Use
of
Pro
pert
yW
ork
ing
Inte
rest
(%)
Net
Reven
ue
Inte
rest
(%)
82.
ST
WY
0-60
49..
....
....
....
....
....
....
....
....
....
....
....
.C
onve
rse
635.
9H
eld
byun
itO
ilan
dga
spr
oduc
tion
9878
83.
CA
RO
LYN
LR
IDLE
YE
TA
L..
....
....
....
....
....
....
....
.C
onve
rse
681
Hel
dby
unit
Oil
and
gas
prod
uctio
n10
082
84.
ST
WY
0-60
50..
....
....
....
....
....
....
....
....
....
....
....
.C
onve
rse
699.
4H
eld
byun
itO
ilan
dga
spr
oduc
tion
9878
85.
WE
ST
PO
RT
OIL
AN
DG
AS
CO
....
....
....
....
....
....
...
Con
vers
e40
Hel
dby
unit
Oil
and
gas
prod
uctio
n10
078
86.
KG
NM
INE
RA
LT
RU
ST
DT
9/9/
9..
....
....
....
....
....
....
Con
vers
e40
Hel
dby
unit
Oil
and
gas
prod
uctio
n10
080
87.
JL
GO
OD
NE
RE
TA
L..
....
....
....
....
....
....
....
....
....
.C
onve
rse
197.
3H
eld
byun
itO
ilan
dga
spr
oduc
tion
9845
88.
CLY
DE
MW
AT
TS
ET
AL
....
....
....
....
....
....
....
....
...
Con
vers
e15
7.3
Hel
dby
unit
Oil
and
gas
prod
uctio
n98
7789
.JA
ME
SC
TV
AR
UZ
EK
ET
UX
....
....
....
....
....
....
....
..C
onve
rse
197.
3H
eld
byun
itO
ilan
dga
spr
oduc
tion
9878
90.
ST
WY
0-60
51..
....
....
....
....
....
....
....
....
....
....
....
.C
onve
rse
922
Hel
dby
unit
Oil
and
gas
prod
uctio
n98
7891
.S
TW
Y0-
6052
....
....
....
....
....
....
....
....
....
....
....
...
Con
vers
e1,
280
Hel
dby
unit
Oil
and
gas
prod
uctio
n98
7892
.F
RE
DW
ALK
INS
HA
WE
TA
L..
....
....
....
....
....
....
....
.C
onve
rse
76.6
Hel
dby
unit
Oil
and
gas
prod
uctio
n98
8093
.C
HA
RLE
SB
OLI
NE
TA
L..
....
....
....
....
....
....
....
....
.C
onve
rse
938.
4H
eld
byun
itO
ilan
dga
spr
oduc
tion
9877
94.
MIN
NIE
OM
OF
FE
TT
....
....
....
....
....
....
....
....
....
....
Con
vers
e16
5H
eld
byun
itO
ilan
dga
spr
oduc
tion
9877
95.
PA
ME
LAD
UG
AN
....
....
....
....
....
....
....
....
....
....
....
Con
vers
e68
1H
eld
byun
itO
ilan
dga
spr
oduc
tion
100
7796
.W
ILLI
LAM
BA
RB
ER
....
....
....
....
....
....
....
....
....
....
.C
onve
rse
90.3
Hel
dby
unit
Oil
and
gas
prod
uctio
n75
7897
.F
EN
EX
OIL
CO
MP
AN
Y,E
TA
L..
....
....
....
....
....
....
..C
onve
rse
160
Hel
dby
unit
Oil
and
gas
prod
uctio
n10
078
98.
SM
AN
DE
RS
ON
ET
AL
....
....
....
....
....
....
....
....
....
Con
vers
e44
7.7
Hel
dby
unit
Oil
and
gas
prod
uctio
n10
078
99.
CLE
ON
AR
DS
MIT
HE
ST
AT
E..
....
....
....
....
....
....
...
Con
vers
e41
0.1
Hel
dby
unit
Oil
and
gas
prod
uctio
n10
078
100.
LIN
CO
LNP
ET
RO
LEU
MC
OM
PA
NY
....
....
....
....
....
..C
onve
rse
447.
7H
eld
byun
itO
ilan
dga
spr
oduc
tion
100
7810
1.W
YW
0-00
0610
....
....
....
....
....
....
....
....
....
....
....
..C
onve
rse
160
Hel
dby
unit
Oil
and
gas
prod
uctio
n10
078
102.
GLE
NR
OC
KS
HE
EP
CO
MP
AN
Y..
....
....
....
....
....
....
Con
vers
e20
0H
eld
byun
itO
ilan
dga
spr
oduc
tion
100
7910
3.S
TW
Y0-
4063
....
....
....
....
....
....
....
....
....
....
....
...
Con
vers
e12
2.8
Hel
dby
unit
Oil
and
gas
prod
uctio
n10
078
104.
SU
SA
NN
EB
BR
UB
AK
ER
....
....
....
....
....
....
....
....
..C
onve
rse
160
Hel
dby
unit
Oil
and
gas
prod
uctio
n10
078
105.
WY
W07
2335
....
....
....
....
....
....
....
....
....
....
....
....
Con
vers
e40
Hel
dby
unit
Oil
and
gas
prod
uctio
n10
078
106.
SU
SA
NN
EB
BR
UB
AK
ER
....
....
....
....
....
....
....
....
..C
onve
rse
120
Hel
dby
unit
Oil
and
gas
prod
uctio
n10
078
107.
SU
SA
NN
EB
BR
UB
AK
ER
....
....
....
....
....
....
....
....
..C
onve
rse
40H
eld
byun
itO
ilan
dga
spr
oduc
tion
100
7810
8.G
EO
RG
EW
KE
LLY
ET
AL
....
....
....
....
....
....
....
....
.C
onve
rse
1,61
2.2
Hel
dby
unit
Oil
and
gas
prod
uctio
n10
077
109.
CH
RIS
EY
RE
....
....
....
....
....
....
....
....
....
....
....
....
.C
onve
rse
681
Hel
dby
unit
Oil
and
gas
prod
uctio
n10
078
110.
KG
NM
INE
RA
LT
RU
ST
(MS
YE
RK
....
....
....
....
....
...
Con
vers
e68
1H
eld
byun
itO
ilan
dga
spr
oduc
tion
100
8011
1.K
GN
MIN
ER
AL
TR
US
T(S
ST
RO
UG
....
....
....
....
....
..C
onve
rse
681
Hel
dby
unit
Oil
and
gas
prod
uctio
n10
080
112.
KG
NM
INE
RA
LT
RU
ST
(GH
AN
DE
....
....
....
....
....
...
Con
vers
e68
1H
eld
byun
itO
ilan
dga
spr
oduc
tion
100
8011
3.K
GN
MIN
ER
AL
TR
US
T(W
CV
ALE
....
....
....
....
....
...
Con
vers
e68
1H
eld
byun
itO
ilan
dga
spr
oduc
tion
100
8011
4.K
GN
MIN
ER
AL
TR
US
T(J
KC
AR
R..
....
....
....
....
....
..C
onve
rse
681
Hel
dby
unit
Oil
and
gas
prod
uctio
n10
080
No
te:
(1)
Inre
spec
tof
our
Wyo
min
goi
land
gas
asse
ts,
HB
Um
eans
the
leas
eis
held
byun
it,an
dha
sno
expi
ratio
nda
te,
whi
leH
BP
mea
nsth
atth
ele
ssee
can
cont
inue
drill
ing
activ
ities
onth
epr
oper
tyas
long
asit
ispr
oduc
ing
am
inim
umpa
ying
amou
ntor
oilo
rga
s.
H-6
For
per
sona
l use
onl
y
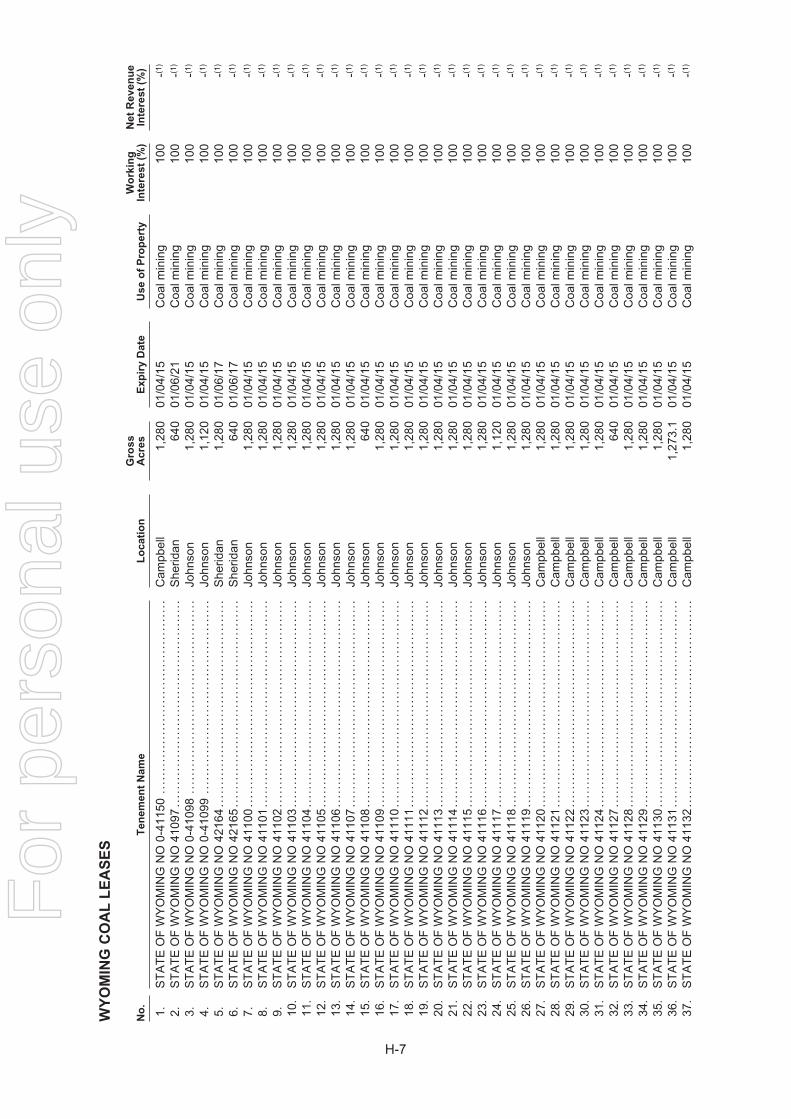
WY
OM
ING
CO
AL
LE
AS
ES
No
.T
en
em
en
tN
am
eL
ocati
on
Gro
ss
Acre
sE
xp
iry
Date
Use
of
Pro
pert
yW
ork
ing
Inte
rest
(%)
Net
Reven
ue
Inte
rest
(%)
1.S
TA
TE
OF
WY
OM
ING
NO
0-41
150
....
....
....
....
....
....
....
....
....
....
...
Cam
pbel
l1,
280
01/0
4/15
Coa
lmin
ing
100
-(1)
2.S
TA
TE
OF
WY
OM
ING
NO
4109
7..
....
....
....
....
....
....
....
....
....
....
....
She
ridan
640
01/0
6/21
Coa
lmin
ing
100
-(1)
3.S
TA
TE
OF
WY
OM
ING
NO
0-41
098
....
....
....
....
....
....
....
....
....
....
...
John
son
1,28
001
/04/
15C
oalm
inin
g10
0-(1
)
4.S
TA
TE
OF
WY
OM
ING
NO
0-41
099
....
....
....
....
....
....
....
....
....
....
...
John
son
1,12
001
/04/
15C
oalm
inin
g10
0-(1
)
5.S
TA
TE
OF
WY
OM
ING
NO
4216
4..
....
....
....
....
....
....
....
....
....
....
....
She
ridan
1,28
001
/06/
17C
oalm
inin
g10
0-(1
)
6.S
TA
TE
OF
WY
OM
ING
NO
4216
5..
....
....
....
....
....
....
....
....
....
....
....
She
ridan
640
01/0
6/17
Coa
lmin
ing
100
-(1)
7.S
TA
TE
OF
WY
OM
ING
NO
4110
0..
....
....
....
....
....
....
....
....
....
....
....
John
son
1,28
001
/04/
15C
oalm
inin
g10
0-(1
)
8.S
TA
TE
OF
WY
OM
ING
NO
4110
1..
....
....
....
....
....
....
....
....
....
....
....
John
son
1,28
001
/04/
15C
oalm
inin
g10
0-(1
)
9.S
TA
TE
OF
WY
OM
ING
NO
4110
2..
....
....
....
....
....
....
....
....
....
....
....
John
son
1,28
001
/04/
15C
oalm
inin
g10
0-(1
)
10.
ST
AT
EO
FW
YO
MIN
GN
O41
103
....
....
....
....
....
....
....
....
....
....
....
..Jo
hnso
n1,
280
01/0
4/15
Coa
lmin
ing
100
-(1)
11.
ST
AT
EO
FW
YO
MIN
GN
O41
104
....
....
....
....
....
....
....
....
....
....
....
..Jo
hnso
n1,
280
01/0
4/15
Coa
lmin
ing
100
-(1)
12.
ST
AT
EO
FW
YO
MIN
GN
O41
105
....
....
....
....
....
....
....
....
....
....
....
..Jo
hnso
n1,
280
01/0
4/15
Coa
lmin
ing
100
-(1)
13.
ST
AT
EO
FW
YO
MIN
GN
O41
106
....
....
....
....
....
....
....
....
....
....
....
..Jo
hnso
n1,
280
01/0
4/15
Coa
lmin
ing
100
-(1)
14.
ST
AT
EO
FW
YO
MIN
GN
O41
107
....
....
....
....
....
....
....
....
....
....
....
..Jo
hnso
n1,
280
01/0
4/15
Coa
lmin
ing
100
-(1)
15.
ST
AT
EO
FW
YO
MIN
GN
O41
108
....
....
....
....
....
....
....
....
....
....
....
..Jo
hnso
n64
001
/04/
15C
oalm
inin
g10
0-(1
)
16.
ST
AT
EO
FW
YO
MIN
GN
O41
109
....
....
....
....
....
....
....
....
....
....
....
..Jo
hnso
n1,
280
01/0
4/15
Coa
lmin
ing
100
-(1)
17.
ST
AT
EO
FW
YO
MIN
GN
O41
110
....
....
....
....
....
....
....
....
....
....
....
..Jo
hnso
n1,
280
01/0
4/15
Coa
lmin
ing
100
-(1)
18.
ST
AT
EO
FW
YO
MIN
GN
O41
111
....
....
....
....
....
....
....
....
....
....
....
..Jo
hnso
n1,
280
01/0
4/15
Coa
lmin
ing
100
-(1)
19.
ST
AT
EO
FW
YO
MIN
GN
O41
112
....
....
....
....
....
....
....
....
....
....
....
..Jo
hnso
n1,
280
01/0
4/15
Coa
lmin
ing
100
-(1)
20.
ST
AT
EO
FW
YO
MIN
GN
O41
113
....
....
....
....
....
....
....
....
....
....
....
..Jo
hnso
n1,
280
01/0
4/15
Coa
lmin
ing
100
-(1)
21.
ST
AT
EO
FW
YO
MIN
GN
O41
114
....
....
....
....
....
....
....
....
....
....
....
..Jo
hnso
n1,
280
01/0
4/15
Coa
lmin
ing
100
-(1)
22.
ST
AT
EO
FW
YO
MIN
GN
O41
115
....
....
....
....
....
....
....
....
....
....
....
..Jo
hnso
n1,
280
01/0
4/15
Coa
lmin
ing
100
-(1)
23.
ST
AT
EO
FW
YO
MIN
GN
O41
116
....
....
....
....
....
....
....
....
....
....
....
..Jo
hnso
n1,
280
01/0
4/15
Coa
lmin
ing
100
-(1)
24.
ST
AT
EO
FW
YO
MIN
GN
O41
117
....
....
....
....
....
....
....
....
....
....
....
..Jo
hnso
n1,
120
01/0
4/15
Coa
lmin
ing
100
-(1)
25.
ST
AT
EO
FW
YO
MIN
GN
O41
118
....
....
....
....
....
....
....
....
....
....
....
..Jo
hnso
n1,
280
01/0
4/15
Coa
lmin
ing
100
-(1)
26.
ST
AT
EO
FW
YO
MIN
GN
O41
119
....
....
....
....
....
....
....
....
....
....
....
..Jo
hnso
n1,
280
01/0
4/15
Coa
lmin
ing
100
-(1)
27.
ST
AT
EO
FW
YO
MIN
GN
O41
120
....
....
....
....
....
....
....
....
....
....
....
..C
ampb
ell
1,28
001
/04/
15C
oalm
inin
g10
0-(1
)
28.
ST
AT
EO
FW
YO
MIN
GN
O41
121
....
....
....
....
....
....
....
....
....
....
....
..C
ampb
ell
1,28
001
/04/
15C
oalm
inin
g10
0-(1
)
29.
ST
AT
EO
FW
YO
MIN
GN
O41
122
....
....
....
....
....
....
....
....
....
....
....
..C
ampb
ell
1,28
001
/04/
15C
oalm
inin
g10
0-(1
)
30.
ST
AT
EO
FW
YO
MIN
GN
O41
123
....
....
....
....
....
....
....
....
....
....
....
..C
ampb
ell
1,28
001
/04/
15C
oalm
inin
g10
0-(1
)
31.
ST
AT
EO
FW
YO
MIN
GN
O41
124
....
....
....
....
....
....
....
....
....
....
....
..C
ampb
ell
1,28
001
/04/
15C
oalm
inin
g10
0-(1
)
32.
ST
AT
EO
FW
YO
MIN
GN
O41
127
....
....
....
....
....
....
....
....
....
....
....
..C
ampb
ell
640
01/0
4/15
Coa
lmin
ing
100
-(1)
33.
ST
AT
EO
FW
YO
MIN
GN
O41
128
....
....
....
....
....
....
....
....
....
....
....
..C
ampb
ell
1,28
001
/04/
15C
oalm
inin
g10
0-(1
)
34.
ST
AT
EO
FW
YO
MIN
GN
O41
129
....
....
....
....
....
....
....
....
....
....
....
..C
ampb
ell
1,28
001
/04/
15C
oalm
inin
g10
0-(1
)
35.
ST
AT
EO
FW
YO
MIN
GN
O41
130
....
....
....
....
....
....
....
....
....
....
....
..C
ampb
ell
1,28
001
/04/
15C
oalm
inin
g10
0-(1
)
36.
ST
AT
EO
FW
YO
MIN
GN
O41
131
....
....
....
....
....
....
....
....
....
....
....
..C
ampb
ell
1,27
3.1
01/0
4/15
Coa
lmin
ing
100
-(1)
37.
ST
AT
EO
FW
YO
MIN
GN
O41
132
....
....
....
....
....
....
....
....
....
....
....
..C
ampb
ell
1,28
001
/04/
15C
oalm
inin
g10
0-(1
)
H-7
For
per
sona
l use
onl
y
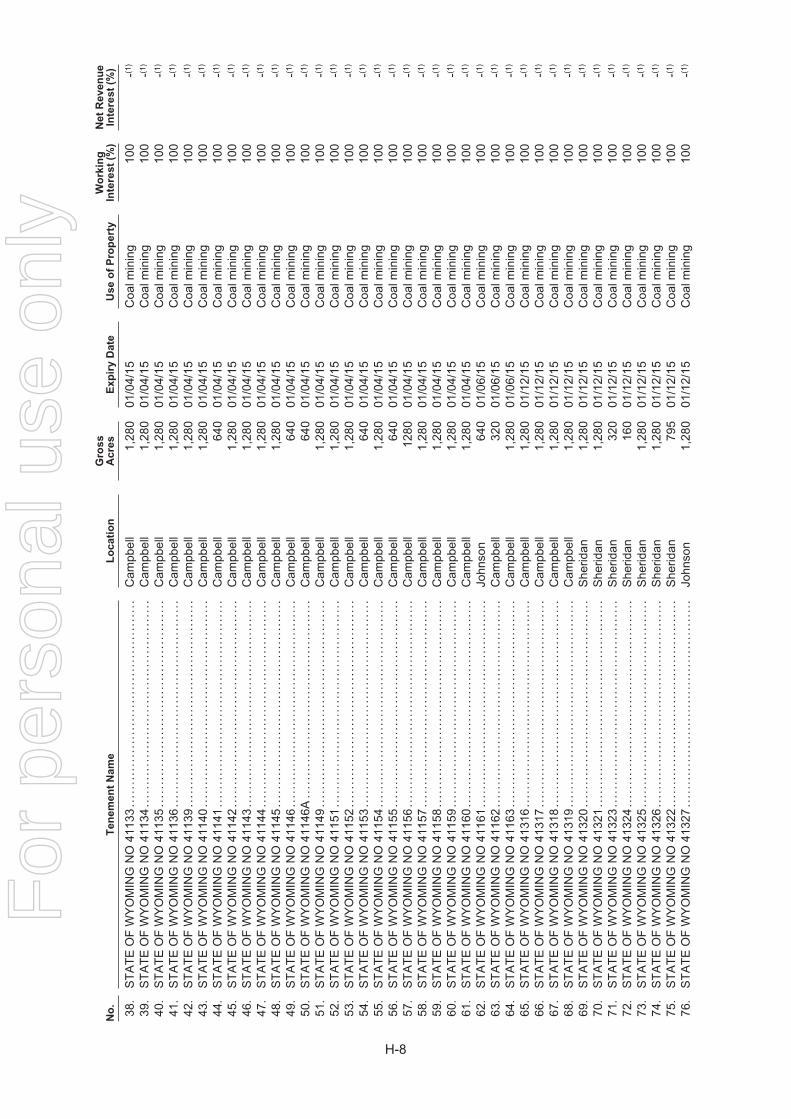
No
.T
en
em
en
tN
am
eL
ocati
on
Gro
ss
Acre
sE
xp
iry
Date
Use
of
Pro
pert
yW
ork
ing
Inte
rest
(%)
Net
Reven
ue
Inte
rest
(%)
38.
ST
AT
EO
FW
YO
MIN
GN
O41
133
....
....
....
....
....
....
....
....
....
....
....
..C
ampb
ell
1,28
001
/04/
15C
oalm
inin
g10
0-(1
)
39.
ST
AT
EO
FW
YO
MIN
GN
O41
134
....
....
....
....
....
....
....
....
....
....
....
..C
ampb
ell
1,28
001
/04/
15C
oalm
inin
g10
0-(1
)
40.
ST
AT
EO
FW
YO
MIN
GN
O41
135
....
....
....
....
....
....
....
....
....
....
....
..C
ampb
ell
1,28
001
/04/
15C
oalm
inin
g10
0-(1
)
41.
ST
AT
EO
FW
YO
MIN
GN
O41
136
....
....
....
....
....
....
....
....
....
....
....
..C
ampb
ell
1,28
001
/04/
15C
oalm
inin
g10
0-(1
)
42.
ST
AT
EO
FW
YO
MIN
GN
O41
139
....
....
....
....
....
....
....
....
....
....
....
..C
ampb
ell
1,28
001
/04/
15C
oalm
inin
g10
0-(1
)
43.
ST
AT
EO
FW
YO
MIN
GN
O41
140
....
....
....
....
....
....
....
....
....
....
....
..C
ampb
ell
1,28
001
/04/
15C
oalm
inin
g10
0-(1
)
44.
ST
AT
EO
FW
YO
MIN
GN
O41
141
....
....
....
....
....
....
....
....
....
....
....
..C
ampb
ell
640
01/0
4/15
Coa
lmin
ing
100
-(1)
45.
ST
AT
EO
FW
YO
MIN
GN
O41
142
....
....
....
....
....
....
....
....
....
....
....
..C
ampb
ell
1,28
001
/04/
15C
oalm
inin
g10
0-(1
)
46.
ST
AT
EO
FW
YO
MIN
GN
O41
143
....
....
....
....
....
....
....
....
....
....
....
..C
ampb
ell
1,28
001
/04/
15C
oalm
inin
g10
0-(1
)
47.
ST
AT
EO
FW
YO
MIN
GN
O41
144
....
....
....
....
....
....
....
....
....
....
....
..C
ampb
ell
1,28
001
/04/
15C
oalm
inin
g10
0-(1
)
48.
ST
AT
EO
FW
YO
MIN
GN
O41
145
....
....
....
....
....
....
....
....
....
....
....
..C
ampb
ell
1,28
001
/04/
15C
oalm
inin
g10
0-(1
)
49.
ST
AT
EO
FW
YO
MIN
GN
O41
146
....
....
....
....
....
....
....
....
....
....
....
..C
ampb
ell
640
01/0
4/15
Coa
lmin
ing
100
-(1)
50.
ST
AT
EO
FW
YO
MIN
GN
O41
146A
....
....
....
....
....
....
....
....
....
....
....
Cam
pbel
l64
001
/04/
15C
oalm
inin
g10
0-(1
)
51.
ST
AT
EO
FW
YO
MIN
GN
O41
149
....
....
....
....
....
....
....
....
....
....
....
..C
ampb
ell
1,28
001
/04/
15C
oalm
inin
g10
0-(1
)
52.
ST
AT
EO
FW
YO
MIN
GN
O41
151
....
....
....
....
....
....
....
....
....
....
....
..C
ampb
ell
1,28
001
/04/
15C
oalm
inin
g10
0-(1
)
53.
ST
AT
EO
FW
YO
MIN
GN
O41
152
....
....
....
....
....
....
....
....
....
....
....
..C
ampb
ell
1,28
001
/04/
15C
oalm
inin
g10
0-(1
)
54.
ST
AT
EO
FW
YO
MIN
GN
O41
153
....
....
....
....
....
....
....
....
....
....
....
..C
ampb
ell
640
01/0
4/15
Coa
lmin
ing
100
-(1)
55.
ST
AT
EO
FW
YO
MIN
GN
O41
154
....
....
....
....
....
....
....
....
....
....
....
..C
ampb
ell
1,28
001
/04/
15C
oalm
inin
g10
0-(1
)
56.
ST
AT
EO
FW
YO
MIN
GN
O41
155
....
....
....
....
....
....
....
....
....
....
....
..C
ampb
ell
640
01/0
4/15
Coa
lmin
ing
100
-(1)
57.
ST
AT
EO
FW
YO
MIN
GN
O41
156
....
....
....
....
....
....
....
....
....
....
....
..C
ampb
ell
1280
01/0
4/15
Coa
lmin
ing
100
-(1)
58.
ST
AT
EO
FW
YO
MIN
GN
O41
157
....
....
....
....
....
....
....
....
....
....
....
..C
ampb
ell
1,28
001
/04/
15C
oalm
inin
g10
0-(1
)
59.
ST
AT
EO
FW
YO
MIN
GN
O41
158
....
....
....
....
....
....
....
....
....
....
....
..C
ampb
ell
1,28
001
/04/
15C
oalm
inin
g10
0-(1
)
60.
ST
AT
EO
FW
YO
MIN
GN
O41
159
....
....
....
....
....
....
....
....
....
....
....
..C
ampb
ell
1,28
001
/04/
15C
oalm
inin
g10
0-(1
)
61.
ST
AT
EO
FW
YO
MIN
GN
O41
160
....
....
....
....
....
....
....
....
....
....
....
..C
ampb
ell
1,28
001
/04/
15C
oalm
inin
g10
0-(1
)
62.
ST
AT
EO
FW
YO
MIN
GN
O41
161
....
....
....
....
....
....
....
....
....
....
....
..Jo
hnso
n64
001
/06/
15C
oalm
inin
g10
0-(1
)
63.
ST
AT
EO
FW
YO
MIN
GN
O41
162
....
....
....
....
....
....
....
....
....
....
....
..C
ampb
ell
320
01/0
6/15
Coa
lmin
ing
100
-(1)
64.
ST
AT
EO
FW
YO
MIN
GN
O41
163
....
....
....
....
....
....
....
....
....
....
....
..C
ampb
ell
1,28
001
/06/
15C
oalm
inin
g10
0-(1
)
65.
ST
AT
EO
FW
YO
MIN
GN
O41
316
....
....
....
....
....
....
....
....
....
....
....
..C
ampb
ell
1,28
001
/12/
15C
oalm
inin
g10
0-(1
)
66.
ST
AT
EO
FW
YO
MIN
GN
O41
317
....
....
....
....
....
....
....
....
....
....
....
..C
ampb
ell
1,28
001
/12/
15C
oalm
inin
g10
0-(1
)
67.
ST
AT
EO
FW
YO
MIN
GN
O41
318
....
....
....
....
....
....
....
....
....
....
....
..C
ampb
ell
1,28
001
/12/
15C
oalm
inin
g10
0-(1
)
68.
ST
AT
EO
FW
YO
MIN
GN
O41
319
....
....
....
....
....
....
....
....
....
....
....
..C
ampb
ell
1,28
001
/12/
15C
oalm
inin
g10
0-(1
)
69.
ST
AT
EO
FW
YO
MIN
GN
O41
320
....
....
....
....
....
....
....
....
....
....
....
..S
herid
an1,
280
01/1
2/15
Coa
lmin
ing
100
-(1)
70.
ST
AT
EO
FW
YO
MIN
GN
O41
321
....
....
....
....
....
....
....
....
....
....
....
..S
herid
an1,
280
01/1
2/15
Coa
lmin
ing
100
-(1)
71.
ST
AT
EO
FW
YO
MIN
GN
O41
323
....
....
....
....
....
....
....
....
....
....
....
..S
herid
an32
001
/12/
15C
oalm
inin
g10
0-(1
)
72.
ST
AT
EO
FW
YO
MIN
GN
O41
324
....
....
....
....
....
....
....
....
....
....
....
..S
herid
an16
001
/12/
15C
oalm
inin
g10
0-(1
)
73.
ST
AT
EO
FW
YO
MIN
GN
O41
325
....
....
....
....
....
....
....
....
....
....
....
..S
herid
an1,
280
01/1
2/15
Coa
lmin
ing
100
-(1)
74.
ST
AT
EO
FW
YO
MIN
GN
O41
326
....
....
....
....
....
....
....
....
....
....
....
..S
herid
an1,
280
01/1
2/15
Coa
lmin
ing
100
-(1)
75.
ST
AT
EO
FW
YO
MIN
GN
O41
322
....
....
....
....
....
....
....
....
....
....
....
..S
herid
an79
501
/12/
15C
oalm
inin
g10
0-(1
)
76.
ST
AT
EO
FW
YO
MIN
GN
O41
327
....
....
....
....
....
....
....
....
....
....
....
..Jo
hnso
n1,
280
01/1
2/15
Coa
lmin
ing
100
-(1)
H-8
For
per
sona
l use
onl
y
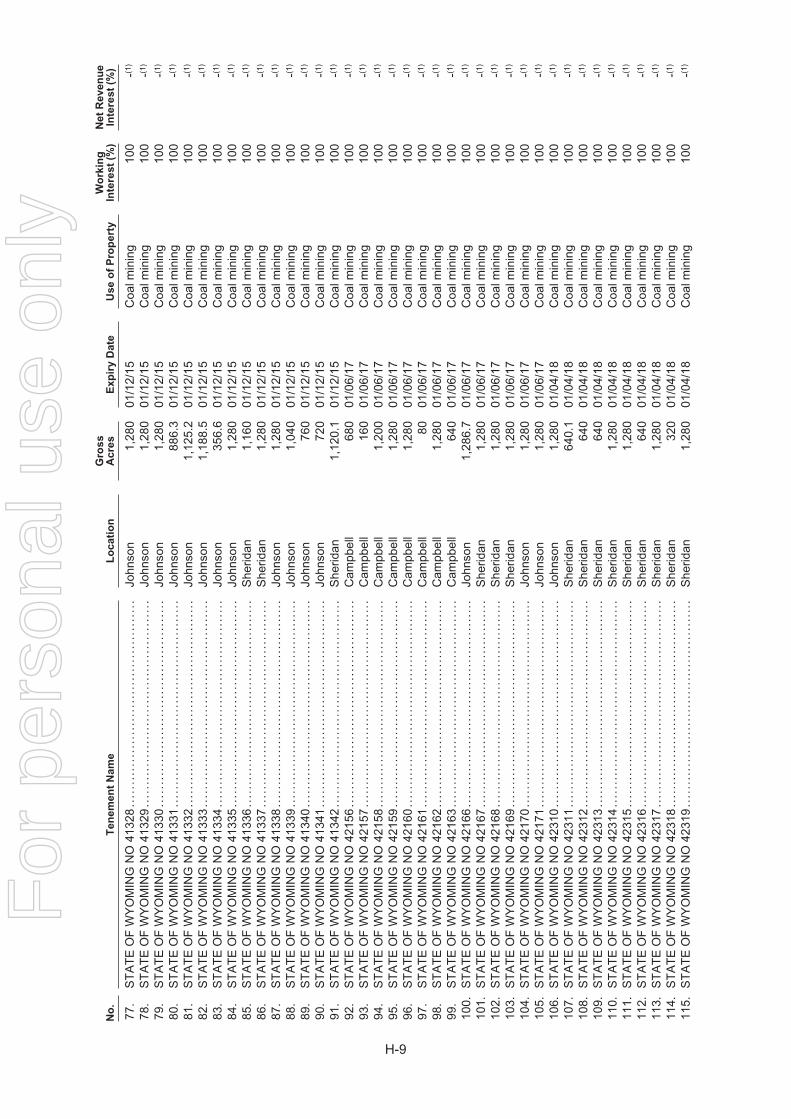
No
.T
en
em
en
tN
am
eL
ocati
on
Gro
ss
Acre
sE
xp
iry
Date
Use
of
Pro
pert
yW
ork
ing
Inte
rest
(%)
Net
Reven
ue
Inte
rest
(%)
77.
ST
AT
EO
FW
YO
MIN
GN
O41
328
....
....
....
....
....
....
....
....
....
....
....
..Jo
hnso
n1,
280
01/1
2/15
Coa
lmin
ing
100
-(1)
78.
ST
AT
EO
FW
YO
MIN
GN
O41
329
....
....
....
....
....
....
....
....
....
....
....
..Jo
hnso
n1,
280
01/1
2/15
Coa
lmin
ing
100
-(1)
79.
ST
AT
EO
FW
YO
MIN
GN
O41
330
....
....
....
....
....
....
....
....
....
....
....
..Jo
hnso
n1,
280
01/1
2/15
Coa
lmin
ing
100
-(1)
80.
ST
AT
EO
FW
YO
MIN
GN
O41
331
....
....
....
....
....
....
....
....
....
....
....
..Jo
hnso
n88
6.3
01/1
2/15
Coa
lmin
ing
100
-(1)
81.
ST
AT
EO
FW
YO
MIN
GN
O41
332
....
....
....
....
....
....
....
....
....
....
....
..Jo
hnso
n1,
125.
201
/12/
15C
oalm
inin
g10
0-(1
)
82.
ST
AT
EO
FW
YO
MIN
GN
O41
333
....
....
....
....
....
....
....
....
....
....
....
..Jo
hnso
n1,
188.
501
/12/
15C
oalm
inin
g10
0-(1
)
83.
ST
AT
EO
FW
YO
MIN
GN
O41
334
....
....
....
....
....
....
....
....
....
....
....
..Jo
hnso
n35
6.6
01/1
2/15
Coa
lmin
ing
100
-(1)
84.
ST
AT
EO
FW
YO
MIN
GN
O41
335
....
....
....
....
....
....
....
....
....
....
....
..Jo
hnso
n1,
280
01/1
2/15
Coa
lmin
ing
100
-(1)
85.
ST
AT
EO
FW
YO
MIN
GN
O41
336
....
....
....
....
....
....
....
....
....
....
....
..S
herid
an1,
160
01/1
2/15
Coa
lmin
ing
100
-(1)
86.
ST
AT
EO
FW
YO
MIN
GN
O41
337
....
....
....
....
....
....
....
....
....
....
....
..S
herid
an1,
280
01/1
2/15
Coa
lmin
ing
100
-(1)
87.
ST
AT
EO
FW
YO
MIN
GN
O41
338
....
....
....
....
....
....
....
....
....
....
....
..Jo
hnso
n1,
280
01/1
2/15
Coa
lmin
ing
100
-(1)
88.
ST
AT
EO
FW
YO
MIN
GN
O41
339
....
....
....
....
....
....
....
....
....
....
....
..Jo
hnso
n1,
040
01/1
2/15
Coa
lmin
ing
100
-(1)
89.
ST
AT
EO
FW
YO
MIN
GN
O41
340
....
....
....
....
....
....
....
....
....
....
....
..Jo
hnso
n76
001
/12/
15C
oalm
inin
g10
0-(1
)
90.
ST
AT
EO
FW
YO
MIN
GN
O41
341
....
....
....
....
....
....
....
....
....
....
....
..Jo
hnso
n72
001
/12/
15C
oalm
inin
g10
0-(1
)
91.
ST
AT
EO
FW
YO
MIN
GN
O41
342
....
....
....
....
....
....
....
....
....
....
....
..S
herid
an1,
120.
101
/12/
15C
oalm
inin
g10
0-(1
)
92.
ST
AT
EO
FW
YO
MIN
GN
O42
156
....
....
....
....
....
....
....
....
....
....
....
..C
ampb
ell
680
01/0
6/17
Coa
lmin
ing
100
-(1)
93.
ST
AT
EO
FW
YO
MIN
GN
O42
157
....
....
....
....
....
....
....
....
....
....
....
..C
ampb
ell
160
01/0
6/17
Coa
lmin
ing
100
-(1)
94.
ST
AT
EO
FW
YO
MIN
GN
O42
158
....
....
....
....
....
....
....
....
....
....
....
..C
ampb
ell
1,20
001
/06/
17C
oalm
inin
g10
0-(1
)
95.
ST
AT
EO
FW
YO
MIN
GN
O42
159
....
....
....
....
....
....
....
....
....
....
....
..C
ampb
ell
1,28
001
/06/
17C
oalm
inin
g10
0-(1
)
96.
ST
AT
EO
FW
YO
MIN
GN
O42
160
....
....
....
....
....
....
....
....
....
....
....
..C
ampb
ell
1,28
001
/06/
17C
oalm
inin
g10
0-(1
)
97.
ST
AT
EO
FW
YO
MIN
GN
O42
161
....
....
....
....
....
....
....
....
....
....
....
..C
ampb
ell
8001
/06/
17C
oalm
inin
g10
0-(1
)
98.
ST
AT
EO
FW
YO
MIN
GN
O42
162
....
....
....
....
....
....
....
....
....
....
....
..C
ampb
ell
1,28
001
/06/
17C
oalm
inin
g10
0-(1
)
99.
ST
AT
EO
FW
YO
MIN
GN
O42
163
....
....
....
....
....
....
....
....
....
....
....
..C
ampb
ell
640
01/0
6/17
Coa
lmin
ing
100
-(1)
100.
ST
AT
EO
FW
YO
MIN
GN
O42
166
....
....
....
....
....
....
....
....
....
....
....
..Jo
hnso
n1,
286.
701
/06/
17C
oalm
inin
g10
0-(1
)
101.
ST
AT
EO
FW
YO
MIN
GN
O42
167
....
....
....
....
....
....
....
....
....
....
....
..S
herid
an1,
280
01/0
6/17
Coa
lmin
ing
100
-(1)
102.
ST
AT
EO
FW
YO
MIN
GN
O42
168
....
....
....
....
....
....
....
....
....
....
....
..S
herid
an1,
280
01/0
6/17
Coa
lmin
ing
100
-(1)
103.
ST
AT
EO
FW
YO
MIN
GN
O42
169
....
....
....
....
....
....
....
....
....
....
....
..S
herid
an1,
280
01/0
6/17
Coa
lmin
ing
100
-(1)
104.
ST
AT
EO
FW
YO
MIN
GN
O42
170
....
....
....
....
....
....
....
....
....
....
....
..Jo
hnso
n1,
280
01/0
6/17
Coa
lmin
ing
100
-(1)
105.
ST
AT
EO
FW
YO
MIN
GN
O42
171
....
....
....
....
....
....
....
....
....
....
....
..Jo
hnso
n1,
280
01/0
6/17
Coa
lmin
ing
100
-(1)
106.
ST
AT
EO
FW
YO
MIN
GN
O42
310
....
....
....
....
....
....
....
....
....
....
....
..Jo
hnso
n1,
280
01/0
4/18
Coa
lmin
ing
100
-(1)
107.
ST
AT
EO
FW
YO
MIN
GN
O42
311
....
....
....
....
....
....
....
....
....
....
....
..S
herid
an64
0.1
01/0
4/18
Coa
lmin
ing
100
-(1)
108.
ST
AT
EO
FW
YO
MIN
GN
O42
312
....
....
....
....
....
....
....
....
....
....
....
..S
herid
an64
001
/04/
18C
oalm
inin
g10
0-(1
)
109.
ST
AT
EO
FW
YO
MIN
GN
O42
313
....
....
....
....
....
....
....
....
....
....
....
..S
herid
an64
001
/04/
18C
oalm
inin
g10
0-(1
)
110.
ST
AT
EO
FW
YO
MIN
GN
O42
314
....
....
....
....
....
....
....
....
....
....
....
..S
herid
an1,
280
01/0
4/18
Coa
lmin
ing
100
-(1)
111.
ST
AT
EO
FW
YO
MIN
GN
O42
315
....
....
....
....
....
....
....
....
....
....
....
..S
herid
an1,
280
01/0
4/18
Coa
lmin
ing
100
-(1)
112.
ST
AT
EO
FW
YO
MIN
GN
O42
316
....
....
....
....
....
....
....
....
....
....
....
..S
herid
an64
001
/04/
18C
oalm
inin
g10
0-(1
)
113.
ST
AT
EO
FW
YO
MIN
GN
O42
317
....
....
....
....
....
....
....
....
....
....
....
..S
herid
an1,
280
01/0
4/18
Coa
lmin
ing
100
-(1)
114.
ST
AT
EO
FW
YO
MIN
GN
O42
318
....
....
....
....
....
....
....
....
....
....
....
..S
herid
an32
001
/04/
18C
oalm
inin
g10
0-(1
)
115.
ST
AT
EO
FW
YO
MIN
GN
O42
319
....
....
....
....
....
....
....
....
....
....
....
..S
herid
an1,
280
01/0
4/18
Coa
lmin
ing
100
-(1)
H-9
For
per
sona
l use
onl
y
No
.T
en
em
en
tN
am
eL
ocati
on
Gro
ss
Acre
sE
xp
iry
Date
Use
of
Pro
pert
yW
ork
ing
Inte
rest
(%)
Net
Reven
ue
Inte
rest
(%)
116.
ST
AT
EO
FW
YO
MIN
GN
O42
320
....
....
....
....
....
....
....
....
....
....
....
..S
herid
an1,
280
01/0
4/18
Coa
lmin
ing
100
-(1)
117.
ST
AT
EO
FW
YO
MIN
GN
O42
321
....
....
....
....
....
....
....
....
....
....
....
..S
herid
an62
2.8
01/0
4/18
Coa
lmin
ing
100
-(1)
118.
ST
AT
EO
FW
YO
MIN
GN
O42
322
....
....
....
....
....
....
....
....
....
....
....
..S
herid
an64
001
/04/
18C
oalm
inin
g10
0-(1
)
119.
ST
AT
EO
FW
YO
MIN
GN
O42
323
....
....
....
....
....
....
....
....
....
....
....
..S
herid
an1,
280
01/0
4/18
Coa
lmin
ing
100
-(1)
120.
ST
AT
EO
FW
YO
MIN
GN
O42
324
....
....
....
....
....
....
....
....
....
....
....
..S
herid
an1,
280
01/0
4/18
Coa
lmin
ing
100
-(1)
121.
ST
AT
EO
FW
YO
MIN
GN
O42
325
....
....
....
....
....
....
....
....
....
....
....
..S
herid
an64
001
/04/
18C
oalm
inin
g10
0-(1
)
122.
ST
AT
EO
FW
YO
MIN
GN
O42
378
....
....
....
....
....
....
....
....
....
....
....
..Jo
hnso
n1,
040
01/1
0/18
Coa
lmin
ing
100
-(1)
123.
ST
AT
EO
FW
YO
MIN
GN
O42
379
....
....
....
....
....
....
....
....
....
....
....
..Jo
hnso
n63
5.5
01/1
0/18
Coa
lmin
ing
100
-(1)
124.
ST
AT
EO
FW
YO
MIN
GN
O42
380
....
....
....
....
....
....
....
....
....
....
....
..Jo
hnso
n64
001
/10/
18C
oalm
inin
g10
0-(1
)
125.
ST
AT
EO
FW
YO
MIN
GN
O42
381
....
....
....
....
....
....
....
....
....
....
....
..Jo
hnso
n1,
196.
401
/10/
18C
oalm
inin
g10
0-(1
)
126.
ST
AT
EO
FW
YO
MIN
GN
O42
382
....
....
....
....
....
....
....
....
....
....
....
..Jo
hnso
n31
8.8
01/1
0/18
Coa
lmin
ing
100
-(1)
127.
ST
AT
EO
FW
YO
MIN
GN
O42
309
....
....
....
....
....
....
....
....
....
....
....
..S
herid
an64
001
/04/
18C
oalm
inin
g10
0-(1
)
128.
ST
AT
EO
FW
YO
MIN
GN
O42
308
....
....
....
....
....
....
....
....
....
....
....
..S
herid
an1,
280
01/0
4/18
Coa
lmin
ing
100
-(1)
129.
ST
AT
EO
FW
YO
MIN
GN
O42
307
....
....
....
....
....
....
....
....
....
....
....
..S
herid
an96
001
/04/
18C
oalm
inin
g10
0-(1
)
130.
ST
AT
EO
FW
YO
MIN
GN
O42
306
....
....
....
....
....
....
....
....
....
....
....
..S
herid
an1,
112.
201
/04/
18C
oalm
inin
g10
0-(1
)
131.
ST
AT
EO
FW
YO
MIN
GN
O42
305
....
....
....
....
....
....
....
....
....
....
....
..S
herid
an64
001
/04/
18C
oalm
inin
g10
0-(1
)
132.
ST
AT
EO
FW
YO
MIN
GN
O42
304
....
....
....
....
....
....
....
....
....
....
....
..S
herid
an1,
280
01/0
4/18
Coa
lmin
ing
100
-(1)
133.
ST
AT
EO
FW
YO
MIN
GN
O42
303
....
....
....
....
....
....
....
....
....
....
....
..S
herid
an1,
280
01/0
4/18
Coa
lmin
ing
100
-(1)
134.
ST
AT
EO
FW
YO
MIN
GN
O42
302
....
....
....
....
....
....
....
....
....
....
....
..S
herid
an1,
120
01/0
4/18
Coa
lmin
ing
100
-(1)
135.
ST
AT
EO
FW
YO
MIN
GN
O42
301
....
....
....
....
....
....
....
....
....
....
....
..S
herid
an88
001
/04/
18C
oalm
inin
g10
0-(1
)
136.
ST
AT
EO
FW
YO
MIN
GN
O42
300
....
....
....
....
....
....
....
....
....
....
....
..Jo
hnso
n1,
280
01/0
4/18
Coa
lmin
ing
100
-(1)
137.
ST
AT
EO
FW
YO
MIN
GN
O42
299
....
....
....
....
....
....
....
....
....
....
....
..Jo
hnso
n1,
280
01/0
4/18
Coa
lmin
ing
100
-(1)
138.
ST
AT
EO
FW
YO
MIN
GN
O42
298
....
....
....
....
....
....
....
....
....
....
....
..C
ampb
ell
640
01/0
4/18
Coa
lmin
ing
100
-(1)
139.
ST
AT
EO
FW
YO
MIN
GN
O42
297
....
....
....
....
....
....
....
....
....
....
....
..S
herid
an1,
120
01/0
4/18
Coa
lmin
ing
100
-(1)
140.
ST
AT
EO
FW
YO
MIN
GN
O42
296
....
....
....
....
....
....
....
....
....
....
....
..C
ampb
ell
640
01/0
4/18
Coa
lmin
ing
100
-(1)
141.
ST
AT
EO
FW
YO
MIN
GN
O42
295
....
....
....
....
....
....
....
....
....
....
....
..C
ampb
ell
1,28
001
/04/
18C
oalm
inin
g10
0-(1
)
142.
ST
AT
EO
FW
YO
MIN
GN
O42
294
....
....
....
....
....
....
....
....
....
....
....
..C
ampb
ell
1,28
001
/04/
18C
oalm
inin
g10
0-(1
)
143.
ST
AT
EO
FW
YO
MIN
GN
O42
293
....
....
....
....
....
....
....
....
....
....
....
..C
ampb
ell
1,28
001
/04/
18C
oalm
inin
g10
0-(1
)
144.
ST
AT
EO
FW
YO
MIN
GN
O42
292
....
....
....
....
....
....
....
....
....
....
....
..C
ampb
ell
1,28
001
/04/
18C
oalm
inin
g10
0-(1
)
145.
ST
AT
EO
FW
YO
MIN
GN
O42
177
....
....
....
....
....
....
....
....
....
....
....
..Jo
hnso
n32
001
/06/
17C
oalm
inin
g10
0-(1
)
146.
ST
AT
EO
FW
YO
MIN
GN
O42
176
....
....
....
....
....
....
....
....
....
....
....
..Jo
hnso
n1,
200
01/0
6/17
Coa
lmin
ing
100
-(1)
147.
ST
AT
EO
FW
YO
MIN
GN
O42
175
....
....
....
....
....
....
....
....
....
....
....
..Jo
hnso
n48
001
/06/
17C
oalm
inin
g10
0-(1
)
148.
ST
AT
EO
FW
YO
MIN
GN
O42
174
....
....
....
....
....
....
....
....
....
....
....
..Jo
hnso
n1,
159.
701
/06/
17C
oalm
inin
g10
0-(1
)
149.
ST
AT
EO
FW
YO
MIN
GN
O42
173
....
....
....
....
....
....
....
....
....
....
....
..Jo
hnso
n1,
280
01/0
6/17
Coa
lmin
ing
100
-(1)
150.
ST
AT
EO
FW
YO
MIN
GN
O42
172
....
....
....
....
....
....
....
....
....
....
....
..Jo
hnso
n1,
280
01/0
6/17
Coa
lmin
ing
100
-(1)
151.
ST
AT
EO
FW
YO
MIN
GN
O42
528
....
....
....
....
....
....
....
....
....
....
....
..Jo
hnso
n1,
280
01/0
4/19
Coa
lmin
ing
100
-(1)
152.
ST
AT
EO
FW
YO
MIN
GN
O42
388
....
....
....
....
....
....
....
....
....
....
....
..Jo
hnso
n63
8.8
01/1
0/18
Coa
lmin
ing
100
-(1)
153.
ST
AT
EO
FW
YO
MIN
GN
O42
384
....
....
....
....
....
....
....
....
....
....
....
..S
herid
an1,
156.
401
/10/
18C
oalm
inin
g10
0-(1
)
154.
ST
AT
EO
FW
YO
MIN
GN
O42
383
....
....
....
....
....
....
....
....
....
....
....
..S
herid
an48
0.2
01/1
0/18
Coa
lmin
ing
100
-(1)
H-10
For
per
sona
l use
onl
y
No
.T
en
em
en
tN
am
eL
ocati
on
Gro
ss
Acre
sE
xp
iry
Date
Use
of
Pro
pert
yW
ork
ing
Inte
rest
(%)
Net
Reven
ue
Inte
rest
(%)
155.
ST
AT
EO
FW
YO
MIN
GN
O42
385
....
....
....
....
....
....
....
....
....
....
....
..S
herid
an64
001
/10/
18C
oalm
inin
g10
0-(1
)
156.
ST
AT
EO
FW
YO
MIN
GN
O42
386
....
....
....
....
....
....
....
....
....
....
....
..Jo
hnso
n63
8.1
01/1
0/18
Coa
lmin
ing
100
-(1)
157.
ST
AT
EO
FW
YO
MIN
GN
O42
387
....
....
....
....
....
....
....
....
....
....
....
..Jo
hnso
n32
001
/10/
18C
oalm
inin
g10
0-(1
)
158.
ST
AT
EO
FW
YO
MIN
GN
O42
719
....
....
....
....
....
....
....
....
....
....
....
..C
onve
rse
640
01/0
4/21
Coa
lmin
ing
100
-(1)
159.
ST
AT
EO
FW
YO
MIN
GN
O42
720
....
....
....
....
....
....
....
....
....
....
....
..C
onve
rse
640
01/0
4/21
Coa
lmin
ing
100
-(1)
160.
ST
AT
EO
FW
YO
MIN
GN
O42
721
....
....
....
....
....
....
....
....
....
....
....
..C
onve
rse
640
01/0
4/21
Coa
lmin
ing
100
-(1)
161.
ST
AT
EO
FW
YO
MIN
GN
O42
722
....
....
....
....
....
....
....
....
....
....
....
..C
onve
rse
640
01/0
4/21
Coa
lmin
ing
100
-(1)
162.
ST
AT
EO
FW
YO
MIN
GN
O42
723
....
....
....
....
....
....
....
....
....
....
....
..C
onve
rse
640
01/0
4/21
Coa
lmin
ing
100
-(1)
163.
ST
AT
EO
FW
YO
MIN
GN
O42
724
....
....
....
....
....
....
....
....
....
....
....
..C
onve
rse
640
01/0
4/21
Coa
lmin
ing
100
-(1)
164.
ST
AT
EO
FW
YO
MIN
GN
O42
725
....
....
....
....
....
....
....
....
....
....
....
..C
onve
rse
640
01/0
4/21
Coa
lmin
ing
100
-(1)
165.
ST
AT
EO
FW
YO
MIN
GN
O42
726
....
....
....
....
....
....
....
....
....
....
....
..C
onve
rse
640
01/0
4/21
Coa
lmin
ing
100
-(1)
166.
ST
AT
EO
FW
YO
MIN
GN
O42
727
....
....
....
....
....
....
....
....
....
....
....
..C
onve
rse
640
01/0
4/21
Coa
lmin
ing
100
-(1)
167.
ST
AT
EO
FW
YO
MIN
GN
O42
728
....
....
....
....
....
....
....
....
....
....
....
..C
onve
rse
640
01/0
4/21
Coa
lmin
ing
100
-(1)
168.
ST
AT
EO
FW
YO
MIN
GN
O42
729
....
....
....
....
....
....
....
....
....
....
....
..C
onve
rse
640
01/0
4/21
Coa
lmin
ing
100
-(1)
169.
ST
AT
EO
FW
YO
MIN
GN
O42
730
....
....
....
....
....
....
....
....
....
....
....
..C
onve
rse
640
01/0
4/21
Coa
lmin
ing
100
-(1)
170.
ST
AT
EO
FW
YO
MIN
GN
O42
731
....
....
....
....
....
....
....
....
....
....
....
..C
onve
rse
640
01/0
4/21
Coa
lmin
ing
100
-(1)
171.
ST
AT
EO
FW
YO
MIN
GN
O42
732
....
....
....
....
....
....
....
....
....
....
....
..C
onve
rse
640
01/0
4/21
Coa
lmin
ing
100
-(1)
172.
ST
AT
EO
FW
YO
MIN
GN
O42
733
....
....
....
....
....
....
....
....
....
....
....
..C
onve
rse
640
01/0
4/21
Coa
lmin
ing
100
-(1)
173.
ST
AT
EO
FW
YO
MIN
GN
O42
734
....
....
....
....
....
....
....
....
....
....
....
..C
onve
rse
640
01/0
4/21
Coa
lmin
ing
100
-(1)
174.
ST
AT
EO
FW
YO
MIN
GN
O42
735
....
....
....
....
....
....
....
....
....
....
....
..C
onve
rse
640
01/0
4/21
Coa
lmin
ing
100
-(1)
175.
ST
AT
EO
FW
YO
MIN
GN
O42
736
....
....
....
....
....
....
....
....
....
....
....
..C
onve
rse
640
01/0
4/21
Coa
lmin
ing
100
-(1)
176.
ST
AT
EO
FW
YO
MIN
GN
O42
737
....
....
....
....
....
....
....
....
....
....
....
..C
onve
rse
640
01/0
4/21
Coa
lmin
ing
100
-(1)
177.
ST
AT
EO
FW
YO
MIN
GN
O42
784
....
....
....
....
....
....
....
....
....
....
....
..C
onve
rse
640
01/0
4/21
Coa
lmin
ing
100
-(1)
178.
ST
AT
EO
FW
YO
MIN
GN
O42
785
....
....
....
....
....
....
....
....
....
....
....
..C
onve
rse
640
01/0
4/21
Coa
lmin
ing
100
-(1)
179.
ST
AT
EO
FW
YO
MIN
GN
O42
786
....
....
....
....
....
....
....
....
....
....
....
..C
onve
rse
640
01/0
4/21
Coa
lmin
ing
100
-(1)
180.
ST
AT
EO
FW
YO
MIN
GN
O42
787
....
....
....
....
....
....
....
....
....
....
....
..C
onve
rse
640
01/0
4/21
Coa
lmin
ing
100
-(1)
181.
ST
AT
EO
FW
YO
MIN
GN
O42
788
....
....
....
....
....
....
....
....
....
....
....
..C
onve
rse
640
01/0
4/21
Coa
lmin
ing
100
-(1)
182.
ST
AT
EO
FW
YO
MIN
GN
O42
789
....
....
....
....
....
....
....
....
....
....
....
..C
onve
rse
640
01/0
4/21
Coa
lmin
ing
100
-(1)
183.
ST
AT
EO
FW
YO
MIN
GN
O42
790
....
....
....
....
....
....
....
....
....
....
....
..C
onve
rse
640
01/0
4/21
Coa
lmin
ing
100
-(1)
184.
ST
AT
EO
FW
YO
MIN
GN
O42
791
....
....
....
....
....
....
....
....
....
....
....
..C
onve
rse
640
01/0
4/21
Coa
lmin
ing
100
-(1)
185.
ST
AT
EO
FW
YO
MIN
GN
O42
799
....
....
....
....
....
....
....
....
....
....
....
..C
arbo
n64
001
/06/
21C
oalm
inin
g10
0-(1
)
186.
ST
AT
EO
FW
YO
MIN
GN
O42
798
....
....
....
....
....
....
....
....
....
....
....
..C
arbo
n64
001
/06/
21C
oalm
inin
g10
0-(1
)
187.
ST
AT
EO
FW
YO
MIN
GN
O42
797
....
....
....
....
....
....
....
....
....
....
....
..C
arbo
n64
001
/06/
21C
oalm
inin
g10
0-(1
)
188.
ST
AT
EO
FW
YO
MIN
GN
O42
802
....
....
....
....
....
....
....
....
....
....
....
..C
arbo
n64
001
/06/
21C
oalm
inin
g10
0-(1
)
189.
ST
AT
EO
FW
YO
MIN
GN
O42
801
....
....
....
....
....
....
....
....
....
....
....
..C
arbo
n64
001
/06/
21C
oalm
inin
g10
0-(1
)
190.
ST
AT
EO
FW
YO
MIN
GN
O42
800
....
....
....
....
....
....
....
....
....
....
....
..C
arbo
n12
001
/06/
21C
oalm
inin
g10
0-(1
)
191.
ST
AT
EO
FW
YO
MIN
G42
810
....
....
....
....
....
....
....
....
....
....
....
....
..C
arbo
n64
001
/08/
21C
oalm
inin
g10
0-(1
)
192.
ST
AT
EO
FW
YO
MIN
G42
809
....
....
....
....
....
....
....
....
....
....
....
....
..C
arbo
n64
001
/08/
21C
oalm
inin
g10
0-(1
)
193.
ST
AT
EO
FW
YO
MIN
G42
808
....
....
....
....
....
....
....
....
....
....
....
....
..C
arbo
n64
001
/08/
21C
oalm
inin
g10
0-(1
)
H-11
For
per
sona
l use
onl
y
No
.T
en
em
en
tN
am
eL
ocati
on
Gro
ss
Acre
sE
xp
iry
Date
Use
of
Pro
pert
yW
ork
ing
Inte
rest
(%)
Net
Reven
ue
Inte
rest
(%)
194.
ST
AT
EO
FW
YO
MIN
G42
813
....
....
....
....
....
....
....
....
....
....
....
....
..S
wee
twat
er64
001
/08/
21C
oalm
inin
g10
0-(1
)
195.
ST
AT
EO
FW
YO
MIN
G42
807
....
....
....
....
....
....
....
....
....
....
....
....
..C
arbo
n64
001
/08/
21C
oalm
inin
g10
0-(1
)
196.
ST
AT
EO
FW
YO
MIN
GN
O42
811
....
....
....
....
....
....
....
....
....
....
....
..Li
ncol
n64
001
/08/
21C
oalm
inin
g10
0-(1
)
No
te:
(1)
The
net
reve
nue
inte
rest
sta
kes
into
acco
unt
the
8%ro
yalty
onal
lcoa
lmin
eddu
eto
the
Sta
teof
Wyo
min
gas
less
or,
and
anad
ditio
nalo
verr
idin
gro
yalty
paid
Gas
tech
,Inc
.and
Wol
dO
ilP
rope
rtie
s,In
c.,
the
selle
rsw
hoso
ldth
eab
ovem
entio
ned
coal
leas
esto
us,
amou
ntin
gto
one
quar
ter
ofth
eco
alpr
oduc
tion
roya
ltypa
yabl
eto
the
Sta
teof
Wyo
min
gun
der
the
leas
espr
ovid
ed,
how
ever
,th
eov
errid
ing
roya
ltysh
alln
ever
exce
ed2%
.
AL
AS
KA
OIL
AN
DG
AS
LE
AS
ES
No
.T
en
em
en
tN
am
eL
ocati
on
Gro
ss
Acre
sE
xp
iry
Date
Use
of
Pro
pert
yW
ork
ing
Inte
rest
(%)
Net
Reven
ue
Inte
rest
(%)
1.Li
ncE
nerg
y(A
lask
a)In
c..
....
....
....
....
....
....
....
....
....
....
....
Mat
anus
ka—
Sus
itna
Bor
ough
10N
.A.
Exp
lora
tion
100
100
2.S
tate
OfA
lask
aA
DL
3907
20..
....
....
....
....
....
....
....
....
....
...
Nor
thS
lope
Bor
ough
907.
531
/06/
16E
xplo
ratio
n10
080
3.S
tate
OfA
lask
aA
DL
3908
84..
....
....
....
....
....
....
....
....
....
...
Nor
thS
lope
Bor
ough
807.
531
/01/
14E
xplo
ratio
n10
080
4.A
A08
4141
(Bur
eau
ofLa
ndM
gmt)
....
....
....
....
....
....
....
....
..N
orth
Slo
peB
orou
gh11
,500
01/1
0/22
Exp
lora
tion
100
805.
AA
0817
26(B
urea
uof
Land
Mgm
t)..
....
....
....
....
....
....
....
....
Nor
thS
lope
Bor
ough
6,13
301
/10/
19E
xplo
ratio
n10
080
AL
AS
KA
CO
AL
LIC
EN
CE
S
No
.T
en
em
en
tN
am
eL
ocati
on
Gro
ss
Acre
sE
xp
iry
Date
Use
of
Pro
pert
yW
ork
ing
Inte
rest
(%)
Net
Reven
ue
Inte
rest
(%)
1.A
KM
enta
lHea
lthT
rust
....
....
....
....
....
....
....
....
....
....
....
...
MH
T94
0043
4D
enal
i&F
airb
anks
N.S
tar
Bor
ough
59,0
99.1
01/0
5/18
Coa
lExp
lora
tion
N.A
.N
.A.
2.A
KM
enta
lHea
lthT
rust
....
....
....
....
....
....
....
....
....
....
....
...
MH
T92
0046
2K
enai
Pen
nins
ula
Bor
ough
82,1
22.7
01/0
5/18
Coa
lExp
lora
tion
N.A
.N
.A.
3.A
KM
enta
lHea
lthT
rust
....
....
....
....
....
....
....
....
....
....
....
...
MH
T92
0046
1M
atan
uska
-Sus
itna
Bor
ough
25,3
74.9
01/0
5/18
Coa
lExp
lora
tion
N.A
.N
.A.
H-12
For
per
sona
l use
onl
y
GU
LF
CO
AS
TO
ILA
ND
GA
SL
EA
SE
S
No
.L
ease
Nam
eL
esso
rC
ou
nty
Sta
teG
ross
Acre
sE
xp
iry
Date
(1)
Use
of
Pro
pert
y
Wo
rkin
gIn
tere
st
(%)
Net
Reven
ue
Inte
rest
(%)
1.S
tate
Tra
ct12
6..
....
....
....
.S
tate
ofT
exas
Leas
e#7
4324
Cha
mbe
rsT
exas
360
Upo
npe
rman
entc
essa
tion
ofpr
oduc
tion
Oil
and
gas
prod
uctio
n10
077
.2
2.S
tate
Tra
ct12
5..
....
....
....
.S
tate
ofT
exas
Leas
eN
o.M
-115
873
Cha
mbe
rsT
exas
320
Upo
npe
rman
entc
essa
tion
ofpr
oduc
tion
Oil
and
gas
prod
uctio
n10
080
3.S
tate
Tra
ct12
7..
....
....
....
.S
tate
ofT
exas
Leas
eN
o.M
-115
903
Cha
mbe
rsT
exas
320
Upo
npe
rman
entc
essa
tion
ofpr
oduc
tion
Oil
and
gas
prod
uctio
n10
080
4.S
tate
Tra
ct72
....
....
....
....
.S
tate
ofT
exas
Leas
eN
o.M
-115
872
Cha
mbe
rsT
exas
40U
pon
perm
anen
tces
satio
nof
prod
uctio
nO
ilan
dga
spr
oduc
tion
100
80
5.S
tate
Tra
ct12
6A..
....
....
...
Sta
teof
Tex
asLe
ase
#M-1
0813
9C
ham
bers
Tex
as28
0U
pon
perm
anen
tces
satio
nof
prod
uctio
nO
ilan
dga
spr
oduc
tion
100
77.2
6.E
.W.B
arbe
r“D
”(S
amso
n)Le
ase
....
....
....
....
....
....
..J.
R.B
arbe
r,et
alC
ham
bers
Tex
as25
Upo
npe
rman
entc
essa
tion
ofpr
oduc
tion
Oil
and
gas
prod
uctio
n10
074
.5
7.A
.E.B
arbe
rLe
ase
....
....
....
Art
hur
E.B
arbe
r,et
uxC
ham
bers
Tex
as73
Upo
npe
rman
entc
essa
tion
ofpr
oduc
tion
Oil
and
gas
prod
uctio
n10
079
.0
8.L.
E.F
itzge
rald
Uni
t...
....
....
Mar
yO
.Sco
tt,et
vir
Cha
mbe
rsT
exas
47.7
7U
pon
perm
anen
tces
satio
nof
prod
uctio
nO
ilan
dga
spr
oduc
tion
100
78.6
Sar
ahE
.Mor
gan,
etvi
ret
alC
ham
bers
Tex
asA
lma
A.E
bers
pach
er,e
tal
Cha
mbe
rsT
exas
Ann
aD
avis
and
A.C
.Dav
isC
ham
bers
Tex
asF
.M.F
itzge
rald
,eta
lC
ham
bers
Tex
asT
.C.F
itzge
rald
and
Wife
Cha
mbe
rsT
exas
9.K
irby
“B”
Leas
e..
....
....
....
.K
irby
Pet
role
umC
ompa
ny,
etal
Cha
mbe
rsT
exas
107.
864
Upo
npe
rman
entc
essa
tion
ofpr
oduc
tion
Oil
and
gas
prod
uctio
n10
079
.1
10.
Kirb
y“C
”Le
ase
....
....
....
...
John
She
arer
Cha
mbe
rsT
exas
15U
pon
perm
anen
tces
satio
nof
prod
uctio
nO
ilan
dga
spr
oduc
tion
100
79.0
Kirb
yP
etro
leum
Com
pany
,et
alC
ham
bers
Tex
as
11.
Kirb
yP
etro
leum
Com
pany
(Sam
son)
Leas
e..
....
....
....
Kirb
yP
etro
leum
Com
pany
Cha
mbe
rsT
exas
49.5
Upo
npe
rman
entc
essa
tion
ofpr
oduc
tion
Oil
and
gas
prod
uctio
n10
074
.0
12.
Esp
eyLe
ase
....
....
....
....
..R
ober
tH.E
spey
II,Li
nG
.E
spey
and
Will
iam
P.E
spey
and
Uni
onS
eabo
ard
Cor
pora
tion
Cha
mbe
rsT
exas
60.2
6U
pon
perm
anen
tces
satio
nof
prod
uctio
nO
ilan
dga
spr
oduc
tion
100
74.0
H-13
For
per
sona
l use
onl
y
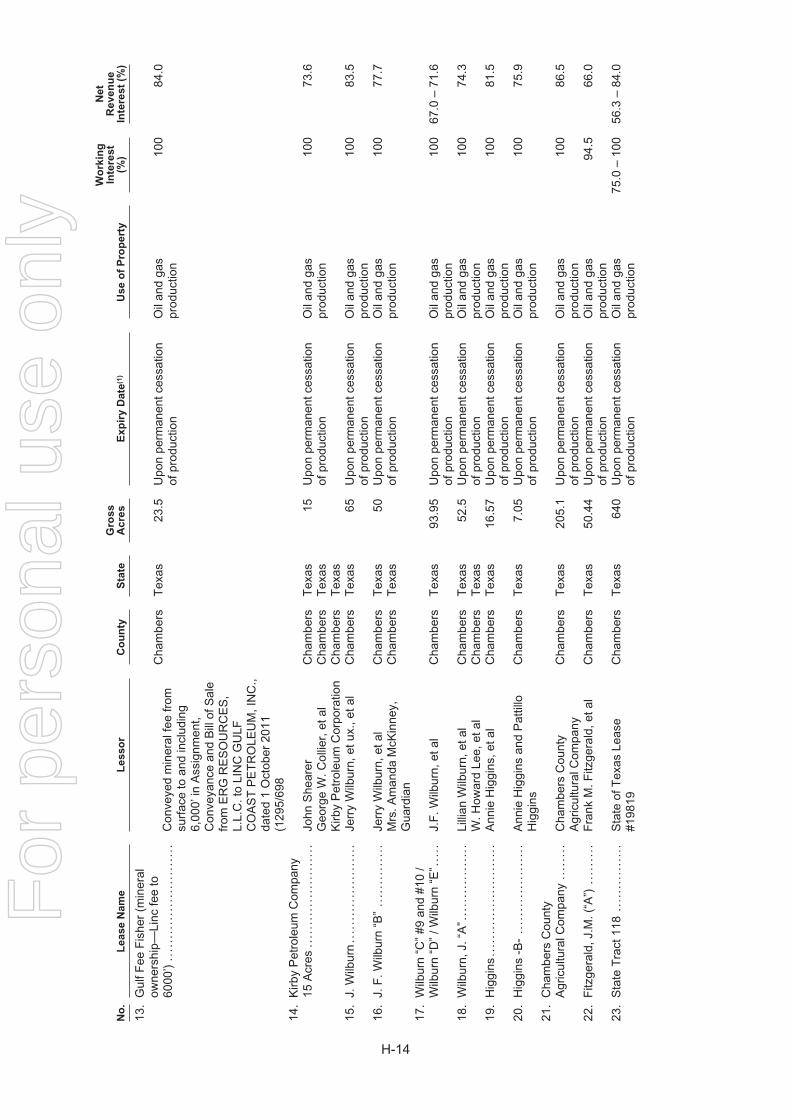
No
.L
ease
Nam
eL
esso
rC
ou
nty
Sta
teG
ross
Acre
sE
xp
iry
Date
(1)
Use
of
Pro
pert
y
Wo
rkin
gIn
tere
st
(%)
Net
Reven
ue
Inte
rest
(%)
13.
Gul
fFee
Fis
her
(min
eral
owne
rshi
p—Li
ncfe
eto
6000
’)..
....
....
....
....
....
....
Con
veye
dm
iner
alfe
efr
omsu
rfac
eto
and
incl
udin
g6,
000’
inA
ssig
nmen
t,C
onve
yanc
ean
dB
illof
Sal
efr
omE
RG
RE
SO
UR
CE
S,
L.L.
C.t
oLI
NC
GU
LFC
OA
ST
PE
TR
OLE
UM
,IN
C.,
date
d1
Oct
ober
2011
(129
5/69
8
Cha
mbe
rsT
exas
23.5
Upo
npe
rman
entc
essa
tion
ofpr
oduc
tion
Oil
and
gas
prod
uctio
n10
084
.0
14.
Kirb
yP
etro
leum
Com
pany
15A
cres
....
....
....
....
....
...
John
She
arer
Cha
mbe
rsT
exas
15U
pon
perm
anen
tces
satio
nof
prod
uctio
nO
ilan
dga
spr
oduc
tion
100
73.6
Geo
rge
W.C
ollie
r,et
alC
ham
bers
Tex
asK
irby
Pet
role
umC
orpo
ratio
nC
ham
bers
Tex
as15
.J.
Wilb
urn
....
....
....
....
....
..Je
rry
Wilb
urn,
etux
.,et
alC
ham
bers
Tex
as65
Upo
npe
rman
entc
essa
tion
ofpr
oduc
tion
Oil
and
gas
prod
uctio
n10
083
.5
16.
J.F
.Wilb
urn
“B”
....
....
....
..Je
rry
Wilb
urn,
etal
Cha
mbe
rsT
exas
50U
pon
perm
anen
tces
satio
nof
prod
uctio
nO
ilan
dga
spr
oduc
tion
100
77.7
Mrs
.Am
anda
McK
inne
y,G
uard
ian
Cha
mbe
rsT
exas
17.
Wilb
urn
“C”
#9an
d#1
0/
Wilb
urn
“D”
/Wilb
urn
“E”.
....
J.F
.Wilb
urn,
etal
Cha
mbe
rsT
exas
93.9
5U
pon
perm
anen
tces
satio
nof
prod
uctio
nO
ilan
dga
spr
oduc
tion
100
67.0
–71
.6
18.
Wilb
urn,
J.“A
”...
....
....
....
..Li
llian
Wilb
urn,
etal
Cha
mbe
rsT
exas
52.5
Upo
npe
rman
entc
essa
tion
ofpr
oduc
tion
Oil
and
gas
prod
uctio
n10
074
.3W
.How
ard
Lee,
etal
Cha
mbe
rsT
exas
19.
Hig
gins
....
....
....
....
....
....
.A
nnie
Hig
gins
,eta
lC
ham
bers
Tex
as16
.57
Upo
npe
rman
entc
essa
tion
ofpr
oduc
tion
Oil
and
gas
prod
uctio
n10
081
.5
20.
Hig
gins
-B-
....
....
....
....
....
Ann
ieH
iggi
nsan
dP
attil
loH
iggi
nsC
ham
bers
Tex
as7.
05U
pon
perm
anen
tces
satio
nof
prod
uctio
nO
ilan
dga
spr
oduc
tion
100
75.9
21.
Cha
mbe
rsC
ount
yA
gric
ultu
ralC
ompa
ny..
....
..C
ham
bers
Cou
nty
Agr
icul
tura
lCom
pany
Cha
mbe
rsT
exas
205.
1U
pon
perm
anen
tces
satio
nof
prod
uctio
nO
ilan
dga
spr
oduc
tion
100
86.5
22.
Fitz
gera
ld,J
.M.(
“A”)
....
....
.F
rank
M.F
itzge
rald
,eta
lC
ham
bers
Tex
as50
.44
Upo
npe
rman
entc
essa
tion
ofpr
oduc
tion
Oil
and
gas
prod
uctio
n94
.566
.0
23.
Sta
teT
ract
118
....
....
....
...
Sta
teof
Tex
asLe
ase
#198
19C
ham
bers
Tex
as64
0U
pon
perm
anen
tces
satio
nof
prod
uctio
nO
ilan
dga
spr
oduc
tion
75.0
–10
056
.3–
84.0
H-14
For
per
sona
l use
onl
y
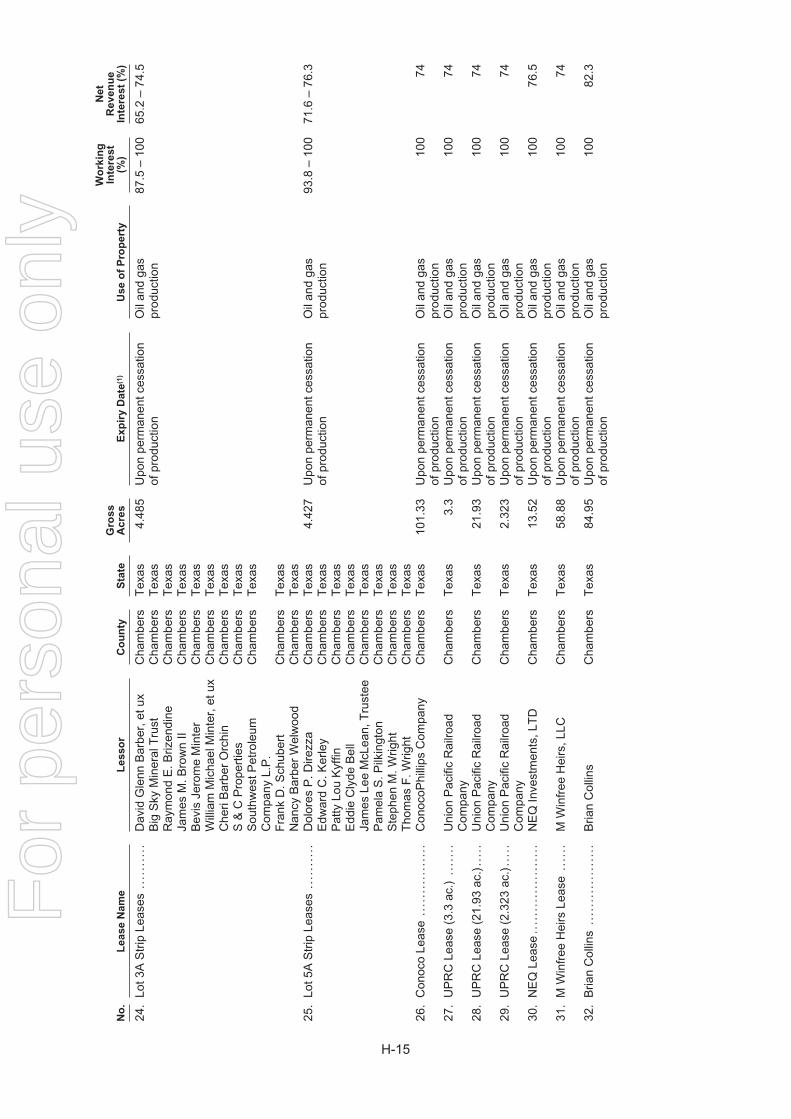
No
.L
ease
Nam
eL
esso
rC
ou
nty
Sta
teG
ross
Acre
sE
xp
iry
Date
(1)
Use
of
Pro
pert
y
Wo
rkin
gIn
tere
st
(%)
Net
Reven
ue
Inte
rest
(%)
24.
Lot3
AS
trip
Leas
es..
....
....
Dav
idG
lenn
Bar
ber,
etux
Cha
mbe
rsT
exas
4.48
5U
pon
perm
anen
tces
satio
nof
prod
uctio
nO
ilan
dga
spr
oduc
tion
87.5
–10
065
.2–
74.5
Big
Sky
Min
eral
Tru
stC
ham
bers
Tex
asR
aym
ond
E.B
rizen
dine
Cha
mbe
rsT
exas
Jam
esM
.Bro
wn
IIC
ham
bers
Tex
asB
evis
Jero
me
Min
ter
Cha
mbe
rsT
exas
Will
iam
Mic
hael
Min
ter,
etux
Cha
mbe
rsT
exas
Che
riB
arbe
rO
rchi
nC
ham
bers
Tex
asS
&C
Pro
pert
ies
Cha
mbe
rsT
exas
Sou
thw
estP
etro
leum
Com
pany
L.P
.C
ham
bers
Tex
as
Fra
nkD
.Sch
uber
tC
ham
bers
Tex
asN
ancy
Bar
ber
Wel
woo
dC
ham
bers
Tex
as25
.Lo
t5A
Str
ipLe
ases
....
....
..D
olor
esP
.Dire
zza
Cha
mbe
rsT
exas
4.42
7U
pon
perm
anen
tces
satio
nof
prod
uctio
nO
ilan
dga
spr
oduc
tion
93.8
–10
071
.6–
76.3
Edw
ard
C.K
erle
yC
ham
bers
Tex
asP
atty
Lou
Kyf
finC
ham
bers
Tex
asE
ddie
Cly
deB
ell
Cha
mbe
rsT
exas
Jam
esLe
eM
cLea
n,T
rust
eeC
ham
bers
Tex
asP
amel
aS
.Pilk
ingt
onC
ham
bers
Tex
asS
teph
enM
.Wrig
htC
ham
bers
Tex
asT
hom
asF
.Wrig
htC
ham
bers
Tex
as26
.C
onoc
oLe
ase
....
....
....
....
Con
ocoP
hilli
psC
ompa
nyC
ham
bers
Tex
as10
1.33
Upo
npe
rman
entc
essa
tion
ofpr
oduc
tion
Oil
and
gas
prod
uctio
n10
074
27.
UP
RC
Leas
e(3
.3ac
.)..
....
.U
nion
Pac
ific
Rai
lroad
Com
pany
Cha
mbe
rsT
exas
3.3
Upo
npe
rman
entc
essa
tion
ofpr
oduc
tion
Oil
and
gas
prod
uctio
n10
074
28.
UP
RC
Leas
e(2
1.93
ac.)
....
.U
nion
Pac
ific
Rai
lroad
Com
pany
Cha
mbe
rsT
exas
21.9
3U
pon
perm
anen
tces
satio
nof
prod
uctio
nO
ilan
dga
spr
oduc
tion
100
74
29.
UP
RC
Leas
e(2
.323
ac.)
....
.U
nion
Pac
ific
Rai
lroad
Com
pany
Cha
mbe
rsT
exas
2.32
3U
pon
perm
anen
tces
satio
nof
prod
uctio
nO
ilan
dga
spr
oduc
tion
100
74
30.
NE
QLe
ase
....
....
....
....
....
NE
QIn
vest
men
ts,L
TD
Cha
mbe
rsT
exas
13.5
2U
pon
perm
anen
tces
satio
nof
prod
uctio
nO
ilan
dga
spr
oduc
tion
100
76.5
31.
MW
infr
eeH
eirs
Leas
e..
....
MW
infr
eeH
eirs
,LLC
Cha
mbe
rsT
exas
58.8
8U
pon
perm
anen
tces
satio
nof
prod
uctio
nO
ilan
dga
spr
oduc
tion
100
74
32.
Bria
nC
ollin
s..
....
....
....
....
Bria
nC
ollin
sC
ham
bers
Tex
as84
.95
Upo
npe
rman
entc
essa
tion
ofpr
oduc
tion
Oil
and
gas
prod
uctio
n10
082
.3
H-15
For
per
sona
l use
onl
y
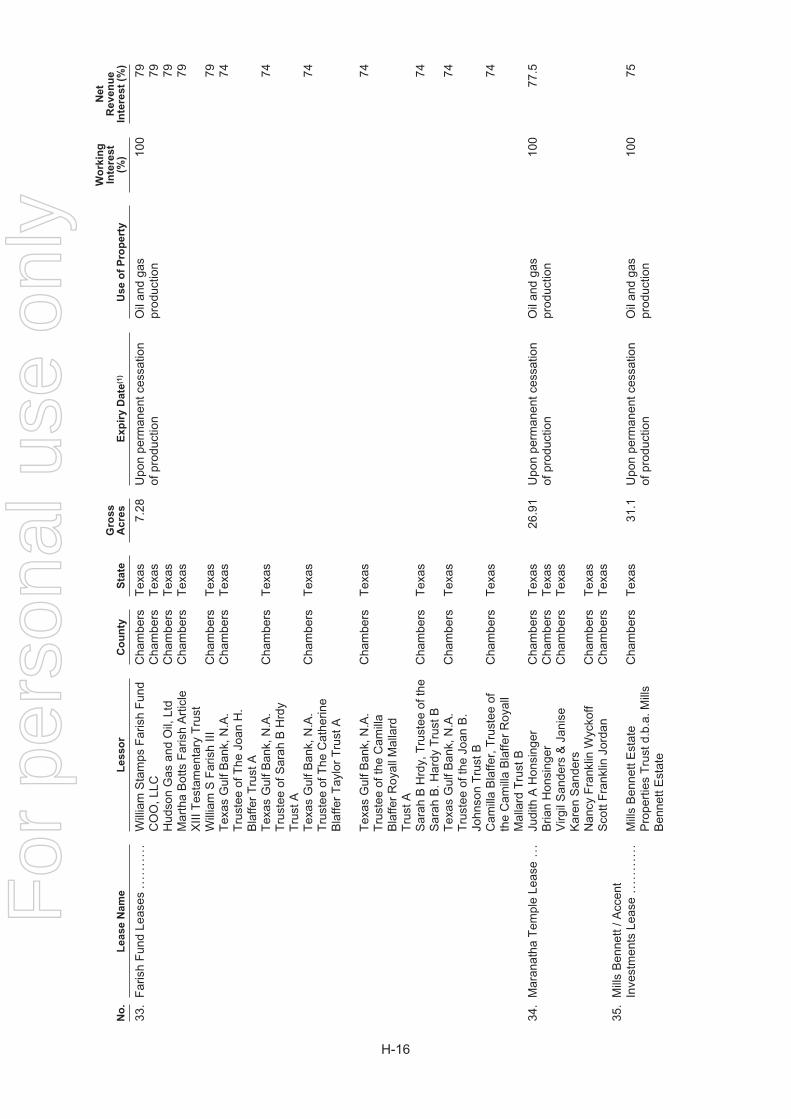
No
.L
ease
Nam
eL
esso
rC
ou
nty
Sta
teG
ross
Acre
sE
xp
iry
Date
(1)
Use
of
Pro
pert
y
Wo
rkin
gIn
tere
st
(%)
Net
Reven
ue
Inte
rest
(%)
33.
Far
ish
Fun
dLe
ases
....
....
..W
illia
mS
tam
psF
aris
hF
und
Cha
mbe
rsT
exas
7.28
Upo
npe
rman
entc
essa
tion
ofpr
oduc
tion
Oil
and
gas
prod
uctio
n10
079
CO
O,L
LCC
ham
bers
Tex
as79
Hud
son
Gas
and
Oil,
Ltd
Cha
mbe
rsT
exas
79M
arth
aB
otts
Far
ish
Art
icle
XIII
Tes
tam
enta
ryT
rust
Cha
mbe
rsT
exas
79
Will
iam
SF
aris
hIII
Cha
mbe
rsT
exas
79T
exas
Gul
fBan
k,N
.A.
Tru
stee
ofT
heJo
anH
.B
laffe
rT
rust
A
Cha
mbe
rsT
exas
74
Tex
asG
ulfB
ank,
N.A
.T
rust
eeof
Sar
ahB
Hrd
yT
rust
A
Cha
mbe
rsT
exas
74
Tex
asG
ulfB
ank,
N.A
.T
rust
eeof
The
Cat
herin
eB
laffe
rT
aylo
rT
rust
A
Cha
mbe
rsT
exas
74
Tex
asG
ulfB
ank,
N.A
.T
rust
eeof
the
Cam
illa
Bla
ffer
Roy
allM
alla
rdT
rust
A
Cha
mbe
rsT
exas
74
Sar
ahB
Hrd
y,T
rust
eeof
the
Sar
ahB
.Har
dyT
rust
BC
ham
bers
Tex
as74
Tex
asG
ulfB
ank,
N.A
.T
rust
eeof
the
Joan
B.
John
son
Tru
stB
Cha
mbe
rsT
exas
74
Cam
illa
Bla
ffer,
Tru
stee
ofth
eC
amill
aB
laffe
rR
oyal
lM
alla
rdT
rust
B
Cha
mbe
rsT
exas
74
34.
Mar
anat
haT
empl
eLe
ase
...
Judi
thA
Hon
sing
erC
ham
bers
Tex
as26
.91
Upo
npe
rman
entc
essa
tion
ofpr
oduc
tion
Oil
and
gas
prod
uctio
n10
077
.5B
rian
Hon
sing
erC
ham
bers
Tex
asV
irgil
San
ders
&Ja
nise
Kar
enS
ande
rsC
ham
bers
Tex
as
Nan
cyF
rank
linW
ycko
ffC
ham
bers
Tex
asS
cott
Fra
nklin
Jord
anC
ham
bers
Tex
as35
.M
ills
Ben
nett
/Acc
ent
Inve
stm
ents
Leas
e..
....
....
.M
ills
Ben
nett
Est
ate
Pro
pert
ies
Tru
std.
b.a.
Mill
sB
enne
ttE
stat
e
Cha
mbe
rsT
exas
31.1
Upo
npe
rman
entc
essa
tion
ofpr
oduc
tion
Oil
and
gas
prod
uctio
n10
075
H-16
For
per
sona
l use
onl
y
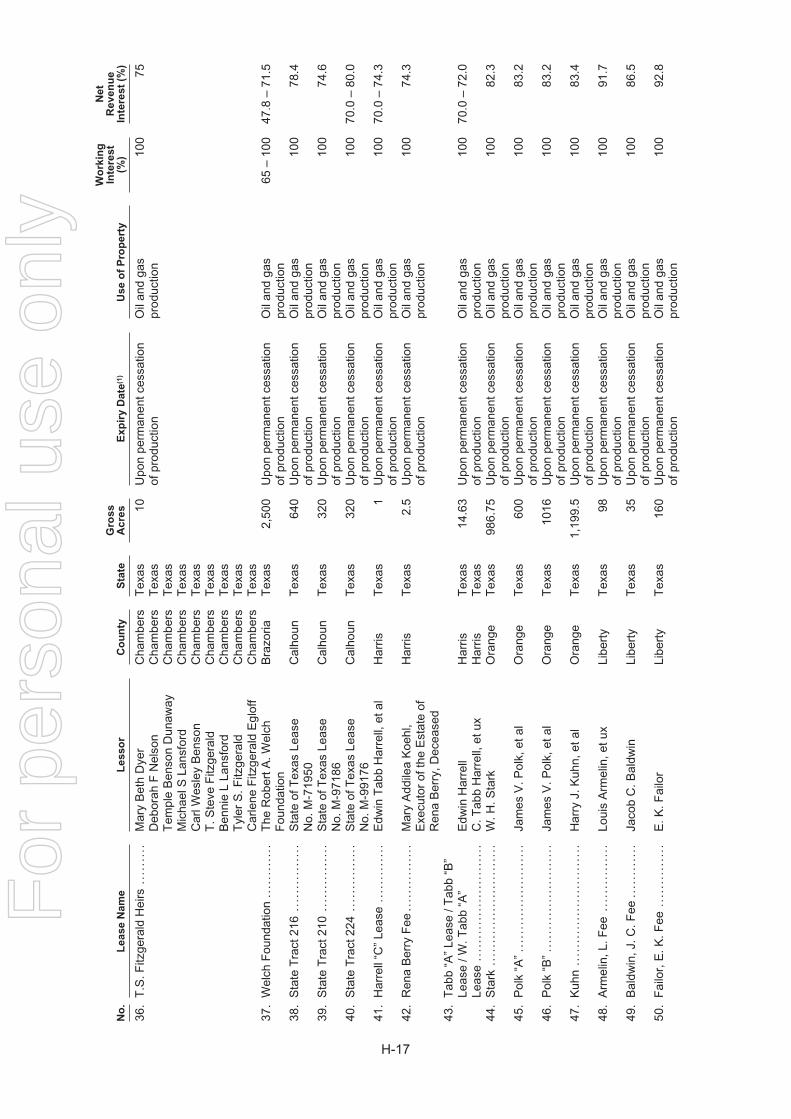
No
.L
ease
Nam
eL
esso
rC
ou
nty
Sta
teG
ross
Acre
sE
xp
iry
Date
(1)
Use
of
Pro
pert
y
Wo
rkin
gIn
tere
st
(%)
Net
Reven
ue
Inte
rest
(%)
36.
T.S
.Fitz
gera
ldH
eirs
....
....
.M
ary
Bet
hD
yer
Cha
mbe
rsT
exas
10U
pon
perm
anen
tces
satio
nof
prod
uctio
nO
ilan
dga
spr
oduc
tion
100
75D
ebor
ahF
Nel
son
Cha
mbe
rsT
exas
Tem
ple
Ben
son
Dun
away
Cha
mbe
rsT
exas
Mic
hael
SLa
nsfo
rdC
ham
bers
Tex
asC
arlW
esle
yB
enso
nC
ham
bers
Tex
asT
.Ste
veF
itzge
rald
Cha
mbe
rsT
exas
Ben
nie
LLa
nsfo
rdC
ham
bers
Tex
asT
yler
S.F
itzge
rald
Cha
mbe
rsT
exas
Car
lene
Fitz
gera
ldE
glof
fC
ham
bers
Tex
as37
.W
elch
Fou
ndat
ion
....
....
....
The
Rob
ertA
.Wel
chF
ound
atio
nB
razo
riaT
exas
2,50
0U
pon
perm
anen
tces
satio
nof
prod
uctio
nO
ilan
dga
spr
oduc
tion
65–
100
47.8
–71
.5
38.
Sta
teT
ract
216
....
....
....
...
Sta
teof
Tex
asLe
ase
No.
M-7
1950
Cal
houn
Tex
as64
0U
pon
perm
anen
tces
satio
nof
prod
uctio
nO
ilan
dga
spr
oduc
tion
100
78.4
39.
Sta
teT
ract
210
....
....
....
...
Sta
teof
Tex
asLe
ase
No.
M-9
7186
Cal
houn
Tex
as32
0U
pon
perm
anen
tces
satio
nof
prod
uctio
nO
ilan
dga
spr
oduc
tion
100
74.6
40.
Sta
teT
ract
224
....
....
....
...
Sta
teof
Tex
asLe
ase
No.
M-9
9176
Cal
houn
Tex
as32
0U
pon
perm
anen
tces
satio
nof
prod
uctio
nO
ilan
dga
spr
oduc
tion
100
70.0
–80
.0
41.
Har
rell
“C”
Leas
e..
....
....
...
Edw
inT
abb
Har
rell,
etal
Har
risT
exas
1U
pon
perm
anen
tces
satio
nof
prod
uctio
nO
ilan
dga
spr
oduc
tion
100
70.0
–74
.3
42.
Ren
aB
erry
Fee
....
....
....
...
Mar
yA
ddile
aK
oehl
,E
xecu
tor
ofth
eE
stat
eof
Ren
aB
erry
,Dec
ease
d
Har
risT
exas
2.5
Upo
npe
rman
entc
essa
tion
ofpr
oduc
tion
Oil
and
gas
prod
uctio
n10
074
.3
43.
Tab
b“A
”Le
ase
/Tab
b“B
”Le
ase
/W.T
abb
“A”
Leas
e..
....
....
....
....
....
....
Edw
inH
arre
llH
arris
Tex
as14
.63
Upo
npe
rman
entc
essa
tion
ofpr
oduc
tion
Oil
and
gas
prod
uctio
n10
070
.0–
72.0
C.T
abb
Har
rell,
etux
Har
risT
exas
44.
Sta
rk..
....
....
....
....
....
....
.W
.H.S
tark
Ora
nge
Tex
as98
6.75
Upo
npe
rman
entc
essa
tion
ofpr
oduc
tion
Oil
and
gas
prod
uctio
n10
082
.3
45.
Pol
k“A
”..
....
....
....
....
....
..Ja
mes
V.P
olk,
etal
Ora
nge
Tex
as60
0U
pon
perm
anen
tces
satio
nof
prod
uctio
nO
ilan
dga
spr
oduc
tion
100
83.2
46.
Pol
k“B
”..
....
....
....
....
....
..Ja
mes
V.P
olk,
etal
Ora
nge
Tex
as10
16U
pon
perm
anen
tces
satio
nof
prod
uctio
nO
ilan
dga
spr
oduc
tion
100
83.2
47.
Kuh
n..
....
....
....
....
....
....
.H
arry
J.K
uhn,
etal
Ora
nge
Tex
as1,
199.
5U
pon
perm
anen
tces
satio
nof
prod
uctio
nO
ilan
dga
spr
oduc
tion
100
83.4
48.
Arm
elin
,L.F
ee..
....
....
....
.Lo
uis
Arm
elin
,etu
xLi
bert
yT
exas
98U
pon
perm
anen
tces
satio
nof
prod
uctio
nO
ilan
dga
spr
oduc
tion
100
91.7
49.
Bal
dwin
,J.C
.Fee
....
....
....
Jaco
bC
.Bal
dwin
Libe
rty
Tex
as35
Upo
npe
rman
entc
essa
tion
ofpr
oduc
tion
Oil
and
gas
prod
uctio
n10
086
.5
50.
Fai
lor,
E.K
.Fee
....
....
....
..E
.K.F
ailo
rLi
bert
yT
exas
160
Upo
npe
rman
entc
essa
tion
ofpr
oduc
tion
Oil
and
gas
prod
uctio
n10
092
.8
H-17
For
per
sona
l use
onl
y
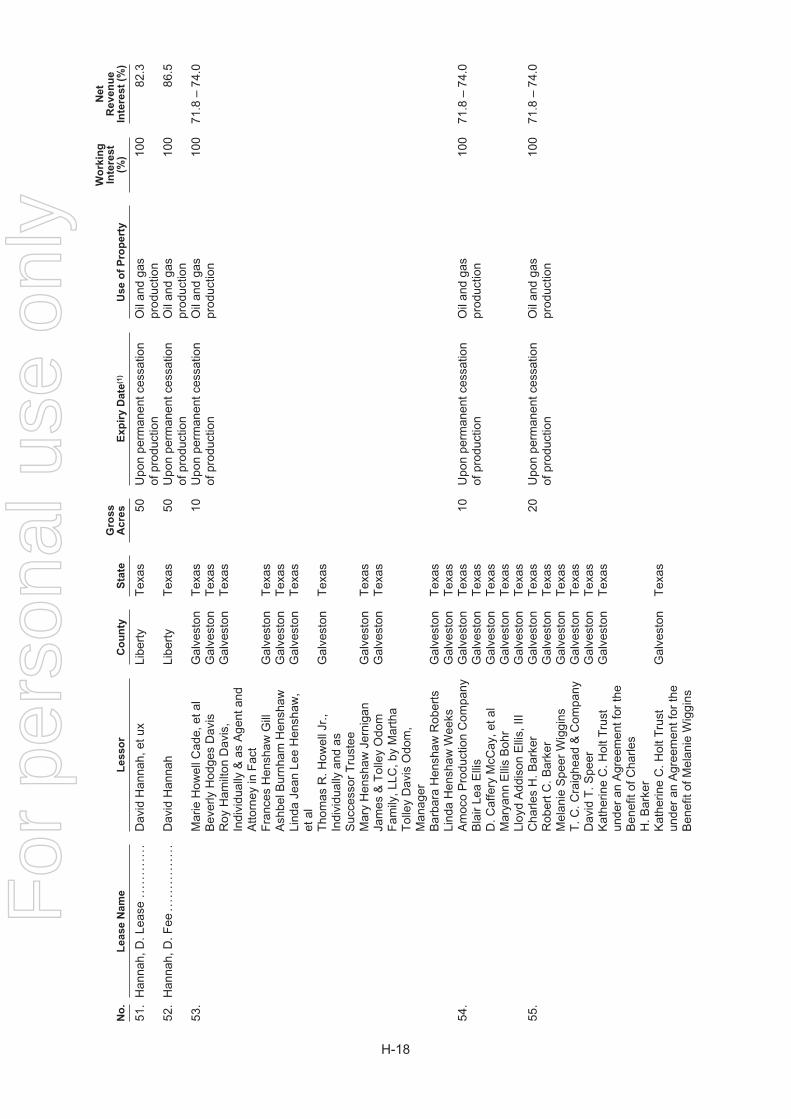
No
.L
ease
Nam
eL
esso
rC
ou
nty
Sta
teG
ross
Acre
sE
xp
iry
Date
(1)
Use
of
Pro
pert
y
Wo
rkin
gIn
tere
st
(%)
Net
Reven
ue
Inte
rest
(%)
51.
Han
nah,
D.L
ease
....
....
....
Dav
idH
anna
h,et
uxLi
bert
yT
exas
50U
pon
perm
anen
tces
satio
nof
prod
uctio
nO
ilan
dga
spr
oduc
tion
100
82.3
52.
Han
nah,
D.F
ee..
....
....
....
.D
avid
Han
nah
Libe
rty
Tex
as50
Upo
npe
rman
entc
essa
tion
ofpr
oduc
tion
Oil
and
gas
prod
uctio
n10
086
.5
53.
Mar
ieH
owel
lCad
e,et
alG
alve
ston
Tex
as10
Upo
npe
rman
entc
essa
tion
ofpr
oduc
tion
Oil
and
gas
prod
uctio
n10
071
.8–
74.0
Bev
erly
Hod
ges
Dav
isG
alve
ston
Tex
asR
oyH
amilt
onD
avis
,In
divi
dual
ly&
asA
gent
and
Atto
rney
inF
act
Gal
vest
onT
exas
Fra
nces
Hen
shaw
Gill
Gal
vest
onT
exas
Ash
belB
urnh
amH
ensh
awG
alve
ston
Tex
asLi
nda
Jean
Lee
Hen
shaw
,et
alG
alve
ston
Tex
as
Tho
mas
R.H
owel
lJr.
,In
divi
dual
lyan
das
Suc
cess
orT
rust
ee
Gal
vest
onT
exas
Mar
yH
ensh
awJe
rnig
anG
alve
ston
Tex
asJa
mes
&T
olle
yO
dom
Fam
ily,L
LC,b
yM
arth
aT
olle
yD
avis
Odo
m,
Man
ager
Gal
vest
onT
exas
Bar
bara
Hen
shaw
Rob
erts
Gal
vest
onT
exas
Lind
aH
ensh
awW
eeks
Gal
vest
onT
exas
54.
Am
oco
Pro
duct
ion
Com
pany
Gal
vest
onT
exas
10U
pon
perm
anen
tces
satio
nof
prod
uctio
nO
ilan
dga
spr
oduc
tion
100
71.8
–74
.0B
lair
Lea
Elli
sG
alve
ston
Tex
asD
.Caf
fery
McC
ay,e
tal
Gal
vest
onT
exas
Mar
yann
Elli
sB
ohr
Gal
vest
onT
exas
Lloy
dA
ddis
onE
llis,
IIIG
alve
ston
Tex
as55
.C
harle
sH
.Bar
ker
Gal
vest
onT
exas
20U
pon
perm
anen
tces
satio
nof
prod
uctio
nO
ilan
dga
spr
oduc
tion
100
71.8
–74
.0R
ober
tC.B
arke
rG
alve
ston
Tex
asM
elan
ieS
peer
Wig
gins
Gal
vest
onT
exas
T.C
.Cra
ighe
ad&
Com
pany
Gal
vest
onT
exas
Dav
idT
.Spe
erG
alve
ston
Tex
asK
athe
rine
C.H
oltT
rust
unde
ran
Agr
eem
entf
orth
eB
enef
itof
Cha
rles
H.B
arke
r
Gal
vest
onT
exas
Kat
herin
eC
.Hol
tTru
stun
der
anA
gree
men
tfor
the
Ben
efit
ofM
elan
ieW
iggi
ns
Gal
vest
onT
exas
H-18
For
per
sona
l use
onl
y
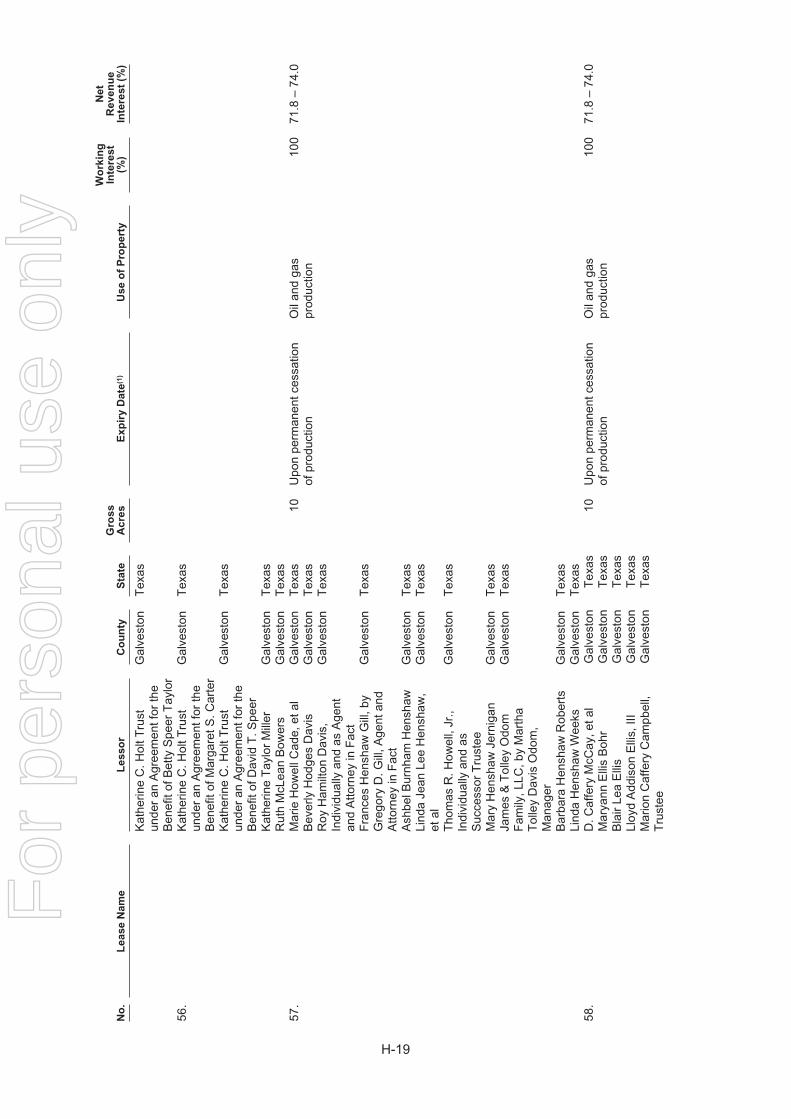
No
.L
ease
Nam
eL
esso
rC
ou
nty
Sta
teG
ross
Acre
sE
xp
iry
Date
(1)
Use
of
Pro
pert
y
Wo
rkin
gIn
tere
st
(%)
Net
Reven
ue
Inte
rest
(%)
Kat
herin
eC
.Hol
tTru
stun
der
anA
gree
men
tfor
the
Ben
efit
ofB
etty
Spe
erT
aylo
r
Gal
vest
onT
exas
56.
Kat
herin
eC
.Hol
tTru
stun
der
anA
gree
men
tfor
the
Ben
efit
ofM
arga
retS
.Car
ter
Gal
vest
onT
exas
Kat
herin
eC
.Hol
tTru
stun
der
anA
gree
men
tfor
the
Ben
efit
ofD
avid
T.S
peer
Gal
vest
onT
exas
Kat
herin
eT
aylo
rM
iller
Gal
vest
onT
exas
Rut
hM
cLea
nB
ower
sG
alve
ston
Tex
as57
.M
arie
How
ellC
ade,
etal
Gal
vest
onT
exas
10U
pon
perm
anen
tces
satio
nof
prod
uctio
nO
ilan
dga
spr
oduc
tion
100
71.8
–74
.0B
ever
lyH
odge
sD
avis
Gal
vest
onT
exas
Roy
Ham
ilton
Dav
is,
Indi
vidu
ally
and
asA
gent
and
Atto
rney
inF
act
Gal
vest
onT
exas
Fra
nces
Hen
shaw
Gill
,by
Gre
gory
D.G
ill,A
gent
and
Atto
rney
inF
act
Gal
vest
onT
exas
Ash
belB
urnh
amH
ensh
awG
alve
ston
Tex
asLi
nda
Jean
Lee
Hen
shaw
,et
alG
alve
ston
Tex
as
Tho
mas
R.H
owel
l,Jr
.,In
divi
dual
lyan
das
Suc
cess
orT
rust
ee
Gal
vest
onT
exas
Mar
yH
ensh
awJe
rnig
anG
alve
ston
Tex
asJa
mes
&T
olle
yO
dom
Fam
ily,L
LC,b
yM
arth
aT
olle
yD
avis
Odo
m,
Man
ager
Gal
vest
onT
exas
Bar
bara
Hen
shaw
Rob
erts
Gal
vest
onT
exas
Lind
aH
ensh
awW
eeks
Gal
vest
onT
exas
58.
D.C
affe
ryM
cCay
,eta
lG
alve
ston
Tex
as10
Upo
npe
rman
entc
essa
tion
ofpr
oduc
tion
Oil
and
gas
prod
uctio
n10
071
.8–
74.0
Mar
yann
Elli
sB
ohr
Gal
vest
onT
exas
Bla
irLe
aE
llis
Gal
vest
onT
exas
Lloy
dA
ddis
onE
llis,
IIIG
alve
ston
Tex
asM
ario
nC
affe
ryC
ampb
ell,
Tru
stee
Gal
vest
onT
exas
H-19
For
per
sona
l use
onl
y
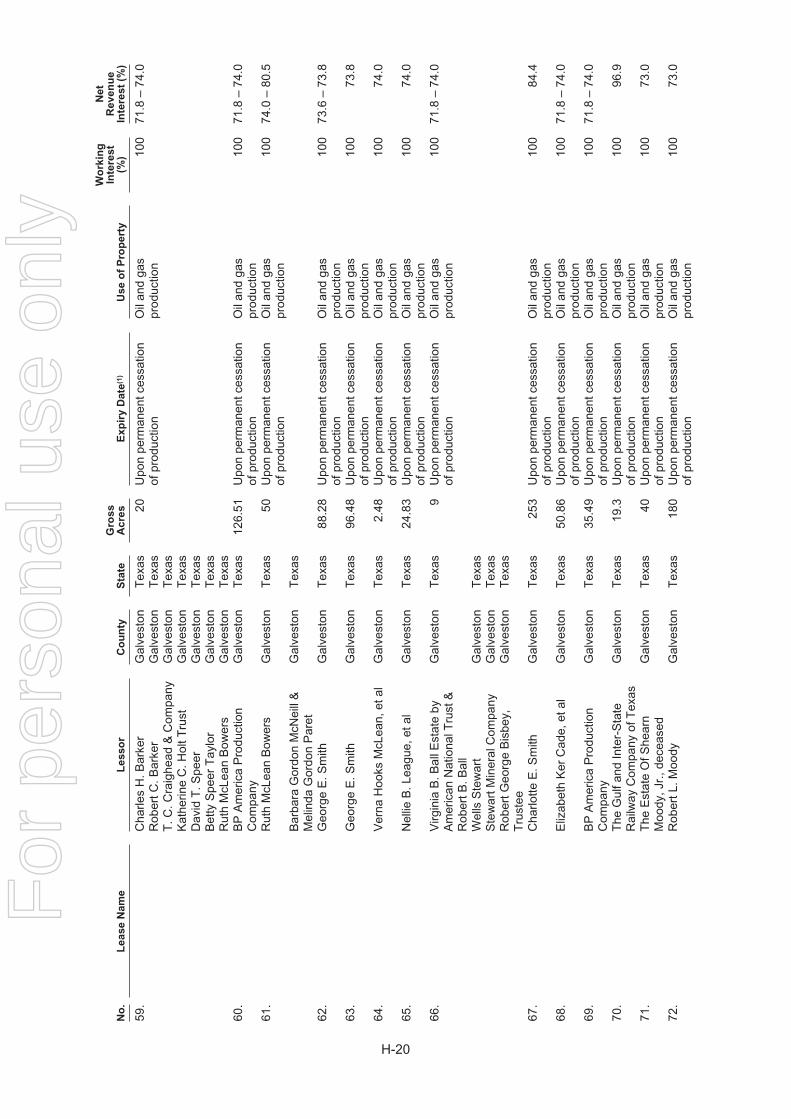
No
.L
ease
Nam
eL
esso
rC
ou
nty
Sta
teG
ross
Acre
sE
xp
iry
Date
(1)
Use
of
Pro
pert
y
Wo
rkin
gIn
tere
st
(%)
Net
Reven
ue
Inte
rest
(%)
59.
Cha
rles
H.B
arke
rG
alve
ston
Tex
as20
Upo
npe
rman
entc
essa
tion
ofpr
oduc
tion
Oil
and
gas
prod
uctio
n10
071
.8–
74.0
Rob
ertC
.Bar
ker
Gal
vest
onT
exas
T.C
.Cra
ighe
ad&
Com
pany
Gal
vest
onT
exas
Kat
herin
eC
.Hol
tTru
stG
alve
ston
Tex
asD
avid
T.S
peer
Gal
vest
onT
exas
Bet
tyS
peer
Tay
lor
Gal
vest
onT
exas
Rut
hM
cLea
nB
ower
sG
alve
ston
Tex
as60
.B
PA
mer
ica
Pro
duct
ion
Com
pany
Gal
vest
onT
exas
126.
51U
pon
perm
anen
tces
satio
nof
prod
uctio
nO
ilan
dga
spr
oduc
tion
100
71.8
–74
.0
61.
Rut
hM
cLea
nB
ower
sG
alve
ston
Tex
as50
Upo
npe
rman
entc
essa
tion
ofpr
oduc
tion
Oil
and
gas
prod
uctio
n10
074
.0–
80.5
Bar
bara
Gor
don
McN
eill
&M
elin
daG
ordo
nP
aret
Gal
vest
onT
exas
62.
Geo
rge
E.S
mith
Gal
vest
onT
exas
88.2
8U
pon
perm
anen
tces
satio
nof
prod
uctio
nO
ilan
dga
spr
oduc
tion
100
73.6
–73
.8
63.
Geo
rge
E.S
mith
Gal
vest
onT
exas
96.4
8U
pon
perm
anen
tces
satio
nof
prod
uctio
nO
ilan
dga
spr
oduc
tion
100
73.8
64.
Ver
naH
ooks
McL
ean,
etal
Gal
vest
onT
exas
2.48
Upo
npe
rman
entc
essa
tion
ofpr
oduc
tion
Oil
and
gas
prod
uctio
n10
074
.0
65.
Nel
lieB
.Lea
gue,
etal
Gal
vest
onT
exas
24.8
3U
pon
perm
anen
tces
satio
nof
prod
uctio
nO
ilan
dga
spr
oduc
tion
100
74.0
66.
Virg
inia
B.B
allE
stat
eby
Am
eric
anN
atio
nalT
rust
&R
ober
tB.B
all
Gal
vest
onT
exas
9U
pon
perm
anen
tces
satio
nof
prod
uctio
nO
ilan
dga
spr
oduc
tion
100
71.8
–74
.0
Wel
lsS
tew
art
Gal
vest
onT
exas
Ste
war
tMin
eral
Com
pany
Gal
vest
onT
exas
Rob
ertG
eorg
eB
isbe
y,T
rust
eeG
alve
ston
Tex
as
67.
Cha
rlotte
E.S
mith
Gal
vest
onT
exas
253
Upo
npe
rman
entc
essa
tion
ofpr
oduc
tion
Oil
and
gas
prod
uctio
n10
084
.4
68.
Eliz
abet
hK
erC
ade,
etal
Gal
vest
onT
exas
50.8
6U
pon
perm
anen
tces
satio
nof
prod
uctio
nO
ilan
dga
spr
oduc
tion
100
71.8
–74
.0
69.
BP
Am
eric
aP
rodu
ctio
nC
ompa
nyG
alve
ston
Tex
as35
.49
Upo
npe
rman
entc
essa
tion
ofpr
oduc
tion
Oil
and
gas
prod
uctio
n10
071
.8–
74.0
70.
The
Gul
fand
Inte
r-S
tate
Rai
lway
Com
pany
ofT
exas
Gal
vest
onT
exas
19.3
Upo
npe
rman
entc
essa
tion
ofpr
oduc
tion
Oil
and
gas
prod
uctio
n10
096
.9
71.
The
Est
ate
OfS
hear
nM
oody
,Jr.
,dec
ease
dG
alve
ston
Tex
as40
Upo
npe
rman
entc
essa
tion
ofpr
oduc
tion
Oil
and
gas
prod
uctio
n10
073
.0
72.
Rob
ertL
.Moo
dyG
alve
ston
Tex
as18
0U
pon
perm
anen
tces
satio
nof
prod
uctio
nO
ilan
dga
spr
oduc
tion
100
73.0
H-20
For
per
sona
l use
onl
y
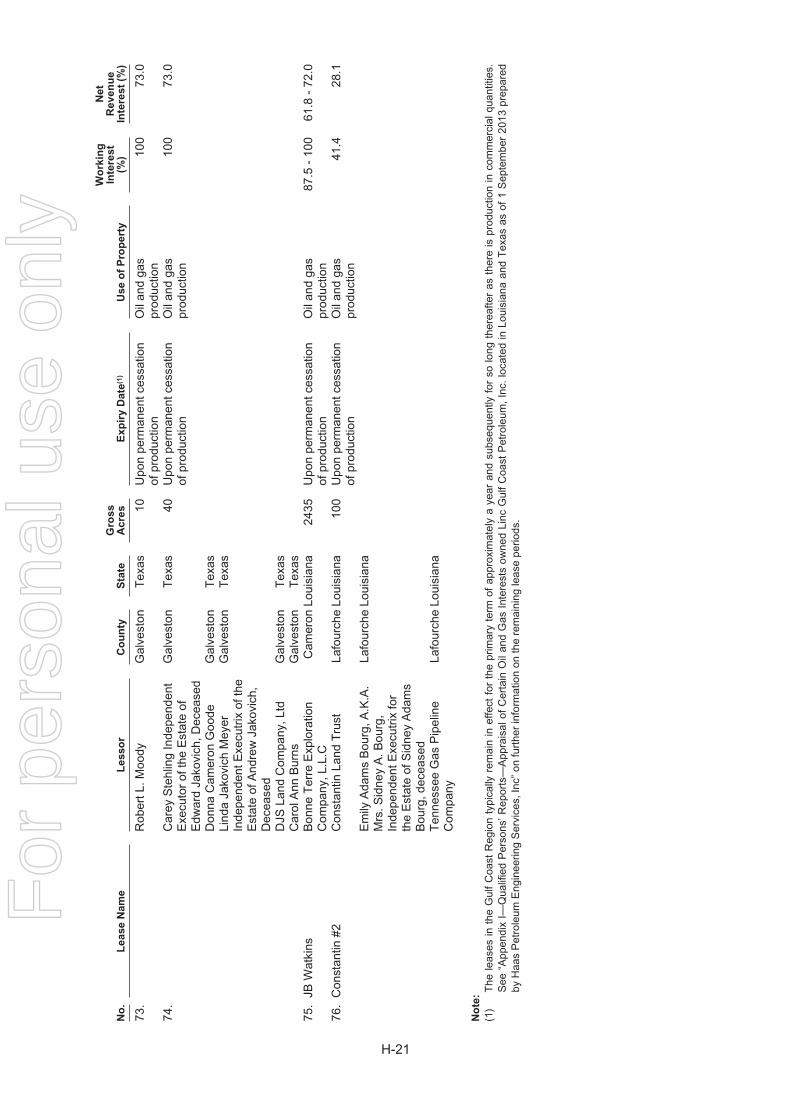
No
.L
ease
Nam
eL
esso
rC
ou
nty
Sta
teG
ross
Acre
sE
xp
iry
Date
(1)
Use
of
Pro
pert
y
Wo
rkin
gIn
tere
st
(%)
Net
Reven
ue
Inte
rest
(%)
73.
Rob
ertL
.Moo
dyG
alve
ston
Tex
as10
Upo
npe
rman
entc
essa
tion
ofpr
oduc
tion
Oil
and
gas
prod
uctio
n10
073
.0
74.
Car
eyS
tehl
ing
Inde
pend
ent
Exe
cuto
rof
the
Est
ate
ofE
dwar
dJa
kovi
ch,D
ecea
sed
Gal
vest
onT
exas
40U
pon
perm
anen
tces
satio
nof
prod
uctio
nO
ilan
dga
spr
oduc
tion
100
73.0
Don
naC
amer
onG
oode
Gal
vest
onT
exas
Lind
aJa
kovi
chM
eyer
Inde
pend
entE
xecu
trix
ofth
eE
stat
eof
And
rew
Jako
vich
,D
ecea
sed
Gal
vest
onT
exas
DJS
Land
Com
pany
,Ltd
Gal
vest
onT
exas
Car
olA
nnB
urns
Gal
vest
onT
exas
75.
JBW
atki
nsB
onne
Ter
reE
xplo
ratio
nC
ompa
ny,L
.L.C
Cam
eron
Loui
sian
a24
35U
pon
perm
anen
tces
satio
nof
prod
uctio
nO
ilan
dga
spr
oduc
tion
87.5
-10
061
.8-
72.0
76.
Con
stan
tin#2
Con
stan
tinLa
ndT
rust
Lafo
urch
eLo
uisi
ana
100
Upo
npe
rman
entc
essa
tion
ofpr
oduc
tion
Oil
and
gas
prod
uctio
n41
.428
.1
Em
ilyA
dam
sB
ourg
,A.K
.A.
Mrs
.Sid
ney
A.B
ourg
,In
depe
nden
tExe
cutr
ixfo
rth
eE
stat
eof
Sid
ney
Ada
ms
Bou
rg,d
ecea
sed
Lafo
urch
eLo
uisi
ana
Ten
ness
eeG
asP
ipel
ine
Com
pany
Lafo
urch
eLo
uisi
ana
No
te:
(1)
The
leas
esin
the
Gul
fC
oast
Reg
ion
typi
cally
rem
ain
inef
fect
for
the
prim
ary
term
ofap
prox
imat
ely
aye
aran
dsu
bseq
uent
lyfo
rso
long
ther
eafte
ras
ther
eis
prod
uctio
nin
com
mer
cial
quan
titie
s.S
ee“A
ppen
dix
I—Q
ualif
ied
Per
sons
’Rep
orts
—A
ppra
isal
ofC
erta
inO
ilan
dG
asIn
tere
sts
owne
dLi
ncG
ulf
Coa
stP
etro
leum
,In
c.lo
cate
din
Loui
sian
aan
dT
exas
asof
1S
epte
mbe
r20
13pr
epar
edby
Haa
sP
etro
leum
Eng
inee
ring
Ser
vice
s,In
c”on
furt
her
info
rmat
ion
onth
ere
mai
ning
leas
epe
riods
.
H-21
For
per
sona
l use
onl
y

[THIS PAGE INTENTIONALLY LEFT BLANK]
For
per
sona
l use
onl
y

[THIS PAGE INTENTIONALLY LEFT BLANK]
For
per
sona
l use
onl
y

[THIS PAGE INTENTIONALLY LEFT BLANK]
For
per
sona
l use
onl
y

CoMpETiTiVESTRENGTHS
Diversified energy company with operating control of a global portfolio of conventional and unconventional oil, gas and coal assets and proven UCG technology ready for commercialisation
• Thelargestlistedindependentupstreamoilandgas exploration and production company in Singapore and one of the largest in South East Asia, in each case, by proved and probable reserves.
• ThelargestSingapore-listedcoalcompanybytotal coal resources.
Strategically positioned and equipped to capitalise on robust demand for oil and gas in Asia; particularly the switch from oil and coal to gas in regional markets
• HighrelevanceoftheCompany’sproprietary UCG technology to the Asian energy market given the large number of potentially suitable coal resources in Asia, namely in China, Mongolia and Indonesia.
• Assetsarestrategicallylocatedinregionsnearhighenergy demand centres across Asia-Pacific and the United States.
High quality, low risk, oil levered production with potential significant production upside from assets currently under development and from exploration
• ProducingGulfCoastRegionassetsarelocatedinoneoftheworld’smostwell-knownoilandgasproducing regions; with net 2P reserves consisting of more than 95% oil. The oil from its Gulf Coast Region assets is considered high quality due to the fact that the Company receives LLS pricing, which has historically traded at a premium to WTI prices.
• ApplicationofGTLtotransformUCGsyngasto UCG syncrude can potentially address the oil supply deficit.
• OilandgasconsumptionintheAsia-Pacificregion increased from 10,804 MMBOE to 13,826 MMBOE between 2005 and 2012, representing a CAGR of 3.6%. Expected to continue increasing from 14,343 in 2013 MMBOE to 17,051 in 2018.
• InWyoming,potentialpeakgrossproductionof10,000 to 15,000 BOPD in the mid-term (between three and five years) utilising a CO2 Enhanced Oil Recovery Project, subject to adequate availability of CO2.
• FortheUmiatfieldinAlaska,targetpeakproduction of 50,000 BOPD (gross) before 2020.
• AccesstovastmajorityoftheArckaringaBasin’spotential shale oil and gas resources.
ProduCtion weLLinJeCtion weLL
uCg CaVitYCoaL seaM
water taBLe
Contracted royalty stream from the Carmichael coal tenement anticipated to provide stable medium to long-term cashflows
• ContractualrighttoreceiveA$2pertonne(indexed to the CPI (Brisbane) All Groups number) of coal produced at the Carmichael project in Queensland, Australia for the first 20 years of its production.
LINC ENERGY HAS POTENTIAL SHALE OIL AND GAS RESOURCES WITH UNRISKED PROSPECTIVE RESOURCES FOR UNCONVENTIONAL RESERVOIRS OF 232.8 BNBOE
Proven management team with development, operational and technical expertise
• Hastrackrecordofdevelopingsignificantprojects worldwide across oil, gas and coal value chains.
• Establishedbaseofrelationshipswithdomestic and foreign governments, national and international oil companies, service companies and independent oil and gas companies.
Leader in UCG technology
• Believedtobetheonlycompanyintheworldtohave demonstrated UCG to GTL, and to have produced diesel and jet fuel from UCG syngas, providing first mover advantage in the UCG front.
• ProprietaryUCGtechnologyisprotectedbyintellectual property rights.
Linc Energy intends to significantly increase production in the mid-term via Carbon Dioxide EOR technique at some of our oil and gas facilities.
LincEnergy’soilandgasassetsintheGulfCoastRegionarelocatedinoneoftheworld’smostwell-knownoilandgasproducingregionswithalonghistory of oil and gas exploration and production.
For
per
sona
l use
onl
y
AustraliaREGISTERED OFFICELinc Energy Ltd.Smellie & Co Building32 Edward StreetBrisbane, Queensland, 4000, Australia
GPO Box 1315, Brisbane, QLD, 4001
Ph: +61 7 3229 0800Fax: +61 7 3229 6800
Linc En
Ergy Ltd
For
per
sona
l use
onl
y

Linc En
Ergy Ltd
Volume 1
For
per
sona
l use
onl
y