Embed Size (px)
Citation preview

MANAGEMENT AND BUSINESS ADMINISTRATION DOCTORAL SCHOOL
Thesis Booklet
Erika Jáki
The behavioural motives of the optimistic EPS forecasting error
Analysing Hungarian and Austrian companies’ EPS forecasts
Ph.D. thesis
Supervisor:
Dr. Miklós Virág
Professor
Budapest, 2012


Department of Enterprise Finances
Thesis Booklet
Erika Jáki
The behavioural motives of the optimistic EPS forecasting error
Analysing Hungarian and Austrian companies’ EPS forecasts
Ph.D. theses
Supervisor:
Dr. Miklós Virág
Professor
Budapest, 2012
© Erika Jáki


1
Table of contents
I. Research background and the rationale for theme selection _______________________ 2
A. Review of the references _____________________________________________________ 3
B. The structure of the thesis ____________________________________________________ 4
II. Methods applied __________________________________________________________ 5
C. Database __________________________________________________________________ 5
D. Hypotheses and methodology _________________________________________________ 6
II. The results of the thesis __________________________________________________ 9
A. Systematic optimism ________________________________________________________ 9
A. The impact of the crisis as negative information and an uncertainty factor ____________ 11
B. Weighting the information: the effect of EPSt-1 on the EPSerr ______________________ 15
C. Conclusion ________________________________________________________________ 19
III. Main references of the dissertation ______________________________________ 22
A. Publications related to the dissertation ________________________________________ 24
B. Presentations on conferences related to the dissertation __________________________ 25

2
I. Research background and the rationale for theme selection
The theme of my thesis is financial planning, with a focus on the earnings per share
(EPS) forecasting error (hereinafter: EPSerr). I have been already active in the field of
corporate financial planning for more than 10 years. First, as SAP adviser in controlling area
in 2001-2002, then as controlling manager at a multinational company from 2002 to 2008,
where I was in charge of financial planning and regular financial reporting. Since 2005,
during my academic carrier, I have been teaching corporate finance and corporate financial
planning at the Corvinus University of Budapest.
There is a multitude of evidence for systematic optimism observed in EPS forecasting:
1. Most of the evidence comes from analyses of EPSerr of American companies
listed on the stock exchange (Zacks, 1979, DeBondt, Thaler, 1990, Dreman,
Berry, 1995, Clayman, Schwartz, 1994, Easterwood, Nutt, 1999, summary study
Brown, 1983).
2. Some researchers analysed the EPSerr of companies floating on stock exchanges
in Western-Europe (Capstaff, Paudyal, Rees, 2001, Beckers, Steliaros, Thomson,
2004, Bagella, Becchetti, Ciciretti, 2007).
3. I have only found one study on Central and Eastern European countries (Djatej,
Gao, Sarikas, Senteney, 2008), which examines how the introduction of the
IFRS has impacted EPS forecasting accuracy.
The causes of overplanning have been investigated from many aspects. There have been
studies on planning fallacy resulting in the conclusion that costs are underplanned to a lesser
extent than revenues are overplanned (Buhler, Griffin, Ross, 1994; Kahneman, Lovallo,
2003). Other research has looked into what motivates (especially EPS forecasting) analysts
to project higher EPS values (Lim, 2001, Brown 1993, Francis, Philbrick, 1993, Libby,
Hunton, Tan, Seybert, 2008; Ke, Yu, 2006; Cotter, Tuna, Wysocki, 2006). What is relevant to
the current theme is a third focus of studies, namely cognitive mechanisms. The thesis
presents and categorises different psychological factors. This categorisation may not
necessarily be appropriate in other disciplines as the correlation with cognitive mechanisms as
outlined in this paper is strictly specific to financial planning. The research idea has been

3
taken from an article by Kahneman and Lovallo (2003) entitled “Delusion of Success”, which
is the most comprehensive publication on behavioural causes related to this subject.
A. Review of the references
Overconfidence bias is the most frequently mentioned reason of overplanning in the
literature. (Camerer, Lovallo, 1999; Kahneman, Lovallo, 2003; Lovallo, Viguerie, Uhlaner,
Horn, 2007, Nofsinger, 2007 Weinstein, 1980, Larwood, és Whittaker, 1977). The following
factors play also important role in overplanning and are strongly connected to the
overconfidence bias:
1. the attribution error (Kahneman, Lovallo, 2003, Kahneman, Miller, 1986
Buehler, Griffin, Ross, 2002),
2. the illusion of control (Krizan és Windschitl 2007, Nofsinger, 2007; Kahneman,
Lovallo, 2003; March, Shapira, 1987), és
3. the illusion of knowledge (Brown, 1993, Easterwood és Nutt, 1999, Nofsinger,
2007).
The roles of the following factors were confirmed in the development of “illusion of
knowledge”:
1. The anchoring heuristic is an accentuated area in the financial overplanning
(Kahneman, Lovallo, 2003, Webby, O’Connor, 1996, Chapman, Johnson, 2002,
Mussweiler; Englich, 2005 Kopelman, Davis, 2004).
2. The confirmation bias (Camerer, Lovallo, 1999, Lovallo, Viguerie, Uhlaner,
Horn, 2007, Krizan és Windschitl 2007 Moisland, 2000, Strack, Mussweiser,
1997),
3. Structure of information (strategy in scenario or in a list format) (Sedor 2002),
4. The evaluation of the probability of conjunctive and disjunctive events
(Kahneman és Tversky, 1974).
Several researches have proved that higher uncertainty leads to higher forecast-
optimism (Ackert, Athanassakos, 1997; Irwin, 1953, Marks 1951, Ashbaugh, Pincus, 2001,

4
De Bondt, Thaler 1990, Duru, Reeb, 2002, Das, Levine, Sivaramakrishnan, 1998, Haw, Jung,
Ruland, 1994).
B. The structure of the thesis
I have divided my thesis into three sections. Chapter One gives an overview of the
conceptual framework necessary for processing this subject, including:
1. An introduction to the criteria of rational decision-making and to decision-
making models;
2. Normative and descriptive schools of decision sciences. These present two
different approaches to examining decision-making;
3. A brief overview of notions used by descriptive decision theory (with a focus on
the phenomenon of overplanning);
4. The definition of EPS;
5. The notion of overplanning; empirical evidence from the areas of corporate
financial planning and EPS forecasting.
Chapter Two of the thesis will discuss financial overplanning (a form of which is the
typically optimistic EPS forecast) and especially the underlying psychological causes as well
as summarising and categorising existing research findings. The psychological causes of
overplanning can be grouped into three main categories of impact:
1. overconfidence and overoptimism
2. illusion of knowledge
3. illusion of control.
The most frequently identified reason for overplanning in budgeting is the decision-
maker’s or analyst’s overconfidence and overoptimism. The other frequently mentioned
reason is the illusion of knowledge, for an explanation of which the dynamics of information
processing is to be examined. There are a number of cognitive mechanisms at play. Many
publications exist examining and proving such impacts (Epley and Gilovich 2001; Chapman
and Johnson, 2002; Mussweiler and Englich 2005; Strack and Mussweiler, 1997; Slovic,
Griffin and Tversky, 2002; Simonson and Drolet, 2004, etc.); it is on the basis of the

5
conclusions of such publications that I present, along the anchoring effect, the formation of
the illusion of knowledge in financial planning.
Chapter Three of the thesis is dedicated to empirical research. The main focus of
research was the weighting of information and making a distinction between positive and
negative information, or, strictly speaking, the empirical study of confirmation bias as one of
the causative factors of the illusion of knowledge.
II. Methods applied
C. Database
For the empirical study I make a distinction between the periods 2003-2007 and
17.09.2008-2010. I have excluded from the analysis forecasts made for the year 2008 before
17.09.2008, as in that period analysts did not yet took into account the impact of the global
financial crisis, and therefore those data may bias the conclusions.
Geographically, the study analyses EPS forecasts made for 3 Hungarian and 4 Austrian
companies:
Hungarian firms:
1. Hungarian Telecom Ltd. (MATAV)
2. Hungarian Oil and Gas Trust Ltd. (MOL)
3. OTP Bank Ltd. (OTP)
Austrian firms:
1. Telekom Austria AG (TKA)
2. OMV AG (OMV)
3. Raiffeisen Bank International AG (RBI)
4. Erste Group Bank AG (EBS)
As opposed to earlier research studies proving the systematic optimism of EPSerr, the
research I have carried out is different in both its temporal focus (post-2003 years) and
geographical scope (Hungary and Austria).
6
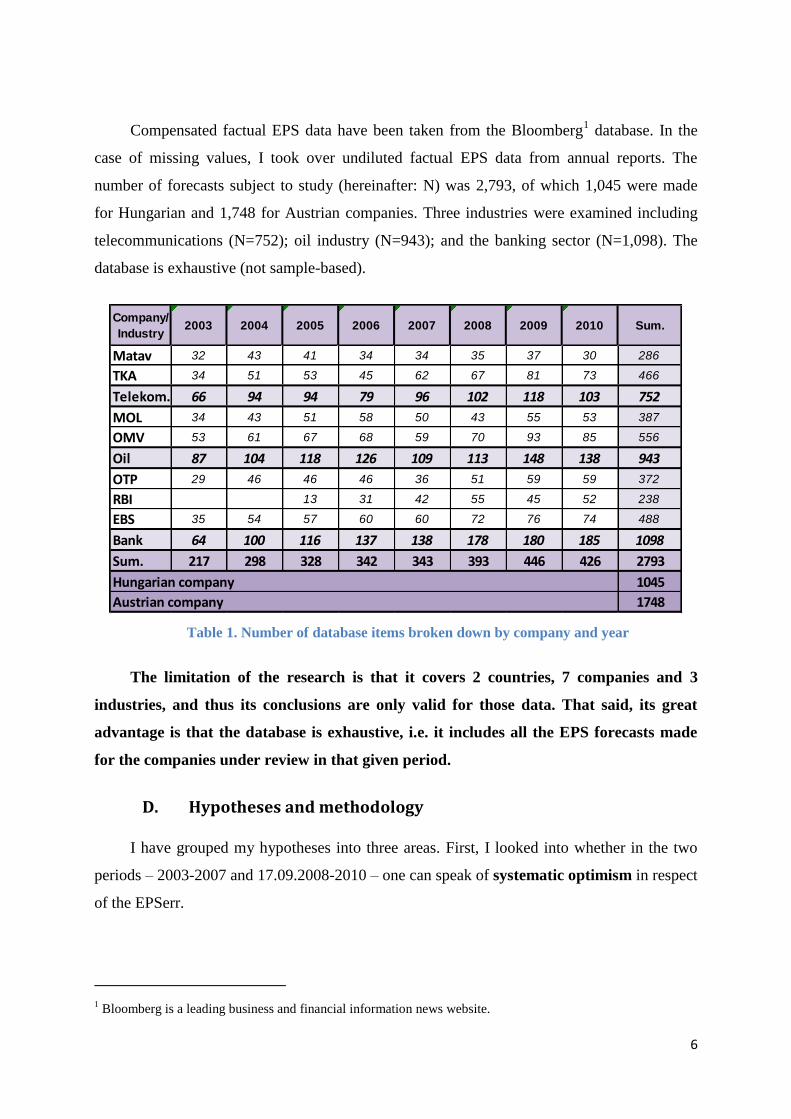
Compensated factual EPS data have been taken from the Bloomberg1 database. In the
case of missing values, I took over undiluted factual EPS data from annual reports. The
number of forecasts subject to study (hereinafter: N) was 2,793, of which 1,045 were made
for Hungarian and 1,748 for Austrian companies. Three industries were examined including
telecommunications (N=752); oil industry (N=943); and the banking sector (N=1,098). The
database is exhaustive (not sample-based).
Company/
Industry2003 2004 2005 2006 2007 2008 2009 2010 Sum.
Matav 32 43 41 34 34 35 37 30 286
TKA 34 51 53 45 62 67 81 73 466
Telekom. 66 94 94 79 96 102 118 103 752
MOL 34 43 51 58 50 43 55 53 387
OMV 53 61 67 68 59 70 93 85 556
Oil 87 104 118 126 109 113 148 138 943
OTP 29 46 46 46 36 51 59 59 372
RBI 13 31 42 55 45 52 238
EBS 35 54 57 60 60 72 76 74 488
Bank 64 100 116 137 138 178 180 185 1098
Sum. 217 298 328 342 343 393 446 426 2793
1045
1748
Hungarian company
Austrian company
Table 1. Number of database items broken down by company and year
The limitation of the research is that it covers 2 countries, 7 companies and 3
industries, and thus its conclusions are only valid for those data. That said, its great
advantage is that the database is exhaustive, i.e. it includes all the EPS forecasts made
for the companies under review in that given period.
D. Hypotheses and methodology
I have grouped my hypotheses into three areas. First, I looked into whether in the two
periods – 2003-2007 and 17.09.2008-2010 – one can speak of systematic optimism in respect
of the EPSerr.
1 Bloomberg is a leading business and financial information news website.

7
H1. On the analysed database, individual EPS forecasts are generally optimistic, i.e.
the EPSerr exceeds zero in the period 2003-2007.
H2. On the analysed database, individual EPS forecasts are generally optimistic, i.e.
the EPSerr exceeds zero in the period 17.09.2008-2010.
Making the EPSerr comparable between different companies and currencies requires
defining the relative value of the error. I have found the EPSerr definition (1) of Capstaff,
Paudyal and Rees (2001) the most suitable for studying the EPSerr.
(1)
For the analysis of H1 and H2, I use DeBondt and Thaler’s (1990) research method
considered to be a milestone in EPS forecast studies, whereby they performed a regression
analysis of the actual and forecasted change in EPS.
Then I go on to focus on the impact of the crisis. On the one hand, the crisis is negative
information, to which analysts underreact as so far shown by results, and thus the EPSerr
grows in the optimistic direction (Easterwood, Nutt, 1999, Sedor, 2002). On the other hand,
the crisis has resulted in increased uncertainty, as a consequence of which heuristics come
into play during information processing, again pushing the final decision in the optimistic
direction2. As the product of the two, what we experience is that the systematic optimism of
the EPSerr increases as a result of the crisis.
Many researchers (Agans, Shaffer, 1994; Strack, Mussweiler, 1997; Sedor, 2002;
Kadeus et al., 2006) have used the ANOVA test to substantiate a correlation between the
formed groups and the EPSerr. I perform an ANOVA test to examine whether the averages of
the two periods are significantly different.
H3. On the analysed database, the optimism of the EPSerr is greater in the crisis
years (17.09.2008-2010) than in the pre-crisis period (2003-2007).
2 Many studies have proven that as uncertainty grows so does the optimism of the EPSerr (Ackert, Athanassakos,
1997; Irwin, 1953, Marks 1951, Ashbaugh, Pincus, 2001, De Bondt, Thaler 1990, Duru, Reeb, 2002, Das,
Levine, Sivaramakrishnan, 1998, Haw, Jung, Ruland, 1994).
8
I perform a separate analysis of whether analysts appropriately weighted the news of the
crisis as negative information in their projections and how in the uncertain environment in the
wake of the crisis the scatter of EPSerr changed. Naturally, a distinction must be made here
between the period where the crisis was a piece of news and the period where it was a factor
of uncertainty. That can be accurately defined based on the scatter of the forecasted ∆EPS,
based on which I have divided the period 17.09.2008-2010 into two sub-periods – one in
which the crisis still had news value and another in which it was an uncertainty factor. I then
compare the two sub-periods using DeBondt and Thaler’s (1990) aforementioned regression
analysis method and verify the difference between averages using the ANOVA test.
H4. On the analysed database, analysts underreacted to the news of the crisis after
17.09.2008 and thus the EPSerr was optimistic.
H5. On the analysed database, the uncertainty triggered by the crisis after
17.09.2008 caused the EPSerr to grow in the optimistic direction.
I perform a further test for weighting the information. Many studies (Sedor, 2002;
Kadous, Krische, Sedor, 2006; Ali, Klein, Rosenfeld, 1992; Easterwood, Nutt, 1999) have
proven that EPSt-1 works as an anchor in making EPS forecasts. The increase in EPSt-1 is
positive information drawing overreaction from analysts, which causes the EPSerr to increase,
while its decrease is considered negative information drawing underreaction, which again
causes the EPSerr to increase.
H6. On the analysed database, a higher EPSt-1 value increases the systematic
optimism of the EPSerr as analysts overreact to positive information in both sub-
periods.
H7. On the analysed database, a lower EPSt-1 value increases the systematic
optimism of the EPSerr as analysts underreact to negative information in both
sub-periods.
I use Easterwood and Nutt’s (1999) test to verify the effect of EPSt-1 on EPS forecasts.
I re-perform their test modified by the insertion in the denominator of the EPSt-2 value rather
than the exchange rate.

9
According to the authors, both positive and negative information adds to optimism, and
therefore these two cases should be distinguished from a situation where the change in EPS is
considered to be neither particularly positive nor negative news. The interpretation of
coefficients is identical with DeBondt and Thaler’s formula with the tests here also focussing
on the value of β, but the interpretation of ß is rather complicated. A more simple analysis
will be made possible if I divide EPSt-1 into quartiles and percentiles and look at whether a
more optimistic EPSerr is characteristic with extreme percentiles and quartiles as opposed to
middle EPSt-1. As in previous studies, I also verify the correlation by using the ANOVA test.
II. The results of the thesis
A. Systematic optimism
Contrary to expectations, for the period 2003-2007 the average EPSerr was -5.93%, i.e.
EPS forecasts were pessimistic. By contrast, for the period 17.09.2008-2010 the EPSerr was
optimistic (+5,29% on average). The scatter of EPSerr grew one and half times compared to
I. Systematic optimism H1. On the analysed database, the EPSerr is syst. opt. in the period of 2003-2007. H2. On the analysed database, the EPSerr is syst. opt. in the period of 17.09.2008–
2010.
II. The effect of the financial crisis on EPSerr H3. On the analysed database, the EPSerr syst. opt. grew due to the fin. crisis. H4. On the analysed database, the EPSerr syst. opt. grew due to underreaction
to negative information about the financial crisis. H5. On the analysed database, the EPSerr syst. opt. grew amidst uncertainty
caused by the fin. crisis.
III. Weighting information:
H6. On the analysed database, higher EPSt-1 as overreaction to positive information increased the EPSerr syst. opt. in both sub-periods.
H7. On the analysed database, lower EPSt-1 as underreaction to negative information increased the EPSerr syst. opt. in both sub-periods.
Figure 1. The structure of hypotheses

10
the period 2003-2007 (from 20.19% to 36.68%), which can be explained by increased
uncertainty.
N Valid 1528 973
-5,93% 5,29%
0,52% 1,18%
-4,94% 1,32%
0,00% 0,00%
20,19% 36,68%
126,98% 88,96%
6,26% 7,84%
661,16% 415,12%
12,51% 15,67%
190,27% 356,57%
-79,56% -163,64%
110,71% 192,93%
Median
EPSerr 2003 - 2007 17.09.2008-2010
Mean
Stand. Err.
Range
Minimum
Maximum
Mode
Std. Deviation
Skewness
Std. Error of
SkewnessKurtosis
Std. Error of Kurtosis
Table 2. Descriptive statistics of EPSerr
The result of the period 2003-2007 disconfirms many earlier studies3. In this period the
economy grew dynamically, which was also followed by the actual EPS values of the
companies under review. Overall, analysts did not incorporate extreme good news into EPS
forecasts, i.e. they underreacted to them, which contradicts the received wisdom that positive
news draw overreaction.
The results of linear regression analysis applied by DeBondt and Thaler (1990) confirm
those of descriptive statistics. In the period 2003-2007, the values of α=0.122 and ß=1.044
suggest pessimistic forecasts. The crisis period is not that simple to evaluate as the value of
α=0.091 is near zero but still in positive territory, as opposed to the negative value found in
earlier studies. However, the value of ß=0.983 indicates slight optimism. Given that the
3 Zhaoyang Gu, Jian Xue (2007) examined the effect of extreme positive news and proved that analysts’ EPSerr
increased in the optimistic direction. Becchetti, Hasan, Santoro, and Anandarajan (2007) studied the impact of
the high-tech stock exchange boom between 1995-2001 and proved analysts’ optimism. Bagella, Becchetti,
Ciciretti (2007) also analysed the impact of the high-tech boom but compared the US and the Eurozone (W-
Europe) and came to the same conclusion as the other study.

11
descriptive analysis also revealed moderate optimism, the value of ß around one and that of α
around zero are acceptable.
Method α t-stat Sig. β t-stat Sig. R2 % N Pearson
korr.
Szig. (2-
tailed),122 9,160 ,000 1,044 110,499 ,000 88,89% 1528 ,943 ,000
,091 4,532 ,000 ,983 49,748 ,000 71,82% 973 ,847 ,000
Period
DeBondt, Thaler (1990)2003-2007
17.09.2008-2010
Table 3. Results of regression analysis
H1 is rejected based on the analysis of EPSerr since in the period 2003-2007
forecasts were significantly pessimistic on average.
I accept H2 as after 17.09.2008 the EPSerr was in the positive direction in respect
of both the average and median values.
A. The impact of the crisis as negative information and an
uncertainty factor
The EPSerr averages of the two periods clearly diverge but I have performed further
tests to verify H3. Based on the results of descriptive statistics, the scatter of EPSerr increased
one and a half times, a consequence of great uncertainty caused by the crisis. The Levene test
also proves the divergence of EPSerr variances in the two periods.
Levene Statistic df1 df2 Sig.
177,303 1 2499 ,000
Test of Homogeneity of Variances EPSerr 2003-2007 és 17.09.2008-2010
Table 4. H3 Levene test
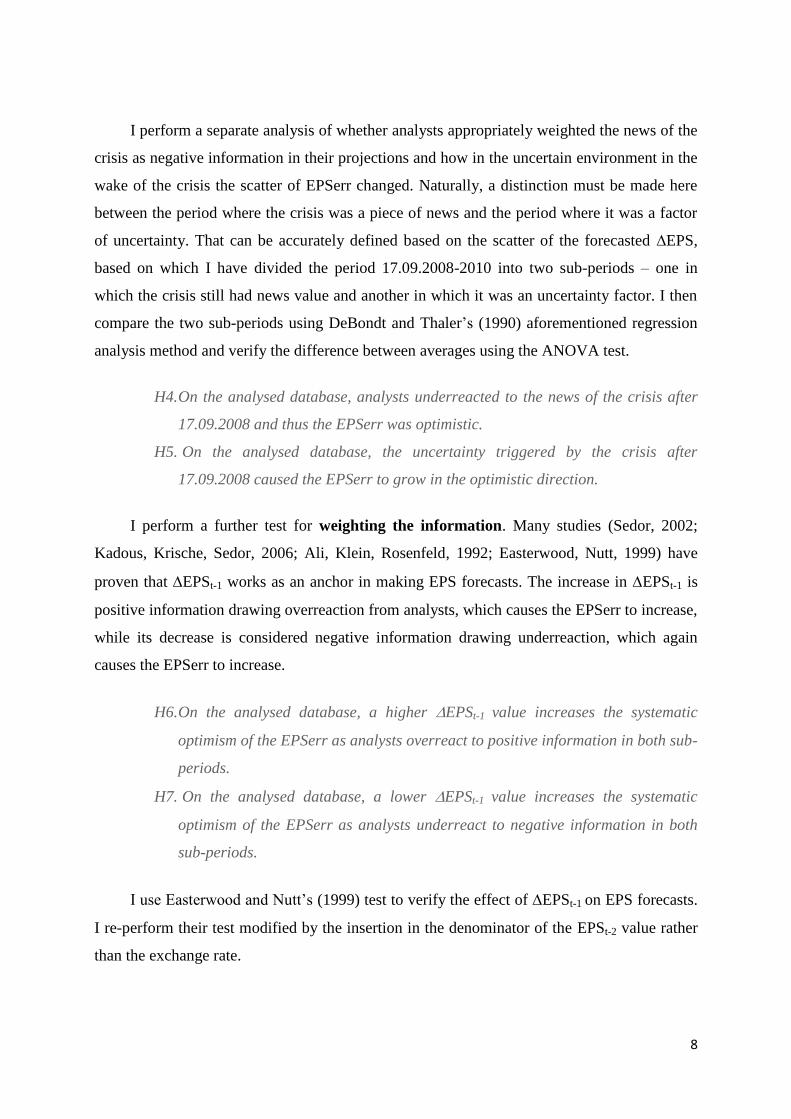
Based on the ANOVA, the EPSerr averages significantly differ in the two periods. The
correlation is weak, eta2=0.037.
12
Sum of
Squares df
Mean
Square F Sig.
7,486 1 7,486 96,919 ,000
193,032 2499 ,077
200,519 2500
0,037Eta Squared
Between Groups
ANOVA Table
Measures of Association
ANOVA table
2003-2007 and
17.09.2008-2010
Within Groups
Total
Table 5. H3 ANOVA test
Overall, the above tests have confirmed that the two periods significantly differ in
respect of both scatter on the basis of the Levene test and average values based on the
ANOVA test. These findings are also borne out by the values of descriptive statistics,
and thus I accept H3.
The crisis as negative information was a piece of news immediately after the
bankruptcy of Lehman Brothers in 2008. The uncertainty arising from the crisis only had a
discernible effect on Austrian and Hungarian companies at a later stage. I distinguish the
period in which the crisis was a piece of news from the period when it was an uncertainty
factor by studying the forecasted ∆EPS. If analysts are uncertain the scatter of the forecasted
∆EPS will be greater, while if the crisis “only” negative information which is underweighted
the scatter of the forecasted ∆EPS will not change to a significant extent.
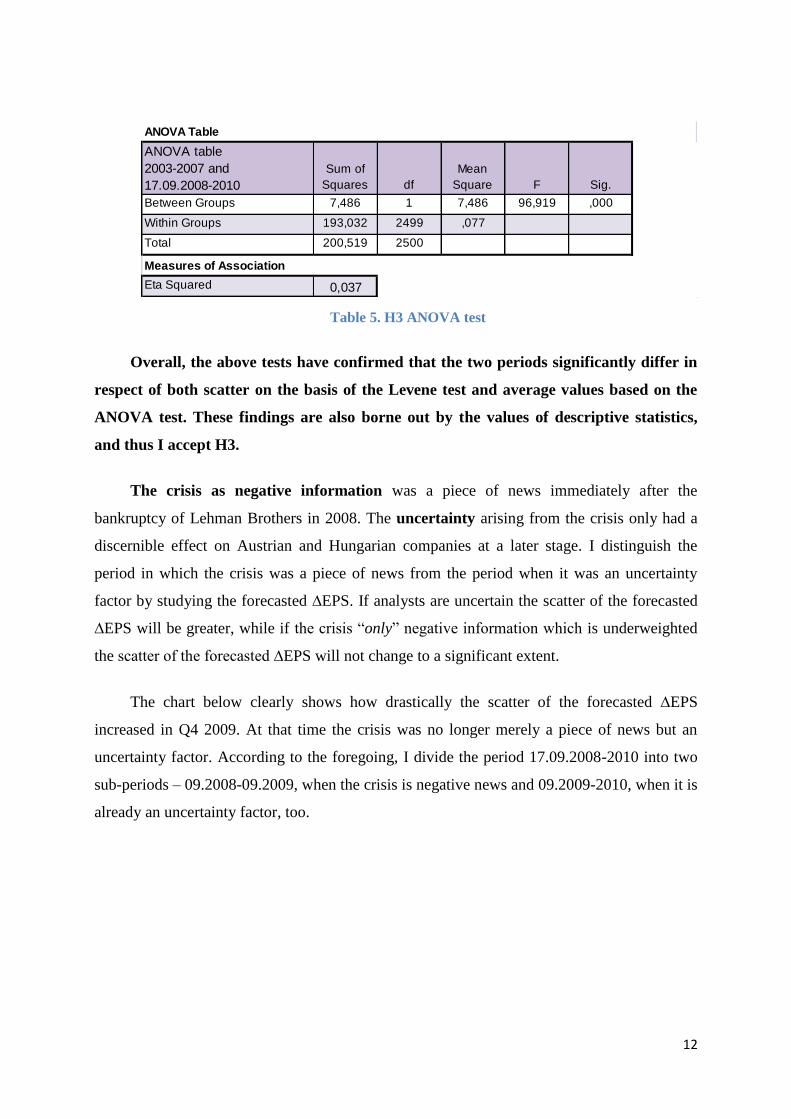
The chart below clearly shows how drastically the scatter of the forecasted ∆EPS
increased in Q4 2009. At that time the crisis was no longer merely a piece of news but an
uncertainty factor. According to the foregoing, I divide the period 17.09.2008-2010 into two
sub-periods – 09.2008-09.2009, when the crisis is negative news and 09.2009-2010, when it is
already an uncertainty factor, too.
13
Figure 2. Impact of the crisis on forecasted ∆EPS
The chart below reflects well how in 2006 and 2007 the forecasted ∆EPS (FC)
fluctuated around the actual ∆EPS (AC) with limited scatter. In the first three quarters of the
years 2008 and 2009, the forecasted change was above the actual value, i.e. forecasts were
optimistic, and then in Q4 and Q5 it approximated the actual value. It was not until the last
two quarters of 2009, when the scatter of the forecasted ∆EPS increased, that analysts made
heavy downward revisions. In this period they already gave pessimistic forecasts. In 2010
they overreacted to the effect of the crisis, i.e. forecasts remained pessimistic in Q1-3,
excluding Q4, and then in Q5, after the closure of the year, they were pessimistic again.
The impact of the financial crisis on the forecasted EPS change

14
Figure 3. The average value of forecasted ∆EPS in 2006-2010 by quarter and the actual
EPS value
The results of regression analysis also confirm the fact that while the crisis was negative
information (09.2008-09.2009), forecasts remained optimistic based on the values of ß=0.872
and α=-0.16, where the confidence interval of ß is also below zero. By contrast, when the
crisis was an uncertainty factor (09.2009-2010), optimistic forecasts were made based on the
values of ß=1.091 and α=0.086.
α t-stat Sig. β t-stat Sig.Lowwer
Bound
Upper
BoundR2 % N
Durbin
Watson
-,016 -1,113 ,267 ,872 28,086 ,000 ,811 ,933 68,2% 370 ,943
,086 2,710 ,007 1,091 39,525 ,000 1,037 1,145 75,0% 522 ,847
Period
09.2008-09.2009
10.2009-2010
Table 6. Study of the crisis as negative information and then as uncertainty factor using
DeBondt and Thaler’s regression analysis
Based on the ANOVA test, the forecasted EPS values are also significantly different in
the two periods; the strength of the correlation is eta2=0.061.
Actual and forecasted EPS change before and during the financial crisis based on the method of DeBondt and Thaler (1990)

15
ANOVA - Forecasted EPS
09.2008-09.2009 and
10.2009-2010
Sum of
Squares df
Mean
Square F Sig.
Between Groups 55,839 1 55,839 58,032 ,000
Within Groups 864,062 898 ,962
Total 919,901 899
Eta Squared 0,061
Anova table
Measures of Association
Table 7. Forecasted ∆EPS; ANOVA test on H4 and H5
I accept H4 on the basis of descriptive statistics, regression analysis and the
ANOVA test since while the crisis was negative news EPS forecasts remained optimistic.
I reject H5 since when the crisis was already an uncertainty factor optimistic forecasts
were already made.
B. Weighting the information: the effect of EPSt-1 on the EPSerr
The period 2003-2007 proved the inadequate weighting of (or underreaction to) positive
information. I explain this phenomenon by concluding that analysts underreact to extreme
positive news.
In the uncertain environment created by the crisis analysts did not underreact but
overreacted to the impact of the crisis (negative news), i.e. they made pessimistic forecasts. I
interpret it as overreaction to extreme negative news. Let us look at how EPSerr changes in
the light of EPSt-1. In forming groups the objective was to have equal numbers of items in all
groups.
In the period 2003-2007, there was growth in several categories.

16
decline gentle growth middle growth great growth
IEPS t-1I< 2, a
the four
category
together
above 1000%
growth
237 396 389 421 1443 85
15,51% 25,92% 25,46% 27,55% 94,44% 5,56%
Range-1,083 0,255 0,727 1,852
2,39061,077
Minimum -1,1244 0,045 0,232 0,586 -1,124 10,154
Maximum -0,04099 0,209 0,495 1,266 1,266 50,923
Mean -0,323 0,118 0,376 0,841 0,326 26,462
Range 162,43% 116,15% 162,45% 104,22% 190,27% 78,32%
Minimum -51,72% -79,56% -63,65% -74,51% -79,56% -52,28%
Maximum 110,71% 36,59% 98,80% 29,71% 110,71% 26,04%
Mean 9,74% -6,02% -11,79% -6,58% -5,15% -19,16%
2003-2007
N
N %
EP
S t-1
EPSe
rr
Table 8. Statistical values of EPSt-1 group formation for 2003-2007
The following chart shows well that with above 1,000% growth the absolute value of
EPSerr still remains higher but its direction is pessimistic (negative). Analysts underweight
extreme good news and thus forecasts underestimate the EPS value for the next year. This is
the same as the experience, i.e. the underweighting of extreme good news, in the period
2003-2007.
9,74%
-6,02%
-11,79%
-6,58%
-19,16%
-25,00%
-20,00%
-15,00%
-10,00%
-5,00%
0,00%
5,00%
10,00%
15,00%
decline gentle growth middle growth great growth above 1000% growth
EPSerr depending on ∆EPSt-1 in 2003-2007
Figure 4. EPSerr relative to ∆EPSt-1 in 2003-2007
During the crisis, there was of course a decline in several categories.
17
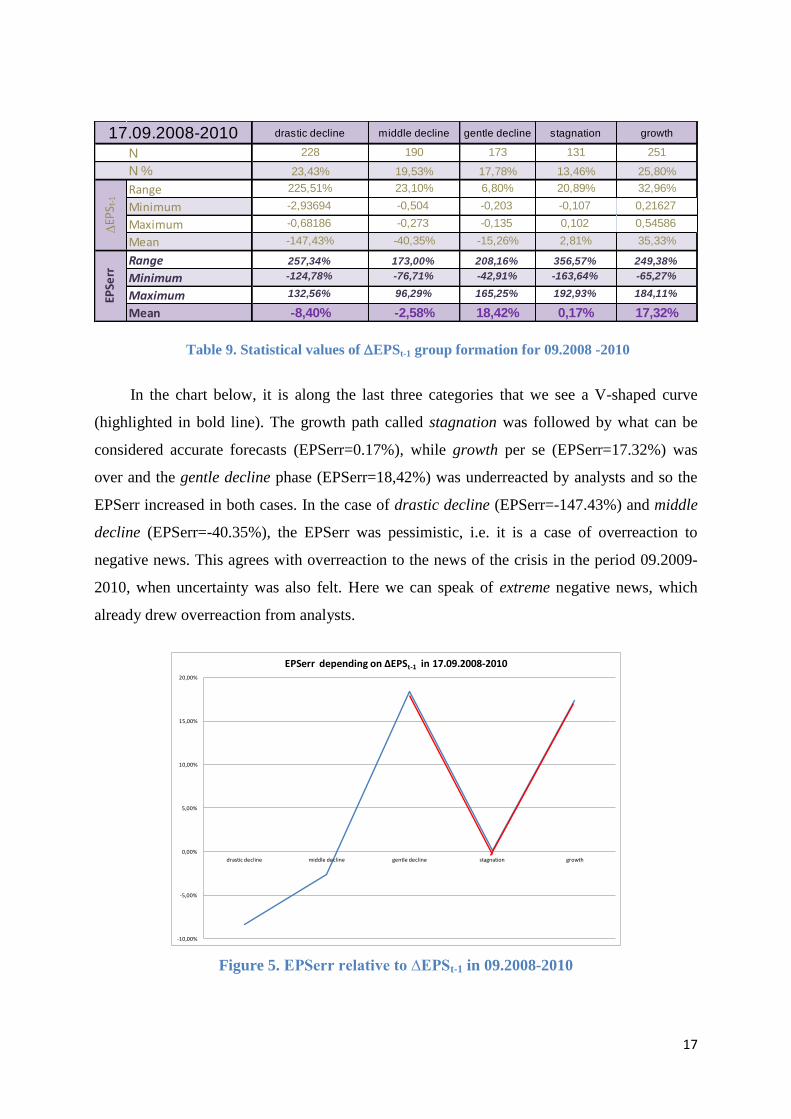
drastic decline middle decline gentle decline stagnation growth
228 190 173 131 251
23,43% 19,53% 17,78% 13,46% 25,80%
Range 225,51% 23,10% 6,80% 20,89% 32,96%
Minimum -2,93694 -0,504 -0,203 -0,107 0,21627
Maximum -0,68186 -0,273 -0,135 0,102 0,54586
Mean -147,43% -40,35% -15,26% 2,81% 35,33%
Range 257,34% 173,00% 208,16% 356,57% 249,38%
Minimum -124,78% -76,71% -42,91% -163,64% -65,27%
Maximum 132,56% 96,29% 165,25% 192,93% 184,11%
Mean -8,40% -2,58% 18,42% 0,17% 17,32%
N
N %
EP
S t-1
EPSe
rr
17.09.2008-2010
Table 9. Statistical values of EPSt-1 group formation for 09.2008 -2010
In the chart below, it is along the last three categories that we see a V-shaped curve
(highlighted in bold line). The growth path called stagnation was followed by what can be
considered accurate forecasts (EPSerr=0.17%), while growth per se (EPSerr=17.32%) was
over and the gentle decline phase (EPSerr=18,42%) was underreacted by analysts and so the
EPSerr increased in both cases. In the case of drastic decline (EPSerr=-147.43%) and middle
decline (EPSerr=-40.35%), the EPSerr was pessimistic, i.e. it is a case of overreaction to
negative news. This agrees with overreaction to the news of the crisis in the period 09.2009-
2010, when uncertainty was also felt. Here we can speak of extreme negative news, which
already drew overreaction from analysts.
-10,00%
-5,00%
0,00%
5,00%
10,00%
15,00%
20,00%
drastic decline middle decline gentle decline stagnation growth
EPSerr depending on ∆EPSt-1 in 17.09.2008-2010
Figure 5. EPSerr relative to ∆EPSt-1 in 09.2008-2010

18
In Easterwood and Nutt’s (1999) regression analysis, in the pre-crisis period the
category of decline emerges from the other data where the EPSerr=9.74% was. Based on the
Pearson correlation, there is a strong opposite-directed relationship between variables, which
means that after such a sharp decline analysts forecast massive growth as is also suggested by
ß=-8.542.
In the case of great growth (EPSerr=-6.58%) and above 1,000% growth (EPSerr=-
19.16%), the value of the Pearson correlation indicates a moderately negative relationship. In
the case of great growth, analysts project a decline for the next year based on the value
ß=-0.885, and thus pessimistic values are forecasted, while in the case of above 1,000%
growth, ß=-0.006 indicates that such an extent of growth is not taken into consideration for
the next year.
In the event of gentle and middle growth, the correlation is very weak; thus EPSt-1 has
hardly any impact on forecasts made for the next year.
Easterwood és Nutt (1999)
2003-2007 α t-stat Sig. β t-stat Sig. R2 % NPearson
korr.
Szig. (2-
tailed)decline -1,300 -12,793 ,000 -8,542 -39,690 ,000 87,02% 237 -,933 ,000
gentle growth ,155 8,614 ,000 -,290 -2,132 ,034 1,14% 396 -,107 ,034
middle growth ,544 6,452 ,000 -,749 -3,437 ,001 2,96% 389 -,172 ,001
great growth 1,005 18,643 ,000 -,885 -14,262 ,000 32,68% 421 -,572 ,000
above 1000% growth ,413 10,618 ,000 -,006 -5,395 ,000 25,96% 85 -,510 ,000
Table 10. Results of Easterwood and Nutt’s (1999) regression analysis based on EPSt-1 in
2003-2007
Examining the period 17.09.2008-2010 it is striking that there is no or little correlation
between the two variables and further that the relationship is typically not significant. The
significance level of the value of ß is similar to that. The R2 indicator is also evidence that the
independent variable only explains a negligible part of the dependent variable’s scatter. The
absence of correlation draws the attention to the fact that in the two years after the crisis the
value of EPSt-1 did not influence forecasts for the next year.
19
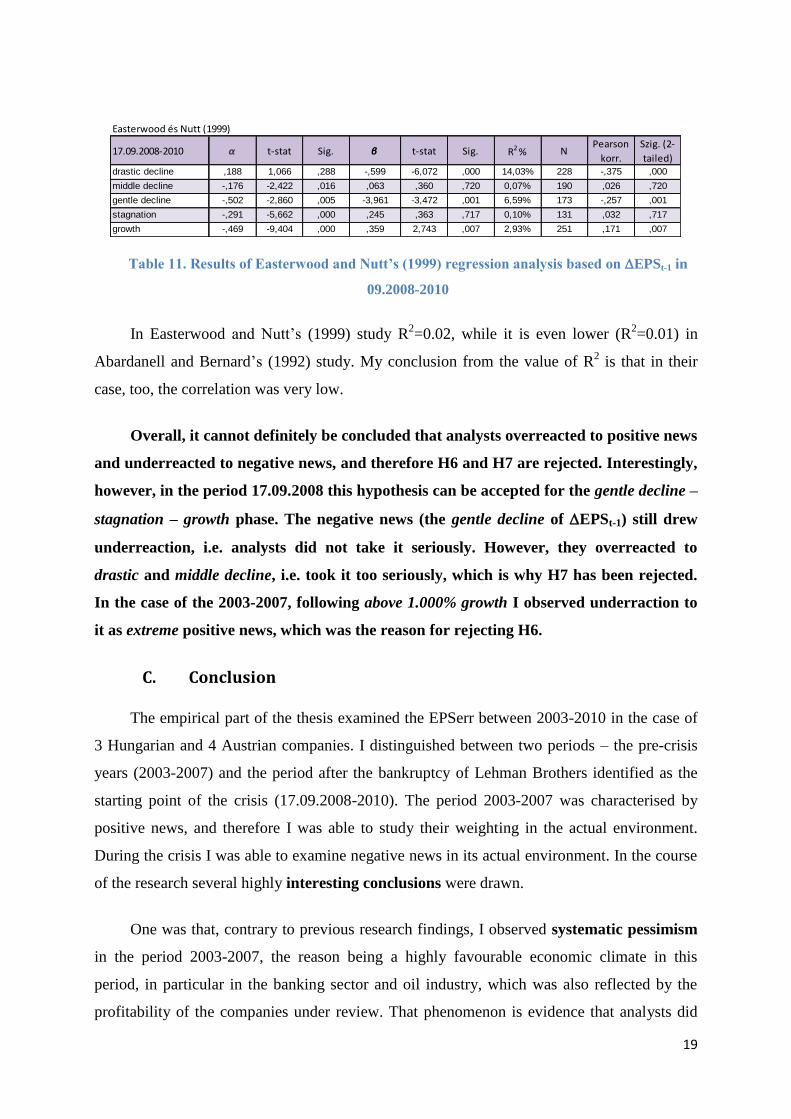
Easterwood és Nutt (1999)
17.09.2008-2010 α t-stat Sig. β t-stat Sig. R2 % NPearson
korr.
Szig. (2-
tailed)drastic decline ,188 1,066 ,288 -,599 -6,072 ,000 14,03% 228 -,375 ,000
middle decline -,176 -2,422 ,016 ,063 ,360 ,720 0,07% 190 ,026 ,720
gentle decline -,502 -2,860 ,005 -3,961 -3,472 ,001 6,59% 173 -,257 ,001
stagnation -,291 -5,662 ,000 ,245 ,363 ,717 0,10% 131 ,032 ,717
growth -,469 -9,404 ,000 ,359 2,743 ,007 2,93% 251 ,171 ,007
Table 11. Results of Easterwood and Nutt’s (1999) regression analysis based on EPSt-1 in
09.2008-2010
In Easterwood and Nutt’s (1999) study R2=0.02, while it is even lower (R
2=0.01) in
Abardanell and Bernard’s (1992) study. My conclusion from the value of R2 is that in their
case, too, the correlation was very low.
Overall, it cannot definitely be concluded that analysts overreacted to positive news
and underreacted to negative news, and therefore H6 and H7 are rejected. Interestingly,
however, in the period 17.09.2008 this hypothesis can be accepted for the gentle decline –
stagnation – growth phase. The negative news (the gentle decline of EPSt-1) still drew
underreaction, i.e. analysts did not take it seriously. However, they overreacted to
drastic and middle decline, i.e. took it too seriously, which is why H7 has been rejected.
In the case of the 2003-2007, following above 1.000% growth I observed underraction to
it as extreme positive news, which was the reason for rejecting H6.
C. Conclusion
The empirical part of the thesis examined the EPSerr between 2003-2010 in the case of
3 Hungarian and 4 Austrian companies. I distinguished between two periods – the pre-crisis
years (2003-2007) and the period after the bankruptcy of Lehman Brothers identified as the
starting point of the crisis (17.09.2008-2010). The period 2003-2007 was characterised by
positive news, and therefore I was able to study their weighting in the actual environment.
During the crisis I was able to examine negative news in its actual environment. In the course
of the research several highly interesting conclusions were drawn.
One was that, contrary to previous research findings, I observed systematic pessimism
in the period 2003-2007, the reason being a highly favourable economic climate in this
period, in particular in the banking sector and oil industry, which was also reflected by the
profitability of the companies under review. That phenomenon is evidence that analysts did
20
not believe positive news and underrated growth trends. All this proves that positive news
was undervalued, which contradicts existing research results.
Another interesting finding is that analysts continued to underrate news of the crisis
throughout the first three quarters of 2009. I was able to examine the news value of the crisis
through the change of the scatter of forecasted EPS. Its value remained unchanged until
09.2009 compared to the preceding period, and so the crisis still had news value, which drew
underreaction, i.e. the EPSerr was optimistic.
The uncertainty caused by the crisis was felt after 10.2009; then the scatter of the
forecasted EPS significantly increased and the EPSerr turned into pessimistic. That was the
third interesting finding, namely the uncertainty, which arose from the crisis, did not add to
the optimism of the EPSerr but pessimistic forecasts were made. In examining the period
2003-2007, what we can also see with regard to uncertainty is that uncertainty can increase
the EPSerr not only in a clearly optimistic direction but also in a negative direction, i.e. it can
raise the value of EPSerr in absolute terms while the latter’s direction is pessimistic
(negative). In this particular case analysts overreacted to negative news in a highly uncertain
environment.
In order to weight positive and negative information I conducted an analysis (in line
with previous research) of the effect of EPSt-1 on the EPSerr. Between 2003 and 2007, the
revenue-generating capacity of the oil industry, i.e. MOL and OMV, and of the banking
sector, i.e. OTP and Erste Bank, was characterised by extreme good news, as was also
evidenced by those firms’ EPS growth. The level of EPSerr in the period 2003-2007 was
pessimistic and thus I found pessimistic EPSerr in all EPSt-1 categories except decline
(EPSt-1<0). Interestingly, however, in the case of above 1,000% growth the EPSerr was even
more pessimistic, i.e. the growth in the preceding period was even more underweighted. In
other words, analysts underreacted to extreme positive news. Examining negative news was
made possible in the period 07.09.2008-2010. Again, an interesting finding here was that
analysts overreacted to drastic decline, i.e. the EPSerr assumed a pessimistic value.
It can be concluded from the overall results that credible and acceptable news draws
overreaction, while extreme news draws underreaction from analysts. Underreaction, i.e.
disbelief, is also typical with negative news but extreme bad news causes overreaction. It must
21
be added that extreme news also intensifies uncertainty. Both extreme positive and negative
news causes a pessimistic EPSerr. As a consequence of overconfidence and optimism, people
are more inclined to believe the good news than the bad news. Initially they believe and
overreact to the good news and gather information that provides confirmation. In the event of
bad news, they seek the opposite information and try to “play down” and thus underweight
the bad news, but as the bad news is confirmed so grows uncertainty causing the EPSerr to
increase in the pessimistic direction.
The research would be worth extending to the whole of Europe, e.g. to include Central
and Eastern European and Western European countries in order to compare the regions.
Another option is to extend the study to oil companies and examine how rising oil prices as
positive news from a revenue-generating aspect impact the EPSerr. Yet another interesting
possibility could be to repeat the foregoing studies for 2011 and subsequent years. Just as
exciting would be to look into how sell-side and buy-side analysts react to positive news or,
knowing analysts’ nationality, to see whether EPS analysts enjoy any “home-ground”
advantage, i.e. whether a local analyst makes forecasts with a smaller EPSerr compared to a
foreign analyst.
22
III. Main references of the dissertation
Affleck –Graves, J.; Davis, L. R.; Mendenhall, R.R. (1990): Forecasts of earnings per share:
possible sources of analyst superiority and bias., Contemprorary Accounting Research , 6,
501-517 p.
Bagella, Michele; Becchetti, Leonardo; Ciciretti, Rocco (2007): Earning Forecast Error in US
and European Stock Markets. European Journal of Finance, Mar2007, Vol. 13 Issue 2, p105-122
Beckers, Stan; Steliaros, Michael; Thomson, Alexander (2004): Bias in European Analysts'
Earnings Forecasts., Financial Analysts Journal, Mar/Apr2004, Vol. 60 Issue 2, p74-85, 12p, 8
Charts
Brown, L. D. (1993): Earnings forecasting research: Its implications for capital markets
research. International Journal of Forecasting, 9, 296 – 320
Camerer, Colin, Lovallo, Dan (1999): Overconfidence and Excess Entry: An Experimental
Approach.. American Economic Review, Mar1999, Vol. 89 Issue 1, p306-318, 13p;
Capstaff, John; Paudyal, Krishna; Rees, William (2001): A Comparative Analysis of
Earnings Forecasts in Europe.. Journal of Business Finance & Accounting, Jun2001, Vol.
28 Issue 5/6
Chapman, Gretchen B.; Johnson, Eric J.(2002): Incorporating the Irrelevant: Anchors in
Judgments of Belief and Value, in Gilovich, T., Griffin, D.W.&Kahnemand D- (2002) (eds.),
Heuristics and Biases: The psychology of intuitive judment.. Cambridge: Cambridge University
Press,
De Bondt, Werner F. M.; Thaler, Richard H..(1990): Do security analysts overreact?
American Economic Review, May90, Vol. 80 Issue 2, p52, 6p,
Easterwood, John C.; Nutt, Stacey R.. (1999): Inefficiency in Analyst's Earnings Forecasts:
Systematic Misreaction or Systematic Optimism? Journal of Finance, Oct99, Vol. 54 Issue
5, p1777-1797, 21p
Epley, Nicholas; Gilovich, Thomas (2001): Putting adjustment back in the anchoring and
adjustment heuristic: Diefferential Processing of Self_Generated and Experimenter – Provided
Anchors, American Psycholohical Society, vol. 12, NO. 5, sept. 2001
Epley, Nicholas; Gilovich, Thomas (2006): The anchoring – and- Adjustment Heuristic, Why
the Adjustment Are Insufficient, Psycholohical Science, vol. 17, NO. 4, 2006
Griffin, D.; Tversky; H. (1992): „The weighting of evidence and the determinants of
confindence”, Cognitive psychology, 24 (1992) 411-435
Hall, Crystal C.; Ariss, Lynn; Todorov, Alexander (2007): The illusion of knowledge: When
more information reduces accuracy and increases confidence. Organizational Behavior &
Human Decision Processes, Jul2007, Vol. 103 Issue 2, p277-290,

23
Hámori Balázs (2003b): Kísérletek és kilátások – Daniel Kahneman. Közgazdasági Szemle,
2003. szeptember, p. 779-799
Kadous, Kathryn; Krische, Susan D.; Sedor, Lisa M..(2006): Using Counter-Explanation
to Limit Analysts' Forecast Optimism. Accounting Review, Mar2006, Vol. 81 Issue 2, p377-
397, 21p
Kahneman, Daniel - Tversky, Amos (1974): Judgment under uncertainty: Heuristics and
biases Science 185, 1974 pp. 1124-1131. (Magyar kiadása Nagy Péter fordításában: Pápai
Zoltán és Nagy Péter: Döntéselméleti szöveggyűjtemény, Aula kiadó, 1991, 77-93)
Kahneman, Daniel - Tversky, Amos (1979): Prospect Theory: An Analysis of Decision
under Risk, Econometrica, Vol. 47, No. 2. 263-291 . old. Magyarul: Csontos László (1998):
A racionális döntések elmélete, Osiris kiadó, Budapest, 1998, 82-112 . old
Kahneman, Daniel - Lovallo, Dan (2003): Delusion of success: How Optimism Udermines
Executives Decisions, Harvard Business Review, 2003 július
Komáromi György [2003b]: “Befektetési döntések és a tudásillúzió”, Competitio 2(1): 1-9.
ISSN 1588-9645
Lawrence, Michael; O'Connor, Marcus (1995): The Anchor and Adjustment Heuristic in Time-
series Forecasting. Journal of Forecasting, Sep95, Vol. 14 Issue 5, p443-451, 9p
Lim, Terence (2001): Rationality and Analysts' Forecast Bias. Journal of Finance, Feb2001, Vol.
56 Issue 1, p369-385, 17p
March, James G.; Shapira, Zur. (1987): MANAGERIAL PERSPECTIVES ON RISK AND
RISK TAKING. Management Science, Nov87, Vol. 33 Issue 11, p1404-1418, 15p
Molnár, M. A. (2005): A hatékony piacok elméletének történeti előzményei. Hitelintézeti
Szemle 4(4): 17-36.
Moisland, Dan (2000): Effective Financial Planning in the Presence of Judgment Heuristics,
Journal of Financial Planning, Apr 2000, Vol. 13 Issue 4, p130-134, 5p;
Muller, A., and R. Kräussl, 2011, Doing Good Deeds in Times of Need: A Strategic
Perspective on Corporate Disaster Donations, Strategic Management Journal, 32(9),
911-929,
Muller, A., and R. Kräussl, 2011, The Value of Corporate Philanthropy during Times
of Crisis: The Sensegiving Effect of Employee Involvement, Journal of Business Ethics,
103(2), 203-220.
Mussweiler, Thomas; Englich, Birte. (2005): Subliminal anchoring: Judgmental consequences
and underlying mechanisms. Organizational Behavior & Human Decision Processes, Nov2005,
Vol. 98 Issue 2, p133-143, 11p;
Nofsinger, John R. (2007): The Psychology of Investing, 3rd edition, Washington State
University.
24
Sedor, Lisa M..(2002): An Explanation for Unintentional Optimism in Analysts' Earnings
Forecasts. By: Accounting Review, Oct2002, Vol. 77 Issue 4, p731-753, 23p
Virág Miklós (1992): Vállalati Pénzügyi Tervezés, Budapest, BKE, 1992
Zoltayné Paprika Zita (2005): Döntéselmélet, 2., 3., 5., 7. fejezet, Alinea Kiadó, Budapest, 2002,
2005 második kiadás
Zacks, Leonard (1979): EPS Forecasts--Accuracy Is Not Enough. Financial Analysts
Journal, Mar/Apr79, Vol. 35 Issue 2, p53, 3p,
A. Publications related to the dissertation
1. Erika Jáki: Illusion of knowledge in financial planning, 2010. március
Tavaszi szél 2010, Spring Wind 2010 Konferenciakötet, Pécs, 2010; p. 183-188.;
ISBN: 978-615-5001-05-5
2. Erika Jáki: Túltervezés okai a pénzügyi tervezésben, 2009. május
Tavaszi szél 2009 Konferencia kiadvány, Szeged, 2009 p. 428-441;
ISBN: 978 963 87569 3 0
3. Erika Jáki: Racionalitás és beruházás értékelés, 2008. október
Gazdálkodástudományi kar, könyvrészlet, Budapest, AULA, 2008, p. 39-53
ISBN szám:978 963 9698 56 7
4. Erika Jáki: Beruházás értékelés döntéselméleti megközelítése, 2008. május
Tavaszi szél 2008 Konferencia-kiadvány, Budapest, 2008, p 169-181
ISBN: 978-963-87569-2-3
5. Erika Jáki: Beruházás Értékelés. Vezetéstudomány, 2004. 35. évf. 4. szám, p. 48-57.
6. Erika Jáki: Pénzügyi Tervezés Lépései. 2004. április
IX. Nemzetközi Agrárökonómiai Tudományos Napok Tanulmánykötet és CD
kiadvány, 2004; Károly Róbert Főiskola – Károly Róbert Kht.
7. Erika Jáki: Beruházási Alternatívák Megfogalmazása. 2004. április
IX. Nemzetközi Agrárökonómiai Tudományos Napok Tanulmánykötet és CD
kiadvány, 2004; Károly Róbert Főiskola – Károly Róbert Kht.
25
B. Presentations on conferences related to the dissertation
1. Erika Jáki: Túltervezés jelenségének empirikus vizsgálata EPS adatok segítségével,
2011. május, Szegedi Tudományegyetem Gazdaságtudományi Kar, Közgazdaságtani
Doktori Iskola, Gazdaságpszichológia Kutatóműhely, 12. Gazdaságpszichológiai
Kutatási Fórum, "Racionalitás versus érzelmek és indulatok a gazdasági döntésekben
és folyamatokban"
2. Erika Jáki: Optimista pénzügyi tervek - túlzott önbizalom / optimizmus -, 2010.
április, Szegedi Tudományegyetem Gazdaságtudományi Kar, A gazdaságpszichológus
Ph.D. hallgatók X. Kutatási Fóruma "Gazdasági kihívások - viselkedési és
pszichológiai reakciók"
3. Erika Jáki: Tudásillúzió a pénzügyi tervezésben, 2010. április, Behavioral Economics
Workshop, Budapesti Corvinus Egyetem
4. Erika Jáki: Illusion of knowledge in financial planning, 2010. március, Spring Wind
2010 Nemzetközi Konferencia – Pécs, Doktoranduszok Országos Szövetségének
szervezésében
5. Erika Jáki: Túltervezés okai a pénzügyi tervezésben, 2009. május, Tavaszi szél 2009
Konferencia – Szeged, Doktoranduszok Országos Szövetségének szervezésében
6. Erika Jáki: Túltervezés okai a pénzügyi tervezésben, 2009. május, Szegedi
Tudományegyetem Gazdaságtudományi Kar, A gazdaságpszichológus Ph.D. hallgatók
VIII. Kutatási Fóruma, "Racionális választás és emberi magatartás a gazdasági és
üzleti döntésekben"
7. Erika Jáki: Racionalitás és beruházás értékelés, 2008. október, BCE 60 éves jubileumi
konferencia
8. Erika Jáki: Beruházás értékelés döntéselméleti megközelítése, 2008. május, Tavaszi
szél 2008 Konferencia – Budapest, Doktoranduszok Országos Szövetségének
szervezésében
9. Erika Jáki: Racionalitás és beruházás értékelés, 2008. május, Szegedi
Tudományegyetem Gazdaságtudományi Kar, A gazdaságpszichológus Ph.D. hallgatók
VI. Kutatási Fóruma, "Racionális választás és emberi magatartás a gazdasági és üzleti
döntésekben"