Embed Size (px)
Citation preview

Management Accounting
1
H6827-Ch01 10/14/05 5:32 PM Page 1

abnormal gain Improvement on theaccepted or normal level of loss associatedwith a production activity. It is isolated as aperiod entry rather than as an adjustmentto product cost.
abnormal loss Any loss in excess ofthe normal loss allowance. It is isolated asa period entry rather than as a componentof product cost.
absorbed overhead Overhead attachedto products or services by means of anabsorption rate, or rates.
under- or over-absorbed overhead Thedifference between overhead incurred andoverhead absorbed, using an estimatedrate, in a given period.
If overhead absorbed is less than thatincurred there is under-absorption, if
overhead absorbed is more than thatincurred there is over-absorption.Over- and under-absorptions are treated asperiod cost adjustments. See Figure 1.1.
absorption rate See overhead absorption rate.
accounting manual Collection of accountinginstructions governing the responsibilities ofpersons, and the procedures, forms andrecords relating to the preparation and useof accounting data. There can be separatemanuals for the constituent parts of theaccounting system, such as a budget manualor cost accounting manual.
accounting period Time period coveredby the accounting statements of an entity.There may be different time periods fordifferent accounting statements, forexample management accounts may be
2 CIMA OFFICIAL TERMINOLOGY
DIRECT COST $ $ $ $$ $ $
FACTORYTOTAL
MachineShop
AssemblyDepartment
EngineeringServices Stores
FactoryAdmin
QualityControl
PRODUCTION COSTCENTRES
SERVICE COST CENTRES
$ /machinehour
$ /unit$ /directlabourhour
(Absorption rates)
Productcost
per unit
Attribution of budgeted payroll cost
Indirect wages cost and salaries
Direct workers’ time not working on products
Sickness, holiday, Nl and pension costs
Indirect workers’ wages and employment costs
Supervision salaries & employment costs
Engineering salaries & employment costs
Quality control salaries & employment costs
Storekeepers’ salaries & employment costs
Other salaries
Total overhead payroll cost
Other allocated overhead
Apportioned costs, e.g. building service costs
Total budgeted production overhead
Re-apportionment of service cost centre costs
Direct material cost allocated
Direct wages cost allocated
Production overhead
– machine shop
– assembly
– quality control
Production cost per unit
X
X
X
X
X
X
X
X
X
X
X
X X
X
X
X
X
X X X
X
X
X
X
X
X
X
X
X
X
X
X
X
X
X
X
X
X
X
X
X
X
X
X
X
X
X X X X X X X
X
X
X
X
X
X
X
OV
ERH
EAD
AB
SOR
PTIO
NC
OST
APP
OR
TIO
NM
ENT
CO
STA
LLO
CA
TIO
N
FIGURE 1.1 COST ALLOCATION, APPORTIONMENT AND OVERHEAD ABSORPTION
H6827-Ch01 10/14/05 5:32 PM Page 2
for four- or five-week periods to coincidewith a thirteen-week financial accountingperiod.
accounts, integrated Set of accountingrecords that integrates both financial andcost accounts using a common input ofdata for all accounting purposes.
accounts, interlocking Set of accountingrecords where the cost and financial accountsare distinct, the two being kept continuouslyin agreement by the use of control accountsor reconciled by other means.
activities, hierarchy of Classification ofactivities by level of organisation, forexample unit, batch, product sustainingand facility sustaining.
activity, batch level Activity (such as setting-up machines) where volume varies directlywith the number of batches of output but isindependent of the number of units in abatch. See activities, hierarchy of.
activity cost pool Aggregation of all costsrelated to a specific activity.
activity driver Transaction that causes anactivity. For example, receipt of a sales ordersets in train the order processing activity.
activity driver analysis Identification andevaluation of the activity drivers used totrace the cost of activities to cost objects.
activity, facility sustaining Activityundertaken to support the organisation
as a whole, and which cannot be logicallylinked to individual units of output.Accounting is a facility sustaining activity.See activities, hierarchy of.
activity, product sustaining Activityundertaken to develop or sustain a product(or service). Product sustaining costs arelinked to the number of products orservices, not to the number of unitsproduced.
activity-based budgeting Methodof budgeting based on an activityframework and utilising cost driver datain the budget setting and variance feedbackprocesses.
activity-based costing (ABC) Approach tothe costing and monitoring of activitieswhich involves tracing resourceconsumption and costing final outputs.Resources are assigned to activities, andactivities to cost objects based onconsumption estimates. The latter utilisecost drivers to attach activity costs tooutputs. See Figure 1.2.
activity-based costing, time-driven(time-driven ABC) Approach toABC based on the time required foreach unit activity. The method avoidsthe use of interviews with operatingmanagers in order to estimate percentageof time spent on different areas of work.It is claimed that “time-driven ABC”based on “time per transactional activity”
MANAGEMENT ACCOUNTING 3
Stage 1Activity cost pools
Stage 2Cost driver rates
Cost per materialmovement
Cost per purchaseorder
Cost per set-up
OVERHEADCOSTS
Materialhandling
Procurement
Set-up
PRODUCT
LINES
FIGURE 1.2 THE FRAMEWORK OF ACTIVITY-BASED COSTING
H6827-Ch01 10/14/05 5:32 PM Page 3
is simpler to install and update and canhighlight unused capacity.
activity-based management (ABM)operational ABM Actions, based on activitydriver analysis, that increase efficiency,lower costs and/or improve assetutilisation.
strategic ABM Actions, based on activity-based cost analysis, that aim to change thedemand for activities so as to improveprofitability.
allocate To assign a whole item of cost,or of revenue, to a single cost unit,centre, account or time period. In theUS, “allocate” does not have this precisemeaning, it is used more generally to referto the whole process of overheadapportionment, allocation and absorption.See Figure 1.1.
apportion To spread indirect revenuesor costs over two or more cost units,centres, accounts or time periods. Thismay also be referred to as “indirectallocation”.
re-apportion The re-spread of costsapportioned to service departments toproduction departments. See Figure 1.1
apportionment basis Physical orfinancial unit used to apportion costs tocost centres.
batch Group of similar units whichmaintains its identity throughout one ormore stages of production and is treated asa cost unit.
behavioural implications, accountingWays in which people affect, and areaffected by, the creation, existence anduse of accounting information. Forexample, see budgeting, behaviouralaspects and consequences.
bill of materials Detailed specification,for each product, of the subassemblies,components and materials required,distinguishing items purchasedexternally from those manufacturedin-house.
bottleneck Facility that has lower capacitythan prior or subsequent facilities and
restricts output based on current capacity.See theory of constraints, throughput.
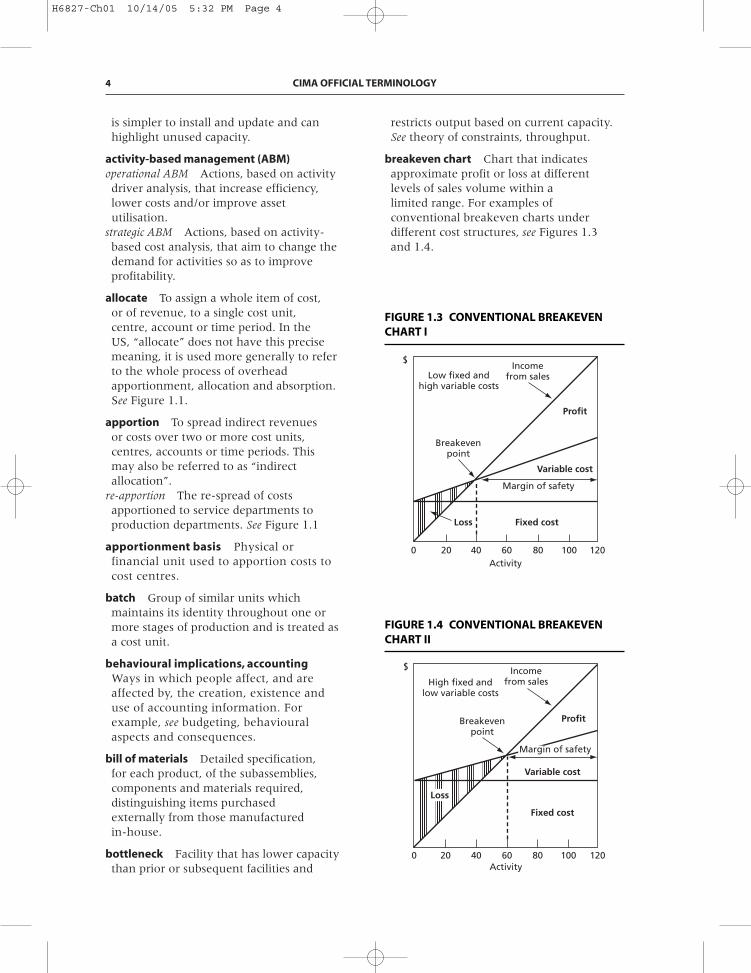
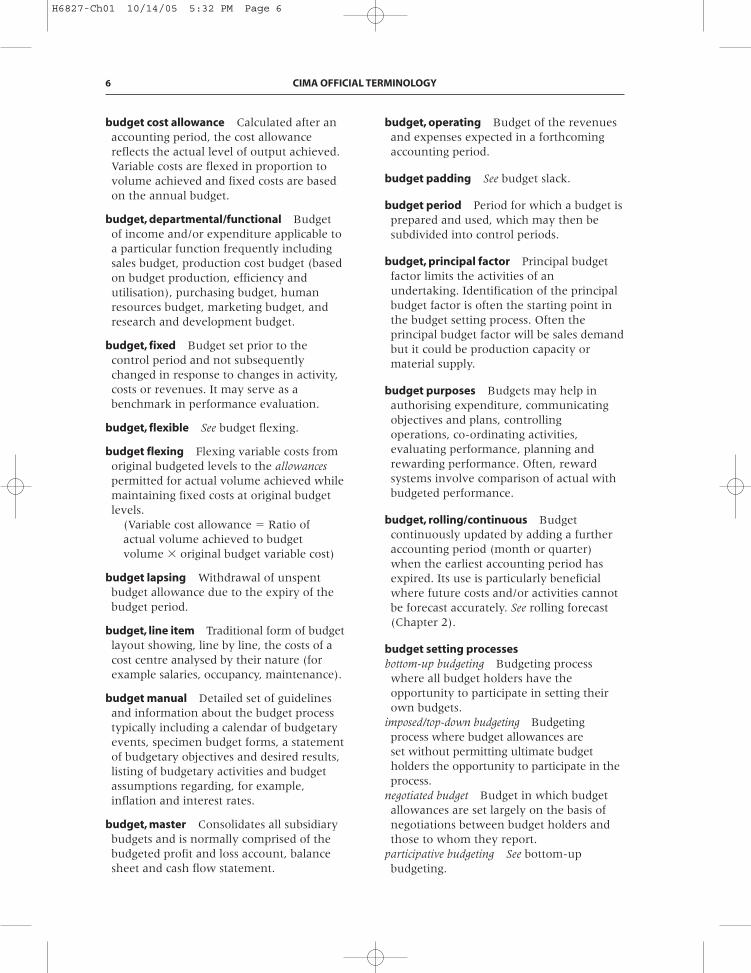
breakeven chart Chart that indicatesapproximate profit or loss at differentlevels of sales volume within alimited range. For examples ofconventional breakeven charts underdifferent cost structures, see Figures 1.3and 1.4.
4 CIMA OFFICIAL TERMINOLOGY
Low fixed andhigh variable costs
Incomefrom sales
Profit
Breakevenpoint
Variable cost
Margin of safety
Loss Fixed cost
Activity
$
0 20 40 60 80 100 120
FIGURE 1.3 CONVENTIONAL BREAKEVENCHART I
FIGURE 1.4 CONVENTIONAL BREAKEVENCHART II
High fixed andlow variable costs
Incomefrom sales
ProfitBreakevenpoint
Variable cost
Fixed cost
Activity
$
0 20 40 60 80 100 120
Loss
Margin of safety
H6827-Ch01 10/14/05 5:32 PM Page 4

$
Sales 10,000Variable costs (e.g. direct materials, direct labour) 6,000Contribution 4,000Fixed cost 2,000Profit 2,000
Number of units sold 1,000Contribution per unit $4Contribution to sales ratio
Number of units to be sold to breakeven
Sales value at breakeven point
Time to breakeven
(assuming that the period is one year, andthat the rate of sales is constant within thatperiod)
budget Quantitative expression of aplan for a defined period of time. Itmay include planned sales volumesand revenues; resource quantities, costs andexpenses; assets, liabilities and cash flows.
budget, cash Detailed budget ofestimated cash inflows and outflowsincorporating both revenue and capitalitems.
budget centre Section of an entityfor which control may be exercisedthrough prepared budgets. It isoften a responsibility centre where themanager has authority over, andresponsibility for, defined costs and(possibly) revenues.
� 6 mth
Total fixed cost � 365
Total contribution �
$2,000
$4,000� 365
� $5,000
Total fixed cost
Contribution to sales ratio �
$2,000
40%
� $500 units
Total fixed cost
Contribution per unit �
$2,000
$4
$4,000
$10,000� 100 � 40%
MANAGEMENT ACCOUNTING 5
FIGURE 1.5 CONTRIBUTION BREAKEVENCHART
Incomefrom sales
Breakevenpoint
Fixed cost
Variable cost
$
Loss
0 50% 100%Activity
Mar
gin
al c
ost
Co
ntr
ibu
tio
n
Profit
FIGURE 1.6 PROFIT–VOLUME CHART
50%Activity
Fixed costLoss
Sales
Breakevenpoint
Fixe
d c
ost
Contribution
Co
ntr
ibu
tio
n
Profit
0 100%
$
Figure 1.5 shows a contributionbreakeven chart and Figure 1.6 aprofit–volume chart.
breakeven point Level of activity atwhich there is neither profit nor loss.It can be ascertained by using abreakeven chart or by calculation.See Figures 1.3, 1.4, 1.5, 1.6 andexample:
H6827-Ch01 10/14/05 5:32 PM Page 5
budget cost allowance Calculated after anaccounting period, the cost allowancereflects the actual level of output achieved.Variable costs are flexed in proportion tovolume achieved and fixed costs are basedon the annual budget.
budget, departmental/functional Budgetof income and/or expenditure applicable toa particular function frequently includingsales budget, production cost budget (basedon budget production, efficiency andutilisation), purchasing budget, humanresources budget, marketing budget, andresearch and development budget.
budget, fixed Budget set prior to thecontrol period and not subsequentlychanged in response to changes in activity,costs or revenues. It may serve as abenchmark in performance evaluation.
budget, flexible See budget flexing.
budget flexing Flexing variable costs fromoriginal budgeted levels to the allowancespermitted for actual volume achieved whilemaintaining fixed costs at original budgetlevels.
(Variable cost allowance � Ratio ofactual volume achieved to budgetvolume � original budget variable cost)
budget lapsing Withdrawal of unspentbudget allowance due to the expiry of thebudget period.
budget, line item Traditional form of budgetlayout showing, line by line, the costs of acost centre analysed by their nature (forexample salaries, occupancy, maintenance).
budget manual Detailed set of guidelinesand information about the budget processtypically including a calendar of budgetaryevents, specimen budget forms, a statementof budgetary objectives and desired results,listing of budgetary activities and budgetassumptions regarding, for example,inflation and interest rates.
budget, master Consolidates all subsidiarybudgets and is normally comprised of thebudgeted profit and loss account, balancesheet and cash flow statement.
budget, operating Budget of the revenuesand expenses expected in a forthcomingaccounting period.
budget padding See budget slack.
budget period Period for which a budget isprepared and used, which may then besubdivided into control periods.
budget, principal factor Principal budgetfactor limits the activities of anundertaking. Identification of the principalbudget factor is often the starting point inthe budget setting process. Often theprincipal budget factor will be sales demandbut it could be production capacity ormaterial supply.
budget purposes Budgets may help inauthorising expenditure, communicatingobjectives and plans, controllingoperations, co-ordinating activities,evaluating performance, planning andrewarding performance. Often, rewardsystems involve comparison of actual withbudgeted performance.
budget, rolling/continuous Budgetcontinuously updated by adding a furtheraccounting period (month or quarter)when the earliest accounting period hasexpired. Its use is particularly beneficialwhere future costs and/or activities cannotbe forecast accurately. See rolling forecast(Chapter 2).
budget setting processesbottom-up budgeting Budgeting processwhere all budget holders have theopportunity to participate in setting theirown budgets.
imposed/top-down budgeting Budgetingprocess where budget allowances areset without permitting ultimate budgetholders the opportunity to participate in theprocess.
negotiated budget Budget in which budgetallowances are set largely on the basis ofnegotiations between budget holders andthose to whom they report.
participative budgeting See bottom-upbudgeting.
6 CIMA OFFICIAL TERMINOLOGY
H6827-Ch01 10/14/05 5:32 PM Page 6
budget slack Intentional overestimationof expenses and/or underestimation ofrevenue during budget setting. Also knownas budget padding.
budget virement Authority to apply savingunder one budget subhead to meetexcesses on others.
budgetary control Master budget,devolved to responsibility centres, allowscontinuous monitoring of actual resultsversus budget, either to secure byindividual action the budget objectives orto provide a basis for budget revision.See control, feedback and control,feedforward.
budgeting, behavioural aspects andconsequences
budget constrained style Excessive pressure toachieve budgets that can lead to job-relatedtension, recriminations, buck-passing andbudget padding.
non-accounting style Management style thatlargely ignores budgets and financialinformation.
profit conscious style Management style thattakes account of budgets together withother information and evaluatesmanagerial performance in a flexiblemanner.
target setting “Tight but achievable” levelsare recommended to motivate optimumperformance. Too loose a budget can leadto under-achievement as can too tight abudget – and this can also bede-motivating.
budgeting, beyond Idea thatcompanies need to move beyondbudgeting because of the inherentflaws in budgeting especially when usedto set incentive contracts. It is argued thata range of techniques, such as rollingforecasts and market-relatedtargets, can take the place of traditionalbudgets.
budgeting, incremental Method ofbudgeting based on the previous budget
or actual results, adjusting for knownchanges and inflation, for example.
budgeting, priority-based Method ofbudgeting whereby budget requests areaccompanied by a statement outlining thechanges expected if the prior period budgetwere increased or decreased by a certainamount or percentage. These changes areprioritised.
budgeting, zero-based Method of budgetingthat requires all costs to be specificallyjustified by the benefits expected.
burden US equivalent of “overhead”.
by-product Output of some value producedincidentally while manufacturing the mainproduct. See joint products.
capital employed Investment in an entity.In assessing managers it is usuallycalculated as total assets less currentliabilities.
equity capital employed Shareholders’ stakein the company. This is important whencalculating return to shareholders.
capital expenditure control Procedures forauthorising and subsequently monitoringcapital expenditure.
capital expenditure proposal/authorisationFormal request for authority to incur capitalexpenditure usually supported by the casefor expenditure in accordance with capitalinvestment appraisal criteria. Levels ofauthority should be clearly defined withreporting of actual expenditure to theequivalent authority levels.
centre Department, area or function towhich costs and/or revenues are charged.See Figure 1.1.
budget centre Centre for which an individualbudget is drawn up.
cost centre Production or service location,function, activity or item of equipment forwhich costs are accumulated. See Figure 1.1.
investment centre Profit centre withadditional responsibilities for capitalinvestment and possibly for financing, andwhose performance is measured by itsreturn on investment.
MANAGEMENT ACCOUNTING 7
H6827-Ch01 10/14/05 5:32 PM Page 7
profit centre Part of a business accountablefor both costs and revenues.
responsibility centre Departmental ororganisational function whose performanceis the direct responsibility of a specificmanager.
revenue centre Centre devoted to raisingrevenue with no responsibility for costs,for example a sales centre. Often usedin not-for-profit organisations.
service cost centre Cost centre providingservices to other cost centres. Whenthe output of an organisation is a service,rather than goods, an alternative nameis normally used, for example supportcost centre or utility cost centre.See Figure 1.1.
classification Arrangement of itemsin logical groups by nature, purposeor responsibility. Classification systemsallow financial information to bereported under subjective headings,by cost object or responsibility centre.See code.
code Brief, accurate referencedesigned to assist classification of itemsby facilitating entry, collation andanalysis. For example, in costing, the firstthree digits in the composite symbol211.392 might indicate the nature of theexpenditure (subjective classification), andthe last three digits might indicate thecost centre or cost unit to be charged(objective classification).
constraint Activity, resource or policythat limits the ability to achieve anobjective. See theory of constraints. Inlinear programming, constraints definethe feasible region within which asolution must lie. See linear programming.See Figure 1.19.
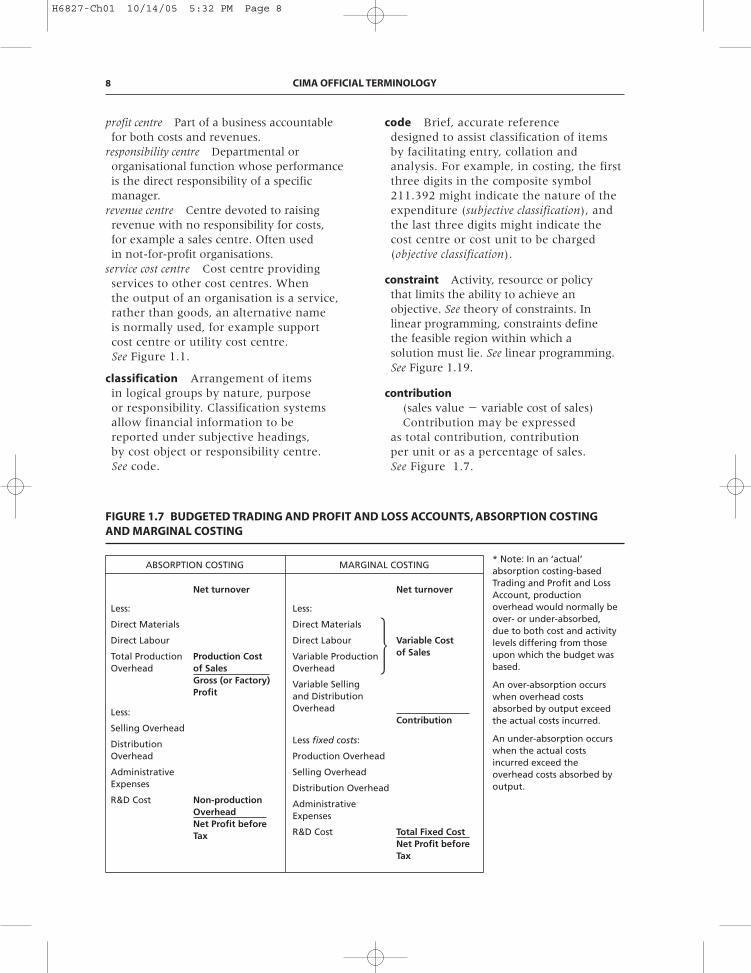
contribution(sales value � variable cost of sales)Contribution may be expressed
as total contribution, contributionper unit or as a percentage of sales.See Figure 1.7.
8 CIMA OFFICIAL TERMINOLOGY
* Note: In an ‘actual’ absorption costing-based Trading and Profit and Loss Account, production overhead would normally be over- or under-absorbed, due to both cost and activity levels differing from those upon which the budget was based.
An over-absorption occurs when overhead costs absorbed by output exceed the actual costs incurred.
An under-absorption occurs when the actual costs incurred exceed the overhead costs absorbed by output.
Net turnover
Less:
Direct Materials
Direct Labour Variable Cost
Variable Production of Sales
Overhead
Variable Sellingand Distribution Overhead
Contribution
Less fixed costs:
Production Overhead
Selling Overhead
Distribution Overhead
AdministrativeExpenses
R&D Cost Total Fixed CostNet Profit before Tax
Net turnover
Less:
Direct Materials
Direct Labour
Total Production Production CostOverhead of Sales
Gross (or Factory)Profit
Less:
Selling Overhead
DistributionOverhead
AdministrativeExpenses
R&D Cost Non-productionOverheadNet Profit beforeTax
ABSORPTION COSTING MARGINAL COSTING
FIGURE 1.7 BUDGETED TRADING AND PROFIT AND LOSS ACCOUNTS, ABSORPTION COSTINGAND MARGINAL COSTING
�
H6827-Ch01 10/14/05 5:32 PM Page 8
control In management accounting,control usually means ensuring thatactivities planned and undertaken lead todesired outcomes. See control, feedback andcontrol, feedforward.
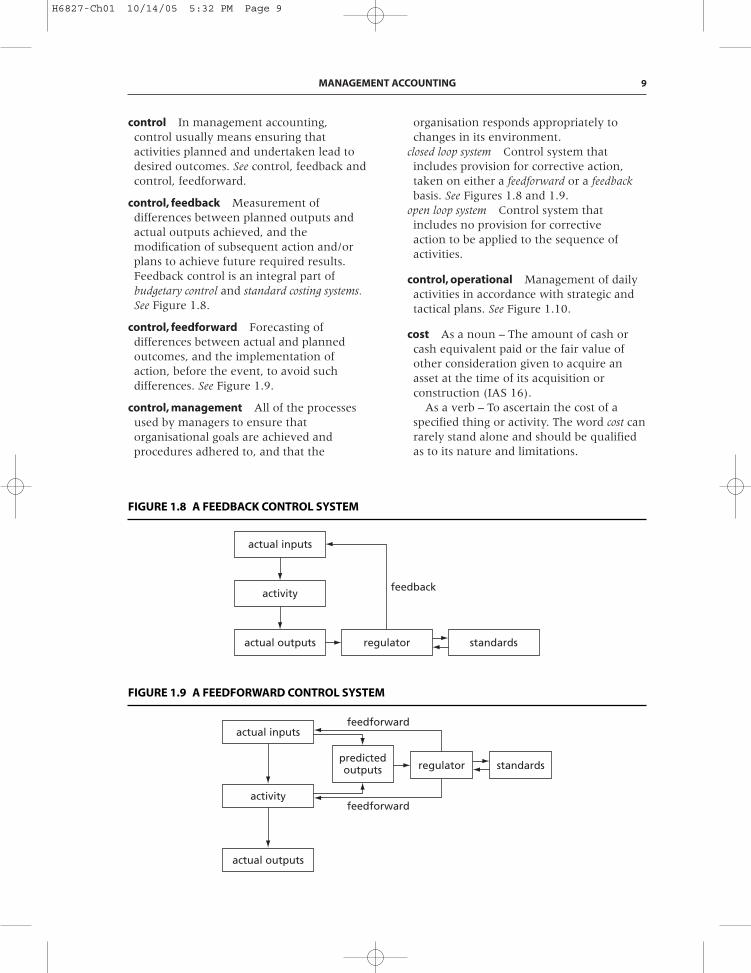
control, feedback Measurement ofdifferences between planned outputs andactual outputs achieved, and themodification of subsequent action and/orplans to achieve future required results.Feedback control is an integral part ofbudgetary control and standard costing systems.See Figure 1.8.
control, feedforward Forecasting ofdifferences between actual and plannedoutcomes, and the implementation ofaction, before the event, to avoid suchdifferences. See Figure 1.9.
control, management All of the processesused by managers to ensure thatorganisational goals are achieved andprocedures adhered to, and that the
organisation responds appropriately tochanges in its environment.
closed loop system Control system thatincludes provision for corrective action,taken on either a feedforward or a feedbackbasis. See Figures 1.8 and 1.9.
open loop system Control system thatincludes no provision for correctiveaction to be applied to the sequence ofactivities.
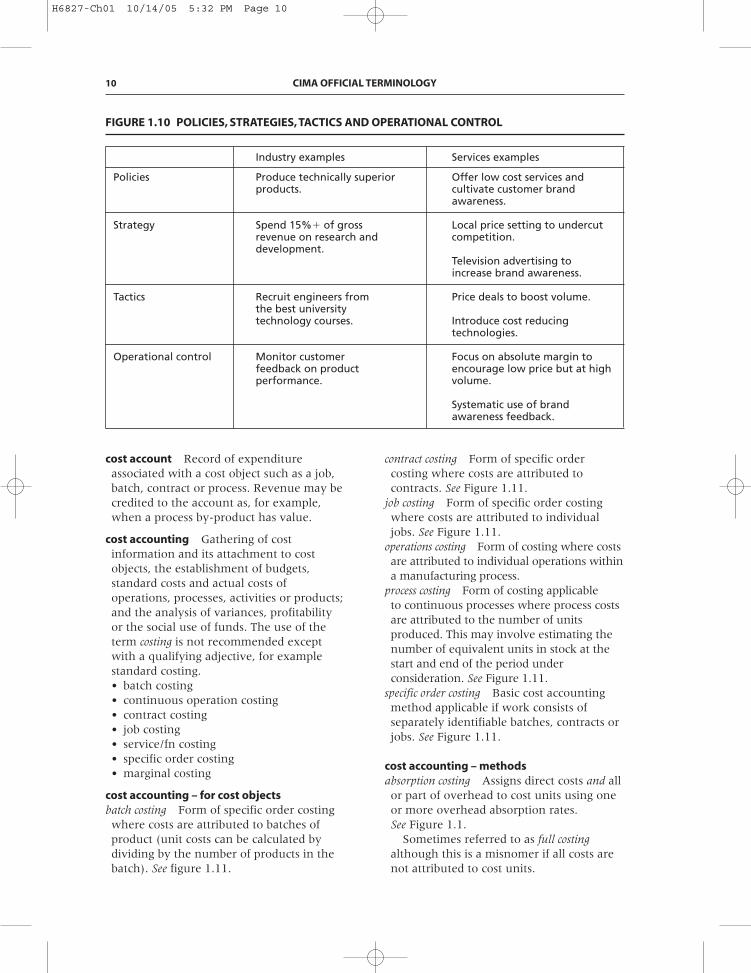
control, operational Management of dailyactivities in accordance with strategic andtactical plans. See Figure 1.10.
cost As a noun – The amount of cash orcash equivalent paid or the fair value ofother consideration given to acquire anasset at the time of its acquisition orconstruction (IAS 16).
As a verb – To ascertain the cost of aspecified thing or activity. The word cost canrarely stand alone and should be qualifiedas to its nature and limitations.
MANAGEMENT ACCOUNTING 9
actual inputs
activityfeedback
actual outputs regulator standards
FIGURE 1.8 A FEEDBACK CONTROL SYSTEM
FIGURE 1.9 A FEEDFORWARD CONTROL SYSTEM
actual inputs
activity
actual outputs
regulator standardspredictedoutputs
feedforward
feedforward
H6827-Ch01 10/14/05 5:32 PM Page 9
cost account Record of expenditureassociated with a cost object such as a job,batch, contract or process. Revenue may becredited to the account as, for example,when a process by-product has value.
cost accounting Gathering of costinformation and its attachment to costobjects, the establishment of budgets,standard costs and actual costs ofoperations, processes, activities or products;and the analysis of variances, profitabilityor the social use of funds. The use of theterm costing is not recommended exceptwith a qualifying adjective, for examplestandard costing.• batch costing• continuous operation costing• contract costing• job costing• service/fn costing• specific order costing• marginal costing
cost accounting – for cost objectsbatch costing Form of specific order costingwhere costs are attributed to batches ofproduct (unit costs can be calculated bydividing by the number of products in thebatch). See figure 1.11.
contract costing Form of specific ordercosting where costs are attributed tocontracts. See Figure 1.11.
job costing Form of specific order costingwhere costs are attributed to individualjobs. See Figure 1.11.
operations costing Form of costing where costsare attributed to individual operations withina manufacturing process.
process costing Form of costing applicableto continuous processes where process costsare attributed to the number of unitsproduced. This may involve estimating thenumber of equivalent units in stock at thestart and end of the period underconsideration. See Figure 1.11.
specific order costing Basic cost accountingmethod applicable if work consists ofseparately identifiable batches, contracts orjobs. See Figure 1.11.
cost accounting – methodsabsorption costing Assigns direct costs and allor part of overhead to cost units using oneor more overhead absorption rates. See Figure 1.1.
Sometimes referred to as full costingalthough this is a misnomer if all costs arenot attributed to cost units.
10 CIMA OFFICIAL TERMINOLOGY
FIGURE 1.10 POLICIES, STRATEGIES, TACTICS AND OPERATIONAL CONTROL
Industry examples Services examples
Policies Produce technically superior Offer low cost services and products. cultivate customer brand
awareness.
Strategy Spend 15%� of gross Local price setting to undercut revenue on research and competition.development.
Television advertising toincrease brand awareness.
Tactics Recruit engineers from Price deals to boost volume.the best universitytechnology courses. Introduce cost reducing
technologies.
Operational control Monitor customer Focus on absolute margin to feedback on product encourage low price but at high performance. volume.
Systematic use of brandawareness feedback.
H6827-Ch01 10/14/05 5:32 PM Page 10

direct costing See variable costing.full costing See absorption costing.marginal costing See variable costing.uniform costing Used by severalundertakings, usually in the same industry,of the same costing methods, principles andtechniques.
variable costing Assigns only variablecosts to cost units while fixed costs arewritten off as period costs. See Figure 1.7.Also known as marginal costing and,especially in the US, as direct costing.
cost allocation/apportionment See allocationand apportionment.
cost, avoidable Specific cost of an activityor sector of a business that would beavoided if the activity or sector did notexist.
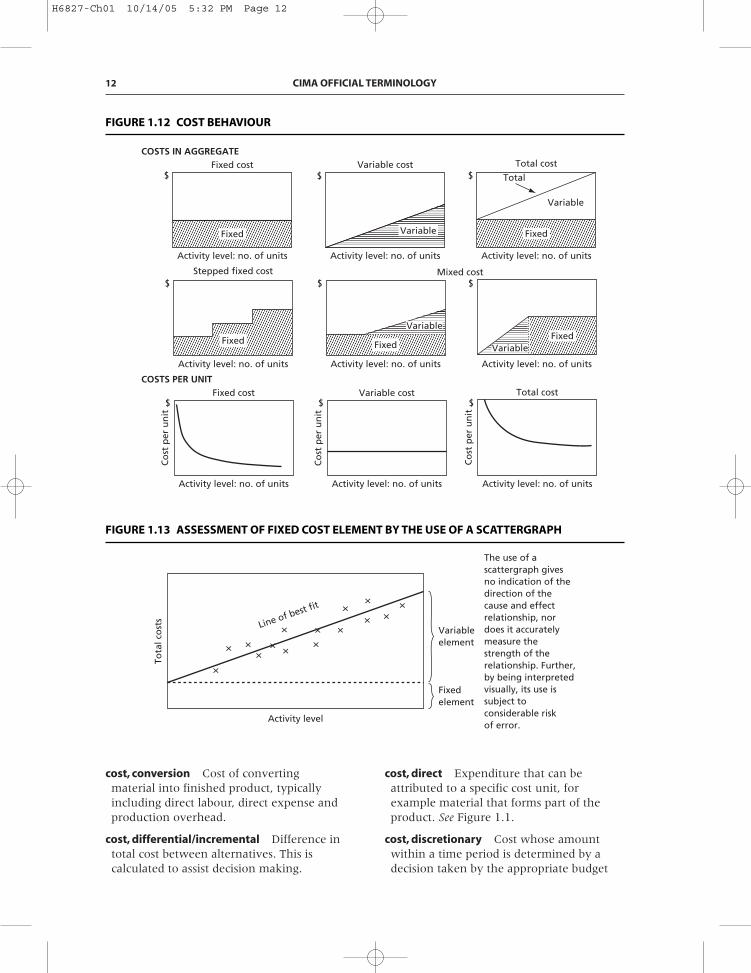
cost behaviour Variability of input costswith activity undertaken. Cost mayincrease proportionately with increasingactivity (the usual assumption for avariable cost), or it may not change withincreased activity (a fixed cost). Some costs(semi-variable) may have both variable andfixed elements. Other behaviour is possible,costs may increase more or less than indirect proportion, and there may be stepchanges in cost, for example. To a largeextent cost behaviour will be dependenton the timescale assumed. See Figures 1.12and 1.13.
cost classification Arrangement of elementsof cost into logical groups with respect totheir nature (fixed, variable, value adding),function (production, selling) or use in thebusiness of the entity.
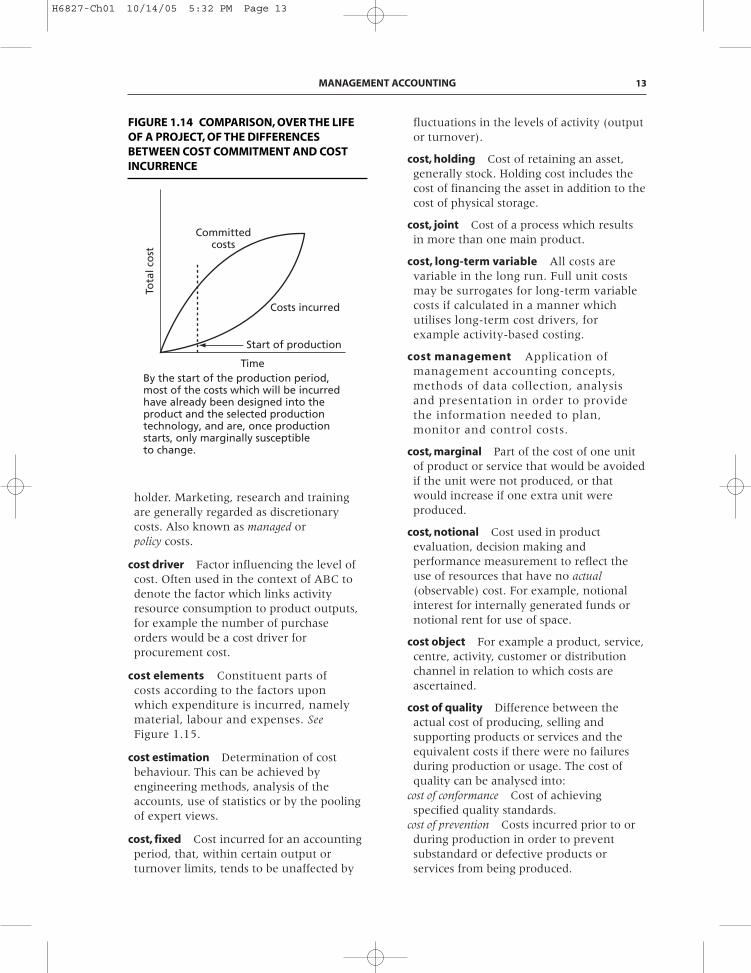
cost, committed Cost arising from priordecisions, which cannot, in the short run,be changed. Committed cost incurrenceoften stems from strategic decisionsconcerning capacity with resultingexpenditure on plant and facilities. Initialcontrol of committed costs at the decisionpoint is through investment appraisaltechniques. See commitment accounting.See Figure 1.14.
cost, common Cost relating to more thanone product or service.
cost, contract Aggregated costs of a singlecontract. This usually applies to majorlong-term contracts rather than short-term jobs.
cost control Process that ensures actionis taken if costs exceed a pre-setallowance (see control, feedback) or thataction is taken if costs are forecast toexceed expected levels (see control,feedforward).
cost, controllable Cost that can becontrolled, typically by a cost, profit orinvestment centre manager.
MANAGEMENT ACCOUNTING 11
FIGURE 1.11 ELEMENTS OF A PRODUCT COSTING SYSTEM
Overall Control System: Budgetary Control
Product costing system Specific orders Continuous operations
Costing method Job costing Batch Contract Continuous Service/costing costing operation/ function
process costingcosting
Treatment offixed production Absorption or marginaloverhead
Method of cost Standard or actualcontrol
H6827-Ch01 10/14/05 5:32 PM Page 11
cost, conversion Cost of convertingmaterial into finished product, typicallyincluding direct labour, direct expense andproduction overhead.
cost, differential/incremental Difference intotal cost between alternatives. This iscalculated to assist decision making.
cost, direct Expenditure that can beattributed to a specific cost unit, forexample material that forms part of theproduct. See Figure 1.1.
cost, discretionary Cost whose amountwithin a time period is determined by adecision taken by the appropriate budget
12 CIMA OFFICIAL TERMINOLOGY
Activity level: no. of units
Co
st p
er u
nit
$
Activity level: no. of units
Co
st p
er u
nit
$
Activity level: no. of units
Co
st p
er u
nit
$
COSTS PER UNITFixed cost Variable cost Total cost
Activity level: no. of units
Fixed
Variable
$
Activity level: no. of units
Stepped fixed cost
Fixed
$
Activity level: no. of units
Mixed cost
FixedVariable
$
COSTS IN AGGREGATEFixed cost
Activity level: no. of units
Fixed
$Variable cost
Activity level: no. of units
Variable
$Total cost
Activity level: no. of units
Fixed
$ Total
Variable
FIGURE 1.12 COST BEHAVIOUR
Activity level
Line of best fit
Tota
l co
sts
Variableelement
The use of ascattergraph givesno indication of thedirection of thecause and effectrelationship, nordoes it accuratelymeasure thestrength of therelationship. Further,by being interpretedvisually, its use issubject toconsiderable riskof error.
Fixedelement
××
×
×
××× ×
××
× ××
× ×
FIGURE 1.13 ASSESSMENT OF FIXED COST ELEMENT BY THE USE OF A SCATTERGRAPH
H6827-Ch01 10/14/05 5:32 PM Page 12
holder. Marketing, research and trainingare generally regarded as discretionarycosts. Also known as managed orpolicy costs.
cost driver Factor influencing the level ofcost. Often used in the context of ABC todenote the factor which links activityresource consumption to product outputs,for example the number of purchaseorders would be a cost driver forprocurement cost.
cost elements Constituent parts ofcosts according to the factors uponwhich expenditure is incurred, namelymaterial, labour and expenses. SeeFigure 1.15.
cost estimation Determination of costbehaviour. This can be achieved byengineering methods, analysis of theaccounts, use of statistics or by the poolingof expert views.
cost, fixed Cost incurred for an accountingperiod, that, within certain output orturnover limits, tends to be unaffected by
fluctuations in the levels of activity (outputor turnover).
cost, holding Cost of retaining an asset,generally stock. Holding cost includes thecost of financing the asset in addition to thecost of physical storage.
cost, joint Cost of a process which resultsin more than one main product.
cost, long-term variable All costs arevariable in the long run. Full unit costsmay be surrogates for long-term variablecosts if calculated in a manner whichutilises long-term cost drivers, forexample activity-based costing.
cost management Application ofmanagement accounting concepts,methods of data collection, analysisand presentation in order to providethe information needed to plan,monitor and control costs.
cost, marginal Part of the cost of one unitof product or service that would be avoidedif the unit were not produced, or thatwould increase if one extra unit wereproduced.
cost, notional Cost used in productevaluation, decision making andperformance measurement to reflect theuse of resources that have no actual(observable) cost. For example, notionalinterest for internally generated funds ornotional rent for use of space.
cost object For example a product, service,centre, activity, customer or distributionchannel in relation to which costs areascertained.
cost of quality Difference between theactual cost of producing, selling andsupporting products or services and theequivalent costs if there were no failuresduring production or usage. The cost ofquality can be analysed into:
cost of conformance Cost of achievingspecified quality standards.
cost of prevention Costs incurred prior to orduring production in order to preventsubstandard or defective products orservices from being produced.
MANAGEMENT ACCOUNTING 13
Committedcosts
Costs incurred
Start of production
TimeBy the start of the production period,most of the costs which will be incurredhave already been designed into theproduct and the selected productiontechnology, and are, once productionstarts, only marginally susceptibleto change.
Tota
l co
st
FIGURE 1.14 COMPARISON, OVER THE LIFEOF A PROJECT, OF THE DIFFERENCESBETWEEN COST COMMITMENT AND COSTINCURRENCE
H6827-Ch01 10/14/05 5:32 PM Page 13

cost of appraisal Costs incurred in order toensure that outputs produced meetrequired quality standards.
cost of non-conformance Cost of failureto deliver the required standard ofquality.
cost of internal failure Costs arising frominadequate quality which are identifiedbefore the transfer of ownership fromsupplier to purchaser.
cost of external failure Cost arising frominadequate quality discovered after the
transfer of ownership from supplier topurchaser.
Note: There is no universally accepteddefinition of quality, which may beassessed on a number of bases, such asconformance to specification, ability tosatisfy wants, inclusion of attractiveperformance/aesthetic attributes, oroffering value for money.
cost, opportunity The value of thebenefit sacrificed when one course of action
14 CIMA OFFICIAL TERMINOLOGY
Direct costs Overhead
Materials
Labour
Expenses
Materials
Labour
Expenses
Prime cost Production
Production cost
Total cost
Stock adjustment
Cost of sales Sales
PROFIT
Production overhead
Absorbedoverhead
Under/overabsorbedoverhead
MarketingAdministration R&D
Selling Distribution
Notes: 1. The above chart is based on the absorption costing principle. 2. In the case of marginal costing, the amount of production overhead absorbed would relate to the variable element only. 3. The relative sizes of the boxes are of no significance.
FIGURE 1.15 ELEMENTS OF AN ABSORPTION COSTING SYSTEM
H6827-Ch01 10/14/05 5:32 PM Page 14
is chosen in preference to an alternative.The opportunity cost is represented by theforegone potential benefit from the bestrejected course of action.
cost, overhead/indirect Expenditureon labour, materials or services thatcannot be economically identified witha specific saleable cost unit.
The synonymous term burden isin common use in the US and insubsidiaries of American companies.
cost, period Cost relating to a time periodrather than to the output of products orservices.
cost pool Grouping of costs relating to aparticular activity in an activity-basedcosting system.
cost, post-purchase Cost incurred after acapital expenditure decision has beenimplemented and facilities acquired. Mayinclude training, maintenance and the costof upgrades.
cost, prime Total cost of direct material,direct labour and direct expenses.
cost, product Cost of a finished productbuilt up from its cost elements.
cost, production Prime cost plus absorbedproduction overhead.
cost, replacement Cost ofreplacing an asset. This is important inrelevant costing because if, for example,material that is in constant use is neededfor a product or service, the relevant costof that material will be its replacementcost. Replacement cost has also beenproposed as an alternate to historic costaccounting and it can, therefore, bean important concept with relevanceto accounting for inflation or measuringperformance where the value of assets isimportant.
cost, semi-variable Cost containing bothfixed and variable components and thuspartly affected by a change in the level ofactivity.
cost, standard Planned unit costof a product, component or service. The
standard cost may be determined ona number of bases (see standard). Themain uses of standard costs are inperformance measurement, control, stockvaluation and in the establishment ofselling prices. See standard productspecification.
cost, sunk Cost that has been irreversiblyincurred or committed and cannottherefore be considered relevant to adecision. Sunk costs may also be termedirrecoverable costs.
cost table Database containingcosts associated with production of aproduct, broken down by functionand/or components and sub-assemblies.It incorporates cost changes that wouldresult from possible changes in theinput mix.
cost, target Product cost estimatederived by subtracting a desiredprofit margin from a competitive marketprice.
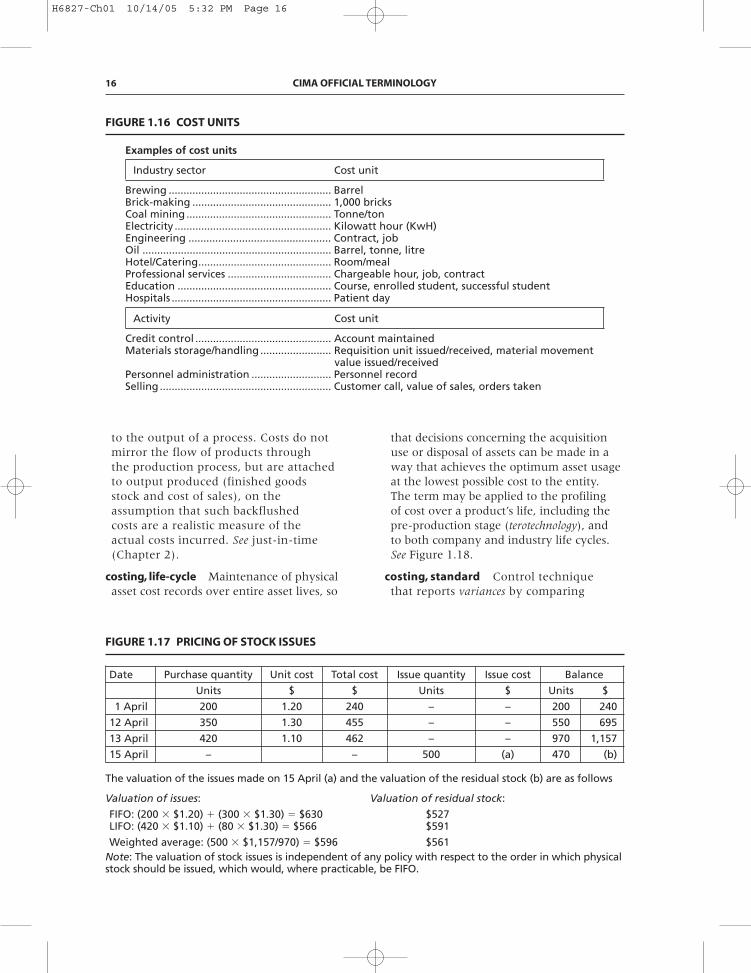
cost unit Unit of product or service inrelation to which costs are ascertained.See Figure 1.16.
cost, variable Cost that varies with ameasure of activity.
cost, weighted average Methodof unit cost determination, oftenapplied to stocks, in which an averageunit cost is calculated, when a newpurchase quantity is received:
See Figure 1.17.
cost-benefit analysis Comparison betweenthe costs of the resources used plus anyother costs imposed by an activity (forexample pollution, environmentaldamage) and the value of the financialand non-financial benefits derived.
costing, backflush Method of costing,associated with a JIT (just-in-time)production system, which applies cost
Cost of opening stock � Cost of acquisitions
Total number of units
MANAGEMENT ACCOUNTING 15
H6827-Ch01 10/14/05 5:32 PM Page 15
to the output of a process. Costs do notmirror the flow of products throughthe production process, but are attachedto output produced (finished goodsstock and cost of sales), on theassumption that such backflushedcosts are a realistic measure of theactual costs incurred. See just-in-time(Chapter 2).
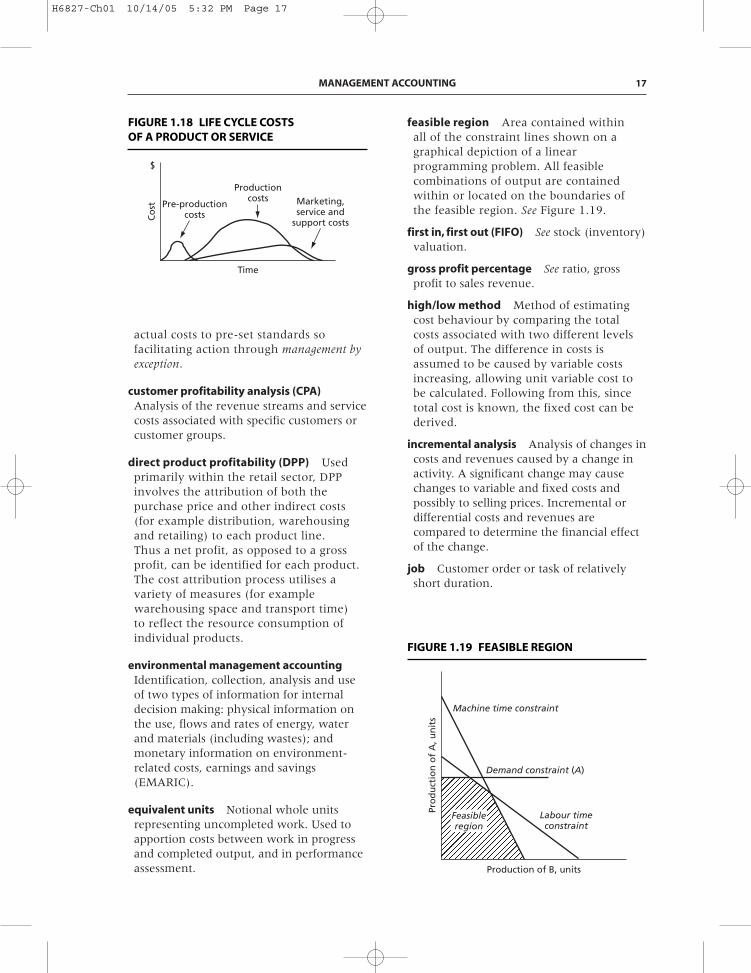
costing, life-cycle Maintenance of physicalasset cost records over entire asset lives, so
that decisions concerning the acquisitionuse or disposal of assets can be made in away that achieves the optimum asset usageat the lowest possible cost to the entity.The term may be applied to the profilingof cost over a product’s life, including thepre-production stage (terotechnology), andto both company and industry life cycles.See Figure 1.18.
costing, standard Control techniquethat reports variances by comparing
16 CIMA OFFICIAL TERMINOLOGY
Examples of cost units
Industry sector Cost unit
Brewing ....................................................... BarrelBrick-making ............................................... 1,000 bricksCoal mining ................................................. Tonne/tonElectricity ..................................................... Kilowatt hour (KwH)Engineering ................................................ Contract, jobOil ................................................................ Barrel, tonne, litreHotel/Catering............................................. Room/mealProfessional services ................................... Chargeable hour, job, contractEducation .................................................... Course, enrolled student, successful studentHospitals ...................................................... Patient day
Activity Cost unit
Credit control .............................................. Account maintainedMaterials storage/handling ........................ Requisition unit issued/received, material movement
value issued/receivedPersonnel administration ........................... Personnel recordSelling .......................................................... Customer call, value of sales, orders taken
FIGURE 1.16 COST UNITS
Date Purchase quantity Unit cost Total cost Issue quantity Issue cost Balance
Units $ $ Units $ Units $
1 April 200 1.20 240 – – 200 240
12 April 350 1.30 455 – – 550 695
13 April 420 1.10 462 – – 970 1,157
15 April – – 500 (a) 470 (b)
The valuation of the issues made on 15 April (a) and the valuation of the residual stock (b) are as follows
Valuation of issues: Valuation of residual stock:
FIFO: (200 � $1.20) � (300 � $1.30) � $630 $527LIFO: (420 � $1.10) � (80 � $1.30) � $566 $591
Weighted average: (500 � $1,157/970) � $596 $561Note: The valuation of stock issues is independent of any policy with respect to the order in which physicalstock should be issued, which would, where practicable, be FIFO.
FIGURE 1.17 PRICING OF STOCK ISSUES
H6827-Ch01 10/14/05 5:32 PM Page 16
actual costs to pre-set standards sofacilitating action through management byexception.
customer profitability analysis (CPA)Analysis of the revenue streams and servicecosts associated with specific customers orcustomer groups.
direct product profitability (DPP) Usedprimarily within the retail sector, DPPinvolves the attribution of both thepurchase price and other indirect costs(for example distribution, warehousingand retailing) to each product line.Thus a net profit, as opposed to a grossprofit, can be identified for each product.The cost attribution process utilises avariety of measures (for examplewarehousing space and transport time)to reflect the resource consumption ofindividual products.
environmental management accountingIdentification, collection, analysis and useof two types of information for internaldecision making: physical information onthe use, flows and rates of energy, waterand materials (including wastes); andmonetary information on environment-related costs, earnings and savings(EMARIC).
equivalent units Notional whole unitsrepresenting uncompleted work. Used toapportion costs between work in progressand completed output, and in performanceassessment.
feasible region Area contained withinall of the constraint lines shown on agraphical depiction of a linearprogramming problem. All feasiblecombinations of output are containedwithin or located on the boundaries ofthe feasible region. See Figure 1.19.
first in, first out (FIFO) See stock (inventory)valuation.
gross profit percentage See ratio, grossprofit to sales revenue.
high/low method Method of estimatingcost behaviour by comparing the totalcosts associated with two different levelsof output. The difference in costs isassumed to be caused by variable costsincreasing, allowing unit variable cost tobe calculated. Following from this, sincetotal cost is known, the fixed cost can bederived.
incremental analysis Analysis of changes incosts and revenues caused by a change inactivity. A significant change may causechanges to variable and fixed costs andpossibly to selling prices. Incremental ordifferential costs and revenues arecompared to determine the financial effectof the change.
job Customer order or task of relativelyshort duration.
MANAGEMENT ACCOUNTING 17
Time
Pre-productioncosts
Productioncosts Marketing,
service andsupport costsC
ost
$
FIGURE 1.18 LIFE CYCLE COSTSOF A PRODUCT OR SERVICE
Machine time constraint
Demand constraint (A)
Labour timeconstraint
Production of B, units
Pro
du
ctio
n o
f A
, un
its
Feasibleregion
FIGURE 1.19 FEASIBLE REGION
H6827-Ch01 10/14/05 5:32 PM Page 17
job cost sheet Detailed record of theamount, and cost, of the labour, materialand overhead charged to a specific job.
joint products Two or more productsproduced by the same process and separatedin processing, each having a sufficiently highsaleable value to merit recognition as a mainproduct. See by-product.
key performance indicators (KPIs)Quantitative but not necessarily financialmetrics that can indicate progress or lack ofprogress towards a strategic objective. Forexample, metrics may be devised for safety,quality, turnover of key staff. Keyperformance indicators were important tothe idea of management by objectives and areintegral to the scorecard ideas developed inthe 1990s.
knowledge management Systematicprocess of finding, selecting, organising,distilling and presenting information so asto improve comprehension of a specificarea of interest. Specific activities helpfocus the organisation on acquiring,storing and utilising knowledge for suchthings as problem solving, dynamiclearning, strategic planning and decisionmaking.
last in, first out (LIFO) See stock (inventory)valuation.
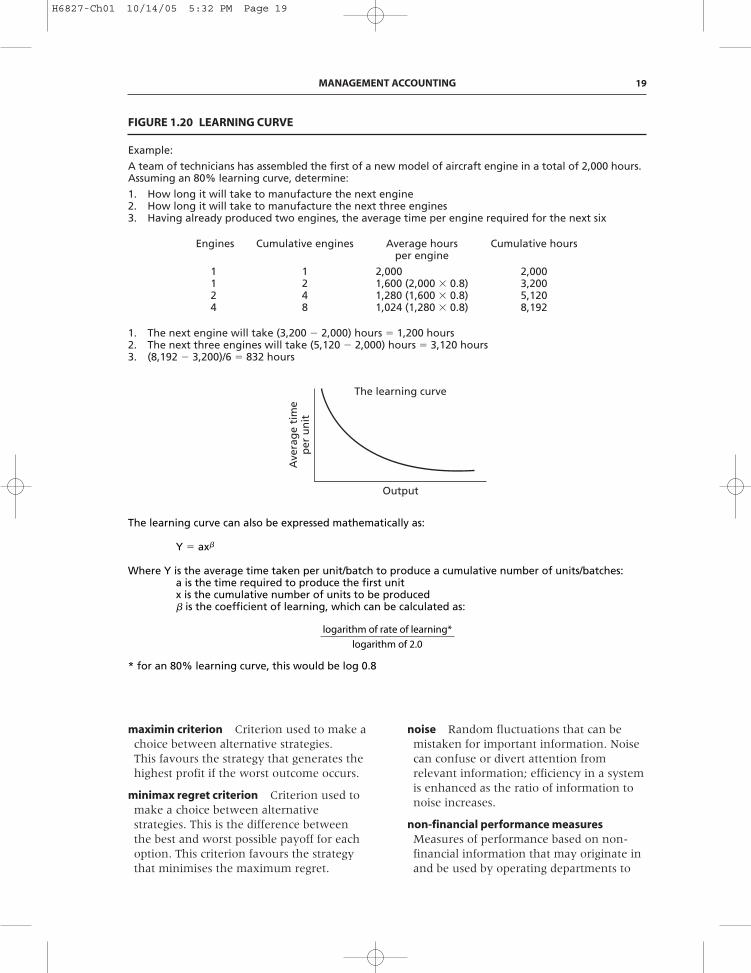
learning curve Mathematical expression ofthe commonly observed effect that, ascomplex and labour-intensive proceduresare repeated, unit labour times tend todecrease. The equation (see Figure 1.20)usually relates the average time taken perunit/batch to the cumulative number ofunits/batches produced. An alternative,little used, formulation uses the sameequation but relates the incremental (notaverage) time for the nth unit to thecumulative number of units/batchesproduced.
management accounting Managementaccounting is the application of theprinciples of accounting and financialmanagement to create, protect, preserveand increase value for the stakeholders of
for-profit and not-for-profit enterprises inthe public and private sectors.
Management accounting is an integralpart of management. It requires theidentification, generation, presentation,interpretation and use of relevantinformation to:• Inform strategic decisions and formulate
business strategy• Plan long, medium and short-run
operations• Determine capital structure and fund
that structure• Design reward strategies for executives
and shareholders• Inform operational decisions• Control operations and ensure the
efficient use of resources• Measure and report financial and non-
financial performance to managementand other stakeholders
• Safeguard tangible and intangible assets
• Implement corporate governanceprocedures, risk management andinternal controls.
management by exception Practiceof concentrating on activities thatrequire attention and ignoring thosewhich appear to be conforming toexpectations.
Typically, standard cost variances orvariances from budget are used to identifythose activities that require attention.
margin Difference between the sellingprice and cost of sales expressed either as apercentage of sales or as an absoluteamount. See mark-up.
marginal revenue Additional revenuegenerated from the sale of one additionalunit of output.
maximax criterion Criterion used to makea choice between alternative strategies. Thisfavours the strategy that might lead to thehighest possible profit, irrespective of theprobability of that profit actually beingachieved and the outcome if it is notsuccessful.
18 CIMA OFFICIAL TERMINOLOGY
H6827-Ch01 10/14/05 5:32 PM Page 18
maximin criterion Criterion used to make achoice between alternative strategies.This favours the strategy that generates thehighest profit if the worst outcome occurs.
minimax regret criterion Criterion used tomake a choice between alternativestrategies. This is the difference betweenthe best and worst possible payoff for eachoption. This criterion favours the strategythat minimises the maximum regret.
noise Random fluctuations that can bemistaken for important information. Noisecan confuse or divert attention fromrelevant information; efficiency in a systemis enhanced as the ratio of information tonoise increases.
non-financial performance measuresMeasures of performance based on non-financial information that may originate inand be used by operating departments to
MANAGEMENT ACCOUNTING 19
Example:
A team of technicians has assembled the first of a new model of aircraft engine in a total of 2,000 hours.Assuming an 80% learning curve, determine:
1. How long it will take to manufacture the next engine2. How long it will take to manufacture the next three engines3. Having already produced two engines, the average time per engine required for the next six
FIGURE 1.20 LEARNING CURVE
Engines Cumulative engines Average hours Cumulative hours per engine
1 1 2,000 2,0001 2 1,600 (2,000 � 0.8) 3,2002 4 1,280 (1,600 � 0.8) 5,1204 8 1,024 (1,280 � 0.8) 8,192
1. The next engine will take (3,200 � 2,000) hours � 1,200 hours2. The next three engines will take (5,120 � 2,000) hours � 3,120 hours3. (8,192 � 3,200)/6 � 832 hours
The learning curve
Output
Ave
rag
e ti
me
per
un
it
The learning curve can also be expressed mathematically as:
Y � ax�
Where Y is the average time taken per unit/batch to produce a cumulative number of units/batches:a is the time required to produce the first unitx is the cumulative number of units to be produced� is the coefficient of learning, which can be calculated as:
* for an 80% learning curve, this would be log 0.8
logarithm of rate of learning*
logarithm of 2.0
H6827-Ch01 10/14/05 5:32 PM Page 19

monitor and control their activities withoutany accounting input.
Non-financial performance measures maygive a more timely indication of the levelsof performance achieved than financialmeasures do, and may be less susceptible todistortion by factors such as uncontrollablevariations in the effect of market forces onoperations.
Non-financial measures are now integratedwith financial measures in systems suchas the balanced scorecard™. Examples ofnon-financial performance measures:
Area assessed Performance measure
Service quality Number of complaintsProportion of repeat
bookingsCustomer waiting timeOn-time deliveries
Production Set-up timesperformance Number of suppliers
Days’ inventory in hand
Output per employeeMaterial yield percentageSchedule adherenceProportion of output
requiring reworkManufacturing lead
times
Marketing Trend in market shareeffectiveness Sales volume growth
Customer visits per salesperson
Client contact hours per salesperson
Sales volume forecast v.actual
Number of customersCustomer survey
response information
Personnel Number of complaints received
Staff turnoverDays lost through
absenteeismDays lost through
accidents/sicknessTraining time per
employee
The values expected may varysignificantly between industries/sectors.
normal loss Expected loss, allowed for inthe budget, and normally calculated as apercentage of the good output from aprocess during a period of time. Normallosses are generally either valued at zero orat their disposal values.
operational gearing Relationship of fixedcost to total cost of an operating unit. Thegreater the proportion of total costs that arefixed (high operational gearing), thegreater is the advantage to the organisationof increasing sales volume. Conversely,should sales volumes drop, a highly gearedorganisation would find the highproportion of fixed costs to be a majorproblem, possibly causing a rapid swingfrom profitability into loss. Gearing mayalso be referred to as leverage. See ratio,gearing/leverage.
overhead absorption rate A means ofattributing overhead to a product orservice, based for example on direct labourhours, direct labour cost or machinehours.
direct labour cost percentage rate Overheadabsorption rate based on direct labourcost.
direct labour hour rate Overhead absorptionrate based on direct labour hours.
machine hour rate Overheadabsorption rate based on machine hours.See Figure 1.1.
payroll analysis Analysis of labour costsfor accounting purposes identifying, forexample: gross pay by department,operation or product; and/or gross payanalysed into direct pay or lost time.
performance measurement Process ofassessing the proficiency with which areporting entity succeeds, by the economicacquisition of resources and their efficientand effective deployment, in achieving itsobjectives. Performance measures may bebased on non-financial as well as onfinancial information. See non-financialperformance measures.
20 CIMA OFFICIAL TERMINOLOGY
H6827-Ch01 10/14/05 5:32 PM Page 20
profit margin(sales � cost of sales)This can be expressed either as a value or
as a percentage of sales value. The profitmargin may be calculated at different stages,hence the terms gross and net profit margin.
The level of profit reported is alsoinfluenced by the extent of the applicationof accounting conventions, and by themethod of product costing used, forexample marginal or absorption costing.
profit–volume/contribution graph Graphshowing the effect on contribution and onoverall profit of changes in sales volume orvalue. See Figure 1.6.
profitability index
Used in investment appraisal. Representsthe net present value of each $1 invested ina project.
project costing See contract costing (costaccounting for cost objects).
qualitative factors Factors that are relevantto a decision but are not expressednumerically.
quantitative factors Factors that arerelevant to a decision and are expressednumerically.
ratio, accounting rate of return
Sometimes used in investment appraisal,derived in the same way as return oninvestment. Unlike net present value andinternal rate of return, the ratio is based onprofits not cash flows. Exclusive use of thisratio is not recommended.
ratio, asset cover
Indicates the safety of lenders’money. Net tangible assets are usually
overdraft and other borrowingsNet tangible assets before deducting
Total borrowings including overdraft
an investment � 100Average annual profit from
Average investment
Present value of cash inflows
Initial investment
calculated after deducting trade payables(hence, net).
ratio, asset value per share
Shows the value of net assets per shareand may aid investment and disinvestmentdecisions. Note that this ratio is equivalentto net worth per share.
ratio, bad debts
Numerator and denominator shouldrelate to the same period, bad debts shouldbe calculated as an average figure for therelevant time period.
Indicates the significance of bad debts asa proportion of debtors.
ratio, capacity Capacity is usuallymeasured in standard units, typicallystandard labour or machine hours inmanufacturing, and, correspondingly,standard hours in professionalpractices such as accountants andconsultants. The more commonlyused capacity levels are:
full capacity Output achievable if salesorders, supplies, workforce, for example,were all available.
practical capacity Full capacity less anallowance for known, unavoidable volumelosses.
budgeted capacity Standard hours plannedfor the budget period, taking account of, forexample, budgeted sales, workforce andexpected efficiency.
normal capacity Measure of thelong-run average level of capacity that maybe expected. This is often used in settingthe budgeted fixed overhead absorptionrate (giving it stability over time,although budgeted fixed overheadvolume variances may be producedas a consequence).
Bad debts � 100
Total receivables at a point in time
Bad debts � 100
Revenue on credit
Total assets � liabilities
Number of issued equity shares
MANAGEMENT ACCOUNTING 21
H6827-Ch01 10/14/05 5:32 PM Page 21
On the following given data, the relatedratios are set out below:
Full capacity standard hours 100Practical capacity standard hours 95Budgeted capacity (budgeted
input hours, 90 at 90%efficiency) 81
Actual input hours 85Standard hours produced 68
idle capacity ratio
Indicates the budgeted shortfall incapacity as a proportion of practicalcapacity.
production volume ratio
Shows the actual output as a proportionof budgeted output.
production efficiency ratio
Measures the relationship betweenoutput produced and productive timetaken, which may be measured in eitherdirect labour or machine hours, asappropriate.
ratio, capital turnover
Expresses the number of times thatcapital is covered by sales in a year or therevenue generated by each $1 of capitalemployed. Capital employed is usuallycalculated as either:
Revenue for the year
Average capital employed in year
�68 � 100
85� 80%
Standard hours produced � 100
Actual hours
�68 � 100
81� 84%
Standard hours produced � 100
Budgeted capacity
�(95 � 81) � 100
95� 15%
(Practical capacity – budgeted capacity) � 100
Practical capacity
(a) total net assets(fixed assets � current assets – currentliabilities) or
(b) capital employed(equity � long-term debt).The two methods are equivalent.
ratio, contribution per unit of limiting factor
Used in short-term decision making tomeasure the contribution to fixedoverhead and profit generated by theuse of each unit of limiting factor. Thisis used to rank alternative uses of thelimiting factor.
ratio, contribution to sales
Of particular use in product profitplanning and as a means of rankingalternative products. Also important inbreakeven problems that assume a constantproduct mix. Note, although contributionto sales ratio can be used to rank products,it cannot be used to solve limiting factorproblems (unless the limiting factor is salesrevenue).
ratio, creditor days See ratio, payables days.
ratio, debtor days See ratio, receivablesdays.
ratio, dividend cover
Indicates the number of times the profitsattributable to the equity shareholders coverthe net dividends payable for the period.
ratio, dividend payout
Shows the proportion of earningsdistributed to ordinary shareholders asdividends. Indicates how safe the
Ordinary dividends for the year
Earnings attributable to theordinary shareholders
Earnings per share
Dividend per share
(Revenue � all variable costs) � 100
Revenue
Product/service contribution
Product/service usage of unitsof limiting factor
22 CIMA OFFICIAL TERMINOLOGY
H6827-Ch01 10/14/05 5:32 PM Page 22
dividend is (as does the dividend coverratio).
ratio, fixed asset turnover
Indicates the revenue generated byeach $1 of fixed assets, or the number oftimes fixed assets are turned over in theyear.
ratio, gearing/leverage Relates tofinancial gearing, which is therelationship between an entity’sborrowings, which includes both priorcharge capital, for example preferenceshares, and long-term debt, and its share-holders’ funds (ordinary sharecapital plus reserves). Gearing calculationscan be made in a number of ways, andmay be based on capital values or onearnings/interest relationships. Overdraftsand interest paid thereon may also beincluded.
Shows the effect of interest on theoperating profit (income gearing). See alsoratio, interest cover.
Shows the proportion of long-termfinancing which is being supplied by debt(balance sheet gearing).
A measure of the capacity to redeem debtobligations by the sale of assets.
Measures ability to redeem debt. Anentity with a high proportion of priorcharge capital to shareholders’ funds ishigh geared, and is low geared if thereverse situation applies.
of financereturns on investment and servicing
Repayments of debt due within one year
Operating cashflows � taxation paid �
Total long-term debt
Total assets
Total long-term debt
Shareholders' funds � long-term debt
Profit before interest and tax
Profit before tax
Revenue for the year
Average net book value of fixed assets
ratio, gross profit to sales revenue(gross profit margin %)
Used to gain an insight into therelationship between production/purchasingcosts and sales revenues.
ratio, interest cover
Used by lenders to determinevulnerability of interest payments to adrop in profit.
ratio(s), inventory daysnumber of days’ inventory
Number of days’ inventory at theforecast or recent usage rate. Can beapplied to finished goods, raw materialand work in progress by usingappropriate numerators anddenominators.
number of weeks’ inventoryThe efficiency of inventory utilisation is
indicated by:
These ratios are normally calculatedusing appropriate values although, incertain circumstances, quantities maybe used.
ratio, length of order book
The sales value of production may bebased on planned, current or availablecapacity production.
Sales value of orders outstanding
Sales value of production perday/week/month
Work in progress
Average weekly production
Raw material stock
Average weekly raw material usage
Finished goods stock
Average weekly despatches
Stock value
Average daily cost of sales in period
Profit before interest and tax
Interest payable
(Sales – cost of sales) � 100
Sales for the period
MANAGEMENT ACCOUNTING 23
H6827-Ch01 10/14/05 5:32 PM Page 23
ratio(s), liquidity Relate to working capitaland indicate the ability to meet liabilitiesfrom assets available. The most commonlyused are:
acid test/quick ratio
Indicates the ability to pay creditors inthe short term.
current ratio
An overall measure of liquidity.
ratio, margin of safety
Indicates the percentage by whichforecast revenue exceeds or falls short ofthat required to break even.
ratio, net profit to sales revenue(net profit margin %)
A key profitability ratio. If the numeratoris not multiplied by 100 it shows the profitgenerated by each $1 of sales.
ratio, payables days
Indicates the average time taken, incalendar days, to pay for supplies receivedon credit. Adjustment is needed if the ratiois materially distorted by value added orother taxes.
ratio, price/earnings (P/E ratio)
Shows the number of years it wouldtake to recoup an equity investment fromits share of the attributable profit. The P/Eratio values the shares of the company asa multiple of current or prospective
Market price per share
Earnings per share
Average trade payables
Average daily purchases on credit terms
Net profit before interest and tax � 100
Revenue
breakeven revenue ) � 100(Forecast revenue �
Forecast revenue
Current assets at end of period
Current liabilities at end of period
Current assets – stock at end of period
Current liabilities at end of period
earnings. The P/E ratio is the mostcommon way of reporting the relationshipbetween earnings and share prices,although its inverse, the earnings yield,is probably intuitively easier to grasp.A low P/E ratio implies a high earningsyield. A low P/E ratio might indicatethat the market perceives earnings to be“low quality”.
ratio, profit per employee
Indication of the effectiveness of theemployment of staff. When there arefull- and part-time employees, full-timeequivalents should be used. See sales peremployee.
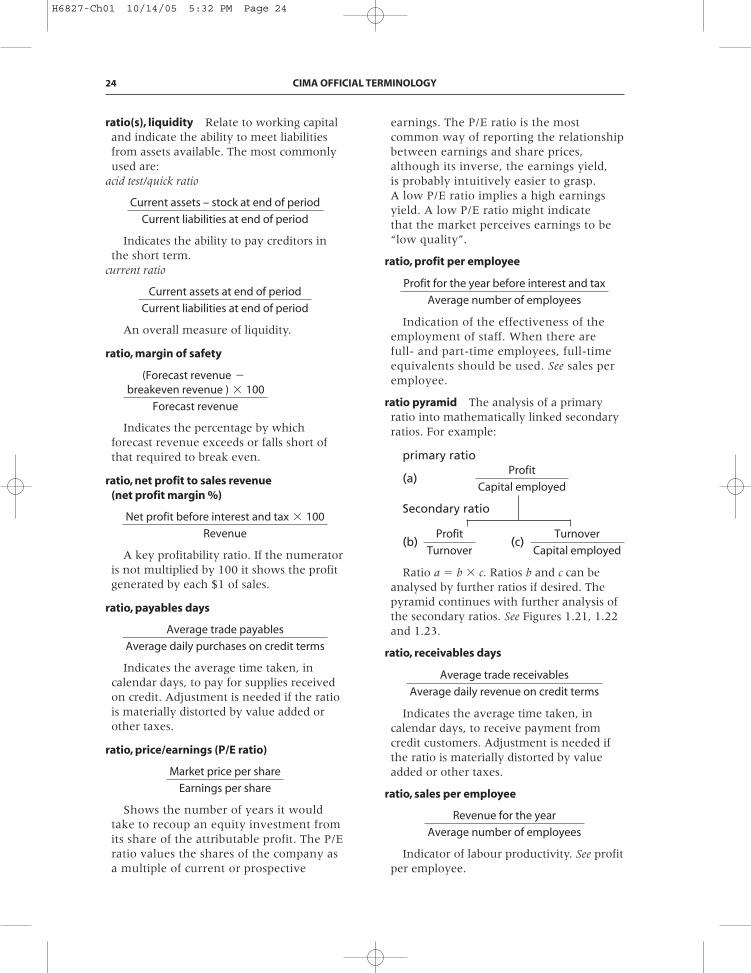
ratio pyramid The analysis of a primaryratio into mathematically linked secondaryratios. For example:
primary ratio
(a)
Secondary ratio
(b) (c)
Ratio a � b � c. Ratios b and c can beanalysed by further ratios if desired. Thepyramid continues with further analysis ofthe secondary ratios. See Figures 1.21, 1.22and 1.23.
ratio, receivables days
Indicates the average time taken, incalendar days, to receive payment fromcredit customers. Adjustment is needed ifthe ratio is materially distorted by valueadded or other taxes.
ratio, sales per employee
Indicator of labour productivity. See profitper employee.
Revenue for the year
Average number of employees
Average trade receivables
Average daily revenue on credit terms
Turnover
Capital employed
Profit
Turnover
Profit
Capital employed
Profit for the year before interest and tax
Average number of employees
24 CIMA OFFICIAL TERMINOLOGY
H6827-Ch01 10/14/05 5:32 PM Page 24
ratio, stock turnover See ratio, inventorydays.
reciprocal cost allocation Method ofreallocating (strictly apportioning) servicecentre costs in a number of iterations untilall service costs have been recharged touser centres. Can also be formulated as aset of equations and solved by matrixalgebra. See re-apportion (apportioning).
recovery See overhead absorption rate.
rejects/defects Units of output which fail aset quality standard and are subsequentlyrectified, sold as substandard or disposed ofas scrap.
relevant costs/revenues Costs andrevenues appropriate to a specificmanagement decision.
These are represented by future cashflows whose magnitude will vary dependingupon the outcome of the managementdecision made. If stock is used, the relevant
MANAGEMENT ACCOUNTING 25
DebtorsAverage daily
sales
Raw material stockAverage daily usage
of raw material
Raw material stockSales
Finished goodsSales
WIPSales
CashSales
DebtorsSales
StockSales
VehiclesSales
PlantSales
PropertySales
Production labour costsTotal no. of direct
employees
Value addedProduction labour
costs
Other production costsSales value of
production
Production labour costsSales value of
production
Material costsSales value of
production
Current assetsSales
Fixed assetsSales
AdministrationSales
Selling costsSales
Production cost of salesSales
AssetsSales
SalesAssets
ProfitSales
ProfitAssets
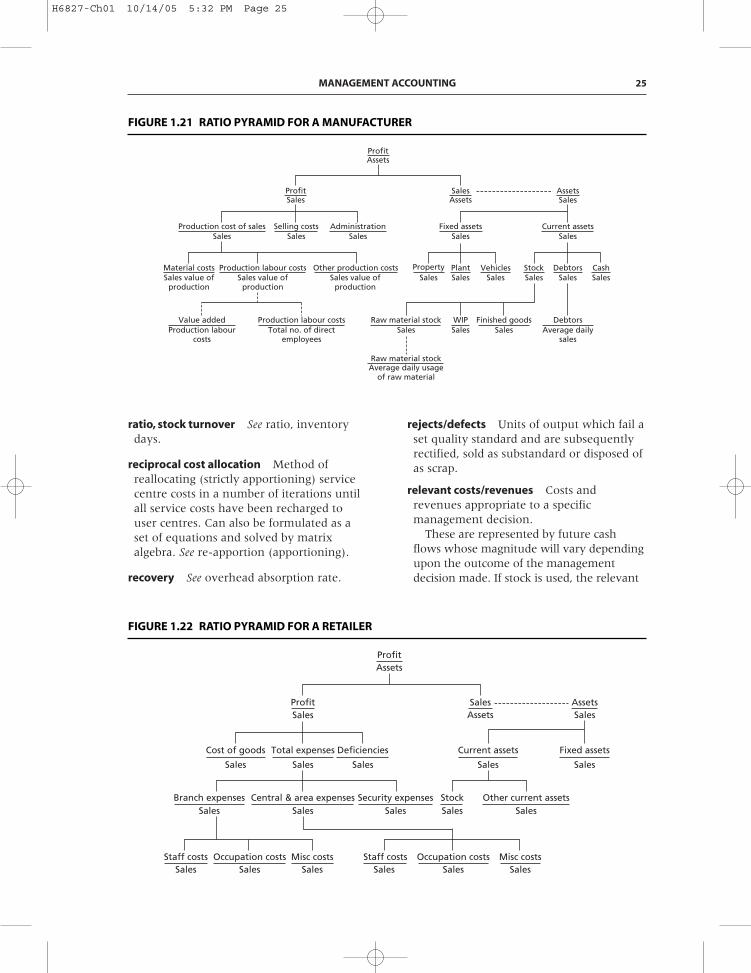
FIGURE 1.21 RATIO PYRAMID FOR A MANUFACTURER
ProfitAssets
ProfitSales Assets
Sales AssetsSales
Sales
Cost of goods
Sales
Total expenses
Sales
Deficiencies
Sales
Current assets
Sales
Fixed assets
SalesOther current assets
SalesStock
SalesSecurity expenses
SalesCentral & area expenses
SalesBranch expenses
SalesStaff costs
SalesStaff costs
SalesOccupation costs
SalesOccupation costs
SalesMisc costs
SalesMisc costs
FIGURE 1.22 RATIO PYRAMID FOR A RETAILER
H6827-Ch01 10/14/05 5:32 PM Page 25
cost, used in the determination ofthe profitability of the transaction, would bethe cost of replacing the stock, not itsoriginal purchase price, which is a sunk cost.
Abandonment analysis, based on relevantcost and revenues, is the process ofdetermining whether or not it is moreprofitable to discontinue a product orservice than to continue it.
relevant range Activity levels within whichassumptions about cost behaviour inbreakeven analysis remain valid.
replacement price Price at which identicalgoods or capital equipment could bepurchased at the date of valuation.
residual income Profit minus a charge forcapital employed in the period. Thecalculation is exactly the same as that foreconomic value added.
However, in the latter case, accountingprofit is often adjusted before thecalculation of economic value added.See economic value added (Chapter 4).
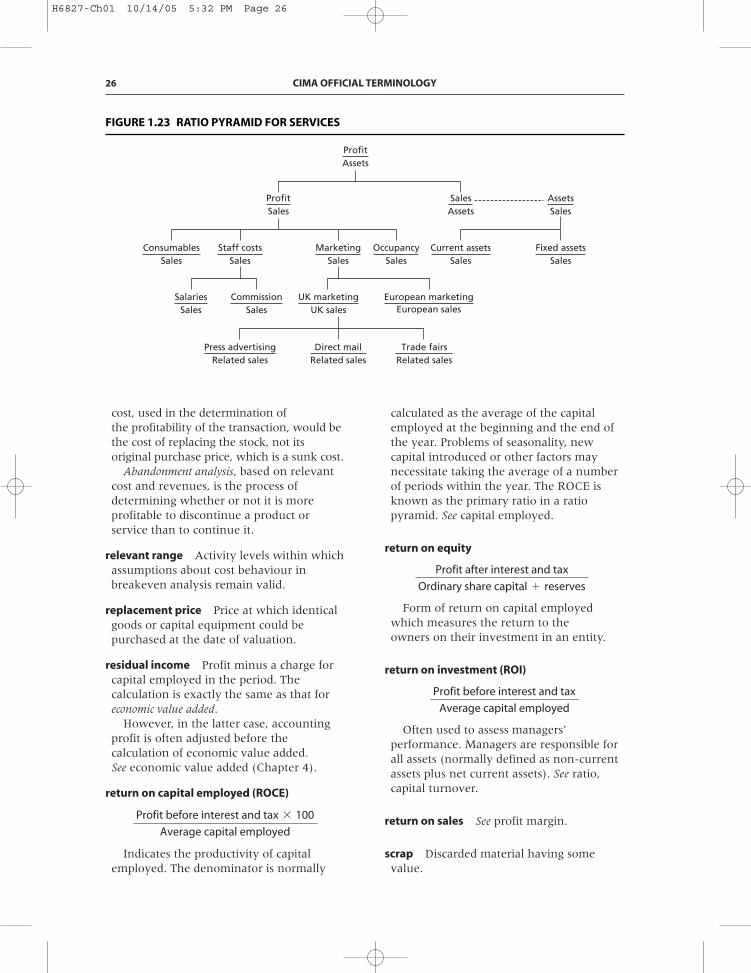
return on capital employed (ROCE)
Indicates the productivity of capitalemployed. The denominator is normally
Profit before interest and tax � 100
Average capital employed
calculated as the average of the capitalemployed at the beginning and the end ofthe year. Problems of seasonality, newcapital introduced or other factors maynecessitate taking the average of a numberof periods within the year. The ROCE isknown as the primary ratio in a ratiopyramid. See capital employed.
return on equity
Form of return on capital employedwhich measures the return to theowners on their investment in an entity.
return on investment (ROI)
Often used to assess managers’performance. Managers are responsible forall assets (normally defined as non-currentassets plus net current assets). See ratio,capital turnover.
return on sales See profit margin.
scrap Discarded material having somevalue.
Profit before interest and tax
Average capital employed
Profit after interest and tax
Ordinary share capital � reserves
26 CIMA OFFICIAL TERMINOLOGY
ProfitAssets
ProfitSales Assets
Sales AssetsSales
SalesConsumables
SalesStaff costs
SalesMarketing
SalesOccupancy
SalesCurrent assets
SalesFixed assets
SalesCommission
SalesSalaries
Related salesTrade fairs
Related salesDirect mail
Related salesPress advertising
UK salesUK marketing
European salesEuropean marketing
FIGURE 1.23 RATIO PYRAMID FOR SERVICES
H6827-Ch01 10/14/05 5:32 PM Page 26
standard Benchmark measurement ofresource usage or revenue or profitgeneration, set in defined conditions.Standards can be set on a number of bases:(a) on an ex ante estimate of expected
performance;(b) on an ex post estimate of attainable
performance;(c) on a prior period level of performance
by the same organisation;(d) on the level of performance achieved
by comparable organisations; or(e) on the level of performance required
to meet organisational objectives.Standards may also be set at attainable
levels that assume efficient levels ofoperation, but that include allowance fornormal loss, waste and machine downtime, or at ideal levels that make noallowance for the above losses, and areonly attainable under the most favourableconditions. The effect of different levels onstaff motivation will be an importantinfluence on the type of standards that areused. See standard, ex ante, and standard,ex post.
standard cost card/standard productspecification Document or digital recorddetailing for each individual product, thestandard inputs required for production aswell as the standard selling price. Inputs arenormally divided into labour, material andoverhead categories, and both price andquantity information is shown for each.
standard direct labour cost Planned cost ofdirect labour.
(standard direct labour time for one unitof product � standard labour rate)
There are separate calculations fordifferent processes and/or grades of labour.
standard, ex ante Before the event. An exante budget or standard is set before aperiod of activity commences.
standard, ex post After the event. An expost budget, or standard, is set afterthe end of a period of activity, when itcan represent the optimum achievablelevel of performance in the conditionswhich were experienced. Thus thebudget can be flexed, and standards can
reflect factors such as unanticipatedchanges in technology and in pricelevels. This approach may be used inconjunction with sophisticated cost andrevenue modelling to determine how farboth the plan and the achieved resultsdiffered from the performance thatwould have been expected in thecircumstances which were experienced.
standard hour or minute Amount of workachievable, at standard efficiency levels, inan hour or minute.
standard performance – labour Level ofefficiency which appropriately trained,motivated and resourced employees canachieve in the long-run.
stock (inventory) valuationaverage cost Used to price issues of goods ormaterials at the weighted average cost of allunits held.
first-in, first-out (FIFO) Used to price issuesof goods or materials based on the cost ofthe oldest units held, irrespective of thesequence in which the actual issue of unitsheld takes place. Closing stock is, therefore,valued at the cost of the oldest purchases.
last-in, first-out (LIFO) Used to price issuesof goods or materials based on the cost ofthe most recently received units. Cost ofsales in the income statement is, therefore,valued at the cost of the most recentpurchases. LIFO is permitted under USGAAP but is not permitted by IAS 2 (orSSAP 9 in the UK).
standard cost All units held as stock arevalued at a standard cost so that unitsissued and closing stock are valued atstandard cost, with any variance betweenactual costs incurred and standard costreported in the income statement in theperiod in which it is incurred. All the abovemethods value stock at cost, but IAS 2requires all stocks to be valued at the lowerof cost and net realisable value. See fairvalue less costs to sell (Chapter 3).
strategic business unit Section, usually adivision, within a larger organisation that hasa significant degree of autonomy, typicallybeing responsible for developing andmarketing its own products and services.
MANAGEMENT ACCOUNTING 27
H6827-Ch01 10/14/05 5:32 PM Page 27
super variable costing See throughputaccounting.
theory, agency Hypothesis that attempts toexplain elements of organisationalbehaviour through an understanding of therelationships between principals (such asshareholders) and agents (such as entitymanagers and accountants). A conflict mayexist between the actions undertaken byagents in furtherance of their own self-interest, and those required to promote theinterests of the principals. Within thehierarchy of entities, the same goalincongruence may arise when divisionalmanagers promote their own self-interestover those of other divisions and of theentity generally.
theory, contingency Theory relatingto the design of accounting systemsthat presupposes that systems canbe effectively designed to suit thecircumstances of the firm including itstechnology, entity structure and itscompetitive environment. For example,it is argued that mechanistic (hierarchical,bureaucratic) systems can be effective instable environments. Organic (typicallyflatter, task-related) systems are said tobe more appropriate in more turbulent,competitive environments.
theory of constraints (TOC) Procedure basedon identifying bottlenecks (constraints),maximising their use, subordinating otherfacilities to the demands of the bottleneckfacilities, alleviating bottlenecks andre-evaluating the whole system.(Goldratt created this concept).
throughput Term defined, in work byGoldratt, as sales minus material andcomponent costs. Similar to contributionexcept material is considered the onlyvariable cost. Goldratt argues that labourcosts should be treated as fixed. InGoldratt’s analysis operating expense is allnon-material costs and inventory cost isdefined as the cost of assets employed.
throughput accounting (TA) Variable costaccounting presentation based on thedefinition of throughput (sales minus
material and component costs). Sometimesreferred to as super variable costing becauseonly material costs are treated as variable.
throughput per bottleneck minute Methodof ranking products that share the same(bottleneck) facility. Very similar to the useof contribution per unit of limiting factor.
throughput ratios Several ratios weredefined by Galloway and Waldron basedon the definition of throughput. The TA(throughput accounting) ratio is:
Note: Galloway and Waldron define factorycost in the same way that Goldratt definesoperating expense. See throughput.
If the TA ratio is greater than 1 theproduct in question is “profitable” because,if all capacity were devoted to that product,the throughput generated would exceed thetotal factory cost. If there was a bottleneckproducts could be ranked by a variant ofthe TA ratio (although the ranking isthe same as that derived by the use ofthroughput per bottleneck minute). Otherperformance ratios suggested include:
and
transfer price Price at which goods orservices are transferred between differentunits in the same company. May be set ona number of bases, such as marginal cost,full cost, market price or negotiation. Forthe transfer of goods between units indifferent countries, tax implications meanthat the respective governments have toaccept the method used. They are likely toinsist on arm’s-length transfer prices.
uniform accounting System by whichdifferent entities in the same industry adoptcommon concepts, principles andassumptions in order to generateaccounting information that facilitatesinter-entity comparison or a system of
throughput
material cost
throughput
labour cost
Throughput per bottleneck minute
Factory cost per bottleneck minute
28 CIMA OFFICIAL TERMINOLOGY
H6827-Ch01 10/14/05 5:32 PM Page 28
classifying financial accounts in a similarmanner within defined business sectors of anational economy to ensure comparability.
value added Traditionally the differencebetween sales revenue and the cost ofmaterials and bought-out services.Alternatively, it might be calculated as thesum of profit, interest and all conversioncosts. Recently, more commonly usedin the context of economic value added.See economic value added, Chapter 4.
value analysis Systematic interdisciplinaryexamination of factors affecting the cost ofa product or service, in order to devisemeans of achieving the specified purposemost economically at the required standardof quality and reliability (BS 3138)1.
value driver Activity or organisationalfocus which enhances the perceived valueof a product or service in the perceptionof the consumer, and which thereforecreates value for the producer. Advancedtechnology, reliability or reputation forcustomer care may be value drivers.
value engineering Redesign of an activity,product or service so that value to thecustomer is enhanced while costs arereduced (or, at least, increase by less thanthe resulting price increase).
variance Difference between a planned,budgeted or standard cost and the actualcost incurred. The same comparisons maybe made for revenues.
variance, administrative cost Measurementof the extent of any over- or underspendon administrative costs.
(budgeted cost of administration � actualcost)
variance analysis Evaluation of performanceby means of variances, whose timelyreporting should maximise the opportunityfor managerial action. See Figure 1.34.
variance, budget Difference, for each costor revenue element in a budget, betweenthe budgeted amount and the actual cost orrevenue. Where flexible budgeting isemployed, it is the difference between theflexed budget and the actual value.
variance, direct labour efficiency Standardlabour cost of any change from thestandard level of labour efficiency.
((actual production in standard hours –actual hours worked) � standard directlabour rate per hour)See Figure 1.28.
variance, direct labour idle time Thisvariance occurs when the hours paidexceed the hours worked and there isan extra cost caused by this idle time.Its computation increases the accuracy ofthe labour efficiency variance.
((hours paid – hours worked) � standarddirect labour rate per hour)
variance, direct labour mix Subdivisionof the direct labour efficiency variance.If grades of labour can be substituted the mixvariance measures the cost of any variationfrom the standard mix of grades.
((actual hours for grade – hours for gradebased on total labour hours split instandard proportions) � (weighted averagecost per hour – standard cost per hour))Alternatively, the calculation can be
made without reference to the relative costof the various labour inputs.
((hours for grade based on total labourhours split in standard proportions –actual labour hours for grade) �standard cost per hour)When the individual grade variances
are summed the same total mix varianceis calculated. The first method isrecommended because the individualgrade variances are meaningful, whereasin the second method they are not.
variance, direct labour rate Indicates theactual cost of any change from the standardlabour rate of remuneration.
((actual hours paid � standard directlabour rate per hour) – (actual hours paid� actual direct labour rate per hour))See Figure 1.28.
MANAGEMENT ACCOUNTING 29
1 Permission to reproduce extracts fromBS 3138: 1992 is granted by BSI. British Standardscan be obtained from BSI Customer Services,389 Chiswich High Road, London W4 4AL.email: cservices@bsi_global.com.
H6827-Ch01 10/14/05 5:32 PM Page 29
variance, direct labour total Indicates thedifference between the standard directlabour cost of the output which has beenproduced and the actual direct labour costincurred.
((standard hours produced � standarddirect labour rate per hour) – (actual hourspaid � actual direct labour rate per hour))
See Figure 1.28.
variance, direct labour yield Subdivisionof the direct labour efficiency variance.Measures the effect on cost of anydifference between the actual usage oflabour and that justified by the outputproduced. It is recommended that thevariance be calculated in total and not forindividual labour grade inputs.
((standard labour hours allowed foractual output – actual labour hoursinput) � standard weighted average costper direct labour hour)It may also be calculated in the following
way:((standard labour hours required forgood output – actual labour hoursworked in standard proportions) �standard cost per labour hour)
variance, direct material mix Subdivision ofthe material usage variance. If differentmaterials can be substituted the mixvariance measures the cost of any variationfrom the standard mix of materials.
((actual quantity of material – quantityof material based on total materialquantity split in standard proportions) �(weighted average cost per kg, litre,other – standard cost per kg, litre, other))Alternatively, the calculation can be
made without reference to the relative costof the various material inputs.
((quantity of material based on totalmaterial quantity split in standardproportions – actual quantity of material)� standard cost per kg, litre, other),When the individual material variances
are summed the same total mix varianceis calculated. The first method isrecommended because the individualmaterial variances are meaningful,whereas in the second method they arenot. See Figure 1.31.
variance, direct material price Differencebetween the actual price paid for purchasedmaterials and their standard cost.
((actual quantity of material purchased� standard price) – actual cost ofmaterial purchased)The material price variance may also be
calculated at the time of materialwithdrawal from stores. In this case, thestock accounts are maintained at actualcost, price variances being extracted at thetime of material usage rather than ofpurchase.
((actual material used � standard cost) –actual cost of material used)The latter method is not usually
recommended because one of theadvantages of a standard costing systemis the valuation of all stock at standardcosts. See Figure 1.28.
variance, direct material totalMeasurement of the difference betweenthe standard material cost of the outputproduced and the actual material costincurred.
(standard material cost of output produced� actual cost of material purchased)Where the quantities of material
purchased and used are different, the totalvariance should be calculated as the sum ofthe usage and price variances.
variance, direct material usage Measuresefficiency in the use of material, bycomparing standard material usage foractual production with actual materialused, the difference is valued at standardcost.
((actual production � standard materialper unit – actual material usage) �standard cost per kg, litre, other)The direct material usage variance may
be divided into mix and yield variances ifseveral materials are mixed in standardproportions. See Figure 1.28.
variance, direct material yield Subdivisionof the material usage variance. Measuresthe effect on cost of any difference betweenthe actual usage of material and thatjustified by the output produced. It isrecommended that the variance be
30 CIMA OFFICIAL TERMINOLOGY
H6827-Ch01 10/14/05 5:32 PM Page 30
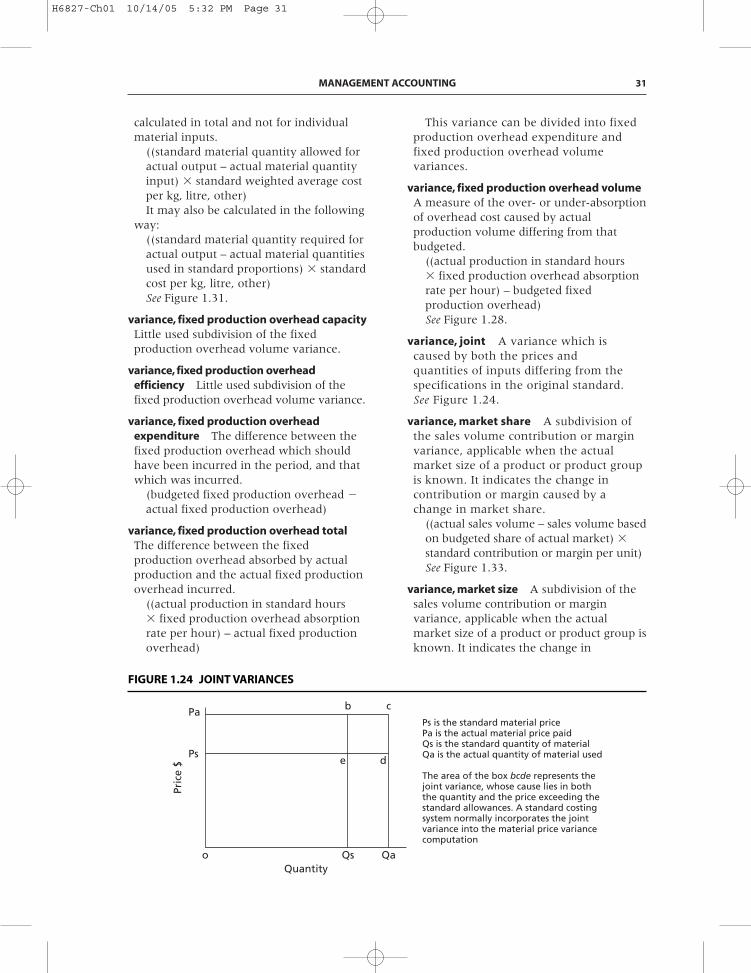
calculated in total and not for individualmaterial inputs.
((standard material quantity allowed foractual output – actual material quantityinput) � standard weighted average costper kg, litre, other)It may also be calculated in the following
way:((standard material quantity required foractual output – actual material quantitiesused in standard proportions) � standardcost per kg, litre, other)See Figure 1.31.
variance, fixed production overhead capacityLittle used subdivision of the fixedproduction overhead volume variance.
variance, fixed production overheadefficiency Little used subdivision of thefixed production overhead volume variance.
variance, fixed production overheadexpenditure The difference between thefixed production overhead which shouldhave been incurred in the period, and thatwhich was incurred.
(budgeted fixed production overhead �actual fixed production overhead)
variance, fixed production overhead totalThe difference between the fixedproduction overhead absorbed by actualproduction and the actual fixed productionoverhead incurred.
((actual production in standard hours� fixed production overhead absorptionrate per hour) – actual fixed productionoverhead)
This variance can be divided into fixedproduction overhead expenditure andfixed production overhead volumevariances.
variance, fixed production overhead volumeA measure of the over- or under-absorptionof overhead cost caused by actualproduction volume differing from thatbudgeted.
((actual production in standard hours� fixed production overhead absorptionrate per hour) – budgeted fixedproduction overhead)See Figure 1.28.
variance, joint A variance which iscaused by both the prices andquantities of inputs differing from thespecifications in the original standard.See Figure 1.24.
variance, market share A subdivision ofthe sales volume contribution or marginvariance, applicable when the actualmarket size of a product or product groupis known. It indicates the change incontribution or margin caused by achange in market share.
((actual sales volume – sales volume basedon budgeted share of actual market) �standard contribution or margin per unit)See Figure 1.33.
variance, market size A subdivision of thesales volume contribution or marginvariance, applicable when the actualmarket size of a product or product group isknown. It indicates the change in
MANAGEMENT ACCOUNTING 31
Pa
Ps
o
e
b c
d
Qs QaQuantity
Ps is the standard material pricePa is the actual material price paidQs is the standard quantity of materialQa is the actual quantity of material used
The area of the box bcde represents thejoint variance, whose cause lies in boththe quantity and the price exceeding thestandard allowances. A standard costingsystem normally incorporates the jointvariance into the material price variancecomputation
Pric
e $
FIGURE 1.24 JOINT VARIANCES
H6827-Ch01 10/14/05 5:32 PM Page 31
contribution or margin caused by a changein the size of the market.
((sales volume based on budgeted share ofactual market – budgeted sales volume) �standard contribution or margin per unit)See Figure 1.33.
variance, marketing cost Where marketingcost contains both fixed and variablecomponents, separate variances should becalculated.
(budgeted marketing cost – actualmarketing cost)
variance, operational Classification ofvariances in which non-standardperformance is defined as being that whichdiffers from an ex post standard.
Operational variances can relate to anyelement of the standard productspecification. See Figure 1.34.
variance, planning Classification of variancescaused by ex ante budget allowances beingchanged to an ex post basis. Also known as arevision variance. See Figure 1.34.
variance, sales mix contribution/profitmargin Subdivision of the sales volumecontribution/profit margin variance. Thechange in the contribution/profit margincaused by a change in the mix of theproducts or services sold.
((actual sales units – sales units based ontotal sales in budget proportions)� (standard contribution/profit marginper unit – budget weighted averagecontribution/profit margin per unit))This method of computation highlights
the contribution/profit margin effect, byproduct, of sales deviating from budgetproportions. A favourable variance denoteseither selling proportionately more of arelatively high contribution/profit marginproduct or proportionately less of a relativelylow contribution/profit margin product.
It can also be calculated as:((actual sales units – sales units based ontotal sales in budget proportions) �standard contribution/profit marginper unit)When summed up for all products this
method gives the same result as the firstmethod. The first method is recommended
because the results for individual productsare meaningful, whereas in the secondmethod they are not. See Figure 1.32.
variance, sales price Change in revenuecaused by the actual selling price differingfrom that budgeted.
(actual sales revenue – (actual salesvolume � standard selling price per unit))See Figure 1.28.
variance, sales quantity contribution/profitSubdivision of the sales volume contribution/profit variance. It is relevant if there aremultiple products and the actual sales mixdiffers from the budgeted sales mix. In thesesituations this variance, together with thesales mix contribution/profit variance, willcomprise the sales volume contribution/profitvariance (for all products). It can becalculated in either of the following ways:
((actual total sales volume – budgetedtotal sales volume) � budgeted weightedaverage contribution/profit per unit)
or
((actual total sales volume in budgetedmix – budgeted sales volume) �budgeted contribution/profit per unit)If the second method is used the sum of
the variances for all products will be the sameas the result obtained using the first formula.
See Figure 1.32.
variance, sales volume contribution/profitMeasure of the effect on contribution/profitof not achieving the budgeted volume ofsales.
((actual sales volume – budgeted salesvolume) � standard contribution/profitper unit) See Figure 1.28.
variance, sales volume revenue Change insales revenue caused by sales volumediffering from that budgeted.
((actual sales volume – budget sales)� standard selling price per unit)This variance is logical but little used
because it cannot be combined withcontribution/profit variances in reconcilingbudget with actual contribution/profit. Inprinciple, if several products are considered,the sales mix revenue variance and total
32 CIMA OFFICIAL TERMINOLOGY
H6827-Ch01 10/14/05 5:32 PM Page 32
sales volume revenue variance can becalculated. See variance, sales mixcontribution and variance, sales quantitycontribution/profit for the method ofderivation – substitute “selling price“ for“contribution“ in the appropriate formula.
variance, total profit Difference between theactual profit and the profit in the budget.
The total profit variance is the sum of allthe subsidiary variances.
(actual profit – budgeted profit)
variance, variable production overheadefficiency Standard variable overheadcost of any change from the standard levelof efficiency.
((actual production in standard hours –actual hours worked) � standardvariable overhead rate per hour)This is directly analogous to the calculation
of direct labour efficiency variance and implicitlyassumes that variable overhead is recoveredon a direct labour hour base. However, theformula can equally be used if variableoverhead is recovered on a machine orprocess hour base. See Figure 1.28.
variance, variable production overheadexpenditure Indicates the actual cost ofany change from the standard rate perhour.
((standard variable rate per hour – actualvariable rate per hour) � actual hoursworked)Hours refer to either labour or machine
hours depending on the recoverybase chosen for variable productionoverhead. See Figure 1.28.
variance, variable production overhead totalMeasures the difference between variableoverhead that should be used for actualoutput and variable production overheadactually used.
((actual production in standard hours� standard variable production overheadabsorption rate per hour) – actual costincurred)The variable production overhead efficiency
and rate variances are subdivisions of thisvariance.
waste Discarded material having no value.
MANAGEMENT ACCOUNTING 33
H6827-Ch01 10/14/05 5:32 PM Page 33

34 CIMA OFFICIAL TERMINOLOGY
fixed productionoverhead
expenditurevariance
variable productionoverhead total
variance
sales mixcontribution
variance
sales quantitycontribution
variance
direct labourtotal variance
direct materialtotal variance
sales pricevariance
direct materialprice variance
direct materialusage variance
direct materialmix variance
direct materialyield variance
variable marketingcost variance
fixed marketingcost variance
fixed administrativecost variance
sales volumecontribution
variance
direct labourrate variance
direct labourefficiency variance
variable productionoverhead expenditure
variance
variable productionoverhead efficiency
variance
VARIABLECOST
VARIANCES
SALESVARIANCES
FIXEDCOST
VARIANCES
T
O
T
A
L
P
R
O
F
I
T
V
A
R
I
A
N
C
E
FIGURE 1.25 CHART OF VARIANCES (MARGINAL COSTING PRINCIPLES)
H6827-Ch01 10/14/05 5:32 PM Page 34
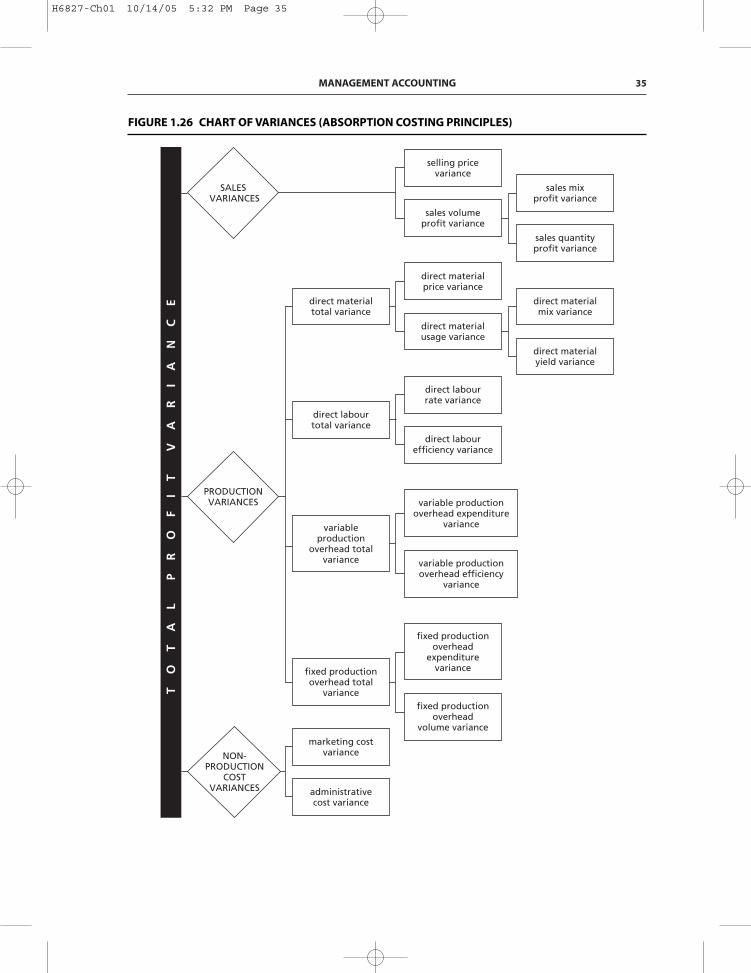
MANAGEMENT ACCOUNTING 35
direct labourefficiency variance
direct labourrate variance
direct materialusage variance
direct materialprice variance
sales volumeprofit variance
selling pricevariance
direct materialyield variance
direct materialmix variance
sales quantityprofit variance
sales mixprofit variance
SALES VARIANCES
direct materialtotal variance
direct labourtotal variance
fixed productionoverhead total
variance
variableproduction
overhead totalvariance
fixed productionoverhead
volume variance
fixed productionoverhead
expenditurevariance
marketing costvariance
administrativecost variance
variable productionoverhead expenditure
variance
variable productionoverhead efficiency
variance
NON-PRODUCTION
COSTVARIANCES
PRODUCTIONVARIANCES
T
O
T
A
L
P
R
O
F
I
T
V
A
R
I
A
N
C
E
FIGURE 1.26 CHART OF VARIANCES (ABSORPTION COSTING PRINCIPLES)
H6827-Ch01 10/14/05 5:32 PM Page 35
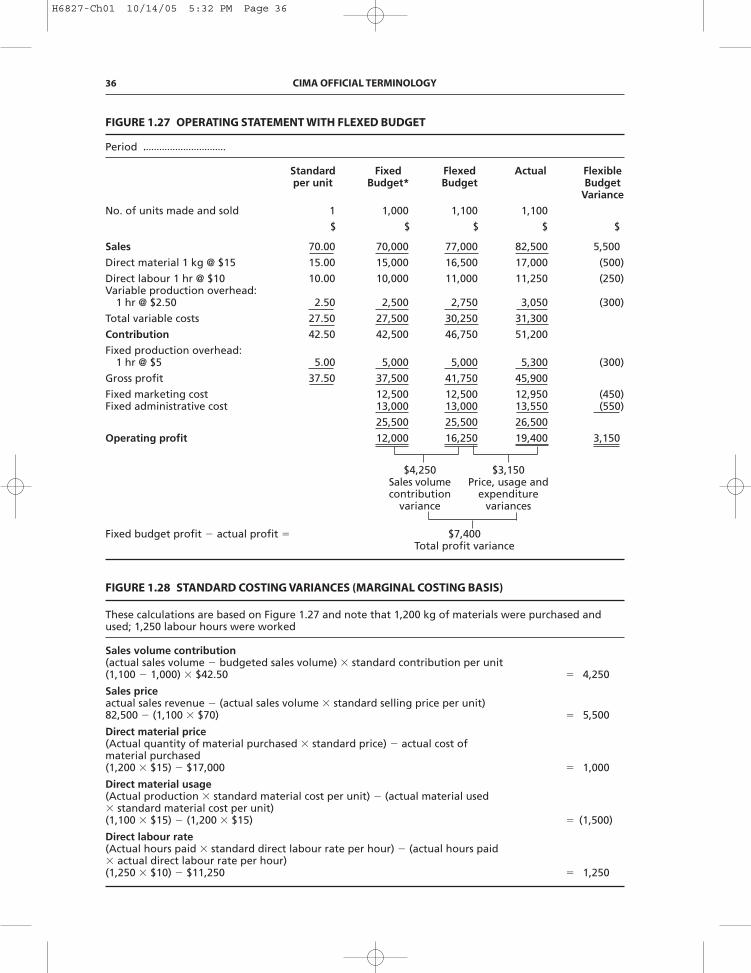
36 CIMA OFFICIAL TERMINOLOGY
Period
Standard Fixed Flexed Actual Flexibleper unit Budget* Budget Budget
Variance
No. of units made and sold 1 1,000 1,100 1,100
$ $ $ $ $
Sales 70.00 70,000 77,000 82,500 5,500
Direct material 1 kg @ $15 15.00 15,000 16,500 17,000 (500)
Direct labour 1 hr @ $10 10.00 10,000 11,000 11,250 (250)Variable production overhead:
1 hr @ $2.50 2.50 2,500 2,750 3,050 (300)
Total variable costs 27.50 27,500 30,250 31,300
Contribution 42.50 42,500 46,750 51,200
Fixed production overhead:1 hr @ $5 5.00 5,000 5,000 5,300 (300)
Gross profit 37.50 37,500 41,750 45,900
Fixed marketing cost 12,500 12,500 12,950 (450)Fixed administrative cost 13,000 13,000 13,550 (550)
25,500 25,500 26,500
Operating profit 12,000 16,250 19,400 3,150
$4,250 $3,150Sales volume Price, usage andcontribution expenditure
variance variances
Fixed budget profit � actual profit � $7,400Total profit variance
FIGURE 1.27 OPERATING STATEMENT WITH FLEXED BUDGET
FIGURE 1.28 STANDARD COSTING VARIANCES (MARGINAL COSTING BASIS)
These calculations are based on Figure 1.27 and note that 1,200 kg of materials were purchased andused; 1,250 labour hours were worked
Sales volume contribution(actual sales volume � budgeted sales volume) � standard contribution per unit (1,100 � 1,000) � $42.50 � 4,250
Sales priceactual sales revenue � (actual sales volume � standard selling price per unit) 82,500 � (1,100 � $70) � 5,500
Direct material price(Actual quantity of material purchased � standard price) � actual cost of material purchased(1,200 � $15) � $17,000 � 1,000
Direct material usage(Actual production � standard material cost per unit) � (actual material used� standard material cost per unit)(1,100 � $15) � (1,200 � $15) � (1,500)
Direct labour rate(Actual hours paid � standard direct labour rate per hour) � (actual hours paid� actual direct labour rate per hour)(1,250 � $10) � $11,250 � 1,250
H6827-Ch01 10/14/05 5:32 PM Page 36
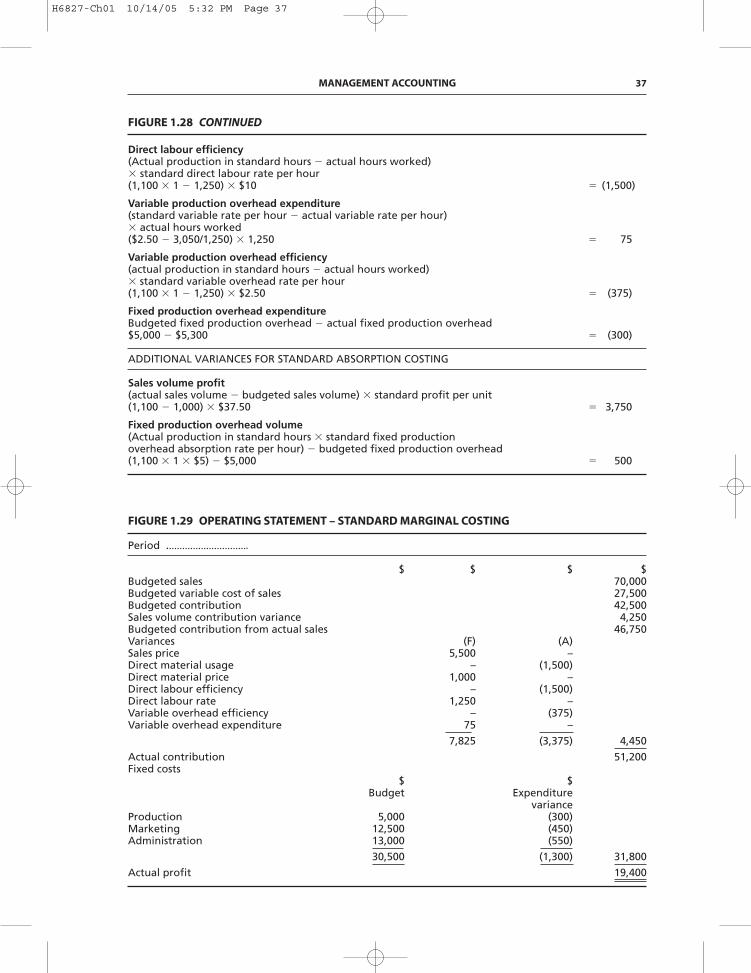
MANAGEMENT ACCOUNTING 37
FIGURE 1.28 CONTINUED
Direct labour efficiency(Actual production in standard hours � actual hours worked)� standard direct labour rate per hour(1,100 � 1 � 1,250) � $10 � (1,500)
Variable production overhead expenditure(standard variable rate per hour � actual variable rate per hour)� actual hours worked($2.50 � 3,050/1,250) � 1,250 � 75
Variable production overhead efficiency(actual production in standard hours � actual hours worked)� standard variable overhead rate per hour(1,100 � 1 � 1,250) � $2.50 � (375)
Fixed production overhead expenditureBudgeted fixed production overhead � actual fixed production overhead$5,000 � $5,300 � (300)
ADDITIONAL VARIANCES FOR STANDARD ABSORPTION COSTING
Sales volume profit(actual sales volume � budgeted sales volume) � standard profit per unit (1,100 � 1,000) � $37.50 � 3,750
Fixed production overhead volume(Actual production in standard hours � standard fixed production overhead absorption rate per hour) � budgeted fixed production overhead (1,100 � 1 � $5) � $5,000 � 500
Period
$ $ $ $Budgeted sales 70,000Budgeted variable cost of sales 27,500Budgeted contribution 42,500Sales volume contribution variance 4,250Budgeted contribution from actual sales 46,750Variances (F) (A)Sales price 5,500 –Direct material usage – (1,500)Direct material price 1,000 –Direct labour efficiency – (1,500)Direct labour rate 1,250 –Variable overhead efficiency – (375)Variable overhead expenditure 75 –
7,825 (3,375) 4,450
Actual contribution 51,200Fixed costs
$ $Budget Expenditure
varianceProduction 5,000 (300)Marketing 12,500 (450)Administration 13,000 (550)
30,500 (1,300) 31,800
Actual profit 19,400
FIGURE 1.29 OPERATING STATEMENT – STANDARD MARGINAL COSTING
H6827-Ch01 10/14/05 5:32 PM Page 37
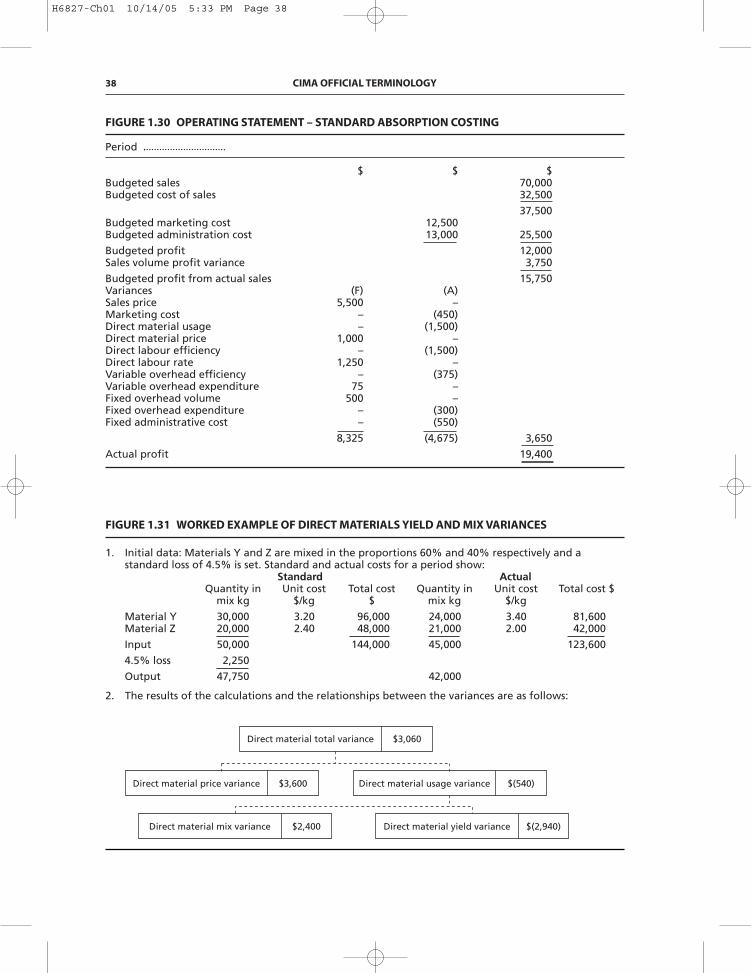
38 CIMA OFFICIAL TERMINOLOGY
Period
$ $ $Budgeted sales 70,000Budgeted cost of sales 32,500
37,500Budgeted marketing cost 12,500Budgeted administration cost 13,000 25,500
Budgeted profit 12,000Sales volume profit variance 3,750
Budgeted profit from actual sales 15,750Variances (F) (A)Sales price 5,500 –Marketing cost – (450)Direct material usage – (1,500)Direct material price 1,000 –Direct labour efficiency – (1,500)Direct labour rate 1,250 –Variable overhead efficiency – (375)Variable overhead expenditure 75 –Fixed overhead volume 500 –Fixed overhead expenditure – (300)Fixed administrative cost – (550)
8,325 (4,675) 3,650
Actual profit 19,400
FIGURE 1.30 OPERATING STATEMENT – STANDARD ABSORPTION COSTING
1. Initial data: Materials Y and Z are mixed in the proportions 60% and 40% respectively and astandard loss of 4.5% is set. Standard and actual costs for a period show:
Standard ActualQuantity in Unit cost Total cost Quantity in Unit cost Total cost $
mix kg $/kg $ mix kg $/kg
Material Y 30,000 3.20 96,000 24,000 3.40 81,600Material Z 20,000 2.40 48,000 21,000 2.00 42,000
Input 50,000 144,000 45,000 123,600
4.5% loss 2,250
Output 47,750 42,000
2. The results of the calculations and the relationships between the variances are as follows:
FIGURE 1.31 WORKED EXAMPLE OF DIRECT MATERIALS YIELD AND MIX VARIANCES
Direct material total variance $3,060
Direct material price variance $3,600 Direct material usage variance $(540)
Direct material mix variance $2,400 Direct material yield variance $(2,940)
H6827-Ch01 10/14/05 5:33 PM Page 38
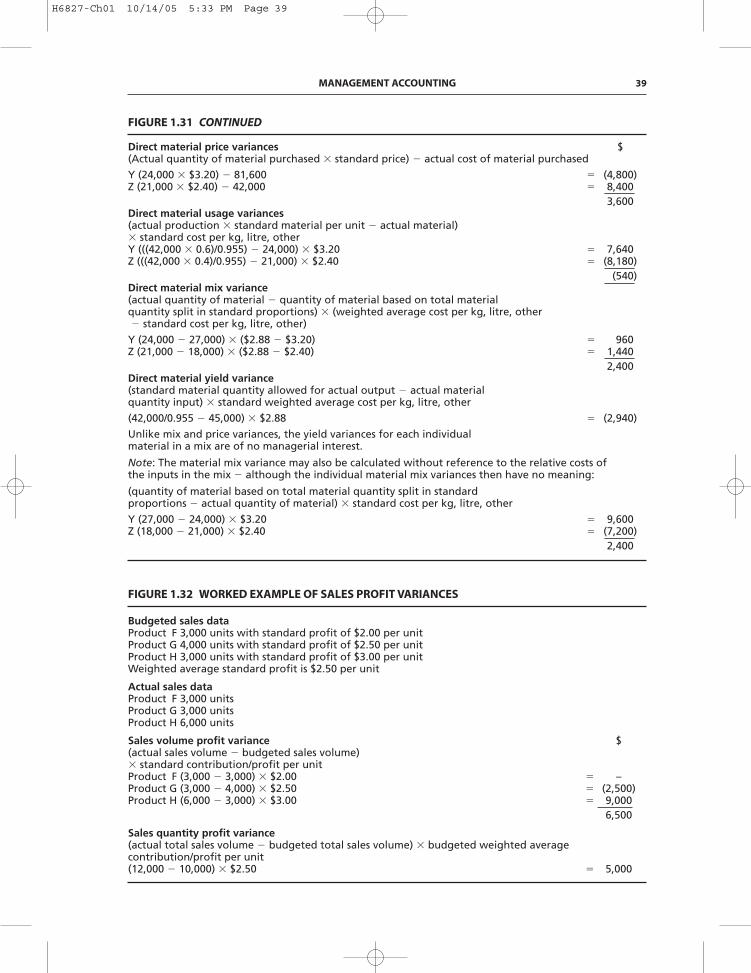
MANAGEMENT ACCOUNTING 39
Direct material price variances $(Actual quantity of material purchased � standard price) � actual cost of material purchased
Y (24,000 � $3.20) � 81,600 � (4,800)Z (21,000 � $2.40) � 42,000 � 8,400
3,600Direct material usage variances(actual production � standard material per unit � actual material)� standard cost per kg, litre, otherY (((42,000 � 0.6)/0.955) � 24,000) � $3.20 � 7,640Z (((42,000 � 0.4)/0.955) � 21,000) � $2.40 � (8,180)
(540)Direct material mix variance(actual quantity of material � quantity of material based on total material quantity split in standard proportions) � (weighted average cost per kg, litre, other� standard cost per kg, litre, other)
Y (24,000 � 27,000) � ($2.88 � $3.20) � 960Z (21,000 � 18,000) � ($2.88 � $2.40) � 1,440
2,400Direct material yield variance(standard material quantity allowed for actual output � actual material quantity input) � standard weighted average cost per kg, litre, other
(42,000/0.955 � 45,000) � $2.88 � (2,940)
Unlike mix and price variances, the yield variances for each individual material in a mix are of no managerial interest.
Note: The material mix variance may also be calculated without reference to the relative costs of the inputs in the mix � although the individual material mix variances then have no meaning:
(quantity of material based on total material quantity split in standard proportions � actual quantity of material) � standard cost per kg, litre, other
Y (27,000 � 24,000) � $3.20 � 9,600Z (18,000 � 21,000) � $2.40 � (7,200)
2,400
FIGURE 1.31 CONTINUED
Budgeted sales dataProduct F 3,000 units with standard profit of $2.00 per unitProduct G 4,000 units with standard profit of $2.50 per unitProduct H 3,000 units with standard profit of $3.00 per unitWeighted average standard profit is $2.50 per unit
Actual sales dataProduct F 3,000 unitsProduct G 3,000 unitsProduct H 6,000 units
Sales volume profit variance $(actual sales volume � budgeted sales volume)� standard contribution/profit per unitProduct F (3,000 � 3,000) � $2.00 � –Product G (3,000 � 4,000) � $2.50 � (2,500)Product H (6,000 � 3,000) � $3.00 � 9,000
6,500
Sales quantity profit variance(actual total sales volume � budgeted total sales volume) � budgeted weighted average contribution/profit per unit(12,000 � 10,000) � $2.50 � 5,000
FIGURE 1.32 WORKED EXAMPLE OF SALES PROFIT VARIANCES
H6827-Ch01 10/14/05 5:33 PM Page 39
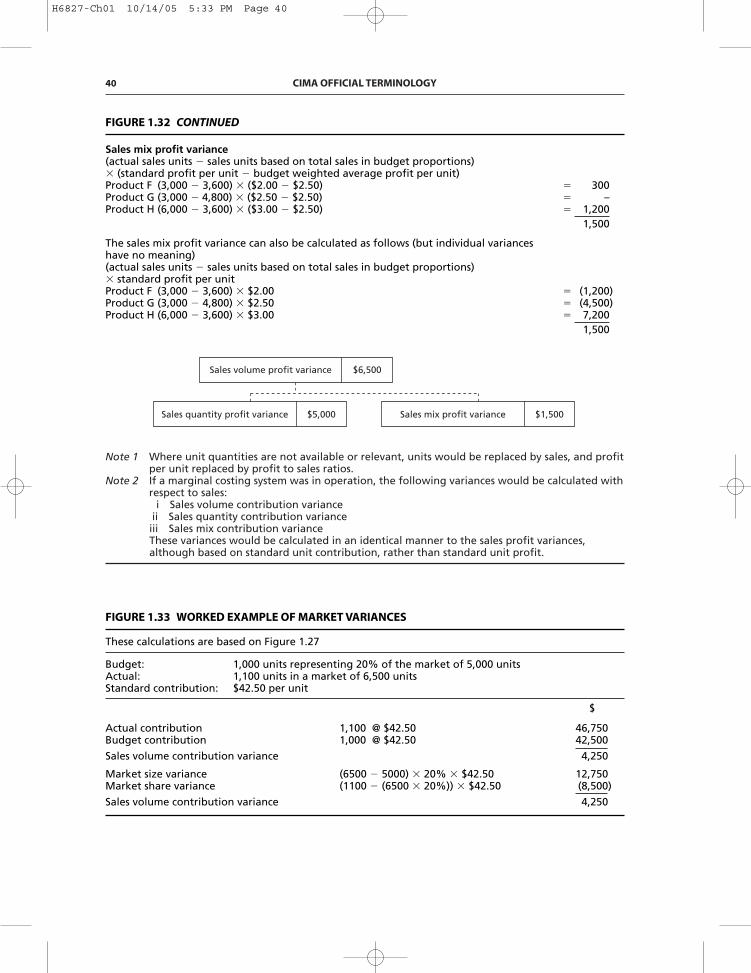
40 CIMA OFFICIAL TERMINOLOGY
Note 1 Where unit quantities are not available or relevant, units would be replaced by sales, and profitper unit replaced by profit to sales ratios.
Note 2 If a marginal costing system was in operation, the following variances would be calculated withrespect to sales:
i Sales volume contribution varianceii Sales quantity contribution varianceiii Sales mix contribution varianceThese variances would be calculated in an identical manner to the sales profit variances,although based on standard unit contribution, rather than standard unit profit.
Sales volume profit variance $6,500
Sales quantity profit variance $5,000 Sales mix profit variance $1,500
These calculations are based on Figure 1.27
Budget: 1,000 units representing 20% of the market of 5,000 unitsActual: 1,100 units in a market of 6,500 unitsStandard contribution: $42.50 per unit
$
Actual contribution 1,100 @ $42.50 46,750Budget contribution 1,000 @ $42.50 42,500
Sales volume contribution variance 4,250
Market size variance (6500 � 5000) � 20% � $42.50 12,750Market share variance (1100 � (6500 � 20%)) � $42.50 (8,500)
Sales volume contribution variance 4,250
FIGURE 1.33 WORKED EXAMPLE OF MARKET VARIANCES
Sales mix profit variance(actual sales units � sales units based on total sales in budget proportions)� (standard profit per unit � budget weighted average profit per unit)Product F (3,000 � 3,600) � ($2.00 � $2.50) � 300Product G (3,000 � 4,800) � ($2.50 � $2.50) � –Product H (6,000 � 3,600) � ($3.00 � $2.50) � 1,200
1,500
The sales mix profit variance can also be calculated as follows (but individual variances have no meaning)(actual sales units � sales units based on total sales in budget proportions)� standard profit per unitProduct F (3,000 � 3,600) � $2.00 � (1,200)Product G (3,000 � 4,800) � $2.50 � (4,500)Product H (6,000 � 3,600) � $3.00 � 7,200
1,500
FIGURE 1.32 CONTINUED
H6827-Ch01 10/14/05 5:33 PM Page 40
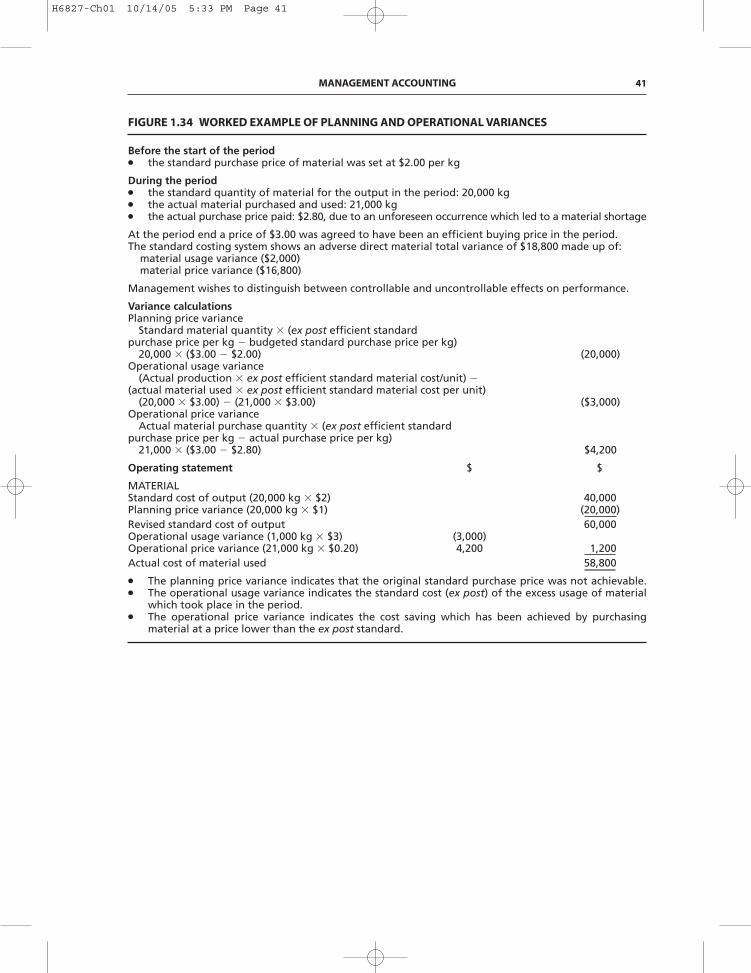
MANAGEMENT ACCOUNTING 41
Before the start of the period● the standard purchase price of material was set at $2.00 per kg
During the period● the standard quantity of material for the output in the period: 20,000 kg● the actual material purchased and used: 21,000 kg● the actual purchase price paid: $2.80, due to an unforeseen occurrence which led to a material shortage
At the period end a price of $3.00 was agreed to have been an efficient buying price in the period.The standard costing system shows an adverse direct material total variance of $18,800 made up of:
material usage variance ($2,000)material price variance ($16,800)
Management wishes to distinguish between controllable and uncontrollable effects on performance.
Variance calculationsPlanning price variance
Standard material quantity � (ex post efficient standard purchase price per kg � budgeted standard purchase price per kg)
20,000 � ($3.00 � $2.00) (20,000)Operational usage variance
(Actual production � ex post efficient standard material cost/unit) �(actual material used � ex post efficient standard material cost per unit)
(20,000 � $3.00) � (21,000 � $3.00) ($3,000)Operational price variance
Actual material purchase quantity � (ex post efficient standard purchase price per kg � actual purchase price per kg)
21,000 � ($3.00 � $2.80) $4,200
Operating statement $ $
MATERIALStandard cost of output (20,000 kg � $2) 40,000Planning price variance (20,000 kg � $1) (20,000)Revised standard cost of output 60,000Operational usage variance (1,000 kg � $3) (3,000)Operational price variance (21,000 kg � $0.20) 4,200 1,200Actual cost of material used 58,800
● The planning price variance indicates that the original standard purchase price was not achievable.● The operational usage variance indicates the standard cost (ex post) of the excess usage of material
which took place in the period.● The operational price variance indicates the cost saving which has been achieved by purchasing
material at a price lower than the ex post standard.
FIGURE 1.34 WORKED EXAMPLE OF PLANNING AND OPERATIONAL VARIANCES
H6827-Ch01 10/14/05 5:33 PM Page 41
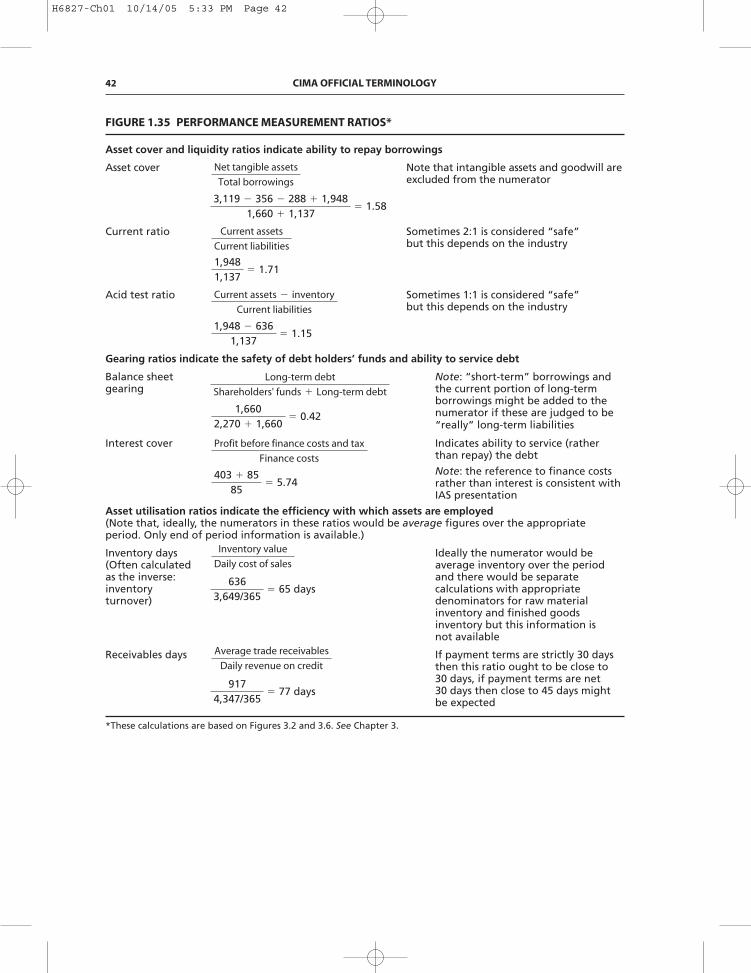
42 CIMA OFFICIAL TERMINOLOGY
Asset cover and liquidity ratios indicate ability to repay borrowings
Asset cover Note that intangible assets and goodwill are excluded from the numerator
Current ratio Sometimes 2:1 is considered “safe” but this depends on the industry
Acid test ratio Sometimes 1:1 is considered “safe” but this depends on the industry
Gearing ratios indicate the safety of debt holders’ funds and ability to service debt
Balance sheet Note: “short-term” borrowings and gearing the current portion of long-term
borrowings might be added to the numerator if these are judged to be “really” long-term liabilities
Interest cover Indicates ability to service (rather than repay) the debt
Note: the reference to finance costsrather than interest is consistent withIAS presentation
Asset utilisation ratios indicate the efficiency with which assets are employed(Note that, ideally, the numerators in these ratios would be average figures over the appropriateperiod. Only end of period information is available.)
Inventory days Ideally the numerator would be (Often calculated average inventory over the period as the inverse: and there would be separate inventory calculations with appropriate turnover) denominators for raw material
inventory and finished goods inventory but this information is not available
Receivables days If payment terms are strictly 30 daysthen this ratio ought to be close to 30 days, if payment terms are net 30 days then close to 45 days might be expected
*These calculations are based on Figures 3.2 and 3.6. See Chapter 3.
1,948 � 6361,137
� 1.15
1,9481,137
� 1.71
3,119 � 356 � 288 � 1,9481,660 � 1,137
� 1.58
9174,347/365
� 77 days
1,6602,270 � 1,660
� 0.42
Net tangible assets
Total borrowings
Current assets
Current liabilities
Current assets � inventory
Current liabilities
Long-term debt
Shareholders' funds � Long-term debt
Profit before finance costs and tax
Finance costs
Inventory value
Daily cost of sales
Average trade receivables
Daily revenue on credit
6363,649/365
� 65 days
403 � 8585
� 5.74
FIGURE 1.35 PERFORMANCE MEASUREMENT RATIOS*
H6827-Ch01 10/14/05 5:33 PM Page 42
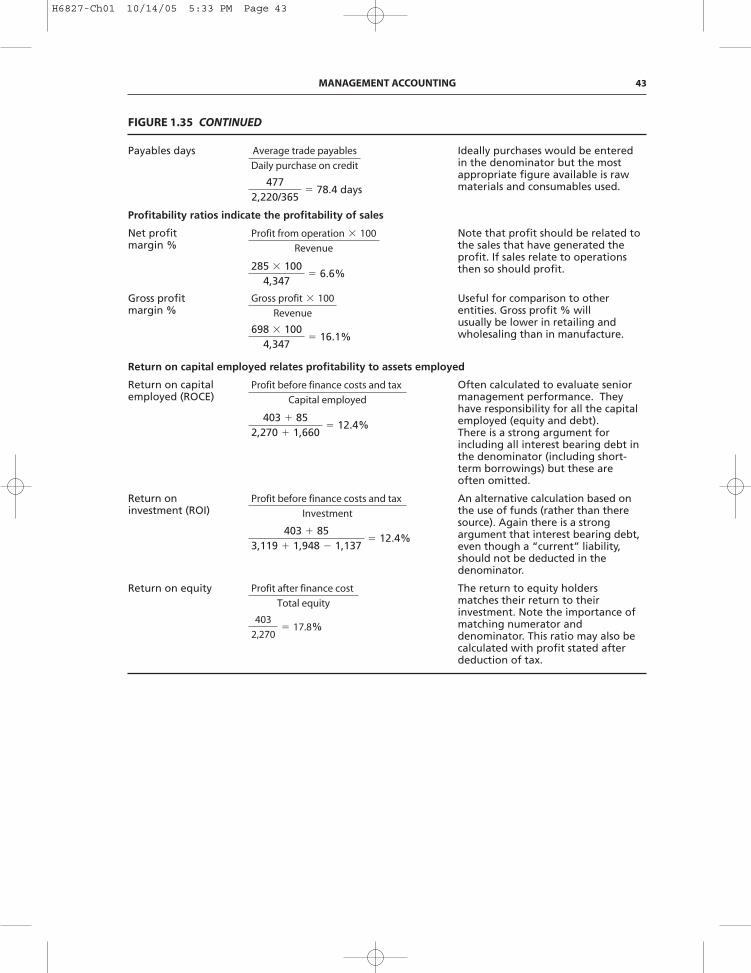
MANAGEMENT ACCOUNTING 43
Payables days Ideally purchases would be entered in the denominator but the most appropriate figure available is raw materials and consumables used.
Profitability ratios indicate the profitability of sales
Net profit Note that profit should be related to margin % the sales that have generated the
profit. If sales relate to operations then so should profit.
Gross profit Useful for comparison to other margin % entities. Gross profit % will
usually be lower in retailing and wholesaling than in manufacture.
Return on capital employed relates profitability to assets employed
Return on capital Often calculated to evaluate senior employed (ROCE) management performance. They
have responsibility for all the capital employed (equity and debt).There is a strong argument for including all interest bearing debt in the denominator (including short-term borrowings) but these are often omitted.
Return on An alternative calculation based on investment (ROI) the use of funds (rather than there
source). Again there is a strong argument that interest bearing debt, even though a “current” liability, should not be deducted in the denominator.
Return on equity The return to equity holders matches their return to their investment. Note the importance of matching numerator and denominator. This ratio may also be calculated with profit stated after deduction of tax.
4772,220/365
� 78.4 days
FIGURE 1.35 CONTINUED
285 � 1004,347
� 6.6%
698 � 1004,347
� 16.1%
403 � 852,270 � 1,660
� 12.4%
403 � 853,119 � 1,948 � 1,137
� 12.4%
403
2,270� 17.8%
Average trade payables
Daily purchase on credit
Profit from operation � 100
Revenue
Profit before finance costs and tax
Capital employed
Profit before finance costs and tax
Investment
Profit after finance cost
Total equity
Gross profit � 100
Revenue
H6827-Ch01 10/14/05 5:33 PM Page 43
H6827-Ch01 10/14/05 5:33 PM Page 44