Embed Size (px)
Citation preview

Malta:Update of Stability Programme2015 - 2018
Ministry for Finance April 2015
The following symbols have been used throughout this document:
. . . to indicate that data are not available;
___ to indicate that the fi gure is negligible;
0 to indicate that the fi gure is zero;
- to indicate that data are not applicable or cannot be determined;
n/c to indicate that there is no change in the data.
f to indicate that it is a forecast
Figures may not add up due to rounding.
iMalta: Update of Stability Programme 2015 - 2018
Contents
Introduction 1 1. Overall Policy Framework and Objectives 5 1.1 Economic Situation 51.2 Fiscal Stance 5 1.3 Risks to the Outlook 51.4 Structural Reforms 6 2. Economic Outlook 92.1 Economic Conditions in 2014 92.2 The Medium-Term Scenario 10 2.2.1 Assumptions for Projections 10 2.2.2 Risks to Outlook 12 2.2.3 Private Final Consumption Expenditure 12 2.2.4 General Government Final Consumption Expenditure 12 2.2.5 Gross Fixed Capital Formation 12 2.2.6 External Balance of Goods and Services 13 2.2.7 Productivity and Employment Prospects 13 2.2.8 Infl ation 14 2.2.9 Comparison to Commission’s Winter Forecast 142.3 Potential Output and the Output Gap 152.4 Potential Growth and Structural Reforms 16 3. Fiscal Outlook and the Medium-Term Fiscal Strategy 193.1 Correction of the Excessive Defi cit 193.2 Fiscal Developments in 2014 20 3.2.1 General Government Revenue in 2014 20 3.2.2 General Government Expenditure in 2014 203.3 Consolidating Budgetary Targets in 2015 21 3.3.1 General Government Revenue in 2015 21 3.3.2 General Government Expenditure in 2015 24 3.3.3 Consolidation Measures in 2015 25 3.4 Medium-Term Fiscal Strategy 25 3.4.1 Defi cit Targets, Fiscal Rules and the Medium-Term Budgetary Objective 26 3.4.2 Revenue Forecasts 27 3.4.3 Expenditure Targets 283.5 Debt levels and developments 29 3.5.1 Projected Debt developments 30 3.5.2 Comparison with the April 2014 Update of the Stability Programme 31

ii Malta: Update of Stability Programme 2015 - 2018
4. Sensitivity Analysis 354.1 The Accuracy of Past Forecasting Performance 354.2 The Balance of Risk 35 4.2.1 Model-Based Scenario 35 4.2.2 Exchange Rate Depreciation Scenario 35 4.2.3 Exchange Rate Undershooting Scenario 36 4.2.4 Improved Euro Area Outlook Scenario 36 4.2.5 Failed Recovery in the Euro Area Scenario 36 4.2.6 Weaker Tourism Growth Scenario 36 4.2.7 Stronger Manufacturing Scenario 37 4.2.8 Weak Manufacturing Scenario 37 4.2.9 Low Energy Prices in the Commercial Sector Scenario 37 4.2.10 Quantitative Easing Scenario 37 4.2.11 Loss in Market Share in Services Scenario 37 4.2.12 Stronger Medium-Term Private Investment Scenario 384.3 Uncertainty and the Balance of Risk Underlying the Macroeconomic Projections 384.4 Risk to Fiscal Targets 39 5. Sustainability of Public Finances 435.1 Long-term Budgetary Projection Results for Malta 43 5.1.1 New Demographic Projections 43 5.1.2 Assumptions Applied 44 5.1.3 Demographic Developments 45 5.1.4 Age-Related Public Expenditure 465.2 Focus on Pension Reforms 48
6. Quality of Public Finances 536.1 Improving the Quality of Public Expenditure 55 6.1.1 Enhancing the Effi ciency and Effi cacy of Expenditure 55 6.1.2 A Better Composition of Public Expenditure 576.2 Improving the Structure and Effi ciency of Revenue Streams 58 6.2.1 Shifting the Tax Burden away from Labour 58 6.2.2 Widening Tax Bases 58 6.2.3 Simplifi cation of Taxation System 59 6.2.4 Fighting Tax Evasion and Avoidance 59
7. Institutional Features of Public Finances 637.1 A Revised National Budgetary Timeline 64
iiiMalta: Update of Stability Programme 2015 - 2018
Statistical Appendix Table 1a Macroeconomic Prospects 67Table 1b Price Developments 68Table 1c Labour Market Developments 69Table 1d Sectoral Balances 70Table 2a General Government Budgetary Prospects 71Table 2b No policy change projections 72Table 2c Amounts to be excluded from the expenditure benchmark 73Table 3 General Government Expenditure by Function 74Table 4 General Government Debt Developments 75Table 5 Cyclical Developments 76Table 6 Divergence from the April 2014 Stability Programme 77Table 7 Long-term Sustainability of Public Finances 78Table 7a Contigent liabilities 79Table 8 Basic Assumptions 80

1Malta: Update of Stability Programme 2015- 2018
IntroductionThis Programme constitutes the seventh update of Malta’s Stability Programme, which was submitted in 2007. The fi rst Update was submitted in December 2008. This Programme has been prepared in accordance with Council Regulation (EC) No. 1466/97 as amended by Council Regulation (EC) No. 1055/05 and Council Regulation (EC) No 1467/97 as amended by Council Regulation (EC) No. 1056/05.
This document is also in line with the new requirements of the Stability and Growth Pact, namely the amendments to Council Regulation (EC) No. 1466/97 by Council Regulation (EU) No 1175/2011 of the European Parliament and of the Council of 16th November 2011 and the amendments to Council Regulation (EC) No 1467/97 by Council Regulation (EU) No 1177/2011 of 8th November 2011. The programme also takes into account Council Directive 2011/85/EU of 8th November 2011 on the requirements for budgetary frameworks of the Member States.
The document is in line with the Specifi cations on the implementation of the Stability and Growth Pact and Guidelines on the format and content of Stability and Convergence Programmes, endorsed by the ECOFIN Council on 24th January 2012.
The Ministry for Finance compiled this document, with an important contribution from the National Statistics Offi ce as well as from other Ministries and entities across Government. It was prepared on the basis of policies proposed in the 2014 Budget and updated with the latest macroeconomic projections.
The Programme includes seven sections: Chapter 1 presents Government’s objectives for economic policy; Chapter 2 presents the main macroeconomic projections for the medium-term as well as the potential impact of a selection of structural reform measures; Chapter 3 outlines the overall fi scal policy strategy and updated budgetary plans for the current year, followed by a presentation of the medium-term fi scal projections and debt developments as well as the budgetary implications of major structural reforms featuring in the National Reform Programme; Chapter 4 contains an analysis of forecast uncertainty and the balance of risk surrounding macroeconomic projections and an evaluation of the risks to the achievement of fi scal targets conditional on alternative plausible macroeconomic conditions; Chapter 5 reviews the long-term sustainability of public fi nances; Chapter 6 analyses the quality of public fi nances, and fi nally Chapter 7 reviews the institutional features of public fi nances particularly the recent enactment of the Fiscal Responsibility Act.
The macroeconomic forecasts underlying this Programme have been submitted to the Fiscal Advisory Council for its endorsement. The Council concluded that “the headline GDP fi gures (both in nominal and real terms) as forecasted by the MFIN may indeed be achievable for the forecast years under consideration”. The fi scal projections underlying this Programme have also been submitted to the Council for its evaluation and endorsement in line with the requirements of the Fiscal Responsibility Act. This exercise is expected to be concluded in the coming days.


1. Overall Policy Framework and Objectives


5Malta: Update of Stability Programme 2015- 2018
1. Overall Policy Framework and ObjectivesMalta has for the second consecutive year managed to attain its fi scal targets. This success was underpinned by strong increases in all revenue streams refl ecting the sustained and robust performance of the Maltese economy. This was made possible through the structural reforms being undertaken.
1.1 Economic SituationBy 2014, potential output growth reached 2.8 per cent and is expected to peak at around 3.3 per cent in the short-term, mainly underpinned by strong improvements in investment, continued positive developments in the labour market, largely through a higher participation rate, and to a lesser extent improvements in the total factor productivity. Potential growth is expected to converge to 2.8 per cent in 2018. These growth rates in potential output will result in a marginally positive output gap in the short-term while a slightly negative output gap is projected in the later years of the forecasts.
Infl ationary pressures are expected to be subdued and unemployment is expected to remain stable, at low levels, underpinned by a good performance in the labour market. The economy is expected to continue to register a surplus in its external goods and services account. In other words, the macroeconomic scenario envisaged in this Programme is one of a strong and stable economy.
1.2 Fiscal StanceGovernment remains convinced that a prudent pace of fi scal consolidation is the best policy in order to successfully attain the Medium-Term Budgetary Objectives (MTO).
The medium-term fi scal strategy is consistent the newly enacted Fiscal Responsibility Act and also the calendar of convergence established by the Commission for Malta. After having reduced the defi cit below the 3 per cent mark in 2013 and reached the target of 2.1 per cent of GDP in 2014, this Programme targets a further reduction in the defi cit to 1.6 per cent of GDP in 2015. The debt-to GDP ratio has declined to 68.0 per cent of GDP in 2014. An improvement in the primary surplus projected over the medium-term, together with positive growth prospects, sustained investor confi dence and an effi cient and eff ective debt management strategy should ensure further improvements in the underlying debt dynamics. In this respect, the debt-to-GDP ratio is expected to exhibit a downward trajectory and to approach the 60 per cent target by the end of this Programme period.
1.3 Risks to the OutlookIn the context of the size and openness of the Maltese economy, the growth and fi scal outlook underlying this Programme can be subject to a number of risk factors. This programme suggests that in the short-term, the balance of risk is tilted to the upside while downward risks are more present in the medium-term. Uncertainty rises with time in line with the past forecasting performance. However, even under the most severe scenarios contemplated in this Programme, the budget defi cit should remain close to
6 Malta: Update of Stability Programme 2015 - 2018
2 per cent of GDP throughout the forecast horizon.
1.4 Structural ReformsThe envisaged fi scal consolidation will be primarily supported by stronger and more sustainable growth. Government spending reviews will continue so as to ensure the achievement of improved effi ciency in public spending, reduction of waste and value for money. In turn, this will ensure greater fi nancial discipline and fi scal accountability in the public sector. Moreover, Government is also consolidating the various functions of Government revenue through the merger of the main revenue departments, which will support its eff orts towards increased effi ciency in revenue collection. The fi scal reforms introduced in 2014 are expected to strengthen the institutional framework supporting the achievement of the ambitious fi scal targets contained in this Programme.
The fi scal targets to be presented in this Programme are supported by a range of structural economic policies as presented in this year’s National Reform Programme. Government’s economic and fi scal strategy rests on a number of policy objectives, primarily meant to address the country’s main economic challenges, in particular:
1. Ensuring public fi nance sustainability in the short to medium-term, while also addressing the long-term dimension;
2. Raising potential output, in particular through the increasing of the labour force participation, especially of women, raising skill and education levels, promoting lifelong learning, and increasing productive capital investment;
3. Enhancing the competitiveness and transparency of the products and services markets whilst strengthening consumer protection, including a holistic justice reform;
4. Eff ectively reducing bureaucracy especially the length of the public procurement process, and ensuring that the public service is effi cient and cost eff ective;
5. Safeguarding the successes achieved by the Maltese fi nancial sector by reducing macroeconomic imbalances related to the fi nancial sector and ensuring it continues to follow rigorous practices; and
6. Prioritising the promotion of a diversifi ed and balanced economy.
In order to continue fulfi lling these policy objectives, the Government, as outlined in the Economic Partnership Programme, is implementing a number of supply-side policies which are aimed at raising the country’s potential growth whilst also ensuring responsible environmental management and social cohesion.
Government believes that sound economic policies which address Malta’s growth potential and competitiveness can also strengthen the sustainability of public fi nances. The reforms in the energy sector are to contribute to the attainment of both the economic and the fi scal objectives thanks to the reducing Government exposures. This will further bolster public fi nance sustainability and investor confi dence in Malta.

2. Economic Outlook

9Malta: Update of Stability Programme 2015 - 2018
2. Economic Outlook
2.1 Economic Conditions in 2014During 2014, the global economy continued to expand albeit at a moderate and uneven pace. According to the IMF’s most recent Economic Outlook, global growth in 2014 grew modestly refl ecting a pickup in growth in advanced economies and a slowdown in emerging market and developing economies. In the Euro Area (EA), activity was weaker than expected in the fi rst half of 2014 but recovered in the fourth quarter and in early part of 2015, supported mainly by lower oil prices and higher net exports. Despite signifi cant downside risks, the outlook for the European economy is that of moderate growth and subdued infl ation. Indeed, the latest forecasts issued by the European Commission are expecting that in 2015, GDP will, for the fi rst time since the fi nancial crisis of 2008, grow in every country in the European Union (EU) in 2015. Activity is expected to be supported by lower oil prices, further monetary policy easing and the recent euro depreciation.
The Maltese economy continued to be amongst the top performers in the European economy. Latest data released by the National Statistics Offi ce (NSO), show that the economy expanded by 3.5 per cent in real terms during 2014, driven by strong domestic demand defi ned as private and public consumption and gross fi xed capital formation. Growth in the domestic sector was in turn underpinned by dynamic investment which expanded by 14.0 per cent, making this component the largest contributor to economic growth. Public and private consumption also contributed positively as they increased by 7.3 per cent and 3.4 per cent, respectively. On the other hand, the external side acted as a drag on real economic growth, contributing negatively by 0.5 percentage points as real exports declined while real imports registered a marginal increase. Nominal exports remained higher than nominal imports thereby contributing to a positive balance on the external side equivalent to 6.0 per cent of GDP.
From the output side, Gross Value Added at basic prices increased by 4.4 per cent in 2014. Growth was underpinned by a positive performance in the majority of sectors in particular in the services sector. The services sector expanded by 5.6 per cent over 2013, with the largest growth in the private sector recorded in the professional, scientifi c and technical activities, information and communication, accommodation and food service activities as well as in the wholesale and retail trade sector. The fi nancial sector reported an overall decline in gross value added, partly refl ecting a fall in the banking profi tability. The decline in manufacturing gross value added was mainly attributed to lower production by the computer, electronic & optical product and pharmaceutical sub-sectors. In contrast, a number of manufacturing sectors which together account for around 50.0 per cent of manufacturing gross value added registered very strong growth rates averaging 21.5 per cent. Indeed, signifi cant absolute increases were recorded in the manufacturing of metal products, as well as that of vehicles, trailers and semi-trailers, furniture and rubber plastics.
From the income side, total incomes grew by 5.2 per cent in 2014 from 4.8 per cent in the previous year, driven by a positive performance in both compensation of employees and gross operating surplus which increased by 5.5 per cent and 3.7 per cent, respectively. Meanwhile, taxes on production and imports increased by €106.7 million or 10.7 per cent while subsidies increased by €24.5 million or 25.7 per cent. This resulted in an increase
10 Malta: Update of Stability Programme 2015 - 2018
in net taxes of €82.2 million or 9.1 per cent during 2014.
2.2 The Medium-Term ScenarioThe Maltese economy is expected to continue growing at a steady pace over the forecast horizon, with real GDP growth reaching 3.4 per cent and 3.1 per cent in 2015 and 2016, respectively. This positive momentum is expected to be supported primarily by strong domestic demand. Imports are expected to grow as a result, contributing negative to growth in both forecast years. Investment is set to remain the main driver of economic growth as a number of large scale projects, mainly in the energy, health and educational sectors are set to be undertaken over the forecast period. Public consumption is also expected to support growth, yet its contribution is expected to be much smaller than that of private consumption which is set to continue growing strongly over the forecast horizon. In the outer forecast years, growth is expected to be more balanced with both the domestic and the external side of the economy both contributing to economic growth.
Chart 2.1 illustrates the projected growth rate of GDP together with a detailed breakdown of the various expenditure aggregates. Table 2.1 presents the main macroeconomic indicators for the years 2014-2018. The fi gures for 2014 have been published by the NSO, whilst fi gures from 2015 onwards are forecasts. The macroeconomic forecasts take into account the latest available data and are being provided in Tables 1a, 1b, 1c, and 1d of the Statistical Appendix.
2.2.1 Assumptions for ProjectionsThe macroeconomic forecasts presented in this Stability Programme are based on the following assumptions:
• Economic activity in Malta’s main trading partners is expected to increase by 1.8 per cent in 2015 and by 2.0 per cent thereafter.
• Oil prices are assumed to decline further in 2015, from an average US$99.0 per barrel in 2014 to US$59.9 per barrel in 2015 and to increase to US$71.4 per barrel in 2016 and to around US$85.0 thereafter.
• The Dollar/Euro exchange rate is assumed to decline further in 2015, from an average of US$1.30 per euro in 2014 to US$1.11 per euro in 2015 and to around US$1.09 per euro thereafter. Similarly, the Pound/Euro exchange rate is assumed to decline further in 2015, from an average of UK£0.79 per euro in 2014 to around UK£0.73 per euro in 2015 and to remain around UK£0.73 per euro thereafter.
• Both short-term and long-term interest rates are assumed to remain stable during the forecast period with a uniform spread between the two.
• It is being assumed that, in line with Government policy, Government’s employment share will decline marginally as Government restricts recruitment in non-essential categories.
• Changes in inventory are assumed not to contribute materially to GDP growth.

11Malta: Update of Stability Programme 2015 - 2018
Chart 2.1
0.0
0.5
1.0
1.5
2.0
2.5
3.0
3.5
-4.0
-2.0
0.0
2.0
4.0
6.0
8.0
10.0
12.0
14.0
16.0
18.0
20.0
22.0
24.0
2015 2016 2017 2018
GDP Growth Rate
Private Consumption Government Consumption Investment Exports Imports GDP
%
(right scale)
%
Main Macroeconomic IndicatorsTable 2.1
2014 2015f 2016f 2017f 2018f
GDP growth at current market prices (%) 5.2 4.7 5.2 5.2 5.4GDP growth at Chain Linked Volumes by period (Reference year 2010) (%)(1) 3.5 3.4 3.1 2.8 2.8
Expenditure Components of GDP at Chain Linked Volumes by period (Reference year 2010) (%) Private fi nal consumption expenditure(2) 3.4 3.4 2.7 2.5 2.4 General government fi nal consumption expenditure 7.3 0.6 1.2 0.5 0.5 Gross fi xed capital formation 14.0 23.6 13.1 -2.8 0.2 Exports of goods and services -0.2 2.8 2.4 1.0 1.9 Imports of goods and services 0.1 5.0 3.5 -0.3 1.0
Infl ation rate (%) 0.8 1.0 1.8 2.4 2.4Employment growth (Resident population concept, LFS defi nition) (%) 3.1 2.0 1.8 1.7 1.8Unemployment rate (Harmonised defi nition, Eurostat) (%) 5.9 5.8 5.7 5.8 5.8Compensation per employee (% change) 1.9 3.1 3.7 3.5 3.5Labour productivity (% change) -0.1 1.8 1.5 1.3 1.2Nominal Unit Labour Cost (% change) 1.9 1.2 2.2 2.1 2.2Real Unit Labour Costs (% change) 0.4 -0.1 0.1 -0.2 -0.4
External Goods and Services Balance (% of GDP) 6.0 2.3 0.8 2.9 4.3
(1) Users should note that chain-linking gives rise to components of GDP not adding up to the aggregate real GDP series. This non-additivity, similar to that in other countries’ national accounts, is due to mathematical reasons and refl ects the fact that chain-linked volumes are calculated by separately extrapolating both totals and their sub-components.
(2)Includes NPISH fi nal consumption expenditure.
12 Malta: Update of Stability Programme 2015 - 2018
2.2.2 Risks to OutlookThe medium-term outlook for the global economy is one of steady growth. Nevertheless, there are a number of factors that could boost or restrain growth prospects. These risk factors will be explored in more detail in Chapter 4 of this Programme. Nevertheless, it is worth noting at this stage that the upside risks are deemed to be stronger than the downside risks.
2.2.3 Private Final Consumption ExpenditureAfter registering a robust growth rate of 3.4 per cent, private consumption expenditure is expected to remain strong in 2015. Indeed, it is forecasted to increase by 3.4 per cent in real terms, as labour market developments, a moderate appreciation in wages, lower energy prices and lower eff ective income tax are all expected to have a benefi cial impact on disposable income. Private consumption is projected to continue expanding over the forecast period, yet its rate of growth is expected to decelerate slightly to 2.7 per cent in 2016 and to 2.5 per cent and 2.4 per cent in 2017 and 2018, respectively. This moderation in private consumption growth is consistent with developments in employment growth and in disposable income.
2.2.4 General Government Final Consumption ExpenditureFollowing a strong increase in 2014, growth in government fi nal consumption expenditure is expected to be more moderate over the forecast horizon, reaching 0.6 per cent in 2015. It is projected to pick up and rise by 1.2 per cent in 2016, and to subsequently grow more moderately, rising by 0.5 per cent in 2017 and 2018, respectively. It is pertinent to note that following Eurostat accounting guidelines, the revenue from the International Investor Programme is classifi ed as market output and is therefore deducted from government consumption. This may contribute to a certain degree of unevenness in the public expenditure growth trend.
2.2.5 Gross Fixed Capital FormationGross fi xed capital formation is set to remain the main driver of economic growth, increasing by a signifi cant 23.6 per cent and 13.1 per cent in 2015 and 2016, respectively. This has contributed to a higher investment to GDP ratio from a low of 16.6 per cent in 2013 to 24.0 per cent in 2016. This robust investment performance refl ects the materialisation of the large scale energy projects, namely the construction of a new gas-power plant and the conversion of another plant to the use of natural gas for power production as well as other private investment projects planned for completion over the same period. In addition, a series of announced government measures are expected to support private investment, particularly in tourism and non-dwelling construction. Meanwhile, investment in dwellings should also benefi t from an accommodative monetary policy stance and demand for high-end property from participants in the Individual Investor Programme. Investment activity in the outer forecast years is in turn infl uenced by the high base from 2015 and 2016. Indeed, gross fi xed capital formation is set to contract by 2.8 per cent in 2017 and to pick-up marginally by 0.2 per cent in 2018. The baseline scenario underpinning these forecasts does not account the impact of a number of large scale projects which are considered to have a high probability of materialising but have not yet been fully disclosed in detail. The reason for non-inclusion in baseline scenario was to maintain a prudent scenario in the medium-term. If long-term interest rates are reduced on the back of quantitative easing, investment growth could further

13Malta: Update of Stability Programme 2015 - 2018
strengthen in the coming years. The positive impact of lower utility tariff s on profi tability and investment is also excluded from this baseline scenario. These will be explored in more detail in Chapter 4 of the Stability Programme.
2.2.6 External Balance of Goods and ServicesThe declining trend in real exports is expected to be reversed, as real exports are set to grow by 2.8 per cent and 2.4 per cent in 2015 and 2016, respectively. This positive momentum is in line with the gradual recovery in the international economic outlook and the depreciation of the euro. At the same time, stronger domestic demand is expected to drive up imports by 5.0 per cent and 3.5 per cent in 2015 and 2016, respectively, resulting in a negative net trade contribution to growth in both forecast years.
Net exports are however expected to turn positive and to contribute signifi cantly towards economic growth in the outer years of the forecast period as growth in the import-intensive domestic demand slows down. Indeed, in 2016 exports are set to grow by 1.0 per cent while imports are set to decline by 0.3 per cent, thereby contributing positively by 2.0 percentage points to overall economic growth. In 2018, imports are expected to pick-up again by 1.0 per cent, in line with a pick-up in investment activity, whilst exports are expected to grow by 1.9 per cent, this resulting in another year of positive net trade contribution.
Meanwhile, nominal exports are expected to remain higher than nominal imports throughout the forecasting period, thereby contributing to a positive balance on the external side.
2.2.7 Productivity and Employment ProspectsThe labour force survey recorded a growth rate of 3.1 per cent in 2014 in total employment, which is well above the 0.6 per cent and 1.1 per cent recorded for the EA and EU average, respectively. Notable labour market progress was accounted for by the rising participation of women in the labour market, which increased by 3.3 per cent in 2014.
Job creation is expected to remain robust, yet grow more moderately over the forecast period, increasing by 2.0 per cent in 2015 and by around 1.8 per cent thereafter. Employment growth is therefore expected to converge to its long-term average as the economy converges to its potential growth rate. Similar to 2014, this performance is expected to be largely supported by a higher female employment rate, partly refl ecting increased eff orts from Government to increase female participation, and an increase in employment fl exibility in terms of labour hours.
Compensation per employee is forecasted to grow by 3.1 per cent in 2015 and then to increase by an average growth rate of 3.5 per cent over the remaining forecast period. Labour productivity growth is expected to be positive over the forecast period with an expected average growth of 1.5 per cent during the 2015-2018 period. Following the 1.9 per cent increase in 2014, nominal Unit Labour Costs (ULC) are expected to increase moderately by 1.2 per cent in 2015. Thereafter, ULC are expected to rise by 2.2 per cent, while real ULC are expected to decline by an average of 0.2 per cent over the forecast horizon, indicating that the growth in nominal ULC is mitigated by the expected increase in the price of output produced as measured by the GDP defl ator.1

14 Malta: Update of Stability Programme 2015 - 2018
Growth in output is expected to be supported by both the traditional and the emerging growth sectors. Indeed, from a sectoral perspective, growth in output is expected to be primarily driven by a positive performance in services. The fi nancial and insurance activity sector is expected to partially recover from the overall temporary decline registered in 2014, whilst the tourism sector is expected to continue performing strongly, supported by a weaker Euro exchange rate, as well as increases in airline and cruise ship seat capacity and investments in the hotel industry. The industrial sector of the economy, including manufacturing, is also expected to contribute, albeit to a lesser extent, to the robust economic growth projected for 2015-2018.
In 2014, the unemployment rate (based on the Harmonised defi nition) stood at 5.9 per cent. Over the forecast period, the unemployment rate is expected to remain below historical averages at around 5.8 per cent. This is well below the expected EU average unemployment rate and refl ects ongoing eff orts in active labour market policies.
2.2.8 Infl ationDuring 2014, the HICP infl ation rate (calculated as the twelve month moving average of the HICP) declined to 0.8 per cent from 1.0 per cent recorded a year earlier. This deceleration was mainly attributed to downward pressures exerted by industrial goods and energy prices, which were partially off set by a pick-up in the price pressures registered in services, food and non-energy industrial goods.
After reaching a seven-year through in 2014, HICP infl ation is projected to remain relatively low at 1.0 per cent in 2015 and to pick-up to 1.8 per cent in 2016. Infl ationary pressures are expected to be driven by the food and services components. In addition, the downward trend in energy price infl ation observed in 2014 is expected to be less pronounced in 2015 and 2016, as the eff ect of the reduction in household electricity tariff s of April 2014 drops out of the annual infl ation rate. At the same time, the reduction in utility tariff s for the commercial sector from March 2015, and subsequent second-round eff ects, is expected to somewhat damper infl ationary pressures. For the outer years, infl ation is expected to rebound to around 2.4 per cent.
2.2.9 Comparison with the Commission’s Winter ForecastThe winter forecasts published by the European Commission project a growth rate for Malta of 3.3 per cent and 2.9 per cent in 2015 and 2016, respectively, as domestic demand is set to remain the main driver of growth. Forecasts for real GDP growth presented in this Programme are 0.1 percentage points higher in 2015 and 0.2 percentage points higher in 2016 than the rates forecasted by the European Commission. Both sets of forecasts are consistent with a domestically-led growth scenario, yet the forecast presented in this Programme assumes a higher expected net contribution from domestic demand, primarily underlined by stronger growth in gross fi xed capital formation, refl ecting the sizable public and private investments set to materialise over the period. Nominal GDP growth is expected to reach 4.7 per cent and 5.2 per cent for 2015 and 2016, respectively, compared to a growth rate of 4.8 per cent and 4.6 per cent in the European Commission’s winter forecasts. It is however to be noted, that the Winter Forecasts of the European Commission are not based on the most recent statistical information and are in the process of being revised.
15Malta: Update of Stability Programme 2015 - 2018
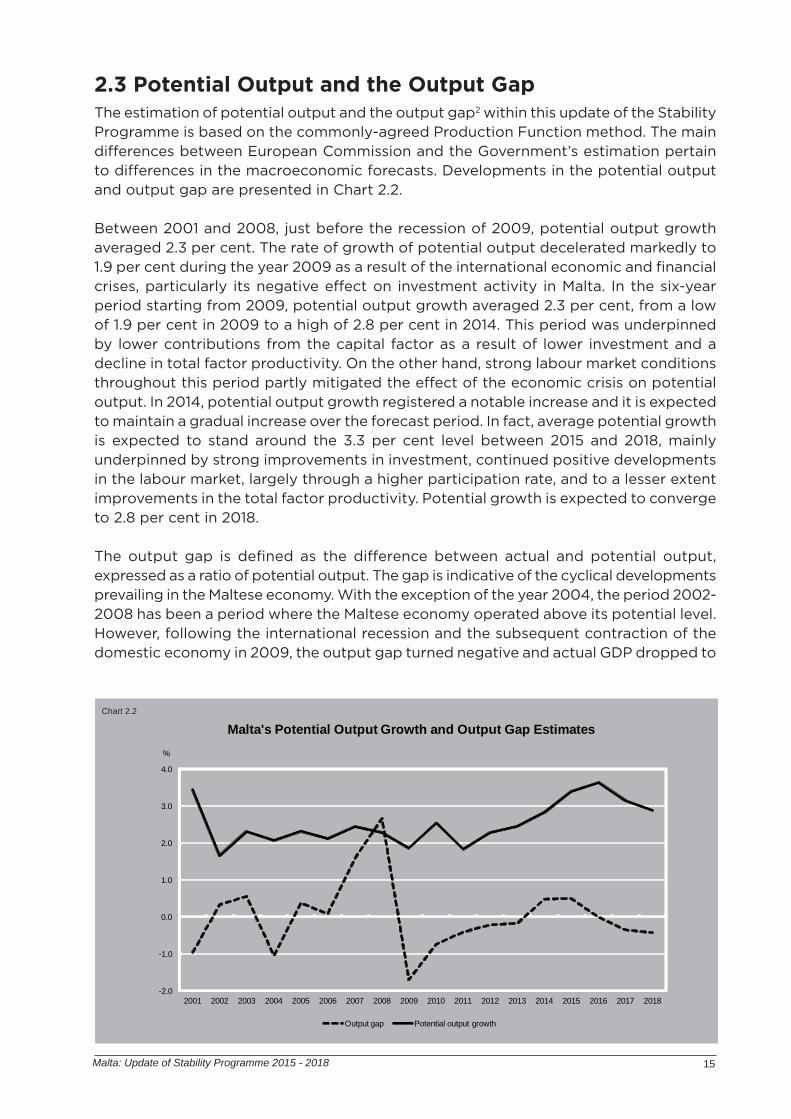
2.3 Potential Output and the Output GapThe estimation of potential output and the output gap2 within this update of the Stability Programme is based on the commonly-agreed Production Function method. The main diff erences between European Commission and the Government’s estimation pertain to diff erences in the macroeconomic forecasts. Developments in the potential output and output gap are presented in Chart 2.2.
Between 2001 and 2008, just before the recession of 2009, potential output growth averaged 2.3 per cent. The rate of growth of potential output decelerated markedly to 1.9 per cent during the year 2009 as a result of the international economic and fi nancial crises, particularly its negative eff ect on investment activity in Malta. In the six-year period starting from 2009, potential output growth averaged 2.3 per cent, from a low of 1.9 per cent in 2009 to a high of 2.8 per cent in 2014. This period was underpinned by lower contributions from the capital factor as a result of lower investment and a decline in total factor productivity. On the other hand, strong labour market conditions throughout this period partly mitigated the eff ect of the economic crisis on potential output. In 2014, potential output growth registered a notable increase and it is expected to maintain a gradual increase over the forecast period. In fact, average potential growth is expected to stand around the 3.3 per cent level between 2015 and 2018, mainly underpinned by strong improvements in investment, continued positive developments in the labour market, largely through a higher participation rate, and to a lesser extent improvements in the total factor productivity. Potential growth is expected to converge to 2.8 per cent in 2018.
The output gap is defi ned as the diff erence between actual and potential output, expressed as a ratio of potential output. The gap is indicative of the cyclical developments prevailing in the Maltese economy. With the exception of the year 2004, the period 2002-2008 has been a period where the Maltese economy operated above its potential level. However, following the international recession and the subsequent contraction of the domestic economy in 2009, the output gap turned negative and actual GDP dropped to
Chart 2.2
-2.0
-1.0
0.0
1.0
2.0
3.0
4.0
2001 2002 2003 2004 2005 2006 2007 2008 2009 2010 2011 2012 2013 2014 2015 2016 2017 2018
Malta's Potential Output Growth and Output Gap Estimates
Output gap Potential output growth
%

16 Malta: Update of Stability Programme 2015 - 2018
1.7 per cent below potential. The output gap turned positive in 2014 and it is expected to remain positive in the subsequent year. The gap is expected to close in 2016 and to turn slightly negative in 2017 and 2018.
2.4 Potential Growth and Structural Reforms Raising potential output through the structural reform agenda is one of the key policy goals through which Government intends to create more jobs and sustain economic growth. The implementation of structural reforms contributes to raise confi dence among households and economic operators and is key to raising productivity and living standards more generally.
Specifi cally, the Maltese Government is aiming to:
• Strengthen fi scal responsibility and long-term sustainability of public fi nances;• Encourage higher labour participation rates by implementing active labour market
policies, making work pay and discouraging dependencies; • Improve the education system and assuring higher education quality whilst reducing
skills gaps; • Strengthen effi ciency in the use of energy by upgrading the energy infrastructure
and diversifying sources and supply of energy; • Encourage greater investment in higher research and development; • Enhancing the quality of the business environment;• Target poverty reduction and strengthen social inclusion
A more detailed discussion on each of these measures and their potential socio-economic impact is presented in Malta’s National Reform Programme 2015.
Structural reforms undertaken since the start of the crisis coincided with an increased potential output growth from an average of 2.2 per cent between 2009 and 2013 to 2.8 per cent in 2014. This notable increase in the economy’s potential supported a reduction in NAWRU from 6.4 per cent during the 2009/13 period to 6.1 per cent in 2014 and the rate is expected to continue to decline to 5.7 per cent by 2018. This indicates that the economy is able to support a higher rate of growth and a lower rate of unemployment without excessive wage and infl ationary pressures which could erode competitiveness.
Footnotes:
1 It is noteworthy that the growth projections for compensation per employee, labour productivity and Unit Labour Cost within this update of Stability Programme are not strictly comparable to last year due to a change in their calculation. These variables are now being calculated on the National Accounts defi nition of employment and not on the Labour Force Survey defi nition.
2 Defi ned as actual output less potential output as a per cent of potential output.

3. Fiscal Outlook and the Medium-Term Fiscal Strategy


19Malta: Update of Stability Programme 2015 - 2018
3. Fiscal Outlook and the Medium-Term Fiscal StrategyThe Government’s fi scal policy objective remains that of ensuring a sustainable fi scal position by gradually but consistently reducing the fi scal imbalance, aiming to reach a balanced budget in the medium-term. Fiscal consolidation is necessary to ensure the sustainability of the Government’s fi scal position, thus regaining the necessary fi scal fl exibility that would spur long-term economic growth. In this context, the general Government defi cit in 2014 has been reduced to 2.1 per cent of GDP with further gradual reductions envisaged over the medium-term horizon. Consistent with the requirements of the national fi scal rules, the Government is targeting an average structural eff ort of 0.65 percentage points of GDP per annum which foresees the attainment of the Medium-Term Budgetary Objective (MTO) in 2019.
The envisaged fi scal consolidation will be primarily supported through strong and sustainable economic growth. As highlighted in Malta’s National Reform Programme 2015, a number of ongoing and planned structural reforms will be contributing to potential economic growth, whilst ensuring fi scal sustainability. These reforms, which are expected to have signifi cant budgetary impact, are expected to be partly fi nanced through EU funds and partly from national funds. The Government spending reviews will continue to ensure improved effi ciency in public spending. Eff orts towards curbing fi scal abuse and improving effi ciency in revenue collection will continue with the merger of revenue departments into one single entity. Furthermore, the institutional fi scal framework introduced in 2014 through the Fiscal Responsibility Act will support the achievement of the fi scal targets contained in this Programme.
The debt-to-GDP ratio has declined to 68.0 per cent of GDP in 2014. Further improvements in the underlying debt dynamics are expected to be attained through an improvement in the primary surplus, positive growth prospects, sustained investor confi dence, and an effi cient and eff ective debt management strategy. In this respect, the debt-to-GDP ratio is expected to exhibit a downward trajectory and to approach the 60 per cent target by the end of this Programme period.
In line with the practice of the previous 2014 Update of the Stability Programme, the Government’s medium-term budget framework as outlined in this Programme constitutes Malta’s national medium-term fi scal plan as required by Article 4(1) of the EU Regulation No 473/2013 on common provisions for monitoring and assessing draft budgetary plans and ensuring the correction of excessive defi cit of the Member States in the Euro Area.
3.1 Correction of Excessive Defi citIn 2012, Malta recorded a general Government defi cit of 3.6 per cent of GDP, well above the reference value. Consequently, the European Council established that an excessive defi cit situation existed in Malta and recommended Malta to correct its excessive defi cit by 2014.
Malta took eff ective action to bring down the Government defi cit below the 3.0 per cent threshold by the end of 2013, a year prior to the deadline set by the Council, but in line with the projections of Malta’s 2013 Update of the Stability Programme. In fact, the general Government defi cit-to-GDP ratio for 2013 improved by 1.0 percentage points to reach 2.6 per cent of GDP. The Government continued on the path of fi scal consolidation
20 Malta: Update of Stability Programme 2015 - 2018
and further reduced the defi cit to 2.1 per cent of GDP in 2014, which is well below the target recommended by the Council.
Improvements were also made in structural terms, where the structural defi cit fell from 3.7 per cent of GDP in 2012 to 2.7 per cent of GDP in 2014. The debt ratio also embarked on a downward trajectory declining from 69.2 per cent in 2013 to 68.0 per cent in 2014, as a result of which, the forward-looking debt reduction benchmark was fulfi lled in 2014.
3.2 Fiscal Development in 2014In 2014, the general Government defi cit-to-GDP ratio improved by 0.5 percentage points over the previous year.
3.2.1 General Government Revenue in 2014In 2014, the general Government revenue-to-GDP ratio increased by 2.0 percentage points to 41.7 per cent of GDP primarily as a result of higher tax revenue.
The ratio to GDP of current taxes on income and wealth increased by 0.7 percentage points, mainly underpinned by higher revenue from personal income tax refl ecting the sustained positive performance of the labour market, an increase of revenue from income tax paid by companies, and proceeds from the Investment Registration Scheme.
Taxes on production and imports also recorded a 0.7 percentage point increase in 2014. This was supported by strong domestic demand conditions, as refl ected in higher revenue ratios from taxes on products, particularly in relation to excise duties and consumption taxes, but also in respect of revenue collected from Value Added Tax (VAT). On the other hand, there were decreases in capital taxes of 0.1 per cent of GDP.
Social security contributions registered a marginal 0.1 percentage point of GDP increase in 2014. This refl ects the stability in the labour market and the strong outcome in output and employment.
Compared to 2013, the ratio of property income remained relatively unchanged, whereas ‘other’ revenue recorded an increase of 0.7 percentage points of GDP, mainly underpinned by higher receipts from other capital transfers and investment grants. In addition, the International Investor Programme (IIP) launched in 2014 was another contributing factor to the increase in ‘other’ revenue.
3.2.2 General Government Expenditure in 2014The ratio of general Government expenditure increased by 1.5 percentage points of GDP from 42.3 per cent in 2013, refl ecting higher ratios recorded for gross fi xed capital formation, intermediate consumption, compensation of employees, and subsidies. These were partly off set by lower expenditure ratios for capital transfers and ‘other’ expenditure.
The increase in the ratio of gross fi xed capital formation from 2.8 per cent of GDP in 2013 to 3.8 per cent of GDP in 2014 was mainly underpinned by higher expenditure for the acquisition of new and existing tangible fi xed assets, notably in relation to road works, transport equipment, restoration of forts and historical places, and the integrated fl ood

21Malta: Update of Stability Programme 2015 - 2018
relief project. These projects were in part fi nanced from EU funds. Other notable increases were attributable to higher outlays by Extra Budgetary Units (EBUs), particularly in relation to acquisitions of new tangible fi xed assets.
The increase in the ratio of intermediate consumption from 6.2 per cent of GDP in 2013 to 6.6 per cent of GDP in 2014 was mainly underpinned by increases in expenditure related to programmes and initiatives. These include increases in expenditure towards medicines and surgical materials, child care for all, a higher administrative fee towards the transport authority, expenditure related to residential care in private homes, and outlays towards the Pharmacy of Your Choice initiative. Higher Operational and Maintenance Expenditure and higher expenditure towards the Waste Water Directorate also contributed to a higher intermediate consumption ratio, whereas this ratio was slightly off set through decreases in capital expenditure classifi ed under this component of revenue.
The ratio of compensation of employees to GDP increased by 0.3 percentage points in 2014, mainly on account of higher expenditures on wages and salaries of public administration and human health activities. Notable increases were also recorded in relation to EBUs and education. An increase in the ratio of subsidies from 1.1 per cent of GDP in 2013 to 1.3 per cent of GDP in 2014 was mainly attributable to the Public Service Obligation in relation to public transport.
The ratio of capital transfers to GDP decreased by 0.2 percentage points in 2014, mainly underpinned by a lower equity injection to the national airline as part of the ongoing restructuring process. This was partly off set by investment in renewable energy in domestic sectors and investment towards reducing carbon footprints.
The ratio of ‘other’ expenditure to GDP decreased by 0.1 percentage points to 2.3 per cent, mainly due to higher proceeds from the sale of non-fi nancial non-produced assets, which is recorded as negative expenditure under this component. This was partly off set by an increase in other current transfers.
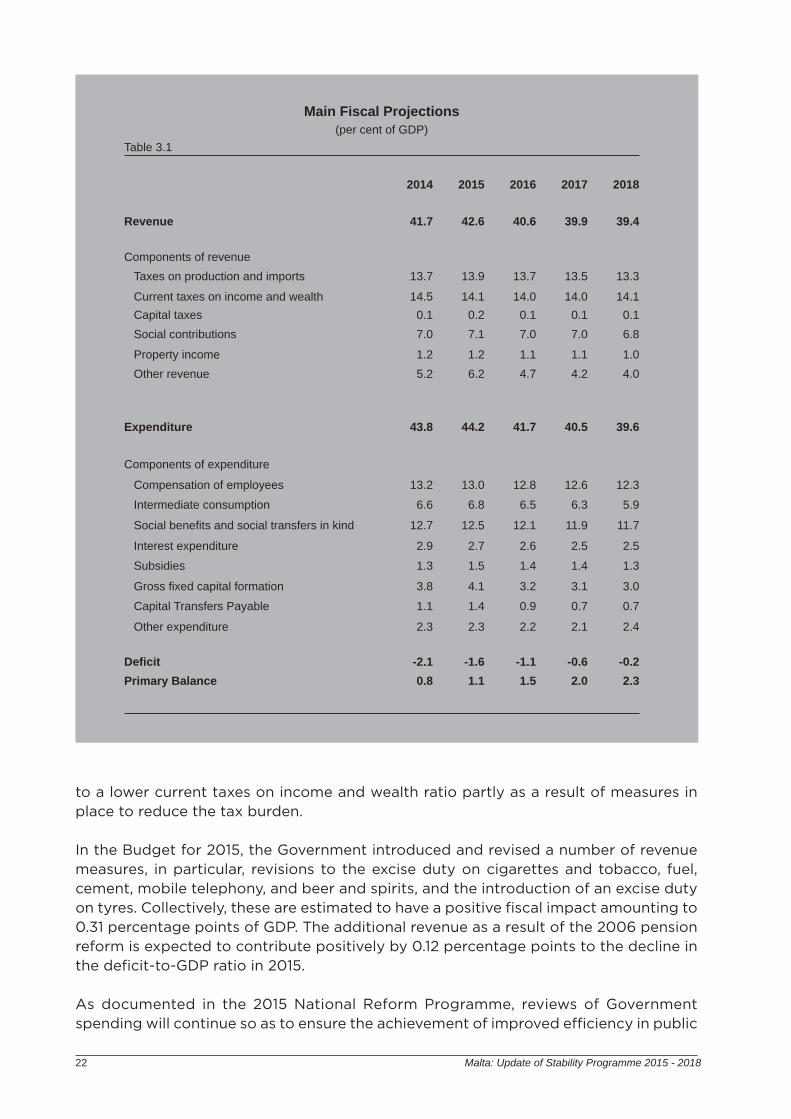
3.3 Consolidating Budgetary Targets in 2015Government remains committed to ensure a sustainable fi scal position by gradually but consistently reducing the fi scal imbalance. During the current fi scal year, the general Government balance is expected to further decline from 2.1 per cent of GDP to 1.6 per cent of GDP, consistent with an improvement in the fi scal position of 0.5 percentage points of GDP and a structural eff ort of 0.7 percentage points of GDP. Table 3.1 presents the main projections of Government while Table 3.2 presents the measures supporting the fi scal consolidation envisaged over the medium-term.
3.3.1 General Government Revenue in 2015As indicated in Table 3.1, the general Government revenue-to-GDP ratio is expected to increase by 0.87 percentage points to 42.6 per cent of GDP in 2015, mainly attributable to an increase in the ratio of the ‘other’ component of revenue (0.97pp) refl ecting higher EU funds (0.74pp) and higher market output (0.27pp) associated with the revenue generated from the International Investor Programme together with greater effi ciency in revenue collection. Marginal increases are expected in the social contributions ratio (0.10pp). On the other hand, a decline is expected in the tax ratio (0.24pp), namely due
22 Malta: Update of Stability Programme 2015 - 2018
to a lower current taxes on income and wealth ratio partly as a result of measures in place to reduce the tax burden.
In the Budget for 2015, the Government introduced and revised a number of revenue measures, in particular, revisions to the excise duty on cigarettes and tobacco, fuel, cement, mobile telephony, and beer and spirits, and the introduction of an excise duty on tyres. Collectively, these are estimated to have a positive fi scal impact amounting to 0.31 percentage points of GDP. The additional revenue as a result of the 2006 pension reform is expected to contribute positively by 0.12 percentage points to the decline in the defi cit-to-GDP ratio in 2015.
As documented in the 2015 National Reform Programme, reviews of Government spending will continue so as to ensure the achievement of improved effi ciency in public
Main Fiscal Projections(per cent of GDP)
Table 3.1
2014 2015 2016 2017 2018
Revenue 41.7 42.6 40.6 39.9 39.4
Components of revenueTaxes on production and imports 13.7 13.9 13.7 13.5 13.3
Current taxes on income and wealth 14.5 14.1 14.0 14.0 14.1Capital taxes 0.1 0.2 0.1 0.1 0.1Social contributions 7.0 7.1 7.0 7.0 6.8
Property income 1.2 1.2 1.1 1.1 1.0Other revenue 5.2 6.2 4.7 4.2 4.0
Expenditure 43.8 44.2 41.7 40.5 39.6
Components of expenditure
Compensation of employees 13.2 13.0 12.8 12.6 12.3
Intermediate consumption 6.6 6.8 6.5 6.3 5.9
Social benefi ts and social transfers in kind 12.7 12.5 12.1 11.9 11.7
Interest expenditure 2.9 2.7 2.6 2.5 2.5
Subsidies 1.3 1.5 1.4 1.4 1.3
Gross fi xed capital formation 3.8 4.1 3.2 3.1 3.0
Capital Transfers Payable 1.1 1.4 0.9 0.7 0.7
Other expenditure 2.3 2.3 2.2 2.1 2.4
Defi cit -2.1 -1.6 -1.1 -0.6 -0.2Primary Balance 0.8 1.1 1.5 2.0 2.3
23Malta: Update of Stability Programme 2015 - 2018
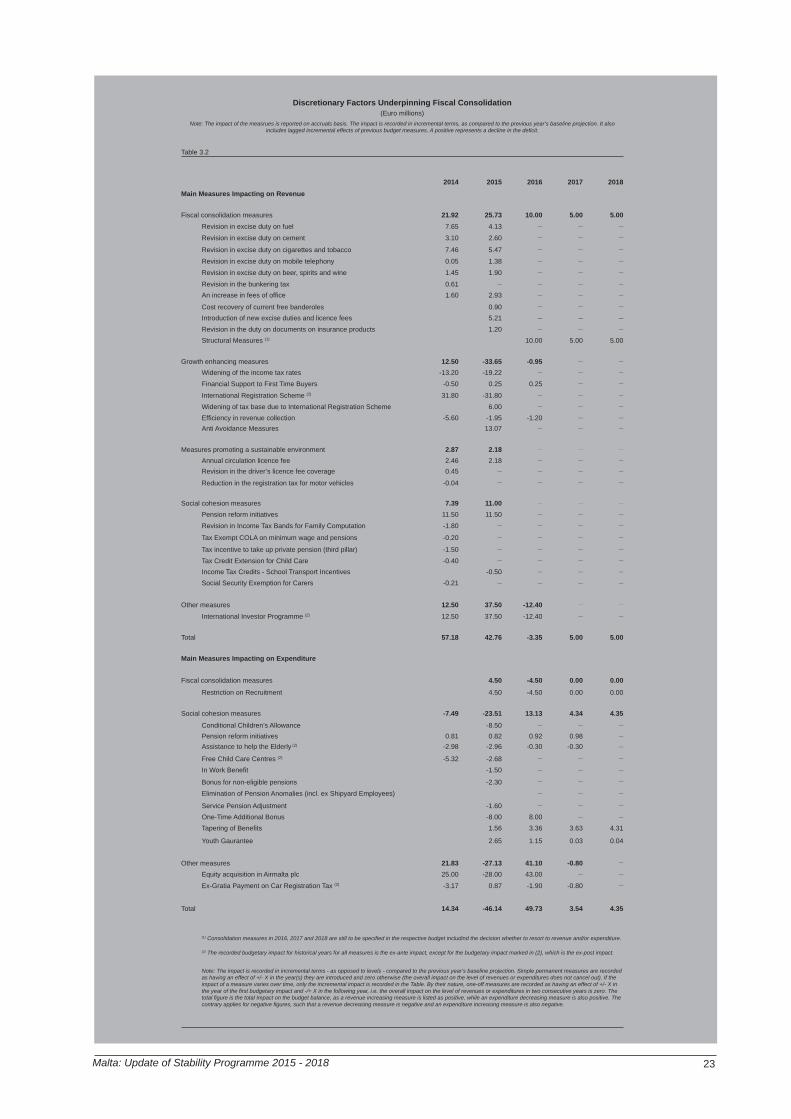
Discretionary Factors Underpinning Fiscal Consolidation(Euro millions)
Note: The impact of the measrues is reported on accruals basis. The impact is recorded in incremental terms, as compared to the previous year’s baseline projection. It also includes lagged incremental effects of previous budget measures. A positive represents a decline in the defi cit.
Table 3.2
2014 2015 2016 2017 2018Main Measures Impacting on Revenue
Fiscal consolidation measures 21.92 25.73 10.00 5.00 5.00Revision in excise duty on fuel 7.65 4.13 __ __ __
Revision in excise duty on cement 3.10 2.60 __ __ __
Revision in excise duty on cigarettes and tobacco 7.46 5.47 __ __ __
Revision in excise duty on mobile telephony 0.05 1.38 __ __ __
Revision in excise duty on beer, spirits and wine 1.45 1.90 __ __ __
Revision in the bunkering tax 0.61 __ __ __ __
An increase in fees of offi ce 1.60 2.93 __ __ __
Cost recovery of current free banderoles 0.90 __ __ __
Introduction of new excise duties and licence fees 5.21 __ __ __
Revision in the duty on documents on insurance products 1.20 __ __ __
Structural Measures (1) 10.00 5.00 5.00
Growth enhancing measures 12.50 -33.65 -0.95 __ __
Widening of the income tax rates -13.20 -19.22 __ __ __
Financial Support to First Time Buyers -0.50 0.25 0.25 __ __
International Registration Scheme (2) 31.80 -31.80 __ __ __
Widening of tax base due to International Registration Scheme 6.00 __ __ __
Effi ciency in revenue collection -5.60 -1.95 -1.20 __ __
Anti Avoidance Measures 13.07 __ __ __
Measures promoting a sustainable environment 2.87 2.18 __ __ __
Annual circulation licence fee 2.46 2.18 __ __ __
Revision in the driver’s licence fee coverage 0.45 __ __ __ __
Reduction in the registration tax for motor vehicles -0.04 __ __ __ __
Social cohesion measures 7.39 11.00 __ __ __
Pension reform initiatives 11.50 11.50 __ __ __
Revision in Income Tax Bands for Family Computation -1.80 __ __ __ __
Tax Exempt COLA on minimum wage and pensions -0.20 __ __ __ __
Tax incentive to take up private pension (third pillar) -1.50 __ __ __ __
Tax Credit Extension for Child Care -0.40 __ __ __ __
Income Tax Credits - School Transport Incentives -0.50 __ __ __
Social Security Exemption for Carers -0.21 __ __ __ __
Other measures 12.50 37.50 -12.40 __ __
International Investor Programme (2) 12.50 37.50 -12.40 __ __
Total 57.18 42.76 -3.35 5.00 5.00
Main Measures Impacting on Expenditure
Fiscal consolidation measures 4.50 -4.50 0.00 0.00
Restriction on Recruitment 4.50 -4.50 0.00 0.00
Social cohesion measures -7.49 -23.51 13.13 4.34 4.35Conditional Children’s Allowance -8.50 __ __ __
Pension reform initiatives 0.81 0.82 0.92 0.98 __
Assistance to help the Elderly (2) -2.98 -2.96 -0.30 -0.30 __
Free Child Care Centres (2) -5.32 -2.68 __ __ __
In Work Benefi t -1.50 __ __ __
Bonus for non-eligible pensions -2.30 __ __ __
Elimination of Pension Anomalies (incl. ex Shipyard Employees) __ __ __
Service Pension Adjustment -1.60 __ __ __
One-Time Additional Bonus -8.00 8.00 __ __
Tapering of Benefi ts 1.56 3.36 3.63 4.31
Youth Gaurantee 2.65 1.15 0.03 0.04
Other measures 21.83 -27.13 41.10 -0.80 __
Equity acquisition in Airmalta plc 25.00 -28.00 43.00 __ __
Ex-Gratia Payment on Car Registration Tax (2) -3.17 0.87 -1.90 -0.80 __
Total 14.34 -46.14 49.73 3.54 4.35
(1) Consolidation measures in 2016, 2017 and 2018 are still to be specifi ed in the respective budget includind the decision whether to resort to revenue and/or expenditure.
(2) The recorded budgetary impact for historical years for all measures is the ex-ante impact, except for the budgetary impact marked in (2), which is the ex-post impact.
Note: The impact is recorded in incremental terms - as opposed to levels - compared to the previous year’s baseline projection. Simple permanent measures are recorded as having an effect of +/- X in the year(s) they are introduced and zero otherwise (the overall impact on the level of revenues or expenditures does not cancel out). If the impact of a measure varies over time, only the incremental impact is recorded in the Table. By their nature, one-off measures are recorded as having an effect of +/- X in the year of the fi rst budgetary impact and -/+ X in the following year, i.e. the overall impact on the level of revenues or expenditures in two consecutive years is zero. The total fi gure is the total Impact on the budget balance, as a revenue increasing measure is listed as positive, while an expenditure decreasing measure is also positive. The contrary applies for negative fi gures, such that a revenue decreasing measure is negative and an expenditure increasing measure is also negative.

24 Malta: Update of Stability Programme 2015 - 2018
spending, reduction of waste and value for money. Indeed, the Government estimates a 0.16 percentage point improvement in the fi scal outcome resulting from anti-avoidance measures in support of its eff orts towards curbing fi scal abuse and increasing effi ciency in revenue collection. The Investment Registration Scheme, as announced in 2014, was successful and has the potential to permanently improve the income tax base and the recovery of arrears by at least 0.07 percentage points of GDP.
The positive impact on the fi scal outcome exerted by the revenue-increasing measures is expected to be partially off set by the revenue-decreasing measures (-0.64pp) mainly underpinned by lower revenue of 0.40 percentage points due to the one-off nature of the revenue collected from the Investment Registration Scheme in 2014. The further revision to the income tax rates as announced in the 2015 Budget, are expected to contribute to a decline of 0.22 percentage points while other revenue-decreasing factors are expected to contribute to a decline of 0.02 percentage points.
3.3.2 General Government Expenditure in 2015In 2015, the ratio of general Government expenditure to GDP is expected to increase by 0.35 percentage points from 43.8 per cent of GDP in 2014. As shown in Table 3.1, this development is mainly due to higher public investment, which is expected to increase from 3.8 per cent of GDP to 4.1 per cent of GDP refl ecting higher expenditure on EU funded projects. Higher capital transfers, namely due to higher equity injection in Air Malta are also expected to contribute towards a higher expenditure ratio.
As indicated in Table 3.3, public investment is expected to contribute to a 0.34 percentage points increase in the expenditure ratio, primarily refl ecting higher expenditure related to capital projects fi nanced from EU funds received under the 2007-2013 Financial Framework, and also but to a lower extent those under the 2014-2020 Financial Framework. Further increases are also expected in projects fi nanced from national sources. In 2015, the higher equity injection in Air Malta when compared to 2014 is expected to have an adverse eff ect on the defi cit-to-GDP ratio of 0.33 percentage points
Analysis of the Adjustment in the Defi cit-to-GDP Ratio(percentage points of GDP)
Table 3.3
2014 2015 2016 2017 2018
Change in Revenue Ratio 2.03 0.87 -1.96 -0.69 -0.54Discretionary factors underpinning fi scal consolidation 0.70 0.47 -0.11 -0.02 -0.02Tax revenue buoyancy 0.98 -0.12 -0.47 -0.19 -0.28Other revenue 0.34 0.52 -1.38 -0.48 -0.24
Change in Expenditure Ratio -1.58 -0.35 2.51 1.19 0.89Discretionary factors underpinning fi scal consolidation -0.14 -0.22 0.09 0.05 0.05Incremental impact of the Equity Injection in the National Airline 0.34 -0.33 0.52 0.00 0.00Change in Gross Fixed Capital Formation -1.00 -0.34 0.94 0.09 0.13Other expenditure -0.78 0.53 0.96 1.06 0.71
Adjustment in defi cit ratio 0.45 0.52 0.54 0.50 0.35
Note: Positive represents a decline in the defi cit-to-GDP ratio

25Malta: Update of Stability Programme 2015 - 2018
to reach 0.5 per cent of GDP in 2015.
Discretionary expenditure-increasing measures are expected to exert an adverse eff ect on the defi cit-to-GDP ratio of 0.32 percentage points, mainly underpinned by the introduction of a conditional children’s allowance (0.10pp) and a one-time additional bonus (0.10pp) to compensate those employees, pensioners and other benefi ciaries who did not benefi t from the reduction in income tax.
Moreover, assistance to help the elderly live independently, free child care centres, an in work benefi t for low-income households with children when both parents work to encourage labour market participation and reduce dependency on social benefi ts and a bonus for non-eligible pensions are also expected to collectively (0.11pp) exert an adverse eff ect on the defi cit-to-GDP ratio. Meanwhile, the growth in subsidies refl ecting the provision of a spare capacity for electricity and higher intermediate consumption are expected to exert a defi cit-increasing eff ect.
3.3.3 Consolidation Measures in 2015The defi cit-increasing factors within the Government expenditure are expected to be partly mitigated by the containment of public sector employment together with a restriction on growth in allowances and overtime roughly with the rate of infl ation is expected to exert a positive impact on the defi cit ratio (0.05pp). The recruitment restriction policy does not apply to the health and education categories.
Furthermore, the Youth Guarantee, aimed at shifting young people on social assistance under the age of 23 to an ESF co-fi nanced project, and the tapering of social benefi ts for persons who are in receipt of unemployment assistance, social assistance and social assistance for single unmarried parents, are expected to yield savings in social benefi ts and are thus expected to contribute positively (0.05pp) to the decline in the defi cit-to-GDP ratio.
Apart from the defi cit-decreasing impact of expenditure measures, the weak growth relative to nominal GDP growth in expenditure on social benefi ts also refl ects the low COLA. Interest expenditure as a ratio of GDP is also expected to decline as GDP growth exceeds borrowing costs.
3.4 Medium-Term Fiscal StrategyIn line with the requirements of the Fiscal Responsibility Act and the Stability and Growth Pact, Malta’s medium-term fi scal strategy envisaged for the 2015/18 period depends on the macroeconomic projections contained in this Programme. The medium-term economic scenario is expected to be characterised by a marginally positive output gap in 2015/16, which turns marginally negative in 2017/18. In 2015, the output gap is expected to change only marginally, and to decline in the following years. This scenario is underpinned by a relatively strong growth in 2015 which is however expected to moderate and converge to its potential over the medium-term.
Infl ation is expected to remain subdued in the short-term and to pick up in the medium-term to reach its long-term average. Nominal unit labour costs are expected to rise in line with output prices. Employment growth is expected to moderate but remain strong
26 Malta: Update of Stability Programme 2015 - 2018
compared to historical performance with a relatively low and stable unemployment rate and a decline in the non-accelerating wage rate of unemployment (NAWRU). No major external imbalances are foreseen and the external balance of goods and services is expected to remain in positive territory despite the surge in investment activity that is expected.
The necessary structural eff ort consistent with normal cyclical conditions would be maintained in the medium-term.
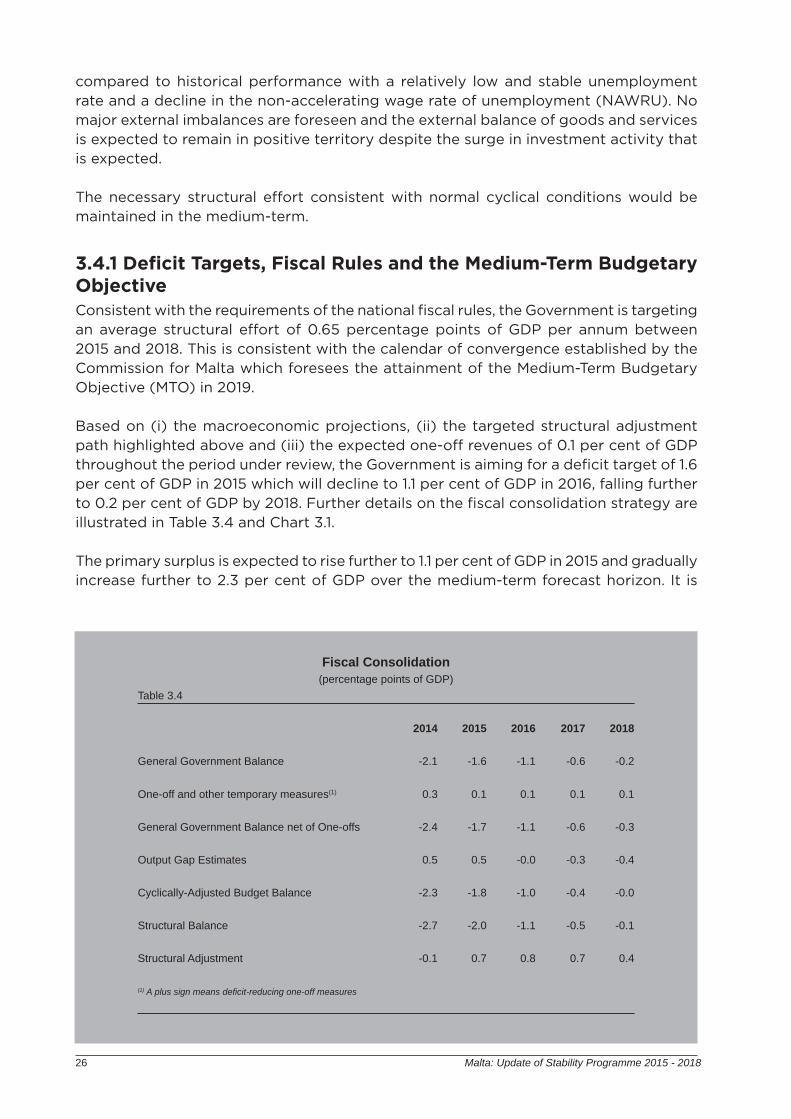
3.4.1 Defi cit Targets, Fiscal Rules and the Medium-Term Budgetary ObjectiveConsistent with the requirements of the national fi scal rules, the Government is targeting an average structural eff ort of 0.65 percentage points of GDP per annum between 2015 and 2018. This is consistent with the calendar of convergence established by the Commission for Malta which foresees the attainment of the Medium-Term Budgetary Objective (MTO) in 2019. Based on (i) the macroeconomic projections, (ii) the targeted structural adjustment path highlighted above and (iii) the expected one-off revenues of 0.1 per cent of GDP throughout the period under review, the Government is aiming for a defi cit target of 1.6 per cent of GDP in 2015 which will decline to 1.1 per cent of GDP in 2016, falling further to 0.2 per cent of GDP by 2018. Further details on the fi scal consolidation strategy are illustrated in Table 3.4 and Chart 3.1.
The primary surplus is expected to rise further to 1.1 per cent of GDP in 2015 and gradually increase further to 2.3 per cent of GDP over the medium-term forecast horizon. It is
Fiscal Consolidation(percentage points of GDP)
Table 3.4
2014 2015 2016 2017 2018
General Government Balance -2.1 -1.6 -1.1 -0.6 -0.2
One-off and other temporary measures(1) 0.3 0.1 0.1 0.1 0.1
General Government Balance net of One-offs -2.4 -1.7 -1.1 -0.6 -0.3
Output Gap Estimates 0.5 0.5 -0.0 -0.3 -0.4
Cyclically-Adjusted Budget Balance -2.3 -1.8 -1.0 -0.4 -0.0
Structural Balance -2.7 -2.0 -1.1 -0.5 -0.1
Structural Adjustment -0.1 0.7 0.8 0.7 0.4
(1) A plus sign means defi cit-reducing one-off measures
27Malta: Update of Stability Programme 2015 - 2018
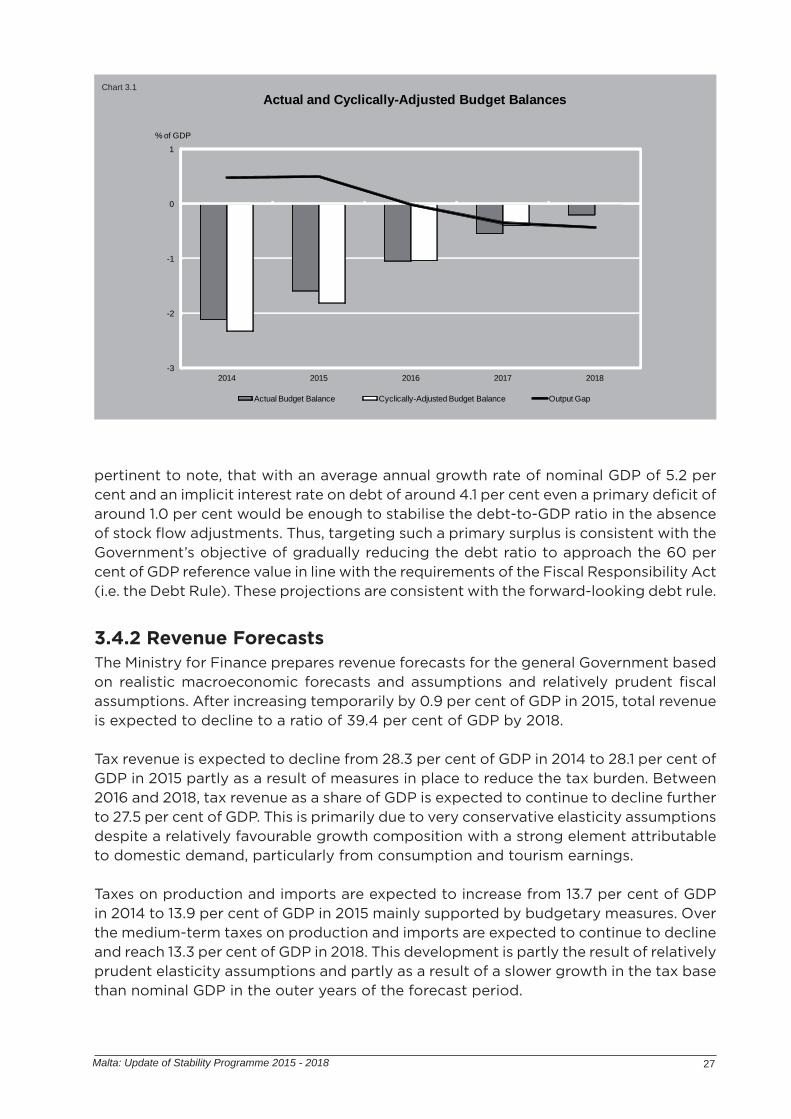
Chart 3.1
-3
-2
-1
0
1
2014 2015 2016 2017 2018
Actual and Cyclically-Adjusted Budget Balances
Actual Budget Balance Cyclically-Adjusted Budget Balance Output Gap
% of GDP
pertinent to note, that with an average annual growth rate of nominal GDP of 5.2 per cent and an implicit interest rate on debt of around 4.1 per cent even a primary defi cit of around 1.0 per cent would be enough to stabilise the debt-to-GDP ratio in the absence of stock fl ow adjustments. Thus, targeting such a primary surplus is consistent with the Government’s objective of gradually reducing the debt ratio to approach the 60 per cent of GDP reference value in line with the requirements of the Fiscal Responsibility Act (i.e. the Debt Rule). These projections are consistent with the forward-looking debt rule.
3.4.2 Revenue ForecastsThe Ministry for Finance prepares revenue forecasts for the general Government based on realistic macroeconomic forecasts and assumptions and relatively prudent fi scal assumptions. After increasing temporarily by 0.9 per cent of GDP in 2015, total revenue is expected to decline to a ratio of 39.4 per cent of GDP by 2018.
Tax revenue is expected to decline from 28.3 per cent of GDP in 2014 to 28.1 per cent of GDP in 2015 partly as a result of measures in place to reduce the tax burden. Between 2016 and 2018, tax revenue as a share of GDP is expected to continue to decline further to 27.5 per cent of GDP. This is primarily due to very conservative elasticity assumptions despite a relatively favourable growth composition with a strong element attributable to domestic demand, particularly from consumption and tourism earnings.
Taxes on production and imports are expected to increase from 13.7 per cent of GDP in 2014 to 13.9 per cent of GDP in 2015 mainly supported by budgetary measures. Over the medium-term taxes on production and imports are expected to continue to decline and reach 13.3 per cent of GDP in 2018. This development is partly the result of relatively prudent elasticity assumptions and partly as a result of a slower growth in the tax base than nominal GDP in the outer years of the forecast period.

28 Malta: Update of Stability Programme 2015 - 2018
Current taxes on income and wealth are expected to register a decline from 14.5 per cent of GDP in 2014 to 14.1 per cent of GDP in 2015 primarily refl ecting the further revisions to the income tax rates. In subsequent years, current taxes on income and wealth are expected to remain relatively stable at 14.0 per cent of GDP.
Social security contributions are expected to remain relatively stable at 7.0 per cent of GDP throughout the forecast period as wages are expected to move roughly in line with nominal GDP. It is worth noting, that no further positive eff ects from the pension reform of 2006 are assumed after 2015.
Property income is expected to rise more modestly than nominal GDP with the share reaching 1.0 per cent of GDP in 2018, down from 1.2 per cent of GDP in 2014. Over the medium-term, other revenue is set to decline from 6.2 per cent of GDP in 2015 to 4.0 per cent of GDP in 2018 as a result of lower EU fund utilisation and as the revenue from the IIP moderates.
3.4.3 Expenditure TargetsOn the basis of the targeted structural eff ort consistent with the national fi scal rules, prudent revenue projections consistent with realistic macroeconomic forecasts and the envisaged budgetary measures, expenditure targets have been set at 44.2 per cent of GDP in 2015. These are projected to decline to 41.7 per cent of GDP in 2016 and to 39.6 per cent of GDP by 2018. It is pertinent to note, that the capital injection in Air Malta in 2015 is temporarily increasing the expenditure ratio in 2015 by 0.3 per cent of GDP. In addition, lower expenditure in EU funded projects (equivalent to a drop of 1.1 per cent of GDP) is behind the sharp drop in the total expenditure ratio in 2016.
Over the four-year period between 2015 and 2018, expenditure (adjusted for the volatility of public investment) excluding interest, cyclical unemployment benefi ts and expenditure matched by EU funded projects net of discretionary revenue measures is expected to rise by an annual average of around 3.0 per cent per annum.
Over the medium-term, the major decline in the expenditure to GDP ratio is set to come from lower EU-fi nanced capital investment projects. The ratio to GDP of gross fi xed capital formation in 2018 is expected to decline to 3.0 per cent of GDP from 4.1 per cent in 2015. Increases expected in projects fi nanced from national sources will not mitigate the decline in EU funded projects in the medium-term. Such declines in outlays correspond to similar decreases in infl ows and thus will have a predominantly neutral impact on the budget balance.
Intermediate consumption as a share of GDP is also set to decline from 6.8 per cent in 2015 to 5.9 per cent in 2018. This decline refl ects the projected decline in capital expenditure classifi ed under intermediate consumption.
The impact of the pension reform initiative legislated in 2006 over the medium-term projections contained in this Programme will be marginal. The allowance for low income households with children, conditional on 95 per cent school attendance introduced in the 2015 Budget will be maintained over 2018. Thus, the conditional children’s allowance is not expected to aff ect the evolution of social benefi ts outlays over the medium-term. This measure is targeted to reduce child poverty and also to reduce school absenteeism.

29Malta: Update of Stability Programme 2015 - 2018
On the other hand, savings in social benefi ts will stem from the Youth Guarantee and the tapering of social benefi ts for persons who are in receipt of unemployment assistance, social assistance and social assistance for single unmarried parents. As a result of these measures and a low infl ationary environment, the ratio of social benefi ts and social transfers is expected to decrease in the medium-term to 11.7 per cent of GDP in 2018 from 12.5 per cent in 2015.
As the evolution of capital transfers follows closely the impact of the restructuring of Air Malta, the capital transfers ratio to GDP is expected to increase further to 1.4 per cent of GDP in 2015 due to a fi nal capital injection. As a result, the ratio of capital transfers to GDP is set to decline to 0.7 per cent of GDP in 2018.
Compensation of employees is expected to decline from 13.0 per cent of GDP in 2015 to 12.3 per cent in 2018, mainly as additional recruitment in the public sector remains contained whilst the growth in the average public sector compensation is expected to lag nominal GDP growth over the medium term.
Subsidies are expected to decline to 1.3 per cent of GDP in 2018 from 1.5 per cent of GDP, mainly due to the projected decline in capital expenditure classifi ed under this component of expenditure in 2018 when compared to 2015.
The ‘other’ component of expenditure, which is mainly explained by other current transfers payable, is expected to reach 2.4 per cent of GDP in 2018 from the ratio of 2.3 per cent in 2015. Moreover, the medium-term projections for other current transfers payable also includes a contingency reserve of 0.1 per cent of GDP which, in line with the Fiscal Responsibility Act 2014, has been established by Government to ensure that unforeseen expenditure or revenue slippages do not jeopardise compliance with the established fi scal rules. If unused, this will contribute towards further improvement in the budget balance and the structural balance beyond the targets included in this Update.
3.5 Debt levels and developmentsGovernment’s core medium-term fi scal objective is that of restoring the trajectory of public fi nances to a sustainable path. This aim involves two main targets: addressing the current imbalance in public fi nances, and reducing the debt-to-GDP ratio at a satisfactory pace. Sustained economic growth and primary surpluses are expected to put Government debt on a downwards trajectory from 68.0 per cent of GDP in 2014 to 61.2 per cent of GDP in 2018, thereby approaching the 60.0 per cent debt-to-GDP target.
Meanwhile, Government’s debt strategy remains that of ensuring that the fi nancing needs of the public sector are met at the lowest possible cost, while simultaneously minimising medium and long-term interest rate risk. The Government’s reliance on short-term funding remains minimal, in line with the dynamics exhibited in recent years. During 2014, short-term debt accounted for 2.6 per cent of total Government debt. The latter is projected to temporarily increase to 5.8 per cent in 2016 due to the fi nancing of the expected increase in redemptions in that year. Thereafter, short-term debt is expected to decline back to reach 2.8 per cent by 2018.
Moreover, the share of maturing stocks in total Government debt is expected to remain rather stable at around 6.6 per cent over the forecast horizon. Indeed, the ratio of
30 Malta: Update of Stability Programme 2015 - 2018
maturing stocks in total Government debt is expected to decline marginally from a level of 6.7 per cent in 2014 to 6.3 per cent in 2015. During 2016, the share of maturing stocks in total Government debt is envisaged to increase to 7.2 per cent. Meanwhile, in the outer years of the forecast horizon, the proportion of maturing stocks in total Government debt is projected to embark on a downwards trajectory, with the ratio reaching 6.6 per cent in 2018.
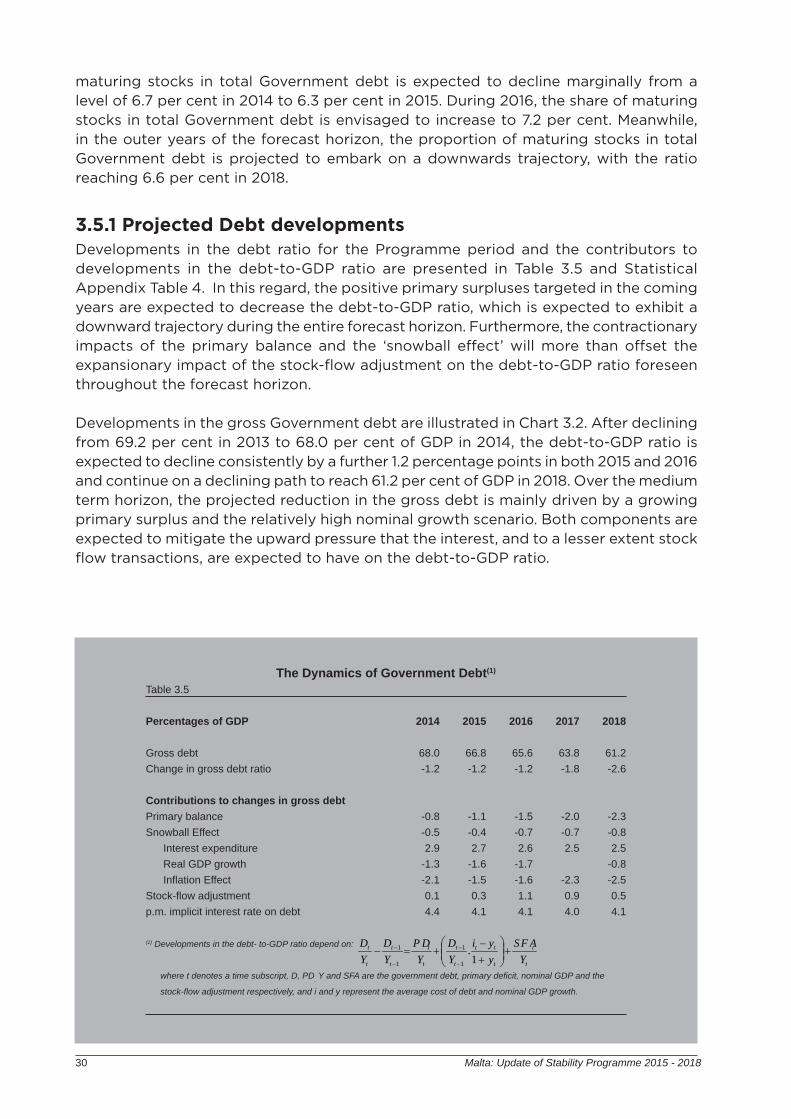
3.5.1 Projected Debt developmentsDevelopments in the debt ratio for the Programme period and the contributors to developments in the debt-to-GDP ratio are presented in Table 3.5 and Statistical Appendix Table 4. In this regard, the positive primary surpluses targeted in the coming years are expected to decrease the debt-to-GDP ratio, which is expected to exhibit a downward trajectory during the entire forecast horizon. Furthermore, the contractionary impacts of the primary balance and the ‘snowball eff ect’ will more than off set the expansionary impact of the stock-fl ow adjustment on the debt-to-GDP ratio foreseen throughout the forecast horizon.
Developments in the gross Government debt are illustrated in Chart 3.2. After declining from 69.2 per cent in 2013 to 68.0 per cent of GDP in 2014, the debt-to-GDP ratio is expected to decline consistently by a further 1.2 percentage points in both 2015 and 2016 and continue on a declining path to reach 61.2 per cent of GDP in 2018. Over the medium term horizon, the projected reduction in the gross debt is mainly driven by a growing primary surplus and the relatively high nominal growth scenario. Both components are expected to mitigate the upward pressure that the interest, and to a lesser extent stock fl ow transactions, are expected to have on the debt-to-GDP ratio.
t
t
t
tt
t
t
t
t
t
t
t
t
YSF A
yyi
YD
YP D
YD
YD
1.
1
1
1
1
The Dynamics of Government Debt(1)
Table 3.5
Percentages of GDP 2014 2015 2016 2017 2018
Gross debt 68.0 66.8 65.6 63.8 61.2Change in gross debt ratio -1.2 -1.2 -1.2 -1.8 -2.6
Contributions to changes in gross debtPrimary balance -0.8 -1.1 -1.5 -2.0 -2.3Snowball Effect -0.5 -0.4 -0.7 -0.7 -0.8
Interest expenditure 2.9 2.7 2.6 2.5 2.5Real GDP growth -1.3 -1.6 -1.7 -0.8Infl ation Effect -2.1 -1.5 -1.6 -2.3 -2.5
Stock-fl ow adjustment 0.1 0.3 1.1 0.9 0.5p.m. implicit interest rate on debt 4.4 4.1 4.1 4.0 4.1
(1) Developments in the debt- to-GDP ratio depend on:
where t denotes a time subscript, D, PD, Y and SFA are the government debt, primary defi cit, nominal GDP and the
stock-fl ow adjustment respectively, and i and y represent the average cost of debt and nominal GDP growth.

31Malta: Update of Stability Programme 2015 - 2018
The other factors contributing to changes in the debt-to-GDP ratio are outlined by the estimated Stock Flow Adjustment (SFA). In 2014, the SFA is estimated to have resulted in a 0.1 percentage point increase in the debt-ratio. This is largely underpinned by the payments made to Government for the accruals accumulated by Enemalta over the past two years, which have helped to decrease the SFA to its low level. The latter was also complemented, to a lesser extent, by a decrease in the cash holdings on the part of Government. After remaining relatively stable in 2015, the SFA is projected to result in an expansion on the debt ratio of 1.1 percentage points in 2016 and 0.9 percentage points in 2017. These expansionary impacts are mainly underpinned by the contribution to a special Malta Government Stocks (MGS) sinking fund. Beyond 2017, stock fl ow transactions are expected to have a rather marginal impact on the debt ratio.
3.5.2 Comparison with the April 2014 Update of the Stability ProgrammeAs illustrated in the Statistical Appendix Table 6, the ratios of general Government debt-to-GDP presented in this Programme are expected to be lower than those presented in the previous Stability Update. The expected improvement is largely attributable to a more favourable macroeconomic outlook for the period 2015-2018 than that envisaged in the preceding Update and a more benefi cial snowball eff ect especially from 2016 onwards.
For 2014, the debt-to-GDP ratio was revised downwards by 1.4 percentage points to 68.0 per cent of GDP. This revision refl ects a more buoyant macro-environment than expected in the earlier update. The debt-to-GDP ratios for 2015 and 2016 were revised downwards by 1.7 and 0.4 percentage points, respectively.
In the 2014 Update, the debt-to-GDP ratio was expected to follow a downwards path from a level of 69.4 per cent in 2014 to a level of 63.9 per cent in 2017. On the other hand, in this Update of the Stability Programme, the debt-to-GDP ratio is estimated to decline to a level of 63.8 per cent by 2017. It is to be noted that the 2014 Update of the
Chart 3.2
0
1
2
3
4
5
40
45
50
55
60
65
70
75
2014 2015 2016 2017 2018
Debt-to-GDP ratio and Debt Growth
Debt-to-GDP ratio Debt Growth
(right scale)
% of GDP %

32 Malta: Update of Stability Programme 2015 - 2018
Stability Programme was based on ESA95 and thus is not strictly comparable with the 2015 Update of the Stability Programme.

4. Sensitivity Analysis


35Malta: Update of Stability Programme 2015 - 2018
4. Sensitivity Analysis Ensuring the accuracy of macroeconomic forecasts in a small and very open economy is a challenging task. Whilst the Maltese economy has proved to be very resilient to the international economic crisis, it is noted that GDP forecast errors are relatively higher for Malta than those observed for larger and less open economies in the European Union (EU). This can be partly explained by the fact that small and open economies such as Malta are more vulnerable to external shocks. Such exposure will typically resonate on the projected growth trajectory. In recognition of the risks surrounding macroeconomic forecasts, this Chapter provides an assessment of forecast uncertainty and the balance of risk surrounding the macroeconomic forecasts in this Programme, in line with the requirements of Council Directive 2011/85/EU.
4.1 The Accuracy of Past Forecasting PerformanceAn analysis carried out by the Economic Policy Department within the Ministry for Finance (EPD)1 exploring past forecast errors and uncertainty in macroeconomic forecast in Malta did not fi nd any systematic bias in the GDP growth projections carried out by the EPD. In addition, forecast accuracy is comparable with that of other institutions which carry out regular forecasts of the Maltese economy, namely the European Commission and the Central Bank of Malta.
4.2 The Balance of RiskTo determine the balance of risk surrounding macroeconomic forecasts, a number of alternative model-based growth projections were carried out. These cover a set of scenarios ranging from exchange rate deprecation to weaker tourism growth. What follows, is a brief description of the alternative scenarios considered in this evaluation.
4.2.1 Model-Based ScenarioThe fi rst scenario is a standard scenario involving the removal of any form of economic judgement underlying the baseline forecast thus, generating a purely model-based forecast. Nevertheless, the forecasts generated are still conditional on a number of exogenous assumptions such as world prices, international economic conditions, interest rates and exchange rates. This scenario is underlined by a stronger GDP growth in 2015 and 2016 and a weaker growth in 2017 and 2018. Consequently, the budget balance improves marginally by 0.2 percentage points and 0.1 percentage points in 2015 and 2016, respectively but deteriorates marginally in 2017 and more strongly (by 0.7 percentage points) in 2018.
4.2.2 Exchange Rate Depreciation ScenarioThe uncertainty surrounding exchange rate movements can have a signifi cant infl uence on an open economy such as Malta. This scenario contemplates a further depreciation of the Euro until it reaches parity with the US$ and 0.7283 with the UK£. This amounts to an 8 per cent depreciation of the Euro throughout the forecast period. This scenario is consistent with a relatively contained impact on 2015 of 0.2 percentage points and a stronger positive impact on real GDP growth of 1.3 percentage points in 2016. As a result, the budget balance improves by 0.2 percentage points in 2015 and 0.6 percentage
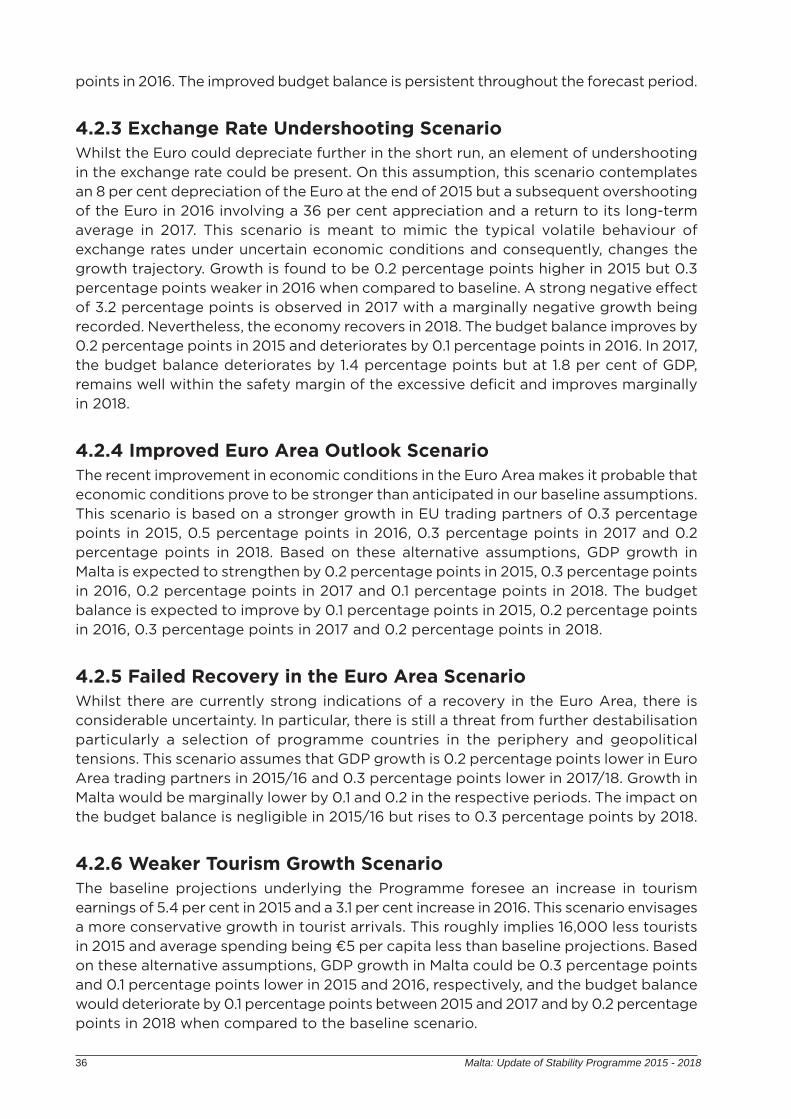
36 Malta: Update of Stability Programme 2015 - 2018
points in 2016. The improved budget balance is persistent throughout the forecast period.
4.2.3 Exchange Rate Undershooting ScenarioWhilst the Euro could depreciate further in the short run, an element of undershooting in the exchange rate could be present. On this assumption, this scenario contemplates an 8 per cent depreciation of the Euro at the end of 2015 but a subsequent overshooting of the Euro in 2016 involving a 36 per cent appreciation and a return to its long-term average in 2017. This scenario is meant to mimic the typical volatile behaviour of exchange rates under uncertain economic conditions and consequently, changes the growth trajectory. Growth is found to be 0.2 percentage points higher in 2015 but 0.3 percentage points weaker in 2016 when compared to baseline. A strong negative eff ect of 3.2 percentage points is observed in 2017 with a marginally negative growth being recorded. Nevertheless, the economy recovers in 2018. The budget balance improves by 0.2 percentage points in 2015 and deteriorates by 0.1 percentage points in 2016. In 2017, the budget balance deteriorates by 1.4 percentage points but at 1.8 per cent of GDP, remains well within the safety margin of the excessive defi cit and improves marginally in 2018.
4.2.4 Improved Euro Area Outlook ScenarioThe recent improvement in economic conditions in the Euro Area makes it probable that economic conditions prove to be stronger than anticipated in our baseline assumptions. This scenario is based on a stronger growth in EU trading partners of 0.3 percentage points in 2015, 0.5 percentage points in 2016, 0.3 percentage points in 2017 and 0.2 percentage points in 2018. Based on these alternative assumptions, GDP growth in Malta is expected to strengthen by 0.2 percentage points in 2015, 0.3 percentage points in 2016, 0.2 percentage points in 2017 and 0.1 percentage points in 2018. The budget balance is expected to improve by 0.1 percentage points in 2015, 0.2 percentage points in 2016, 0.3 percentage points in 2017 and 0.2 percentage points in 2018.
4.2.5 Failed Recovery in the Euro Area ScenarioWhilst there are currently strong indications of a recovery in the Euro Area, there is considerable uncertainty. In particular, there is still a threat from further destabilisation particularly a selection of programme countries in the periphery and geopolitical tensions. This scenario assumes that GDP growth is 0.2 percentage points lower in Euro Area trading partners in 2015/16 and 0.3 percentage points lower in 2017/18. Growth in Malta would be marginally lower by 0.1 and 0.2 in the respective periods. The impact on the budget balance is negligible in 2015/16 but rises to 0.3 percentage points by 2018.
4.2.6 Weaker Tourism Growth ScenarioThe baseline projections underlying the Programme foresee an increase in tourism earnings of 5.4 per cent in 2015 and a 3.1 per cent increase in 2016. This scenario envisages a more conservative growth in tourist arrivals. This roughly implies 16,000 less tourists in 2015 and average spending being €5 per capita less than baseline projections. Based on these alternative assumptions, GDP growth in Malta could be 0.3 percentage points and 0.1 percentage points lower in 2015 and 2016, respectively, and the budget balance would deteriorate by 0.1 percentage points between 2015 and 2017 and by 0.2 percentage points in 2018 when compared to the baseline scenario.

37Malta: Update of Stability Programme 2015 - 2018
4.2.7 Stronger Manufacturing ScenarioBased on meetings with operators in the manufacturing sector, a stronger than anticipated recovery and a weaker price erosion in specifi c sub-segments was seen as a plausible scenario compared to the rather prudent scenario foreseen in these projections. Based on these alternative assumptions, GDP growth could strengthen by 0.2 percentage points in 2015 and 2016 and the budget balance improve by 0.1 percentage points in 2015, 0.2 percentage points in 2016 and 2017 and 0.1 percentage points in 2018.
4.2.8 Weak Manufacturing ScenarioWhilst major operators remain upbeat about the prospects, risks in specifi c sub-segments of manufacturing remain. Thus, a more prudent scenario (though not symmetrical to the previous shock) than the one contemplated in the baseline was also considered. Based on these alternative assumptions, GDP growth could weaken temporarily by 0.1 percentage points in 2015 and recover by 0.1 percentage points in 2016 with the budget balance recording no major eff ect.
4.2.9 Low Energy Prices in the Commercial Sector ScenarioIn March 2015, Government announced a 25 per cent reduction in utility prices for the commercial sector. This could have an impact on the future profi tability of the private sector and therefore stimulate private sector investment. Whilst such a scenario is not contemplated in the baseline scenario (the model used is primarily demand driven), use was made of the QUEST model to try to replicate the eff ects of such a reduction through a dynamic general equilibrium framework. This suggests that private investment could be higher than the baseline projection by €52 million in 2016, €72 million in 2017 and €80 million in 2018. These fi gures were subsequently incorporated into the model used in these macroeconomic projections. This translates into a higher GDP growth of 0.1 percentage points in 2016 and 2017 with the impact being limited by leakages in the form of imports. The budget balance improves marginally by 0.1 percentage points in the corresponding years.
4.2.10 Quantitative Easing ScenarioIn view of eff orts by the European Central Bank aimed at stimulating long-term investment through quantitative easing, a scenario purporting a decline in long-term interest rates by 0.5 percentage points from 2016 was carried out. This stimulates investment by 10 percentage points in 2016 and GDP growth by 0.3 percentage points. The eff ect on growth is shown to be temporary although this is attributable mainly to the structure of the model which in essence is not a general equilibrium model. The budget balance improves by 0.2 percentage points in 2016/17 and by 0.1 percentage points in 2018 when compared to the baseline scenario.
4.2.11 Loss in Market Share in Services ScenarioFinally, in view of a measure of uncertainty surrounding the growth projections of a major service-oriented sector in the Maltese economy, a scenario purporting a loss in export market share in this industry was carried out. This is equivalent to a negative shock to exports of the sector by 0.7 per cent of GDP in 2015 and an additional shock, equivalent to the fi rst in 2016. This scenario reduces GDP growth by 0.4 percentage points in 2015 and 2016. The budget balance deteriorates by 0.1 percentage points in

38 Malta: Update of Stability Programme 2015 - 2018
2015, 0.3 percentage points in 2016, 0.2 percentage points in 2017 and 0.3 percentage points in 2018.
4.2.12 Stronger Medium-Term Private Investment ScenarioThe baseline projections expect a very strong growth in investment in 2015/16, primarily due to the heavy investment in the energy sector and the health sector. Nevertheless, there are a number of major projects which have a strong probability of being implemented in the outer year of the forecast period but are yet to be included in the baseline projections. These could include large-scale construction projects, land reclamation projects, a logistics hub in the South of Malta and various investments in the education sector. This scenario increases investment by around 2.5 per cent of GDP in 2017 and 2.4 per cent of GDP in 2018. This increases GDP growth by 0.5 percentage points and 0.4 percentage points in 2017 and 2018, respectively.
4.3 Uncertainty and the Balance of Risk Underlying the Macroeconomic Projections The uncertainty surrounding the macroeconomic projections is based on the past forecast error variance of GDP. This is equal to 1.7 for the current year forecast, 1.5 for the one-year-ahead forecast, 2.7 for the two-year-ahead forecast and 3.4 for the three-year-ahead forecast. The balance of risk is based on the Pearson skewness indicator of the model generating alternative forecasts for GDP documented above. Chart 4.1 exhibits representation of the uncertainty and the balance of risk surrounding the macroeconomic forecasts presented in this Programme.
Chart 4.1
-4.0
-3.0
-2.0
-1.0
0.0
1.0
2.0
3.0
4.0
5.0
6.0
7.0
8.0
9.0
10.0
-4.0
-3.0
-2.0
-1.0
0.0
1.0
2.0
3.0
4.0
5.0
6.0
7.0
8.0
9.0
10.0
2008 2009 2010 2011 2012 2013 2014 2015 2016 2017 2018
Fan Chart with GDP Growth Forecasts
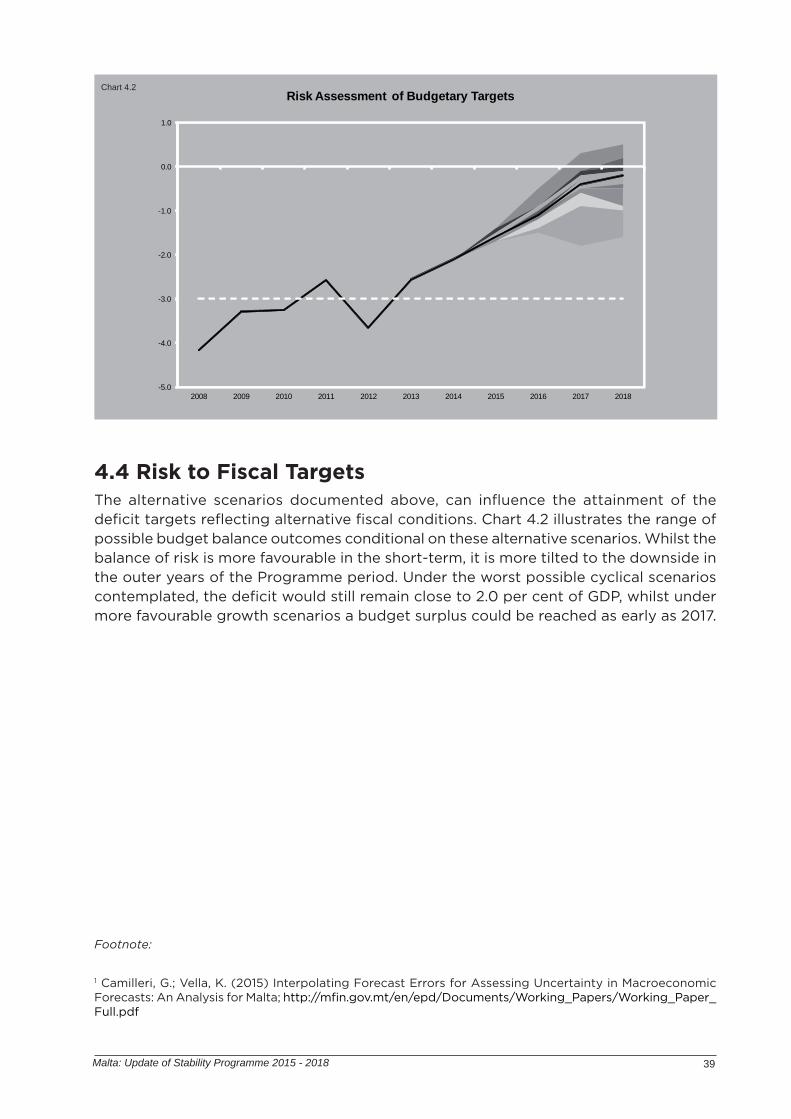
39Malta: Update of Stability Programme 2015 - 2018
4.4 Risk to Fiscal TargetsThe alternative scenarios documented above, can infl uence the attainment of the defi cit targets refl ecting alternative fi scal conditions. Chart 4.2 illustrates the range of possible budget balance outcomes conditional on these alternative scenarios. Whilst the balance of risk is more favourable in the short-term, it is more tilted to the downside in the outer years of the Programme period. Under the worst possible cyclical scenarios contemplated, the defi cit would still remain close to 2.0 per cent of GDP, whilst under more favourable growth scenarios a budget surplus could be reached as early as 2017.
Footnote:
1 Camilleri, G.; Vella, K. (2015) Interpolating Forecast Errors for Assessing Uncertainty in Macroeconomic Forecasts: An Analysis for Malta; http://mfi n.gov.mt/en/epd/Documents/Working_Papers/Working_Paper_Full.pdf
Chart 4.2
-5.0
-4.0
-3.0
-2.0
-1.0
0.0
1.0
2008 2009 2010 2011 2012 2013 2014 2015 2016 2017 2018
Risk Assessment of Budgetary Targets


5. Sustainability of Public Finances


43Malta: Update of Stability Programme 2015 - 2018
5. Sustainability of Public FinancesThis Chapter provides an assessment of Malta’s long-term sustainability of public fi nances for the period 2013-2060 on the basis of the projections of the Ageing Working Group (AWG) within the Economic Policy Committee (EPC) and the population projections EUROPOP2013 carried out by Eurostat. This Chapter covers pension expenditure in Malta and the other age-related expenditure items of health, long-term care, unemployment and education expenditure projections. These long-term projections provide an indication of the timing and scale of economic changes that would result from an ageing population in a ‘no-policy change’ scenario. The projections show where, when, and to what extent, ageing pressures will accelerate as the baby-boom generation retires and the average life span continues to increase. Hence, the projections are helpful in highlighting the immediate and future policy challenges posed for governments by demographic trends.
5.1 Long-Term Budgetary Projection Results for MaltaThis section provides an analysis of the long-term sustainability of public fi nances for Malta for the period 2013-2060 on the basis of commonly agreed assumptions for the EU Member States under the AWG. The modelling work for pension outlays projections refl ects as strictly as possible the pension rules, both current as well as those applying in future following the reform law enacted during December 2006. The pension reforms not incorporated in the projections refl ect: (i) the launching of the Third Pillar pension scheme, referred to as the Personal Retirement Scheme, and which is being supplemented by another scheme, the Individual Savings Account (ISA). Both schemes are optional and are intended to encourage low-income earners to save more for their retirement and safeguard their future quality of life; and (ii) the Budget for 2015 announced that in the case of individuals who are currently in employment and by the time they reach their retirement age would not have enough contributions to qualify for a Contributory Retirement, will be given the opportunity to pay back a maximum of fi ve years of contributions to qualify for a pension once they retire.
The model used in projecting pension expenditure is the World Bank’s Pension Reform Options Simulation Toolkit (PROST) 15. Statistical Appendix Table 7 shows the expenditure components of the long-term budgetary projections as a percentage of GDP for the period 2013-2060 and the assumptions used.
5.1.1 New Demographic ProjectionsEUROSTAT have published the results of the updated population projection exercise, EUROPOP2013. These results were used as a primary input in the long-term age-related expenditure projections used by the European Commission in the assessment of the sustainability of public fi nances. For Malta, this new set of population projections led to signifi cant diff erences in terms of the trajectory as well as the dynamics of population changes. As shown in Table 5.1, total population is projected to increase to around 476,000 by 2060, under the new demographic projections, compared to the absolute decline to around 387,000 in the previous round of projections. Furthermore, the old-age dependency ratio is expected to reach 50.9 per cent in 2060, around 5 percentage points lower than that projected in EUROPOP 2010. The revised demographic projections have resulted in a relatively smaller increase of 2.0 percentage points of the GDP over the entire projection period in the age-related expenditure relative to the 2012 Ageing

44 Malta: Update of Stability Programme 2015 - 2018
Report. These revisions were in line with similar revisions to the demographic projections of other EU Member States.
5.1.2 Assumptions AppliedIn projecting pensions, the demographic assumptions refl ect EUROPOP2013 projections by Eurostat, while the macroeconomic assumptions refl ect the commonly agreed methodology in the EPC. The assumptions used include the real GDP growth rate, labour productivity (growth rate per hour), infl ation rate, labour participation rate by age and gender, unemployment rate by age and gender, population (EUROPOP2013), fertility rate by age, mortality rate by age and gender, and net migration by age and gender. A number of variables included in the assumptions as provided by the AWG-EPC, were not incorporated in the PROST workings for the pension projections, primarily due to the fact that such variables are not required as PROST inputs. Accordingly, the budgetary projections for Malta covering the period up to 2060 include the following two main sets of assumptions:
As regards the demographic evolution, life expectancy at birth for men is assumed to rise by 6.4 years over 2013 to reach 85.1 years in 2060, whilst in the case of women it is expected to reach 89.1 years, an increase of 6.3 years over 2013. This implies that despite some convergence, female life expectancy in 2060 is projected to remain 4 years higher than that of males. Meanwhile, life expectancy at 65 years for males is projected to increase by 4.3 years between 2013 and 2060, while for women it is projected to increase by 4.4 years during this period. The fertility rate is projected to increase from 1.4 in 2013 to around 1.8 in 2060. The survivor rate for men aged over 65 years is projected to increase from 87.5 years in 2013 to 93.9 years in 2060, while that for women is projected to increase from 91.6 years in 2013 to 96.2 years in 2060. Following a similar upward trend, the survivor rate for men aged over 80 years, is projected to increase from 58.5 years in 2013 to 77.8 years in 2060, and that for women, is projected to increase from 72.5 years in 2013 to 86.9 years in 2060. Another important variable in the evolution of the demography is net migration, which is projected to decline from 1,600 in 2013 to 1,146 in 2060. As a share of total population, net migration infl ows to
EUROPOP2010 and EUROPOP2013 Population Projections
2013 2020 2030 2040 2050 2060
EUROPOP2010Total population 412,637 415,664 416,631 407,057 396,649 386,935Old-age dependency ratio (65+ yrs/15-64 yrs) 25.3 32.2 39.3 40.4 46.9 55.9
EUROPOP2013Total population 422,556 439,341 456,792 462,995 468,528 476,383Old-age dependency ratio (65+ yrs/15-64 yrs) 25.8 33.2 40.5 40.8 45.0 50.9
Note: Figures may not add up due to the rounding
Source: Eurostat
45Malta: Update of Stability Programme 2015 - 2018
Malta is projected to decline from 0.4 per cent in 2013 to 0.2 per cent in 2060. Net migration shall represent an important factor in determining developments in total population during the projection period as indicated by the ratio of net migration over population change, which is projected to increase from 0.5 per cent in 2013 to 3.6 per cent in 2040 and to decline to 1.7 per cent in 2060.
With respect to macroeconomic assumptions, potential GDP growth rate is assumed to increase from 1.7 per cent in 2013 to around 2 per cent by 2020, thereby declining to 1.8 per cent by 2040. It is assumed to decline further to 1.4 per cent by 2060. The unemployment rate (15-64 years) is assumed to increase marginally from 6.5 per cent in 2013 to 6.7 per cent in 2060. The female participation rate (15-64 years) is assumed to increase from 50.2 per cent in 2013 to 66.9 per cent by 2050 and to remain relatively stable at around that level by 2060. The male participation rate (15-64 years) is assumed to increase from 79.7 per cent in 2013 to 84.5 per cent by 2030 and to decline to 83.4 per cent by 2060.
5.1.3 Demographic DevelopmentsPopulation projections (EUROPOP2013) indicate that total population in Malta is projected to rise from around 423,000 in 2013 to around 457,000 in 2030, and to reach around 476,000 by 2060. As shown in Table 5.2, the age structure of the population is projected to change signifi cantly. While the share of the very young people (aged 0-14 years) in the total population is projected to hover around the 15 per cent share, the share of the people aged 65+ is projected to increase from 17.5 per cent to 28.5 per cent.
Total Population, by Selected Age GroupsTable 5.2
Age 2013 2020 2030 2040 2050 2060
0-14 yrs 61,182 65,365 70,157 67,451 69,839 73,39715-64 yrs 287,317 280,771 275,096 280,827 274,938 267,09565+ yrs 74,057 93,205 111,540 114,717 123,751 135,892Total 422,556 439,341 456,792 462,995 468,528 476,383
Share (%)
0-14 yrs 14.5 14.9 15.4 14.6 14.9 15.415-64 yrs 68.0 63.9 60.2 60.7 58.7 56.165+ yrs 17.5 21.2 24.4 24.8 26.4 28.5
Ratio
Youth dependency ratio (0-14 yrs/15-64 yrs) 21.3 23.3 25.5 24.0 25.4 27.5Old-age dependency ratio (65+ yrs/15-64 yrs) 25.8 33.2 40.5 40.8 45.0 50.9Total dependency ratio 47.1 56.5 66.0 64.9 70.4 78.4Ageing of the Aged Ratio (80+ yrs/65+ yrs) 21.7 23.1 31.8 38.9 35.6 36.7Support ratio (15-64 yrs/65+ yrs) 3.9 3.0 2.5 2.4 2.2 2.0
Note: Figures may not add up due to the rounding
Source: EUROPOP2013, Eurostat
46 Malta: Update of Stability Programme 2015 - 2018
From an economic perspective, the most signifi cant change in demography concerns the working-age population (aged 15-64 years), which refl ects the share of the population that will bear the fi nancial ‘burden’ of the elderly. From a share of 68.0 per cent in 2013, this ratio is projected to subsequently fall to 60.2 per cent by 2030 and to reach 56.1 per cent in 2060. By contrast, the share of the elderly population (aged 65+ years) in total population is projected to increase steeply from 17.5 per cent in 2013 to 28.5 per cent by 2060.
The dynamics of the ageing process could be better appreciated by analysing the developments in the relative share of the elderly to the working-age population. These dependency ratios relate the number of individuals that are likely to be “dependent” on the support of others for their daily living – youths and the elderly – to the number of those individuals who are capable of providing such support. Key indicators of age dependency presented in Table 5.2 are the: youth-dependency ratio (for individuals aged less than 15 years), old-age-dependency ratio (for persons aged 65 years and more) and the ageing of the aged ratio. The youth dependency ratio (0-14 year bracket as a percentage of the 15-64 year bracket) is expected to increase from 21.4 per cent in 2013 to 25.5 per cent in 2030 and to hover around that level until 2050, and increase to 27.5 per cent by 2060. The old-age dependency ratio (65+ year bracket as a percentage of the 15-64 year bracket) is projected to increase consistently from 25.8 per cent in 2013 to 50.9 per cent in 2060, an increase of 25.1 percentage points. Thus, by 2060, the total dependency ratio, which is the combined burden of these two components of the economically active population, will amount to 78.4 per cent. Meanwhile, the ageing of the aged ratio (80+ age bracket as a percentage of the 65+ age bracket), is projected to increase from 21.7 per cent in 2013 to 38.9 per cent in 2040, decline to 35.6 per cent by 2050 and increase to 36.7 per cent by 2060. As a result of these demographic developments, the support ratio (persons in the 15-64 years bracket as a proportion of persons aged 65+) is expected to decline from 3.9 per cent in 2013 to 2 per cent in 2060. This means that while in 2010 there were around 4 persons of working-age for every person that reached pension age, by 2060 this ratio is projected to decrease to around 2 persons of working-age for every person of pensionable age.
5.1.4 Age-Related Public ExpenditureAge-related spending including pensions, health care, long-term care, education and unemployment benefi ts in Malta is projected to increase by 6.6 percentage points of GDP over the period 2013-2060 (as opposed to an increase of 8.6 percentage points in the 2012 Ageing Report). Chart 5.1 shows the age-related public expenditure as a share of GDP for this projection period.
Public expenditure on pensions is presently the most important age-related government expenditure item, and is projected to remain so also in the future. The pension projection exercise covers contributory and non-contributory old-age pension paid under the social security scheme. The coverage of pension schemes includes also the expenditure on non-contributory old-age pension together with the share paid on the contributory and non-contributory bonus payment. At present, private pensions play a rather minor role as regards pension provision for old-aged persons. Over the projection period, pension expenditure is projected to increase from 9.6 per cent of GDP in 2013 to 12.8 per cent of GDP by 2060, an increase of 3.2 percentage points (as opposed to an increase of 5.7 percentage points in the 2012 Ageing Report). The increase in pension expenditure is
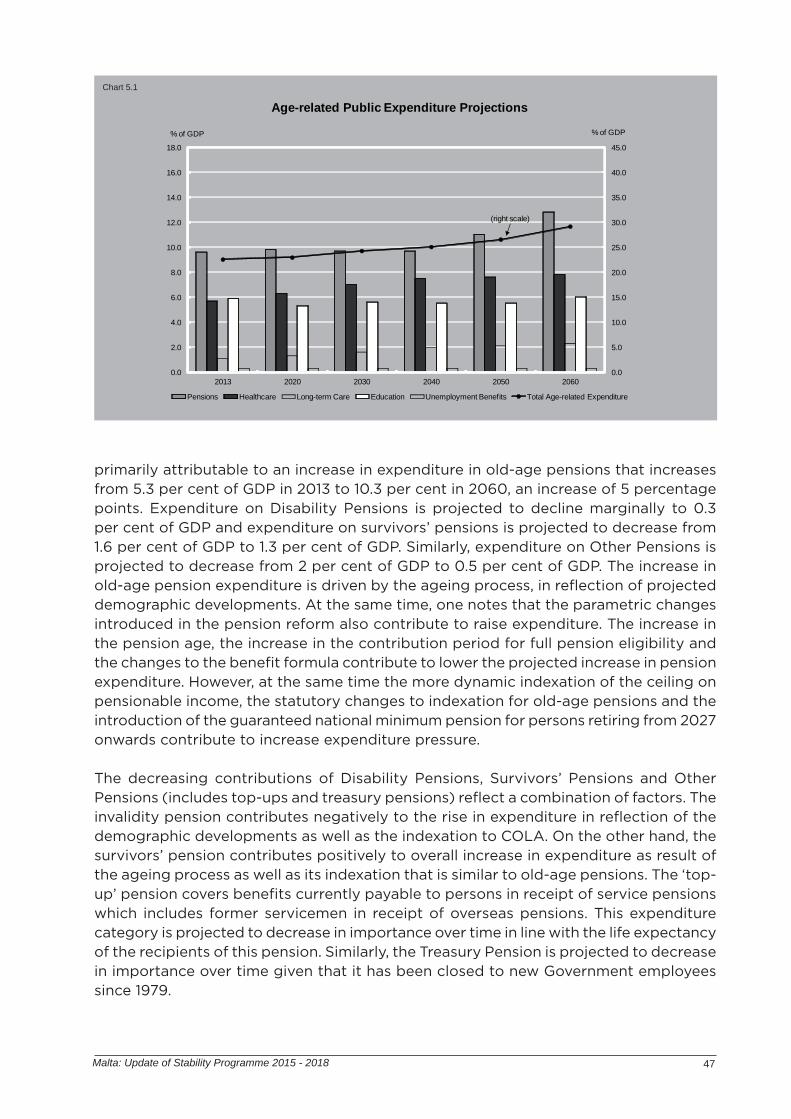
47Malta: Update of Stability Programme 2015 - 2018
primarily attributable to an increase in expenditure in old-age pensions that increases from 5.3 per cent of GDP in 2013 to 10.3 per cent in 2060, an increase of 5 percentage points. Expenditure on Disability Pensions is projected to decline marginally to 0.3 per cent of GDP and expenditure on survivors’ pensions is projected to decrease from 1.6 per cent of GDP to 1.3 per cent of GDP. Similarly, expenditure on Other Pensions is projected to decrease from 2 per cent of GDP to 0.5 per cent of GDP. The increase in old-age pension expenditure is driven by the ageing process, in refl ection of projected demographic developments. At the same time, one notes that the parametric changes introduced in the pension reform also contribute to raise expenditure. The increase in the pension age, the increase in the contribution period for full pension eligibility and the changes to the benefi t formula contribute to lower the projected increase in pension expenditure. However, at the same time the more dynamic indexation of the ceiling on pensionable income, the statutory changes to indexation for old-age pensions and the introduction of the guaranteed national minimum pension for persons retiring from 2027 onwards contribute to increase expenditure pressure.
The decreasing contributions of Disability Pensions, Survivors’ Pensions and Other Pensions (includes top-ups and treasury pensions) refl ect a combination of factors. The invalidity pension contributes negatively to the rise in expenditure in refl ection of the demographic developments as well as the indexation to COLA. On the other hand, the survivors’ pension contributes positively to overall increase in expenditure as result of the ageing process as well as its indexation that is similar to old-age pensions. The ‘top-up’ pension covers benefi ts currently payable to persons in receipt of service pensions which includes former servicemen in receipt of overseas pensions. This expenditure category is projected to decrease in importance over time in line with the life expectancy of the recipients of this pension. Similarly, the Treasury Pension is projected to decrease in importance over time given that it has been closed to new Government employees since 1979.
Chart 5.1
0.0
5.0
10.0
15.0
20.0
25.0
30.0
35.0
40.0
45.0
0.0
2.0
4.0
6.0
8.0
10.0
12.0
14.0
16.0
18.0
2013 2020 2030 2040 2050 2060
Age-related Public Expenditure Projections
Pensions Healthcare Long-term Care Education Unemployment Benefits Total Age-related Expenditure
% of GDP
(right scale)
% of GDP
48 Malta: Update of Stability Programme 2015 - 2018
Another important contributor to the increase in age-related spending is healthcare. Projections indicate that Malta is now expected to record an increase of 2.1 percentage points of GDP in health care (compared to 2.6 percentage points in the 2012 Ageing Report) and an increase of 1.2 percentage points of GDP in long-term care (as opposed to an increase of 0.8 percentage points in the 2012 Ageing Report) during the period 2013-2060. This increased spending on health care and long-term care is primarily due to an ageing society and an increase in life-expectancy at birth over the projection period. Government is aware of the challenges posed by these demographic developments on healthcare and hence it is actively working on implementing a holistic strategy that will ensure the long-term sustainability of the health sector.
On the other hand, public spending on unemployment benefi ts as a share of GDP is projected to remain unchanged at 0.3 per cent between 2013 and 2060. Additionally, the 2015 projection exercise aimed at assessing the impact of demographic changes per se on the general government education expenditure. The results showed that education spending is projected to increase by 0.1 percentage points of GDP during the projection period (compared to a decrease of 0.6 percentage points of GDP in the 2012 Ageing Report).
5.2 Focus on Pension ReformsAlthough the new projections present a relatively better outlook with regards to pension expenditure as well as pension sustainability and adequacy, when compared to the previous projections presented in the 2012 Ageing Report, the projected demographic developments will still cause the outlays on pensions paid by Government to rise over the coming decades. Consequently, this is expected to lead to a worsening in the balance of the current system. It is to be noted that in December 2006, the House of Representatives adopted a series of parametric reforms (Act No. XIX of 2006) to the defi nition of pension age, retirement before pension age, the full rate of two-thirds pension, calculation formula, the maximum pensionable income and the crediting of contributions as provided for under the preceding legislative framework. The reforms were aimed at enhancing the sustainability of the pension system whilst improving the adequacy of the pension enjoyed by retirees in the future.
As a continuation of the pension reform process, in 2010, the Pensions Working Group (PWG) was tasked with the responsibility to carry out a Report “reviewing Part V of [the Social Security Act] ... with a view of achieving further adequacy, sustainability and social solidarity” as required by Article 64B of the Social Security Act. During 2013, the Government of Malta has expressed its commitment for the continuation of the pension reform process in Malta. A Joint Pensions Working Group (PWG) – the Pensions Strategy Group (PSG) – between the Ministry for the Family and Social Solidarity (MFSS) and the Ministry for Finance, was set up to review the work carried out by the PWG, in particular the recommendations outlined in the Post-Consultation Report submitted to Government in August 2012. Furthermore, it has been tasked to draw up a holistic strategy aimed at addressing the adequacy and sustainability of pensions in Malta and develop a communications strategy directed towards raising the level of public awareness on pension issues in Malta and the need to ensure that future pension incomes are adequate in order to sustain a high standard of living in retirement.

49Malta: Update of Stability Programme 2015 - 2018
The Pension Strategy Group has presented its report to Government on pension reforms and a presentation with the proposals is expected to be delivered shortly to Cabinet, after which it will be published for public consultation. The Government has also recently announced that the reform process shall be prioritised in the second half of this year and the pension reform strategy is expected to be adopted during the third quarter of 2015.
It is to be noted that on the 19th of February 2015, the Prime Minister delivered a policy speech whereby the following reform principles were underscored:
1. A clear defi nition of the objectives of the Maltese pension system is to be established, in particular, a defi nition of the exact nature of the poverty alleviation function of the system and optimisation of the eff ectiveness of the current social assistance programmes.
2. A strong active employment policy which is already being addressed through increasing female participation, reducing dependency on social benefi ts and youth training.
3. An adequate state pension that is not necessarily the only source of retirement income. Individuals should be provided with the opportunity to improve their situation, while at the same time those less able to do so are to be provided with the necessary means to secure an adequate standard of living.
4. A fair balance needs to be sought between contributions and benefi ts across generations.
5. An evolving pension system that responds to long-term developments.
In principle, the Government is not in favour of forced saving, especially with regards to low-income families. Hence, the Government is implementing a multi-tier strategy with the state Pay As You Go (PAYG) and the voluntary third pillar pensions which aim to address the poverty relief, insurance and consumption smoothing objectives.
Following the entry into force of the Retirement Pensions Act on 1st January 2015, fi scal incentives were introduced with the aim of sustaining the policy objective of diversifying retirement income through the take up of voluntary third pillar pensions.
Furthermore, the Ministry for Finance has been studying the possibility of making use of equity linked with real estate, which is in view of the fact that most pensioners are home owners and have invested most of their incomes to acquire this rather illiquid asset. The Government wants to ensure that pensioners will be able to access this form of wealth, without necessarily losing ownership completely.
In terms of adequacy, the Budget for 2015 announced that individuals who are currently in employment and by the time they reach their retirement age would not have enough contributions to qualify for a Contributory Retirement Pension, will be given the opportunity to pay back a maximum of fi ve years of contributions to qualify for a pension once they retire.


6. Quality of Public Finances


53Malta: Update of Stability Programme 2015 - 2018
6. Quality of Public Finances
The Maltese Government is committed to continue improving the quality of public fi nances. To this end, the Government has directed its eff orts towards ensuring a more effi cient use of public fi nances, whilst concurrently reviewing its expenditures to focus more on productive spending. This enables it to be in a better position to face the challenges presented amongst others, by demographic developments and the continual improvement in the skill level of the labour force. The Government is also committed to continue improving the level of effi ciency of the taxation system.
Box 6.1
The Quality of Public Finances
The attainment of the policy objective of long-term economic growth requires that some prerequisites are met. These prerequisites, drawn from the works of Afonso et al. (2005)1 and Barrios et Schaechter (2008), can be summarised in four requirements. Firstly, one must take into consideration the fact that public fi nances impact the functioning of markets as well as the business environment, which together with the institutional environment can be instrumental for long-term economic growth. The composition and effi ciency of public expenditure also feature as a prerequisite to growth. Indeed, both theoretical and empirical research indicate that public expenditure can promote growth if it is geared towards investment, be it in human capital (through health and education), research and development or public infrastructure. On the other hand, the structure and effi ciency of revenue streams is another important indicator of a high quality fi scal system. Since it is commonly accepted that the taxation structure affects the demand and supply of labour, the incentive to invest, risk taking as well as human capital formation it is essential that taxation systems are as effi cient, simple and transparent as possible so as not to create undue distortions. Finally, sound and sustainable fi scal positions which promote macroeconomic stability is another precondition for sustainable growth. In this context, while one must keep in mind the issue of endogeneity of debts and defi cits to growth, one cannot overlook the negative relationship that exists between public debt and growth.
Government Expenditure
Government expenditure has the capacity to stimulate growth, yet one needs to keep in mind that not all expenditure has the same productive capacity. In general, for government expenditure to be considered as productive, it must have an impact on the private sector production function. However academic literature fails to achieve a consensus on a precise defi nition of what productive government expenditure is; partly due to the country specifi c considerations that one needs to keep in mind when analysing such a topic. Bayraktar and Moreno-Dodson (2011)2 identifi ed general public services, infrastructure, defence, education, health, housing, transportation, and communications as government expenditures which have a positive impact on the private production function. In other words, such government spending stimulates expansion in the private sector thus promoting long-term economic growth. On the other hand, in the same paper Bayraktar and Moreno-Dodson identify social security and welfare; recreation; fuel and energy; agriculture, forestry, fi shing and hunting, mining and mineral resources, manufacturing and construction; as well as other economic affairs and services to be unproductive.
54 Malta: Update of Stability Programme 2015 - 2018
With the aim of ensuring the proper identifi cation of productive factors within government spending one must take into account for country specifi c considerations to make up for the heterogeneity of different countries and their respective economies. In this context education, health, housing and community amenities as well as environmental protection are deemed to have a positive impact on the Maltese private sector function, and thus considered as productive expenditure. In contrast, and in line with the Brayaktar and Moreno Dodson model, social benefi ts as well as social transfers in kind are not considered as productive expenditure.
Government Revenue
A country's tax system affects its government revenues but also has broader economic and societal implications. Indeed, the design of the tax system is imperative for the attainment of the often contradictory objectives of sustainability, growth and fairness, which have become even more important in the aftermath of the most recent fi nancial and economic crisis. With some trade-offs, governments can ensure stable public fi nances, boost growth, employment and competitiveness, and contribute to a fair distribution of income by changing the tax structure in a balanced way and by improving the effectiveness and effi ciency of the system.
Shifting away from labour taxation
The structure of the tax system can have an impact on national income by affecting labour utilisation, labour productivity, or both. Labour taxes affect labour supply through both the decision to work and average hours worked. Labour taxes also infl uence fi rms’ cost of labour – lower taxes bring down labour costs and fi rms respond by increasing labour demand.3
One must be mindful however, that in an age where the great majority of countries are facing austerity, fi scal stability must be maintained. To this end, the fall in government revenue resulting from the reduction in labour taxation, must be replaced by some other source of income or reduced from expenditure. Several different international fora have thus for the past years been advocating a shift in the taxation system to focus more on revenue stemming from indirect taxes rather than from direct taxation.
Broadening tax bases and simplifying tax systems
In general, a broad tax base combined with low tax rates is preferable as it is less distortive than narrow bases combined with high tax rates.
Moreover, narrow tax bases are often symptomatic of complex tax systems with various loopholes, whose effects are diffi cult to assess. Indeed, an effi cient tax system should not be diffi cult to compute and maintain. Thus it should be simple both for the administration’s sake as well as for the individual tax payer’s sake. Simplifi cation of the taxation structures can reduce the errors, being wilful or otherwise, in the computation system.
Tax Governance
The main aim of tax authorities is to collect the full amount of taxes and duties that are payable by law. For a variety of reasons, ranging from deliberate fraud to accidental error, the amount of
55Malta: Update of Stability Programme 2015 - 2018
tax actually paid in a given year does not match the theoretical revenue.
Footnotes:
1 A. Afonso, W. Ebert, L. Schuknecht and M. Thone, 2005, Quality of public fi nances and growth European Central Bank, working paper no. 4382 N. Bayraktar and B. Moreno Dodson, 2011, How can public spending help you grow? – An empirical analysis for developing countries, Policy Research Working Paper 5367 (The World Bank, Poverty Reduction and Economic Management Network, Offi ce of the Vice president)3 Å. Johansson, C. Heady, J. Arnold., B. Brys and L. Vartia, 2008, Tax and Economic Growth, OECD Economics Department, OECD Publishing, Working Paper No. 620
6.1 Improving the Quality of Public Expenditure
6.1.1 Enhancing the Effi ciency and Effi cacy of ExpenditureThe Government is committed to keeping public expenditure in check through improved effi ciency in public spending. A Comprehensive Spending Review is ongoing, that aims to ensure the achievement of improved effi ciency in public spending, reduce waste and ensure more value for money. The Spending Review provides a methodology for zero budgets, line by line analysis and connecting expenditure inputs to policy outputs. This should ensure that spending refl ects changing priorities and changing needs. The Comprehensive Spending Review was conducted in all 14 Ministries focusing on programmes and initiatives with the aim of starting to link outputs to expenditure for all line items. The fi rst review was completed in 2014.
In February 2014, the Government started an in depth Comprehensive Review of Social Security expenditure. The reason behind this review was that while social protection systems promote a more equitable and inclusive society, and consequently aid in reducing poverty, such systems may also give rise to unintended consequences such as dependency and passivity. In addition, in some instances, the system has proven to be vulnerable to fraud and other abuse. The Review was based on a series of hearings with stakeholders. A report was then presented to the Prime Minister at the end of May 2014. This was the framework upon which the social security reforms announced in the 2015 Budget were based.
Through enacted policy initiatives, the Government will ensure that individuals face clear incentives to work and contribute to society and steer them away from dependency. The Maltese Social Security Act was amended to permit the tapering of social benefi ts in order to allow for the gradual reduction of benefi t income upon entry into the labour market for those mothers who have been on social benefi ts for long periods.
Another budget measure, aimed at reducing unnecessary dependencies on the social security system and hence enhancing effi ciency of public expenditure, was to shift young people on social assistance under the age of 23 to the Youth Guarantee Programme, proposed as an ESF co-fi nanced project. Through the initiatives listed

56 Malta: Update of Stability Programme 2015 - 2018
Chart 6.1
0
2
4
6
8
10
12
14
16
Gen
eral
pub
lic
serv
ices
Def
ence
Pub
lic o
rder
and
sa
fety
Eco
nom
ic a
ffai
rs
Env
ironm
enta
l pr
otec
tion
Hou
sing
and
co
mm
unity
am
eniti
es
Hea
lth
Rec
reat
ion,
cul
ture
an
d re
ligio
n
Edu
catio
n
Soc
ial p
rote
ctio
n
% of GDP
Functional Classification of General Government Expenditure as a % of GDP
2010 2013 2018
in the Youth Guarantee Implementation Plan, the Maltese Government is providing a second opportunity to individuals with a low level of education and is helping them enter the labour market with the aim of retaining their employment and advance further in the employment ladder. The expected results are two-fold. First, there will be no new infl ows of people under 23 entering social assistance in 2016. Secondly, individuals will be exposed to training and work exposure which will yield to better productive employment opportunities.
According to data collated in March 2015, some 450 single parents have found employment and shifted to tapered benefi ts. This means that the government is saving some 35 per cent of benefi t while the new employees are now contributing to national insurance which in the future will mean less dependence on government for pensions. Furthermore, over 90 young people have also shifted from unemployment assistance to youth guarantee. The implication is that in future no individual under the age of 23 will not be entitled to benefi ts without electing to go to training education or employment.Health is another area whereby the Maltese Government has already embarked on numerous initiatives aimed at improving governance, driven by the need for greater effi ciency, eff ectiveness and accountability. The Government’s approach is to curtail and contain costs through the introduction of various internal control mechanisms and monitoring of operational costs. Measures include the implementation of fi nancial governance models which have led to restructuring, increased effi ciency of service delivery, containment of indirect administrative costs and deterrence of abuse and misuse of resources. Improved fi nancial control through the recruitment of fi nancial and audit expertise has also reaped benefi ts, particularly through the enforcement and monitoring of fi nancial and procurement protocols. Procurement services were also centralised to increase gains from economies of scale, whilst instilling accountability by making each entity responsible for its own purchasing. A comprehensive spending review, similar to that undertaken in social security is now under way within the Ministry for Health with the aim of providing reforms for the budget of October 2016 .

57Malta: Update of Stability Programme 2015 - 2018
Chart 6.2
1
6.1.2 A Better Composition of Public ExpenditureComplementing the eff orts to increase the effi ciency of public expenditure, it is the Government’s policy to shift expenditure to more productive functions. Chart 6.1 shows the diff erent classifi cations as a percentage share of Gross Domestic Product (GDP) for the years 2010, 2013 and forecasts for 2018. One should point out that, as a share of GDP, total government expenditure was 41.0 per cent in 2010. This share rose to 42.3 per cent by 2013, but is projected to decline to 39.6 per cent of GDP by 2018. This refl ects the Government’s policy of limiting the growth in expenditure below the rate of economic growth. The largest decline is forecasted in social protection expenditure with a fall of 0.88 percentage points between 2013 and 2018, while the smallest decline is expected to be in housing and community amenities with a fall of 0.02 percentage points. Chart 6.2 illustrates the share of productive expenditure as a percentage of the total government expenditure in Malta, the European Union (EU) and the Euro Area for the years 2007 to 2013. This share represents expenditure on education, health, housing and community amenities and environmental protection, while excluding social benefi ts and transfers in kind. As indicated in Chart 6.2, Malta’s share of productive spending is on a rising trend. It is also higher than both the EU and Euro Area average share of productive spending. It is to be noted that 2013 data for the EU and Euro Area has not been factored in due to insuffi cient data at the time of compilation of this report.
0
2
4
6
8
10
12
14
2007 2008 2009 2010 2011 2012 2013
%
Share of Productive Spending in Total General Government Expenditure
Malta EU EA
58 Malta: Update of Stability Programme 2015 - 2018
6.2 Improving the Structure and Effi ciency of Revenue StreamsThe Maltese Government is committed to continue enhancing the level of effi ciency of the taxation system. To this end, the Maltese Government has embarked on several projects aimed at gradually changing the structure of the tax system, while concurrently increasing tax effi ciency by:
• Shifting the tax burden away from labour;• Widening tax bases;• Simplifi cation of taxation systems and;• Fighting tax evasion and avoidance.
6.2.1 Shifting the Tax Burden away from LabourFurther to the targeted reductions in income taxation in the previous two years, the 2015 Budget reduced further the rate of personal income tax applicable to those who earn €60,000 or less to 25.0 per cent. In addition, the tax ceiling was raised to take COLA into consideration so as to exempt minimum wage earners.
Nevertheless, in order to maintain fi scal stability and further support fi scal consolidation, a number of measures were outlined in the 2015 Budget, among them a revision in fees on market output and measures to control the public sector wage bill.
6.2.2 Widening Tax BasesIt is the Government’s policy to avoid unnecessary increases in the tax rates. In order to maintain an adequate level of tax revenue without raising tax rates, it is deemed preferable to widen the base to which taxation is charged and to include more goods, services, individuals or entities. Measures which encourage labour market participation improve the tax base whilst fostering better living conditions. In this context, the Government has introduced the new In-work benefi t for working parents with children under the age of 23. Coupled with the extension of free childcare for working parents, this will encourage people to join the labour force as well as strengthen female participation in the labour force.
Furthermore, conscious of the economic and fi scal problems as well as the inequity issues brought about by undeclared work, the Government is committed to regularise undeclared work and minimise precarious employment. With this in mind, the general public will be encouraged to come forward about cases of undeclared work either through an online system or through a free-phone number which has been made available. Furthermore, a campaign will soon be launched to encourage the public to use the above facilities, whilst educating the general public about the risks and disadvantages associated with illegal and undeclared work.
Other policies, like the tapering of social benefi ts upon employment or after marriage, also act as an incentive to regularise one’s employment or as an incentive to re-join the labour force. Such policies, similar to the ones previously mentioned, further widen the tax base and improve the effi ciency of the existing tax system.
59Malta: Update of Stability Programme 2015 - 2018
6.2.3 Simplifi cation of Taxation SystemGovernment has embarked on a major project to merge the diff erent revenue departments into one entity. Such a merger is set to streamline the diff erent processes to make it easier both for tax payers to keep their aff airs in order, as well as taxation offi cials to gather the information they need to perform their duties in the most effi cient way.
Moreover, the Government has also directed its eff orts to reducing the administrative burden of the taxation system by improving the online fi ling of tax returns. Indeed, following several adjustments and improvements in the software that is used for e-fi ling of tax returns, some 92 per cent of companies now fi le their tax returns online. This facility has also been extended to individuals to further simplify the process of tax computation and fi ling of tax returns.
With the aim of further simplifying taxation and improving tax effi ciency, as of 1st January 2015, the 35 per cent Capital Gains Tax was replaced by an 8 per cent Final withholding Tax (FWT), applicable to traders and non-traders alike. In the case of non-traders, if the property was acquired prior to 2004, the applicable FWT rate is 10 per cent, while if the property was acquired less than ten years ago the FWT rate shall be 5 per cent.
6.2.4 Fighting Tax Evasion and AvoidanceFurther to the Investment Registration Scheme and the 15 per cent rent scheme, the latter coming into eff ect in 2015, the Government will be implementing other measures to increase tax compliance. The ongoing merger of the revenue departments will include the merger of the investigation departments of the VAT department as well as the Tax Compliance Unit. This should result in a stronger capacity for the department to handle tax evasion.
Likewise, the 2015 Budget introduced the initiative whereby from 2015 onwards, any person carrying out a commercial activity has to register with the VAT department irrespective of the turnover. This is also expected to strengthen the tax audit trail and improve tax effi ciency.
The Maltese Government has also set up a National Strategy for Electronic Payments Steering Committee whose mandate is to draw up a national strategy for electronic payments with the aim of increasing the incidence of its use and thus, fi ght tax evasion.
In addition, to further raise public awareness on the use of public funds, an educational campaign is planned. The campaign will explain how the funds collected from taxes are being used in terms of infrastructure, services, health, education, and social security. This will make people more conscious of the importance of tax compliance and it will show a clear link between taxes collected and their fi nal use.


7. Institutional Features of Public Finances


63Malta: Update of Stability Programme 2015 - 2018
7. Institutional Features of Public FinancesThe fi nancial and economic crisis and the resulting increases in defi cits and debt level in the European Union (EU) was followed by a profound reform of the Stability and Growth Pact. The resulting six-pack and two-pack reforms sought to strengthen and deepen budgetary surveillance by making it more continuous and integrated. These reforms put stronger emphasis on medium-term planning, better synchronised and more transparent budgeting processes, procedures to foster the use of unbiased macroeconomic forecasts for budget planning, as well as independent monitoring of compliance with fi scal rules at national level.
These regulations have led to a signifi cant reform to Malta’s budgetary system and processes. At the national level, one of the main responses to these reforms has been the Fiscal Responsibility Act, which was enacted by Parliament on 8th August 2014.
The Act outlines the main principles of fi scal responsibility and the objectives of fi scal policy. These ensure continuity in the application of fi scal policy from one administration to the next whilst providing the context within which subsequent provisions are to be interpreted. It establishes fi scal rules which bind national fi scal authorities in achieving a balanced structural budget, or in its absence, converge towards the medium-term budgetary objective, and to maintain the public debt at sustainable levels (lower than 60 per cent of GDP) over the medium and long-term. When the debt-to-GDP ratio exceeds 60 per cent of GDP, it shall be reduced in accordance with the Council Regulation (EC) No. 1467/97 until the ratio reaches 60 per cent. Whilst fi scal rules ensure adequate fi scal discipline in good times, the Act allows for a measured level of fl exibility when needed. In this context, it defi nes “exceptional circumstances” as “a period during which an unusual event outside the control of the State has a major impact on the fi nancial position of the general government, or a period of severe economic downturn”, on the basis of which fi scal policy can be allowed to deviate from the fi scal rules.
The Fiscal Responsibility Act also establishes rolling 3-year business and fi nancial plans which are based on the (most recently announced) medium-term fi scal strategy. The latter, which is outlined in the Medium-Term Fiscal Policy Statement and the Fiscal Policy Strategy Statement, sets forth the Government’s fi scal objectives, strategic priorities and a three-year rolling target for fi scal management together with a description of any underlying assumptions. The Medium-Term Fiscal Policy Strategy Statement is endorsed by the Prime Minister and the Minister for Finance, attesting to the reliability and completeness of the information in the medium-term fi scal strategy and to compliance to the principles of fi scal responsibility. This gives such a plan a strong measure of political endorsement.
Through the top-down budget approach and the establishment of a spending ceiling consistent with independently endorsed offi cial forecasts and fi scal rules under the scrutiny of the Fiscal Advisory Council, the medium-term budgetary framework also strengthens the role of the Ministry for Finance.
In the course of the budget year, no new or additional expenditures can be made or committed to in excess of the relevant budgetary allocation, except with the approval of the Minister for Finance and as long as adherence to the fi scal rules is ensured. The Act places personal responsibility on whoever makes unauthorised new or additional
64 Malta: Update of Stability Programme 2015 - 2018
expenditures and the person occupying the highest executive position in ministries, departments, authorities, agencies and entities falling within the remit of the Act. Furthermore, the Act requires all collective agreements and pay negotiations in the public sector to obtain the prior approval of the Ministry for Finance.
The fl exibility instruments, such as virements between votes within the same department, re-allocation of expenditure within the same Ministry and the contingency reserve, also reduce the risk of non-compliance with the Act, improve the credibility of the fi scal rules and promote effi ciency in budget execution.
The regular monitoring of the budgetary performance provided for by the Act, especially the mid-term review, allow Government to take remedial action in time if needed and allow the Fiscal Council to propose such remedial action as well. It also increases the level of accountability on fi scal matters. In addition, the Fiscal Responsibility Act provides for the publication of a draft budgetary plan before the actual budget and for the regulation of the annual budget to ensure conformity with the provisions of the Act.
The Act also establishes a Fiscal Council that is tasked with assessing and endorsing macroeconomic and fi scal forecasts, securing compliance with fi scal rules, and with determining the existence of exceptional circumstances (when relevant) and assessing progress in corrective action plan implementation (where relevant). As mentioned earlier on in this Chapter, the Fiscal Council is also entrusted with the ex-ante and ex-post assessment of the budgetary performance against the fi scal rules and targets, and in particular issue opinions and recommendations on the Half-Yearly and Annual Report published by the Ministry for Finance.
It is to be noted, that the Fiscal Council is now operational following the appointment of the Chairperson and its two Members by the Minister for Finance for a period of four years with eff ect from 1st January 2015. The Members, competent and experienced professionals in macroeconomic and fi scal matters, perform their functions as defi ned by this Act in the pursuit of sound economic judgement. The Council enjoys functional independence. Although the members of the Fiscal Council are appointed by the Minister for Finance, the staff involved in its operations is appointed by the Council. Members can be removed only on specifi cally limited and defi ned grounds and subject to Parliamentary approval. The Fiscal Council cannot seek or receive instructions from public authorities. The Fiscal Council has all powers to conduct its functions under this act, specifi cally the power to request information, documents, data from any Ministry, Department, Public Entity, Authority or Agency or Local Council.
7.1 A Revised National Budgetary TimelineOne of the provisions of the economic governance regulations is a common budgetary timeline for all Euro Area Member States. Under the common timeline, all Euro Area Member States are required to publish their draft budget for central government and the main parameters of all other general government sub-sectors not later than the 15th of October of each year. The common budgetary timeline also foresees that the fi nal budget should be adopted or fi xed upon annually by 31st December. Government has announced that it will be adjusting the timing and publication of the 2016 Budget and the subsequent budgets to fi t the requirements of the common budgetary timeline.

Statistical Appendix

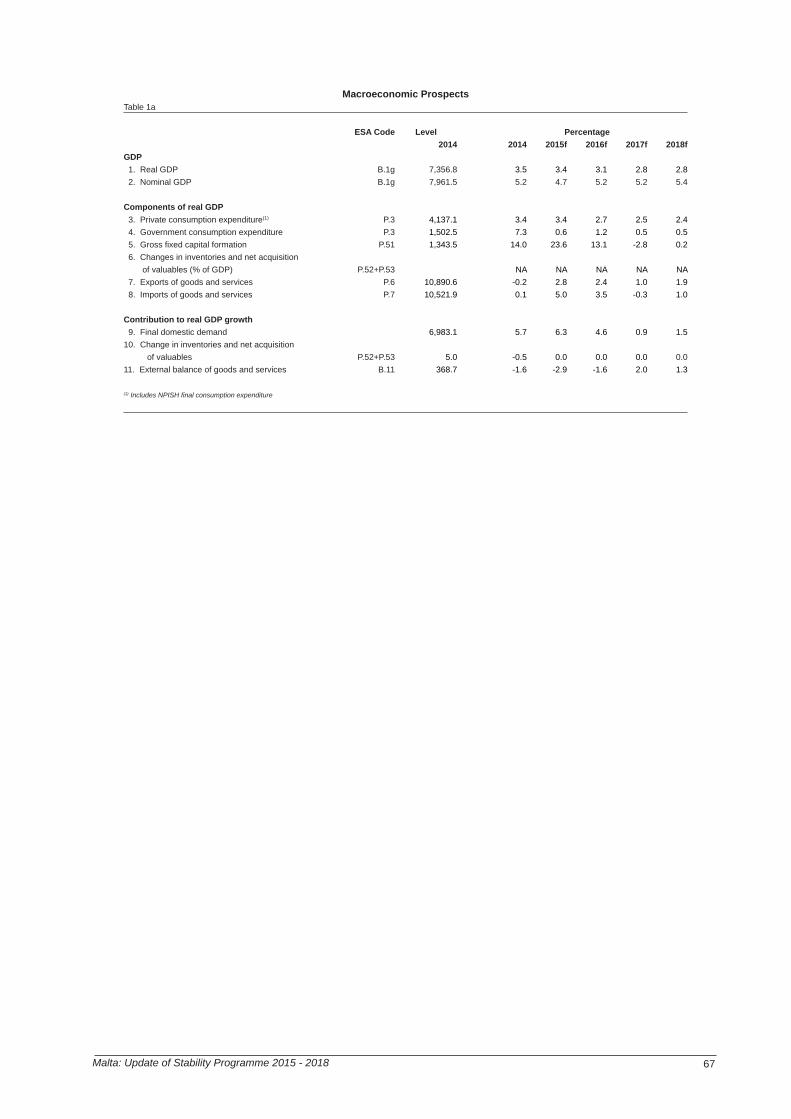
67Malta: Update of Stability Programme 2015 - 2018
Macroeconomic ProspectsTable 1a
ESA Code Level Percentage2014 2014 2015f 2016f 2017f 2018f
GDP 1. Real GDP B.1g 7,356.8 3.5 3.4 3.1 2.8 2.8 2. Nominal GDP B.1g 7,961.5 5.2 4.7 5.2 5.2 5.4
Components of real GDP 3. Private consumption expenditure(1) P.3 4,137.1 3.4 3.4 2.7 2.5 2.4 4. Government consumption expenditure P.3 1,502.5 7.3 0.6 1.2 0.5 0.5 5. Gross fi xed capital formation P.51 1,343.5 14.0 23.6 13.1 -2.8 0.2 6. Changes in inventories and net acquisition of valuables (% of GDP) P.52+P.53 NA NA NA NA NA 7. Exports of goods and services P.6 10,890.6 -0.2 2.8 2.4 1.0 1.9 8. Imports of goods and services P.7 10,521.9 0.1 5.0 3.5 -0.3 1.0
Contribution to real GDP growth 9. Final domestic demand 6,983.1 5.7 6.3 4.6 0.9 1.510. Change in inventories and net acquisition of valuables P.52+P.53 5.0 -0.5 0.0 0.0 0.0 0.011. External balance of goods and services B.11 368.7 -1.6 -2.9 -1.6 2.0 1.3
(1) Includes NPISH fi nal consumption expenditure
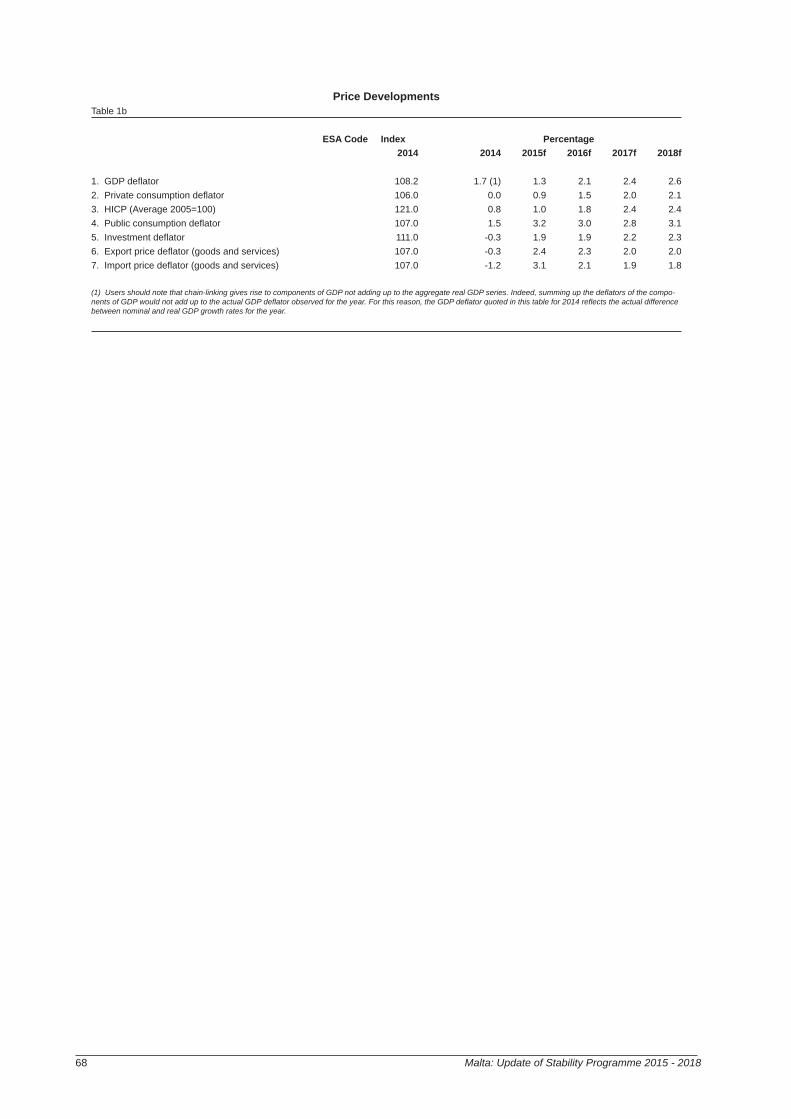
68 Malta: Update of Stability Programme 2015 - 2018
Price DevelopmentsTable 1b
ESA Code Index Percentage2014 2014 2015f 2016f 2017f 2018f
1. GDP defl ator 108.2 1.7 (1) 1.3 2.1 2.4 2.62. Private consumption defl ator 106.0 0.0 0.9 1.5 2.0 2.13. HICP (Average 2005=100) 121.0 0.8 1.0 1.8 2.4 2.44. Public consumption defl ator 107.0 1.5 3.2 3.0 2.8 3.15. Investment defl ator 111.0 -0.3 1.9 1.9 2.2 2.36. Export price defl ator (goods and services) 107.0 -0.3 2.4 2.3 2.0 2.07. Import price defl ator (goods and services) 107.0 -1.2 3.1 2.1 1.9 1.8
(1) Users should note that chain-linking gives rise to components of GDP not adding up to the aggregate real GDP series. Indeed, summing up the defl ators of the compo-nents of GDP would not add up to the actual GDP defl ator observed for the year. For this reason, the GDP defl ator quoted in this table for 2014 refl ects the actual difference between nominal and real GDP growth rates for the year.
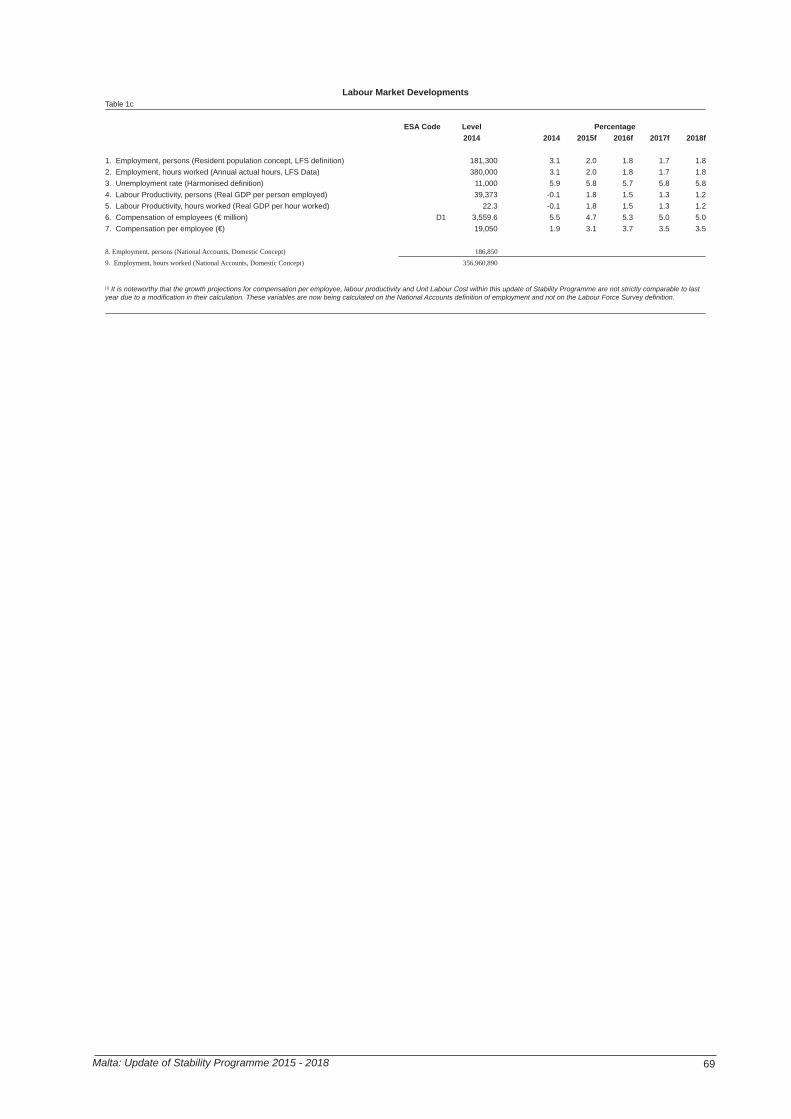
69Malta: Update of Stability Programme 2015 - 2018
Labour Market DevelopmentsTable 1c
ESA Code Level Percentage2014 2014 2015f 2016f 2017f 2018f
1. Employment, persons (Resident population concept, LFS defi nition) 181,300 3.1 2.0 1.8 1.7 1.82. Employment, hours worked (Annual actual hours, LFS Data) 380,000 3.1 2.0 1.8 1.7 1.83. Unemployment rate (Harmonised defi nition) 11,000 5.9 5.8 5.7 5.8 5.84. Labour Productivity, persons (Real GDP per person employed) 39,373 -0.1 1.8 1.5 1.3 1.25. Labour Productivity, hours worked (Real GDP per hour worked) 22.3 -0.1 1.8 1.5 1.3 1.26. Compensation of employees (€ million) D1 3,559.6 5.5 4.7 5.3 5.0 5.07. Compensation per employee (€) 19,050 1.9 3.1 3.7 3.5 3.5
8. Employment, persons (National Accounts, Domestic Concept) 186,850 9. Employment, hours worked (National Accounts, Domestic Concept) 356,960,890
[1] It is noteworthy that the growth projections for compensation per employee, labour productivity and Unit Labour Cost within this update of Stability Programme are not strictly comparable to last year due to a modifi cation in their calculation. These variables are now being calculated on the National Accounts defi nition of employment and not on the Labour Force Survey defi nition.

70 Malta: Update of Stability Programme 2015 - 2018
Sectoral BalancesTable 1d
Percentages of GDPESA
Code 2012 2013 2014 2015 2016 2017 2018
1. Net lending/ borrowing 3.4% 4.8% 4.4% 2.2% -0.7% 0.7% 2.4%vis-à-vis the rest of the world B.9of which:
Balance on goods and services 4.9% 5.6% 6.4% 2.8% 0.9% 2.6% 4.3%Balance of primary incomes and secondary income -3.4% -2.5% -3.7% -3.7% -3.4% -3.7% -3.6%Capital account 1.9% 1.7% 1.7% 3.0% 1.8% 1.7% 1.7%
2. Net lending/ borrowing of the private sector B.9 1.2% 17.3% 19.3% 2.9% 0.5% 2.4% 4.2%3. Net lending/ borrowing of general Government EDP B.9 -3.6% -2.6% -2.1% -1.6% -1.0% -0.4% -0.2%4. Statistical discrepancy 5.9% -9.9% -12.7% -2.3% -2.2% -2.1% -2.0%

71Malta: Update of Stability Programme 2015 - 2018
General Government Budgetary ProspectsTable 2a
Percentages of GDP ESA code 2014(*) 2014 2015 2016 2017 2018
Net Lending (EDP B9) by sub-sector1. General Government S13 -168.3 -2.1 -1.6 -1.1 -0.6 -0.22. Central Government S1311 -166.0 -2.1 -1.6 -1.0 -0.5 -0.23. State Government S1312 - - - - - -4. Local Government S1313 -2.2 -0.0 -0.0 -0.0 -0.0 -0.05. Social security funds S1314 - - - - - -
General Government 6. Total revenue TR 3,321.8 41.7 42.6 40.6 39.9 39.47. Total expenditure TE 3,490.1 43.8 44.2 41.7 40.5 39.68. Net lending / borrowing B9 -168.3 -2.1 -1.6 -1.1 -0.6 -0.29. Interest expenditure D41 230.2 2.9 2.7 2.6 2.5 2.510. Primary balance(1) 61.9 0.8 1.1 1.5 2.0 2.311. One-off and other temporary measures(2) 25.8 0.3 0.1 0.1 0.1 0.1
Selected Components of Revenue12. Total Taxes (12=12a+12b+12c) 2,254.5 28.3 28.1 27.8 27.7 27.512a. Taxes on production and imports D2 1,087.2 13.7 13.9 13.7 13.5 13.312b. Current Taxes on Income, Wealth, etc. D5 1,155.4 14.5 14.1 14.0 14.0 14.112c. Capital Taxes D91 11.8 0.1 0.2 0.1 0.1 0.113. Social Contributions D61 560.3 7.0 7.1 7.0 7.0 6.814. Property Income D4 94.4 1.2 1.2 1.1 1.1 1.015. Other(3) 412.6 5.2 6.2 4.7 4.2 4.016=6. Total Revenue TR 3,321.8 41.7 42.6 40.6 39.9 39.4
p.m.:Tax Burden (D2+D5+D6111+D6131+D91-D995)(4) 2,738.6 34.4 34.3 34.0 33.8 33.6
Selected Components of Expenditure
17.Compensation of employees + intermedi-ate consumption D1+P2 1,577.4 19.8 19.8 19.3 18.8 18.2
17a. Compensation of employees D1 1,051.9 13.2 13.0 12.8 12.6 12.317b. Intermediate consumption P2 525.5 6.6 6.8 6.5 6.3 5.918. Social payments (18=18a+18b) 1,008.4 12.7 12.5 12.1 11.9 11.7
of which Unemployment benefi ts (5) 32.4 0.4 0.4 0.4 0.3 0.3
18a.Social transfers in kind supplied via mar-ket producers D632 44.8 0.6 0.6 0.6 0.6 0.5
18b. Social transfers other than in kind D62 963.7 12.1 11.9 11.5 11.3 11.119=9. Interest expenditure D41 230.2 2.9 2.7 2.6 2.5 2.520. Subsidies D3 103.6 1.3 1.5 1.4 1.4 1.321. Gross fi xed capital formation P51G 300.2 3.8 4.1 3.2 3.1 3.022. Capital transfers D9 88.6 1.1 1.4 0.9 0.7 0.723. Other(6) 181.7 2.3 2.3 2.2 2.1 2.424=7. Total Expenditure TE 3,490.1 43.8 44.2 41.7 40.5 39.6p.m.: Government consumption (nominal) P3 1,607.9 20.2 19.9 19.7 19.3 18.7
(*) € million(1) The primary balance is calculated as (B9, item 8) plus (D41, item 9)(2) A plus sign means defi cit-reducing one-off measures(3) P10 + D39rec + D7rec + D9N (ie D9 other than D91rec)(4) Including those collected by the EU and including an adjustment for uncollected taxes and social contributions D995), if appropriate

72 Malta: Update of Stability Programme 2015 - 2018
No policy change projectionsTable 2b
Percentages of GDP 2014(1) 2014 2015 2016 2017 2018
1. Total revenue at unchanged policies 3,264.6 41.0 42.1 40.7 40.0 39.42. Total expenditure at unchanged policies 3,504.4 44.0 43.6 42.3 40.5 39.6
(1) € million

73Malta: Update of Stability Programme 2015 - 2018
Amounts to be excluded from the expenditure benchmarkTable 2c
Percentages of GDP 2014(1) 2014 2015 2016 2017 2018
1.Expenditure on EU programmes fully matched by EU funds revenue 202.13 2.54 3.35 2.16 1.82 1.73
2.Cyclically adjusted unemployment benefi t expenditure(2) 15.03 0.2 0.2 0.4 0.5 0.5
3. Effect of discretionary revenue measures 57.18 0.72 0.51 -0.04 0.05 0.054. Revenue increases mandated by law - - - - - -
(1) € million(2) The cyclically adjusted unemployment benefi t expenditure is estimate based on the sensitivity of expenditure to the output gap . Data for the total unemployment benefi t expedniture is per Table 2a in this Annex as defi ned in COFOG under 10.5(3) Revenue increases mandated by law should not be included in the effect of discretionary revenue measures: data reported in rows 3 and 4 are mutually exclusive

74 Malta: Update of Stability Programme 2015 - 2018
General Government Expenditure by FunctionTable 3
Percentages of GDP COFOG Code 2013 20181. General public services 1 7.0 6.5 2. Defence 2 0.7 0.7 3. Public order and safety 3 1.4 1.3 4. Economic affairs 4 5.1 4.3 5. Environmental protection 5 1.4 1.3 6. Housing and community amenities 6 0.3 0.3 7. Health 7 5.7 5.4 8. Recreation, culture and religion 8 0.9 0.8 9. Education 9 5.7 5.4 10. Social protection 10 13.9 13.0 11. Total Expenditure TE 42.3 39.6

75Malta: Update of Stability Programme 2015 - 2018
General Government Debt DevelopmentsTable 4
Percentages of GDP ESA Code 2014 2015 2016 2017 2018
1. Gross debt 68.0 66.8 65.6 63.8 61.22. Change in gross debt ratio -1.2 -1.2 -1.2 -1.8 -2.6
Contributions to changes in gross debt3. Primary balance -0.8 -1.1 -1.5 -2.0 -2.34. Interest expenditure EDP D.41 2.9 2.7 2.6 2.5 2.55. Stock-fl ow adjustment 0.1 0.3 1.1 0.9 0.5p.m. implicit interest rate on debt(1) 4.4 4.1 4.1 4.0 4.1
(1) Proxied by interest expenditure divided by the debt level of the previous year.
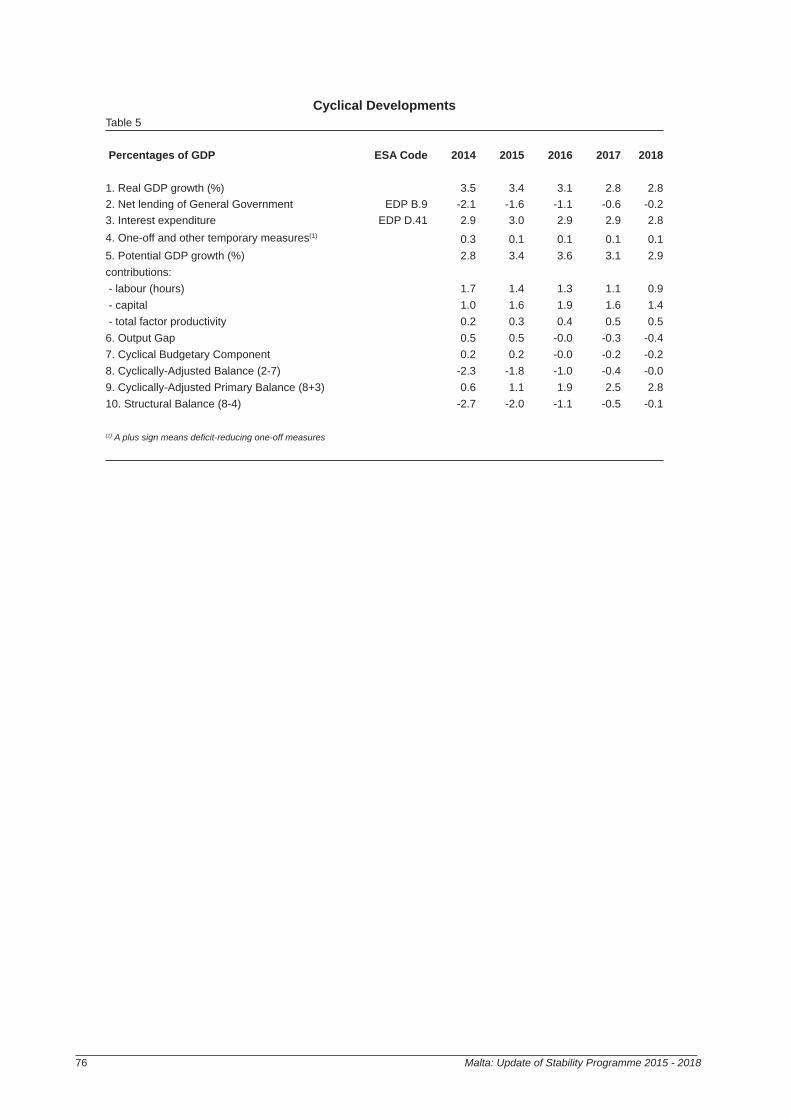
76 Malta: Update of Stability Programme 2015 - 2018
Cyclical DevelopmentsTable 5
Percentages of GDP ESA Code 2014 2015 2016 2017 2018
1. Real GDP growth (%) 3.5 3.4 3.1 2.8 2.82. Net lending of General Government EDP B.9 -2.1 -1.6 -1.1 -0.6 -0.23. Interest expenditure EDP D.41 2.9 3.0 2.9 2.9 2.84. One-off and other temporary measures(1) 0.3 0.1 0.1 0.1 0.15. Potential GDP growth (%) 2.8 3.4 3.6 3.1 2.9contributions: - labour (hours) 1.7 1.4 1.3 1.1 0.9 - capital 1.0 1.6 1.9 1.6 1.4 - total factor productivity 0.2 0.3 0.4 0.5 0.56. Output Gap 0.5 0.5 -0.0 -0.3 -0.47. Cyclical Budgetary Component 0.2 0.2 -0.0 -0.2 -0.28. Cyclically-Adjusted Balance (2-7) -2.3 -1.8 -1.0 -0.4 -0.09. Cyclically-Adjusted Primary Balance (8+3) 0.6 1.1 1.9 2.5 2.810. Structural Balance (8-4) -2.7 -2.0 -1.1 -0.5 -0.1
(1) A plus sign means defi cit-reducing one-off measures
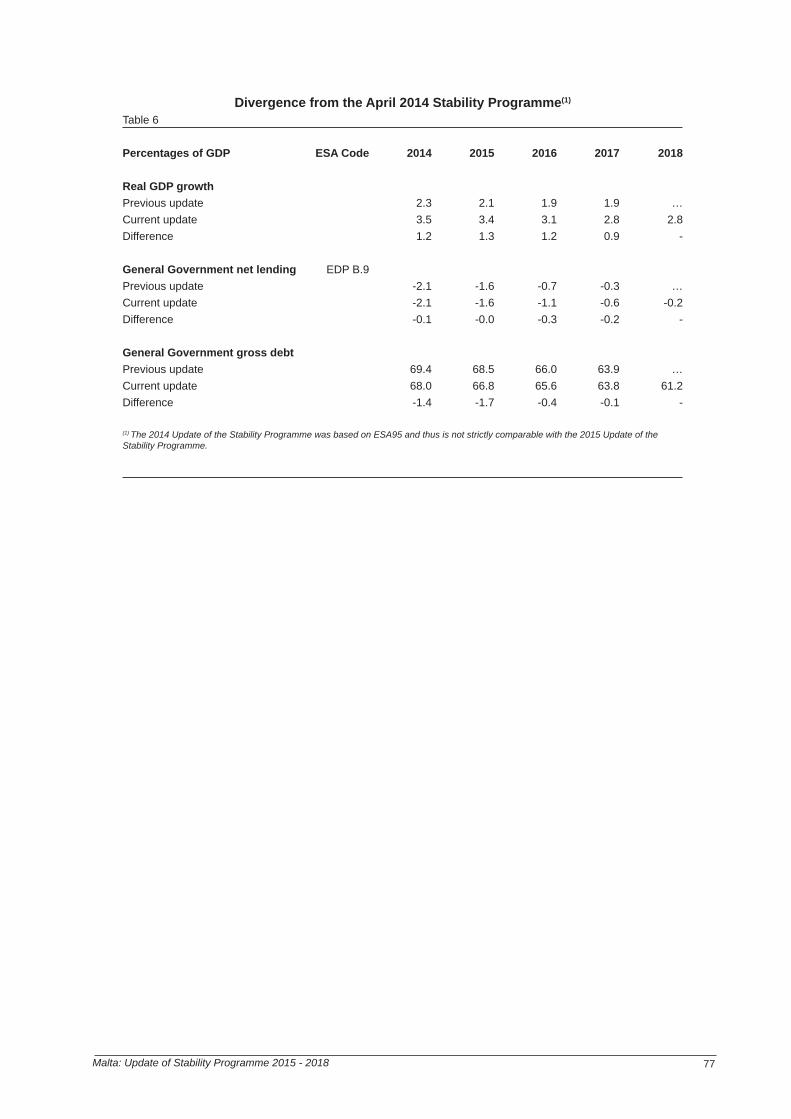
77Malta: Update of Stability Programme 2015 - 2018
Divergence from the April 2014 Stability Programme(1)
Table 6
Percentages of GDP ESA Code 2014 2015 2016 2017 2018
Real GDP growthPrevious update 2.3 2.1 1.9 1.9 …Current update 3.5 3.4 3.1 2.8 2.8Difference 1.2 1.3 1.2 0.9 -
General Government net lending EDP B.9Previous update -2.1 -1.6 -0.7 -0.3 …Current update -2.1 -1.6 -1.1 -0.6 -0.2Difference -0.1 -0.0 -0.3 -0.2 -
General Government gross debtPrevious update 69.4 68.5 66.0 63.9 …Current update 68.0 66.8 65.6 63.8 61.2Difference -1.4 -1.7 -0.4 -0.1 -
(1) The 2014 Update of the Stability Programme was based on ESA95 and thus is not strictly comparable with the 2015 Update of the Stability Programme.

78 Malta: Update of Stability Programme 2015 - 2018
Long-term Sustainability of Public FinancesTable 7
Percentages of GDP 2013 2020 2030 2040 2050 2060
Total Expenditure - - - - - - of which: age-related expenditures 22.6 23.0 24.3 25.1 26.6 29.2Pension expenditure 9.6 9.8 9.7 9.7 11.0 12.8Social security pensions* - - - - - -Old-age and early pensions 5.3 5.8 6.1 6.7 8.3 10.3Other pensions (disability, survivors) 4.0 3.7 3.2 2.7 2.3 2.0Occupational pensions - - - - - -Health care 5.7 6.3 7.0 7.5 7.6 7.8Long-term care 1.1 1.3 1.6 2.0 2.1 2.3Educational expenditure 5.9 5.3 5.6 5.5 5.5 6.0Other age-related expenditures: (Unemployment benefi ts) 0.3 0.3 0.3 0.3 0.3 0.3Interest expenditure - - - - - -Total revenue - - - - - - of which: property income 1.9 1.9 1.9 1.8 1.8 1.7 of which: from pensions contributions 8.6 7.6 7.8 7.7 7.6 7.4Pension reserve fund assets - - - - - - of which: consolidated public pension fund assets - - - - - -
Labour productivity growth -0.7 1.3 1.5 1.7 1.7 1.5Real GDP growth 1.7 1.9 1.9 1.8 1.4 1.4Participation rate males (aged 20-64) 84.7 86.1 89.7 88.9 88.6 89.0Participation rate females (aged 20-64) 52.8 60.9 69.1 70.8 71.0 71.4Total participation rates (aged 20-64) 69.0 73.8 79.6 80.1 80.0 80.4Unemployment rate (aged 15-64) 6.5 6.6 6.7 6.7 6.7 6.7Population aged 65+ over total population 17.5 21.2 24.4 24.8 26.4 28.5
* Malta’s two-thirds pension included under the pension expenditure category
Note: Figures may not add up due to rounding
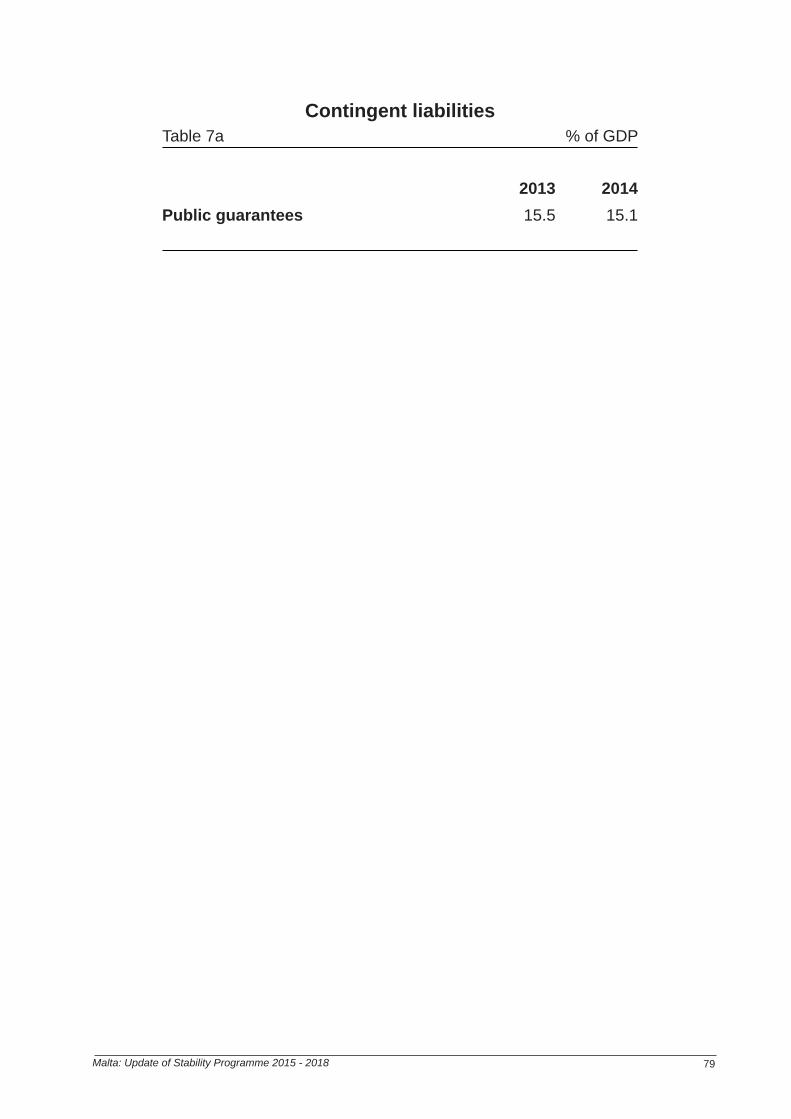
79Malta: Update of Stability Programme 2015 - 2018
Contingent liabilitiesTable 7a % of GDP
2013 2014Public guarantees 15.5 15.1

80 Malta: Update of Stability Programme 2015 - 2018
Basic AssumptionsTable 8
2014 2015f 2016f 2017f 2018f
Short-term interest rate (annual average) 0.18 *** 0.05 0.05 0.05 0.05Long-term interest rate (annual average) 1.7 1.6 1.6 1.6 1.6
USD/EUR exchange rate (annual average) 1.304 1.106 1.091 1.099 1.099GBP/EUR exchange rate (annual average) 0.797 0.736 0.729 0.728 0.728
Malta’s main trading partners growth 1.2 1.8 2.0 2.0 2.0
Oil prices (Brent, USD/barrel) 99.0 59.9 71.4 84.9 86.5
1 If necessary, purely technical assumptions
* 0.25 with effect from 13/Nov/2013
* 0.15 with effect from 11/Jun/2014
* 0.05 with effect from 10/Sept/2014