Embed Size (px)
Citation preview
Malini Nair, N. H. Ravindranath, Nitasha Sharma, Ruth Kattumuri and Madhushree Munshi Poverty index as a tool for adaptation intervention to climate change in northeast India Article (Accepted version) (Refereed) Original citation: Nair, Malini, Ravindranath, N. H., Sharma, Nitasha, Kattumuri, Ruth and Munshi, Madhushree (2013) Poverty index as a tool for adaptation intervention to climate change in northeast India. Climate and Development, 5 (1). pp. 14-32. ISSN 1756-5529 DOI: 10.1080/17565529.2012.751337 © 2013 Taylor & Francis This version available at: http://eprints.lse.ac.uk/31061/ Available in LSE Research Online: July 2014 LSE has developed LSE Research Online so that users may access research output of the School. Copyright © and Moral Rights for the papers on this site are retained by the individual authors and/or other copyright owners. Users may download and/or print one copy of any article(s) in LSE Research Online to facilitate their private study or for non-commercial research. You may not engage in further distribution of the material or use it for any profit-making activities or any commercial gain. You may freely distribute the URL (http://eprints.lse.ac.uk) of the LSE Research Online website. This document is the author’s final accepted version of the journal article. There may be differences between this version and the published version. You are advised to consult the publisher’s version if you wish to cite from it.
1
Poverty Index as a Tool for Adaptation Intervention to Climate Change in North East India Nair, Malini, Ravindranath, N. H., Sharma, Nitasha, Kattumuri, Ruth and Munshi, Madhushree Abstract The Inter Governmental Panel on Climate Change (IPCC) (2007) reports that the number of extreme events of precipitation and temperature in India are projected to increase in the short-term. The negative effects of this climate change in rural populations of India may include crop and livestock loss, livelihood risk, health and sanitation disruptions and shelter risk. Overseas Development Assistance, in the form of aid, will help the rural communities in countering these losses; several development agencies already require that the adaptation to climate change risks be included in as project activities in the aid program. However the accurate targeting of developmental aid is often difficult in developing countries due to uneven and cluster-like development of areas. To help counter this problem, we develop a poverty index intended to assist the prioritization of the development aid towards the communities at risk, in order of their need. The district-wise poverty index was created for seven states of North-East India, a region that has high imbalances in development, to exhibit its effectiveness. The poverty index has been developed from the district-wise data available from the North-East Data Bank (DoNER). The indicators chosen were selected to adequately represent the poverty of the people as well as to act as a prioritizing mechanism in a data scarce region. The inclusion of a Gini coefficient of land distribution is new to the development of a poverty index, this is a tool included to capture the high inequality in land distribution pattern in North East India, which in turn affects the distribution of income, since most of the population is Agriculture-dependent. Although primarily developed for North-East India, this poverty index can be used in developing countries with regional imbalances of development. If the biophysical factors affecting vulnerability are known, this index can be used in a weighted combination with vulnerability. Keywords: Adaptation intervention, climate change, poverty index, Gini coefficient, vulnerability index
1. Introduction Poverty in India has been historically two-fold. One form is rural poverty, where the access to education, food or adequate healthcare as well as government support programs is reduced or unavailable due to the lack of infrastructure and awareness among the rural populace. The other, a more recent phenomenon is urban poverty, whereby lateral migration of unskilled rural population towards urban centers increases slum-dwelling in cities. This creates insecurity of livelihood, shelter and sanitation (Hashim, 2009) among these populations. Both rural poverty and urban poverty affects the response to hazards posed by climate change, the livelihood risk being the highest challenge in adapting to these hazards, however, the rural poverty is more prevalent in India, thus a subject of this article. The incidence of rural poverty is highest in the arid and semi-arid sections of India, flood plains of Bihar and Andhra Pradesh, as well as the hilly and tribal areas of North and North East India.
2
Agriculture is the primary occupation of landowners in rural India (60%) and majority of these landowners exist at subsistence level (78%), thus the rural areas of India exhibit high levels of poverty (65%)(National Commission on Women, 2001). This rate of agricultural poverty imposes substantial difficulties in decision-making for the policy planner, especially in the direction of developmental assistance. The Planning Commission of India reports (11th Five Year Plan, 2007a) that although the income from agriculture increased 400%, the productivity per capita of agriculture increased only 75% over the 5 decades after independence, indicating the persistence of subsistence level of agriculture over majority of India. Subsistence farmers are far more susceptible to the variations of climate, diminishing their capacity to adapt, pushing them deeper into poverty. A study conducted by Norwegian Agency of Developmental Cooperation (NORAD) (Eriksen et. al., 2007) suggests that climate change will affect the poorest people in developing nations who are highly dependent on natural resources, such as the agriculture dependent population of India. The IPCC also suggests that projected changes in the frequency and intensity of climate extremes would threaten the livelihoods of the people affected by poverty, especially in South Asia (IPCC, 2007). According to the IPCC, poverty and unavailability of alternate sources of gainful employment, drives agricultural communities towards unsustainable utilization of even marginal lands, leading to increase in vulnerability of these lands and their populace, resulting in large-scale environmental degradation. Thus the compounding negative effect of climate change predicted for India and the low and unchanging GDP/capita of the agriculture – dependent population creates a highly vulnerable condition for the households dependent on agriculture in India.
In the case of North East of India, its population is mostly rural (85%) (Ministry of Development of North Eastern Region (DONER) Poverty Eradication Document, 2011), the region is mostly hilly (70%) and access to services and infrastructure in this region is very limited (Human Development Report on North-East, A Bird’s Eye View (MPRA), 2009). Although the poorer households in North-East India are diversifying their livelihood activities, agriculture and tenant farming remains the activities that the population heavily depends upon for their primary income. The valleys around the Brahmaputra River are comparatively more economically active in this region compared to the hilly areas, creating a regional imbalance in development. The absence of communication facilities, lack of private and foreign investments, inadequate employment opportunities for the relatively highly educated people is an issue for the entire North-East region (DONER, 2009). The current developmental status of North East India is of concern to the policy planners of India, because the uneven terrain lends itself to irregular infrastructure development, and thus inaccessible tribes in some states, while some regions are more advanced in terms of education and employment. Due to this high imbalance in development across states of North –East, the distribution of development assistance will be inefficient, due to the disparate nature of the economic status of the communities. Thus a prioritization tool at a right granular level suited to direct assistance (in form of developmental assistance or adaptation interventions) towards the most vulnerable populations is necessary.
This paper attempts to develop such a tool, in the form of a poverty index. During the calculation of a poverty index, we bring an additional advantage of capturing the inequality across the districts using a Gini coefficient. This development of poverty index of North East is the first of its kind in India, and can be minimally transformed to be used to suit other parts of the developing world with high regional imbalances of growth.
The structure of the paper is as follows: In Section 1 we introduce the concepts of the paper, in section 2, we discuss the objectives of the study, in section 3, we discuss the background literature, in section 4, the data and methods, in the section 5, the empirical results, in the section 6, we discuss the comparison of the poverty index to other indices developed in the region, the section 7, the implications of poverty in the
3
North-East region and the suitable adaptation interventions. In the section 8 we discuss conclude the paper and provide recommendations.
2. Objective of Study
The main objective of this paper is to develop a poverty index of North East India, so that it can be used as a tool to direct ‘adaptation interventions’ towards most needy sections of the population. The poverty index is developed at a district-level for the seven states of North East India: Arunachal Pradesh, Assam, Manipur, Meghalaya, Mizoram, Nagaland and Sikkim.
3. Background
3.1 Effects of Climate Change on the Poor and the Current State of Adaptation Interventions in North-East India The effects of climate change are felt to varying degrees by different communities and various geographies In India, the major future impacts of climate change are as follows: a) Increase in precipitation and temperature over the entire Indian subcontinent in the latter part of 21st century b) Substantial regional differences in rainfall patterns are projected over India, with West Central India projected to have an increase in expected rainfall. The extreme rainfall events are predicted to rise, especially over West Coast and West central India c) The extremes of minimum and maximum temperature are predicted to increase, with warmer nights. (RupaKumar, 2006) d) In the case of North East India, the agricultural yields are predicted to decrease, mixed increase and decrease in precipitation patterns and increase in frequency of floods and droughts over the North-East region (Ravindranath et al, 2011). In addition to these projected biophysical impacts in India, farmers who thrive on subsistence agriculture often do not have savings or supplementary income to tide them over a hazard caused by climate change. They reside in marginal lands and in the case of North-East India, rely on jhum cultivation, that leaves the land rid of plant cover and nutrients for a very long time. Thus their exposure and sensitivity to a drought or a flood is very high. These farmers are also constrained by low literacy levels or lack of proper infrastructure to be able to access the government support programs or employment opportunities present in cities. Thus, adaptation programs have to be designed to support populations which are unable to access even basic support facilities. Mostly, developing countries have poverty alleviating programs; e.g. NREGA in India, focused on improving the livelihood of poor. These programs are designed to be complementary to growth planning. However, none of these programs prioritize adaptation to climate
4
change as one of their strategies. This translates into the poor being the most vulnerable to hazards related to climate change, with no governmental support to tide over a disaster. Recently, certain countries have started incorporating adaptation interventions as part of their overseas development assistance. This process, referred to as ‘mainstreaming’ climate change adaptation (Mertz, 2009), is part of Millennium Development Goals in several countries. Successful mainstreaming of adaptation includes planning for the smooth & coordinated functioning of the governing processes, individuals and institutions under the new climate change scenario. The ‘adaptation interventions’ include not only successful technical adaptations such as a drought resistant variety of a staple crop, but also flexible institutions such as local banks with accessible lending and loan write-offs for poor, during a climate related crisis. Adaptation is defined as “all activities aimed at preparing for or dealing with the consequences of climate change, be it at the level of individual households, communities, and firms or of entire sectors and countries” (Klein, 2011). Adaptation interventions may include localized actions, such as access to drought tolerant varieties or tree planting to deal with the increased crop water demand and or reduced water availability or policy interventions such as policies that mandate rainwater harvesting in hilly areas.
As adaptive capacity of a location is often dependent on the economic and physical well being of communities that reside upon it, poverty and inequality often undermines the ability of a community to adapt. Poverty is the most important determinant of vulnerability and adaptation to climate change. Poverty affects in several ways:
1. Poverty-stricken areas often are dependent on natural resources that are climate sensitive, such as forests, water and soil. These resources are already degraded by population pressures, thus a climate induced variation would affect these poverty stricken population to a greater degree.
2. The poverty-stricken population has very few coping mechanisms during the times of increased hardship, whereby they have limited savings and access to credit, which in turn leads them to be trapped in this marginal livelihood, called poverty-trap. This poverty trap increases their vulnerability to climate change by several degrees. For example, an increase in frequency of floods might result in increased water-borne diseases, which may decrease ability of the household breadwinner to cope long-term with productive work and result in decreased income for the family. In addition, this may decrease the ability of women to cope with housework and bear children , withdrawal of children from school, sale of land and unproductive, conservative use of land, inability to send children back to school, thus passing on the inescapability of poverty into future generations (Barrett et al, 2007)
3. Poverty-stricken population often reside in marginal lands, that are exposed to the vagaries of nature, as sloping eroded areas (e.g. most countries in Africa), low lying areas(e.g. Bangladesh) and slums (e.g. sections of Mumbai, India) . The incidence of poverty is very high in these regions and even a small incidence of hazard is enough to damage the livelihood of the community to a very high level.
It is thus imperative that National Adaptation Planning consider the effect of poverty among communities, while designing adaptation strategies. Some least developed countries already link their National Adaptation Planning (NAPA) to national level growth and poverty reduction policies (Organization of Economic Development and Cooperation (OECD), 2009). These countries include Bangladesh and Rwanda, where the NAPAs were linked to the Poverty Reduction Strategy Papers (PRSPs), to mainstream adaptation to climate change.
5
Poverty Reduction Strategy Paper is a comprehensive strategy for reducing poverty and promoting growth prepared for least developed countries in conjunction between the government agencies, International Monetary Fund (IMF) and World Bank. The IMF (2011) describes these papers as “A PRSP contains an assessment of poverty and describes the macroeconomic, structural, and social policies and programs that a country will pursue over several years to promote growth and reduce poverty, as well as external financing needs and the associated sources of financing”. As of August 2011, the 165 Poverty Reduction Strategy Papers have been already accepted by the IMF board. The IMF and the World Bank work with the countries to prioritize their funding towards the strategies that are delineated by the PRSPs. As mentioned before, certain PSRPs link adaptation strategies to poverty reduction and development and these countries are:
• Bangladesh: The PRSP of Bangladesh consists of 19 policy matrices, one of which is devoted to hazard reduction and management. The target of this policy is to factor in vulnerability impacts and adaptation to climate change into disaster management. The NAPA of Bangladesh also designs priority adaptation to complement the PRSP
• Rwanda: In the PRSP of Rwanda, multi-criteria analysis techniques are used to select priority adaptation interventions closely linked to the various national and sectoral policies of Rwanda.
Thus, under the auspices of UNFCCC and IMF (via Poverty Strategy Papers), the least developed countries have already progressed, albeit with differing efficiencies towards National Adaptation Planning processes. The draft decision C 17 reached at the Durban Climate meetings of 2011 (November-December 2011), does not mandate, but only invites the other developing countries to prepare National Adaptation plans, incorporating participatory and gender-sensitive tools. The C 17 decision also requests the developing nations to incorporate, “activities aimed at integrating climate change adaptation into national and sub national development and sectoral planning”. The major emerging markets as China and India have prepared their own national adaptation plans. In the case of China, the National Adaptation Plan consists of introducing technical innovations to promote adaptation in sectors of Agriculture, Forests, Water and Coastal zones. In addition, the strengthening of the existing pollution laws and improving upon institutional flexibility is recommended in these regions (China’s National Climate Change Program, 2010).
In the case of India, the Prime Minister’s National Action Plan on Climate Change (NAPCC) (Prime Ministers’ Council on Climate Change, 2010) has identified some key sectors such as Clean Energy (Solar Energy, Energy Efficiency), Habitat, Himalayan Ecosystem, Water and Agriculture as the sectors which require interventions. These are resources that are most vulnerable to climate change in India, today. However there has been no effort, unlike the case of several developing countries like Bangladesh, to link the development programs or prioritize the interventions according to most vulnerable communities.
The 11th Five Year Plan of India (Planning Commission of India, 2007b) has taken an approach of adaptation to climate change through the specific strategies prepared through the NAPCC. The NAPCC is designed to address adaptation through the following:
• Develop new agricultural varieties to adapt to the climate variability. • Develop institutional network capable of coping with greater frequency of hazards. The Plan
additionally states that the existing networks that are created under the Initial National Communications for Climate Change is sufficient for National Action on Climate Change.
6
In an interim report of the approach paper to the 12th Five Year Plan (Planning Commission of India, 2011), low –carbon inclusive growth strategies are to be one of the pillars of growth of India. The growth strategies (yet to be detailed), intended for the 12th Five Year Plan are based on two principles, “Low-carbon policies that are inclusive need to be differentiated across sectors based on national priorities and transaction costs of implementing the policy” and “Who bears the burden and whether it is equitably distributed, need to be examined and considered explicitly during the formulation and implementation of low-carbon strategies”. Thus, development is still India’s top priority, but the path chosen would minimize carbon –emissions whenever possible. The cost burden of the carbon –emissions may be redistributed upwards in the income-scale, to a degree.
In short, the adaptation to climate change is currently being mainstreamed into the development objectives in India through the processes established by NAPCC, National Communication on Climate Change and the 11th Five year plans. Since development is still the top priority of India, adaptation to climate change is often not the primary objective of the nation. Thus, in the process of optimizing the allocation of adaptation interventions with the constrained budgets, these interventions need to be targeted to rural communities that are most in need of assistance.
Our intent in this paper is to develop a poverty index, which will serve as a tool to prioritize the rural communities most in need of adaptation interventions, in the case where the interventions are not connected to the National development objectives. By this process, we can ensure that the chances of maladaptation are very few. In this particular case, North East India is best suited, mainly due to the fact that the overall development in this region is very low as compared to the rest of the country. The poverty index is developed at a district-level, since it is the best suited granularity, where local governmental agencies and NGOs can provide assistance.
3.2. Why the case of North –East India?
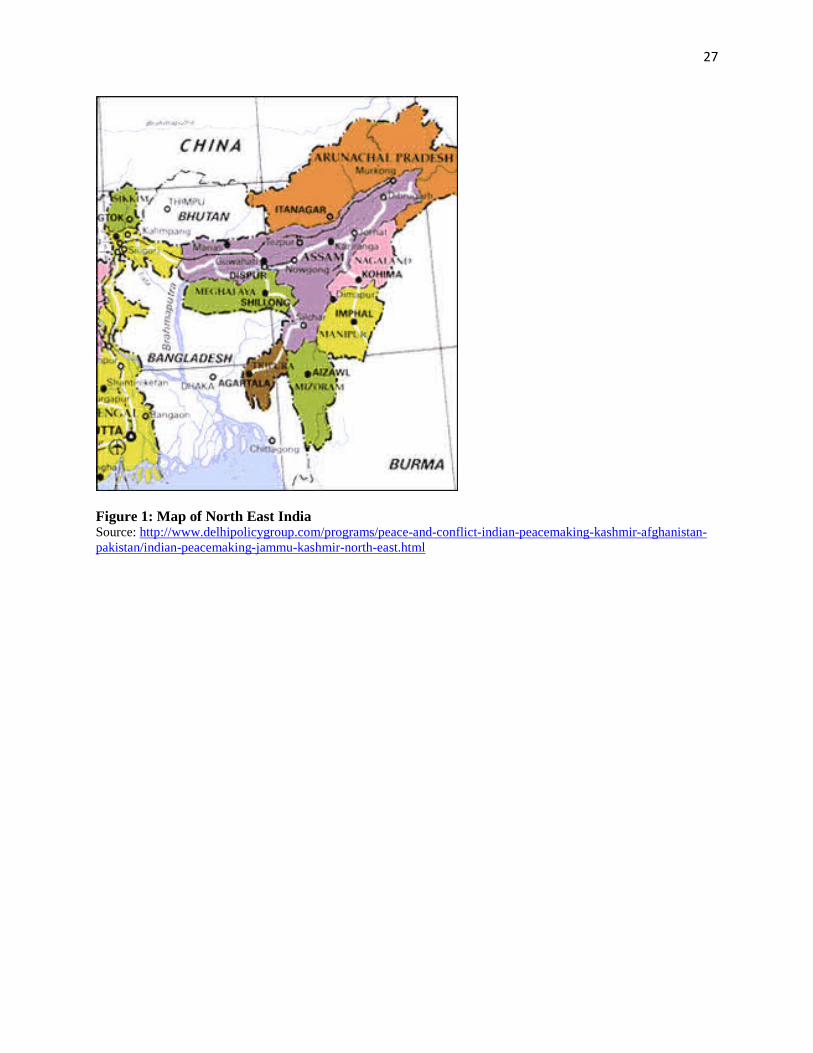
The North East region of India consists of seven states called the “sister states”: Arunachal Pradesh, Assam, Manipur, Meghalaya, Mizoram, Nagaland and Sikkim (Figure 1). Although mostly hilly, potentially arable land rich in natural resources is found in vast tracts on both sides of the Brahmaputra river valley. In spite of fertile land and relatively educated people (68.5% literacy rate, compared to 64.8% nation-wide) the North-East remains one of the most underdeveloped regions in India. After the market reforms of 1990’s the lag in development of this region became even more pronounced (MDoNER, 2008), due to the resources being directed towards other regions of India with availability of skilled labor.
The 11th five year plan (2007) suggests that despite huge investments ($1.5 billion), the infrastructure development in the North –East region has remained non-uniform or incomplete in phases due to poor planning, absence of co-ordination, poor management of projects and lack of accountability. There is considerable lack of income for the states, due to the low industrial and economic activity and credit non- availability for individuals due to low penetration of financial institutions. All these factors lead to a lag of development in most of the North-East when compared to the other regions of India. However, certain regions in North-East, especially the districts located in the Brahmaputra river valley are comparatively economically advanced with some industrial activity. Delivery of blanketed centrally planned aid in this situation is not tenable. In the case of hazards related to climate change, the distribution of inaccessible tribes in hilly areas and generally poor infrastructure creates difficulties in any Disaster fund distribution. In the case of adaptation to climate change in these local regions, the aid or the activities (adaptation
7
interventions) have to be granular at a district level, to incorporate this variation in economic situation. The district-wise poverty index to be developed in this paper will assist in granular targeting of adaptation interventions.
3.3 Vulnerability and Poverty Analysis
The importance of vulnerability and adaptation as the primary concepts to measure the socio-economic impacts of climate change is evident from concentration of Working Group II in analyzing these factors from Third Assessment Report (TAR) onwards. In the Working Group II section of the IPCC AR4 (Carter et. al., 2007), an entire chapter is devoted to the review of the techniques of vulnerability and adaptation assessments. A few forward looking points from the report include:
• Continued research towards determining the reliable, local impacts under projected climate change
• Continued research towards identifying, comparing and prioritizing different adaptation strategies, especially at the local level
The most popular stream of vulnerability conceptualization (Kelly and Adger (2000), Gallopin (2006)) determines vulnerability as a function of exposure, sensitivity and adaptive capacity. In this classification, exposure is primarily an external stimulant, while sensitivity and adaptive capacity are primarily unique to the system (Locatelli, 2008). Here, vulnerability is represented as:
V = f (Exposure, Sensitivity, Adaptive Capacity)
Where, exposure is defined as “The nature and degree to which a system is exposed to significant climatic variations’; while sensitivity is represented as the “The degree to which a system is affected, either adversely or beneficially, by climate-related stimuli” (McCarthy et. al., 2001). Adaptive Capacity of a system is defined as “The ability of a system to adjust to climate change (including climate variability and extremes) to moderate potential damages, to take advantage of opportunities, or to cope with the consequences”. There has been some research towards the theoretical definitions of vulnerability (Luers, 2003), and recent research has been somewhat disparate in the nature of tools used to quantify vulnerability. Among the tools the indicator based analysis has gained popularity, especially in developing countries, mainly due to the fact that they do not need costly, time consuming and often unavailable granular analysis of impacts that are downscaled to regional level. The indicator based analysis has been included in social sciences literature for grouping cohorts of populations, the most popular index that has been used in several development studies is the Human Development Index (HDI), created by the United Nations Development Programme (UNDP). The indicator based approaches have been utilized in the case of developing nations where impact data is mostly unavailable and also where the prioritization of aid (both overseas and internal) has to be conducted to reach maximum number of most vulnerable people (Adger et. al., 2004). Several indicator –based approaches exist in vulnerability literature; the first, well-known study was conducted by Downing et al (2001) who utilized a mixture of biophysical and demographic indicators such as income, livestock holdings, crop land, food aid and road access to describe the vulnerability at the household level of Delanta Dawunt province of Ethiopia. Similar location-specific mixture of biophysical and socio-
8
economic indicators was chosen by Moss et al (2001), in analyzing cross-country vulnerability to climate change. The indicators chosen included sea level rise, % of population with access to safe water, % of population with access to sanitation, Birth rate, life expectancy, % of managed land, GDP per capita, income inequality, % of population in the workforce, and % of SO2 emissions. An exhaustive listing of nation –wide indicators used by Downing et al. (2001) is available in the EM-Dat database (http://www.emdat.be/) (Adger et al, 2004) and the list of indicators used by Moss et al. (2001) is available in the GCAM database ( http://www.globalchange. umd.edu/ models/gcam/). With regards to national case studies, a national level social vulnerability index was constructed for Africa by Vincent (2004), where the author utilized the popular indicators available from the development agencies, such as standard of living, % change in urban population, dependent population, % of population with Aids, health expenditure as a % of GDP , corruption, trade balance and % of rural population. Due to the unavailability of data, these indicators were chosen by expert judgment method and the authors validated the results across historical disaster incidence data. The results indicated that the developing countries of Africa, such as Tunisia, South Africa and Libya were comparatively less vulnerable to climate change as compared to countries such as Niger, and Sierra Leone.
A more granular, district-level vulnerability index was developed and field tested in India by O’Brien et al. (2004). In this analysis, the authors developed indices using biophysical indicators such as soil quality and depth, incidences of droughts and extreme rainfall events, inputs such as irrigation and infrastructure development, as well as socio-economic factors such as adult literacy rates and gender equity. The indices were developed for adaptive capacity, climate sensitivity, climate change vulnerability and farmers’ vulnerability to globalization. This analysis was first of its kind in India, where district –wise vulnerability indices were developed from the downscaled national data. In addition, this analysis calculated the districts that were ‘double-exposed’ to globalization and climate change, where stresses due to adaptation to these two processes were felt to a greater degree.
In both the analyses (Vincent (2004) and O’Brien (2004), the authors address the disadvantages of the index –based measurement, main concerns being:
1. Time Scale of the index created was considered problematic, since both these indices calculate the vulnerability in current period and the future socio-economic scenario is hard to predict. However the author (Vincent (2004) suggests that current vulnerability profile can be an unbiased predictor of future adaptive capacity
2. The utility of national –level indicators in lower-resolution studies. Vincent (2004) suggests that granular studies may perform better while accounting for social capital, networks and reciprocal relationships.
3. Interrelationships between indicators might be an ignored factor in the analysis (Vincent, 2004), however, due to extreme sub-national level data scarcity in the regions of analyses, Africa and India, the indicators are considered to be sufficient in the exploratory analysis and building up of literature.
Majority of policy implementation and disbursion of aid in India happens at the local level (O’Brien, 2004), therefore a sub-national analysis is required. Brooks et al. (2004) suggests that since vulnerability
9
varies considerably at local –level, local level indicators would be more important to build a clear vulnerability profile of an area. It is keeping these factors in mind that the poverty index was developed, at a district level.
3.4. Poverty Index as a Tool for Adaptation Interventions
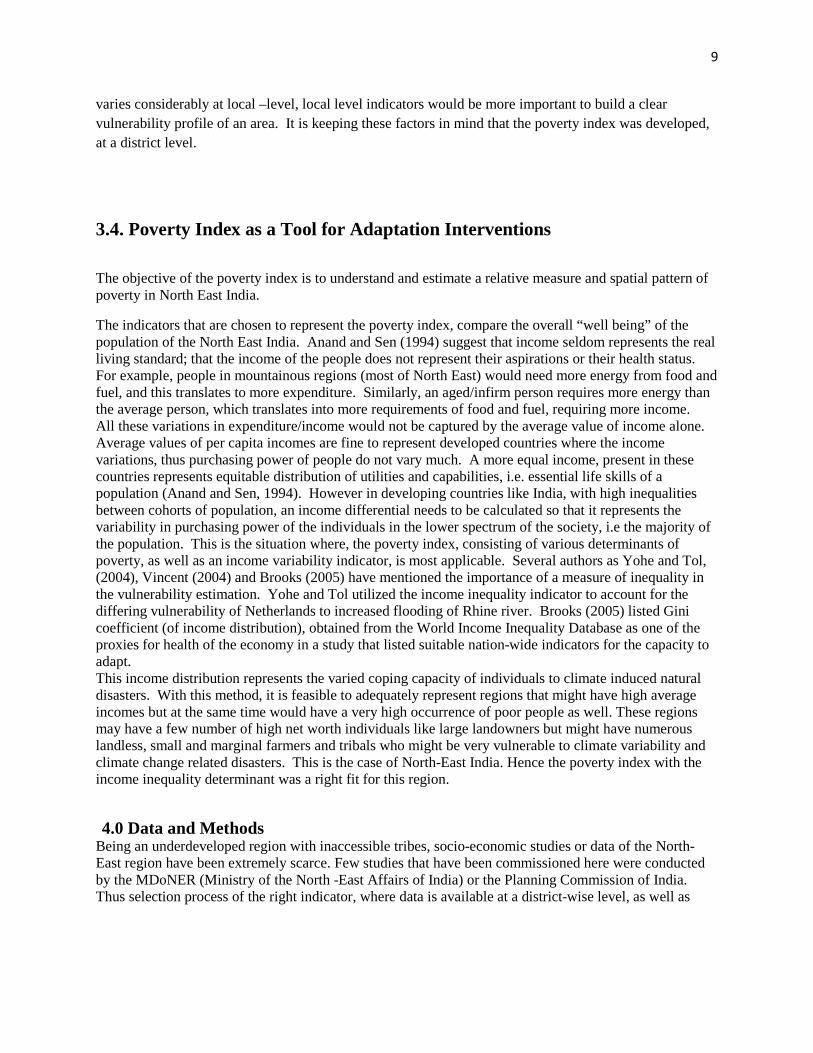
The objective of the poverty index is to understand and estimate a relative measure and spatial pattern of poverty in North East India.
The indicators that are chosen to represent the poverty index, compare the overall “well being” of the population of the North East India. Anand and Sen (1994) suggest that income seldom represents the real living standard; that the income of the people does not represent their aspirations or their health status. For example, people in mountainous regions (most of North East) would need more energy from food and fuel, and this translates to more expenditure. Similarly, an aged/infirm person requires more energy than the average person, which translates into more requirements of food and fuel, requiring more income. All these variations in expenditure/income would not be captured by the average value of income alone. Average values of per capita incomes are fine to represent developed countries where the income variations, thus purchasing power of people do not vary much. A more equal income, present in these countries represents equitable distribution of utilities and capabilities, i.e. essential life skills of a population (Anand and Sen, 1994). However in developing countries like India, with high inequalities between cohorts of population, an income differential needs to be calculated so that it represents the variability in purchasing power of the individuals in the lower spectrum of the society, i.e the majority of the population. This is the situation where, the poverty index, consisting of various determinants of poverty, as well as an income variability indicator, is most applicable. Several authors as Yohe and Tol, (2004), Vincent (2004) and Brooks (2005) have mentioned the importance of a measure of inequality in the vulnerability estimation. Yohe and Tol utilized the income inequality indicator to account for the differing vulnerability of Netherlands to increased flooding of Rhine river. Brooks (2005) listed Gini coefficient (of income distribution), obtained from the World Income Inequality Database as one of the proxies for health of the economy in a study that listed suitable nation-wide indicators for the capacity to adapt. This income distribution represents the varied coping capacity of individuals to climate induced natural disasters. With this method, it is feasible to adequately represent regions that might have high average incomes but at the same time would have a very high occurrence of poor people as well. These regions may have a few number of high net worth individuals like large landowners but might have numerous landless, small and marginal farmers and tribals who might be very vulnerable to climate variability and climate change related disasters. This is the case of North-East India. Hence the poverty index with the income inequality determinant was a right fit for this region.
4.0 Data and Methods
Being an underdeveloped region with inaccessible tribes, socio-economic studies or data of the North-East region have been extremely scarce. Few studies that have been commissioned here were conducted by the MDoNER (Ministry of the North -East Affairs of India) or the Planning Commission of India. Thus selection process of the right indicator, where data is available at a district-wise level, as well as
10
representative of the factors that influence/cause poverty was iterative. The district-wise data and the chosen indicators were obtained from the Planning Commission of India (2009) and the North-East Data Bank (2010), a data storage facility created by the North East Finance Corporation.
4.1 Composition of Poverty Index Approximately 90% of North East population is dependent on agriculture. In this region, increasingly unpredictable seasons and extreme weather events such as cyclones, floods and droughts often lead to crop failure. This leaves the farmers without any sustainable food supply or livelihood as they often rely exclusively on their own crops. The North-East India is highly susceptible to ecological and biodiversity loss, because the most common type of agriculture is shifting (jhum) cultivation. Amongst the alternate livelihood options, animal husbandry is the most common in North-East India. The indicators that compose the poverty index are chosen to ensure that the variation of poverty in all the states of North-East can be optimally captured in the index. After repeated consultation with the stakeholders, urban-rural population ratio, per-capita income, number of livestock owned per household, Gini Coefficient of income and literacy rates were chosen as indicators to construct the poverty index. The selected indicators to represent the poverty index are further elaborated between sections 4.1.1 through section 4.1.5. 4..1 Urban – Rural Population Ratio This variable is selected to represent the disparities in living standards among the population. In urban areas, access to health care, alternate employment opportunities and access to education are higher. In areas around the Brahmaputra river, the employment opportunities are higher than the hilly and tribal areas of North East India. Thus in the case of North-East India, the urban –rural population ratio may be used as a proxy for health and life expectancy. The expected value of the urban-rural population ratio is below 0.5, since majority of population lives in the rural areas. For the purposes of cross-sectional analysis, the inverse of the urban-rural population ratio was examined In the State-wise cross sectional analysis, the highest rural to urban population ratio is found in the State of Manipur (78%), and the lowest in the State of Meghalaya (44%). This represents the distribution of the population around the townships in Meghalaya and the border towns with Bangladesh, which were developed as a result of cross-border trade. In the descending order, the states with the highest rural – urban population ratios are Manipur, Assam (74%), Mizoram (69%), Nagaland (57%), Arunachal Pradesh (56%), Sikkim (52%) and Meghalaya, indicative of the high levels of rural populations in the states of the North East India. In comparison, the rural urban population ratio of India is about 72%. 4.1.2 Per Capita Income
The average value of per capita income is taken as indicator. The rural per capita income is chosen here since more than 80% of population in North East India lives in rural areas. The observations from descriptive analysis reveal the distribution of the per capita income in Arunachal Pradesh ($1126/year), Meghalaya ($ 1025), Nagaland ($ 1015), Mizoram ($879), Assam ($ 609) and Manipur ($ 584). The comparatively higher per-capita income in Assam might be attributed to the sparsely distributed population and the higher density of population around the towns of Brahmaputra River. When comparing this distribution of the per capita income in the North East with that of India, all the states figure poorly. However, the per capita income does not reveal the entire economic status of people, especially their vulnerability. Thus we include a distributive measure of the economic well-being, such as Gini Coefficient.
4.1.3 Number of livestock owned per household

11
In India, livestock is an alternate measure that the rural population depends on for livelihood. The income share earned from livestock directly is not high, however owners obtain other such services as the capacity of livestock to provide a buffer income if the crops fail due to disaster (Thornton et. al., 2008). Livestock also provides manure, an important input in farming in the developing world, and they act as an a savings instrument, which the farmers can liquidate for cash (Thornton, 2010). Thus number of livestock can be a proxy variable for subsidiary income in the rural areas of North East India..
4.1.4 Gini Coefficient of Income
This is the indicator that represents the distribution of income among the population. A Gini coefficient can take a value between 0 and 1. For example, a country like Sweden will have very little income variation, thus the Gini coefficient will be around 0.2 and a country like Nigeria (with high income variation) would have a Gini coefficient around 0.8. Gini Coefficient has been extensively used by United Nations and other development agencies to represent the income inequality of a region. This income inequality represents the purchasing power of a group of people. Since the Consumer Price Index (price for a basket of essential goods) remaining the same in a region, the income inequality would be an excellent proxy for representing the shortfall of goods. A shortfall of a group of goods is termed poverty. The calculation of Gini Coefficient adopted by us is as follows:
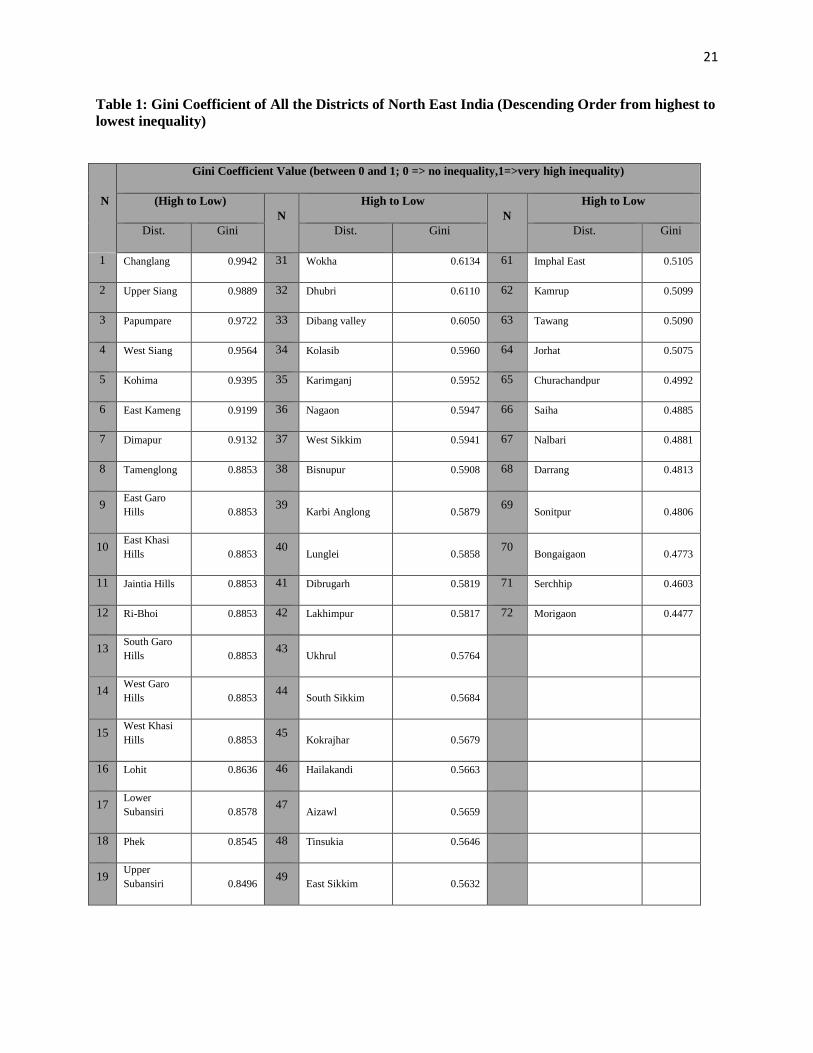
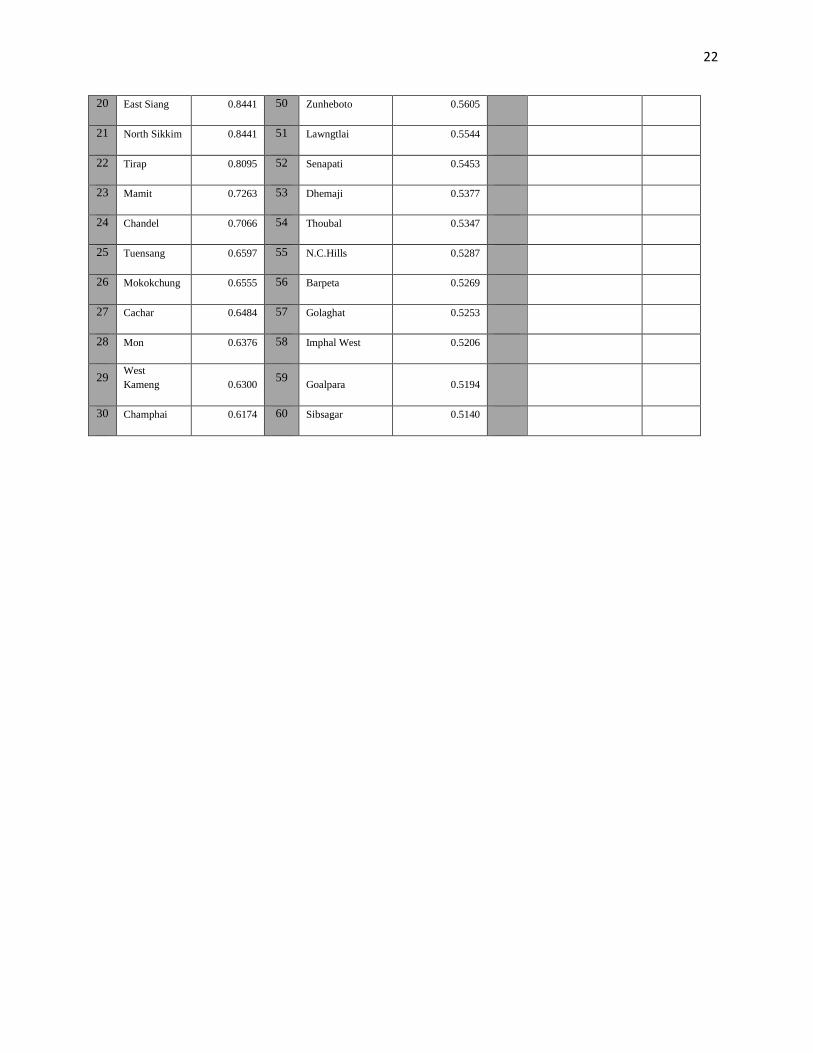
where Xk is the Cumulative percentage of the population, Yk is the cumulative percentage of landholders in the total population based on the land size, Abs is absolute value. The land distribution was chosen as a proxy variable to income distribution because majority of population of North East depends on agriculture as their primary means of livelihood. The Gini coefficient as mentioned, takes a value between 0 and 1. The closer the value is to 1, the higher the disparity in the land distribution pattern. In India, the number of farmers with smaller parcels of land is higher; hence a Gini value closer to one would be observed. The observed Gini coefficient of all the districts in the North East is provided in Table 1. From the table, the value of Gini coefficient is high in all the states of North East. The highest Gini coefficient is observed in the districts of Meghalaya (Average = 0.8853), Arunachal Pradesh (Average =0.8308), Nagaland (Average =0.7292), Sikkim (Average =0.6495), Manipur (Average=0.5966), Mizoram (Average =0.5743), Assam (Average =0.5411). The intra-state variation of Gini coefficient among the districts is high for Arunachal Pradesh and Nagaland, where the coefficient varies from 0.5 to 0.9. This is indication of very high inequality in land distribution in these states. In the state of Assam, the value of Gini coefficient varies only from 0.45 to 0.65, indicating somewhat lesser inequality in land distribution pattern. In comparison, the Gini coefficient of land distribution in India is 0.7605 (Rawal, 2008).
4.1.5 Literacy Rate
Amartya Sen (2003) states, “Not to be able to read or write or count or communicate is a tremendous deprivation. The extreme case of insecurity is the certainty of deprivation, and the absence of any chance of avoiding that fate. The first and most immediate contribution of successful school education is a direct reduction of this basic deprivation - this extreme insecurity - which continues to ruin the lives of a large part of the global population”. The literacy rate represents the ability to earn jobs, to have mobility to access better jobs and the ability to be properly paid for the jobs done. This also provides ability to access better healthcare services and for women especially, it represents the ability to take better care for children and subsequent generations.
12
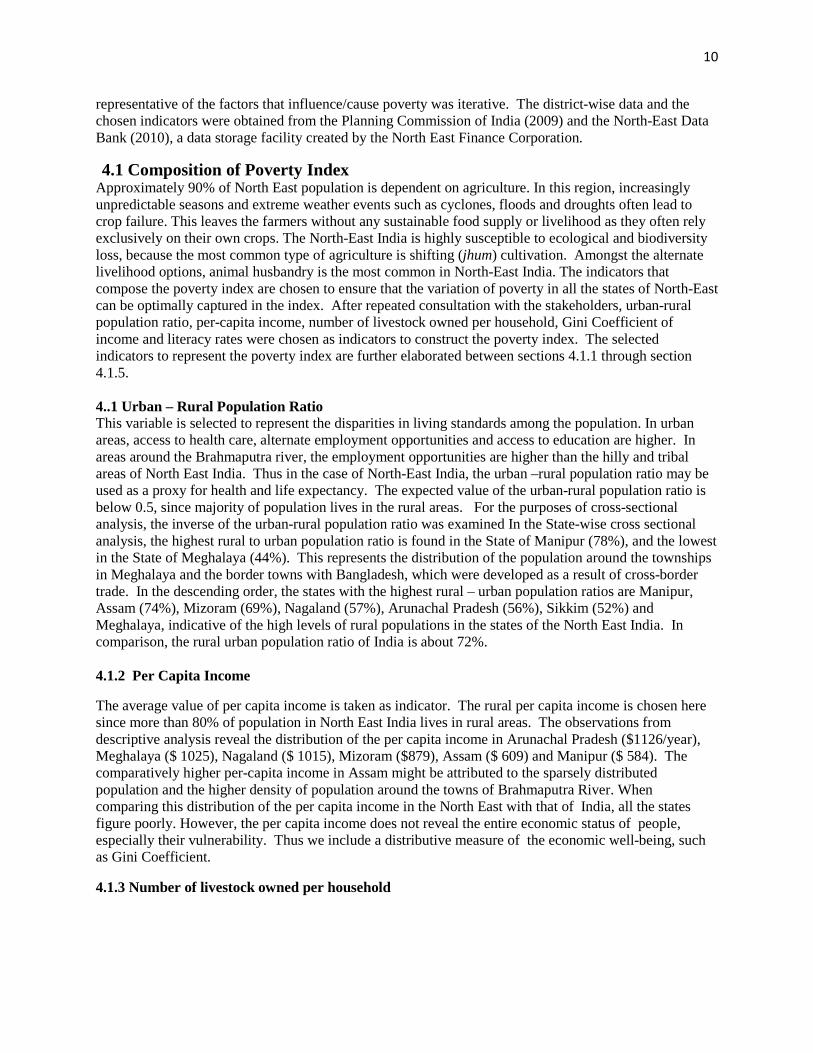
The Poverty Index creation out of these indicators included the steps of normalization and aggregation of the five indicators that are mentioned above. The values of the indicators such as urban-rural population ratio, per capita rural income, literacy rate and number of livestock have been inverted, since they share an inverse relationship with poverty. The socio-economic literature suggests the utilization of principal components for the variable section process in the creation of an index. The main utility of the principal component analysis is the reduction of number of variables in a set of correlated variables. However due to the scarcity of district –level data in this region of India, we opted out of this technique. Thus, as mentioned before, the indicators were selected using repeated consultations with the stakeholders (government officials and researchers). The indicators are normalized so that they are made dimensionless for aggregation. The normalization process is mathematically represented as the following:
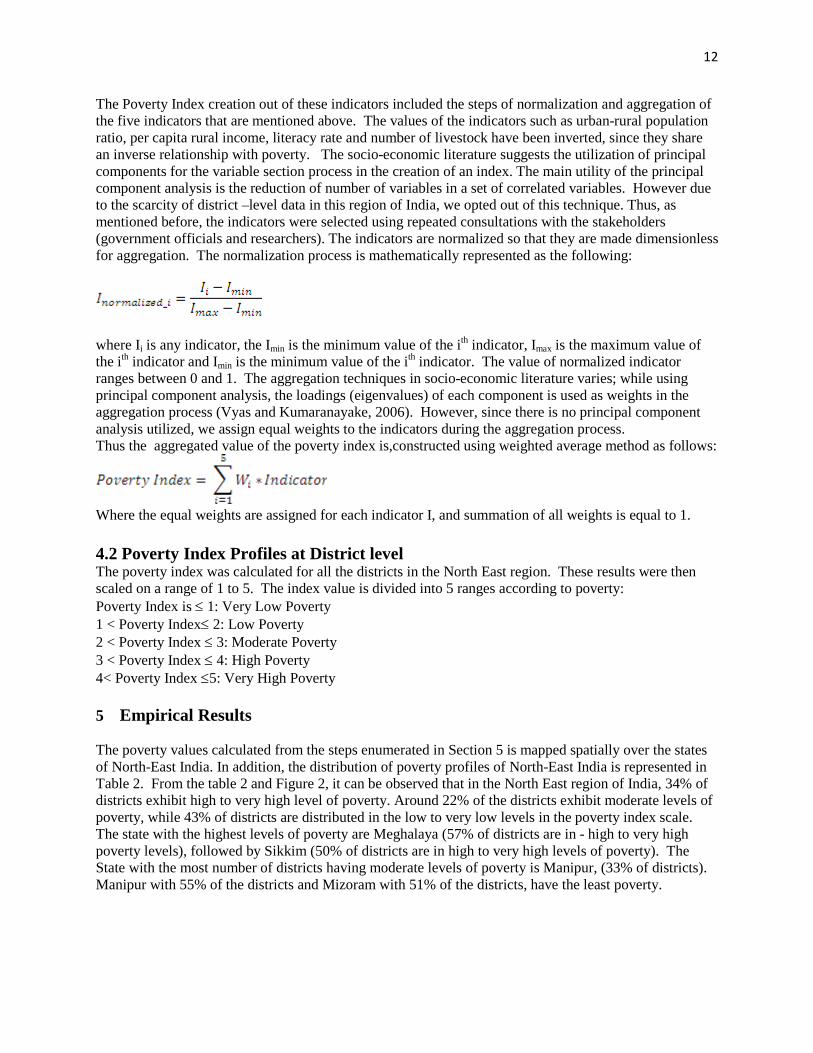
where Ii is any indicator, the Imin is the minimum value of the ith indicator, Imax is the maximum value of the ith indicator and Imin is the minimum value of the ith indicator. The value of normalized indicator ranges between 0 and 1. The aggregation techniques in socio-economic literature varies; while using principal component analysis, the loadings (eigenvalues) of each component is used as weights in the aggregation process (Vyas and Kumaranayake, 2006). However, since there is no principal component analysis utilized, we assign equal weights to the indicators during the aggregation process. Thus the aggregated value of the poverty index is,constructed using weighted average method as follows:
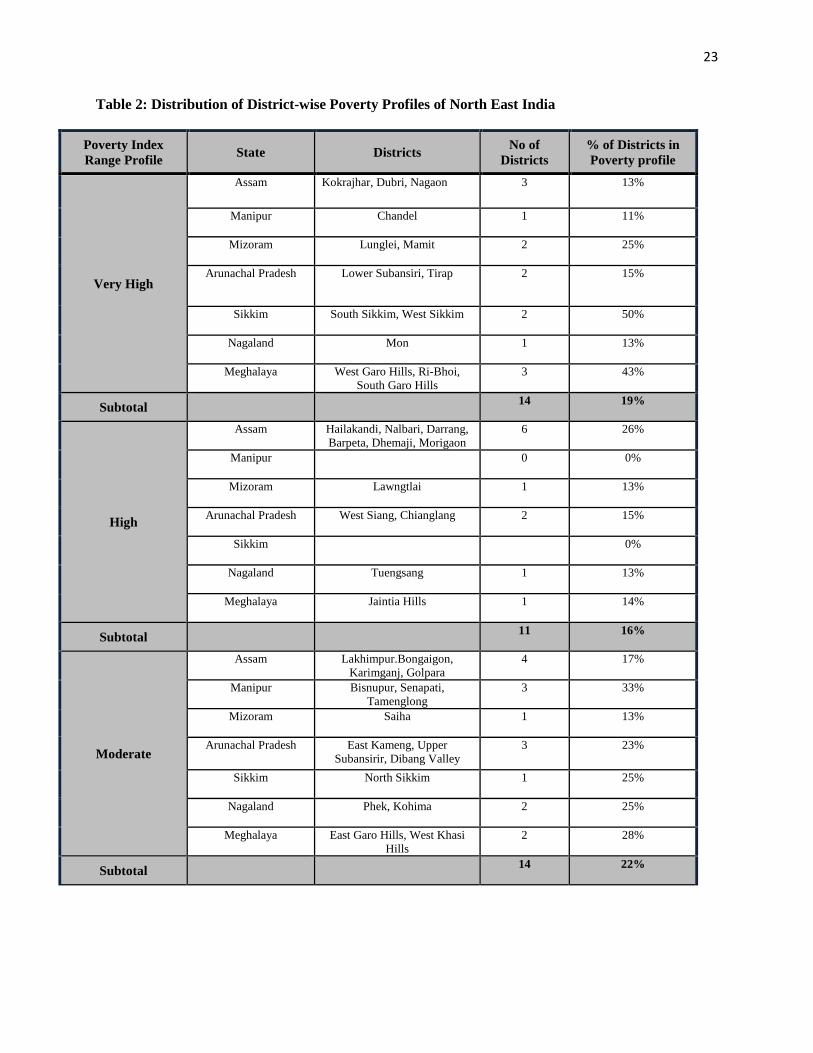
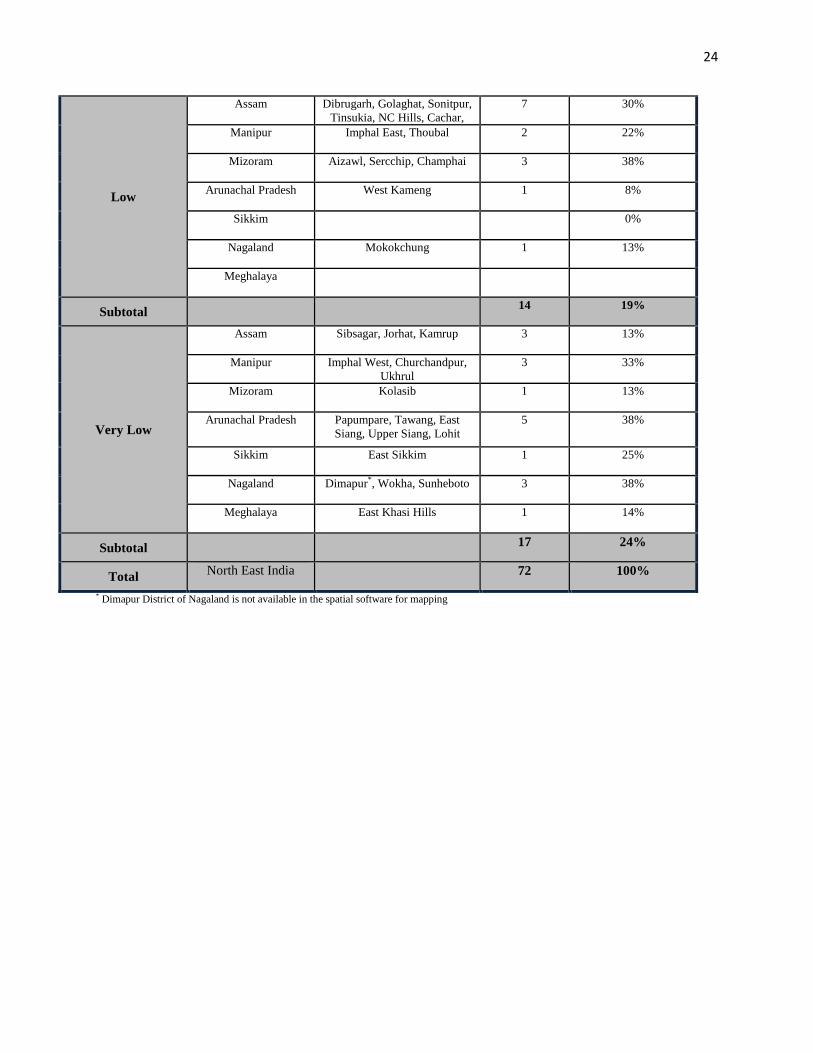
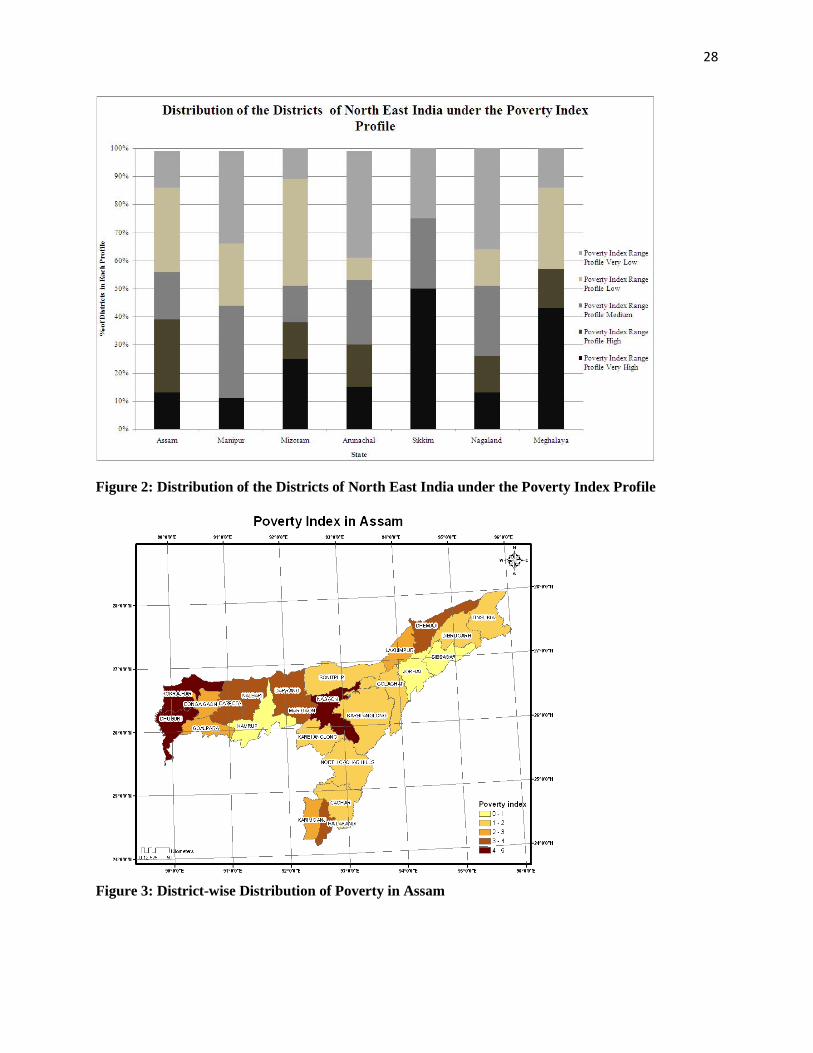
Where the equal weights are assigned for each indicator I, and summation of all weights is equal to 1. 4.2 Poverty Index Profiles at District level The poverty index was calculated for all the districts in the North East region. These results were then scaled on a range of 1 to 5. The index value is divided into 5 ranges according to poverty: Poverty Index is ≤ 1: Very Low Poverty 1 < Poverty Index≤ 2: Low Poverty 2 < Poverty Index ≤ 3: Moderate Poverty 3 < Poverty Index ≤ 4: High Poverty 4< Poverty Index ≤5: Very High Poverty 5 Empirical Results The poverty values calculated from the steps enumerated in Section 5 is mapped spatially over the states of North-East India. In addition, the distribution of poverty profiles of North-East India is represented in Table 2. From the table 2 and Figure 2, it can be observed that in the North East region of India, 34% of districts exhibit high to very high level of poverty. Around 22% of the districts exhibit moderate levels of poverty, while 43% of districts are distributed in the low to very low levels in the poverty index scale. The state with the highest levels of poverty are Meghalaya (57% of districts are in - high to very high poverty levels), followed by Sikkim (50% of districts are in high to very high levels of poverty). The State with the most number of districts having moderate levels of poverty is Manipur, (33% of districts). Manipur with 55% of the districts and Mizoram with 51% of the districts, have the least poverty.

13
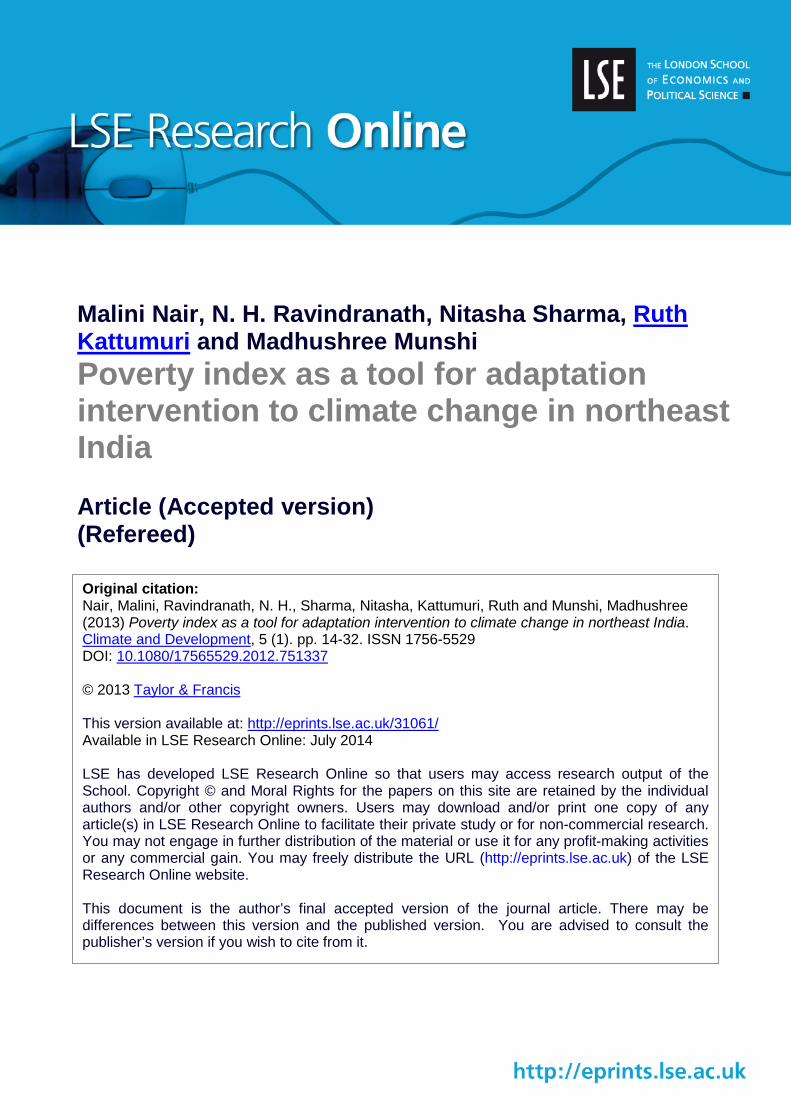
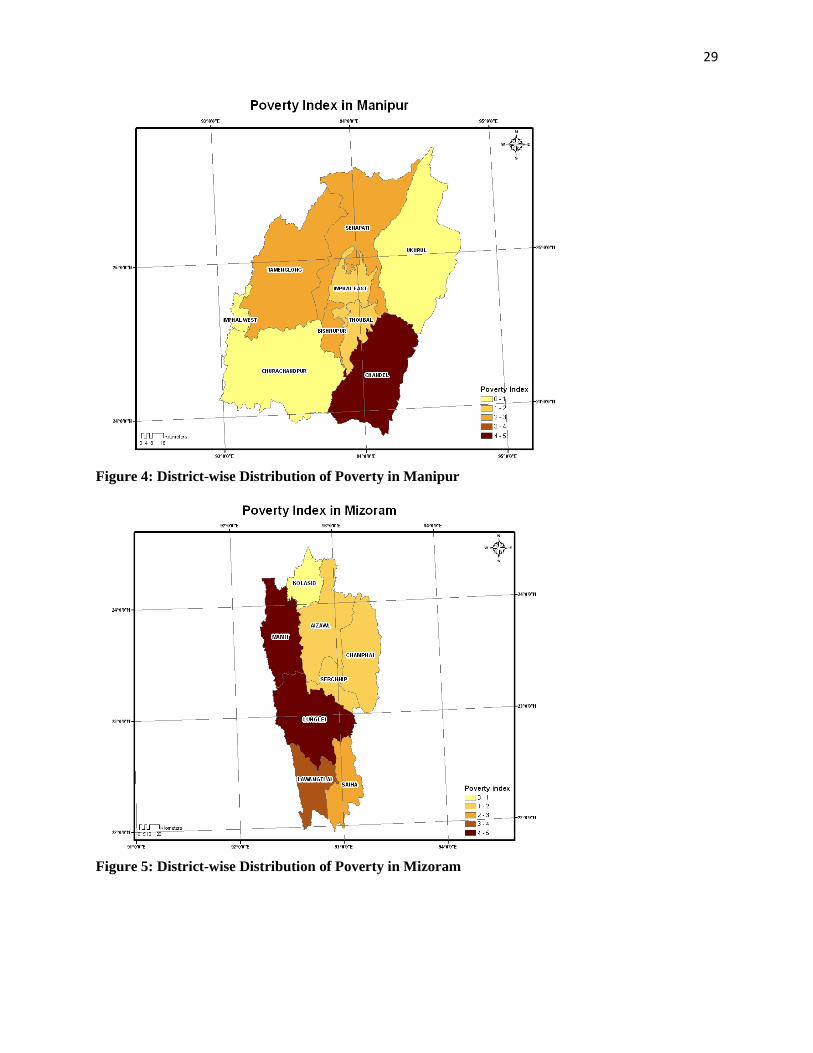
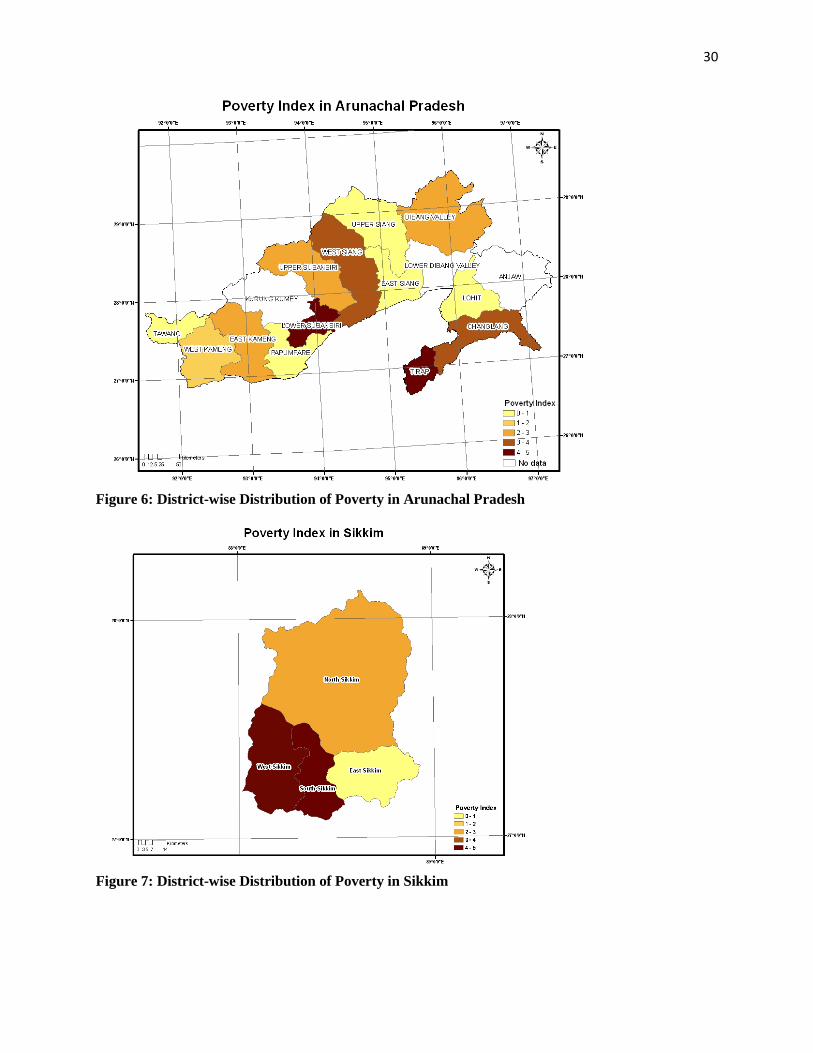
The poverty of the largest state North East, Assam, is spatially represented in Figure 3. The districts of Assam are evenly distributed on either ends of the poverty scale. Out of a total of 23 districts, 43% are low to very low poverty level and 39% are in the high to very high level of poverty. The main differentiating factor of these districts across the scale is their per capita income. The districts exhibiting the highest level of poverty are Dhubri and Kokrajhar which located at the western-most region of Assam and Nagaon, which is located in the middle of Assam. In the case of the State of Manipur (Figure 4), majority of districts (55%) exhibit low to very low level of poverty. The town of Imphal, the seat of Manipur Government and the surrounding districts exhibit low levels of poverty. Chandel is the poorest district in Manipur, with high levels of rural population and very high disparity of income. This district also shares a border with Myanmar. In the State of Mizoram (Figure 5), the majority (53%) of the districts exhibit low to very low levels of poverty. The districts of Mamit and Lawangtlai have the highest poverty levels, mainly due to low literacy levels and high disparities of income among the population. These districts are also located bordering Bangladesh. The district containing Aizawl, the capital of Mizoram, exhibits lower poverty levels. The northern-most state of Arunachal Pradesh (Figure 6) exhibits moderate to very high levels of poverty (69%). The population in Arunachal Pradesh is overwhelmingly rural, with low per capita income and low literacy rates, hence most susceptible to a climate related disaster. The population located around the urban centers is more educated, have higher per capita income and are thus more capable of coping with climate variability. The highest disparities of income are seen in Arunachal Pradesh.
In the State of Sikkim, West Sikkim and South Sikkim exhibit high levels of poverty, while East Sikkim and North Sikkim exhibit lower levels of poverty (Figure 7). The majority of population of Sikkim is agrarian, without much supplementary sources of income. The urban population of Sikkim is very low, even when compared to the rest of North-East states. The population around Gangtok (East Sikkim), the capital town is increasingly urbanized, thus are lower on the poverty index scale.
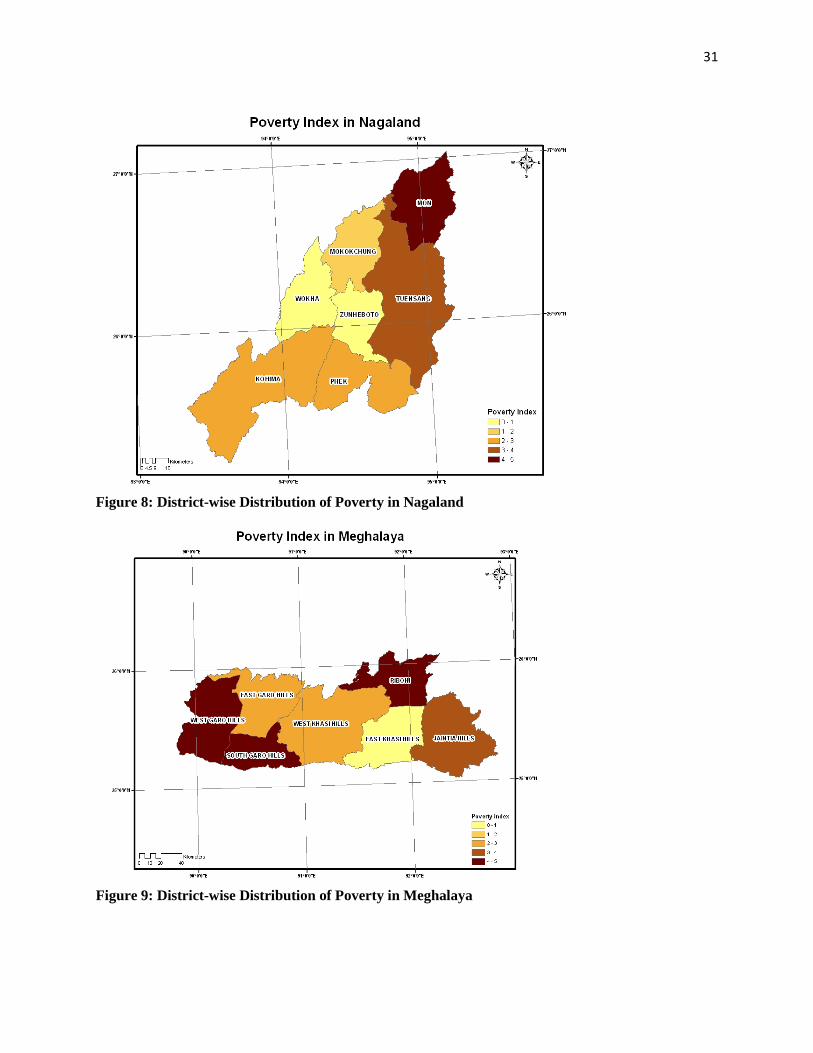
The State of Nagaland has the highest disparities in income of the North East Region. Two districts, Tuensang and Mon score high in the poverty scale (Figure 8). Kohima, even though it is the seat of the government, indicates moderate levels of poverty due to the percentage of literacy being very low. Four districts in Nagaland show low poverty levels and these are: Mokokchung, Zunheboto, Wokha and Dimapur. However, even in these districts the income disparities are very high, indicating inability of a large section of population to cope with climate related disasters.
In Meghalaya, when compared to other states, there are very high to moderate poverty levels (71%), only one district score very low in the poverty scale and that is East Khasi Hills (Figure 9). West Garo Hills, Ri-Bhoi and South Garo Hills indicate very high poverty levels. Here the per capita income, literacy rates, alternate income sources and urban population are very low. East Garo Hills, West Khasi Hills and Jaintia Hills have moderate poverty levels. In these districts, the per capita income and number of livestock with the landowners are higher when compared to the other districts of Meghalaya. Meghalaya is also another state where income disparities among the population are high.
14
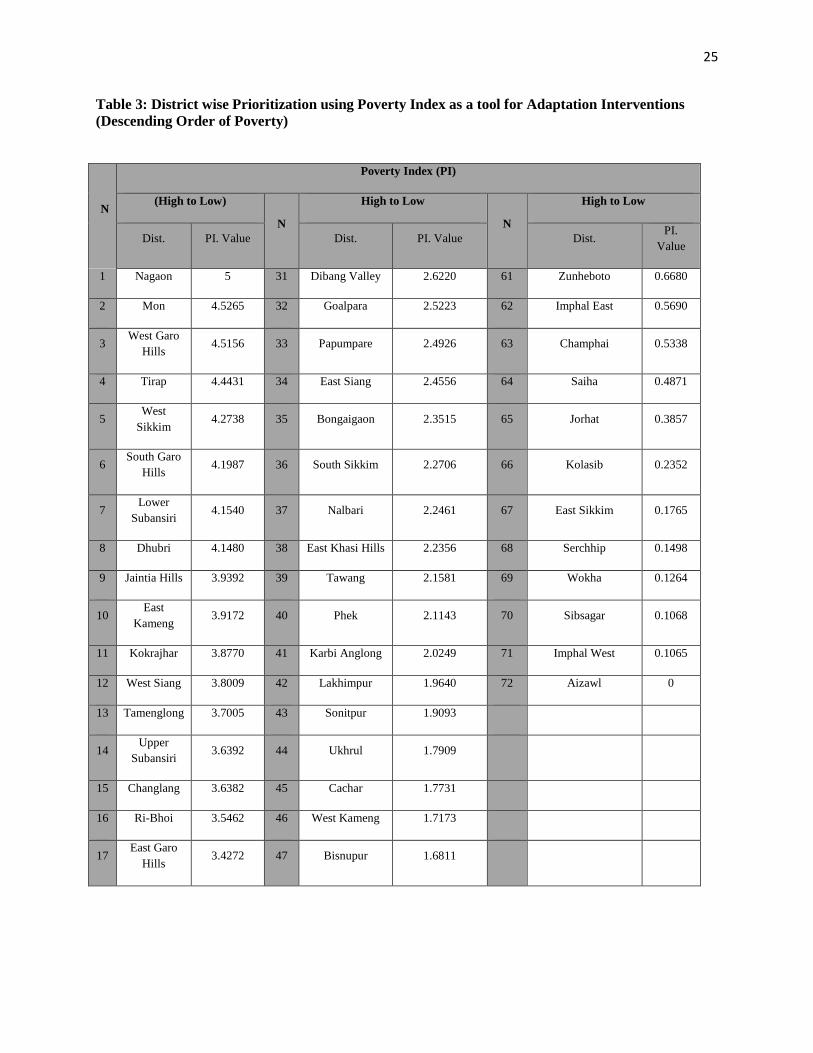
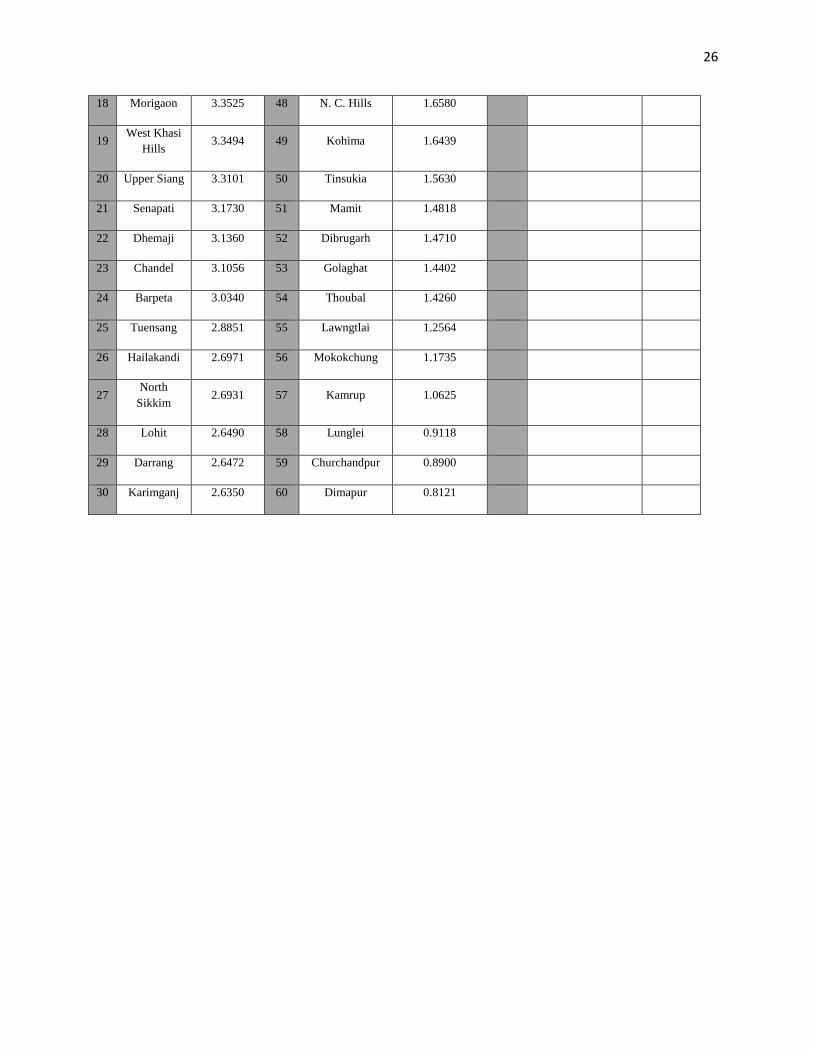
In summary, the poverty index developed has created a differential grouping of districts across the North-East India, according to levels of inability to adapt. Localized (district level here) distribution of interventions has several advantages, such as increased efficiency, cost savings and decreased moral hazard with the involvement of strong local institutions (Bardhan, 2002). A report by Transparency International (2006) states that accurate targeting and distribution of aid can prevent corrupt practices such double claims and charging fees for releasing aid. This district level prioritization tool will help deliver the adaptation interventions with maximum effectiveness. The prioritized list of districts of North East India, according to the descending order of poverty, is provided in Table 3. A fact to note here is that this is a district-wise prioritization; therefore all the 72 districts are ranked in descending order according to their overall poverty index values. In the state-wise analysis conducted earlier, the poverty is compared within states, and districts are prioritized within states.
In this section, we discussed the components of poverty index and the usefulness of poverty index in directed adaptation assistance towards poverty stricken communities, who might suffer from a climate related catastrophe. The level of poverty will determine the populations’ ability to adapt, but prior information of which area/location is most susceptible is required to determine the ability of poor communities of that particular location to adapt. It is in this situation that a vulnerability index is most applicable.
6. Comparison of Vulnerability Index and Poverty Index
In a previously conducted district-wise study of India, O’Brien et al (2004) calculated a climate sensitivity, adaptive capacity, impact sensitivity, and vulnerability to globalization. However the case study analyses were concentrated on Rajasthan, Andhra Pradesh and Karnataka and the district-wise vulnerability of North-East India was not reported.
Ravindranath, et. al., (2011) developed district-wise vulnerability profiles for North East India, using a vulnerability index, constructed using biophysical, climate variability and climate change indicators. The variables used in the construction of the vulnerability index were: Relative and percentage annual variability of rainfall, area under rainfed/rural crops, Rural population density, Number of agricultural holdings < 2ha, Net Sown area, Area under irrigated crops, area under high yielding varieties, amount of fertilizers consumed, amount of manure consumed, net annual groundwater availability and mean rainfed crop yield. The district level poverty index developed here is mainly composed of socio-economic variables is designed as a tool for adaptation intervention, so as to prioritize actions, financial assistance or other actions such as, shelter options, healthcare assistance, etc.
A correlation analysis conducted between the vulnerability index developed by Ravindranath et. al. (2011), and the poverty index developed here, found positive correlation. However, since the poverty index is developed from socioeconomic variables, and the vulnerability index is developed from mostly biophysical and climate variables, the absolute value of correlation is low (+0.06). Thus it is necessary to use both the poverty and vulnerability indices in tandem or in weighted combinations as per the requirements of the user.
15
7. Implications about Poverty in North-East India and suggestions of adaptation interventions in this region From the analysis conducted in this paper, it was discovered that majority of the districts (53%) exhibit moderate to very high poverty levels, whereby interventions are needed to tackle this problem. The North-East Council has published two studies, a vision 2020 document (2008) and an approach to poverty eradication (2010), both these documents detail some poverty reducing mechanisms that are tailored for North –East region. These adaptation interventions include:
• Promotion of cultivation with short –duration high yielding varieties of rice, wheat, maize, vegetables with adequate fertilization and pesticides.
• The promotion of long-term agro-horticultural crops where the jhum cultivation has left fallow land with less nutrients
• The mostly tribal populations displaced due to jhum cultivation are to be trained in cottage industries and other livelihood options
• Increasing the number of higher educational institutions to improve the skills of the local populace. Institutions such as IIT Guwahati, North East Hills University and Assam Agricultural University are pioneers; however the research facilities in these universities must be improved.
• Strengthening infrastructure options like roads, highways, and broadband connectivity and creating a centre of trade and commerce
• Gender mainstreaming through microfinance loans to females and empowering people through participatory governance of institutions, with gender quotas
With the utilization of the district-wise poverty index, these interventions can be provided to communities in order of their need. All the interventions listed above can be allocated to vulnerable districts using the poverty index developed. Considering certain interventions in detail, the North- East India has a deficiency in the production of cereal crops, hence there is presence of vulnerability here. This vulnerability can be effectively addressed by the public distribution system (PDS) of the North East India in case of climate-related disaster. Most of these districts may also be susceptible to the vulnerability of food grain diversification due to corruption, hence the poverty index can be used as a tool by the PDS in the case of ensuring the distributed food supplies reach the villages most in need. In the case of a particular infrastructure intervention such as creation of all weather roads, the poverty index can be utilized to allocate the road funds in a phased manner to districts that require the development, where already the introduction of new high yielding, short duration varieties of crops have been conducted using the poverty index. This will help complete the input, product and market linkages. In the case of development of secondary sectors (North – East Council, 2010) as the rural artisanal groups and encouragement of local handicrafts, the poverty index can assist in prioritizing villages for introduction of new looms and technology to support designing. In the case of the tertiary sector development as laid out by the Government of India, through the programs such as ‘The Swarnajayanthi Gram Swarozgar Yojana’ and ‘The Pradhan Mantri Rozgar Yojana’ (financial assistance to poor, but self employed people), the poverty index can be used as a tool for providing assistance, since the index will give a guidance of directing the assistance using this programs. The case of disaster assistance is straightforward, currently North –East India is experiencing very poor official response to the increasing occurance of floods ( Reuters, http://blogs.reuters.com/india/2012/09/27/another-year-of-poor-flood-response-in-northeast-india/, 2012 ) this poverty index can be utilized by the National Disaster Management Agency in providing assistance to the most needy. As mentioned earlier in this paper, in the short-term, the frequency of floods and droughts are predicted to increase in the short-term. There is urgent need for localized infrastructure development and disaster preparedness, where the poverty index can assist in
16
prioritization for such infrastructure development. In conclusion, the poverty index developed is not only applicable for disaster and overseas development assistance disbursement, but also the prioritization of the rural development programs of India.
8. Conclusions and Recommendations A poverty index was developed in the entire North East Region to prioritize adaptation of the region. North East was chosen due to its lag in its growth when compared to the rest of India. The main conclusions of this study were that the rural population dominates the North East region; hence Agriculture is the main source of income. However, some alternate sources of income such as livestock production are distributed evenly across the states, so that the farmers do have livelihood sources if there is a climate related disaster. We observed very high land income disparities (as measured by Gini Coefficient) being high in several states such as Arunachal Pradesh, Nagaland and Meghalaya. The high Gini coefficients are due to the high numbers of subsistence farmers are high and low numbers of large landowners across the North East. Considering the 72 districts of North – East India; very high poverty is observed in 14 districts, high poverty is observed in 11 districts, moderate poverty is observed in 14 districts, low poverty is observedin16 districts and very low poverty is observed for 17 districts. This might be due to the phenomenon of denser population around the towns and sparse distribution of the population in the hilly regions. The development projects targeting North East should enhance the tribal/agricultural livelihood sources and try to improve literacy rates of the population. Some of the livelihood options include encouraging cultivation of short-duration, high yielding varieties of rice, encouraging mainstream educational & alternative skill development and improving the institutional flexibility. These adaptation interventions should be targeted in the next five year plans by obtaining more funding from National/International development agencies. A correlation analysis revealed positive correlation between a previously developed vulnerability index (Ravindranath et. al., 2011) and the poverty index; however, since the indicators that compose them are very dissimilar, the absolute value of the correlation represents the issue. Each index has its advantage; vulnerability index is more localities specific and has elements of exposure and sensitivity in it, while the poverty index is designed solely from an adaptation intervention point of view. A combination of these two indices should be used as per the specific need of a policy practitioner; a poverty index might be used when adaptation interventions have to be directed towards a relatively new region, where biophysical and climate change/variability data is unavailable.
In development of an “adaptation intervention” prioritizing mechanism for a region with a combination of high and low poverty areas, the poverty index developed performs well, distributing the districts among equally among the poverty classifications of very high, high, moderate, low and very low. In addition to performing well in prioritizing adaptation intervention, the index can be utilized for the impact analysis studies of the ODA, where this prioritized list can be used to select the most poor and the least poor districts to compare the aid effectiveness. As the discussion aid effectiveness, is gaining strength in development literature (Hansen and Tarp, 2001), the poverty index offers a method for selection of districts for evaluation. The indicators used to create this poverty index are selected from macro economic data and not from survey data, hence, this index can be utilized for aid allocation to inaccessible areas, as present in North-East India. The index can be used with minimum transformation to prioritize adaptation interventions in other regions of the world with regional imbalances in development.
17
9. References Adger, W.N., Brooks, N., Bentham, G., Agnew, M. and Eriksen, S. (2004) New Indicators of Vulnerability and Adaptive Capacity. Tyndall Centre for Climate Research. Anand, S., and Sen, A. K., 1994. Human Development Index: Methodology and Measurement. Occasional Papers, Human Development Report Office, United Nations Organization, New York, New York. Bardhan, P., 2002. Decentralization of Governance and Development. Journal of Economic Perspectives 16(4): 1865-205
Barrett, et al., 2007, Poverty Traps and Climate andWeather Risk Limitations and Opportunities of Index-based Risk Financing, The International Research Institute for Climate and Society, IRI TECHNICAL REPORT NUMBER 07-03.
Brooks, N., Adger, W. N., and P. M. Kelly, 2005. The Determinants of Vulnerability and Adaptive Capacity at the National Level and the Implications for Adaptation, Global Environmental Change, 15, 151-163.
Carter, T.R., R.N. Jones, X. Lu, S. Bhadwal, C. Conde, L.O. Mearns, B.C. O’Neill, M.D.A. Rounsevell and M.B. Zurek, 2007. New Assessment Methods and the Characterization of Future Conditions. Climate Change 2007: Impacts, Adaptation and Vulnerability. Contribution of Working Group II to the Fourth Assessment Report of the Intergovernmental Panel on Climate Change, M.L. Parry, O.F. Canziani, J.P. Palutikof, P.J. van der Linden and C.E. Hanson, Eds., Cambridge University Press, Cambridge, UK, 133-171
China’s National Climate Change Program, 2010. http://www.ccchina.gov.cn/cn/index.asp
Downing, TE, Butterfield, R, Cohen, S, Huq, S, Moss, R, Rahman, A, Sokona, Y and Stephen, L (2001) Vulnerability Indices: Climate Change Impacts and Adaptation, UNEP Policy Series, UNEP, Nairobi.
Eriksen, S. E. H., Klein, R. J. T., Ulsrud, K., Naess, L. O. and O’Brien, K. O., 2007. Climate Change Adaptation and Poverty Reduction, Key Interactions and Critical Measures, Report prepared for the Norwegian Agency for Development Cooperation (NORAD), Oslo, Norway.
Gallopin, G, C, 2006, Linkages between Vulnerability, Resilence and Adaptive Capacity, Global Environment Change, 16, 293-303.
Hansen, H., and Tarp, F., 2001, Aid Effectiveness Disputed, http://www.oecd.org/development/evaluationofdevelopmentprogrammes/2664921.pdf .
Hashim, S. R., 2009. Economic Development and Urban Poverty, in India: Urban Poverty Report, United Nations Development Program. NY, NY.
18
International Monetary Fund, 2011. Fact Sheet on Poverty Reduction Strategy Papers, http://www.imf.org/external/np/exr/facts/prsp.htm. IPCC (Intergovernmental Panel on Climate Change) 2007. Climate Change 2007: Synthesis Report. Contribution of Working Groups I, II and III to the Fourth Assessment Report of the Intergovernmental Panel on Climate Change [Pachauri, R.K and Reisinger, A. (eds.)]. IPCC, Geneva, Switzerland, 104 pp.
Kelly P M, Adger W N (2000) Theory and practice in assessing vulnerability to climate change and facilitating adaptation, Climatic Change, 47, 325 -352.
Klein, R. J. T., 2011. Mainstreaming Climate Adaptation into Development: A Policy Dilemma. in: Ansohn, A., and Pleskovic, B., (eds.) Climate Governance and Development, The World Bank, Germany, pp 35-52.
Locatelli B, Herawati H, et al, (2008) Methods and Tools for Assessing the Vulnerability of Forests and People to Climate Change, Forest Perspectives No.5, CIFOR, Bogor, Indonesia.
Luers, A L, The surface of vulnerability: An analytical framework for examining environmental change, Global Environmental Change 15 (2005) 214–223 McCarthy, J. J., O. F. Canziani, N. A. Leary, D. J. Dokken, K. S. White, Eds., 2001: Climate Change 2001: Impacts, Adaptation, and Vulnerability. Cambridge University Press, 1032 pp. Mertz, O., Halsnæs, K., Olesen, J. E., Rasmussen, K., 2009. Adaptation to Climate Change in Developing Countries, Environmental Management. 43, 743–752. Ministry of Development of North Eastern Affairs (DONER), 2011. The North Eastern Council, Poverty Eradication/Alleviation in North Eastern India: An Approach. http://mdoner.gov.in/index2.asp?sid=237 .
Ministry of Development of North Eastern Region, 2009. Annual Report, 2007-09. Online at: http://mdoner.gov.in/writereaddata/sublinkimages/DoNER-AR-2010-115734712018.pdf .
Moss, R H, Brenkert, A L, Malone E L, (2001) Vulnerability to Climate Change: A Quantitative Approach, Research Report Prepared by the Pacific North West National Laboratory, Prepared for the U.S. Department of Energy, Under Contract DE-AC06-76RLO 1830.
Munich Personal RePEC Archive, 2009. Human Development Report on North Eastern India: A Bird’s Eye View, http://mpra.ub.uni-muenchen.de/17015/.
National Commission on Women, 2001. Agriculture Sector in India. http://ncw.nic.in/pdfreports/Impact%20of%20WTO%20Women%20in%20Agriculture.pdf .
North East Finance Development Corporation, 2010. North East Data Bank, http://db.nedfi.com/
O’Brien et. al., 2004, Mapping vulnerability to multiple stressors: climate change and globalization in India, Global Environmental Change 14 (2004) 303–313.
19
Organization of Economic Development and Cooperation, 2009. Policy Guidance on Integrating Climate Change Adaptation into Development Co-operation, Report prepared by the Development Assistance Committee and Environmental Policy Committee of the OECD. www.oecd.org
Pettengell, C., 2010. Climate Change Adaptation: Enabling People Living in Poverty to Adapt. Oxfam Research Report, www.oxfam.org Planning Commission of India, 2007a. Spatial Development and Regional Imbalances. The Eleventh Five Year Plan of India, pp. 137-151. http://planningcommission.nic.in/plans/planrel /fiveyr/11th/11_v1/11v1_ch7.pdf
Planning Commission of India, 2007b. Environment and Climate Change, The Eleventh Five Year Plan of India, pp. 191-207. http://planningcommission.nic.in/plans/planrel/fiveyr/11th/11_v1/11v1_ch9.pdf Planning Commission of India, 2009. Data and Statistics, http://planningcommission.nic.in/data/central/index.php?data=centab, Planning Commission of India, 2011. Interim Report on the Low Carbon Strategies for Inclusive Growth, http://planningcommission.gov.in/reports/genrep/Inter_Exp.pdf. Prime Ministers’ Council on Climate Change, Government of India, 2010. National Action Plan on Climate Change, http://pmindia.nic.in/climate_change.htm Ravindranath, N. H., Rao, S., Sharma, N., Nair, M., Gopalakrishnan, R., Rao, A. S., Malviya, S., Tiwari, R., Sagadevan, A., Munsi, M. and Bala, G. 2011. Climate Change Vulnerability Profiles for North East India, Current Science, Special Issue on Climate Change, 101(3), 384-394. Rawal, V., 2008. Ownership Holdings of Land in Rural India: Putting the Record Straight, Economic & Political Weekly, March 8, 2008. Reuters India Blog, 2012, Another Year of Poor Flood Response in the North –East India, http://blogs.reuters.com/india/2012/09/27/another-year-of-poor-flood-response-in-northeast-india/ Rupa Kumar, K., et al. 2006, High Resolution Climate Change Scenarios for 21st Century, Current Science, 90 (3), 334-345. Sen, A. K., 2003.The Importance of Basic Education. Keynote Speech at the Commonwealth Education Conference, 15th Conference of Commonwealth Education Ministers, Edinburgh, Scotland, United Kingdom, 27-30 October 2003. Thornton, P, K, 2010, Livestock Production, Recent Trends, Future Prospects, Phil. Trans. R. Soc. B (2010) 365, 2853–2867 doi:10.1098/rstb.2010.0134 Thornton, P.K., Mude, A., Ouma, R., Herrero, M., Notenbaert, A., Steeg, J.A.van de, Kariuki, J., and Ayantunde, A. 2008. Vulnerability, climate change, and livestock: Challenges and Opportunities for the
20
Poor. Invited paper for the CTA Seminar, Implications of Climate Change for Sustainable Agricultural Production Systems, Ouagadougou, Burkina Faso, 26-31 October 2008. Nairobi (Kenya): ILRI. Transparency International, 2006. Corruption in Humanitarian Aid. Transparency International. Alt Moabit, 9610559 Berlin. http://www.transparency.org/news_room/in_focus/2006/humanitarian_relief Vincent, 2004, Creating an index of social vulnerability to climate change for Africa, Working Paper 56, Tyndall Centre for Climate Change Research, Oxford University Vyas, S., and Lilani Kumaranayake, Constructing Socio-Economic Status Indices: How to use Principal Component Analysis, Health Policy and Planning, 21 (6), 459-468. Yohe, G., and R. S. J. Tol, 2002, Indicators for Social and Economic Coping Capacity - Moving toward a Working Definition of Adaptive Capacity, Global Environmental Change, 12 (2002) 25-40.
21
Table 1: Gini Coefficient of All the Districts of North East India (Descending Order from highest to lowest inequality)
N
Gini Coefficient Value (between 0 and 1; 0 => no inequality,1=>very high inequality)
(High to Low) N
High to Low N
High to Low
Dist. Gini Dist. Gini Dist. Gini
1 Changlang 0.9942 31 Wokha 0.6134 61 Imphal East 0.5105
2 Upper Siang 0.9889 32 Dhubri 0.6110 62 Kamrup 0.5099
3 Papumpare 0.9722 33 Dibang valley 0.6050 63 Tawang 0.5090
4 West Siang 0.9564 34 Kolasib 0.5960 64 Jorhat 0.5075
5 Kohima 0.9395 35 Karimganj 0.5952 65 Churachandpur 0.4992
6 East Kameng 0.9199 36 Nagaon 0.5947 66 Saiha 0.4885
7 Dimapur 0.9132 37 West Sikkim 0.5941 67 Nalbari 0.4881
8 Tamenglong 0.8853 38 Bisnupur 0.5908 68 Darrang 0.4813
9 East Garo Hills 0.8853 39 Karbi Anglong 0.5879 69 Sonitpur 0.4806
10 East Khasi Hills 0.8853 40 Lunglei 0.5858 70 Bongaigaon 0.4773
11 Jaintia Hills 0.8853 41 Dibrugarh 0.5819 71 Serchhip 0.4603
12 Ri-Bhoi 0.8853 42 Lakhimpur 0.5817 72 Morigaon 0.4477
13 South Garo Hills 0.8853 43 Ukhrul 0.5764
14 West Garo Hills 0.8853 44 South Sikkim 0.5684
15 West Khasi Hills 0.8853 45 Kokrajhar 0.5679
16 Lohit 0.8636 46 Hailakandi 0.5663
17 Lower Subansiri 0.8578 47 Aizawl 0.5659
18 Phek 0.8545 48 Tinsukia 0.5646
19 Upper Subansiri 0.8496 49 East Sikkim 0.5632
22
20 East Siang 0.8441 50 Zunheboto 0.5605
21 North Sikkim 0.8441 51 Lawngtlai 0.5544
22 Tirap 0.8095 52 Senapati 0.5453
23 Mamit 0.7263 53 Dhemaji 0.5377
24 Chandel 0.7066 54 Thoubal 0.5347
25 Tuensang 0.6597 55 N.C.Hills 0.5287
26 Mokokchung 0.6555 56 Barpeta 0.5269
27 Cachar 0.6484 57 Golaghat 0.5253
28 Mon 0.6376 58 Imphal West 0.5206
29 West Kameng 0.6300 59 Goalpara 0.5194
30 Champhai 0.6174 60 Sibsagar 0.5140
23
Table 2: Distribution of District-wise Poverty Profiles of North East India
Poverty Index Range Profile State Districts No of
Districts % of Districts in Poverty profile
Very High
Assam Kokrajhar, Dubri, Nagaon 3 13%
Manipur Chandel 1 11%
Mizoram Lunglei, Mamit 2 25%
Arunachal Pradesh Lower Subansiri, Tirap 2 15%
Sikkim South Sikkim, West Sikkim 2 50%
Nagaland Mon 1 13%
Meghalaya West Garo Hills, Ri-Bhoi, South Garo Hills
3 43%
Subtotal 14 19%
High
Assam Hailakandi, Nalbari, Darrang, Barpeta, Dhemaji, Morigaon
6 26%
Manipur 0 0%
Mizoram Lawngtlai 1 13%
Arunachal Pradesh West Siang, Chianglang 2 15%
Sikkim 0%
Nagaland Tuengsang 1 13%
Meghalaya Jaintia Hills 1 14%
Subtotal 11 16%
Moderate
Assam Lakhimpur.Bongaigon, Karimganj, Golpara
4 17%
Manipur Bisnupur, Senapati, Tamenglong
3 33%
Mizoram Saiha 1 13%
Arunachal Pradesh East Kameng, Upper Subansirir, Dibang Valley
3 23%
Sikkim North Sikkim 1 25%
Nagaland Phek, Kohima 2 25%
Meghalaya East Garo Hills, West Khasi Hills
2 28%
Subtotal 14 22%
24
Low
Assam Dibrugarh, Golaghat, Sonitpur, Tinsukia, NC Hills, Cachar,
7 30%
Manipur Imphal East, Thoubal 2 22%
Mizoram Aizawl, Sercchip, Champhai 3 38%
Arunachal Pradesh West Kameng 1 8%
Sikkim 0%
Nagaland Mokokchung 1 13%
Meghalaya
Subtotal 14 19%
Very Low
Assam Sibsagar, Jorhat, Kamrup 3 13%
Manipur Imphal West, Churchandpur, Ukhrul
3 33%
Mizoram Kolasib 1 13%
Arunachal Pradesh Papumpare, Tawang, East Siang, Upper Siang, Lohit
5 38%
Sikkim East Sikkim 1 25%
Nagaland Dimapur*, Wokha, Sunheboto 3 38%
Meghalaya East Khasi Hills 1 14%
Subtotal 17 24%
Total North East India 72 100%
* Dimapur District of Nagaland is not available in the spatial software for mapping
25
Table 3: District wise Prioritization using Poverty Index as a tool for Adaptation Interventions (Descending Order of Poverty)
N
Poverty Index (PI)
(High to Low)
N
High to Low
N
High to Low
Dist. PI. Value Dist. PI. Value Dist. PI. Value
1 Nagaon 5 31 Dibang Valley 2.6220 61 Zunheboto 0.6680
2 Mon 4.5265 32 Goalpara 2.5223 62 Imphal East 0.5690
3 West Garo Hills
4.5156 33 Papumpare 2.4926 63 Champhai 0.5338
4 Tirap 4.4431 34 East Siang 2.4556 64 Saiha 0.4871
5 West
Sikkim 4.2738 35 Bongaigaon 2.3515 65 Jorhat 0.3857
6 South Garo
Hills 4.1987 36 South Sikkim 2.2706 66 Kolasib 0.2352
7 Lower
Subansiri 4.1540 37 Nalbari 2.2461 67 East Sikkim 0.1765
8 Dhubri 4.1480 38 East Khasi Hills 2.2356 68 Serchhip 0.1498
9 Jaintia Hills 3.9392 39 Tawang 2.1581 69 Wokha 0.1264
10 East
Kameng 3.9172 40 Phek 2.1143 70 Sibsagar 0.1068
11 Kokrajhar 3.8770 41 Karbi Anglong 2.0249 71 Imphal West 0.1065
12 West Siang 3.8009 42 Lakhimpur 1.9640 72 Aizawl 0
13 Tamenglong 3.7005 43 Sonitpur 1.9093
14 Upper
Subansiri 3.6392 44 Ukhrul 1.7909
15 Changlang 3.6382 45 Cachar 1.7731
16 Ri-Bhoi 3.5462 46 West Kameng 1.7173
17 East Garo
Hills 3.4272 47 Bisnupur 1.6811
26
18 Morigaon 3.3525 48 N. C. Hills 1.6580
19 West Khasi Hills
3.3494 49 Kohima 1.6439
20 Upper Siang 3.3101 50 Tinsukia 1.5630
21 Senapati 3.1730 51 Mamit 1.4818
22 Dhemaji 3.1360 52 Dibrugarh 1.4710
23 Chandel 3.1056 53 Golaghat 1.4402
24 Barpeta 3.0340 54 Thoubal 1.4260
25 Tuensang 2.8851 55 Lawngtlai 1.2564
26 Hailakandi 2.6971 56 Mokokchung 1.1735
27 North
Sikkim 2.6931 57 Kamrup 1.0625
28 Lohit 2.6490 58 Lunglei 0.9118
29 Darrang 2.6472 59 Churchandpur 0.8900
30 Karimganj 2.6350 60 Dimapur 0.8121
27
Figure 1: Map of North East India Source: http://www.delhipolicygroup.com/programs/peace-and-conflict-indian-peacemaking-kashmir-afghanistan-pakistan/indian-peacemaking-jammu-kashmir-north-east.html
28
Figure 2: Distribution of the Districts of North East India under the Poverty Index Profile
Figure 3: District-wise Distribution of Poverty in Assam
29
Figure 4: District-wise Distribution of Poverty in Manipur
Figure 5: District-wise Distribution of Poverty in Mizoram
30
Figure 6: District-wise Distribution of Poverty in Arunachal Pradesh
Figure 7: District-wise Distribution of Poverty in Sikkim
31
Figure 8: District-wise Distribution of Poverty in Nagaland
Figure 9: District-wise Distribution of Poverty in Meghalaya

![Index [assets.cambridge.org]assets.cambridge.org/97811070/21259/index/9781107021259_index.pdfIndex ... Index](https://img.pdfslide.us/doc/110x75/5e6e9051865fe77870536fbb/-index-index-index.jpg)


![2 3 4 5 void ordered_fill (float* array, int array_length) { int index; for (index = 0; index < array_length; index++) { array[index] = index; }](https://img.pdfslide.us/doc/110x75/56649e0d5503460f94af6e07/2-3-4-5-void-orderedfill-float-array-int-arraylength-int-index-for.jpg)

![Index [assets.cambridge.org]assets.cambridge.org/97805211/95591/index/9780521195591...Index ... Index Index](https://img.pdfslide.us/doc/110x75/60d574a113c9786842650971/-index-index-index-index.jpg)
![INDEX [] · 2019-04-15 · INDEX ... index](https://img.pdfslide.us/doc/110x75/5e5bc6adf543e8499e5ad9a4/index-2019-04-15-index-index.jpg)
![index [] · index ... index](https://img.pdfslide.us/doc/110x75/5e33c50d475fc05b6d5265f9/index-index-index.jpg)
![[IUSIL Index & Sustainabe Index]](https://img.pdfslide.us/doc/110x75/577c80071a28abe054a7016a/iusil-index-sustainabe-index.jpg)