Embed Size (px)
Citation preview

CHAPTER-1
COMPANY PROFILE

INTRODUCTION
Malhotra Spinners Private Ltd. is a Private company incorporated on 6 th Jan 1998. Malhotra
Spinners Private Limited's Corporate Identification Number (CIN) is U17116
PB1998PTC020907, Registration Number is 020907. It is classified as Indian Non-Govt.
Company and is registered at Registrar of Companies, Chandigarh. Its authorized share capital is
Rs.15,000,000 and its paid up capital is Rs.8,103,000.
Malhotra is spinners Private Ltd. Annual General Meeting CA GM was last held on 20 th Sept.
2013 and as per records from Ministry of Corporate Affairs CMCAN. It’s balance sheet was last
filed on 31st March 2013.
Malhotra Spinner is registered address is Wait Ganj Ludhiana Punjab. There and 3 directors of
Malhotra a Spinner Private Ltd. Current Status of Malhotra Spinners Private Ltd. is Active. It is
a Private Company. It is classified as limited by shares.
Malhotra Spinners Private Limited currently have 3 Active Directors / Partners: Som Nath,
Rajeev Malhotra, Sanjay Kumar Malhotra, and there are no other Active Directors / Partners in
the company except these 3 officials.
Malhotra Spinners Private Limited is currently in Active Status.
Company Name MALHOTRA SPINNERS PRIVATE LIMITED
Cin U17116PB1998PTC020907
Registration Date 06/01/1998
Registeration No. 020907
Address Wait Ganjludhiana, Punjab - , Punjab, India

CHAPTER-2
ABSENTEEISM:
AN INTRODUCTION

2.A.1) CONCEPT OF ABSENTEEISM:-
Employee’s Presence at work place during the schedule time is highly essential for the smooth
running of the production process in particular and the Organisation in general. Despite the
significance of their presence, employees sometime fail to report at the work place during the
schedule time, which is known as ‘absenteeism’.
Labour Bureau, Simla, define the term ‘absenteeism’ as “the failure of a worker to report for
work when he scheduled to work.” Labour Bureau also state that “absenteeism is the total man-
shifts lost because of absence as a percentage of the total number of man-shifts scheduled to
work”
According to Webster’s Dictionary, Absenteeism is the practice or habit of being an ‘absence’
and an absentee is one who habitually stay away”.
It signifies unscheduled absents of an employee from work which is unauthorized
unexplained, avoidable & willful absence from work the rate of absenteeism can be calculated
when number of person schedules to work & number actually present are calculated. Absence
may be caused by uncontrollable circumstance like sickness and accident etc. it may be willful,
unauthorized or authorized. The absence may be authorized or unauthorized willful or caused by
circumstances beyond are’s control. It has been observed that the phenomenon of absenteeism
does not exist only in Indian industry; it is a universal fact. The difference is only in terms of
magnitude. The rate of absenteeism varies from 7%to nearly 30%. In same occupations, it has
risen to the abnormal level of 40% in same region; the extent of absenteeism may differ from
industry, place to place and occupation to occupation, it may also differ according to the make up
of the workforce. Absenteeism may be extensive in a particular department of an industry or a
concern.

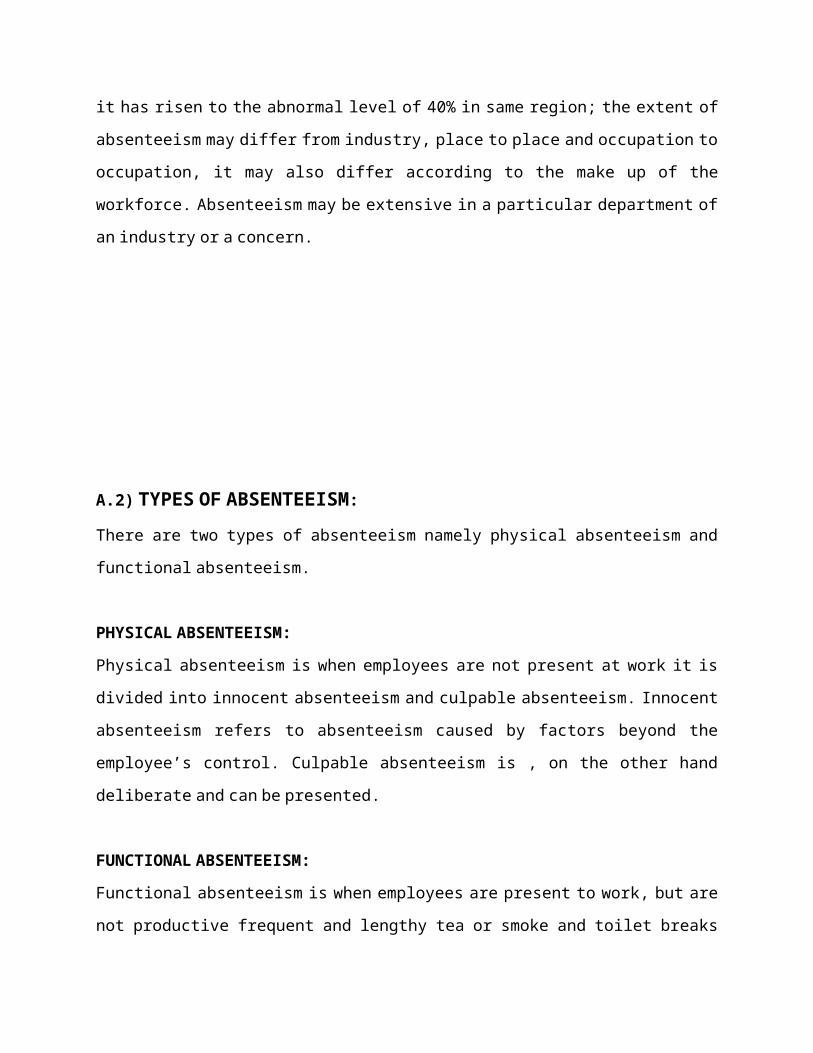
A.2) TYPES OF ABSENTEEISM:
There are two types of absenteeism namely physical absenteeism and functional absenteeism.
PHYSICAL ABSENTEEISM:
Physical absenteeism is when employees are not present at work it is divided into innocent
absenteeism and culpable absenteeism. Innocent absenteeism refers to absenteeism caused by
factors beyond the employee’s control. Culpable absenteeism is , on the other hand deliberate
and can be presented.
FUNCTIONAL ABSENTEEISM:
Functional absenteeism is when employees are present to work, but are not productive frequent
and lengthy tea or smoke and toilet breaks examples of types of absenteeism. Absent also means
arriving late, leaving early, attending and spending undue length of time in fetching or carrying
tools or looking for information.
B.1) CAUSES OF ABSENTEEISM
Human relations systems (part of HRM). Often these can be linked to Herzberg’s hygiene Aside
from genuine illness, the main causes of absenteeism are failures of the firm’s factors, such as:
Poor working conditions, making workers uncomfortable or even causing injury.
A failure to respect individuals and to be concerned with their needs.
A failure to respect individuals and be concerned with their needs.
A failure of teamwork, leading to feelings of alienation or even bullying.
Over supervision, leading to stress or the feeling of not being trusted.
Inappropriate tasks, leading to stress as workers are unable to complete their tasks
satisfactorily.
Pay rates that the employees feel are too low for their skills.
B.2) THE COSTS OF ABSENTEEISM
For a firm the costs of absenteeism can be very high:-
Lost production as the worker is unable to catch up with the work that was
missed.
It maybe necessary to offer extra overtime in order to complete an order on time.
This will increase the costs of the firm and lower their overall profits unless they
can raise the price to compensate.
If workers sense that there is a trend of absenteeism, they will tend to take more
days off themselves, this will lead to the problem snowballing
How much is absenteeism costing your organisation?
1. WHY?
Absenteeism costs organisation in a number of ways:
Direct costs - The cost of temporary labour to cover absent staff is estimated at
£13.2 billion for the whole economy (2008). This equates to 3.1% of payroll for a
typical employer
Indirect costs - These include issues such as the effect on the quality of your
customer services and are estimated at £20 billion for the whole economy.
2. WHEN?
These are just some of the occasions when absenteeism can affect your business:
Persistent lateness/regular intermittent absences
Long-term absence that has a disproportionate effect both on payroll costs and
management time
Non-genuine absences. A survey (by CBI/AXA) indicates that this accounts for
12% of absence on average, equating to 21 million working days per year
3. WHAT?
What areas can we help with?
Identify the causes of absence
Conduct Absentee Management Audits;
Review current absence management strategies and their effectiveness
Review current corporate culture on absence and employee communications
Identify the impact of long-term and short-term absences
Identify stress related problems

Assess your occupational health processes
Manage absences resulting from industrial injuries and disabilities
4. HOW?
Our approach to dealing with absenteeism will analyse your organisation and not follow generic
methods.This allows us to:
Identify the issues that affect your organisation
Analyse and provide constructive feedback on the issues identified
Provide bespoke reports on the issues
Advise on how best to tackle the problems using tact and diplomacy
Assist with any required implementation
C) CALCULATION OF ABSENTEEISM RATE:-
Using the Standard U.S. Department of Labour formula, the rate of absenteeism is calculated by
dividing the number of working days lost through absence in any given period by the total
number of available working days in that same period.
Absenteeism Rate = ( Number of lost working days due to absence/ No. of Employees X No. of
workdays available)*100
Example;
No. of employees = 100
No. of available workdays = 20
Total no. of lost days = 93
Absenteeism rate = 93/(100 x 20) X100 = 4.65%
D) MEASURES TO REDUCE ABSENTEEISM :-
When a firm is faced with high levels of absenteeism it will look to the HRM department for
remedies, such as:
Flextime – allows workers some degree of control over the hours they are at
work. It can help to relieve pressures caused by such things as child care and

transport problems, which would otherwise lead to workers taking time off as
though they were sick.
Job enrichment – a satisfying, challenging job will ensure that workers will want
to go to work.
Improved HRM – making workers feel more valued will allow people to feel
more committed to the workforce. Employees who feel part of a team will not
want to let others down.
Attendance bonuses – these are paid to workers who attend regularly. This is a
controversial idea, recent studies have shown that they may not actually increase
attendance.
E) EFFECTS OF ABSENTEEISM ON INDUSTRY
Absenteeism
↓
Affects production targets
↓
Increases the work load of inexperienced & less experienced
↓
Leads to rejection of finished products
↓
Increases the cost of production
↓
Lowers the Profit margin
↓
Affects Industrial growth

EFFECTS OF ABSENTEEISM ON WORKERS
Absenteeism
↓
Reduces his earnings
↓
Adds his indebtedness
↓
Decreases the Purchasing power
↓
Leads to family problems
↓
Increases mental stress
↓
Leads to inefficiency in his job
↓
Loss of employment
14

CHAPTER-3
REVIEW OF LITERATURE

REVIEW OF LITERTAURE
At first we will discuss the different determinants which were found to have a relevant
impact on Manpower absenteeism by previous research. To be able to keep a clear overview,
the discussion of these factors will be divided into four categories. The four categories used
throughout the study are: demographics, health characteristics, household characteristics and
job characteristics.
2.1. Demographics
Employee absence behaviour is expected to vary with socio-demographic characteristics.
This section will discuss the influence of gender, age and educational attainment on
employee absenteeism.
2.1.1. Gender
Women are expected to be absent more often since they are, traditionally seen, more inclined
with taking care of the household (Barmby, Ercolani and Treble, 2002), but also other
explanations were found in the literature.
Steers and Rhodes (1978) support the view that traditionally the family responsibilities, such
as taking care of sick children, are ascribed to the wife or mother. Johns (2003) and Barham
and Begum (2005) discuss similar explanations. Barham and Begum (2005) even found a
similar rate of absence for women with or without dependent children while commonly is
perceived that presence of children is associated with a higher rate. A study of Cuelenaere
(1997) showed that most sick women did not resume work until they were fully recovered,
whereas most men often (partially) resumed work even when they were not fully recovered.
Geurts, Kompier and Grundemann (2000) further state that women are alleged by the media
to hold lower work values because they make less serious attempts to resume work after
sickness. Two final explanations mentioned by Johns (2003) are that, compared to men,
women appeared to be more restless and busier during a scheduled day off. And secondly
that women may experience or respond more negatively or proactively to stressful or
dissatisfying events at work and use time off as an adjective mechanism.

Steers and Rhodes (1978), Geurts, Kompier and Grundemann (2000), Barmby, Ercolani and
Treble (2002), Johns (2003), Gimeno et al. (2004), Barham and Begun (2005) and Leaker
(2008)
2.1.2. Age
Despite much previous research, many contradictory evidence is found regarding the
relationship between age and absenteeism. On one hand it is often argued that older
employees will be absent more since older people are expected to be sick more. On the other
hand also much research discusses a difference in work attitude between older and younger
employees. Since health aspects are controlled for and will be discussed later on, this
research will focus on the latter explanation. Older workers often show a higher commitment
to their company. Another explanation discussed for lower absence among older workers
regards the higher opportunity costs for being absent.
The basis for this view can be found in the theories concerning the labour-leisure choice
framework (Allen, 1981) and organizational commitment (Gellatly, 1995). Like Drago and
Wooden (1992) explain in their research, the higher absence rate among younger workers
can be expected because of the greater opportunity cost of forgone leisure. They further state
that younger workers are typically very mobile between jobs and thus will be less committed
to the firm and workgroup than older workers are. Allen and Meyer (1993) and Hackett,
Bycio and Hausdorf (1994) also state that affective and continuance commitment tends to be
higher for older than for younger employees, as well for employees with longer, rather than
shorter, organizational tenure. Analysis from Leaker (2000) concerning absenteeism in the
United Kingdom supports the statement that younger employees are more likely to take
sickness absence than older employees.
Barham and Begum (2005), Clegg (1983), Hackett (1990) and Leaker (2008) find support for
the negative relation and Barmby, Ercolani and Treble (2002), Bergendorf et al. (2004),
Geurts, Kompier and Grundemann (2000) and Lusinyan and Bonato (2007) find support for
a positive relation between age and absenteeism. Although ambiguous results are found in
previous research, a negative relation between age and absenteeism is expected.

2.1.3. Education
A far less often tested factor in relation to absenteeism is level of education. It is expected
that employees have finished their education before they started working. As such this factor
will merely focus on whether significant differences can be found between absenteeism and
highest finished level of education. In general it is to be expected that education will be
inversely associated with absence (Drago and Wooden, 1992). The higher level of education
finished, the less absent this person will be. This expectation is mostly based upon the fact
that better educated people are assumed to be healthier.
Koopmanschap et al. (1993) showed in their research that absence from work is strongly
related to education and also that lower educated people have a higher risk of becoming
disabled. An explanation for this result could be that increased educational attainment is
related to greater knowledge about health (Winkleby, Fortmann and Barrett, 1990). This is in
line with the statement that education could influence a persons‟ judgment regarding their
capacity to work Lag (1962).
Drago and Wooden (1992), Steers and Rhodes (1978), Granlund (2010), Winkleby Fortmann
and Barret (1990) and Koopmanschap et al. (1993) all found a negative relation between
education and absenteeism. In line with the literature this study also expects a negative
relation between the level of education and absenteeism.
2.2. Health characteristics
Probably the most important indicators of absenteeism are related to the health of employees.
While other factors have their impact on influencing the absence rate, health itself, for
example general illness, is the most occurring reason for an employee to be absent. Better
health associated with lower sickness absence (Lusinyan and Bonato, 2007). The factors
discussed in this category will discuss how self-assessed health, certain health lifestyles, such
as Body Mass Index (BMI) and smoking, and whether a person is hampered in his normal
activities by his illness relate to absence.
2.2.1. Health status
Self-assessed health status is an increasingly common measure of health in empirical
research and has shown to provide a trustworthy view of a person’s health (Linn and Linn,

1980; Crossley and Kennedy, 2002). It could be understood that people who assess their
health better, thus rate their own health at a higher degree, are likely to be absent less often.
People hampered by their health in their daily activities, for example disabled and
chronically ill people, can be expected to have higher absence rates. Disabled and chronically
ill people can also be expected to rate their own health lower. Which, as explained, also
relate to a higher absence rate.

CHAPTER-4
RESEARCH
METHODOLOGY

A) STATEMENT OF PROBLEM
Study of Absenteeism among Industrial Worker is not only from view point of but it is
important from the view point of moral of employees. Even though the effect of the good morale
of employees, may not be calculated in terms of costs, but it should be said that, it is important
than cost.
There is a clear relationship between high absenteeism and employees moral, because it
can easily traced that these department having high rate of absenteeism have low moral.
There is a clear relationship between employee’s attitude & absenteeism. They are related
to each other. So employee’s attitude & morale are the important factors. Labors is Human
Factor, therefore consideration shall also be taken into account in the discussion of problem
connected in the absenteeism has been continuous to be one of the major labors problem in
Indian Industries.
As “No work No pay” is usually the general rule, the loss to workers absenteeism is quite
obvious when the workers fail to attend to the regular work, there income is reduced and the
workers become still poorer. Hence, Health and efficiency of the worker is affected by the
irregularity of the workers attendance.
The loss of employees and industry is due to absenteeism is still greater and both
efficiency and discipline suffer the maintenance of additional workers leads to serious
implications.
Thus the above discussions show how the problem of absenteeism is very important to
the organization. So, I have selected this problem of study.
B) SCOPE OF THE PROJECT

The project study is conducted in Malhotra Spinning Pvt. Ltd. The sample chosen for the study
includes the regular workers of the organization.
C) NEED FOR THE RESEARCH
“Workers aren’t just the faces in the crowd, they are the real performers”. Workers’
absenteeism is one of the primary factor that influence the working of the organization. Infact the
rate of absenteeism is an indicator of organizations state of health and also its supervisory and
managerial effectiveness
One of the major problems affecting this precious resource is absenteeism. Absenteeism is not
only an individual problem but also a social as well as economic problem of our country. When
absenteeism becomes a habit there is not only general lowering of morale, but also results in loss
and deterioration of skill and efficiency. This may lead an organization to attain reduced
productivity. Decrease in production will affect the profits of the company.
To control the rate of absenteeism we should know what absenteeism is and study the factors
such as personal factors, social factors and environmental factors responsible for absenteeism.
Reducing the rate of absenteeism is not a simple task.
So, there is a great need for the research and analysis of absenteeism in the organization.
D) OBJECTIVES OF THE STUDY
To study the level of absenteeism in the company.
To analysis various factors that cause absenteeism in company. .
To Identifying the rate of absenteeism and causes of it.
To identify the measures to control absenteeism.
RESEARCH DESIGN :
“A research design is the arrangement of conditions for collection and analysis data in a manner
to combine relevance to the researcher purpose with economy in procedure”
It constitutes the blueprint for the collection, measurement and analysis of data. As such design
includes an outline of what the researcher will do form writing the hypothesis and its operational
implications to the final analysis of data.
As such the design includes an outline of what the researcher will do from

writing the hypothesis and its operational implications to the final analysis of data.
More explicit, the decisions happen to be in respect of:
What is the study about?
Why is the study being made?
Where will the study be carried out?
What type of data is required?
Where can the data found?
What periods of time will the study include?
What will be the sample design?
How will the data be analyzed?
In what style will the report be prepared?
What techniques of data collection will be used?
The Research Design undertaken for the study is Descriptive one. A study, which wants to
portray the characteristics of a group or individuals or situation, is known as Descriptive study. It
is mostly qualitative in nature. The main objective of Descriptive study is to acquire knowledge.
Tools of Data Collection
1. Interview with the employees.
2. Discussion with the managers.
3. Time Office records and leave registers.
4. Handbook of Company
5. Questionnaire
DESCRIPTION OF STATISTICAL TOOLS USED
PERCENTAGE METHOD
In this project Percentage method test was used. The percentage method is used to know the
accurate percentages of the data we took, it is easy to graph out through the percentages. The
following are the formula
No of Respondent Percentage of Respondent = ______________________x 100

Total no. of Respondents
From the above formula, we can get percentages of the data given by the respondents.
SAMPLING
Research work was conducted by taking a sample of 100 employees of 426 (excluding
apprentice trainees and contract labors) from the company; the sample was sufficient and
representative for the purpose of this research work. To study the problem clearly numbers of
employees from each department were selected on the basis of the size of the department as well
as nature of the work. Questionnaires are printed in English for the convenience of employees
and lot of efforts had to be taken to collect the required data from the selected sample of
employees representing the population.
The questions in the questionnaire are framed on the basis of the factors responsible for
absenteeism. i.e.,
1. Personal Factors - (Age, Educational qualification, marital status, income level, etc.)
2. Environment and Social factors – (Climatic conditions, family functions, other sources of
income, festivals, Nature of dwelling, etc.,
20

CHAPTER-V
DATA ANALYSIS
&
INTERPRETATION

DATA ANALYSIS & INTERPRETATION
Analysis Using Percentage Method
Personal Details:
1.Age of Respondent
Table: Various age groups of respondent
S.No Otion Response
1 <25 years 40
2 25-35 44
3 >35 years 16
Total 100
Inference :
In the above pie chart out of 100 respondents 40% respondents are below 25 years, 44%
respondents between 25-35 years and remaining 16% respondents are of above 35 years.
From the above chart it is clear that majority of respondents are between the age group of 25-35
years.

2. Sex of Respondents:
Table: Sex of Respondents
S.No Option Response
1 Male 48
2 Female 52
Total 100
Inference :
In the above pie chart out of 100 respondents 52% respondents are female and 48% respondents
are male.
From the above chart it is identified that majority of respondents are female.

3.Marital Status:
Table: Marital Status
S.No. Option Response
1 Married 57
2 Unmarried 43
Total 100
Inference:
In the above chart out of 100 respondents, 57% respondents are married and remaining 43%
respondents are unmarried
From the above pie chart it seems to be clear that majority of respondents are married in the
company.

4.Years of Service:
Table:Years of Service
S.No. Option Response
1 <1 16
2 1 to 2 28
3 2 to 3 8
4 4 to 5 20
5 >5 28
total 100
Inference :
In the above chart out of 100 respondents, 16% respondents are below one year of service ,28%
respondents are between 1 to 2 years of service ,8% respondents have 2-3 years of service,20%
respondents are between 4-5 years of service and remaining 28% have above 5 years of service.
From above chart it is clear that majority of respondents have 1-2 and >5 years of service in the
company.

5.Academic Qualification:
Table: Academic Qualification Of Respodents
S.No.Option Response
1 <5th 20
2 5th 25
3 8th 29
4 10th 16
5 12th 10
Total 100
Inference :
According to the survey out of 100 respondents 20% respondents are <5 th , 25% respondents are
5th passed, 29% respondents are 8th passed, 16% respondents are 10th passed and only 10%
respondents are 12th passed.

From the above chart it is clear that majority of respondents are 8 th passed and only 10%
respondents are 12th passed .
6.Do you find your job interesting?
Table: Job Interest
S.No Option Response
1 Yes 95
2 No 5
total 100
Inference :
According to the survey out of 100 respondents 95% respondents find their job interesting
and only5% respondents do not find their job interesting.
In the company most of respondents find their job interesting i.e 95% .

7.Is your work tiring?
Table: Is work tiring
S.No Option Response
1 Always 18
2 Sometimes 45
3 Often 5
4 Never 32
Total 100
Inference:
According to pie chart, 18% respndents says that their work is tiring always, 45% respondents
says that their work is tiring sometimes, 5% respondents says that work is tiring often and
remaining 32% respondents says that their work is not tiring.
It is clear from above that majority of respondents feels their work is tiring sometimes.

CHI-SQUARE TEST-1
TO TEST THE RESPONDENT’S RESPONSE ON WORK TIRING
Option No. of Respondents %ageAlways 18 18
Sometimes 45 45
Often 5 5
Never 32 32
Note: χ2= 7.81, for υ=3; Significant at 0.05 level
Hypothesis :
Null Hypothesis (Ho): There is no significant relationship between works tiring.
Alternative Hypothesis (H1): There is close significant relationship work tiring.
O E O-E (O-E)2 (O-E)2/E
Always 18 25 -7 49 1.96
Sometimes 45 25 20 400 16
Often 5 25 -20 400 16
Never 32 25 7 49 1.96
35.92
Where,
O is Observed value
and, E is expected value
(O-E)2/E = 35.92
n-1 = 4-1= 3 Degree of freedom
n = number of variables
The significance level = 0.05
So, 7.81 is Tabulated
Calculated > Tabulated

There, Null Hypothesis is rejected i.e. majority of respondents feels their work is tiring
sometimes.
8.Which shift do you find more difficult to work?
Table: Difficult Shift to Work (Male Workers)
S.No Option Response
1 Morning 5
2 Evening 8
3 Night 35
Total 48
Inference :
Only male workers works in all shifts and female workers works only in morning shift.
In the above chart out of 48 respondents(males) only 10% respondents find their job difficult in
morning shift, 17% respondents find evening shift difficult to work and 73% respondents find
night shift difficult to work.
It is clear from above that most of workers find night shift difficult to work.

CHI-SQUARE TEST-2
TO TEST THE RESPONDENT’S RESPONSE ON DIFFICULT SHIFT TO WORK
Option No. of Respondents %ageMorning 5 9
Evening 8 12
Night 35 70
Morning 5 9
Note: χ2= 7.81, for υ=3; Significant at 0.05 level
Hypothesis :
Null Hypothesis (Ho): There is no significant relationship between difficult shift to work.
Alternative Hypothesis (H1): There is close significant relationship difficult shift to work.
O E O-E (O-E)2 (O-E)2/E
Morning 5 12 -7 49 4.08
Evening 8 12 -4 14 1.16
Night 35 12 23 529 44.08
Morning 5 12 -7 49 4.08
53.5
Where,
O is Observed value
and, E is expected value
(O-E)2/E = 53.5
n-1 = 4-1= 3 Degree of freedom
n = number of variables
The significance level = 0.05
So, 7.81 is Tabulated
Calculated > Tabulated

There, Null Hypothesis is rejected i.e. most of workers find night shift difficult to work
9.Are you required overtime in your job?
Table: Require overtime in your job
S.No Option Response
1 Always 31
2 Sometimes 41
3 Often 0
4 Never 28
Total 100
Inference :
In the above chart out of 100 respondents only 31% respondents always required overtime in
their job, 41% respondents required overtime sometime, 0% respondent says often and 28%
respondents never required any overtime in their job.

From the above chart it is clear that majority of workers sometimes required overtime in their
job.
10.Does company take strict action against absenteeism?
Table: Strict action against absenteeism
S.No. Option Response
1 Yes 42
2 No 58
Total 100
Inference :
According to the survey, out of 100 respondents majority of workers i.e 58% says that their is no
strict action against absenteeism in the company and remaining 42% says there is strict action
against absenteeism.

11.Are you given due recognition for excelling in your job?
Table: Being recognized for excelling in your job
S.No Option Response
1 Always 25
2 Sometimes 60
3 Often 5
4 Never 10
total 100
Inference :

In the above chart, 25% respondents says that they are recognized for excelling job always, 60%
says that they are recognised for excelling in their job sometimes, 5% says often and remaining
10% says that they are never excelling for their job.
Majority sys that sometimes they are recognised for excelling in their job.
12.Does co-workers help you in work related problems?
Table: Does co-workers help you
S.No Option Response
1 Yes 100
2 No 0
total 100
Inference :
According to the survey, 100% respondents says that their co-worker help them in their work at
shop floor in the company.

13.What is the satisfaction level of help from co-worker?
Table: Satisfaction with help:
S.No Option Response
1 Highly satisfied 5
2 Satisfied 70
3 Moderate 25
4 Dissatisfied 0
Total 100
Inference :

According to the survey out of 100 respondents says that their satisfaction level with co-worker
help – 5% respondents are highly satisfied, 70% respondents are satisfied, 25% respondents
have moderate level of satisfaction with co-workers help.
From chart it ts clear that majority of respondents i.e70% are satisfied with their co-worker’s
help in work related problems at shopfloor.
14.Are you satisfied with the oppurtunities provided by the company for your
career advancement?
Table: Satisfaction with oppurtunity provided by the company:
S.No Option Response
1 Highly satisfied 5
2 Satisfied 65
3 Moderate 25
4 Dissatisfied 5
total 100
Inference :

In the survey out of 100 respondents 5% respondents are highly satisfied with the opportunities,
65% rspondents says that they are satisfied with opportunities provided by the company, 25%
respondents says that it is moderate and only 5% respondents are dissatisfied.
From the above chart it is clear that majority of workers i.e. 65% are satisfied with the
opportunities provided by company.
15.Do you have any other source of income?
Table: Any other source of income
S.No Option Response
1 Yes 8
2 No 92
Total 100
Inference :
Acording to the survey out of 100 respondents only 8% says that they have another source of
income ,92% respondents says that they don’t have any other source of income.
From the above it is clear that maximum of workers don’t have any other source of income.

16.Nature of work:
Table: Nature of work
S.No Option Response
1 Hard 10
2 Moderate 65
3 Better 25
Total 100
Inference :
In the above chart, out of 100 respondent 10% respondents says that nature of work is hard. 65%
says that nature of work is moderate, 25% says that nature of work is better .

From above chart it is find that 65% respondent says that nature of work is moderate in the
company
17.Do you get a rest day in a week?
Table: Get rest in a week
S.No Option Response
1 Always 80
2 Sometimes 0
3 Often 20
4 Never 0
Total 100

Inference :
According to the survey, out of 100 respondent 80% respondents says that they always get a rest
in a week, 20% respondent says that they often get a rest in a week , sometimes and never
respondent are 0%.
Most of respondents always get a rest in a week.
18.what'the preferable day to be absent?
Table: Which day prefer more absent
S.No Option Response
1 After rest day 38
2 Mid week 12
3 Before rest day 19
4 None 31
Total 100
Inference :

According the survey, out of 100 respondent 38% respondents says that they prefer more absent
after rest day ,12% respondents prefer absent in the mid week ,19% respondents prefer absent
after rest day and 31 % respondents never prefer absent.
From the above chart it is clear that majority of respondent prefer more absent after rest day
19.What is your opinion about working conditions offered by the org.?
Table : Your opinion about working conditions
S.No Option Response
1 Very good 10
2 Good 75
3 Average 15
4 Poor 0
Total 100

Inference :
According to the survey ,out of 100 respondents 10% respondents says that working condition is
very good in the company,75% respondents says that it is good,15% says that working condition
is average and no respondents said poor.
From the chart it is clear that majority of respondents says that working condition is good in the
company.
20 do you want long leave?
Table: Go for long leave
S.No Option Response
1 Yes 72
2 No 28
Total 100
Inference :

According to the survey, out of 100 respondents 72% respondents says that yes they go for long
leave, and only 28% said no they never go for long leave .
21.How many times you plan to take long leave in a year?
Table: Plan to take long leave
S.No Option Response
1 Once 56
2 Twice 21
3 Thrice 0
4 No idea 23
Total 100
Inference :

According to the pie chart, out of 100 respondents 56% respondent said that they plan once for
long leave in a year , 21% said they plan twice in a year, and 23% said that they have no idea
when to take long leave.
Most of respondents plan once for long leave.
22.What is the reason for long leave?
Table: Reason for long leave
S.No Option Response
1 Health problems 21
2 Family Reasons 33
3 Festivals 23
4 Agriculture 8
5 Marriages 15
Total 100

Inference: In the above pie chart, out of 100 respondents - 21% go long leave due to health
problems, 33% says family reasons, 23% said festivals, 8% says agriculture, and 15% take long
leave for marriages.
Majority of respondent plan to take long leave due to family reasons.
23.Are you satisfied with permitted leaves?
Table: Satisfaction with permitted leave
S.No Option Response
1 Yes 46
2 No 54
Total 100
Inference :

According to the survey, out of 100 respondents 46% respondents says yes they are satisfied
with permitted leave in the company,54% respondent says they are not satisfied with permitted
leave.
Majority says that they are not satisfied with the permitted leave.
24a.After completion of long leave, do you overtime?
Table: Overstay after completion of long leave
S.No Option Response
1 Yes 47
2 No 53
Total 100
Inference :

According to the survey, out of 100 respondents 47% respondents says yes they overstay after
completion of long leave,and 53% of respondent said they never overstay after completion of
long leave.
b.If overtime, then why?
Table: Reasons for oversyay
S.No Option Response
1 Health problems 32
2 Family Reasons 21
3 Festivals 17
4 Agriculture 10
5 Marriages 20
Total 100

Inference :
According to the survey out of 100 respondents 32% respondents says that the health problem is
the main reason of their overstay,21% says family reasons is the reason of overstay, 17% says
reason of overstay is festivals, 10% of respondents says agriculture is the main reason of
overstay and only 20% respondents says that marriages is the reason of overstay.
Majority says that health & family problems are the reasons of overstay.
25.Is your organisation better than other?
Table: Your organisation is better than other
S.No Option Response
1 Yes 100
2 No 0
total 100

Inference :
According to the survey out of 100 respondents 100% respondents said that yes their
organization is better than other organizations and 0% respondent said no.

CHAPTER-VI
FINDINGS

FINDINGS
It is findings that:
100 respondents 95% respondents find their job interesting and only5% respondents do
not find their job interesting
Their work is tiring always, 45% respondents says that their work is tiring sometimes, 5%
respondents says that work is tiring often and remaining 32% respondents says that their
work is not tiring
Only male workers works in all shifts and female workers works only in morning shift.
31% respondents always required overtime in their job, 41% respondents required
overtime sometime, 0% respondent says often and 28% respondents never required any
overtime in their job
majority of workers i.e 58% says that their is no strict action against absenteeism in the
company and remaining 42% says there is strict action against absenteeism.
25% respondents says that they are recognized for excelling job always, 60% says that
they are recognised for excelling in their job sometimes, 5% says often and remaining
10% says that they are never excelling for their job.
100% respondents says that their co-worker help them in their work at shop floor in the
company.
5% respondents are highly satisfied, 70% respondents are satisfied, 25% respondents
have moderate level of satisfaction with co-workers help.
5% respondents are highly satisfied with the opportunities, 65% rspondents says that
they are satisfied with opportunities provided by the company, 25% respondents says that
it is moderate and only 5% respondents are dissatisfied.
8% says that they have another source of income ,92% respondents says that they don’t
have any other source of income.
10% respondents says that nature of work is hard. 65% says that nature of work is
moderate, 25% says that nature of work is better.
80% respondents says that they always get a rest in a week, 20% respondent says that
they often get a rest in a week , sometimes and never respondent are 0%.

38% respondents says that they prefer more absent after rest day ,12% respondents
prefer absent in the mid week ,19% respondents prefer absent after rest day and 31 %
respondents never prefer absent.
10% respondents says that working condition is very good in the company,75%
respondents says that it is good,15% says that working condition is average and no
respondents said poor.
72% respondents says that yes they go for long leave, and only 28% said no they never
go for long leave.
56% respondent said that they plan once for long leave in a year , 21% said they plan
twice in a year, and 23% said that they have no idea when to take long leave.
21% go long leave due to health problems, 33% says family reasons, 23% said festivals,
8% says agriculture, and 15% take long leave for marriages.
46% respondents says yes they are satisfied with permitted leave in the company,54%
respondent says they are not satisfied with permitted leave.
47% respondents says yes they overstay after completion of long leave,and 53% of
respondent said they never overstay after completion of long leave.
32% respondents says that the health problem is the main reason of their overstay,21%
says family reasons is the reason of overstay, 17% says reason of overstay is festivals,
10% of respondents says agriculture is the main reason of overstay and only 20%
respondents says that marriages is the reason of overstay.
100% respondents said that yes their organization is better than other organizations and
0% respondent said no.

CHAPTER-VII
SUGGESTION

SUGGESTIONS
Absenteeism is a serious problem for management because it involves heavy additional
expenses. The management should take the following measures to reduce the rate of
absenteeism:-
High collaborative culture.
Be aware of problems that may effect employee attendance or performance.
Develop open communication between managers, supervisors and employees.
Employees are encouraged to voice their concerns so their perceptions of the work place
are clear and can be dealt with.
Regularly scheduled department meetings are an excellent way not only to hear employee
perceptions and concerns but also to communicate organizational goals.
An employee’s relationship with their supervisor can greatly influence their feelings
about their work, their coworkers and thus their attendance at work.
More openness and transparency on the part of management.
Make each employee aware that they are a valued member of the ‘’team’’, that they play
an important role in your organization and that their attendance is critical.
Introduce an incentive scheme to reward those who don’t have an absent day. This is
measured quarterly and annually.
Sickness Reporting – Tell employees that they must phone in as early as possible to
advise why they are unable to make it to work and when they expect to return.
Bonus for unused sick leave.
Effective career planning and development program.
Effective training and development program.

CHAPTER-VIII
CONCLUSION

CONCLUSION
Finding and analysis reveals the following conclusion:
Majority of workers find their job interesting in the company .
Majority of workers find night shift difficult to work .
Absenteeism is more in the company after the rest days.
Workers absent due to more overtime.
Most of workers satisfied with cooperation of co-workers & superior.
Most of workers satisfied with opportunities provided by the company for their
advancement.
Workers plan to take long leave once in a year.
Most of workers go for long leave for family reasons, festivals & marriages.
Most of workers overstay after completion of long leave due to health and family
reasons.
There is no strict action against absenteeism in the organization.
Majority of worker are not satisfied with permitted leaves.

CHAPTER-IX
LIMITATION OF THE STUDY

Limitation of the study
The study was limited only to Malhotra Spinners Pvt. Ltd. only.
As sampling is taken as an element of the study there might always be sampling errors.
The sample under consideration may not reflect the whole population.
Survey and study has been carried out in a span of only 6 weeks due to time constraint.
Since absenteeism is a vast topic to be discussed, the study may not reflect each and
every aspect.

BIBLIOGRAPHY
BOOKS:
“HUMAN RESOURCE MANAGEMENT”
By C.B. GUPTA
Published by SULTAN CHAND &SONS, New Delhi.
WEBSITES:
www.malhotraspinners.com

QUESTIONNAIRE
STUDY ON WORKERS ABSENTEEISM IN
MALHOTRA SPINNERS PVT. LTD.
PERSONAL DETAILS :
1. Name………………………….
2. Age
a) <25years b) 25-35 c) >35years
3. Sex
a) Male b) female
4. Marital Status
a) Married b) Unmarried
5. No. of year of service
a) <1 year
b) 1-2 years
c) 2-3 years
d) 4-5 years e) >5 years
You are requested to select any one of the alternative which you feel correct in
your opinion, against each statement.
1. Do you find your job interesting?
o Yes o No
you find your work tiring?
o Always o Often o Sometimes

o Never
2. Which shift do you find more difficult to work?
o Morning o Evening o Night
3. Does your work require overtime?
o Always
o Often
o Sometimes
o Never
4. Does company take strict disciplinary action against absentee?
o Yes o No
5. Are you being recognition for excelling in your job?
o Always
o Often
o Sometimes
o Never
6. Does your co-workers help in work related problems?
o Yes o No
7. If yes, what is the satisfactory ?
o Highly Satisfied
o Satisfied
o Moderate
o Dissatisfied
o Highly Dissatisfied
8. Are you satisfied with the opportunities provided by the company for your advancement?
o Highly Satisfied
o Satisfied
o Moderate
o Dissatisfied
o Highly Dissatisfied
9. Whether you have any other source of income?
o Yes o No

A) Absent while working:-
11. Nature of work.
o Hard o Moderate o Better
12. Do you get rest in a week?
o Always
o Often
o Sometimes
o Never
13. what's the preferable day to be absent?
o After Rest Day
o Mid Week
o Before Rest Day
o None
14. What is your opinion about the working conditions offered by the organization?
o Very Good
o Good
o Average
o Poor
o No Idea
15. What is your reason for absenteeism from the work?
o Health problems
o Family Reasons
o Festivals
o Agriculture
o Marriage
B) Absent after long leaves or Overstaying:-
16. a. How many times you plan to take long leave in a year?
o One time o Twice o Thrice
b. For what reasons;
o Sickness
o Marriage
o Agriculture
o Death
o Festivals
17. How many days you want long leave?
o 10
o 15
o 20
o 1 month
18. How many days you are permitted for leave?
o 10
o 15
o 20
o 1 month
19. Are you satisfied with the permitted leaves?
o Yes o No
20. a. After completion of long leave, do you genrally overtime?
o Yes o No
b. If yes, then why?
o Sickness
o Marriage
o Festivals
o Agriculture
o Tiredness
o Grievance with co-workers

o Regenerating and Reenergizing
21. Having considered everything would you say your organization is better than other
organization?
Yes
No

Training Report On
Manpower Absenteeism In
Malhotra Spinners Pvt. Ltd.
Submitted to:
Punjab Technical University, Jalandhar
In partial fulfillment for the requirement
of the degree of
Masters of Business Administration
Session : 2013-2014
Submitted by:
Shipra
MBA (3rd Sem)
1334701
KHALSA INSTITUTE OF MANAGEMENT AND
TECHNOLOGY, LUDHIANA

ACKNOWLEDGEMENT
It is a great pleasure to have this opportunity to express my regards and sense of gratitude
to my guide it is due to her encouragement and proper suggestion this project work could
not be finished without their help in the time limit prescribed by the university.
I am also very much thankful to my parents & brother for their continue
encouragement and moral support during the project.
Last but not least I am also thankful to my friends who supported me during
the deed of the project work.

DECLARATION
I hereby certify that this training report entitled “A COMPREHENSIVE STUDY ON
MANPOWER ABSENTEEISM” in partial fulfillment of requirement for the award of
degree of M.B.A. submitted in the KHALSA INSTITUTE OF MANAGEMENT AND
TECHNOLOGY, LUDHIANA is an authentic record of my own work under the supervision of
Mr. Rajeev Malhotra. The matter present in this project has not been submitted by me in any
other University/Institute for the award of M.B.A. degree.
This is to certify that the above statement made by the candidate is correct to the best of
my knowledge.

INDEX
Ch. No. Topics Page No.
1. Company Profile 1-2
2. Absenteeism : An Introduction 3-9
3. Review of Literature 10-14
4. Research Methodology 15-19
5. Data Analysis and Interpretation 20-48
6. Findings 49-51
7. Suggestion 52-53
8. Conclusion 54-55
9. Limitations of the study 56-57
Bibliography 58
Questionnaires 59-62