Embed Size (px)
Citation preview
ed-TH / sa- WMT, PY
Focus on emerging growth corridors
• Rising supply in 2017 to dent market sentiment
• Higher demand for public housing due to raised
income ceiling could intensify competition in
affordable housing
• Demand at emerging growth corridors with huge
population catchments remains healthy
• BUY developers with niche expertise: Eco World,
MKH and Matrix Concepts
Subdued sentiment. Despite the recent share price recovery
for property developers, we believe the property market will
remain lacklustre in 2017, driven by persistently weak
sentiment, low affordability and accelerating incoming supply.
We believe more high-rise completions are expected this year
due to the delivery of projects with developer interest-bearing
scheme (DIBS) that developers capitalised on before it was
banned effective January 2014. This could continue to dent the
sentiment in the property market.
Intensifying competition in affordable housing. The
government has already prioritised the development of public
housing. PR1MA is set to complete 15,000 homes this year,
which is ~20% of recent year’s average completions. Also,
132,000 PR1MA houses are under construction now. The
raised household income eligibility to RM15,000/month and
reduced moratorium of five years will appeal to more middle-
income households, indirectly posing more competition to
private developers. Developers will have to revise their product
offerings to incorporate more ‘value-buy’ properties with
differentiating lifestyle amenities that will distinguish
themselves from lower-priced public housing, which could
come at the expense of margins.
Flattish sales targets. Developers under our coverage have
largely set flattish sales targets for 2017 in view of the still
challenging property market, despite the healthy demand at
certain emerging growth corridors with huge population
catchments such as Kajang/Semenyih, Sungai Buloh/Denai
Alam and Dengkil/Salak Tinggi.
Selective picks. We like Eco World, MKH and Matrix which
are township developers with niche expertise and established
brand names within local communities. The trio has achieved
their respective commendable sales targets in FY16 despite a
fair share of downward revisions by their peers amidst the
challenging environment.
KLCIKLCIKLCIKLCI : : : : 1,725.541,725.541,725.541,725.54
Analyst QUAH He Wei, CFA +603 2604 3966 [email protected]
STOCKS
Source: AllianceDBS, Bloomberg Finance L.P.
Closing price as of 8 Mar 2017
SP SetiaSP SetiaSP SetiaSP Setia :::: Sector leader - largest residential property developer by market cap
Sunway BhdSunway BhdSunway BhdSunway Bhd :::: Property and construction group with interests in quarrying, building materials manufacturing and trading.
UEM Sunrise BhdUEM Sunrise BhdUEM Sunrise BhdUEM Sunrise Bhd :::: Master developer of Nusajaya, high-end and commercial developer in Mont' Kiara and around KLCC
Eco WorldEco WorldEco WorldEco World :::: Township developer with 7,443 acres of land bank worth RM81bn GDV offering comprehensive range of products in Iskandar Malaysia, Klang Valley and Penang.
Eastern & Oriental BhdEastern & Oriental BhdEastern & Oriental BhdEastern & Oriental Bhd :::: Largest niche high-end developer with exposure to prime landbank in Penang, KL & Iskandar Malaysia
Matrix Concepts Holdings BhdMatrix Concepts Holdings BhdMatrix Concepts Holdings BhdMatrix Concepts Holdings Bhd :::: Matrix Concepts is one of the largest developers in Negeri Sembilan, focusing on its flagship township development, Bandar Sri Sendayan which covers 2,350 acres
MKH BerhadMKH BerhadMKH BerhadMKH Berhad :::: MKH is an established township developer in Kajang/Semenyih and Greater Klang Valley. Its 16k ha oil palm estates in Indonesia has started to contribute significantly
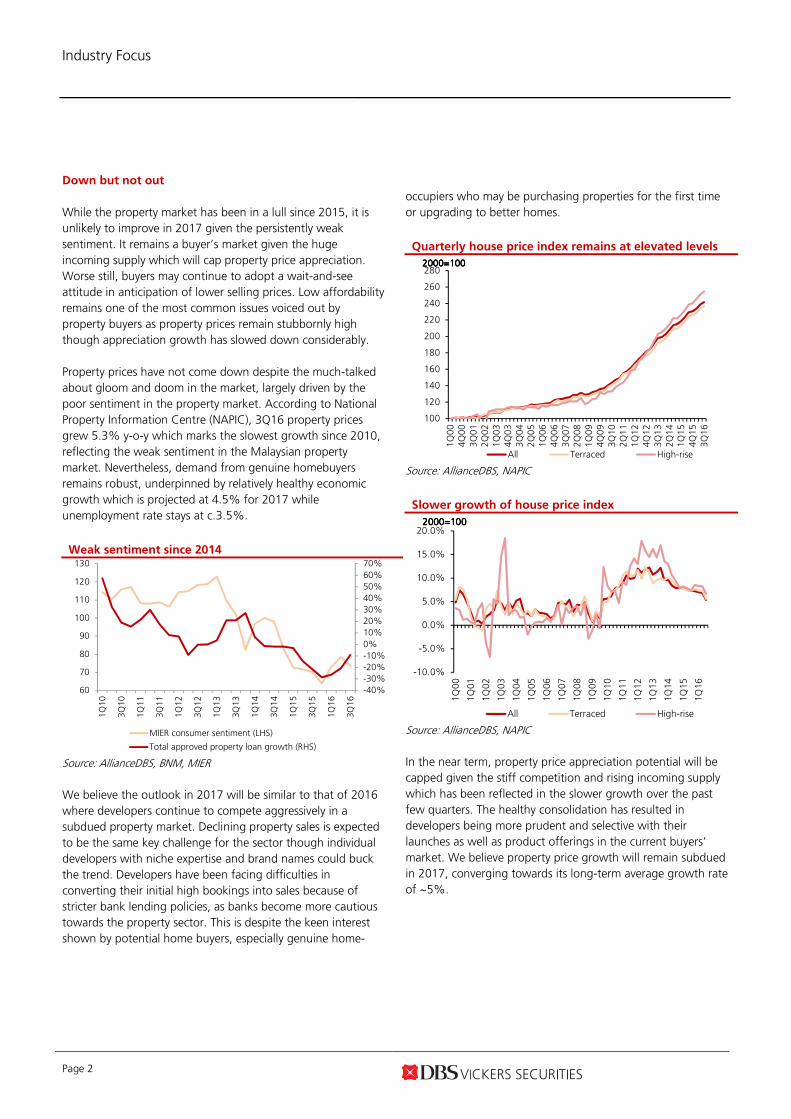
Weak consumer sentiment
Source: AllianceDBS, BNM, MIER
-40%
-30%
-20%
-10%
0%
10%
20%
30%
40%
50%
60%
70%
60
70
80
90
100
110
120
130
1Q10
3Q10
1Q11
3Q11
1Q12
3Q12
1Q13
3Q13
1Q14
3Q14
1Q15
3Q15
1Q16
3Q16
MIER consumer sentiment (LHS)
Total approved property loan growth (RHS)
DBS Group Research . Equity DBS Group Research . Equity DBS Group Research . Equity DBS Group Research . Equity
9 Mar 2017
Malaysia Industry Focus
Malaysia Property Refer to important disclosures at the end of this report
Price Price Price Price Mkt CapMkt CapMkt CapMkt Cap Target PriceTarget PriceTarget PriceTarget Price Performance (%)Performance (%)Performance (%)Performance (%)
RMRMRMRM US$mUS$mUS$mUS$m RMRMRMRM 3 mth3 mth3 mth3 mth 12 mth12 mth12 mth12 mth RatingRatingRatingRating
SP Setia 3.39 2,172 3.50 1.8 9.4 HOLD Sunway Bhd 3.16 1,436 3.00 6.8 3.6 HOLD UEM Sunrise Bhd 1.21 1,233 1.10 18.6 16.4 HOLD Eco World 1.55 823 1.80 12.3 20.2 BUY Eastern & Oriental Bhd
1.89 533 1.20 26.9 18.1 FV Matrix Concepts Holdings Bhd
2.51 322 3.10 2.5 4.2 BUY MKH Berhad 2.95 278 3.70 2.4 30.5 BUY
Industry Focus
Page 2
Down but not out
While the property market has been in a lull since 2015, it is
unlikely to improve in 2017 given the persistently weak
sentiment. It remains a buyer’s market given the huge
incoming supply which will cap property price appreciation.
Worse still, buyers may continue to adopt a wait-and-see
attitude in anticipation of lower selling prices. Low affordability
remains one of the most common issues voiced out by
property buyers as property prices remain stubbornly high
though appreciation growth has slowed down considerably.
Property prices have not come down despite the much-talked
about gloom and doom in the market, largely driven by the
poor sentiment in the property market. According to National
Property Information Centre (NAPIC), 3Q16 property prices
grew 5.3% y-o-y which marks the slowest growth since 2010,
reflecting the weak sentiment in the Malaysian property
market. Nevertheless, demand from genuine homebuyers
remains robust, underpinned by relatively healthy economic
growth which is projected at 4.5% for 2017 while
unemployment rate stays at c.3.5%.
Weak sentiment since 2014
Source: AllianceDBS, BNM, MIER
We believe the outlook in 2017 will be similar to that of 2016
where developers continue to compete aggressively in a
subdued property market. Declining property sales is expected
to be the same key challenge for the sector though individual
developers with niche expertise and brand names could buck
the trend. Developers have been facing difficulties in
converting their initial high bookings into sales because of
stricter bank lending policies, as banks become more cautious
towards the property sector. This is despite the keen interest
shown by potential home buyers, especially genuine home-
occupiers who may be purchasing properties for the first time
or upgrading to better homes.
Quarterly house price index remains at elevated levels
Source: AllianceDBS, NAPIC
Slower growth of house price index
Source: AllianceDBS, NAPIC
In the near term, property price appreciation potential will be
capped given the stiff competition and rising incoming supply
which has been reflected in the slower growth over the past
few quarters. The healthy consolidation has resulted in
developers being more prudent and selective with their
launches as well as product offerings in the current buyers’
market. We believe property price growth will remain subdued
in 2017, converging towards its long-term average growth rate
of ~5%.
-40%
-30%
-20%
-10%
0%
10%
20%
30%
40%
50%
60%
70%
60
70
80
90
100
110
120
130
1Q10
3Q10
1Q11
3Q11
1Q12
3Q12
1Q13
3Q13
1Q14
3Q14
1Q15
3Q15
1Q16
3Q16
MIER consumer sentiment (LHS)
Total approved property loan growth (RHS)
100
120
140
160
180
200
220
240
260
280
1Q00
4Q00
3Q01
2Q02
1Q03
4Q03
3Q04
2Q05
1Q06
4Q06
3Q07
2Q08
1Q09
4Q09
3Q10
2Q11
1Q12
4Q12
3Q13
2Q14
1Q15
4Q15
3Q16
2000=1002000=1002000=1002000=100
All Terraced High-rise
-10.0%
-5.0%
0.0%
5.0%
10.0%
15.0%
20.0%
1Q00
1Q01
1Q02
1Q03
1Q04
1Q05
1Q06
1Q07
1Q08
1Q09
1Q10
1Q11
1Q12
1Q13
1Q14
1Q15
1Q16
2000=1002000=1002000=1002000=100
All Terraced High-rise
Industry Focus
Page 3
Intensifying competition
Recall that the highly successful developer interest-bearing
scheme (DIBS) was banned effective January 2014, and
developers had capitalised on the last window in 2013 to
launch more development projects with DIBS. We believe more
completions will be expected in 2017 especially for high-rise
units which typically take between three to four years before
delivery.
Potential property buyers may not be willing to actively look
for their choice units in view of the relatively soft sentiment.
Also, investors could be discouraged by the subdued capital
appreciation in recent years, despite the generous freebies
offered by developers for newly launched projects. We
understand that a 10%-15% discount to the listed selling price
has increasingly become the norm in the property market as
take-up remains uninspiring, compared to the good years back
in 2011-2013.
Meanwhile, the federal government has been stepping up its
efforts in accelerating supply of affordable housing to the
masses, especially under the 1Malaysia People’s Housing
Programme (PR1MA). Recently, the monthly income eligibility
to purchase PR1MA houses was increased from RM10,000 to
RM15,000 while the moratorium has been cut to five years
from ten years previously.
Therefore, more middle-income households will be eligible to
purchase these houses in key urban centres which are sold at
between RM100,000 and RM400,000. This will indirectly pose
more competition to private developers as they will have to
revise their product offerings to incorporate more ‘value-buy’
properties with differentiating lifestyle amenities that will
distinguish themselves from lower-priced public housing,
which could come at the expense of margins.
The government has also come out with a special end-
financing scheme named Skim Pembiayaan Fleksibel (SPEF)
which is created exclusively for PR1MA buyers in collaboration
with Bank Negara Malaysia, Employees Provident Fund and
four local banks, namely Maybank, CIMB, RHB and AmBank.
SPEF allows borrowers to only service their interest in the first
five years, and the principal amount only kicks in from year six
onwards.
New supply coming on stream
*HPI – House Price Index
Source: AllianceDBS, NAPIC
Comple tionsComple tionsComple tionsComple tions
% of % of % of % of
stoc kstoc kstoc kstoc k
Incoming Incoming Incoming Incoming
supp lysupp lysupp lysupp ly
% of % of % of % of
s tocks tocks tocks tock Exis ting s tockExi s ting s tockExi s ting s tockExi s ting s tock HPIHPIHPIHPI
HPI HPI HPI HPI
growthgrowthgrowthgrowth
2002 156,042 5.1% 605,566 19.9% 3,050,421 104
2003 192,490 5.9% 627,028 19.1% 3,287,733 108 4.0%
2004 165,964 4.8% 641,771 18.5% 3,467,812 113 4.8%
2005 180,600 4.9% 637,208 17.3% 3,680,462 116 2.4%
2006 171,448 4.4% 619,583 16.0% 3,864,432 118 1.9%
2007 181,123 4.5% 573,716 14.1% 4,063,167 124 5.3%
2008 136,881 3.2% 557,502 13.2% 4,220,510 130 4.7%
2009 103,335 2.4% 538,894 12.4% 4,338,609 132 1.5%
2010 99,866 2.2% 533,605 12.0% 4,446,085 141 6.8%
2011 65,866 1.4% 533,844 11.7% 4,547,971 155 9.9%
2012 72,247 1.6% 628,655 13.5% 4,640,269 173 11.8%
2013 78,265 1.7% 696,557 14.8% 4,718,534 193 11.6%
2014 107,747 2.2% 769,788 15.9% 4,848,030 211 9.4%
2015 80,850 1.6% 892,099 18.1% 4,928,883 227 7.4%
9M16 39,791 0.8% 837,251 17.1% 4,906,722 242 6.6%
Industry Focus
Page 4
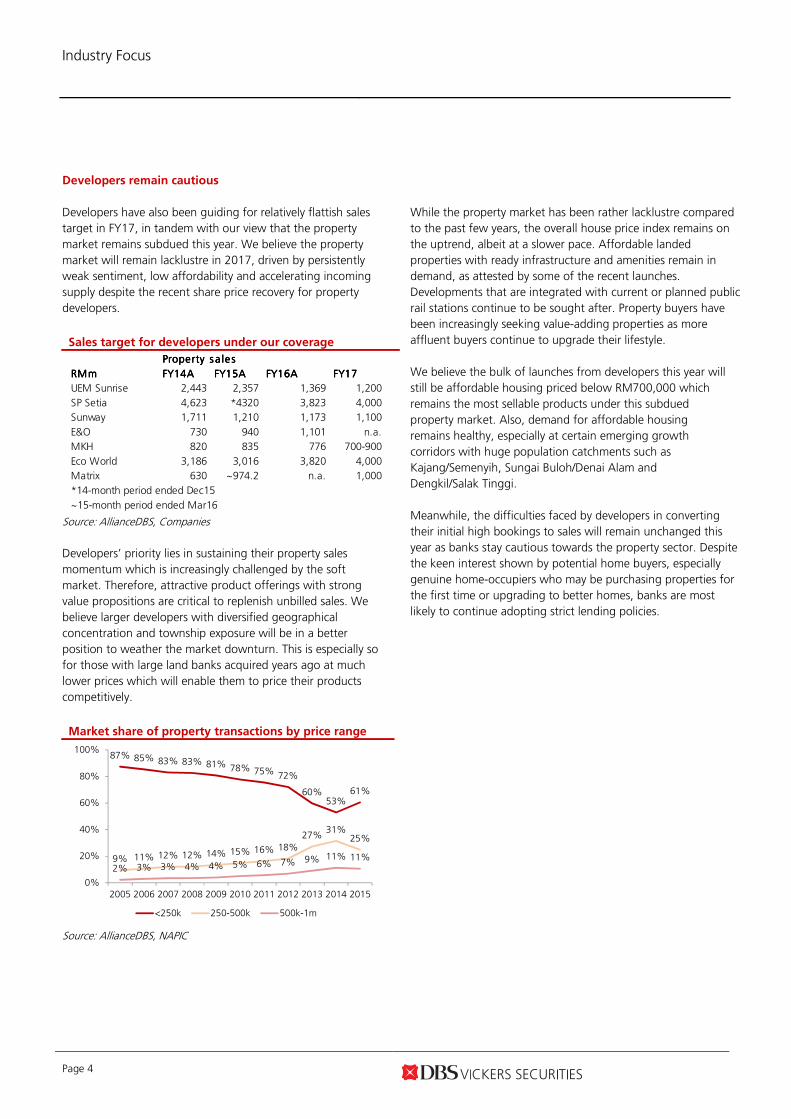
Developers remain cautious
Developers have also been guiding for relatively flattish sales
target in FY17, in tandem with our view that the property
market remains subdued this year. We believe the property
market will remain lacklustre in 2017, driven by persistently
weak sentiment, low affordability and accelerating incoming
supply despite the recent share price recovery for property
developers.
Sales target for developers under our coverage
Source: AllianceDBS, Companies
Developers’ priority lies in sustaining their property sales
momentum which is increasingly challenged by the soft
market. Therefore, attractive product offerings with strong
value propositions are critical to replenish unbilled sales. We
believe larger developers with diversified geographical
concentration and township exposure will be in a better
position to weather the market downturn. This is especially so
for those with large land banks acquired years ago at much
lower prices which will enable them to price their products
competitively.
Market share of property transactions by price range
Source: AllianceDBS, NAPIC
While the property market has been rather lacklustre compared
to the past few years, the overall house price index remains on
the uptrend, albeit at a slower pace. Affordable landed
properties with ready infrastructure and amenities remain in
demand, as attested by some of the recent launches.
Developments that are integrated with current or planned public
rail stations continue to be sought after. Property buyers have
been increasingly seeking value-adding properties as more
affluent buyers continue to upgrade their lifestyle.
We believe the bulk of launches from developers this year will
still be affordable housing priced below RM700,000 which
remains the most sellable products under this subdued
property market. Also, demand for affordable housing
remains healthy, especially at certain emerging growth
corridors with huge population catchments such as
Kajang/Semenyih, Sungai Buloh/Denai Alam and
Dengkil/Salak Tinggi.
Meanwhile, the difficulties faced by developers in converting
their initial high bookings to sales will remain unchanged this
year as banks stay cautious towards the property sector. Despite
the keen interest shown by potential home buyers, especially
genuine home-occupiers who may be purchasing properties for
the first time or upgrading to better homes, banks are most
likely to continue adopting strict lending policies.
Property s a le sProperty s a le sProperty s a le sProperty s a le s
RMmRMmRMmRMm FY14AFY14AFY14AFY14A FY15AFY15AFY15AFY15A FY16AFY16AFY16AFY16A FY17FY17FY17FY17
UEM Sunrise 2,443 2,357 1,369 1,200
SP Setia 4,623 *4320 3,823 4,000
Sunway 1,711 1,210 1,173 1,100
E&O 730 940 1,101 n.a.
MKH 820 835 776 700-900
Eco World 3,186 3,016 3,820 4,000
Matrix 630 ~974.2 n.a. 1,000
*14-month period ended Dec15
~15-month period ended Mar16
87% 85% 83% 83% 81% 78% 75% 72%
60%53%
61%
9% 11% 12% 12% 14% 15% 16% 18%
27%31%
25%
2% 3% 3% 4% 4% 5% 6% 7% 9% 11% 11%
0%
20%
40%
60%
80%
100%
2005 2006 2007 2008 2009 2010 2011 2012 2013 2014 2015
<250k 250-500k 500k-1m
Industry Focus
Page 5
Investment strategy
Our key property picks in 2017 are Eco World, MKHEco World, MKHEco World, MKHEco World, MKH and
MatrixMatrixMatrixMatrix which are township developers with niche expertise
and established brand names within local communities. The
trio has achieved their respective commendable sales targets
in FY16 despite a fair share of downward revisions by their
peers amidst the challenging environment.
Eco World (Eco World (Eco World (Eco World (BUYBUYBUYBUY, RM1.80 TP), RM1.80 TP), RM1.80 TP), RM1.80 TP). Eco World remains the one-of-
its-kind premium developer with aggressive expansion plans
despite being a relatively new property developer with only
three years of history. It has been able to sell properties at an
unprecedented pace, reflecting property buyers’ confidence in
the group’s strong brand name.
After booking RM3.2bn/RM3.0bn/RM3.8bn gross sales in
FY14 -FY16, respectively, ECW is targeting RM4bn gross sales
in FY17 (including JV portion) despite the relatively weak
property market where most of its peers are having slower
sales performance. ECW has clearly been gaining more
market share at the expense of its competitors.
We are projecting an explosive 3-year earnings CAGR of 33%
over FY16-19F, due to its relatively smaller profit base at this
juncture. This is supported by its all-time high unbilled sales of
RM4.9bn as at end-October 2016 which will underpin
earnings up to FY19.
MKH (MKH (MKH (MKH (BUYBUYBUYBUY, RM3., RM3., RM3., RM3.77770 TP)0 TP)0 TP)0 TP). The company will be the largest
beneficiary of the upcoming MRT connectivity given its high
exposure to the booming Kajang/Semenyih growth corridor.
MKH has an unrivalled competitive advantage in
Kajang/Semenyih property development because of their low
land cost of RM10psf (vs peers’ >RM20psf).
Affordable homes - MKH’s stronghold - remains the key
theme for the property sector. The company's large tract of
property land bank in Kajang/Semenyih (490 acres) makes it
the prime beneficiary of rising land prices there. Scarcity of
land within Kajang also provides a distinct advantage for
MKH’s future launches, which are expected to see strong
demand and fetch premium pricing.
Matrix Concepts (Matrix Concepts (Matrix Concepts (Matrix Concepts (BUY, RM3.1BUY, RM3.1BUY, RM3.1BUY, RM3.10 TP)0 TP)0 TP)0 TP). Matrix has bucked the
trend with record-high property sales at its two flagship
projects, Bandar Sri Sendayan (BSS) in Seremban and Bandar
Sri Impian (BSI) in Kluang, despite the relatively weak market
sentiment. The majority of its launches are priced below the
RM600k/unit mark, leveraging on the robust demand for
affordable homes. The sales momentum going forward is
likely to remain on the uptrend as Matrix still has a large
pipeline of affordable homes which are ready for launch.
BSS remains its jewel in the crown given the low average land
cost of RM7psf (with infrastructure in place) when its
affordably-priced properties are already selling at ~RM200psf,
leading to significantly higher-than-average profit margins.
It is on track to hit management’s target of RM1bn in FY17. This
reinforces our view that the strong sales momentum for its
flagship projects in BSS, Seremban and BSI, Kluang. Unbilled
sales stood at an all-time high of RM903m as at end-December
2016 which will provide strong earnings visibility over the next
two years
Industry Focus
Page 6
Risk
ForeclosuresForeclosuresForeclosuresForeclosures. This would be largely driven by several
completed schemes entering the market, for which the units
were purchased with small down payments a few years ago.
Buyers may not be able to flip at the high margins they had
expected earlier, and they may not want to go ahead with the
mortgage payments. Foreclosures could also arise from
incidences of rentals not being able to cover mortgage
payments. Buyers with weak holding power will face
foreclosure risk.
Margin compression. Margin compression. Margin compression. Margin compression. Developers may not be able to pass on
incremental land and construction costs to property buyers, as
the market may not be receptive to higher selling prices amid
record-high house prices. Also, the steep depreciation of the
MYR could result in higher cost of imported materials for
some projects.
Slowing salesSlowing salesSlowing salesSlowing sales. Property sales may slow down in some
locations as property buyers may be deterred by the high
entry price and tightening measures, with banks adopting
more cautious lending practices for mortgage loans.
Rising household debtRising household debtRising household debtRising household debt. The currently elevated household debt
level could strain purchasing power and the demand for
future properties, in view of the rising inflationary pressure
and unaffordability.
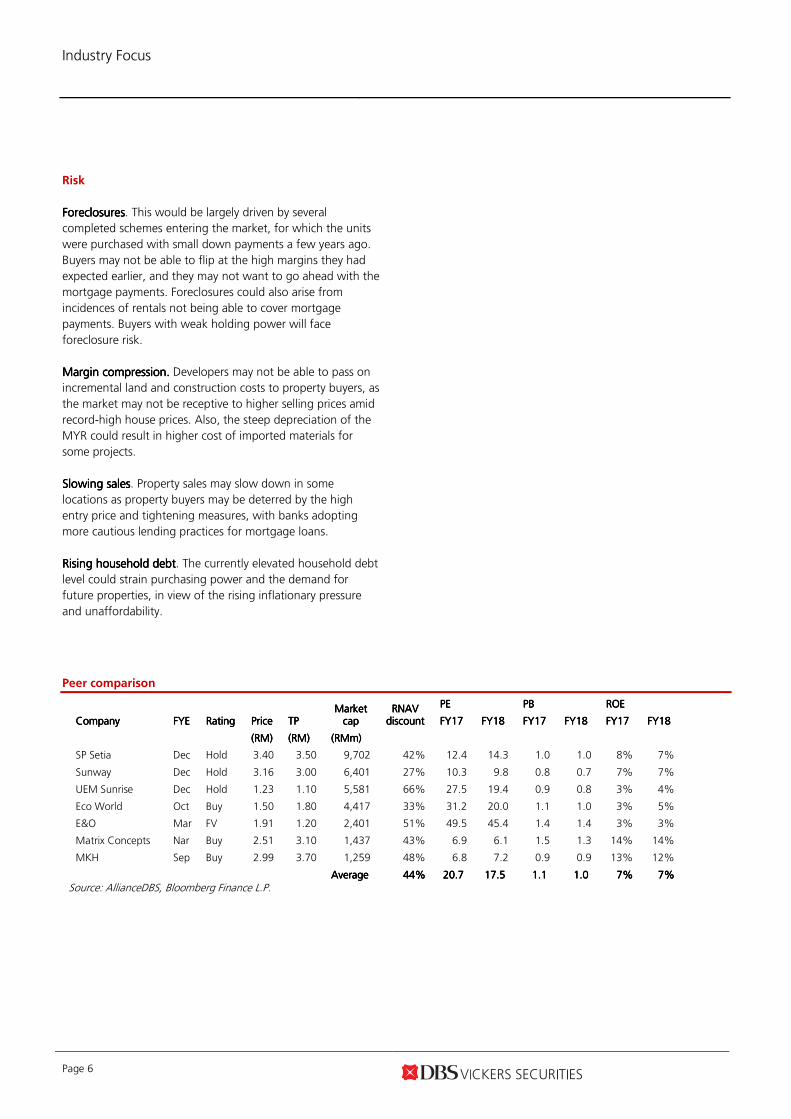
Peer comparison
Market Market Market Market capcapcapcap
RNAV RNAV RNAV RNAV discountdiscountdiscountdiscount
PEPEPEPE
PBPBPBPB
ROEROEROEROE CompanyCompanyCompanyCompany FYEFYEFYEFYE RatingRatingRatingRating PricePricePricePrice TPTPTPTP FFFFY1Y1Y1Y17777 FFFFY1Y1Y1Y18888 FFFFY1Y1Y1Y17777 FFFFY1Y1Y1Y18888 FFFFY1Y1Y1Y17777 FFFFY1Y1Y1Y18888
(RM)(RM)(RM)(RM) (RM)(RM)(RM)(RM) ((((RMmRMmRMmRMm))))
SP Setia Dec Hold 3.40 3.50 9,702 42% 12.4 14.3 1.0 1.0 8% 7%
Sunway Dec Hold 3.16 3.00 6,401 27% 10.3 9.8 0.8 0.7 7% 7%
UEM Sunrise Dec Hold 1.23 1.10 5,581 66% 27.5 19.4 0.9 0.8 3% 4%
Eco World Oct Buy 1.50 1.80 4,417 33% 31.2 20.0 1.1 1.0 3% 5%
E&O Mar FV 1.91 1.20 2,401 51% 49.5 45.4 1.4 1.4 3% 3%
Matrix Concepts Nar Buy 2.51 3.10 1,437 43% 6.9 6.1 1.5 1.3 14% 14%
MKH Sep Buy 2.99 3.70 1,259 48% 6.8 7.2 0.9 0.9 13% 12%
AverageAverageAverageAverage 44%44%44%44% 20.7 20.7 20.7 20.7 17.5 17.5 17.5 17.5 1.1 1.1 1.1 1.1 1.0 1.0 1.0 1.0 7%7%7%7% 7%7%7%7%
Source: AllianceDBS, Bloomberg Finance L.P.
ASIAN INSIGHTS VICKERS SECURITIES ed: CK / sa:BC, PY
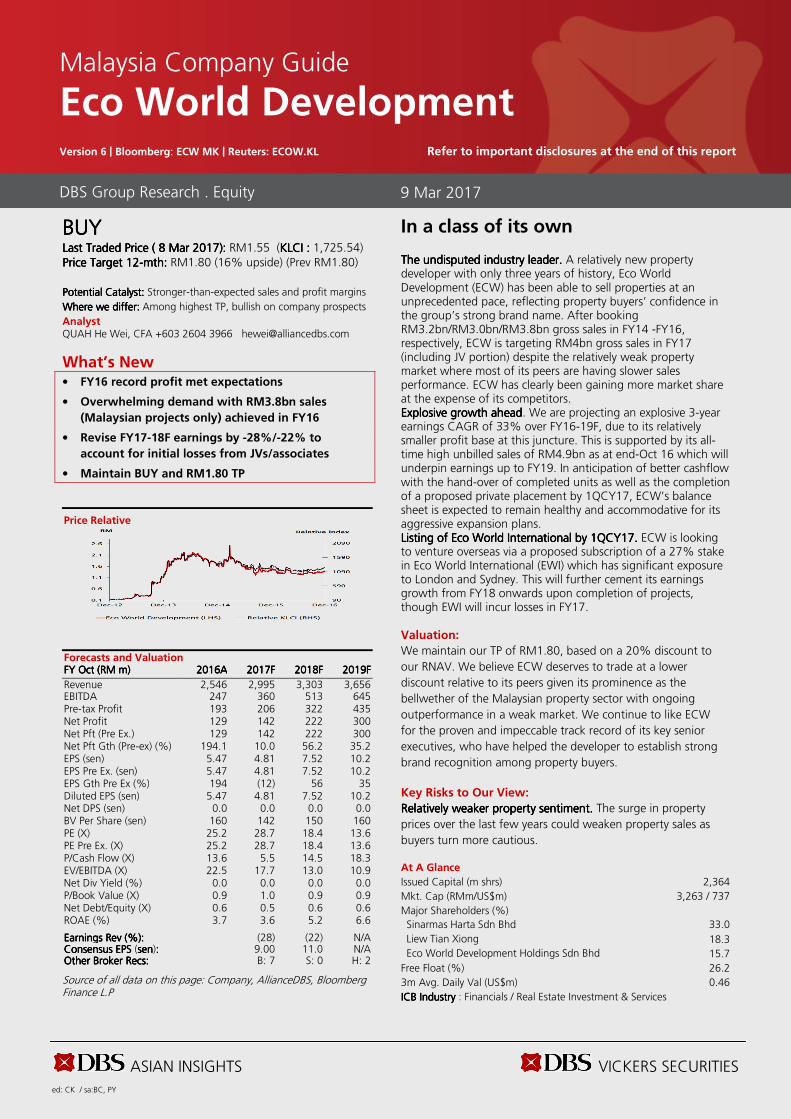
BUYBUYBUYBUY Last Traded PriceLast Traded PriceLast Traded PriceLast Traded Price (((( 8 Mar 20178 Mar 20178 Mar 20178 Mar 2017)))): : : : RM1.55 (KLCIKLCIKLCIKLCI : : : : 1,725.54) Price TaPrice TaPrice TaPrice Target rget rget rget 12121212----mthmthmthmth:::: RM1.80 (16% upside) (Prev RM1.80)
Potential Catalyst: Potential Catalyst: Potential Catalyst: Potential Catalyst: Stronger-than-expected sales and profit margins
Where we differ:Where we differ:Where we differ:Where we differ: Among highest TP, bullish on company prospects
Analyst QUAH He Wei, CFA +603 2604 3966 [email protected]
What’s New • FY16 record profit met expectations
• Overwhelming demand with RM3.8bn sales
(Malaysian projects only) achieved in FY16
• Revise FY17-18F earnings by -28%/-22% to
account for initial losses from JVs/associates
• Maintain BUY and RM1.80 TP
Price Relative
Forecasts and Valuation FY FY FY FY OctOctOctOct ((((RMRMRMRM m) m) m) m) 2016201620162016AAAA 2017201720172017FFFF 2018201820182018FFFF 2019201920192019FFFF
Revenue 2,546 2,995 3,303 3,656 EBITDA 247 360 513 645 Pre-tax Profit 193 206 322 435 Net Profit 129 142 222 300 Net Pft (Pre Ex.) 129 142 222 300 Net Pft Gth (Pre-ex) (%) 194.1 10.0 56.2 35.2 EPS (sen) 5.47 4.81 7.52 10.2 EPS Pre Ex. (sen) 5.47 4.81 7.52 10.2 EPS Gth Pre Ex (%) 194 (12) 56 35 Diluted EPS (sen) 5.47 4.81 7.52 10.2 Net DPS (sen) 0.0 0.0 0.0 0.0 BV Per Share (sen) 160 142 150 160 PE (X) 25.2 28.7 18.4 13.6 PE Pre Ex. (X) 25.2 28.7 18.4 13.6 P/Cash Flow (X) 13.6 5.5 14.5 18.3 EV/EBITDA (X) 22.5 17.7 13.0 10.9 Net Div Yield (%) 0.0 0.0 0.0 0.0 P/Book Value (X) 0.9 1.0 0.9 0.9 Net Debt/Equity (X) 0.6 0.5 0.6 0.6 ROAE (%) 3.7 3.6 5.2 6.6 Earnings Rev (%):Earnings Rev (%):Earnings Rev (%):Earnings Rev (%): (28) (22) N/A Consensus EPS Consensus EPS Consensus EPS Consensus EPS (sensensensen):::: 9.00 11.0 N/A Other Broker Recs:Other Broker Recs:Other Broker Recs:Other Broker Recs: B: 7 S: 0 H: 2
Source of all data on this page: Company, AllianceDBS, Bloomberg Finance L.P
In a class of its own The undisputed industry leader. The undisputed industry leader. The undisputed industry leader. The undisputed industry leader. A relatively new property developer with only three years of history, Eco World Development (ECW) has been able to sell properties at an unprecedented pace, reflecting property buyers’ confidence in the group’s strong brand name. After booking RM3.2bn/RM3.0bn/RM3.8bn gross sales in FY14 -FY16, respectively, ECW is targeting RM4bn gross sales in FY17 (including JV portion) despite the relatively weak property market where most of its peers are having slower sales performance. ECW has clearly been gaining more market share at the expense of its competitors. Explosive growth aheadExplosive growth aheadExplosive growth aheadExplosive growth ahead. We are projecting an explosive 3-year earnings CAGR of 33% over FY16-19F, due to its relatively smaller profit base at this juncture. This is supported by its all-time high unbilled sales of RM4.9bn as at end-Oct 16 which will underpin earnings up to FY19. In anticipation of better cashflow with the hand-over of completed units as well as the completion of a proposed private placement by 1QCY17, ECW’s balance sheet is expected to remain healthy and accommodative for its aggressive expansion plans. Listing of Eco World International by 1QCY17. Listing of Eco World International by 1QCY17. Listing of Eco World International by 1QCY17. Listing of Eco World International by 1QCY17. ECW is looking to venture overseas via a proposed subscription of a 27% stake in Eco World International (EWI) which has significant exposure to London and Sydney. This will further cement its earnings growth from FY18 onwards upon completion of projects, though EWI will incur losses in FY17.
Valuation:
We maintain our TP of RM1.80, based on a 20% discount to
our RNAV. We believe ECW deserves to trade at a lower
discount relative to its peers given its prominence as the
bellwether of the Malaysian property sector with ongoing
outperformance in a weak market. We continue to like ECW
for the proven and impeccable track record of its key senior
executives, who have helped the developer to establish strong
brand recognition among property buyers.
Key Risks to Our View:
Relatively weaker property sentiment. Relatively weaker property sentiment. Relatively weaker property sentiment. Relatively weaker property sentiment. The surge in property
prices over the last few years could weaken property sales as
buyers turn more cautious.
At A Glance Issued Capital (m shrs) 2,364
Mkt. Cap (RMm/US$m) 3,263 / 737
Major Shareholders (%)
Sinarmas Harta Sdn Bhd 33.0
Liew Tian Xiong 18.3
Eco World Development Holdings Sdn Bhd 15.7
Free Float (%) 26.2
3m Avg. Daily Val (US$m) 0.46
ICB IndustryICB IndustryICB IndustryICB Industry : Financials / Real Estate Investment & Services
DBS Group Research . Equity
9 Mar 2017
Malaysia Company Guide
Eco World Development Version 6 | Bloomberg: ECW MK | Reuters: ECOW.KL Refer to important disclosures at the end of this report
ASIAN INSIGHTS VICKERS SECURITIES
Page 8
Company Guide
Eco World Development
CRITICAL DATA POINTS TO WATCH
Earnings Drivers:
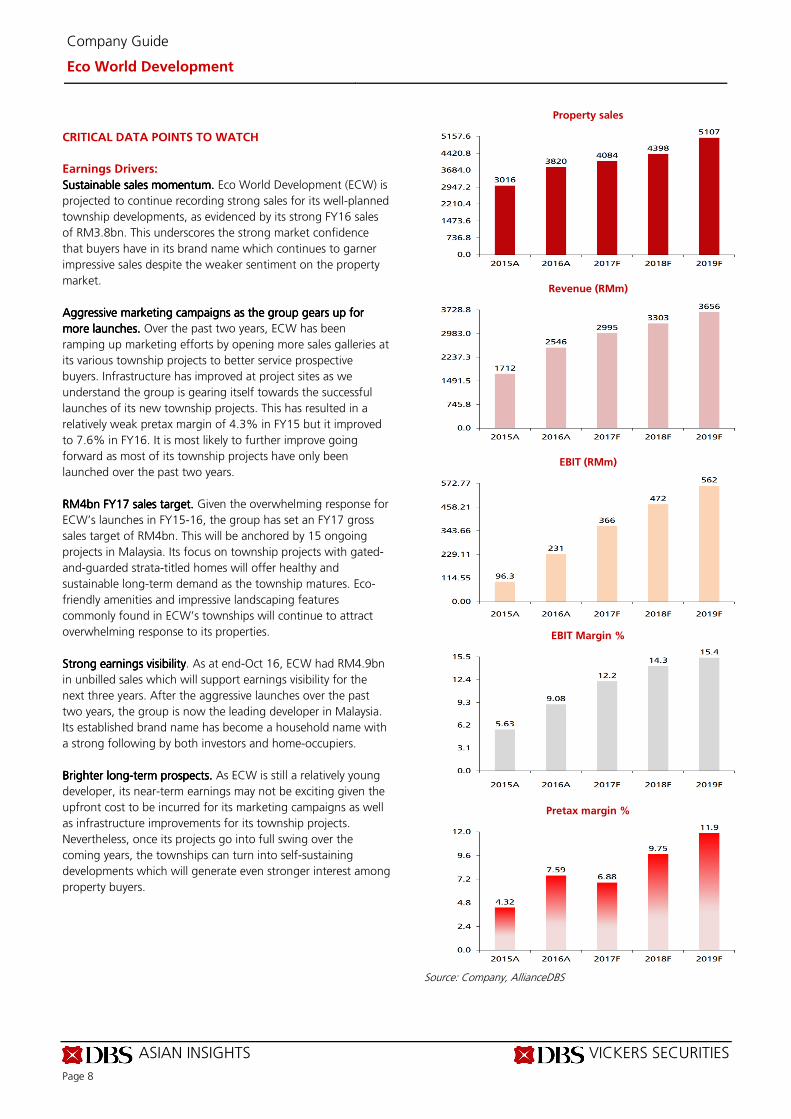
Sustainable sales momentum. Sustainable sales momentum. Sustainable sales momentum. Sustainable sales momentum. Eco World Development (ECW) is
projected to continue recording strong sales for its well-planned
township developments, as evidenced by its strong FY16 sales
of RM3.8bn. This underscores the strong market confidence
that buyers have in its brand name which continues to garner
impressive sales despite the weaker sentiment on the property
market.
Aggressive marketing campaigns as the group gears up for Aggressive marketing campaigns as the group gears up for Aggressive marketing campaigns as the group gears up for Aggressive marketing campaigns as the group gears up for
more launches. more launches. more launches. more launches. Over the past two years, ECW has been
ramping up marketing efforts by opening more sales galleries at
its various township projects to better service prospective
buyers. Infrastructure has improved at project sites as we
understand the group is gearing itself towards the successful
launches of its new township projects. This has resulted in a
relatively weak pretax margin of 4.3% in FY15 but it improved
to 7.6% in FY16. It is most likely to further improve going
forward as most of its township projects have only been
launched over the past two years.
RM4bn FY17RM4bn FY17RM4bn FY17RM4bn FY17 sales target. sales target. sales target. sales target. Given the overwhelming response for
ECW’s launches in FY15-16, the group has set an FY17 gross
sales target of RM4bn. This will be anchored by 15 ongoing
projects in Malaysia. Its focus on township projects with gated-
and-guarded strata-titled homes will offer healthy and
sustainable long-term demand as the township matures. Eco-
friendly amenities and impressive landscaping features
commonly found in ECW’s townships will continue to attract
overwhelming response to its properties.
Strong earnings visibilityStrong earnings visibilityStrong earnings visibilityStrong earnings visibility. As at end-Oct 16, ECW had RM4.9bn
in unbilled sales which will support earnings visibility for the
next three years. After the aggressive launches over the past
two years, the group is now the leading developer in Malaysia.
Its established brand name has become a household name with
a strong following by both investors and home-occupiers.
Brighter longBrighter longBrighter longBrighter long----term prospects.term prospects.term prospects.term prospects. As ECW is still a relatively young
developer, its near-term earnings may not be exciting given the
upfront cost to be incurred for its marketing campaigns as well
as infrastructure improvements for its township projects.
Nevertheless, once its projects go into full swing over the
coming years, the townships can turn into self-sustaining
developments which will generate even stronger interest among
property buyers.
Property sales
Revenue (RMm)
EBIT (RMm)
EBIT Margin %
Pretax margin %
Source: Company, AllianceDBS
ASIAN INSIGHTS VICKERS SECURITIES
Page 9
Company Guide
Eco World Development
Balance Sheet:
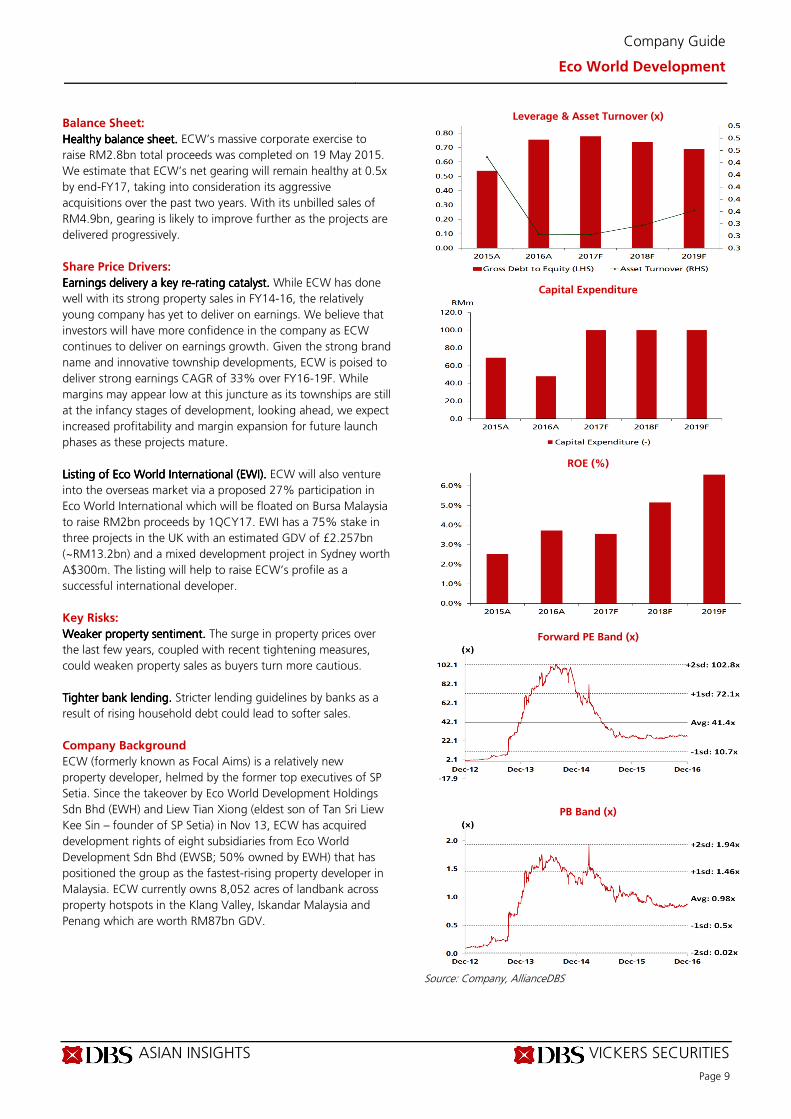
Healthy balance sheet. Healthy balance sheet. Healthy balance sheet. Healthy balance sheet. ECW’s massive corporate exercise to
raise RM2.8bn total proceeds was completed on 19 May 2015.
We estimate that ECW’s net gearing will remain healthy at 0.5x
by end-FY17, taking into consideration its aggressive
acquisitions over the past two years. With its unbilled sales of
RM4.9bn, gearing is likely to improve further as the projects are
delivered progressively.
Share Price Drivers:
Earnings delivery a key reEarnings delivery a key reEarnings delivery a key reEarnings delivery a key re----rating catalyst. rating catalyst. rating catalyst. rating catalyst. While ECW has done
well with its strong property sales in FY14-16, the relatively
young company has yet to deliver on earnings. We believe that
investors will have more confidence in the company as ECW
continues to deliver on earnings growth. Given the strong brand
name and innovative township developments, ECW is poised to
deliver strong earnings CAGR of 33% over FY16-19F. While
margins may appear low at this juncture as its townships are still
at the infancy stages of development, looking ahead, we expect
increased profitability and margin expansion for future launch
phases as these projects mature.
Listing of Eco World International (EWI). Listing of Eco World International (EWI). Listing of Eco World International (EWI). Listing of Eco World International (EWI). ECW will also venture
into the overseas market via a proposed 27% participation in
Eco World International which will be floated on Bursa Malaysia
to raise RM2bn proceeds by 1QCY17. EWI has a 75% stake in
three projects in the UK with an estimated GDV of £2.257bn
(~RM13.2bn) and a mixed development project in Sydney worth
A$300m. The listing will help to raise ECW’s profile as a
successful international developer.
Key Risks:
Weaker property sentiment. Weaker property sentiment. Weaker property sentiment. Weaker property sentiment. The surge in property prices over
the last few years, coupled with recent tightening measures,
could weaken property sales as buyers turn more cautious.
Tighter bank lending. Tighter bank lending. Tighter bank lending. Tighter bank lending. Stricter lending guidelines by banks as a
result of rising household debt could lead to softer sales.
Company Background
ECW (formerly known as Focal Aims) is a relatively new
property developer, helmed by the former top executives of SP
Setia. Since the takeover by Eco World Development Holdings
Sdn Bhd (EWH) and Liew Tian Xiong (eldest son of Tan Sri Liew
Kee Sin – founder of SP Setia) in Nov 13, ECW has acquired
development rights of eight subsidiaries from Eco World
Development Sdn Bhd (EWSB; 50% owned by EWH) that has
positioned the group as the fastest-rising property developer in
Malaysia. ECW currently owns 8,052 acres of landbank across
property hotspots in the Klang Valley, Iskandar Malaysia and
Penang which are worth RM87bn GDV.
Leverage & Asset Turnover (x)
Capital Expenditure
ROE (%)
Forward PE Band (x)
PB Band (x)
Source: Company, AllianceDBS
ASIAN INSIGHTS VICKERS SECURITIES
Page 10
Company Guide
Eco World Development
Key Assumptions
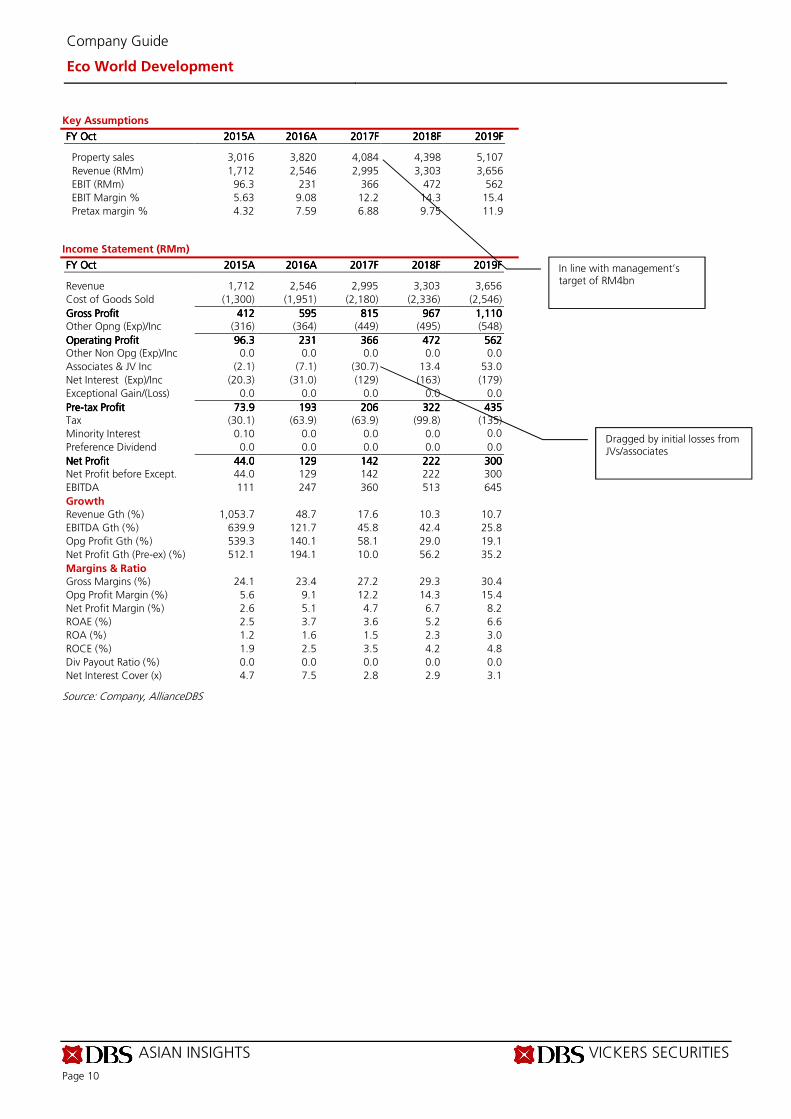
FY FY FY FY OctOctOctOct 2015201520152015AAAA 2016201620162016AAAA 2017201720172017FFFF 2018201820182018FFFF 2019201920192019FFFF
Property sales 3,016 3,820 4,084 4,398 5,107
Revenue (RMm) 1,712 2,546 2,995 3,303 3,656
EBIT (RMm) 96.3 231 366 472 562
EBIT Margin % 5.63 9.08 12.2 14.3 15.4
Pretax margin % 4.32 7.59 6.88 9.75 11.9 Income Statement (RMm)
FY FY FY FY OctOctOctOct 2015201520152015AAAA 2016201620162016AAAA 2017201720172017FFFF 2018201820182018FFFF 2019201920192019FFFF Revenue 1,712 2,546 2,995 3,303 3,656
Cost of Goods Sold (1,300) (1,951) (2,180) (2,336) (2,546)
Gross ProfitGross ProfitGross ProfitGross Profit 412412412412 595595595595 815815815815 967967967967 1,1101,1101,1101,110 Other Opng (Exp)/Inc (316) (364) (449) (495) (548)
Operating ProfitOperating ProfitOperating ProfitOperating Profit 96.396.396.396.3 231231231231 366366366366 472472472472 562562562562 Other Non Opg (Exp)/Inc 0.0 0.0 0.0 0.0 0.0
Associates & JV Inc (2.1) (7.1) (30.7) 13.4 53.0
Net Interest (Exp)/Inc (20.3) (31.0) (129) (163) (179)
Exceptional Gain/(Loss) 0.0 0.0 0.0 0.0 0.0
PrePrePrePre----tax Profittax Profittax Profittax Profit 73.973.973.973.9 193193193193 206206206206 322322322322 435435435435 Tax (30.1) (63.9) (63.9) (99.8) (135)
Minority Interest 0.10 0.0 0.0 0.0 0.0
Preference Dividend 0.0 0.0 0.0 0.0 0.0
Net ProfitNet ProfitNet ProfitNet Profit 44.044.044.044.0 129129129129 142142142142 222222222222 300300300300 Net Profit before Except. 44.0 129 142 222 300
EBITDA 111 247 360 513 645
Growth
Revenue Gth (%) 1,053.7 48.7 17.6 10.3 10.7
EBITDA Gth (%) 639.9 121.7 45.8 42.4 25.8
Opg Profit Gth (%) 539.3 140.1 58.1 29.0 19.1
Net Profit Gth (Pre-ex) (%) 512.1 194.1 10.0 56.2 35.2
Margins & Ratio
Gross Margins (%) 24.1 23.4 27.2 29.3 30.4
Opg Profit Margin (%) 5.6 9.1 12.2 14.3 15.4
Net Profit Margin (%) 2.6 5.1 4.7 6.7 8.2
ROAE (%) 2.5 3.7 3.6 5.2 6.6
ROA (%) 1.2 1.6 1.5 2.3 3.0
ROCE (%) 1.9 2.5 3.5 4.2 4.8
Div Payout Ratio (%) 0.0 0.0 0.0 0.0 0.0
Net Interest Cover (x) 4.7 7.5 2.8 2.9 3.1
Source: Company, AllianceDBS
Dragged by initial losses from JVs/associates
In line with management’s target of RM4bn
ASIAN INSIGHTS VICKERS SECURITIES
Page 11
Company Guide
Eco World Development
Quarterly / Interim Income Statement (RMm)
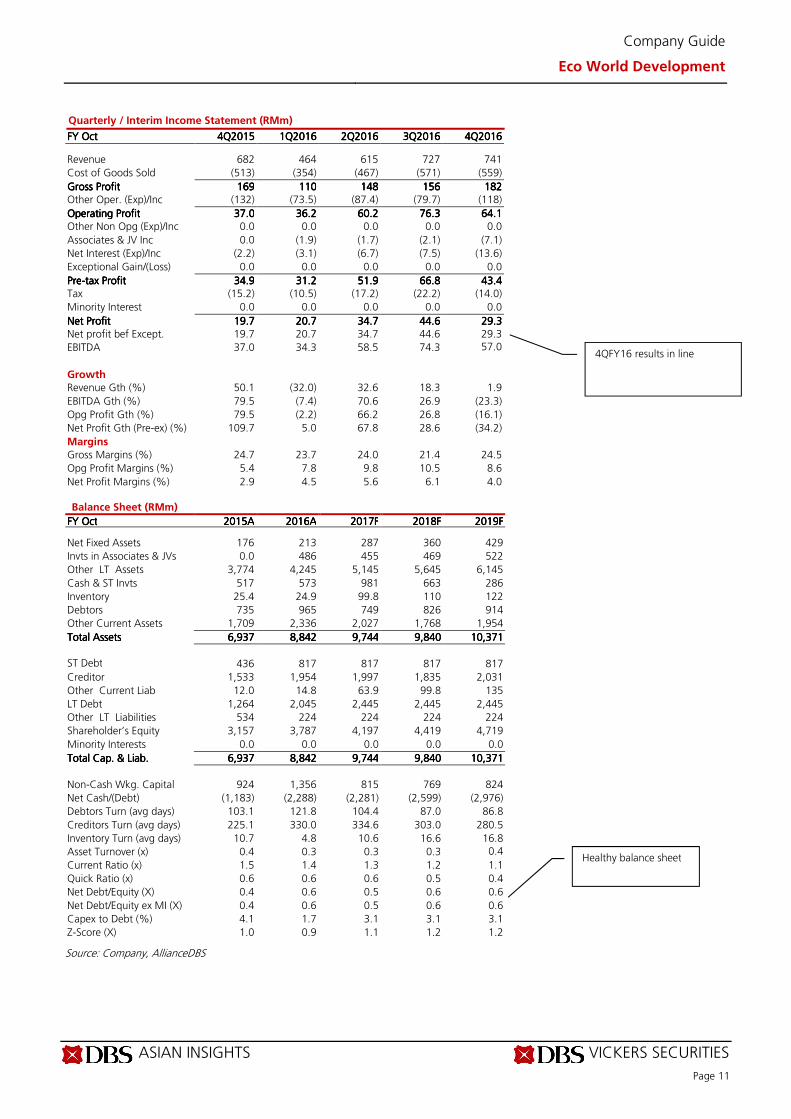
FY FY FY FY OctOctOctOct 4Q4Q4Q4Q2015201520152015 1Q1Q1Q1Q2016201620162016 2Q2Q2Q2Q2016201620162016 3Q3Q3Q3Q2016201620162016 4Q4Q4Q4Q2016201620162016 Revenue 682 464 615 727 741
Cost of Goods Sold (513) (354) (467) (571) (559)
Gross ProfitGross ProfitGross ProfitGross Profit 169169169169 110110110110 148148148148 156156156156 182182182182 Other Oper. (Exp)/Inc (132) (73.5) (87.4) (79.7) (118)
Operating ProfitOperating ProfitOperating ProfitOperating Profit 37.037.037.037.0 36.236.236.236.2 60.260.260.260.2 76.376.376.376.3 64.164.164.164.1 Other Non Opg (Exp)/Inc 0.0 0.0 0.0 0.0 0.0
Associates & JV Inc 0.0 (1.9) (1.7) (2.1) (7.1)
Net Interest (Exp)/Inc (2.2) (3.1) (6.7) (7.5) (13.6)
Exceptional Gain/(Loss) 0.0 0.0 0.0 0.0 0.0
PrePrePrePre----tax Profittax Profittax Profittax Profit 34.934.934.934.9 31.231.231.231.2 51.951.951.951.9 66.866.866.866.8 43.443.443.443.4 Tax (15.2) (10.5) (17.2) (22.2) (14.0)
Minority Interest 0.0 0.0 0.0 0.0 0.0
Net ProfitNet ProfitNet ProfitNet Profit 19.719.719.719.7 20.720.720.720.7 34.734.734.734.7 44.644.644.644.6 29.329.329.329.3 Net profit bef Except. 19.7 20.7 34.7 44.6 29.3
EBITDA 37.0 34.3 58.5 74.3 57.0
Growth
Revenue Gth (%) 50.1 (32.0) 32.6 18.3 1.9
EBITDA Gth (%) 79.5 (7.4) 70.6 26.9 (23.3)
Opg Profit Gth (%) 79.5 (2.2) 66.2 26.8 (16.1)
Net Profit Gth (Pre-ex) (%) 109.7 5.0 67.8 28.6 (34.2)
Margins
Gross Margins (%) 24.7 23.7 24.0 21.4 24.5
Opg Profit Margins (%) 5.4 7.8 9.8 10.5 8.6
Net Profit Margins (%) 2.9 4.5 5.6 6.1 4.0 Balance Sheet (RMm)
FY FY FY FY OctOctOctOct 2015201520152015AAAA 2016201620162016AAAA 2017201720172017FFFF 2018201820182018FFFF 2019201920192019FFFF Net Fixed Assets 176 213 287 360 429
Invts in Associates & JVs 0.0 486 455 469 522
Other LT Assets 3,774 4,245 5,145 5,645 6,145
Cash & ST Invts 517 573 981 663 286
Inventory 25.4 24.9 99.8 110 122
Debtors 735 965 749 826 914
Other Current Assets 1,709 2,336 2,027 1,768 1,954
Total AssetsTotal AssetsTotal AssetsTotal Assets 6,9376,9376,9376,937 8,8428,8428,8428,842 9,7449,7449,7449,744 9,8409,8409,8409,840 10,37110,37110,37110,371
ST Debt
436 817 817 817 817
Creditor 1,533 1,954 1,997 1,835 2,031
Other Current Liab 12.0 14.8 63.9 99.8 135
LT Debt 1,264 2,045 2,445 2,445 2,445
Other LT Liabilities 534 224 224 224 224
Shareholder’s Equity 3,157 3,787 4,197 4,419 4,719
Minority Interests 0.0 0.0 0.0 0.0 0.0
Total Cap. & Liab.Total Cap. & Liab.Total Cap. & Liab.Total Cap. & Liab. 6,9376,9376,9376,937 8,8428,8428,8428,842 9,7449,7449,7449,744 9,8409,8409,8409,840 10,37110,37110,37110,371
Non-Cash Wkg. Capital 924 1,356 815 769 824
Net Cash/(Debt) (1,183) (2,288) (2,281) (2,599) (2,976)
Debtors Turn (avg days) 103.1 121.8 104.4 87.0 86.8
Creditors Turn (avg days) 225.1 330.0 334.6 303.0 280.5
Inventory Turn (avg days) 10.7 4.8 10.6 16.6 16.8
Asset Turnover (x) 0.4 0.3 0.3 0.3 0.4
Current Ratio (x) 1.5 1.4 1.3 1.2 1.1
Quick Ratio (x) 0.6 0.6 0.6 0.5 0.4
Net Debt/Equity (X) 0.4 0.6 0.5 0.6 0.6
Net Debt/Equity ex MI (X) 0.4 0.6 0.5 0.6 0.6
Capex to Debt (%) 4.1 1.7 3.1 3.1 3.1
Z-Score (X) 1.0 0.9 1.1 1.2 1.2
Source: Company, AllianceDBS
4QFY16 results in line
Healthy balance sheet
ASIAN INSIGHTS VICKERS SECURITIES
Page 12
Company Guide
Eco World Development
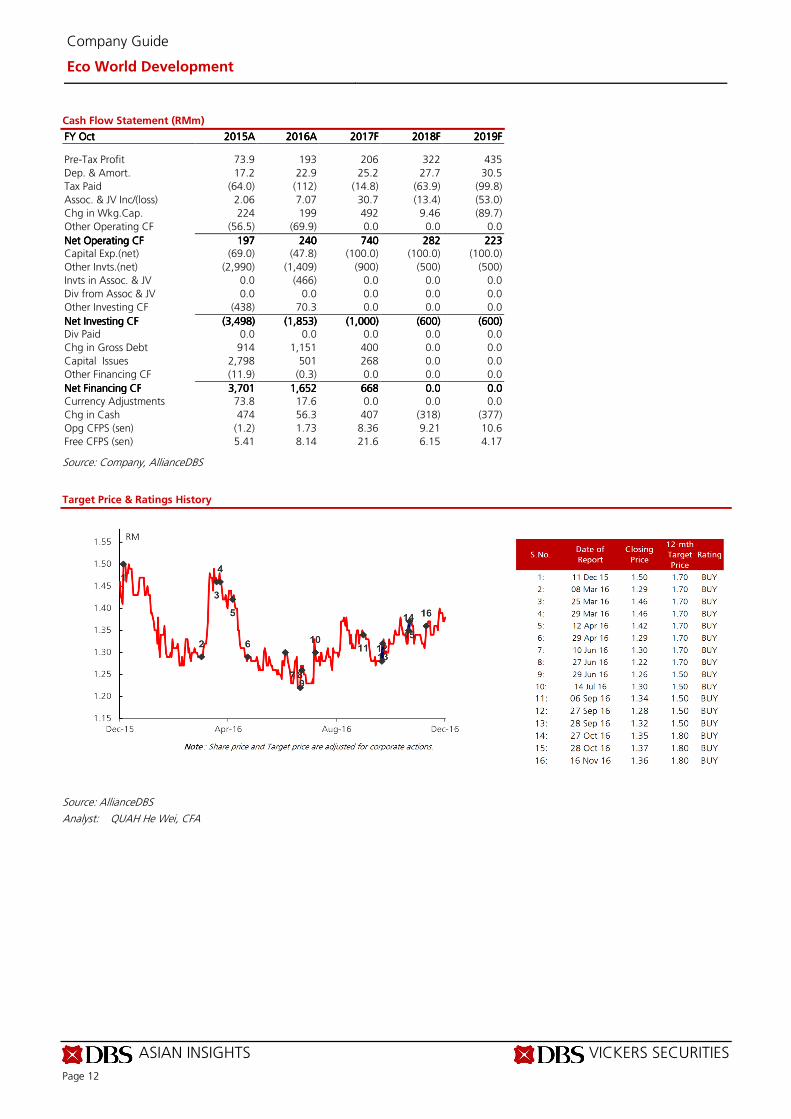
Cash Flow Statement (RMm)
FY FY FY FY OctOctOctOct 2015201520152015AAAA 2016201620162016AAAA 2017201720172017FFFF 2018201820182018FFFF 2019201920192019FFFF Pre-Tax Profit 73.9 193 206 322 435
Dep. & Amort. 17.2 22.9 25.2 27.7 30.5
Tax Paid (64.0) (112) (14.8) (63.9) (99.8)
Assoc. & JV Inc/(loss) 2.06 7.07 30.7 (13.4) (53.0)
Chg in Wkg.Cap. 224 199 492 9.46 (89.7)
Other Operating CF (56.5) (69.9) 0.0 0.0 0.0
Net Operating CFNet Operating CFNet Operating CFNet Operating CF 197197197197 240240240240 740740740740 282282282282 223223223223 Capital Exp.(net) (69.0) (47.8) (100.0) (100.0) (100.0)
Other Invts.(net) (2,990) (1,409) (900) (500) (500)
Invts in Assoc. & JV 0.0 (466) 0.0 0.0 0.0
Div from Assoc & JV 0.0 0.0 0.0 0.0 0.0
Other Investing CF (438) 70.3 0.0 0.0 0.0
Net Investing CFNet Investing CFNet Investing CFNet Investing CF (3,498)(3,498)(3,498)(3,498) (1,853)(1,853)(1,853)(1,853) (1,000)(1,000)(1,000)(1,000) (600)(600)(600)(600) (600)(600)(600)(600) Div Paid 0.0 0.0 0.0 0.0 0.0
Chg in Gross Debt 914 1,151 400 0.0 0.0
Capital Issues 2,798 501 268 0.0 0.0
Other Financing CF (11.9) (0.3) 0.0 0.0 0.0
Net Financing CFNet Financing CFNet Financing CFNet Financing CF 3,7013,7013,7013,701 1,6521,6521,6521,652 668668668668 0.00.00.00.0 0.00.00.00.0
Currency Adjustments 73.8 17.6 0.0 0.0 0.0
Chg in Cash 474 56.3 407 (318) (377)
Opg CFPS (sen) (1.2) 1.73 8.36 9.21 10.6
Free CFPS (sen) 5.41 8.14 21.6 6.15 4.17
Source: Company, AllianceDBS
Target Price & Ratings History
Source: AllianceDBS
Analyst: QUAH He Wei, CFA
ASIAN INSIGHTS VICKERS SECURITIES ed: CK / sa:BC, PY
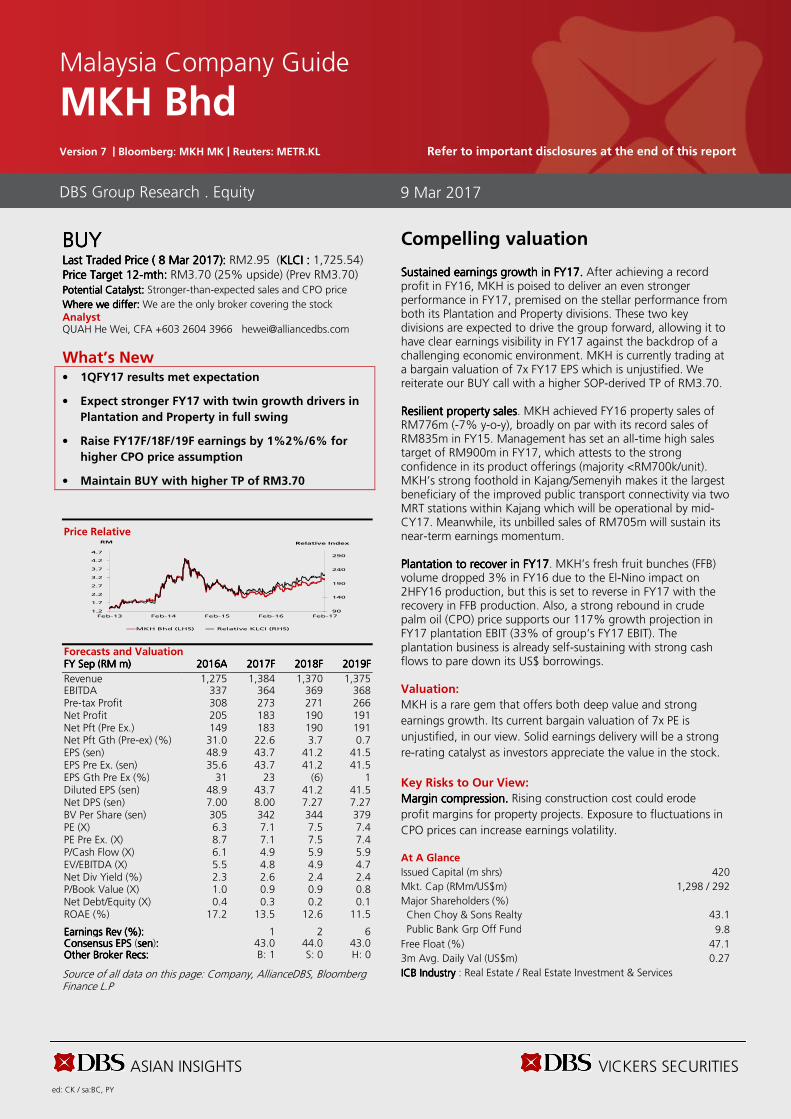
BUYBUYBUYBUY Last Traded PriceLast Traded PriceLast Traded PriceLast Traded Price (((( 8 Mar 20178 Mar 20178 Mar 20178 Mar 2017)))): : : : RM2.95 (KLCIKLCIKLCIKLCI : : : : 1,725.54) Price Target Price Target Price Target Price Target 12121212----mthmthmthmth:::: RM3.70 (25% upside) (Prev RM3.70) Potential Catalyst: Potential Catalyst: Potential Catalyst: Potential Catalyst: Stronger-than-expected sales and CPO price
Where we differ:Where we differ:Where we differ:Where we differ: We are the only broker covering the stock Analyst QUAH He Wei, CFA +603 2604 3966 [email protected]
What’s New • 1QFY17 results met expectation
• Expect stronger FY17 with twin growth drivers in
Plantation and Property in full swing
• Raise FY17F/18F/19F earnings by 1%2%/6% for
higher CPO price assumption
• Maintain BUY with higher TP of RM3.70
Price Relative
Forecasts and Valuation FY FY FY FY SepSepSepSep ((((RMRMRMRM m) m) m) m) 2016201620162016AAAA 2017201720172017FFFF 2018201820182018FFFF 2019201920192019FFFF
Revenue 1,275 1,384 1,370 1,375 EBITDA 337 364 369 368 Pre-tax Profit 308 273 271 266 Net Profit 205 183 190 191 Net Pft (Pre Ex.) 149 183 190 191 Net Pft Gth (Pre-ex) (%) 31.0 22.6 3.7 0.7 EPS (sen) 48.9 43.7 41.2 41.5 EPS Pre Ex. (sen) 35.6 43.7 41.2 41.5 EPS Gth Pre Ex (%) 31 23 (6) 1 Diluted EPS (sen) 48.9 43.7 41.2 41.5 Net DPS (sen) 7.00 8.00 7.27 7.27 BV Per Share (sen) 305 342 344 379 PE (X) 6.3 7.1 7.5 7.4 PE Pre Ex. (X) 8.7 7.1 7.5 7.4 P/Cash Flow (X) 6.1 4.9 5.9 5.9 EV/EBITDA (X) 5.5 4.8 4.9 4.7 Net Div Yield (%) 2.3 2.6 2.4 2.4 P/Book Value (X) 1.0 0.9 0.9 0.8 Net Debt/Equity (X) 0.4 0.3 0.2 0.1 ROAE (%) 17.2 13.5 12.6 11.5 Earnings Rev (%):Earnings Rev (%):Earnings Rev (%):Earnings Rev (%): 1 2 6 Consensus EPS Consensus EPS Consensus EPS Consensus EPS (sensensensen):::: 43.0 44.0 43.0 Other Broker Recs:Other Broker Recs:Other Broker Recs:Other Broker Recs: B: 1 S: 0 H: 0
Source of all data on this page: Company, AllianceDBS, Bloomberg Finance L.P
Compelling valuation Sustained earnings growth in FY17. Sustained earnings growth in FY17. Sustained earnings growth in FY17. Sustained earnings growth in FY17. After achieving a record profit in FY16, MKH is poised to deliver an even stronger performance in FY17, premised on the stellar performance from both its Plantation and Property divisions. These two key divisions are expected to drive the group forward, allowing it to have clear earnings visibility in FY17 against the backdrop of a challenging economic environment. MKH is currently trading at a bargain valuation of 7x FY17 EPS which is unjustified. We reiterate our BUY call with a higher SOP-derived TP of RM3.70. ResilientResilientResilientResilient property salesproperty salesproperty salesproperty sales. MKH achieved FY16 property sales of RM776m (-7% y-o-y), broadly on par with its record sales of RM835m in FY15. Management has set an all-time high sales target of RM900m in FY17, which attests to the strong confidence in its product offerings (majority <RM700k/unit). MKH’s strong foothold in Kajang/Semenyih makes it the largest beneficiary of the improved public transport connectivity via two MRT stations within Kajang which will be operational by mid-CY17. Meanwhile, its unbilled sales of RM705m will sustain its near-term earnings momentum. Plantation to recover in FY17Plantation to recover in FY17Plantation to recover in FY17Plantation to recover in FY17. MKH’s fresh fruit bunches (FFB) volume dropped 3% in FY16 due to the El-Nino impact on 2HFY16 production, but this is set to reverse in FY17 with the recovery in FFB production. Also, a strong rebound in crude palm oil (CPO) price supports our 117% growth projection in FY17 plantation EBIT (33% of group’s FY17 EBIT). The plantation business is already self-sustaining with strong cash flows to pare down its US$ borrowings.
Valuation:
MKH is a rare gem that offers both deep value and strong
earnings growth. Its current bargain valuation of 7x PE is
unjustified, in our view. Solid earnings delivery will be a strong
re-rating catalyst as investors appreciate the value in the stock.
Key Risks to Our View:
Margin compression. Margin compression. Margin compression. Margin compression. Rising construction cost could erode
profit margins for property projects. Exposure to fluctuations in
CPO prices can increase earnings volatility. At A Glance Issued Capital (m shrs) 420
Mkt. Cap (RMm/US$m) 1,298 / 292
Major Shareholders (%)
Chen Choy & Sons Realty 43.1
Public Bank Grp Off Fund 9.8
Free Float (%) 47.1
3m Avg. Daily Val (US$m) 0.27
ICB IndustryICB IndustryICB IndustryICB Industry : Real Estate / Real Estate Investment & Services
DBS Group Research . Equity
9 Mar 2017
Malaysia Company Guide
MKH Bhd Version 7 | Bloomberg: MKH MK | Reuters: METR.KL Refer to important disclosures at the end of this report
90
140
190
240
290
1.2
1.7
2.2
2.7
3.2
3.7
4.2
4.7
Feb-13 Feb-14 Feb-15 Feb-16 Feb-17
Relative IndexRM
MKH Bhd (LHS) Relative KLCI (RHS)
ASIAN INSIGHTS VICKERS SECURITIES
Page 14
Company Guide
MKH Bhd
CRITICAL DATA POINTS TO WATCH
Earnings Drivers:
FirstFirstFirstFirst----mover advantage. mover advantage. mover advantage. mover advantage. We expect MKH to do well in property
development, given its entrenched brand name in the Kajang-
Semenyih growth corridor and stronghold in the affordable
housing segment. This has placed the company in an enviable
position with property sales and unbilled sales continuing to
chalk new highs. Strong unbilled sales of RM705m imply clear
earnings visibility in the near term.
Healthy sales of affordable housingHealthy sales of affordable housingHealthy sales of affordable housingHealthy sales of affordable housing. MKH’s projects continue to
be well-received in this challenging market because of its focus
on affordable housing. MKH’s FY16 property sales came in at
RM776m (-7% y-o-y) which is a commendable performance.
The completion of MRT Line 1 by 2017 that will link the
Kajang/Semenyih growth corridor will be a strong catalyst for
MKH, given its 490-acre property land bank in that area.
Scarcity of land in Kajang also offers an advantage for MKH for
its future launches – they are expected to fetch premium
pricing, supported by strong demand.
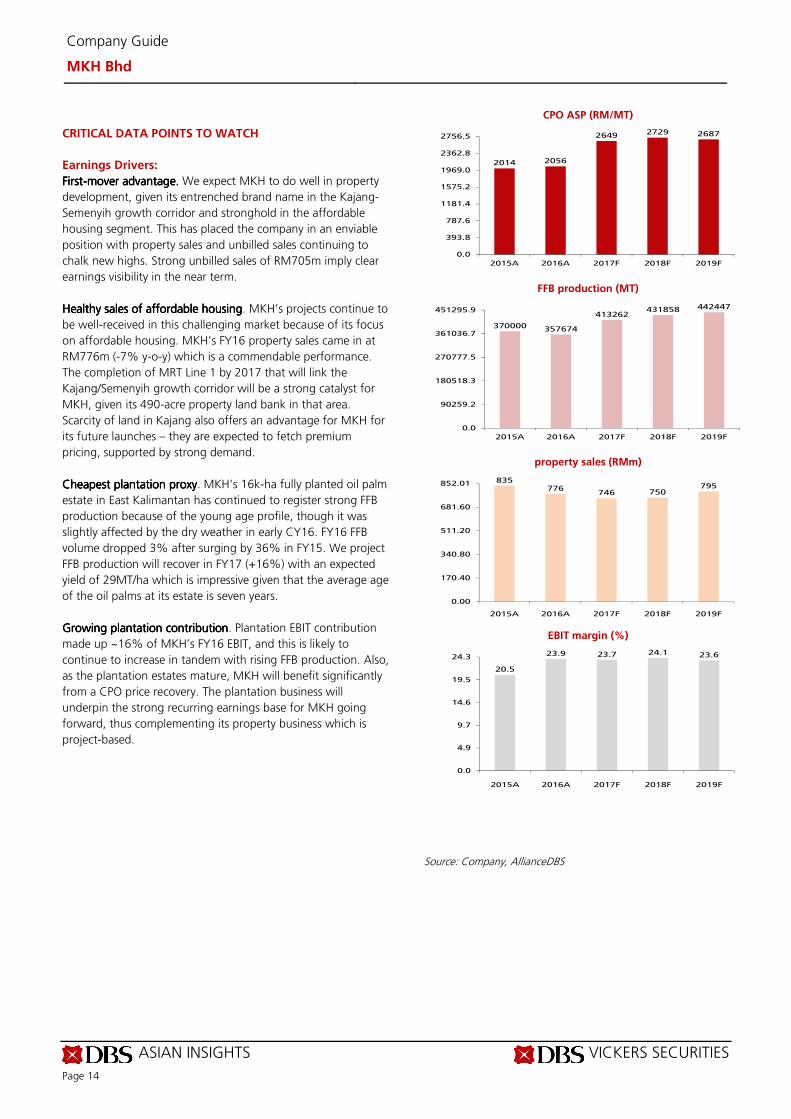
Cheapest plantation proxyCheapest plantation proxyCheapest plantation proxyCheapest plantation proxy. MKH’s 16k-ha fully planted oil palm
estate in East Kalimantan has continued to register strong FFB
production because of the young age profile, though it was
slightly affected by the dry weather in early CY16. FY16 FFB
volume dropped 3% after surging by 36% in FY15. We project
FFB production will recover in FY17 (+16%) with an expected
yield of 29MT/ha which is impressive given that the average age
of the oil palms at its estate is seven years.
Growing plantation contributionGrowing plantation contributionGrowing plantation contributionGrowing plantation contribution. Plantation EBIT contribution
made up ~16% of MKH’s FY16 EBIT, and this is likely to
continue to increase in tandem with rising FFB production. Also,
as the plantation estates mature, MKH will benefit significantly
from a CPO price recovery. The plantation business will
underpin the strong recurring earnings base for MKH going
forward, thus complementing its property business which is
project-based.
CPO ASP (RM/MT)
FFB production (MT)
property sales (RMm)
EBIT margin (%)
Source: Company, AllianceDBS
2014 2056
2649 2729 2687
0.0
393.8
787.6
1181.4
1575.2
1969.0
2362.8
2756.5
2015A 2016A 2017F 2018F 2019F
370000 357674
413262431858 442447
0.0
90259.2
180518.3
270777.5
361036.7
451295.9
2015A 2016A 2017F 2018F 2019F
835776
746 750795
0.00
170.40
340.80
511.20
681.60
852.01
2015A 2016A 2017F 2018F 2019F
20.5
23.9 23.7 24.1 23.6
0.0
4.9
9.7
14.6
19.5
24.3
2015A 2016A 2017F 2018F 2019F
ASIAN INSIGHTS VICKERS SECURITIES
Page 15
Company Guide
MKH Bhd
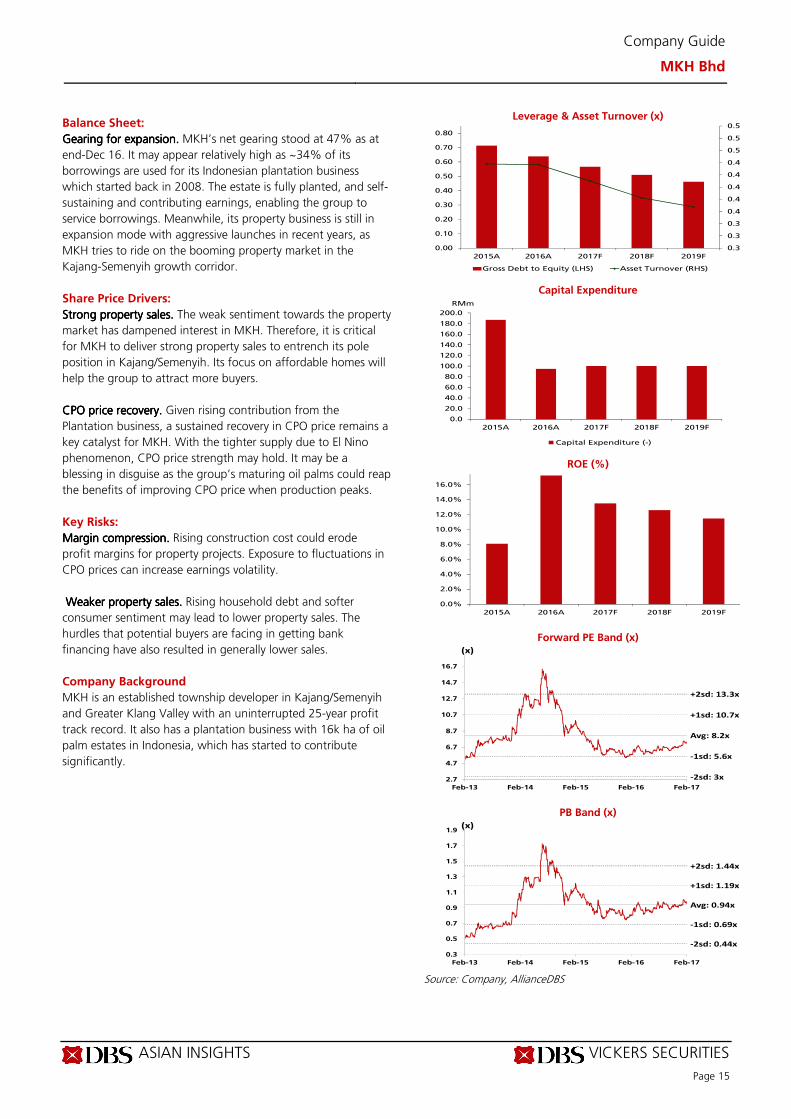
Balance Sheet:
Gearing for expansion. Gearing for expansion. Gearing for expansion. Gearing for expansion. MKH’s net gearing stood at 47% as at
end-Dec 16. It may appear relatively high as ~34% of its
borrowings are used for its Indonesian plantation business
which started back in 2008. The estate is fully planted, and self-
sustaining and contributing earnings, enabling the group to
service borrowings. Meanwhile, its property business is still in
expansion mode with aggressive launches in recent years, as
MKH tries to ride on the booming property market in the
Kajang-Semenyih growth corridor.
Share Price Drivers:
Strong property sales. Strong property sales. Strong property sales. Strong property sales. The weak sentiment towards the property
market has dampened interest in MKH. Therefore, it is critical
for MKH to deliver strong property sales to entrench its pole
position in Kajang/Semenyih. Its focus on affordable homes will
help the group to attract more buyers.
CPO price recovery. CPO price recovery. CPO price recovery. CPO price recovery. Given rising contribution from the
Plantation business, a sustained recovery in CPO price remains a
key catalyst for MKH. With the tighter supply due to El Nino
phenomenon, CPO price strength may hold. It may be a
blessing in disguise as the group’s maturing oil palms could reap
the benefits of improving CPO price when production peaks.
Key Risks:
Margin compression. Margin compression. Margin compression. Margin compression. Rising construction cost could erode
profit margins for property projects. Exposure to fluctuations in
CPO prices can increase earnings volatility.
Weaker property sales. Weaker property sales. Weaker property sales. Weaker property sales. Rising household debt and softer
consumer sentiment may lead to lower property sales. The
hurdles that potential buyers are facing in getting bank
financing have also resulted in generally lower sales.
Company Background
MKH is an established township developer in Kajang/Semenyih
and Greater Klang Valley with an uninterrupted 25-year profit
track record. It also has a plantation business with 16k ha of oil
palm estates in Indonesia, which has started to contribute
significantly.
Leverage & Asset Turnover (x)
Capital Expenditure
ROE (%)
Forward PE Band (x)
PB Band (x)
Source: Company, AllianceDBS
0.3
0.3
0.3
0.4
0.4
0.4
0.4
0.4
0.5
0.5
0.5
0.00
0.10
0.20
0.30
0.40
0.50
0.60
0.70
0.80
2015A 2016A 2017F 2018F 2019F
Gross Debt to Equity (LHS) Asset Turnover (RHS)
0.0
20.0
40.0
60.0
80.0
100.0
120.0
140.0
160.0
180.0
200.0
2015A 2016A 2017F 2018F 2019F
Capital Expenditure (-)
RMm
0.0%
2.0%
4.0%
6.0%
8.0%
10.0%
12.0%
14.0%
16.0%
2015A 2016A 2017F 2018F 2019F
Avg: 8.2x
+1sd: 10.7x
+2sd: 13.3x
-1sd: 5.6x
-2sd: 3x2.7
4.7
6.7
8.7
10.7
12.7
14.7
16.7
Feb-13 Feb-14 Feb-15 Feb-16 Feb-17
(x)
Avg: 0.94x
+1sd: 1.19x
+2sd: 1.44x
-1sd: 0.69x
-2sd: 0.44x
0.3
0.5
0.7
0.9
1.1
1.3
1.5
1.7
1.9
Feb-13 Feb-14 Feb-15 Feb-16 Feb-17
(x)
ASIAN INSIGHTS VICKERS SECURITIES
Page 16
Company Guide
MKH Bhd
Key Assumptions
FY FY FY FY SepSepSepSep 2015201520152015AAAA 2016201620162016AAAA 2017201720172017FFFF 2018201820182018FFFF 2019201920192019FFFF
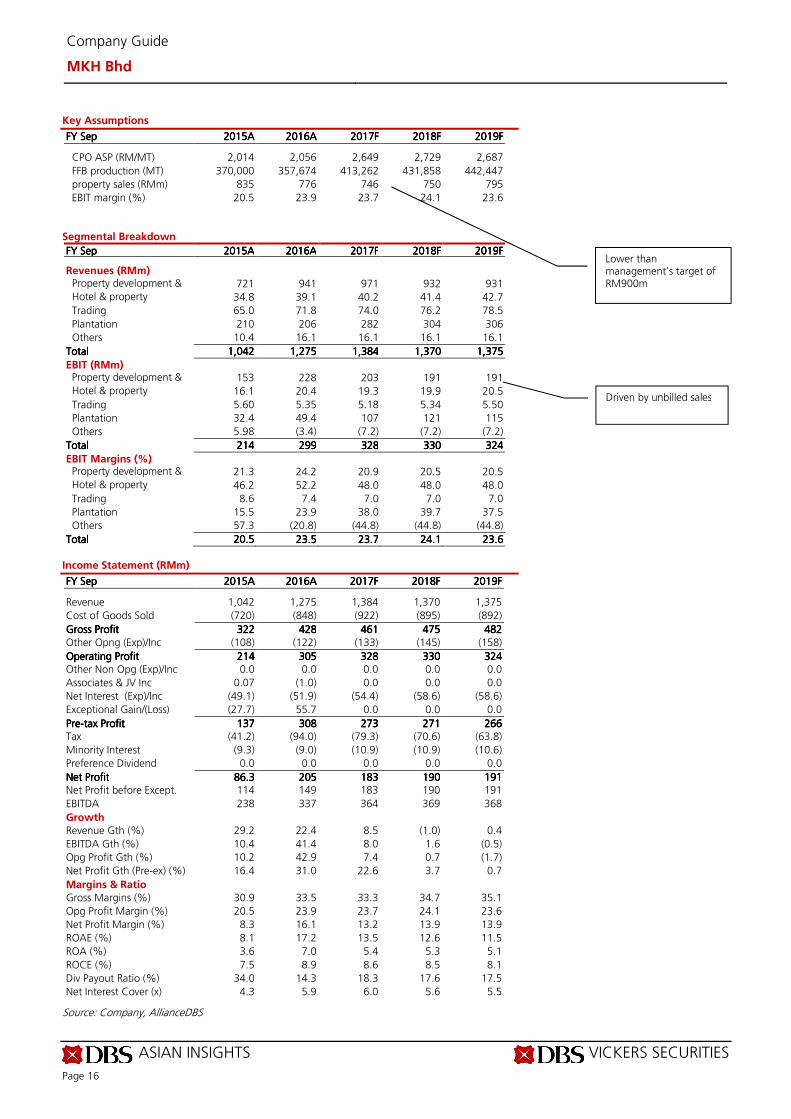
CPO ASP (RM/MT) 2,014 2,056 2,649 2,729 2,687
FFB production (MT) 370,000 357,674 413,262 431,858 442,447
property sales (RMm) 835 776 746 750 795
EBIT margin (%) 20.5 23.9 23.7 24.1 23.6
Segmental Breakdown
FY FY FY FY SepSepSepSep 2015201520152015AAAA 2016201620162016AAAA 2017201720172017FFFF 2018201820182018FFFF 2019201920192019FFFF Revenues (RMm) Property development & construction
721 941 971 932 931 Hotel & property investment
34.8 39.1 40.2 41.4 42.7
Trading 65.0 71.8 74.0 76.2 78.5
Plantation 210 206 282 304 306
Others 10.4 16.1 16.1 16.1 16.1
TotalTotalTotalTotal 1,0421,0421,0421,042 1,2751,2751,2751,275 1,3841,3841,3841,384 1,3701,3701,3701,370 1,3751,3751,3751,375
EBIT (RMm) Property development & construction
153 228 203 191 191 Hotel & property investment
16.1 20.4 19.3 19.9 20.5
Trading 5.60 5.35 5.18 5.34 5.50
Plantation 32.4 49.4 107 121 115
Others 5.98 (3.4) (7.2) (7.2) (7.2)
TotalTotalTotalTotal 214214214214 299299299299 328328328328 330330330330 324324324324
EBIT Margins (%) Property development & construction
21.3 24.2 20.9 20.5 20.5 Hotel & property investment
46.2 52.2 48.0 48.0 48.0
Trading 8.6 7.4 7.0 7.0 7.0
Plantation 15.5 23.9 38.0 39.7 37.5
Others 57.3 (20.8) (44.8) (44.8) (44.8)
TotalTotalTotalTotal 20.520.520.520.5 23.523.523.523.5 23.723.723.723.7 24.124.124.124.1 23.623.623.623.6
Income Statement (RMm)
FY FY FY FY SepSepSepSep 2015201520152015AAAA 2016201620162016AAAA 2017201720172017FFFF 2018201820182018FFFF 2019201920192019FFFF Revenue 1,042 1,275 1,384 1,370 1,375
Cost of Goods Sold (720) (848) (922) (895) (892)
Gross ProfitGross ProfitGross ProfitGross Profit 322322322322 428428428428 461461461461 475475475475 482482482482
Other Opng (Exp)/Inc (108) (122) (133) (145) (158)
Operating ProfitOperating ProfitOperating ProfitOperating Profit 214214214214 305305305305 328328328328 330330330330 324324324324 Other Non Opg (Exp)/Inc 0.0 0.0 0.0 0.0 0.0
Associates & JV Inc 0.07 (1.0) 0.0 0.0 0.0
Net Interest (Exp)/Inc (49.1) (51.9) (54.4) (58.6) (58.6)
Exceptional Gain/(Loss) (27.7) 55.7 0.0 0.0 0.0
PrePrePrePre----tax Profittax Profittax Profittax Profit 137137137137 308308308308 273273273273 271271271271 266266266266 Tax (41.2) (94.0) (79.3) (70.6) (63.8)
Minority Interest (9.3) (9.0) (10.9) (10.9) (10.6)
Preference Dividend 0.0 0.0 0.0 0.0 0.0
Net ProfitNet ProfitNet ProfitNet Profit 86.386.386.386.3 205205205205 183183183183 190190190190 191191191191 Net Profit before Except. 114 149 183 190 191
EBITDA 238 337 364 369 368
Growth
Revenue Gth (%) 29.2 22.4 8.5 (1.0) 0.4
EBITDA Gth (%) 10.4 41.4 8.0 1.6 (0.5)
Opg Profit Gth (%) 10.2 42.9 7.4 0.7 (1.7)
Net Profit Gth (Pre-ex) (%) 16.4 31.0 22.6 3.7 0.7
Margins & Ratio
Gross Margins (%) 30.9 33.5 33.3 34.7 35.1
Opg Profit Margin (%) 20.5 23.9 23.7 24.1 23.6
Net Profit Margin (%) 8.3 16.1 13.2 13.9 13.9
ROAE (%) 8.1 17.2 13.5 12.6 11.5
ROA (%) 3.6 7.0 5.4 5.3 5.1
ROCE (%) 7.5 8.9 8.6 8.5 8.1
Div Payout Ratio (%) 34.0 14.3 18.3 17.6 17.5
Net Interest Cover (x) 4.3 5.9 6.0 5.6 5.5
Source: Company, AllianceDBS
Lower than management’s target of RM900m
Driven by unbilled sales
ASIAN INSIGHTS VICKERS SECURITIES
Page 17
Company Guide
MKH Bhd
Quarterly / Interim Income Statement (RMm)
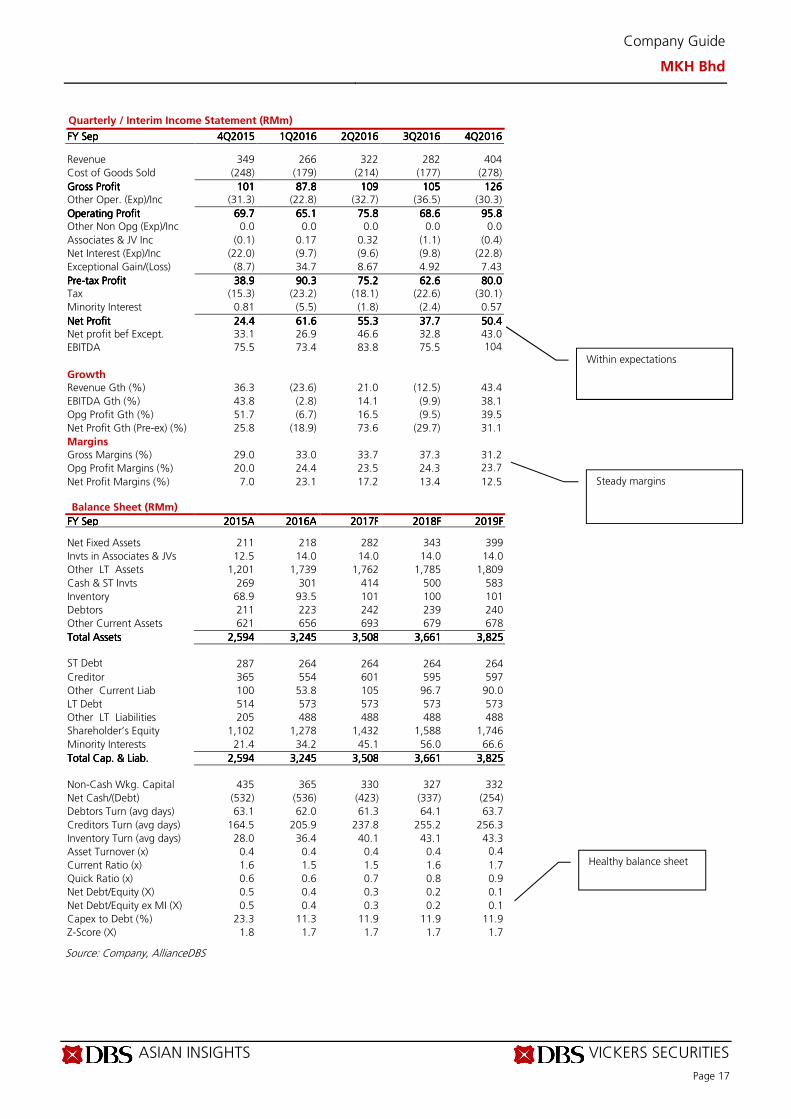
FY FY FY FY SepSepSepSep 4Q4Q4Q4Q2015201520152015 1Q1Q1Q1Q2016201620162016 2Q2Q2Q2Q2016201620162016 3Q3Q3Q3Q2016201620162016 4Q4Q4Q4Q2016201620162016 Revenue 349 266 322 282 404
Cost of Goods Sold (248) (179) (214) (177) (278)
Gross ProfitGross ProfitGross ProfitGross Profit 101101101101 87.887.887.887.8 109109109109 105105105105 126126126126 Other Oper. (Exp)/Inc (31.3) (22.8) (32.7) (36.5) (30.3)
Operating ProfitOperating ProfitOperating ProfitOperating Profit 69.769.769.769.7 65.165.165.165.1 75.875.875.875.8 68.668.668.668.6 95.895.895.895.8 Other Non Opg (Exp)/Inc 0.0 0.0 0.0 0.0 0.0
Associates & JV Inc (0.1) 0.17 0.32 (1.1) (0.4)
Net Interest (Exp)/Inc (22.0) (9.7) (9.6) (9.8) (22.8)
Exceptional Gain/(Loss) (8.7) 34.7 8.67 4.92 7.43
PrePrePrePre----tax Profittax Profittax Profittax Profit 38.938.938.938.9 90.390.390.390.3 75.275.275.275.2 62.662.662.662.6 80.080.080.080.0 Tax (15.3) (23.2) (18.1) (22.6) (30.1)
Minority Interest 0.81 (5.5) (1.8) (2.4) 0.57
Net ProfitNet ProfitNet ProfitNet Profit 24.424.424.424.4 61.661.661.661.6 55.355.355.355.3 37.737.737.737.7 50.450.450.450.4 Net profit bef Except. 33.1 26.9 46.6 32.8 43.0
EBITDA 75.5 73.4 83.8 75.5 104
Growth
Revenue Gth (%) 36.3 (23.6) 21.0 (12.5) 43.4
EBITDA Gth (%) 43.8 (2.8) 14.1 (9.9) 38.1
Opg Profit Gth (%) 51.7 (6.7) 16.5 (9.5) 39.5
Net Profit Gth (Pre-ex) (%) 25.8 (18.9) 73.6 (29.7) 31.1
Margins
Gross Margins (%) 29.0 33.0 33.7 37.3 31.2
Opg Profit Margins (%) 20.0 24.4 23.5 24.3 23.7
Net Profit Margins (%) 7.0 23.1 17.2 13.4 12.5 Balance Sheet (RMm)
FY FY FY FY SepSepSepSep 2015201520152015AAAA 2016201620162016AAAA 2017201720172017FFFF 2018201820182018FFFF 2019201920192019FFFF Net Fixed Assets 211 218 282 343 399
Invts in Associates & JVs 12.5 14.0 14.0 14.0 14.0
Other LT Assets 1,201 1,739 1,762 1,785 1,809
Cash & ST Invts 269 301 414 500 583
Inventory 68.9 93.5 101 100 101
Debtors 211 223 242 239 240
Other Current Assets 621 656 693 679 678
Total AssetsTotal AssetsTotal AssetsTotal Assets 2,5942,5942,5942,594 3,2453,2453,2453,245 3,5083,5083,5083,508 3,6613,6613,6613,661 3,8253,8253,8253,825
ST Debt
287 264 264 264 264
Creditor 365 554 601 595 597
Other Current Liab 100 53.8 105 96.7 90.0
LT Debt 514 573 573 573 573
Other LT Liabilities 205 488 488 488 488
Shareholder’s Equity 1,102 1,278 1,432 1,588 1,746
Minority Interests 21.4 34.2 45.1 56.0 66.6
Total Cap. & Liab.Total Cap. & Liab.Total Cap. & Liab.Total Cap. & Liab. 2,5942,5942,5942,594 3,2453,2453,2453,245 3,5083,5083,5083,508 3,6613,6613,6613,661 3,8253,8253,8253,825
Non-Cash Wkg. Capital 435 365 330 327 332
Net Cash/(Debt) (532) (536) (423) (337) (254)
Debtors Turn (avg days) 63.1 62.0 61.3 64.1 63.7
Creditors Turn (avg days) 164.5 205.9 237.8 255.2 256.3
Inventory Turn (avg days) 28.0 36.4 40.1 43.1 43.3
Asset Turnover (x) 0.4 0.4 0.4 0.4 0.4
Current Ratio (x) 1.6 1.5 1.5 1.6 1.7
Quick Ratio (x) 0.6 0.6 0.7 0.8 0.9
Net Debt/Equity (X) 0.5 0.4 0.3 0.2 0.1
Net Debt/Equity ex MI (X) 0.5 0.4 0.3 0.2 0.1
Capex to Debt (%) 23.3 11.3 11.9 11.9 11.9
Z-Score (X) 1.8 1.7 1.7 1.7 1.7
Source: Company, AllianceDBS
Within expectations
Steady margins
Healthy balance sheet
ASIAN INSIGHTS VICKERS SECURITIES
Page 18
Company Guide
MKH Bhd
Cash Flow Statement (RMm)
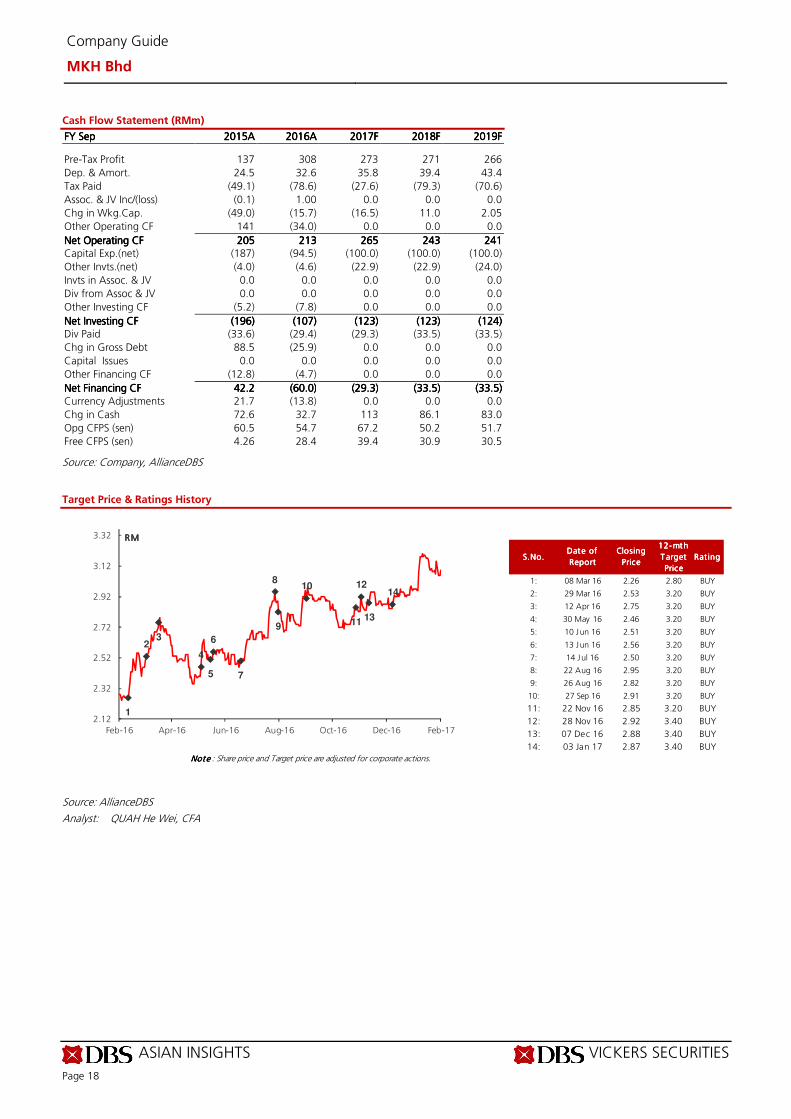
FY FY FY FY SepSepSepSep 2015201520152015AAAA 2016201620162016AAAA 2017201720172017FFFF 2018201820182018FFFF 2019201920192019FFFF Pre-Tax Profit 137 308 273 271 266
Dep. & Amort. 24.5 32.6 35.8 39.4 43.4
Tax Paid (49.1) (78.6) (27.6) (79.3) (70.6)
Assoc. & JV Inc/(loss) (0.1) 1.00 0.0 0.0 0.0
Chg in Wkg.Cap. (49.0) (15.7) (16.5) 11.0 2.05
Other Operating CF 141 (34.0) 0.0 0.0 0.0
Net Operating CFNet Operating CFNet Operating CFNet Operating CF 205205205205 213213213213 265265265265 243243243243 241241241241 Capital Exp.(net) (187) (94.5) (100.0) (100.0) (100.0)
Other Invts.(net) (4.0) (4.6) (22.9) (22.9) (24.0)
Invts in Assoc. & JV 0.0 0.0 0.0 0.0 0.0
Div from Assoc & JV 0.0 0.0 0.0 0.0 0.0
Other Investing CF (5.2) (7.8) 0.0 0.0 0.0
Net Investing CFNet Investing CFNet Investing CFNet Investing CF (196)(196)(196)(196) (107)(107)(107)(107) (123)(123)(123)(123) (123)(123)(123)(123) (124)(124)(124)(124) Div Paid (33.6) (29.4) (29.3) (33.5) (33.5)
Chg in Gross Debt 88.5 (25.9) 0.0 0.0 0.0
Capital Issues 0.0 0.0 0.0 0.0 0.0
Other Financing CF (12.8) (4.7) 0.0 0.0 0.0
Net Financing CFNet Financing CFNet Financing CFNet Financing CF 42.242.242.242.2 (60.0)(60.0)(60.0)(60.0) (29.3)(29.3)(29.3)(29.3) (33.5)(33.5)(33.5)(33.5) (33.5)(33.5)(33.5)(33.5)
Currency Adjustments 21.7 (13.8) 0.0 0.0 0.0
Chg in Cash 72.6 32.7 113 86.1 83.0
Opg CFPS (sen) 60.5 54.7 67.2 50.2 51.7
Free CFPS (sen) 4.26 28.4 39.4 30.9 30.5
Source: Company, AllianceDBS
Target Price & Ratings History
Source: AllianceDBS
Analyst: QUAH He Wei, CFA
S.No.S.No.S.No.S.No.Date of Date of Date of Date of
ReportReportReportReport
Closing Closing Closing Closing
PricePricePricePrice
12-mth 12-mth 12-mth 12-mth
T arget T arget T arget T arget
PricePricePricePrice
Rat ing Rat ing Rat ing Rat ing
1: 08 Mar 16 2.26 2.80 BUY
2: 29 Mar 16 2.53 3.20 BUY
3: 12 Apr 16 2.75 3.20 BUY
4: 30 May 16 2.46 3.20 BUY
5: 10 Jun 16 2.51 3.20 BUY
6: 13 Jun 16 2.56 3.20 BUY
7: 14 Jul 16 2.50 3.20 BUY
8: 22 Aug 16 2.95 3.20 BUY
9: 26 Aug 16 2.82 3.20 BUY
10: 27 Sep 16 2.91 3.20 BUY
11: 22 Nov 16 2.85 3.20 BUY
12: 28 Nov 16 2.92 3.40 BUY
13: 07 Dec 16 2.88 3.40 BUY
14: 03 Jan 17 2.87 3.40 BUY
Note Note Note Note : Share price and Target price are adjusted for corporate actions.
1
23
4
5
6
7
8
9
10
11
12
13
14
2.12
2.32
2.52
2.72
2.92
3.12
3.32
Feb-16 Apr-16 Jun-16 Aug-16 Oct-16 Dec-16 Feb-17
RMRMRMRM
ASIAN INSIGHTS VICKERS SECURITIES ed: CK / sa:BC, PY
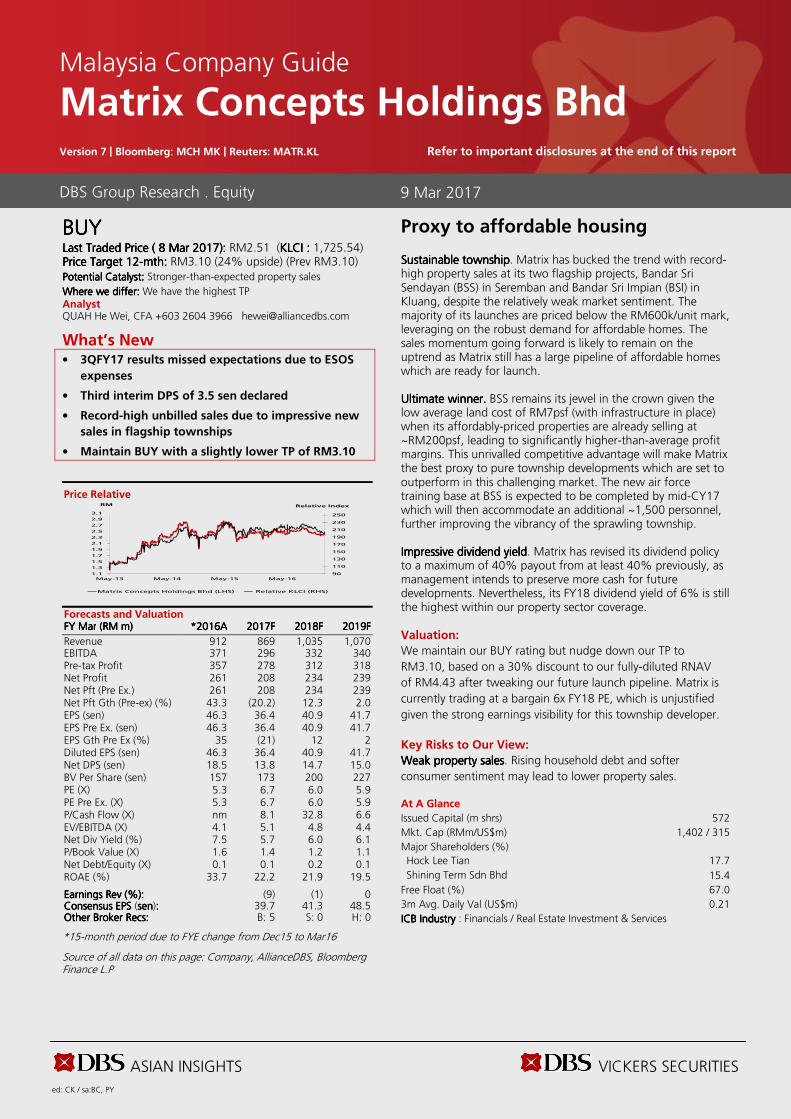
BUYBUYBUYBUY Last Traded PriceLast Traded PriceLast Traded PriceLast Traded Price (((( 8 Mar 20178 Mar 20178 Mar 20178 Mar 2017)))): : : : RM2.51 (KLCIKLCIKLCIKLCI : : : : 1,725.54) Price Target Price Target Price Target Price Target 12121212----mthmthmthmth:::: RM3.10 (24% upside) (Prev RM3.10) Potential Catalyst: Potential Catalyst: Potential Catalyst: Potential Catalyst: Stronger-than-expected property sales
Where we differ:Where we differ:Where we differ:Where we differ: We have the highest TP Analyst QUAH He Wei, CFA +603 2604 3966 [email protected]
What’s New • 3QFY17 results missed expectations due to ESOS
expenses
• Third interim DPS of 3.5 sen declared
• Record-high unbilled sales due to impressive new
sales in flagship townships
• Maintain BUY with a slightly lower TP of RM3.10
Price Relative
Forecasts and Valuation FY FY FY FY MarMarMarMar ((((RMRMRMRM m) m) m) m) ****2016201620162016AAAA 2017201720172017FFFF 2018201820182018FFFF 2019201920192019FFFF
Revenue 912 869 1,035 1,070 EBITDA 371 296 332 340 Pre-tax Profit 357 278 312 318 Net Profit 261 208 234 239 Net Pft (Pre Ex.) 261 208 234 239 Net Pft Gth (Pre-ex) (%) 43.3 (20.2) 12.3 2.0 EPS (sen) 46.3 36.4 40.9 41.7 EPS Pre Ex. (sen) 46.3 36.4 40.9 41.7 EPS Gth Pre Ex (%) 35 (21) 12 2 Diluted EPS (sen) 46.3 36.4 40.9 41.7 Net DPS (sen) 18.5 13.8 14.7 15.0 BV Per Share (sen) 157 173 200 227 PE (X) 5.3 6.7 6.0 5.9 PE Pre Ex. (X) 5.3 6.7 6.0 5.9 P/Cash Flow (X) nm 8.1 32.8 6.6 EV/EBITDA (X) 4.1 5.1 4.8 4.4 Net Div Yield (%) 7.5 5.7 6.0 6.1 P/Book Value (X) 1.6 1.4 1.2 1.1 Net Debt/Equity (X) 0.1 0.1 0.2 0.1 ROAE (%) 33.7 22.2 21.9 19.5 Earnings Rev (%):Earnings Rev (%):Earnings Rev (%):Earnings Rev (%): (9) (1) 0 Consensus EPS Consensus EPS Consensus EPS Consensus EPS (sensensensen):::: 39.7 41.3 48.5 Other Broker Recs:Other Broker Recs:Other Broker Recs:Other Broker Recs: B: 5 S: 0 H: 0
*15-month period due to FYE change from Dec15 to Mar16
Source of all data on this page: Company, AllianceDBS, Bloomberg Finance L.P
Proxy to affordable housing Sustainable townshipSustainable townshipSustainable townshipSustainable township. Matrix has bucked the trend with record- high property sales at its two flagship projects, Bandar Sri Sendayan (BSS) in Seremban and Bandar Sri Impian (BSI) in Kluang, despite the relatively weak market sentiment. The majority of its launches are priced below the RM600k/unit mark, leveraging on the robust demand for affordable homes. The sales momentum going forward is likely to remain on the uptrend as Matrix still has a large pipeline of affordable homes which are ready for launch. Ultimate winner.Ultimate winner.Ultimate winner.Ultimate winner. BSS remains its jewel in the crown given the low average land cost of RM7psf (with infrastructure in place) when its affordably-priced properties are already selling at ~RM200psf, leading to significantly higher-than-average profit margins. This unrivalled competitive advantage will make Matrix the best proxy to pure township developments which are set to outperform in this challenging market. The new air force training base at BSS is expected to be completed by mid-CY17 which will then accommodate an additional ~1,500 personnel, further improving the vibrancy of the sprawling township. Impressive dividend yieldImpressive dividend yieldImpressive dividend yieldImpressive dividend yield. Matrix has revised its dividend policy to a maximum of 40% payout from at least 40% previously, as management intends to preserve more cash for future developments. Nevertheless, its FY18 dividend yield of 6% is still the highest within our property sector coverage. Valuation:
We maintain our BUY rating but nudge down our TP to
RM3.10, based on a 30% discount to our fully-diluted RNAV
of RM4.43 after tweaking our future launch pipeline. Matrix is
currently trading at a bargain 6x FY18 PE, which is unjustified
given the strong earnings visibility for this township developer.
Key Risks to Our View:
Weak property salesWeak property salesWeak property salesWeak property sales. Rising household debt and softer
consumer sentiment may lead to lower property sales. At A Glance Issued Capital (m shrs) 572
Mkt. Cap (RMm/US$m) 1,402 / 315
Major Shareholders (%)
Hock Lee Tian 17.7
Shining Term Sdn Bhd 15.4
Free Float (%) 67.0
3m Avg. Daily Val (US$m) 0.21
ICB IndustryICB IndustryICB IndustryICB Industry : Financials / Real Estate Investment & Services
DBS Group Research . Equity %
9 Mar 2017
Malaysia Company Guide
Matrix Concepts Holdings Bhd Version 7 | Bloomberg: MCH MK | Reuters: MATR.KL Refer to important disclosures at the end of this report
90
110
130
150
170
190
210
230
250
1.1
1.3
1.5
1.7
1.9
2.1
2.3
2.5
2.7
2.9
3.1
May-13 May-14 May-15 May-16
Relative IndexRM
Matrix Concepts Holdings Bhd (LHS) Relative KLCI (RHS)
ASIAN INSIGHTS VICKERS SECURITIES
Page 20
Company Guide
Matrix Concepts Holdings Bhd
CRITICAL DATA POINTS TO WATCH
Earnings Drivers:
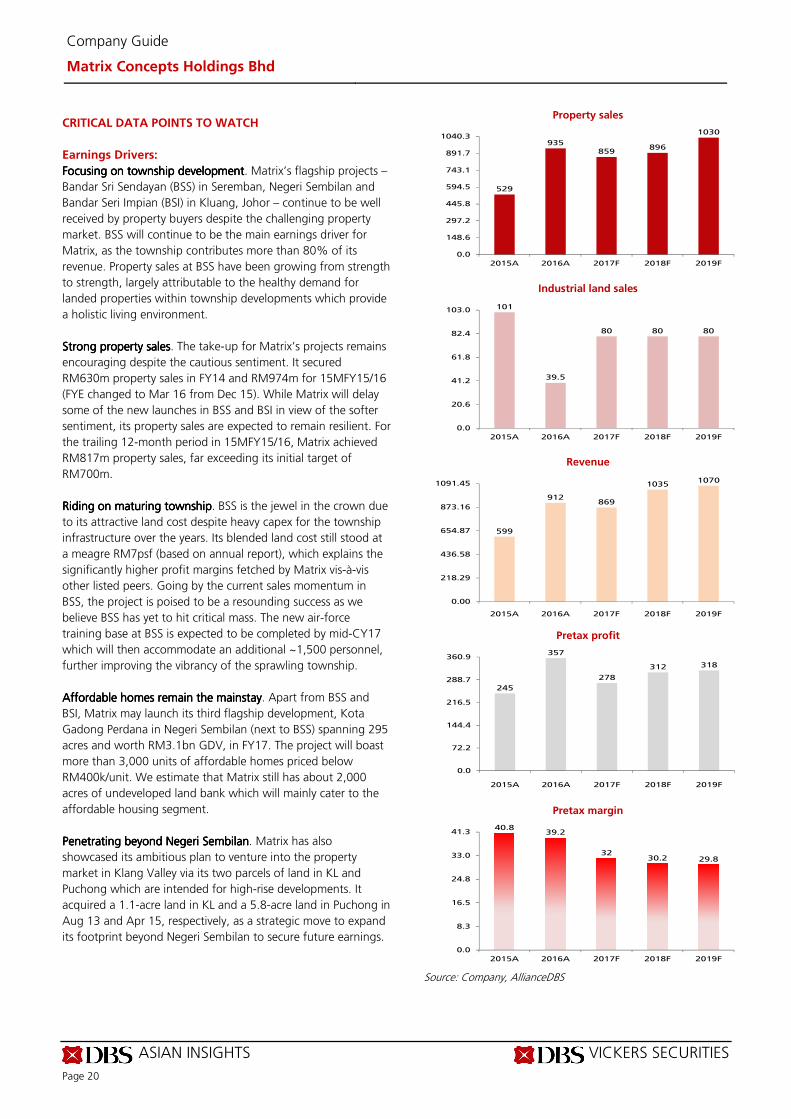
Focusing on township developmentFocusing on township developmentFocusing on township developmentFocusing on township development. Matrix’s flagship projects –
Bandar Sri Sendayan (BSS) in Seremban, Negeri Sembilan and
Bandar Seri Impian (BSI) in Kluang, Johor – continue to be well
received by property buyers despite the challenging property
market. BSS will continue to be the main earnings driver for
Matrix, as the township contributes more than 80% of its
revenue. Property sales at BSS have been growing from strength
to strength, largely attributable to the healthy demand for
landed properties within township developments which provide
a holistic living environment.
Strong property salesStrong property salesStrong property salesStrong property sales. The take-up for Matrix’s projects remains
encouraging despite the cautious sentiment. It secured
RM630m property sales in FY14 and RM974m for 15MFY15/16
(FYE changed to Mar 16 from Dec 15). While Matrix will delay
some of the new launches in BSS and BSI in view of the softer
sentiment, its property sales are expected to remain resilient. For
the trailing 12-month period in 15MFY15/16, Matrix achieved
RM817m property sales, far exceeding its initial target of
RM700m.
Riding on maturing townshipRiding on maturing townshipRiding on maturing townshipRiding on maturing township. BSS is the jewel in the crown due
to its attractive land cost despite heavy capex for the township
infrastructure over the years. Its blended land cost still stood at
a meagre RM7psf (based on annual report), which explains the
significantly higher profit margins fetched by Matrix vis-à-vis
other listed peers. Going by the current sales momentum in
BSS, the project is poised to be a resounding success as we
believe BSS has yet to hit critical mass. The new air-force
training base at BSS is expected to be completed by mid-CY17
which will then accommodate an additional ~1,500 personnel,
further improving the vibrancy of the sprawling township.
Affordable homes remain the mainstayAffordable homes remain the mainstayAffordable homes remain the mainstayAffordable homes remain the mainstay. Apart from BSS and
BSI, Matrix may launch its third flagship development, Kota
Gadong Perdana in Negeri Sembilan (next to BSS) spanning 295
acres and worth RM3.1bn GDV, in FY17. The project will boast
more than 3,000 units of affordable homes priced below
RM400k/unit. We estimate that Matrix still has about 2,000
acres of undeveloped land bank which will mainly cater to the
affordable housing segment.
Penetrating beyond Negeri SembilanPenetrating beyond Negeri SembilanPenetrating beyond Negeri SembilanPenetrating beyond Negeri Sembilan. Matrix has also
showcased its ambitious plan to venture into the property
market in Klang Valley via its two parcels of land in KL and
Puchong which are intended for high-rise developments. It
acquired a 1.1-acre land in KL and a 5.8-acre land in Puchong in
Aug 13 and Apr 15, respectively, as a strategic move to expand
its footprint beyond Negeri Sembilan to secure future earnings.
Property sales
Industrial land sales
Revenue
Pretax profit
Pretax margin
Source: Company, AllianceDBS
529
935859
896
1030
0.0
148.6
297.2
445.8
594.5
743.1
891.7
1040.3
2015A 2016A 2017F 2018F 2019F
101
39.5
80 80 80
0.0
20.6
41.2
61.8
82.4
103.0
2015A 2016A 2017F 2018F 2019F
599
912869
10351070
0.00
218.29
436.58
654.87
873.16
1091.45
2015A 2016A 2017F 2018F 2019F
245
357
278
312 318
0.0
72.2
144.4
216.5
288.7
360.9
2015A 2016A 2017F 2018F 2019F
40.839.2
3230.2 29.8
0.0
8.3
16.5
24.8
33.0
41.3
2015A 2016A 2017F 2018F 2019F
ASIAN INSIGHTS VICKERS SECURITIES
Page 21
Company Guide
Matrix Concepts Holdings Bhd
Balance Sheet:
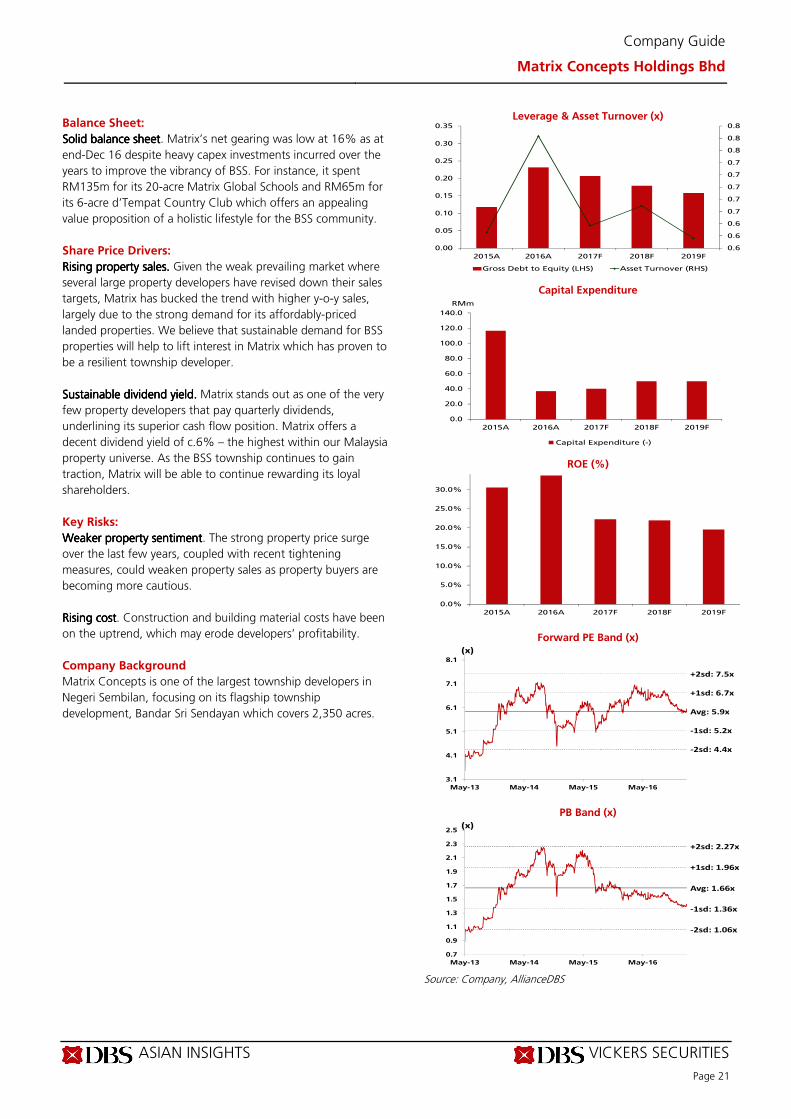
Solid balance sheetSolid balance sheetSolid balance sheetSolid balance sheet. Matrix’s net gearing was low at 16% as at
end-Dec 16 despite heavy capex investments incurred over the
years to improve the vibrancy of BSS. For instance, it spent
RM135m for its 20-acre Matrix Global Schools and RM65m for
its 6-acre d’Tempat Country Club which offers an appealing
value proposition of a holistic lifestyle for the BSS community.
Share Price Drivers:
Rising property sales. Rising property sales. Rising property sales. Rising property sales. Given the weak prevailing market where
several large property developers have revised down their sales
targets, Matrix has bucked the trend with higher y-o-y sales,
largely due to the strong demand for its affordably-priced
landed properties. We believe that sustainable demand for BSS
properties will help to lift interest in Matrix which has proven to
be a resilient township developer.
Sustainable dividend yield. Sustainable dividend yield. Sustainable dividend yield. Sustainable dividend yield. Matrix stands out as one of the very
few property developers that pay quarterly dividends,
underlining its superior cash flow position. Matrix offers a
decent dividend yield of c.6% – the highest within our Malaysia
property universe. As the BSS township continues to gain
traction, Matrix will be able to continue rewarding its loyal
shareholders.
Key Risks:
Weaker property sentimentWeaker property sentimentWeaker property sentimentWeaker property sentiment. The strong property price surge
over the last few years, coupled with recent tightening
measures, could weaken property sales as property buyers are
becoming more cautious.
Rising costRising costRising costRising cost. Construction and building material costs have been
on the uptrend, which may erode developers’ profitability.
Company Background
Matrix Concepts is one of the largest township developers in
Negeri Sembilan, focusing on its flagship township
development, Bandar Sri Sendayan which covers 2,350 acres.
Leverage & Asset Turnover (x)
Capital Expenditure
ROE (%)
Forward PE Band (x)
PB Band (x)
Source: Company, AllianceDBS
0.6
0.6
0.6
0.7
0.7
0.7
0.7
0.7
0.8
0.8
0.8
0.00
0.05
0.10
0.15
0.20
0.25
0.30
0.35
2015A 2016A 2017F 2018F 2019F
Gross Debt to Equity (LHS) Asset Turnover (RHS)
0.0
20.0
40.0
60.0
80.0
100.0
120.0
140.0
2015A 2016A 2017F 2018F 2019F
Capital Expenditure (-)
RMm
0.0%
5.0%
10.0%
15.0%
20.0%
25.0%
30.0%
2015A 2016A 2017F 2018F 2019F
Avg: 5.9x
+1sd: 6.7x
+2sd: 7.5x
-1sd: 5.2x
-2sd: 4.4x
3.1
4.1
5.1
6.1
7.1
8.1
May-13 May-14 May-15 May-16
(x)
Avg: 1.66x
+1sd: 1.96x
+2sd: 2.27x
-1sd: 1.36x
-2sd: 1.06x
0.7
0.9
1.1
1.3
1.5
1.7
1.9
2.1
2.3
2.5
May-13 May-14 May-15 May-16
(x)
ASIAN INSIGHTS VICKERS SECURITIES
Page 22
Company Guide
Matrix Concepts Holdings Bhd
Key Assumptions
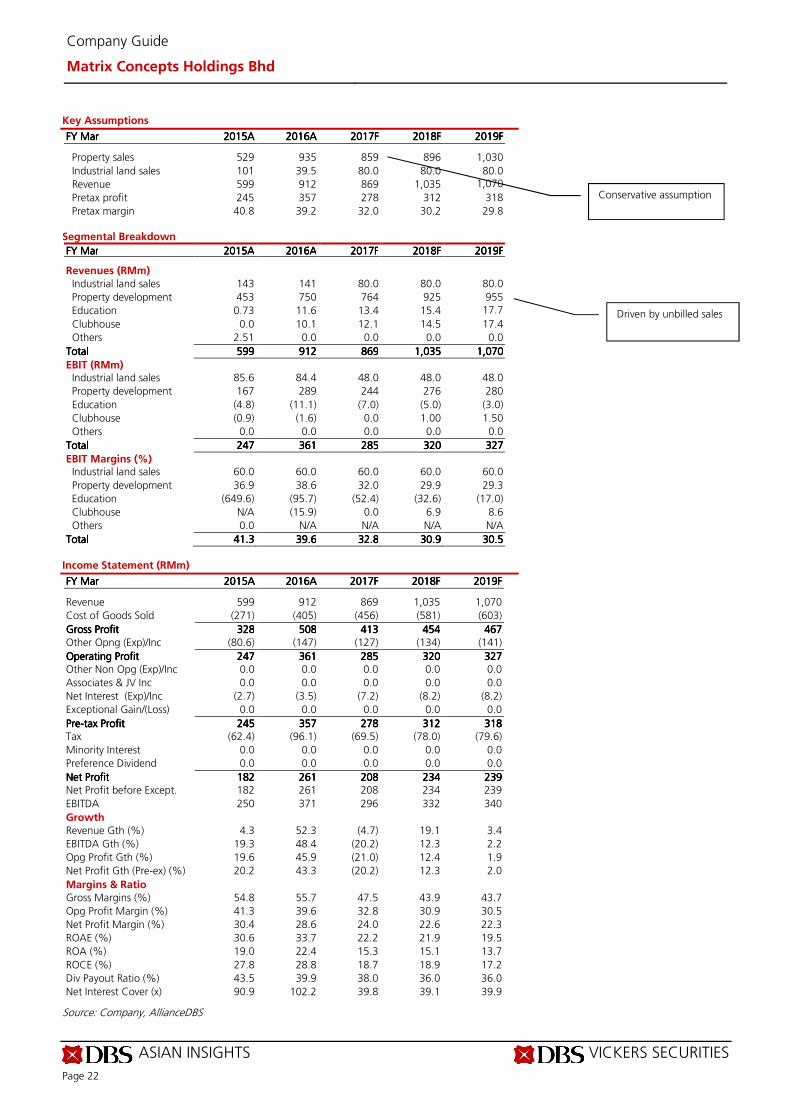
FY FY FY FY MarMarMarMar 2015201520152015AAAA 2016201620162016AAAA 2017201720172017FFFF 2018201820182018FFFF 2019201920192019FFFF
Property sales 529 935 859 896 1,030
Industrial land sales 101 39.5 80.0 80.0 80.0
Revenue 599 912 869 1,035 1,070
Pretax profit 245 357 278 312 318
Pretax margin 40.8 39.2 32.0 30.2 29.8 Segmental Breakdown
FY FY FY FY MarMarMarMar 2015201520152015AAAA 2016201620162016AAAA 2017201720172017FFFF 2018201820182018FFFF 2019201920192019FFFF Revenues (RMm)
Industrial land sales 143 141 80.0 80.0 80.0
Property development 453 750 764 925 955
Education 0.73 11.6 13.4 15.4 17.7
Clubhouse 0.0 10.1 12.1 14.5 17.4
Others 2.51 0.0 0.0 0.0 0.0
TotalTotalTotalTotal 599599599599 912912912912 869869869869 1,0351,0351,0351,035 1,0701,0701,0701,070
EBIT (RMm) Industrial land sales 85.6 84.4 48.0 48.0 48.0
Property development 167 289 244 276 280
Education (4.8) (11.1) (7.0) (5.0) (3.0)
Clubhouse (0.9) (1.6) 0.0 1.00 1.50
Others 0.0 0.0 0.0 0.0 0.0
TotalTotalTotalTotal 247247247247 361361361361 285285285285 320320320320 327327327327
EBIT Margins (%) Industrial land sales 60.0 60.0 60.0 60.0 60.0
Property development 36.9 38.6 32.0 29.9 29.3
Education (649.6) (95.7) (52.4) (32.6) (17.0)
Clubhouse N/A (15.9) 0.0 6.9 8.6
Others 0.0 N/A N/A N/A N/A
TotalTotalTotalTotal 41.341.341.341.3 39.639.639.639.6 32.832.832.832.8 30.930.930.930.9 30.530.530.530.5
Income Statement (RMm)
FY FY FY FY MarMarMarMar 2015201520152015AAAA 2016201620162016AAAA 2017201720172017FFFF 2018201820182018FFFF 2019201920192019FFFF Revenue 599 912 869 1,035 1,070
Cost of Goods Sold (271) (405) (456) (581) (603)
Gross ProfitGross ProfitGross ProfitGross Profit 328328328328 508508508508 413413413413 454454454454 467467467467
Other Opng (Exp)/Inc (80.6) (147) (127) (134) (141)
Operating ProfitOperating ProfitOperating ProfitOperating Profit 247247247247 361361361361 285285285285 320320320320 327327327327 Other Non Opg (Exp)/Inc 0.0 0.0 0.0 0.0 0.0
Associates & JV Inc 0.0 0.0 0.0 0.0 0.0
Net Interest (Exp)/Inc (2.7) (3.5) (7.2) (8.2) (8.2)
Exceptional Gain/(Loss) 0.0 0.0 0.0 0.0 0.0
PrePrePrePre----tax Profittax Profittax Profittax Profit 245245245245 357357357357 278278278278 312312312312 318318318318 Tax (62.4) (96.1) (69.5) (78.0) (79.6)
Minority Interest 0.0 0.0 0.0 0.0 0.0
Preference Dividend 0.0 0.0 0.0 0.0 0.0
Net ProfitNet ProfitNet ProfitNet Profit 182182182182 261261261261 208208208208 234234234234 239239239239 Net Profit before Except. 182 261 208 234 239
EBITDA 250 371 296 332 340
Growth
Revenue Gth (%) 4.3 52.3 (4.7) 19.1 3.4
EBITDA Gth (%) 19.3 48.4 (20.2) 12.3 2.2
Opg Profit Gth (%) 19.6 45.9 (21.0) 12.4 1.9
Net Profit Gth (Pre-ex) (%) 20.2 43.3 (20.2) 12.3 2.0
Margins & Ratio
Gross Margins (%) 54.8 55.7 47.5 43.9 43.7
Opg Profit Margin (%) 41.3 39.6 32.8 30.9 30.5
Net Profit Margin (%) 30.4 28.6 24.0 22.6 22.3
ROAE (%) 30.6 33.7 22.2 21.9 19.5
ROA (%) 19.0 22.4 15.3 15.1 13.7
ROCE (%) 27.8 28.8 18.7 18.9 17.2
Div Payout Ratio (%) 43.5 39.9 38.0 36.0 36.0
Net Interest Cover (x) 90.9 102.2 39.8 39.1 39.9
Source: Company, AllianceDBS
Conservative assumption
Driven by unbilled sales
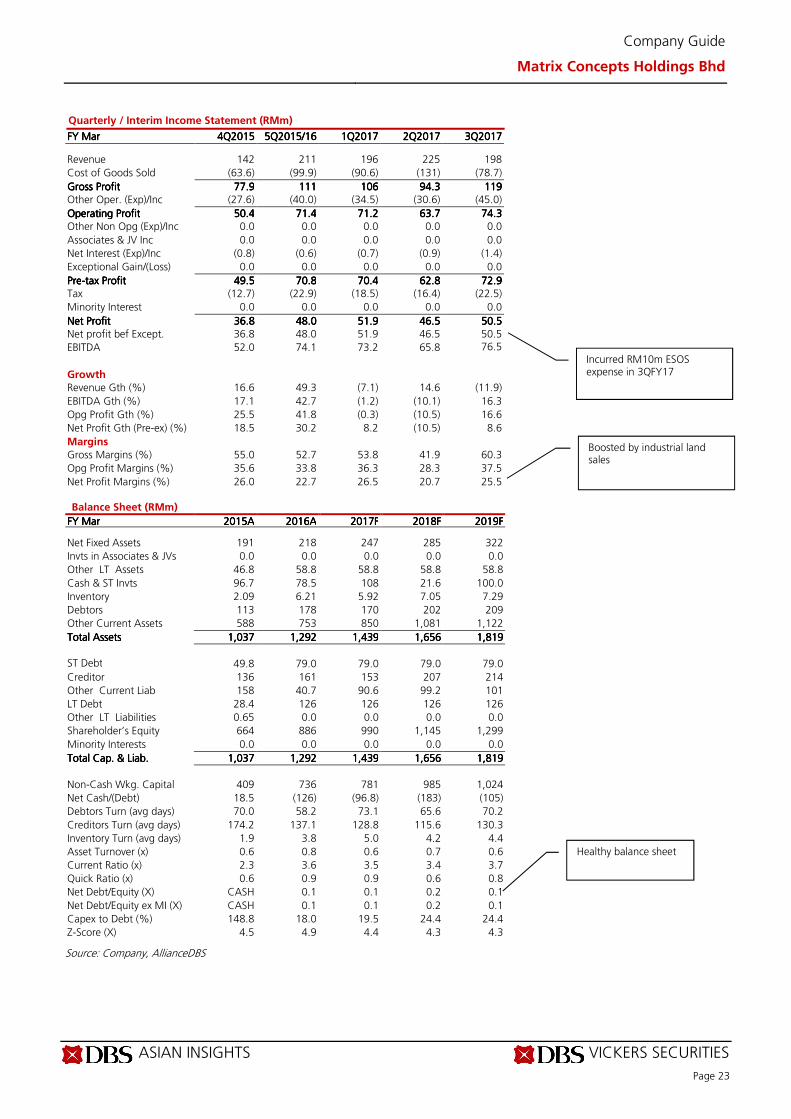
ASIAN INSIGHTS VICKERS SECURITIES
Page 23
Company Guide
Matrix Concepts Holdings Bhd
Quarterly / Interim Income Statement (RMm)
FY FY FY FY MarMarMarMar 4Q4Q4Q4Q2015201520152015 5Q2015/165Q2015/165Q2015/165Q2015/16 1Q20171Q20171Q20171Q2017 2Q20172Q20172Q20172Q2017 3Q20173Q20173Q20173Q2017 Revenue 142 211 196 225 198
Cost of Goods Sold (63.6) (99.9) (90.6) (131) (78.7)
Gross ProfitGross ProfitGross ProfitGross Profit 77.977.977.977.9 111111111111 106106106106 94.394.394.394.3 119119119119 Other Oper. (Exp)/Inc (27.6) (40.0) (34.5) (30.6) (45.0)
Operating ProfitOperating ProfitOperating ProfitOperating Profit 50.450.450.450.4 71.471.471.471.4 71.271.271.271.2 63.763.763.763.7 74.374.374.374.3 Other Non Opg (Exp)/Inc 0.0 0.0 0.0 0.0 0.0
Associates & JV Inc 0.0 0.0 0.0 0.0 0.0
Net Interest (Exp)/Inc (0.8) (0.6) (0.7) (0.9) (1.4)
Exceptional Gain/(Loss) 0.0 0.0 0.0 0.0 0.0
PrePrePrePre----tax Profittax Profittax Profittax Profit 49.549.549.549.5 70.870.870.870.8 70.470.470.470.4 62.862.862.862.8 72.972.972.972.9 Tax (12.7) (22.9) (18.5) (16.4) (22.5)
Minority Interest 0.0 0.0 0.0 0.0 0.0
Net ProfitNet ProfitNet ProfitNet Profit 36.836.836.836.8 48.048.048.048.0 51.951.951.951.9 46.546.546.546.5 50.550.550.550.5 Net profit bef Except. 36.8 48.0 51.9 46.5 50.5
EBITDA 52.0 74.1 73.2 65.8 76.5
Growth
Revenue Gth (%) 16.6 49.3 (7.1) 14.6 (11.9)
EBITDA Gth (%) 17.1 42.7 (1.2) (10.1) 16.3
Opg Profit Gth (%) 25.5 41.8 (0.3) (10.5) 16.6
Net Profit Gth (Pre-ex) (%) 18.5 30.2 8.2 (10.5) 8.6
Margins
Gross Margins (%) 55.0 52.7 53.8 41.9 60.3
Opg Profit Margins (%) 35.6 33.8 36.3 28.3 37.5
Net Profit Margins (%) 26.0 22.7 26.5 20.7 25.5 Balance Sheet (RMm)
FY FY FY FY MarMarMarMar 2015201520152015AAAA 2016201620162016AAAA 2017201720172017FFFF 2018201820182018FFFF 2019201920192019FFFF Net Fixed Assets 191 218 247 285 322
Invts in Associates & JVs 0.0 0.0 0.0 0.0 0.0
Other LT Assets 46.8 58.8 58.8 58.8 58.8
Cash & ST Invts 96.7 78.5 108 21.6 100.0
Inventory 2.09 6.21 5.92 7.05 7.29
Debtors 113 178 170 202 209
Other Current Assets 588 753 850 1,081 1,122
Total AssetsTotal AssetsTotal AssetsTotal Assets 1,0371,0371,0371,037 1,2921,2921,2921,292 1,4391,4391,4391,439 1,6561,6561,6561,656 1,8191,8191,8191,819
ST Debt
49.8 79.0 79.0 79.0 79.0
Creditor 136 161 153 207 214
Other Current Liab 158 40.7 90.6 99.2 101
LT Debt 28.4 126 126 126 126
Other LT Liabilities 0.65 0.0 0.0 0.0 0.0
Shareholder’s Equity 664 886 990 1,145 1,299
Minority Interests 0.0 0.0 0.0 0.0 0.0
Total Cap. & Liab.Total Cap. & Liab.Total Cap. & Liab.Total Cap. & Liab. 1,0371,0371,0371,037 1,2921,2921,2921,292 1,4391,4391,4391,439 1,6561,6561,6561,656 1,8191,8191,8191,819
Non-Cash Wkg. Capital 409 736 781 985 1,024
Net Cash/(Debt) 18.5 (126) (96.8) (183) (105)
Debtors Turn (avg days) 70.0 58.2 73.1 65.6 70.2
Creditors Turn (avg days) 174.2 137.1 128.8 115.6 130.3
Inventory Turn (avg days) 1.9 3.8 5.0 4.2 4.4
Asset Turnover (x) 0.6 0.8 0.6 0.7 0.6
Current Ratio (x) 2.3 3.6 3.5 3.4 3.7
Quick Ratio (x) 0.6 0.9 0.9 0.6 0.8
Net Debt/Equity (X) CASH 0.1 0.1 0.2 0.1
Net Debt/Equity ex MI (X) CASH 0.1 0.1 0.2 0.1
Capex to Debt (%) 148.8 18.0 19.5 24.4 24.4
Z-Score (X) 4.5 4.9 4.4 4.3 4.3
Source: Company, AllianceDBS
Incurred RM10m ESOS expense in 3QFY17
Boosted by industrial land sales
Healthy balance sheet
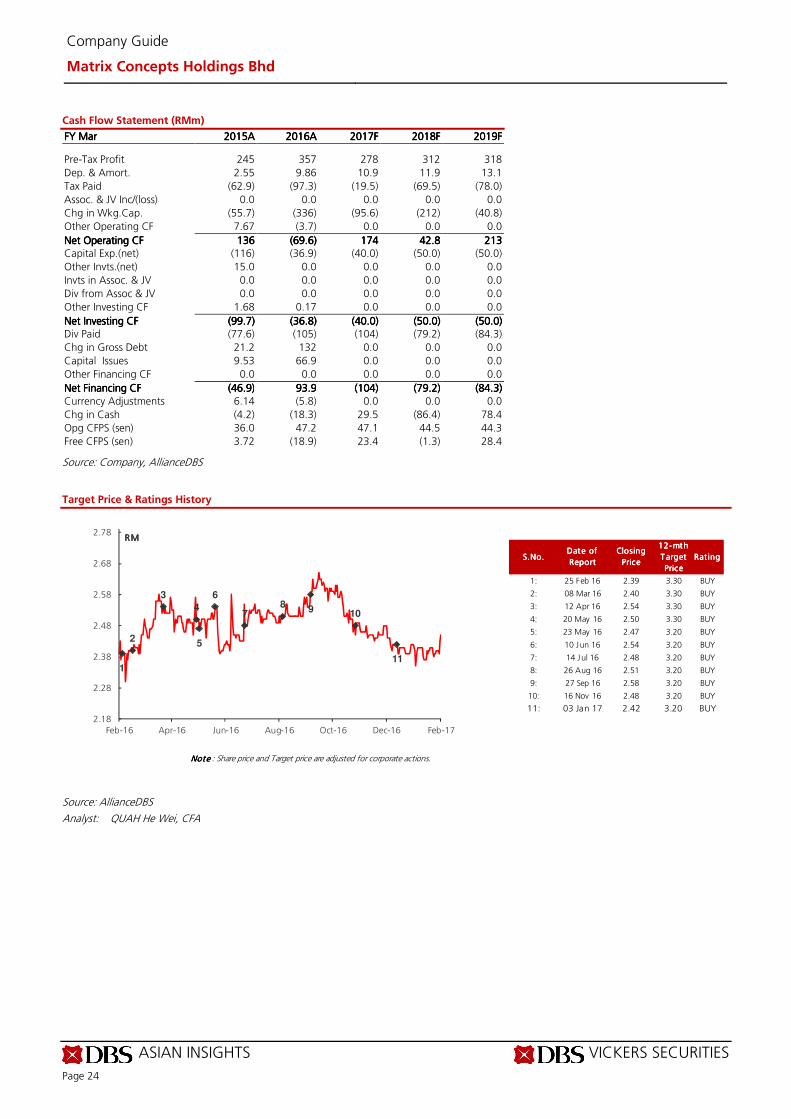
ASIAN INSIGHTS VICKERS SECURITIES
Page 24
Company Guide
Matrix Concepts Holdings Bhd
Cash Flow Statement (RMm)
FY FY FY FY MarMarMarMar 2015201520152015AAAA 2016201620162016AAAA 2017201720172017FFFF 2018201820182018FFFF 2019201920192019FFFF Pre-Tax Profit 245 357 278 312 318
Dep. & Amort. 2.55 9.86 10.9 11.9 13.1
Tax Paid (62.9) (97.3) (19.5) (69.5) (78.0)
Assoc. & JV Inc/(loss) 0.0 0.0 0.0 0.0 0.0
Chg in Wkg.Cap. (55.7) (336) (95.6) (212) (40.8)
Other Operating CF 7.67 (3.7) 0.0 0.0 0.0
Net Operating CFNet Operating CFNet Operating CFNet Operating CF 136136136136 (69.6)(69.6)(69.6)(69.6) 174174174174 42.842.842.842.8 213213213213 Capital Exp.(net) (116) (36.9) (40.0) (50.0) (50.0)
Other Invts.(net) 15.0 0.0 0.0 0.0 0.0
Invts in Assoc. & JV 0.0 0.0 0.0 0.0 0.0
Div from Assoc & JV 0.0 0.0 0.0 0.0 0.0
Other Investing CF 1.68 0.17 0.0 0.0 0.0
Net Investing CFNet Investing CFNet Investing CFNet Investing CF (99.7)(99.7)(99.7)(99.7) (36.8)(36.8)(36.8)(36.8) (40.0)(40.0)(40.0)(40.0) (50.0)(50.0)(50.0)(50.0) (50.0)(50.0)(50.0)(50.0) Div Paid (77.6) (105) (104) (79.2) (84.3)
Chg in Gross Debt 21.2 132 0.0 0.0 0.0
Capital Issues 9.53 66.9 0.0 0.0 0.0
Other Financing CF 0.0 0.0 0.0 0.0 0.0
Net Financing CFNet Financing CFNet Financing CFNet Financing CF (46.9)(46.9)(46.9)(46.9) 93.993.993.993.9 (104)(104)(104)(104) (79.2)(79.2)(79.2)(79.2) (84.3)(84.3)(84.3)(84.3)
Currency Adjustments 6.14 (5.8) 0.0 0.0 0.0
Chg in Cash (4.2) (18.3) 29.5 (86.4) 78.4
Opg CFPS (sen) 36.0 47.2 47.1 44.5 44.3
Free CFPS (sen) 3.72 (18.9) 23.4 (1.3) 28.4
Source: Company, AllianceDBS
Target Price & Ratings History
Source: AllianceDBS
Analyst: QUAH He Wei, CFA
S.No.S.No.S.No.S.No.Date of Date of Date of Date of
ReportReportReportReport
Closing Closing Closing Closing
PricePricePricePrice
12-mth 12-mth 12-mth 12-mth
T arget T arget T arget T arget
PricePricePricePrice
Rat ing Rat ing Rat ing Rat ing
1: 25 Feb 16 2.39 3.30 BUY
2: 08 Mar 16 2.40 3.30 BUY
3: 12 Apr 16 2.54 3.30 BUY
4: 20 May 16 2.50 3.30 BUY
5: 23 May 16 2.47 3.20 BUY
6: 10 Jun 16 2.54 3.20 BUY
7: 14 Jul 16 2.48 3.20 BUY
8: 26 Aug 16 2.51 3.20 BUY
9: 27 Sep 16 2.58 3.20 BUY
10: 16 Nov 16 2.48 3.20 BUY
11: 03 Jan 17 2.42 3.20 BUY
Note Note Note Note : Share price and Target price are adjusted for corporate actions.
1
2
3
4
5
6
78 9 10
11
2.18
2.28
2.38
2.48
2.58
2.68
2.78
Feb-16 Apr-16 Jun-16 Aug-16 Oct-16 Dec-16 Feb-17
RMRMRMRM
Industry Focus
Page 25
AllianceDBS recommendations are based an Absolute Total Return* Rating system, defined as follows:
STRONG BUYSTRONG BUYSTRONG BUYSTRONG BUY (>20% total return over the next 3 months, with identifiable share price catalysts within this time frame)
BUY BUY BUY BUY (>15% total return over the next 12 months for small caps, >10% for large caps)
HOLDHOLDHOLDHOLD (-10% to +15% total return over the next 12 months for small caps, -10% to +10% for large caps)
FULLY VALUEDFULLY VALUEDFULLY VALUEDFULLY VALUED (negative total return i.e. > -10% over the next 12 months)
SELL SELL SELL SELL (negative total return of > -20% over the next 3 months, with identifiable catalysts within this time frame)
Share price appreciation + dividends
Completed Date: 9 Mar 2017 08:01:16 (MYT) Dissemination Date: 9 Mar 2017 08:25:49 (MYT)
GENERAL DISCLOSURE/DISCLAIMER GENERAL DISCLOSURE/DISCLAIMER GENERAL DISCLOSURE/DISCLAIMER GENERAL DISCLOSURE/DISCLAIMER
This report is prepared by AllianceDBS Research Sdn Bhd (“AllianceDBS”). This report is prepared by AllianceDBS Research Sdn Bhd (“AllianceDBS”). This report is prepared by AllianceDBS Research Sdn Bhd (“AllianceDBS”). This report is prepared by AllianceDBS Research Sdn Bhd (“AllianceDBS”). This report is solely intended for the clients of DBS Bank Ltd, its
respective connected and associated corporations and affiliates only and no part of this document may be (i) copied, photocopied or duplicated in
any form or by any means or (ii) redistributed without the prior written consent of AllianceDBS Research Sdn Bhd (“AllianceDBS”).
The research set out in this report is based on information obtained from sources believed to be reliable, but we (which collectively refers to DBS
Bank Ltd, its respective connected and associated corporations, affiliates and their respective directors, officers, employees and agents (collectively,
the “DBS Group”) have not conducted due diligence on any of the companies, verified any information or sources or taken into account any other
factors which we may consider to be relevant or appropriate in preparing the research. Accordingly, we do not make any representation or
warranty as to the accuracy, completeness or correctness of the research set out in this report. Opinions expressed are subject to change without
notice. This research is prepared for general circulation. Any recommendation contained in this document does not have regard to the specific
investment objectives, financial situation and the particular needs of any specific addressee. This document is for the information of addressees
only and is not to be taken in substitution for the exercise of judgement by addressees, who should obtain separate independent legal or financial
advice. The DBS Group accepts no liability whatsoever for any direct, indirect and/or consequential loss (including any claims for loss of profit)
arising from any use of and/or reliance upon this document and/or further communication given in relation to this document. This document is not
to be construed as an offer or a solicitation of an offer to buy or sell any securities. The DBS Group, along with its affiliates and/or persons
associated with any of them may from time to time have interests in the securities mentioned in this document. The DBS Group, may have
positions in, and may effect transactions in securities mentioned herein and may also perform or seek to perform broking, investment banking and
other banking services for these companies.
Any valuations, opinions, estimates, forecasts, ratings or risk assessments herein constitutes a judgment as of the date of this report, and there can
be no assurance that future results or events will be consistent with any such valuations, opinions, estimates, forecasts, ratings or risk assessments.
The information in this document is subject to change without notice, its accuracy is not guaranteed, it may be incomplete or condensed, it may
not contain all material information concerning the company (or companies) referred to in this report and the DBS Group is under no obligation to
update the information in this report.
This publication has not been reviewed or authorized by any regulatory authority in Singapore, Hong Kong or elsewhere. There is no planned
schedule or frequency for updating research publication relating to any issuer.
The valuations, opinions, estimates, forecasts, ratings or risk assessments described in this report were based upon a number of estimates and
assumptions and are inherently subject to significant uncertainties and contingencies. It can be expected that one or more of the estimates on
which the valuations, opinions, estimates, forecasts, ratings or risk assessments were based will not materialize or will vary significantly from actual
results. Therefore, the inclusion of the valuations, opinions, estimates, forecasts, ratings or risk assessments described herein IS NOT TO BE RELIED
UPON as a representation and/or warranty by the DBS Group (and/or any persons associated with the aforesaid entities), that:
(a) such valuations, opinions, estimates, forecasts, ratings or risk assessments or their underlying assumptions will be achieved, and
(b) there is any assurance that future results or events will be consistent with any such valuations, opinions, estimates, forecasts, ratings or risk
assessments stated therein.
Please contact the primary analyst for valuation methodologies and assumptions associated with the covered companies or price targets.
Any assumptions made in this report that refers to commodities, are for the purposes of making forecasts for the company (or companies)
mentioned herein. They are not to be construed as recommendations to trade in the physical commodity or in the futures contract relating to the
commodity referred to in this report.
Industry Focus
Page 26
DBSVUSA, a US-registered broker-dealer, does not have its own investment banking or research department, has not participated in any public
offering of securities as a manager or co-manager or in any other investment banking transaction in the past twelve months and does not engage
in market-making.
ANALYST CERTIFICATIONANALYST CERTIFICATIONANALYST CERTIFICATIONANALYST CERTIFICATION
The research analyst(s) primarily responsible for the content of this research report, in part or in whole, certifies that the views about the
companies and their securities expressed in this report accurately reflect his/her personal views. The analyst(s) also certifies that no part of his/her
compensation was, is, or will be, directly or indirectly, related to specific recommendations or views expressed in the report. The research analyst (s)
primarily responsible for the content of this research report, in part or in whole, certifies that he or his associate1 does not serve as an officer of the
issuer or the new listing applicant (which includes in the case of a real estate investment trust, an officer of the management company of the real
estate investment trust; and in the case of any other entity, an officer or its equivalent counterparty of the entity who is responsible for the
management of the issuer or the new listing applicant) and the research analyst(s) primarily responsible for the content of this research report or
his associate does not have financial interests2 in relation to an issuer or a new listing applicant that the analyst reviews. DBS Group has
procedures in place to eliminate, avoid and manage any potential conflicts of interests that may arise in connection with the production of
research reports. The research analyst(s) responsible for this report operates as part of a separate and independent team to the investment
banking function of the DBS Group and procedures are in place to ensure that confidential information held by either the research or investment
banking function is handled appropriately. There is no direct link of DBS Group's compensation to any specific investment banking function of the
DBS Group.
COMPANYCOMPANYCOMPANYCOMPANY----SPECIFIC / REGULATORY DISCLOSURES SPECIFIC / REGULATORY DISCLOSURES SPECIFIC / REGULATORY DISCLOSURES SPECIFIC / REGULATORY DISCLOSURES
1. DBS Bank Ltd, DBS Vickers Securities (Singapore) Pte Ltd (''DBSVS''), their subsidiaries and/or other affiliates do not have a proprietary
position in the securities recommended in this report as of 31 Jan 2017.
2. Neither DBS Bank Ltd, DBS HK nor DBSV HK market makes in equity securities of the issuer(s) or company(ies) mentioned in this Research
Report.
Compensation for investment banking services: Compensation for investment banking services: Compensation for investment banking services: Compensation for investment banking services:
3. DBSVUSA does not have its own investment banking or research department, nor has it participated in any public offering of securities as a
manager or co-manager or in any other investment banking transaction in the past twelve months. Any US persons wishing to obtain further
information, including any clarification on disclosures in this disclaimer, or to effect a transaction in any security discussed in this document
should contact DBSVUSA exclusively.
Disclosure of previous investment recommendation produced:Disclosure of previous investment recommendation produced:Disclosure of previous investment recommendation produced:Disclosure of previous investment recommendation produced:
4. DBS Bank Ltd, DBS Vickers Securities (Singapore) Pte Ltd (''DBSVS''), their subsidiaries and/or other affiliates may have published other
investment recommendations in respect of the same securities / instruments recommended in this research report during the preceding 12
months. Please contact the primary analyst listed in the first page of this report to view previous investment recommendations published by
DBS Bank Ltd, DBS Vickers Securities (Singapore) Pte Ltd (''DBSVS''), their subsidiaries and/or other affiliates in the preceding 12 months.
1 An associate is defined as (i) the spouse, or any minor child (natural or adopted) or minor step-child, of the analyst; (ii) the trustee of a trust of which the analyst, his spouse, minor child (natural or adopted) or minor step-child, is a beneficiary or discretionary object; or (iii) another person accustomed or obliged to act in accordance with the directions or instructions of the analyst.
2 Financial interest is defined as interests that are commonly known financial interest, such as investment in the securities in respect of an issuer or a new listing applicant, or financial accommodation arrangement between the issuer or the new listing applicant and the firm or analysis. This term does not include commercial lending conducted at arm's length, or investments in any collective investment scheme other than an issuer or new listing applicant notwithstanding the fact that the scheme has investments in securities in respect of an issuer or a new listing applicant.
Industry Focus
Page 27
RESTRICTIONS ON DISTRIBUTION RESTRICTIONS ON DISTRIBUTION RESTRICTIONS ON DISTRIBUTION RESTRICTIONS ON DISTRIBUTION
GeneralGeneralGeneralGeneral This report is not directed to, or intended for distribution to or use by, any person or entity who is a citizen or resident of or located in any locality, state, country or other jurisdiction where such distribution, publication, availability or use would be contrary to law or regulation.
AustraliaAustraliaAustraliaAustralia This report is being distributed in Australia by DBS Bank Ltd. (“DBS”) or DBS Vickers Securities (Singapore) Pte Ltd (“DBSVS”), both of which are exempted from the requirement to hold an Australian Financial Services Licence under the Corporation Act 2001 (“CA”) in respect of financial services provided to the recipients. Both DBS and DBSVS are regulated by the Monetary Authority of Singapore under the laws of Singapore, which differ from Australian laws. Distribution of this report is intended only for “wholesale investors” within the meaning of the CA.
Hong KongHong KongHong KongHong Kong This report has been prepared by an entity(ies) which is not licensed by the Hong Kong Securities and Futures Commission to carry on the regulated activity of advising on securities pursuant to the Securities and Futures Ordinance (Chapter 571 of the Laws of Hong Kong). This report is being distributed in Hong Kong and is attributable to DBS Vickers Hong Kong Limited, a licensed corporation licensed by the Hong Kong Securities and Futures Commission to carry on the regulated activity of advising on securities pursuant to the Securities and Futures Ordinance (Chapter 571 of the Laws of Hong Kong).
For any query regarding the materials herein, please contact Paul Yong (CE. No. ASE988) at [email protected].
IndonesiaIndonesiaIndonesiaIndonesia This report is being distributed in Indonesia by PT DBS Vickers Sekuritas Indonesia.
MalaysiaMalaysiaMalaysiaMalaysia This report is distributed in Malaysia by AllianceDBS Research Sdn Bhd ("ADBSR"). Recipients of this report, received from ADBSR are to contact the undersigned at 603-2604 3333 in respect of any matters arising from or in connection with this report. In addition to the General Disclosure/Disclaimer found at the preceding page, recipients of this report are advised that ADBSR (the preparer of this report), its holding company Alliance Investment Bank Berhad, their respective connected and associated corporations, affiliates, their directors, officers, employees, agents and parties related or associated with any of them may have positions in, and may effect transactions in the securities mentioned herein and may also perform or seek to perform broking, investment banking/corporate advisory and other services for the subject companies. They may also have received compensation and/or seek to obtain compensation for broking, investment banking/corporate advisory and other services from the subject companies.
Wong Ming Tek, Executive Director, ADBSR
SingaporeSingaporeSingaporeSingapore This report is distributed in Singapore by DBS Bank Ltd (Company Regn. No. 196800306E) or DBSVS (Company Regn No. 198600294G), both of which are Exempt Financial Advisers as defined in the Financial Advisers Act and regulated by the Monetary Authority of Singapore. DBS Bank Ltd and/or DBSVS, may distribute reports produced by its respective foreign entities, affiliates or other foreign research houses pursuant to an arrangement under Regulation 32C of the Financial Advisers Regulations. Where the report is distributed in Singapore to a person who is not an Accredited Investor, Expert Investor or an Institutional Investor, DBS Bank Ltd accepts legal responsibility for the contents of the report to such persons only to the extent required by law. Singapore recipients should contact DBS Bank Ltd at 6327 2288 for matters arising from, or in connection with the report.
ThailandThailandThailandThailand This report is being distributed in Thailand by DBS Vickers Securities (Thailand) Co Ltd. Research reports distributed are only intended for institutional clients only and no other person may act upon it.
United KingdomUnited KingdomUnited KingdomUnited Kingdom This report is produced by DBS Bank Ltd which is regulated by the Monetary Authority of Singapore.
This report is disseminated in the United Kingdom by DBS Vickers Securities (UK) Ltd, ("DBSVUK"). DBSVUK is authorised and regulated by the Financial Conduct Authority in the United Kingdom.
In respect of the United Kingdom, this report is solely intended for the clients of DBSVUK, its respective connected and associated corporations and affiliates only and no part of this document may be (i) copied, photocopied or duplicated in any form or by any means or (ii) redistributed without the prior written consent of DBSVUK. This communication is directed at persons having professional experience in matters relating to investments. Any investment activity following from this communication will only be engaged in with such persons. Persons who do not have professional experience in matters relating to investments should not rely on this communication.
DubaiDubaiDubaiDubai
This research report is being distributed in The Dubai International Financial Centre (“DIFC”) by DBS Bank Ltd., (DIFC Branch) having its office at PO Box 506538, 3
rd Floor, Building 3, East Wing, Gate Precinct, Dubai International Financial Centre (DIFC),
Dubai, United Arab Emirates. DBS Bank Ltd., (DIFC Branch) is regulated by The Dubai Financial Services Authority. This research report is intended only for professional clients (as defined in the DFSA rulebook) and no other person may act upon it.
United StatesUnited StatesUnited StatesUnited States This report was prepared by DBS Bank Limited. DBSVUSA did not participate in its preparation. The research analyst(s) named on this report are not registered as research analysts with FINRA and are not associated persons of DBSVUSA. The research analyst(s) are not subject to FINRA Rule 2241 restrictions on analyst compensation, communications with a subject company, public appearances and trading securities held by a research analyst. This report is being distributed in the United States by DBSVUSA, which accepts responsibility for its contents. This report may only be distributed to Major U.S. Institutional Investors (as defined in SEC Rule 15a-6) and to such other institutional investors and qualified persons as

Industry Focus
Page 28
DBSVUSA may authorize. Any U.S. person receiving this report who wishes to effect transactions in any securities referred to herein should contact DBSVUSA directly and not its affiliate.
Other jurisdictionsOther jurisdictionsOther jurisdictionsOther jurisdictions In any other jurisdictions, except if otherwise restricted by laws or regulations, this report is intended only for qualified, professional, institutional or sophisticated investors as defined in the laws and regulations of such jurisdictions.
AllianceDBS AllianceDBS AllianceDBS AllianceDBS Research Sdn Bhd (''AllianceDBS'')Research Sdn Bhd (''AllianceDBS'')Research Sdn Bhd (''AllianceDBS'')Research Sdn Bhd (''AllianceDBS'')
(128540 U) 19th Floor, Menara Multi-Purpose, Capital Square,
8 Jalan Munshi Abdullah 50100 Kuala Lumpur, Malaysia.
Tel.: +603 2604 3333 Fax: +603 2604 3921 email : [email protected]