Embed Size (px)
Citation preview
MALAYSIA ECONOMIC MONITOR
JUNE 2020
Surviving the Storm

CONNECT WITH US
wbg.org/Malaysia
@WorldBankMalaysia
@WB_AsiaPacific
http://bit.ly/WB_blogsMY

MALAYSIA ECONOMIC MONITOR

© 2020 International Bank for Reconstruction and Development / The World BankSasana Kijang, 2 Jalan Dato Onn, Kuala Lumpur 50480, MalaysiaSome rights reserved.
This work is a product of the staff of The World Bank with external contributions. The findings, interpretations, and conclusions expressed in this work do not necessarily reflect the views of The World Bank, its Board of Executive Directors, or the governments they represent. The World Bank does not guarantee the accuracy of the data included in this work. The boundaries, colors, denominations, and other information shown on any map in this work do not imply any judgment on the part of The World Bank concerning the legal status of any territory or the endorsement or acceptance of such boundaries.
Nothing herein shall constitute or be considered to be a limitation upon or waiver of the privileges and immunities of The World Bank, all of which are specifically reserved.
Rights and Permissions
This work is available under the Creative Commons Attribution 3.0 IGO license (CC BY 3.0 IGO) http://creativecommons.org/licenses/by/3.0/igo. Under the Creative Commons Attribution license, you are free to copy, distribute, transmit, and adapt this work, including for commercial purposes, under the following conditions:
Attribution: Please cite the work as follows: World Bank (2020) “Surviving the Storm” Malaysia Economic Monitor (June), World Bank, Washington, DC.
Translations: If you create a translation of this work, please add the following disclaimer along with the attribution: This translation was not created by The World Bank and should not be considered an official World Bank translation. The World Bank shall not be liable for any content or error in this translation.
Adaptations: If you create an adaptation of this work, please add the following disclaimer along with the attribution: This is an adaptation of an original work by The World Bank. Views and opinions expressed in the adaptation are the sole responsibility of the author or authors of the adaptation and are not endorsed by The World Bank.
Third-party content: The World Bank does not necessarily own each component of the content contained within the work. The World Bank therefore does not warrant that the use of any third-party-owned individual component or part contained in the work will not infringe on the rights of those third parties. The risk of claims resulting from such infringement rests solely with you. If you wish to re-use a component of the work, it is your responsibility to determine whether permission is needed for that re-use and to obtain permission from the copyright owner. Examples of components can include, but are not limited to, tables, figures, or images.
All queries on rights and licenses should be addressed to World Bank Publications, The World Bank, 1818 H Street NW, Washington, DC 20433, USA; e-mail: [email protected].

Surviving the Storm
MALAYSIA ECONOMIC MONITOR
JUNE 2020

Acknowledgements This edition of the Malaysia Economic Monitor was prepared by Richard Record (Task Team Leader), Shakira Teh Sharifuddin, Yew Keat Chong, Mahama Samir Bandaogo, Achim Schmillen (Task Team Leader for Part 2), Amanina Abdur Rahman, Mark Dorfman and Alyssa Farha Jasmin. Samuel Fraiberger, Yan Liu, Jorge Guzman, Steven Pennings, Norman Loayza, Young Kim, Smita Kuriakose, Antoine Coste, Joshua Foong and Clarissa David provided additional contributions.
Achim Fock, Firas Raad, Ndiame Diop and Philip O’Keefe provided overall guidance. The team is grateful to Hassan Zaman, Souleymane Coulibaly, Gabriel Demombynes, Ekaterine Vashakmadze, Ergys Islamaj, Vera Kehayova Kevin Cruz, Jeevakumar Govindasamy and Frederico Gil Sander for their constructive input on the document.
This report benefited from productive discussions with staff from the Economic Planning Unit, Bank Negara Malaysia, the Ministry of Finance and many other government ministries and agencies, all of whom provided valuable information and useful feedback.
In particular, the team would like to thank the International Cooperation Division of the Economic Planning Unit and the Economics Department of Bank Negara Malaysia for close ongoing collaboration with the World Bank and for the crucial support to the launch of this report. The team would also like to express its gratitude to analysts at several private financial firms and rating institutions, whose participation in a constructive dialogue also informed the analysis.
Joshua Foong and Min Hui Lee led external communications and the production and design of the report. Irfan Kortschak provided editing assistance, while Aziaton Ahmad provided administrative support. Kane Chong designed the report and its cover.
The report is based on information current as of June 19, 2020.
Please contact Richard Record ([email protected]), Yew Keat Chong ([email protected]) or Shakira Teh Sharifuddin ([email protected]) if you have any questions, comments or suggestions regarding the Malaysia Economic Monitor.
4 MALAYSIA ECONOMIC MONITOR | JUNE 2020

AbbreviationsALMPs Active Labor Market Programs
APPERANTISApprenticeship Allowance for Children of Poor Families (Elaun Perantis)
B40 Bottom 40 percent (of the population)
BA Public Assistance (Bantuan Am)
BAPFinancial Assistance for Foster Care Children (Bantuan Anak Pelihara)
BAT/ASFinancial Assistance for Artificial Aid and Assistive Devices (Bantuan Alat Tiruan/Alat Sokongan)
BKKFinancial Assistance for Children (Bantuan Kanak-Kanak)
BNM Bank Negara Malaysia
BOTFinancial Assistance for Older Persons (Bantuan Orang Tua)
BPN National Caring Aid (Bantuan Prihatin Nasional)
BPTFinancial Assistance for Carers of Bed-Ridden, Disabled and Chronically Ill (Bantuan OKU Terlantar/Pesakit Kronik Terlantar)
BSH Cost of Living Aid (Bantuan Sara Hidup Rakyat)
BTBFinancial Assistance for Persons with Disabilities Incapable of Work (Bantuan OKU Tidak Berupaya Bekerja)
CAGR Compound Annual Growth Rate
CMCO Conditional Movement Control Order
COVID-19 Coronavirus Disease 2019
CPI Consumer Price Index
DE Development Expenditure
DFI Development Finance Institution
DOSM Department of Statistics Malaysia
DSR Debt Service Ratio
E&E Electrical and Electronics
EAP East Asia and Pacific
EIS Employment Insurance System
EMDEs Emerging Market and Developing Economies
EPCAllowance for Disabled Workers (Elaun Pekerja Cacat)
EPF Employees Provident Fund
FBM KLCI FTSE Bursa Malaysia Index
FDI Foreign Direct Investment
FLFP Female Labor Force Participation
GDP Gross Domestic Product
GFCF Gross Fixed Capital Formation
GLC Government Linked Corporation
GNI Gross National Income
GST Goods and Services Tax
GVCs Global Value Chains
HRDF Human Resource Development Fund
ILO International Labor Organization
IMF International Monetary Fund
IPI Industrial Production Index
JAWHARDepartment of Wakaf, Zakat and Haj (Jabatan Wakaf, Zakat dan Haji)
JKMDepartment of Social Welfare (Jabatan Kebajikan Masyarakat)
KWAPPublic Service Pension Fund (Kumpulan Wang Persaraan)
LCR Liquidity Coverage Ratio
LHDNInland Revenue Board (Lembaga Hasil Dalam Negeri Malaysia)
LTATArmed Forces Pension Board Fund (Lembaga Tabung Angkatan Tentera)
LTGM Long Term Growth Model
M40 Middle 40 percent (of the population)
MCO Movement Control Order
MEM Malaysia Economic Monitor
MGII Malaysia Government Investment Issues
MGS Malaysian Government Securities
MITB Malaysian Islamic Treasury Bills
MOF Ministry of Finance Malaysia
MTFF Medium-Term Fiscal Framework
MySPC Malaysia Social Protection Council
OE Operating Expenditure
OPR Overnight Policy Rate
PPP Public Private Partnership
PPTS Percentage Points
PRS Private Retirement Scheme
RMCO Recovery Movement Control Order
RPGT Real Property Gains Tax
SIRCs State Islamic Religious Councils
SOCSO Social Security Organization
SOEs State Owned Enterprises
SMEs Small and Medium Sized Enterprises
SRR Statutory Reserve Requirement
SST Sales and Services Tax
T20 Top 20 percent (of the population)
TFP Total Factor Productivity
WHO World Health Organization
Y/Y Year-on-Year
5MALAYSIA ECONOMIC MONITOR | JUNE 2020

6 MALAYSIA ECONOMIC MONITOR | JUNE 2020

AcknowledgementsAbbreviationsSummary
Recent economic developments
Economic outlook
Surviving the storm
PART ONERecent economic developments
The COVID-19 pandemic has triggered a collapse in global economic activity
Malaysia’s economy has been dramatically affected by COVID-19
Exports have continued to see negative growth
Inflation has trended downward due to a significant decline in fuel prices
The financial sector has remained resilient, despite significant outflows
The Prihatin stimulus package has helped blunt the impact of the crisis
Higher spending to cushion the pandemic’s impact coupled with declines in revenue have led to a narrowing of fiscal space
Economic outlookThe global economy is projected to experience a major contraction this year
Malaysia’s economy is expected to contract sharply in 2020
The COVID-19 pandemic has exacerbated downside risks to growth
Policies in the near term should focus on protecting the most vulnerable
Medium-term measures should prepare the economy for recovery in a ‘new normal’ environment
In the long run, focus should be geared towards laying the foundations for the transition to a high-income economy
The pandemic provides a window of opportunity for Malaysia to enhance its social protection system
PART TWOSurviving the storm
The COVID-19 pandemic and changing world of work require an enhanced social protection system
The social assistance system does not yet provide a guaranteed minimum of protection to all those in need
While BSH/BR1M coverage is very high, the program lacks an explicit objective
Core social assistance programs are progressive, but initiatives to promote productive employment are still nascent
Uncoordinated delivery approaches reduce equity and efficiency
Coverage and adequacy of long-term savings arrangements need to be improved
Duplication and fragmentation exist in Malaysia’s labor market programs
Short- and medium-term policies should support COVID-19 recovery efforts and deepen social assistance for the B40
In the long term, expenditure and revenue policies should support the development of an enhanced social protection system
References
4
5
8
9
12
14
18
20
20
21
25
30
31
35
37
40
40
41
46
48
50
53
53
56
58
58
66
73
75
78
80
84
85
90
94
Table of Contents
7MALAYSIA ECONOMIC MONITOR | JUNE 2020

Summary
In 2020, Malaysia’s economy is projected to contract by 3.1 percent. In Q1 2020, growth slowed to just 0.7 percent with efforts to flatten the curve of the pandemic through a series of movement control orders and with deep uncertainty regarding growth prospects severely constraining economic activity. A pronounced output contraction of around 10 percent in Q2 2020 is envisioned, reflecting the significant impact of the economic disruptions resulting from the MCO imposed during the quarter. This is expected to be followed by a partial recovery in the second half of the year, as the outbreak eases and mobility restrictions are gradually lifted. This forecast assumes that the spread of pandemic is broadly contained at the global level and that the massive fiscal and monetary policy support measures implemented by governments around the world limit the depth of contraction in global economic activity. With all these factors, the near-term outlook for Malaysia’s economy is unusually uncertain at present.
The COVID-19 pandemic has resulted in an unprecedented crisis that requires large-scale and unconventional policy responses by governments everywhere. With the crisis severely affecting private demand and causing supply shocks, the government is tasked with the responsibility of facilitating economic recovery in the near term.
Malaysia’s economy remains resilient and rests on strong fundamentals. Its diversified economic
structure, sound financial system, effective public health response and proactive macroeconomic policy support suggest that Malaysia will be able to ride out the storm better than many other countries.
In the near term, Malaysia’s fiscal strategy should be re-prioritized to create additional policy space. This will require efforts to re-allocate expenditures towards priority areas, identify new sources of non-tax revenue, as well as legislative amendments to temporarily increase available fiscal space.
The Prihatin stimulus package, and more recently the Penjana plan, have provided important support to households and firms affected by the crisis. However, efficiency could be improved, and the quantum of financial assistance provided may need to be increased to adequately protect the welfare of vulnerable households and to ensure the sustainability of affected firms.
Over the medium term, the government should establish policies to prepare Malaysia’s economy for a post-COVID-19 recovery in the context of ‘new normal’ conditions. While to some extent, the COVID-19 crisis has required the temporary suspension of Malaysia’s medium and long-term economic plans, it also creates an opportunity to accelerate necessary structural reforms. First, it will be necessary to rebuild fiscal buffers and to ensure
Malaysia’s economy has been severely affected by the COVID-19 pandemic
8 MALAYSIA ECONOMIC MONITOR | JUNE 2020
Summary

Recent economic developmentsThe COVID-19 crisis has triggered a global economic shock of historic magnitude, causing a synchronized collapse in economic activity across the world during H1 2020. In particular, economic conditions in East Asia and the Pacific (EAP) deteriorated sharply as the impact of pandemic-related lockdowns rippled through the region.
Malaysia’s economy has been dramatically affected by COVID-19 and the subsequent movement restrictions implemented to flatten the curve of the pandemic. The health and human toll of the crisis on Malaysia has been enormous, with more than 8,000 confirmed cases and 121 deaths recorded to date, and many more suffering from economic hardship and diminished prospects. The MCO announced in mid-March led to a sudden decline in mobility in public places and severely interrupted economic activity. It was later replaced by the Conditional Movement Control Order (CMCO) and then the Recovery Movement Control Order (RMCO) that allowed progressively greater mobility and resumption of economic activity.
In this context, Malaysia’s economy expanded at the rate of 0.7 percent in Q1 2020. This represented a sharp deceleration from the rate of 3.6 percent recorded in Q4 2019, which itself was significantly lower than in the preceding quarters of 2019.
While private consumption remained the largest contributor to economic growth in the first quarter, its growth moderated to 6.7 percent in Q1 2020, down from 8.1 percent in Q4 2019. In particular, the MCO weighed heavily on retail, travel, leisure and recreational spending and on spending on durable goods. However, solid consumption expenditure in January and February and the continued operation of online platforms and delivery services throughout the MCO period helped to support private consumption during the quarter.
Aggregate investment contracted for the fifth consecutive quarter, with declines in both private and public investment. Gross fixed capital formation shrank by -4.6 percent in Q1 2020 (Q4 2019: -0.7 percent). Over the quarter, private investment was deeply affected by uncertainty related to the pandemic and the change in government. Over the same period, public investment registered its tenth consecutive quarter of negative growth.
spending efficiency; second, to re-invigorate foreign and domestic private investment; third, to upskill and redeploy human capital; and fourth, to accelerate the digitalization agenda.
The Malaysia Economic Monitor (MEM) consists of two parts. Part 1 presents a review of recent economic developments and a macroeconomic outlook. Part 2 focuses on a selected special topic that is key to Malaysia’s medium-term development prospects and to the achievement of shared prosperity.
In this edition, the focus of the special topic is on Malaysia’s social protection system and how it can be improved and leveraged to better address the needs of the Malaysian population within a rapidly changing economic context. This altering economic environment flows from the shock of the global COVID-19 pandemic and the changing world of work induced by growing digitalization and automation.
With Malaysia set to achieve high-income country status and with its new emphasis on ensuring shared prosperity, it will need to ensure that its social protection framework is fit-for-purpose. At present, the thin provision of social assistance provides very limited support to enable the population to absorb shocks. To establish an adequate social insurance system, Malaysia needs both to improve the adequacy of financial protection for those already contributing to existing systems and to expand coverage to reach almost 40 percent of the labor force outside the current net.
The need for these measures will become even more acute as disruptive technologies and evolving demographics change the nature of work. The special topic in this MEM presents an analysis of issues related to the framework for social protection, with a series of policy recommendations to enable Malaysia to address the ongoing impacts of the COVID-19 crisis and other challenges into the future.
The crisis has demonstrated the importance of having an enhanced social protection system that provides minimum protection to all those in need
9MALAYSIA ECONOMIC MONITOR | JUNE 2020
Summary

Exports of goods and services shrank for the third consecutive quarter in Q1 2020 due to weak external demand and heightened uncertainty. Exports of goods and services declined by -7.1 percent in Q1 2020 (Q4 2020: -3.4 percent), the largest decline since the 2009 Global Financial Crisis. Over the same period, imports shrank by -2.5 percent (Q4 2019: -2.4 percent) due to a fall in capital goods imports, especially machines and transport equipment. The current account surplus narrowed to 2.9 percent of GDP (Q4 2019: 3.4 percent), based on four-quarter rolling averages.
growth (2.1 percent) helped to keep unemployment stable at 3.3 percent in January and February. However, a decrease in tourism-related activities and the enactment of the MCO resulted in employment growth decelerating to 1.6 percent over the quarter. In March, unemployment was estimated to stand at 3.9 percent, and in April it rose to 5 percent, its highest rate since monthly data has been available.
Bank Negara Malaysia (BNM) lowered the Overnight Policy Rate (OPR) from 3 to 2 percent in the period from January to May. In addition to lowering the OPR, BNM boosted liquidity in the financial system by lowering the Statutory Reserve Requirement (SRR) from 3 to 2 percent and by allowing financial institutions to use their holding of Malaysian government bonds to comply with the SRR.
The financial sector remained resilient in Q1 2020. The banking sector’s overall return on equity stood at 11.1 percent in Q1 2020 (Q4 2019: 13 percent), while return on assets was estimated at 1.3 percent (Q4 2019: 1.5 percent). Financial institutions’ capital and liquidity ratios remained well above the minimum statutory requirements.
Heightened uncertainty caused a decline in performance in the domestic financial market. Increased investors’ demand for safe assets has led to substantial non-resident outflows from domestic equity and bond markets in February and March, with the ringgit depreciating against the US dollar in line with most regional currencies.
Responding to the impact of the MCO on vulnerable households and businesses, the government unveiled two rounds of the Prihatin Rakyat Economic Stimulus Package in Q1 2020. The package was designed with the aim of addressing three broad objectives: (1) to protect Malaysian households, including through one-off cash assistance programs; (2) to support businesses, including through a wage subsidy program for employees; and (3) to ensure that the structure of the economy remains in place, through measures to preserve jobs and support domestic investment activities with strong multiplier effects. More recently, the government has announced the Penjana short-term economic recovery plan, which outlined measures to help stimulate the economy. The Penjana plan focuses on three key thrusts, which is to empower people, to empower businesses and to stimulate the economy.
Higher government spending to cushion the pandemic’s impact coupled with declines in revenue have led to a narrowing of fiscal space. While the
On the supply side, manufacturing and services were the main drivers of growth in Q1 2020, with agriculture, construction and mining all contracting. The decline in growth of services can be attributed to the direct impact of the pandemic on tourism and travel, which in turn weighed on retail, food services and accommodation. Meanwhile, other services that could be delivered through internet-based platforms and that were thus better able to weather the impact of movement restrictions, recorded increased activity. The manufacturing sector was impacted first by disrupted international supply chains and then by the MCO-related restrictions, which severely reduced operational capacity. In the mining sector, ongoing maintenance led to contraction in the production of oil and gas. In agriculture, weather conditions were not favorable to palm oil production, leading to a decline in production. Of all the sectors, the construction sector contracted the most (-7.9 percent), with the MCO leading to the closure of all constructions sites.
Headline inflation stood at just 0.9 percent in Q1 2020 (Q4 2019: 1 percent), with this low rate mostly due to falling fuel prices. While the inflation rate was positive in January and February, at 1.6 percent and 1.3 percent respectively, the decline in fuel prices resulting from a significant decrease in global oil prices caused inflation to turn negative in March (-0.2 percent) and April (-2.9 percent).
Labor market conditions deteriorated over the course of the first quarter. Strong employment
Exports of goods and services recorded its largest decline since the 2009 Global Financial Crisis
10 MALAYSIA ECONOMIC MONITOR | JUNE 2020
Summary

1 Excluding the one-off Petronas special dividend of RM30 billion.
cost of the overall Prihatin Rakyat package amounts to a total of RM260 billion, or 17 percent of GDP, the direct fiscal injection is fairly modest, amounting to RM35 billion (or 2.3 percent of GDP), with the bulk of the expenditure on the one-off Bantuan Prihatin Nasional (BPN) cash assistance program. Meanwhile, the Penjana plan increases the government expenditure by another RM10 billion, of which the bulk is allocated for the extension of the wage subsidy program and upskilling and re-skilling programs. The heavy reliance on non-fiscal mechanisms to finance the bulk of both the Prihatin package and Penjana plan reflects the limited fiscal space available to government at the outset of the COVID-19 crisis.
Falling global oil prices have placed additional downward pressure on already declining federal government revenues. Global commodity prices have
declined sharply, with crude oil prices expected to average at US$32 per barrel in 2020, half the US$62 per barrel assumed by the government in its budget.
With projected increases to expenditure and downward pressures on revenue, the fiscal deficit is expected to widen in 2020, with a consequent erosion to fiscal policy space. Malaysia entered the crisis with a relatively elevated level of federal government debt (2019: 52.5 percent of GDP) and a low level of revenue (2019:15.4 percent of GDP1). World Bank estimates suggest that the fiscal deficit could widen to as high as 7 percent of GDP if measures to reduce non-core spending or to secure additional non-tax revenue are not adopted. The government’s options to finance any additional fiscal measures are constrained by statutory limits, which can only be amended through a parliamentary sitting.
11MALAYSIA ECONOMIC MONITOR | JUNE 2020
Summary

With the outcome of the pandemic remaining uncertain, there is a risk that it will lead to an increase in the number of vulnerable households. While necessary to curb the virus outbreak, the implementation of the MCO has weighed heavily on domestic demand, jeopardizing the sustainability of many businesses and leading to higher unemployment.
Particularly with existing statutory limits, any further narrowing of fiscal policy space could constrain the government’s ability to provide adequate economic support, especially in the near term. The marked reduction in fiscal space presents a potential risk should the economic impact of the initial MCO be greater than anticipated, thus requiring additional fiscal injections, particularly to provide support to vulnerable households and businesses. These risks would be amplified by the occurrence of a second wave of the pandemic that could require the re-imposition of the MCO.
Economic outlookWorld Bank projections suggest that the global recession in 2020 will be the deepest in eight decades, despite the unprecedented policy response. Growth in the EAP region is expected to slow sharply in 2020 to its lowest rate since 1967.
Malaysia’s GDP is projected to decline by 3.1 percent this year (2019: 4.3 percent), mainly reflecting a sharp slowdown in economic activity in H1 2020. The near-term outlook for Malaysia’s economy is unusually uncertain at present. The baseline projection envisions a pronounced output contraction of around 10 percent in Q2 2020, reflecting the significant impact of economic disruptions from the MCO imposed during the quarter, followed by a partial recovery in the second half of the year as the outbreak eases and mobility restrictions are gradually lifted. It also assumes that the spread of pandemic is broadly contained at the global level, and the sizable fiscal and monetary policy support measures implemented by major economies limit potential structural damage to global economic activity.
While household expenditure and business investment spending are expected to improve gradually, they are likely to remain subdued throughout the year due to the high levels of uncertainty. Private consumption and aggregate investment growth are projected to fall to 1.2 and -4.9 percent respectively in 2020 (2019: 7.6 and -2.1 percent). Despite large-scale support through the Prihatin Rakyat and Penjana stimulus packages, private sector activity is likely to recover modestly as restrictions on social interactions are gradually scaled back, and will remain below its pre-crisis level over the foreseeable future.
The recovery of the external sector is likely to be relatively slow, consistent with the projected path of recovery in global trade. This year, Malaysia’s exports and imports are projected to contract sharply, by 12.9 and 9.2 percent respectively (2019: -1.1 and -2.3 percent) in the context of the dramatic collapse in global trade activity. A gradual recovery in Malaysia’s external sector is expected to begin in H2 2020 as the impact of the pandemic fades, and gain momentum next year as global trade activity begins to normalize.
Consumer price inflation will likely be muted over the near term due to the marked decline in global oil prices and overall demand since March. Inflation is expected to be close to 0 percent on average this
year (2019: 0.7 percent), primarily reflecting the steep fall in oil prices and the broad-based weaknesses in demand.
On the external front, the global pandemic has amplified existing downside risks. A further weakening of global growth would pose downside risks to Malaysia’s external demand. Furthermore, with ongoing uncertainty and increased risk aversion, this could lead to heightened volatility in the domestic financial markets and to higher portfolio outflows.
12 MALAYSIA ECONOMIC MONITOR | JUNE 2020
Summary

The collapse of the Pakatan Harapan government in February 2020 and its replacement with a new coalition, known as Perikatan Nasional, has also contributed to uncertainty surrounding Malaysia’s economic policy. In the near term, this includes the ability to table the necessary legislative amendments and emergency bills in parliament, and subsequently to gain sufficient support from the Dewan Rakyat (lower house) to pass them.
On the upside, the containment of the spread of COVID-19 and the various government support measures could be more effective than anticipated. This would lead to higher pent-up consumer demand, greater investor confidence, and consequently a more robust recovery in domestic economic activity in H2 2020. A breakthrough in the development of effective treatments and vaccines against the new disease is also possible, which would bring an earlier-than-expected end to the global pandemic and contribute to a more sustained resumption in global economic activity, with considerable positive spillovers to Malaysia’s economy.
The COVID-19 pandemic is an unprecedented situation that requires the government to implement large-scale and unconventional policy responses. While the outcome of the pandemic remains uncertain, and until more effective means to manage it emerge, the economy can be expected to operate under a set of new norms, characterized by social distancing, temporary movement restrictions to contain local outbreaks, and limited international travel. With the crisis severely affecting both private demand and supply, it falls upon the government to do most of the heavy lifting to support the economy in the near term.
The quantum of the financial assistance in the Prihatin package and Penjana plan may need to be increased. While the measures included in the Prihatin package could help lessen the near-term disruptions on vulnerable households and businesses, the package implicitly assumes that the crisis will pass within a few months. Given that it could take at least another 1-2 years for the economy to return to pre-COVID-19 conditions, additional financial assistance may be needed to protect the welfare of vulnerable households and to ensure the sustainability of SMEs.
In the near term, fiscal strategy should be re-prioritized to create additional policy space through legislative amendments. This would entail placing fiscal consolidation efforts temporarily on hold and increasing the government’s fiscal space to enable it to better manage larger-than-expected impacts from the pandemic. Without legislative changes, the
government’s immediate options are limited to either reallocating some expenditure items or increasing its reliance on government linked corporations (GLCs) such as Petronas. However, these options may not provide sufficient resources to adequately respond to the crisis if a deeper stimulus is required. Thus, the government could also consider pursuing legislative amendments to existing laws through an emergency bill, as other countries have done.
Over the medium term, policies should aim to prepare the economy for post-COVID-19 recovery, in the context of a “new normal” environment. While the COVID-19 crisis has to some extent resulted in the temporary suspension of measures mandated by Malaysia’s medium and long-term economic plans, it also presents opportunities to accelerate a number of structural reforms. Looking ahead, policies in the medium term should have four broad areas of focus. They should facilitate the intensive rebuilding of fiscal buffers and ensure spending efficiency; the re-invigoration of foreign and domestic private investment; the upskilling and redeployment of human capital; and the promotion of the digitalization agenda. The reform agenda on strengthening institutions, governance, and the capacity of the administration remains an important complement to these efforts and should be maintained.
Finally, the COVID-19 crisis has emphasized the importance of having an enhanced social protection system that provides minimum protection to all those in need. Enhancing Malaysia’s existing social protection system will entail the implementation of both short- and long-term policies. In the near term, the focus would necessarily be on support to the COVID-19 recovery efforts through continued cash transfers to the B40. There are also short- and medium-term opportunities for deepening social assistance, improving the delivery of social protection programs, and promoting a jobs recovery. Over the long term, policies on both the revenue and the expenditure side would be needed to support the combined achievement of a guaranteed minimum of protection for all those in need and a broader and more progressive tax framework.
The crisis also presents an opportunity to accelerate a number of much needed structural reforms
13MALAYSIA ECONOMIC MONITOR | JUNE 2020
Summary

Surviving the stormThe COVID-19 pandemic and the associated economic slowdown underscore the need to better protect individuals and households in Malaysia, both during the recovery period and into the medium- and long-term future. With the impact of the COVID-19 pandemic on Malaysia, it faces a battle to defend the welfare and livelihoods of its people, especially those in the B40. The crisis is expected to accelerate major changes around the world, ushering in what has been described as a “new normal.”
To survive the storm and thrive in the “new normal”, Malaysia needs a mixture of expenditure and revenue measures, including an enhanced social protection system that provides minimum protection for all those in need. Ideally, the guaranteed minimum of protection to all those in need will be set at adequate benefit levels and regardless of specific work arrangements. In addition, the social protection system would incentivize work, be responsive to changing circumstances, and be fiscally sustainable. On the expenditure side, it would cover publicly financed social assistance programs such as cash transfers, contributory social insurance programs such as retirement savings, and active labor market programs such as skills-building initiatives. An enhanced social protection system would imply a strong role for the government and additional fiscal expenditures. Thus, it would also require policy measures on the revenue side, such as the introduction a broader and more progressive tax framework.
Structurally, Malaysia faces challenges related to the changing nature of work and its aging population. Rapid technological transformation has been changing the way people work, leading to some degree of job displacement and a growing prevalence of forms of jobs that do not involve “standard” employment relationships, such as own-account work and gig economy jobs. In addition, Malaysia’s population is aging rapidly, with the proportion of the population aged 65 and above expected to double from seven percent to 14 percent within only 24 years. This puts increasing pressure on the social protection system, particularly on components based on “standard” employment relationships.
In Malaysia, social assistance programs have only a modest impact on poverty reduction and on promoting productive employment. While the coverage of Malaysia’s non-contributory social
assistance programs is high (encompassing 76 percent of all individuals and 98 percent of those in the B20 as per the distribution of income per capita), the level of benefits is generally insufficient to achieve a reduction in the poverty gap similar to that of the average upper middle-income and high-income countries. At about 1 percent of GDP, spending on social assistance is also low by international standards. There are also few policies that link the beneficiaries of social assistance programs to efforts to build their human capital or to improve their productive inclusion in the labor market. In addition to a lack of specific support measures and incentives for participating in those measures for beneficiaries with the capacity to work, there is also a lack of coordination between social assistance, education and labor market programs.
With Malaysia’s economy operating in a “new normal” context, it is vital to improve the performance of the social protection system and to ensure that it is integrated with wider economic policy. Throughout the recovery from the COVID-19 crisis, cash transfers to the B40 will remain vitally important to provide short-term relief mitigating acute financial strains, to support medium-term recovery efforts, and to support consumption and human capital development at a time of economic downturn. Also, there is significant potential to achieve better outcomes through both the flagship Bantuan Sara Hidup (BSH) program and the core social assistance programs implemented by the Department of Social Welfare (Jabatan Kebajikan Masyarakat, JKM). Key to forming a more consistent systemic approach will be to improve and better harmonize the objectives, design and implementation of BSH and JKM programs. This would include improving the coverage and adequacy of some of the well-targeted JKM programs and to put more emphasis on productive welfare for beneficiaries with work capacity. It would also include clarifying the objectives and improving the targeting performance of BSH. More generally, there is potential to improve the equity and efficiency of social assistance programs by better coordinating targeting approaches, information systems, and front-end service delivery.
Participation in retirement savings institutions is low, especially among the B40 and women, and the majority of participants will only receive very low benefits in retirement. With about 7.6 million active members, the EPF is the retirement savings institution with the largest coverage in Malaysia, although coverage is slightly lower than would be expected given the country’s level of development. Coverage is especially low among lower income households, with less than half of the B40 being active EPF contributors. Average
14 MALAYSIA ECONOMIC MONITOR | JUNE 2020
Summary

contributions per worker are also relatively low because participation in “standard” employment is intermittent and the minimum withdrawal age is low relative to global benchmarks. As a result, average balances are inadequate, with more than half of workers at age 54 having balances of under RM150,000 and almost three quarters having balances under RM250,000. Average balances for women are even lower.
Several measures could increase the proportion of workers actively contributing to the EPF and ensure that retirement savings could be sustained for a longer period of time. To increase coverage, oversight could be improved, including through a requirement for the registration of all workers as a condition for the granting of business licenses and/or government contracts. To raise average balances, the minimum withdrawal age for EPF could gradually be increased to 65 through a well-considered transition process. For instance, the increase could be implemented over a
period of 20 years. In addition, consideration could be given to converting all contributions to EPF wholly into retirement savings, to mandating phased withdrawals of EPF balances, and to exploring longevity insurance and annuitization options. Over time, the EPF contribution rate could be reduced as the benefit eligibility age increases, provided that there is an observed increase in coverage and adequacy. With the changing nature of work, it is unlikely that EPF can ever reach full coverage of the labor force even with all these measures. Thus, a modest, broadly targeted social pension may also be required.
There is a significant degree of duplication and fragmentation in Malaysia’s labor market programs. While the country has long emphasized the importance of human capital development and productive participation in the labor market, relevant efforts have been constrained by the multiplicity of implementing agencies and programs. This has made it difficult to obtain accurate data on program effectiveness; made programs costly to administer; and created a lack of clarity among beneficiaries.
In the near future, the COVID-19 pandemic increases the need for further wage subsidies as well for effective labor market programs to address rising unemployment and underemployment. Over time, the focus of wage subsidies should shift from job retention to job creation, largely consistent with what was announced as part of the Penjana plan. Again, broadly consistent with the Penjana plan, skills-building initiatives will be vital to facilitate workers’ access to jobs that will be in demand during the recovery, such as those necessitating digital or socio-emotional skills. More in the medium and long term, measures to reduce duplication and fragmentation of labor market programs are needed. A deeper culture of program evaluation could produce significant benefits; flagship labor market programs that have been credibly evaluated could be strengthened and others discontinued.
The development of an enhanced social protection system implies a strong role for the government, likely entailing additional fiscal expenditures financed by higher, progressive taxes. Even a gradual expansion of the social protection system may be challenging in the context of the downward trend in government revenues and the fiscal shock resulting from the COVID-19 pandemic. There is a critical need to diversify the revenue base and to increase collection through more progressive taxation. Thus, an enhanced social protection system will require a mixture of public policy measures on both the expenditure and the revenue sides.
15MALAYSIA ECONOMIC MONITOR | JUNE 2020
Summary

Recent trends in Malaysia’s economy
GDP, y/y, Percentage
0
1
2
3
4
5
6
7
Q1-
2016
Q2-
2016
Q3-
2016
Q4-
2016
Q1-
2017
Q2-
2017
Q3-
2017
Q4-
2017
Q1-
2018
Q2-
2018
Q3-
2018
Q4-
2018
Q1-
2019
Q2-
2019
Q3-
2019
Q4-
2019
Q1-
2020 Net Exports
GFCF Change in Inventory
Private Consumption Public Consumption
Real GDP, y/y
Contribution to GDP, y/y, Percentage
-4
-2
0
2
4
6
8
Q1-
2017
Q2-
2017
Q3-
2017
Q4-
2017
Q1-
2018
Q2-
2018
Q3-
2018
Q4-
2018
Q1-
2019
Q2-
2019
Q3-
2019
Q4-
2019
Q1-
2020
Real Exports of Goods and Services, y/y, Percentage
-10
-5
0
5
10
Q1-
2016
Q2-
2016
Q3-
2016
Q4-
2016
Q1-
2017
Q2-
2017
Q3-
2017
Q4-
2017
Q1-
2018
Q2-
2018
Q3-
2018
Q4-
2018
Q1-
2019
Q2-
2019
Q3-
2019
Q4-
2019
Q1-
2020
Contribution to GDP, y/y, Percentage
Net Exports
GFCF Change in Inventory
Private Consumption Public Consumption
Real GDP, y/y
-6
-4
-2
0
2
4
6
8
2015 2016 2017 2018 2019f 2020f 2021f
GDP, y/y, Percentage
5.14.4
5.7
4.74.3
-3.1
6.9
-4
-2
0
2
4
6
8
2015 2016 2017 2018 2019e 2020f 2021f
Non-resident Portfolio Flows, RM Billion
Equity Corporate Bondsand Sukuk
Government Bondsand BNM Bills
-20
-15
-10
-5
0
5
10
06/2
017
08/2
017
10/2
017
12/2
017
02/2
018
04/2
018
06/2
018
08/2
018
10/2
018
12/2
018
02/2
019
04/2
019
06/2
019
08/2
019
10/2
019
12/2
019
02/2
020
04/2
020
Malaysia’s economic activity has slowed markedly amid the COVID-19 pandemic...
...weighed down by contracting investmentand exports
Exports have seen negative growth... ...and the domestic financial markets have seen significant outflows
Malaysia’s economy is forecast to contractby 3.1 percent in 2020...
...reflecting a broad-based decline in privatesector activity
16 MALAYSIA ECONOMIC MONITOR | JUNE 2020

Surviving the storm
Share of Own-Account Workers among All Workers, Percentage
Men Women
0
5
10
15
20
25
2010 2011 2012 2013 2014 2015 2016 2017 2018 2019
Population Aged 65 and Above,Percentage
0
1,000
2,000
3,000
4,000
5,000
6,000
7,000
0
2
4
6
8
10
12
14
16
1970
1980
1990
2000
2010
2020
2030
2040
Population Aged 65 and Above,Number (’000)
Population Age 65+ Percent of Population Age 65+
Malaysia LowIncome
LowerMiddleIncome
UpperMiddleIncome
HighIncome
Share of Households Receiving Social Assistance, Percentage
0
20
40
60
80
100
All B20
Adequacy of Social Assistance Bene�ts, Percentage
Malaysia LowIncome
LowerMiddleIncome
UpperMiddleIncome
HighIncome
All B20
0
5
10
15
20
25
30
35
40
Number of Active Members Age 54
Active EPF Members Aged 54,Number
Estimated Monthly Pensions, RM
Indexed Annuity (Amount per Month)
0
500
1,000
1,500
2,000
2,500
3,000
3,500
4,000
4,500
0
5,000
10,000
15,000
20,000
25,000
Less
tha
n 50
50-1
00
100-
150
150-
200
200-
250
250-
500
500-
1,00
0
1,00
0+
EPF Account Balances (’000)
Average Contributions per Capitaper Month, RM
Individuals Contributing to EPF,Percentage
Income Deciles
0
5
10
15
20
25
30
35
40
45
0
100
200
300
400
500
600
1 2 3 4 5 6 7 8 9 10
Average Monthly EPF Contributions Per Capita
Share of Working Age Individuals Contributing
Malaysia will soon be aging rapidly, with the proportion of the population aged 65 and above doubling within only 24 years
With the changing nature of work, own-account work has been on the rise, particularly among women
The coverage of publicly �nanced social assistance is high across all income groups especially among the B20
Social assistance bene�ts amount to a small share of per capita income, leading to only a modest impact on poverty and inequality
Coverage by retirement savings institutions is far from universal, especially among lowerincome households
Even among those covered by retirementsavings institutions, a majority will receivevery low bene�ts
17MALAYSIA ECONOMIC MONITOR | JUNE 2020

PART ONE
Recent Economic Developments and Outlook
18 MALAYSIA ECONOMIC MONITOR | JUNE 2020

19MALAYSIA ECONOMIC MONITOR | JUNE 2020

The COVID-19 crisis has triggered a global economic shock of historic magnitude, causing a synchronized collapse in activity across the world during H1 2020 (see Figure 1). The health crisis represents the most severe economic shock the world has witnessed in decades, striking a devastating blow to an already fragile global economy. The necessary but economically costly mitigation measures required to contain the public health crisis, together with widespread reductions in economic activity by many producers and consumers, have steeply curbed consumption and investment, and have restricted production and labor supply globally. The cross-border spillovers have also resulted in severe disruptions to international trade and supply chains, a sharp tightening of global financial conditions and precipitous declines in commodity prices. Advanced economies and several emerging market and developing economies
FIGURE 1The COVID-19 pandemic has resulted in a collapse of global economic activity
FIGURE 2Economic conditions in East Asia and Pacific have also deteriorated sharply
The COVID-19 pandemic has triggered a collapse in global economic activity
(EMDEs) with available policy space have implemented unprecedented fiscal and monetary support measures to prevent a more severe downturn, which has contributed to recent stabilization in global financial markets.
Economic conditions in EAP region deteriorated sharply in H1 2020 as the impact of pandemic-related lockdowns and external spillovers rippled through the region (see Figure 2). In China, the initial epicenter of the pandemic, output registered its first contraction since 1976 in Q1 2020, as stringent containment efforts led to a sharp economic slowdown in February. Output has begun to recover since March when containment measures were relaxed, with industrial production returning to growth in April. In the rest of the region, domestic lockdowns and external spillovers have led to the deepest fall in consumption,
Recent economic developments
Source: World Bank Global Economic Prospects Source: World Bank Global Economic Prospects
World AdvancedEconomies
Emerging andDeveloping Economies
GDP, y/y, Percentage
-3
-2
-1
0
1
2
3
4
5
6
Q1-
2016
Q2-
2016
Q3-
2016
Q4-
2016
Q1-
2017
Q2-
2017
Q3-
2017
Q4-
2017
Q1-
2018
Q2-
2018
Q3-
2018
Q4-
2018
Q1-
2019
Q2-
2019
Q3-
2019
Q4-
2019
Q1-
2020
GDP, y/y, Percentage
Developing EAP
Indonesia
Thailand China
PhilippinesVietnam
-8
-6
-4
-2
0
2
4
6
8
Q1-
2016
Q2-
2016
Q3-
2016
Q4-
2016
Q1-
2017
Q2-
2017
Q3-
2017
Q4-
2017
Q1-
2018
Q2-
2018
Q3-
2018
Q4-
2018
Q1-
2019
Q2-
2019
Q3-
2019
Q4-
2019
Q1-
2020
20 MALAYSIA ECONOMIC MONITOR | JUNE 2020
PART ONE - Recent Economic Developments and Outlook

Malaysia’s economy has been dramatically affected by COVID-19 and the subsequent movement restrictions implemented to flatten the curve of the pandemic. The health and human toll of the crisis on Malaysia has been enormous, with more than 8000 confirmed cases and 120 deaths recorded to date, and many more suffering from economic hardship and diminished prospects. Soon after the first case of the virus was reported in Malaysia in January, to stem its spread, the government enacted measures such as
FIGURE 3Falling global demand has resulted in a marked decline in commodity prices...
FIGURE 4... with a particularly sharp drop in energy prices
Malaysia’s economy has been dramatically affected by COVID-19
contact tracing, quarantine requirements for returning travelers and a travel ban for those coming from China. With increases in the number of identified cases by mid-March, the government enacted the Movement Control Order (MCO) on March 18, which remained in force until May. It was then replaced by the Conditional Movement Control Order (CMCO) and the Recovery Movement Control Order (RMCO) that allowed for progressively greater mobility and resumption of economic activity. During the MCO, businesses could not operate unless
Source: World Bank Source: World Bank
production, investment and trade activity since the East Asian financial crisis in 1998 for most countries. An abrupt tightening in global financial conditions since March has also triggered sharp spikes in interest rate spreads and sudden capital outflows from the region. All major economies have responded decisively to deteriorating growth prospects by implementing sizable targeted measures to support affected households and businesses.
Falling global demand has resulted in a marked decline in commodity prices during H1 2020, with a particularly sharp drop in energy prices (see Figure 3 and Figure 4). Brent crude oil prices have decreased
almost 50 percent since the start of the year, in large part due to an unprecedented decline in transport and travel activity, which accounts for about two-thirds of global oil consumption. The prices of minerals and base metals also fell sharply during H1 2020 due to weaker industrial demand, although the decline was less pronounced than in the case of energy prices. Overall, agricultural prices fell only modestly over the period, with mounting concerns over food security due to supply chain disruptions and temporary restrictive trade policies imposed by a number of countries, despite production levels and stocks for most staple foods nearing all-time highs.
Changes in Nominal Price Indexes, May over January 2020, Percentage
-50 -40 -30 -20 -10 0 10
Precious Metals
Beverages
Fertilizers
Raw Materials
Agriculture
Non-energy
Food
Metals & Minerals
Energy
Major Commodity Price Indexes, US$ (2010=100)
20
40
60
80
100 0
1/20
18
04/
2018
07/
2018
10/
2018
01/
2019
04/
2019
07/
2019
10/
2019
01/
2020
04/
2020
Energy Metals & MineralsAgriculture
21MALAYSIA ECONOMIC MONITOR | JUNE 2020
PART ONE - Recent Economic Developments and Outlook

specifically authorized by the government to do so. While under the CMCO and RMCO, all economic sectors have been allowed to re-open except for those on a negative list, subject to COVID-19 standard operating procedures designed for each sector.
The MCO led to a sudden and dramatic decline of mobility in public places and significant interruptions to economic activities. The MCO resulted in a
decrease to mobility in highly frequented public places such as retail and recreation outlets, transit stations, workplaces, public parks, groceries and pharmacies (see Figure 5 and Figure 6), leading to profound demand and supply disruptions in the economy. Compared to similar measures in other countries in the region, Malaysia’s MCO was one of the most effective at restricting movement (see Figure 7) and helped to flatten the pandemic curve (see Figure 8).
FIGURE 5The MCO lasted for over 6 weeks...
FIGURE 7Malaysia experienced one of the largest declines in mobility in the region...
FIGURE 6...leading to a dramatic decline in mobility
FIGURE 8...which helped to effectively flatten the curve of the pandemic
Source: World Bank staff calculations based on European Centre for Disease Prevention and Control data
Source: World Bank staff based on Google data
Source: World Bank staff calculations based on Google data
Source: World Bank staff calculations based European Centre for Disease Prevention and Control data
New Daily Con�rmed Cases, 7-Day Moving Average
-5
15
35
55
75
95
115
135
155
175
31/1
2/20
19
09/0
1/20
20
18/0
1/20
20
27/0
1/20
20
05/0
2/20
20
14/0
2/20
20
23/0
2/20
20
03/0
3/20
20
12/0
3/20
20
21/0
3/20
20
30/0
3/20
20
08/0
4/20
20
17/0
4/20
20
26/0
4/20
20
05/0
5/20
20
14/0
5/20
20
23/0
5/20
20
01/0
6/20
20
10/0
6/20
20
MCO CMCO
Percent Change in Mobility from January 2020, 7-day Moving Average
Retail & Recreation Grocery & Pharmacy
Parks Transit stations
WorkplacesResidential
-80
-60
-40
-20
0
20
40
21-F
eb
27-F
eb
04-M
ar
10-M
ar
16-M
ar
22-M
ar
28-M
ar
03-A
pr
09-A
pr
15-A
pr
21-A
pr
27-A
pr
03-M
ay
09-M
ay
15-M
ay
21-M
ay
27-M
ay
02-J
un
Percent Change in Mobility from January 2020, Retail and Recreation
Malaysia
Singapore
Thailand Indonesia
PhilippinesKorea, Rep.
-100
-80
-60
-40
-20
0
20
21-F
eb
27-F
eb
04-M
ar
10-M
ar
16-M
ar
22-M
ar
28-M
ar
03-A
pr
09-A
pr
15-A
pr
21-A
pr
27-A
pr
03-M
ay
09-M
ay
15-M
ay
21-M
ay
27-M
ay
02-J
un
Pandemic Curve, Log Scale
Tota
l Num
ber
of
Cas
es
Number of Days Since 100th Death
Malaysia
Singapore
Thailand Indonesia
PhilippinesVietnam
100
1,000
10,000
100,000
0 7 14 21 28 35 42 49 56 63 70 77 84 91 98 105
22 MALAYSIA ECONOMIC MONITOR | JUNE 2020
PART ONE - Recent Economic Developments and Outlook

FIGURE 9Malaysia’s economy slowed down markedly in Q1 2020...
FIGURE 10...weighed down by negative investment and net export growth
Source: DOSM Source: World Bank staff calculations based on DOSM data
In this context, the Malaysian economy expanded at a modest pace of 0.7 percent in Q1 2020 (see Figure 9). The modest growth rate recorded in Q1 2020 was significantly lower than that in Q4 2019, when the economy grew by 3.6 percent. Although private consumption moderated, it continued to be the largest source of growth in Q1 2020 (see Figure 10). Over the same period, aggregate investment contracted for the fifth consecutive quarter, continuing to drag on growth.
Primarily due to the government’s imposition of the MCO, private consumption growth moderated to 6.7 percent in Q1 2020, down from 8.1 percent in Q4 2019, with a particularly heavy impact on retail, travel, leisure and recreational spending, as well as spending on durable goods. However, solid consumption spending in January and February, the Bantuan Sara Hidup (BSH) stimulus, and the continued operation of online platforms and delivery services during the MCO mitigated the impact on private consumption during the quarter. Continued moderate inflation (Q1 2020: 0.9 percent) also provided additional support to private consumption spending. Meanwhile, increased government spending on employees’ wages, goods and services led to an increase in public consumption (5 percent; Q4 2019: 1.3 percent).
Aggregate investment contracted for the fifth consecutive quarter, with broad-based weakness in both private and public investment. Gross fixed capital formation (GFCF) shrank by -4.6 percent in Q1 2020 (Q4 2019: -0.7 percent). Deteriorating
external and domestic economic conditions, increased uncertainty, and interruption to ongoing investment projects due to the MCO weighed heavily on investor sentiment, leading to the first period of negative growth in private investment in almost 10 years. Meanwhile, public investment grew at a negative rate for the tenth consecutive quarter in Q1 2020 (-11.3 percent; Q4 2019: -8 percent) due to a contraction in capital spending by the general government and state-owned enterprises (SOEs).
On the supply side, manufacturing and services were the main drivers of growth in Q1 2020. Manufacturing and services continue to expand, albeit at slower paces than in the preceding quarter. The sharp moderation in the growth of the services sector can be attributed to the direct impact of the outbreak on tourism and travel at home and abroad, which in turn weighed heavily on retail, food services and accommodation. However, services that could be delivered with minimal direct contact, particularly those involving internet-based platforms, were better able to weather the impact of movement restrictions, with finance, insurance and services related to information and communication recording increased activity. The manufacturing sector was impacted by a number of factors, including: (i) factory shutdowns in China, which disrupted supply chains and created a shortage of intermediate inputs; and (ii) the MCO in Malaysia, which resulted in shutdowns of non-essential facilities and to limits to operational capacity of 50 percent except for facilities deemed to be essential. In the mining
Net Exports
GFCF Change in Inventory
Private Consumption Public Consumption
Real GDP, y/y
Contribution to GDP, y/y, Percentage
-4
-2
0
2
4
6
8
Q1-
2017
Q2-
2017
Q3-
2017
Q4-
2017
Q1-
2018
Q2-
2018
Q3-
2018
Q4-
2018
Q1-
2019
Q2-
2019
Q3-
2019
Q4-
2019
Q1-
2020
GDP, y/y, Percentage
0
1
2
3
4
5
6
7
Q1-
2016
Q2-
2016
Q3-
2016
Q4-
2016
Q1-
2017
Q2-
2017
Q3-
2017
Q4-
2017
Q1-
2018
Q2-
2018
Q3-
2018
Q4-
2018
Q1-
2019
Q2-
2019
Q3-
2019
Q4-
2019
Q1-
2020
23MALAYSIA ECONOMIC MONITOR | JUNE 2020
PART ONE - Recent Economic Developments and Outlook

sector, ongoing maintenance led to a contraction in the production of oil and gas. In agriculture, weather conditions were not favorable to palm oil production, leading to a decline in production. Of all the sectors, the construction sector contracted to the greatest extent (-7.9 percent), with the MCO leading to the closure of all constructions sites.
Leading economic indicators suggest that weakness in demand is likely to persist for some time. In May, the manufacturing PMI was estimated to stand at 45.6,
TABLE 1GDP growth decomposition
Source: World Bank staff calculations based on DOSM data
a considerable increase over the previous month’s estimate of 31.3. Despite this increase, the estimate still indicates a continued deterioration to conditions in the manufacturing sector, with the figure remaining below the neutral threshold of 50. Meanwhile, the consumer confidence index (produced by the Malaysian Institute of Economic Research), which has remained below 100 since Q4 2018, declined sharply to just 51.1 in Q1 2020 (Q4 2019: 82.3), indicating low levels of confidence in the economy.
GDP, y/y, Percentage
2017Q1
2018Q2
2018Q3
2018Q4
20182018
Q1 2019
Q2 2019
Q3 2019
Q4 2019
2019Q1
2020
GDP 5.8 5.2 4.7 4.4 4.8 4.8 4.5 4.8 4.4 3.6 4.3 0.7
Consumption
Private Sector 6.9 6.5 7.9 8.9 8.4 8.0 7.7 7.8 7.0 8.1 7.6 6.7
Public Sector 5.7 0.2 2.9 5.0 3.9 3.2 6.3 0.3 1.0 1.3 2.0 5.0
Gross Fixed Capital Formation
6.1 0.4 1.6 2.8 0.6 1.4 -3.5 -0.6 -3.7 -0.7 -2.1 -4.6
Exports of Goods & Services
8.7 2.3 2.0 0.5 2.9 1.9 0.1 0.5 -2.1 -3.4 -1.3 -7.1
Imports of Goods & Services
10.2 -2.0 3.7 2.3 2.0 1.5 -1.6 -2.3 -3.5 -2.4 -2.5 -2.5
Sectoral
Agriculture 5.9 3.1 -1.5 -1.2 0.2 0.1 5.8 4.3 4.0 -5.7 2.0 -8.7
Mining 0.4 -2.5 -1.3 -5.1 -0.1 -2.2 -1.5 0.9 -4.1 -3.4 -2.0 -2.0
Manufacturing 6.0 5.2 4.9 5.0 4.7 5.0 4.1 4.3 3.6 3.0 3.8 1.5
Construction 6.7 4.9 4.8 4.7 2.5 4.2 0.4 0.5 -1.4 1..0 0.1 -7.9
Services 6.3 6.5 6.6 7.3 6.9 6.8 6.4 6.1 5.8 6.2 6.1 3.1
24 MALAYSIA ECONOMIC MONITOR | JUNE 2020
PART ONE - Recent Economic Developments and Outlook

In real terms, the export of goods and services shrank for the third consecutive quarter in Q1 2020 (see Figure 11). Malaysia’s exports of goods and services declined by 7.1 percent in Q1 2020 (Q4 2020: -3.4 percent), the largest decline since the Global Financial Crisis (Q3 2009). Both the shortage of intermediate inputs due to factory shutdowns in China and the impact of the MCO on firms’ production capacity toward the end of the quarter weighed on manufacturing exports. Meanwhile, gross merchandise exports expanded marginally by 1.1 percent in the quarter, driven partly by an increase in non-E&E exports (Q1 2020: 5 percent; Q4 2019: 1.7 percent) and a low base effect from Q1 2019. A decline in E&E gross exports within the region contributed to a contraction in the sector, while commodity exports declined due to a fall in oil and gas exports. The outbreak further disrupted international trade in April 2020, causing gross exports to contract by 23.8 percent compared to April 2019. E&E exports, which represented 40 percent of exports in April 2020, dropped by 21.7 percent. Although aggregate gross exports declined, Malaysia’s exports to China rose by 4.2 percent in April.
Exports have continued to see negative growth
In line with the decline in exports, imports of goods and services continued to shrink throughout the quarter. Real imports declined by -2.5 percent in Q1 2020 (Q4 2019: -2.4 percent) due to a fall in capital goods imports, especially machines and transport equipment. This is partially attributable to subdued investment, which declined for the fifth consecutive quarter in Q1 2020. However, gross imports grew by 1.3 percent, supported by the increased imports of intermediate goods (8.1 percent) and consumption goods (4.8 percent). With declining investment, gross imports of capital goods contractor drastically, by almost 27 percent over the quarter. In April 2020, gross imports fell by 8 percent. With factory shutdowns due to the MCO in April, intermediate goods imports declined by 30.6 percent, but imports of capital goods rose by 68.9 percent.
Based on 4-quarter rolling averages, the current account narrowed in Q1 2020, driven by a smaller surplus in goods and a larger deficit in services (see Figure 12). The current account in Q1 2020 stood at 2.9 percent of GDP (Q4 2019: 3.4 percent).2 With the
FIGURE 11Negative export growth continued amid plunging external demand
FIGURE 12A smaller goods surplus and a larger deficit in services led to a narrower current account surplus
Source: World Bank staff calculations based on BNM and DOSM data Source: World Bank staff calculations based on DOSM data
2 These are based on 4-quarter rolling averages, which helps to highlight trends.
Real Exports of Goods and Services, y/y, Percentage
-10
-5
0
5
10
Q1-
2016
Q2-
2016
Q3-
2016
Q4-
2016
Q1-
2017
Q2-
2017
Q3-
2017
Q4-
2017
Q1-
2018
Q2-
2018
Q3-
2018
Q4-
2018
Q1-
2019
Q2-
2019
Q3-
2019
Q4-
2019
Q1-
2020
Current Account Balance, Percentage of GDP, 4-quarter Rolling Average
Goods Primary & Secondary Income Account
Services Current Account
-10
-5
0
5
10
Q1-
2016
Q2-
2016
Q3-
2016
Q4-
2016
Q1-
2017
Q2-
2017
Q3-
2017
Q4-
2017
Q1-
2018
Q2-
2018
Q3-
2018
Q4-
2018
Q1-
2019
Q2-
2019
Q3-
2019
Q4-
2019
Q1-
2020
25MALAYSIA ECONOMIC MONITOR | JUNE 2020
PART ONE - Recent Economic Developments and Outlook

decline in goods exports outstripping that of goods imports, there was an overall decline in goods surplus. Over the same period, a drastic decline in foreign tourist arrivals drove the increase in the service trade deficit, while a fall in income paid to foreign investors led to the decline in the primary income deficit. In the financial account, heightened global uncertainty and increased investors’ demand for safe assets resulted in large portfolio outflows estimated at RM41.3 billion in
the first quarter. Over this period, there was a net inflow of foreign direct investment, estimated at RM6.4 billion, the majority of which flowed to the manufacturing and financial sectors. Additionally, for direct investment abroad by Malaysian firms, there was a net outflow of RM3 billion, while a rise in interbank deposits in domestic banking sector caused a net inflow of RM22.1 billion into the ‘other investments’ account.
TABLE 2Selected external sector indicators
Source: World Bank staff calculations based on DOSM data
Q1 2018
Q2 2018
Q3 2018
Q42018
Q12019
Q2 2019
Q3 2019
Q4 2019
Q1 2020
Balance of Goods & Services (% of GDP) 8.0 5.4 6.0 7.4 8.8 6.7 7.2 7.1 5.7
Current Account Balance (% of GDP) 4.3 1.0 0.9 2.9 4.8 3.9 3.0 2.0 2.6
Total Exports (% of GDP) 68.4 68.2 68.7 68.9 66.2 65.9 65.0 63.9 60.9
Total Imports (% of GDP) 60.4 62.8 62.7 61.5 57.4 59.2 57.8 56.8 55.2
Net Portfolio Investment (RM billion) -3.5 -40.2 0.9 -6.5 6.5 -10.6 -23.6 -1.3 -41.3
Gross Official Reserves (RM billion) 416.4 423.4 427.0 419.5 420.2 425.4 431.3 424.1 440.1
(US$ billion) 107.8 104.7 103.0 101.4 103.0 102.7 103.0 103.6 101.7
26 MALAYSIA ECONOMIC MONITOR | JUNE 2020
PART ONE - Recent Economic Developments and Outlook

BOX 1
Foreign direct investment and global value chains in the wake of COVID-19The COVID-19 pandemic has created unprece-dented challenges to global value chains (GVCs), hampering the flows of intermediate inputs, final goods, services and people. Governments around the world have been scrambling to mitigate the impact of the pandemic on major GVC network hubs, including China, Europe, and the United States (see Figure 13). With multinational corporations having continued to adapt their supply networks to balance efficiency and resilience, their investment decisions will shape the evolution of GVCs in the years to come. Governments from developing countries could further open their economies to foreign investment, seizing opportunities stemming from the reconfiguration of GVCs, and strengthening global collaboration to expedite recovery and to boost longer-term growth.
Multinational corporations are at the epicenter of the current turmoil, with these corporations being required to make investment decisions to fragment and relocate production in a process that will have
an ongoing impact on the geography of global value chains. These enterprises account for about 22 percent of global output and contribute to about 70 percent of total trade, particularly in sectors heavily involved in global value chains, such as electrical and electronics, motor vehicles and chemicals (see Figure 14). Around the world, multinationals also contribute to a substantial share of employment, with U.S. multinationals alone employing 42.3 million workers worldwide in 2016 and representing 22 percent of total private industry employment in the United States. As a result of the immediate supply restrictions, the demand shock, and general decline in investor confidence, the COVID-19 pandemic is expected to reduce FDI by 30 to 40 percent this year. Already, the top 5,000 multinational corporations have reduced their earnings estimates by around 30 percent for the year. This could cause lasting damage to supply chains, with more than half of foreign direct investment consisting of reinvested earnings by these corporations and with their inextricable links to numerous suppliers.
FIGURE 13The emergence of global value chains has made trade more complex...
FIGURE 14...with multi-national corporations dominating trade in the largest sectors
Source: Authors’ calculations using UNCTAD-EORA database Source: Authors’ calculations using OECD AMNE database
MNCs’ Share of Export, Percentage
100
80
60
40
20
0
5 6 7 8 9 10 11
Log Average Annnual Export
Commodity KIG KIS LIG LIS RP
Agriculture
Refined petroleum
Utility
Commodity
Motor Vehicles
Electrical equipment
ChemicalsElectronics
Machines
Other transport
Pub admin Education
ITFinancial
Research
Textile & apparelRetail
Transport
Telecom
Construction
Hotel & restaurant
Real estate
Arts & entertainment
Health & social
Publish & broadcast
Basic metals
Rubber & plasticMineral
PaperFood & beverages
Furniture
Fabricated metal
Wood
27MALAYSIA ECONOMIC MONITOR | JUNE 2020
PART ONE - Recent Economic Developments and Outlook
27

Multinationals have a long history of managing GVC disruptions resulting from crises, with these enterprises having learnt to constantly adapt to risks and opportunities by reconfiguring production networks. The 2008 Japanese earthquake and the 2011 Thailand Chao Phraya river floods both shaped the evolution of GVCs, in many ways making them more resilient. No consensus has emerged on how GVCs will look like after the current pandemic subsides. Some economists hold the view that there will be little significant change and that adjustments will concentrate in health-related industries, as the economic rationale for most GVCs continues to hold (Baldwin 2020; Freund 2020; Miroudot 2020). Others believe that the pandemic is a major wake-up call, requiring a new balance between risk and reward for GVCs, as pandemics, climate change, natural disasters and manmade crises may expose the world to increasingly frequent crises (Goldberg 2020; Javorcik 2020).
Given evolving tolerances for risk as a result of the pandemic, while some multinationals may be willing to lose some efficiency gains to diversify suppliers, the relationship between production length and GVC resilience is more complicated than it may first appear. There is no correlation between supply chain complexity and the severity of the economic impact of COVID-19 (Miroudot 2020). Production localization, or shorter supply chains, would not necessarily result in greater resilience. On the contrary, some previous crises and disasters have led to more offshoring to diversify suppliers and to integrate with a production network spread across a range of countries. Even during the current pandemic, countries have still relied on global production networks to meet higher domestic demand for essential medical and other goods.
Over time, traditional supply chains have also evolved into supply networks, making it difficult to relocate, whether back to an enterprise’s own country or elsewhere. The challenge relates to a number of factors, including how modern supply networks are structured and how lead firms choose to engage with their suppliers (Willy Shih 2020). For example, a foreign affiliate manufacturing T-shirts in Rwanda may source coloring material, textiles, textile machinery from at least three tiers of domestic suppliers, while importing fabrics, chemicals and machines from hundreds of firms around the world (see Figure 15). As the example shows, the supplier networks are so interconnected that building them somewhere
else would incur considerable costs, thus risking a loss of competitiveness. Even if production facilities could be relocated, it would require a whole ecosystem of talent, infrastructure as well as nearby upstream and downstream industries to scale up production in a new location.
As lead firms seek to stay abreast of the evolution of GVCs in the recovery phase, one sure strategy for multinationals is to accelerate technology adoption. COVID-19 could create opportunities to embrace digital transformation to enhance efficiency and to reduce risks. Multinationals could use artificial intelligence, machine learning, and big data to monitor supply networks, to develop and oversee production remotely, to connect to customers, and to fulfill orders. Toyota has efficiently implemented this approach since the 2011 Japanese earthquake, enabling it to track components and replace them relatively easily during the pandemic. About 70 percent of companies surveyed in Europe are speeding up digital transformation in response to the pandemic, with banks, health care providers, and retailers moving to digital channels and using e-commerce platforms to expand their customer base (MGI, 2020).
The pandemic has also exacerbated already increasing protectionist sentiment, encouraging more nationalist policies. In particular, the United States and the European Union have enacted strict screenings of foreign acquisitions in response to perceived risks to national or economic security. In 2019,
FIGURE 15Networks between MNCs and their suppliers are now incredibly complex
Source: Author’s calculation using transaction level data from Rwanda
28 MALAYSIA ECONOMIC MONITOR | JUNE 2020
PART ONE - Recent Economic Developments and Outlook
28

restrictions on FDI had already reached the highest level in 20 years. Another worrying development is that some governments are now conditioning state support on shifting production back home. US lawmakers are crafting proposals to push American companies to move operations or key suppliers out of China by offering tax breaks, new regulatory incentives, and carefully structured subsidies, while Japan has set aside a record US$ 2.2 billion support package to subsidize manufacturers who move their production out of China. Such interventions are often not supported by economic rationale. In particular, not only does reshoring not necessarily reduce supply chain risks, the increased production costs could undermine national competitiveness and lower long-term growth across the world. These policies could also hurt low-income countries that are increasingly reliant on GVCs to stimulate economic growth.
investment, countries could counter the global protectionist trend by further easing entry and reducing operational FDI restrictions as part of their structural reforms. Becoming relatively more open to foreign investors can significantly help attract investment. For example, China and India both recently announced the removal of caps on foreign equity ownership of securities and defense and allowing foreign ownership of fund management firms.
• Seizing opportunities created by the evolving structure of GVCs: Recent trade tensions between the US and China have prompted a diversification of American production facilities to other East Asian countries. The push to diversify supply chains may intensify, with regional supply chains gaining more momentum in the context of the pandemic. Policymakers may also respond to changes in sectoral dynamics, including the rise in e-commerce and digital health or the decline in fossil fuels. These changes may create new opportunities for some developing countries, according to their respective comparative advantages. Policymakers should reflect on the possible shifts and let business realities guide their response, building on economic fundamentals. These will entail realigning investment incentives to the new national development priorities that are likely to emerge following the pandemic, such as job creation. Reforms may also be needed to phase out of crisis-related investment screening and approval mechanisms for FDI entry.
• Strengthening global collaboration: The COVID-19 pandemic has resulted in an increased awareness of the shared public health and economic vulnerabilities faced by countries and of the importance of collaboration to resolve crises. It has also highlighted the critical importance of a commitment to enabling the exchange of data, the sharing of information on good practices, and strengthening collaboration. Recent history has shown that global integration through trade and investment has brought peace and prosperity to many countries. Global leaders need to work together to secure the hard-earned gains from participation in global value chains.
3 http://blogs.worldbank.org/psd/foreign-direct-investment-and-global-value-chains-wake-covid-19
Even during the current pandemic, countries have still relied on global production networks to meet higher domestic demand for essential medical and other goods
What can countries do in the recovery phase and the ‘new normal’ of GVC to counter prevailing global headwinds and uncertainty related to national economic sovereignty measures? World Bank research suggests a three-part policy response, as follows3:
• Opening up the economy and ensuring that it is ready for a post-crisis start: The crisis has exposed a number of structural challenges that may impact developing countries, including dependence on a small number of vulnerable sectors. By its nature, FDI strengthens the resilience of an economy and enables it to absorb future shocks through economic diversification and enhanced productivity. To attract additional
29MALAYSIA ECONOMIC MONITOR | JUNE 2020
PART ONE - Recent Economic Developments and Outlook
29

Inflation has trended downward due to a significant decline in fuel pricesHeadline inflation turned negative in recent months, reflecting marked declines in fuel prices, while underlying inflation remained generally muted (see Figure 16 and Figure 17). During the first quarter, the contribution from the lagging impact of reforms to the GST to headline inflation was offset
by a decrease in fuel prices. While Malaysia’s headline inflation rate stood at 1.6 percent in January and at 1.3 percent in February, the decline in fuel prices caused inflation to turn negative in March and April (-0.2 and -2.9 percent respectively). The significant impact of the decline in gasoline prices was partially offset by modest
FIGURE 16Headline inflation turned negative in recent months...
FIGURE 18Unemployment rose to its highest rate in March...
FIGURE 17...due primarily to sharp declines in petrol prices
FIGURE 19...driven by a rise in unemployment for the 15-24 age group
Source: DOSM
Source: DOSM
Source: World Bank staff calculations based on DOSM data
Source: DOSM
In�ation, y/y, Percentage
Headline In�ation Core In�ation
-4
-3
-2
-1
0
1
2
3
10/2
018
12/2
018
02/2
019
04/2
019
06/2
019
08/2
019
10/2
019
12/2
019
02/2
020
04/2
020
Contribution to In�ation, y/y, Percentage
Others Transport
Housing, Water, Electricity,Gas & Other Fuels
Food and Non-alcoholicBeverages
Headline In�ation
-4
-2
0
2
4
01/2
018
03/2
018
05/2
018
07/2
018
09/2
018
11/2
018
01/2
019
03/2
019
05/2
019
07/2
019
09/2
019
11/2
019
01/2
020
03/2
020
Unemployment Rate, Percentage
Labor Force Participation Rate,Percentage
Labor Force Participation Rate Unemployment Rate
65
66
67
68
69
70
0
1
2
3
4
5
01/2
015
05/2
015
09/2
015
01/2
016
05/2
016
09/2
016
01/2
017
05/2
017
09/2
017
01/2
018
05/2
018
09/2
018
01/2
019
05/2
019
09/2
019
01/2
020
Unemployment Rate, Percentage
15-24Overall 25-34 35-44 45-54
0
2
4
6
8
10
12
Q1-
2017
Q2-
2017
Q3-
2017
Q4-
2017
Q1-
2018
Q2-
2018
Q3-
2018
Q4-
2018
Q1-
2019
Q2-
2019
Q3-
2019
Q4-
2019
Q1-
2020
30 MALAYSIA ECONOMIC MONITOR | JUNE 2020
PART ONE - Recent Economic Developments and Outlook

The financial sector has remained resilient, despite significant outflowsIn the period from January to May, BNM lowered the OPR by a total of 1 percent, with the rate declining from 3 percent to 2 percent over this period. At the Monetary Policy Committee (MPC) meetings in January and March, the OPR was lowered by 0.25 percent on each occasion, following which it was lowered by a further 0.50 percent in May. In addition to lowering the OPR, BNM took steps to ensure ample liquidity in the financial system by: (i) lowering the Statutory Reserve
Requirement (SRR) from 3 percent to 2 percent; and (ii) allowing financial institutions to use their holding of Malaysian government bonds to comply with the SRR, which BNM estimates could inject up to RM46 billion worth of liquidity into the financial system. BNM expects Malaysia’s economy to be significantly impacted by the pandemic in the first half of 2020, with a gradual pick-up in economic activities in the second half as the MCO is lifted, supported by the government’s fiscal
price increases in food and non-alcoholic beverages, housing and utilities categories during the quarter. Core inflation declined slightly to 1.3 percent from 1.4 percent in the previous quarter.
Labor market conditions softened noticeably in recent months. In January and February, strong employment growth (2.1 percent) helped keep the unemployment rate stable at 3.3 percent. However, a decrease in tourism-related activities and the enactment of the MCO resulted in a decline to employment growth to 1.6 percent, with the unemployment rate increasing to 3.5 percent. The rate in April was estimated to stand at 5 percent, its highest level in available recorded monthly data (see Figure 18). Meanwhile, the labor force participation rate declined slightly to 68.1 percent
in April, down from its peak of 68.9 percent in January.
The rise in the unemployment rate was mostly driven by an increase in unemployment for the 15-24 age group, with the rate for this group already the highest for all age groups (see Figure 19). The graduate unemployment rate will likely increase in coming months, with new graduates entering the labor market in the second half of the year and many employers reducing or postponing new hiring in the current downturn. A moderation in private services wage growth (Q1 2020: 1.4 percent; Q4 2019: 4.2 percent), and in manufacturing wage growth (Q1 2020: 3.4 percent; Q4 2019: 4.4 percent) led private wage growth to decelerate to 2.1 percent in Q1 2020, down from 4.3 percent in Q4 2019.
FIGURE 20Net financing slowed due to a moderation in corporate bond issuances
Source: BNM
FIGURE 21Household debt remained elevated at 82.7 percent of GDP
Source: BNM
Contribution to Net Financing Growth, y/y, Percentage
Corporate Bonds
Banking System and DFI Loans
Total NetFinancing
0
2
4
6
8
10
07/
2016
11/
2016
03/
2017
07/
2017
11/
2017
03/
2018
07/
2018
11/
2018
03/
2019
07/
2019
11/
2019
03/
2020
Household Debt-to-GDP, Percentage Household Debt, y/y
70
75
80
85
90
2013 2014 2015 2016 2017 2018 2019 March2020
31MALAYSIA ECONOMIC MONITOR | JUNE 2020
PART ONE - Recent Economic Developments and Outlook
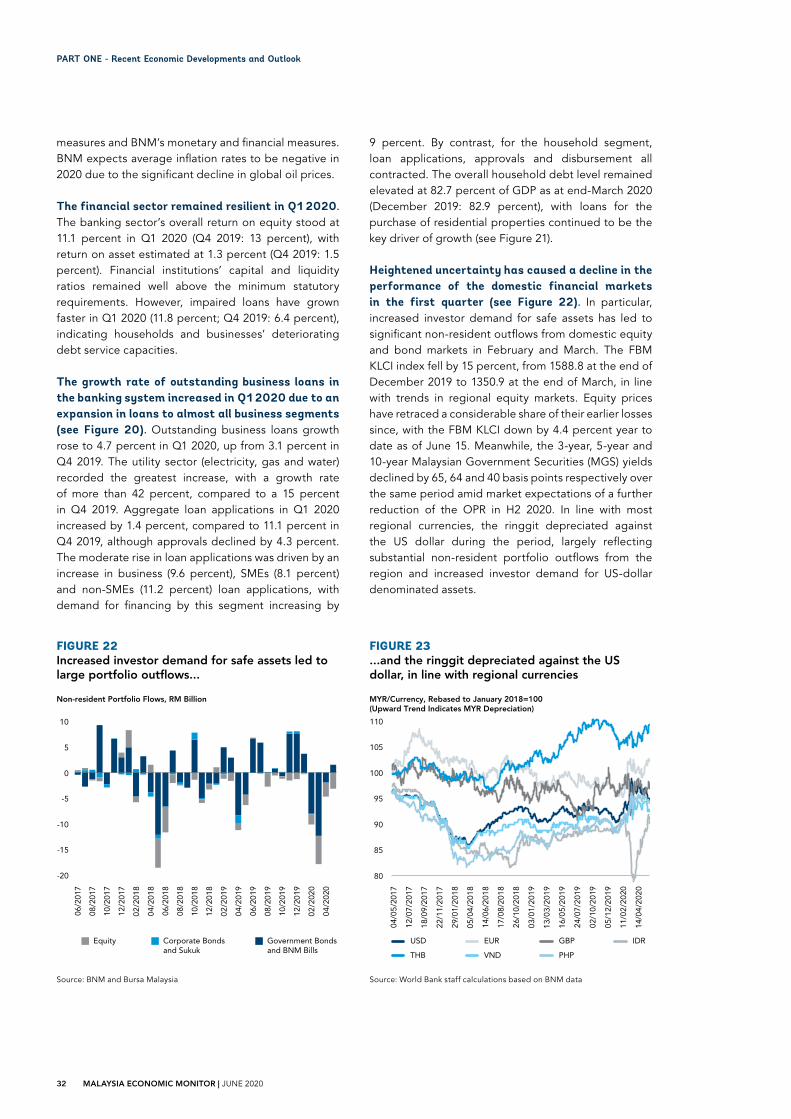
FIGURE 22Increased investor demand for safe assets led to large portfolio outflows...
Source: BNM and Bursa Malaysia
FIGURE 23...and the ringgit depreciated against the US dollar, in line with regional currencies
Source: World Bank staff calculations based on BNM data
measures and BNM’s monetary and financial measures. BNM expects average inflation rates to be negative in 2020 due to the significant decline in global oil prices.
The financial sector remained resilient in Q1 2020. The banking sector’s overall return on equity stood at 11.1 percent in Q1 2020 (Q4 2019: 13 percent), with return on asset estimated at 1.3 percent (Q4 2019: 1.5 percent). Financial institutions’ capital and liquidity ratios remained well above the minimum statutory requirements. However, impaired loans have grown faster in Q1 2020 (11.8 percent; Q4 2019: 6.4 percent), indicating households and businesses’ deteriorating debt service capacities.
The growth rate of outstanding business loans in the banking system increased in Q1 2020 due to an expansion in loans to almost all business segments (see Figure 20). Outstanding business loans growth rose to 4.7 percent in Q1 2020, up from 3.1 percent in Q4 2019. The utility sector (electricity, gas and water) recorded the greatest increase, with a growth rate of more than 42 percent, compared to a 15 percent in Q4 2019. Aggregate loan applications in Q1 2020 increased by 1.4 percent, compared to 11.1 percent in Q4 2019, although approvals declined by 4.3 percent. The moderate rise in loan applications was driven by an increase in business (9.6 percent), SMEs (8.1 percent) and non-SMEs (11.2 percent) loan applications, with demand for financing by this segment increasing by
9 percent. By contrast, for the household segment, loan applications, approvals and disbursement all contracted. The overall household debt level remained elevated at 82.7 percent of GDP as at end-March 2020 (December 2019: 82.9 percent), with loans for the purchase of residential properties continued to be the key driver of growth (see Figure 21).
Heightened uncertainty has caused a decline in the performance of the domestic financial markets in the first quarter (see Figure 22). In particular, increased investor demand for safe assets has led to significant non-resident outflows from domestic equity and bond markets in February and March. The FBM KLCI index fell by 15 percent, from 1588.8 at the end of December 2019 to 1350.9 at the end of March, in line with trends in regional equity markets. Equity prices have retraced a considerable share of their earlier losses since, with the FBM KLCI down by 4.4 percent year to date as of June 15. Meanwhile, the 3-year, 5-year and 10-year Malaysian Government Securities (MGS) yields declined by 65, 64 and 40 basis points respectively over the same period amid market expectations of a further reduction of the OPR in H2 2020. In line with most regional currencies, the ringgit depreciated against the US dollar during the period, largely reflecting substantial non-resident portfolio outflows from the region and increased investor demand for US-dollar denominated assets.
Non-resident Portfolio Flows, RM Billion
Equity Corporate Bondsand Sukuk
Government Bondsand BNM Bills
-20
-15
-10
-5
0
5
10
06/2
017
08/2
017
10/2
017
12/2
017
02/2
018
04/2
018
06/2
018
08/2
018
10/2
018
12/2
018
02/2
019
04/2
019
06/2
019
08/2
019
10/2
019
12/2
019
02/2
020
04/2
020
MYR/Currency, Rebased to January 2018=100(Upward Trend Indicates MYR Depreciation)
IDRUSD
THB
EUR
VND
GBP
PHP
80
85
90
95
100
105
110
04/0
5/20
17
12/0
7/20
17
18/0
9/20
17
22/1
1/20
17
29/0
1/20
18
05/0
4/20
18
14/0
6/20
18
17/0
8/20
18
26/1
0/20
18
03/0
1/20
19
13/0
3/20
19
16/0
5/20
19
24/0
7/20
19
02/1
0/20
19
05/1
2/20
19
11/0
2/20
20
14/0
4/20
20
32 MALAYSIA ECONOMIC MONITOR | JUNE 2020
PART ONE - Recent Economic Developments and Outlook

BOX 2
Foreign workers in Malaysia during the COVID-19 pandemicThe COVID-19 pandemic has hit foreign workers particularly hard. While the pandemic and MCO have affected practically everyone in Malaysia, foreign workers—both regular foreign workers that entered Malaysia using the Visit Pass (Temporary Employment) system and comparable irregular foreign workers—are likely to have been hit particularly hard for several reasons. First, foreign workers are a vulnerable population, with low salaries and limited savings and support. Second, the MCO negatively impacted non-essential businesses that require physical interactions or presence—such as in hospitality and retail services, manufacturing and construction sectors—that are likely to have laid off at least some of their employees. Third, foreign workers are for the most part not covered by measures announced in the economic support packages and plans. Finally, regulations like those that prevent foreign workers to change employers within Malaysia could aggravate the adverse impacts.
Mitigating the effects of the pandemic on foreign workers could benefit not only these workers but also businesses and Malaysia more broadly. Even though foreign workers are not Malaysian citizens, there are humanitarian grounds to support them during the extraordinary crisis caused by the COVID-19 pandemic. Support to foreign workers can also help any business with continuing labor shortages to survive the crisis. In addition, support to foreign workers can also benefit Malaysia more broadly. Support will mean that a larger share of foreign workers will be willing and able to remain properly documented, to comply with the RMCO, and to avail themselves of COVID-19 testing and treatment offered by the health care system. In turn, this will likely limit the spread of COVID-19 across Malaysia.
Malaysia has taken some positive steps to accommodate the needs of foreign workers. Access to tests and treatment for COVID-19 has been extended to both regular and irregular foreign workers. This is essential both for the well-being of foreign workers, who often live in communal housing that does not permit social distancing, and to prevent the wider spread of COVID-19. The government has also moved to improve the housing conditions of foreign workers and introduced a 25 percent discount on the levy imposed on the extension of work permits for foreign workers
with permits expiring between April 1 and December 31, 2020, which acts as an incentive for employers to retain these workers.
Even though foreign workers are not Malaysian citizens, there are humanitarian grounds to support them during the extraordinary crisis caused by the pandemic
However, more can be done to mitigate the adverse effects of COVID-19 on foreign workers and their employers. Based on international best practices and Malaysia’s unique country context, recommended measures include continued provision of access to healthcare and improvements both to the clarity and scope of outreach efforts to the foreign worker community. Testing and treatment needs to become part of daily business until a COVID-19 vaccine becomes readily available. In addition, it should be assured that all foreign workers remain with proper lodging and food. Finally, it would be worth considering allowing and facilitating changes of foreign workers’ employers, extending expiring visas, and temporarily suspending the foreign worker levy.
As far as feasible, all foreign workers should be treated equally. Based on an estimate by World Bank (2020), irregular foreign workers make up more than 40 percent of the total foreign worker population in Malaysia. Irregular foreign workers arguably face more adverse conditions than their regular counterparts, due to the lack of social protection benefits, contracts, and workplace protections. In this time of crisis, as far as feasible any support that is being provided for regular foreign workers should be extended to the more vulnerable communities of irregular foreign workers to limit the adverse effects of COVID-19 on the total foreign worker population in Malaysia and the spread of the pandemic.
33MALAYSIA ECONOMIC MONITOR | JUNE 2020
PART ONE - Recent Economic Developments and Outlook
33

4 See http://www.worldbank.org/en/data/interactive/2020/04/02/database-on-coronavirus-covid-19-trade-flows-and-policies.
BOX 3
Malaysia is a key player in the global trade of personal protection equipmentThe intense focus on international trade in medical products resulting from the pandemic creates both opportunities and challenges to small, open economies such as Malaysia’s. While Malaysia is a key player in the global market for personal protection equipment, it is also dependent on imports in many other critical areas.
The World Health Organization COVID-19 Disease Community Package contains 46 items related to surveillance, triage, screening and the clinical management of the disease. Among them, 17 products have been prioritized as key critical items to deal with the current crisis, including essential items for diagnosis and treatment processes, personal protection equipment, and oxygen concentrators.
Malaysia plays a critical role in the export of key COVID-19 products1. For example, Malaysia meets about 57 percent of the global demand for sterile medical gloves (three-year average of US$ 3.4b in total exports, pre-crisis) and about 53 percent of the demand for non-sterile gloves for examination (three-year average of US$ 1.1b in total exports, pre-crisis). In the markets that import medical gloves from Malaysia, the average applied tariff is 10.9 percent.
However, Malaysia relies on imports for a number of other key products that the management of COVID-19. Malaysia has large import needs across the list of COVID-19 products, including those required for both case management and for personal protection equipment. Some of the import sources are highly concentrated, potentially resulting in disruption risks. For example, 78.2 percent of Malaysia’s imported medical masks are sourced from just three supplier countries, with 66.1 percent of its requirements imported from China. Similarly, 80.3 percent of protective goggles are imported from the same three countries. Further, while most items on the essential COVID-19 products list can
be imported duty free into Malaysia, medical masks are subject to a 10 percent import tariff, heavy duty aprons to a 20 percent tariff, and oxygen flow-splitters to a 5 percent tariff. This acts as an unnecessary tax on the provision of public health.
Trade policy plays a key role in determining Malaysia’s ability to manage the health crisis. Malaysia should look to diversify the imports of critical COVID-19 medical products, particularly from providers that are highly affected by the crisis and/or that are imposing export restrictions. Malaysia should also consider eliminating tariffs on imported COVID-19 medical products. It should also continue to refrain from imposing export restrictions that create unnecessary barriers to trade and that pose risks to other countries that are reliant on Malaysian exports to meet their needs.
There is also an opportunity to scale up production and exports of COVID-19 medical products, particularly for those with which Malaysia already has a demonstrated comparative advantage. Currently, medical glove exports constitute around 1.3 percent of Malaysia’s total exports of goods and services. However, even before the crisis, there were concerns regarding productivity in the manufacturing of rubber glove and regarding the pace of automation in a sector that still relies heavily on labor-intensive manufacturing. Particularly with Malaysia transitioning to high-income country status, it will need to focus on building the quality of workforce skills, promoting quality investments, and intensifying technology adoption across all sectors of the economy to boost competitiveness, including in the manufacture of medical products.
34 MALAYSIA ECONOMIC MONITOR | JUNE 2020
PART ONE - Recent Economic Developments and Outlook
34

The Prihatin stimulus package has helped blunt the impact of the crisisResponding to the impending impact of the MCO on vulnerable households and businesses, the government unveiled two rounds of the Prihatin Rakyat Economic Stimulus Package in Q1 2020. The package was designed to achieve three broad objectives (see Table 3). Firstly, it was intended to protect Malaysian households through various measures to ease households’ financial burden in the near term, particularly one-off cash assistance programs, together with increased flexibility in the withdrawal and contribution to the Employees Provident Fund (EPF). Secondly, to support businesses, measures were implemented to ensure the sustainability of firms’ operations and to retain employment, especially among SMEs, with these measures including a wage subsidy program for employees earning less than RM4,000 per month. Thirdly, to ensure that the structure of the economy remains in place, the government introduced measures focusing on preserving jobs and on domestic investment activities with large multiplier effects.
TABLE 3Main elements of the Prihatin Rakyat Economic Stimulus Packages
RM Billion
Protecting the people 126
National Caring Aid Cash Transfer Program 10
Wage subsidy 13.8
Cash aid for government servants and pensioners 1.7
EPF Account 2 withdrawal 40
6-month moratorium on loan repayments 63
Special fund to strengthen health care system 1
Supporting the business community 101
6-month moratorium on loan repayments 35
Corporate loan guarantees from Danajamin 50
6-month freeze on EPF contributions and HRDF contributions by employers 10
Strengthening the economy 3
Total 260 (17 percent of GDP)
Source: World Bank staff calculations based on MOF data
To complement measures in the Prihatin package, many state governments have also announced stimulus packages at the state level. The bulk of the packages involve the provision of cash assistance to lower income families, reliefs for small and micro entrepreneurs, and the deferment of land taxes and rentals. The Sarawak, Sabah and Selangor state governments had the largest stimulus packages of all the states, with their value standing at RM1.1 billion, RM670 million and RM400 million respectively.
While the measures introduced under the Prihatin package are welcome, their efficiency could be improved in a number of areas. The latest update from the Ministry of Finance has indicated that almost RM9 billion out of the RM10 billion allocated for the one-off cash transfer programs has been disbursed,5 with a survey by DOSM indicating that around 70 percent of the respondents believed that the stimulus package was an effective means of reducing their financial burdens.6
5 https://www.treasury.gov.my/pdf/Laporan-Pelaksanaan-Pakej-Prihatin-Rakyat-Keenam.pdf6 Special survey on “Effects of Covid-19 on Economy and Individual (Round 2)”. https://www.dosm.gov.my/v1/index.php?r=column/cone&menu_id=Skp1WWdzalp0aVZ6MG9jRUdIbXdwUT09
35MALAYSIA ECONOMIC MONITOR | JUNE 2020
PART ONE - Recent Economic Developments and Outlook

Nevertheless, the disbursement of BPN cash assistance has been affected by implementation issues, resulting in an exclusion error in certain vulnerable communities.7 In addition, the uptake for the wage subsidy program has been relatively low, with many SMEs reluctant to sign a clause that will require them to retain their employees for at least six months (three months under the wage subsidy and three months after) with no forced unpaid leave and continued wage payments. Finally, because the package was formulated on the assumption that the crisis would be resolved within 2-3 months, the cash assistance are one-off payments. With the high level of uncertainty regarding the impact of the pandemic and with the already significant economic downturn, there are growing public expectations that the quantum of the assistance should be increased.
More recently, the government has announced the Penjana short-term economic recovery plan, which outlined measures to help stimulate the economy. The Penjana plan focuses on three key thrusts, which is to empower people, to empower businesses and to stimulate the economy. The plan amounts to RM35 billion, of which RM10 billion will be a direct fiscal injection. Among the measures included under the first pillar are the extension of the wage subsidy for a further three months amounting to RM5.3 billion, the establishment of a RM2 billion fund for reskilling and upskilling programs as well as additional one-off cash assistance for vulnerable groups including the disabled and single mothers. Under the second pillar to empower businesses, the measures include
financing and liquidity support for SMEs and affected sectors such as tourism, and incentives to boost digital adoption and e-commerce. Finally, under the third pillar, the government outlined tax exemption measures for various sector initiatives as well as a plan for accelerated payment terms by GLCs and large corporations. In addition, it was also announced that the government plans to table a COVID-19 Temporary Measures Act to provide relief from contractual obligations and financial distress.
Similar to the Prihatin package, the Penjana plan could be made more efficient with greater attention given towards supporting vulnerable households. Overall measures to support employment, labor force upskilling, digitalization of SMEs and new investment are welcomed. Nonetheless, there is a notable absence of cash transfers to citizens in the plan, unlike in the Prihatin package, which have proven to be the more effective mechanism to protect the consumption of the B40 and to provide relief to lower income households. In addition, a number of the measures, such as the various exemptions on stamp duty, real property gains tax (RPGT) and vehicles sales tax favor the higher income groups, in addition to being costly in terms of forgone revenue. There is also a risk that untargeted tax incentives may result in further revenue loss without substantial gains in terms of job creation. In addition, the fragmentation of measures across 40 separate initiatives may prove challenging to implement effectively within a short period of time.
7 Various news outlets reported of selected groups being rejected of their BPN application for numerous reasons including the applicant/spouse having a company registered with the Companies Commission of Malaysia, as well as those who lost their jobs or facing a significant reduction in income near to the application closing date. MOF has since indicated that rejected applicants can appeal for reconsideration by submitting the relevant supporting documents.
36 MALAYSIA ECONOMIC MONITOR | JUNE 2020
PART ONE - Recent Economic Developments and Outlook

Higher spending to cushion the pandemic’s impact coupled with declines in revenue have led to a narrowing of fiscal spaceCosts associated with the Prihatin package and the Penjana plan are expected to result in an increase to government expenditure of RM35 billion in 2020. While the cost of the Prihatin package amounts to a total of RM260 billion, or 17 percent of GDP – comparable to that seen in many advanced economies – the direct fiscal injection is fairly modest, amounting to RM35 billion (or 2.3 percent of GDP) (see Figure 24)8. The bulk of the expenditure is on the one-off Bantuan Prihatin Nasional (BPN) cash assistance program for B40 and M40 households and on the wage subsidy program, amounting to RM10 billion and RM13.8 billion respectively. Together, these two programs account for 64 percent of the federal government’s allocation for the stimulus packages (see Figure 25). Meanwhile, the Penjana plan increases the government expenditure by another RM10 billion, of which the bulk of it is allocated for the extension of the wage subsidy program and upskilling and re-skilling programs (RM8.8 billion). The heavy reliance on non-fiscal mechanisms to finance the bulk of both the Prihatin package and Penjana plan reflects the limited fiscal space available to government
at the outset of the COVID-19 crisis. Taken together, the Prihatin package and the Penjana plan come to a value of about 19 percent of GDP (RM296 billion) in total measures, and a fiscal injection of about 2.4 percent of GDP (RM45 billion).
8 The scale of Malaysia’s response package is among the largest in the EAP region, with only Thailand and Singapore announcing responses on a comparable scale as a share of GDP and is close in size to those adopted by Advanced Economies.9 The World Bank crude oil price forecast is the average for West Texas Intermediate, Brent, and Dubai.
FIGURE 24The direct fiscal injection in the Prihatin package and Penjana plan is fairly modest...
Source: World Bank staff calculations
FIGURE 25...with the bulk of the fiscal injection consisting of wage subsidies and cash transfers
Source: World Bank staff calculations
Breakdown of Prihatin and Penjana, RM Billion
3510
225
25
0
50
100
150
200
250
300
Prihatin Penjana
Direct Fiscal Injection Non-Fiscal Stimulus
Breakdown of Direct Fiscal Injection in Prihatin and Penjana, RM Billion
Other One-Off Cash Assistance Others
Wage SubsidyBPN Civil Servants One-Off Cash Assistance
0
5
10
15
20
25
30
35
40
45
BPN
10
19.1
1.71
13.2
Falling global oil prices have placed additional downward pressure on already declining federal government revenues. Global commodity prices have declined sharply in line with the expectation of a sharp economic downturn worldwide. Currently, crude oil
The heavy reliance on non-fiscal mechanisms reflects the limited fiscal space available to government at the outset of the COVID-19 crisis
37MALAYSIA ECONOMIC MONITOR | JUNE 2020
PART ONE - Recent Economic Developments and Outlook

FIGURE 26World Bank calculations suggest that the federal government will face a revenue shortfall...
Source: World Bank staff calculations
FIGURE 27...mainly driven by sharply lower petroleum-related income
Source: World Bank staff calculations
prices are expected to average at US$ 32 per barrel over 2020,9 much lower than the figure assumed by the government in its budget of US$ 62 per barrel. World Bank staff calculations suggest that in 2020, the federal government will face a revenue shortfall of at least RM22 billion in 2020 (1.5 percent of GDP) from its budget estimate of RM245 billion (15.2 percent of GDP) (see Figure 26) driven mainly driven by the considerable loss of petroleum-related income (see Figure 27). In addition, the various tax exemptions granted in the Penjana plan also represent loss of potential revenue.
With projected increases to expenditure and downward pressures on revenue, the fiscal deficit is expected to widen in 2020, thus eroding the government’s fiscal space. Malaysia entered the crisis with a relatively elevated level of federal government debt (2019: 52.5 percent of GDP) and a low level of revenue (2019:15.4 percent of GDP10). The World Bank estimates that the fiscal deficit could widen to as much as 7 percent of GDP, thus placing the government in a very tight spot if additional stimulus is needed. At the current juncture, the government has a couple of immediate options to limit the increase in the fiscal deficit this year. First, although the savings may not be sufficient to offset the fall in revenue, it could
recalibrate selected items in the operating budget. The government could also explore other non-tax revenue measures through higher dividends from GLCs such as Petronas, as well as through the sale of selected government’s assets. However, this reliance on GLCs may have negative implications for the GLCs financial standing (See Box 4 for a broader discussion on fiscal space).
The government’s options to finance any additional fiscal measures are constrained by its statutory limits, which may only be amended through a parliamentary sitting. At present, several legislations curtail the government’s ability to raise additional funds, particularly if a larger stimulus is needed. These legislations include the Loan (Local) Act 1959, which prohibits the use of borrowings to fund operational spending, and the Government Funding Act, which states that the outstanding federal government debt financed via Malaysian Government Securities (MGS), Malaysia Government Investment Issues (MGII) and Malaysian Islamic Treasury Bills (MITB) must be capped at 55 percent of GDP. The emergency COVID-19 bill, which is expected to be tabled in July, could be an opportunity for the government to amend these statutory laws.
10 Excluding the one-off Petronas special dividend of RM30 billion.
Federal Government Revenue, RM Billion
100
120
140
160
180
200
220
240
2015 2016 2017 2018 2019 2020f
Projected Shortfall in Government Revenue, RM Billion
-28
-23
-18
-13
-8
-3
2
Personal Income Tax
SST
Others
Petroleum-related Revenue
Corporate Income Tax
38 MALAYSIA ECONOMIC MONITOR | JUNE 2020
PART ONE - Recent Economic Developments and Outlook

A primer on fiscal space for shock resilienceGenerally speaking, fiscal space is defined in terms of the flexibility required to enable a government to provide resources for public purposes without compromising macroeconomic stability and fiscal sustainability. With adequate fiscal space, a government has the necessary budgetary resources to stimulate activity. Just as importantly, it provides reassurance regarding the sustainability of the budget, thereby helping to ensure the effectiveness of fiscal stimulus measures to economic growth.
A country’s fiscal space can be classified into three broad categories. Fiscal space is said to be limited when only marginal or no fiscal easing is possible. A country that has some fiscal space is able to implement meaningful temporary fiscal measures within certain limits, despite concerns regarding financing and sustainability. The country has substantial fiscal space when financing, fiscal sustainability and credibility considerations do not impose significant constraints on the implementation of temporary fiscal measures (IMF 2018).
Most approaches to analyzing fiscal space involved an examination of a country’s debt-related indicators. For example, Kose, Kurlat, Ohnsorge and Sugawara (2017) have constructed a comprehensive database of a wide range of indicators grouped into four broad categories: debt sustainability; balance sheet vulnerability; external and private sector debt-related risks as potential causes of contingent liabilities; and market access. The IMF’s most recent fiscal space assessment uses two sets of considerations to formulate its fiscal space framework. First, it looks at a country’s financing capacity (i.e. the extent to which the government is able to access markets and raise funds at a reasonable rate). Secondly, it looks at the sustainability of the government’s public debt and its annual financing needs. In addition, it implies a qualitative assessment, taking into consideration any country-specific factors that could affect the degree of the fiscal space.
Fiscal space assessment could also be expanded to other fiscal-related indicators. Pick (2017) suggests that fiscal space methodologies that are based on long-term debt levels may not necessarily be the best approach for many most low- and lower-middle-income countries, as they may not have the same access to markets as middle
BOX 4
and high-income advanced countries. Thus, for many developing countries, fiscal space may be better assessed on a forward-looking basis, based on a medium-term expenditure framework (MTEF). For example, additional fiscal space may be created when tax revenues exceed expectations or when there is underspending or savings generated from a particular program.
In general, advanced economies tend to have greater space than emerging markets given that their financing is more secure, in part due to their credibility and institutional strength (IMF, 2018). While fiscal space at a global level improved prior to the 2008 financial crisis, for many emerging markets, this trend has now reversed, with many countries observing a narrowing of their fiscal space. Furthermore, for energy-exporting emerging market and developing economies, fiscal space tends to narrow during periods of a decline in global oil prices (Kose et al. 2017).
The timing of the use of fiscal space should be based on a number of considerations, including the state of the economy and the accompanying required fiscal measures. Given the forward-looking nature of fiscal space, its impact is dependent on future policies and the economic situation that a country faces. For instance, in the event of a severe negative shock, a large fiscal consolidation could actually reduce fiscal space by dampening growth. Alternatively, if implemented appropriately, a temporary fiscal stimulus could create fiscal space and improve debt prospects in the medium term. On the other hand, a poorly executed stimulus could deplete fiscal space and exert upward pressure on financing costs.
In the case of Malaysia, a broad assessment suggests that there is limited fiscal space to respond to shocks. This is mainly due to two factors: first, the relatively high level of federal government debt (52.7 percent of GDP in 2019). The rising trend of government-guaranteed liabilities and other payment obligations also poses additional risk to government debt. Second, the persistent decline in revenue since 2012 limits the government’s resources to stimulate economic activity, particularly in the event of a shock to the economy.
39MALAYSIA ECONOMIC MONITOR | JUNE 2020
PART ONE - Recent Economic Developments and Outlook
39

Economic outlook
Current projections suggest that the global recession will be the deepest in eight decades, despite the unprecedented policy response around the world. The baseline forecast projects a -5.2 percent contraction in global GDP in 2020 (2019e: 2.4 percent) due to the severe disruptions in domestic demand and supply, trade and finance in most economies (see Figure 28). Aggregate activity in advanced economies and EMDEs are forecast to decline by -7.0 percent and -2.5 percent respectively this year (2019e: 1.6 and 3.5 percent), with all major economies experiencing deep recessions before a gradual recovery later in the year. Assuming that the pandemic does not result in any lasting damage to financial systems, global growth is projected to rebound to 4.2 percent in 2021 as the pandemic eases and large-scale policy support gains traction, but the recovery will be insufficient to bring output back to its previously expected levels over the forecast period.
Growth in the East Asia and Pacific region is expected to decline sharply in 2020, reaching its lowest rate since 1967. In aggregate, regional growth is projected to slow to 0.5 percent (2019e: 5.9 percent) this year, reflecting the impact of economically-costly movement restrictions, tighter financing conditions, and a steep decline in exports (see Figure 29). Growth in China is forecast to slow to 1 percent this year (2019e: 6.1 percent), its lowest rate since 1976. Economic activity in the rest of the region is projected to contract by -1.2 percent, its worst rate since the East Asian financial crisis in 1998. These baseline projections assume that a severe contraction in Q1 2020 in China and in Q2 2020 in the rest of the region will be followed by a gradual and sustained recovery back to around trend levels by late 2021, aided by the sizable fiscal and monetary policy support measures implemented by major economies and the normalization of global trade and financial conditions.
FIGURE 28Global GDP is projected to contract sharply in 2020...
FIGURE 29...with growth in Developing EAP projected at its lowest rate since 1967
Source: World Bank staff projections Source: World Bank staff projections
The global economy is projected to experience a major contraction this year
GDP, y/y, Percentage
Latest Estimates (June 2020)
Previous Estimates (January 2020)
World AdvancedEconomies
Emerging Market & Developing
Economies
-8
-6
-4
-2
0
2
4
6
8
2019e 2020f 2021f 2019e 2020f 2021f 2019e 2020f 2021f
GDP, y/y, Percentage
Latest Estimates (June 2020)
Previous Estimates (January 2020)
DevelopingEAP
Developing EAPexcl. China
China
-2
-1
0
1
2
3
4
5
6
7
8
2019e 2020f 2021f 2019e 2020f 2021f 2019e 2020f 2021f
40 MALAYSIA ECONOMIC MONITOR | JUNE 2020
PART ONE - Recent Economic Developments and Outlook

Malaysia’s economy is expected to contract sharply in 2020Malaysia’s GDP is projected to decline by 3.1 percent this year (2019: 4.3 percent), mainly due to a sharp slowdown in economic activity in H1 2020 (see Table 4). At present, the near-term outlook for Malaysia’s economy is unusually uncertain, and is highly conditional upon the underlying assumptions regarding the evolution of the COVID-19 shock and the magnitude of its economic disruptions at home and abroad, as well as the scale and efficacy of government policy responses to stem the pandemic and to mitigate its impacts. The baseline projection envisions a pronounced output contraction of around 10 percent in Q2 2020, reflecting the significant impact of economic disruptions due to the MCO and CMCO imposed during the quarter, followed by a partial recovery in the second half of the year as the outbreak eases and mobility restrictions are gradually lifted. It also assumes that the spread of pandemic is broadly contained at the global level and that the sizable fiscal and monetary policy support measures implemented by major economies limit potential structural damage to global economic activity and financial systems.
While household expenditure and business investment spending are expected to increase gradually, they will likely remain subdued over the near term due to heightened uncertainty. Private
consumption and aggregate investment growth are projected to fall sharply to 1.2 and -4.9 percent respectively in 2020 (2019: 7.6 and -2.1 percent), mainly reflecting the impact of the stringent movement control measures on household spending and business operations in H1 2020. Despite large-scale support from the Prihatin Rakyat and Penjana stimulus packages, private sector activity is likely to recover modestly in H2 2020 following the gradual scaling back of restrictions on social interactions, remaining below its pre-crisis level for the foreseeable future. In particular, with lingering uncertainty regarding the pandemic, continued caution and social distancing practices are likely to persist for some time, reducing mobility and the discretionary consumption that arises from daily face-to-face interactions. Facing precipitous losses of income as a result of the lockdowns and of increased uncertainty regarding prospects for future income and profits, many households and firms will also strive to increase precautionary savings, to strengthen balance sheets and to delay investment plans over the forecast period.
With the longer projected path of recovery for global trade, the recovery of the external sector is likely to be relatively slow. Malaysia’s exports and imports are projected to contract sharply this year, by -12.9 and
TABLE 4GDP growth and contribution to growth
Source: World Bank staff calculations and projections
Annual Growth, y/y, Percentage Contribution to Annual GDP Growth (Percentage Point)
2018 2019f 2020f 2021f 2018 2019f 2020f 2021f
GDP 4.7 4.3 -3.1 6.9
Domestic Demand (including stocks) 4.3 4.0 0.1 6.3 Domestic Demand
(including stocks) 4.0 3.7 0.1 6.0
Private Consumption 8.0 7.6 1.2 7.7 Private Consumption 4.4 4.3 0.7 4.8
Public Consumption 3.3 2.0 2.4 2.3 Public Consumption 0.4 0.3 0.3 0.3
Gross Fixed Capital Formation 1.4 -2.1 -4.9 4.0 Gross Fixed Capital
Formation 0.3 -0.5 -1.1 0.9
Change in Stocks -1.2 -0.4 0.0 0.0
External Demand External Demand
Exports of Goods & Services 2.2 -1.1 -12.9 5.7 Exports of Goods
& Services 1.5 -0.8 -8.3 3.3
Imports of Goods & Services 1.3 -2.3 -9.2 4.6 Imports of Goods
& Services 0.8 -1.4 -5.2 2.4
41MALAYSIA ECONOMIC MONITOR | JUNE 2020
PART ONE - Recent Economic Developments and Outlook

-9.2 percent (2019: -1.1 and -2.3 percent) due to the dramatic collapse in global trade activity. The extent of the downturn is magnified by particularly severe disruptions to trade in services, especially tourism, and to global value chains due to delayed shipments of key intermediate inputs. The gradual recovery of Malaysia’s external sector is expected to begin in H2 2020, as the impact of the pandemic fades and restrictions on international borders are gradually lifted, and to gather more momentum next year as global trade activity normalizes from very low levels.
News-based measures of economic sentiment suggest that Malaysia’s longer-term growth prospects could be lower than the consensus economic forecast (see Figure 30 and Figure 31). Complementary news-based measures of economic sentiment have been on par with the monthly consensus forecast for GDP in 2020. However, the sentiment-adjusted growth forecast for 2021 has been tracking below the consensus forecasts since January, with a latest estimate of 5.6 percent.
The public health crisis could also weigh on Malaysia’s potential output and longer-term growth prospects as it transitions to high-income country status within this decade. Beyond its short-term impact, steep recessions triggered by the crisis
FIGURE 30News-based measures of economic sentiment is on par with the consensus GDP forecast for 2020...
FIGURE 31...but points towards a lower growth prospects next year compared to those of professional forecasters
Source: World Bank staff calculations and projections Source: World Bank staff calculations and projections
could potentially have long-term consequences on growth through multiple channels, including long-lasting changes in consumer spending patterns and persistently weak confidence accompanied by a buildup of savings, low investment and reduced aggregate demand and supply; the erosion of human capital associated with prolonged unemployment and widespread learning disruptions; and a retreat of global trade and supply linkages.
Consumer price inflation will likely be muted into the near-term future due to the marked decline in global oil prices and overall demand since March. The average inflation rate is expected to be close to 0 percent this year (2019: 0.7 percent), primarily reflecting the steep fall in oil prices and the broad-based weaknesses in demand at home and abroad. The deflationary impact of the pandemic will be partially offset by supply disruptions affecting specific goods and services and by the ringgit’s depreciation, both of which have exerted some upward pressures on overall prices. CPI inflation is projected to normalize in 2021 as demand recovers and the direct negative impact of the decline in gasoline prices drops out of the annual comparison. Underlying inflation will be broadly contained over the forecast horizon due to the lack of immediate domestic cost pressures arising from softer growth prospects and labor market conditions.
GDP, 2020f, y/y, Percentage
Sentiment-adjusted Forecast Mean Consensus Forecast
-4
-2
0
2
4
01/2
020
02/2
020
03/2
020
04/2
020
05/2
020
-3.3%
GDP, 2021f, y/y, Percentage
Sentiment-adjusted Forecast Mean Consensus Forecast
3
4
5
6
7
01/2
020
02/2
020
03/2
020
04/2
020
05/2
020
-5.6%
-6.1%
42 MALAYSIA ECONOMIC MONITOR | JUNE 2020
PART ONE - Recent Economic Developments and Outlook

43MALAYSIA ECONOMIC MONITOR | JUNE 2020

Malaysia’s growth dividend from increasing the determinants of productivityUsing the Long-Term Growth Model (LTGM), this box simulates the boost to long-term growth in Malaysia by increasing total factor productivity (TFP) growth. The LTGM is based on the celebrated Solow-Swan growth model, adapted to developing/emerging economies. The LTGM-TFP extension assesses a country’s potential for improving TFP growth depending on its determinants – innovation, education, market efficiency, infrastructure, and institutions. As physical capital accumulates, the return on investment diminishes, making productivity more important for sustainable long-term growth. The simulations assume that other growth drivers besides TFP growth (e.g. investment) continue at their historical trend rates.
In the business-as-usual baseline, Malaysia’s potential GDP growth is initially at around 4.5 percent, but slows over the next 30 years to 2 percent as the country converges with high-income economies (see Figure 32). TFP growth is assumed to
decrease gradually from 0.9 percent to 0.6 percent over the next three decades (see Figure 33). In the baseline, TFP growth declines from the historical growth rate of 0.9 percent in 2019 (the median over the period 1985-2014) to 0.6 percent over the period of 2020-2050. For this simulation, we assumed that the TFP overall determinant index (the composite index of the sub-indexes for the five categories of the determinants) increases at the historical trend of the last 10 years. We applied the average annual change in the overall determinant index over 2009-2018 to the period of 2019-2050 (see Figure 34).
As expected, Malaysia’s TFP determinants are currently lower than in most high-income economies. The current levels of the TFP determinants for Malaysia in 2019, as a percentile among high-income economies, are as follows: innovation is at the 31st percentile; education is at the 19th percentile; market efficiency is at the 49th percentile; infrastructure
BOX 5
FIGURE 32Malaysia’s growth is projected to decline over the long-term...
FIGURE 33...but would be affected by reforms to boost productivity
Source: World Bank staff calculations using data from the World Development Indicators
Source: World Bank staff calculations using data from the World Development Indicators
Malaysia’s GDP Growth Under Three Different Reform Scenarios,Percentage
Historical (3-year Moving Average)BaselineWeak ReformModerate ReformStrong Reform
0
2
4
6
8
2000 2010 2020 2030 2040 2050
Malaysia’s TFP Growth Under Three Different Reform Scenarios,Percentage
Historical (3-year Moving Average)BaselineWeak ReformModerate ReformStrong Reform
-2
-1
0
1
2
3
2000 2020 2030 2040 20502010
44 MALAYSIA ECONOMIC MONITOR | JUNE 2020
PART ONE - Recent Economic Developments and Outlook
44

FIGURE 34The largest productivity impact comes from a strong reform scenario
Source: World Bank staff calculations using data from the World Development Indicators
Source: Loayza N. and S. Pennings. (2018). The Long-Term Growth Model. http://www.worldbank.org/LTGM. Specifically, this box draws upon Kim, Young Eun; Loayza, Norman V. 2019. “Productivity Growth: Patterns and Determinants across the World.” Policy Research Working Paper, No. WPS 8852. Washington, D.C.: The World Bank.
Note: Baseline assumptions for other growth drivers are: (i) a labor share of 50 percent, (ii) an initial capital-to-output ratio of 2.25, (iii) public and private investment of 6 and 18 percent of GDP (respectively), (iv) human capital growth declining from 0.6 to 0.1 percent by 2050, (v) TFP growth declining from 0.9 to 0.6 percent by 2050, (viii) population growth declining from 1.3 to 0.4 percent by 2050.
at the 23rd percentile; and institutions are at the 14th percentile.
We model three scenarios for TFP growth with different levels of reform by targeting the 25th (Spain), 50th (France), and 75th (Sweden) percentiles of the TFP determinant sub-indexes among high-income countries. This results in a reduction of GDP growth by 0.12 percentage points (ppts) and increments
of 0.02 ppts and 0.42 ppts, respectively, as compared to the business-as-usual baseline (see Figure 32).
The simulations show that strong reforms are required to increase TFP growth above the historical rate and to mitigate the decrease of GDP growth for the next decades. The scenario of weak reform results in a reduction of GDP growth by 0.12ppts over 2020-2050 as compared to the business-as-usual baseline. However, the scenario of moderate reform, which is almost the same as the baseline, results in a boost in GDP growth by 0.02 ppts; and that of strong reform leads to a boost in GDP growth by 0.42 ppts on average over 2020-2050 as compared to the business-as-usual baseline.
40
50
60
70
80
90
100
110
120
130
2000 2010 2020 2030 2040 2050
Malaysia’s TFP Determinants Index Under Three Different Reform Scenarios, Percentage
Historical (3-year Moving Average)BaselineWeak ReformModerate ReformStrong Reform
45MALAYSIA ECONOMIC MONITOR | JUNE 2020
PART ONE - Recent Economic Developments and Outlook
45

FIGURE 35The share of workers with savings duration beyond four months is low...
FIGURE 36...and most cash transfer recipients indicated that they need additional support
Source: DOSM Source: DOSM
The COVID-19 pandemic has exacerbated downside risks to growthIn terms of external risk, the pandemic has amplified Malaysia’s existing downside risks (see Figure 37). Responding to the global pandemic, many countries have taken bold measures to restrict movements in order to mitigate the spread of the virus, leading to domestic demand and supply shocks. As a result, many advanced and developing economies are facing the prospects of sharp economic downturn into the near-term future. This has led to a marked decline in external and trade, thus affecting Malaysia’s external demand. While many economies are now tentatively easing their movement restrictions, given the uncertainty over the duration and outcome of the pandemic, risks related to a resurgence of the pandemic and its negative spillovers to the economy remain. Furthermore, with rising uncertainty and risk aversion, this could lead to heightened volatility in domestic financial markets and to higher portfolio outflows.
The occurrence of a second wave of the pandemic in Malaysia could also mandate the re-imposition of movement restrictions. With the economy gradually transitioning into a recovery phase, and in the absence of more effective and lasting solutions to the pandemic (such as a vaccine and better treatment
and screening facilities), the possibility of a resurgence remains, which could see the re-imposition of the MCO. Such a re-imposition would once again entail the temporary closures of businesses operations and stricter movement restrictions, which could exert further pressures, particularly on vulnerable households, SMEs, and micro-entrepreneurs which have already been severely impacted by the initial MCO. Moreover, it would also push back any post-COVID-19 recovery efforts, including by delaying the implementation of large infrastructure projects, such as the East Coast Rail Link, and the withholding of investments essential to revive the economy.
The modest roll-out rate of key programs in the Prihatin package could lead to a slower-than-expected pace of economic recovery. As of 5 June 2020, the amount approved for the wage subsidy program under the Prihatin package is RM4 billion, affecting a total of 2.3 million workers, which is far less than its initial allocation of RM13.8 billion. Similarly, only RM42.9 million has been approved out of the RM10 billion allocation under the 6-month freeze for EPF contributions for employers.11 This could imply that many businesses, particularly SMEs, may be in
11 Progress report on the Prihatin package, 9 June 2020 (https://www.treasury.gov.my/pdf/Teks-Ucapan-Laporan-LAKSANA-PRIHATIN-Kelapan.pdf).
Share of Respondents (by Employment Type) with Savings Duration Above4 Months, Percentage
10
17
23
33
41
0
5
10
15
20
25
30
35
40
45
Self-employed
PrivateEmployee
Employer GLCs Multinationals(MNCs)
Share of Respondents Who Need Additional BPN Beyond MCO Phase 1,Percentage
Yes82%
No18%
46 MALAYSIA ECONOMIC MONITOR | JUNE 2020
PART ONE - Recent Economic Developments and Outlook

distress and potentially the unemployment rate could be higher than anticipated. Meanwhile, initiatives which were intended to alleviate the burden of households and subsequently prop-up domestic demand such as EPF Account 2 withdrawal, has only seen RM1.94 billion been disbursed out of the initial RM40 billion allocation.
With the outcome of the pandemic remaining uncertain, there is a risk that it will lead to an increase in the number of vulnerable households. While necessary to curb the virus outbreak, the implementation of the MCO has weighed heavily on domestic demand, jeopardizing the sustainability of many businesses and leading to higher unemployment. A survey conducted by DOSM showed that the share of workers with savings able to support consumption beyond four months is fairly low (see Figure 35). Earlier findings have also shown that a large share of working adults, especially those earning below RM4,000, feel under pressure given their current financial position.12 A follow-up survey indicated that while respondents believed that the BPN was helpful in enabling them to manage the first round of the MCO, 82 percent of them indicated that they would need additional BPN if the MCO were extended (see Figure 36).13 The time that it would take between the implementation of MCO and a return to pre-pandemic capacity would also mean that some households, particularly those in the lower-income would need more financial support for an extended period of time.
Particularly with the existing statutory limits, any further narrowing of fiscal policy space could constrain the government’s ability to provide adequate economic support, especially in the near term. In the near term, the marked reduction in fiscal space presents a potential risk should the economic impact of the COVID-19 crisis be greater than anticipated, thus requiring additional fiscal injections, particularly to provide support to vulnerable households and businesses. To a large extent, this constraint is driven by the declining trend in government revenue collection observed since 2012 and by the high proportion of locked-in expenditures, exacerbated in recent months by the decline in crude oil prices. Adding to the complexity, existing laws and statutory requirements limit the ability of the government to raise additional funds. This includes the statutory public debt limit of 55 percent of GDP and the terms of the Loan (Local) Act, which prohibit the use of government borrowing to fund operational expenditure.
Uncertainty regarding the domestic political landscape could further complicate the government’s capability to implement key economic policies in the near term. The collapse of the Pakatan Harapan government in February 2020 and its replacement with a new coalition, known as Perikatan Nasional, took place just as the COVID-19 pandemic began to spread. Ongoing speculation regarding the future of the coalition have led to increased uncertainty surrounding Malaysia’s political stability and the overall direction of economic policies. In the near term, this includes the ability to table the necessary legislative amendments and emergency bills in parliament, and subsequently to gain sufficient support from the Dewan Rakyat (lower house) to pass them. In addition, the lack of instruments that outline the government’s medium and long-term development plans may contribute to the lack of clarity regarding overall economic policies.
12 See December 2019 Malaysia Economic Monitor, “Making Ends Meet”.13 Special Survey on Effects of COVID-19 on Economy and Individual (Round 2).
On the upside, the containment of the spread of COVID-19 and the various government support measures could be more effective than anticipated. This would lead to higher pent-up consumer demand, greater investor confidence, and consequently a more robust recovery in domestic economic activity in H2 2020. A breakthrough in the development of effective treatments and vaccines against the new disease is also possible, which would bring an earlier-than-expected end to the global pandemic, contributing to a more sustained resumption in global economic activity, a sharper recovery in international trade and investment, as well as stabilization of global financial and commodity markets, with considerable positive spillovers to Malaysia’s economy.
Additional fiscal injections, particularly to provide support to vulnerable households and businesses, may be required should the economic impact of the COVID-19 crisis be greater than anticipated
47MALAYSIA ECONOMIC MONITOR | JUNE 2020
PART ONE - Recent Economic Developments and Outlook

FIGURE 37The COVID-19 pandemic has exacerbated downside risks to growth
Source: World Bank staff elaboration
Policies in the near term should focus on protecting the most vulnerableThe COVID-19 pandemic is an unprecedented situation that requires governments everywhere to implement large-scale and unconventional policy responses. Unlike previous economic and financial crises, the pandemic is not only global, it is also multidimensional in nature, manifesting in the form of both health and socio-economic crises. The immediate public policy response involved massive movement restrictions and lockdowns to help contain the spread of the pandemic. While the outcome of the pandemic remains uncertain, and until more effective means to manage it emerge (such as the discovery of a vaccine), the economy can be expected to operate under a set of new norms, characterized by social distancing, temporary movement restrictions to contain local outbreaks, and limited international travel. With the crisis severely affecting both private demand and supply, it falls upon the government to do most of the heavy lifting to revive the economy in the near term. In
particular, the policy focus in the near term should be on ensuring that the capacity of health system is not overburdened and on protecting the welfare of the most vulnerable, particularly lower-income households, SMEs and micro-entrepreneurs.
It is important that the implementation of the CMCO and RMCO strikes a balance between the need to open the economy and to ensure that the risk of a resurgence of the COVID-19 pandemic is contained. The implementation of the initial MCO from 18 March until 4 May was instrumental in flattening Malaysia’s pandemic curve and reducing the burden on the healthcare system. It also paved the way for the implementation of the CMCO and later the RMCO, which enable a greater number of businesses in a range of sectors to re-open under specific operating guidelines. Nonetheless, the gradual resumption of economic activity must be accompanied by the active
Narrowing fiscal policy spaceFurther narrowing of fiscal space given existing statutory limits could restrict further economic recovery measures
Domestic political uncertaintyOngoing political uncertainty could complicate policy implementation and dampen investor confidence
Upside risk on effective containmentEffective containment and pent-up demand could lead to faster-than-expected recovery in consumer confidence
Higher number of vulnerable householdsThe pandemic’s outcome remains uncertain; hence there is a risk that the number of vulnerable households could increase
Modest roll-out of response packagesAn insufficient economic response by the government could lead to a slower-than-expected pace of recovery
Second waveThe occurrence of a second wave could lead to the return of stricter movement restrictions
Global economic downturnMany advanced and developing economies are facing the prospect of a sharp economic downturn, affecting Malaysia’s external demand
Risks to growth
1
2
3
45
6
7
48 MALAYSIA ECONOMIC MONITOR | JUNE 2020
PART ONE - Recent Economic Developments and Outlook

enforcement of new standard operating procedures, such as establishing adequate social distancing practices and ensuring a safe and hygienic working environment. Compliance with these guidelines is crucial to reduce the potential risk of a rise in new cases that could lead to another round of restrictions, preventing an economic recovery and exacerbating the downturn.
In the near term, fiscal strategy could be re-prioritized towards the creation of additional policy space through legislative amendments. This would entail temporarily suspending fiscal consolidation efforts of working towards a balanced budget, and instead increasing the government’s fiscal space. The additional fiscal space would provide brief breathing room for the government to determine pre-emptive measures in the event of a greater-than-expected impact from MCO, or another round of movement restriction. Without legislative changes, the government’s immediate options are limited to either reallocating some operating expenditure items or increasing its reliance on non-tax revenue from GLCs such as Petronas.
An emergency bill which is expected to be tabled in Parliament in July 2020 would be an opportunity to address existing statutory limits, which would provide the government with greater flexibility to meet its financial needs during and immediately following the pandemic. Currently, the government’s options to finance additional fiscal measures are constrained by various legislations which can only be resolved by parliamentary vote. The scheduled special emergency COVID-19 bill presents an opportunity to address this, in line with similar recent procedures in many other countries (see Table 5). The proposed measures include raising the statutory debt limit from the current 55 percent of GDP and temporarily permitting the use of government borrowing to fund operating expenditures.14 This would allow debt to be used to facilitate the payment of cash subsidies and transfers and to meet the healthcare sector’s immediate operational needs, including boosting its COVID-19 testing capacity. The emergency bill could also cover the expansion of certain assistance programs, including the Employment Insurance Scheme Act (2017).
14 This would pertain the Government Funding Act and Statute Paper 76 of 2006 which puts a statutory debt limit of 55 percent of GDP and the Loan (Local) Act 1959 which states that operating expenditure must be financed by revenue (not borrowing).
TABLE 5Selected countries COVID-19 related Acts/Bills
Source: IMF, various news outlets
Countries Act and Summary of Fiscal Responses
Australia (March 2020)
Coronavirus Economic Response Package Omnibus Act 2020Economic support package of AUD259 billion represents fiscal and balance sheet support across the forward estimates of 13.3 percent of GDP. Direct fiscal measures are equivalent to around 6.9 percent of GDP.
Canada (March 2020)
COVID-19 Emergency Response ActKey tax and spending measures amounting to CAD205 billion (9.8 percent of GDP).
Germany (March 2020)
COVID-19 Insolvency Suspension Act and Economic Stabilization Fund ActIn addition to running down accumulated reserves, the federal government adopted a supplementary budget of EUR156 billion (4.9 percent of GDP). The government also expanded the volume and access to public guarantees for firms of different sizes and credit insurers.
New Zealand (March 2020)
Government Budget AnnouncementThe government announced fiscal measures amounting to a total of NZD62.1 billion (20.7 percent of GDP) through FY2023-24, of which NZD20.5 billion will be disbursed by end-June.
Singapore (April 2020)
COVID-19 (Temporary Measures) Act 2020The government have announced four packages of measures amounting to a total stimulus of SGD63.7 billion (13 percent of GDP).
Philippines (March 2020)
The Bayanihan to Heal as One ActThe government launched a PHP 595.6 billion fiscal package (about 3.1 percent of 2019 GDP) for vulnerable individuals and groups.
49MALAYSIA ECONOMIC MONITOR | JUNE 2020
PART ONE - Recent Economic Developments and Outlook

15 DOSM’s Special Survey on Effects of COVID-19 on Economy and Individual, Special Survey on Effects of COVID-19 on Economy and Companies/ Business/ Firms.16 See December 2019 Malaysia Economic Monitor, “Making Ends Meet”.
Medium-term measures should prepare the economy for recovery in a ‘new normal’ environmentOver the medium term, policies should aim to prepare the economy for post-COVID-19 recovery, in the context of a “new normal” environment. While the COVID-19 crisis has to some extent resulted in the temporary suspension of measures mandated by Malaysia’s medium and long-term economic plans, it presents opportunities to accelerate a number of reforms (see Figure 38). Looking ahead, policies in the medium term should have four broad areas of focus. They should facilitate the intensive rebuilding of fiscal buffers and ensure spending efficiency; the re-invigoration of foreign and domestic private investment; the upskilling and redeployment of human capital, and the promotion of the digitalization agenda including bridging the digital divide.
On the fiscal front, the focus should be on aggressively restoring fiscal buffers through the introduction of a more progressive tax framework and on improving spending efficiency. The pandemic serves as a strong reminder of the necessity for fiscal policy space as a buffer to deal with shocks to the economy. With the fiscal deficit widening and the possibility of debt level increasing, this further underscores the need to strengthen fiscal policy in the medium term. To date, the government’s fiscal space has been constrained by declining revenue collection and by the high proportion of locked-in expenditures,16
limiting the ability for fiscal policy to balance the distribution of income. The various exemptions granted in the Penjana plan, albeit temporary, not only represent foregone revenue but may further limit fiscal policy as a
redistributive tool. Addressing the persistent decline in revenue collection could be achieved by increasing the progressivity of the personal income tax framework, including through revisiting the current system of reliefs and exemptions. In addition, the current capital gains tax framework could be expanded to other forms of progressive tax, such as a wealth tax. On the expenditure side, improved spending efficiency could be achieved through better targeting and reducing fragmentation within the various households’ social protection programs (see Part 2, Surviving the Storm). This would also include moving away from the current blanket fuel subsidy framework which is regressive towards a more targeted transportation allowance for the lower income households regardless of vehicle ownership. In addition, spending efficiency could also be done through the reallocation of spending items in key social sectors, such as education and health.
It is important to enhance Malaysia’s investment competitiveness to seize new opportunities from shifting global trade and investment trends in the wake of COVID-19. Shifting trade and investment preferences and changing forms of international production in light of the pandemic are reshaping international trade and investment, presenting opportunities for Malaysia to reinvigorate private investment in support of its near-term economic recovery and longer-term economic transformation. To strengthen Malaysia’s competitiveness in attracting new quality investments, the government should look to establish clear and measurable investment policy
The quantum and delivery of financial assistance to vulnerable households in the various fiscal packages should be increased. While the measures included in the Prihatin package could help lessen the near-term disruptions on vulnerable households and businesses, the package implicitly assumes that the crisis will pass within a few months. Given that it could take at least another 1-2 years for the economy to return to pre-COVID-19 conditions, additional financial
assistance may be needed to protect the welfare of vulnerable households and the sustainability of firms. Initial data and survey results have suggested that the impact of the pandemic thus far has been substantial.15
The time lapse between the start of the movement restrictions and the time when the economy return to its pre-pandemic capacity would suggest that a longer period of assistance is needed.
50 MALAYSIA ECONOMIC MONITOR | JUNE 2020
PART ONE - Recent Economic Developments and Outlook

goals to anchor investment strategies and monitoring of outcomes; build a more targeted, automated and transparent incentives system to stimulate desirable activities; and create a more cohesive national investment promotion framework to facilitate proactive investor services across the investment lifecycle.
The government should also focus on reinforcing efforts to upskill human capital and potentially to redeploy it to selected sectors. The crisis has seen many workers, particularly those working in hard-hit sectors such as tourism and retail, losing their jobs or being placed on unpaid leave. Conversely, certain sectors, such as health services and logistics, have seen an increase in demand as a result of the crisis. The pandemic has accelerated changes to the nature of jobs and work, with increased demand for digitization and automation. Hence, there is a need to reskill and retrain the workforce to ensure that firms can perform and produce at least at pre-crisis levels.
The pandemic also creates opportunities for Malaysia to boost its digital economy agenda, including through measures to bridge the digital divide. The crisis has increased the appeal of
e-commerce and the need for Malaysia to expedite digital adoption, especially by SMEs and micro-entrepreneurs. To adjust to the pandemic, various initiatives have been developed to increase the online involvement of small businesses through participation in e-bazaars and centralized online sales platforms. The government has also responded by introducing various initiatives in the Penjana plan to encourage digital adoption among SMEs and microentrepreneurs, and to stimulate online consumption. Beyond these initiatives, policies and measures to provide support to peripheral sectors such as logistical services could also help to boost e-commerce in Malaysia. It is also equally important to close the digital divide across spatial and demographic dimensions. As more transactions are conducted online, it is essential to intensify efforts to improve digital literacy, including for those in older age groups who may not necessarily be familiar with the use of digital technologies. Similarly, with school closures following the MCO, CMCO and RMCO, there has been a dramatic shift to online learning. Therefore, it is important that children, especially those living in the rural areas and those from lower-income households have the adequate hardware and stable internet access to ensure that they are not left behind.
FIGURE 38Policy considerations in the short, medium and long term
Source: World Bank staff elaboration
Short-term:Protecting vulnerablehouseholds and businesses
Medium-term:Preparing the economyunder a ‘new normal’
Containing the risk of another outbreak.
Creating temporary fiscal space through legislative amendments.
Increasing the quantum and delivery of financial assistance to the vulnerable in the Prihatin package.
Restoring fiscal buffers through a more progressive tax framework, improving spending efficiency, and reducing fragmentation in social protection programs.
Upskilling and retraining of the workforce.
Enhancing competitiveness in attracting quality investments.
Accelerating the digital agenda and bridging the digital divide.
Long-term:Laying the foundationsfor transition tohigh-income status
Implementing structural reforms in six broad areas including raising female labor force participation, improving human capital, boosting competitiveness, creating quality jobs, modernizing institutions, and promoting inclusion.
51MALAYSIA ECONOMIC MONITOR | JUNE 2020
PART ONE - Recent Economic Developments and Outlook

52 MALAYSIA ECONOMIC MONITOR | JUNE 2020

In the long run, focus should be geared towards laying the foundations for the transition to a high-income economy
The pandemic provides a window of opportunity for Malaysia to enhance its social protection system
Despite the COVID-19 crisis, Malaysia is expected to transition from an upper middle-income economy to a high-income economy within this decade. However, the transition to high-income country status also raises several questions related to both the quality of growth and its sustainability. Compared to other countries that achieved high-income status in recent years, Malaysia is growing more slowly; it has a lower share of employment at high skill levels; and it has greater inequality. In particular, there is a growing sense among Malaysia’s middle-class that the proceeds of growth have not been equitably shared between the richest and the poorest, and that increases in the cost of living are outstripping incomes, especially in urban areas. Reflecting this, a different set of policies and institutions will be needed to facilitate the achievement of more knowledge-intensive and productivity-driven growth.
Finally, the COVID-19 crisis has emphasized the importance of having a strong social protection system that provides minimum protection to all those in need. Strengthening the existing social protection system will entail the implementation of both short and long-term policies. While Malaysia already has a social assistance and social insurance system and implements a range of labor market programs, to date, the impact on poverty and inequality has been fairly modest. In addition, social protection largely fails to play an active part in wider economic policy. In the near term, the focus would necessarily be on support to the COVID-19 recovery efforts through continued cash transfers to the B40. There are also short- and medium-term opportunities for deepening social assistance, improving the delivery of social protection programs, and promoting a jobs recovery.
The 12th Malaysia Plan and the Shared Prosperity Vision 2030 serve as an important vehicle for Malaysia to outline key policies to facilitate this transition. At Malaysia’s current state of development, adding labor and capital is no longer sufficient to maintain growth, let alone to ensure that its benefits are shared equitably. To compete with other high-income countries, Malaysia needs to use its resources more efficiently, to produce new ideas and products, to expand markets, and to increase productivity (see Box 5 for a discussion on the importance of boosting the determinants of productivity). Reforms in six broad areas, including raising female labor force participation; improving human capital; boosting competitiveness; creating well-paying, high quality jobs; modernizing institutions; and promoting inclusion are vital for Malaysia to transition successfully to high-income status and to sustain equitable growth beyond the transition.
Over the long term, policies could support the development of an enhanced social protection system appropriate to the “new normal” that combines a guaranteed minimum of protection for all those in need with a broader and more progressive tax framework. This enhanced social protection system could encompass initiatives that provide adequate old-age income protection for all Malaysians; measures to better coordinate design, targeting approaches, information systems, and front-end service delivery of social assistance programs, and to promote productive employment; and the strengthening of flagship labor market programs that have been credibly evaluated. These issues and policies are explored in greater detail in Part 2 of this edition of the MEM, titled Surviving the Storm.
53MALAYSIA ECONOMIC MONITOR | JUNE 2020
PART ONE - Recent Economic Developments and Outlook

Strengthening public trust through effective communication, especially in times of crisisThe global shock of the COVID-19 pandemic has brought attention to the importance of public trust not only in responding to public health emergencies but also in reopening economies and planning for economic recovery. Governments, international organizations like the World Health Organization (WHO), and experts in medicine and public health rely on public trust to gain cooperation for health advisories, movement control orders or community quarantines, and social distancing. On the economic front, businesses and workers will need to trust that authorities are in control of the situation to restart enterprises that were put on hold. As such, high levels of collaboration between governments and citizens are essential to defeating the pandemic.17
Trust between citizens and institutions is sustained by effective communication characterized by transparency and openness, both during the health crisis and in the reopening of markets and economies. Good communication engages with numerous audiences, tailored to their respective contexts, via suitable channels and outputs, and over a period of time. An effective and strategic communication is one that is integrated with operations, with the ability to explain and expound upon policies and their future path, playing a key part in any successful outcome.
Surveys of trust in government institutions, private sector, and of other citizens illustrate important differences in levels of interpersonal and institutional trust across countries18. The Ipsos Global Advisor Trustworthiness Monitor, launched early 2020, revealed that professions such as doctors, scientists and teachers enjoy high levels of trust among Malaysians (see Figure 39). The Ipsos Malaysia study further revealed that public services, such as education, healthcare/medicine, and the armed forces tend to receive comparatively higher trust ratings from the public. Another survey, the YouGov COVID-19 perception tracker of government handling of the crisis, sees Malaysia second only to Vietnam in terms of citizen confidence with which the COVID-19 crisis is being handled (see Figure 40).
Ensuring widespread compliance with public health measures requires trust in those who are in authority to instruct their populations to engage in social distancing. The daily health updates provided by Dr. Noor Hisham Abdullah, the Director-General of the Ministry of Health, Malaysia exemplifies a key communications strategy by the government to position the top public health official to strengthen public trust and support for government instructions and enforcement. The daily updates, which utilize a
BOX 6
17 We’re all in this together: Collective action and trust in the age of coronavirus. (2020, April 20). Retrieved from https://blogs.worldbank.org/governance/were-all-together-collective-action-and-trust-age-coronavirus 18 Do low-trust societies do better in a pandemic? (2020, May 2). Retrieved May 20, 2020, from https://www.economist.com/europe/2020/05/02/do-low-trust-societies-do-better-in-a-pandemic
54 MALAYSIA ECONOMIC MONITOR | JUNE 2020
PART ONE - Recent Economic Developments and Outlook
54

FIGURE 39Citizens have the greatest trust in teachers and doctors...
FIGURE 40...and Malaysia scores well on measures of handling the COVID-19 crisis
Source: Ipsos survey Source: YouGov survey
19 http://documents.worldbank.org/curated/en/355311588754029852/pdf/An-Opportunity-to-Build-Legitimacy-and-Trust-in-Public-Institutions-in-the-Time-of-COVID-19.pdf
methodical and evidence-led approach, have garnered a popular following and raised public compliance levels to the MCO imposed nationwide to curb the pandemic. This had shown signs of early success and had enabled the government to allow the economy to reopen with the announcement of a Conditional MCO in early May, increasing the focus on facilitating economic recovery, while maintaining public health as an urgent priority.
The same principles of trust apply to manage economic crises. A 2018 study explored how increasing government accountability to citizens across Asia would in turn increase policy capacity to respond to an economic crisis (Yap 2018). Evidence from the study shows that “the dynamic exchange between government and citizens underlie the successful rehabilitation of the Asian economies (from the 1997/98 Asian Financial Crisis)” and that when “government demonstrates accountability to its citizens; this spurs citizens’ support for the government and cooperation on policies, which directly broaden the government’s policy capacity to facilitate economic recovery or success”. The study cites the experience of Singapore which adopted clear, transparent, and consultatory approaches in dealing with the crisis. Their citizens responded by providing further political and economic support. When Singapore presented
its budget statement in February 1998, there was an acknowledgement that the financial crisis was not fully over, and the country had to deal with much economic uncertainty. The government expressed commitment to “keep in close touch with the private sector” regarding economic developments.
With trust, the ability of public officials to restore confidence will also increase. One well-known example was during the eurozone crisis. In July 2012, the eurozone was on the verge of collapse. Speaking at a bankers’ forum in London was then-President of the European Central Bank Mario Draghi who pledged to do “whatever it takes” to preserve the Euro. This statement resonated across the European markets and led to calmer conditions and subsequently helped to restore financial confidence (Stankova 2019).
In this crisis, as in others before it, there is an opportunity to build trust in bureaucracies and in the capability of the public service to protect the citizenry and quickly steer the country to economic recovery.19 While building trust takes time, features of transparency, open communication, and increased government accountability can bring governments closer to solutions and, more importantly, to citizens.
Trust Levels Based on Profession Among Citizens of Malaysia, Percentage, 2020
0 25 50 75 100
Teachers
Doctors
Scientists
Armed Forces
Religious Leaders
Judges
Police
Lawyers
TV News Readers
Pollsters
Civil Servants
Bankers
Business Leaders
Journalists
Ordinary People
Ad Executives
Government Ministers
Politicians
Perceptions of Government Handling of COVID-19, Score for SelectedCountries, 2020
20
40
60
80
100
11/03/2020 11/04/2020 11/05/2020
Indonesia
Philippines
Malaysia
Singapore
Taiwan (China)
USA
UK
Vietnam
55MALAYSIA ECONOMIC MONITOR | JUNE 2020
PART ONE - Recent Economic Developments and Outlook
55

PART TWO
Surviving the Storm
56 MALAYSIA ECONOMIC MONITOR | JUNE 2020

57MALAYSIA ECONOMIC MONITOR | JUNE 2020

The COVID-19 pandemic and changing world of work require an enhanced social protection system
Surviving the storm
The COVID-19 pandemic and the associated economic slowdown underscore the need to better protect individuals and households in Malaysia, both during the recovery period from the crisis and into the medium- and long-term future. As Malaysia bears the impact of the COVID-19 pandemic, it faces a battle to defend the welfare and livelihoods of its people, especially those in the bottom 40 percent household income bracket (the B40). The government has announced a series economic support packages and plans, with at least two of these focusing on supporting Malaysians who risk falling through the cracks, including street vendors, micro-entrepreneurs, artists and other informal workers. While these proactive measures will afford at-risk Malaysians some relief, it is an opportune moment to reconsider the country’s overall social protection strategy, not only during the recovery from the COVID-19 pandemic, but into the medium- and long-term future. The crisis is expected to accelerate major changes around the world, ushering in what has been described as a “new normal.”
To survive the storm and thrive in the “new normal,” Malaysia needs an enhanced social protection system that provides minimum protection appropriate to all those in need and is underpinned by a mixture of public policy measures on both the expenditure and revenue sides. Ideally, an enhanced social protection system would provide a guaranteed minimum of protection to all those in need at its core, set at adequate benefit levels and regardless of specific work arrangements. In addition, it would incentivize work, be responsive to changing circumstances, and be fiscally sustainable. In line with Malaysia’s Shared Prosperity Vision 2030, the emphasis could be on supporting the B40 (as well as the poor, the economically vulnerable, women, and other target groups mentioned in the Vision). A guiding principle could be progressive universalism, which implies gradually expanding coverage of risk-sharing instruments to meet higher societal expectations in line with the prevailing fiscal
space, and giving priority to those most in need. Beyond the core guaranteed minimum, additional layers of incentivized, nudged or purely voluntary protection would be needed. The development of an enhanced social protection system would imply a strong role for the government and additional fiscal expenditures. In 2018, Malaysia spent 1.0 percent of GDP on non-contributory social assistance programs, which is less than most upper middle-income countries (see below). However, even gradual expansion of fiscal expenditures may be challenging in the context of the downward trend in government revenues and the fiscal shock of the COVID-19 pandemic. Thus, it would require policy measures on the revenue side, such as the introduction of a broader and more progressive tax framework.
The realization of an enhanced social protection system will entail the implementation of both short- and long-term policies and measures. To date, the impact of Malaysia’s social protection system on poverty and inequality has been fairly modest. In addition, social protection has largely failed to play an active part in wider economic policy. In the near term, the focus would necessarily be on providing support to the COVID-19 relief and recovery efforts by deepening social assistance for the B40, improving the delivery of social protection programs, and promoting a jobs recovery. Over the medium and long term, policies appropriate to the “new normal” could be strengthened and revamped to move toward a guaranteed minimum of protection to all those in need and a broader and more progressive tax framework. The enhanced social protection system could encompass (i) initiatives that provide adequate old-age income protection for all Malaysians through increased coverage and adequacy of the EPF and the introduction of a modest, broadly targeted social pension; (ii) measures to deepen social assistance for the B40 through better coordination of program design, targeting approaches, information systems, and front-end service delivery, and the promotion of productive employment; and (iii) the
58 MALAYSIA ECONOMIC MONITOR | JUNE 2020
PART TWO - Surviving the Storm

FIGURE 41Malaysia implements various social protection programs
Stylized Overview of Malaysia’s Social Protection System
Source: Adapted from World Bank (2015)
strengthening of flagship labor market programs that have been credibly evaluated and the discontinuation of others.
Typically, a social protection system encompasses social assistance, social insurance and active labor market programs (ALMPs). Non-contributory social assistance programs (also known as safety net programs) include cash transfers, school feeding and targeted food assistance; contributory social insurance programs encompass old-age and disability pensions and unemployment insurance; and ALMPs include skills-building initiatives, employment services and wage subsidies. Together, these programs can facilitate the achievement of three objectives: First, they can increase resilience for the vulnerable by providing protection against the impact of declines in well-being from shocks. The COVID-19 pandemic shows how volatility increases in an integrated world, thus necessitating adaptive social protection. Second, they can provide equity for the poor through protection against destitution and the promotion of equality of opportunity. Third, they can create opportunities for all through measures to build human capital in children and adults and to enable men and women to engage in more productive employment (World Bank 2012). Increasingly, a well-performing social protection system
is seen as a tool not only of social policy but also an important part of wider economic policy.
In Malaysia, a number of different ministries and agencies are responsible for implementing social protection programs, under the coordination of the Malaysia Social Protection Council (MySPC). The implementation of social protection programs faces inherent challenges related to coherence across agencies and programs. In this context, the establishment of MySPC to provide overall coordination has been an important development. Though the effectiveness of MySPC is still largely untested and Malaysia is yet to have a national social protection masterplan which might describe both a comprehensive package of social protection measures and a roadmap for realizing this package, MySPC might enable Malaysia to move from a set of social protection programs (see Figure 41) toward a more coherent social protection system. In this context, MySPC has the potential to become the main body to streamline and enhance all elements of Malaysia’s social protection system and broader social policies.
Over time, Malaysia’s social assistance programs have experienced a considerable degree of evolution and proliferation. The country’s largest social
Publicly financed skills-building programs by
various ministries
Levy-financed skills-building programs by HRDF
Employment services by JobsMalaysia and others
Malaysians@Work wage subsidies (announced)
• • •
Labor market programs
Inst
itut
iona
l co
ord
inat
ion
by
MyS
PC
Del
iver
y sy
stem
s fo
r as
sess
men
t, e
nro
llmen
t, p
rovi
sio
n, m
oni
tori
ng
Social assistance programs
BSH/BR1M unconditional cash transfers
Core social assistance benefits and services by JKM
Education assistance
Fuel and other subsidies
Zakat
• • •
Private sector retirement savings by EPF
Public sector pensions
Voluntary, supplementary pensions savings
arrangements
Disability, survivorship, and unemployment insurance by SOCSO
• • •
Social insurance programs
59MALAYSIA ECONOMIC MONITOR | JUNE 2020
PART TWO - Surviving the Storm

20 The precise eligibility requirements and benefit labels of BSH/BR1M have varied over time. The main differences between BR1M and BSH are that BSH place no conditionalities on household size and gives an additional benefit of RM120 to each child in the household, up to four children.
assistance program is the Bantuan Sara Hidup (BSH), or Cost of Living Aid Program. In 2018, this replaced the Bantuan Rakyat 1 Malaysia (BR1M), or 1Malaysia People’s Aid Program, which was introduced in 2012. Both BSH and its precursor are unconditional cash transfer programs implemented by the Inland Revenue Board (Lembaga Hasil Dalam Negeri Malaysia, LHDN). These programs were designed roughly to benefit the B40 (more precisely, households with monthly incomes of less than RM4,000). For its analysis of Malaysia’s social assistance programs, this report relies on data from the 2016 Household Income and Basic Amenities Survey, conducted by the Department of Statistics Malaysia (DOSM). Therefore, it uses data pertaining to BR1M as a close but imperfect proxy for its successor program, BSH (henceforth referred to as BSH/BR1M).20 In addition to BSH/BR1M, a core set of social assistance benefits and welfare services are provided by the Department of Social Welfare (Jabatan Kebajikan Masyarakat, JKM), under the Ministry of Women, Family and Community Development. In total, the JKM implements ten programs intended to benefit specific vulnerable groups, including the elderly, children, the disabled, and the chronically ill. In addition, there are a number of education-related social assistance programs to provide support in cash or in kind to students in school and to expand educational opportunities for students through the provision of scholarships. Finally, Malaysia’s social assistance system includes fuel and other subsidies in a range of different forms; institutionalized zakat (an Islamic welfare scheme); programs implemented by states; and a number of other relevant support measures. Overall, 75.7 percent of all Malaysians are covered by some form of social assistance.
Social insurance systems include the Employees Provident Fund (EPF), the Social Security Organization (SOCSO), the Public Service Pension Fund (Kumpulan Wang Persaraan, KWAP), the Armed Forces Board Fund (Lembaga Tabung Angkatan Tentera, LTAT), and Private Retirement Schemes (PRS). Insurance companies also offer a number of occupational pension schemes and retirement products. The EPF is Malaysia’s mandatory private-sector retirement savings scheme, while KWAP provides pensions to civil servants, and LTAT provides pensions to the members of the armed forces. The PRS are voluntary, supplementary pensions savings arrangements. SOCSO provides benefits for people with disabilities, survivorship and some health procedures. It also manages the employment insurance system (EIS), introduced in 2018.
Malaysia has made a significant commitment to programs to support the labor market. In Malaysia, ALMPs involve a wide range of ministries and agencies, with up to 11 ministries involved in the implementation of skills-building initiatives, including the Ministry of Youth and Sports, the Ministry of Human Resources, and the Ministry of Higher Education. Various other ministries also provide smaller-scale skills-building programs, including the Ministry of Agriculture and Food Industries and the Ministry of Rural Development. In addition, the EIS covers training fees and training allowances for its own set of training providers. While most ALMPs are focused on jobless workers or new labor market entrants, the Human Resource Development Fund (HRDF) financed by a mandatory levy of 1 percent of wages on employers in many sectors brokers training and up-skilling interventions to key industries. Employment services are implemented by both JobsMalaysia and the EIS, and there was also an announcement of a wage subsidy program known as Malaysians@Work aimed at encouraging firms to hire vulnerable groups, including youth and women, and to retain them for a minimum of two years. As announced, the program would aim to create jobs for people who need them the most for a substantial period of time while still having an exit strategy.
Malaysia has implemented a series of additional social protection measures as part of the Prihatin package and Penjana plan to protect livelihoods in the advent of the COVID-19 crisis, encompassing social assistance, social insurance, and labor market responses. Responses have included one-off cash transfers, reduced contribution rates to and early withdrawal modalities from EPF accounts, time-bound wage subsidies, and incentives for training. The intention has been to protect incomes and consumption and to encourage firms’ labor retention during a time when mobility restrictions were implemented, and many businesses were unable to operate. In fact, the social protection programs in general and more specifically the one-off cash transfer program targeted to B40 and M40 households, Bantuan Prihatin Nasional (BPN), and the wage subsidy program were the most significant budgetary items in the Prihatin package. Combined expenditures for these two programs is expected to amount to RM15.9 billion or about 1.1 percent of GDP (see Box 7 for more details on Malaysia’s social protection response to COVID-19).
60 MALAYSIA ECONOMIC MONITOR | JUNE 2020
PART TWO - Surviving the Storm

Malaysia’s social protection response to COVID-19Social assistance, social insurance and labor market measures have formed an integral part of Malaysia’s Prihatin package and Penjana plan in response to COVID-19. Measures that have been announced included one-off cash transfers, reduced contribution rates to and early withdrawal modalities from EPF savings, wage subsidies, and incentives for training.
The one-off cash transfer, BPN, was announced as part of the Prihatin package and targeted to B40 and M40 individuals and households with the benefit amount varying based on household income. More specifically, RM1,600 was disbursed to 4 million households with income less than RM4,000 per month, RM1,000 was disbursed to 1.1 million households with income between RM4,000 and RM8,000 per month, RM800 was disbursed to 3 million single individuals aged 21 and older with income less than RM2,000 per month, and RM500 was disbursed to 400,000 single individuals aged 21 and older with income between RM2,000 and RM4,000 per month. The transfers to single individuals and households were not exclusive, with single individuals with income below the eligibility threshold being eligible to receive the transfer while their households also remained eligible. Other than the BPN, a series of smaller one-off cash transfers were also made in response to COVID-19, including transfers of RM500 each to civil servants and e-hailing drivers and transfers of RM200 each to all students enrolled in institutes of higher learning. Moreover, BSH beneficiaries received an additional RM100 while all Malaysians were eligible to receive a deposit of RM50 into their mobile wallets.
Reduced contribution rates to and early withdrawal modalities from EPF accounts formed an important part of the response to COVID-19. EPF members were given the option to reduce their contribution from 11 percent to 7 percent of wages from April to December 2020. In parallel, members were also allowed to withdraw RM500 per month from April 2020 to March 2021. These measures were intended to increase households’ liquidity during the crisis, and are estimated to amount to RM50 billion.
Wage subsidies targeted to workers earning RM4,000 or less per month were introduced as part of the Prihatin package to encourage employee retention, initially for three months. The value of the wage subsidies was tied to the number of workers in a company. RM600 per worker per month was allocated for firms with more than
BOX 7
200 employees, RM800 per worker was allocated for firms with 76 to 200 employees, and RM1,200 per worker was allocated for firms with less than 76 employees. Firms with more than 76 employees had to demonstrate that their revenues had fallen by at least half since January 2020, and employers were disallowed from laying off workers covered by wage subsidies and from reducing their wages. The subsidy was only available to companies registered prior to 2020 and limited to Malaysian employees, and was expected to benefit 4.8 million workers.
The government has also incentivized training. Measures introduced to this end as part of the initial support packages included double tax deductions on expenses incurred on approved tourism-related training, an allocation of RM50 million to subsidize short courses in digital and certain other skills, and an increase in the training cost that is claimable through the EIS from RM4,000 to RM6,000 for affected sectors, as well as a daily training allowance of RM30 to EIS trainees.
As the economy moves toward recovery, Malaysia will be implementing further measures as part of the Penjana plan that are largely focused on the retention and hiring of workers. Announced on June 5 2020, the Penjana plan extends the existing wage subsidy program for a further three months. In addition, the plan supports firms with a reduced work week and introduces a separate wage subsidy program for the hiring of youth and unemployed workers. It also aims to strengthen job matching efforts particularly through SOCSO’s job portal and allocates funds for the training of unemployed workers including youth and gig economy workers. Moreover, it offers incentives to encourage flexible work arrangements including working from home.
Some measures related to social assistance and social insurance programs were also announced as part of the Penjana plan. Working parents are entitled to one-off e-vouchers of RM800 per household for mobile childcare services. In addition, a public transport subsidy offers discounted unlimited monthly travel passes costing RM30 for the main public transport lines in Kuala Lumpur from mid-June to December 2020. Further, a one-off transfer of RM300 will be made to specific vulnerable groups, primarily the disabled and single mothers. Finally, modest matching grants totaling of up to RM50 million will be given to gig economy platforms that make EPF and SOCSO contributions.
61MALAYSIA ECONOMIC MONITOR | JUNE 2020
PART TWO - Surviving the Storm
61

Malaysia’s official poverty line income (PLI) is extraordinarily low and fails to provide practical guidance to social protection policies to ensure the well-being of Malaysians. The PLI is calculated based on the basic requirements for a household to live healthily and actively and has remained essentially unchanged in real terms since 1977, representing the same standards of deprivation that were applied more than 40 years ago, despite Malaysia’s remarkable economic transformation and growing prosperity. Most upper middle and high-income countries apply higher national absolute poverty lines than Malaysia. Ravallion (2019) estimates that a more appropriate absolute poverty line for Malaysia would be approximately USD12 in 2011 purchasing power parity (PPP) terms, which translates to approximately RM20 per person per day. For a family of four, that would amount to RM2,433 per month, nearly triple the official PLI which currently averages RM980.21 If Malaysia’s poverty line were set at that level, its poverty rate would have stood at 16.0 percent in 2016. This is close to the rate of 16.9 percent that could be derived using the OECD’s 50 percent of median income benchmark, and also in the 15–20 percent range suggested by Alston (2019).
With technological advances and other factors, changes to the nature of work are challenging the effectiveness of social protection programs based on what have until recently been regarded as “standard” employment relationships (see Box 8). This “standard” employment relationship, characterized by long-term, full-time wage employment with a single employer, provides the basis for many risk-sharing policies, especially those related to income security. However, in developing and emerging economies, a large proportion of the labor force has never been involved in these kinds of “standard” relationships. This has been exacerbated by the changing nature of work, with disruptive technologies increasingly eroding existing sources of “standard” employment. In addition, societal expectations regarding the provision and quality of public services and facilities have increased with changing demographics and a rapidly aging society. As a result, in many developed and emerging countries, a greater proportion of the labor force engages in part-time work, self-employment, the gig economy, and zero-hour contracts. In many countries, the coverage of traditional risk-sharing policies has been either stagnating or declining (World Bank 2019b). Early research suggest that these trends have accelerated as a result of the COVID-19 crisis, which can be seen as a temporary shock that may have lasting consequences for the world of work (KPMG 2020).
Various indicators demonstrate a high prevalence of non-standard forms of work in Malaysia, even before the current crisis. According to the Labour Force Survey, the share of own-account workers (that is, self-employed persons without paid employees) as a proportion of all workers is relatively high and growing, increasing from 16.4 percent in 2010 to 18.1 percent in 2019. The increase in own-account work has been particularly pronounced in the case of women, among whom the share of own-account workers increased from 11.6 percent in 2010 to 17.7 percent in 2019 (see Figure 42). Because women’s labor force participation rose during the 2010–2019 period and new forms of work such as those in the gig economy emerged, it is likely that the change in the share of self-employed women was at least partly due to the choices made by women entering or re-entering the labor market, such as a desire for more flexible work arrangements (World Bank 2019a). At the same time, out-of-necessity self-employment may trap women in a relatively unproductive and unprotected situation. That is particularly the case because most of Malaysia’s social insurance is either directly tied to an employer-employee relationship, or in practice has much higher coverage for employees than for own-account workers (see below).
In Malaysia, while the majority of the labor force is covered by some form of social insurance, this coverage is still far from universal. In 2019, 11.9 percent of the labor force consisted of civil servants or members of the armed forces, while 48.9 percent contributed to the EPF. This implies that 39.2 percent of the labor force were uncovered by EPF or pension arrangements for civil servants or members of the armed forces (see Figure 43). Although workers contributing to the EPF are technically “covered” by social insurance arrangements, many move in and out of standard employment and thus, for many of them, their contribution histories tend to be inadequate to support their retirement (see below).22
Malaysia’s population is aging rapidly, placing additional pressure on its social protection system, particularly on those components predicated on “standard” employment relationships. By international convention, an aging society is defined as one in which seven percent or more of the population is aged 65 and above, while an aged society has more than 14 percent of the population aged 65 and above. Malaysia will pass the threshold that defines an aging society in 2020 (see Figure 44). Henceforth, Malaysia is expected to continue to age rapidly and projected
21 In Malaysia, household-specific PLIs are constructed based on the consumption needs of the household using detailed information about the age and gender composition of the household. The PLIs are also adjusted for consumer price differences across states, federal territories, and rural/urban areas of residence. Thus, the RM 980 cited is a national average, with higher or lower PLIs applying to different household types and different locations.22 With 7.56 million contributors in 2019, coverage of SOCSO is slightly lower than that of EPF which had 7.63 million active members in the fourth quarter of 2019.
62 MALAYSIA ECONOMIC MONITOR | JUNE 2020
PART TWO - Surviving the Storm

FIGURE 42Own-account work has been on the rise, particularly among women...
FIGURE 44Malaysia will soon be aging rapidly...
FIGURE 43...and coverage by retirement savings institutions remains far from complete
FIGURE 45...transitioning from an aging to an aged society in only 24 years
Source: World Bank (2019a)
Source: World Bank staff calculations using DOSM data
Source: World Bank staff calculations using EPF, KWAP and DOSM data
Source: World Bank staff calculations using DOSM dataNote: Data for Australia, France and United Kingdom are truncated as these were aging societies even before 1950.
to become an aged society by 2044. Malaysia’s aging process will also occur at a much faster pace than in some European countries and Australia, and at a similar speed to that in other countries in East Asia and the Pacific, such as Japan, Singapore, Thailand and China (see Figure 45). Thus, old-age income protection and
care services for older persons will become increasingly crucial. Due to the already incomplete coverage of Malaysia’s social insurance schemes and the changing nature of work, it will also become ever more crucial to at least partly delink this support from “standard” employment relationships.
Share of Own-Account Workers among All Workers, Percentage
Men Women
0
5
10
15
20
25
2010 2011 2012 2013 2014 2015 2016 2017 2018 2019
Coverage by Retirement Savings Institutions, 2019, Percentage of LaborForce
48.9%
11.9%
39.2%
EPF Contributors
Civil Servants and Armed Forces
Uncovered
Population Aged 65 and Above,Percentage
0
1,000
2,000
3,000
4,000
5,000
6,000
7,000
0
2
4
6
8
10
12
14
16
1970
1980
1990
2000
2010
2020
2030
2040
Population Aged 65 and Above,Number (’000)
Population Age 65+ Percent of Population Age 65+
Transition from Aging to Aged Status, Years
2418
2326
20
1718
24
2213
31
3026
21
1950
1960
1970
1980
2000
1990
2010
2020
2040
2060
2030
2050
2070
United Kingdom
France
Australia
Japan
Republic of Korea
China
Turkey
Thailand
Singapore
Vietnam
Malaysia
Indonesia
Brunei Darussalam
Myanmar
Philippines
Cambodia
Lao PDR
63MALAYSIA ECONOMIC MONITOR | JUNE 2020
PART TWO - Surviving the Storm
63

Social protection in a changing world of workA stylized framework for an enhanced social protection system with four layers of protection, adapted from World Bank (2019b) is illustrated in Figure 46. The first (innermost) layer of protection would largely comprise non-contributory social assistance programs, such as cash transfer programs. In addition, this layer would include any publicly-financed premium subsidies for those who voluntarily participate in contributory social insurance schemes, such as matching grants for voluntary pension contributions. In principle, the guaranteed minimum of this layer would be available to all those in need, set at adequate benefit levels. It would incentivize work, be responsive to changing circumstances, and be fiscally sustainable. The second layer would consist of mandatory contributory social insurance programs, such as mandatory old-age pension schemes. It should not fully depend on participation in formal wage employment and should be combined with the guaranteed minimum to ensure
BOX 8
an adequate level of protection for everyone. In the third and fourth (outer) layers, additional insurance is achievable through voluntary savings schemes supported by government incentives and “nudges,” backed by purely unincentivized savings for those who can afford it, respectively.
Malaysia can learn from other countries in East Asia and beyond that are also trying to adapt to the changing nature of work to determine a path to develop an enhanced social protection system. China’s social pension system, which blurs the distinction between contributory and noncontributory social protection, is a case in point, with public financing for the average retiree of around 80 percent. As detailed in World Bank (2019b), China struggled for years to expand coverage of its contributory pension system to workers outside formal employment, with coverage of rural workers stalled at around 55 million.
64 MALAYSIA ECONOMIC MONITOR | JUNE 2020
PART TWO - Surviving the Storm
64

FIGURE 46Governments should aspire to offer a comprehensive package of social protection
Source: Adapted from World Bank (2019b)
Informed by extensive subnational pilot programs, the government designed a scheme for informal workers that was implemented at a national level for rural workers in late 2009 and for urban workers in 2011. The system involves a voluntary scheme according to which informal workers make modest annual contributions to individual accounts. This contribution is matched at a rate of 30 percent by the government. After 15 years of contributions, the worker is entitled to a basic pension benefit at age 60. With the introduction of this system, the increase in pension coverage has been impressive. Currently, around 360 million informal workers contribute to the plan, with around 150 million older persons receiving payments.
Labor policies may also be structured as risk-sharing policies. Just like the policy package to provide income security, a comprehensive labor policy package would have a publicly financed, guaranteed minimum level of protection at its core, with supplementary
outer layers of mandated, nudged, and fully voluntary segments. The core guaranteed minimum protection would address the rarest shocks, the largest losses, and the problems with the greatest social externalities. Ideally, this protection would be available to everyone in need, regardless of specific work arrangements. At its heart would be ALMPs. Beyond the core guaranteed minimum, additional layers would be needed. These additional layers would recognize the limits of minimum protection that labor policies can guarantees, especially in terms of fiscal sustainability. For instance, they might encompass some aspects of labor regulations or profit-sharing arrangements between workers and firms.
Incentivized and privately �nanced(”Nudge”)
Mandated and individually �nanced
Guaranteedminimum
Purely �nancedfrom generalexpenditures
Resilience Equity Opportunity
Purely voluntary and privately �nanced
Stylized Framework for an Enhanced Social Protection System Attuned to the Changing World
65MALAYSIA ECONOMIC MONITOR | JUNE 2020
PART TWO - Surviving the Storm
65

FIGURE 47Malaysia’s social assistance spending is low compared to other countries...
FIGURE 48...and until around 2014 spending on social assistance was overshadowed by subsidies
Source: MOF; World Bank ASPIRE Database Source: MOFNote: Projected for 2019, budgeted for 2020
The social assistance system does not yet provide a guaranteed minimum of protection to all those in needA high-performing social assistance system can provide a guaranteed minimum standard of living for all and improve the resilience of the vulnerable against income shocks, including those resulting from events such as the COVID-19 pandemic. The economic crisis resulting from the COVID-19 pandemic has had an adverse impact on incomes in Malaysia and worldwide, particularly among lower income groups. Thus, it emphasizes the need for a high-performing social assistance system. As detailed in World Bank (2018), in addition to impacts in areas as human capital outcomes, saving behavior or labor supply, core attributes of a high-performing social assistance system include a high rate of coverage of the most vulnerable population groups and a sufficient adequacy in terms of the transfer amount received by beneficiaries as a share of their total welfare. In addition, with limited fiscal resources, it is important to make sure that fiscal outlays are appropriate and sustainable. Finally, it is important that the beneficiary incidence of social assistance (as a yardstick of the share of beneficiaries that are in a certain income bracket) is progressive – that is, that those most in need benefit to the greatest extent from available resources.
Despite the proliferation of its programs, Malaysia’s expenditure on social assistance is relatively low compared to most upper middle-income countries. In 2018, Malaysia spent RM14.6 billion on social assistance programs, which amounts to about 1.0 percent of GDP. This means its spending is lower than the average not just for upper middle-income countries, but across all country income groups. Spending is particularly low when compared with Malaysia’s upper middle-income peers or more aspirational high-income countries. On average, upper middle-income and high-income countries spend 1.6 percent and 2.0 percent of GDP respectively on social assistance programs (see Figure 47).
Until around 2014, Malaysia’s spending on social assistance was overshadowed by spending on often untargeted subsidies, particularly fuel subsidies. Malaysia has had subsidies of different forms since independence, originally introduced along with rural development programs as production subsidies. World Bank (2015) documents that in 2013, fuel subsidies accounted for 2.4 percent of GDP, 9.3 percent of total government spending, and 54 percent of total social
Share of GDP, Percentage
Malaysia(2016)
LowIncome
LowerMiddleIncome
UpperMiddleIncome
HighIncome
1.0
1.4 1.51.6
2.0
0
0.5
1.0
1.5
2.0
2.5
Expenditures, RM Million
0
5,000
10,000
15,000
20,000
25,000
30,000
35,000
2010
2011
2012
2013
2014
2015
2016
2017
2018
2019
2020
Subsidies Social Assistance
66 MALAYSIA ECONOMIC MONITOR | JUNE 2020
PART TWO - Surviving the Storm

protection spending. As in other countries, Malaysia’s fuel subsidies have been highly regressive. In 2009, around 60 percent of these subsidies benefited the richest 40 percent of households and only 3 percent reached the poorest 10 percent. In spite of efforts of subsidy rationalization, a de facto suspension of fuel subsidies during the COVID-19 crisis due the fall in global crude prices, and a relative declined in the absolute spending on subsidies since around 2014, spending on subsidies has generally remained substantial (see Figure 48).
A large share of the overall population and an even larger share of the bottom 20 (B20) are covered by some form of social assistance.23 In Malaysia, 75.7 percent of all individuals and 98.2 percent of those in the B20 as measured by the distribution of income per capita are covered by some form of social assistance. Both numbers are higher than the averages across country income groups, including among upper middle-income and high-income countries. In upper middle-income countries, an average of 45.0 percent of all individuals and 65.9 percent of the B20 are covered by social assistance, while in high-income countries coverage averages 43.9 percent of all individuals and 66.2 percent of the B20 (see Figure 49).
The beneficiary incidence of social assistance is progressive, with the bulk of social assistance being channeled to the B20, though to a lesser extent than in the average upper middle-income or high-income country. Figure 50 shows that at 25.9 percent, about a quarter of all beneficiaries of Malaysia’s social assistance programs are in the B20. This is a much higher share than the 11.1 percent of beneficiaries that are in the top 20 (T20). That said, at 29.3 percent and 30.2 percent respectively, the share of social assistance beneficiaries in the B20 in the average upper middle-income and high-income country is higher than in Malaysia. Thus, the beneficiary incidence is generally less progressive in Malaysia than the average for upper middle and high-income countries. This suggests that there is still potential to transform these programs so that those most in need make up an even higher share of all social assistance beneficiaries.
The typical level and adequacy of social assistance programs is low, with average monthly social transfers amounting to RM34 per person for the B20. As a result of these relatively low benefit levels, social assistance programs alone are generally not sufficient to guarantee an adequate income. For the B20 receiving social assistance benefits, the average
FIGURE 49In Malaysia, the coverage of social assistance is high, especially among the B20...
FIGURE 50...and the beneficiary incidence of social assistance is progressive
Source: World Bank staff calculations using Household Income and Basic Amenities Survey (DOSM) and ASPIRE Database
Source: World Bank staff calculations using Household Income and Basic Amenities Survey (DOSM)
23 The level of social assistance in Malaysia is calculated using data from the 2016 Household Income and Basic Amenities Survey by the Department of Statistics Malaysia, using the ASPIRE Social Protection and Labor Program Classification by the World Bank (2018). Malaysia uses household measures of welfare. In this report, calculations are instead based on a per capita basis to ensure comparability with international social assistance data from the World Bank’s ASPIRE database. When the analysis is conducted at the household level, the results are qualitatively similar, revealing similar patterns in, for instance, the distribution of social assistance and other measures.
Malaysia LowIncome
LowerMiddleIncome
UpperMiddleIncome
HighIncome
Share of Households Receiving Social Assistance, Percentage
0
20
40
60
80
100
All B20
Malaysia LowIncome
LowerMiddleIncome
UpperMiddleIncome
HighIncome
Share of Bene�ciaries, Percentage
0
20
40
60
80
100
Third QuintileFirst Quintile
Fourth Quintile
Second Quintile
Fifth Quintile
67MALAYSIA ECONOMIC MONITOR | JUNE 2020
PART TWO - Surviving the Storm

FIGURE 51Social assistance benefits amount to a small share of per capita income...
FIGURE 52...resulting in modest impacts on poverty and inequality
Source: World Bank staff calculations using Household Income and Basic Amenities Survey (DOSM) and ASPIRE Database
Source: World Bank staff calculations using Household Income and Basic Amenities Survey (DOSM) and ASPIRE Database
24 There are large spatial price differences in Malaysia and adequacy as compared to the “living wage” might potentially be higher outside of Kuala Lumpur.
per capita income is RM435. Thus, the level of social assistance benefits as a share of per capita income amounts to 7.8 percent. This is a much lower level of adequacy than is the norm across all country groups, including upper middle-income and high-income countries. For these two groups, social assistance programs on average cover 13.0 percent and 21.2 percent of beneficiaries’ per capita income respectively (see Figure 51). In Malaysia, adequacy is also low among all beneficiaries, irrespective of their income. Overall, benefits amount to about 3.0 percent of average income, compared to an average of 5.6 percent for upper middle-income countries and 7.8 percent for high-income countries. In Malaysia, the general inadequacy of social assistance benefits is also evident from a comparison of average monthly transfers of RM34 per person for the B20 with the RM2,700 which Bank Negara Malaysia (2018) estimates is the monthly living wage for a single adult living in Kuala Lumpur in 2016.24
In Malaysia, social assistance programs have only a relatively modest impact on poverty. While the impact is broadly similar to what is typical for other upper middle-income countries, it falls well short of the average among high-income countries as a more aspirational comparison group. For the purposes of this report, a country’s poverty headcount is defined in terms of the size of the B20 before transfers. This poverty headcount differs from the one based on Malaysia’s PLI. However, it is not too far removed
from those that have been proposed as suitable for Malaysia by Ravallion (2019) and others and also greatly facilitates international comparisons. As depicted in Figure 52, Malaysia’s social assistance programs reduce the proportion of poor people by about 10.1 percent. This is a slightly higher impact than for the average upper middle-income country, but falls well short of the impact for the average high-income country as a more aspirational comparator. Malaysia’s social assistance programs also increase the incomes of those who remain poor after receiving transfers. In other words, they decrease the poverty gap. However, the reduction in the poverty gap of about 17.9 percent is lower than the average reduction for both upper middle-income and high-income countries.
Malaysia’s social assistance programs help to modestly reduce inequality. A comparison of the Gini index in per capita income before and after social assistance transfers shows a reduction of about 2.5 percent. This means that the impact of social assistance on inequality in Malaysia is higher than in the typical upper middle-income country but again considerably lower than in the average high-income country (see Figure 52).
The relatively modest poverty impact of Malaysia’s social assistance programs is attributable to both the low level of expenditure and the low adequacy. Figure 53 plots the coverage and adequacy of social
Adequacy of Social Assistance Bene�ts, Percentage
Malaysia LowIncome
LowerMiddleIncome
UpperMiddleIncome
HighIncome
All B20
0
5
10
15
20
25
30
35
40
Impacts on Poverty and Inequality, Percentage
Malaysia LowIncome
LowerMiddleIncome
UpperMiddleIncome
HighIncome
0
5
10
15
20
25
30
Inequality Reduction
Poverty HeadcountReduction (B20)
Poverty GapReduction (B20)
68 MALAYSIA ECONOMIC MONITOR | JUNE 2020
PART TWO - Surviving the Storm

25 The benefit-cost ratio is calculated by taking the sum of the difference between the pre-transfer B20 poverty threshold and the per capita income for each person in the B20 before and after receiving transfers from each program, and dividing it by the total amount spent on the program.
assistance programs among the B20 in Malaysia and different country income groups and the programs’ impact on the poverty gap (represented by the size of the circles). This figure confirms that while the coverage of Malaysia’s social assistance programs is high among the B20, adequacy is generally insufficient to achieve a reduction in the poverty gap similar to that of the average upper middle-income and high-income countries. With Malaysia implementing a range of different social assistance programs, Figure 53 also raises questions regarding the performance of these different programs. As a first element of an answer, Figure 54 shows that a relatively large share of the overall reduction in the poverty gap is due to Malaysia’s flagship BSH/BR1M program. At the same time, the various social assistance programs implemented by the JKM also have a notable impact on the aggregate poverty gap. In fact, if one considers the benefit-cost ratios (that is, the reduction in the aggregate poverty gap obtained for each RM 1 spent on the two types of programs), the JKM programs significantly outperform BSH/BR1M.25
In addition to cash-based social assistance, there is a need to address the increasing demand for non-cash support services, especially for older persons. Malaysia’s aged care sector faces many challenges, which are reinforced during the COVID-19 pandemic. First, the aged care industry is at its infancy. Even though civil society and the private sector have started
to respond to the acceleration of aging by participating in the provision and financing of aged care services, so far they have only done so on a limited scale. Second, both among public and private providers, there are significant opportunities to improve the content and quality of aged care services. The importance of established and enforced quality standards for both public and private care providers, including the capacity for isolation and quarantine, has become acutely apparent in the face of contagion and fatalities due to the COVID-19 virus amongst older persons in institutional care. Third, public financing is inadequate to meet increasing care needs of lower income households. Private sector providers responding to these households’ needs depend on limited grants from the government, zakat, or donations, but may also charge small fees to those able to pay (see Box 9 for a discussion on zakat as an important element of Malaysia’s social assistance system). Lastly, the provision of aged care and broader social protection services is constrained by significant human resource challenges. There is an acute need to develop a larger cadre of social and care workers and related professions. While proposed measures to strengthen the legal framework for social and care workers and for the provision of education facilities to qualify them are welcome, they are in need of accelerated implementation.
FIGURE 53The modest poverty impact of Malaysia’s social assistance programs is largely due to their low adequacy...
FIGURE 54...with the flagship BSH/BR1M program having a lower benefit-cost ratio than the programs implemented by JKM
Source: World Bank staff calculations using Household Income and Basic Amenities Survey (DOSM) and ASPIRE DatabaseNote: The size of the circles represents the reduction in the poverty gap.
Source: World Bank staff calculations using Household Income and Basic Amenities Survey (DOSM) and ASPIRE Database
Poverty Gap Reduction, Adequacy and Coverage of Social AssistanceBene�ts for B20, Percentage
0
5
10
15
20
25
30
35
40
0 20 40 60 80 100
Ad
equa
cy o
f B
ene�
ts
Coverage of Bene�ts
LowIncome
LowerMiddleIncome
UpperMiddleIncome
Malaysia
HighIncome
Poverty Gap Reduction, Percentage Benefit-Cost Ratio, RM
0
0.1
0.2
0.3
0.4
0.5
0.6
0
2
4
6
8
10
12
BSH/BR1M JKM
Poverty Gap Reduction (B20) Benefit-Cost Ratio
69MALAYSIA ECONOMIC MONITOR | JUNE 2020
PART TWO - Surviving the Storm

Zakat as an important element of Malaysia’s social protection systemZakat is an important component of Malaysia’s social assistance system, with disbursements exceeding those of JKM programs. Zakat refers to one of the five main pillars in Islam and technically means giving a portion of one’s private wealth or assets to deserving members of the community. In Malaysia, zakat falls under the jurisdiction of states. Assisted by the Department of Wakaf, Zakat and Haj (JAWHAR) in the Prime Minister’s Department, State Islamic Religious Councils (SIRCs) are responsible for collecting and distributing zakat, a function that is performed by the Islamic Religious Council in the Federal Territories. In 2018, the total value of zakat disbursed exceeded RM3 billion.
The amount of zakat that can be disbursed in a state depends on how much is collected (see Figure 55). In principle, the payment of zakat is compulsory for all Muslims, levied at a rate of 2.5 percent on most valuables and savings held for a full year if their total
value is in excess of the nisab, or the value of 85 grams of gold. In practice, zakat payments in Malaysia are made on a voluntary basis and are tax deductible. Figure 56 shows that the amount of zakat collected in each state in Peninsular Malaysia is positively associated with the sum of annual household income of the Bumiputera in the state, with a correlation coefficient of 0.86.26
However, this association is largely driven by the high zakat collection in Selangor and the Federal Territories. Without these, the correlation coefficient between the sum of household income and zakat collection is only 0.19.
There are eight categories of zakat beneficiaries, referred to as asnaf. These are the hardcore poor and destitute (faqir); the poor (masakin); zakat administrators (amil); converts to Islam or people who show an inclination toward Islam (mualaf); people who are oppressed (al-Riqab); people who have been declared bankrupt or who are heavily in debt (al-Gharimin);
BOX 9
FIGURE 55The amount of zakat that can be disbursed in a state depends on how much is collected...
FIGURE 56...which is moderately positively correlated with the income of Muslims in the state
Source: Islamic Religious Councils Source: World Bank staff calculations using Household Income and Basic Amenities Survey (DOSM) and State Islamic Religious Councils
26 In Peninsular Malaysia, Bumiputera are highly likely to be Malays, which make up the bulk of the Bumiputera there and are Muslim by definition. The situation is different East Malaysia.
Zakat Collected Zakat Disbursed
Amount of Zakat Collected and Disbursed, RM Million
0
100
200
300
400
500
600
700
800
900
Sara
wak
Sab
ah
Mel
aka
Pen
ang
Neg
eri S
emb
ilan
Pah
ang
Ked
ah
Tere
ngg
anu
Per
ak
Kel
anta
n
Per
lis
Joho
r
Fed
eral
Ter
rito
ries
Sela
ngo
r
Sum of Household Income and Amount of Zakat Collected, RM Million
Zak
at C
olle
cted
Sum of Household Income
Kelantan
FederalTerritories
Selangor
Johor
Kedah
Melaka
PahangPenang
Perak
Perlis
Terengganu
0
100
200
300
400
500
600
700
800
900
0 20,000 40,000 60,000 80,000 100,000
NegeriSembilan
70 MALAYSIA ECONOMIC MONITOR | JUNE 2020
PART TWO - Surviving the Storm
70

FIGURE 57Half of zakat is paid to poor and destitute beneficiaries...
FIGURE 58...but the amount of zakat disbursed in a state is not correlated with that state’s share of the B20
Source: State Islamic Religious CouncilsNote: Based on data from the Federal Territories, Selangor, Kelantan, Kedah, Penang, Pahang, Perak, Johor, Sabah, and Negeri Sembilan
Source: State Islamic Religious Councils
Share of Zakat Disbursements, Percentage
Fisabilillah29.5%
Masakin28.5%
Fakir20.5%
Amil10.6%
Muallaf4.6%
Gharimin3.6%
Al-Riqab2.5%
Ibnu Sabil0.1%
Share of B20, Percentage
0
100
200
300
400
500
600
700
800
900
0
5
10
15
20
Sab
ah
Sara
wak
Kel
anta
n
Ked
ah
Pera
k
Sela
ngo
r
Joho
r
Paha
ng
Ter
eng
gan
u
Pen
ang
Neg
eri S
emb
ilan
Mel
aka
Fed
eral
Ter
rito
ries
Perl
is
Zakat Disbursement, RM Million
Share of B20 Zakat Disbursed
people who perform activities to uphold, maintain, and promote Islam and Islamic teachings (fisabilillah); and travelers in need, as determined by Islamic law (ibnu sabil). Almost half of Malaysia’s zakat is disbursed to faqir and masakin (see Figure 57). The SIRCs proactively seek out these and other groups of beneficiaries. In addition, potential beneficiaries can declare themselves as asnaf, subject to verification by the SIRC. Since the amount of zakat disbursed is dependent on the amount collected by each state, there is no clear correlation between the share of B20 in a state and the amount of zakat disbursed (see Figure 58).
All SIRCs have announced their intention to conduct significant support programs in response to the COVID-19 pandemic. Support primarily consists of cash transfers, food aid, and advancement in zakat payments. The overall allocation made by the SIRCs amounts to RM171.84 million (Berita Harian 2020), with the highest allocation from the Federal Territories. Similar to regular zakat disbursements, the SIRCs’ response to the COVID-19 pandemic has emphasized the poor and destitute. Transfers per beneficiary (which can be either an individual or a household) are generally between RM100 and RM1,000.
71MALAYSIA ECONOMIC MONITOR | JUNE 2020
PART TWO - Surviving the Storm
71

72 MALAYSIA ECONOMIC MONITOR | JUNE 2020

FIGURE 59BSH/BR1M has consistently benefited around seven million one-person and multi-person households...
FIGURE 60...with expenditures increasing over time due to adjustments in benefit amounts
Source: MOF Economic Reports and Budget Speeches (various years).Note: The number of BSH/BR1M households and single individuals in 2017 is estimated based on the relevant shares in 2016 and the number of beneficiaries in 2017.
Source: MOF Economic Reports and Budget Speeches (various years).
While BSH/BR1M coverage is very high, the program lacks an explicit objectiveBy design, BSH/BR1M is a relatively broad program intended to cover all B40 households. The precise objective of BSH/BR1M has not been entirely static or explicit. Initially the program was introduced to alleviate the rising cost of living for low-income households and to soften the effects of fuel subsidy rationalization. Later, this scope was broadened to mitigate the impacts of the introduction of a good and services tax (GST) in 2015. Since then, conditions in Malaysia have changed: Fuel prices have plummeted due to the impact of the COVID-19 pandemic and the GST has been replaced by a sales and services tax (SST), with more zero-rated and exempted goods. Nevertheless, BSH/BR1M persists and has in fact temporarily supplemented by the even broader Bantuan Prihatin Nasional (BPN) program (see Box 7).
BSH/BR1M has consistently covered about seven million one-person and multi-person households, with expenditures on the program having gradually increased. Eligibility for BSH/BR1M is determined through a self-declaration process, with a series of cross-validation exercises between LHDN and various agencies. While precise eligibility requirements and benefits have changed over time, for the variety of BSH/BR1M analyzed in this report, households with
more than one person earning RM4,000 or less and households with one person earning RM2,000 or less were eligible to apply. The benefit amounts vary based on pre-transfer income. The highest level of benefit was RM1,050 for multiple person households earning less than RM1,000, while the lowest was RM400 for single person households earning less than RM2,000. In 2012, the year of its inception, BSH/BR1M benefited around 3.4 million households, with total expenditures of around RM1.8 billion. Since then, coverage has increased significantly, with BSH/BR1M having consistently benefited around seven million households since 2013. For instance, in 2018, 7.1 million households received BSH/BR1M, with total expenditure amounting to around RM6.4 billion. The increase in spending on BSH/BR1M over the years is due both to changes in the eligibility criteria and to the benefit level (see Figure 59 and Figure 60).
An assessment of the targeting performance of BSH/BR1M can draw on the concepts of inclusion and exclusion error. In the context of a program such as BSH/BR1M, inclusion error refers to the extent to which a program that targets the B40 also covers persons outside of the B40. This leads to a leakage of limited fiscal resources from those who are most at need to
Number of Bene�ciaries, Million
0
1
2
3
4
5
2012 2013 2014 2015 2016 2017 2018
Households Single Individuals
Annual Expenditures, RM Billion
0
1
2
3
4
5
6
7
2012 2013 2014 2015 2016 2017 2018
73MALAYSIA ECONOMIC MONITOR | JUNE 2020
PART TWO - Surviving the Storm

FIGURE 61In addition to most of the B40, many non-B40 are covered by BSH/BR1M...
FIGURE 62...while coverage of BSH/BR1M among the B40 varies substantially between states
Source: World Bank staff calculations using Household Income and Basic Amenities Survey (DOSM)
Source: World Bank staff calculations using Household Income and Basic Amenities Survey (DOSM)
those with higher incomes. Exclusion error refers to the extent to which members of the B40 do not receive BSH/BR1M benefits even though they are entitled to them. This has the most severe impact if it affects those in the lowest income deciles. An important caveat in assessing the targeting performance of BSH/BR1M is that the definition of a household according to the LHDN is different from that used for the DOSM surveys. While BSH/BR1M allows for more than one recipient in the same residence, these surveys are based on the concept of the “common kitchen.” As such, it is not possible to perfectly map program eligibility against available household survey data. Another difficulty in measuring the targeting performance of BSH/BR1M relates to the challenges associated with measuring informal income, which is exacerbated in this case by a lack of clarity regarding income sources that must be declared. Finally, it is recognized that the reference to B40 and non-B40 households to determine inclusion and exclusion error is a simplification compared to the precise eligibility criteria applied for BSH/BR1M.
While the coverage of BSH/BR1M is very high and progressive, there is also substantial inclusion error. BSH/BR1M covers 63.3 percent of the overall population, 88.5 percent of the B40 and 92.8 percent of the B20 (see Figure 61). This means that BSH/BR1M manages to cover the overwhelming majority of its intended beneficiaries, the B40. However, it also covers a large share of the non-B40. More specifically, about 46.4 percent of people outside of the B40 receive BSH/
BR1M. Similarly, while more BR1M benefits are received by the B40 than by the non-B40, a significant share of fiscal resources intended for the B40 are in fact received by those outside this group. About 59.9 percent of the funds disbursed through BSH/BR1M is received by the B40, while the remaining 40.1 percent is received by the non-B40.
In spite of the programs’ generally very high level of coverage among the B40, the exclusion error of BSH/BR1M is significant, especially in Putrajaya and Kuala Lumpur. As stated above, 88.5 percent of the B40 are covered by BSH/BR1M. This implies that a nontrivial 11.5 percent of the B40 do not receive BSH/BR1M. Using the national 40th percentile income cutoff across all states as a common threshold and with exclusion error defined in terms of individuals with incomes lower than this threshold not receiving BSH/BRIM, the coverage of BSH/BR1M for B40 households across states can be assessed in more detail. Figure 62 shows that exclusion errors are most pronounced in Putrajaya, which together with Kuala Lumpur and Labuan constitutes one of Malaysia’s three Federal Territories. Based on the national threshold, 30.8 percent of the B40 who live in Putrajaya do not receive BSH/BR1M. At 28.4 percent and 16.8 percent respectively, exclusion errors are also relatively high in Kuala Lumpur and Negeri Sembilan. In contrast, Perlis has the lowest exclusion error, with only 2.8 percent of the B40 not receiving BSH/BR1M.
Share of Population Covered and of BSH/BR1M Bene�ts, Percentage
Coverage Benefits Incidence
0
20
40
60
80
100
1 2 3 4 5
Income Quintiles
Share of B40 Covered, Percentage
0
20
40
60
80
100
Put
raja
ya
Kua
la L
ump
ur
Neg
eri S
emb
ilan
Lab
uan
Per
ak
Pen
ang
Sela
ngo
r
Pah
ang
Joho
r
Mel
aka
Sara
wak
Ked
ah
Sab
ah
Tere
ngg
anu
Kel
anta
n
Per
lis
74 MALAYSIA ECONOMIC MONITOR | JUNE 2020
PART TWO - Surviving the Storm

Further reducing the exclusion error in BSH/BR1M will require a careful examination of the delivery process to obtain a clear understanding of the factors that contribute to this error. The observation that a non-negligible share of the B40 does not receive BSH/BR1M is frequently attributed to the program’s income-based targeting approach. However, since overreporting of income is uncommon, it appears more likely that most of this exclusion errors is attributable to weaknesses in other aspects of the delivery chain. While a more comprehensive evaluation would be necessary to identify precise gaps in the overall delivery of the program, research by UNICEF (2018) suggests that there is a need for better outreach among the B40, and a more thorough yet agile approach to making enrollment and eligibility decisions. Overall, improving the delivery process can increase the efficiency and the effectiveness of BSH/BR1M, ensuring that fiscal resources are channeled to those who are most in need.
There is significant potential for BSH/BR1M to more actively facilitate human capital development and productive employment. Currently, there are few policies that link the beneficiaries of BSH/BR1M to efforts to build their human capital or to improve their productive inclusion in the labor market. As discussed in World Bank (2018), facilitating this operationally would requires better coordination between BSH/BR1M, education programs and ALMPs so that those receiving BSH/BR1M could build the skills and gather the work experience needed to move into productive
employment. For instance, BSH/BR1M recipients could benefit from information provided through accompanying measures, such as measures to raise parents’ awareness of best practices for providing nurturing care. These beneficiaries could also be supported to make better choices and to increase the use of services provided by various agencies. Finally, it would be possible to consider interventions directly provided by or linked to BSH/BR1M, including training to enhance human capital formation, employment services to link beneficiaries and jobs, and initiatives that leverage higher old age savings and incentives for workers to formalize.
During the ongoing COVID-19 pandemic, BSH/BR1M can ensure that a high share of the B40 receive adequate income support. It is crucial to ensuring comprehensive coverage of social assistance for the B40 during the pandemic, until their income recovers. People in this income group are relatively unlikely to be covered by formal social insurance schemes such as the EPF or SOCSO, making it difficult to channel any form of income support to them through such schemes. While increasing benefit levels for BSH/BR1M during normal times might not be fiscally sustainable or even desirable, during the crisis it is crucial that the B40 are provided with adequate support to mitigate a significant share of their income loss.
Core social assistance programs are progressive, but initiatives to promote productive employment are still nascentThe JKM implements ten core social assistance programs for poor and vulnerable groups (see Table 6). These ten programs include Financial Assistance for Older Persons (Bantuan Orang Tua, or BOT); Financial Assistance for Children (Bantuan Kanak Kanak, or BKK); the Allowance for Disabled Workers (Elaun Pekerja Cacat, or EPC); and Public Assistance directed at various vulnerable groups facing financial difficulties (Bantuan Am, or BA). Cash transfers are also provided to foster children (Bantuan Anak Pelihara, or BAP); bed-ridden persons with disabilities or chronically ill patients (Bantuan Penjagaan Pesakit Terlantar or BPT); persons with disabilities incapable of work (Bantuan
OKU Tidak Berupaya Bekerja, or BTB); and apprentices (APPERANTIS). Finally, the JKM also provides assistive devices (Bantuan Alat Tiruan/Alat Sokongan or BAT/AS) and launching grants for micro-businesses (Geran Pelancaran or GP).
For beneficiary selection, the JKM utilizes a combination of income and categorical targeting. For instance, BOT provides beneficiaries with a cash transfer of RM350 per month and is targeted at persons over 60 with no fixed income to sustain their livelihood and no family support. Enrollment into JKM programs is managed by eBantuan, the Department’s
75MALAYSIA ECONOMIC MONITOR | JUNE 2020
PART TWO - Surviving the Storm

TABLE 6The JKM implements ten core social assistance programs
Program Description
Financial Assistance for Older Persons (BOT)
Financial assistance to older persons outside of institutional settings.
Financial Assistance for Children (BKK)Financial assistance to single parents and parents who face difficulties due to loss of income, frailty, disability, illness, imprisonment or detention.
Allowance for Disabled Workers (EPC)Financial incentives to encourage persons with disabilities to work, stay independent and be productive members of society.
Public Assistance (BA)Financial assistance directed at various vulnerable groups facing financial difficulties.
Financial Assistance for Foster Care Children (BAP)
Financial assistance for families who have adopted orphans so that the children can continue living in the community rather than being institutionalized in orphanages.
Financial Assistance for Carers of Bed-Ridden, Disabled and Chronically Ill (BPT)
Financial assistance to reduce the burden of families caring for the bedridden members to reduce the likelihood of institutionalization of these members.
Financial Assistance for Persons with Disabilities Incapable of Work (BTB)
Financial assistance for people with disabilities that are incapable of work to prevent the likelihood of their institutionalization.
Apprenticeship Allowance for Children of Poor Families (APPERANTIS)
Financial assistance for vulnerable youth, especially children of JKM beneficiaries, to participate in skills building programs such as apprenticeships and job training.
Financial Assistance for Artificial Aid and Assistive Devices (BAT/AS)
In-kind or financial assistance to persons with disabilities for devises such as hearing aid, prosthetics, calipers, wheelchairs, canes, eyeglasses, and customized shoes.
Launching Grants (GP)Grants to encourage JKM beneficiaries to improve their own livelihood by starting a micro-business.
Source: Adapted from World Bank (2015) and Department of Social Welfare
information system and beneficiary registry. All information provided by the prospective beneficiary is verified through a home visit. To qualify for most JKM programs, household incomes must be below the PLI of RM980. However, EPC has a higher eligibility threshold of RM1,200 of employment income per month, while eligibility of BAP is independent of income. In addition to the JKM’s outreach efforts and proactive applications by prospective beneficiaries, recommendations for inclusion into JKM programs can also be made by authorities at the district level.
Overall, there were almost 500,000 beneficiaries of JKM programs in 2018, with a total expenditure on these programs of about RM1.7 billion. In 2018, the total expenditure on all ten JKM programs stood at 26.7 percent of the allocation for BSH/BR1M in the same year. As shown in Figure 63 and Figure 64 there were about 135,000 beneficiaries of BOT in 2018, equivalent to 27.6 percent of the total number of JKM beneficiaries. In the same year, government expenditure on BOT amounted to about RM554 billion, equivalent to 32.5
percent of JKM’s total expenditure on social assistance. Together with BOT, the three programs that have had the largest number of beneficiaries and that account for the highest share of expenditures in recent years are the Public Assistance (BA) program; the EPC program for disabled workers; and BKK for children. In 2018, the total number of beneficiaries of BA stood at 106,000; of EPC at 84,000; and of BKK at 70,000, with some individuals potentially being beneficiaries of multiple programs. Expenditures on the three programs amounted to RM266 million, RM381 million and RM213 million respectively.
With the number of people receiving social assistance benefits from the JKM more than doubling in the period from 2008 to 2012, the number has since remained roughly constant. Figure 63 and Figure 64 show that the number of JKM beneficiaries increased from 221,602 in 2008 to 486,858 in 2018. Over the same period, total expenditure also increased markedly. The most significant increase in coverage and spending occurred between 2008 and
76 MALAYSIA ECONOMIC MONITOR | JUNE 2020
PART TWO - Surviving the Storm

FIGURE 63There have been about 500,000 beneficiaries of core social assistance programs in recent years...
FIGURE 64...with BOT for older persons as the largest program both in terms of beneficiaries and expenditures
Source: Department of Social Welfare, various years Source: Department of Social Welfare, various years
2012. Since then, coverage and spending have been mostly flat, except in 2018, when expenditure increased by close to RM200 million. In terms of individual programs, the number of BOT beneficiaries increased particularly significantly by more than 120,000, between 2008 and 2012. As a result, BOT has become the largest JKM program, possibly reflecting a widespread lack of old-age income protection (see below).
While the JKM programs are highly progressive, due to their relatively small budget allocation, coverage is very low, even among the B20. Figure 65 shows that 12.8 percent of the B20 receive assistance from JKM, with this share falling with each successive income quintile. In total, 9.1 percent of the B40 are covered. The low level of coverage is unsurprising given the programs’ relatively small budget allocation and narrow eligibility criteria. The average monthly transfer per person under the JKM programs is RM292, or about 70.0 percent of the average post-transfer income for JKM beneficiaries in the B20. To assess the performance of the JKM programs, it is illuminating to analyze their coverage rates across states. Figure 66 shows that there is a strong positive association between the share of B20 residing in a state and the share of JKM expenditures channeled to beneficiaries in the state. States with relatively high proportions of B20, such as Kelantan, Sarawak, and Sabah, all receive relatively large shares of the total JKM expenditure. The correlation coefficient between the share of B20 and
the share of JKM beneficiaries is 0.89, reflecting this strong positive association.
Initiatives to promote productive employment are not yet mainstreamed into programs implemented by the JKM. World Bank (2015) documents that in recent years, there have been active efforts to promote productive employment of beneficiaries of JKM programs. For instance, the JKM implements a broad screening of beneficiaries in order to prioritize work-related support. Nevertheless, the benefit design of core social assistance programs does not yet include well-developed incentives or support to promote productive employment and program exit for those with work capacity. In addition, there is no systematic profiling of beneficiaries in terms of suitability for different types of additional support. As a result, much of the detailed information that is collected on households for eBantuan assessments is not used in a structured way.
Currently, the core social assistance programs under the JKM and BSH/BR1M do not provide a strong foundation to provide a guaranteed minimum of protection to all those in need. Neither BSH/BR1M nor the JKM programs cover the B40 in a comprehensive manner. Gaps in coverage and adequacy are even more problematic among the B20. Unlike BSH/BR1M, which is broad in coverage but poorly targeted, the JKM programs are much better targeted but reach a
Number of Beneficiaries (’000)
0
100
200
300
400
500
600
2008
2009
2010
2011
2012
2013
2014
2015
2016
2017
2018
BOT BA EPC BKK Others
Annual Expenditures, RM Million
BOT BA EPC BKK Others
0
200
400
600
800
1,000
1,200
1,400
1,600
1,800
2008
2009
2010
2011
2012
2013
2014
2015
2016
2017
2018
77MALAYSIA ECONOMIC MONITOR | JUNE 2020
PART TWO - Surviving the Storm

FIGURE 65Social assistance benefits from the JKM reach the poorest people...
FIGURE 66...and patterns of coverage closely follow the distribution of poverty across states
Source: World Bank staff calculations using Household Income and Basic Amenities Survey (DOSM)
Source: World Bank staff calculations using Household Income and Basic Amenities Survey (DOSM) and Department of Social Welfare
much smaller share of the poor and vulnerable. Only 9.1 percent of the B40 are covered by the JKM programs, compared to the 88.5 percent that receive benefits through BSH/BR1M. This partly reflects the difference in the implicit or explicit objectives of the two different programs. While some JKM programs aim to reach very specific vulnerable groups, BSH/BR1M provides more broad-based income support. Nevertheless, JKM programs are still too narrow, focusing on a limited group of beneficiaries. For instance, only 26.4 percent of older persons in the B20 are covered by BOT or any other JKM program. These programs’ adequacy
is also quite low. Therefore, with Malaysia recovering from the COVID-19 crisis and transitioning to a “new normal,” a key challenge to improving the performance of its social assistance programs will be to improve the coverage and adequacy of some of the well-targeted JKM programs and to put more emphasis on productive welfare for beneficiaries with work capacity. In parallel, another key challenge will be to improve the targeting performance of BSH/BR1M, to clarify its objectives, and to maximize its potential as a platform for supporting broader economic and social policies.
Uncoordinated delivery approaches reduce equity and efficiencyThe delivery of social protection interventions is a crucial part of a social protection system. The delivery chain refers to the operating environment for implementing social protection benefits and services. As illustrated in Figure 67, delivery systems for all benefits and services require nine phases, beginning with outreach to promote awareness and understanding among the intended population. Next, they involve some form of intake and registration, to gather information on people’s characteristics, needs, and conditions. In addition, there is a need to
undertake an assessment of the profile of potential beneficiaries, to use the profiles to determine eligibility, to assign the appropriate level of benefits and services, to take enrollment decisions, and to notify and onboard beneficiaries. Then, it is necessary to provide enrolled beneficiaries with the intervention, which may involve payment of cash benefits and/or the provision of services. Finally, one needs to monitor beneficiaries to ensure that their information is accurate and up to date and that they comply with any co-responsibilities, to manage grievances and appeals, to conduct
Share of Population Covered and of JKM Spending, Percentage
0
10
20
30
40
50
60
70
1 2 3 4 5
Income Quintiles
Coverage Benefits Incidence
Share of B20 and of JKM Expenditure, Percentage
PutrajayaLabuan
Kuala Lumpur Perlis
Melaka
Terengganu
NegeriSembilan
Penang
Pahang
SelangorJohor
KedahPerak
Kelantan
Sarawak
Sabah
0
2
4
6
8
10
12
14
0 5 10 15 20
Shar
e o
f JK
M E
xpen
dit
ure
Share of B20
78 MALAYSIA ECONOMIC MONITOR | JUNE 2020
PART TWO - Surviving the Storm

FIGURE 67The delivery chain is a crucial part of a social protection system
Source: World Bank (2019d)
reassessments, and to manage beneficiaries exiting the program.
Reflecting fragmented institutional arrangements, currently there is no standardized targeting mechanism of social assistance programs in Malaysia. There are three major targeting systems, on which most social protection programs fully or partially rely: the BR1M/BSH registry administered by LHDN, the eBantuan system administered by JKM, and the eKasih system administered by the Implementation Coordination Unit in the Prime Minister’s Department (which is for instance used as the basis for determining eligibility for some of the education assistance initiatives). Each of these systems has its own targeting procedures.
The current targeting approaches in Malaysia are fragmented along several lines. First, the unit of targeting differs. For eKasih, the focus for targeting is the household, defined in the common way of DOSM. For eBantuan, the primary focus is the individual applicant, though information is also collected on total household income and other variables relevant to the eligibility determination of the individual applicant. For BSH/BR1M, the unit for targeting mixes both families and individuals. Second, the method to determine eligibility for social assistance programs differs. For eKasih, eligibility if determined based on a detailed questionnaire administered periodically. For BSH/BR1M, the method is self-declaration with cross-validation of data against other databases. For eBantuan, there is a separate applicant questionnaire which collects detailed information and is subject to home visits and other verification in case where
eligibility is uncertain. Third, the eligibility threshold for programs varies. Part of the variation in thresholds is by design, e.g. BSH/BR1M intends to target roughly the B40, while eKasih and eBantuan have much lower (but different) thresholds, intending to cover poor households. Apart from the issue of fragmentation of targeting approaches, there are two other major issues in Malaysia’s targeting mechanisms: First, the eligibility criteria of programs do not always take into account the different standards of living across regions. Second, eligibility is typically determined based on an assumed average household size and not per capita income, creating a bias against larger households (who are those with higher poverty and vulnerability rates).
Malaysia has a number of information systems across its social protection programs, operated by a diverse range of agencies and with limited interoperability. Like many countries, Malaysia developed a diverse and fragmented set of information systems across its social protection programs and agencies. While there is sharing and exchange of data, it happens in a fairly rudimentary manner that falls considerably short of a broader interoperable system as has been achieved by an increasing number of developing and emerging countries. A more integrated or interoperable information system would play a helpful role in channeling funds to those most in need, while at the same time limiting the administrative burden. Each of the current systems (eKasih, eBantuan and BSH/BR1M) serves a different but specific purpose within their host agencies. Thus, it might not be necessary for these systems to be replaced by a single integrated database. Instead, what might be needed would be for these systems to “talk” to a single authoritative and
Stylized Framework for the Social Protection Delivery Chain
Assess Enroll Provide
RecurringCycle
Periodic Re-Assessment
Monitor &ManagePotential Demand
Outreach
1Intake &
Registration
2Assess Needs& Conditions
3Eligibility &EnrollmentDecisions
4DetermineBenefits &
ServicePackages
5Notification &Onboarding
6Benefitsand/or
Services
7BeneficiariesGrievancesCompliance
8Exit DecisionsNotifications
Case Outcomes
9
79MALAYSIA ECONOMIC MONITOR | JUNE 2020
PART TWO - Surviving the Storm

integrated virtual database that has accurate and up-to-date information of beneficiaries.
There is also potential for consolidation of front-end service delivery of social protection programs to improve efficiency, client orientation and institutional coordination. There is increasingly weak justification for the multiplicity of front-end points of
contact across the social protection system. It would be very possible to achieve the same degree of proximity to clients with a significantly reduced front-end presence if different agencies could better coordinate and share services. This process could be reinforced by deeper use of the government’s demonstrated capacity for web-based services, like the LHDN’s online application system for BSH/BR1M.
Coverage and adequacy of long-term savings arrangements need to be improvedOver the past 70 years, Malaysia’s institutional framework for old age income protection has remained largely unchanged, in spite of rapid aging. Historically, families in Malaysia often financed the needs of older persons no longer able to work. Rapid aging and growth in the number of older persons have increased the importance of structured savings arrangements to smooth incomes over the life cycle. As Malaysia’s population continues to age and urbanize and as co-residency declines, such savings arrangements will need to be adjusted to support its increasing number of elderly citizens. Among the primary criteria to evaluate the current performance of Malaysia’s system of old-age income protection and to identify potential adjustments are the ability to maintain adequacy, coverage, and affordability (World Bank 2008). An adequate system with high coverage is one that provides benefits sufficient to prevent old-age poverty to the full breadth of the population, in addition to providing a reliable means to smooth lifetime consumption for the vast majority of the population. An affordable system is one that is within the financing capacity of individuals and society and that does not unduly displace other social or economic imperatives or have untenable fiscal consequences.
In the short term, the COVID-19 crisis may exacerbate the vulnerability of older persons while temporarily reducing their savings for retirement. Temporarily, retirement savings will be reduced through declining EPF contribution rates, withdrawals from EPF accounts, and declines in asset prices (see Box 7). Fortunately, retirement savings are intended to meet long-term needs and it is expected that most people with adequate savings will be able to withstand these short-term adjustments, just as they have in earlier economic crises.
This report focuses on the EPF as the retirement savings institution with the largest coverage. The EPF is a contractual savings institution established for the purposes of ensuring that citizens save for old age and other contingencies including housing, education and select medical procedures. It is a defined-contribution provident fund with a regular minimum contribution rate of 7 percent for employees and 12 to 13 percent for employers. There is no ceiling on wages subject to such contributions. Seventy percent of contributions are placed in Account 1, which is dedicated to old age benefits, while the remaining 30 percent goes into Account 2, which can be used for home purchase or loans, tuition for tertiary education, and payment of the costs of specified treatments for major medical procedures and illnesses. The self-employed can contribute voluntarily to the EPF and may qualify for modest matching grants of 15 percent of contributions, up to a relatively low cap of RM250 per year. Balances are offered as lump-sums upon reaching a minimum withdrawal age and retirees can choose to make periodic withdrawals, though annuity options are not provided. Therefore, participants in the EPF
An adequate system with high coverage is one that provides benefits sufficient to prevent old-age poverty to the full breadth of the population
80 MALAYSIA ECONOMIC MONITOR | JUNE 2020
PART TWO - Surviving the Storm

27 Anecdotal evidence suggests that the frequent underreporting of earnings by employers also contributes to low balances.28 The number may overstate coverage for Malaysia as it is based on the number of people who made at least one contribution in the 12 months prior to December 31 2019. The number of people who make consistent contributions is likely to be lower as many EPF members engage in intermittent formal work.
FIGURE 68A majority of retirees will receive very low benefits in retirement from EPF accounts...
FIGURE 69...and effective replacement rates are low under the current minimum withdrawal age
Source: World Bank staff calculations using data from EPF Source: World Bank staff calculations using data from EPF
than the minimum retirement age of 60. Along with the fact that many EPF members engage in intermittent formal work, this means that the contribution rate would have to be inordinately high to support a meaningful replacement rate as a percentage of final salaries. Life expectancy at age 55 is 24.5 years. Thus, many workers will spend longer in retirement than as active contributors. Increasing the minimum withdrawal age from 55 to 65 could almost double the effective replacement rate for individuals who work continuously from age 30 (see Figure 69). This is due to three effects: individuals could contribute for an additional 10 years, substantially increasing balances at retirement; they would reap an additional 10 years of dividends; and the payout period would be substantially shortened.27
Another reason for low benefits is that many workers do not contribute to the EPF for part or all of their working lives. Malaysia’s coverage of retirement savings institutions is slightly below expectations when benchmarked against other countries (see Figure 70).28 On average, countries with a higher GDP per capita have higher coverage by retirement savings institutions. This is primarily due to the positive correlation between GDP per capita and the proportion of workers in “standard” employment relationships amenable to contributory retirement savings schemes. It also reflects that many upper middle- and high-income countries have been able to extend the coverage of retirement savings institutions to the self-employed. Malaysia falls
may face challenges to smoothing consumption during their retirement years or protecting themselves against longevity risks. Rabi et al. (2019) estimate that more than two thirds of EPF members withdraw their balances at retirement. Even those retirees who voluntarily leave their balances in their EPF accounts bear the full burden of investment and longevity risks.
Adequacy and coverage of long-term savings arrangements are major challenges. The distribution of balances for active EPF contributors at age 54 suggests that a majority of retirees will receive very low benefits in retirement from their EPF accounts (see Figure 68). Over half of workers at age 54 have balances of under RM150,000 and almost three quarters have balances under RM250,000. Translated into an indexed annuity, almost three quarters of workers retiring with active EPF accounts will have a monthly benefit of less than RM1,050, only slightly more than the PLI of RM980. Moreover, over 40 percent of EPF retirees would have an annuitized income of less than RM420 per month, only slightly higher than the BOT benefit of RM350 per month.
While the real rates of return on individual balances have been substantial, the low minimum withdrawal age has been one of the key reasons for low balances. The minimum withdrawal age is 50 for Account 2 and 55 for Account 1, which is very low by international and regional standards and also lower
Number of Active Members Age 54
Active EPF Members Aged 54,Number
Estimated Monthly Pensions, RM
Indexed Annuity (Amount per Month)
0
500
1,000
1,500
2,000
2,500
3,000
3,500
4,000
4,500
0
5,000
10,000
15,000
20,000
25,000
Less
tha
n 50
50-1
00
100-
150
150-
200
200-
250
250-
500
500-
1,00
0
1,00
0+
EPF Account Balances (’000)
Simulated Replacement Rates, Percentage
EPF Minimum Withdrawal Age
20
40
60
80
100
120
140
50 52 54 56 58 60 62 64 66 68 70 72 74
3% Real Return2% Real Return
81MALAYSIA ECONOMIC MONITOR | JUNE 2020
PART TWO - Surviving the Storm

FIGURE 70Malaysia’s coverage of retirement savings institutions is slightly below expectations...
FIGURE 71...and especially low among lower income households
Source: World Bank staff calculations using World Bank Pensions Database and World Development Indicators
Source: World Bank staff calculations using Household Income and Basic Amenities Survey (DOSM)
slightly short of the global benchmark; it would need to increase coverage by about one percentage point to align with it. To achieve more adequate benefits, it would also need workers to contribute longer.
Workers from low-income households have both lower rates of coverage with the EPF and lower balances at age 54 (see Figure 71). Those with lower incomes are less likely to be in “standard” employment relationships covered by the EPF. Average contributions per person are also relatively low among the B40, resulting in low balances. The low coverage and adequacy amongst the B40 suggest that measures are needed to increase coverage amongst workers outside of “standard” employment relationships. It also suggests that a substantial portion of older persons will need public assistance in addition to EPF payouts.
Women also have both lower rates of EPF coverage and lower balances. There are two reasons why a relatively large share of women is uncovered by EPF and other forms of social insurance. First, the female labor force participation rate in Malaysia is comparatively low. In 2019, only 55.5 percent of women participated in the labor force, compared to 80.8 percent of men. Second, a relatively large share of women who participate in the labor market is self-employed or engaged as unpaid
family workers or in the informal sector and thus outside of “standard” employment relationships. In addition, women who are covered by social insurance on average have lower EPF balances than men, partly due to the prevailing gender wage gap (World Bank 2019a). As a result, the average EPF balance at age 54 is RM177,000 for women and RM233,000 for men.
It is essential to have a non-contributory social pension to assist vulnerable and poor older persons. As most older persons in Malaysia can expect only an inadequate EPF distribution, it is essential that non-contributory elderly assistance protects poor and vulnerable older persons against poverty and destitution. As discussed above, while the JKM provides cash assistance to this target group primarily through BOT (and also BA), the coverage of its programs is insufficient, reaching only 26.4 percent of older persons in the B20. If Malaysia is to consider the introduction of a social pension, it needs to weigh the size of its target population, the minimum benefit level needed to improve welfare, and the current and future fiscal costs. In the short or medium term, one practical option would be to introduce a relatively modest social pension of the same benefit level as BOT but targeted at the B40 aged 65 and over.
Labor Force Covered by Retirement Savings Institutions, Percentage
Malaysia
0
10
20
30
40
50
60
70
80
90
100
0 20,000 40,000 60,000 80,000 100,000 120,000
GDP per capita (PPP, 2017 USD)
Average Contributions per Capitaper Month, RM
Individuals Contributing to EPF,Percentage
Income Deciles
0
5
10
15
20
25
30
35
40
45
0
100
200
300
400
500
600
1 2 3 4 5 6 7 8 9 10
Average Monthly EPF Contributions Per Capita
Share of Working Age Individuals Contributing
82 MALAYSIA ECONOMIC MONITOR | JUNE 2020
PART TWO - Surviving the Storm

83MALAYSIA ECONOMIC MONITOR | JUNE 2020

Duplication and fragmentation exist in Malaysia’s labor market programsThe changing nature of work increases the importance of ALMPs to facilitate jobs transitions and to improve the matching of workers and jobs. As rapid technological change and automation threaten to displace workers, there will be an increasing need for the facilitation of job transitions through upskilling, re-skilling, and improved job matching (World Bank 2018). This process is likely to be accelerated by the COVID-19 pandemic, which has imposed mobility restrictions on workers around the globe. In the process of economic recovery following the gradual easing of these restrictions, ALMPs—which as defined above include skills-building initiatives, employment services, and wage subsidies—can play an important role in facilitating reemployment.
Duplication and fragmentation exist in Malaysia’s ALMPs. As mentioned above, Malaysia’s ALMPs involve a wide range of ministries and agencies, with up to 11 ministries involved in the implementation of skills-building initiatives alone. In addition, the EIS covers training fees and training allowances for its own set of training providers. While most ALMPs are focused on jobless workers or new labor market entrants, the HRDF brokers training and up-skilling interventions to key industries. Employment services are implemented by both JobsMalaysia and the EIS. An evaluation of Malaysia’s skills development system found that significant progress was made in the period from 2000 to 2010 (World Bank 2014), including the strengthened ability to formulate a strategic vision and the adoption of more suitable policies and institutions to support that vision. However, weaknesses were found in the areas of implementation and system oversight. The multiplicity of implementing agencies also makes it difficult to obtain accurate data on spending and on the effectiveness of ALMPs. At the same time, the fragmentation of programs results in a smaller level of spending and a reduced number of beneficiaries for each program, making the programs both costly to administer and inefficient. Further, from the beneficiaries’ perspective, the multiplicity of programs and implementing agencies can be confusing and creates high transaction costs.
In Malaysia, the introduction of new programs is often not based upon a consideration of the existing system of ALMPs, exacerbating duplication and fragmentation. For example, the EIS covers training
fees and training allowances for its own set of training providers, instead of using the HRDF list of providers. Similarly, the EIS provides a reemployment placement program and career counseling without clear linkages with JobsMalaysia. In principle, relatively new schemes such as the EIS present opportunities to improve the overall social protection system by creating synergies between new and existing ALMPs and enabling linkages between social assistance, social insurance and labor market programs. In contrast, a lack of synergies risks exacerbating the fragmentation of the system.
Limited monitoring and evaluation of ALMPs inhibits the ability to make course corrections to ineffective programs. While the government occasionally uses cost benefit analyses to make decisions related to the ALMPs, the practice is not widespread. Moreover, these analyses typically focus on financial costs and benefits, and not on economic costs and benefits for society at large. A qualitative study by Nor and Khelgat-Doost (2019) on the challenges faced by the AZAM program (largely an entrepreneurship program) in reducing poverty finds that a significant number of the participants were never monitored throughout their participation in the program.29 A report published by the government in 2013 acknowledges the lack of systematic monitoring, while suggesting that beneficiaries of the program managed to increase their income by RM300 for any three months (GTP 2013). However, the methodology for this calculation and the potential impact of the increase on income or poverty remained unclear.
Even well-functioning programs could be further adjusted so that they are more suitable in the context of the changing nature of work. HRDF is the largest broker of skills trainings in Malaysia, with a steady rise in disbursed training grants over time (see Figure 72). A World Bank evaluation demonstrates that HRDF has been effective in increasing training and productivity (see Figure 73 and World Bank 2017). That said, there remains room for further improvement, particularly in the context of the changing nature of work. For instance, HRDF is employer-centric and does not have much scope to train individuals, including those who have been displaced due to changing skill requirements, technological advancements or the COVID-19 crisis. Further areas of development might include fostering even closer links with employers,
29 AZAM (previously 1AZAM) is a series of income generation programs aimed at improving the productivity of low-income households, comprising of four different sub-programs covering work placements, small business, small service outlets, and small-scale agriculture.
84 MALAYSIA ECONOMIC MONITOR | JUNE 2020
PART TWO - Surviving the Storm

Short- and medium-term policies should support COVID-19 recovery efforts and deepen social assistance for the B40With Malaysia’s economy entering a “new normal” following the outbreak of the COVID-19 pandemic, it is vital that direct income support in the form of cash transfers continues. The battle to protect the welfare and livelihoods of the B40 in the wake of an unprecedented crisis brought forth by the COVID-19 pandemic is still ongoing. In this context, further rounds of cash transfers will remain vitally important. These transfers provide short-term relief to mitigate acute financial strains, they support medium-term recovery efforts, and they support consumption and human capital development at a time of economic downturn. It will be worthwhile to consider channeling further rounds of cash transfers to the beneficiaries of
the BSH/BR1M program instead of the wider group of beneficiaries covered by BPN. This would ensure that a greater share of transfers goes to the B40–the group most in the need of support.
In addition, it is worthwhile to consider Malaysia’s overall social protection strategy. Many expect this crisis to usher in major changes to the world of work, resulting in the emergence of what has been described as the “new normal.” Thus, Malaysia needs an enhanced social protection system that provides minimum protection appropriate to the “new normal” context to all those in need, underpinned by a mixture of public policy measures on both the expenditure and
leveraging real-time labor market information to complement traditional survey data, and building stronger relationships with other agencies in Malaysia working on human capital development. Many of these areas of improvement were recognized in the HRDF’s
National Workforce Human Capital Development Blueprint 2018–2025, which also made actionable recommendations for improving the effectiveness of ALMPs in Malaysia (HRDF 2018).
FIGURE 72HRDF has disbursed steadily more training grants over time...
FIGURE 73...and registration with HRDF increases the training provided by firms
Source: HRDF Annual Reports 2007 to 2016 Source: HRDF (2018) based on World Bank (2017)
Training Grants Disbursed by HRDF, RM Million
0
50
100
150
200
250
300
350
400
450
500
2004
2005
2006
2007
2008
2009
2010
2011
2012
2013
2014
2015
Impact of HRDF Registration on Share of Workers Trained, Percentage
0
5
10
15
20
25
All Workers Low-Skilled Mid-Skilled High-Skilled
85MALAYSIA ECONOMIC MONITOR | JUNE 2020
PART TWO - Surviving the Storm

revenue sides. This enhanced social protection system could encompass (i) initiatives that provide adequate old-age income protection for all Malaysians through increased coverage and adequacy of the EPF and the introduction of a modest, broadly targeted social pension; (ii) measures to deepen social assistance for the B40 through better coordination of program design, targeting approaches, information systems, and front-end service delivery, and the promotion of productive employment; and (iii) the strengthening of flagship labor market programs that have been credibly evaluated and the discontinuation of others.
Malaysia could update its benchmarks for both monetary and non-monetary deprivation. While Malaysia has made admirable progress in reducing poverty based on the deprivation thresholds established in the 1970s, an updating of those thresholds is overdue. Benchmarks such as the PLI and the multidimensional poverty index (MPI) are generally aligned with the minimum socially acceptable standard of living in a given society. This goes beyond survival to encompass living standards consistent with living in dignity and making it possible to participate fully in society without stigma. In contrast, the current PLI is anachronistic and fails to provide practical guidance to social protection and other policies to ensure the well-being of Malaysians.
There is significant potential to deepen social assistance for the B40 and to achieve better outcomes by clarifying and harmonizing the objectives of the programs implemented by the JKM and even more so of BSH/BR1M. One of the key target groups listed in Malaysia’s Shared Prosperity Vision 2030 are the B40, the poor, and the economically vulnerable. Against this backdrop, JKM programs might continue to aim to address the needs of specific poor and vulnerable groups with updated benchmarks for both monetary and non-monetary deprivation while BSH/BR1M has the potential to serve as a platform for broader social inclusion policies aimed at boosting shared prosperity by improving the welfare of the B40. BSH/BR1M even has the potential to become a “social registry” for multiple social programs, including cash transfers, food aid, health services, education scholarships, and others. This could minimize the resources required at the assessment and enrollment stages of each of the different programs. For instance, should global crude prices surge again and there is a sense that additional support is needed, the registry could be used to replace nontargeted regressive fuel subsidies by a progressive targeted allowance that is irrespective of vehicle ownership or a household’s fuel consumption.
There is also significant potential to improve the design and implementation of JKM and BSH/BR1M programs. It would be worth considering improving the coverage and adequacy of some of the well-targeted JKM programs and putting more emphasis on productive welfare for beneficiaries with work capacity. While a point of contention in expanding cash transfers is that beneficiaries will use the cash to purchase “temptation goods,” international evidence shows that, if anything, cash transfers reduce expenditure on such goods (see Box 10). Nevertheless, an expansion of JKM programs could be accompanied by a systematic emphasis on productive welfare for those with the capacity to work, such as through a systematic profiling of beneficiaries and their linkage to counseling, training or other services. It would also be worth improving the targeting performance of BSH/BR1M to reduce the programs’ inclusion and exclusion errors and using the program to achieve better socio-economic impacts. For instance, beneficiaries could benefit from accompanying measures, such as to raise parents’ awareness of best practices for providing nurturing care. There is also potential to increase the use of services provided by various agencies, including training to enhance human capital formation. BSH/BR1M could also leverage goals such as higher old age savings and incentives for workers to formalize, potentially through the use of a very small proportion of transfers as deposits into EPF accounts as a nudge for beneficiaries to join EPF.
There is potential to improve the delivery of social protection programs by better coordinating targeting approaches, information systems, and front-end service delivery. First, Malaysia would benefit from moving toward a more standardized and commonly implemented targeting system to promote a more common approach in terms of the unit of targeting, consistent eligibility thresholds for targeted programs, and flexibility to handle programs which target different segments of the population. Second, information systems within and across social protection agencies would benefit from deeper integration or interoperability. It would be worthwhile to consider what integration means in more concrete terms and to build consensus on the model for achieving interoperability across the diverse systems in different agencies responsible for social protection programs. There are two broad approaches which are open to Malaysia. The first is to create a single information system. The second is to create a virtual “single” information system in the sense that existing systems are networked so that they can inter-operate. Given that Malaysia is starting from a position of multiple legacy systems, a key question in considering which broad approach to pursue is
86 MALAYSIA ECONOMIC MONITOR | JUNE 2020
PART TWO - Surviving the Storm

Cash transfers, in-kind transfers and “temptation goods”One contentious point in disbursing social assistance in the form of cash transfers is that beneficiary households may misuse the cash to purchase so-called “temptation goods.” This is one reason why some countries prefer in-kind transfer programs, even though cash transfers are, on average, more cost-effective in terms of delivering resources to households than in-kind alternatives, at least outside of extraordinary situations where markets break down (Gentilini 2016). In this context, “temptation goods” often refer to alcohol and tobacco, as in Evans and Popova (2017). There are, of course, other temptation goods that can potentially be purchased with cash, but alcohol and tobacco have been studied most extensively (Banerjee and Duflo 2007).
Evidence shows that, if anything, cash transfers reduce expenditure on temptation goods. In a meta-analysis of research on the impact of cash transfer programs on expenditures on temptation goods, Evans and Popova (2017) find that on average, cash transfers actually decrease total expenditure on these goods, irrespective of geography, program design, or program duration. This conclusion is based on the findings from 19 studies in ten countries in Latin America, Africa, and Asia that have used experimental or quasi-experimental design (in other words, studies that are methodologically robust). The finding by Evans and Popova (2017) is consistent across various specifications. While precise reasons behind a negative – as opposed to zero – impact of cash transfers on the purchase of temptation goods have yet to be established, one of
BOX 10
the possible explanations mentioned by Evans and Popova (2017) is that cash transfers are often directed at women. They might therefore improve women’s within-household bargaining position, supporting their desire not to spend limited cash on temptation goods.
While the evidence on the impact of cash transfers on the purchase of temptation goods is clear, the effectiveness of cash versus in-kind transfers are dependent on program context and design. In another meta-analysis, Gentilini (2016) compares the effectiveness of cash transfers and food transfers. While he finds that cash transfers are, on average, more cost-effective than in-kind alternatives, context matters. Some of the specific context and design considerations that affect the effectiveness of cash and food transfers include the marginal propensity to consume food, the duration of the program, the frequency of transfers, and perceived risks (such as erosion of purchasing power), all of which affect purchasing and consumption behaviors. Further, Gentilini (2016) finds that both cash and food transfers improve a range of indicators related to income, poverty, and malnutrition. Even though the meta-analysis focuses on food transfers, one can expect that the effectiveness of cash transfers relative to other types of in-kind transfers to also be dependent on specific context and design. The key takeaway is that overall effectiveness cannot be generalized and is dependent on the objectives of each program and on the specific indicators used to measure those objectives.
87MALAYSIA ECONOMIC MONITOR | JUNE 2020
PART TWO - Surviving the Storm
87

FIGURE 74A phased withdrawal of EPF balances could help spread income over time...
FIGURE 75...while options for a social pension would need to be attentive to the fiscal space
Source: World Bank staff calculations using data from EPF Source: World Bank staff calculations using data from EPF, IMF and UN Population Projections
the extent to which there is a desire to continue the operation of legacy systems, or instead to merge into a single centralized system after some transition period.30 Third, front-end service delivery in social protection programs has major potential to be consolidated in order to improve efficiency, client orientation and institutional coordination. It would be very possible to achieve the same degree of proximity to clients with a significantly reduced front-end presence if different agencies can better coordinate and share services. Single window service would be a desirable goal. This process could be reinforced by deeper use of Malaysia’s demonstrated capacity for web-based services.31
With the changing nature of work, it is unlikely that EPF can ever reach full coverage of the labor force – nevertheless, several complementary measures could be implemented that would each help to increase the proportion of workers actively contributing to the EPF. First, the scope of contributors could be broadened to cover the self-employed, farmers and employment insurance beneficiaries. The self-employed could either be required to contribute or be governed by a default option whereby all are registered with EPF when they register with the Companies Commission or LHDN but can opt-out
in writing during their first month of employment and annually. Second, oversight could be improved, including through a requirement for the registration of all workers as a condition for the granting of employers’ business licenses or government contracts. Compliance monitoring could also be improved using a risk-based approach and select auditing of wage reporting. Third, cooperation with industry associations and other aggregators such as gig economy platforms could be encouraged or mandated. Fourth, linkages between the EPF scheme and SOCSO’s Self Employment Social Security Scheme could be strengthened. Fifth, public education and account-related communications could be improved further. While these five measures would not be targeted at any specific group of workers, it is expected that they would disproportionately benefit those with low EPF coverage rates, including the B40 and women.
Measures are also desired to increase the contribution histories for those workers who are active EPF members to ensure that retirement savings could be sustained for a longer period of time. First, the minimum withdrawal age for EPF Account 1 could be gradually increased from 55 to 65, perhaps over a ten to 20-year period. This
30 Deciding the core platform around which to develop greater interoperability would also be important. The system underpinning BSH/BR1M appears to have the best-developed linkages with other databases and fairly high population coverage. However, before making a final determination it would be useful to assess population coverage, scope of household data, functional cross-checks and other features of different systems in more detail.31 MySPC could play an important role in clarifying and harmonizing the objectives of social protection programs, improving their design and implementation, and better coordinating targeting approaches, information systems, and front-end service delivery.
Balance - Phased Withdrawal at Age 55
Simulated EPF Balances, RM Simulated Annual Change, RM
Annual Change - Phased Withdrawal at Age 55
-4,000
-3,000
-2,000
-1,000
0
1,000
2,000
0
10,000
20,000
30,000
40,000
50,000
30 35 40 45 50 55 60 65 70 75 80 85 90 95
Simulated Fiscal Cost of Social Pension, Percentage of Revenue
0
2
4
6
8
10
12
14
2020 2025 2030 2035 2040 2045 2050
Current RM350/Month - Bottom 40% - Age 60+
Current RM350/Month - Bottom 40% - Age 65+
Current RM350/Month - Universal - Age 65+
30% of Median (RM769/Month) - Bottom 40% - Age 65+
88 MALAYSIA ECONOMIC MONITOR | JUNE 2020
PART TWO - Surviving the Storm

32 Without improvements to the targeting performance of BSH/BR1M, the estimates for coverage and fiscal costs of the social pension are likely to be lower bounds as the program covered 63.3 percent of the population in 2016 (see above).
would substantially increase accumulated balances and create incentives for individuals to work longer. Second, consideration could be given to converting contributions to EPF Account 2 to retirement savings. Before such as step is taken, it would be necessary to evaluate whether there still is a continued rationale for having a mandatory savings program for housing, education and health. Third, as an intermediate step toward the exploration of annuitization options, phased withdrawals of EPF balances could be mandated to spread income over time. As illustrated in Figure 74, phased withdrawal could be based on a calculation that takes the EPF account balance at retirement and divides it by the life expectancy at retirement. Each year, the benefit would be recalculated based on the revised account balance and the life expectancy at the new age. If an individual becomes gravely ill either while working or retired, hardship provisions could permit additional withdrawals. Again, these measures would not be explicitly targeted at any specific group, but likely disproportionately benefit the B40 and women.
There is a need for a modest, broadly targeted social pension. In principle, social pensions could either be targeted at all those above a certain age; restricted to those with insufficient income or EPF balances; or provided as a supplemental benefit for those in households qualifying for other social assistance. Each option would need to consider the benefit amount, the target recipients and the desired coverage. In the short or medium term, one practical option would be to introduce a relatively modest social pension of the same benefit level of RM350 per month targeted at the B40 aged 65 and over and using the BSH/BR1M implementation system. Projections indicate that the introduction of this benefit would cost about 1.6 percent of projected fiscal revenues in 2020, with increases in line with the growth in the population aged 65 and over thereafter.32 In the spirit of progressive universalism, coverage or adequacy of the social pension could be extended over time, fiscal space permitting. For instance, the benefit level could be increased over time to 30 percent of the median wage (though at a considerably higher cost, see Figure 75).
The need for a comprehensive system of ALMPs including wage subsidies is more pertinent than ever to enable Malaysia to recover from the impacts of the COVID-19 pandemic. During a period of crisis, time-bound, conditional wage subsidies can
serve as an effective policy tool to enable the retention and hiring of workers. While implementation of the wage subsidies announced as part of the Prihatin packages has uncovered some weaknesses, the three-month extension announced as part of the Penjana plan is welcome. However, over time the focus should shift from job retention to job creation. The Hiring and Training Assistance for Business announced as part of the Penjana plan contributes to this shift but appears more limited in scope and ambition than the previously announced Malaysians@Work program.
Effective skills-building programs and employment services can help address rising unemployment and underemployment. As physical distancing and other mobility restrictions that have been implemented in Malaysia to mitigate the health impact of the COVID-19 pandemic continue, businesses that accommodate physical distancing needs and that have a digital presence are more likely to be sustainable. This is likely to increase the demand for digital skills, accelerating the change in the nature of work that was already underway as a result of rapid technological advancement. Subsequently, there will be an increased and urgent need for the reemployment of displaced workers, as well as increased demand for skills-building programs that can enhance workers’ digital and also socio-emotional skills. In addition, strengthening employment services by partnering with industry and education institutions can help ensure an efficient and effective job matching during the recovery. In this context, providing information both to jobseekers and employers would be crucial. Finally, better monitoring and evaluation of ALMPs could allow for continuous improvements, to terminate unsuccessful programs, and to demonstrate accountability and justify government expenditure (OECD 2015).
Strengthening employment services by partnering with industry and education institutions can help ensure an efficient and effective job matching during the recovery
89MALAYSIA ECONOMIC MONITOR | JUNE 2020
PART TWO - Surviving the Storm

In the long term, expenditure and revenue policies should support the development of an enhanced social protection systemIn addition to the ongoing impacts of the COVID-19 pandemic during the recovery period, Malaysia faces a range of structural challenges related to the changing nature of work; the evolution of its economy as it continues its journey toward becoming a high-income, developed nation; and its increasingly aging population. In Malaysia and elsewhere, rapid technological change has been changing the way people work, leading to some degree of job displacement, particularly among people with mid-skilled occupations that are intensive in routine cognitive and manual skills (Chuah et al. 2018). Within this context, social assistance and social insurance play an important role in protecting workers as they transition from one job to another. In addition, the types of jobs that will be created after the COVID-19 crisis will be different and Malaysia’s population is aging rapidly, with the country expected to move from being an aging society to an aged society within 24 years (the same duration that it took for the transition in Japan). Moreover, the growing prevalence of forms
of work that do not involve “standard” employment relationships means that a large share of the labor force will likely remain uncovered by contribution-based social insurance.
To address these issues, Malaysia could develop a Social Protection Masterplan that facilitates a shift from a set of social protection programs toward a social protection system that is coherent in terms of institutions, policies and programs. Such a Masterplan should be an actionable document rather than simply a study, along the lines the SME Masterplan which Malaysia is in the process of implementing, with some success (see World Bank 2020b). The Social Protection Masterplan could be developed under the leadership of MySPC, with the involvement of a diverse and inclusive set of stakeholders. A useful initial step would be a functional review of the social protection sector as an input for the development of the Social Protection Masterplan. Functional reviews assess the policy appropriateness of social protection programs
90 MALAYSIA ECONOMIC MONITOR | JUNE 2020
PART TWO - Surviving the Storm
and the efficiency and effectiveness of programs. They are also a useful starting point to identify needs for more detailed downstream organizational reviews and business process re-engineering within and across agencies delivering social protection programs.
The Social Protection Masterplan could set out actionable steps to progressively increase the coverage and depth of social assistance, based on the principles of progressive universalism. The Masterplan could describe a set of discrete expenditure and revenue policies. These might include measures for increasing revenue as well as for expanding outlays for core social assistance programs, including the social pension, in line with fiscal space. The objective should be to gradually move toward a guaranteed minimum that would be available to all those in need, be set at adequate benefit levels, incentivize work, be responsive to changing circumstances, and be fiscally sustainable. The Masterplan could also describe how the overall social assistance system could be made more equitable and effective through better coordination of program design, targeting approaches, information systems, and front-end service delivery, and through the promotion of productive employment.
one which also stresses the quality of services and client outcomes. The interaction between the state, non-governmental and community-service organizations, and volunteers is also likely to evolve, not just with respect to service provision, but also regarding policy development and social monitoring of services. Finally, it would be important to invest in strengthening the capacity of social and care workers through training and other means.
In the long run, the coverage and adequacy of old-age income protection will deserve renewed attention. To reduce the administrative burden of contributions, a one-stop-shop could be established which unifies the contribution collections for both the EPF and SOCSO (as well as HRDF). Such a one-stop-shop could then distribute earmarked contributions to each of the respective institutions. This would reduce the burden on individual employers and make it easier for the self-employed or informal workers to participate. In addition, the age for benefit eligibility might need to be further increased beyond 65, in parallel with Malaysia’s increasing life expectancy. Over the longer-term, age-based portfolios that invest in riskier portfolios for young people while reducing the risk as individuals age could be explored to achieve returns that are improved but remain smooth. Longevity insurance and annuitization options could also be explored as a means of covering risks related to individuals outliving their cash balance and to provide an effective means of sharing longevity risks across retirees. As phased withdrawals offer no insurance against longevity risks, it is also possible for a portion of an individual’s cash balance to be held back until reaching a very high age to ensure that resources are provided for those who live beyond the average life expectancy. It would also be opportune to explore options for the EPF to underwrite the risk of indexed, annuitized benefits while likely drawing upon the expertise of insurance companies to appropriately structure and price such benefit options.
It will also be important to improve the affordability of EPF contributions. Over time, the EPF contribution rate could be reduced as the benefit eligibility age increases, provided that there is an observed increase in coverage and adequacy for most workers. Also, a cap on wages subject to mandatory EPF contributions could be established, similar to the way in which a cap has been established for SOCSO contributions. The level of the cap could be relatively high to ensure that retirement savings are adequate. Similarly, EPF contribution rates could be lowered for individuals who have accumulated sufficient balances for both a minimum benefit in absolute terms and a reasonable replacement rate.
Malaysia could develop a Social Protection Masterplan that facilitates a shift from a set of social protection programs toward a social protection system that is coherent in terms of institutions, policies and programs
Over time, the demand for social care services is likely to increase, requiring the development of a regulatory and contracting framework for public-private partnerships with non-state providers. Increased rates of disability and chronic illness and family breakdown due to mobility and changing social mores will lead to growth in the size of the social care services sector. Hence, enhanced government capacities will be required to regulate the sector and to ensure basic standards. Licensing, accreditation and oversight standards are likely to evolve, and monitoring of performance is likely to move from an emphasis largely on quantitative indicators of performance to
91MALAYSIA ECONOMIC MONITOR | JUNE 2020
PART TWO - Surviving the Storm

With regard to ALMPs, duplication and fragmentation could be reduced by strengthening flagship programs that have been credibly evaluated and by discontinuing others. There is significant scope to improve the performance monitoring and evaluation of ALMPs and thereby to facilitate improved learning from their implementation. A first step could involve setting clearer performance parameters. Second, measures could be taken to ensure that performance management avoids overly standardized measures that may result in perverse provider behavior. Beyond performance monitoring, a deeper culture of program evaluation could produce significant benefits. A first step could be to increase and improve access to and the use of household-level data for program oversight and policy development. While Malaysia has a well-developed statistical system, restricted access to available data mean that rigorous assessments of ALMPs and social protection programs more generally are constrained. A second step would be to conduct rigorous program evaluations. A third step would be to expand and strengthen programs that have been credibly evaluated and to discontinue others. In addition, all new ALMPs would benefit from provisions for the changing nature of work, while existing ALMPs could be regularly reviewed and, if necessary, adjusted to remain relevant and effective. There is also significant room for expanding linkages between social assistance and ALMPs.
The full implementation of the HRDF’s National Workforce Human Capital Development Blueprint 2018-2025 could further improve the effectiveness of ALMPs. The Blueprint outlines measures to establish closer links between HRDF and employers, to leverage real-time labor market information, and to building stronger relationships with other agencies in Malaysia working on human capital development. For instance, while training brokered by HRDF is usually employer-centric, the EIS subsidizes training for its beneficiaries through the provision of a training fee and a training allowance. This leaves a significant gap in terms of training provisions for jobseekers not covered by the EIS, the self-employed, workers moving from one short-term contract to another, or those outside of “standard” employment relationships.
The development of an enhanced social protection system implies a strong role for the government, possibly entailing additional fiscal expenditures. A guiding principle underlying this report is progressive universalism, which implies gradually expanding coverage of risk-sharing instruments to meet higher societal expectations in line with the prevailing fiscal space. However, even gradual expansion may be
challenging in the context of the downward trend in government revenues and the fiscal shock of the COVID-19 pandemic. Malaysia’s collected revenues have been on a downward trend since 2012, driven by a confluence of factors, including the under-collection of personal and consumption taxes, the provision of generous tax incentives, and the failure to develop new sources of revenue. World Bank estimates suggest that in the wake of the COVID-19 pandemic the fiscal deficit could widen to as high as 7 percent of GDP (see above). In the medium and long term, there is a need for the government to diversify its revenue base and to increase its revenue collection through more progressive taxation in order to finance a more comprehensive social protection system. Thus, an enhanced social protection system will require a mixture of public policy measures on both the expenditure and revenue sides.
To survive the storm, there is a need to address challenges related to increasing revenue. To address these challenges, the following measures have been identified: First, the progressivity of the personal income tax framework could be increased, with a reassessment of current reliefs and exemptions, as a means both to increase revenue and to redistribute income. Second, capital gains taxes could be expanded, with explorations to assess the feasibility of other forms of taxes on non-earned income. Currently the real property gains tax is very restricted in application, with very generous reliefs. In Malaysia, inequality in wealth is significantly greater than inequality in income, so taxing a share of the gains made from asset price inflation could provide an important new source of public sector revenue. Third, indirect taxation could be broadened by restricting zero rated and exempted items to a more limited set of goods and services. A gradual lifting of the SST exemptions and zero-ratings on selected non-essential items, particularly those not within the B40 consumption basket, could facilitate increased revenue without jeopardizing the purchasing power of lower-income households. Efforts to increase the collection of indirect taxes could be accompanied by associated measures to increase progressivity elsewhere in the fiscal framework, such as through greater taxation on income and wealth, in addition to greater progressive social expenditures.
92 MALAYSIA ECONOMIC MONITOR | JUNE 2020
PART TWO - Surviving the Storm

TABLE 7Summary of policy recommendations for surviving the storm
Objectives From relief to recovery:Short- and medium-term policies
From recovery to an enhanced social protection system: Long-term policies
Promote equity through
protection against destitution
i. Continue to provide COVID-19 emergency cash transfers until income of B40 recovers
ii. Deepen social assistance:
• Use BSH/BR1M as a platform for human capital accumulation and productive welfare
• Reduce exclusion error through proactive outreach/enrollment
• Replace nontargeted fuel subsidies by a targeted allowance
iii. Improve the delivery of social protection programs:
• Move toward a more standardized and commonly implemented targeting system
• Achieve deeper integration or interoperability of information systems
• Consolidate front-end service delivery
iv. Update benchmarks for monetary and non-monetary deprivation
i. Formulate a Social Protection Masterplan based on a functional review of the social protection system
ii. Further deepen social assistance:
• Strengthen core social assistance programs in line with fiscal space
• Promote productive employment and the capacity of social/care workers
iii. Address increasing demand for non-cash support services, especially for older persons
iv. Reverse the downward trend in government revenues:
• Increase the progressivity of the personal income tax framework
• Expand the capital gains tax
• Restrict items that are SST zero rated or exempted
• Focus the use of tax incentives
Promote resilience for the vulnerable through insurance against the impact
of drops in well-being from shocks
i. Improve social assistance for older persons through a modest, broadly targeted social pension
ii. Strengthen the coverage of old-age income protection:
• Broaden the scope of contributions to cover the self-employed, possibly with auto enrollment and an option to opt out
• Work with aggregators, like gig economy platforms
iii. Strengthen the adequacy of old-age income protection:
• Gradually increase the minimum withdrawal age for EPF Account 1 balances to 65
• Convert contributions to EPF Account 2 to retirement savings
• Mandate a phased withdrawal for EPF balances
i. Further improve social assistance for older persons through a higher coverage or adequacy of social pensions in line with fiscal space
ii. Further strengthen the coverage and adequacy of old-age income protection:
• Unify registration requirements and contribution collection for EPF, SOCSO and HRDF
• Further increase the EPF minimum withdrawal age with increased life expectancy
• Consider lowering EPF contribution rates and capping covered wages subject to mandatory contributions
• Offer age-based portfolios, longevity insurance and annuitization options
Promote opportunity for all through the promotion of
human capital and the connection of workers to
productive employment
i. Promote a jobs recovery
• Provide targeted wage subsidies to firms that retain and hire workers
• Strengthen employment services that match workers and jobs, partnering with industry and education institutions
• Implement skills-building programs with a focus on skills that show promise in economic recovery
ii. Strengthen monitoring and evaluation of ALMPs with an emphasis on cost-effectiveness
i. Reduce duplication and fragmentation of ALMPs by strengthening flagship programs that have been credibly evaluated and discontinuing others
ii. Realize the HRDF Blueprint:
• Train individuals, displaced due to new skill requirements and technological change
• Foster even closer links with employers
• Leverage real-time labor market information to complement traditional survey data
93MALAYSIA ECONOMIC MONITOR | JUNE 2020
PART TWO - Surviving the Storm

ReferencesAlston, P. (2019). Statement by Professor Philip Alston, United Nations Special Rapporteur on extreme poverty and human rights, on his visit to Malaysia, 13-23 August 2019. Retrieved from: https://www.ohchr.org/en/NewsEvents/Pages/DisplayNews.aspx?NewsID=24912&LangID=E
Baldwin, R. and S. Evenett (2020). COVID-19 and Trade Policy: Why Turning Inward Won’t Work, London: Centre for Economic Policy Research
Banerjee, A., and E. Duflo (2007). “The Economic Lives of the Poor”, Journal of Economic Perspectives, 21: 141–67.
Bank Negara Malaysia (2018). “The Living Wage: Beyond Making Ends Meet”, Kuala Lumpur: Bank Negara Malaysia
Berita Harian (2020). RM153.24 juta diagih bantu asnaf sepanjang PKP. Retrieved from: https://www.bharian.com.my/berita/nasional/2020/04/676555/rm15324-juta-zakat-diagih-bantu-asnaf-sepanjang-pkp
Bureau of Economic Analysis (2018). “Activities of U.S. Multinational Enterprises: 2016”, Maryland: Bureau of Economic Analysis.
Chuah, L., N. Loayza and A. Schmillen (2018). “Race with – not against – the Machine”, Washington, DC: The World Bank.
Davis, S. (2019). Rising Policy Uncertainty. Retrieved from: http://www.policyuncertainty.com/media/Rising%20Policy%20Uncertainty.pdf
Espitia, Rocha and Ruta (2020). Database on COVID-19 trade flows and policies, Washington, DC: The World Bank. Retrieved from: https://www.worldbank.org/en/data/interactive/2020/04/02/database-on-coronavirus-covid-19-trade-flows-and-policies
Evans, D., and A. Popova (2017). “Cash Transfers and Temptation Goods”, Economic Development and Cultural Change, 21: 189–221.
Freund, C. (2020). Governments could bring supply chains home. It would defy economic rationality. Barron’s.
Gentilini, U. (2016). “Revisiting the ‘Cash versus Food’ Debate: New Evidence for an Old Puzzle?” World Bank Research Observer, 31: 135–67.
Government Transformation Program (GTP) (2013). Annual Report. Putrajaya: Prime Minister’s Department.
Heller, P. S. (2005). “Understanding Fiscal Space.” IMF Policy Discussion Paper 05/4, International Monetary Fund, Washington, DC.
HRDF (2018). “National Workforce Human Capital Development Blueprint 2018-2025.” Kuala Lumpur: Human Resources Development Fund.
IMF (2018). “Assessing Fiscal Space: An Update and Stocktaking.” IMF Policy Paper, Washington, DC: International Monetary Fund.
Khemani, S. (2020). “An Opportunity to Build Legitimacy and Trust in Public Institutions in the Time of COVID-19” (English). Research & Policy Briefs; no. 32. Washington, DC: The World Bank. http://documents.worldbank.org/curated/en/355311588754029852/An-Opportunity-to-Build-Legitimacy-and-Trust-in-Public-Institutions-in-the-Time-of-COVID-19
Kose, M. A., S. Kurlat, F. Ohnsorge, and N. Sugawara (2017). “A Cross-Country Database of Fiscal Space.” Policy Research Working Paper 8157, Washington, DC: The World Bank.
KPMG (2020). “Rise of the Gig Worker in the Robot Century”, Canberra: KPMG.
Ley, E. (2009). “Fiscal Policy for Growth” PREM Note 131, Washington, DC: The World Bank.
94 MALAYSIA ECONOMIC MONITOR | JUNE 2020

McKinsey (2020). Digital strategy in a time of crisis. Retrieved from: https://www.mckinsey.com/business-functions/mckinsey-digital/our-insights/digital-strategy-in-a-time-of-crisis
Nor, R. M. and Khelghat-Doost, H. (2019). “1AZAM Programme: The Challenges and Prospects of Poverty Eradication in Malaysia”, International Journal of Academic Research in Business and Social Sciences, 9: 345–356.
OECD (2015). “Activation Policies for More Inclusive Labour Markets”, in OECD (2015), Employment Outlook. Paris: Organisation for Economic Co-operation and Development.
Pick, A. (2017). “Fiscal space in developing countries: It’s about revenues”. Retrieved from: https://oecd-development-matters.org/2017/06/13/fiscal-space-in-developing-countries-its-about-revenues/
Qiang, C. et al., (2020). Foreign direct investment and global value chains in the wake of COVID-19. Washington, DC: The World Bank. Retrieved from: https://blogs.worldbank.org/psd/foreign-direct-investment-and-global-value-chains-wake-covid-19
Rabi, A., Mansor N., Awang H. and Kamarulzaman N.D., (2019). “Longevity Risk and Social Old-Age Protection in Malaysia: Situation Analysis and Options for Reform.” Retrieved from: http://swrc.um.edu.my/wp-content/uploads/2020/01/20191230-old-age-protection-for-publication.pdf
Ravallion, M. (2019). “Has Malaysia Virtually Eliminated Poverty?” Economics and Poverty, January 21, 2019. Retrieved from: https://economicsandpoverty.com/2019/01/21/has-malaysia-virtually-eliminated-poverty/
Shih, W. (2020). “Bringing manufacturing back to the U.S. is easier said than done.” Harvard Business Review.
Stankova, O. I. (2019). “Frontiers of Economic Policy Communications,” IMF Departmental Papers / Policy Papers 19/08, Washington, DC: International Monetary Fund.
UNCTAD (2013). World Investment Report: Global Value Chains: Investment and Trade for Development, Geneva: United Nations Conference on Trade and Development.
UNCTAD (2020a). The Covid-19 Shock to Developing Countries: Towards a “Whatever it Takes” Programme for the Two-Thirds of the World’s Population being Left Behind, Geneva: United Nations Conference on Trade and Development.
UNCTAD (2020b). Impact for the COVID-19 Pandemic on Global FDI and GVCs, Geneva: United Nations Conference on Trade and Development.
World Bank (2008). The World Bank Pension Conceptual Framework, Washington, DC: The World Bank.
World Bank (2012). World Bank Social Protection and Labor Strategy: Resilience, Equity, and Opportunity, Washington, DC: The World Bank.
World Bank (2014) Developing Skills for Innovation and a High-Income Economy in Malaysia, Washington, DC: The World Bank.
World Bank (2015). Social Protection for a Productive Malaysia, Washington, DC: The World Bank.
World Bank (2016). Live Long and Prosper, Washington, DC: The World Bank.
World Bank (2018). The State of Social Safety Nets, Washington, DC: The World Bank.
World Bank (2019a). Breaking Barriers – Toward Better Economic Opportunities for Women in Malaysia, Washington, DC: The World Bank.
World Bank (2019b). Protecting All – Risk Sharing for a Diverse and Diversifying World of Work, Washington, DC: The World Bank.
95MALAYSIA ECONOMIC MONITOR | JUNE 2020
References
World Bank (2019c). Malaysia Economic Monitor, December 2019: Making Ends Meet, Washington, DC: The World Bank.
World Bank (2019d). Sourcebook on the Foundations of Social Protection Delivery Systems, Washington, DC: The World Bank.
World Bank (2020a). Global Economic Prospects – Lasting Scars of the COVID-19 Pandemic, Washington, DC: The World Bank.
World Bank (2020b). Malaysia’s experience with the SME Masterplan: Lessons Learned, Washington, DC: The World Bank.
World Bank (forthcoming). What will it take? Malaysia’s ambition to become a High-Income and Developed Economy, Washington, DC: The World Bank.
World Bank (forthcoming). Global Value Chains: An Investment Perspective, Washington, DC: The World Bank.
World Health Organization (2003). Global Conference on Severe Acute Respiratory Syndrome (SARS): Where do we go from here? [summary report], Kuala Lumpur.
Yap O.F. (2018) Government’s Credible Accountability and Strategic Policy Capacity: Evidence from the Asian NICs of Taiwan, South Korea, Malaysia, and Singapore. In: Wu X., Howlett M., Ramesh M. (eds) Policy Capacity and Governance. Studies in the Political Economy of Public Policy, Palgrave Macmillan.
96 MALAYSIA ECONOMIC MONITOR | JUNE 2020
References

CONNECT WITH US
wbg.org/Malaysia
@WorldBankMalaysia
@WB_AsiaPacific
http://bit.ly/WB_blogsMY