Embed Size (px)
Citation preview

1
Comprehensive
food security
and
vulnerability
analysis
(CFSVA)
and
nutrition
assessment
Malawi
October 2012

2
ACKNOWLEDGMENTS
he State of Food Security and Nutrition in Malawi was prepared under the overall
coordination of Cinzia Papavero, Katy Williams and Siemon Hollema. Astrid Mathiassen
provided technical support. Rogerio Bonifacio provided a risk analysis based on climate and
weather data and Rossella Bottone supported the market analysis. Oscar Gobbato prepared the
maps presented in the report. Thanks also to Shelton Kanyanda who oversaw the survey for the
Malawi National Statistical Office and to Talip Kilic, research economist in the World Bank’s Living
Standards Measurement Study Team, and co-ordinator of the Integrated Surveys on Agriculture
Project in Malawi and Uganda.
For questions or comments concerning any aspect of the food security and vulnerability analysis
please contact:
WFP Country Office, Malawi
Lazarus Gonani Head of VAM [email protected]
Daniele Barelli VAM officer [email protected]
WFP Headquarters, Italy
Astrid Mathiassen Researcher [email protected]
Katy Williams Writer [email protected]
National Statistics Office, Malawi
Shelton Kanyanda NSS Coordinator [email protected]
T

3
Table of contents
Acknowledgments ................................................................................................................................... 2
Key findings ............................................................................................................................................. 5
Foreword ................................................................................................................................................. 6
How to measure food security and nutrition ......................................................................................... 8
THE STATE OF FOOD SECURITY AND NUTRITION ................................................................................. 12
Food deficiency .................................................................................................................................... 12
Food diversity ........................................................................................................................................ 12
The food consumption score ................................................................................................................ 13
Seasonality of food shortages ............................................................................................................... 15
Reduced coping index ........................................................................................................................... 18
Major regional differences for food deficits ......................................................................................... 19
Malnutrition – stunting is ‘critical’ in central Malawi ........................................................................... 21
WHO ARE THE FOOD INSECURE? .......................................................................................................... 24
The poor ................................................................................................................................................ 24
Households headed by a woman .......................................................................................................... 24
Households with a high number of dependents and those with an orphaned child ........................... 28
Households headed by an elderly person (over 64) ............................................................................. 28
Households with a member who is chronically sick ............................................................................. 29
Households with less than adequate sanitation and drinking water facilities ..................................... 29
Households with an uneducated head ................................................................................................. 30
Agricultural workers and those dependent on ganyu for income ........................................................ 31
Households that have lower crop yields ............................................................................................... 31
ANALYSIS – WHAT ARE THE MAIN ISSUES BEHIND FOOD INSECURITY AND MALNUTRITION? ........... 33
Issue 1 - Widespread poverty ........................................................................................................... 33

4
Issue 2 - Fragile macroeconomic stability ......................................................................................... 36
Issue 3: Low levels of education ....................................................................................................... 38
Issue 4: Land pressure and low yields ............................................................................................... 39
Issue 5 - “Maize is our life” ............................................................................................................... 41
Issue 6 – Climatic shocks and natural disasters ................................................................................ 42
CONCLUSION ......................................................................................................................................... 44

5
Key findings
The food supply situation in Malawi is extremely
precarious. The destruction of crops by lack of rainfall and
floods combined with spiralling food and fuel prices
combine to create a perfect storm for severe food
insecurity.
Nationally almost half of Malawians are food energy
deficient. In five southern districts (Phalombe, Chikwawa,
Nsanje, Machinga and Mulanje) more than 55% of
households are energy deficient. In the central district of
Lilongwe some 63% are lacking food energy.
Malawians are highly maize dependent with three
quarters of their food energy coming from nsima1.
Northern and central Malawians are even more maize
dependent than in 2004.
Dietary diversity has improved in the last seven years
especially in urban Malawi. Still, around one in three rural
households have low diversity.
One in four households or 3.1 million people have inadequate food consumption. Almost
half a million people (3.5%) or about 100,000 households have poor consumption - they are
mainly surviving on nsima with sparse amounts of vegetable relish.
Food shortages are seasonal with the lean season starting from November, when
households become market dependent and prices rise, and usually lasting until March.
More than half of southern households face seasonal deficits which they blame almost
exclusively on erratic rains and prolonged dry spells.
Shortages in central Malawi – also experienced by more than half of households – are
attributed to lack of farm inputs and small land size. For urban households it is food prices
that drive scarcity.
Stunting, a key indicator of chronic malnutrition, is much improved since 2004 but levels are
still serious with more than one in three children stunted. Prevalence is higher in urban and
central Malawi.
1 Nsima is a staple food in Malawi and made from ground maize flour
Photo: Andrew Thorne
6
Foreword
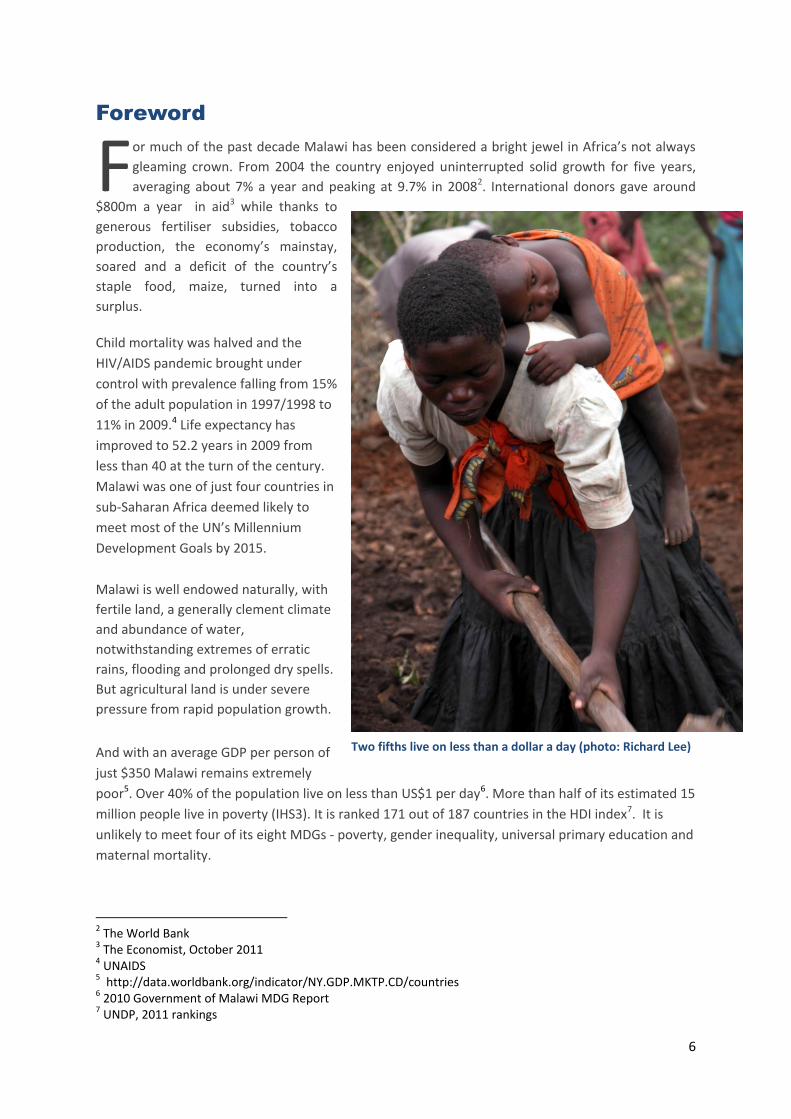
or much of the past decade Malawi has been considered a bright jewel in Africa’s not always
gleaming crown. From 2004 the country enjoyed uninterrupted solid growth for five years,
averaging about 7% a year and peaking at 9.7% in 20082. International donors gave around
$800m a year in aid3 while thanks to
generous fertiliser subsidies, tobacco
production, the economy’s mainstay,
soared and a deficit of the country’s
staple food, maize, turned into a
surplus.
Child mortality was halved and the
HIV/AIDS pandemic brought under
control with prevalence falling from 15%
of the adult population in 1997/1998 to
11% in 2009.4 Life expectancy has
improved to 52.2 years in 2009 from
less than 40 at the turn of the century.
Malawi was one of just four countries in
sub-Saharan Africa deemed likely to
meet most of the UN’s Millennium
Development Goals by 2015.
Malawi is well endowed naturally, with
fertile land, a generally clement climate
and abundance of water,
notwithstanding extremes of erratic
rains, flooding and prolonged dry spells.
But agricultural land is under severe
pressure from rapid population growth.
And with an average GDP per person of
just $350 Malawi remains extremely
poor5. Over 40% of the population live on less than US$1 per day6. More than half of its estimated 15
million people live in poverty (IHS3). It is ranked 171 out of 187 countries in the HDI index7. It is
unlikely to meet four of its eight MDGs - poverty, gender inequality, universal primary education and
maternal mortality.
2 The World Bank 3 The Economist, October 2011 4 UNAIDS 5 http://data.worldbank.org/indicator/NY.GDP.MKTP.CD/countries 6 2010 Government of Malawi MDG Report 7 UNDP, 2011 rankings
F
Two fifths live on less than a dollar a day (photo: Richard Lee)

7
Crops being destroyed
by drought and floods
coupled with spiralling
food prices combine to
create a perfect storm
for severe food
insecurity
Malawi fares far worse than other countries in southern Africa on key measures of education quality
and access and the country has a real shortage of skilled workers with the skills gap not being
effectively addressed by universities and technical institutions.
Electricity is unreliable. The current installed capacity is far less than
the estimated demand and only 7% of the population has access to
electricity services. Malawi is not connected to the regional grid,
hence faces shortages while it is trying to develop its domestic sources
of power. The fuel and electricity shortages are contributing to low
economic activity and productivity.8
In June 2011 the IMF criticised Malawi for failing to comply with
conditions set for access to a $79m loan that had been previously agreed. This led Western donors
to suspend their budgetary support which represented about a fifth of total government spending.
Matters were made worse by a slump in tobacco prices in 2011 as tobacco is the country’s second-
biggest source of foreign currency after aid. The suspension of budget support and poor tobacco
sales were major contributors to the shortage of foreign exchange in the country.
With forex in such short supply, fuel and medicine began to run short and businesses were unable to
import critical components for production. Sometimes fuel pumps remained dry for two weeks in a
row, inevitably pushing the cost of food higher.
In spring 2012, in an effort to tackle the country’s grave economic woes, the Malawi kwacha was
devalued by 49%, which was a key component in resuming talks with the IMF. But the devaluation,
coupled with inflation of 20.1%, significantly increased the price of basic goods and services and
significantly lowered consumer purchasing power.
If growing and harvesting conditions remain favourable Malawi has enough food nationally. If fuel
and food prices remain under control access to this food is not such a problem. But when fuel is in
short supply and only available on the black market, by the time maize is transported from the
surplus north to the deficit south it is prohibitively expensive. Crops being destroyed by lack of rain
and floods coupled with spiralling food prices combine to create a perfect storm for severe food
insecurity.
At the peak of the lean season in January this year maize prices were spiralling mainly because of the
fuel crisis, and at a time when people had little cash as it was nine months since the harvest. Some
201,8549 were assessed to be at high risk of food insecurity and be dependent on food aid in parts of
Nsanje, Chikhwawa, Balaka, Blantyre, Chiradzulu, Mwanza, Neno, Phalombe, Zomba and Ntcheu,
where rainfall is most erratic and dry spells most pronounced.
Large parts of Malawi are again expected to suffer from food insecurity this year. Agricultural
production estimates for the 2012 harvest season show a decrease in maize production by as much
as 40% in some areas, following poor onset and erratic distribution of rains in the country. The
Malawi Vulnerability and Assessment Committee (MVAC) estimates low cash crop production and
sales combined with high food prices, local currency devaluation and fuel supply instability will
contribute to a food emergency that puts almost two million people (1,972,993) in 16 mainly
southern districts in need of humanitarian assistance to meet basic food needs between August
8 The World Bank 9 The Malawi Vulnerability Assessment Committee vulnerability forecast April 2011 – March 2012

8
2012 and March 2013. This represents a 21% increase from MVAC’s July 2012 projection of
1,630,007.
An initial Food Insecurity Response Plan with an estimated budget of $48 million was presented by
the Government of Malawi with the support of the humanitarian partners in August 2012.
This report provides an update on the food and nutrition security findings of IHS2, which was
published in 2004. It assesses the causes of food and nutrition insecurity and the current major
issues that will expose Malawians to further risk, revealing the pockets of vulnerability where
targeted assistance may be required. It identifies potential ways to mitigate food and nutrition
insecurity.
How to measure food security and nutrition
ood security defines a situation in which all people at all times have physical and economic
access to sufficient, safe and nutritious food which meets their dietary needs and food
preferences for an active and healthy life (FAO, 1996).
This report provides an overview of food security at the national (urban and rural) and regional level
in Malawi. Food security depends upon three main factors:
1. Availability of food - This is the extent to which sufficient quantity and quality of food is
physically present in an area. This includes food found in markets, produced on local farms
or home gardens or provided as food aid or gifts
2. Access to food - Even if food is available people cannot always access it. Food access is
ensured when communities, households and all individuals have enough resources to obtain
sufficient quantity and quality of food for a nutritious diet through a combination of home
production, stocks, purchase, barter, gifts, borrowing or food aid.
3. Utilization of food - Even if food is available and can be accessed, inadequate utilisation of it
will lead to malnutrition. Proper child care, providing a diet with enough energy and
nutrients, safe drinking water, adequate sanitation as well as knowledge of food storage,
processing, illness management and basic nutrition are essential to achieving adequate food
utilization.
The nutritional status of a population can be assessed by anthropometric measurements of the most
vulnerable i.e., children under the age of five, as well as micro-nutrient measurements such as
anaemia prevalence rates.
The critical period is the first thousand days of a child’s life. When deprived of nutritious food, a
child’s physical development is impaired and he or she matures into an adult that is less likely to
reach his or her cerebral potential and is more prone to disease. This adult will be less productive
with a far greater likelihood of being stuck in poverty, thereby perpetuating the cycle of food
insecurity and malnutrition.
F

9
Malnutrition is not a simple problem with a single cause and silver bullet solution. Its immediate
causes are inadequate dietary intake and illness which can create a vicious circle: a malnourished
child’s resistance to illness is lowered and when he/she falls ill, malnourishment worsens. Children
entering this malnutrition-infection cycle can fall into a potentially fatal spiral as one condition feeds
off the other.
These immediate causes are related to underlying causes: inadequate access to food in a household,
insufficient health services, an unhealthy living environment and inadequate care for women and
children.
There is no single measure to judge a nation’s food security and nutrition status, but a variety of
measurement techniques to provide an insight into the varying aspects of consumption and
nutrition. This report utilizes data from the third Integrated Household Survey (IHS3), collected
between March 2010 and March 2011 conducted by the Government National Statistics Office.
The state of household food insecurity can be assessed by:
Measuring the quantity of food
that its members consume10 Households consuming fewer than a threshold amount of calories
required to stay healthy and conduct physical activity can be classified as
food insecure. Daily energy consumption needs vary according to the age,
sex and activity levels of HH members ( FAO 2004). For instance adult men
(aged under 60 years) doing moderate activity require 3000 kcal a day and
women 2,375kcal. Further a 9-10 year old girl doing light activity needs
1,575 kcal while a 17-18 year old boy doing heavy activity requires 3,925
kcal. The average person needs 2,100 calories a day to lead a healthy life –
though extra is needed during pregnancy and lactation. When it lacks
energy the body compensates by slowing down its physical and mental
activities. A hungry mind cannot concentrate, a hungry body does not take
initiative, a hungry child loses all desire to play and study.
Measuring the quality/diversity
of food that its members
consume11
Households consuming a one-sided, non-diverse and unhealthy diet can
be classified as food insecure. Hungry people spend a larger share, if not
all, of their food budget on stomach-filling staples, such as rice and wheat,
which provide cheap sources of calories. They forfeit more nutritious
items that provide proteins and micro-nutrients. Therefore the less varied
the food intake by members of a household, the more likely it is to be food
insecure. Dietary diversity can be captured by simply measuring the
number of food groups (out of seven) that a household consumes over a
reference period of seven days. Households consuming fewer than four
food groups are considered to have low diversity. The seven food groups
are: cereals, tubers and root crops; pulses; vegetables; fruit; meat and fish;
milk; oil12.
10 http://www.ifpri.org/sites/default/files/pubs/pubs/fspractice/sp3/sp3.pdf 11 ibid 12 Sugar is included in the computation of the FCS but not in the dietary diversity.

10
Calculating the food
consumption score (FCS)13,
This combines food diversity, food frequency (the number of days each
food group is consumed) and the relative nutritional importance of
different food groups. The FCS uses standardized thresholds that
subsequently divide households into three groups: poor food
consumption, borderline food consumption and acceptable food
consumption.
Measuring coping strategy
index14
When confronted with sudden negative events such as a natural disaster,
food price rises, illness of household member or loss of employment etc
households compromise by, for example, buying cheaper products and/or
switching to less preferred food, limiting portion size and reducing the
number of meals eaten in a day. These coping mechanisms may have
severe nutritional impacts. A reduced coping strategy index (CSI)
calculation, based on the frequency and severity of coping strategies for
households reporting food consumption problems, can be an indicator of
food insecurity. Higher CSI scores indicate a more serious food security
situation, and lower scores, a better one. Weights are assigned to
different coping strategies according to their severity. So ‘relying on less
preferred and/or less expensive foods’, ‘limiting portion size at meal
times’ and ‘reducing the number of meals eaten in a day’ score one.
‘Borrowing food or relying on help from a friend or relative’ score two,
while ‘restricting adults’ consumption to allow small children to eat’ is
given three.
Measuring nutrition This compares the anthropometric indicators for children under the age of
five (stunting, wasting and underweight) against a healthy reference
population as defined by the WHO. Stunting or low height-for-age is
defined as having a height at least two standard deviations below the
median height for a reference population. Stunting among children is a
strong nutritional indicator for chronic food insecurity as insufficient
macro and micro nutrient intake translates into reduced child growth.
Underweight or low weight-for-age is similarly defined and reflects both
chronic and acute malnutrition. Wasting is based on standardized weight-
for-height and low values can be a measure of acute malnutrition.
Food security can be transitory or chronic in nature. Transitory food insecurity is of a temporary
nature caused by a negative event such as a natural disaster, illness of household member or loss of
employment. Chronic food insecurity is the persistent inability of a household to meet its dietary
needs over a long period. Its main underlying cause is poverty and is characterized by seasonal
shortages of food. Transitory food insecurity can lead to chronic food insecurity.
13 http://documents.wfp.org/stellent/groups/public/documents/manual_guide_proced/wfp203207.pdf 14 http://documents.wfp.org/stellent/groups/public/documents/manual_guide_proced/wfp211058.pdf
11
Data analysis and sources
The primary data analyzed in this report come from the third integrated household survey (IHS3) that was conducted from
March 2010 to March 2011 covering a period of 12 months. The government of Malawi implemented the survey and the
LSMS-ISA project of the World Bank supported the work on the IHS3 as part of a multi-donor support of the IHS programme.
It is a nationally representative sample survey designed to provide information on the various aspects of household welfare in
Malawi. It collected information from a sample of 12,267 households statistically designed to be representative at both
national and district level providing reliable estimates for these levels.
More details about the survey methodology can be found at:
http://siteresources.worldbank.org/INTLSMS/Resources/3358986-1233781970982/5800988-
1271185595871/IHS3.BID.FINAL.pdf
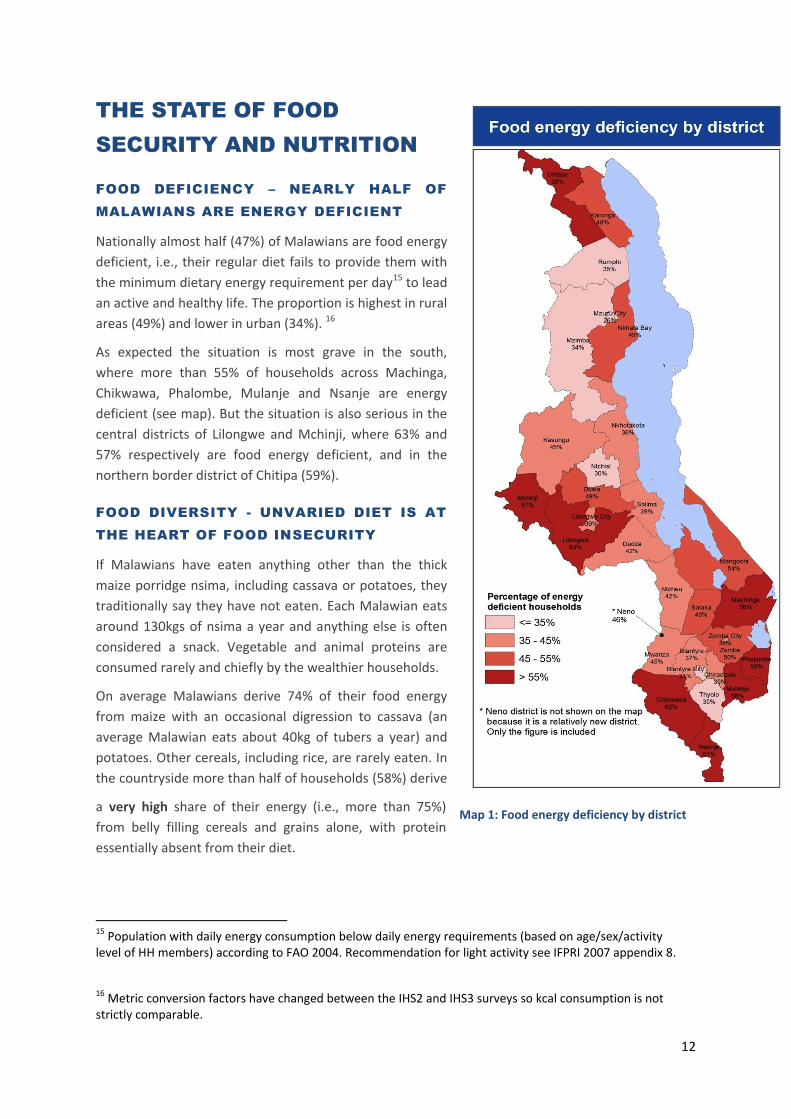
The above illustrates the complexity of measuring food security outcomes. People have choices and
when having to make compromises they can either reduce the quantity or the diversity of their food
consumption. However both are measures of food insecurity. Households that meet both the
quantity and quality thresholds are classified as food secure while those that are unable to meet one
or either are food insecure.
12
THE STATE OF FOOD
SECURITY AND NUTRITION
FOOD DEFICIENCY – NEARLY HALF OF
MALAWIANS ARE ENERGY DEFICIENT
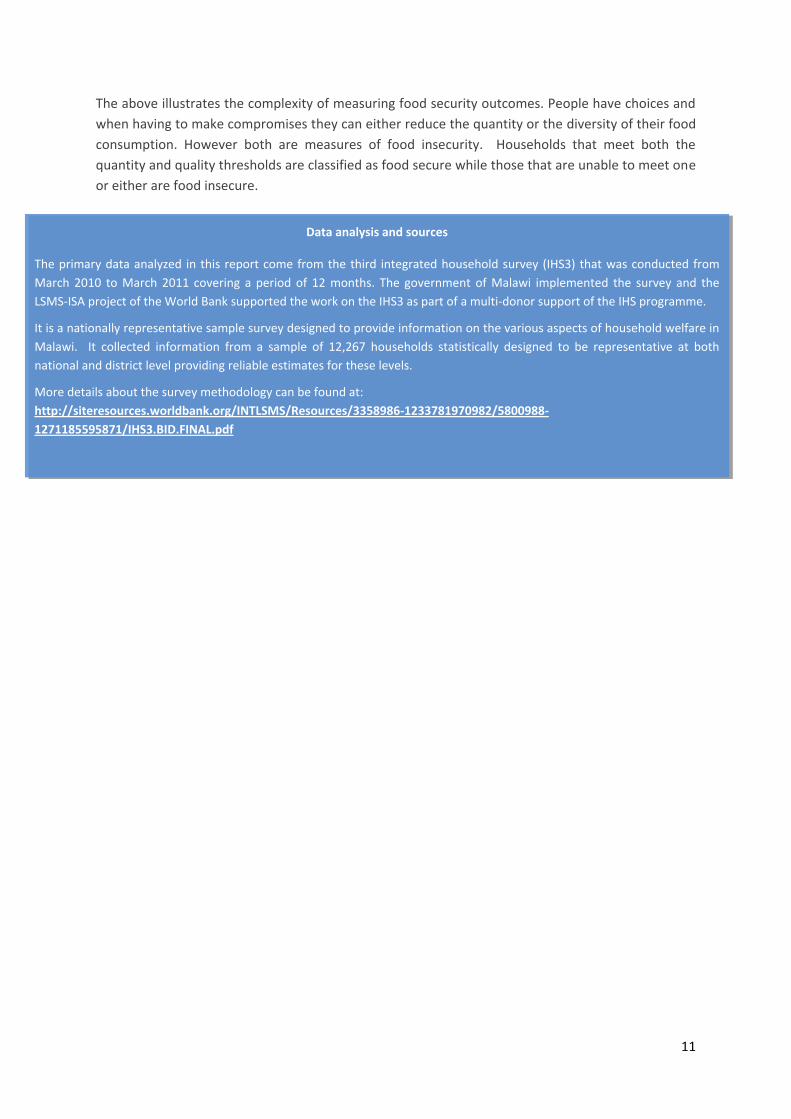
Nationally almost half (47%) of Malawians are food energy
deficient, i.e., their regular diet fails to provide them with
the minimum dietary energy requirement per day15 to lead
an active and healthy life. The proportion is highest in rural
areas (49%) and lower in urban (34%). 16
As expected the situation is most grave in the south,
where more than 55% of households across Machinga,
Chikwawa, Phalombe, Mulanje and Nsanje are energy
deficient (see map). But the situation is also serious in the
central districts of Lilongwe and Mchinji, where 63% and
57% respectively are food energy deficient, and in the
northern border district of Chitipa (59%).
FOOD DIVERSITY - UNVARIED DIET IS AT
THE HEART OF FOOD INSECURITY
If Malawians have eaten anything other than the thick
maize porridge nsima, including cassava or potatoes, they
traditionally say they have not eaten. Each Malawian eats
around 130kgs of nsima a year and anything else is often
considered a snack. Vegetable and animal proteins are
consumed rarely and chiefly by the wealthier households.
On average Malawians derive 74% of their food energy
from maize with an occasional digression to cassava (an
average Malawian eats about 40kg of tubers a year) and
potatoes. Other cereals, including rice, are rarely eaten. In
the countryside more than half of households (58%) derive
a very high share of their energy (i.e., more than 75%)
from belly filling cereals and grains alone, with protein
essentially absent from their diet.
15 Population with daily energy consumption below daily energy requirements (based on age/sex/activity level of HH members) according to FAO 2004. Recommendation for light activity see IFPRI 2007 appendix 8.
16 Metric conversion factors have changed between the IHS2 and IHS3 surveys so kcal consumption is not strictly comparable.
Map 1: Food energy deficiency by district
13
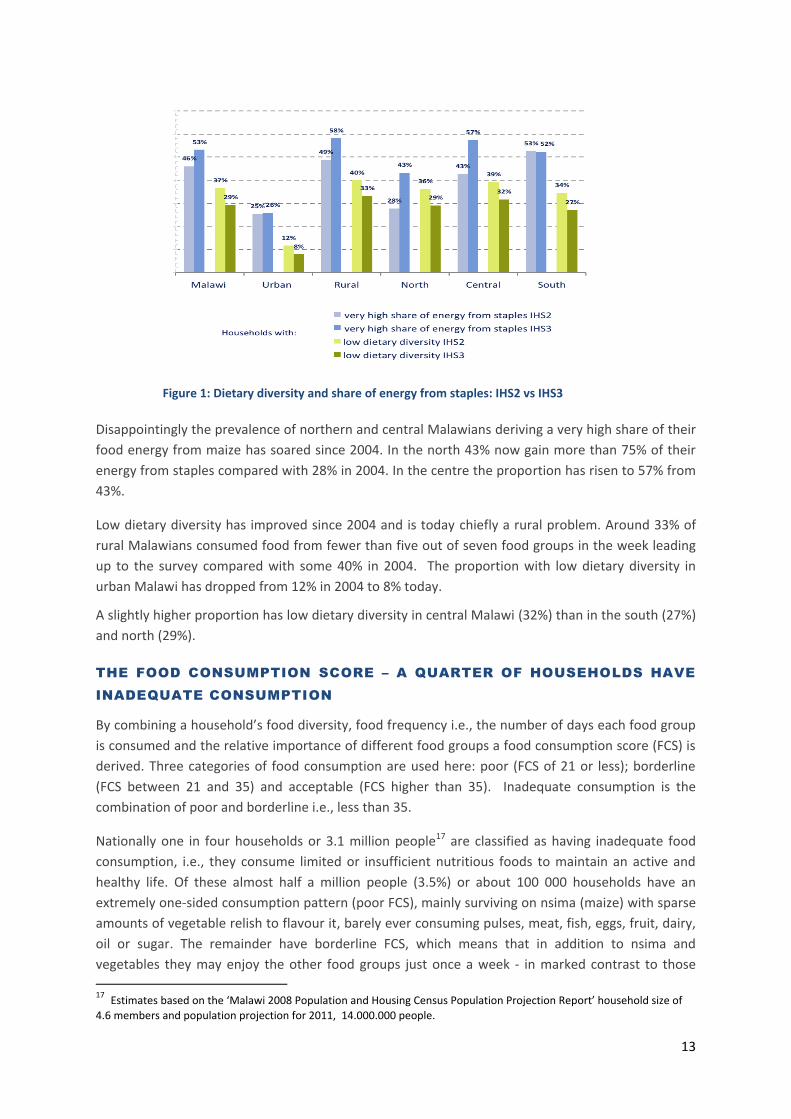
Disappointingly the prevalence of northern and central Malawians deriving a very high share of their
food energy from maize has soared since 2004. In the north 43% now gain more than 75% of their
energy from staples compared with 28% in 2004. In the centre the proportion has risen to 57% from
43%.
Low dietary diversity has improved since 2004 and is today chiefly a rural problem. Around 33% of
rural Malawians consumed food from fewer than five out of seven food groups in the week leading
up to the survey compared with some 40% in 2004. The proportion with low dietary diversity in
urban Malawi has dropped from 12% in 2004 to 8% today.
A slightly higher proportion has low dietary diversity in central Malawi (32%) than in the south (27%)
and north (29%).
THE FOOD CONSUMPTION SCORE – A QUARTER OF HOUSEHOLDS HAVE
INADEQUATE CONSUMPTION
By combining a household’s food diversity, food frequency i.e., the number of days each food group
is consumed and the relative importance of different food groups a food consumption score (FCS) is
derived. Three categories of food consumption are used here: poor (FCS of 21 or less); borderline
(FCS between 21 and 35) and acceptable (FCS higher than 35). Inadequate consumption is the
combination of poor and borderline i.e., less than 35.
Nationally one in four households or 3.1 million people17 are classified as having inadequate food
consumption, i.e., they consume limited or insufficient nutritious foods to maintain an active and
healthy life. Of these almost half a million people (3.5%) or about 100 000 households have an
extremely one-sided consumption pattern (poor FCS), mainly surviving on nsima (maize) with sparse
amounts of vegetable relish to flavour it, barely ever consuming pulses, meat, fish, eggs, fruit, dairy,
oil or sugar. The remainder have borderline FCS, which means that in addition to nsima and
vegetables they may enjoy the other food groups just once a week - in marked contrast to those
17 Estimates based on the ‘Malawi 2008 Population and Housing Census Population Projection Report’ household size of
4.6 members and population projection for 2011, 14.000.000 people.
Figure 1: Dietary diversity and share of energy from staples: IHS2 vs IHS3

14
classed as having acceptable food
consumption. The latter balance their daily
diet of cereals/grains and vegetables with
roots, tubers, pulses, meat, fish, eggs and fruit
on three days a week, oil on four days and,
less healthily, sugar on as many as five. The
wealthiest quintile consume sugar and oil six
days a week, demonstrating how increased
wealth does not necessarily lead to a
healthier, more varied diet, but one that may
be more laden with fats and sugar.
Again there is a marked contrast between
rural and urban areas. Some 29% of rural
households have inadequate food
consumption compared with just 7% of urban.
Urban households tend to have a more
protein-rich diet and are more likely to
consume dairy, oil and sugar.
But as the map shows some 13 districts
throughout the country have more than 30%
of households with inadequate food
consumption peaking at more than 40% in
Chikwawa and Phalombe in the south. It is
worth noting that the distribution of
households with inadequate food
consumption by district is comparable with
the distribution of those with energy
deficiency.
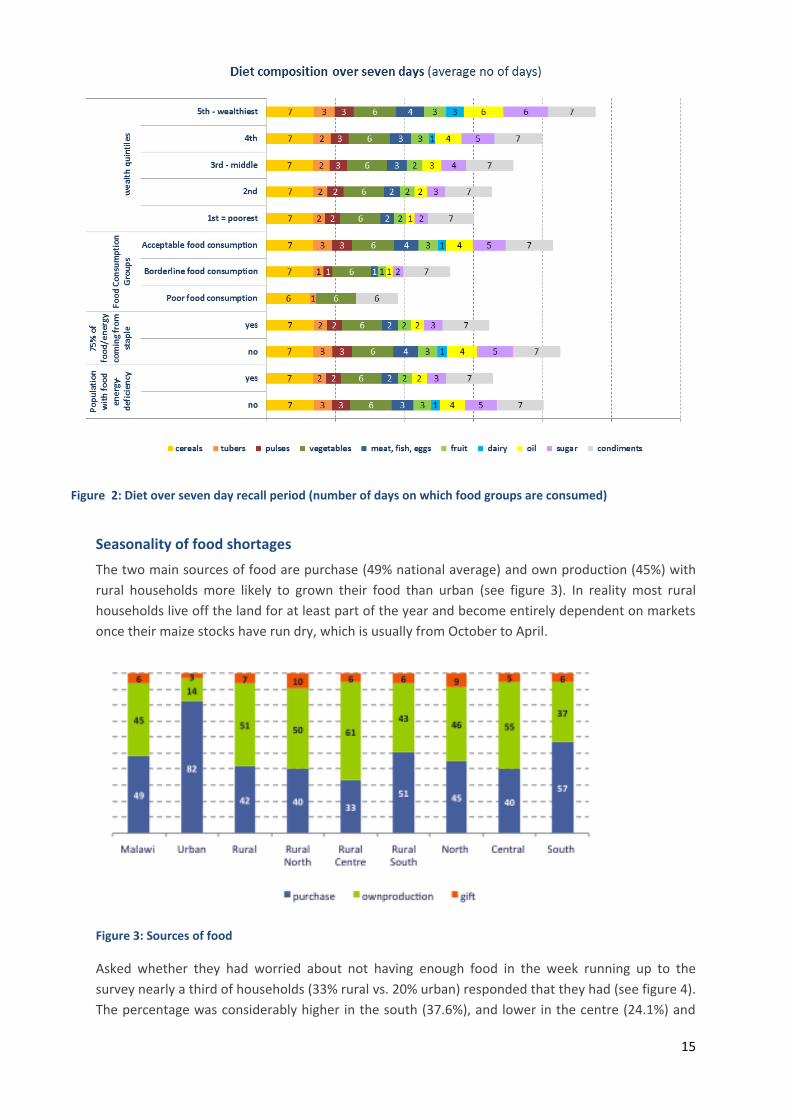
Regardless of milieu or social status Malawians
eat cereals every day and vegetables almost
daily. Although farmers may keep goats
and/or cattle, dairy is rarely consumed outside
the cities where it is consumed about twice a
week. As figure 2 shows, the poorer the household (with the wealth index here used as the indicator
of poverty) the less likely it is to eat meat, fish, eggs, fruit, dairy, oil and sugar.
Map 2: Inadequate food consumption by district
15
Seasonality of food shortages
The two main sources of food are purchase (49% national average) and own production (45%) with
rural households more likely to grown their food than urban (see figure 3). In reality most rural
households live off the land for at least part of the year and become entirely dependent on markets
once their maize stocks have run dry, which is usually from October to April.
Figure 3: Sources of food
Asked whether they had worried about not having enough food in the week running up to the
survey nearly a third of households (33% rural vs. 20% urban) responded that they had (see figure 4).
The percentage was considerably higher in the south (37.6%), and lower in the centre (24.1%) and
Figure 2: Diet over seven day recall period (number of days on which food groups are consumed)

16
north (26.9%).The lower the wealth quintile the more they likely they are to have faced this anxiety.
In 15 out of 27 districts more than half of households reported having had a time when they didn’t
have enough food in the year preceding the survey with shortages peaking in February 2010. Some
districts fared even worse. In Chikwawa and Nsanje more than 80% said they experienced food
shortages in the past 12 months while in Dowa, Dezna and Balaka the proportion was over 70%.
Food shortages tend to be seasonal, regardless of their cause. (See seasonal calendar, figure 8). This
stems from the importance of home production in total food consumption combined with the lack of
irrigation and the fact that the vast majority of landholdings are too small to cover household needs.
Even minor water shortages can have devastating effects on crop yields – especially when shortages
occur during the flowering stage of the staple crop, maize. The lean season starts from November,
when stocks from the main harvest have run dry and as result food prices climb, until the beginning
of the harvest in March.
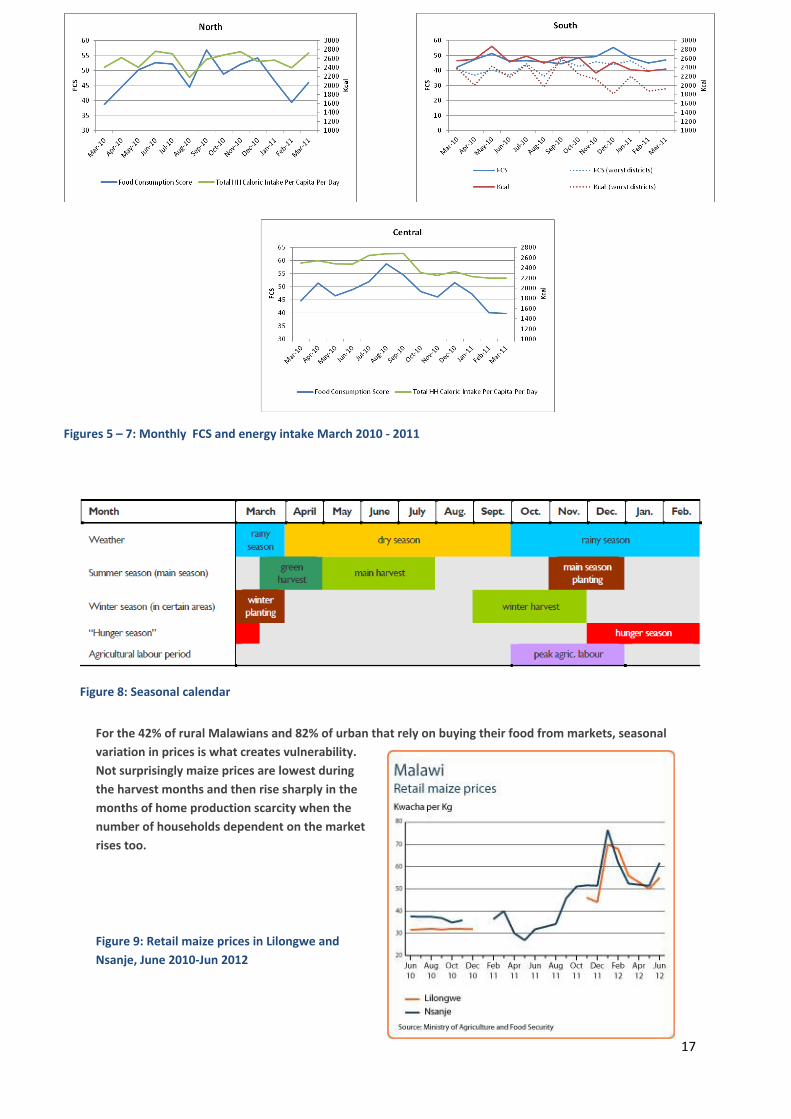
As figures 5-7 show average per capita daily calorific consumption is higher during the months
following the harvest (May-August). There tends to be a steady decline in daily calorie consumption
and FCS from September (with a slight rise in December, probably for Christmas) until it picks up in
March. The decline in energy consumption for the worst hit districts in the south is considerably
more marked.
Figure 4: Percentage of households worried about food shortages in seven days preceding the survey
17
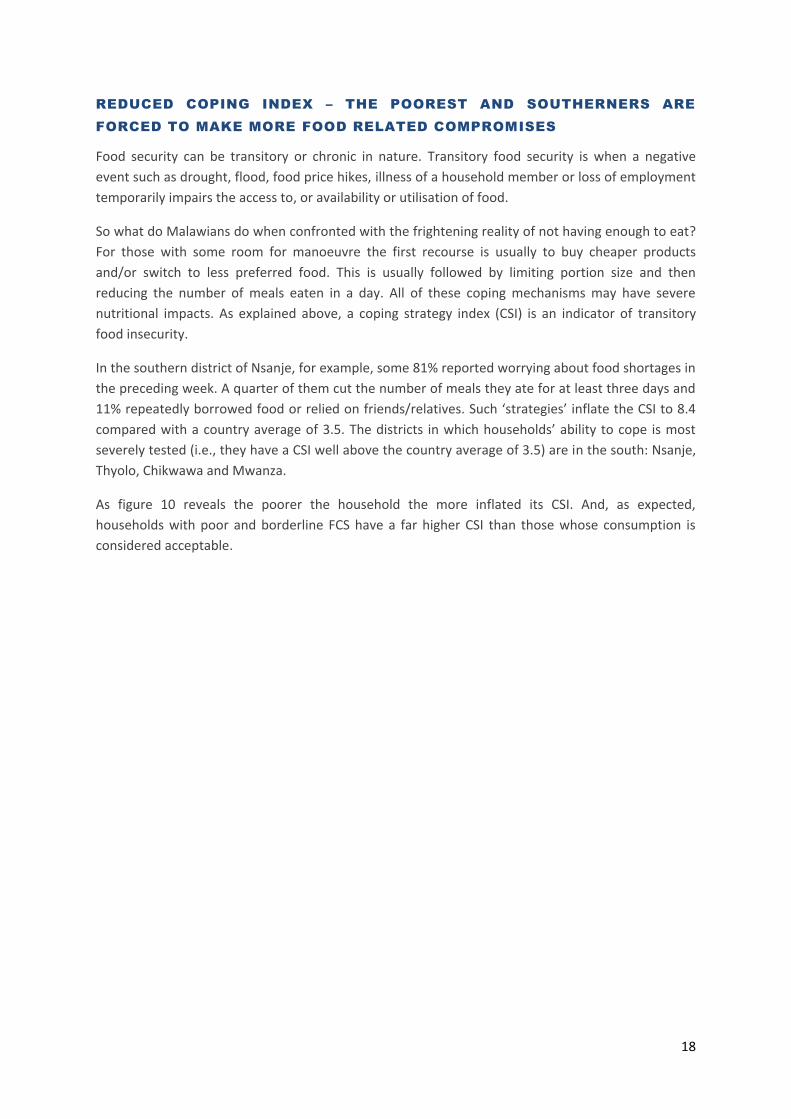
For the 42% of rural Malawians and 82% of urban that rely on buying their food from markets, seasonal
variation in prices is what creates vulnerability.
Not surprisingly maize prices are lowest during
the harvest months and then rise sharply in the
months of home production scarcity when the
number of households dependent on the market
rises too.
Figure 9: Retail maize prices in Lilongwe and
Nsanje, June 2010-Jun 2012
Figure 8: Seasonal calendar
Figures 5 – 7: Monthly FCS and energy intake March 2010 - 2011
18
REDUCED COPING INDEX – THE POOREST AND SOUTHERNERS ARE
FORCED TO MAKE MORE FOOD RELATED COMPROMISES
Food security can be transitory or chronic in nature. Transitory food security is when a negative
event such as drought, flood, food price hikes, illness of a household member or loss of employment
temporarily impairs the access to, or availability or utilisation of food.
So what do Malawians do when confronted with the frightening reality of not having enough to eat?
For those with some room for manoeuvre the first recourse is usually to buy cheaper products
and/or switch to less preferred food. This is usually followed by limiting portion size and then
reducing the number of meals eaten in a day. All of these coping mechanisms may have severe
nutritional impacts. As explained above, a coping strategy index (CSI) is an indicator of transitory
food insecurity.
In the southern district of Nsanje, for example, some 81% reported worrying about food shortages in
the preceding week. A quarter of them cut the number of meals they ate for at least three days and
11% repeatedly borrowed food or relied on friends/relatives. Such ‘strategies’ inflate the CSI to 8.4
compared with a country average of 3.5. The districts in which households’ ability to cope is most
severely tested (i.e., they have a CSI well above the country average of 3.5) are in the south: Nsanje,
Thyolo, Chikwawa and Mwanza.
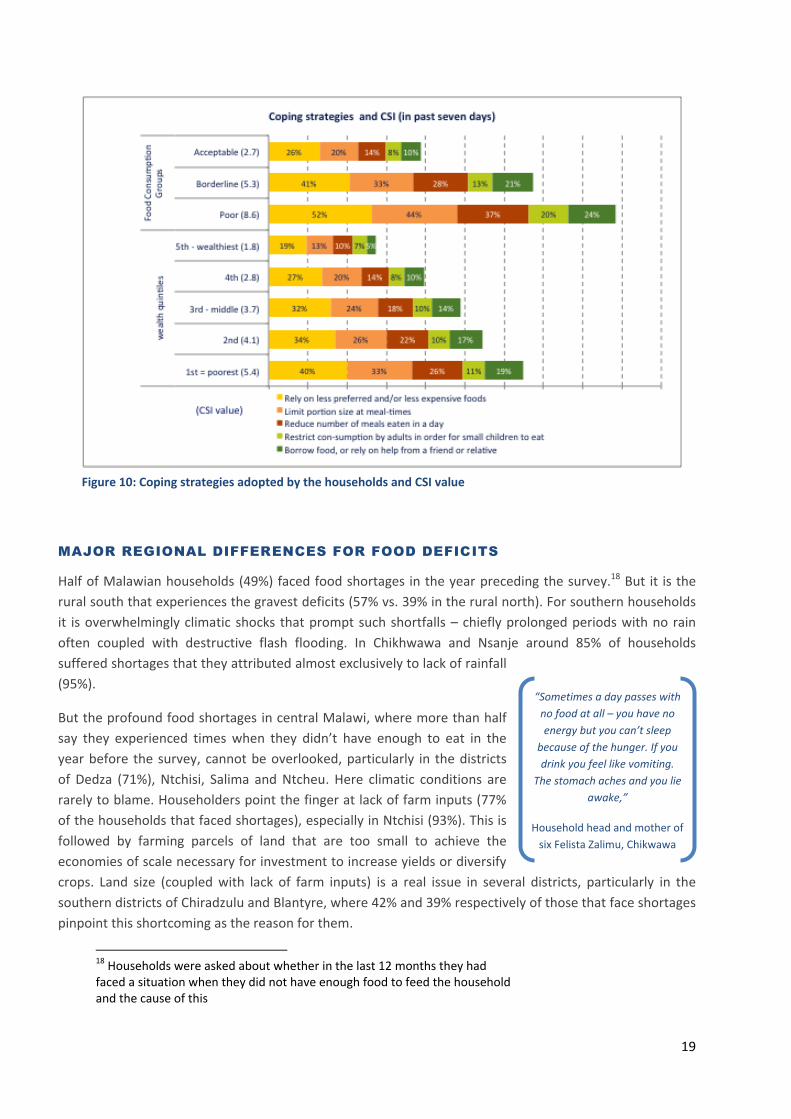
As figure 10 reveals the poorer the household the more inflated its CSI. And, as expected,
households with poor and borderline FCS have a far higher CSI than those whose consumption is
considered acceptable.
19
“Sometimes a day passes with
no food at all – you have no
energy but you can’t sleep
because of the hunger. If you
drink you feel like vomiting.
The stomach aches and you lie
awake,”
Household head and mother of
six Felista Zalimu, Chikwawa
district
MAJOR REGIONAL DIFFERENCES FOR FOOD DEFICITS
Half of Malawian households (49%) faced food shortages in the year preceding the survey.18 But it is the
rural south that experiences the gravest deficits (57% vs. 39% in the rural north). For southern households
it is overwhelmingly climatic shocks that prompt such shortfalls – chiefly prolonged periods with no rain
often coupled with destructive flash flooding. In Chikhwawa and Nsanje around 85% of households
suffered shortages that they attributed almost exclusively to lack of rainfall
(95%).
But the profound food shortages in central Malawi, where more than half
say they experienced times when they didn’t have enough to eat in the
year before the survey, cannot be overlooked, particularly in the districts
of Dedza (71%), Ntchisi, Salima and Ntcheu. Here climatic conditions are
rarely to blame. Householders point the finger at lack of farm inputs (77%
of the households that faced shortages), especially in Ntchisi (93%). This is
followed by farming parcels of land that are too small to achieve the
economies of scale necessary for investment to increase yields or diversify
crops. Land size (coupled with lack of farm inputs) is a real issue in several districts, particularly in the
southern districts of Chiradzulu and Blantyre, where 42% and 39% respectively of those that face shortages
pinpoint this shortcoming as the reason for them.
18 Households were asked about whether in the last 12 months they had faced a situation when they did not have enough food to feed the household and the cause of this
Figure 10: Coping strategies adopted by the households and CSI value

20
A lower proportion of urban households had to cope with shortages, but it
was still almost a third (30%). In Zomba, Blantyre, Lilongwe and Mzuzu cities,
where people are far more likely to buy their food than produce their own,
price increases are the main driver of scarcity (46%).
The poorer the household the more likely it is to have faced hunger in the year
running up to the survey with 72% of the poorest fifth having faced shortfalls
compared with 23% of the wealthiest fifth. And households headed by women
are considerably more likely to have faced shortages than those headed by
men (57% vs. 47%).
Figure 11: Main reasons for shortages by region
Malawi 49.0%
Rural 52.4%
Urban 30.4%
Rural North 39.3%
Rural Centre 51.4%
Rural South 57.3%
North 37.7%
Chitipa 39.4%
Karonga 42.8%
Nkhatabay 23.8%
Rumphi 24.8%
Mzimba 45.6%
Mzuzu City 22.6%
Central 47.7%
Kasungu 43.7%
Nkhota kota 53.0%
Ntchisi 66.3%
Dowa 43.0%
Salima 67.1%
Lilongwe 40.6%
Mchinji 38.6%
Dedza 71.2%
Ntcheu 61.4%
Lilongwe City 26.5%
South 53.6%
Mangochi 54.2%
Machinga 55.3%
Zomba 37.9%
Chiradzulu 45.0%
Blanytyre 43.1%
Mwanza 60.9%
Thyolo 57.6%
Mulanje 53.1%
Phalombe 50.2%
Chikwawa 83.4%
Nsanje 85.5%
Balaka 75.7%
Neno 62.1%
Zomba City 19.5%
Blantyre City
34.8%
Table 1: Households facing food shortages in the
year preceding the survey

21
MALNUTRITION – STUNTING IS ‘CRITICAL’ IN CENTRAL MALAWI
Stunting is a strong indicator of chronic food insecurity. When deprived of nutritious food –
especially during the critical
first thousand days of life, a
child’s physical development is
impaired and he or she matures
into an adult that is less likely
to reach his or her cerebral
potential and is more prone to
disease. This adult will be less
productive with a far great
likelihood of being stuck in
poverty, thereby perpetuating
the cycle of food insecurity and
malnutrition.
Although stunting is much improved since the IHS2 recorded a rate of
43%, levels are still serious by WHO standards with more than one in
three children too short for their age, implying that he/she cannot reach
full mental and physical capacity. Stunting does not always go hand in
hand with inadequate food consumption as measured by the food
consumption score in Malawi. It is slightly higher in urban areas than rural
(38% vs. 35%) and is particularly severe in Lilongwe city (45%) and Zomba
(47%) although the prevalence of inadequate food consumption is low in
urban areas. Conversely in Chikwawa, where 41% have inadequate food
consumption, just 15% are stunted.
Stunting is primarily a central
and southern issue with the
central region worst off. Here
some 41% (critical by WHO
standards) of under fives are
stunted, but in all districts
except Lilongwe, Salima and
Ntcheu the proportion is
closer to half. In fact it is
considered ‘critical in eight
out of 10 central districts. A
‘serious’ 34% are stunted in
the south - but in the districts
Figure 12: Prevalence of stunting, wasting and underweight by strata
Photo: Katy Williams
Figure 13: Link between stunting and food security

22
Table 2: Stunting levels by district
Global Severe
North 18.3 1.9
Chitipa 26.0 2.6
Karonga 15.4 2.0
Nkhatabay 16.7 4.3
Rumphi 20.8 1.4
Mzimba 17.8 1.5
Mzuzu City 15.2 .4
Central 42.1 21.8
Kasungu 47.2 24.4
Nkhota kota
50.3 14.8
Ntchisi 49.4 21.7
Dowa 50.2 29.5
Salima 41.9 19.1
Lilongwe 31.6 16.2
Mchinji 52.8 31.1
Dedza 49.2 26.2
Ntcheu 18.2 7.4
Lilongwe City
44.6 27.1
South 34.5 14.5
Mangochi 22.7 3.5
Machinga 27.1 6.1
Zomba 52.0 24.0
Chiradzulu 25.3 12.8
Blanytyre 41.2 21.3
Mwanza 47.2 28.3
Thyolo 34.3 14.7
Mulanje 54.1 28.0
Phalombe 51.2 26.5
Chikwawa 15.4 5.5
Nsanje 23.4 2.1
Balaka 22.2 8.6
Neno 47.6 33.8
Zomba City 47.3 21.0
Blantyre City
36.4 17.4
of Mulanje, Zomba and Phalombe the proportion is well over
a half. As seen in figure 13 those with inadequate food
consumption are more likely to be stunted as are the poor
and the less educated. Conversely those with adequate food
consumption and those in the wealthiest quintile are less
likely to be stunted.
The prevalence of global underweight (7% for rural and 3%
for urban Malawi) is only truly concerning in the central
district of Salima where a fifth are classified as such: this is
deemed ‘serious’ by WHO standards. Similarly wasting levels
are fairly negligible at 3% though high enough to be
considered ‘poor’ in the central districts of Kasungu, Salima,
Lilongwe, Dedza and southern districts of Mwanza,
Phalombe and Neno.
23
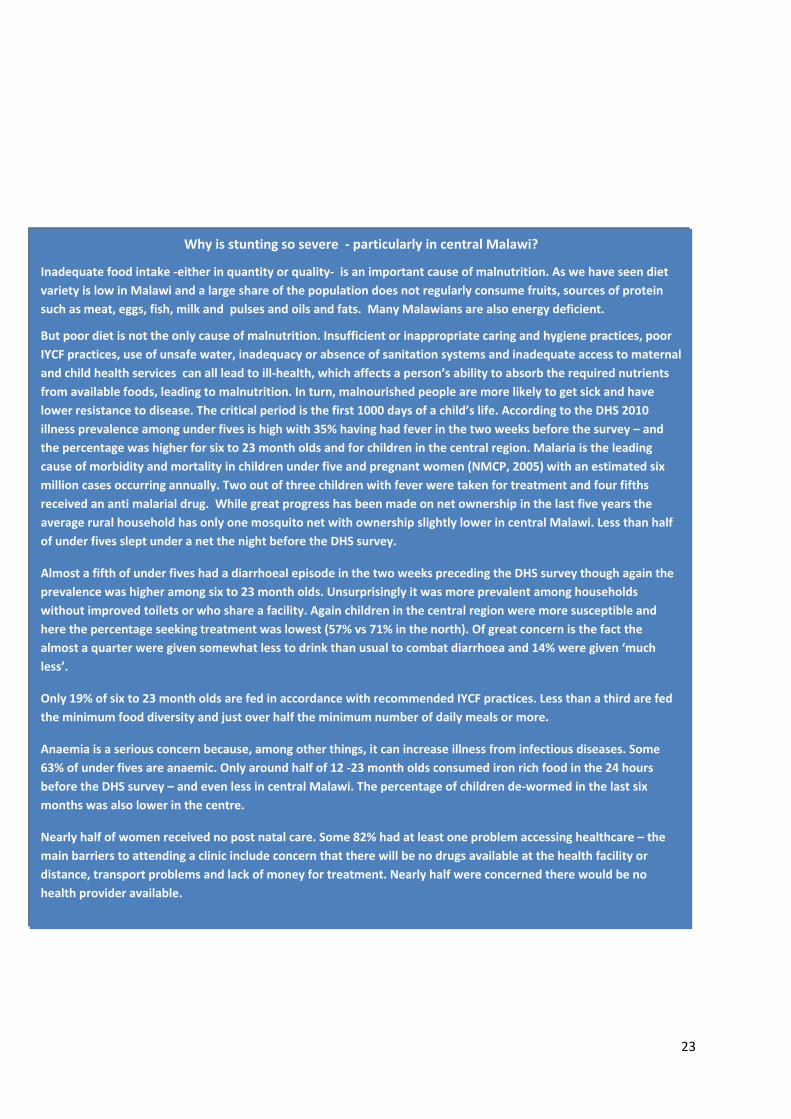
Why is stunting so severe - particularly in central Malawi?
Inadequate food intake -either in quantity or quality- is an important cause of malnutrition. As we have seen diet
variety is low in Malawi and a large share of the population does not regularly consume fruits, sources of protein
such as meat, eggs, fish, milk and pulses and oils and fats. Many Malawians are also energy deficient.
But poor diet is not the only cause of malnutrition. Insufficient or inappropriate caring and hygiene practices, poor
IYCF practices, use of unsafe water, inadequacy or absence of sanitation systems and inadequate access to maternal
and child health services can all lead to ill-health, which affects a person’s ability to absorb the required nutrients
from available foods, leading to malnutrition. In turn, malnourished people are more likely to get sick and have
lower resistance to disease. The critical period is the first 1000 days of a child’s life. According to the DHS 2010
illness prevalence among under fives is high with 35% having had fever in the two weeks before the survey – and
the percentage was higher for six to 23 month olds and for children in the central region. Malaria is the leading
cause of morbidity and mortality in children under five and pregnant women (NMCP, 2005) with an estimated six
million cases occurring annually. Two out of three children with fever were taken for treatment and four fifths
received an anti malarial drug. While great progress has been made on net ownership in the last five years the
average rural household has only one mosquito net with ownership slightly lower in central Malawi. Less than half
of under fives slept under a net the night before the DHS survey.
Almost a fifth of under fives had a diarrhoeal episode in the two weeks preceding the DHS survey though again the
prevalence was higher among six to 23 month olds. Unsurprisingly it was more prevalent among households
without improved toilets or who share a facility. Again children in the central region were more susceptible and
here the percentage seeking treatment was lowest (57% vs 71% in the north). Of great concern is the fact the
almost a quarter were given somewhat less to drink than usual to combat diarrhoea and 14% were given ‘much
less’.
Only 19% of six to 23 month olds are fed in accordance with recommended IYCF practices. Less than a third are fed
the minimum food diversity and just over half the minimum number of daily meals or more.
Anaemia is a serious concern because, among other things, it can increase illness from infectious diseases. Some
63% of under fives are anaemic. Only around half of 12 -23 month olds consumed iron rich food in the 24 hours
before the DHS survey – and even less in central Malawi. The percentage of children de-wormed in the last six
months was also lower in the centre.
Nearly half of women received no post natal care. Some 82% had at least one problem accessing healthcare – the
main barriers to attending a clinic include concern that there will be no drugs available at the health facility or
distance, transport problems and lack of money for treatment. Nearly half were concerned there would be no
health provider available.
24
WHO ARE THE FOOD INSECURE?
THE POOR
In this section of the report the wealth index is used as a proxy for measuring long term living
standards.19 It is based on data from the household’s ownership of consumer goods, dwelling
characteristics, type of drinking water source, toilet facilities and other characteristics related to
household socio economic status. According to this index 46% of rural Malawians are in the lowest
two quintiles.
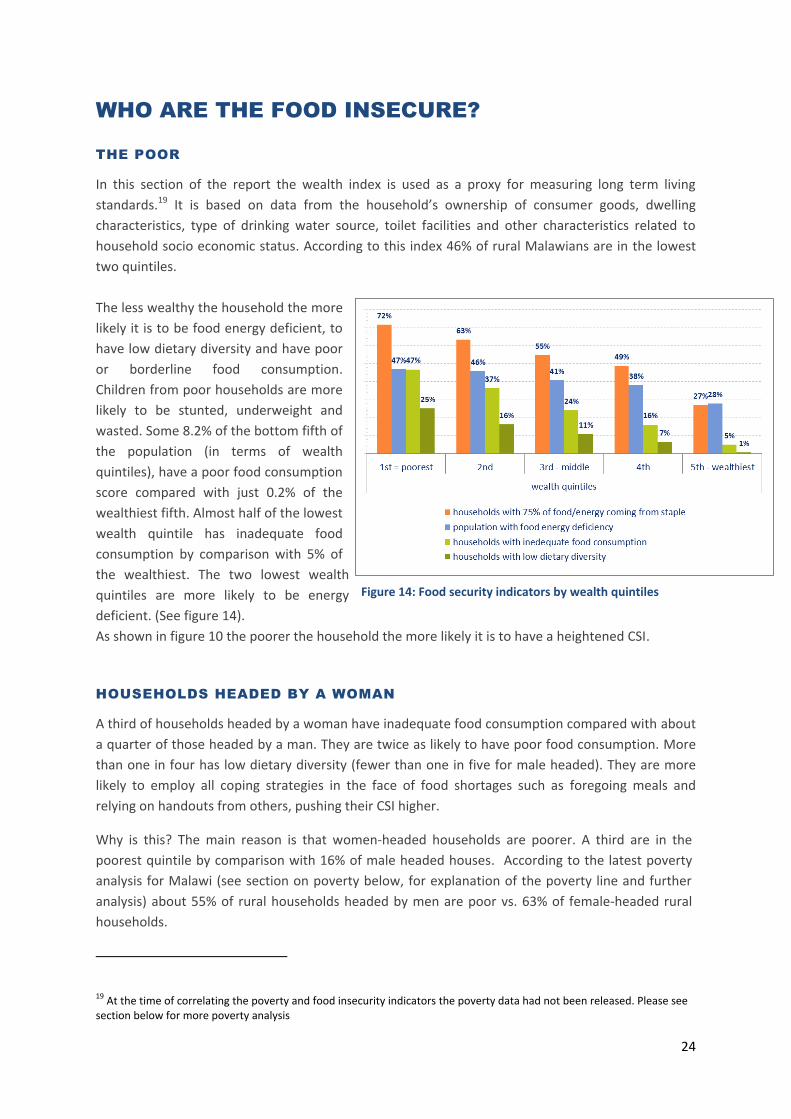
The less wealthy the household the more
likely it is to be food energy deficient, to
have low dietary diversity and have poor
or borderline food consumption.
Children from poor households are more
likely to be stunted, underweight and
wasted. Some 8.2% of the bottom fifth of
the population (in terms of wealth
quintiles), have a poor food consumption
score compared with just 0.2% of the
wealthiest fifth. Almost half of the lowest
wealth quintile has inadequate food
consumption by comparison with 5% of
the wealthiest. The two lowest wealth
quintiles are more likely to be energy
deficient. (See figure 14).
As shown in figure 10 the poorer the household the more likely it is to have a heightened CSI.
HOUSEHOLDS HEADED BY A WOMAN
A third of households headed by a woman have inadequate food consumption compared with about
a quarter of those headed by a man. They are twice as likely to have poor food consumption. More
than one in four has low dietary diversity (fewer than one in five for male headed). They are more
likely to employ all coping strategies in the face of food shortages such as foregoing meals and
relying on handouts from others, pushing their CSI higher.
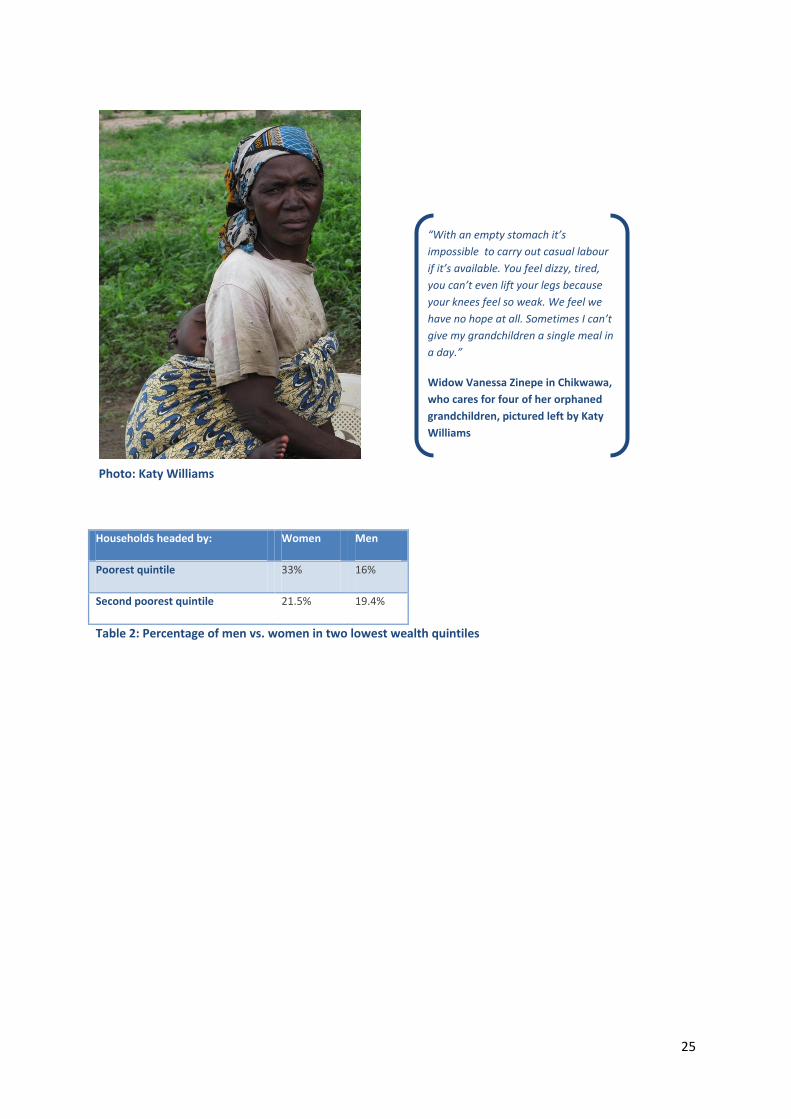
Why is this? The main reason is that women-headed households are poorer. A third are in the
poorest quintile by comparison with 16% of male headed houses. According to the latest poverty
analysis for Malawi (see section on poverty below, for explanation of the poverty line and further
analysis) about 55% of rural households headed by men are poor vs. 63% of female-headed rural
households.
19 At the time of correlating the poverty and food insecurity indicators the poverty data had not been released. Please see section below for more poverty analysis
Figure 14: Food security indicators by wealth quintiles
25
Households headed by: Women Men
Poorest quintile 33% 16%
Second poorest quintile 21.5% 19.4%
Table 2: Percentage of men vs. women in two lowest wealth quintiles
“With an empty stomach it’s
impossible to carry out casual labour
if it’s available. You feel dizzy, tired,
you can’t even lift your legs because
your knees feel so weak. We feel we
have no hope at all. Sometimes I can’t
give my grandchildren a single meal in
a day.”
Widow Vanessa Zinepe in Chikwawa,
who cares for four of her orphaned
grandchildren, pictured left by Katy
Williams
Photo: Katy Williams

26
Figure 15: Poverty levels in female vs. male headed households, urban and rural
There are many reasons why women household heads are likely to be poorer than men. For
instance, on average they earn 12,500 Kwacha a year from crop production while men average
20,000 Kwacha annually. As figure 16 shows they are more dependent on more insecure, low paid
livelihoods such as ganyu and subsistence farming and much less on wage labour by comparison
with men.
Figure 17 illustrates that women household heads are more likely to be elderly (over 65 years old)
and therefore less able to work. They are more likely to be caring for a sick member and for
dependents, making them less available to carry out paid work. Some 38% of women who head
households are responsible for
the care of at least one orphan
compared with 10% of male
headed households.
In addition, according to the
DHS 2010, some 6% of 15-49
year old women have been
widowed, immediately
reducing the household’s
earning potential. What’s
more, of those women more
than a third were then
dispossessed of their property.
Figure 16: Income activities by sex of the household head
In addition some 43% of female household heads have never attended school compared with just
17% of male. As explored below there is a strong correlation between lack of education and food
insecurity and malnutrition. Of course lack of education locks people into a cycle of poorly paid work
and perpetuates poverty.

27
“We feel we have no hope at all” – the widows and grandmothers left to raise Malawi’s
children
Alufanes Maloya brought her 22 month old orphaned grandchildren Brian and Bethan to the district hospital in
Chikwawa because she was so worried about their lack of growth and life. Both are being treated for acute
malnutrition but are slow to respond because they are HIV positive. Alufanes is also responsible for their two older
siblings. She can’t afford to feed any of them.
Widowed grandmothers unable to feed their orphaned grandchildren are commonplace. Like so many in Chikwawa,
at the beginning of each year they have no income source, their stocks are depleted and the cost of maize is
spiralling.
This year maize prices reached unprecedented levels of 100 Kwacha per kg in January 2012 before settling at around
70-80 Kwacha. What’s more the rains came so late, delaying planting, and then with such a vengeance that they
washed away the newly planted crops. Having lost two rounds of seedlings many could not afford to buy a third.
The lean season starts when household maize supplies run out in October and food insecurity peaks in
January/February. This year many households limited themselves to just one small meal a day of porridge made
with maize flour and water . Some sold livestock, collected firewood or just depended on daily labour to drum up
enough cash for the next meal. But with so many crops destroyed there was little ganyu (casual labour) around. In
any case they don’t have the energy to work well.
Food distribution programmes funded by the Government’s Malawi Vulnerability Assessment Committee targeted
8,190 households. Each household, regardless of size, received 50kg of cereals (mainly maize), 10 kg of pulses and 2
litres of oil a month from January to March.
One heard the same story again and again. That the last two years were the worst droughts in their lifetime. Even
maize alternatives such as cassava, sweet potatoes and bananas failed because of drought. They depleted their
mango crops early, cooking them while they were still green. They felt constantly hungry.
‘Sometimes a day passes with no food at all – you have no energy but you can’t sleep because of the hunger. If you
drink you feel like vomiting. The stomach aches and you lie awake,’ said household head Felista Zalimu (54), who has
six of her seven children still living at home. Widow Vanessa Zinepe has seven grandchildren, four of whom live with
her because their parents are both dead. Sometimes she can’t provide a single meal for the children in a day. ‘With
an empty stomach it’s impossible to carry out casual labour if it’s available. You feel dizzy, tired, you can’t even lift
your legs because your knees feel so weak. We feel we have no hope at all.’
Figure 17: Characteristics of male versus female-headed households

28
HOUSEHOLDS WITH A HIGH NUMBER OF DEPENDENTS
AND THOSE WITH AN ORPHANED CHILD
In the rural south more than a fifth of households have a high number of
dependents (i.e., more than 70% of the household is a dependent). By
district level Mangochi, Machinga, Mulanje, Phalombe and Balaka have the
highest dependency ratios. Having such high dependency almost doubles
the chances of not having an adequate e diet (a quarter of households with
inadequate food consumption have a high number of dependents compared
with 14% of those with acceptable food consumption).
Food consumption At least 1 orphan in the household
High percentage of dependents (>70%)
Acceptable 15.5% 13.8%
Inadequate 17.4% 23.6% Differences are significant p < 0.05
Table 4: Households with orphans and/or high percentage of dependents
Overall 16% of Malawian households have an orphan20 and such households
are significantly more likely to have inadequate food consumption. The rural
south, where almost one in five households is caring for an orphaned child,
has the highest proportion with well over a fifth of households in the
districts of Zomba, Thyolo and Mulanje caring for at least one. In Phalombe
the percentage is as high as 27.5%. Overall urban households have a higher
prevalence than rural.
Children are most likely to be orphaned following the death of their father
but a fifth of all orphans have lost both parents. According to the DHS 2010
3% of children under 18 have lost both parents and 19% of all children are
not living with a biological parent. It should also be noted that orphaned
children – or those who are vulnerable because they have a chronically sick
parent - are at greater risk of dropping out of school, perhaps because of the
family’s inability to pay school fees, or because they have to help with
household labour or stay at home to care for a sick parent or younger
siblings.
HOUSEHOLDS HEADED BY AN ELDERLY PERSON (OVER
64)
The average age of a household head with inadequate food consumption is
45 and 41 for those with acceptable consumption. A fifth of households with poor food consumption
are headed by someone over the age of 64 whereas just one in ten of those with acceptable
consumption have an elderly head. Again this is likely to relate to their inhibited ability to earn an
income.
20 A child aged 15 years or below who has lost at least one parent is considered an orphan.
Malawi 16.0%
Urban 17.4%
Rural 15.8%
Rural north 16.9%
Rural centre 12.1%
Rural south 18.8%
North 16.6%
Chitipa 15.6%
Karonga 19.5%
Nkhatabay 19.5%
Rumphi 16.5%
Mzimba 15.8%
Mzuzu City 12.7%
Central 12.7%
Kasungu 11.3%
Nkhota kota 17.4%
Ntchisi 8.3%
Dowa 11.7%
Salima 13.4%
Lilongwe 11.1%
Mchinji 12.5%
Dedza 11.7%
Ntcheu 14.5%
Lilongwe City 16.5%
South 18.8%
Mangochi 18.1%
Machinga 13.0%
Zomba 21.3%
Chiradzulu 18.3%
Blanytyre 17.3%
Mwanza 14.3%
Thyolo 21.2%
Mulanje 21.7%
Phalombe 27.5%
Chikwawa 13.7%
Nsanje 19.9%
Balaka 19.3%
Neno 15.5%
Zomba City 21.0%
Blantyre City 17.8%
Table 3: Household with one or
more orphans

29
HOUSEHOLDS WITH A MEMBER WHO IS CHRONICALLY SICK
A fifth of all households with poor food consumption have a chronically sick member compared with
13% of those with acceptable consumption.
HOUSEHOLDS WITH LESS THAN ADEQUATE SANITATION AND DRINKING
WATER FACILITIES
Households that don’t benefit from improved toilet facilities (i.e. they are using a public or shared
latrine, open pit, bucket latrine or have no facilities) are more likely to fall into the inadequate food
consumption category than those that have improved sanitation. They are also more likely to be
deficient in food energy and derive more than 75% of their food energy from staples. By the same
token households that don’t enjoy improved drinking water (i.e., they are using untreated water
from unprotected wells, springs, rivers or ponds) are more likely to have inadequate food
consumption, be energy deficient and more staple dependent than households with improved
drinking water. Of course lack of such facilities is an indicator of poverty, a chief cause of food
insecurity in itself, but unimproved facilities can also lead to illness and malnutrition.
Children in households without improved toilets or potable water are more likely to be stunted,
underweight and wasted. Overall 87% of rural households do not enjoy improved water though in
some districts barely anyone has improved water sources (Nsanje, Blantyre, Neno and Salima).
Nearly a third of rural households don’t have improved toilet facilities – but this rises to half or more
in Salima, Chiradzulu, Blantyre, Chikwawa and Nsanje.
Figure 18: FC grouping for households with elderly head
and chronically sick member
30
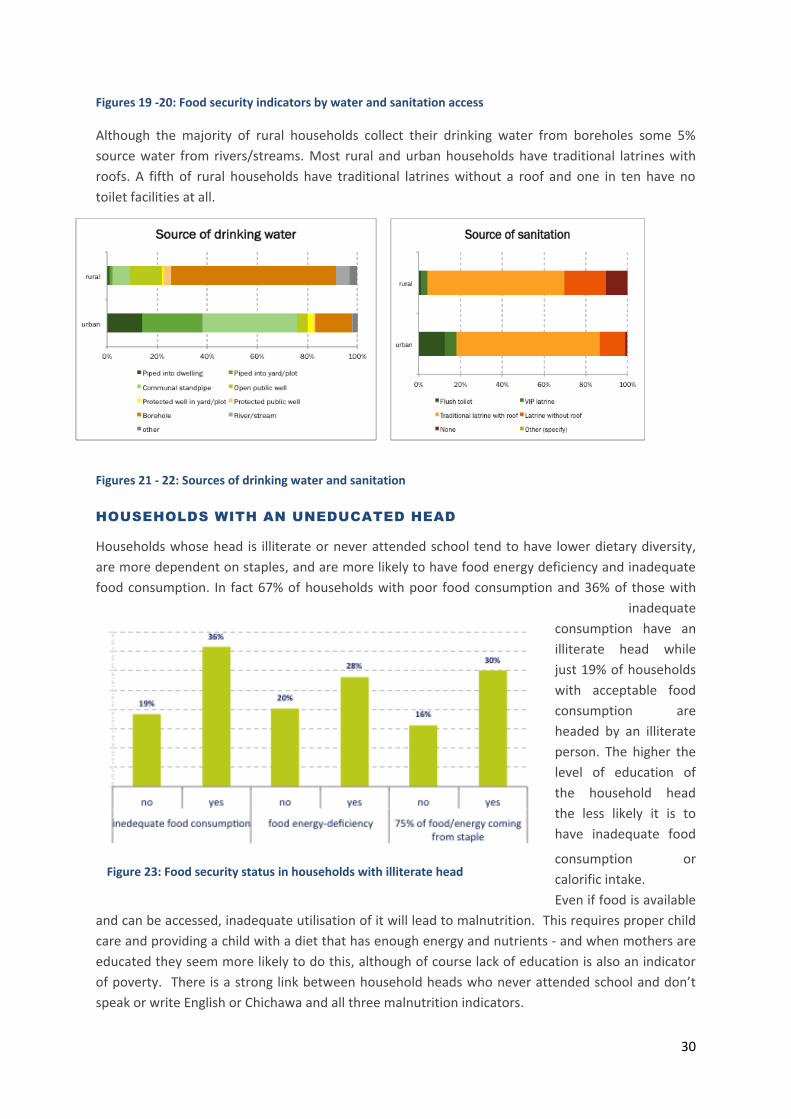
Figures 19 -20: Food security indicators by water and sanitation access
Although the majority of rural households collect their drinking water from boreholes some 5%
source water from rivers/streams. Most rural and urban households have traditional latrines with
roofs. A fifth of rural households have traditional latrines without a roof and one in ten have no
toilet facilities at all.
Figures 21 - 22: Sources of drinking water and sanitation
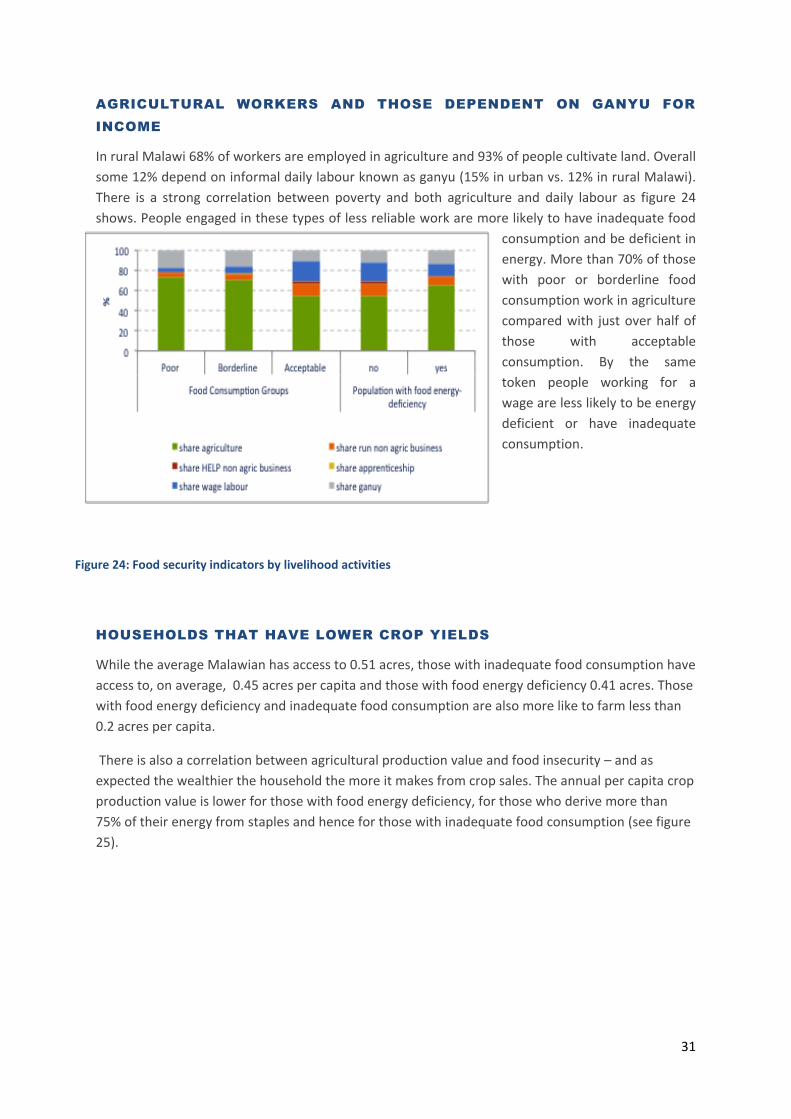
HOUSEHOLDS WITH AN UNEDUCATED HEAD
Households whose head is illiterate or never attended school tend to have lower dietary diversity,
are more dependent on staples, and are more likely to have food energy deficiency and inadequate
food consumption. In fact 67% of households with poor food consumption and 36% of those with
inadequate
consumption have an
illiterate head while
just 19% of households
with acceptable food
consumption are
headed by an illiterate
person. The higher the
level of education of
the household head
the less likely it is to
have inadequate food
consumption or
calorific intake.
Even if food is available
and can be accessed, inadequate utilisation of it will lead to malnutrition. This requires proper child
care and providing a child with a diet that has enough energy and nutrients - and when mothers are
educated they seem more likely to do this, although of course lack of education is also an indicator
of poverty. There is a strong link between household heads who never attended school and don’t
speak or write English or Chichawa and all three malnutrition indicators.
Figure 23: Food security status in households with illiterate head
31
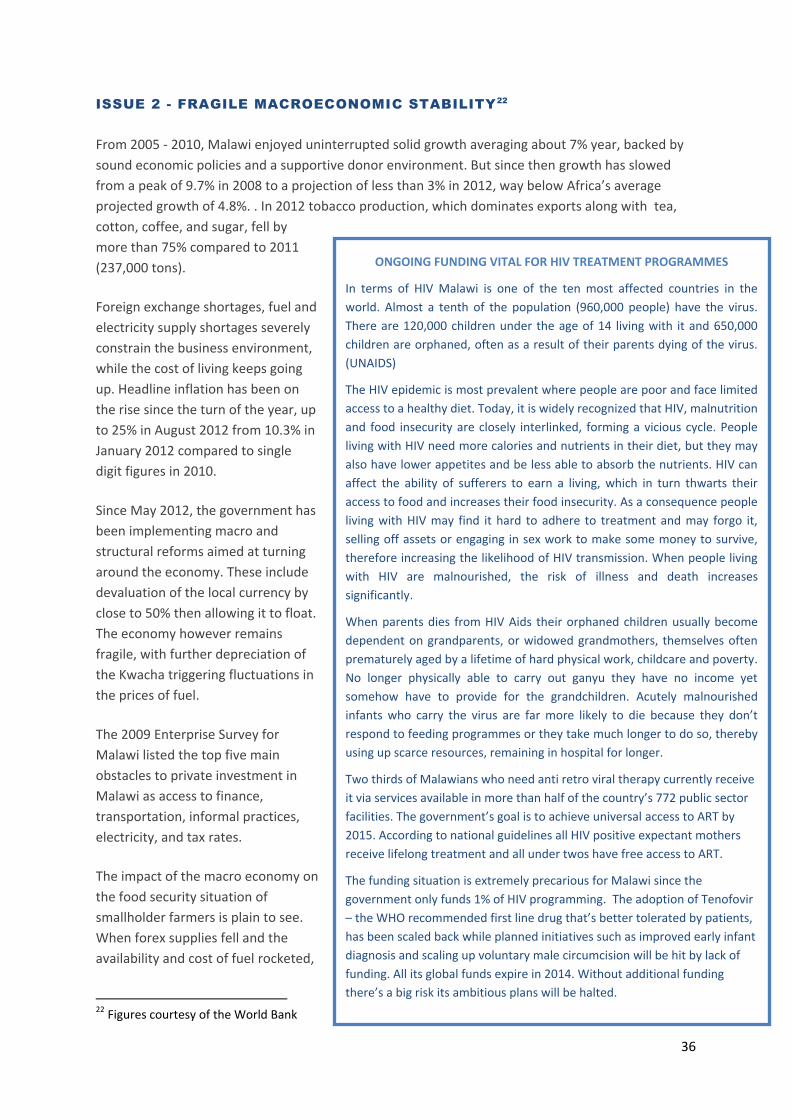
AGRICULTURAL WORKERS AND THOSE DEPENDENT ON GANYU FOR
INCOME
In rural Malawi 68% of workers are employed in agriculture and 93% of people cultivate land. Overall
some 12% depend on informal daily labour known as ganyu (15% in urban vs. 12% in rural Malawi).
There is a strong correlation between poverty and both agriculture and daily labour as figure 24
shows. People engaged in these types of less reliable work are more likely to have inadequate food
consumption and be deficient in
energy. More than 70% of those
with poor or borderline food
consumption work in agriculture
compared with just over half of
those with acceptable
consumption. By the same
token people working for a
wage are less likely to be energy
deficient or have inadequate
consumption.
HOUSEHOLDS THAT HAVE LOWER CROP YIELDS
While the average Malawian has access to 0.51 acres, those with inadequate food consumption have
access to, on average, 0.45 acres per capita and those with food energy deficiency 0.41 acres. Those
with food energy deficiency and inadequate food consumption are also more like to farm less than
0.2 acres per capita.
There is also a correlation between agricultural production value and food insecurity – and as
expected the wealthier the household the more it makes from crop sales. The annual per capita crop
production value is lower for those with food energy deficiency, for those who derive more than
75% of their energy from staples and hence for those with inadequate food consumption (see figure
25).
Figure 24: Food security indicators by livelihood activities

32
Table 5: Average acreage per capita
Figure 25: Annual
per capita value of
household crop
production
<0.2 acres per capita (%)
Land per capita (acre)
Malawi 24.9% .5032
Food energy deficiency No 21.1% .5714
Yes 30.0% .4101
75% of food/energy coming from staple
No 25.5% .5253
Yes 24.4% .4859
Inadequate food consumption
No 23.6% .5231
Yes 28.3% .4538

33
ANALYSIS – WHAT ARE THE MAIN ISSUES BEHIND
FOOD INSECURITY AND MALNUTRITION?
ISSUE 1 - WIDESPREAD POVERTY
Poverty is the root cause of food
insecurity because poor households lack
the resources required to access enough
nutritious food to live a healthy active life.
Poor households are unable to invest in
the inputs required to boost their own
yields. Poor farmers have to sell any
surplus soon after harvest to earn income
and repay debts, at once exposing
themselves to fluctuating market prices as
well as not being able to benefit from
selling when prices rise.
It is always the poorest that suffer the
most when food prices rise – not only is
their ability to purchase food curtailed,
but so is their capacity to buy other goods
and services essential for their health and
welfare, including water, sanitation,
education, healthcare and adequate
shelter and clothing.
The extreme poor have no financial buffer
to protect them from recurrent shocks
(for the poorest districts of southern
Malawi these shocks are chiefly climatic -
prolonged periods with no rain followed
by destructive flash flooding which
destroy crops and therefore lead to food
price hikes). In times of such stress
households often resort to corrosive
coping mechanisms that may involve
reducing food intake and removing
children from school. Such strategies
often perpetuate a cycle of poverty and
further undermine their already fragile
food security status.
Map 3: Rural poverty by district

34
How poverty is analysed in IHS3
The methodology replicates as much as possible that of the poverty analysis of the 2004/05 IHS2 to guarantee comparability over time.
The measure of welfare used in this analysis is the total annual per capita consumption reported by a household in Malawi Kwacha deflated to February/March 2010 prices.
The food poverty line represents the cost of a food bundle that provides the necessary energy requirements per person per day (2,400 kilocalories). For 2011 it is set at 22,956 Malawi kwacha per person a year. The line is calculated as the daily calorie requirement per person multiplied by the estimated price per calorie.
The non-food poverty line represents an allowance for basic non-food needs of the population whose food consumption is close to the food poverty line and is set at MWK 14,045 per person a year.
The total poverty line is simply the sum of the food and non-food poverty lines (MWK 37,002 per person a year for IHS3).
The population that has total consumption below MWK 37,002 is deemed poor and the population with total consumption less than the minimum food consumption (MWK 22, 956) is considered ultra-poor.
According to 2010 estimates
Malawi’s GDP per person has grown steadily over the past two decades to $343 a head, but only
four countries in the world rankings (Democratic Republic of Congo, Burundi, Liberia and Sierra
Leone) have lower per capita GDP. It is ranked 171 out of 187 countries in the HDI index21.
Around half of the Malawian population is poor (50.7%), which marks a slight fall from a poverty rate
of 52.4% reported in the 2004/2005 integrated household survey (IHS2). While the poverty rate has
fallen in urban Malawi from 25% to 17%, it has risen slightly in rural areas to 56% since IHS2.
Lilongwe city has the highest proportion of urban poor (22%).
21 Human Development Report 2011, UNDP
Photo: Katy Williams

35
Overall the proportion of ultra poor has
risen from 22% in IHS2 to 25% in IHS3,
meaning that about one in every four people
lives in such dire poverty that they cannot
even afford to meet the minimum standard
for daily-recommended food requirement.
In fact the proportion of ultra poor has risen
markedly across all rural regions of Malawi
(from 24% in IHS2 to 28% in IHS3) and fallen
in urban areas (down from 7.5% to 4.3%).
The rural south has the highest poverty rate
with three out of five people living in
poverty (63%). In fact almost half (47%) of
Malawi’s poor live in the rural south. And
the percentage of southerners living in ultra
poverty has risen from 32% in IHS2 to more
than a third today (34%). But it is in the two
most food insecure districts where poverty
is deepest. Some four out of five people
(81%) in the southern districts of Chikwawa
and Nsanje are poor and almost three in five
people (59% and 56% respectively) are living
in ultra poverty compared with 32% and
44% in 2004.
The northern region has the second highest
proportion of poor people (60%) and the
central region the lowest proportion (49%).
However, according to the MVAC October
2012 bulletin, this year’s food insecurity
situation is also affecting the middle wealth
groups in some areas.
Map 4: Rural ultra poverty by district
Figures 26-27: Percentage of poor and ultra-poor by region IHS2 vs IHS3
36
ONGOING FUNDING VITAL FOR HIV TREATMENT PROGRAMMES
In terms of HIV Malawi is one of the ten most affected countries in the
world. Almost a tenth of the population (960,000 people) have the virus.
There are 120,000 children under the age of 14 living with it and 650,000
children are orphaned, often as a result of their parents dying of the virus.
(UNAIDS)
The HIV epidemic is most prevalent where people are poor and face limited
access to a healthy diet. Today, it is widely recognized that HIV, malnutrition
and food insecurity are closely interlinked, forming a vicious cycle. People
living with HIV need more calories and nutrients in their diet, but they may
also have lower appetites and be less able to absorb the nutrients. HIV can
affect the ability of sufferers to earn a living, which in turn thwarts their
access to food and increases their food insecurity. As a consequence people
living with HIV may find it hard to adhere to treatment and may forgo it,
selling off assets or engaging in sex work to make some money to survive,
therefore increasing the likelihood of HIV transmission. When people living
with HIV are malnourished, the risk of illness and death increases
significantly.
When parents dies from HIV Aids their orphaned children usually become
dependent on grandparents, or widowed grandmothers, themselves often
prematurely aged by a lifetime of hard physical work, childcare and poverty.
No longer physically able to carry out ganyu they have no income yet
somehow have to provide for the grandchildren. Acutely malnourished
infants who carry the virus are far more likely to die because they don’t
respond to feeding programmes or they take much longer to do so, thereby
using up scarce resources, remaining in hospital for longer.
Two thirds of Malawians who need anti retro viral therapy currently receive
it via services available in more than half of the country’s 772 public sector
facilities. The government’s goal is to achieve universal access to ART by
2015. According to national guidelines all HIV positive expectant mothers
receive lifelong treatment and all under twos have free access to ART.
The funding situation is extremely precarious for Malawi since the
government only funds 1% of HIV programming. The adoption of Tenofovir
– the WHO recommended first line drug that’s better tolerated by patients,
has been scaled back while planned initiatives such as improved early infant
diagnosis and scaling up voluntary male circumcision will be hit by lack of
funding. All its global funds expire in 2014. Without additional funding
there’s a big risk its ambitious plans will be halted.
ISSUE 2 - FRAGILE MACROECONOMIC STABILITY22
From 2005 - 2010, Malawi enjoyed uninterrupted solid growth averaging about 7% year, backed by
sound economic policies and a supportive donor environment. But since then growth has slowed
from a peak of 9.7% in 2008 to a projection of less than 3% in 2012, way below Africa’s average
projected growth of 4.8%. . In 2012 tobacco production, which dominates exports along with tea,
cotton, coffee, and sugar, fell by
more than 75% compared to 2011
(237,000 tons).
Foreign exchange shortages, fuel and
electricity supply shortages severely
constrain the business environment,
while the cost of living keeps going
up. Headline inflation has been on
the rise since the turn of the year, up
to 25% in August 2012 from 10.3% in
January 2012 compared to single
digit figures in 2010.
Since May 2012, the government has
been implementing macro and
structural reforms aimed at turning
around the economy. These include
devaluation of the local currency by
close to 50% then allowing it to float.
The economy however remains
fragile, with further depreciation of
the Kwacha triggering fluctuations in
the prices of fuel.
The 2009 Enterprise Survey for
Malawi listed the top five main
obstacles to private investment in
Malawi as access to finance,
transportation, informal practices,
electricity, and tax rates.
The impact of the macro economy on
the food security situation of
smallholder farmers is plain to see.
When forex supplies fell and the
availability and cost of fuel rocketed,
22 Figures courtesy of the World Bank

37
this in turn pushed up the cost of maize and other foods.
This year Malawians were forced to buy many commodities – particularly fuel on the black market
where the rate could reach 250 Kwacha to the Dollar compared with the official exchange rate of
about 166 Kwacha.
From about October until the harvest in April, rural Malawians have to buy their maize since
household stocks have generally run out. According to official figures released by FEWSNET maize
reached unprecedented high price levels in early 2012 throughout the country. Prices started
climbing from October 2011 in spite of a maize production surplus of 1.2m MT23 in the previous
season. March retail prices for maize were 40% higher than the five-year average. To make matters
worse prices were volatile. Private traders hiked their prices following a 50% price adjustment by
ADMARC in December 2011.
In the northern market of Karonga, which is influenced by cross border trade with Tanzania, they
reached around MK70 per kg in March. In Salima, on the lake in central Malawi, they peaked at MK
85 per kg in February and in Ngabu market in Chikwawa in the south they reached over MK 80 per kg
in January, although, anecdotally, southerners reported paying as much a MK 100 per kg. Just a few
months before, following the maize harvest in April, farmers, desperate for some cash for the first
time in months and without access to storage facilities, were selling the crop to traders for as little as
MK 0-20 a kg. According to the MVAC October 2012 bulletin, prices in southern Malawi were already
ranging from MK65 – MK 85 per kg even before the lean season had really started to bite.
When one considers that a casual labourer may only get about 200 kwacha for a day’s Ganyu and
may only get about two days of this informal labour a week, one sees how tough it is to feed the
average household of five needing about 1.5 kg of maize a day. Ganyu is unreliable and increasingly
hard to come by when crops – and the economy - are failing. With this year’s crop production so
poor and income levels so low the better off households that normally engage others in casual
labour will offer fewer casual opportunities to the poorer.
In addition to the reform mentioned above, the government has launched an 18 month Economic
Recovery Plan (ERP) that focuses on a few priorities that are “pro-growth, represent quick wins, and
are highly effective.” This plan stresses the need for social protection programmes (Farmer Input
Support Program (FISP) and other assistance to small farmers, public works, school feeding,
scholarships for girls, cash transfers) and identifies diversified commercial agriculture, tourism,
energy, mining and infrastructure/Information Technology and Communications (ITC) as sectors that
can help turn around the economy and provide the initial building blocks towards structural
transformation, needed to successfully implement the Second Malawi Growth and Development
Strategy (MDGSII.)
Development partners are back on track to provide budget support after the resumption of the
International Monetary Fund (IMF) programme that derailed in 2010. The World Bank warns:
“Macroeconomic stability following the actions taken by the new administration is still fragile and
would critically depend upon the continuance of the policy measures instituted.”
23 The Malawi Vulnerability Assessment Committee (MVAC), Bulletin March 2011
38
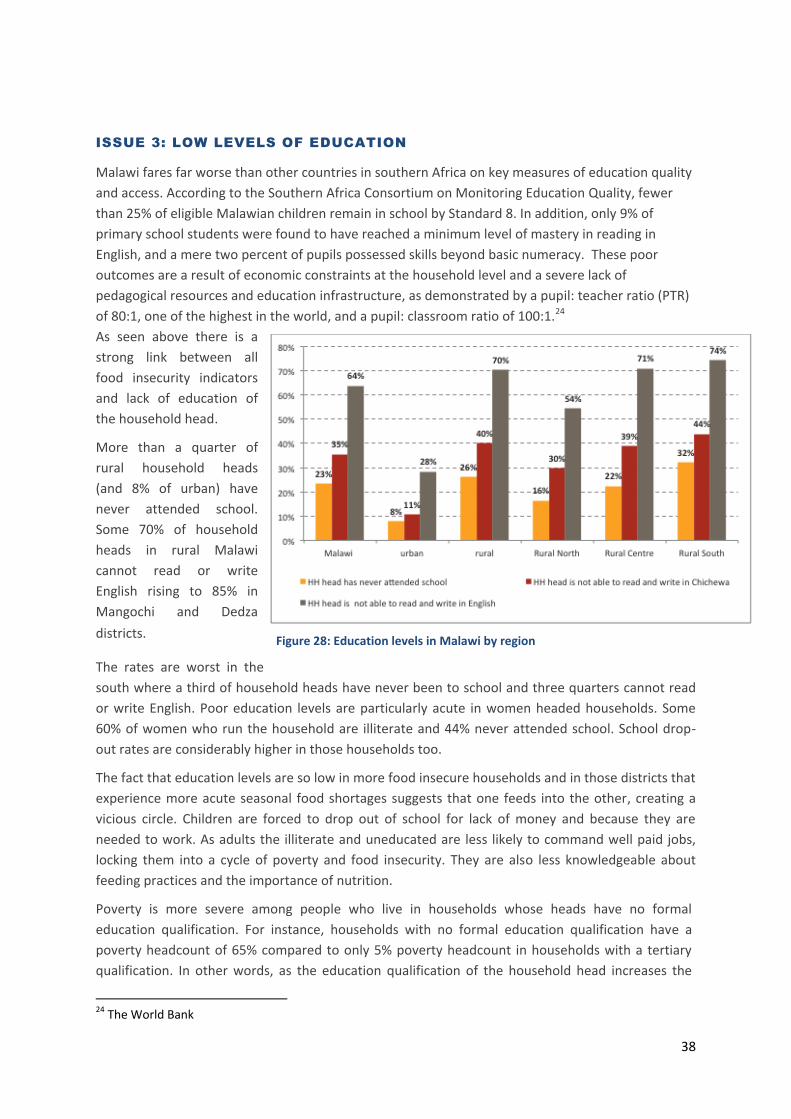
ISSUE 3: LOW LEVELS OF EDUCATION
Malawi fares far worse than other countries in southern Africa on key measures of education quality
and access. According to the Southern Africa Consortium on Monitoring Education Quality, fewer
than 25% of eligible Malawian children remain in school by Standard 8. In addition, only 9% of
primary school students were found to have reached a minimum level of mastery in reading in
English, and a mere two percent of pupils possessed skills beyond basic numeracy. These poor
outcomes are a result of economic constraints at the household level and a severe lack of
pedagogical resources and education infrastructure, as demonstrated by a pupil: teacher ratio (PTR)
of 80:1, one of the highest in the world, and a pupil: classroom ratio of 100:1.24
As seen above there is a
strong link between all
food insecurity indicators
and lack of education of
the household head.
More than a quarter of
rural household heads
(and 8% of urban) have
never attended school.
Some 70% of household
heads in rural Malawi
cannot read or write
English rising to 85% in
Mangochi and Dedza
districts.
The rates are worst in the
south where a third of household heads have never been to school and three quarters cannot read
or write English. Poor education levels are particularly acute in women headed households. Some
60% of women who run the household are illiterate and 44% never attended school. School drop-
out rates are considerably higher in those households too.
The fact that education levels are so low in more food insecure households and in those districts that
experience more acute seasonal food shortages suggests that one feeds into the other, creating a
vicious circle. Children are forced to drop out of school for lack of money and because they are
needed to work. As adults the illiterate and uneducated are less likely to command well paid jobs,
locking them into a cycle of poverty and food insecurity. They are also less knowledgeable about
feeding practices and the importance of nutrition.
Poverty is more severe among people who live in households whose heads have no formal
education qualification. For instance, households with no formal education qualification have a
poverty headcount of 65% compared to only 5% poverty headcount in households with a tertiary
qualification. In other words, as the education qualification of the household head increases the
24 The World Bank
Figure 28: Education levels in Malawi by region

39
poverty rate drops significantly. Those in households whose head has more than JCE level of
education are significantly less likely to live in poverty.
Figure 29: Poverty incidences by education qualification of household head
Adequate skilled labour is also a constraint to much needed private sector-led growth. Malawi ranks
very low on knowledge, innovation, and technology. The World Bank Knowledge Economy Index25
(KEI), a broad measure of the overall level of preparedness of a country or region for the knowledge
economy, ranks Malawi as the lowest in the region. According to the World Bank, transitioning
countries like Malawi are at risk of being further marginalized in a highly competitive world
economy because their tertiary and other post basic education/training programmes are not
adequately prepared to capitalize on the creation and use of knowledge. In addition, Malawi faces a
serious human capacity problem with its labour market that is characterized by large numbers of
unskilled workers with low productivity.
ISSUE 4: LAND PRESSURE AND LOW YIELDS
High population density and poverty have led to significant human pressure on the environment and
degradation of Malawi’s natural resource base, notably land and forests. The growing population
increases the land area under cultivation and exploits forests and woodlands for firewood and
charcoal production. Land degradation, deforestation, inappropriate farming methods, and limited
incentives to promote land and water conservation techniques have increased the incidence of
erosion, run-off and flash floods, carrying high loads of sediment that are deposited in reservoirs and
flood-plains and reduce agricultural productivity. 26 A UNDP-UNEP Poverty Environment Initiative
estimated that unsustainable natural resource use costs Malawi US$191m or 5.3% of GDP each year,
chiefly from loss of agricultural activity as a result of soil degradation.
25 http://web.worldbank.org 26 The World Bank

40
The FIS programme The Government’s well publicised fertilizer subsidy programme, aimed at transforming the agricultural sector and sharply reducing rural poverty, has resulted in rapid growth in the smallholder farming sector, especially in tobacco. Several years of bumper harvest have allowed Malawi to produce enough maize to meet its national requirements and in some years it has even exported grain. At a macro level it can be deemed a great success.
But can Malawi continue to import fertilizer on this scale given the current forex crisis? Such a financial commitment could squeeze out spending on other sector needs, such as the provision of technical advice by extension workers and scientific research into improved varieties of local seeds. There are also concerns about effective targeting. Some studies suggest that the system of village committees and headmen identifying ‘vulnerable’ households lacks impartiality. Female-headed households are a particular concern – a quarter of rural households fall into this category.
There are concerns that the programme lacks clear criteria for determining the number of, and for selecting, the programme participants. Often the official target group- the poorest of the poor (the elderly, orphaned children, disabled), do not benefit from receiving the FIS coupon because they are unable to carry out the necessary physical work to produce the maize.
Some 93% of rural Malawians have access to land. The total cultivated area is 2.7 million hectares,
and about 1.7-2 million hectares of that is cultivated by smallholders, who account for over 80% of
Malawi’s agricultural
production.
Since most Malawians make
their livelihoods from
Table 6: Land size per capita
agriculture the main
underlying cause of poverty is low agricultural productivity (yields were 2,206 kg a hectare in
201027).This is in turn is caused by
dependency on rain fed cultivation (according
to the IHS3 just 0.5% of land is irrigated), use
of low-yielding seed varieties, limited access
to inputs, credit or training, poor land
management (e.g. weeding is rarely
practised) and small land holdings. According
to the IHS3 Malawians have an average of 0.5
acres per capita with land more scarce in the
south where poverty rates are highest. And
the population of the country is growing by
3.1%28, putting further pressure on the land.
Having such low acreage means most
smallholder land is continuously cropped,
with little replenishment of the nutrients,
again leading to soil mining and low
productivity.
The reliance on rain-fed agriculture cuts the
crop growing period to just six months.
Despite several years of bumper maize
harvests in which a healthy surplus has been
produced – chiefly thanks to a government
programme of fertilizer subsidies – 80% of
smallholders are still net buyers of maize
(Makombe et al, 2010).
The majority of smallholders in central
Malawi,
27 World Bank/FAO 28 World Bank 2011 estimate
<0.2 acres per capita (%)
Land per capita (acre)
Malawi 24.9% .5032
Urban 51.4% .3589
Rural 22.9% .5139
Rural centre 16.5% .5671
Rural south 31.3% .4439
Yes 24.4% .4859

41
where more than half say they
experienced times when they didn’t
have enough to eat in the year
before the survey, blame lack of farm
inputs as well as farming parcels of
land that are too small to achieve the
economies of scale necessary for
investment to increase yields or
diversify crops. Land size (coupled
with lack of farm inputs) is
particularly an issue in the southern
districts of Chiradzulu and Blantyre,
where 42% and 39% respectively of
those that face shortages pinpoint
this shortcoming as the reason for
them (IHS3).
In 2010 the Ministry of Agriculture
and Food Security (MoAFS) identified
the main constraints to a progressive
sector as low productivity; reliance
on rain-fed cultivation; low value
addition; low investments in
agricultural research and extension
services; inefficiencies of subsidies;
poor capacity in terms of policy processes and human resources issues.
In its Malawi Country Assessment Report of November 2010, the UN stated that the MoAFS’s goal of
achieving 6% growth in the sector per annum would be possible if there were more diversification of
export crops from the traditional ones like tobacco, tea, sugar and coffee.
ISSUE 5 - “MAIZE IS OUR LIFE”29
With 97% of farms growing maize in 2011, it is no surprise that Malawi is believed to consume more
of the cereal per capita than any other country on earth.30 It is often said that Malawians will only
diversify their diet when faced with far greater affluence or complete starvation.
Unless the diet is balanced with proteins and vitamin-rich fruit and vegetables, a heavy reliance on
maize is a recipe for malnutrition, especially amongst young children. What’s more continual
growing of maize in an unbroken cycle of fertilizer-rich soil (leaving land fallow on small farms is
impractical) is depleting soil quality. The degraded soil craves ever more fertilizer.
The adoption of maize as the chief crop is linked to the fact that it is potentially the highest yielding
grain crop under the right conditions. It requires a substantial amount of water, but has little
resilience to weather extremes of flood, drought and high temperatures.
29 Peters and Herrera, 1994, p314 30 Smale 1995, p820
Photo: Richard Lee
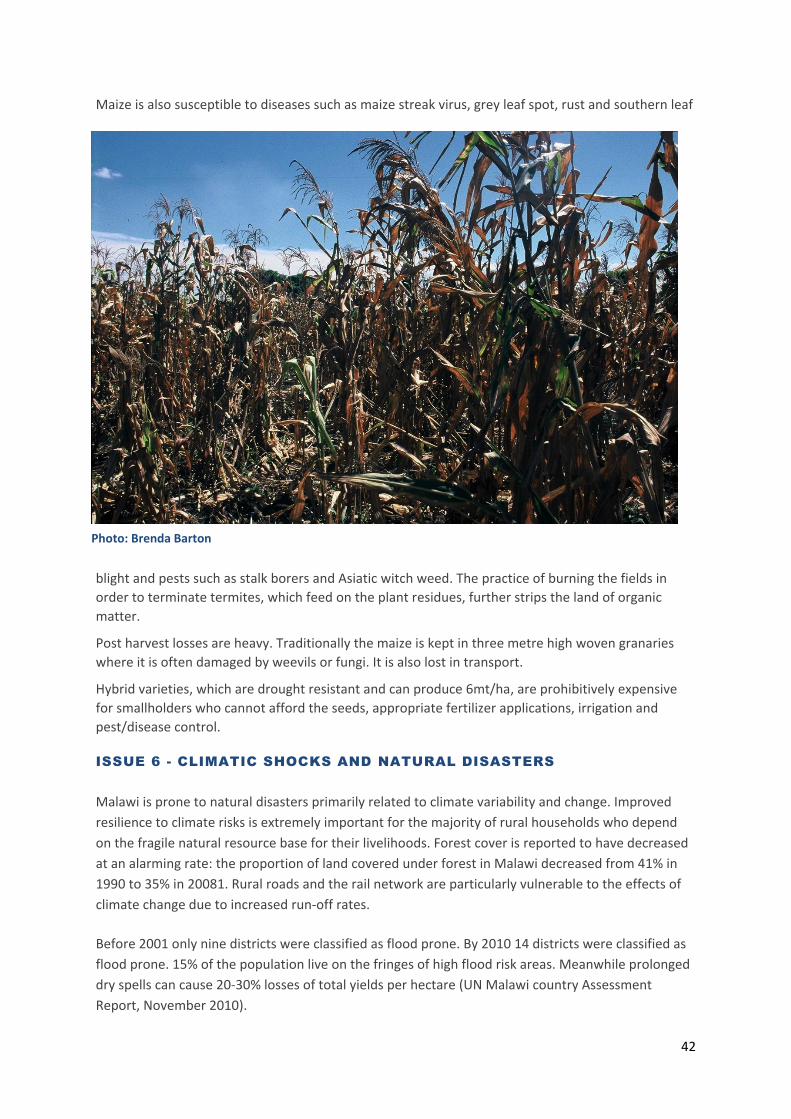
42
Maize is also susceptible to diseases such as maize streak virus, grey leaf spot, rust and southern leaf
blight and pests such as stalk borers and Asiatic witch weed. The practice of burning the fields in
order to terminate termites, which feed on the plant residues, further strips the land of organic
matter.
Post harvest losses are heavy. Traditionally the maize is kept in three metre high woven granaries
where it is often damaged by weevils or fungi. It is also lost in transport.
Hybrid varieties, which are drought resistant and can produce 6mt/ha, are prohibitively expensive
for smallholders who cannot afford the seeds, appropriate fertilizer applications, irrigation and
pest/disease control.
ISSUE 6 - CLIMATIC SHOCKS AND NATURAL DISASTERS
Malawi is prone to natural disasters primarily related to climate variability and change. Improved
resilience to climate risks is extremely important for the majority of rural households who depend
on the fragile natural resource base for their livelihoods. Forest cover is reported to have decreased
at an alarming rate: the proportion of land covered under forest in Malawi decreased from 41% in
1990 to 35% in 20081. Rural roads and the rail network are particularly vulnerable to the effects of
climate change due to increased run-off rates.
Before 2001 only nine districts were classified as flood prone. By 2010 14 districts were classified as
flood prone. 15% of the population live on the fringes of high flood risk areas. Meanwhile prolonged
dry spells can cause 20-30% losses of total yields per hectare (UN Malawi country Assessment
Report, November 2010).
Photo: Brenda Barton

43
It’s worth looking at Malawi’s rainfall patterns more closely to investigate whether Malawian
smallholders should be encouraged to diversify from maize. Seasonal rainfall in Malawi varies from
700mm in the extreme south west of the country to 1200mm in the north east. 90% of the yearly
rain falls between October and April. Within this period, the growing season is longer in the north
than the south, as the monsoonal rainfall regime prompts the season to start.
Maize has a relatively high water requirement varying from 500mm to 800mm for the standard four
month development cycle depending on the region's climate. Climate records across the continent
show that the 50s and 60s were markedly wetter decades than the 80s and recent times, which
explains why maize was established as the preferred crop during such wetter periods.
For southern Malawi, water requirements for maize are near 700mm which just about equals the
average rainfall for the region. This fine
balance between maize water
requirements and average seasonal
rainfall underlies the vulnerability of rain
dependent maize farmers in the south
of the country. Though maize can be a
high yielding crop it is also notoriously
sensitive to water deficits during the key
stages of its development, flowering and
grain filling.
In regions where the seasonal rainfall is
close to the crop water requirements
there is little margin to avoid serious
impacts on the crop yield if there are
water deficits during the key stages.
These can come about in two ways.
Firstly a marked dry spell / rainfall
deficit during flowering and/or early
grain filling (after a trouble free planting
and development period) – this has a
direct impact on crop performance that
can seem out of proportion to the
associated fluctuation in seasonal
rainfall. Secondly, a marked delay in the
start of the season leading to late
planting – this causes the crop
development to time shift forcing the
flowering and grain filling to occur later
than usual. In the later season it is more
likely that rainfall will end or long dry
spells will occur.
Map 5: Variability in rainfall during maize flowering and grain filling

44
These two types of events (mid season dry spells and delayed planting) are quite usual, especially in
the south. In more northern areas, rainfall amounts are higher, growing seasons longer and the
rainfall regime more stable in both timings and amount.
The map conveys these constraints by showing the inter annual (year on year) of 30 day rainfall
during the period when maize usually undergoes flowering and grain filling. Southern regions clearly
have far more variable rainfall during these critical stages. Well above average rainfall can also be
counterproductive because of water logging if much above average, but below average rainfall has a
significant detrimental impact for the reasons outlined above.
The more pronounced inter annual rainfall variability in the south therefore has a negative long term
effect on rain-fed maize farmers and this can only be alleviated by appropriate agricultural policy
interventions or by the vagaries of climate - such as a short cycle of seasons with favourable rainfall
patterns.
This maize bias means Malawi is risking losing on the potential in national and regional markets for
other commodities such as tobacco, sugar, coffee, legumes, groundnuts, tea, cotton, rice, livestock,
fisheries and horticulture.
CONCLUSION
Finding solutions to Malawi’s grave food security problems is highly dependent on getting the macro
economy back on track so that forex inflows increase and the cost of fuel, food, medicine and other
necessities stabilize. At the same time measures to protect the poorest must be taken.
As discussed, Malawi’s people are highly vulnerable to natural disasters – prolonged dry spells
coupled with flash floods destroy crops, livelihoods and lead to greater poverty and food insecurity.
There needs to be a shift from a disaster response culture to the integration of disaster risk into
sustainable development planning and programming. This includes mainstreaming disaster risk
reduction into policies, strategies, programmes and annual planning at all levels as well as creating a
multi stakeholder forum for the coordination of different stakeholder. People centred early warning
systems need to exist at national and local levels.
But this survey has highlighted that food insecurity is not solely a climatic driven southern issue. The
south requires most food aid because it faces severe seasonal deficits, but it’s in the centre that
childhood stunting is most severe. Outdated agricultural practices and small land size are preventing
central farmers from increasing their yields and exposing them to food deficits.
Malawi’s high dependency on maize is unsustainable both from a nutrition and economic view point.
This is most marked in the south where the crop’s high water requirement just about equals the
average rainfall for the region, leaving farmers with rain fed maize crops highly exposed to any
vagaries in rainfall volume during the key stages of its development, flowering and grain filling.
Consumers will naturally lessen their reliance on maize if they move out of poverty: as we have seen
in this survey those in the higher wealth quintiles are less reliant on consuming maize, opting for a
more varied diet that includes more protein, fruit, oil and sugar.
Given the high export potential for crops and the fact that Malawi remains such an agrarian society,
the Ministry of Agriculture should be supported to investigate creating commodity geographical

45
zones based on the agro-ecological potential of crops such as tobacco, sugar, coffee, tea, cotton,
rice, ground nuts, livestock, fisheries , legumes and horticulture and develop comprehensive
development plans to do so. Internal, regional and international markets need to be assessed as
does the potential to supply regional markets and cater for their changing demands. Small, medium
and large entrepreneurs in the commodity value chain must be supported and developed. Private
investments in irrigation need to be encouraged and developed – as does a business environment
that’s appealing to investors.
The design of the FIS subsidy programme also needs improving. A model for determining the
economically appropriate rate of subsidy per FIS participant and length of stay in the programme
should be devised. It should focus on targeting farmers with potential to succeed in the FIS, and
there needs to be an incentive package for motivating graduation of successful farmers out of the
programme. The fertilizers being provided need to be targeted to variable soil and rainfall conditions
around the country. The adoption of more sustainable farming practices including conservation
farming must be promoted to improve the efficiency of fertilizer and water use and increase the
profitability of each kilogram of input used.
At the heart of improving food security in Malawi is education. The system requires an overhaul, not
only to provide a higher standard of teaching but also to vastly improve school attendance levels,
particularly in the south and for women. Training institutions need to be strengthened to ensure
that Malawians are able to access specific and standardised skills training.
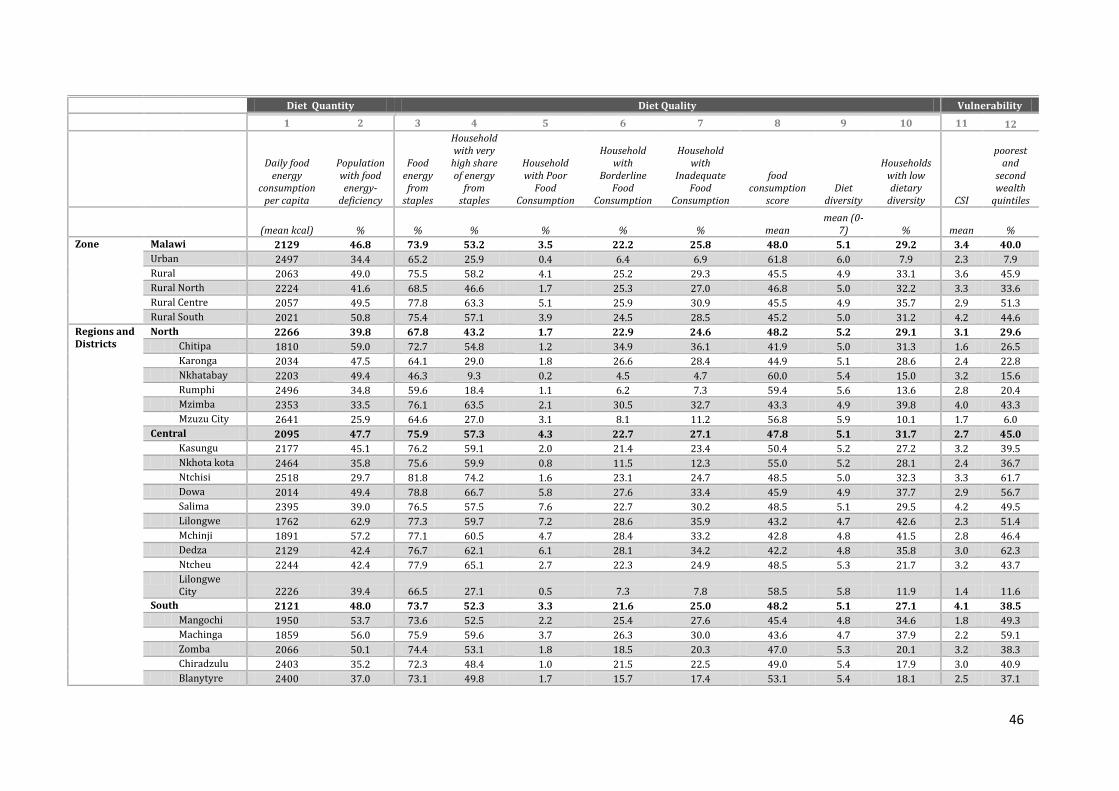
46
Diet Quantity Diet Quality Vulnerability
1 2 3 4 5 6 7 8 9 10 11 12
Daily food energy
consumption per capita
Population with food energy-
deficiency
Food energy from
staples
Household with very
high share of energy
from staples
Household with Poor
Food Consumption
Household with
Borderline Food
Consumption
Household with
Inadequate Food
Consumption
food consumption
score Diet
diversity
Households with low dietary
diversity CSI
poorest and
second wealth
quintiles
(mean kcal) % % % % % % mean mean (0-
7) % mean %
Zone Malawi 2129 46.8 73.9 53.2 3.5 22.2 25.8 48.0 5.1 29.2 3.4 40.0
Urban 2497 34.4 65.2 25.9 0.4 6.4 6.9 61.8 6.0 7.9 2.3 7.9
Rural 2063 49.0 75.5 58.2 4.1 25.2 29.3 45.5 4.9 33.1 3.6 45.9
Rural North 2224 41.6 68.5 46.6 1.7 25.3 27.0 46.8 5.0 32.2 3.3 33.6
Rural Centre 2057 49.5 77.8 63.3 5.1 25.9 30.9 45.5 4.9 35.7 2.9 51.3
Rural South 2021 50.8 75.4 57.1 3.9 24.5 28.5 45.2 5.0 31.2 4.2 44.6
Regions and Districts
North 2266 39.8 67.8 43.2 1.7 22.9 24.6 48.2 5.2 29.1 3.1 29.6
Chitipa 1810 59.0 72.7 54.8 1.2 34.9 36.1 41.9 5.0 31.3 1.6 26.5
Karonga 2034 47.5 64.1 29.0 1.8 26.6 28.4 44.9 5.1 28.6 2.4 22.8
Nkhatabay 2203 49.4 46.3 9.3 0.2 4.5 4.7 60.0 5.4 15.0 3.2 15.6
Rumphi 2496 34.8 59.6 18.4 1.1 6.2 7.3 59.4 5.6 13.6 2.8 20.4
Mzimba 2353 33.5 76.1 63.5 2.1 30.5 32.7 43.3 4.9 39.8 4.0 43.3
Mzuzu City 2641 25.9 64.6 27.0 3.1 8.1 11.2 56.8 5.9 10.1 1.7 6.0
Central 2095 47.7 75.9 57.3 4.3 22.7 27.1 47.8 5.1 31.7 2.7 45.0
Kasungu 2177 45.1 76.2 59.1 2.0 21.4 23.4 50.4 5.2 27.2 3.2 39.5
Nkhota kota 2464 35.8 75.6 59.9 0.8 11.5 12.3 55.0 5.2 28.1 2.4 36.7
Ntchisi 2518 29.7 81.8 74.2 1.6 23.1 24.7 48.5 5.0 32.3 3.3 61.7
Dowa 2014 49.4 78.8 66.7 5.8 27.6 33.4 45.9 4.9 37.7 2.9 56.7
Salima 2395 39.0 76.5 57.5 7.6 22.7 30.2 48.5 5.1 29.5 4.2 49.5
Lilongwe 1762 62.9 77.3 59.7 7.2 28.6 35.9 43.2 4.7 42.6 2.3 51.4
Mchinji 1891 57.2 77.1 60.5 4.7 28.4 33.2 42.8 4.8 41.5 2.8 46.4
Dedza 2129 42.4 76.7 62.1 6.1 28.1 34.2 42.2 4.8 35.8 3.0 62.3
Ntcheu 2244 42.4 77.9 65.1 2.7 22.3 24.9 48.5 5.3 21.7 3.2 43.7
Lilongwe City 2226 39.4 66.5 27.1 0.5 7.3 7.8 58.5 5.8 11.9 1.4 11.6
South 2121 48.0 73.7 52.3 3.3 21.6 25.0 48.2 5.1 27.1 4.1 38.5
Mangochi 1950 53.7 73.6 52.5 2.2 25.4 27.6 45.4 4.8 34.6 1.8 49.3
Machinga 1859 56.0 75.9 59.6 3.7 26.3 30.0 43.6 4.7 37.9 2.2 59.1
Zomba 2066 50.1 74.4 53.1 1.8 18.5 20.3 47.0 5.3 20.1 3.2 38.3
Chiradzulu 2403 35.2 72.3 48.4 1.0 21.5 22.5 49.0 5.4 17.9 3.0 40.9
Blanytyre 2400 37.0 73.1 49.8 1.7 15.7 17.4 53.1 5.4 18.1 2.5 37.1

47
Mwanza 2162 45.2 76.8 63.8 0.7 17.2 17.9 48.9 5.2 24.1 6.7 45.4
Thyolo 2444 34.9 69.9 43.4 2.3 15.7 18.0 49.0 5.3 19.9 6.2 25.3
Mulanje 1830 57.8 77.3 62.0 6.5 28.8 35.3 41.8 4.8 37.1 3.7 42.5
Phalombe 1756 59.1 77.7 63.7 9.2 32.1 41.3 39.9 4.6 42.6 3.4 54.5
Chikwawa 1721 61.9 79.3 65.3 9.1 31.8 40.9 41.2 4.6 42.4 8.5 54.5
Nsanje 1867 61.4 78.4 64.1 6.4 27.0 33.4 42.6 4.7 39.7 8.3 46.3
Balaka 2031 48.6 79.4 70.7 2.1 31.5 33.5 45.2 5.0 30.7 4.5 42.0
Neno 2074 45.6 79.5 68.3 2.1 26.4 28.5 43.9 4.8 36.8 6.6 52.4
Zomba City 2413 38.1 63.1 22.7 0.5 8.1 8.6 62.1 6.1 6.2 1.6 5.3
Blantyre City 2779 31.2 64.3 24.7 0.0 4.5 4.5 66.7 6.1 4.4 3.8 1.6
sex of the household head
male 2119 46.6 73.1 51.1 2.8 20.2 23.1 49.3 5.2 26.3 3.1 35.5
female 2170 47.4 76.4 59.9 5.8 28.7 34.4 44.0 4.8 38.5 4.4 54.2
wealth quintiles
1st = poorest 1881 54.2 80.8 71.7 8.2 38.6 46.8 38.1 4.4 52.3 5.1 100.0
2nd 1950 53.5 77.9 63.3 5.2 31.3 36.5 41.5 4.7 39.3 3.9 100.0
3rd - middle 2060 47.5 74.1 54.7 2.8 21.4 24.2 45.8 5.0 28.6 3.4 0.0
4th 2178 46.4 71.5 48.9 1.2 15.0 16.2 50.6 5.3 20.3 2.7 0.0
5th - wealthiest 2507 34.6 65.1 27.0 0.2 4.9 5.1 64.3 6.1 5.4 1.8 0.0
population with food energy deficiency
no 2840 0.0 73.3 51.4 2.0 15.2 17.2 52.2 5.4 20.5 3.0 35.7
yes 1321 100.0 74.7 55.9 5.9 32.8 38.7 41.8 4.6 43.2 4.1 46.5
food consumption
acceptable 2294 39.9 70.1 43.4 0.0 0.0 0.0 54.9 5.5 14.2 2.6 31.4
inadequate 1650 66.9 84.6 80.8 13.7 86.3 100.0 28.4 3.8 72.2 5.6 64.7
1 KCALS (per capita): kilocalories consumed per household divided by # of household members. Mean constructed at different population levels. Below 2050 is very low. >3000 very high based on IFPRI 2007
2 FED (people): Population with daily energy consumption below daily energy requirements (based on age/sex/activity level of HH members) . According to FAO 2004. Recommendation for light activity see IFPRI 2007 appendix 8
3 Percentage of food coming from staples (cereals, grain, tubers and roots) 4 Very High Staple (HH): 75%+ of food energy from staples (cereals and grains)
5 PFCS: percentage of households with poor food consumption (FCS 21 or less) 6 BFCS: percentage of households with borderline Food consumption (FCS greater than 21 and less than 35) 7 Percentage of households with poor and borderline food consumption ( FCS less than 35)
8 mean food consumption score 9 Diet Diversity: Number of food groups (1 to 7) consumed by household during 7 day reference period 10 LDD proportion of household with low diet diversity. Household consumes 4 or less food groups over 1 week 11 Coping strategy index reduced 12 first and second wealth quintiles

48
Nutrition
13 14 15
Underweight Stunting Wasting
% Severe (<-3 Z-score)
% Global (<-2 Z-score
)
% Severe (<-3 Z-score)
% Global (<-2 Z-score
)
% SAM (<-3 Z-score)
%GAM (<-2 Z-score
) Zone Malawi 1.5 6.4 16.0 35.7 0.8 3.1
Urban 0.8 3.0 19.1 37.8 0.4 1.2 Rural 1.7 7.0 15.6 35.3 0.9 3.4 Rural North 0.3 1.7 2.1 18.7 0.1 1.3 Rural Centre 1.9 9.1 21.0 41.5 1.0 4.2 Rural South 1.9 6.5 14.4 34.4 1.0 3.3
Regions and Districts
North 0.3 1.6 1.9 18.3 0.1 1.4 Chitipa 0.6 1.7 2.6 26.0 0.5 1.0 Karonga 0.0 1.7 2.0 15.4 0.0 3.1 Nkhatabay 0.0 2.0 4.3 16.7 0.0 1.3 Rumphi 0.3 1.7 1.4 20.8 0.3 0.3 Mzimba 0.3 1.4 1.5 17.8 0.0 0.9 Mzuzu City 0.3 1.3 0.4 15.2 0.6 1.6 Central 1.8 8.3 21.8 42.1 0.9 3.6 Kasungu 1.6 8.1 24.4 48.2 0.2 5.2 Nkhota kota 0.5 8.2 14.8 50.3 0.3 2.3 Ntchisi 2.0 10.9 21.7 49.4 0.6 2.8 Dowa 2.9 8.2 29.5 50.2 0.7 2.7 Salima 4.7 20.1 19.1 41.9 2.2 8.3 Lilongwe 0.8 5.1 16.2 31.6 1.9 5.2 Mchinji 1.6 9.8 31.1 52.8 1.7 2.5 Dedza 4.1 16.8 26.2 49.2 0.7 6.3 Ntcheu 0.0 1.6 7.4 18.2 0.0 0.4 Lilongwe
City 1.0 4.0 27.1 44.6 0.3 0.6 South 1.7 5.9 14.5 34.5 1.0 3.1 Mangochi 1.4 4.3 3.5 22.7 1.4 3.0 Machinga 1.2 2.6 6.1 27.1 1.2 2.1 Zomba 1.0 8.2 24.0 52.0 0.3 1.7 Chiradzulu 0.9 5.4 12.8 25.3 0.5 4.1 Blanytyre 2.9 12.6 21.3 41.2 0.0 4.7 Mwanza 4.8 11.9 28.3 47.2 2.4 5.5 Thyolo 0.7 3.0 14.7 34.3 1.9 4.1 Mulanje 2.7 8.5 28.0 54.1 0.5 1.0 Phalombe 5.7 13.7 26.5 51.1 2.8 7.5 Chikwawa 1.7 3.9 5.5 15.4 0.3 1.6 Nsanje 0.0 2.2 2.1 23.4 0.5 2.3 Balaka 1.0 6.0 8.6 22.2 0.0 4.6 Neno 4.8 11.9 33.8 47.6 2.4 8.5 Zomba City 2.5 10.2 21.0 47.3 0.5 2.0 Blantyre
City 0.0 0.3 17.4 36.4 0.9 2.0
13 underweight
14 stunting
15 wasting