Embed Size (px)
Citation preview

GOVERNMENT OF MALAWI
Malawi Micronutrient Survey Key Indicators Report
2015-16
National Statistical Office Zomba, Malawi
Community Health Services Unit of the Ministry of Health
Department of Nutrition, HIV and AIDS Lilongwe, Malawi
Centers for Disease Control & Prevention
Emory University Atlanta, Georgia, USA
February 2017
The mark “CDC” is owned by the US Dept. of Health and Human Services and is used with permission. Use of this logo is not an endorsement by HHS or CDC of any particular product, service, or enterprise.
ACKNOWLEDGEMENTS The 2015-16 Malawi Micronutrient Survey (MNS) was carried out between December 2015 and February 2016 by the National Statistical Office (NSO), Community Health Services Unit (CHSU) of the Ministry of Health, and Department of Nutrition, HIV and AIDS (DNHA) jointly with the 2015-16 Malawi Demographic and Health Survey. Technical and financial support for the MNS was provided by the government of Malawi, United States Agency for International Development (USAID), United Nations Children’s Fund (UNICEF), Irish Aid, World Bank, and Emory Global Health Institute. The Centers for Disease Control and Prevention (CDC), Emory University, and ICF provided technical assistance. Special thanks go to the Principal Investigators Dr. Ben Chilima (CHSU) and Mr. Isaac Chirwa (NSO) for their dedication and commitment throughout the survey process. We acknowledge the contributions from various authors, members of the technical committee, and other professionals who individually and collectively gave comments and advice in the process of writing this report. We give special thanks to all the survey team members who dedicated many months of their time to the survey. We are especially grateful to the Malawian children, women, and men who participated in this survey; without their willingness, the survey would not have been conducted. Recommended citation: National Statistical Office (NSO), Community Health Sciences Unit (CHSU) [Malawi], Centers for Disease Control and Prevention (CDC), and Emory University. 2016. Malawi Micronutrient Survey 2015-16: Key Indicators Report. Atlanta, GA, USA: NSO, CHSU, CDC and Emory University.
TABLE OF CONTENTS EXECUTIVE SUMMARY ...................................................................................................................... 1 CHAPTER 1. INTRODUCTION ............................................................................................................. 3 CHAPTER 2. METHODS ........................................................................................................................ 5 CHAPTER 3. RESPONSE RATES AND BACKGROUND CHARACTERISTICS ............................ 13 CHAPTER 4. INFLAMMATION, MALARIA, AND SCHISTOSOMIASIS ....................................... 16 CHAPTER 5. IRON DEFICIENCY, ANEMIA, IRON DEFICIENCY ANEMIA, AND BLOOD DISORDERS .......................................................................................................................................... 19 CHAPTER 6. VITAMIN A STATUS .................................................................................................... 23 CHAPTER 7. ZINC DEFICIENCY ....................................................................................................... 24 CHAPTER 8. COVERAGE OF NUTRITION INTERVENTIONS ...................................................... 26 APPENDICES ........................................................................................................................................ 30 REFERENCES ....................................................................................................................................... 32

LIST OF TABLES Table 1.1 Comprehensive list of indicators measured in the 2015-16 Malawi Micronutrient Survey ......... 4 Table 2.1 Micronutrient sample allocation of clusters by region and residence ........................................... 6 Table 2.2 Minimum food specimen sample required for analysis ................................................................ 9 Table 2.3 Cutoffs used for key biomarkers ................................................................................................. 12 Table 3.1 Target sample size and participation by target group, Malawi 2016 .......................................... 13 Table 3.2 Background characteristics of households, Malawi 2016 ........................................................... 14 Table 3.3 Background characteristics of individuals, Malawi 2016 ........................................................... 14 Table 5.1 Prevalence of iron deficiency, anemia, and iron deficiency anemia among preschool children and school-aged children, Malawi 2016 ..................................................................................................... 20 Table 5.2 Prevalence of iron deficiency, anemia, and iron deficiency anemia among non-pregnant women of reproductive age, Malawi 2016 .............................................................................................................. 21 Table 5.3 Prevalence of blood disorders among preschool children, Malawi 2016 ................................... 22 Table 6.1 Prevalence of low retinol binding protein among preschool children, school-aged children, non-pregnant women of reproductive age and men, Malawi 2016 .................................................................... 23 Table 7.1 Prevalence of zinc deficiency among preschool children and school-aged children, Malawi 2016 ............................................................................................................................................................ 24 Table 7.2 Prevalence of zinc deficiency among non-pregnant women of reproductive age and men, Malawi 2016 ............................................................................................................................................... 25 Table 8.1 Prevalence of household hunger, Malawi 2016 .......................................................................... 28 Table A.1 Details of biological indicators .................................................................................................. 30 Table A.2 Design effects for main micronutrient outcomes ....................................................................... 31
LIST OF FIGURES Figure 1.1 Key Findings from 2015-16 Malawi Micronutrient Survey ........................................................ 2 Figure 2.1 2015-16 Malawi Micronutrient Survey sampling design ............................................................ 6 Figure 2.2 Specimen volume and testing .................................................................................................... 10 Figure 4.1 Prevalence of elevated AGP, elevated CRP, and any inflammation among preschool children, school-aged children, non-pregnant women of reproductive age, and men by residence, Malawi 2016 ... 16 Figure 4.2 Prevalence of malaria among preschool children, school-aged children, non-pregnant women of reproductive age, and men by residence, Malawi 2016 .......................................................................... 17 Figure 4.3 Prevalence of urinary schistosomiasis based on self-reported and measured hematuria among preschool children, school-aged children, and men, Malawi 2016 ............................................................. 18 Figure 8.1 Prevalence of micronutrient supplementation use and other nutrition-related interventions among preschool children by region, Malawi 2016 .................................................................................... 26 Figure 8.2 Prevalence of micronutrient supplementation use and other nutrition-related interventions among school-aged children by region, Malawi 2016 ................................................................................ 27 Figure 8.3 Prevalence of micronutrient supplementation use among non-pregnant women of reproductive age by region, Malawi 2016 ........................................................................................................................ 28 Figure 8.4 Coverage of social protection programs by region, Malawi 2016 ............................................. 29

1
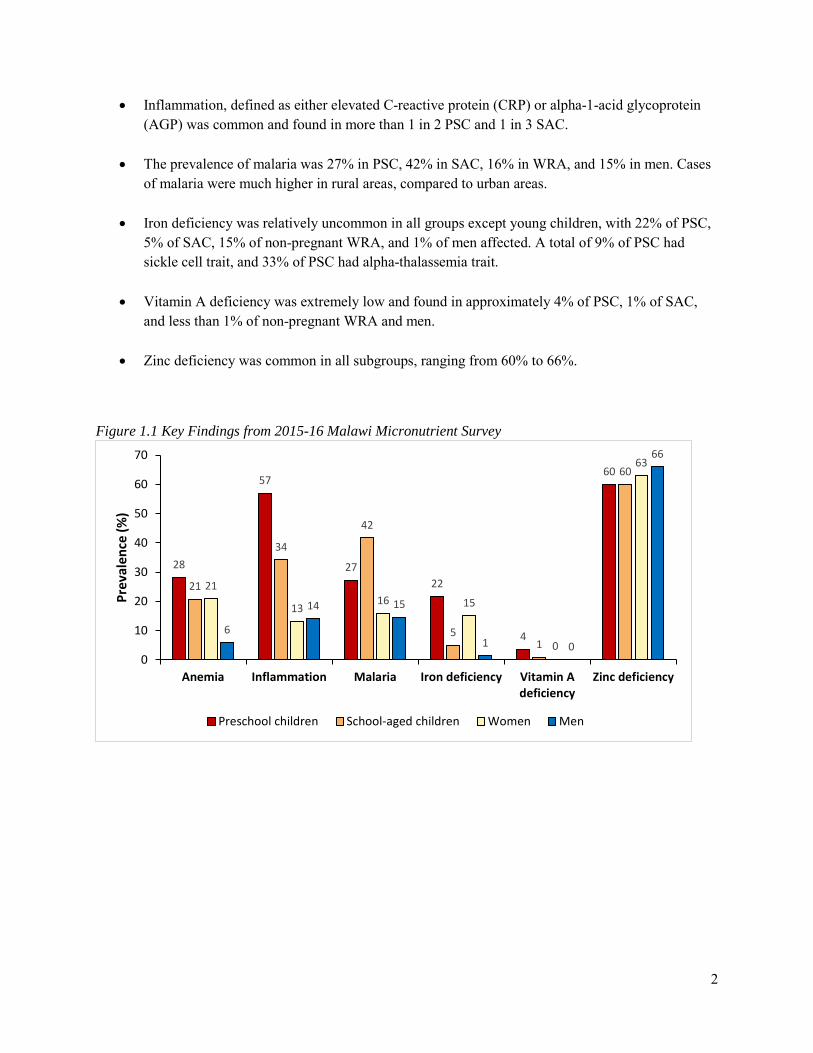
EXECUTIVE SUMMARY This Key Indicators Report summarizes major findings of the 2015-16 Malawi Micronutrient Survey (2015-16 MNS) conducted between December 2015 and February 2016, jointly as part of the 2015-16 Malawi Demographic and Health Survey (2015-16 MDHS). The National Statistical Office (NSO) implemented the 2015-16 MDHS at the request of the Ministry of Health. Through the DHS Program, a United States Agency for International Development (USAID) funded program, ICF International provided technical assistance in designing and implementing the 2015-16 MDHS. The Centers for Disease Control and Prevention (CDC) and Emory University, in collaboration with the Department of Nutrition, HIV and AIDS (DNHA) and the Community Health Sciences Unit (CHSU), provided technical assistance for designing and implementing the micronutrient component. Financial support for the 2015-16 MDHS and MNS was provided by the government of Malawi, USAID, United Nations Children’s Fund (UNICEF), Malawi National AIDS Commission (NAC), United Nations Population Fund (UNFPA), UN WOMEN, Irish Aid, World Bank and Emory Global Health Institute. The main purpose of the MNS was to provide program managers and policy makers with the data needed to plan, implement, and monitor and evaluate nutrition interventions for Malawi. The MNS determined the prevalence of micronutrient deficiencies (vitamin A, iron, iodine, zinc, vitamin B12, and folate) and anemia among a nationally and regionally-representative sample of preschool children (PSC), school-aged children (SAC), women of reproductive age (WRA), and men. The survey also assessed the coverage of nutrition and nutrition-related interventions (including micronutrient supplementation and food fortification) and evaluated the determinants of anemia (including nutrition, malaria, inflammation, inherited blood disorders, and urinary schistosomiasis). Data from prior surveys have shown that micronutrient deficiencies are major public health problems in Malawi (MDHS 2000, 2004, and 2010 and national micronutrient surveys in 2001 and 2009). Thus, the government of Malawi and partners have implemented a range of interventions to combat micronutrient malnutrition. These interventions include targeted micronutrient supplementation (e.g., vitamin A supplementation for young children and iron-folic acid supplementation for pregnant women), nutrition education, and food fortification of staple foods (namely sugar and oil with vitamin A). Information on recent trends in micronutrient deficiencies among vulnerable populations in Malawi is lacking. The MNS findings will assess progress, evaluate existing programs, and provide a basis for policy direction and planning. This Key Indicators Report is a first report of the key findings from the MNS and is intended for a broad nutrition and non-nutrition audience. A comprehensive MNS report will be published subsequently. The main micronutrient findings for all four target groups are presented in Figure 1.1. Key findings include:
• The overall survey response rate was 90% with an included sample size of 1233 PSC, 800 SAC, 778 non-pregnant WRA, and 228 men from 2114 households.
• Anemia was found in 28% of PSC, 21% of SAC, 21% of non-pregnant WRA, and 6% of men.
2
• Inflammation, defined as either elevated C-reactive protein (CRP) or alpha-1-acid glycoprotein (AGP) was common and found in more than 1 in 2 PSC and 1 in 3 SAC.
• The prevalence of malaria was 27% in PSC, 42% in SAC, 16% in WRA, and 15% in men. Cases of malaria were much higher in rural areas, compared to urban areas.
• Iron deficiency was relatively uncommon in all groups except young children, with 22% of PSC, 5% of SAC, 15% of non-pregnant WRA, and 1% of men affected. A total of 9% of PSC had sickle cell trait, and 33% of PSC had alpha-thalassemia trait.
• Vitamin A deficiency was extremely low and found in approximately 4% of PSC, 1% of SAC, and less than 1% of non-pregnant WRA and men.
• Zinc deficiency was common in all subgroups, ranging from 60% to 66%.
Figure 1.1 Key Findings from 2015-16 Malawi Micronutrient Survey
28
57
2722
4
60
21
34
42
51
60
21
1316 15
0
63
6
14 15
1 0
66
0
10
20
30
40
50
60
70
Anemia Inflammation Malaria Iron deficiency Vitamin Adeficiency
Zinc deficiency
Prev
alen
ce (%
)
Preschool children School-aged children Women Men

3
CHAPTER 1. INTRODUCTION The 2015-16 Malawi Micronutrient Survey (2015-16 MNS) was conducted jointly with the 2015-16 Malawi Demographic Health Survey (2015-16 MDHS). The Malawi National Statistical Office (NSO) implemented the 2015-16 MDHS in collaboration with other agencies and with technical assistance from ICF International through the USAID-funded DHS Program. The 2015-16 MNS was implemented by the NSO, Community Health Services Unit (CHSU) of the Ministry of Health, and Department of Nutrition, HIV and AIDS (DNHA) with funding from Irish Aid, World Bank and Emory Global Health Institute and coordination from UNICEF. Technical assistance for the survey was provided by the Centers for Disease Control and Prevention (CDC) and Emory University. This was the third MNS following the 2001 and 2009 national micronutrient surveys in Malawi. This Key Indicators Report summarizes the key findings from the MNS and is intended for a broad audience. A separate, comprehensive MNS report will be published subsequently to present additional data as well as comparisons with results from the 2001 and 2009 surveys. 1.1 SURVEY OBJECTIVES The primary objective of the 2015-16 MNS was to provide up-to-date data to support the planning and monitoring and evaluation of nutrition interventions in Malawi. Specifically, the 2015-16 MNS aimed to estimate the prevalence of:
1) Anemia (including iron deficiency anemia), 2) Iron deficiency, 3) Vitamin A deficiency,1 4) Iodine deficiency,2 5) Zinc deficiency, 6) Vitamin B12 and folate deficiency,2 7) Inflammation, 8) Infection (malaria and urinary schistosomiasis), 9) Inherited blood disorders,2 10) Wasting, stunting, underweight and overweight/obesity,3 11) Households with adequately iodized salt,2 12) Households with vitamin A fortified oil and sugar,2
and to estimate the: 13) Coverage of key nutrition interventions.
1 The prevalence of vitamin A deficiency based on low RBP alone will be presented in the Key Indicators Report. The prevalence of vitamin A deficiency comparing various indicators (retinol, MRDR and RBP) will be presented in the main 2015-16 MNS report. 2 Due to pending laboratory analysis, these indicators will only be included in the main 2015-16 MNS report 3 Anthropometry is not included in this Key Indicators Report because it was also assessed in the MDHS and reported in the MDHS reported. Anthropometry from the MNS will be reported in the main 2015-16 MNS report.

4
1.2 TARGET GROUPS The target populations of the 2015-16 MNS included: preschool children (PSC) 6-59 months, school-aged children (SAC) 6-14 years, pregnant and non-pregnant women of reproductive age (WRA) 15-49 years, and men 20-54 years. A total of 34 (4%) of enrolled WRA were pregnant. For the purposes of this Key Indicators Report, results on only non-pregnant WRA are presented. Details on pregnant WRA will be reported in the main MNS report. Table 1.1 Comprehensive list of indicators measured in the 2015-16 Malawi Micronutrient Survey1
Indicator Household Preschool children
(6-59 months)
School-aged
children (5-14 years)
Women of reproductive
age (15-49 years)
Men (20-55 years)
Hemoglobin - K, M K, M K, M K, M Vitamin A deficiency (RBP) - K, M K, M K, M K, M Vitamin A status (MRDR and serum retinol, in subsample)
- M M M M
Iron deficiency (serum ferritin)
- K, M K, M K, M K, M
Iron deficiency (serum transferrin receptor)
- M M M M
Inflammation (CRP, AGP) - K, M K, M K, M K, M Zinc deficiency (serum zinc) - K, M K, M K, M K, M Malaria (rapid diagnostic test)
- K, M K, M K, M K, M
Urinary schistosomiasis (Hematuria)
- K, M K, M - K, M
Urinary iodine - - M M -
Inherited blood disorders (sickle cell, alpha-thalassemia, G6PD deficiency)
- K, M - - -
Selenium deficiency - M M M M Folic acid and B12 status (serum folate, B12)
- M - M -
Anthropometry - M M M M Iodized salt M - - - - Vitamin A in sugar M - - - - Vitamin A in oil M - - - -
1 Cells with a “K” indicate that reporting will be done in the 2015-16 MNS Key Indicators Report, and cells with an “M” indicate that reporting will be done in the main 2015-16 MNS report. All findings presented in the Key Indicators Report will also be presented in the main MNS report

5
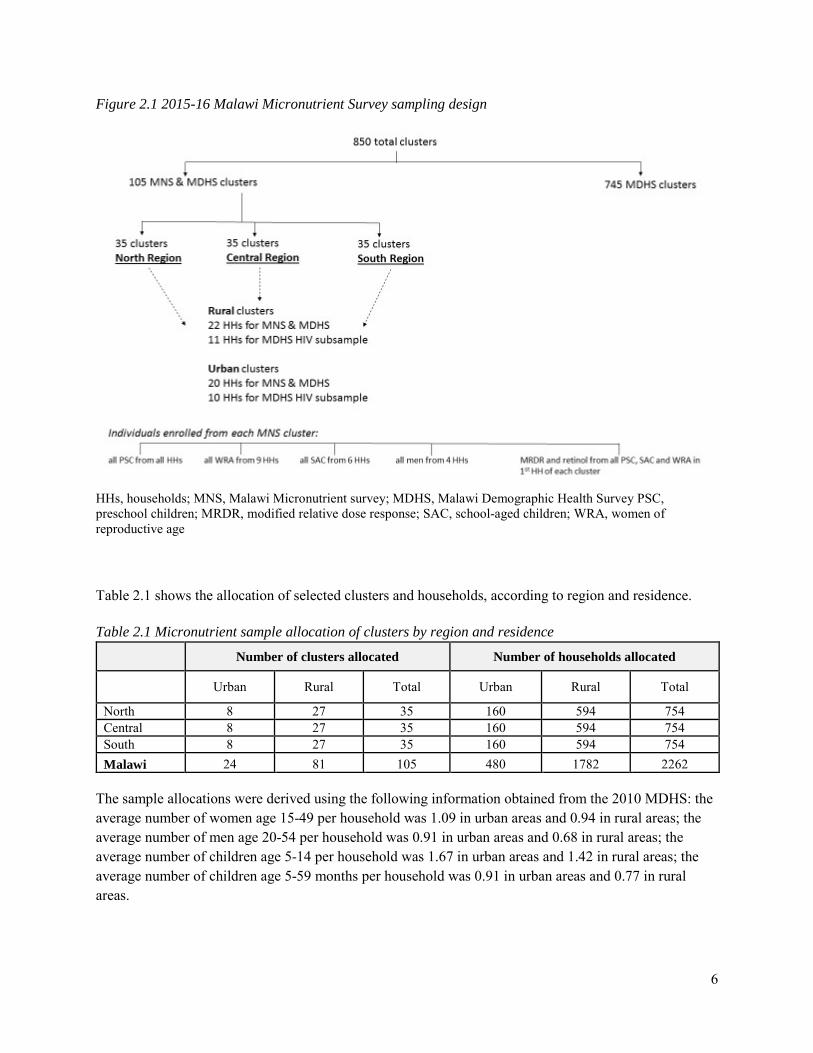
CHAPTER 2. METHODS 2.1 SURVEY DESIGN AND SAMPLING MDHS sampling The 2015-16 MDHS was cross-sectional and employed a two-stage cluster sampling design to produce estimates for key indicators for the country as a whole, for urban and rural areas separately, and for each of the 28 districts in Malawi. The sampling frame utilized the Malawi Population and Housing Census conducted in 2008. The first stage of sampling involved selecting clusters (standard enumeration areas) probability proportional to population size. The second stage followed an updated household listing in each cluster carried out from August to October 2016; a fixed number of 30 households per urban cluster and 33 households per rural cluster were selected with an equal probability systematic selection from the newly created household listing. The 2015-16 MDHS selected a total of 850 clusters, reflecting 27,531 households to participate in the survey. All WRA who were usual members of the selected households and those who spent the night in the selected households before the survey were eligible to be interviewed. In a random subsample of one-third of these households per cluster, all men age 15-54 were eligible for individual interviews and HIV testing. In the same subsample, all eligible WRA and PSC were eligible for anthropometry measurements and anemia and HIV testing. Further information on the methodology for the 2015-16 MDHS is presented in the main MDHS report. MNS sampling The 2015-16 MNS was selected as a subsample of the MDHS to produce estimates of key indicators for the country as a whole, as well as results stratified by region (North, Central, South) and residence (urban, rural). A subsample of 105 clusters (35 clusters in each of the 3 regions) were randomly selected from the 850 MDHS clusters (see Figure 2.1). Among these selected clusters, the households selected for the MDHS HIV subsample of households (10 per urban cluster and 11 per rural cluster) described above were excluded from the MNS. The remaining households (20 per urban cluster and 22 per rural cluster) were included in the MNS. In each selected household, all eligible participants (defined as usual members of the household who spent the night in that household before the survey) were invited to participate according to the following schematic: PSC from all households, WRA from 9 households randomly selected from all households, SAC from 6 households randomly selected from the 9 WRA households, and men from 4 households randomly selected from the 6 SAC households. The first household in each cluster was randomly selected and approached first. In this same household, all eligible PSC, SAC, and WRA were invited to participate in the modified relative dose response (MRDR) subsample, which required administering a small challenge dose of a retinol analog along with a fatty snack, and collecting a venous blood sample 4 to 6 hours later.
6
Figure 2.1 2015-16 Malawi Micronutrient Survey sampling design
HHs, households; MNS, Malawi Micronutrient survey; MDHS, Malawi Demographic Health Survey PSC, preschool children; MRDR, modified relative dose response; SAC, school-aged children; WRA, women of reproductive age Table 2.1 shows the allocation of selected clusters and households, according to region and residence. Table 2.1 Micronutrient sample allocation of clusters by region and residence
Number of clusters allocated Number of households allocated
Urban Rural Total Urban Rural Total
North 8 27 35 160 594 754 Central 8 27 35 160 594 754 South 8 27 35 160 594 754 Malawi 24 81 105 480 1782 2262
The sample allocations were derived using the following information obtained from the 2010 MDHS: the average number of women age 15-49 per household was 1.09 in urban areas and 0.94 in rural areas; the average number of men age 20-54 per household was 0.91 in urban areas and 0.68 in rural areas; the average number of children age 5-14 per household was 1.67 in urban areas and 1.42 in rural areas; the average number of children age 5-59 months per household was 0.91 in urban areas and 0.77 in rural areas.

7
2.2 SAMPLE SIZE DETERMINATION Sample size estimates were based on a predicted change in the prevalence of vitamin A deficiency in PSC from 2009 to 2015 from 22% to 15%. At a confidence level of 95%, power of 80%, design effect of 2.0, and 90% household and individual response rates, data had to be collected on a minimum of 1452 PSC. The final sample of 1452 PSC was more than adequate for estimating both the national and region-specific prevalence of all the key nutrition indicators for the 2015-16 MNS (e.g., anemia, iron deficiency, zinc deficiency, stunting) at 5% and 10% precision, respectively. Calculations assumed a 90% household-response rate, 90% individual-response rate, and an average household size of 4.3 persons. Estimates for the population proportion for each target group were obtained from NSO. The 2015-16 MNS was conducted in 2262 residential households, including 480 households in urban areas and 1782 households in rural areas. The sample size calculated was expected to result in data collected from about 750 eligible WRA, 252 eligible men, 762 eligible SAC, and 1479 eligible PSC. 2.3 ETHICAL CONSIDERATIONS To ensure the 2015-16 MDHS and MNS followed principles to prevent unethical risk to study participants, a joint proposal was submitted and approved by the National Health Sciences Research Committee. Informed consent Informed consent for the survey took place at several levels. First, community leaders from each cluster were informed about the MDHS and MNS, and communal consent was obtained prior to the arrival of the MDHS teams. Second, after completing the MDHS fieldwork, the MDHS enumerators asked each MNS-eligible household for permission to participate in the MNS. Consent for each household was recorded on the MNS paper questionnaire, which was subsequently handed off to the MNS team. Third, upon arrival to the consenting household, the MNS interviewer asked for informed consent from the head of household for collection of food samples. Finally, upon arrival to the field laboratory, the nurse asked for informed consent from each individual for anthropometry and biological testing (venous blood, urine). For children, informed consent was asked from parents or guardians of the child. Confidentiality The data collected by the MNS is protected and will be stored at NSO for three years from the time of data collection. De-identified data from the MNS will be available to the public after release of the 2015-16 MDHS and MNS main reports. Identification of a health condition The survey excluded those too ill to participate and those with a physical disability that would prevent accurate height and/or weight measurement. Survey participants identified as having severe anemia (hemoglobin <7 g/dL), malaria (based on positive results from a rapid diagnostic test), moderate or severe acute malnutrition [using age-appropriate mid-upper arm circumference (MUAC) cutoffs], hematuria

8
(based on urine dipstick in all groups except WRA), or severe illness as identified by a team nurse were provided with a referral to a local hospital for evaluation. 2.4 SURVEY PERSONNEL AND TRAINING Six teams were responsible for conducting the MNS. Each team consisted of one supervisor, one enumerator, two pediatric nurses, and two laboratory technicians. One national supervisor, one national laboratory supervisor, and three regional supervisors oversaw the entire data collection process. MNS personnel received six days of intensive training on the survey objectives, anthropometry measurement, questionnaire administration, and procedures for food sample and biological specimen collection. After completing the training, they conducted a pretest, which involved carrying out the handover process between the MDHS and MNS teams and conducting all survey data collection in two of the 105 clusters. Specialists from CHSU, the Ministry of Health, NSO, DNHA, and CDC conducted the training and supervised the pretest and initial data collection period. Staff from CDC and Emory University provided in-country technical support throughout data collection and the close-out of the survey. Nurses and laboratory personnel were recruited from government district hospitals and had prior experience in phlebotomy, including venous blood collection in children. 2.5 SURVEY IMPLEMENTATION The 2015-16 MNS was conducted from mid-December 2015 to February 2016. The MDHS teams collected survey data electronically using tablet computers, and the MNS teams used a paper questionnaire pre-translated in Chichewa, Tumbuka, or English. MDHS teams completed data collection in each cluster prior to arrival by the MNS team. MNS participants were pre-selected by the MDHS teams through an algorithm pre-programmed into their tablets. After completing data collection in each selected household, the MDHS supervisor filled the cover sheet of the MNS questionnaire booklet with names and ages of eligible individuals selected for the MNS. For each eligible household, MDHS enumerators placed a household label with a unique barcode on the questionnaire and entered the barcode number into the tablet. The barcode number allowed the data collected separately by the MDHS and the MNS teams to be linked. The MDHS team lead then handed over the questionnaire booklets to the MNS team supervisors, who cross-checked the information on the tablets with the questionnaire booklet. On arrival in the cluster, the nurses and laboratory technicians set up the mobile laboratory, and the team lead and enumerator began visiting the selected households. Only households that had agreed to allow the MNS team to visit (as indicated on the cover sheet) were approached. No replacement was done for households that were not enrolled for any reason. On arrival at a household, the enumerator proceeded with the consent process, conducted the household interview, and collected available food specimens of salt, sugar, and oil (see Section 2.8). The enumerator also placed an identification bracelet with a unique barcode label on all household members who were eligible. A corresponding barcode label was placed on the questionnaire booklet. The remaining labels with the same ID were stapled to the back of the

9
questionnaire booklet so that the nurses responsible for interviewing that person at the mobile laboratory could match the number on the bracelet with the number on the questionnaire and then use the remaining corresponding barcode labels for labeling the biological specimens. Following the household interview, the enumerator escorted the selected household members with bracelets to the mobile laboratory. There, the nurse consented each individual and if they agreed, completed the remaining sections of the questionnaire, collected the biological specimens, and conducted anthropometry (see sections 2.7 and 2.8). The nurse confirmed that the ID on the bracelet label, questionnaire labels, and specimen labels matched. After the specimens were collected, the questionnaire, remaining labels, and blood specimens were transferred to the laboratory technicians for processing. Hemoglobin, malaria, and hematuria were assessed in the mobile laboratory, and the results were provided to the individuals while they were at the laboratory; referrals were made if necessary. Each participant was offered a beverage after biological samples were collected.
2.6 ANTHROPOMETRY Anthropometric measurements [length or height, weight, mid-upper arm circumference (MUAC)] were taken from all consenting individuals at the mobile laboratory. Standard procedures using the World Health Organization methodology were utilized. Since anthropometry results are presented in the MDHS report, details of anthropometry will be presented in the main MNS report. 2.7 FOOD SPECIMEN COLLECTION The minimum amounts of food samples that were collected in each household are listed in Table 2.2. Sugar and salt were collected in a plastic, sealable bag and then placed in a paper bag. Cooking oil was collected in a tube and was wrapped with foil to prevent light deteriorating the retinol content. Each food type collected was replaced by the MNS team. Table 2.2 Minimum food specimen sample required for analysis
Food Weight (g) Measure
Sugar 44 10 tablespoons
Salt 22 10 tablespoons
Cooking oil - Half the collection tube (~7mL)
10
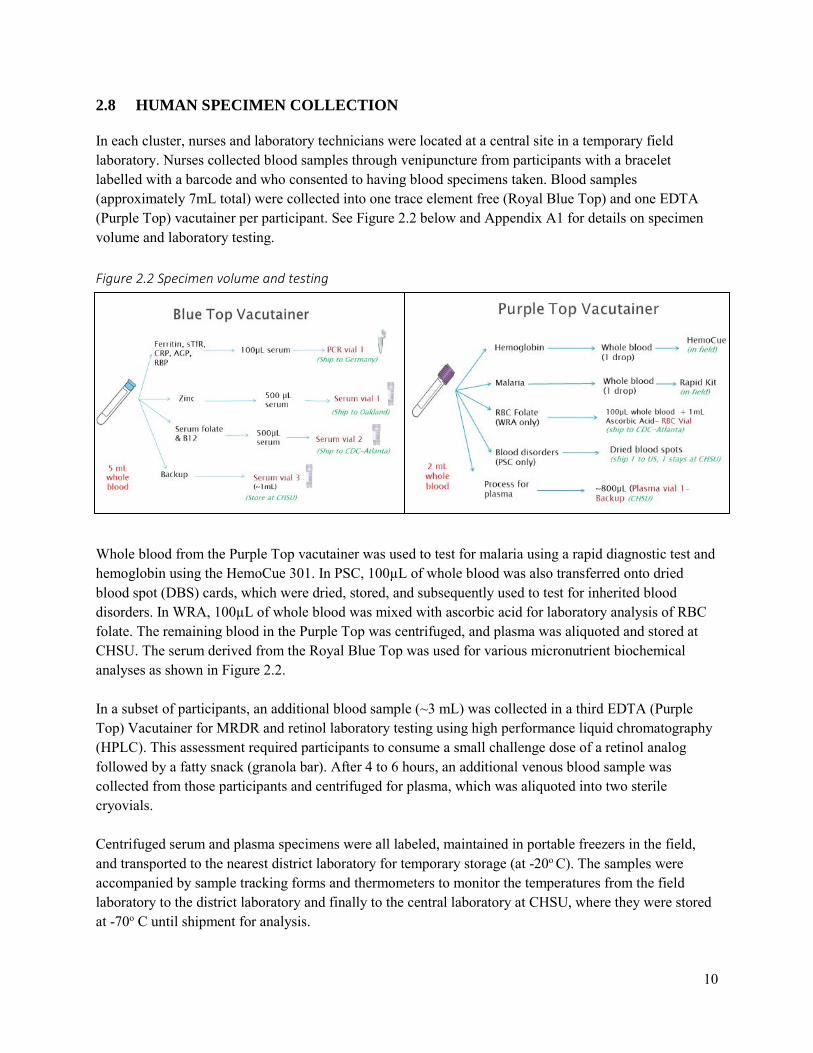
2.8 HUMAN SPECIMEN COLLECTION In each cluster, nurses and laboratory technicians were located at a central site in a temporary field laboratory. Nurses collected blood samples through venipuncture from participants with a bracelet labelled with a barcode and who consented to having blood specimens taken. Blood samples (approximately 7mL total) were collected into one trace element free (Royal Blue Top) and one EDTA (Purple Top) vacutainer per participant. See Figure 2.2 below and Appendix A1 for details on specimen volume and laboratory testing. Figure 2.2 Specimen volume and testing Whole blood from the Purple Top vacutainer was used to test for malaria using a rapid diagnostic test and hemoglobin using the HemoCue 301. In PSC, 100µL of whole blood was also transferred onto dried blood spot (DBS) cards, which were dried, stored, and subsequently used to test for inherited blood disorders. In WRA, 100µL of whole blood was mixed with ascorbic acid for laboratory analysis of RBC folate. The remaining blood in the Purple Top was centrifuged, and plasma was aliquoted and stored at CHSU. The serum derived from the Royal Blue Top was used for various micronutrient biochemical analyses as shown in Figure 2.2. In a subset of participants, an additional blood sample (~3 mL) was collected in a third EDTA (Purple Top) Vacutainer for MRDR and retinol laboratory testing using high performance liquid chromatography (HPLC). This assessment required participants to consume a small challenge dose of a retinol analog followed by a fatty snack (granola bar). After 4 to 6 hours, an additional venous blood sample was collected from those participants and centrifuged for plasma, which was aliquoted into two sterile cryovials.
Centrifuged serum and plasma specimens were all labeled, maintained in portable freezers in the field, and transported to the nearest district laboratory for temporary storage (at -20o C). The samples were accompanied by sample tracking forms and thermometers to monitor the temperatures from the field laboratory to the district laboratory and finally to the central laboratory at CHSU, where they were stored at -70o C until shipment for analysis.

11
Urine samples (~10 mL) were collected in sterile collection cups from all eligible participants. The urine samples were tested for the presence of hematuria (as a proxy diagnosis for urinary schistosomiasis) using urine dipsticks in PSC, SAC, and men. WRA were excluded from hematuria testing given potential confounding from menstruation. For both SAC and WRA, an aliquot (2 mL) of urine was transferred into iodine-free storage vials (in duplicate) and sent to CHSU laboratory for testing of urinary iodine. 2.9 DATA MANAGEMENT AND ANALYSIS Data management was conducted jointly by NSO, ICF, and CDC, and Emory University. During the survey, questionnaires were collected, reviewed for completion by the team lead at the end of each day, edited and transported weekly to the NSO where the data were double-entered by NSO staff using CSPro. Discrepancies were reconciled by a data management supervisor, and secondary editing was done if necessary. De-identified and cluster scrambled files were shared with CDC and Emory University for further data cleaning as well as data analysis. The data from the MNS questionnaire were linked at the individual and household level to the MDHS data, and laboratory data received from various laboratories were appended to the existing data file. These data manipulations and any data cleaning of the MNS set were performed in SAS version 9.4 at CDC and Emory University. Frequency tables for the Key Indicators Report were generated in SAS 9.4 using Proc SurveyFreq to account for the complex sampling design. For the purposes of this Key Indicators Report, statistical comparisons were not made. Serum ferritin results were adjusted for CRP and AGP concentrations using the Biomarkers Reflecting Inflammation and Nutritional Determinants of Anemia (BRINDA) internal (country-specific) regression-correction approach (1). Hemoglobin concentrations were adjusted based on altitude of the cluster in all individuals and smoking in WRA. Smoking data was not available for men. Serum zinc concentrations may be affected by physiologic factors, including fasting status, time of blood collection, and inflammation (2). Vitamin A status was assessed using retinol binding protein (RBP) as a surrogate measure for serum retinol (3). Since the molar ratio of RBP and retinol is not always 1:1, a subsample of serum from each target group except men was also analyzed for serum retinol to adjust the RBP cut-points, as was done in the 2009 Malawi national micronutrient survey and as reported in the literature (4, 5). While inflammation is known to affect vitamin A status, there are no global recommendations on how to account for this effect (3); thus for this report, RBP and retinol concentrations were not adjusted for inflammation. Also, zinc concentrations were not adjusted for inflammation, as there are no current recommendations for adjustment. Cutoffs for serum zinc were dependent on the time of day when the specimen was collected and assumed a non-fasting status (2). Standard thresholds for abnormal biomarker concentrations by target group were used and are summarized in Table 2.3. Additional details on biological indicator assessment and cutoffs used to assess status are described in Appendix A1.
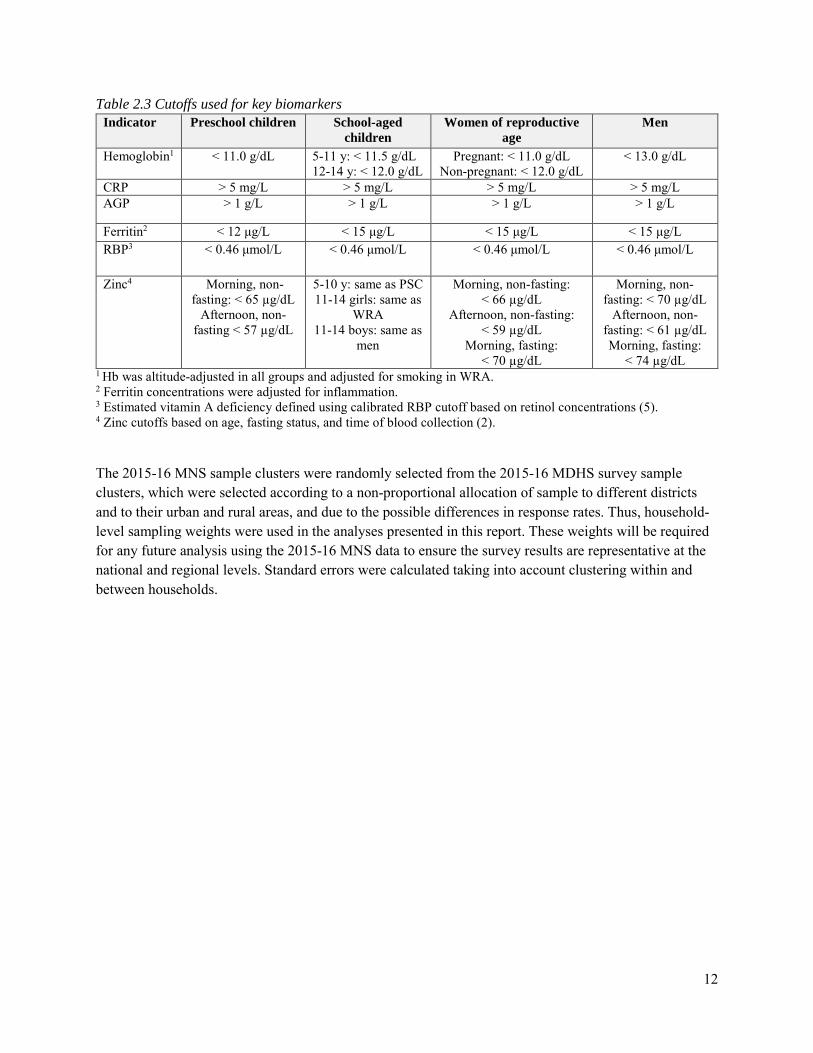
12
Table 2.3 Cutoffs used for key biomarkers Indicator Preschool children School-aged
children Women of reproductive
age Men
Hemoglobin1 < 11.0 g/dL 5-11 y: < 11.5 g/dL 12-14 y: < 12.0 g/dL
Pregnant: < 11.0 g/dL Non-pregnant: < 12.0 g/dL
< 13.0 g/dL
CRP > 5 mg/L > 5 mg/L > 5 mg/L > 5 mg/L AGP > 1 g/L > 1 g/L > 1 g/L > 1 g/L
Ferritin2 < 12 μg/L < 15 μg/L < 15 μg/L < 15 μg/L
RBP3 < 0.46 μmol/L < 0.46 μmol/L < 0.46 μmol/L < 0.46 μmol/L
Zinc4 Morning, non-fasting: < 65 µg/dL
Afternoon, non-fasting < 57 µg/dL
5-10 y: same as PSC 11-14 girls: same as
WRA 11-14 boys: same as
men
Morning, non-fasting: < 66 µg/dL
Afternoon, non-fasting: < 59 µg/dL
Morning, fasting: < 70 µg/dL
Morning, non-fasting: < 70 µg/dL
Afternoon, non-fasting: < 61 µg/dL Morning, fasting:
< 74 µg/dL 1 Hb was altitude-adjusted in all groups and adjusted for smoking in WRA. 2 Ferritin concentrations were adjusted for inflammation. 3 Estimated vitamin A deficiency defined using calibrated RBP cutoff based on retinol concentrations (5). 4 Zinc cutoffs based on age, fasting status, and time of blood collection (2). The 2015-16 MNS sample clusters were randomly selected from the 2015-16 MDHS survey sample clusters, which were selected according to a non-proportional allocation of sample to different districts and to their urban and rural areas, and due to the possible differences in response rates. Thus, household-level sampling weights were used in the analyses presented in this report. These weights will be required for any future analysis using the 2015-16 MNS data to ensure the survey results are representative at the national and regional levels. Standard errors were calculated taking into account clustering within and between households.

13
CHAPTER 3. RESPONSE RATES AND BACKGROUND CHARACTERISTICS Of the 2277 households targeted, 2250 were eligible and 94% agreed to participate (n=2114). Table 3.1 summarizes the target sample size and actual data collected by target group. Individual response rates were > 90% for PSC and SAC, 86% for WRA, and 72% for men. Anthropometry was completed on nearly all individuals, and venous blood was collected on approximately 90% of those who agreed to participate in the survey. Table 3.1 Target sample size and participation by target group, Malawi 2016
Household Preschool
children School-aged
children
Non-pregnant women of
reproductive age2 Men
Target sample size 2277 1500 700 780 200
Number of eligible subjects / households invited 2250 1279 878 900 315
Actual participation 2114 (94%)1
1233 (96%)1
800 (91%)1
778 (86%)1
228 (72%)1
Anthropometry -- 1230 (99.8%)
797 (99.6%)
775 (99.6%)
227 (99.6%)
Venipuncture blood collection -- 1102 (89%)
758 (94%)
752 (90%)
219 (96%)
Modified relative dose response (MRDR) and retinol subsample -- 76 85 96 --
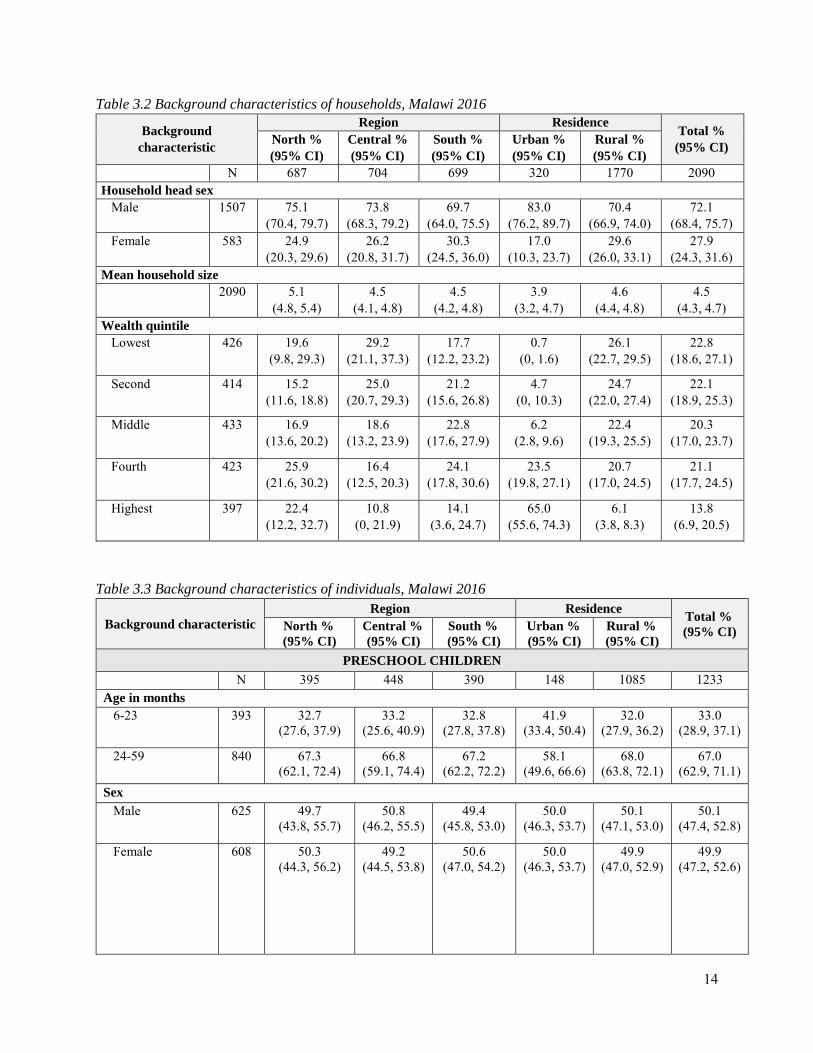
Results reported as n (%) 1 Overall survey response rate 2 Response rate among those who participated includes non-pregnant women of reproductive age. At the time of the survey, 4% of women reported being pregnant and are excluded from this report. Data were collected on the demographic, social, and economic characteristics of participants and their households, since these factors can influence nutritional status and nutrition risk factors. The background characteristics of households stratified by region and residence (urban/rural) are summarized in Table 3.2. Most households had a male head of household, though having a male head of household was more common in urban (83%) versus rural (70%) households. Average household size was 4.5 individuals. The background characteristics of individuals stratified by region and residence are summarized in Table 3.3.
14
Table 3.2 Background characteristics of households, Malawi 2016
Background characteristic
Region Residence Total % (95% CI) North %
(95% CI) Central % (95% CI)
South % (95% CI)
Urban % (95% CI)
Rural % (95% CI)
N 687 704 699 320 1770 2090 Household head sex Male 1507 75.1
(70.4, 79.7) 73.8
(68.3, 79.2) 69.7
(64.0, 75.5) 83.0
(76.2, 89.7) 70.4
(66.9, 74.0) 72.1
(68.4, 75.7) Female 583 24.9
(20.3, 29.6) 26.2
(20.8, 31.7) 30.3
(24.5, 36.0) 17.0
(10.3, 23.7) 29.6
(26.0, 33.1) 27.9
(24.3, 31.6) Mean household size 2090 5.1
(4.8, 5.4) 4.5
(4.1, 4.8) 4.5
(4.2, 4.8) 3.9
(3.2, 4.7) 4.6
(4.4, 4.8) 4.5
(4.3, 4.7) Wealth quintile Lowest 426 19.6
(9.8, 29.3) 29.2
(21.1, 37.3) 17.7
(12.2, 23.2) 0.7
(0, 1.6) 26.1
(22.7, 29.5) 22.8
(18.6, 27.1)
Second 414 15.2 (11.6, 18.8)
25.0 (20.7, 29.3)
21.2 (15.6, 26.8)
4.7 (0, 10.3)
24.7 (22.0, 27.4)
22.1 (18.9, 25.3)
Middle 433 16.9 (13.6, 20.2)
18.6 (13.2, 23.9)
22.8 (17.6, 27.9)
6.2 (2.8, 9.6)
22.4 (19.3, 25.5)
20.3 (17.0, 23.7)
Fourth 423 25.9 (21.6, 30.2)
16.4 (12.5, 20.3)
24.1 (17.8, 30.6)
23.5 (19.8, 27.1)
20.7 (17.0, 24.5)
21.1 (17.7, 24.5)
Highest 397 22.4 (12.2, 32.7)
10.8 (0, 21.9)
14.1 (3.6, 24.7)
65.0 (55.6, 74.3)
6.1 (3.8, 8.3)
13.8 (6.9, 20.5)
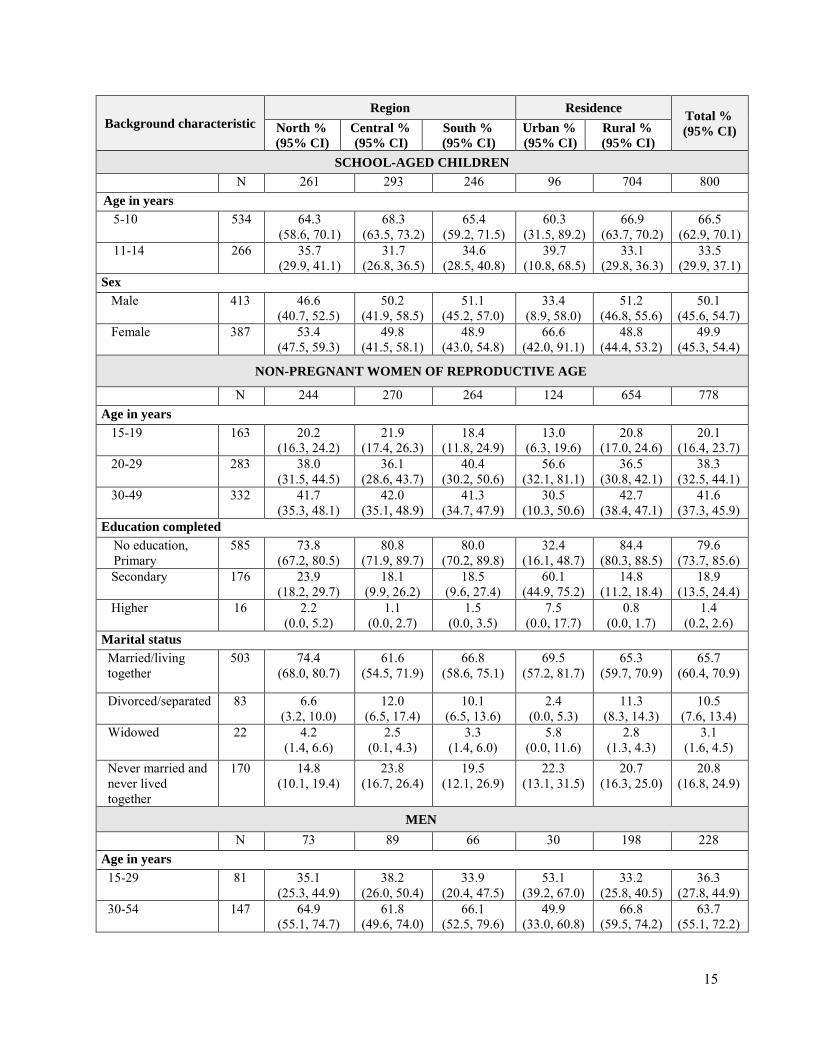
Table 3.3 Background characteristics of individuals, Malawi 2016
Background characteristic Region Residence Total %
(95% CI) North % (95% CI)
Central % (95% CI)
South % (95% CI)
Urban % (95% CI)
Rural % (95% CI)
PRESCHOOL CHILDREN N 395 448 390 148 1085 1233
Age in months 6-23 393 32.7
(27.6, 37.9) 33.2
(25.6, 40.9) 32.8
(27.8, 37.8) 41.9
(33.4, 50.4) 32.0
(27.9, 36.2) 33.0
(28.9, 37.1)
24-59 840 67.3 (62.1, 72.4)
66.8 (59.1, 74.4)
67.2 (62.2, 72.2)
58.1 (49.6, 66.6)
68.0 (63.8, 72.1)
67.0 (62.9, 71.1)
Sex Male 625 49.7
(43.8, 55.7) 50.8
(46.2, 55.5) 49.4
(45.8, 53.0) 50.0
(46.3, 53.7) 50.1
(47.1, 53.0) 50.1
(47.4, 52.8)
Female 608 50.3 (44.3, 56.2)
49.2 (44.5, 53.8)
50.6 (47.0, 54.2)
50.0 (46.3, 53.7)
49.9 (47.0, 52.9)
49.9 (47.2, 52.6)
15
Background characteristic Region Residence Total %
(95% CI) North % (95% CI)
Central % (95% CI)
South % (95% CI)
Urban % (95% CI)
Rural % (95% CI)
SCHOOL-AGED CHILDREN N 261 293 246 96 704 800 Age in years 5-10 534 64.3
(58.6, 70.1) 68.3
(63.5, 73.2) 65.4
(59.2, 71.5) 60.3
(31.5, 89.2) 66.9
(63.7, 70.2) 66.5
(62.9, 70.1) 11-14 266 35.7
(29.9, 41.1) 31.7
(26.8, 36.5) 34.6
(28.5, 40.8) 39.7
(10.8, 68.5) 33.1
(29.8, 36.3) 33.5
(29.9, 37.1) Sex Male 413 46.6
(40.7, 52.5) 50.2
(41.9, 58.5) 51.1
(45.2, 57.0) 33.4
(8.9, 58.0) 51.2
(46.8, 55.6) 50.1
(45.6, 54.7) Female 387 53.4
(47.5, 59.3) 49.8
(41.5, 58.1) 48.9
(43.0, 54.8) 66.6
(42.0, 91.1) 48.8
(44.4, 53.2) 49.9
(45.3, 54.4)
NON-PREGNANT WOMEN OF REPRODUCTIVE AGE
N 244 270 264 124 654 778 Age in years 15-19 163 20.2
(16.3, 24.2) 21.9
(17.4, 26.3) 18.4
(11.8, 24.9) 13.0
(6.3, 19.6) 20.8
(17.0, 24.6) 20.1
(16.4, 23.7) 20-29 283 38.0
(31.5, 44.5) 36.1
(28.6, 43.7) 40.4
(30.2, 50.6) 56.6
(32.1, 81.1) 36.5
(30.8, 42.1) 38.3
(32.5, 44.1) 30-49 332 41.7
(35.3, 48.1) 42.0
(35.1, 48.9) 41.3
(34.7, 47.9) 30.5
(10.3, 50.6) 42.7
(38.4, 47.1) 41.6
(37.3, 45.9) Education completed
No education, Primary
585 73.8 (67.2, 80.5)
80.8 (71.9, 89.7)
80.0 (70.2, 89.8)
32.4 (16.1, 48.7)
84.4 (80.3, 88.5)
79.6 (73.7, 85.6)
Secondary 176 23.9 (18.2, 29.7)
18.1 (9.9, 26.2)
18.5 (9.6, 27.4)
60.1 (44.9, 75.2)
14.8 (11.2, 18.4)
18.9 (13.5, 24.4)
Higher 16 2.2 (0.0, 5.2)
1.1 (0.0, 2.7)
1.5 (0.0, 3.5)
7.5 (0.0, 17.7)
0.8 (0.0, 1.7)
1.4 (0.2, 2.6)
Marital status Married/living together
503 74.4 (68.0, 80.7)
61.6 (54.5, 71.9)
66.8 (58.6, 75.1)
69.5 (57.2, 81.7)
65.3 (59.7, 70.9)
65.7 (60.4, 70.9)
Divorced/separated 83 6.6 (3.2, 10.0)
12.0 (6.5, 17.4)
10.1 (6.5, 13.6)
2.4 (0.0, 5.3)
11.3 (8.3, 14.3)
10.5 (7.6, 13.4)
Widowed 22 4.2 (1.4, 6.6)
2.5 (0.1, 4.3)
3.3 (1.4, 6.0)
5.8 (0.0, 11.6)
2.8 (1.3, 4.3)
3.1 (1.6, 4.5)
Never married and never lived together
170 14.8 (10.1, 19.4)
23.8 (16.7, 26.4)
19.5 (12.1, 26.9)
22.3 (13.1, 31.5)
20.7 (16.3, 25.0)
20.8 (16.8, 24.9)
MEN N 73 89 66 30 198 228 Age in years 15-29 81 35.1
(25.3, 44.9) 38.2
(26.0, 50.4) 33.9
(20.4, 47.5) 53.1
(39.2, 67.0) 33.2
(25.8, 40.5) 36.3
(27.8, 44.9) 30-54 147 64.9
(55.1, 74.7) 61.8
(49.6, 74.0) 66.1
(52.5, 79.6) 49.9
(33.0, 60.8) 66.8
(59.5, 74.2) 63.7
(55.1, 72.2)

16
CHAPTER 4. INFLAMMATION, MALARIA, AND SCHISTOSOMIASIS Inflammation, malaria, and schistosomiasis were assessed to evaluate common causes of infection and subclinical inflammation that may be associated with nutritional status and influence the interpretation of biomarkers. Inflammation is commonly assessed using C-reactive protein (CRP), which measures acute inflammation, and α–1 acid glycoprotein (AGP), which measures chronic inflammation. Plasmodium falciparum is the most common cause of malaria infection in Malawi and contributes the highest rates of morbidity and mortality (6). Urinary schistosomiasis is common in Malawi due to the infestation of water snails, particularly in the southern part of Lake Malawi (7). Among PSC, the prevalence of elevated AGP was 56%, and the prevalence of elevated CRP was 24%. PSC had a 57% prevalence of any inflammation (elevated CRP or AGP), compared to 34% in SAC and 13% in WRA, and 14% in men. Among PSC and SAC, the prevalence of elevated AGP was almost double the prevalence of CRP. Among non-pregnant WRA and men, the prevalence of elevated AGP and CRP was low (<12%). Figure 4.1 presents the prevalence of inflammation in PSC, SAC, non-pregnant WRA, and men as defined by elevated CRP, elevated AGP, or any inflammation by residence. The prevalence of elevated CRP in rural areas was 25% in PSC, 17% in SAC and 11% in men, compared to 13%, 4% and <1% among those same groups in urban areas. Figure 4.1 Prevalence of elevated AGP, elevated CRP, and any inflammation among preschool children, school-aged children, non-pregnant women of reproductive age, and men by residence, Malawi 2016
* Elevated alpha-1-acid glycoprotein (AGP) defined as AGP > 1 g/L; elevated C-reactive protein (CRP) defined as CRP > 5mg/L; any inflammation defined as elevated AGP or CRP. Sample size for preschool children: North (n=383); Central (n=395); South (n=324); Total (n=1102); Sample size for school-aged children: North (n=256); Central (n=279); South (n=223); Total (n=758); Sample size for women: North (n=237); Central (n=256); South (n=248); Total (n=741); Sample size for men: North (n=72); (Central (n=84); South (n=63); Total (n=219)
46.2
12.7
46.5
57.1
25.2
58.3
31.5
3.9
31.6 32.3
16.7
34.4
13.9
8.1
15.711
7.3
13.1
30.8
3.8
11.5 10.515.5
0
10
20
30
40
50
60
70
Elevated AGP(>1 g/L)
Elevated CRP(> 5 mg/L)
Anyinflammation
Elevated AGP(>1 g/L)
Elevated CRP(> 5 mg/L)
Anyinflammation*
Urban Rural
Prev
alen
ce (%
)
Preschool children School-aged children Women Men

17
Figure 4.2 presents the prevalence of malaria in PSC, SAC, non-pregnant WRA, and men. The national prevalence of malaria was 27%, 42%, 16%, and 15% in PSC, SAC, non-pregnant WRA, and men, respectively. In all groups, there was a higher prevalence of malaria in rural areas compared to urban areas. Figure 4.2 Prevalence of malaria1 among preschool children, school-aged children, non-pregnant women of reproductive age, and men by residence, Malawi 2016
1 Measured by rapid malaria test kit Sample size for preschool children: North (n=385); Central (n=437); South (n=362); Total (n=1184) Sample size for school-aged children: North (n=258); Central (n=287); South (n=241); Total (n=786) Sample size for women: North (n=236); Central (n=265); South (n=258); Total (n=759) Sample size for men: North (n=68); Central (n=81); South (n=62); Total (n=211)
0.2
30.227.3
4.2
43.841.7
1.6
17.415.9
0.6
16.514.6
0
5
10
15
20
25
30
35
40
45
50
Urban Rural National
Prev
alen
ce (%
)
Preschool children School-aged children Women Men
18
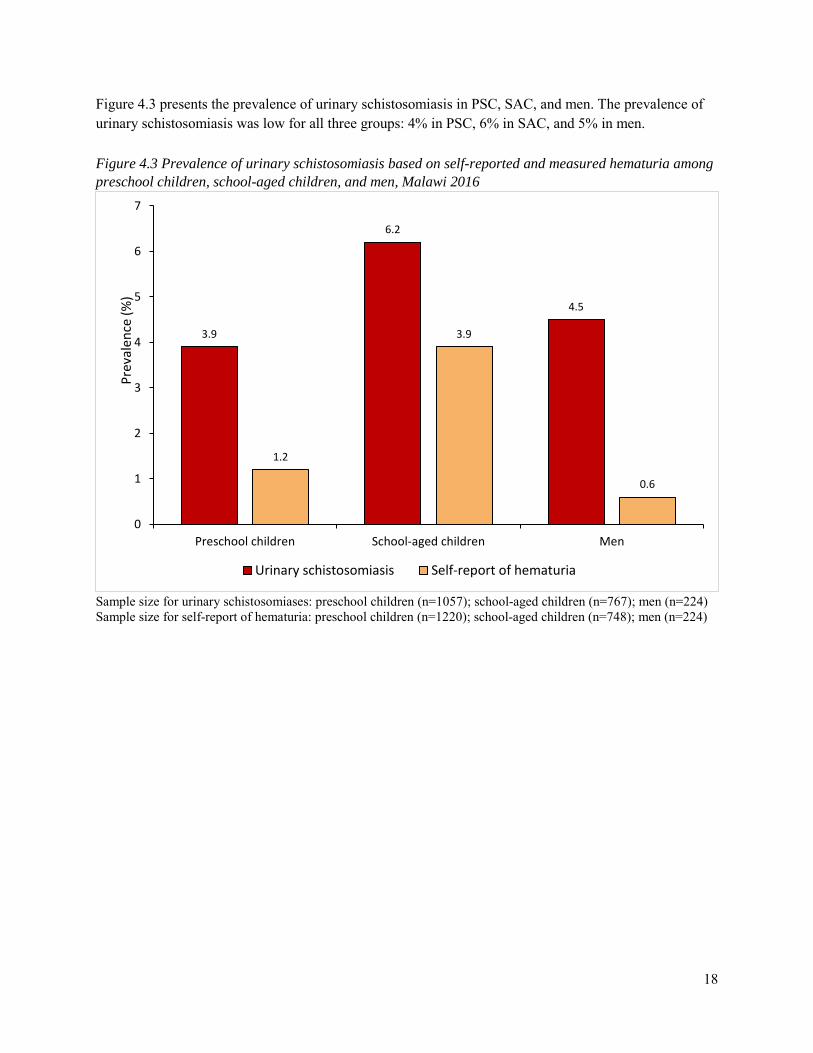
Figure 4.3 presents the prevalence of urinary schistosomiasis in PSC, SAC, and men. The prevalence of urinary schistosomiasis was low for all three groups: 4% in PSC, 6% in SAC, and 5% in men. Figure 4.3 Prevalence of urinary schistosomiasis based on self-reported and measured hematuria among preschool children, school-aged children, and men, Malawi 2016
Sample size for urinary schistosomiases: preschool children (n=1057); school-aged children (n=767); men (n=224) Sample size for self-report of hematuria: preschool children (n=1220); school-aged children (n=748); men (n=224)
3.9
6.2
4.5
1.2
3.9
0.6
0
1
2
3
4
5
6
7
Preschool children School-aged children Men
Prev
alen
ce (%
)
Urinary schistosomiasis Self-report of hematuria

19
CHAPTER 5. IRON DEFICIENCY, ANEMIA, IRON DEFICIENCY ANEMIA, AND BLOOD DISORDERS Globally, iron deficiency is one of the most widespread micronutrient deficiencies (8, 9). Pregnant and postpartum women and young children are particularly vulnerable because of the high iron requirements for growth and pregnancy. Iron status can be assessed by measuring serum ferritin. However, ferritin is an acute phase protein and increases as part of the inflammatory response. Thus, adjusting for inflammation leads to an increase in the estimated prevalence of iron deficiency using ferritin concentrations. Prevalence estimates of inflammation-corrected iron deficiency are thought to be more accurate and are reported here (1). Anemia is characterized by low levels of hemoglobin (the protein in red blood cells responsible for carrying oxygen) in the blood. Iron is an important component of hemoglobin, and iron deficiency is estimated to contribute to approximately one-half of anemia cases worldwide (10). Other micronutrient deficiencies (including vitamin B12, folate, and vitamin A deficiencies) and non-nutritional causes (such as blood disorders, malaria, and hookworm and other helminths) also can cause anemia. Anemia impairs children’s physical and cognitive development, increases susceptibility to infections, and results in fatigue and reduced work capacity among adults. Anemia also increases risk of child and maternal mortality (10). Table 5.1 presents inflammation-corrected iron deficiency, anemia, and iron deficiency anemia for PSC and SAC. The percentage of PSC with iron deficiency was higher in urban areas than rural areas (50% and 19%, respectively) and higher in males than females (26% and 18%, respectively). In SAC, the prevalence of iron deficiency was low (5%). Anemia was found in nearly one in three PSC and one in five SAC. The prevalence of iron deficiency anemia was approximately 9% among PSC and 2% among SAC.

20
Table 5.1 Prevalence of iron deficiency, anemia, and iron deficiency anemia among preschool children and school-aged children, Malawi 2016
Background characteristic Iron deficiency1 Anemia2 Iron deficiency anemia3
N % (95% CI) N % (95% CI) N % (95% CI)
PRESCHOOL CHIDLREN Sex Male 564 25.9
(20.0, 31.9) 624 26.8
(21.3, 32.4) 562 12.1
(9.0, 15.2) Female 540 17.5
(11.4, 23.5) 604 29.7
(25.2, 34.1) 538 6.6
(2.3, 10.9) Residence Urban 129 49.5
(37.5, 61.4) 147 29.5
(18.2, 40.9) 127 23.7
(16.0, 31.5) Rural 977 18.6
(15.1, 22.1) 1081 28.1
(24.1, 32.1) 973 7.7
(5.8, 9.6) Region North 384 22.2
(17.1, 27.2) 391 25.5
(16.5, 34.4) 382 11.1
(7.3, 14.8) Central 397 18.6
(7.3, 29.9) 448 27.6
(21.5, 33.7) 395 8.1
(2.1, 14.1) South 325 24.8
(19.2, 30.5) 389 29.6
(24.2, 35.0) 323 10.0
(7.0, 13.1) Total 1106 21.7
(16.2, 27.2) 1228 28.2
(24.4, 32.0) 1100 9.3
(6.4, 12.3) SCHOOL-AGED CHILDREN
Sex Male 394 4.7
(1.7, 7.7) 419 19.7
(13.8, 25.6) 392 2.7
(0.0, 5.4) Female 378 4.8
(2.1, 7.5) 391 21.9
(16.0, 27.9) 375 0.7
(0.0, 1.5) Residence Urban 93 1.7
(0.0, 4.1) 96 15.8
(0.0, 35.3) 93 0.2
(0.0, 0.6) Rural 680 5.2
(3.0, 7.4) 715 21.1
(16.7, 25.6) 675 1.7
(0.3, 3.2) Region North 265 2.7
(0.5, 4.8) 267 19.7
(10.6, 28.8) 261 0.3
(0.0, 0.7) Central 284 3.8
(1.3, 6.4) 297 18.9
(13.8, 23.9) 283 0.4
(0.0, 1.3) South 224 6.9
(2.7, 11.0) 247 22.9
(15.1, 30.8) 224 3.3
(0.3, 6.4) Total 773 5.0
(2.9, 7.0) 811 20.8
(16.4, 25.2) 768 1.6
(0.3, 3.0) 1 Iron deficiency defined as serum ferritin < 12 μg/L for preschool children and < 15 μg/L for school-aged children corrected for inflammation. 2 Anemia defined as Hb < 11.0 g/dL for preschool children, < 11.5 g/dL for children 5 – 11 years of age, and < 12.0 g/dL for children 12 – 14 years of age. Hemoglobin levels were adjusted for altitude. 3 Iron deficiency anemia defined as those with inflammation-corrected iron deficiency plus anemia.

21
Table 5.2 presents inflammation-corrected iron deficiency, anemia, and iron deficiency anemia for non-pregnant WRA and men. The prevalence of iron deficiency among WRA was 15%, with the highest prevalence in the Northern region (25%). About one in five WRA were anemic, and 6% of WRA had iron deficiency anemia. The prevalence of iron deficiency and anemia among men was low (1% and 6%, respectively). There were no cases of iron deficiency anemia in men. Table 5.2 Prevalence of iron deficiency, anemia, and iron deficiency anemia among non-pregnant women of reproductive age and men, Malawi 2016
Background characteristic Iron deficiency1 Anemia2 Iron deficiency anemia3
N % (95% CI) N % (95% CI) N % (95% CI)
NON-PREGNANT WOMEN OF REPRODUCTIVE AGE
Residence Urban 121 15.8
(6.7, 24.9) 123 20.9
(5.1, 36.7) 119 10.4
(4.2, 16.6)
Rural 631 15.1 (11.5, 18.7)
653 20.9 (17.3, 24.5)
621 5.2 (2.9, 7.5)
Region North 240 25.4
(16.8, 34.4) 243 17.7
(13.2, 22.1) 240 10.5
(4.8, 16.2) Central 261 10.2
(6.7, 13.9) 270 15.5
(10.2, 20.8) 261 3.3
(0.7, 5.8) South 251 17.0
(11.3, 22.6) 263 26.5
(20.7, 32.2) 250 6.7
(3.2, 10.1) Total 752 15.1
(11.8, 18.5) 776 20.9
(17.3, 24.4) 740 5.7
(3.6, 7.9)
MEN Residence
Urban 27 -- 28 -- 27 --
Rural 192 0.6 (0.0, 3.9)
197 6.9 (2.4, 11.4)
192 --
Region
North 72 -- 72 2.7 (0.0, 5.9)
72 --
Central 84 -- 88 8.2 (1.2, 15.1)
84 --
South 63 3.8 (0.0, 9.0)
65 3.6 (0.0, 8.0)
63 --
Total 219 1.4 (0.0, 3.4)
225 5.9 (1.7, 10.1)
219 --
1 Iron deficiency defined inflammation-corrected ferritin < 15 μg/L 2 Anemia defined as Hb < 12.0 g/dL for non-pregnant women and < 13.0 g/dL for men. Hemoglobin levels were adjusted for altitude and smoking in women and for altitude only in men (smoking data not available in men). 3 Iron deficiency anemia defined as those with inflammation-corrected iron deficiency plus anemia. -- Unable to calculate due to small sample size

22
Inherited blood disorders, such as alpha-thalassemia, sickle cell disease, and glucose-6-phosphate dehydrogenase (G6PD) deficiency, are common among children in many parts of Africa (11); however, the prevalence of these disorders and their relationship to anemia have not previously been reported in Malawi. The prevalence of inherited blood disorders among PSC are summarized in Table 5.3. Overall, approximately 9% of PSC were carriers for sickle cell, or had sickle cell trait (HbAS), 11% were affected by G6PD (G6PD deficiency), and 33% were carriers for alpha-thalassemia. The prevalence of G6PD deficiency was higher in males than females. This finding is expected since G6PD is a sex-linked trait carried on the X chromosome. There appeared to be a lower prevalence of sickle cell trait and G6PD deficiency in the Southern region, but a higher prevalence of alpha-thalassemia in this region, compared to the Northern and Central regions. Table 5.3 Prevalence of blood disorders among preschool children, Malawi 2016
Sickle cell disease (HbSS) G6PD deficiency Alpha-thalassemia
Affected1 Unaffected2 Carrier3 Affected1 Unaffected2 Carrier3 Affected1 Unaffected 2 Carrier3
% (95% CI)
% (95% CI)
% (95% CI)
% (95% CI)
% (95% CI)
% (95% CI)
% (95% CI)
% (95% CI)
% (95% CI)
Sex
Male 0.0 90.5
(87.4, 95.6) 9.5
(6.4, 12.6) 19.4
(14.7, 24.2) 79.3
(74.3, 84.3) n/a4 9.7
(6.4, 12.9) 59.1
(53.9, 64.2) 31.3
(26.3, 36.3)
Female 0.1
(0.0, 0.2) 91.3
(87.3, 95.2) 8.7
(4.8, 12.6) 3.0
(1.2, 4.8) 63.5
(58.2, 68.7) 33.5
(28.7, 38.3) 10.2
(6.5, 13.8) 55.1
(47.5, 62.6) 34.7
(28.4, 41.0)
Residence
Urban 0.0 98.1
(95.4, 100.0) 1.9
(0.0,4.7) 13.9
(5.3, 22.5) 66.1
(57.1, 75.2) 20.0
(16.9, 23.0) 13.1
(8.3, 17.9) 53.2
(43.2, 63.1) 33.7
(20.8, 46.7)
Rural 0.04
(0.0, 0.1) 90.1
(0.0, 4.6) 9.9
(6.9, 12.9) 10.7
(7.8, 13.5) 71.8
(67.7, 75.9) 17.5
(14.7, 20.3) 9.6
(7.1, 12.0 57.5
(51.6, 63.4) 33.0
(27.9, 38.0)
Region
North 0.3
(0.0, 0.7) 89.5
(83.3, 95.7) 10.2
(4.4, 16.1) 11.6
(7.1, 16.1) 72.7
(65.7, 79.6) 15.8
(11.0, 20.5) 5.1
(2.5, 7.6) 61.1
(53.8, 68.4) 33.9
(25.9, 41.9)
Central 0.0 87.0
(81.4, 92.6) 13.0
(7.4, 18.6) 15.1
(10.9, 19.2) 68.5
(62.5, 74.5) 16.5
(13.4, 19.5) 8.3
(5.0, 11.6) 59.2
(52.2, 66.2) 32.5
(27.3, 37.8)
South 0.0
96.1
(93.3, 98.8) 3.9
(1.2, 6.7) 6.0
(2.9, 9.1) 74.0
(68.4, 79.5) 20.0
(15.0, 25.0) 13.5
(9.9, 17.1) 53.1
(42.5, 63.7) 33.4
(23.5, 43.3)
Total 0.0
(0.0, 0.1) 90.9
(88.0, 93.8) 9.1
(6.1, 12.0) 11.0
(8.3, 13.8) 71.2
(67.3, 75.1) 17.8
(15.2, 20.3) 9.9
(7.7, 12.1) 57.0
(51.6, 62.5) 33.0
(28.2, 37.8) 1 Affected individuals were defined as sickle cell disease (HbSS), or hemizygous males or homozygous females for the G6PD A- allele, or two (-α/-α) deletions 2 Unaffected individuals had normal phenotype 3 Carriers were defined as sickle cell trait (HbAS), or hemizygous females for the G6PD allele, or as one (-α/αα) deletion. 4 G6PD is a sex-linked trait and thus only females are carriers.

23
CHAPTER 6. VITAMIN A STATUS Vitamin A is essential for the functioning of the immune system and the healthy growth and development of children (12). Vitamin A deficiency is primarily caused by an inadequate dietary intake of vitamin A. For the MNS, the primary indicator used to define vitamin A status was retinol binding protein (RBP). Since the molar ratio of RBP and retinol is not always 1:1, a subsample of serum was also analyzed for serum retinol to adjust the RBP cut-points, as was also done in the 2009 Malawi national micronutrient survey. Based on comparisons among the subsample with serum retinol and RBP measures, vitamin A deficiency was defined as RBP < 0.46 µmol/L. Table 6.1 presents the prevalence of low RBP in PSC, SAC, non-pregnant WRA, and men. Overall, the prevalence of vitamin A deficiency was low in PSC (4%) and less than 1% in SAC, WRA, and men. There were no apparent differences in vitamin A deficiency by background characteristics. Table 6.1 Prevalence of low retinol binding protein among preschool children, school-aged children, non-pregnant women of reproductive age, and men, Malawi 2016
Background characteristic
Vitamin A deficiency1 N %
(95% CI) N %
(95% CI) N %
(95% CI) N %
(95% CI) PRESCHOOL
CHILDREN SCHOOL-AGED
CHILDREN WOMEN MEN
Sex Male 563 4.7
(2.2 ,7.3) 372 0.4
(0.0, 1.0) - - - -
Female 539 2.4 (0.6, 4.1)
386 1.4 (0.0, 2.9)
- - - -
Residence
Urban 128 3.7 (0.0, 10.5)
93 0.6 (0.0, 1.7)
121 0.0 (0.0, 0.0)
27 0.8 (0.0, 2.7)
Rural 974 3.6 (1.6, 5.5)
665 0.1 (0.0, 1.8)
631 0.4 (0.0, 0.8)
192 0.0 (0.0, 0.0
Region North 383 2.3
(0.8, 3.8) 256 0.1
(0.0, 2.7) 240 - 72 0.8
(0.0, 2.6) Central 395 3.0
(1.1 ,4.8) 279 1.8
(0.0, 3.6) 261 0.2
(0.0, 0.7) 84 0.0
(0.0, 0.0) South 324 4.6
(0.8, 8.3) 223 0.0
(0.0, 0.0) 251 0.5
(0.0, 1.3) 63 0.0
(0.0, 0.0) Total 1102 3.6
(1.7, 5.4) 758 0.9
(0.1,1.7) 752 0.3
(0.0, 0.7) 219 0.1
(0.0, 0.3) 1 Vitamin A deficiency defined as retinol binding protein (RBP) < 0.46 μmol/L calibrated to equal retinol < 0.7 μmol/L
24
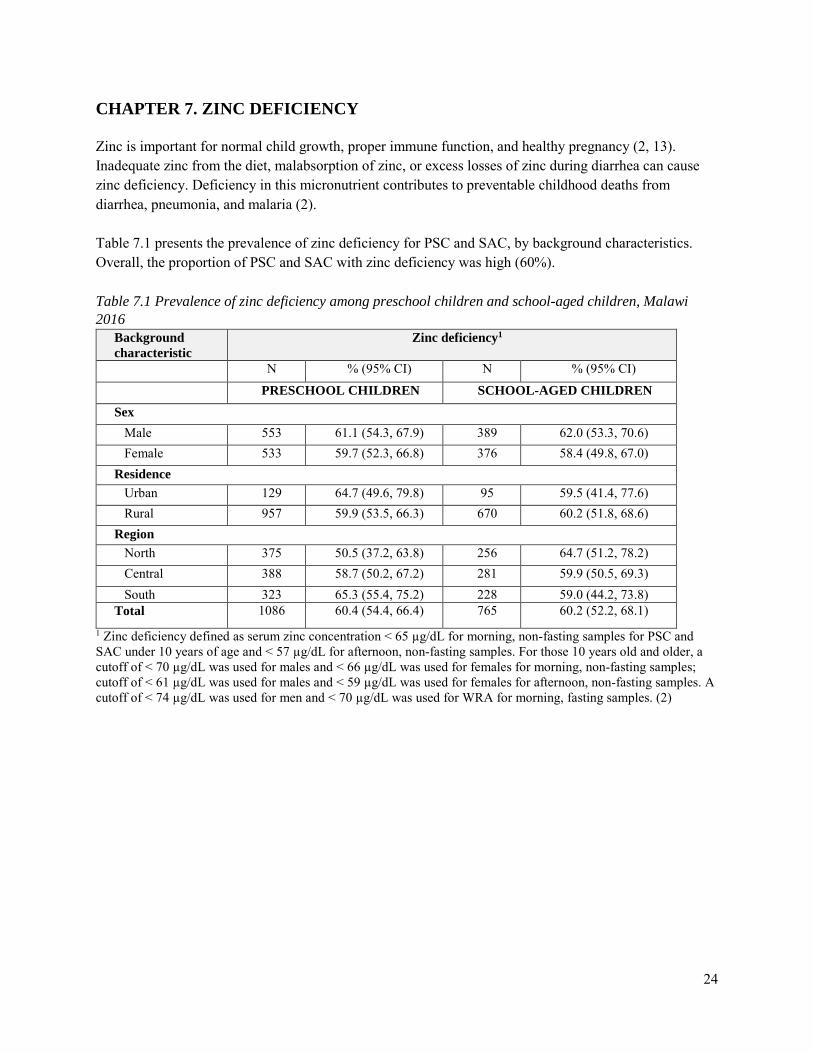
CHAPTER 7. ZINC DEFICIENCY Zinc is important for normal child growth, proper immune function, and healthy pregnancy (2, 13). Inadequate zinc from the diet, malabsorption of zinc, or excess losses of zinc during diarrhea can cause zinc deficiency. Deficiency in this micronutrient contributes to preventable childhood deaths from diarrhea, pneumonia, and malaria (2). Table 7.1 presents the prevalence of zinc deficiency for PSC and SAC, by background characteristics. Overall, the proportion of PSC and SAC with zinc deficiency was high (60%). Table 7.1 Prevalence of zinc deficiency among preschool children and school-aged children, Malawi 2016
Background characteristic
Zinc deficiency1
N % (95% CI) N % (95% CI) PRESCHOOL CHILDREN SCHOOL-AGED CHILDREN Sex Male 553 61.1 (54.3, 67.9) 389 62.0 (53.3, 70.6) Female 533 59.7 (52.3, 66.8) 376 58.4 (49.8, 67.0) Residence Urban 129 64.7 (49.6, 79.8) 95 59.5 (41.4, 77.6) Rural 957 59.9 (53.5, 66.3) 670 60.2 (51.8, 68.6) Region North 375 50.5 (37.2, 63.8) 256 64.7 (51.2, 78.2) Central 388 58.7 (50.2, 67.2) 281 59.9 (50.5, 69.3) South 323 65.3 (55.4, 75.2) 228 59.0 (44.2, 73.8) Total 1086 60.4 (54.4, 66.4) 765 60.2 (52.2, 68.1)
1 Zinc deficiency defined as serum zinc concentration < 65 µg/dL for morning, non-fasting samples for PSC and SAC under 10 years of age and < 57 µg/dL for afternoon, non-fasting samples. For those 10 years old and older, a cutoff of < 70 µg/dL was used for males and < 66 µg/dL was used for females for morning, non-fasting samples; cutoff of < 61 µg/dL was used for males and < 59 µg/dL was used for females for afternoon, non-fasting samples. A cutoff of < 74 µg/dL was used for men and < 70 µg/dL was used for WRA for morning, fasting samples. (2)

25
Table 7.2 presents the prevalence of zinc deficiency for non-pregnant WRA and men, by background characteristics. Among both WRA and men, the prevalence of zinc deficiency was high (63% and 66%, respectively). Table 7.2 Prevalence of zinc deficiency among non-pregnant women of reproductive age and men, Malawi 2016
Background characteristic
Zinc deficiency1
N % (95% CI) N % (95% CI)
NON-PREGNANT WOMEN OF REPRODUCTIVE AGE
MEN
Residence Urban 122 84.7 (69.9, 99.0) 28 56.1 (42.2, 70.0) Rural 635 60.2 (53.6, 66.9) 190 67.3 (56.6, 78.0) Region
North 239 58.1 (41.7, 74.5) 70 57.5 (36.4, 78.5) Central 262 58.7 (49.3 68.2) 85 61.9 (47.8, 76.0) South 256 67.0 (56.1, 78.0) 63 73.8 (57.6, 89.9) Total 757 62.5 (55.8, 69.3) 218 65.7 (55.8, 75.6)
1 Zinc deficiency is defined as serum zinc concentration < 70 for males and < 66 for females for morning, non-fasting samples; cutoff of < 61 was used for males and < 59 was used for females for afternoon, non-fasting samples.(2)

26
CHAPTER 8. COVERAGE OF NUTRITION INTERVENTIONS
Nutrition-specific interventions, such as vitamin A and iron supplementation and delivery of therapeutic foods, are essential for addressing undernutrition among children (14). Another intervention to improve child nutritional status is deworming treatment. Helminths (commonly referred to as worms) can cause diarrhea, poor absorption of nutrients, and appetite loss, and, in turn, heighten vulnerability to micronutrient deficiencies. Household food security – the ability of the household to secure adequate food for meeting the dietary needs of all household members – is an important determinant of nutrition (15). Malawi has implemented social protection programs to support household food security, including a social cash transfer program, food or cash support during droughts and floods, and coupons from the Farm Input Subsidy Program. Figure 8.1 presents the percentages of PSC who took an iron-containing supplement, used therapeutic foods, received a vitamin A capsule in the past 6 months, and received deworming treatment in the past 6 months. Overall, the use of iron-containing supplements (3%) and therapeutic foods (1%) was low. The prevalence of PSC receiving a vitamin A capsule in the previous 6 months was 67% nationally. Vitamin A is generally provided through biannual campaigns, and the most recent campaign before the survey was in June 2015. Vitamin A and deworming treatment are typically provided together in a campaign setting, but deworming is not always part of the package. The percentage of children 12 – 59 months who received deworming treatment in the previous 6 months was 19% overall. Figure 8.1 Prevalence of micronutrient supplementation use and other nutrition-related interventions among preschool children by region, Malawi 2016
* Iron supplements include iron tablets, syrups, or multiple micronutrient powders ** Only children 12-59 months were eligible to receive deworming treatment, total N=1098 Sample size: North (n=389); Central (n=447); South (n=384); Total (n=1220)
7.5
69.6
12.1
3.1 1.4
69.0
9.9
1.0 0.8
64.0
26.7
2.7 1.0
66.8
18.7
0
10
20
30
40
50
60
70
80
Took iron supplementsin past month*
Received anytherapeutic foods in
past month
Received a vitamin Acapsule in past 6
months
Received dewormingtreatment in past 6
months**
Prev
alen
ce (%
)
North Central South Total

27
Figure 8.2 presents the percentages of SAC who used therapeutic foods, received a vitamin A capsule the in the past month and or received deworming treatment in the past 6 months. Nationally, 5% of SAC received therapeutic foods, 2% received a vitamin A capsule in the past month, and 6% received deworming treatment in the past 6 months. There was little variation across background characteristics. Figure 8.2 Prevalence of micronutrient supplementation use and other nutrition-related interventions among school-aged children by region, Malawi 20161
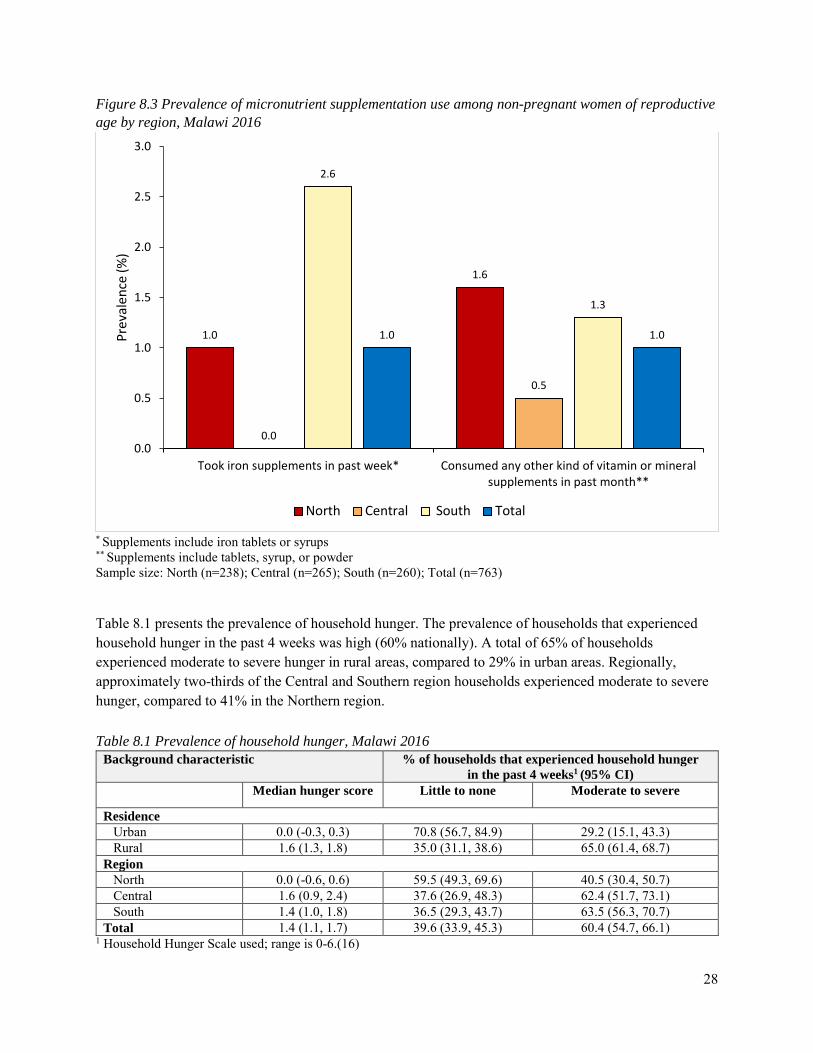
1 Data on iron supplements (including iron tablets or syrups) and vitamin A capsule in the past 6 months were not available in the MNS dataset for SAC. Sample size: North (n=243); Central (n=278); South (n=231); Total (n=752) Figure 8.3 presents the percentage of WRA who took iron containing supplements in the past week and those that consumed any kind of vitamin or mineral supplement in the past month. Very few women took either iron containing supplements in the last week or vitamin or mineral supplements in the past month (1% nationally).
3.8
2.6
7.57.0
3.3
4.14.0
0.6
7.5
5.3
2.1
6.0
0
1
2
3
4
5
6
7
8
Received any therapeutic foodsin past month
Received a vitamin A capsulein past month
Received deworming treatmentin past six months
Prea
vlen
ce (%
)
North Central South Total
28
Figure 8.3 Prevalence of micronutrient supplementation use among non-pregnant women of reproductive age by region, Malawi 2016
* Supplements include iron tablets or syrups ** Supplements include tablets, syrup, or powder Sample size: North (n=238); Central (n=265); South (n=260); Total (n=763) Table 8.1 presents the prevalence of household hunger. The prevalence of households that experienced household hunger in the past 4 weeks was high (60% nationally). A total of 65% of households experienced moderate to severe hunger in rural areas, compared to 29% in urban areas. Regionally, approximately two-thirds of the Central and Southern region households experienced moderate to severe hunger, compared to 41% in the Northern region. Table 8.1 Prevalence of household hunger, Malawi 2016
Background characteristic % of households that experienced household hunger in the past 4 weeks1 (95% CI)
Median hunger score Little to none Moderate to severe
Residence Urban 0.0 (-0.3, 0.3) 70.8 (56.7, 84.9) 29.2 (15.1, 43.3) Rural 1.6 (1.3, 1.8) 35.0 (31.1, 38.6) 65.0 (61.4, 68.7) Region North 0.0 (-0.6, 0.6) 59.5 (49.3, 69.6) 40.5 (30.4, 50.7) Central 1.6 (0.9, 2.4) 37.6 (26.9, 48.3) 62.4 (51.7, 73.1) South 1.4 (1.0, 1.8) 36.5 (29.3, 43.7) 63.5 (56.3, 70.7) Total 1.4 (1.1, 1.7) 39.6 (33.9, 45.3) 60.4 (54.7, 66.1)
1 Household Hunger Scale used; range is 0-6.(16)
1.0
1.6
0.0
0.5
2.6
1.3
1.0 1.0
0.0
0.5
1.0
1.5
2.0
2.5
3.0
Took iron supplements in past week* Consumed any other kind of vitamin or mineralsupplements in past month**
Prev
alen
ce (%
)
North Central South Total

29
Figure 8.4 presents the coverage of social protection programs in Malawi. Just over a third of households in Malawi received coupons for the Farm Input Subsidy program (36%). As suspected, the prevalence was 5% in urban areas, compared to 41% in rural areas. Approximately 8% of households participated in the social cash transfer program, and there was little variation by region. Nationally, 6% of household reported being on the Malawian Vulnerability Assessment Committee list for 2015-2016, and 3% of households reported receiving food or cash support during last year’s drought and flood response from the Malawian Vulnerability Assessment Committee for 2014-2015. Figure 8.4 Coverage of social protection programs by region, Malawi 2016
* This season refers to the 2015-2016 season. ** Last year refers to 2014-2015. Sample size: North (n=740); Central (n=759); South (n=751); Total (n=2250)
32.2
6.9 7.1
2.8
33.9
7.14.6
1.8
39.2
9.77.3
3.8
36.2
8.36.1
2.8
0
5
10
15
20
25
30
35
40
45
Households receivingcoupons for the Farm Input
Subsidy Program for thisseason*
Households participating inthe social cash transfer
program
Household on theMalawian Vulnerability
Assessment Committee listthis season*
Households receiving foodor cash support during lastyear's drought and flood
response from theMalawian Vulnerability
Assessment Committee**
Prev
alen
ce (%
)
North Central South Total
30
APPENDICES
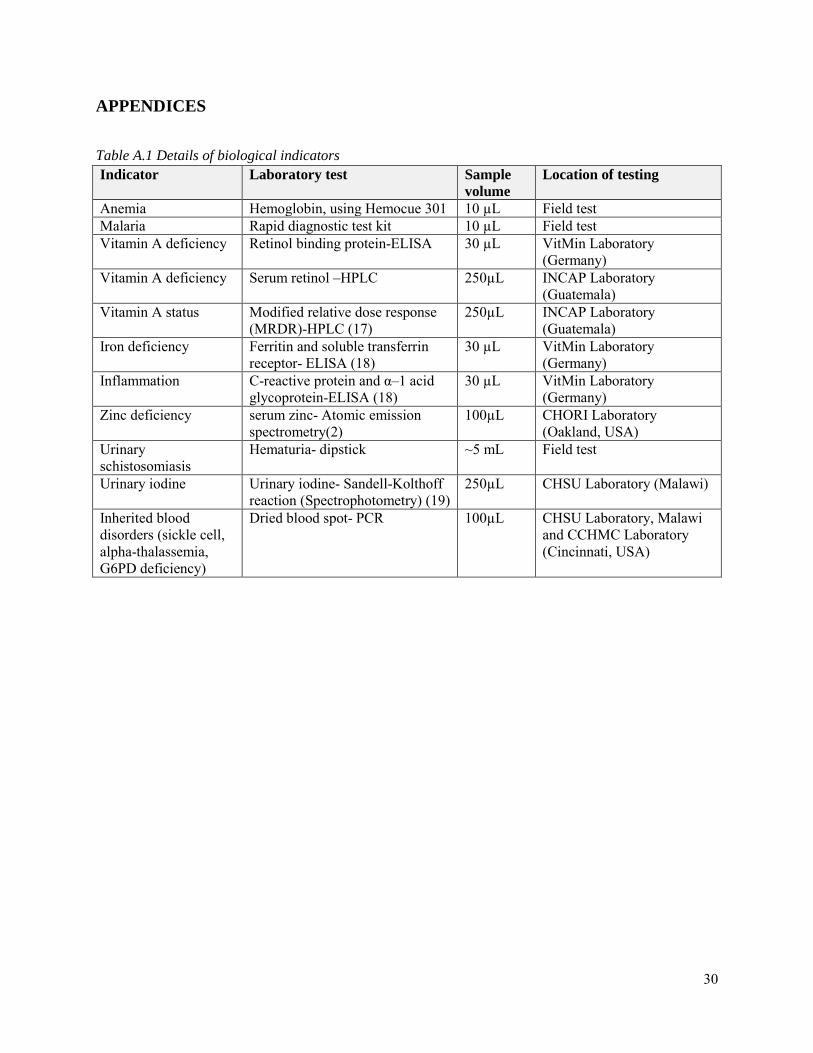
Table A.1 Details of biological indicators Indicator Laboratory test Sample
volume Location of testing
Anemia Hemoglobin, using Hemocue 301 10 µL Field test Malaria Rapid diagnostic test kit 10 µL Field test Vitamin A deficiency Retinol binding protein-ELISA 30 µL VitMin Laboratory
(Germany) Vitamin A deficiency Serum retinol –HPLC 250µL INCAP Laboratory
(Guatemala) Vitamin A status Modified relative dose response
(MRDR)-HPLC (17) 250µL INCAP Laboratory
(Guatemala) Iron deficiency Ferritin and soluble transferrin
receptor- ELISA (18) 30 µL VitMin Laboratory
(Germany) Inflammation C-reactive protein and α–1 acid
glycoprotein-ELISA (18) 30 µL VitMin Laboratory
(Germany) Zinc deficiency serum zinc- Atomic emission
spectrometry(2) 100µL CHORI Laboratory
(Oakland, USA) Urinary schistosomiasis
Hematuria- dipstick ~5 mL Field test
Urinary iodine Urinary iodine- Sandell-Kolthoff reaction (Spectrophotometry) (19)
250µL CHSU Laboratory (Malawi)
Inherited blood disorders (sickle cell, alpha-thalassemia, G6PD deficiency)
Dried blood spot- PCR 100µL CHSU Laboratory, Malawi and CCHMC Laboratory (Cincinnati, USA)

31
Table A.2 Design effects for main micronutrient outcomes Outcome Design Effect
Anemia Preschool children 2.2 School-aged children 2.4 Women of reproductive age 1.8 Men 1.8
Iron Deficiency Preschool children 3.3 School-aged children 2.1 Women of reproductive age 2.1 Men 1.5
Iron Deficiency Anemia Preschool children 5.0 School-aged children 2.2 Women of reproductive age 2.0 Men1 --
Inherited Blood Disorders Preschool children – alpha thalassemia 3.3 Preschool children – Sickle cell 0.4 Preschool children – G6PD 2.1
Low retinol binding protein Preschool children 2.7 School-aged children 2.9 Women of reproductive age 2.5 Men 0.5
Zinc Deficiency Preschool children 4.1 School-aged children 5.2 Women of reproductive age 3.3 Men 2.5
1 The prevalence of IDA in men is 0, and therefore a design effect cannot be calculated.

32
REFERENCES
1. Suchdev PS, Namaste SM, Aaron GJ, Raiten DJ, Brown KH, Flores-Ayala R, et al. Overview of the Biomarkers Reflecting Inflammation and Nutritional Determinants of Anemia (BRINDA) Project. Adv Nutr. 2016;7(2):349-56. 2. King JC, Brown KH, Gibson RS, Krebs NF, Lowe NM, Siekmann JH, et al. Biomarkers of Nutrition for Development (BOND)-Zinc Review. J Nutr. 2016. 3. WHO. Serum retinol concentrations for determining the prevalence of vitamin A deficiency in populations.: World Health Organization; 2011. 4. Gorstein JL, Dary O, Pongtorn, Shell-Duncan B, Quick T, Wasanwisut E. Feasibility of using retinol-binding protein from capillary blood specimens to estimate serum retinol concentrations and the prevalence of vitamin A deficiency in low-resource settings. Public Health Nutr. 2008;11(5):513-20. 5. Engle-Stone R, Haskell MJ, Ndjebayi AO, Nankap M, Erhardt JG, Gimou MM, et al. Plasma retinol-binding protein predicts plasma retinol concentration in both infected and uninfected Cameroonian women and children. J Nutr. 2011;141(12):2233-41. 6. WHO. World Malaria Report 2015. Geneva: World Health Organization: 2015. 7. Makaula P, Sadalaki JR, Muula AS, Kayuni S, Jemu S, Bloch P. Schistosomiasis in Malawi: a systematic review. Parasit Vectors. 2014;7:570. 8. Kassebaum NJ, Jasrasaria R, Naghavi M, Wulf SK, Johns N, Lozano R, et al. A systematic analysis of global anemia burden from 1990 to 2010. Blood. 2014;123(5):615-24. 9. Bailey RL, West KP, Black RE. The epidemiology of global micronutrient deficiencies. Ann Nutr Metab. 2015;66 Suppl 2:22-33. 10. Kassebaum NJ, Collaborators GA. The Global Burden of Anemia. Hematol Oncol Clin North Am. 2016;30(2):247-308. 11. Suchdev PS, Ruth LJ, Earley M, Macharia A, Williams TN. The burden and consequences of inherited blood disorders among young children in western Kenya. Maternal & child nutrition. 2014;10(1):135-44. 12. Sommer A, Davidson FR, Accords A. Assessment and control of vitamin A deficiency: the Annecy Accords. J Nutr. 2002;132(9 Suppl):2845S-50S. 13. Lamberti LM, Fischer Walker CL, Black RE. Zinc Deficiency in Childhood and Pregnancy: Evidence for Intervention Effects and Program Responses. World Rev Nutr Diet. 2016;115:125-33. 14. Bhutta ZA, Das JK, Rizvi A, Gaffey MF, Walker N, Horton S, et al. Evidence-based interventions for improvement of maternal and child nutrition: what can be done and at what cost? Lancet. 2013;382(9890):452-77. 15. Black RE, Victora CG, Walker SP, Bhutta ZA, Christian P, de Onis M, et al. Maternal and child undernutrition and overweight in low-income and middle-income countries. Lancet. 2013;382(9890):427-51. 16. Deitchler MB, T. Swindale, A. Coates, J. Introducing a Simple Measure of Household Hunger for Cross-Cultural Use. In: Food and Nutrition Technical Assistance II Project A, editor. Washington, D.C.2011. 17. Tanumihardjo SA, Russell RM, Stephensen CB, Gannon BM, Craft NE, Haskell MJ, et al. Biomarkers of Nutrition for Development (BOND)-Vitamin A Review. J Nutr. 2016;146(9):1816S-48S. 18. Erhardt JG, Estes JE, Pfeiffer CM, Biesalski HK, Craft NE. Combined measurement of ferritin, soluble transferrin receptor, retinol binding protein, and C-reactive protein by an inexpensive, sensitive, and simple sandwich enzyme-linked immunosorbent assay technique. J Nutr. 2004;134(11):3127-32. 19. Rohner F, Zimmermann M, Jooste P, Pandav C, Caldwell K, Raghavan R, et al. Biomarkers of nutrition for development--iodine review. The Journal of nutrition. 2014;144(8):1322s-42s.