Embed Size (px)
Citation preview
MALARIA SEVERITY CLASSIFICATIONTHROUGH JORDAN-ELMAN NEURAL
NETWORK BASED ON FEATURESEXTRACTED FROM THICK BLOOD SMEAR
H. Chiroma∗†, S. Abdul-kareem∗, U. Ibrahim†, I. Gadam Ahmad‡, A. Garba‡,A. Abubakar§, M. Fatihu Hamza¶, T. Herawan∗
Abstract: This article presents an alternative approach useful for medical prac-titioners who wish to detect malaria and accurately identify the level of severity.Malaria classifiers are usually based on feed forward neural networks. In this study,the proposed classifier is developed based on the Jordan-Elman neural networks. Itsperformance is evaluated using a receiver-operating characteristic curve, sensitiv-ity, specificity, positive predictive value, negative predictive value, confusion matrix,mean square error, determinant coefficient, and reliability. The effectiveness of theclassifier is compared to a support vector machine and multiple regression models.The results of the comparative analysis demonstrate a superior performance levelof the Jordan-Elman neural network model. Further comparison of the classierwith previous literature indicates performance improvement over existing results.The Jordan-Elman neural networks classifier can assist medical practitioners inthe fast detection of malaria and determining its severity, especially in tropical andsubtropical regions where cases of malaria are prevalent.
Key words: learning algorithms, Jordan-Elman neural network, malaria, modelperformance, evaluation
Received: June 25, 2013 DOI: 10.14311/NNW.2015.25.028Revised and accepted: November 26, 2014
1. Introduction
The tropical disease of malaria causes between one to three million deaths annu-ally [17]. It is caused by a parasite (plasmodium) transmitted by female Anopheles
∗Haruna Chiroma – Corresponding author, Tutut Herawan, Sameem Abdul-kareem, De-partment of Artificial Intelligence, Faculty of Computer Science and Information Technology,Department of Biological Sciences, University of Malaya, Kuala Lumpur, Malaysia, E-mail:[email protected], [email protected]
†Haruna Chiroma, Umar Ibrahim, Federal College of Education (Technical), Gombe, Nigeria‡Ibrahim Gadam Ahmad, Abdulmumini Garba, College of Medical Sciences, University of
Maiduguri Teaching Hospital, Department of Computer Science, Maiduguri, Nigeria§Adamu Abubakar, Kulliyyah of Information and Communication Technology, International
Islamic University Malaysia, Kuala Lumpur, Malaysia¶Mukhtar Fatihu Hamza, Bayero University, Department of Mechatronics Engineering, 3011,
Kano, Nigeria
c⃝CTU FTS 2015 565
Neural Network World 5/15, 565–584
mosquitoes. Malaria is prevalent in tropical Africa and ranked among the diseaseswith the highest mortality rates and a discernible economic and social impact [42].The most severe and complicated effects of the disease are commonly found amonginfants (0–5 years) and pregnant women [41]. Malaria infection during pregnancyconstitutes a major public health problem in the tropical and subtropical regionsof the world [27]. The 90% of the global malaria cases occur in Sub-SaharanAfrica [2]. Studies have shown that pregnancy exacerbates malaria through a non-specific hormone-dependent depression of the immune system. The protective anti-plasmodia activity is suppressed at pregnancy which has clinical consequences withimportant public health implications on pregnant women [28]. Malaria infectionalso causes premature deliveries of infants with low birth weight due to intrauter-ine growth retardation attributed to placental parasitisation [37]. Environmentalchanges such as global warming, civil disturbances, increased global mobility andincreased drug resistance are also considered among the causes of the rising numberof malaria cases worldwide [14]. In endemic areas, children under the age of fiveyears bear the brunt of the burden because their immunity levels are considerablylower than those of the other members of their community [32]. Species of the plas-modium parasite that causes malaria in humans are: plasmodium (P) falciparum,P. Vivax, P. Ovale, and P. Malariae. While P. Vivax and P. Ovale cause the mildestform of malaria, P. Falciparum causes the severest. In Africa, the most dominantparasite is the virulent plasmodium falciparum [26, 28]. Thus, the present situationcalls for an accurate diagnostic tool that detects the disease and instantly identifiesthe level of severity so that adequate treatment can be provided as fast as possible.
An important aspect of a diagnostic tool is machine learning. Major compo-nents of machine learning are learning domain, training set, learning system, andtesting. Machine learning constitutes the process of identifying a learning domain,evaluating the learning system through testing, and generating results to be used[4]. The machine learning method that can be used in predicting the class of dif-ferent categories of unknown item to a specific class label based on a training setis called classification [11].
Artificial Neural Networks (ANN) offer an alternative approach to solve prob-lems in classification, pattern recognition, and assessment through non-linear map-ping, classification learning, and real-time optimization [23, 31]. Prediction modelsare built with ANN because of their ability to learn from experience without priorinformation [15]. ANN possess the ability to create a model with continuous out-put [3] and have been proven to serve as an adequate tool for solving functionapproximation problems [20].
The classification of malaria parasites using feed-forward neural networks hasbeen the object of a number of existing studies but applying a recurrent neuralnetwork in this domain is an alternative which deserves consideration and furtherexamination. Gao et al. [12] applied a multi–layer perceptron to forecast malariaand their model achieved 84.85% forecast accuracy. Ross et al. [33] applied back-propagation neural networks to classify different malaria species isolated in infectedred blood cells through thin blood smears. They achieved a positive predictionvalue of 81% with a sensitivity of 85%. More recently, Abu et al. [1] classifiedP. falciparum, P. viva and P. malariae parasites using multi-layer feed-forwardneural networks, and their experimental results obtained a classification accuracy
566
Chiroma H. et al.: Malaria severity classification through . . .
of 89.80%. In another study, an asymptomatic malaria diagnosis tool with a multi–layer perceptron could diagnose with an accuracy of 80.0% [25]. Subsequently,Yunda et al. [44] used a multi–layer perceptron to classify malaria parasites inthick film blood images. Their experimental results translated into an accuracy of77.19%. Most recently, the model created by Imroze et al. [19] based on multi-layerperceptron, achieved 81% correctness.
Recurrent neural networks are more appropriate for pattern detection and pos-sess the ability to characterize the related computational structure in a more par-simonious way than the feed forward neural network. Various categories of RNNexist in literature but the most outstanding is the Jordan-Elman neural network[14]. Experimental evidence established in [13] pointed out that an RNN oper-ates decidedly better than a feed-forward neural network in terms of predictionaccuracy.
Studies on the classification of the severity level of malaria using recurrent neuralnetwork based on the size of the infected RBC (SRBCI), the shape of parasite(SP), the number of chromatin dots (NCD), the number of parasites per RBC(NPRBC), the texture of RBC (TRBC), and the location of chromatin (LC) arestill scarce in the literature to the best of our knowledge because existing studieshave concentrated on the application of the feed-forward neural network.
This study proposes an alternative type of malaria classification based on theJordan-Elman neural network to improve classification accuracy. The proposedclassifier has been evaluated using several performance metrics.
Section 2 of the paper presents the methodology which discusses the Jordan-Elman neural network, learning algorithms, data collection location and proce-dure, and description of the performance metrics used in evaluating our proposal.Section 3 presents the results and discussion followed by concluding remarks inSection 4.
2. Methodology
2.1 Jordan-Elman neural network
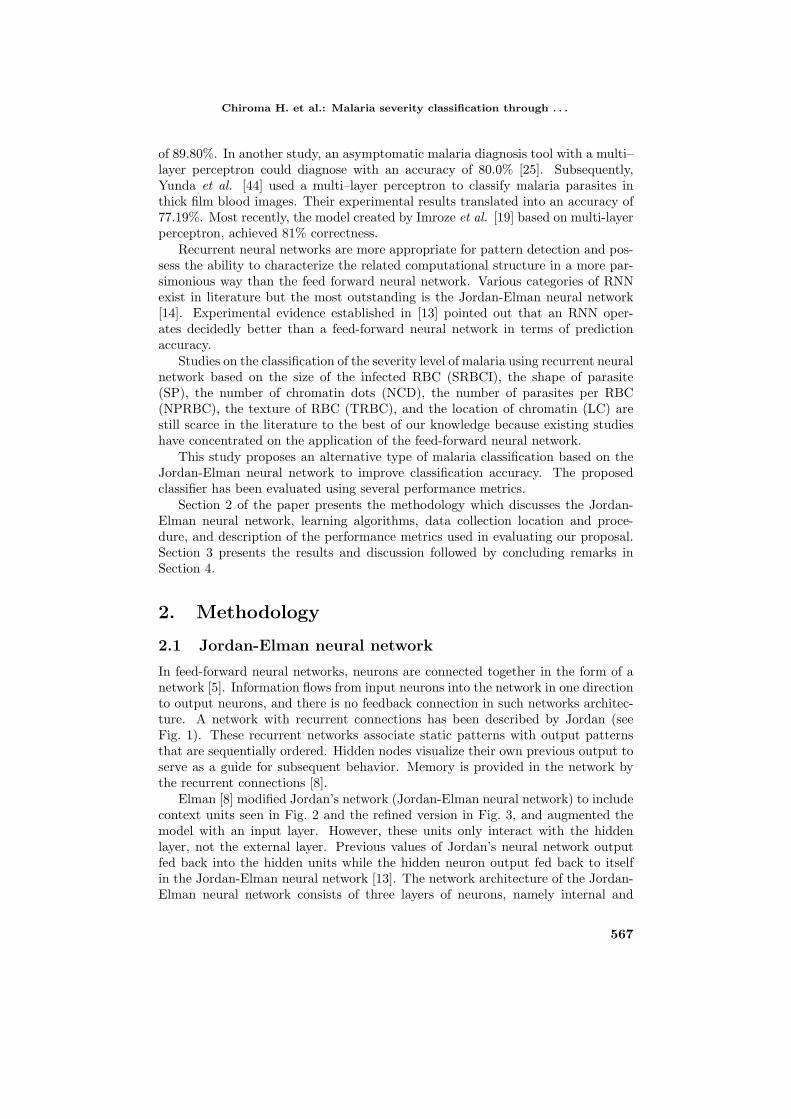
In feed-forward neural networks, neurons are connected together in the form of anetwork [5]. Information flows from input neurons into the network in one directionto output neurons, and there is no feedback connection in such networks architec-ture. A network with recurrent connections has been described by Jordan (seeFig. 1). These recurrent networks associate static patterns with output patternsthat are sequentially ordered. Hidden nodes visualize their own previous output toserve as a guide for subsequent behavior. Memory is provided in the network bythe recurrent connections [8].
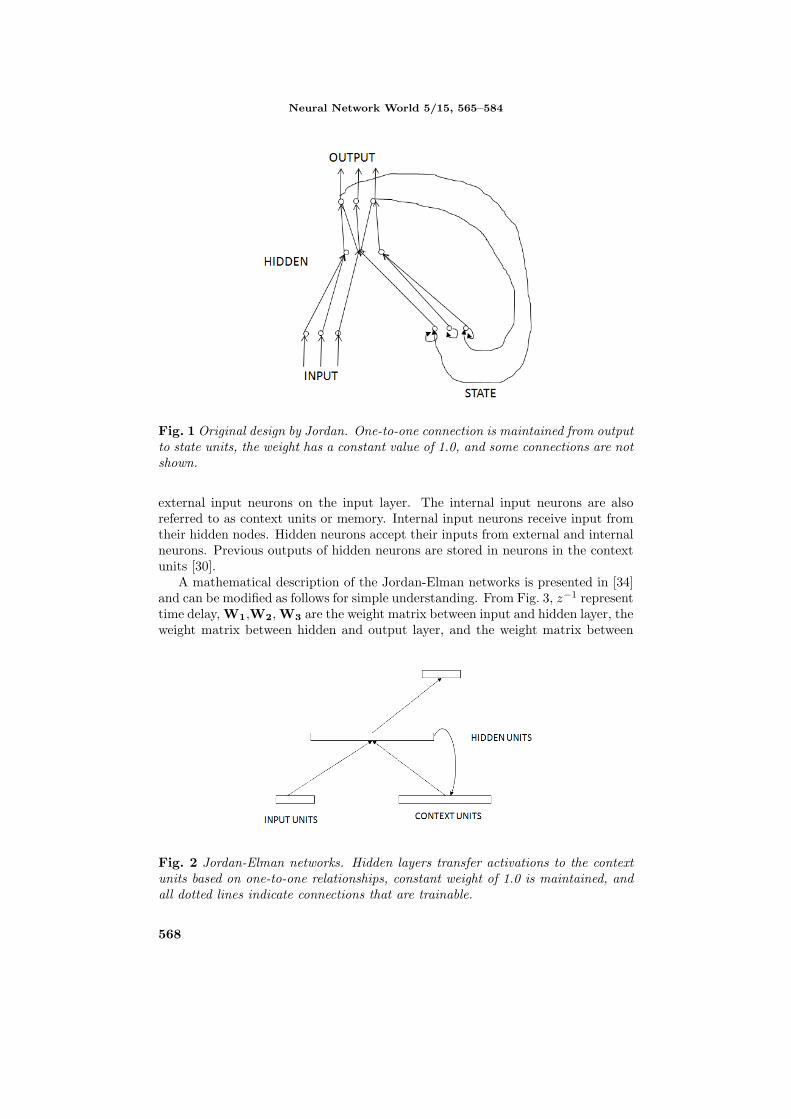
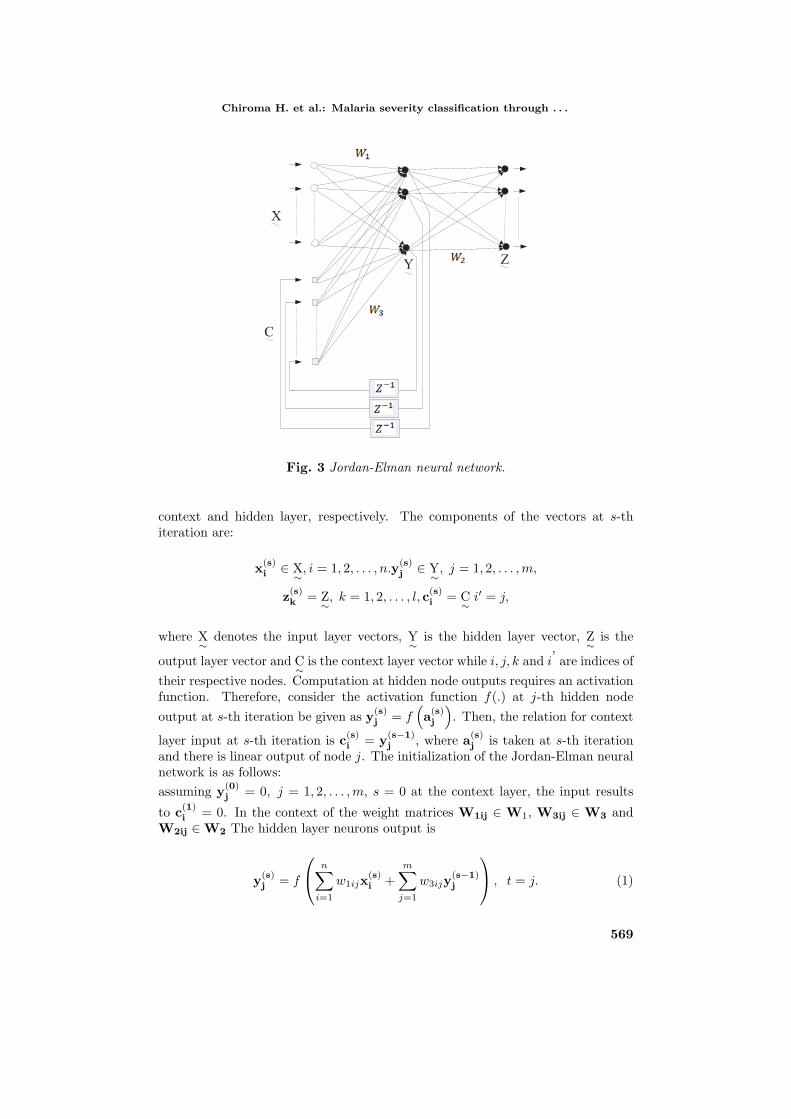
Elman [8] modified Jordan’s network (Jordan-Elman neural network) to includecontext units seen in Fig. 2 and the refined version in Fig. 3, and augmented themodel with an input layer. However, these units only interact with the hiddenlayer, not the external layer. Previous values of Jordan’s neural network outputfed back into the hidden units while the hidden neuron output fed back to itselfin the Jordan-Elman neural network [13]. The network architecture of the Jordan-Elman neural network consists of three layers of neurons, namely internal and
567
Neural Network World 5/15, 565–584
Fig. 1Original design by Jordan. One-to-one connection is maintained from outputto state units, the weight has a constant value of 1.0, and some connections are notshown.
external input neurons on the input layer. The internal input neurons are alsoreferred to as context units or memory. Internal input neurons receive input fromtheir hidden nodes. Hidden neurons accept their inputs from external and internalneurons. Previous outputs of hidden neurons are stored in neurons in the contextunits [30].
A mathematical description of the Jordan-Elman networks is presented in [34]and can be modified as follows for simple understanding. From Fig. 3, z−1 representtime delay, W1,W2,W3 are the weight matrix between input and hidden layer, theweight matrix between hidden and output layer, and the weight matrix between
Fig. 2 Jordan-Elman networks. Hidden layers transfer activations to the contextunits based on one-to-one relationships, constant weight of 1.0 is maintained, andall dotted lines indicate connections that are trainable.
568
Chiroma H. et al.: Malaria severity classification through . . .
ZY
C
X
neural networkFig. 3 Jordan-Elman neural network.
context and hidden layer, respectively. The components of the vectors at s-thiteration are:
x(s)i ∈ X
∼, i = 1, 2, . . . , n.y
(s)j ∈ Y
∼, j = 1, 2, . . . ,m,
z(s)k = Z
∼, k = 1, 2, . . . , l, c
(s)i = C
∼i′ = j,
where X∼
denotes the input layer vectors, Y∼
is the hidden layer vector, Z∼
is the
output layer vector and C∼is the context layer vector while i, j, k and i’ are indices of
their respective nodes. Computation at hidden node outputs requires an activationfunction. Therefore, consider the activation function f(.) at j-th hidden node
output at s-th iteration be given as y(s)j = f
(a(s)j
). Then, the relation for context
layer input at s-th iteration is c(s)i = y
(s−1)j , where a
(s)j is taken at s-th iteration
and there is linear output of node j. The initialization of the Jordan-Elman neuralnetwork is as follows:
assuming y(0)j = 0, j = 1, 2, . . . ,m, s = 0 at the context layer, the input results
to c(1)i = 0. In the context of the weight matrices W1ij ∈W1, W3ij ∈W3 and
W2ij ∈W2 The hidden layer neurons output is
y(s)j = f
n∑i=1
w1ijx(s)i +
m∑j=1
w3ijy(s−1)j
, t = j. (1)
569
Neural Network World 5/15, 565–584
The output layer neurons output at s-th iteration is
z(s)k = f
m∑j=1
w2jky(s)j
, (2)
z(s)k = f
m∑j=1
w2jk
n∑i−1
w2ijx(s)i +
m∑j=1
w3ijy(s−1)j
. (3)
The error E is minimized by updating the weight coefficients at the output layerby
wnew = wold + η∆w, (4)
where ηis the learning rate. The relationship that defined pattern vectors andoutput nodes is
E(w) =1
2
p∑s=1
l∑k=1
(Z
(s)k − z
(s)k
)2, (5)
E(w) =1
2
p∑s=1
l∑k=1
z(s)k −
f m∑j=1
w2jk
n∑i=1
w2ijx(s)i +
m∑j=1
w3ijy(s−1)j
, (6)
where Z2k is the desired value at s-th iteration and p represents the sequence of
training length. W1 and W3 can be computed with back propagation algorithmsas they conform to the feed-forward character.
The back propagation algorithms for computation in the context of W3 aredescribed as follows:
W3 =n∑
i=1
w3ijy(s)j , (7)
and we have the sigmoid function (fj) given as
fj =1
1 + ℓ−λW3. (8)
The sigmoid activation function is used for the computation in the neurons of theJordan-Elman neural network. Here, λ is the step size which controls the steepnessof fj defined as
fj =1
1 + ℓ−λw3ijy(s)j
. (9)
To obtain Eq. (9), we substitute Eq. (7) in the indicated activation function asexpressed in Eq. (8). Hence, it was used in the computation of
W2 =l∑
k=1
w2jkfj . (10)
The activation function presented in Eq. (9) is passed to Eq. (10) for computationwith the network weights in the neurons of the network. The expression for the
570
Chiroma H. et al.: Malaria severity classification through . . .
operation is given by
W2 =
l∑k=1
w2jk
1 + ℓ−λ
n∑i=1
w3ijy(s)j
. (11)
The computation of Eq. (11) is in the hidden layer neurons of the Jordan-Elmanneural network, whereas the computation at the output layer of the network canbe expressed as
Z∼=
1
−λ
l∑k
1
1+ℓ
−λ
(n∑
i=1w2ijy
(s)j
). (12)
Training output for Z∼neurons is
rok =(Z
(s)k − z
(s)k
)(1− z
(s)k
)λz
(s)k , (13)
where rokis the training signal for output neuron andrhj is hidden layer neuron com-puted as
rhj =
(l∑
k=1
rokw2jk
)(1− y
(s)j
)λy
(s)j . (14)
Updating weight of the output layer at s-th iteration is
w2jk(s) = w2jk(s) + ηroky(s)j (s), (15)
w2jk(s) = w2jk(s) + y(s)j z
(s)k ηλ
(Z
(s)k − z
(s)k
)(1− z
(s)k
)(s). (16)
Updating weight of the hidden layer at s-th iteration, computation of w3ij at s-thiteration can be expressed as
w2ij(s) = w3ij(s) + ηrhj x(s)i (s). (17)
The substitution of Eq. (15) into Eq. (17) produces the expression
w3ij(s) = w3ij(s) + ηλx(s)i y
(s)j
(l∑
k=1
rokw2jk
)(1− y
(s)j
)(s). (18)
The value of Eq. (18) in training the Jordan-Elman neural networks is used toupdate coefficients of weight between hidden memory units. The value of Eq. (18)update coefficients of weight between memory units and hidden layer using themethod of training applied in the Jordan-Elman neural networks.
571
Neural Network World 5/15, 565–584
2.2 Learning algorithms
Iterative non–linear optimization algorithms are responsible for minimizing errorin most common ANN architectures. The accuracy of the global error functiondepends on the ANN weights. The best performing learning algorithms (LA) con-verged to minimum global error function with smaller number of iterations. Op-timization algorithms are mostly based on gradient descent algorithms, in whichthe activation function is differentiable continuously. ANN learns by approximat-ing unfamiliar mapping of input–output relation by modifying connection weightsof ANN. Input and desired output are required for error function minimization.Many LA exist in literature, such as the most commonly used back-propagation al-gorithm, while others include scale conjugate gradient, conjugate gradient method,and back–propagation through time [29]. Back–propagation has been generallyaccepted as the suitable LA for searching correct weights of ANN [24]. The fastestor most exact LA for a specific problem is difficult to decide because of the manyfactors that need to be taken into account, such as problem complexity, volumeof data available for training, number of network weights and biases in a givennetworks, error goal. Also, it needs to be decided first whether the task to besolved by neural network is pattern recognition or function approximation [35]. Ina particular problem, searching for the optimum solution requires different ANNLA to be considered and experimentally tried. The decision to be made on archi-tectural configurations of ANN is critical for topology description. Therefore, toestablish the best performing ANN LA for a specific problem, there is the need toexperimentally try different LA for several times using varying initial weights andthen adopt the ANN LA with superior performance in a particular problem domain[36]. The LA, initial weights, and number of epochs are the three critical pointsrequired to ensure the accuracy and stability of the learning system [16]. The Quickpropagation (QP), back propagation and resilient propagation learning algorithmshave been experimentally tried but others were rejected in the study in favourof resilient propagation which generated more satisfactory results [9]. The presentstudy’s model considers QP, conjugate gradient (CG), Levenberg-Marquardt (LM),and Delta-Bar-Delta (DBD) for experimental trials.
2.3 Model performance evaluations
Any modeling procedure covers testing, validation and verification phases. Theseprocedures suggest to model builders and other stakeholders whether the pro-posed model will achieve its desired purpose or not. Regardless of which modelingmethodology is being employed, the performance exhibited by such a model givesa first insight into the representation expected in real-life systems. A factual ap-praisal of how good a model performs largely depends on individual views of themodel. The verification process works similar to a debugging process in as much asits primary purpose is to confirm whether the model generates the desired results.Verification is not interchangeable with validation but validation and verificationusually act in form of a combination, especially when model systems have avail-able measured data. If the results produced by a model are correlated with thatof actual systems, then the proper verification of the implementation assumptionis achieved and it constitutes a true representation of a real-life system [38]. The
572
Chiroma H. et al.: Malaria severity classification through . . .
quality of a model is considered a critical issue in its design [18]. Therefore, thisresearch employs model performance evaluation in two phases to ensure the qualityand reliability of the proposed model.
2.3.1 Phase 1: Testing the proposed classifier with out-of-sample data
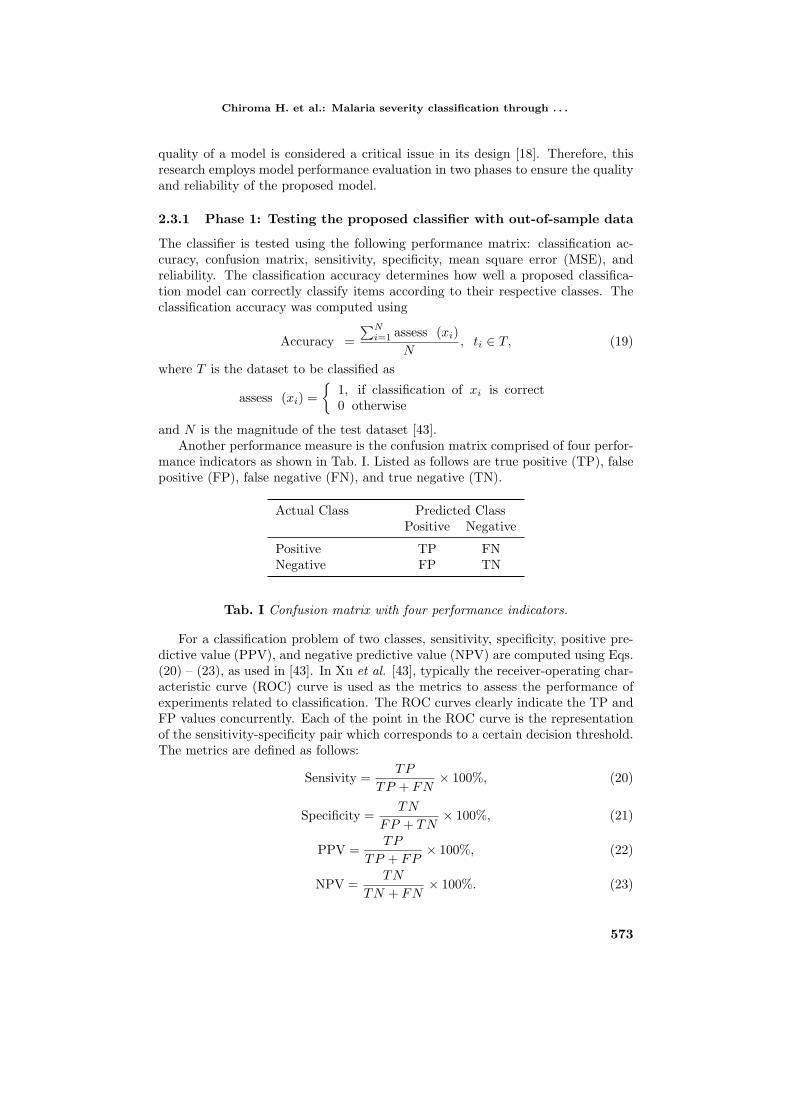
The classifier is tested using the following performance matrix: classification ac-curacy, confusion matrix, sensitivity, specificity, mean square error (MSE), andreliability. The classification accuracy determines how well a proposed classifica-tion model can correctly classify items according to their respective classes. Theclassification accuracy was computed using
Accuracy =
∑Ni=1 assess (xi)
N, ti ∈ T, (19)
where T is the dataset to be classified as
assess (xi) =
{1, if classification of xi is correct0 otherwise
and N is the magnitude of the test dataset [43].Another performance measure is the confusion matrix comprised of four perfor-
mance indicators as shown in Tab. I. Listed as follows are true positive (TP), falsepositive (FP), false negative (FN), and true negative (TN).
Actual Class Predicted ClassPositive Negative
Positive TP FNNegative FP TN
Tab. I Confusion matrix with four performance indicators.
For a classification problem of two classes, sensitivity, specificity, positive pre-dictive value (PPV), and negative predictive value (NPV) are computed using Eqs.(20) – (23), as used in [43]. In Xu et al. [43], typically the receiver-operating char-acteristic curve (ROC) curve is used as the metrics to assess the performance ofexperiments related to classification. The ROC curves clearly indicate the TP andFP values concurrently. Each of the point in the ROC curve is the representationof the sensitivity-specificity pair which corresponds to a certain decision threshold.The metrics are defined as follows:
Sensivity =TP
TP + FN× 100%, (20)
Specificity =TN
FP + TN× 100%, (21)
PPV =TP
TP + FP× 100%, (22)
NPV =TN
TN + FN× 100%. (23)
573
Neural Network World 5/15, 565–584
2.3.2 Phase 2: Comparison of the proposed classifier with supportvector machine and multiple regression
A multiple regression and support vector machine models were chosen for the pur-pose of evaluating the performance of the proposed Jordan-Elman neural networksclassification model. The MSE and determination of coefficient (R2) were com-puted using Eqns. (24) – (25) as used in [38]. The comparison results are listed inTab. VII. We thus have
MSE =1
2
N∑i=1
(Ti −Oi)2, (24)
R2 =
N∑i=1
(Oi −Oi
) (Ti − Ti
)√
N∑i−1
(Oi −Oi
)2 N∑i−1
(Ti − Ti
)22
, (25)
where Ti, Oi, Oi, Ti, N are average of actual values, average of predicted set, pre-dicted output, actual values and total number of data set, respectively.
2.3.3 Model reliability
In respect to model reliability, Wang et al. [40] states, “Higher model reliabil-ity implies a relaxed requirement to solution constraint. Conversely if the modelreliability is weak, then the variation scope of the parameters becomes limited.”As such, the process of achieving a feasible solution can be more complex thananticipated. Reliability of the proposed model is computed with Eq. (26) [7] (seeTab. VIII):
Reliability =Correct
Correct + E× 100%. (26)
2.4 Data collection and standardization
In this research, samples of 450 clinical data of six features (SRBC, SP, NCD,TRBC, LC, and NPRBC) extracted from thick blood smear were collected fromthe Department of Medical Microbiology, Clinical Parasitology Unit, University ofMaiduguri Teaching Hospital. Maiduguri is the state capital of Borno, the north-eastern state of Nigeria, West Africa. Cho [7] pointed out that thick and thin bloodsmear are the two techniques required to detect the malaria parasite. Species ofmalaria parasites are determined by thin blood smear whereas the density of themalaria parasite per RBC is determined by thick blood smear. In detecting thelevel of severity of malaria, infected RBC were used to differentiate between mildlysevere and highly severe cases, as indicated in Tab. II. Encoding for PlasmodiumFalcifarun (PF), Ansocytos Pork (AP), and Ring Shape (RS) are in Tab. III.
The improved ANN performance depends on the data type presented to the net-work. Thus, encoding data into acceptable format plays a critical role in improvingthe neural network’s performance. The encoding process requires the representa-tion of the data in such a way that ANN can easily classify inputs according to
574
Chiroma H. et al.: Malaria severity classification through . . .
LC TRBC SP NPRBC Malaria Severity
PF AP RS above 4 Highly Severe (HS)PF AP RS 1 – 4 Mildly Severe (MS)
Tab. II Classification of malaria severity.
their respective classes [22]. Tab. III shows the encoding method adopted from[22].
Specimen Code
PF 10AP 20RS 30
Tab. III Encoding.
The inputs to the proposed Jordan-Elman neural network classifier are alto-gether five while outputs are two as depicted in Fig. 4. Inputs are defined as theindependent variables whereas output represents the dependent variables. The dataused in the experiments done in the course of this study were not normalized, apractice suggested by [39] who argued that the use of raw data values is preferableto normalized data because it allows to retain the original pattern in the data.
2.5 The design of the Jordan-Elman neural networkclassifier
The length of the data measured altogether 450 rows. In a dynamic neural network,the order in which data are presented to the network is significant because inputsare sequentially presented to the network as elements of a cell array (MATLABmanual). Therefore, this study presented the features extracted from thick bloodsmears to the Jordan-Elman neural network model in the following order: SRBC,SP, NCD, TRBC and LC. Several experiments were conducted with different com-binations of the network’s architectural configurations in search for the optimalJordan-Elman neural networks classifier. In this study, 45 experiments were triedfor classification of malaria severity with varying LA, hidden layer neurons, andratio of data partition. A total of four LA were considered for the study. Theexperimental series begins with networks of three neurons on the hidden layer, fiveinput neurons, one hidden layer, three context unit neurons, and one output neu-ron. The data partition ratio of 60:15:25 was a default value set by NeuroSolution(the neural network simulator used in this research) 6.0, and the gradient descentwas the first algorithm to be tried.
To select the optimum architecture of the Jordan-Elman neural networks model,it was trained and tested for several configurations. The hidden neurons were de-termined by increasing the number from three to seven with a step interval of one.
575

Neural Network World 5/15, 565–584
AC LA HLAF CUP Epoch CDMS CDHS MSEMS MSEHS DP[%] [%]
5-5-2 LM SA (0.8,SIA) 1000 96.40 91.20 0.0262 0.0614 70-10-205-5-2 CG SA (0.8,SIA) 1000 98.20 76.50 0.0556 0.1728 71-10-205-5-2 QP SA (0.8,SIA) 1000 0.00 100 0.0108 0.1926 72-10-205-5-2 DBD SA (0.8,SIA) 1000 96.10 89.50 0.0281 0.0694 73-10-20
Tab. IV Experimental trials to determine appropriate LA and optimum AC. Cor-rect detection and classification of MS (CDMS), correct detection and classificationof HS (CDHS), MSE of MS (MSEMS), MSE of HS (MSEHS), hidden layer ac-tivation function (HLAF), context units parameters (CUP) = (time, activationfunction), architectural configurations (AC), LA, data partitioning (training – val-idation – testing) expressed in percentage (DP), sigmoid axon (SA) and sigmoidintegrated axon (SIA).
It was observed that the performance was increasing as the number of neuronsincreased. The performance started diminishing when the number of hidden neu-rons reached six and seven. In consequence, the experiments were stopped and thebest performing network configuration with five hidden neurons was adopted. TheSigmoid activation function was used in the hidden layer and the linear activationfunction was used in the output layer as recommended by [38]. Time delay at thecontext units and epochs were a default setting of the simulator (NeuroSolution6.0). The best trial results are reported in Tab. IV and the optimal architecturalconfigurations of the proposed Jordan-Elman neural network classifier is depictedin Fig. 4.
Fig. 4 Optimum architectural configurations of the Jordan-Elman neural networkmodel.
576
Chiroma H. et al.: Malaria severity classification through . . .
LM algorithms were chosen as this proved to perform very well in classifyingMS and HS malaria with an adequate level of accuracy as shown in Tab. IV. Thebest classification accuracy of MS malaria was achieved by CG although it didnot perform as well in HS malaria classification as LM. The worst performance inclassification of MS malaria was recorded by QP but generated excellent results inthe classification of HS malaria. DBD performed satisfactory in the classification ofboth MS and HS malaria but less so in the classification of HS as compared to LM.LM achieved more than 90% classification accuracy in both cases while none ofthe LA was able to achieve similar results. Consequently, LM was identified as thebest performing LA clearly outperforming other LA. The probable reason for itssuperior performance may be attributable to its suitability in less complex neuralnetwork architecture which makes it suitable for small and medium sized neuralnetworks. The best and final MSE result during training measured 0.028. Crossvalidation was specified to terminate after 100 epochs without improvement. Crossvalidation was terminated at the 45th epoch with a minimum MSE of 0.0129 andfinal MSE of 0.0164. The training stopped as cross validation MSE was no longerimproving. MSE of cross validation measured lower than training MSE indicatingthere was improvement over training MSE. The configurations of the Elman NeuralNetwork realized in the experiments design were used for the classification of themalaria severity. Support vector machine, and multiple regression were also usedfor the classification of malaria severity.
3. Results and discussion
3.1 Classification of malaria severity using the proposedJordan-Elman neural network classifier
The Jordan-Elman neural network classifier described in Section 2.6 is appliedfor the classification of malaria severity. Tab. V displays the confusion matrixgenerated by the proposed Jordan-Elman neural networks classifier at a thresholdof 0.5; of a total of 57 cases of MS malaria, 54 were correctly classified and threewere wrongly classified as HS malaria. In the case of HS malaria, of a total of 33cases, 31 were correctly classified and two were incorrectly classified as MS malaria.This result indicated that the proposed model did not perform perfectly but hasvery high classification accuracy.
MS HS
MS 54 3HS 2 31
Tab. V Confusion matrix.
Due to the probability of misclassification of a patient’s malaria severity status,the medical practitioner and patient need to be aware that the classifier only pro-vides knowledge of the level of severity. This does not change the fact that any case
577

Neural Network World 5/15, 565–584
of malaria calls for immediate medical treatment. Its use lies in supporting anydecision made in regard to the type of treatment to be administered to a patient.
Fig. 5 ROC curve obtained from testing.
The ROC depicted in Fig. 5 shows the sensitivity and specificity on a verticaland a horizontal axis respectively. The curve is represented by each dotted pointshown in Fig. 5. Every sensitivity–specificity corresponds to a certain thresholddecision. Values of sensitivity, specificity, positive predictive value, and negativepredictive value at a threshold of 0.5 are listed in Tab. VI. Classification accuracydepends on how large the area under the ROC curve is. The larger the area,the more accurate will the classification result be and vice versa. The more theROC curve extends to the top left hand corner, the larger is the ROC curve whichtranslates into superior classification accuracy. In this case, the ROC curve is veryclose to the top left hand angle with promising values of sensitivity–specificity asdisplayed in Tab. VI. This suggests that the proposed Jordan-Elman neural networkclassifier performed at an acceptable classification accuracy level.
Indicators Accuracy [%]
Sensitivity 91.2Specificity 96.4Positive Predictive Value 93.9Negative Predictive Value 94.7
Tab. VI Performance values obtained at a threshold of 0.5.
Tab. VII shows the reliability of the proposed classifier in detecting and classify-ing malaria severity (MS or HS). The results reveal that reliability of the proposedmodel achieves more than 90%.
578
Chiroma H. et al.: Malaria severity classification through . . .
Detection and Classification RateMalaria Severity Correct [%] Error [%] Reject Reliability [%]
MS 96.4 3.60 0 96.4HS 91.2 8.80 0 91.2
Tab. VII Measuring reliability of the proposed model (expressed as %).
3.2 Sensitivity analysis
The sensitive features of available inputs may be of assistance in the process ofmodeling because it allows handling such contributing features with great care andprecision [21].
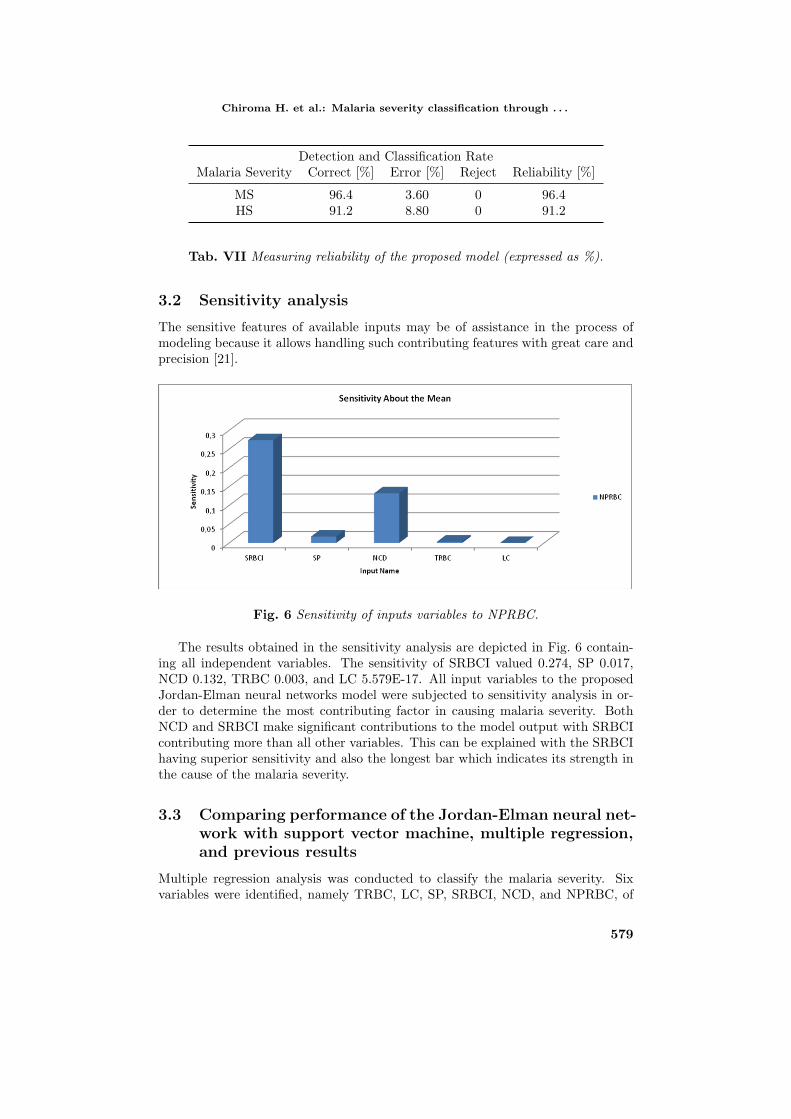
Fig. 6 Sensitivity of inputs variables to NPRBC.
The results obtained in the sensitivity analysis are depicted in Fig. 6 contain-ing all independent variables. The sensitivity of SRBCI valued 0.274, SP 0.017,NCD 0.132, TRBC 0.003, and LC 5.579E-17. All input variables to the proposedJordan-Elman neural networks model were subjected to sensitivity analysis in or-der to determine the most contributing factor in causing malaria severity. BothNCD and SRBCI make significant contributions to the model output with SRBCIcontributing more than all other variables. This can be explained with the SRBCIhaving superior sensitivity and also the longest bar which indicates its strength inthe cause of the malaria severity.
3.3 Comparing performance of the Jordan-Elman neural net-work with support vector machine, multiple regression,and previous results
Multiple regression analysis was conducted to classify the malaria severity. Sixvariables were identified, namely TRBC, LC, SP, SRBCI, NCD, and NPRBC, of
579
Neural Network World 5/15, 565–584
which the first five represent the independent variables and the sixth the dependentvariable.
Performance Our Support Vector Multiple RegressionIndicator proposal Machine Model
MSE (0.02, 0.06) (16.92, 17.56) 0.72R [%] 84 74.19 73
Tab. VIII Performance comparison of the proposed Jordan-Elman neural networksand the compared algorithms. HS MSE, MS MSE.
The R Square measure of variability described by the independent variablesequaled 73%. The adjusted R Square value of 73% was identical with that of theoriginal R Square indicating how well the model generalized since there was noshrinkage from adjusted values. The MSE measured 0.72, and the summary of themultiple regression results is shown in Tab. VIII.
The support vector machine was applied for the classification of the malariaseverity. The results generated by support vector machine shows that a totalof 36 cases of HS malaria were detected, 28 were correctly classified and 8 werewrongly classified as MS malaria. In the case of MS malaria, of a total of 84cases, 68 were correctly classified and 16 were incorrectly classified as HS malaria.The accuracy for the classification of HS and MS are 63.63 and 77.78% respectively,this classification rate and the results in Tab. VIII clearly indicate that the Jordan-Elman neural network classifier performs better than the support vector machineclassifier. In summary, the Jordan-Elman neural networks model performed betterin terms of classification accuracy than the compared algorithm despite the goodperformance exhibited by the models.
Reference Accuracy [%]
[12] 84.85[33] 85[25] 80[19] 81.00[44] 77.19
Tab. IX Earlier published results.
Tab. IX contains the results achieved in earlier studies in which feed-forwardANN was applied for classification in the domain of malaria. The classificationof malaria in a clinical blood samples using feed-forward artificial neural networksdoes not constitute a new method of research, as pointed out in the introduction.However, the application of the Jordan-Elman neural network (recurrent neuralnetwork) in this domain does indeed constitute an alternative approach. The pro-posed Jordan-Elman neural network classifier generates more accurate results thanthe common feed-forward neural network method currently applied in this field.
580
Chiroma H. et al.: Malaria severity classification through . . .
Tabs. V to VIII and Fig. 5 have indicated that the proposed model achieved su-perior accuracy (more than 90%) compared to previous results of other models asreported in Tab. IX. The probable cause of its superior accuracy lies in the fact thatSRBCI and NCD were extracted from thick blood smears whose salient featureswere easier detected by the proposed classifier than by the feed-forward neuralnetworks, multiple regression, and support vector machine. Moreover, the pres-ence of internal feedback makes the recurrent network a more generally applicablemodel than feed-forward neural networks, multiple regression, and support vectormachine. The proposed model performs better than the multiple regression model,which was already expected as previous studies had shown that neural networksperformed better than statistical tools. However, it needs to be noted that criticalreviews such as that of [45] concluded that the performance of neural networksis not always better than that of statistical tools. Fernandez [10] also providedempirical evidence in which the statistical tool performed better than the supportvector machine in short term forecasts. However, contradictory results were foundin [6].
4. Conclusions
The speedy detection and classification of malaria severity are urgent requirementsin order to assist medical practitioners in making accurate and proper decisionsthat lead to the administration of correct treatment plans. This will eventuallyreduce the rate of morbidity, premature births, and maternal and infant mortality,especially in the tropical and subtropical regions of the world which are prone tomalaria infection. This study proposes the Jordan-Elman neural networks classifierin order to detect and correctly classify malaria severity based on features extractedfrom thick blood smears. The proposed classifier has proven to perform at a higheraccuracy level than other classifiers.
Acknowledgement
This research is supported by University of Malaya research grant vote No. BK011-2013.
References
[1] ABU N.S., ASHIDI N.M.I., CHIA L.L., MOHAMED Z., KALTHUM U.N., ZUHAIRI K.Z.Classification of malaria parasite species based on thin blood smears using multilayer percep-tron network. International Journal of the Computer, the Internet and Management. 2008,16(1), pp. 46–52.
[2] ADEFIOYE O.A., ADEYABA A.O., HASSAN W.O., OYENIRAN O.A. Prevalence ofmalaria parasite in infection among pregnant women in Oshogbo, southwest Nigeria. Amer-ican Eurasian Journal of Scientific Research. 2007, 2(1), pp. 43–45.
[3] AO S.I., NG M.K. Gene expression time series modeling with principal component and neuralnetwork. Soft Computing. 2006, 10, pp. 351–358, doi: 10.1007/s00500-005-0494-8.
[4] BANZHAF W.P., NORDIN R.E., KELLER R., FRANCONE F.D. Genetic programming:An introduction. San Francisco: Morgan Kaufmann Publishers, 1998.
581
Neural Network World 5/15, 565–584
[5] BELOHLAVEK R. Feedforward networks with fuzzy signals. Soft Computing. 1999, 3, pp.37–43, doi: 10.1007/s005000050089.
[6] CHIROMAH., ABDULKAREEM S., ABUBAKAR A.I., SARI E.N., HERAWANT. A NovelApproach to Gasoline Price Forecasting Based on Karhunen-Loeve Transform and Networkfor Vector Quantization with Voronoid Polyhedral. In: LINAWATI, M.S. MAHENDRA, E.J.NEUHOLD, A.M. TJOA, I. YOU, eds. Information and Communication Technology. BerlinHeidelberg: Springer 2014, pp. 257–266, doi: 10.1007/978-3-642-55032-4_25.
[7] CHO S. Combining modular neural networks developed by evolutionary algorithms. In: T.BACK, Z. MICHALEWICZ, X. YAO, eds. Proceedings of the 1997 IEEE international Con-ference on evolutionary Computation, Indianapolis, New York: IEEE, 2007, pp. 647–650,doi: 10.1109/ICEC.1997.592393.
[8] ELMAN J.L. Finding Structure in Time. Cognitive Science. 1990, 14, pp. 179–211, doi: 10.1016/0364-0213(90)90002-E.
[9] FAN Y., LIANG Q., WEI Y. A Generalized pattern matching approach for multi–step pre-diction of crude oil price. Energy Economics. 2008, 30, pp. 889–904, doi: 10.1016/j.eneco.2006.10.012.
[10] FERNANDEZ V. Forecasting crude oil and natural gas spot prices by classification methods[online]. In: IDEAS, 2006 [viewed 2012-04-6]. Available from: http://www.webmanager.cl/prontus_cea/cea_2006/site/asocfile/ASOCFILE120061128105820.pdf.
[11] GANATRA A.Y.P., KOSTA G., PANCHAL C., GAJJAR K. Initial Classification throughback propagation in a neural network following optimization through GA to evaluate thefitness of an algorithms. International Journal of Computer Science and Information Tech-nology, 2011, 3(1), pp. 98–116, doi: 10.5121/ijcsit.2011.3108.
[12] GAO C.Y., XIONG H.Y., YI D., CHAI G.J., YANG X.W., LIU L. Study on meteorologicalfactors–based neural networks model malaria. Chinese Journal of Epidemiology, 2003, 24(9),pp. 831–834.
[13] GENCAY R., LIU T. Nonlinear modeling and prediction with feedforward and recurrentnetworks. Physica D, 1997, 108, pp. 119–134, doi: 10.1016/S0167-2789(97)82009-X.
[14] GREENWOOD B.M. The Epidemiology of malaria. Annals of Tropical Medicine and Par-asitology. 1997, 91, pp. 763–769, doi: 10.1080/00034989760518.
[15] GUNDIN D.A., GARCIA C., GOMEZ E., DIMITRIADIS Y.A., VEGA G. Short-term loadforecasting for industrial customers using fasArt and fasBack neuro-fuzzy systems. In: Y.DIMITRIADIS, I. ZIGURS, E. GOMEZ-SANCHEZ, eds. Proceedings of the 14th IEEEpower systems computation Conference, Sevilla, Spain. New York: IEE, 2002, pp. 221–227,doi: 10.1.1.12.6503.
[16] HARJES F., SCHOLZ-REITER B., KAVIANI A.M. Elman networks for the prediction ofinventory levels and capacity utilization. International Journal of Applied Mathematics andInformatics. 2011, 5(4), pp. 283–290.
[17] HETAL P. K., PRATIBHA D.B. Evaluation of one Rapid Method for Diagnosis of MalariaThe Optional and Better Replacement of Microscopy. Research Journal of Recent Sciences.2012, 1, pp. 361–364.
[18] HUSKEN M., JIN Y., SENDHOFF B. Structure optimization of neural networks forevolutionary design optimization. Soft Computing. 2005, 9, pp. 21–28, doi: 10.1007/
s00500-003-0330-y.
[19] IMROZE M.K., ACHARYA B., KUMAR B.S., SONI J. Content Based ImageRetrieval Ap-proaches for Detection of Malarial Parasite in Blood Images. International Journal of Bio-metrics and Bioinformatics. 2011, 5(2), pp. 97–110.
[20] JIN Y. A comprehensive survey of fitness approximation in evolutionary computation. SoftComputing. 2003, 9, pp. 3–12, doi: 10.1007/s00500-003-0328-5.
[21] JONG Y.H., LEE C.I. Influence of geological conditions on the powder factor for tunnelblasting.International Journal of Rock Mechanics and Mining Science. 2004, 41, pp. 533–538, doi: 10.1016/j.ijrmms.2004.03.095.
582
Chiroma H. et al.: Malaria severity classification through . . .
[22] KUMAR A.B., KIRAN K., MURTY U.S.N., VENKATESWARLU C.H. Classification an-didentification of mosquito species using artificial neural networks. Computational Biologyand Chemistry. 2008, 32, pp. 442–447, doi: 10.1016/j.compbiolchem.2008.07.020.
[23] LIZHE Y., BO X., XIANJIE W. BP networks model optimization by adaptive genetic algo-rithms and the application on quality for class teaching. In: IEEE Proceedings of Interna-tional Conference on future computer and communication, Wuhan, China. New York: IEEE2010, 3, pp. 273–276, doi: 10.1109/ICFCC.2010.5497635.
[24] MAEDA Y., WAKAMURA M. Simultaneous perturbation learning rule for recurrent neuralnetworks and its FPGA implementation. IEEE Transaction on Neural Network. 2005, 16(6),pp. 1664–1671, doi: 10.1109/TNN.2005.852237.
[25] MAGALHAES A.B.J., AMANCIO A.D., BARRAL M.N., BEZERRIL B.A. Artificial neuralnetworks and Bayesian networks as supporting tools for diagnosis of asymptomatic malaria.In: IEEE Proceedings of 12 thInternational Conference on e–Health Networking Applicationsand Services, Lyon, France. New York: IEEE, 2010, pp. 106–111, doi: 10.1109/HEALTH.2010.5556584.
[26] MARIELLE K.B.A., DENISA E.I.C., MODESTE M.M., ERIC K., PIERRE-BLAISE M.,ELIE M., VONNE M.K. Prevalence of Plasmodium falciparum infection in pregnant womenin Gabon. Malaria Journal. 2003, 2, pp. 1–17, doi: 10.1186/1475-2875-2-18.
[27] NOSTAN F., TERUILE F., MALANKIRI L. Malaria in pregnancy in an area of unstableendimicity. Transaction on Royal Society of Tropical Medicine and Hygiene. 1991, 48(1),pp. 154–160.
[28] OMOLADE O.O. The status of malaria among pregnant women: a study in Lagos, Nigeria.African Reproductive Health. 2003, 7(3), pp. 77–83, doi: 10.2307/3583292.
[29] PACIFICI F., DEL F.F., SOLIMINI C., WILLIAM J.E. Neural Networks for Land Cover Ap-plications. Computational Intelligence for Remote Sensing. 2008, 133, pp. 267–293, doi: 10.1007/978-3-540-79353-3_11.
[30] PHAM D.T., KARABOGA D. Training Elman and Jordan Networks for system identifica-tion using genetic algorithms. Artificial Intelligence in Engineering. 1999, 13, pp. 107–117,doi: 10.1016/S0954-1810(98)00013-2.
[31] QI D., LIU M., QIU M., ZHANG S. Exponential H∞ Synchronization of General Discrete-Time Chaotic Neural Networks With or Without Time Delays. IEEE Transaction on NeuralNetwork. 2010, 21(8), pp. 1358–1365, doi: 10.1109/TNN.2010.2050904.
[32] RAMI O.G., KANU C.P. The prevalence of malaria infection in pregnant women livingin suburb of Lagos, Nigeria. African Journal of Biochemistry Research. 2010, 4(10), pp.243–245, doi: 10.5897/AJBR.
[33] ROSS N.E., PRITCHARD C.J., RUBIN D.M., DUSE A.G. Automated image process-ing method for the diagnosis and classification of malaria on thin blood smears. Med-ical and Biological Engineering and Computing. 2006, 44, pp. 427–436, doi: 10.1007/
s11517-006-0044-2.
[34] SEKER S., AYAZ E., TURKCAN E. Elman’s recurrent neural networks applications tocondition monitoring nuclear power plant and rotating machinery. Engineering Applicationof Artificial Intelligence. 2003, 16, pp. 647–656, doi: 10.1016/j.engappai.2003.10.004.
[35] SERTER M.U., INAN O., YILMAZ N. A hybrid breast cancer detection system via neuralnetwork and feature selection based on SBS, SFS and PCA. Neural Computing and Appli-cations. 2013, (3–4), pp. 719–728, doi: 10.1007/s00521-012-0982-6.
[36] SHEN Y., LI T., HERMANS E., RUAN D., WETS G., VANHOOF K., BRIJS T. A hy-brid system of neural networks and rough sets for road safety performance indicators. SoftComputing. 2010, 14, pp. 1255–1263, doi: 10.1007/s00500-009-0492-3.
[37] STEKEETEE R.W., WIRIMA J.J., HIGHTOWER A.W., SLUTSKER L., HELIMAN D.L.,BREMAN J.G. The effects of malaria. Malaria prevention in pregnancy on Offspring birthweight, Prematurity and Intra-uterine Retardation in rural Malawi. American Journal ofTropical Medicine and Hygiene. 1996, 2, pp. 824–832.
[38] TAHER A.Z. Fast neural network learning algorithms for medical applications. Neural Com-puting and Application. 2013, 23(3–4), pp. 1019–1034, doi: 10.1007/s00521-012-1026-y.
583
Neural Network World 5/15, 565–584
[39] VANSTON B.J. Trading in the Australian stock market using artificial neural networks[online]. Bond, 2006. PhD thesis, Bond University [viewed 2012–10–26]. Available from:http://works.bepress.com/bruce_vanstone/1/.
[40] WANG D., KIM Y., CHEON S.P. C.S.L., KYUNG Y.H. Learning based neural similaritymetrics for multimedia data mining. Soft Computing. 2007, 11, pp. 335–340, doi: 10.1007/s00500-006-0086-2.
[41] WARRELL D.A. CEREBRAL MALARIA. Clinic Features, Pathophysiology and Treatment.Annals of Tropical Medicine Parasitology. 1997, 91, pp. 875–884.
[42] WORLD HEALTH ORGANIZATION. WHO Recommended Strategies for the Preventionand Control of Communicable Diseases [online]. World Health Organization, 2001 [viewed2012-08-23]. Available from: http://apps.who.int/iris/handle/10665/67088.
[43] XU Y., ZHU Q., WANG J. Breast cancer diagnosis based on a kernel orthogonal trans-form. Neural Computing and Applications. 2012, 21(8), pp. 1865–1870, doi: 10.1007/
s00521-011-0547-0.
[44] YUNDA L., ALARCON A., MILLAN J. Automated image analysis method for p. vivaxmalaria parasite detection in thick blood film blood images. Revista S & T. 2011, 10(20),pp. 9–25, doi: 10.18046/syt.v10i20.1151.
[45] ZHANG G., HU M.Y., PATUWO B.E., INDRO D.C. Artificial neural networks inbankruptcy prediction: general framework and cross-validation analysis. European Journalof Operation Research. 1999, 116, pp. 16–32, doi: 10.1016/S0377-2217(98)00051-4.
584