Embed Size (px)
Citation preview

Interim Report for Economic Analysis of Political Shocks, IDE-JETRO, FY 2015
Malaria Infection and Fetal Growth during the War:Evidence from Liberia†
Yuya Kudo*
March 2016
Abstract
This study investigates whether the Liberian civil war increased infant mortality by expos-
ing pregnant women to a high risk of malaria infection, thus retarding fetal development. I find
that the war-induced, one-percent increase in maternal infection risk resulted in a 0.44 percent
increase in one-year mortality. This mortality effect gradually increased following childbirth as
maternal passive immunity waned. The consequences were pronounced for infants conceived
in rainy seasons by young mothers residing in rural, battle-intensive areas, with no gender dif-
ference detected. I also provide evidence suggesting the wartime culling of the weakest infants
associated with maternal malaria infection.
†I thank James Fenske, Seiro Ito, Tomohiro Machikita, Saumik Paul, Akira Sato, William Seitz, Yoshito Takasaki,Shinichi Takeuchi, Miwa Tsuda, Anthony Wray, and participants at seminars at GRIPS, Hitotsubashi, and theIDE-JETRO for valuable comments and suggestions. My great thanks also go to Souknilanh Keola for helpingme process geo-coded data. Financial support from the IDE-JETRO for my field trip to Buduburam in Ghana isgratefully acknowledged. My great thanks in this trip goes to Frederick Mills, Alexander Nimo Wiredu, and Liberianrespondents. The findings, interpretations, and conclusions expressed in this paper are entirely those of the authorand do not represent the views of the IDE-JETRO. All errors are my own.
*Institute of Developing Economies (IDE-JETRO), 3-2-2 Wakaba, Mihama-ku, Chiba-shi, Chiba 261-8545, Japan,Yuya [email protected], +81-43-299-9697.
1

Interim Report for Economic Analysis of Political Shocks, IDE-JETRO, FY 2015
1 Introduction
One legacy of civil war is the interruption of health accumulation. Following several pioneering
studies (e.g., Akresh et al. (2011); Akresh et al. (2012a); Akresh et al. (2012b); Alderman et al.
(2006); Bundervoet et al. (2009); Minoiu and Shemyakina (2012)), one recent leading question is
in what ways an armed conflict harms the human capital stock rather than whether such harm
occurs at all (Blattman and Miguel (2010), p. 42). This question is important to design effective
assistance programs both during and after the conflict and to better understand wars’ long-term
influence on economic development. Accordingly, an emerging body of empirical research has
only recently illuminated the significance of the limited effectiveness of consumption-smoothing
strategies (Verpoorten (2009)), reduced dietary diversity (Dabalen and Paul (2014)), economic
loss (Minoiu and Shemyakina (2014)), and prenatal maternal stress (Camacho (2008); Mansour
and Rees (2012)) as mechanisms underlying health damage induced by conflict.
While malaria has historically been seen as one of the most important causes of violence-
induced mortality and morbidity (Collier et al. (2003); Ross (1910), p. 577), few economic studies
have assessed its influence in a rigorous manner. Armed conflict greatly increases the risk of
malaria-related mortality because people seeking to escape from battle areas often hide in and/or
travel through malaria-prone bushes and forests while being unable to maintain typical preventive
actions (e.g., Foster et al. (2009)). Furthermore, despite this increase in infection risk, appropriate
treatment is often unavailable due to health services impaired by the war.
By focusing on the Liberian civil war, this study explores whether the armed conflict increased
infant mortality by exposing pregnant mothers to a higher risk of malaria infection, which would
retard fetal development. This war provides a unique setting for the purpose of the current study.
First, based on the 2011 Malaria Indicator Survey, this country is an ideal breeding ground for
malaria-carrying mosquitoes. In almost all parts of this country, malaria transmission is possible
throughout the year (see Appendix A.1 for a more detailed explanation of the geographic and
climatic suitability).1 In addition, due to the brutality of violence, approximately 60% of the pre-
war populations was either internally or externally displaced during the 14-year conflict. Therefore,
the Liberian people must have faced exposure to great infection risk when fleeing war-torn areas.
Second, the large-scale armed conflict devastated Liberia’s health system by destroying health
facilities and inducing the deaths and flights of health professionals (Kruk et al. (2010)).
Infant mortality is worth exploring because among adults, mobile and pregnant populations are
among the highest risk groups for malaria infection. In addition, it is well known that maternal
malaria infection is highly associated with unfavorable birth outcomes (e.g., low birthweight),
1See National Malaria Control Program (NMCP) [Liberia], Ministry of Health and Social Welfare (MOHSW),Liberia Institute of Statistics and Geo-information Services (LISGIS) and ICF International (2012).
2
Interim Report for Economic Analysis of Political Shocks, IDE-JETRO, FY 2015
which in turn increase the risk of newborn deaths.
To address the question of interest, this study exploits child-level data based on the full
birth history of the respondent females in two rounds (2007 and 2013) of the Demographic and
Health Surveys (DHS) conducted in Liberia. The endemicity map of Plasmodium falciparum
(P.falciparum), provided by the Malaria Atlas Project (Gething et al. (2011)), is also used to mea-
sure malaria infection risk. In Liberia, P.falciparum is a major plasmodium species (Patz and
Olson (2006)) that produces the most deadly health consequences among human malaria parasites
(WHO (2013), p. 72). Assuming that pregnant mothers hiding in and/or escaping from malaria
endemic areas must have been exposed to greater infection risk than those doing so in and/or from
less endemic areas, this study estimates an intent-to-treat effect (ITT) of malaria infection risk in
pregnancy that increased in mothers’ original places of residence at the time of the war.
By comparing changes in mortality for children conceived before and after the outbreak of the
war between areas of high and low malaria endemicity (after controlling for fixed effects of the
month- and year-of-conception as well as community-level fixed effects), this study will show that
wartime pregnancy in areas of high infection risk exhibited increased infant mortality. This finding,
provided by the differences-in-differences (DID) approach, is robust to the utilization of both the
indicator and continuous measure of malaria infection risk, alternative controls (e.g., geographic
and climate controls sourced from numerous geo-coded data sets, and mother-fixed effects that are
expected to be the most powerful control), time-trends specific to each district, non-linearity of
the empirical models (probit, hazard), alternative measures of malaria infection risk, and analyses
exploiting separate sub-samples of the data.
This study will also show that war-induced infant mortality gradually increased and that it
can be seen more clearly from six months after childbirth. It is expected that children born to a
mother infected with malaria will have low birthweights and thus be vulnerable to several infectious
diseases. While antibodies passed from mother to fetus protect such low-birthweight children, this
maternal passive immunity wanes six to 12 months after the child is born. Therefore, this decrease
in immunity might have made the vulnerability of low-birthweight children more evident while
gradually increasing their mortality rate.
Moreover, the mortality effect was more pronounced for children conceived in rainy seasons
by mothers residing in battle-intensive, rural areas, suggesting that these environmental factors
increased the risk of malaria infection in wartime. Based on the knowledge of human biology,
this study will also investigate whether parity- and (maternal) age-dependent immunity affects the
mortality effect; it also provides evidence highlighting the importance of maternal age at birth.
In contrast, the current research finds no significant gender differences in the adverse mortality
impact.
3

Interim Report for Economic Analysis of Political Shocks, IDE-JETRO, FY 2015
This study will also argue that the DID estimate is a lower-bound effect of wartime malaria
infection risk in pregnancy, and by taking three different approaches, it will provide some evidence
supporting this view. These approaches include an assessment of the importance of unobserv-
ables (relative to the observed controls) required to explain the identified mortality effect (Oster
(2015)) and an exploitation of an instrumental variable approach and of an insight obtained from
a regression discontinuity design.
This study mainly contributes to three strands of the extant economic literature. First, the
current study explores transmission channels driving human capital consequences of wars by fo-
cusing on the role of “malaria” infection in “pregnancy.” By specifically investigating a country
that experienced armed conflict, this research differs from the study conducted by Montalvo and
Reynal-Querol (2007), which found an increase in malaria cases in countries that hosted refugees
fleeing war. On the other hand, the current research reveals a similarity to Camacho (2008) and
Mansour and Rees (2012), who examined the birthweights of children born to mothers exposed to
violence during pregnancy from the perspective of maternal stress.
Second, within the field of economics, a rapidly growing body of research has demonstrated
the negative influence of adverse prenatal conditions on human capital stocks. In contrast to some
studies investigating the role of maternal nutritional deficiencies (e.g., Almond and Mazumder
(2011); van Ewijk (2011); Almond et al. (2015)), this research explores the influence of infectious
diseases as others have done in the context of an influenza pandemic (e.g., Almond (2006); Almond
and Mazumder (2005)).
Third, a socioeconomic consequence of infectious diseases is of general interest in health-related
research. In contrast to several studies focusing on relatively unusual disorders such as HIV/AIDS
(e.g., Fortson (2009); Kalemli-Ozcan and Turan (2011); Young (2005)), by exploiting “conflict”
shocks, this study assesses the influence of a particular universal disease that possesses a major
health problem in sub-Saharan Africa and elsewhere in the developing world (e.g., Kudamatsu
et al. (2014)).
The rest of the paper is organized as follows. To facilitate an empirical analysis, Section 2
provides a review of the previous literature that links armed conflict with infant mortality, with
particular emphasis placed on maternal malaria infection. The empirical strategy is presented
in Section 3, followed by the data overview given in Section 4. Section 5 reports the empirical
findings, with the concluding remarks summarized in Section 6.
4
Interim Report for Economic Analysis of Political Shocks, IDE-JETRO, FY 2015
2 Channels from war to infant mortality
The conceptual framework that underlies the subsequent empirical analysis can schematically be
summarized as occurring through the following series of events: “fighting (subsection 2.1) ⇒ an
increase in malaria infection risk (subsection 2.2) ⇒ pregnant mothers’ infection with malaria
(subsection 2.3) ⇒ fetal growth retardation (subsection 2.4) ⇒ an increase in mortality of weak
infants associated with a ruined health system (subsection 2.5).” This section reviews the literature
relevant to each of these stages.
2.1 Liberian civil war
While a detailed account is provided in Appendix A.2, Liberia’s political unrest encompassed two
civil wars between 1989 and 2003, with the first war taking place between December 1989 and July
1997 and the second war taking place between April 1999 and August 2003. During the 14-year
state of chaos and fear, it is believed that more than 250,000 soldiers and civilians were killed, i.e.,
approximately more than 12% of the 2.1 million population in 1990 (Mama (2014), p. 55).2 Due
to the atrocious and indiscriminate nature of the fighting and human rights abuses (e.g., killings,
looting, property destruction, rape, child recruitment), it is estimated that approximately 500,000
people were internally displaced and another 780,000 sought refuge abroad during the war.3 Many
factors (e.g., limited access to education and health services, severing of family and community
links, concerns over gender-based violence, and absence of job opportunities) discouraged the
displaced populations from returning to their homes after the war ended. Consequently, it took
more than three years for the majority of the internally displaced persons (IDPs) to return or
settle elsewhere since the Accra Peace Agreement was signed in 2003.4 The UN refugee agency
also completed a repatriation program in 2012 that facilitated the return of more than 155,000
refugees by the end of that year (Momodu (2013)).
2Information on the total population is sourced from “World Population Prospects: The 2012 Revision” (http://esa.un.org/wpp/unpp/panel population.htm).
3Information pertaining to the externally and internally displaced persons is drawn from the “2005 UNHCRStatistical Year Book” (http://www.unhcr.org/464478a72.html) and “Liberia: Internal displacement in brief” asof December 2013, Internal Displacement Monitoring Center (IDMC) (http://www.internal-displacement.org/sub-saharan-africa/liberia/summary), respectively.
4The IDP camps were officially closed in April 2006, although this does not necessarily mean that all IDPs hadreturned to their place of origin by this time.
5

Interim Report for Economic Analysis of Political Shocks, IDE-JETRO, FY 2015
2.2 Increase in malaria infection risk
Compared to combatant fatalities during a conflict, far more civilians tend to be killed, even after
the conflict is over (Collier et al. (2003)).5 Such high mortality rates are primarily attributed
to infectious diseases among the IDPs and refugees, and their influence is highly persistent (e.g.,
Ghobarah et al. (2003); Ghobarah et al. (2004)). Of these diseases, malaria is seen as the most
important cause of violence-induced mortality and morbidity for both displaced populations (e.g.,
Nafo-Traore and Nabarro (2005); Rowland and Nosten (2001)) and host societies (e.g., Baez (2011);
Montalvo and Reynal-Querol (2007)). While other diseases of acute epidemic potential (e.g.,
cholera, shigella dysentery, meningitis, and yellow fever) also play a role, their influence is usually
short lived (Salama et al. (2004)).6
Conflict is expected to greatly raise the risk of malaria infection. To avoid areas of military
operations, for instance, people are forced to hide in and/or walk through unknown rural areas
and forests widely inhabited by malaria-infected mosquitoes. These hiding and mobile populations
also have difficulty exploiting typical risk-reducing strategies, such as staying inside a house at
night, keeping doors and windows closed, cutting the grass, burning incense/firewood, avoiding
unnecessary in-house water storage, and sleeping under bed nets.
In the Liberian war, fleeing populations often hid in swamps, bushes, and mountains for days,
weeks, and even months in response to gunfire, government warnings or rumors of an assault, and
surprise attacks (Foster et al. (2009)). This hiding was usually followed by internal displacement
within Liberia and/or refuge in other countries. The cycle of fighting, hiding, and relocating was
repeated during the long years of the conflict. In addition to these behavioral factors, deteriorating
ecological conditions during the war (e.g., burned villages and inadequate sewage treatment) might
also have enhanced the incidence of malaria.
2.3 Maternal malaria infection
Among adults, it is well acknowledged that pregnant women are at considerably high risk of con-
tracting malaria.7 Several insightful review and survey articles exist on this topic (e.g., Desai et al.
5Collier et al. (2003) provide a succinct summary of the adverse effects of civil war from several perspectives. Inaddition to the aspects of mortality and morbidity explained here, they also discuss the waste of productive resources,destruction of infrastructure, capital flight, loss of social capital, adverse political legacy, and psychological damage.
6Salama et al. (2004) also drew invaluable lessons from epidemiological studies on complex emergencies in thelast decade of the 20th century. Based on their study, the major causes of mortality during the time of crises arefundamentally the same as those typical in developing countries (e.g., diarrhea, respiratory infection, and malaria),although such risks greatly increase due to the conflict. Malaria control is one of the most important health-relatedpolicy concerns in emergency settings (WHO (2005)).
7Other high-risk groups include infants, children under five years of age, HIV/AIDS patients, non-immunemigrants, mobile populations, and travelers (http://www.who.int/malaria/areas/high risk groups/en/).
6
Interim Report for Economic Analysis of Political Shocks, IDE-JETRO, FY 2015
(2007); Dorman and Shulman (2000); Lagerberg (2008); Steketee et al. (2001); Uneke (2007b)).
Based on Desai et al. (2007), it is estimated that at least one in four women in malaria-endemic
areas of Africa is infected with the disease at the time of childbirth. While adult females may
be asymptomatic because of immunity acquired in childhood, their immune system still becomes
weaker in pregnancy, particularly for primigravidae (Schantz-Dunn and Nour (2009)).
Maternal anemia is one of the major complications of this infectious disease in sub-Saharan
Africa. Desai et al. (2007) estimated that approximately 26% of severe anemia among pregnant
women can be attributed to malaria.8 Pregnant women also suffer from a serious anemic burden
due to the sequestration of the parasites in the placenta (placental malaria). As one recent estimate
shows, in the absence of pregnancy-specific interventions, approximately 41.2% of total pregnancies
leading to live births would have contracted placental malaria at some stage during pregnancy in
the high-transmission spectrum in Africa (Walker et al. (2014)). In Africa, co-infection with HIV
could also strengthen the unfavorable association of malaria with maternal anemia (and possibly
fetal development) because the virus impairs the mothers’ immune system, which controls the
malaria parasitemia (e.g., Brentlinger et al. (2006); Kuile et al. (2004); Steketee et al. (1996));
however, the prevalence of HIV/AIDS in Liberia was estimated at 1.5% and 1.9% based on the
2007 and 2013 DHS reports, respectively, which are substantially lower than the corresponding
rates in eastern and southern African countries.
2.4 Influence of maternal malaria infection on fetal growth
It is widely accepted that pregnant women infected with malaria are prone to a variety of adverse
perinatal outcomes, including miscarriage, stillbirth, intrauterine growth retardation, premature
delivery, and low birthweight (e.g., Uneke (2007c)).
Among these, low birthweight (i.e., a weight at birth less than 2,500 g) is one of the most
important factors that affect neonatal and infant deaths.9 Based on Guyatt and Snow (2001,
2004), in malaria-endemic areas in Africa, babies born to mothers having an infected placenta
are twice as likely to exhibit low birthweights than those born to uninfected mothers, and these
low birthweights may be responsible for approximately 5.7% of the infant deaths per year in this
region.10
8This symptom is attributed to several factors, such as direct destruction of parasitized erythrocytes (i.e., hemol-ysis), immune responses shortening red cell survival, defective cell production, and hypersplenism.
9Another possible factor that links maternal malaria infection with infant mortality is congenital malaria (i.e.,transplacental transmission of malaria to the fetus). This may result from the materno-fetal circulation or directpenetration through the chorionic villi. Previously, it was presumed that congenital transmission was rare, butmore recently, cases have been increasingly reported (e.g., Menendez and Mayor (2007); Uneke (2007a)). More-over, malaria infection in pregnancy during wartime may increase maternal stress, which would further reduce thebirthweight of neonates (Camacho (2008); Mansour and Rees (2012)).
10It is also estimated that approximately 60―80% of newborn deaths are cases of low-birthweight neonates (Lawn
7
Interim Report for Economic Analysis of Political Shocks, IDE-JETRO, FY 2015
While the underlying biological pathways are still subject to debate, maternal malaria infection
is thought to reduce the birthweight of newborns by affecting gestational length and/or causing
fetal growth restriction (or a combination of these factors). For example, maternal active immune
responses (carrying antibodies, cytokines, and macrophages) induced by malaria-parasitized pla-
centa may stimulate early labor, although establishing this theory requires more careful research
(e.g., Guyatt and Snow (2004); Menendez et al. (2000)).
In contrast to the influence of malaria infection on prematurity, its relationships with intrauter-
ine growth retardation are better understood. As reviewed in more detail in Appendix A.4, Umbers
et al. (2011) provided a good summary on the underlying pathological factors that link placental
malaria with fetal growth restriction.
Finally, whether due to malaria or not, it should also be noted that maternal anemia is also
expected to reduce neonates’ birthweight (e.g., Levy et al. (2005)).
2.5 Influence of health system impairment on weak infants
Low-birthweight children are vulnerable to a range of infectious diseases, such as pneumonia,
diarrhea, and malaria, all of which raise the risk of infant mortality (e.g., Lawn et al. (2005); Lawn
et al. (2010); Liu et al. (2015)). Compounding this, the wartime impairment of the health system
is expected to increase this already-raised mortality risk.
Due to the near-total destruction of Liberia’s infrastructure (e.g., road networks, water and
power supplies) and the looting of clinics and medicines, more than half of Liberia’s 550 pre-war
health facilities were deemed non-functional as of the end of 2003 (Lee et al. (2011)). In addition,
the number of public health sector employees also shrank from 3,526 in 1988 to 1,396 in 1998
because many doctors and nurses died or fled during the conflict (Varpilah et al. (2011)). It is also
estimated that nine out of 10 doctors left the country (Downie (2012)), leaving only 30 physicians
serving a population of 3 million at the end of the war (Kruk et al. (2010)). The brutal conflict
also deprived training institutions of appropriate resources to train health care workers (Duale
and Mataya (2007)). While some humanitarian aid agencies provided health services during the
fighting, most of the population had little or no access to such services (Kruk et al. (2010)), par-
ticularly in rural areas (National Transitional Government of Liberia (2004)). While the available
evidence is limited, the wartime chaos might have also made it difficult for the majority of Liberi-
ans to attempt self-treatment and/or traditional remedies that might have been common health
practices before the conflict. In fact, based on the author’s field interviews made with Liberians
in Buduburam refugee settlement in Ghana, the pre-war access to formal health services was lim-
et al. (2005)). See Appendix A.3 for a review of factors affecting infant mortality in general.
8
Interim Report for Economic Analysis of Political Shocks, IDE-JETRO, FY 2015
ited in remote areas, and people often used to take traditional medicines (e.g., herb) to self-treat
malaria infection.11
3 Empirical strategy
During the conflict, the fleeing populations might have contracted malaria either during their
travels or while residing in a temporary settlement.12 Thus, this scenario would be ideal to assess
the significance of the disease risk undertaken by the war survivors throughout the war. However,
the current study cannot take this approach because it is difficult to trace their escape routes.
Alternatively, this study therefore attempts to estimate the wars’ influence on children born
to mothers residing in malaria-endemic areas at the beginning of the conflicts. Compared to
pregnant mothers hiding in and/or escaping from less-endemic areas, those doing so in and/or
from disease-prone areas must have been exposed to greater infection risk. In addition, at the time
of the war, infants must have suffered from the destruction of the country’s health system, and this
problem must have been more serious in areas of high malaria transmission than in areas of low
transmission. This is because it is expected that children from the former area had low birthweights
due to their mothers’ infections in pregnancy, and therefore, they were more vulnerable to a number
of deadly infectious diseases. These infectious diseases might have included malaria, which is also
more prevalent in high endemic areas. This study jointly tests these assumptions and the mortality
consequences while estimating an intent-to-treat (ITT) effect of malaria infection risk in pregnancy
that increased in the mothers’ original places of residence at the time of the war.
3.1 Specification
3.1.1 Empirical model
To estimate the aforementioned effect, this study primarily uses data drawn from two rounds
(2007 and 2013) of the Demographic and Health Surveys (DHS) in Liberia that aimed to collect
representative data on the population, health, and nutrition of females of reproductive age (15―
49). While the DHS data allow different units of analysis (e.g., household, women, children, etc.),
11After getting a research permit from the Ghana Refugee Board in Accra, the author conducted a semi-structuredquestionnaire-based survey in Buduburam in February 2016. While the respondents were not randomly selected,in this survey, two males and five females originating from five counties (Grand Bassa, Grand Gedeh, Maryland,Montserrado, Sinoe) were individually interviewed, and the duration of each of those interviews was approximately30 minutes. The interviews collected information on the respondents’ brief life-history since they left Liberia andtheir preventive and treatment strategies against malaria before, during, and after the war.
12Related to this point, once malaria-infected mosquitoes feed on human blood in refugee camps, the disease tendsto become epidemic due to the concentration of the populations. Furthermore, the camps are also often located onmarginal land prone to vector breeding (e.g., near water sources) (Rowland and Nosten (2001)).
9

Interim Report for Economic Analysis of Political Shocks, IDE-JETRO, FY 2015
the main empirical analysis focuses on data pertaining to children to whom respondents gave birth
in the past, i.e., the mother’s full history of births (up to 20 entries).13 In the data set, the birth
year of the investigated children ranges from 1969 to 2013.
More precisely, for a child i conceived in a calendar month s of a year t by a mother k currently
residing in a community j, this study exploits a linear probability model (LPM) and estimates
ystikj = α1 + α2wstikj ·mj + α3x
stikj + α4x
stkj + vj + δs + ρt + ϵstijk, (1)
whereby ystikj takes a value of one if the child died within Z months after birth and zero otherwise;
mj measures the risk of malaria infection in a community j; wstikj is an indicator equal to one
if the month s in the year t of conception belongs to periods following the outbreak of the war
(i.e., after December 1989); the vectors xstikj and xst
kj contain controls specific to the child (e.g.,
gender, birth order, single birth indicator, mothers’ age at birth) and the mother (e.g., education,
religion), respectively14; vj is a dummy for each community (620 communities; see Figure 1 for
the positions); δs and ρt are fixed effects of the month- and year-of-conception, respectively; and
ϵstijk represents a stochastic error. The community-fixed effects are expected to control for all time-
invariant geographic and climate characteristics specific to each community. The fixed effects of
the year-of-conception control for global time-trends that affected mortality between areas of high
and low malaria risks in a similar manner, such as economic sanctions (e.g., Cortright et al. (2000),
pp. 189-193).
While the periods following the outbreak of the war can be broken down into four different
categories (first war, ceasefire, second war, and post-war), the benchmark analysis avoided this
disaggregation for two reasons. First, the ceasefire and end of the war do not necessarily mean
the economic and relevant health situation immediately recovered (Kruk et al. (2010); Lee et al.
(2011); Varpilah et al. (2011)). Second, the disaggregation did not reveal a noticeable difference
in the estimated coefficients across those periods, as will be discussed later.
Regarding the malaria infection risk, this study uses an index sourced from the Malaria Atlas
Project (Gething et al. (2011)) that ranges from zero to one. This index estimates the 2010
endemicity levels of P.falciparum, which is a major plasmodium species in Liberia (WHO (2013),
p. 149) as the proportion of the infected populations aged 2―10 years.15 Figure 1 provides a
13The selection of 20 entries is due to a restriction imposed by the DHS. In the data set exploited in this study,no births more than 17 were recorded.
14Information on respondents’ ethnicity is not available in the Liberian DHS data.15More precisely, this index averages a monthly proportion of children aged 2―10 years in the general population
who are infected with P.falciparum at any one time over the 12 months in 2010. The infected population is estimatedby exploiting data drawn from Plasmodium falciparum parasite surveys and Bayesian model-based geostatis-tics. The data can be downloaded from the Malaria Atlas Project (http://www.map.ox.ac.uk/browse-resources/endemicity/Pf mean/world/).
10

Interim Report for Economic Analysis of Political Shocks, IDE-JETRO, FY 2015
graphical representation of the index at each location (approximately 1 km2) and the position of
the DHS communities. In the empirical analysis, this study assigned the value of a raster point to
each DHS community in its closest proximity in this endemicity map.
In contrast to standard nonlinear models such as logit and probit, the LPM enables coefficients
on the interaction term to have a straightforward interpretation (Ai and Norton (2003)). To avoid
a censoring problem, the analysis also exploits data on children born more than Z months before
the month of the DHS interview. The standard errors are robust to heteroscedasticity and are
adjusted for clustering on a community.
[Here, Figure 1]
3.1.2 Measurement issues
By exploiting the surrounding malaria endemicity of each DHS community as a measure of the in-
fection risk that affected respondents during the war, the empirical strategy implicitly assumes that
all the displaced populations returned to their original places of residence after the war. However,
the assumption made here allows for the possibility that displaced populations resettled elsewhere
in Liberia but might not have been widespread enough to invalidate the empirical analysis. Based
on the 2007 DHS, at least 55% of the respondent females were identified as permanent residents of
the surveyed community (corresponding information was not available in the 2013 DHS). As shown
later, the main findings of this study are robust to utilizing this sub-sample. Moreover, it is also
noted that the remaining females include two groups: (1) those who were not permanent residents
but who settled in the DHS community before the war and (2) young respondents who must have
recently relocated due to patrilocal marriage into the surveyed community in the vicinity of their
birthplaces.
Relatedly, this study also needs to assume that malaria endemicity has not noticeably changed
over the last two decades. However, the situation relevant to malaria control in sub-Saharan
Africa has remarkably improved since the turn of the 21st century, as reflected in the Roll Back
Malaria initiative launched in 1998 and the Millennium Development Goals established in 2000. In
addition, the Liberian Government established a National Health Policy in 2007 that planned to
deliver a basic package of health services to citizens without charge, including services intended to
control communicable diseases such as HIV/AIDS and malaria, thus making the above assumption
somewhat doubtful.16
However, based on Noor et al. (2014) (Figure 6), the mean Plasmodium falciparum parasite
rate (PfPR) was almost identical between 2000 and 2010 in Liberia. In addition, this global16The package also included emergency care, maternal and newborn health, and mental health care (Downie
(2012)).
11

Interim Report for Economic Analysis of Political Shocks, IDE-JETRO, FY 2015
concerted campaign of malaria control only reached peak intensity after 2010 (Bhatt et al. (2015)).
Moreover, the corresponding report of the 2007 DHS (p. 158) also refers to a huge gap between a
national target within the national malaria policy and the present coverage of relevant interventions.
It appears to take more time for those initiatives to achieve a significant improvement in this
country (Kruk et al. (2010); Lee et al. (2011)).
For every child born to a female respondent, the DHS data contain information on year and
month of birth. Given the presumption that a mother became impregnated nine months before
delivery (e.g., January for children born in October), this study utilizes the estimated month of
conception. In areas of high malaria transmission in Africa, the immunity that women acquire in
childhood prevents the febrile episodes that often cause premature deliveries (Desai et al. (2007), p.
97). This medical knowledge may somewhat alleviate concerns over measurement noise pertaining
to the timing of conception.
3.2 Identification
3.2.1 Parallel trend assumption
As seen from the specification (1), this study compares changes in infant mortality before and after
the outbreak of the war between areas of high and low malaria transmission. The key identification
assumption of this differences-in-differences (DID) estimation is that in the absence of the conflict,
infant mortality would have followed parallel trends for children conceived in both disease-prone
and remaining areas.
Exploiting the median value of the malaria endemicity index as the criteria of sample separation,
Figure 2 plots the fraction of children who died within one year after birth by year of conception.
Vertical lines indicate the timings of (1) the first war’s outbreak (December 1989), (2) start of the
ceasefire (August 1997), (3) beginning of the second war (April 1999), and (4) end of the second
war (September 2003), respectively. The post-1977 fraction was presented in the figure because
the yearly number of children conceived before 1977 was small (less than 100); thus, the estimated
mortality rate is likely to be imprecise.
First, a remarkably similar trend of infant mortality between malaria-endemic and remaining
areas was observed both before and after the outbreak of the war. Based on a more formal test
described in Appendix B, the mortality trend was not significantly different between the high and
low endemic areas of malaria parasites before the fighting took place. This finding lends great
credit to the key identification assumption of the DID approach.
Second, while the pre-war mortality rate of children conceived in malaria-prone areas was lower
than the corresponding rate in less endemic areas, after the war’s outbreak, the mortality rate
12

Interim Report for Economic Analysis of Political Shocks, IDE-JETRO, FY 2015
in the former areas reached the levels seen in the latter areas. This finding suggests unfavorable
health consequences of wartime pregnancy in high-infection-risk areas, which the present study
aims to identify.
In addition to these main findings, it may deserve repeating that before the war, the one-year
mortality rate was higher in areas of low malaria endemicity than in areas of high endemicity. This
is possible because the immunity women acquire by the time of pregnancy tends to be weak if they
grew up in areas of low malaria transmission. In such areas, it is perceived that malaria infection
during pregnancy results in more serious symptoms, including deaths of the mothers and fetuses,
compared to infections occurring in endemic areas (Desai et al. (2007), p. 96).
Finally, in areas of both high and low malaria endemicity, mortality levels have declined over the
last two decades. As the corresponding report of the 2007 DHS indicates, this decline possibly stems
from several organizational initiatives that made at least some progress in improving maternal and
child health in this country, particularly in post-conflict periods (e.g., immunization programs,
malaria prevention initiatives, suspension of user fees in all health facilities) (Kruk et al. (2010);
Lee et al. (2011)). On the other hand, as noted in the 2007 and 2013 DHS reports, selective
omission of childhood deaths from the data set may also explain the downward trend. Two major
reasons account for this selection. First, respondents often fail to report pregnancies that did not
result in normal delivery (e.g., miscarriage, stillbirth) and/or resulted in deaths early in infancy.
Second, in the DHS data, only female respondents who survived the civil war (and returned to
Liberia if the war had displaced them to other countries) were interviewed. If the violence increased
the likelihood of unsuccessful pregnancy and/or females in good health in wartime predominantly
constituted such survivors, these selection mechanisms lead to underestimation of the mortality
rate during the war.17
[Here, Figure 2]
3.2.2 Potential underestimation
Despite the considerable support provided for the parallel trend assumption, however, it is still
expected that this study underestimates the adverse influence of malaria infection risk for many
reasons. First, women originally residing in areas of low malaria endemicity have less immunity
to malaria. Therefore, whether by escaping to malaria-endemic forests or by coming into contact
with people fleeing disease-prone areas, they tend to show higher propensity to contract the disease
and undergo more serious birth outcomes. As a result, it appears that the mortality of children
17The gradual decline in mortality levels is also possible provided that such wartime deaths not recorded in theDHS started with the weakest mothers and infants and slowly moved to stronger ones.
13

Interim Report for Economic Analysis of Political Shocks, IDE-JETRO, FY 2015
born to such women becomes high. On the other hand, the mortality of children born to mothers
originating from areas of high endemicity would tend to be low for the same immunological reason.18
Somewhat relatedly, people living in malaria-endemic areas also tend to have sickle cell genes that
make them malaria resistant (e.g., Livingstone (1958); Piel et al. (2010)). This may also result in
underestimation of the mortality consequence in endemic areas.
Second, the timing of conception may not be seen as strictly exogenous. The estimated timing
based on month of birth unavoidably includes noise. In addition, wartime childbearing (particularly
in malaria-endemic areas) might have been possible only when parents could guarantee the safety
of nursing the neonates, which reduced the risk of mortality. In the aforementioned field survey
in Buduburam, the author identified one elderly Liberian refugee that midwifed another refugee
during the wartime travel, and asked for the neighboring villagers’ support provided for the mother
after the childbirth.
Third, as noted in subsection 3.1.2, the measured malaria endemicity also suffers from a mea-
surement concern due to the post-war resettlement issue of the displaced populations, which may
attenuate the true effects of interest (as long as the measurement errors are classical).
Moreover, the aforementioned omission of childhood deaths from the DHS data may also play
a role. If unsuccessful pregnancies were more pronounced in malaria-endemic areas than in low en-
demic areas during the conflict or if the wartime health condition of the female survivors was better
in malaria-prone areas compared to that in low malarial transmission areas, the DID estimation is
likely to underestimate unfavorable consequences for child survival.
Finally, the war might have increased malaria infection risk in pregnancy even in low endemic
areas of malaria parasites. For any areas having malaria infection risk, the relevant counter-factual
should have been those having no such risk, which are not exploited in the current study.
After showing the main estimation results, this study will provide evidence suggesting the
potential underestimation of the DID estimate in subsection 5.6.
18Related to this point, as the war became protracted, malaria parasites might have been transmitted from highto low endemic areas (e.g., from rural immune to urban non-immune populations) due to great migration whilereducing the mortality gap between the two areas. This is an important empirical concern because most IDPssought refuge in Monrovia, the capital (Nilsson (2003)), whereby the mean value of the malaria endemicity indextakes a value of 0.28 compared to the overall average of 0.42 in the data set. One possible way to investigate thepresence of such spillover effects is to compare changes in mortality for children conceived before and after thewar’s outbreak between low malaria-endemic areas in Liberia and similarly malaria-endemic areas unaffected by thewar. However, it is difficult to find such comparison areas because all the neighboring countries (i.e., Cote d’Ivoire,Guinea, and Sierra Leone) were influenced by their own conflicts and/or an influx of refugees fleeing from theirneighbors during the periods of investigation.
14
Interim Report for Economic Analysis of Political Shocks, IDE-JETRO, FY 2015
4 Data
This study primarily uses the repeated cross-sectional data drawn from the Liberia Demographic
and Health Surveys in 2007 and 2013, which were designed to provide nationally representative
information in the fields of population, health, and nutrition (e.g., marriage, fertility, and child
health).19 The interviews were conducted from December 2006 to April 2007 for the 2007 survey
and from March to July 2013 for the latter round, respectively.
In both rounds, a two-stage sample design was exploited. The first stage of the respective round
selected communities (clusters) from enumeration areas of the 1984 and 2008 Population Census,
followed by the second stage, which involved a systematic sampling of 25 (2007 round) or 30 (2013
round) households in each community. The survey team aimed at interviewing all women aged
15―49 years in each selected household, enabling the DHS to eventually contact 7,092 and 9,239
female respondents residing in 298 and 322 communities in the respective rounds. Exploiting the
history of children born to all the female respondents (up to 20 births), the current research uses
the children as the main analytical unit.
4.1 Immunity, infection risk, and mortality
As Figure 2 demonstrated, before the war, the one-year mortality rate was higher in less endemic
areas than in high endemic areas while highlighting the weak (strong) immunity acquired by
women who grew up in the former (latter) areas. Before providing summary statistics, this section
describes in more detail the relationships between immunity, infection risk (measured by malaria
endemicity), and mortality because it may facilitate an understanding of the effects this study aims
at identifying.
After separating the sample children into 10 quantile groups based on the level of malaria
endemicity in their mothers’ residential areas, Figure 3 plots the one-year mortality rate of children
conceived before and after the outbreak of the first war, respectively. Two findings are notable.
First, the relationship between the endemicity and mortality is non-monotonic for both sampled
periods. This is expected because at very low levels of endemicity, the infection risk is too low to
raise the infant mortality level even though pregnant mothers’ immunity is weak. On the other
hand, at the high end of the malaria transmission spectrum, the mothers’ strong immunity can
prevent infant mortality even if the infection risk is high. Consequently, the mortality rate is the
highest for intermediate levels of endemicity. Notably, while the relationship between levels of
infection risk and mortality is non-monotonic, this does not necessarily mean that changes in risk
19Data and relevant documents were publicly available from http://dhsprogram.com/what-we-do/survey/
survey-display-271.cfm and http://dhsprogram.com/what-we-do/survey/survey-display-435.cfm for the 2007and 2013 rounds, respectively.
15

Interim Report for Economic Analysis of Political Shocks, IDE-JETRO, FY 2015
and mortality are also non-monotonic. As seen in the subsequent empirical analysis, the increase
in infection risk induced by the war raised the rate of infant mortality in a monotonic manner.
Second, at all endemicity levels, the mortality rate declined after the first war began. This
corresponds to the picture in Figure 2 showing that mortality levels have declined over the last
two decades in both high and low endemic areas of malaria parasites. The DID approach attempts
to show that this decline in mortality levels is smaller in high endemic areas than in low endemic
areas, i.e., the war-induced infection risk increased the mortality rate in high endemic areas more
evidently compared to that in low endemic areas.
[Here, Figure 3]
4.2 Summary statistics
For children conceived both before and after the outbreak of the war, Table 1 provides a description
of several selected variables with checks on the equality of the mean between two groups charac-
terized by the endemicity of P.falciparum. The sample separation was made based on the median
value of the endemicity index corresponding to their mothers’ (i.e., the DHS respondents’) resi-
dential community. Information on malaria endemicity was provided by the Malaria Atlas Project
(Gething et al. (2011)).
A few observations are worth noting here before proceeding with the empirical analysis. First,
before the war, the one-year mortality rate was significantly higher in areas of low malaria transmis-
sion compared to the corresponding rate in malaria-endemic regions, but this difference disappeared
after the war began. Second, in both high and low endemic areas, mortality rates have declined
over time. In addition to these observations, which are consistent with the findings provided in
Figure 2, malaria parasites were more prevalent in rural (and likely forested and mountainous) ar-
eas of high altitude, which are intuitive findings because such environmental characteristics make
the parasite’s development easier.
While this information will be explained in more detail and used in the analysis presented in
subsection 5.3.3, this study also exploited a map of monthly mean temperatures (multiplied by
10 ◦C) and precipitation amounts (mm) between 1950 and 2000 provided by the “WorldClim -
Global Climate Data” (Hijmans et al. (2005)) and assigned each DHS community the value of
a raster point at its closest proximity. Based on these data, malaria-endemic areas show lower
temperatures (probably due to high altitudes) with lower amounts of rainfall than less malaria-
endemic areas.
This study also calculated the number of battle events that occurred within a 25-km radius
from each DHS community based on information sourced from the Armed Conflict Location and
16

Interim Report for Economic Analysis of Political Shocks, IDE-JETRO, FY 2015
Event Database (ACLED).20 ACLED is a well-known data set used in the scientific analysis of
conflict (e.g., Adhvaryu and Fenske (2014); Dabalen and Paul (2014)), and it contains information
on specific dates and locations of political violence from 1960 to 2004, types of events, and groups
involved (Raleigh et al. (2012)). In Liberia, 265 battle events that occurred between April 1980
and July 2003 were recorded in this data set (see Figure A.1 for battle locations). As the summary
statistics reveal, the fighting occurred more intensively in less malaria-endemic areas of lower-
altitude (more urban) land. This information will be exploited in the empirical analysis conducted
in subsection 5.4.1.
[Here, Table 1]
5 Estimation results
5.1 Main results
The estimation results of one-year mortality (Z = 12) of the specification (1) are reported in
Table 2. The analysis in column (a) separated the sample into 10 categories based on the value of
malaria endemicity, and the corresponding indicators for each category are included (the reference
group is the lowest percentile). Based on the result, wartime pregnancies in the groups of 60―100
percentiles of malaria endemicity experienced significantly increased one-year mortality rates by
approximately 4―5 percentage points. The estimation in column (b), which alternatively exploited
an indicator for the highest 50 percentiles of malaria endemicity, also revealed a 3% increase in the
mortality rate in the corresponding areas.
As the one-year mortality rate of children conceived before the war was approximately 17%
based on the exploited data, the 3-percent increase in infant mortality accounts for about 17.6% of
the pre-war mortality. In addition, the estimated mean proportion of the infected population aged
2―10 years (i.e., values of malaria endemicity index) is about 0.34 and 0.49 in areas belonging
to the lowest and highest 50 percentiles of malaria endemicity, respectively. By combining these
numbers with the 17.6% change in the mortality rate, therefore, it can be determined that the war
might have caused a 0.44-percent increase in the infant mortality rate in response to a one-percent
increase in the infection risk measured by the infected population.
It is difficult to speculate on this magnitude in terms of the number of infants killed by maternal
malaria infection during the war and to find estimates comparable to this elasticity. However, the
impact size is non-negligible, considering the presumption that the estimated coefficient does not
20The data and relevant documents are freely available from https://www.prio.org/Data/Armed-Conflict/
Armed-Conflict-Location-and-Event-Data/.
17

Interim Report for Economic Analysis of Political Shocks, IDE-JETRO, FY 2015
necessarily capture the full effect of maternal malaria infection. This is because not all women
residing in malaria-endemic areas may contract the disease. Since the infection probability is
typically less than unity, the treatment effect of malaria infection is still likely to be larger than
the ITT estimate (i.e., treatment effect of malaria infection risk) shown in the present analysis.
The exercise in column (c) replaced the dummy for the upper 50% quantile of malaria endemic-
ity with the continuous value of the index. Exploiting the continuous measure also confirmed the
view that after the war, children conceived by mothers residing in malaria-endemic areas more
clearly lost their life within one year after birth compared to those conceived by mothers in low
endemic areas.
By including the fixed effects of year-of-conception, the previous estimations controlled for all
time-varying factors that affected areas of high and low malaria endemicity in a similar manner.
However, it is possible that the war noticeably changed the health-related infrastructure across
areas having different levels of malaria endemicity while biasing the estimated α2. To mitigate
this concern to some extent, this study grouped the sample data into 66 categories based on
administration areas of “districts” (see Figure A.1 for the boundaries) and in the analysis of
column (d) in Table 2, controlled for a time trend (over 40 years) specific to each district.21 The
exercise exploiting the continuous measure of malaria endemicity yielded similar estimates to those
obtained in column (c).
To alleviate the potential bias attributed to possible pregnancy cases that were not reported to
the DHS team, the analysis in column (e) included an indicator equal to one if a mother had ever
experienced a pregnancy that terminated in a miscarriage, abortion, or stillbirth. This additional
control left the implications obtained from the previous estimations almost unchanged.
As discussed in subsection 3.2.2, wartime childbearing might have been possible only for those
with particular parental characteristics (e.g., health safety). To control for such (only) time-
invariant characteristics, this study replaced the previously exploited covariates relevant to mothers
and community-fixed effects with mother-fixed effects and then re-estimated the specification (1).
Column (f) reports the estimation result, which again highlights the adverse mortality effect of
wartime pregnancy associated with high malaria infection risk.
Another empirical challenge noted in subsections 3.1.2 and 3.2.2 is that the respondents might
have resided in different locations from the current DHS communities because the crisis induced
massive population displacement. In this case, the measured malaria endemicity includes some
21It was not possible to identify a district corresponding to each community from the DHS data alone. To achievethis purpose, therefore, this study matched a community’s GPS latitude/longitude coordinates with a map of Liberiasourced from DIVA-GIS (http://www.diva-gis.org/datadown). Consequently, the communities were categorizedinto 65 districts plus one group for which the ArcGIS failed to identify the corresponding district. The analysis incolumn (d) in Table 2 included the unidentified group as one district because it constituted only 3% of the sample.
18
Interim Report for Economic Analysis of Political Shocks, IDE-JETRO, FY 2015
noise. To determine whether previous findings were sensitive to this concern, two exercises were
performed. First, this study exploited data pertaining only to children born to mothers who were
identified as permanent residents of the surveyed community in the 2007 DHS and re-estimated
the specification (1) in column (g). Data for the 2013 DHS were not exploited in this estimation
because the relevant information was not available in that round. Second, during the conflict, most
IDPs headed towards the capital, Monrovia (Nilsson (2003)). In addition, Liberian refugees were
repatriated to the capital under a program run by the UN refugee agency after the war. Because
some of those people preferred to stay there instead of returning to their original homes in the post-
war periods, the current residents of the capital area must show a great tendency to have resided
in different places during the years of the conflict. This is particularly true if they no longer had
any relatives living in their original communities (Jesuit Refugee Service (2007); Omata (2012)).
Given this likelihood, the other exercise conducted in column (h) excluded from the estimated
sample those currently living in the Greater Monrovia District. As is evident from the estimation
results, the additional analyses based on these sub-samples of the data yielded similar implications
to that obtained before.22
[Here, Table 2]
5.2 Robustness checks
5.2.1 Survival lengths
The specification (1) was estimated for different lengths of child survival by varying the value of
Z; Figure 4 reports the estimated α2 with 95% confidence intervals. The left-hand panel uses the
indicator for the upper 50% quantile of malaria endemicity, in contrast to the right-hand panel,
which exploits the continuous value of the index. Two interesting findings emerged. First, the
unfavorable effects of wartime pregnancy in malaria-endemic areas gradually increased as this
study examined longer survival periods, as can particularly be seen in the estimations based on the
indicator of malaria endemicity (left-hand panel) as well as for analyses of survival periods equal
to or less than 12 months (i.e., Z ≤ 12). Second, the mortality effects became more statistically
significant as the examined survival periods grew longer than six months.
22Admittedly, limiting analytical attention to sub-samples possibly introduces selection bias because the choice ofresidential places is endogenous. In the present context, the permanent residents might have resided in less conflict-affected areas. However, regressing a dummy for children conceived by mothers identified as permanent residentson the number of battle events that occurred within a 25-km radius from DHS communities as well as fixed effectsof year-of-conception and of districts yielded a coefficient that was insignificantly different from zero. Replacing thenumber of battle events with malaria endemicity or simultaneously including these variables in similar regressionsalso identified insignificant relationships between these variables and the outcome dummy.
19

Interim Report for Economic Analysis of Political Shocks, IDE-JETRO, FY 2015
Presumably, children born to a mother infected with malaria have low birthweights and thus
are vulnerable to several infectious diseases. Although antibodies passed from a mother to the
fetus through the placenta still protect newborns, in humans, such maternal passive immunity
wanes over six to 12 months after the child’s birth (e.g., Niewiesk (2014), p. 2). Therefore, the
infant mortality rate might have gradually increased as the vulnerability of such low-birthweight
children became more evident.
[Here, Figure 4]
5.2.2 Non-linear empirical models
By exploiting probit and Cox proportional hazard models, this study also checked whether the
aforementioned findings were robust to non-linear empirical models (and controls), as detailed in
Appendix C.1. The relevant exercises provided support for the findings provided by Table 2 and
Figure 4.
5.2.3 Trend of the mortality effects
In column (a) in Table 3, this study interacted the previously exploited indicator for areas of high
malaria endemicity (50―100 percentiles) with four different periods of conception, namely, first
war, ceasefire, second war, and after the end of the war, and estimated a version of specification
(1). Compared to the inter-war periods, it is expected that people have lower infection risk in
the post-war periods. However, the results show significant mortality effects even after the war
ended. Exploiting a continuous measure of malaria endemicity in column (b) also did not affect
this finding.
This finding is possible because the ITT interpretation of mortality consequences includes the
influence of limited access to pre-natal and post-natal care. While the 2007 National Health
Policy has contributed to progress in providing basic health services, Kruk et al. (2010) noted that
the ambitious target set by the government was unlikely to be achieved by 2010 based on their
study exploring the availability of essential health services in 2008. They attempted to survey a
“typical” rural population and showed that just one-quarter of their respondents had access to
basic emergency obstetric care, while even fewer obtained the integrated management service of
childhood illness.23 The overall service quality is also low, with long travel times required at the
nearest health facilities (Lee et al. (2011)), long waits at clinics, few available medicines, impassable
dirt roads (particularly in the rainy season), enormous rural―urban disparities, and so on (Downie
(2012)).
23The integrated management of childhood illness seeks to prevent deaths from pneumonia, malaria, and diarrhea.
20

Interim Report for Economic Analysis of Political Shocks, IDE-JETRO, FY 2015
On the other hand, the Ministry of Health and Social Welfare has also attempted to increase the
size and capacity of human resources for health, and the number of health workers greatly increased
from 2006 to 2010 (Varpilah et al. (2011)). Whether due to this increase or not, it may deserve
mentioning that the mortality effect has shown a declining tendency starting with conceptions
occurring in 2009, as seen in Figure 5. This figure further disaggregated periods following the
outbreak of the first war and reported the estimated α2 (with 95% confidence intervals) specific to
each year of conception.24
[Here, Table 3 and Figure 5]
5.2.4 Alternative measures of malaria infection risk
In Appendix C.2, this study also checked whether the main findings were robust to the exploitation
of alternative estimates of malaria endemicity provided by Bhatt et al. (2015). The key implications
remained unchanged.
5.3 Threats to interpretation
5.3.1 Conception or birth?
One concern regarding the previous findings is that the unfavorable mortality effect may be at-
tributed to malaria infection occurring in infants themselves in malaria-endemic areas because the
current research estimated the timing of conception based on the month of birth.
To mitigate this concern, this study replaced wstikj in the specification (1) with an indicator equal
to one if the child was born after the outbreak of the war and then re-estimated the equation. If the
present concern is true, this alternative indicator will serve as a more accurate measure of factors
driving the unfavorable health consequence; therefore, it is likely to identify greater influences on
the infant mortality than the wstikj did.
The estimation results exploiting a dummy variable for the upper 50% quantile and continuous
measure of malaria endemicity were reported in columns (c) and (d) in Table 3, respectively.
Compared to the estimation results presented in Table 2, the adverse mortality effect is attenuated
and its statistical significance is weak, suggesting that the timing of conception plays a more
important role in explaining child survival than that of birth. This study also simultaneously
included both the wstikj and alternative indicator (interacted by the measured malaria endemicity)
in regressors and reported the estimation results in columns (e) and (f). Admittedly, exploiting
24In these estimations, children conceived in December 1989 (i.e., the beginning of the first war) were included ina group of those conceived in 1990 for the sake of tractability.
21

Interim Report for Economic Analysis of Political Shocks, IDE-JETRO, FY 2015
two highly positively correlated variables in the same estimation tends to result in overestimating
one parameter and underestimating the other based on the informal statistical guidelines (Williams
(2013)). Nevertheless, the results still highlighted the significance of the timing of conception.
It is also important to note that maternal malaria infection could reinforce an infant’s own
infection because children born to mothers infected with malaria are expected to have low birth-
weights and are therefore vulnerable to several infectious diseases, including malaria. In this case,
the influence of an infant’s own infection (i.e., timing of birth) would include effects of maternal
infection (i.e., timing of conception).
5.3.2 Sexual violence
During the war, acts of sexual and gender-based violence against women and girls were exploited
as weapons of warfare. This raises the issue that children born of these unwanted events might
have been abandoned or killed shortly after birth (e.g., Denov (2015)). If such violence was more
evident in malaria-endemic areas, the previous findings may be consistent with this possibility.25
However, the current study sees this possibility as less likely for several reasons. First, to
the best of the author’s knowledge, such cases of infanticide are not supported by the relevant
qualitative research in Liberian contexts (e.g., Foster et al. (2009); UNFPA (2011)). Second,
as described in Section 4, the fighting was less intense in malaria-endemic areas. Third, if this
alternative interpretation is true, it is likely that newborn deaths will frequently occur during
the immediate months following these births. The gradual increase in mortality rate (based on
the examined periods of child survival) shown in Figure 4 is not compatible with this prediction.
Fourth, this scenario cannot explain the long-term positive selection effect on the health of female
survivors, as discussed in subsection 5.5.
5.3.3 Maternal undernutrition
It is acknowledged that poor nutritional status in pregnancy positively correlates with adverse
birth outcomes, such as low birthweight and preterm delivery (for example, see Abu-Saad and
Fraser (2010) and Villar et al. (2003) for an overview of the relevant observational and exper-
imental studies, respectively). Accordingly, if the malaria-endemic areas were food insecure in
25Recent scientific research has also revealed systematic relationships between climate (e.g., high temperature,high precipitation) and frequency of violence (e.g., Cane et al. (2014); Hsiang et al. (2013)), and subsequent analysesmade in the fifth and sixth columns in Table 5 showed that the significant mortality effect was more pronouncedfor children conceived in rainy seasons. By exploiting data sets of war crimes recorded by the Truth and Reconcili-ation Commission (TRC), which amount to 163,615 cases sourced from 17,160 testimonies (see Table A.12 for thebreakdown), and data sets of battle events drawn from the aforementioned ACLED, this study found some (albeitmarginal) evidence suggesting that human rights violations more frequently occurred in rainy seasons during thetime of conflict (see Appendix E for details of the analysis).
22

Interim Report for Economic Analysis of Political Shocks, IDE-JETRO, FY 2015
wartime, maternal nutritional deprivation may also explain the previous findings.26 Needless to
say, maternal undernutrition increases the risk of morbidity and mortality resulting from malaria
infection; therefore, these two factors may not mutually be exclusive. Nevertheless, this concern
still deserves attention.
This study also included in the specification (1) interaction terms between wstikj and proxies for
community-level food availability, which is measured by climatology, land scape, and soil quality
in the vicinity of each DHS community (see also Appendix F for details) as well as a community’s
GPS-based coordinates. These estimation results are reported in Table 4.27 In this table, only
the relevant coefficients are presented. For each type of these geographic and climatic conditions
as well as for the GPS latitude and longitude position, the results exploiting an indicator for
malaria-endemic areas and a continuous measure of malaria endemicity are reported in Table 4.
In the presence of the above concern, the malaria-related mortality effect may disappear due to
the inclusion of these additional controls.
The “WorldClim - Global Climate Data” provided information on mean monthly precipitation
amounts (mm) and temperatures (multiplied by 10 ◦C) over 1950 and 2000 with a spatial resolution
of 30 seconds (≈ 1 km2) longitude/latitude in a raster format (Hijmans et al. (2005)). In addition
to information on the elevation (m) of each community, which was based on the Shuttle Radar
Topography Mission (SRTM) Digital Elevation Model (DEM) and directly available in the DHS
data, this study also took information on slope (percent) and terrain ruggedness index (100 m)
from data provided by Nunn and Puga (2012) at the cell levels on a 30 arc-second grid. The
information on soil quality was sourced from a 30 arc-second raster data set provided by the
“Harmonized World Soil Database” (Fisher et al. (2008)). For each of six soil quality variables
(nutrient availability, nutrient retention capacity, rooting conditions, oxygen availability to roots,
excess salts, and field-management constraint), this study created an indicator for a community
characterized as having “moderate, severe, or very severe constraint” (reference group is “no or
slight constraint”).28
26The pronounced mortality effect revealed in Table 5 for children conceived in the rainy season may also beconsistent with the fact that in Liberia, this season almost overlaps with hunger periods given heavy agriculturalworkloads (Owadi et al. (2010), Figure 4.7) due to the frequent heavy rains, inaccessible roads, limited access tomarkets, depletion of food stocks, food price hikes, and so on; however, the relationship between mothers’ dietaryintake and positive or negative birth outcomes may differ by pregnancy stages, types of nutrients (e.g., energy,protein, iron, zinc, vitamin A, folate, vitamin D), and a combination of these factors.
27The GPS position may also represent any confounding factors inherent to each community (e.g., sanitaryconditions).
28Soil quality data also included information on toxicity. All DHS communities were identified as having “no orslight constraint”; however, this information was not exploited in this study. In addition, analyses utilizing thesesoil quality variables excluded from the regressions children born to mothers residing in 30 communities (out of 620communities) whose nearest raster point was not located on land, which corresponded to approximately 4% of allthe recorded childbirths.
23

Interim Report for Economic Analysis of Political Shocks, IDE-JETRO, FY 2015
As the results in Table 4 show, the inclusion of variables relevant to climatology [columns (a)―
(b)], landscape [columns (c)―(d)], soil quality [columns (e)―(f)], and GPS coordinates [columns
(g)―(h)] almost did not affect the previously identified effects of wartime malaria infection risk
in pregnancy. While the results are not reported to save space, simultaneously including all those
geographic and climate controls also left the obtained implications unchanged.
[Here, Table 4]
5.3.4 Other tropical diseases
If malaria-endemic areas were prone to other tropical diseases, the unfavorable consequences for
infant mortality may also be consistent with this possibility. Among “neglected tropical diseases”
including hookworm, ascariasis, trichuriasis, schistosomiasis, lymphatic filariasis, onchocerciasis,
and dengue, (only) the estimated number of people infected with schistosomiasis and onchocercia-
sis is comparable to that of those infected with malaria in Liberia (e.g., Hotez (2015)).29 However,
morbidity of pregnant women and their children attributable to the first is largely unknown (Fried-
man et al. (2007)), and a major symptom of the second is blindness, both of which have not been
highlighted by the relevant qualitative research in the context of the Liberian war. The vector-
mediated transmission of dengue is also much less common in this country (e.g., Amarasinghe
et al. (2011)). The aforementioned geographic and climate controls may also help in mitigating
the present concern.
5.4 Heterogeneity
5.4.1 Environmental risk
Several environmental factors might have raised malaria infection risk in wartime pregnancy while
further discouraging child survival. Three relevant perspectives were examined in Table 5: battle
intensity, types of residential areas, and seasons of conception. Analyses made in panels (A)―(C) in
that table exploited an indicator for the upper 50% quantile of malaria endemicity, compared to the
remaining panels (D)―(F), which used the continuous value of the index. Given the significance of
maternal passive immunity suggested by the exercises performed in Figure 4, the estimations in this
table (and Table 6) investigated periods of child survival equal to or longer than 12 months (more
precisely, Z = 12, 36, and 60 months). For brevity’s sake, this study also suppressed coefficients
on controls, which are available upon request.
29It is thought that hookworm infection in pregnancy can also result in adverse birth outcomes (e.g,. prematuredelivery, low birthweight, and intrauterine growth retardation).
24

Interim Report for Economic Analysis of Political Shocks, IDE-JETRO, FY 2015
First, this study explored the possibility that the unfavorable mortality effect was more pro-
nounced in areas more frequently affected by the armed conflict. For this purpose, exercises con-
ducted in the first two columns in Table 5 split the sample based on the number of battle events
that occurred within a 25-km radius from each DHS community and independently estimated the
specification (1) for both the sub-samples. The sample median number of fighting incidents was
exploited as the criterion of sample separation. As explained in Section 4, the information on the
battle events was sourced from the ACLED. As the estimation results in the first two columns
show, particularly in panels (D)―(F) based on the continuous measure of malaria endemicity, a
significant mortality effect was more evident for infants born to mothers (currently) residing in
war-torn areas.
Given the presumption that the mortality effect is more significant in rural than in urban areas
due to a likely high infection risk and/or limited access to health services (e.g., few health facilities,
dirt roads difficult to traverse in rainy seasons), the specification (1) was estimated for both the
sub-samples of (the current) rural and urban residents in the third and fourth columns in Table 5.
The results supported the expectation.
Typically, malaria transmission positively correlates with relatively predictable patterns of pre-
cipitation (Stanley C. Oaks et al. (1991), pp. 217-218). While malaria infection is possible through-
out the year in Liberia due to its climatically suitable nature for the vector-mediated transmission,
this picture still seems true even in this country. Anopheles gambiae, a principal anopheles species
in Liberia (WHO (2013), p. 149), is most abundant during the rainy season in this country (e.g.,
Fahmy et al. (2015); Gelfand (1955); Hogh et al. (1993); Somah (2005)). Based on these argu-
ments, this study estimated the specification (1) for both the sub-samples of children conceived
in rainy (May to October) and dry seasons (November to April) in the fifth and sixth columns
in Table 5, respectively. Strictly speaking, interpretation of the estimates is not straightforward
because the seasonal influence of maternal malaria infection varies by three factors, i.e., gestational
timing of the highest infection risk, overlap between gestation periods and malaria-prone seasons,
and gestational timing, yielding the worst birth outcomes attributed to malaria in pregnancy (see
Appendix A.5 for details). Acknowledging this limitation, the results showed that the negative
health consequences of wartime pregnancy in malaria-endemic areas were more clearly identified
for children conceived in the rainy reason than for those conceived in the remaining periods.
[Here, Table 5]
25

Interim Report for Economic Analysis of Political Shocks, IDE-JETRO, FY 2015
5.4.2 Human biology
As shown in Table 6, this study also investigated whether the influence of wartime pregnancy in
malaria-endemic areas varied by biological factors from two standpoints: maternal immunity and
child genetics. Similar to Table 5, both the indicator and continuous measure of malaria endemicity
were exploited in the estimations in panels (A)―(C) and (D)―(F), respectively, with each panel
corresponding to analyses of different survival periods (i.e., Z = 12, 36, and 60 months). As before,
coefficients on controls are suppressed but are available upon request.
First, women acquire parity-dependent immunity; therefore, it is viewed that first- and second-
time mothers are at greater risk of malaria infection compared to multigravidae (e.g., Desai et al.
(2007); Schantz-Dunn and Nour (2009); Uneke (2007b)). Similarly, young maternal age also inde-
pendently increases the risk of infection due to acquisition of age-associated immunity.30 Accord-
ingly, this study separated the sample into children born to paucigravidae and the others in the
first two columns in Table 6 and into those born to young (lower 50% quantile of mothers’ age at
birth) and elderly mothers (upper 50% quantile) in the next two columns.
The results confirm only the age-dependent heterogeneity of the mortality effect. This study
might have failed to identify the presence of gravidity-dependent heterogeneity because those iden-
tified as the first and second children in the data set might have had elder siblings who did not
experience normal deliveries and/or who died early in infancy and thus were not reported to the
DHS team. Alternatively, the diagnosis of malaria in pregnancy is sometimes sensitive to exploited
methods (e.g., Othoro et al. (2006)); therefore, the parity-dependent heterogeneity may not be
uncontroversial.31
The level effects of a male dummy reported in Table 2 are consistent with the oft-cited biological
“weakness” of male infants relative to females (e.g., Waldron (1983)). To explore whether this male
vulnerability made a significant difference in the malaria-related mortality effect across gender, this
study separately estimated the specification (1) for boys and girls, and the results are reported in
the final two columns in Table 6. As seen from the results, such a gender difference in mortality
was not clearly observed.
Two remarks can be made regarding this finding. First, the finding may be consistent with that
provided by Akresh et al. (2011). They showed that in Rwanda, the armed conflict equally reduced
the height-for-age of boys and girls while highlighting the indiscriminate nature of the violence
(compared to a peacetime crop failure, which made a significant gender difference). Second, if
30In general, it is possible that HIV/AIDS eliminates this gravidity- or age-specific patterns of malaria risk byshifting the burden to all pregnant women (Desai et al. (2007)), although the prevalence rate of this disease is lowin Liberia as described in subsection 2.3.
31Based on Rogerson et al. (2003) (p. 1372), for example, the parity-specific pattern was more evident formicroscopically detectable infection with P.falciparum, compared to that detected by histology.
26

Interim Report for Economic Analysis of Political Shocks, IDE-JETRO, FY 2015
boys are more vulnerable than girls, the “no gender-difference” result suggests that the identified
mortality consequences may be underestimates of the total population effect. This is because this
study might have failed to consider the mortality effect on boys who did not result in normal
childbearing and/or who died shortly after birth and therefore were not recorded in the DHS
data.32
[Here, Table 6]
5.5 Long-term selection on adult health
Exploring long-term health consequences for respondents who were conceived in malaria-endemic
areas after the outbreak of the war may help in further assessing the magnitude of the mortality
effect. This is because in the long term, the immediate mortality effect may make it possible
for only those who were genetically strong or in good health at conception and/or during their
maturation process to survive until the present, thus exerting a positive relationship between
in-utero exposure to malaria infection risk and present health status.
To investigate this possibility, this study utilized the 2013 DHS data. The data set includes
extensive information on the respondents conceived after the outbreak of the war (approximately
33% of the 2013 sample) because the DHS’s target population is women aged 15―49 years. By
focusing on female respondents as a unit of analysis (rather than children born to those respondents,
as exploited in the previous estimations) and by replacing the outcome of specification (1) with
the respondents’ height-for-age (z-scores) at the point of the survey, similar DID estimations were
performed in Table 7. The height-for-age is a measure frequently exploited to detect chronic
malnutrition or stunting. These exercises were conducted for a sub-sample of female respondents
(i.e., respondents who delivered children in the five years preceding the survey) because in the
DHS, the information on height-for-age was collected only for that particular sample.
Since the parental characteristics of the interviewed women cannot be discerned from the DHS
data, these exercises alternatively exploited several controls evaluated at the point when the re-
spondents were in childhood. Therefore, the estimations controlled for the number of respondents’
siblings who had passed away, those still living when the respondents were 10 years old, and the
respondents’ birth order.33
32Related to the second point, this study assessed whether changes in the mean values of several variables reportedin Table 1 relevant to children conceived before and after the conflict were statistically equal between areas of highand low malaria transmission; the DID estimates are reported in Table A.2. While the estimate is statisticallyinsignificant, children in malaria-endemic areas tend to be girls as a result of the war. This finding may be consistentwith the under-reporting problem of male births and their immediate deaths. Alternatively, unfavorable conditions inwartime might have increased the likelihood that females were born due to the biological process of sex determinationat conception (Trivers and Willard (1973)) or lowered frequency of sexual intercourse (e.g., James (1971)).
33The number of deceased siblings is included in line with the assumption that the mortality information may
27

Interim Report for Economic Analysis of Political Shocks, IDE-JETRO, FY 2015
Note that not all these mothers might have conceived the DHS respondents in the surveyed
community. If the measure of malaria endemicity is completely noise for this reason, the DID
estimations on the respondents’ present health outcomes would not reveal any meaningful results.
However, the estimation results reported below make this concern less critical.
5.5.1 Parallel trend assumption
As before, the DID approach needs to assume that areas of high and low malaria endemicity
experienced a similar trend in health outcomes. Figure 6 demonstrates the respondents’ mean
height-for-age according to their year of conception. The most recent year of conception observed
in the data was 1997, and the vertical line in the figure indicates the beginning of the first war in
December 1989.
Two findings deserve mentioning. First, the figure reveals a similar trend of adult health
between the two areas having different degrees of malaria endemicity while supporting the identi-
fication assumption (see also Appendix B for a more formal test of the pre-war parallel trends and
the results).
Second, while the height-for-age is higher in low endemic areas than in areas of high endemicity
before the war,34 the pattern was reversed once the war started. This increase in height-for-age in
malaria-prone areas following the outbreak of the war is expected to represent the aforementioned
selection effect. In other words, a wartime increase in malaria infection risk made it possible for
only those who were healthy in childhood to grow into adulthood (while discouraging the present
survival of weak infants).
5.5.2 Suggestive evidence for culling of the weakest infants
Table 7 reports the DID estimation results on the respondents’ height-for-age and height (cm) in
columns (a)―(c) and (d)―(f), respectively. For each outcome, the exercise in the first column
exploits 10 categorical variables indicating malaria intensity in contrast to the indicator for the
upper 50% quantile used in the second column and the continuous measure used in the third column.
Based on the results, wartime pregnancy in malaria-endemic areas has positive correlations with
positively correlate with the respondents’ poverty status in childhood. Given the mortality information, the numberof existing siblings is expected to measure the respondent’s parental household’s financial capacity to raise therespondent and his or her siblings.
34This observation is not inconsistent with the finding in Figure 2 that before the war, the mortality rate washigher in areas of low malaria endemicity compared to that in areas of high transmission. Due to the great likelihoodof infant mortality, it is expected that only healthy children could survive in low endemic areas through the present.It is thus possible that the height-for-age in adulthood becomes higher in low endemic areas than that in thedisease-prone areas.
28

Interim Report for Economic Analysis of Political Shocks, IDE-JETRO, FY 2015
health-related outcomes pertaining to adult women. This finding is robust to the inclusion of
numerous geographic and climate controls (see Appendix D.2.1).
Notably, because it is possible that the negative influence of maternal malaria infection on
fetal growth (e.g., low birthweight) has accumulating consequences for adult health, the DID
approach only identifies net effects of this (negative) and the aforementioned (positive) selection
effects. Given these two possible conflicting forces, the apparent long-term health improvement
may highlight the significance of the immediate mortality effects. Moreover, it is also difficult to
interpret whether this positive coefficient can be entirely attributed to the post-conflict policy effort
made to improve access to basic health services because the service quality is lower in malaria-
prone rural areas compared to urban cities. Based on a nationwide household survey in 2008, for
example, more than two-thirds of rural households need more than one hour to reach the nearest
health care facility, compared to the 41% country-wide average (Lee et al. (2011)).
This better health might have facilitated learning during school-attending years (e.g., Almond
et al. (2009); Field et al. (2009); Kelly (2011)). Based on the relevant analyses provided in Appendix
D.1, the relationship of wartime malaria infection risk in pregnancy to subsequent educational
attainment is less conclusive compared to that found for health-related outcomes.
[Here, Table 7 and Figure 6]
5.6 Assessment of bias attributed to unobservables
In subsection 3.2.2, this study mentioned that the mortality effect identified in the DID approach
would be attenuated. Similarly, due to the long-term positive selection effect discussed in subsection
5.5, the true health effects of wartime pregnancy in malaria-endemic areas on adult health might
have exhibited an upwards bias in the DID approach.
By taking three different approaches and reporting the relevant empirical findings in Table 8,
this subsection attempts to provide evidence supporting these views, i.e., that such bias exists.
For the purpose of comparison to the results obtained from these approaches, the DID estimates
reported in columns (b)―(c) in Table 2 and in columns (b)―(c) and (e)―(f) in Table 7 are copied
and pasted to panel (A) in Table 8.
5.6.1 Oster (2015)’s δ
First, this study evaluated the relative importance of omitted variables that share covariance prop-
erties with observed controls and that are required to explain the identified estimates. Following
Altonji et al. (2005), Oster (2015) developed a way of calculating this importance, denoted as δ
29
Interim Report for Economic Analysis of Political Shocks, IDE-JETRO, FY 2015
(i.e., a coefficient of proportionality on selection assumptions). The δ > 1 means that the unobserv-
ables are more important than the observables. A negative δ means that including the unobserved
controls in regressions increases the magnitude of the estimated effect rather than absorbing the
effect size.
This approach needs to assume the value of R-squared obtained from a hypothetical regression of
the outcome on the treatment, observed, and unobserved controls, denoted as Rmax. Three values
of Rmax were attempted in this study. Referring to the value of R-squared arising from a regression
on the treatment and observed controls as R, Oster (2015) heuristically suggested Rmax = 1.3R.
Based on the R-squared of the OLS estimation results reported in panel (A), accordingly, this
study first used 0.11, 0.17, and 0.18 as the Rmax for the mortality outcome, height-for-age, and
height, respectively, in row (1) in panel (B) in Table 8. In theory, the value of Rmax should reflect
how much including both the observed and unobserved controls (that have a proportional selection
relationship) and the treatment explains the variation in the outcome. Regarding the mortality
consequence, one such value of R-squared may be obtained from the estimations controlling for
mother-fixed effects. Referring to the value of R-squared in the estimation of column (f) in Table
2 that included the fixed effects, this study alternatively exploited Rmax = 0.3 as the second
possibility in row (2) in panel (B) in Table 8. In row (3) in panel (B), finally, Rmax = 1 is also
used as the least conservative value.
In all the cases reported in panel (B), the values of δ are negative, thus suggesting that the
DID estimates reported in panel (A) are attenuated. The negative ratio for adult health outcomes
may appear somewhat at odds with the expectation that the long-term influence on adult health
is biased upwards due to the positive selection effect. However, the negative ratio here solely
implies that the positive selection effect is underestimated in panel (A) (while underestimating the
immediate mortality effects).
5.6.2 Instrumental variable approach
By exploiting a climate-based instrumental variable for malaria endemicity and conducting two-
stage least-squares (2SLS) estimations, this study assessed the possible direction of bias in the OLS
estimates.
It is widely accepted that temperature and rainfall are two critical factors in explaining malaria
endemicity (e.g., Blanford et al. (2013)). As far as the range of the mean temperature recorded
in the data set used in this study is concerned, a higher temperature is expected to increase the
potential for malaria transmission (Craig et al. (1999)).35 However, a higher temperature does
not necessarily ensure mosquito survival in regions having low precipitation because mosquitoes
35In general, there are lower and upper limits for temperatures suitable for malaria transmission.
30

Interim Report for Economic Analysis of Political Shocks, IDE-JETRO, FY 2015
cannot breed in such areas (Craig et al. (1999)). Therefore, a complementarity exists between
temperature and rainfall, playing an important role in malaria transmission. Accordingly, this
study exploited an interaction term between these two factors (which are also interacted with
wstikj) as an instrumental variable for wst
ikj · mj . To give more credit to the assumption of the
exclusion restriction of this instrument, this study added levels of temperature and precipitation
(interacted with wstikj) in regressors but not in the excluded instruments.
The estimation results of the mortality effects are reported in columns (3a) and (3b) in Table
8. The coefficient on the instrument and the F-statistics in the first-stage estimations are reported
at the bottom of Table A.8, which provides full results of the second-stage estimations.36 Based on
the results, the instrument is strong37 and this instrumental variable approach identified greater
mortality effects than the OLS estimates while suggesting that the latter estimates are attenuated.
The same instrumental variable approach was applied to adult health outcomes in columns
(3c)―(3f). It is expected that the valid instrument removes upward bias of the OLS estimates
associated with the war-induced culling of vulnerable infants. The results provided evidence (al-
though statistically insignificant) suggesting long-term unfavorable health consequences of wartime
malaria infection risk in pregnancy.
5.6.3 Discontinuity sample
The third approach exploits the insight from a regression discontinuity design. Assuming that the
influence of any confounding factors must have been nearly identical for those conceived just before
and after the outbreak of the war, this study applied the DID approach for sub-samples of those
conceived in 1989 and 1990 (given that the first war began in December 1989).
The estimation results on the mortality effect are reported in columns (4a) and (4b) in Table 8.
The estimates are greater than the OLS estimates exploiting the full sample, and they reveal a great
similarity to the local effect identified in the 2SLS estimations in columns (3a) and (3b). On the
other hand, exploiting discrete and continuous measures of malaria endemicity yielded inconsistent
estimates for adult health outcomes. These estimates might have suffered from imprecise estimation
due to the small sample size. The relevant full estimation results are reported in Table A.9.
[Here, Table 8]
36Unfortunately, the standard errors were not corrected to allow for intra-community correlation due to compu-tational difficulty in these estimations.
37However, the first-stage estimation results revealed a strong negative correlation between the instrumentalvariable and wst
ikj ·mj , which is a counter-intuitive finding. Similar to the study Alsan (2015) conducted in the context
of the Tsetse fly, this finding may suggest the importance of the non-linear interaction between temperature andrainfall. Alternatively, the finding may stem from the fact that in Liberia, malaria is more prevalent in mountainousareas of lower temperature and precipitation.
31

Interim Report for Economic Analysis of Political Shocks, IDE-JETRO, FY 2015
6 Conclusion
In what ways does an armed conflict interrupt health accumulation? To provide one answer for
this question, this study investigated whether the Liberian civil war increased infant mortality
by exposing pregnant mothers to a higher risk of malaria infection, thus disrupting fetal growth.
Three existing frameworks encouraged the current research to address this question. First, conflict
is known to greatly increase the risk of malaria-related mortality by increasing infection risk and
impairing health-service deliveries. Second, pregnant women are one of the groups at the highest
risk of malaria infection. Third, maternal malaria infection tends to result in adverse perinatal
outcomes.
By comparing changes in mortality for children conceived before and after the outbreak of the
Liberian civil war between high and low malaria endemic areas, this study found that a one-percent
increase in maternal infection risk induced by the conflict resulted in a 0.44-percent increase in
one-year infant mortality. This elasticity is potentially a lower-bound effect of malaria infection
risk, and it could be used as one reference point for future research exploring the influence of such
risk on infant mortality.
This negative health effect gradually increased and became more statistically significant as ma-
ternal passive immunity waned. In addition, the adverse health consequences were more serious for
infants conceived in rainy seasons by young mothers residing in rural, battle-intense areas. On the
other hand, a significant gender difference was not observed for the mortality effect. The impor-
tance of this passive immunity and the influence on infants conceived by geographically, seasonally,
and immunologically high-risk mothers may help policymakers and practitioners determine target
groups for aid programs during inter- and post-war periods.
The current study also showed that in-utero exposure to malaria infection risk had a positive
correlation with adult health as measured by height-for-age and height. Assuming that the pos-
sible wartime culling of the weakest infants enables only those who are genetically strong and/or
protected during their childhood to reach adulthood, this apparent long-term human-capital im-
provement may highlight the significance of the immediate mortality effect. This selection effect
is potentially inherent in any research exploring the long-term consequences of armed conflict on
survivors’ health based on post-conflict data, and it likely leads to underestimation of the adverse
health impacts.
This study concludes by providing a few reservations with respect to the findings reported here.
First, this study evaluated the total effect arising from an increase in malaria infection risk in
pregnancy and impairment of the health system that aggravated unfavorable consequences of the
heightened infection risk during the war. If available, exploiting information on wartime access
32

Interim Report for Economic Analysis of Political Shocks, IDE-JETRO, FY 2015
to health services would have been useful for disaggregating the pathways. Second, this study
only identified the wars’ influence on children conceived by mothers originally residing in malaria-
endemic areas. Given the sizeable war-induced diaspora, this research may not necessarily capture
the influence of all the malaria infection risk faced by pregnant mothers during the years of the
conflict. Related to this point, this study was not able to explore whether and how the war and
people’s behavioral responses encouraged the spread of the malaria parasites across spaces. Rele-
vant studies addressing this spillover effect may need to consider people’s immunity and infection
risk.
33

Interim Report for Economic Analysis of Political Shocks, IDE-JETRO, FY 2015
A Appendix: Literature review
A.1 Liberia and malaria suitability
Together with the tropical heat and humidity, Liberia lies almost entirely within the rainforest zone.
The landscape is characterized by swampy plains along the coast and inland rolling plateaus leading
to low mountains. Most areas lie below an altitude of 500 m, which makes malaria transmission
possible in almost all parts of this country because malaria infection does not typically occur above
an altitude of approximately 1,500 m (Stanley C. Oaks et al. (1991), p. 219). Throughout the year,
the monthly average temperature is also higher than the minimum temperature (approximately
18 ◦C) required for parasite development of P.falciparum, a major plasmodium species in this
country (Patz and Olson (2006)). While the body’s inflammatory response is a typical malaria
symptom, this most dangerous species also causes cytoadherence of erythrocytes to vascular walls;
thus, infected blood cells are often trapped in small blood vessels. This can result in end-organ
damage or blood abnormalities. In addition, microcytic anemia in adults and folic acid deficiency
also commonly occur due to the splenic sequestration of the parasites (e.g., Schantz-Dunn and
Nour (2009)).
A.2 Liberian civil war
In Liberia, while the True Whig Party, founded in 1869 by Americo-Liberians (i.e., former slaves
liberated from the United States) has taken a monopolistic position on the political system since
the late 19th century, a bloody military coup led by Samuel Doe overthrew the government in
1980. Although he attempted to legitimize his rule, which gave preferential treatment to his own
ethnic group, the Krahns, corruption and brutality (e.g., crackdowns on the Gio and Mano ethnic
groups) during his 10 years in power unavoidably induced the subsequent uprising against him,
followed by Liberia’s descent into the political abyss during the last decade of the 20th century
(Zeleza and Eyoh (2003), p. 327).
Liberia’s political unrest encompassed two civil wars between 1989 and 2003. The first war
erupted in December 1989, when an armed group, the National Patriotic Front of Liberia (NPFL),
attacked the border town of Butuo in north-central Nimba county from Cote d’Ivoire under the
leadership of Charles Taylor. This war was brought to an end in July 1997 when national elections
were held and Taylor was elected president. During this war, an ethnic pattern of killings based on
corresponding factional groups, which fought to control the rich natural resources of this country
(e.g., diamonds, gold, iron ore, and timber), emerged and set a tone for the conflict that lasted for
14 years. A second war began in April 1999, when a Guinean-backed rebel group, the Liberians
34

Interim Report for Economic Analysis of Political Shocks, IDE-JETRO, FY 2015
United for Reconciliation and Democracy (LURD), sparked a revolt in northwest Lofa County.
This war continued until August 2003, when the warring parties signed the Accra Comprehensive
Peace Agreement. During the 14-year state of chaos and fear, more than 250,000 soldiers and
civilians were killed, i.e., approximately more than 12% of the 2.1 million population in 1990
(Mama (2014), p. 55).38
Due to the atrocious, indiscriminate nature of the fighting and human rights abuses (e.g.,
killings, looting, property destruction, rape, and child recruitment), it is estimated that approx-
imately 500,000 people were internally displaced and another 780,000 sought refuge abroad.39
Detailed accounts of egregious human rights abuses and displacement can be found in Foster et al.
(2009), a document based on more than 1,600 statements by war survivors (see also Nilsson (2003)
for an excellent literature review of the internally displaced persons, refugees, and returnees).
The displacement typically proceeded through phases of hiding, internal displacement within
Liberia, and refuge in other countries. In response to the sound of gunfire, government warnings
or rumors of an assault, and surprise attacks, fleeing populations often hid in swamps, bushes, and
mountains for days, weeks, or even months. Rebel groups also exploited the forced displacement
as a military tactic to clear areas for their occupation (Foster et al. (2009), p. 131). It is argued
that women more disproportionately suffered from difficulties stemming from the displacement
compared to men and boys, who were often forced to join various fighting forces (Dabo (2012)).
This cycle of fighting, hiding, and relocation was also repeated during the long years of the conflict.
Most internally displaced persons (IDPs) headed towards Monrovia, the capital (Nilsson (2003)).
IDPs often took shelter in public buildings and other available spaces (e.g., church compounds,
embassy compounds, sports stadiums, and university campuses) in overcrowded, impoverished
conditions. After the signing of the Accra Peace Agreement in 2003, most IDPs relocated to for-
mal camps located close to Monrovia and along the main road in Bong County. The World Food
Programme (WFP) registered approximately 320,000 Liberians at these camps (see Jesuit Refugee
Service (2007) for a good review of issues relevant to IDPs).
At the beginning of the war, refugees successfully settled in asylum countries, and they were
economically integrated into their host communities (e.g., Dick (2002); Leach (1992); Kuhlman
(2002)). Based on the research Damme (1999) conducted in the Forest Region of Guinea, for
example, less than 20 percent of the refugees were residing in camps in 1996. As refugees came to
outnumber their hosts, however, anti-refugee sentiment became visible, sometimes forcing refugees
38Information on the total population is sourced from “World Population Prospects: The 2012 Revision” (http://esa.un.org/wpp/unpp/panel population.htm).
39Information pertaining to the externally and internally displaced persons is drawn from the “2005 UNHCRStatistical Year Book” (http://www.unhcr.org/464478a72.html) and “Liberia: Internal displacement in brief” asof December 2013, Internal Displacement Monitoring Center (IDMC) (http://www.internal-displacement.org/sub-saharan-africa/liberia/summary), respectively.
35

Interim Report for Economic Analysis of Political Shocks, IDE-JETRO, FY 2015
to return to Liberia even though it remained unsafe (Lawrie and Damme (2003)). As the war
persisted, refugees often arrived suffering from exhaustion because they tended to choose the
option of leaving the country only after enduring several years of internal displacement and the
associated hardships (Damme (1999)).
Many factors (e.g., limited access to education and health services, severance of family and
community links, concerns of gender-based violence, and absence of job opportunities) have dis-
couraged IDPs and refugees from returning to their places of origin after the war ended (e.g.,
Wright and Savage (2007)). Consequently, it took more than three years for the majority of the
IDPs to return to their homes or settle elsewhere following the 2003 Peace Agreement.40 In addi-
tion, the UN refugee agency completed a repatriation program in 2012 that facilitated the return
of more than 155,000 refugees by the end of that year (Momodu (2013)). It is also reported that
those returnees sometimes went through daunting hardships when resettling in Liberia (e.g., Jesuit
Refugee Service (2007); Omata (2012)).
A.3 Factors affecting infant mortality
Based on a recent estimate, approximately 44% of deaths in children under the age of five years
occur within the first four weeks following birth (Liu et al. (2015)).41 Public health research has
reported the following direct causes of neonatal mortality (excluding stillbirths) worldwide: severe
infections (e.g., sepsis, pneumonia, tetanus, and diarrhea) (29%), preterm births (i.e., delivery at
less than 37 weeks of completed gestation) (29%), asphyxia (23%), and congenital abnormality
(8%) (Lawn et al. (2010)).
Pneumonia, diarrhea, and malaria also constitute approximately 23%, 16%, and 13% of the
remaining proportion (i.e., 56% = 100% − 44%) of under-five mortality, respectively (Liu et al.
(2015)). In Profile 2 countries (e.g., Guinea and Sierra Leone) characterized by Black et al. (2003),
it is also estimated that pneumonia, diarrhea, malaria, and neonatal deaths each account for
approximately 20―26% of deaths in children younger than five years.
Low birthweight (i.e., a weight at birth less than 2,500 g) is also an important secondary factor
that affects neonatal and infant deaths. The short gestation and intrauterine growth restriction
(i.e., restricted growth of a fetus during pregnancy) and a combination of these factors lead to low
40The IDP camps were officially closed in April 2006, although this does not necessarily mean all the IDPs hadreturned to their places of origin by this time.
41The corresponding ratio was 37% in 1990; thus, an increasing proportion of under-five deaths is now attributedto newborn deaths (e.g., Lawn et al. (2005); Lawn et al. (2010)). With 32 deaths per 1,000 live births estimated in2012, the neonatal mortality rate (NMR) in sub-Saharan Africa is the highest in major developing areas, and thisregion has also seen the lowest (28%) reduction in NMRs from 1990 to 2012 (UNICEF (2013), p. 13). Explicitlyreferring to Liberia, Lawn et al. (2005) also noted that the high incidence of neonatal deaths in Africa is particularlyseen in countries that experienced violent political turmoil.
36
Interim Report for Economic Analysis of Political Shocks, IDE-JETRO, FY 2015
birthweight, and approximately 60―80% of newborn deaths are cases of low-birthweight neonates
(Lawn et al. (2005)).
Because these factors are closely inter-related, it is difficult to identify a single reason for
each neonatal and infant death. For example, the incidence of preterm births increases that
newborn’s difficulty in feeding and maintaining his or her body temperature while raising the risk
of contracting infectious diseases (Lawn et al. (2005); Lawn et al. (2010)). Prematurity and in-
utero growth failure or disruption also raise the risk of neonatal deaths especially attributed to
infection (Lawn et al. (2005)). Many infants recorded as dying from infectious diseases are also
premature (Lawn et al. (2010)).
A.4 Pathological pathways from maternal malaria infection to fetal growth retar-
dation
Umbers et al. (2011) provided a good pathological review on the underlying factors that link
placental malaria with fetal growth restriction. For instance, placental infection is likely to impair
placental development while prompting maternal hypertension and placental vascular dysfunction.
In addition, placental inflammation attenuates levels of hormones that regulate placental functions.
Of those hormones, some affect fetal cell proliferation, maternal appetite, metabolism, and fat
accumulation. Moreover, a high density of parasites in placental blood and the associated immune
response may decrease levels of nutrients (e.g., amino acids, lipids, and glucose) delivered to the
fetus. Similarly, the transplacental transfer of maternal antibodies and cellular immune responses
to several infectious diseases (e.g., measles, tetanus) can also be prevented by placental infection
(e.g., Brair et al. (1994); de Moraes-Pinto et al. (1998)). Placental changes such as thickening of
cytrophoblastic membranes may also hinder the effectiveness of nutrient transporters (e.g., Guyatt
and Snow (2004)).
A.5 Seasonal influence of maternal malaria infection on fetal growth
Analyses in the fifth and sixth columns in Table 5 showed that wartime pregnancy in malaria-
endemic areas raised infant mortality if conception occurred in the rainy season. While this finding
may suggest a higher infection risk in malaria-prone seasons and associated unfavorable birth
outcomes, some caution is needed in asserting such a link because the seasonal influence of maternal
malaria infection on fetal growth could be affected by multiple factors, a possibility supported by
the studies reviewed in this section.
In Africa, birthweights are likely to exhibit seasonal fluctuations (e.g., Rayco-Solon et al.
(2005)). While maternal malaria infection may be just one factor that underlies this observa-
37

Interim Report for Economic Analysis of Political Shocks, IDE-JETRO, FY 2015
tion, it could possibly have a seasonal influence on fetal growth for three reasons. First, some
gestational months may biologically reveal a higher risk of contracting the disease than in the re-
maining months. Second, even if the inherent risk of infection is identical throughout the gestation
period, epidemic-prone seasons may also exist. Third, the magnitude of the adverse influence on
fetal growth may also vary by gestational months of infection.
Based on the review of epidemiological literature made by Desai et al. (2007) and others (e.g.,
Brabin (1983); Rogerson et al. (2000); Walker et al. (2014); Zhou et al. (2002)), it appears that
the infection risk is highest during the second trimester. The peak prevalence in this period may
also be attributed to an increasing susceptibility in the first trimester (e.g., Cohee et al. (2014);
Dicko et al. (2003)).
Typically, malaria transmission positively correlates with relatively predictable patterns of pre-
cipitation, although the infection risk may continue at lower levels during the dry season (Stanley
C. Oaks et al. (1991), pp. 217-218). While malaria infection is possible throughout the year in
Liberia due to its climatically suitable nature for the vector-mediated transmission, this seasonal
pattern seems to remain even in this country. Anopheles gambiae, a principal anopheles species in
Liberia (WHO (2013), p. 149), is most abundant during the rainy seasons in this country (Fahmy
et al. (2015); Gelfand (1955); Hogh et al. (1993); Somah (2005)).
Compared to the health consequences of malaria in pregnancy in general, it is relatively un-
known which gestational period of infection has the largest unfavorable effects (e.g., Cottrell et al.
(2007); Kalilani et al. (2010); Huynh et al. (2011)). As Desai et al. (2007) pointed out, intrauter-
ine growth restriction and low birthweight may be attributed to infection in the second and third
trimesters, whereas low birthweight and preterm delivery may result from infection in the third
trimester. While the adverse effects of infection in the first trimester are relatively unclear, it may
also explain the decrease in the birthweight of newborns (e.g., Huynh et al. (2011)).
B Appendix: Parallel trend assumption
The key identification assumption of the DID approach is a parallel trend of the outcomes. While
Figure 2 (infant mortality) and Figure 6 (height-for-age) provide an informal assessment of and
support for the assumption, this subsection statistically tests whether the pre-war trend of the out-
comes significantly varied with malaria endemicity. To achieve this purpose, this study restricted
its attention to data pertaining to persons conceived in or before 1989 (because the war began
in December 1989) and estimated the following equation for the outcomes yij of individual i in
38

Interim Report for Economic Analysis of Political Shocks, IDE-JETRO, FY 2015
community j,
yij = β1 + βh2
∑h
ahij + βh3
∑h
ahij ·mj + vj + uij , (B.1)
where ahij is an indicator equal to one if the person was conceived in year h and zero otherwise (the
reference group was all those conceived in and before 1980); vj is community-level fixed effects;
and uij is a stochastic error. The unit of analysis is either children born to the DHS respondents
or the DHS respondents themselves, depending upon the outcomes of interest. The parallel trend
is consistent with the estimated βh3 , which is insignificantly different from zero. The estimation
results of the one-year mortality of children born to the DHS respondents, the respondents’ height-
for-age, height, and education were presented in columns (a) through (d) in Table A.1, respectively.
As is clear from the table, these exercises provided no evidence undermining the assumption of
parallel trends in the pre-war periods.
C Appendix: Robustness checks
C.1 Non-linear empirical models
As shown in Table A.3, this study attempted to determine whether the findings provided in Table
2 were robust to non-linear empirical models (and controls). First, this study separated the sam-
ple into two groups, namely children conceived before and after the outbreak of the conflict, and
independently estimated the influence of maternal malaria infection risk based on a probit model.
The sample separation facilitates a straightforward calculation of the marginal effects reported in
columns (a)―(g) and (i)―(o) in Table A.3, respectively (Ai and Norton (2003)). As seen in the
table, several survival periods were investigated by varying the value of Z from one (i.e., neona-
tal mortality) to 60 (i.e., five-year infant mortality). To avoid computational obstacles resulting
from estimating non-linear models with numerous indicator coefficients as well as the potential
incidental parameter problem that biases the estimates and the associated standard errors (e.g.,
Greene (2004); Lancaster (2000)), the probit estimations replaced the community-fixed effects with
county-level fixed effects (16 groups) while including a community’s geographical position (latitude,
longitude) and elevation in meters.42
As the results show, the malaria infection risk in pregnancy exhibited statistically positive rela-
42Similar to the identification of a district corresponding to each DHS community (see footnote 21), the commu-nities were categorized into 15 counties plus one group for which the ArcGIS failed to identify the correspondingcounty. The estimations in Table A.3 included the unidentified group as one county that corresponded only to 3%of the entire sample.
39

Interim Report for Economic Analysis of Political Shocks, IDE-JETRO, FY 2015
tionships with child mortality only after the war’s outbreak. The estimates on malaria endemicity
and the corresponding statistical significance also gradually increased as the exercises examined
longer survival periods. These findings are consistent with those provided by Table 2 and Figure
4.
By exploiting a Cox proportional hazard model, this study also analyzed the duration (months)
from birth to death in columns (h) and (p) in Table A.3, whereby the estimated hazard ratio
is reported and a ratio greater (smaller) than one means that the variable induces (prevents)
mortality.43 Due to the proportional hazard assumption, the ratio should be interpreted as the
hazard ratio at any point in time between two individuals that only varies by one unit of covariates.
Schoenfeld residual (p-values) reported at the bottom of Table A.3 failed to reject the assumption
of proportional hazards. The results again highlight that malaria infection risk in pregnancy
decreases the survival likelihood of children conceived only after the outbreak of the war (with 5%
statistical significance).
C.2 Alternative measures of malaria infection risk
This study collected estimates of endemicity levels of P.falciparum in each year between 2000 and
2010 from another study of the Malaria Atlas Project, Bhatt et al. (2015).44 Despite a similar
Bayesian geostatistical model and the map resolution exploited by Gething et al. (2011) and Bhatt
et al. (2015), these two studies provided different estimates in 2010. In the data set used in this
study, for example, the community-level mean 2010 endemicity was 0.41 based on Gething et al.
(2011) and 0.31 based on Bhatt et al. (2015), respectively. In part, this difference is attributed to
differences in a geographical scope of these two studies as well as the timing of the Plasmodium
falciparum parasite rate (PfPR) surveys that input data of the parasite rate into the geostatistical
model. For instance, Bhatt et al. (2015) considered the PfPR surveys taking place between 1995
and 2014 in Africa, and Gething et al. (2011) was based on PfPR surveys conducted between 1985
and 2010 primarily in (but not limited to) Africa.
Due to these differences and a great difficulty in estimating endemicity in general, this study
avoids a hasty judgment about which of these (or other possible) studies provides more precise
estimates of endemicity.45 Instead, these alternative estimates were exploited to check the ro-
bustness of the main findings. Accordingly, this study estimated the specification (1) based on
endemicity estimates provided by Bhatt et al. (2015) and reported the estimated α2 in Table A.10.
43Unlike the previous estimations that exploited data pertaining to children born more than Z months before thetiming of the DHS interview, this survival analysis used all the available observations.
44The data are available from http://www.map.ox.ac.uk/.45Relatedly, similar to the endemicity estimates of Gething et al. (2011), those based on Bhatt et al. (2015) should
also be seen as just another proxy for the pre-war levels of endemicity in the present study.
40
Interim Report for Economic Analysis of Political Shocks, IDE-JETRO, FY 2015
In each panel from (A) to (K), endemicity levels sourced from different years were exploited for
the estimations.
As seen in the first two columns, this study confirmed that the wartime conception in malaria-
endemic areas increased the likelihood of infant mortality. In addition, the estimates are almost
identical across panels. This finding supports the discussion in subsection 3.1.2 that the endemicity
levels of P.falciparum have not markedly changed between 2000 and 2010 in Liberia despite a
global malaria control effort. Regressing Bhatt et al. (2015)’s endemicity estimates in 2010 on
those in 2000 at the community-level yielded a coefficient of 0.937 (std. 0.029), which is close to
one.
D Appendix: Long-term selection on adult human capital
stocks
D.1 Selection effects on education
In subsection 5.5, this study showed that pre-natal exposure to malaria infection risk positively
correlated with long-term health outcomes. Then, better health might also have facilitated learning
during school-attending years. Based on the previous studies, unfavorable prenatal conditions
appear to hinder children’s cognitive development (e.g., Almond et al. (2009); Field et al. (2009);
Kelly (2011)).
By applying a similar DID approach to that demonstrated in subsection 5.5, this study inves-
tigated the long-term consequences of wartime malaria infection risk in pregnancy on the respon-
dents’ completed years of education in Table A.4. In contrast to analyses of adult health outcomes
reported in Table 7, the data pertaining to all the respondents in the 2013 DHS were exploited for
the exercises in Table A.4 (recall that in the DHS, the information on height-for-age was collected
only for respondents that delivered children in the five years preceding the survey).
Exploiting both the discrete (upper 50% quantile) and continuous measures of malaria infection
risk provided evidence supporting the positive selection effect at around 10% significance level in
columns (b) and (c) in Table A.4, respectively. However, this positive relationship appears to
be less conclusive because, based on the estimation result in column (a) in Table A.4, which
uses 10 categorical variables of malaria endemicity (the reference group is the lowest percentile),
the statistically significant positive and negative effects were found for relatively lower levels of
malaria endemicity. This finding may indicate that the linkage between fetal development and
educational attainment may not be as straightforward during the time of the war. Following
discussions presented in subsection 5.6, the results of the 2SLS estimations [columns (d)―(e)] and
41
Interim Report for Economic Analysis of Political Shocks, IDE-JETRO, FY 2015
of the estimations exploiting data on those conceived in 1989 and 1990 [columns (f)―(g)] are also
reported in the remaining columns in Table A.4.
D.2 Robustness checks
D.2.1 Inclusion of geographic and climate controls
Analyses in subsection 5.5 and Appendix D.1 showed that in-utero exposure to malaria infection
risk had a positive correlation with health and (with less confidence) educational attainment in
adulthood. This section checks the robustness of this finding to the inclusion of geographic and
climate controls. For this purpose, this study further examined height-for-age (z-scores), height
(cm), and education (years) in Table A.5, Table A.6, and Table A.7, respectively. In these tables,
a similar empirical model to that in Table 7 and Table A.4 is estimated. As before, estimation
results exploiting an indicator for high malaria infection risk (upper 50% quantile) and a continuous
measure of malaria endemicity are reported together with the relevant coefficients. Coefficients on
suppressed controls are available from the author upon request.
This study performed similar exercises to those conducted for infant mortality in subsection
5.3.3. In other words, the estimations also included interaction terms between an indicator for the
respondents conceived after the outbreak of the war and several variables representing a commu-
nity’s climatology [columns (a)―(b)], landscape [columns (c)―(d)], soil quality [columns (e)―(f)],
and GPS-based coordinates [columns (g)―(h)].
The statistical significance of the estimated coefficients is not always strong likely due to the
small sample size (relative to that used in analyses of infant mortality) and the high correlation
between the measures of malaria endemicity and geographic and climatic conditions. Nevertheless,
these estimation results continued to confirm positive relationships between pre-natal exposure to
malaria infection risk and adult human capital stocks.
D.2.2 Alternative measures of malaria infection risk
By exploiting alternative endemicity estimates provided by Bhatt et al. (2015) (see subsection
C.2), this study assessed the robustness of the long-term selection effects reported in Table A.10,
whereby only the relevant coefficients are reported. As seen from the estimation results in the
third through eighth columns in panels (A)―(K), in-utero exposure to malaria infection risk in
wartime had positive correlations with adult human capital stocks.
42

Interim Report for Economic Analysis of Political Shocks, IDE-JETRO, FY 2015
E Appendix: Violence seasonality
While it is difficult to obtain precise data on the frequency of crimes committed during the time
of conflict, this study assessed the seasonal pattern of violence by exploiting two independent data
sources, namely the Truth and Reconciliation Commission (TRC) and (as described in Section 4)
the ACLED.46 With assistance from the Human Rights Data Analysis Group (HRDAG) and the
Benetech, the TRC built an electronic database of violence events based on statements collected
from victims, witnesses, and perpetrators of human rights violations during the war (see Cibelli
et al. (2009) for details of descriptive statistics of the data).47
The TRC team has made an extensive effort to collect as many statements as possible. The
statement givers provided the TRC with 17,160 testimonies, including 163,615 total violations that
existed between April 1979 and December 2003 across 15 of the country’s counties. As summarized
in Table A.12, in the TRC data, violence is classified into 23 categories.48 Figure A.2 reports the
number of acts of sexual violence (grouping rape, gang rape, multiple rape, sexual abuse, and
sexual slavery) and the total number of violent acts by year of incidence.49 While sexual violence
constitutes approximately 3―4% of the reported total human rights violations, Figure A.2 shows
a similar episodic tendency between sexual and total violence, with three spikes: one in 1990 at
the onset of the first civil war, one in 1994, and one in 2003 linked to attacks on Monrovia by the
rebel groups.
The year of incidence was discerned from the TRC data for all human rights violations. How-
ever, of the recorded 6,534 violations relevant to sexual violence, only 1,190 observations (approx-
imately 18%) contained information on the month of incidence. With this admitted limitation,
Figure A.3 provided the details of the time trend of sexual violence (see also Figure A.4 for a similar
breakdown of the total violence). Apparently, the figure provides some evidence suggesting that
in wartime, sexual crimes were more intensively committed in rainy seasons (May to October).
To test this finding more formally, this study constructed balanced panel data of human rights
violations at the county-month level, consisting of 15 counties and 297 months from April 1979 and
December 2003 (yielding 4,455 observations). By exploiting this panel data, the seasonal pattern
of the human rights violations was checked in columns (a) through (f) in Table A.11. Notably,
the number of human rights violations includes cases only when both the timing and location of
the alleged violation are discerned from the TRC dataset; therefore, the regression analyses in
Table A.11 using the fixed effects of year/month-of-incidence and each county are seriously subject
46The TRC data and the relevant documents can be downloaded from https://hrdag.org/liberia-data/.47See https://hrdag.org/ and http://benetech.org/ for the HRDAG and Benetech, respectively.48In Table A.12, this study grouped rape, gang rape, and multiple rape into one category.49Notably, not only females but also males can be victims of sexual violence; in addition, sexual abuse includes a
case of stripping victims, which could be seen as a means of humiliating people during the war.
43

Interim Report for Economic Analysis of Political Shocks, IDE-JETRO, FY 2015
to this issue (as well as a problem of selective statements explained in the next paragraph).50
Acknowledging this limitation, the results still show that violence was more intensive in rainy
seasons during the time of conflict. The analyses in columns (i) through (n) disaggregated the
periods following the outbreak of the war into four periods relevant to the first war, ceasefire,
second war, and post war and repeated similar exercises. The obtained implications remained
unchanged.
Unavoidably, the statements reported to the TRC cannot be seen as representing the general
population of human rights violations (Cibelli et al. (2009)). First, the statement givers are not
randomly selected. Second, some crimes―such as sexual violence and murders―may be under-
recorded unless appropriate witnesses are found and/or the victims tell the truth. Consequently,
estimations using the TRC data might have failed to provide a true picture of the seasonal pattern
of violence. Hence, to further the analysis of violence seasonality, this study also exploited data
drawn from the ACLED.
The seasonal pattern of the total number of battle events was checked in columns (g) and (h)
and, with a similar breakdown of the periods following the outbreak of the war, in columns (o) and
(p) in Table A.11. Similar to the analysis using the TRC data, this study established balanced
panel data consisting of 14 counties and 284 months from January 1980 to August 2003 (yielding
3,976 observations). In contrast to the TRC data, the ACLED data contain information on both
the month and year of incidence for all battles; therefore, it is less likely that the analysis using the
latter data suffers from the problem attributed to difficulty utilizing the representative violence
data. Based on the results, it appears that the frequency of the battles was higher in rainy seasons
compared to the remaining periods after the war started, particularly during the time of the first
war, although the statistical significance is absent.
F Appendix: Geo-coded variables
This section describes community-level geo-coded variables used in this study and the original
sources.
F.1 Malaria endemicity
The data on the endemicity levels of P.falciparum are provided by the Malaria Atlas Project.
The spatial resolution exploited in this study is between 30 seconds of a longitude/latitude degree
(≈ 1 km2). Gething et al. (2011)’s estimates are available from http://www.map.ox.ac.uk/
50For example, only 31,001 of the total 163,615 human rights violations (approximately 19%) included all theinformation on year, month, and place of incidence.
44

Interim Report for Economic Analysis of Political Shocks, IDE-JETRO, FY 2015
browse-resources/endemicity/Pf mean/world/. Bhatt et al. (2015)’s estimates are available
from http://www.map.ox.ac.uk/.
F.2 Battle intensity
The data on battle intensity are provided by the Armed Conflict Location and Event Database
(ACLED), available from https://www.prio.org/Data/Armed-Conflict/Armed-Conflict-Location-and-Event-Data/.
This study calculated the number of battle events that occurred within a 25-km radius from each
DHS community.
F.3 Administrative areas
A county and district corresponding to each DHS community was identified by matching a com-
munity’s GPS latitude/longitude coordinate with a map of Liberia sourced from DIVA-GIS (http:
//www.diva-gis.org/datadown).
F.4 Climatology
The data on climatology is provided by “WorldClim - Global Climate Data” (Hijmans et al. (2005);
http://www.worldclim.org/current). The spatial resolution exploited in this study is between
30 seconds of a longitude/latitude degree (≈ 1 km2).
Temperature: average monthly temperature (multiplied by 10 ◦C) between 1950 and 2000
Precipitation: average monthly precipitation (mm) between 1950 and 1990
F.5 Land scape
Elevation: elevation (m) of each community based on the Shuttle Radar Topography Mission
(SRTM) Digital Elevation Model (DEM) and directly available in the DHS data
Slope: slope (percent) provided by Nunn and Puga (2012) (http://diegopuga.org/data/rugged/
#grid); the spatial resolution exploited in this study is between 30 seconds of a longitude/latitude
degree (≈ 1 km2).
Terrain roughness: terrain roughness (percent) provided by Nunn and Puga (2012) (http:
//diegopuga.org/data/rugged/#grid); the spatial resolution exploited in this study is between
30 seconds of a longitude/latitude degree (≈ 1 km2).
45
Interim Report for Economic Analysis of Political Shocks, IDE-JETRO, FY 2015
F.6 Soil quality
The data on soil quality is provided by the “Harmonized World Soil Database” (Fisher et al. (2008);
http://webarchive.iiasa.ac.at/Research/LUC/External-World-soil-database/HTML/index.
html?sb=1). The spatial resolution exploited in this study is between 30 seconds of a longi-
tude/latitude degree (≈ 1 km2).
Nutrient availability: an indicator for nutrient availability, which takes one if a community is
characterized as having “moderate, severe, or very severe constraint” (the reference group is “no
or slight constraint”)
Nutrient retention capacity: an indicator for nutrient retention capacity, which takes a value
of one if a community is characterized as having “moderate, severe, or very severe constraint” (the
reference group is “no or slight constraint”)
Rooting conditions: an indicator for rooting conditions, which takes a value of one if a commu-
nity is characterized as having “moderate, severe, or very severe constraint” (the reference group
is “no or slight constraint”)
Oxygen availability to roots: an indicator for oxygen availability to roots, which takes a value
of one if a community is characterized as having “moderate, severe, or very severe constraint” (the
reference group is “no or slight constraint”)
Excess salts: an indicator for excess salts, which takes a value of one if a community is charac-
terized as having “moderate, severe, or very severe constraint” (the reference group is “no or slight
constraint”)
Field-management constraint: an indicator for field-management constraint (workability),
which takes a value of one if a community is characterized as having “moderate, severe, or very
severe constraint” (the reference group is “no or slight constraint”)
46

Interim Report for Economic Analysis of Political Shocks, IDE-JETRO, FY 2015
References
Abu-Saad, K. and Fraser, D. (2010). Maternal Nutrition and Birth Outcomes. Epidemiologic
Reviews, 32:5–25.
Adhvaryu, A. and Fenske, J. (2014). Conflict and the Formation of Political Beliefs in Africa.
HiCN Working Paper, 164.
Ai, C. and Norton, E. C. (2003). Interaction Terms in Logit and Probit Models. Economics Letters,
80(1):123–129.
Akresh, R., Bhalotra, S., Leone, M., and Osili, U. O. (2012a). War and Stature: Growing Up
during the Nigerian Civil War. American Economic Review, 102(3):273–277.
Akresh, R., Lucchetti, L., and Thirumurthy, H. (2012b). Wars and Child Health: Evidence from
the Eritrean-Ethiopian Conflict. Journal of Development Economics, 99(2):330–340.
Akresh, R., Verwimp, P., and Bundervoet, T. (2011). Civil War, Crop Failure, and Child Stunting
in Rwanda. Economic Development and Cultural Change, 59(4):777–810.
Alderman, H., Hoddinott, J., and Kinsey, B. (2006). Long Term Consequences of Early Childhood
Malnutrition. Oxford Economic Papers, 58(3):450–474.
Almond, D. (2006). Is the 1918 Influenza Pandemic Over? Long-term Effects of In Utero Influenza
Exposure in the Post-1940 U.S. Population. Journal of Political Economy, 114(4):672–712.
Almond, D., Edlund, L., and Palme, M. (2009). Chernobyl’s Subclinical Legacy: Prenatal Expo-
sure to Radioactive Fallout and School Outcomes in Sweden. Quarterly Journal of Economics,
124(4):1729–1772.
Almond, D. and Mazumder, B. (2005). The 1918 Influenza Pandemic and Subsequent Health
Outcomes: An Analysis of SIPP Data. American Economic Review: Papers & Proceedings,
95(2):258–262.
Almond, D. and Mazumder, B. (2011). Health Capital and the Prenatal Environment: The Effect
of Ramadan Observance during Pregnancy. American Economic Journal: Applied Economics,
3(4):56–85.
Almond, D., Mazumder, B., and van Ewijk, R. (2015). In Utero Ramadan Exposure and Children’s
Academic Performance. Economic Journal, 125(589):1501–1533.
47

Interim Report for Economic Analysis of Political Shocks, IDE-JETRO, FY 2015
Alsan, M. (2015). The Effect of the TseTse Fly on African Development. American Economic
Review, 105(1):382–410.
Altonji, J. G., Elder, T. E., and Taber, C. R. (2005). Selection on Observed and Unobserved Vari-
ables: Assessing the Effectiveness of Catholic Schools. Journal of Political Economy, 113(1):151–
184.
Amarasinghe, A., Kuritsky, J. N., Letson, G. W., and Margolis, H. S. (2011). Dengue Virus
Infection in Africa. Emerging Infectious Diseases, 17(8):1349–1353.
Baez, J. E. (2011). Civil Wars beyond Their Borders: The Human Capital and Health Consequences
of Hosting Refugees. Journal of Development Economics, 96(2):391–408.
Bhatt, S., Weiss, D. J., Cameron, E., Bisanzio, D., Mappin, B., Dalrymple, U., Battle, K. E.,
Moyes, C. L., Henry, A., Eckhoff, P. A., Wenger, E. A., Briet, O., Penny, M. A., Smith, T. A.,
Bennett, A., Yukich, J., Eisele, T. P., Griffin, J. T., Griffin, C. A., Fergus, C. A., Lynch, M.,
Lindgren, F., Cohen, J. M., L., C., Murray, J., Smith, D. L., Hay, S. I., Cibulskis, R. E., and
Gething, P. W. (2015). The Effect of Malaria Control on Plasmodium Falciparum in Africa
between 2000 and 2015. Nature. Published online 16 September 2015.
Black, R. E., Morris, S. S., and Bryce, J. (2003). Where and Why are 10 Million Children Dying
Every Year? The Lancet, 361(9376):2226–2234.
Blanford, J. I., Blanford, S., Crane, R. G., Mann, M. E., Paaijmans, K. P., Paaijmans, K. P.,
Schreiber, K. V., and Thomas, M. B. (2013). Implications of Temperature Variation for Malaria
Parasite Development across Africa. Scientic Report, 3(1300):1–11.
Blattman, C. and Miguel, E. (2010). Civil War. Journal of Economic Literature, 48(1):3–57.
Brabin, B. J. (1983). An Analysis of Malaria in Pregnancy in Africa. Bulletin of the World Helath
Organization, 61(6):1005–1016.
Brair, M.-E., Brabin, B., Milligan, P., Maxwell, S., and Hart, C. A. (1994). Reduced Transfer of
Tetanus Antibodies with Placental Malaria. The Lancet, 343(8891):208–209.
Brentlinger, P., Behrens, C. B., and Micek, M. A. (2006). Challenges in the Concurrent Manage-
ment of Malaria and HIV in Pregnancy in Sub-Saharan Africa. The Lancet Infectious Diseases,
6(2):100–111.
Bundervoet, T., Verwimp, P., and Akresh, R. (2009). Heath and Civil War in Rural Burundi.
Journal of Human Resources, 44(2):536–563.
48

Interim Report for Economic Analysis of Political Shocks, IDE-JETRO, FY 2015
Camacho, A. (2008). Stress and Birth Weight: Evidence from Terrorist Attacks. American Eco-
nomic Review: Papers & Proceedings, 98(2):511–515.
Cane, M. A., Miguel, E., Burke, M., Hsiang, S. M., Lobell, D. B., Meng, K. C., and Satyanath, S.
(2014). Temperature and Violence. Nature Climate Change, 4:234–235.
Cibelli, K., Hoover, A., and Kruger, J. (2009). Descriptive Statistics from Statements to the
Liberian Truth and Reconciliation Commission. The Benetech Human Rights Program.
Cohee, L. M., Kalilani-Phiri, L., Boudova, S., Joshi, S., Mukadam, R., Seydel, K. B., Mawindo,
P., Thesing, P., Kamiza, S., Muehlenbachs, K. M. A., Taylor, T. E., and Laufer, M. K. (2014).
Submicroscopic Malaria Infection during Pregnancy and the Impact of Intermittent Preventive
Treatment. Malaria Journal, 13(1):1–9.
Collier, P., Elliott, V. L., Hegre, H., Hoeffler, A., Reynal-Querol, M., and Sambanis, N. (2003).
Breaking the Conflict Trap: Civil War and Development Policy. World Bank Publications.
Policy Research Reports.
Cortright, D., Lopez, G. A., and Conroy, R. W. (2000). Flawed UN Arms Embargoes in Somalia,
Liberia, and Rwanda. Lynne Rienner Publishers, Inc., 1800 30th Street, Boulder, Colorado
80301. Chapter 10 in The Sanctions Decade: Assessing UN Strategies in the 1990s, edited by
David Cortright and George A. Lopez.
Cottrell, G., Mary, J.-Y., Barro, D., and Cot, M. (2007). The Importance of the Period of Malarial
Infection during Pregnancy on Birth Weight in Tropical Africa. American Journal of Tropical
Medicine and Hygiene, 76(5):849–854.
Craig, M. H., Snow, R. W., and le Sueur, D. (1999). A Climate-based Distribution Model of
Malaria Transmission in Sub-Saharan Africa. Parasitology Today, 15(3):105–111.
Dabalen, A. L. and Paul, S. (2014). Effect of Conflict on Dietary Diversity: Evidence from Cote
d’Ivoir. World Development, 58:143–158.
Dabo, A. (2012). In the Presence of Absence: Truth-telling and Displacement in Liberia. pages
1–16. ICTJ and the Brookings-LSE Project on Internal Displacement.
Damme, W. V. (1999). How Liberian and Sierra Leonean Refugees Settled in the Forest Region
of Guinea (1990-1996). Journal of Refugee Studies, 12(1):36–53.
de Moraes-Pinto, M. I., Verhoeff, F., Chimsuku, L., Milligan, P. J. M., Wesumperuma, L., Broad-
head, R. L., Brabin, B. J., and Johnson, P. M. (1998). Placental Antibody Transfer: Influence
49

Interim Report for Economic Analysis of Political Shocks, IDE-JETRO, FY 2015
of Maternal HIV Infection and Placental Malaria. Archives of Disease in Childhood Fetal &
Neonatal Edition, 79(3):F202–F205.
Denov, M. (2015). Children Born of Wartime Rape: The Intergenerational Realities of Sexual
Violence and Abuse. Ethnic, Medicine and Public Health, 1(1):61–68.
Desai, M., ter Kuile, F. O., Nosten, F., McGready, R., Asamoa, K., Brabin, B., and Newman, R. D.
(2007). Epidemiology and Burden of Malaria in Pregnancy. The Lancet Infectious Diseases,
7(2):93–104.
Dick, S. (2002). Responding to Protracted Refugee Situations: A Case Study of Liberian Refugees
in Ghana. United Nations High Commissioner for Refugees (UNHCR), Evaluation and Policy
Analysis Unit (EPAU).
Dicko, A., Mantel, C., Thera, M. A., Doumbia, S., Diallo, M., Diakite, M., Sagara, I., and Doumbo,
O. K. (2003). Risk Factors for Malaria Infection and Anemia for Pregnant Women in the Sahel
Area of Bandiagara, Mali. Acta Tropica, 89(1):17–23.
Dorman, E. and Shulman, C. (2000). Malaria in Pregnancy. Current Obstetrics & Gynaecology,
10(4):183–189.
Downie, R. (2012). The Road to Recovery: Rebuilding Liberia’s Health System. A Report of the
Center for Strategic & International Studies (CSIS), Global Health Policy Center.
Duale, S. and Mataya, R. (2007). Assessment of Health Training Institutions in Liberia. USAID.
Fahmy, N. T., Villinski, J. T., Bolay, F., Stoops, C. A., Tageldin, R. A., Fakoli, L., Okasha, O.,
Obenauer, P. J., and II, J. W. D. (2015). The Seasonality and Ecology of the Anopheles Gambiae
Complex (Dipetra: Culicidae) in Liberia: Using Molecular Identification. Journal of Medical
Entomology, 52(3):475–482.
Field, E., Robles, O., and Torero, M. (2009). Iodine Deficiency and Schooling Attainment in
Tanzania. American Economic Journal: Applied Economics, 1(4):140–169.
Fisher, G., Nachtergaele, F. O., Prieler, S., van Velthuizen, H., Verelst, L., and Wiberg, D. (2008).
Global Agro-ecological Zones Assessment for Agriculture (gaez 2008). IIASA, Laxenburg, Austria
and FAO, Rome, Italy.
Fortson, J. G. (2009). HIV/AIDS and Fertility. American Economic Journal: Applied Economics,
1(3):170–194.
50

Interim Report for Economic Analysis of Political Shocks, IDE-JETRO, FY 2015
Foster, D., Heins, D., Kalla, M., McKenzie, M. G., O’Neal, J., Park, R., Phillips, R., Prestholdt,
J., II, A. K. S., and Young, L. A. (2009). A House with Two Rooms: Final Report of the Truth
Reconciliation Commission of Liberia Diaspora Project. DRI Press, Saint Paul, Minnesota. The
Advocates for Human Rights.
Friedman, J. F., Mital, P., Kanzaria, H. K., Olds, G. R., and Kurtis, J. D. (2007). Schistosomiasis
and Pregnancy. Trends in Parasitology, 23(4):159–164.
Gelfand, H. M. (1955). Anopheles Gambias Giles and Anopheles Melas Theobald in a Coastal
Area of Liberia, West Africa. Transactions of the Royal Society of Tropical Medicine & Hygiene,
49(6):508–527.
Gething, P. W., Patil, A. P., Smith, D. L., Guerra, C. A., Elyazar, I. R., Johnston, G. L., Taem,
A. J., and Hay, S. I. (2011). A New World Malaria Map: Plasmodium Falciparum Endemicity
in 2010. Malaria Journal, 10(378).
Ghobarah, H. A., Huth, P., and Russett, B. (2003). Civil Wars Kill and Maim People - Long after
the Shooting Stops. American Political Science Review, 97(2):189–202.
Ghobarah, H. A., Huth, P., and Russett, B. (2004). The Post-war Public Health Effects of Civil
Conflict. Social Science & Medicine, 59(4):864–884.
Greene, W. (2004). The Behavior of the Maximum Likelihood Estimator of Limited Dependent
Variable Models in the Presence of Fixed Effects. Econometrics Journal, 7(1):98–119.
Guyatt, H. L. and Snow, R. W. (2001). Malaria in Pregnancy as an Indirect Cause of Infant
Mortality in Sub-Saharan Africa. Transactions of the Royal Society of Tropical Medicine &
Hygiene, 95(6):569–576.
Guyatt, H. L. and Snow, R. W. (2004). Impact of Malaria during Pregnancy on Low Birth Weight
in Sub-Saharan Africa. Clinical Microbiology Reviews, 17(4):760–769.
Hijmans, R. J., Cameron, S. E., Parra, J. L., Jones, P. G., and Jarvis, A. (2005). Very High Resolu-
tion Interpolated Climate Surfaces for Global Land Areas. International Journal of Climatology,
25(15):1965–1978.
Hogh, B., Marbiah, N. T., Petersen, E., Dolopaye, E., Willcox, M., Bjorkman, A., Hanson, A. P.,
and Gottschau, A. (1993). Classification of Clinical Falciparum Malaria and its Use for the
Evaluation of Chemosuppression in Children under Six Years of Age in Liberia, West Africa.
Acta Tropica, 54(2):105–115.
51

Interim Report for Economic Analysis of Political Shocks, IDE-JETRO, FY 2015
Hotez, P. J. (2015). Neglected Tropical Diseases in the Ebola-affected Countries of West Africa.
PLoS Neglected Tropical Diseases, 9(6):1–5. doi: 10.1371/journal.pntd.0003671.
Hsiang, S. M., Burke, M., and Miguel, E. (2013). Quantifying the Influence of Climate on Human
Conflict. Science, 341(6151):1212–1226.
Huynh, B.-T., Fievet, N., Gbaguidi, G., Dechavanne, S., Borgella, S., Guezo-Mevo, B., Massoug-
bodji, A., Tuikue, N., Deloron, P., and Cot, M. (2011). Influence of the Timing of Malaria
Infection during Pregnancy on Birth Weight and on Maternal Anemia in Benin. American
Journal of Tropical Medicine and Hygiene, 85(2):214–220.
James, W. H. (1971). Cycle Day of Insemination, Coital Rate, and Sex Ratio. The Lancet,
297(7690):112–114.
Jesuit Refugee Service (2007). Six Months after the Official Closure of the IDP Camps. JRS
Assessment of the IDP Return Process in Liberia.
Kalemli-Ozcan, S. and Turan, B. (2011). HIV and Fertility Revisited. Journal of Development
Economics, 96(1):61–65.
Kalilani, L., Mofolo, I., Chaponda, M., Rogerson, S. J., and Meshnick, S. R. (2010). The Effect
of Timing and Frequency of Plasmodium Falciparum Infection during Pregnancy on the Risk of
Low Birth Weight and Maternal Anemia. Transactions of the Royal Society of Tropical Medicine
& Hygiene, 104(6):416–422.
Kelly, E. (2011). The Scourge of Asian Flu: In Utero Exposure to Pandemic Influenza and the
Development of a Cohort of British Children. Journal of Human Resources, 46(4):660–694.
Kruk, M. E., Rockers, P. C., Williams, E. H., Varpilah, S. T., Macauley, R., Saydee, G., and
Galea, S. (2010). Availability of Essential Health Services in Post-conflict Liberia. Bulletin of
the World Health Organization, 88(7):527–534.
Kudamatsu, M., Persson, T., and Stromberg, D. (2014). Weather and Infant Mortality in Africa.
mimeo.
Kuhlman, T. (2002). Responding to Protracted Refugee Situations: A Case Study of Liberian
Refugees in Cote d’Ivoire. United Nations High Commissioner for Refugees (UNHCR), Evalua-
tion and Policy Analysis Unit (EPAU).
52

Interim Report for Economic Analysis of Political Shocks, IDE-JETRO, FY 2015
Kuile, F. O. T., Parise, M. E., Verhoeff, F. H., Yakumar, V. U., Newman, R. D., Eijk, A. M. V.,
Rogerson, S. J., and Steketee, R. W. (2004). The Burden of Co-infection with Human Immun-
odeficiency Virus Type 1 and Malaria in Pregnant Women in Sub-Saharan Africa. American
Journal of Tropical Medicine and Hygiene, 71(2 suppl):41–54.
Lagerberg, R. E. (2008). Malaria in Pregnancy: A Literature Review. Journal of Midwifery&
Women’s Health, 53(3):209–215.
Lancaster, T. (2000). The Incidental Parameter Problem since 1948. Journal of Econometrics,
95(2):391–413.
Lawn, J. E., Cousens, S., and Zupan, J. (2005). 4 Million Neonatal Deaths: When? Where? Why?
The Lancet, 365(9462):891–900.
Lawn, J. E., Kerber, K., Enweronu-Laryea, C., and Cousens, S. (2010). 3.6 Million Neonatal
Deaths - What is Progressing and What is Not? Seminars in Perinatology, 34(6):371–386.
Lawrie, N. and Damme, W. V. (2003). The Importance of Refugee-host Relations: Guinea 1990-
2003. The Lancet, 362(9383):575.
Leach, M. (1992). Dealing with Displacement: Refugee-host Relations, Food and Forest Resources
in Sierra Leone Mende Communities during the Liberian Influx, 1990-1991. IDE Research Re-
ports 22.
Lee, P. T., Kruse, G. R., Chan, B. T., Massaquoi, M. B., Panjabi, R. R., and Dahn, B. T. (2011).
An Analysis of Liberia’s 2007 National Health Policy: Lessons for Health Systems Strengthening
and Chronic Disease Care in Poor, Post-conflict Countries. Globalization and Health, 7(37):1–14.
Levy, A., Fraser, D., Katz, M., Mazor, M., and Sheiner, E. (2005). Maternal Anemia during
Pregnancy is an Independent Risk Factor for Low Birthweight and Preterm Delivery. European
Journal of Obstetrics & Gynecology and Reproductive Biology, 122(2):182–186.
Liu, L., Oza, S., Hogan, D., Perin, J., Rudan, I., Lawn, J. E., Cousens, S., Mathers, C., and
Black, R. E. (2015). Global, Regional, and National Causes of Child Mortality in 2000-2013,
with Projections to Inform Post-2015 Priorities: An Updated Systematic Analysis. The Lancet,
385(9966):430–440.
Livingstone, F. B. (1958). Anthropological Implications of Sickle Cell Gene Distribution in West
Africa. American Anthropologist, 60(3):533–562.
53

Interim Report for Economic Analysis of Political Shocks, IDE-JETRO, FY 2015
Mama, A. (2014). Beyond Survival: Militarism, Equity and Women’s Security. Brill Academic
Pub. Chapter 3 in Development and Equity: An Interdisciplinary Exploration by Ten Scholars
from Africa, Asia and Latin America’ edited by Dick Foeken, Ton Dietz, Leo De Haan, and
Linda Johnson.
Mansour, H. and Rees, D. I. (2012). Armed Conflict and Birth Weight: Evidence from the Al-aqsa
Intifada. Journal of Development Economics, 99(1):190–199.
Menendez, C. and Mayor, A. (2007). Congenital Malaria: The Least Known Consequence of
Malaria in Pregnancy. Seminars in Fetal and Neonatal Medicine, 12(3):207–213.
Menendez, C., Ordi, J., Ismail, M. R., Ventura, P. J., Aponte, J. J., Kahigwa, E., Font, F., and
Alonso, P. L. (2000). The Impact of Placental Malaria on Gestational Age and Birth Weight.
Journal of Infectious Diseases, 181(5):1740–1745.
Minoiu, C. and Shemyakina, O. N. (2012). Child Health and Conflict in Cote d’Ivoire. American
Economic Review, 102(3):294–299.
Minoiu, C. and Shemyakina, O. N. (2014). Armed Conflict, Household Victimization, and Child
Health in Cote d’Ivoire. Journal of Development Economics, 108:237–255.
Momodu, S. (2013). UNHCR Completes Repatriation of 155,000 Liberians. UNHCR, http:
//www.unhcr.org/50e6af089.html.
Montalvo, J. G. and Reynal-Querol, M. (2007). Fighting against Malaria: Prevent Wars while
Waiting for the “Miraculous” Vaccine. Review of Economics and Statistics, 89(1):165–177.
Nafo-Traore, F. and Nabarro, D. (2005). Breaking the Cycle of Malaria and Death in Emergencies:
The Way Forward. Humanitarian Change, 31:3–5. The Global Malaria Crisis.
National Malaria Control Program (NMCP) [Liberia], Ministry of Health and Social Welfare
(MOHSW), Liberia Institute of Statistics and Geo-information Services (LISGIS) and ICF In-
ternational (2012). Liberia Malaria Indicator Survey 2011. Monrovia, Liberia: NMCP, LISGIS,
and ICF International.
National Transitional Government of Liberia (2004). Joint Needs Assessment.
Niewiesk, S. (2014). Maternal Antibodies: Clinical Significance, Mechanism of Interference with
Immune Response, and Possible Vaccination Strategies. Frontiers in Immunology, 5(446):1–15.
Nilsson, D. (2003). Liberia - the Eye of the Storm. pages 1–28. Studies on Emergencies and
Disaster Relief No. 10, Nordiska Afrikainstitutet.
54
Interim Report for Economic Analysis of Political Shocks, IDE-JETRO, FY 2015
Noor, A. M., Kinyoki, D. K., Mundia, C. W., Kabaria, C. W., Mutua, J. W., Alegana, V. A., Fall,
I. S., and Snow, R. W. (2014). The Changing Risk of Plasmodium Falciparum Malaria Infection
in Africa: 2000-2010: A Spatial and Temporal Analysis of Transmission Intensity. The Lancet,
383(9930):1739–1747.
Nunn, N. and Puga, D. (2012). Ruggedness: The Blessing of Bad Geography in Africa. Review of
Economics and Statistics, 94(1):20–36.
Omata, N. (2012). Repatriation and Integration of Liberian Refugees from Ghana: the Importance
of Personal Networks in the Country of Origin. Journal of Refugee Studies, 26(2):265–282.
Oster, E. (2015). Unobservable Selection and Coefficient Stability. mimeo.
Othoro, C., Moore, J. M., Wannemuehler, K., Nahlen, B. L., Otieno, J., Slutsker, L., Lal, A. A.,
and Shi, Y. P. (2006). Evaluation of Various Methods of Maternal Placental Blood Collection
for Immunology Studies. Clinical and Vaccine Immunology, 13(5):568–574.
Owadi, B., Kendle, A., and Koiwu, T. (2010). The State of Food and Nutrition Insecurity in
Liberia: Comprehensive Food Security and Nutrition Survey 2010. Ministry of Agriculture and
World Food Programme, VAM Food Security Analysis.
Patz, J. A. and Olson, S. H. (2006). Malaria Risk and Temperature: Influences from Global
Climate Change and Local Land Use Practices. Proceedings of the National Academy of Science
of the United States of America (PNAS), 103(15):5635–5636.
Piel, F. B., Patil, A. P., Howes, R. E., Nyangiri, O. A., Gething, P. W., Williams, T. N., Weather-
all, D. J., and Hay, S. I. (2010). Global Distribution of the Sickle Cell Gene and Geograph-
ical Confirmation of the Malaria Hypothesis. Nature Communications, 1(8):1–7. 104 DOI:
10.1038/ncomms1104.
Raleigh, C., Hegre, H., Carlsen, J., and Ormhaug, C. (2012). Armed Conflict Location and Event
Dataset (ACLED) Codebook. Center for the Study of Civil War, International Peace Research
Institute, Oslo (PRIO).
Rayco-Solon, P., Fulford, A. J., and Prentice, A. M. (2005). Differential Effects of Seasonality
on Preterm Birth and Intrauterine Growth Restriction in Rural Africans. American Journal of
Clinical Nutrition, 81(1):134–139.
Rogerson, S. J., den Broek, N. R. V., Chaluluka, E., Qongwane, C., Mhango, C. G., and Molyneux,
M. E. (2000). Malaria and Anemia in Antenatal Women in Blantyre, Malawi: A Twelve-month
Survey. American Journal of Tropical Medicine and Hygiene, 62(3):335–340.
55

Interim Report for Economic Analysis of Political Shocks, IDE-JETRO, FY 2015
Rogerson, S. J., Mkundika, P., and Kanjala, M. (2003). Diagnosis of Plasmodium Falciparum
Malaria at Delivery: Comparison of Blood Film Preparation Methods and of Blood Films with
Histology. Journal of Clinical Microbiology, 41(4):1370–1374.
Ross, R. (1910). The Prevention of Malaria. Boydell & Brewer Inc., New York.
Rowland, M. and Nosten, F. (2001). Malaria Epidemiology and Control in Refugee Camps and
Complex Emergencies. Annals of Tropical Medicine & Parasitology, 95(8):741–754.
Salama, P., Spiegel, P., Talley, L., and Waldman, R. (2004). Lessons Learned from Complex
Emergencies over Past Decade. The Lancet, 364(9447):1801–1813.
Schantz-Dunn, J. and Nour, N. M. (2009). Malaria and Pregnancy: A Global Health Perspective.
Reviews in Obstetrics & Gynecology, 2(3):186–192.
Somah, S. (2005). Combating Malaria in the Next Liberian Republic. The Perspective. http:
//www.theperspective.org/2005/jan/malaria.html.
Stanley C. Oaks, J., Mitchell, V. S., Pearson, G. W., and Carpenter, C. C. J. (1991). Malaria:
Obstacles and Opportunities. National Academy Press, Washington D. C.
Steketee, R. W., Nahlen, B. L., Parise, M. E., and Menendez, C. (2001). The Burden of Malaria
in Pregnancy in Malaria-endemic Areas. American Journal of Tropical Medicine and Hygiene,
64(1):28–35.
Steketee, R. W., Wirima, J. J., Bloland, P. B., Chilima, B., Mermin, J. H., Chitsulo, L., and Bre-
man, J. G. (1996). Impairment of a Pregnant Woman’s Acquired Ability to Limit Plasmodium
Falciparum by Infection with Human Immunodeficiency Virus Type-1. American Journal of
Tropical Medicine and Hygiene, 55(1 suppl):42–49.
Trivers, R. L. and Willard, D. E. (1973). Natural Selection of Parental Ability to Vary the Sex
Ratio of Offspring. Science, 179(4068):90–92.
Umbers, A. J., Aitken, E. H., and Rogerson, S. J. (2011). Malaria in Pregnancy: Small Babies,
Big Problem. Trends in Parasitology, 27(4):168–175.
Uneke, C. J. (2007a). Congenital Plasmodium Falciparum Malaria in Sub-Saharan Africa: A
Rarity or Frequent Occurrence? Parasitology Research, 101(4):835–842.
Uneke, C. J. (2007b). Impact of Placental Plasmodium Falciparum Malaria on Pregnancy and
Perinatal Outcome in Sub-Saharan Africa, I: Introduction to Placental Malaria. Yale Journal
of Biology and Medicine, 80(2):39–50.
56

Interim Report for Economic Analysis of Political Shocks, IDE-JETRO, FY 2015
Uneke, C. J. (2007c). Impact of Placental Plasmodium Falciparum Malaria on Pregnancy and
Perinatal Outcome in Sub-Saharan Africa, II: Effects of Placental Malaria on Perinatal Outcome;
Malaria and HIV. Yale Journal of Biology and Medicine, 80(3):95–103.
UNFPA (2011). In-depth Study on Reasons for High Incidence of Sexual and Gender Based
Violence in Liberia - Recommendations on Prevention and Response. Government of Liberia/UN
Joint Programme on Sexual and Gender Based Violence, supported by Swedish International
Development Cooperation (SIDA).
UNICEF (2013). Levels & Trends in Child Mortality: Report 2013.
van Ewijk, R. (2011). Long-term Health Effects on the Next Generation of Ramadan Fasting
during Pregnancy. Journal of Health Economics, 30(6):1246–1260.
Varpilah, S. T., Safer, M., Frenkel, E., Baba, D., Massaquoi, M., and Barrow, G. (2011). Rebuilding
Human Resources for Health: A Case Study from Liberia. Human Resources for Health, 9(11):1–
9.
Verpoorten, M. (2009). Household Coping in War- and Peacetime: Cattle Sales in Rwanda, 1991-
2001. Journal of Development Economics, 88(1):67–86.
Villar, J., Merialdi, M., Gulmezoglu, A. M., Abalos, E., Carroli, G., Kulier, R., and de Oni, M.
(2003). Nutritional Interventions during Pregnancy for the Prevention or Treatment of Maternal
Morbidity and Preterm Delivery: An Overview of Randomized Controlled Trials. Journal of
Nutrition, 133(5):1606S–1625S.
Waldron, I. (1983). Sex Differences in Human Mortality: The Role of Genetic Factors. Social
Science & Medicine, 17(6):321–333.
Walker, P. G. T., ter Kuile, F. O., Garske, T., Menendez, C., and Ghani, A. C. (2014). Estimated
Risk of Placental Infection and Low Birthweight Attributable Plasmodium Falciparum Malaria
in Africa in 2012: A Modelling Study. The Lancet Global Health, 2(8):e460–e467.
WHO (2005). Malaria Control in Complex Emergencies: An Inter-agency Field Handbook.
WHO (2013). World Malaria Report 2013. WHO Global Malaria Programme.
Williams, R. (2013). Multicollinearity.
Wright, N. and Savage, E. (2007). Real-time Evaluation of UNHCR’s IDP Operation in Liberia.
pages 1–18. PDES/2007/02 - RTE 2, Policy Development and Evaluation Service (PDES),
UNHCR.
57

Interim Report for Economic Analysis of Political Shocks, IDE-JETRO, FY 2015
Young, A. (2005). The Gift of the Dying: The Tragedy of AIDS and the Welfare of Future African
Generations. Quarterly Journal of Economics, 120(2):423–466.
Zeleza, P. T. and Eyoh, D. (2003). Encyclopedia of Twentieth-Century African History. Routledge.
Zhou, A., Megnekou, R., Leke, R., Fogako, J., Metenou, S., Trock, B., Taylor, D. W., and Leke,
R. F. G. (2002). Prevalence of Plasmodium Falciparum Infection in Pregnant Cameroonian
Women. American Journal of Tropical Medicine and Hygiene, 67(6):566–570.
58

Interim Report for Economic Analysis of Political Shocks, IDE-JETRO, FY 2015
0.00 - 0.07
0.07 - 0.14
0.14 - 0.23
0.23 - 0.33
0.33 - 0.41
0.41 - 0.49
0.49 - 0.58
0.58 - 0.77
Figure 1: Malaria endemicity map (Plasmodium falciparum) in 2010 and locations of DHScommunities
Source: Gething et al. (2011))
59

Interim Report for Economic Analysis of Political Shocks, IDE-JETRO, FY 2015
1st war 2nd war
.05
.1.1
5.2
.25
.3
one−
year
mor
talit
y ra
te
1977 1980 1983 1986 1989 1992 1995 1998 2001 2004 2007 2010 2012
year of conception
endemicity (0−50 percentile) endemicity (50−100 percentile)
Figure 2: One-year mortality rate by the timing of conception
60

Interim Report for Economic Analysis of Political Shocks, IDE-JETRO, FY 2015
.05
.1.1
5.2
.25
.3
one−
year
mor
talit
y ra
te
1 2 3 4 5 6 7 8 9 10
endemicity (quantile)
conceived after the outbreak of the first war
conceived before the outbreak of the first war
Figure 3: One-year mortality rate by levels of endemicity
61

Interim Report for Economic Analysis of Political Shocks, IDE-JETRO, FY 2015−
.01
.01
.03
.05
estim
ate
1 2 3 4 5 6 7 8 9 10 11 12 24 36 48 60Z−month
Endemicity (50−100 percentile)
−.0
4.0
4.1
2.2
estim
ate
1 2 3 4 5 6 7 8 9 10 11 12 24 36 48 60Z−month
Endemicity (continuous)
Figure 4: Impacts of wartime pregnancy in malaria endemic areas on Z-month infant mortality(LPM)
Notes: (1) This figure reports the estimated α2 with 95% confidence intervals by varying the investigated survivalperiods. (2) Standard errors are robust to heteroskedasticity and clustered residuals within each community.
62
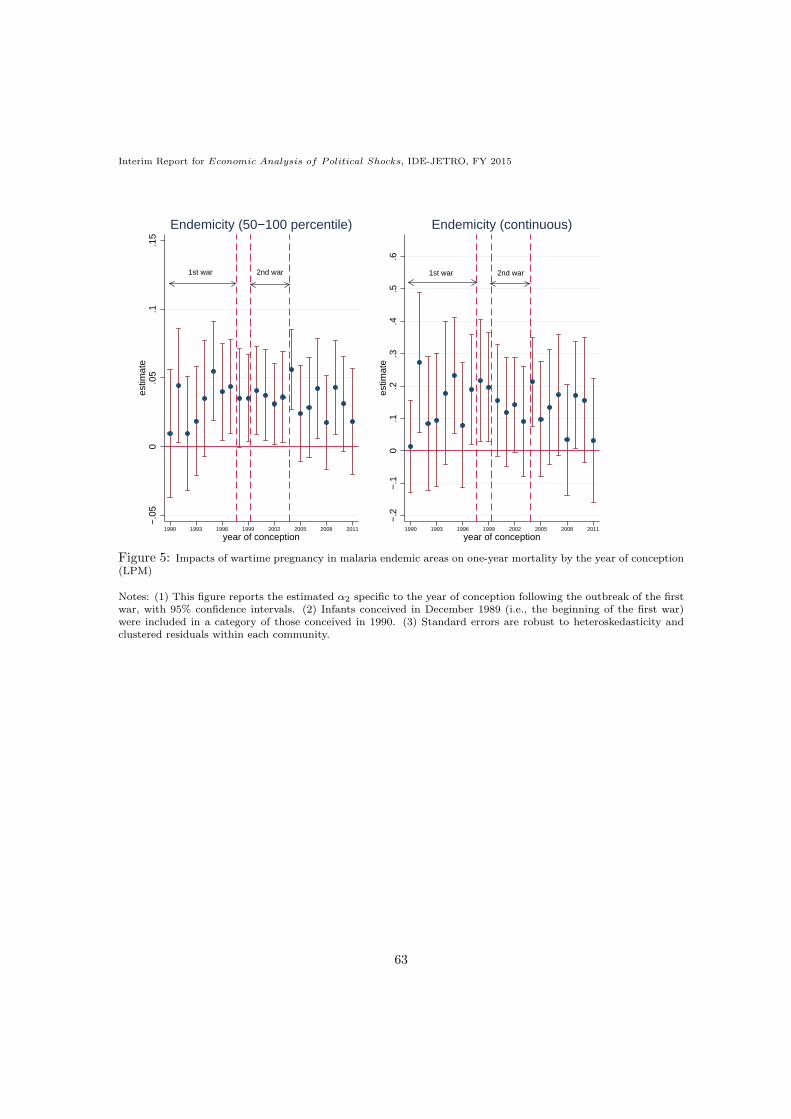
Interim Report for Economic Analysis of Political Shocks, IDE-JETRO, FY 2015
1st war 2nd war
−.0
50
.05
.1.1
5es
timat
e
1990 1993 1996 1999 2002 2005 2008 2011
year of conception
Endemicity (50−100 percentile)
1st war 2nd war
−.2
−.1
0.1
.2.3
.4.5
.6es
timat
e
1990 1993 1996 1999 2002 2005 2008 2011
year of conception
Endemicity (continuous)
Figure 5: Impacts of wartime pregnancy in malaria endemic areas on one-year mortality by the year of conception(LPM)
Notes: (1) This figure reports the estimated α2 specific to the year of conception following the outbreak of the firstwar, with 95% confidence intervals. (2) Infants conceived in December 1989 (i.e., the beginning of the first war)were included in a category of those conceived in 1990. (3) Standard errors are robust to heteroskedasticity andclustered residuals within each community.
63
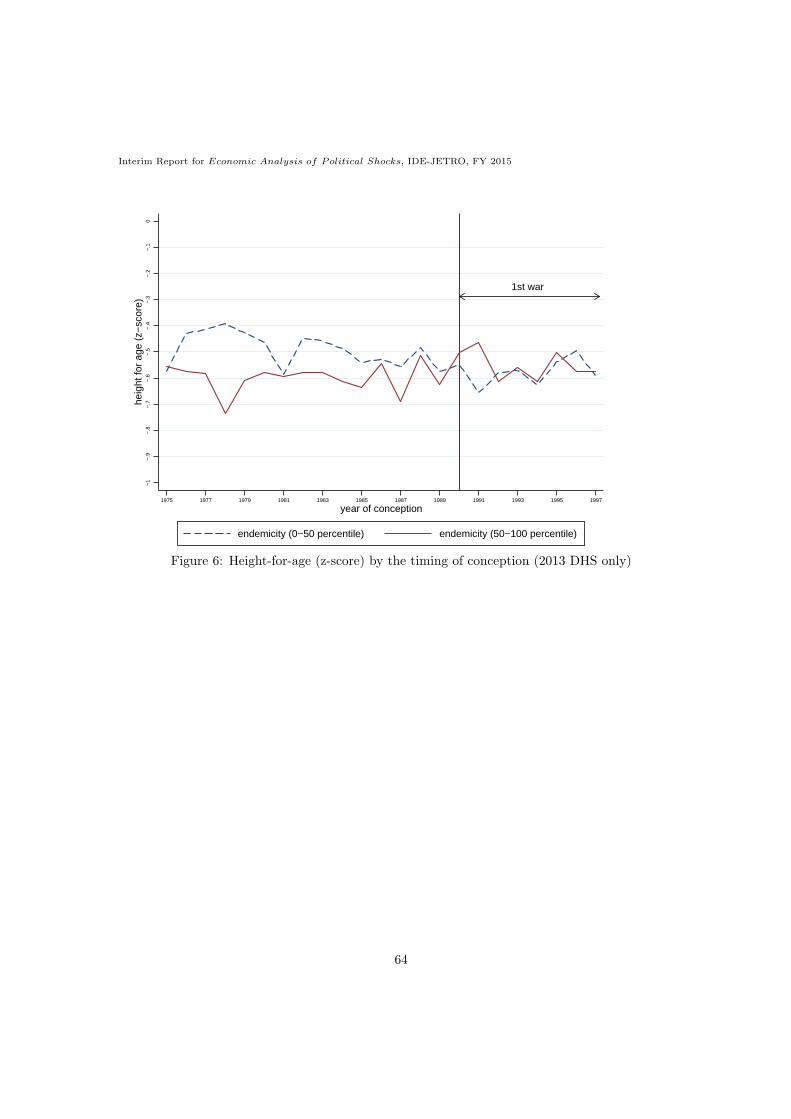
Interim Report for Economic Analysis of Political Shocks, IDE-JETRO, FY 2015
1st war
−1
−.9
−.8
−.7
−.6
−.5
−.4
−.3
−.2
−.1
0
heig
ht fo
r ag
e (z
−sc
ore)
1975 1977 1979 1981 1983 1985 1987 1989 1991 1993 1995 1997
year of conception
endemicity (0−50 percentile) endemicity (50−100 percentile)
Figure 6: Height-for-age (z-score) by the timing of conception (2013 DHS only)
64

Interim Report for Economic Analysis of Political Shocks, IDE-JETRO, FY 2015
National Geographic, Esri, DeLorme, HERE, UNEP-WCMC, USGS, NASA, ESA, METI, NRCAN, GEBCO, NOAA,
increment P Corp.
Figure A.1: Spatial distribution of battle events with district boundaries
Source: Armed Conflict Location and Event Database (ACLED)Notes: (1) In the data set, 265 conflicts are recorded. (2) The map of Liberia is sourced from DIVA-GIS (http://www.diva-gis.org/datadown).
65

Interim Report for Economic Analysis of Political Shocks, IDE-JETRO, FY 2015
010
000
2000
030
000
4000
050
000
no. o
f tot
al v
iole
nce
even
ts
050
010
0015
00no
. of s
exua
l vio
lenc
e ev
ents
1979 1982 1985 1988 1991 1994 1997 2000 2003year
Sexual violence Total violence
Figure A.2: Violence events by year
Source: Truth and Reconciliation Commission (TRC)Note: Sexual violence includes rape, gang rape, multiple rape, sexual abuse and sexual slavery (See also Table A.12).The figure includes all the violence events recorded (163,615 human rights violations).
66

Interim Report for Economic Analysis of Political Shocks, IDE-JETRO, FY 2015
0.2
.4.6
.81
no. o
f vio
lenc
e ev
ents
1 2 3 4 5 6 7 8 9 101112month
1989
010
2030
4050
no. o
f vio
lenc
e ev
ents
1 2 3 4 5 6 7 8 9 101112month
1990
02
46
8no
. of v
iole
nce
even
ts
1 2 3 4 5 6 7 8 9 101112month
1991
010
2030
no. o
f vio
lenc
e ev
ents
1 2 3 4 5 6 7 8 9 101112month
1992
010
2030
40no
. of v
iole
nce
even
ts
1 2 3 4 5 6 7 8 9 101112month
19930
2040
6080
no. o
f vio
lenc
e ev
ents
1 2 3 4 5 6 7 8 9 101112month
1994
02
46
810
no. o
f vio
lenc
e ev
ents
1 2 3 4 5 6 7 8 9 101112month
1995
010
2030
no. o
f vio
lenc
e ev
ents
1 2 3 4 5 6 7 8 9 101112month
1996
−1
1no
. of v
iole
nce
even
ts
1 2 3 4 5 6 7 8 9 101112month
1997
0.5
11.
52
no. o
f vio
lenc
e ev
ents
1 2 3 4 5 6 7 8 9 101112month
1998
02
46
810
no. o
f vio
lenc
e ev
ents
1 2 3 4 5 6 7 8 9 101112month
1999
01
23
45
no. o
f vio
lenc
e ev
ents
1 2 3 4 5 6 7 8 9 101112month
2000
02
46
no. o
f vio
lenc
e ev
ents
1 2 3 4 5 6 7 8 9 101112month
2001
05
1015
no. o
f vio
lenc
e ev
ents
1 2 3 4 5 6 7 8 9 101112month
2002
010
2030
4050
no. o
f vio
lenc
e ev
ents
1 2 3 4 5 6 7 8 9 101112month
2003
Figure A.3: Violence seasonality (sexual violence)
Source: Truth and Reconciliation Commission (TRC)Notes: (1) Sexual violence includes rape, gang rape, multiple rape, sexual abuse and sexual slavery. (2) The numberof violence events do not include cases if the year and month of alleged violation are not recorded in the dataset.Of the recorded 6,534 sexual violence cases, only 1,190 observations (approximately 18%) included information onboth the year and month of incidence.
67

Interim Report for Economic Analysis of Political Shocks, IDE-JETRO, FY 2015
050
100
150
200
no. o
f vio
lenc
e ev
ents
1 2 3 4 5 6 7 8 9 101112month
1989
050
010
0015
0020
00no
. of v
iole
nce
even
ts
1 2 3 4 5 6 7 8 9 101112month
1990
050
100
150
no. o
f vio
lenc
e ev
ents
1 2 3 4 5 6 7 8 9 101112month
1991
010
020
030
040
0no
. of v
iole
nce
even
ts
1 2 3 4 5 6 7 8 9 101112month
1992
020
040
060
0no
. of v
iole
nce
even
ts
1 2 3 4 5 6 7 8 9 101112month
19930
500
1000
1500
2000
no. o
f vio
lenc
e ev
ents
1 2 3 4 5 6 7 8 9 101112month
1994
050
100
150
200
no. o
f vio
lenc
e ev
ents
1 2 3 4 5 6 7 8 9 101112month
1995
020
040
060
080
0no
. of v
iole
nce
even
ts
1 2 3 4 5 6 7 8 9 101112month
1996
010
2030
4050
no. o
f vio
lenc
e ev
ents
1 2 3 4 5 6 7 8 9 101112month
1997
020
4060
80no
. of v
iole
nce
even
ts
1 2 3 4 5 6 7 8 9 101112month
1998
020
4060
80no
. of v
iole
nce
even
ts
1 2 3 4 5 6 7 8 9 101112month
1999
020
4060
80no
. of v
iole
nce
even
ts
1 2 3 4 5 6 7 8 9 101112month
2000
2040
6080
100
120
no. o
f vio
lenc
e ev
ents
1 2 3 4 5 6 7 8 9 101112month
2001
6080
100
120
140
no. o
f vio
lenc
e ev
ents
1 2 3 4 5 6 7 8 9 101112month
2002
050
010
0015
00no
. of v
iole
nce
even
ts
1 2 3 4 5 6 7 8 9 101112month
2003
Figure A.4: Violence seasonality (total violence)
Source: Truth and Reconciliation Commission (TRC)Notes: The number of violence events do not include cases if the year and month of alleged violation is not recordedin the dataset. Of the recorded 163,615 human rights violations, only 31,173 observations (approximately 19%)included information on both the year and month of incidence.
68

Interim Report for Economic Analysis of Political Shocks, IDE-JETRO, FY 2015
0.2
.4.6
.81
no. o
f con
flict
inci
denc
e
1 2 3 4 5 6 7 8 9 101112month
1989
05
1015
20no
. of c
onfli
ct in
cide
nce
1 2 3 4 5 6 7 8 9 101112month
1990
05
1015
no. o
f con
flict
inci
denc
e
1 2 3 4 5 6 7 8 9 101112month
1991
05
10no
. of c
onfli
ct in
cide
nce
1 2 3 4 5 6 7 8 9 101112month
1992
01
23
no. o
f con
flict
inci
denc
e
1 2 3 4 5 6 7 8 9 101112month
19930
24
68
no. o
f con
flict
inci
denc
e
1 2 3 4 5 6 7 8 9 101112month
1994
01
23
45
no. o
f con
flict
inci
denc
e
1 2 3 4 5 6 7 8 9 101112month
1995
02
46
no. o
f con
flict
inci
denc
e
1 2 3 4 5 6 7 8 9 101112month
1996
−1
1no
. of c
onfli
ct in
cide
nce
1 2 3 4 5 6 7 8 9 101112month
1997
−1
1no
. of c
onfli
ct in
cide
nce
1 2 3 4 5 6 7 8 9 101112month
1998
02
46
no. o
f con
flict
inci
denc
e
1 2 3 4 5 6 7 8 9 101112month
1999
0.5
11.
52
no. o
f con
flict
inci
denc
e
1 2 3 4 5 6 7 8 9 101112month
2000
02
46
no. o
f con
flict
inci
denc
e
1 2 3 4 5 6 7 8 9 101112month
2001
02
46
no. o
f con
flict
inci
denc
e
1 2 3 4 5 6 7 8 9 101112month
2002
02
46
8no
. of c
onfli
ct in
cide
nce
1 2 3 4 5 6 7 8 9 101112month
2003
Figure A.5: Violence seasonality (conflict incidence)
Source: Armed Conflict Location and Event Database (ACLED)Note: In the data set, 265 conflicts are recorded.
69

Interim Report for Economic Analysis of Political Shocks, IDE-JETRO, FY 2015
Table 1: Summary statistics
Endemicity (50-100 percentile) Endemicity (0-50 percentile)Mean Std. No. of Mean Std. No. of
obs. obs.Panel (A): Conceived before the warDie within 12 months (dummy) 0.15*** 0.36 4477 0.19 0.39 4862Male (dummy) 0.52 0.49 4477 0.51 0.49 4862Birth order 2.46 1.63 4477 2.46 1.66 4862Single birth (dummy) 0.96* 0.17 4477 0.97 0.16 4862Mother’s age at birth (years) 19.92 4.21 4477 19.96 4.16 4862Mother’s education (years) 2.10 5.99 4477 2.26 4.90 4862Mother’s experience of 0.29* 0.45 4457 0.30 0.46 4861terminated pregnancy (dummy)Conceived in rainy season 0.58 0.49 4477 0.57 0.49 4862(dummy)Urban (dummy) 0.20*** 0.40 4477 0.47 0.49 4862Longitude -8.82*** 0.94 4328 -10.17 0.90 4862Latitude 6.28 1.19 4328 6.28 0.57 4862Elevation (m) 213.91*** 145.27 4328 64.89 63.28 5862No. of battles (< 25 km) 4.85*** 7.84 4477 20.03 19.25 4862Malaria endemicity (0―1) 0.49*** 0.04 4477 0.34 0.05 4862Mean temperature (× 10 ◦C), 1950―2000 253.86*** 6.20 4477 258.08 3.30 4862Mean precipitation (mm), 1950―2000 210.93*** 46.29 4477 291.44 60.74 4862
Panel (B): Conceived after the outbreak of the warDie within 12 months (dummy) 0.11 0.31 21927 0.11 0.31 21661Male (dummy) 0.50 0.49 21927 0.51 0.49 21661Birth order 3.66*** 2.41 21927 3.48 2.38 21661Single birth (dummy) 0.95 0.19 21927 0.96 0.19 21661Mother’s age at birth (years) 25.39*** 6.76 21927 25.18 6.66 21661Mother’s education (years) 2.21*** 4.62 21927 2.97 5.46 21661Mother’s experience of 0.22** 0.42 21873 0.23 0.42 21631terminated pregnancy (dummy)Conceived in rainy season 0.54** 0.49 21927 0.53 0.49 21661(dummy)Urban (dummy) 0.21*** 0.41 21927 0.46 0.49 21661Longitude -8.84*** 0.93 21631 -10.18 0.89 21661Latitude 6.29*** 1.21 21631 6.27 0.59 21661Elevation (m) 217.68*** 145.94 21631 64.01 61.61 21661No. of battles (< 25 km) 4.68*** 7.35 21927 18.94 18.90 21661Malaria endemicity (0―1) 0.49*** 0.04 21927 0.34 0.05 21661Mean temperature (× 10 ◦C), 1950―2000 253.19*** 6.21 21927 257.92 3.27 21661Mean precipitation (mm), 1950―2000 214.35*** 45.97 21927 292.38 58.18 21661
Note: The equality of means between the high and low endemicity areas is examined for children conceived beforeand after the outbreak of the war, respectively. *** denotes significance at 1%, ** at 5%, and * at 10%.
70

Interim Report for Economic Analysis of Political Shocks, IDE-JETRO, FY 2015
Table 2: Impacts of wartime pregnancy in malaria endemic areas on one-year infant mortality (OLS)
Dependent variable: One if die within 12 months after the birthSample: All All All All All All 2007 DHS All
only & excludingBorn to Greatera mother Monrovialiving in her Districtbirth place
(a) (b) (c) (d) (e) (f) (g) (h)Conceived after the outbreak of the war× Malaria endemicity 0.029 - - - - - - -
(10-20 percentile) (0.022)× Malaria endemicity 0.024 - - - - - - -
(20-30 percentile) (0.023)× Malaria endemicity -0.028 - - - - - - -
(30-40 percentile) (0.027)× Malaria endemicity 0.016 - - - - - - -
(40-50 percentile) (0.023)× Malaria endemicity 0.035 - - - - - - -
(50-60 percentile) (0.021)× Malaria endemicity 0.049** - - - - - - -
(60-70 percentile) (0.023)× Malaria endemicity 0.047** - - - - - - -
(70-80 percentile) (0.022)× Malaria endemicity 0.041** - - - - - - -
(80-90 percentile) (0.021)× Malaria endemicity 0.045** - - - - - - -
(90-100 percentile) (0.022)× Malaria endemicity - 0.035*** - - 0.035*** 0.047*** 0.037** 0.036***
(50-100 percentile) (0.010) (0.010) (0.015) (0.016) (0.011)× Malaria endemicity - - 0.115** 0.148*** - - - -
(continuous measure) (0.046) (0.052)
Male (dummy) 0.017*** 0.017*** 0.017*** 0.017*** 0.017*** 0.016*** 0.014** 0.017***(0.003) (0.003) (0.003) (0.003) (0.003) (0.004) (0.006) (0.003)
Birth order 0.013*** 0.013*** 0.013*** 0.017*** 0.013*** -0.015*** 0.013*** 0.013***(0.001) (0.001) (0.001) (0.001) (0.001) (0.003) (0.003) (0.001)
Single birth (dummy) -0.240*** -0.239*** -0.239*** -0.232*** -0.240*** -0.255*** -0.248*** -0.246***(0.014) (0.014) (0.014) (0.014) (0.014) (0.018) (0.031) (0.015)
Mother’s age at birth -0.006*** -0.006*** -0.006*** -0.007*** -0.006*** -0.004 -0.005*** -0.006***(0.000) (0.000) (0.000) (0.000) (0.000) (0.007) (0.001) (0.000)
Mother’s education -0.001 -0.001 -0.001 -0.001 -0.001 - 0.000 -0.000(years) (0.001) (0.001) (0.001) (0.001) (0.001) (0.001) (0.001)Mother’s experience of - - - - 0.009** - - -terminated pregnancy (0.004)Mother’s religion FE Yes Yes Yes Yes Yes No Yes YesMother FE No No No No No Yes No NoMonth-of-conception FE Yes Yes Yes Yes Yes Yes Yes YesYear-of-conception FE (YFE) Yes Yes Yes Yes Yes Yes Yes YesRound FE Yes Yes Yes Yes Yes Yes No YesCommunity FE Yes Yes Yes No Yes No Yes YesDistrict FE (DFE) No No No Yes No No No NoDFE × YFE No No No Yes No No No NoR-squared 0.085 0.085 0.085 0.107 0.085 0.318 0.114 0.087No. of obs. 49185 49185 49185 49185 49089 49429 11721 44299
Notes: (1) Figures ( ) are standard errors. *** denotes significance at 1%, ** at 5%, and * at 10%. (2) Standard errors are robust toheteroskedasticity and clustered residuals within each community. (3) In column (d), this study identified a district corresponding to eachDHS community by matching a community’s GPS latitude/longitude position with a map of Liberia. Consequently, the communities werecategorized into 65 districts plus one group for which the ArcGIS failed to identify the corresponding district, enabling the estimations toinclude 66 district-level fixed effects.
71

Interim Report for Economic Analysis of Political Shocks, IDE-JETRO, FY 2015
Table 3: Trend of the mortality effects and month-of-birth effects (OLS)
Dependent variable: One if die within 12 months after the birthMalaria endemicity: 50-100 continuous 50-100 continuous 50-100 continuous
percentile measure percentile measure percentile measure(a) (b) (c) (d) (e) (f)
Malaria endemicity × Conceived:during the 1st war 0.036*** 0.128*** - - - -(Dec 1989 to July 1997) (0.011) (0.048)during the ceasefire 0.031** 0.098* - - - -(Aug 1997 to Mar 1999) (0.014) (0.052)during the 2nd war 0.034*** 0.097* - - - -(Apr 1999 to Aug 2003) (0.012) (0.053)during the post-war 0.036*** 0.105* - - - -(After Sep 2003) (0.012) (0.054)
Conceived after the outbreak of the war× Malaria endemicity - - - - 0.068*** 0.120*
(0.020) (0.064)Born after the outbreak of the war× Malaria endemicity - - 0.026** 0.078* -0.039* -0.006
(0.011) (0.046) (0.021) (0.063)
Male (dummy) 0.017*** 0.017*** 0.017*** 0.017*** 0.017*** 0.017***(0.003) (0.003) (0.003) (0.003) (0.003) (0.003)
Birth order 0.013*** 0.013*** 0.013*** 0.013*** 0.013*** 0.013***(0.001) (0.001) (0.001) (0.001) (0.001) (0.001)
Single birth (dummy) -0.240*** -0.239*** -0.239*** -0.239*** -0.239*** -0.239***(0.014) (0.014) (0.014) (0.014) (0.014) (0.014)
Mother’s age at birth -0.006*** -0.006*** -0.006*** -0.006*** -0.006*** -0.006***(0.000) (0.000) (0.000) (0.000) (0.000) (0.000)
Mother’s education -0.001 -0.001 -0.001 -0.001 -0.001 -0.001(years) (0.001) (0.001) (0.001) (0.001) (0.001) (0.001)Mother’s religion FE Yes Yes Yes Yes Yes YesMonth-of-conception FE Yes Yes Yes Yes Yes YesYear-of-conception FE (YFE) Yes Yes Yes Yes Yes YesRound FE Yes Yes Yes Yes Yes YesCommunity FE Yes Yes Yes Yes Yes YesR-squared 0.085 0.085 0.085 0.085 0.085 0.085No. of obs. 49185 49185 49185 49185 49185 49185
Notes: (1) Figures ( ) are standard errors. *** denotes significance at 1%, ** at 5%, and * at 10%. (2) Standarderrors are robust to heteroskedasticity and clustered residuals within each community.
72

Interim Report for Economic Analysis of Political Shocks, IDE-JETRO, FY 2015
Table 4: The mortality effects with geographic and climate controls (OLS)
Dependent variable: One if die within 12 months after the birthMalaria endemicity: 50-100 continuous 50-100 continuous 50-100 continuous 50-100 continuous
percentile measure percentile measure percentile measure percentile measure(a) (b) (c) (d) (e) (f) (g) (h)
Conceived after the outbreak of the war× Malaria endemicity 0.038*** 0.199** 0.034*** 0.095 0.027** 0.116 0.034*** 0.125**
(0.013) (0.088) (0.013) (0.062) (0.013) (0.076) (0.013) (0.063)× Temperature (× 10 ◦C) -0.000 -0.000 - - - - - -
(0.000) (0.000)× Precipitation (mm) 0.000 0.000 - - - - - -
(0.000) (0.000)× Elevation (m) - - 0.000 0.000 - - - -
(0.000) (0.000)× Slope (%) - - -0.004 -0.003 - - - -
(0.016) (0.017)× Terrain ruggedness index (100 m) - - 0.004 0.001 - - - -
(0.042) (0.043)× Nutrient availability - - - - -0.052 -0.086 - -
(0.053) (0.059)× Nutrient retention capacity - - - - 0.044 0.046 - -
(0.034) (0.033)× Rooting conditions - - - - 0.013 0.015 - -
(0.023) (0.024)× Oxygen availability to roots - - - - -0.019 -0.021 - -
(0.014) (0.014)× Excess salts - - - - -0.014 -0.011 - -
(0.016) (0.019)× Workability - - - - -0.005 -0.003 - -
(0.020) (0.020)× Longitude - - - - - - 0.001 0.005
(0.006) (0.006)× Latitude - - - - - - -0.003 -0.002
(0.008) (0.008)Individual controls Yes Yes Yes Yes Yes Yes Yes YesMother characteristics Yes Yes Yes Yes Yes Yes Yes YesMother’s religion FE Yes Yes Yes Yes Yes Yes Yes YesMonth-of-conception FE Yes Yes Yes Yes Yes Yes Yes YesYear-of-conception FE Yes Yes Yes Yes Yes Yes Yes YesRound FE Yes Yes Yes Yes Yes Yes Yes YesCommunity FE Yes Yes Yes Yes Yes Yes Yes YesR-squared 0.085 0.085 0.085 0.085 0.087 0.087 0.085 0.085No. of obs. 49185 49185 48769 48769 47135 47135 48769 48769
Notes: (1) Figures ( ) are standard errors. *** denotes significance at 1%, ** at 5%, and * at 10%. (2) Standard errors arerobust to heteroskedasticity and clustered residuals within each community. (3) The individual controls include a genderdummy, birth order, a single-birth dummy, and mothers’ age at birth. (4) The mother characteristics include mothers’education (years) and religion dummies.
73

Interim Report for Economic Analysis of Political Shocks, IDE-JETRO, FY 2015
Table 5: Heterogeneity: environmental risk (OLS)Dependent variable: One if die within Z months after the birthSample: No. of battles Residential area Conceived in
(<25 km)Above Below Rural Urban Rain Drymedian median season season(1a) (1b) (1c) (1d) (1e) (1f)
Panel (A): Z = 12Malaria endemicity (50-100 percentile) 0.036** 0.030** 0.042*** 0.024 0.039*** 0.031**× Conceived after (0.016) (0.015) (0.014) (0.018) (0.013) (0.013)
the outbreak of the warR-squared 0.087 0.087 0.091 0.077 0.094 0.103No. of obs. 23030 26155 32562 16623 26653 22532
(2a) (2b) (2c) (2d) (2e) (2f)Panel (B): Z = 36Malaria endemicity (50-100 percentile) 0.039** 0.019 0.034** 0.028 0.040*** 0.026*× Conceived after (0.018) (0.016) (0.015) (0.019) (0.015) (0.015)
the outbreak of the warR-squared 0.096 0.090 0.097 0.083 0.101 0.111No. of obs. 20690 23354 29163 14881 23942 20102
(3a) (3b) (3c) (3d) (3e) (3f)Panel (C): Z = 60Malaria endemicity (50-100 percentile) 0.037* 0.023 0.038** 0.029 0.045*** 0.026× Conceived after (0.019) (0.018) (0.016) (0.020) (0.016) (0.016)
the outbreak of the warR-squared 0.097 0.091 0.097 0.085 0.104 0.115No. of obs. 18384 20473 25631 13226 21086 17771
(4a) (4b) (4c) (4d) (4e) (4f)Panel (D): Z = 12Malaria endemicity (continuous) 0.116 0.067 0.147* 0.095 0.176*** 0.087× Conceived after (0.071) (0.069) (0.078) (0.062) (0.067) (0.060)
the outbreak of the warR-squared 0.087 0.086 0.091 0.077 0.094 0.103No. of obs. 23030 26155 32562 16623 26653 22532
(5a) (5b) (5c) (5d) (5e) (5f)Panel (E): Z = 36Malaria endemicity (continuous) 0.135* -0.005 0.127 0.073 0.169** 0.073× Conceived after (0.076) (0.078) (0.083) (0.072) (0.077) (0.066)
the outbreak of the warR-squared 0.096 0.090 0.097 0.083 0.101 0.111No. of obs. 20690 23354 29163 14881 23942 20102
(6a) (6b) (6c) (6d) (6e) (6f)Panel (F): Z = 60Malaria endemicity (continuous) 0.128 0.008 0.142* 0.068 0.198** 0.068× Conceived after (0.078) (0.082) (0.085) (0.071) (0.079) (0.068)
the outbreak of the warR-squared 0.097 0.091 0.097 0.084 0.104 0.114No. of obs. 18384 20473 25631 13226 21086 17771Individual controls Yes Yes Yes Yes Yes YesMother characteristics Yes Yes Yes Yes Yes YesMonth-of-conception FE Yes Yes Yes Yes Yes YesYear-of-conception FE Yes Yes Yes Yes Yes YesRound FE Yes Yes Yes Yes Yes YesCommunity FE Yes Yes Yes Yes Yes Yes
Notes: (1) Figures ( ) are standard errors. *** denotes significance at 1%, ** at 5%, and * at 10%. (2) Standarderrors are robust to heteroskedasticity and clustered residuals within each community. (3) A rainy (dry) seasonis defined as periods between May to October (November to April). (4) The individual controls include a genderdummy, birth order, a single-birth dummy, and mothers’ age at birth. (5) The mother characteristics includemothers’ education (years) and religion dummies. 74
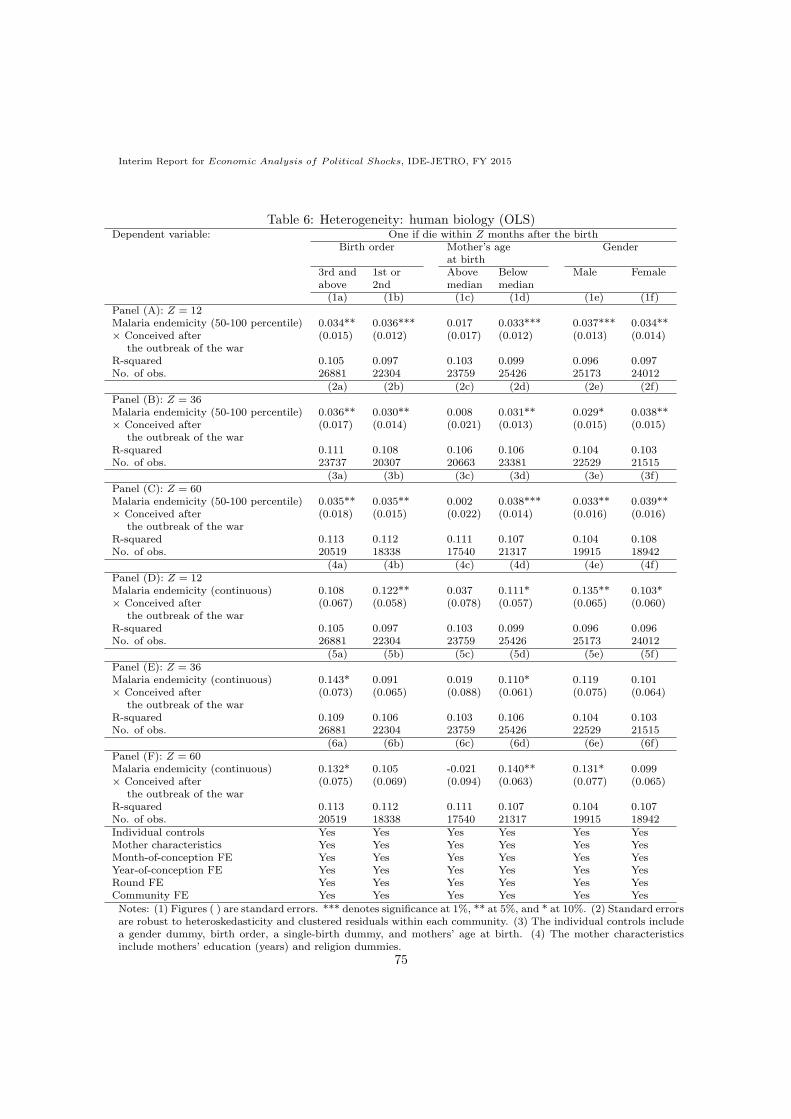
Interim Report for Economic Analysis of Political Shocks, IDE-JETRO, FY 2015
Table 6: Heterogeneity: human biology (OLS)Dependent variable: One if die within Z months after the birth
Birth order Mother’s age Genderat birth
3rd and 1st or Above Below Male Femaleabove 2nd median median(1a) (1b) (1c) (1d) (1e) (1f)
Panel (A): Z = 12Malaria endemicity (50-100 percentile) 0.034** 0.036*** 0.017 0.033*** 0.037*** 0.034**× Conceived after (0.015) (0.012) (0.017) (0.012) (0.013) (0.014)
the outbreak of the warR-squared 0.105 0.097 0.103 0.099 0.096 0.097No. of obs. 26881 22304 23759 25426 25173 24012
(2a) (2b) (2c) (2d) (2e) (2f)Panel (B): Z = 36Malaria endemicity (50-100 percentile) 0.036** 0.030** 0.008 0.031** 0.029* 0.038**× Conceived after (0.017) (0.014) (0.021) (0.013) (0.015) (0.015)
the outbreak of the warR-squared 0.111 0.108 0.106 0.106 0.104 0.103No. of obs. 23737 20307 20663 23381 22529 21515
(3a) (3b) (3c) (3d) (3e) (3f)Panel (C): Z = 60Malaria endemicity (50-100 percentile) 0.035** 0.035** 0.002 0.038*** 0.033** 0.039**× Conceived after (0.018) (0.015) (0.022) (0.014) (0.016) (0.016)
the outbreak of the warR-squared 0.113 0.112 0.111 0.107 0.104 0.108No. of obs. 20519 18338 17540 21317 19915 18942
(4a) (4b) (4c) (4d) (4e) (4f)Panel (D): Z = 12Malaria endemicity (continuous) 0.108 0.122** 0.037 0.111* 0.135** 0.103*× Conceived after (0.067) (0.058) (0.078) (0.057) (0.065) (0.060)
the outbreak of the warR-squared 0.105 0.097 0.103 0.099 0.096 0.096No. of obs. 26881 22304 23759 25426 25173 24012
(5a) (5b) (5c) (5d) (5e) (5f)Panel (E): Z = 36Malaria endemicity (continuous) 0.143* 0.091 0.019 0.110* 0.119 0.101× Conceived after (0.073) (0.065) (0.088) (0.061) (0.075) (0.064)
the outbreak of the warR-squared 0.109 0.106 0.103 0.106 0.104 0.103No. of obs. 26881 22304 23759 25426 22529 21515
(6a) (6b) (6c) (6d) (6e) (6f)Panel (F): Z = 60Malaria endemicity (continuous) 0.132* 0.105 -0.021 0.140** 0.131* 0.099× Conceived after (0.075) (0.069) (0.094) (0.063) (0.077) (0.065)
the outbreak of the warR-squared 0.113 0.112 0.111 0.107 0.104 0.107No. of obs. 20519 18338 17540 21317 19915 18942Individual controls Yes Yes Yes Yes Yes YesMother characteristics Yes Yes Yes Yes Yes YesMonth-of-conception FE Yes Yes Yes Yes Yes YesYear-of-conception FE Yes Yes Yes Yes Yes YesRound FE Yes Yes Yes Yes Yes YesCommunity FE Yes Yes Yes Yes Yes Yes
Notes: (1) Figures ( ) are standard errors. *** denotes significance at 1%, ** at 5%, and * at 10%. (2) Standard errorsare robust to heteroskedasticity and clustered residuals within each community. (3) The individual controls includea gender dummy, birth order, a single-birth dummy, and mothers’ age at birth. (4) The mother characteristicsinclude mothers’ education (years) and religion dummies.
75

Interim Report for Economic Analysis of Political Shocks, IDE-JETRO, FY 2015
Table 7: Long-term selection on adult health: 2013 DHS only (OLS)Dependent variables: Height for age (z-score) Height (cm)
(a) (b) (c) (d) (e) (f)Conceived after the outbreak of the war× Malaria endemicity 0.224 - - 0.878 - -
(10-20 percentile) (0.143) (1.053)× Malaria endemicity 0.080 - - 0.427 - -
(20-30 percentile) (0.132) (0.807)× Malaria endemicity 0.114 - - 0.596 - -
(30-40 percentile) (0.139) (0.852)× Malaria endemicity 0.181 - - 1.043 - -
(40-50 percentile) (0.135) (0.818)× Malaria endemicity 0.206 - - 1.038 - -
(50-60 percentile) (0.157) (0.956)× Malaria endemicity 0.007 - - -0.013 - -
(60-70 percentile) (0.153) (0.932)× Malaria endemicity 0.312* - - 1.811* - -
(70-80 percentile) (0.159) (0.967)× Malaria endemicity 0.398** - - 2.368** - -
(80-90 percentile) (0.166) (1.013)× Malaria endemicity 0.288** - - 1.596* - -
(90-100 percentile) (0.137) (0.914)× Malaria endemicity - 0.124* - - 0.766* -
(50-100 percentile) (0.067) (0.434)× Malaria endemicity - - 0.802*** - - 5.099**
(continuous measure) (0.306) (2.003)
Birth order 0.009 0.009 0.009 0.049 0.050 0.048(0.012) (0.012) (0.012) (0.072) (0.072) (0.072)
No. of alive siblings 0.006 0.006 0.006 0.049 0.050 0.051at age 10 (0.011) (0.011) (0.011) (0.067) (0.067) (0.067)No. of late siblings -0.019 -0.017 -0.017 -0.159 -0.155 -0.157at age 10 (0.019) (0.019) (0.018) (0.133) (0.133) (0.133)Religion FE Yes Yes Yes Yes Yes YesMonth-of-conception FE Yes Yes Yes Yes Yes YesYear-of-conception FE Yes Yes Yes Yes Yes YesCommunity FE Yes Yes Yes Yes Yes YesR-squared 0.135 0.133 0.134 0.142 0.140 0.141No. of obs. 4576 4576 4576 4582 4582 4582
Notes: (1) Figures ( ) are standard errors. *** denotes significance at 1%, ** at 5%, and * at 10%. (2) Standarderrors are robust to heteroskedasticity and clustered residuals within each community.
76

Interim Report for Economic Analysis of Political Shocks, IDE-JETRO, FY 2015
Table 8: Assessment of bias attributed to unobservables
Dependent variables: One if die within Height for age Height (cm)12 months after the (z-score)birth
Malaria endemicity: 50-100 Continuous 50-100 Continuous 50-100 Continuouspercentile measure percentile measure percentile measure
(1a) (1b) (1c) (1d) (1e) (1f)
Panel (A): Main results from Tables 2 and 7 (OLS)Conceived after the outbreak of the war 0.035*** 0.115** 0.124* 0.802*** 0.766* 5.099**× Malaria endemicity (0.010) (0.046) (0.067) (0.306) (0.434) (2.003)R-squared 0.085 0.085 0.133 0.134 0.140 0.141No. of obs. 49185 49185 4576 4576 4582 4582
(2a) (2b) (2c) (2d) (2e) (2f)
Panel (B): Oster (2015)’s δ
(1) Rmax = 1.3R -1.28 -0.54 -1.52 -0.27 -0.91 -0.46(2) Rmax = 0.3 -0.19 -0.09 -0.41 -0.12 -0.25 -0.19(3) Rmax = 1.0 -0.04 -0.02 -0.08 -0.03 -0.04 -0.04
(3a) (3b) (3c) (3d) (3e) (3f)
Panel (C): Instrumental variable approachConceived after the outbreak of the war 0.049*** 0.297*** -0.003 -0.015 -0.390 -2.138× Malaria endemicity (0.018) (0.105) (0.152) (0.832) (0.944) (5.170)R-sqaured 0.085 0.085 0.133 0.133 0.140 0.140No. of. obs 49185 49185 4576 4576 4582 4582
(4a) (4b) (4c) (4d) (4e) (4f)
Panel (C): Discontinuity sample conceived in 1989 and 1990 (OLS)Conceived after the outbreak of the war 0.064* 0.226 -0.174 2.367 -1.035 14.144× Malaria endemicity (0.037) (0.141) (0.832) (2.199) (4.964) (13.114)R-sqaured 0.272 0.272 0.660 0.668 0.660 0.668No. of. obs 2556 2556 325 325 325 325
Individual controls Yes Yes Yes Yes Yes YesMother characteristics Yes Yes NA NA NA NAMonth-of-conception FE Yes Yes Yes Yes Yes YesYear-of-conception FE Yes Yes Yes Yes Yes YesRound FE Yes Yes NA NA NA NACommunity FE Yes Yes Yes Yes Yes Yes
Notes: (1) Figures ( ) are standard errors. *** denotes significance at 1%, ** at 5%, and * at 10%. (2) Standarderrors are robust to heteroskedasticity and clustered residuals within each community in columns (1a)―(1f) and(4a)―(4f) and to heteroskedasticity in columns (3a)―(3b). (3) The individual controls in columns (1a)―(1b), (3a)―(3b), and (4a)―(4b) include a gender dummy, birth order, a single-birth dummy, and mothers’ age at birth. Theindividual controls in columns (1c)―(1f), (3c)―(3f), and (4c)―(4f) include birth order, no. of alive siblings at age10, and no. of late siblings at age 10. (4) The mother characteristics include mothers’ education (years) and religiondummies.
77
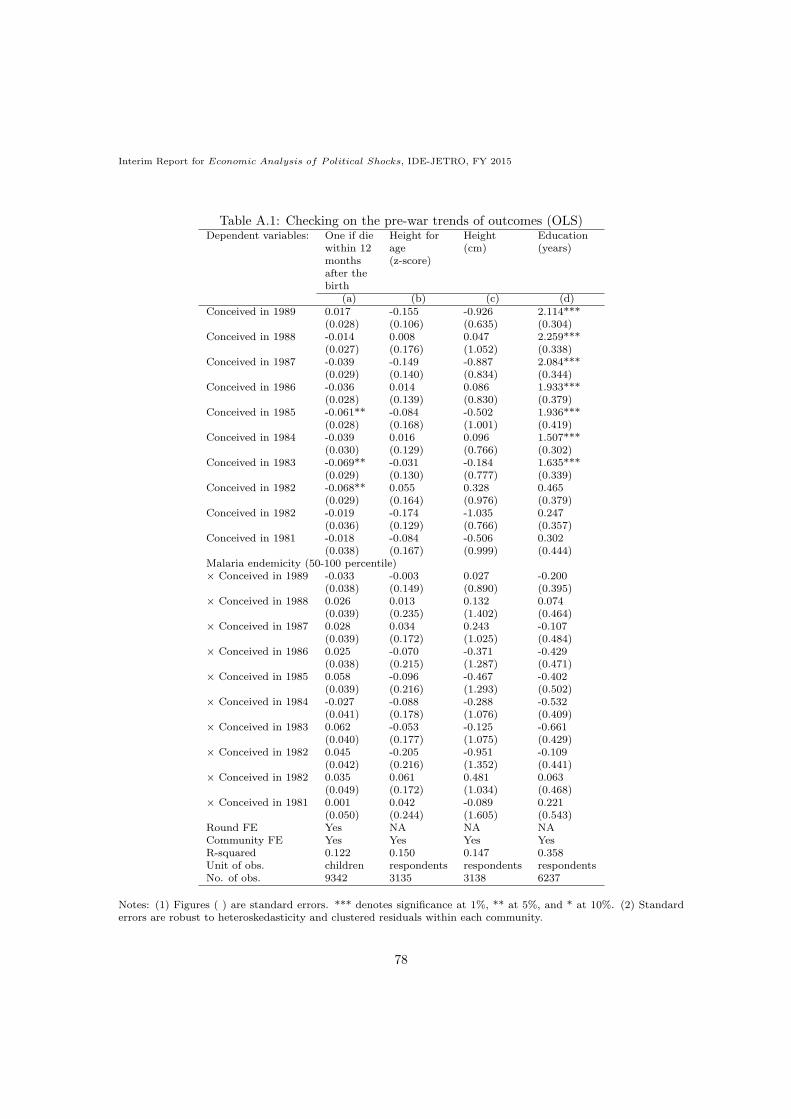
Interim Report for Economic Analysis of Political Shocks, IDE-JETRO, FY 2015
Table A.1: Checking on the pre-war trends of outcomes (OLS)Dependent variables: One if die Height for Height Education
within 12 age (cm) (years)months (z-score)after thebirth
(a) (b) (c) (d)Conceived in 1989 0.017 -0.155 -0.926 2.114***
(0.028) (0.106) (0.635) (0.304)Conceived in 1988 -0.014 0.008 0.047 2.259***
(0.027) (0.176) (1.052) (0.338)Conceived in 1987 -0.039 -0.149 -0.887 2.084***
(0.029) (0.140) (0.834) (0.344)Conceived in 1986 -0.036 0.014 0.086 1.933***
(0.028) (0.139) (0.830) (0.379)Conceived in 1985 -0.061** -0.084 -0.502 1.936***
(0.028) (0.168) (1.001) (0.419)Conceived in 1984 -0.039 0.016 0.096 1.507***
(0.030) (0.129) (0.766) (0.302)Conceived in 1983 -0.069** -0.031 -0.184 1.635***
(0.029) (0.130) (0.777) (0.339)Conceived in 1982 -0.068** 0.055 0.328 0.465
(0.029) (0.164) (0.976) (0.379)Conceived in 1982 -0.019 -0.174 -1.035 0.247
(0.036) (0.129) (0.766) (0.357)Conceived in 1981 -0.018 -0.084 -0.506 0.302
(0.038) (0.167) (0.999) (0.444)Malaria endemicity (50-100 percentile)× Conceived in 1989 -0.033 -0.003 0.027 -0.200
(0.038) (0.149) (0.890) (0.395)× Conceived in 1988 0.026 0.013 0.132 0.074
(0.039) (0.235) (1.402) (0.464)× Conceived in 1987 0.028 0.034 0.243 -0.107
(0.039) (0.172) (1.025) (0.484)× Conceived in 1986 0.025 -0.070 -0.371 -0.429
(0.038) (0.215) (1.287) (0.471)× Conceived in 1985 0.058 -0.096 -0.467 -0.402
(0.039) (0.216) (1.293) (0.502)× Conceived in 1984 -0.027 -0.088 -0.288 -0.532
(0.041) (0.178) (1.076) (0.409)× Conceived in 1983 0.062 -0.053 -0.125 -0.661
(0.040) (0.177) (1.075) (0.429)× Conceived in 1982 0.045 -0.205 -0.951 -0.109
(0.042) (0.216) (1.352) (0.441)× Conceived in 1982 0.035 0.061 0.481 0.063
(0.049) (0.172) (1.034) (0.468)× Conceived in 1981 0.001 0.042 -0.089 0.221
(0.050) (0.244) (1.605) (0.543)Round FE Yes NA NA NACommunity FE Yes Yes Yes YesR-squared 0.122 0.150 0.147 0.358Unit of obs. children respondents respondents respondentsNo. of obs. 9342 3135 3138 6237
Notes: (1) Figures ( ) are standard errors. *** denotes significance at 1%, ** at 5%, and * at 10%. (2) Standarderrors are robust to heteroskedasticity and clustered residuals within each community.
78

Interim Report for Economic Analysis of Political Shocks, IDE-JETRO, FY 2015
Table A.2: Summary statistics (DID estimates)Coefficient Std. R-sqd No. of
Dependent variables: obs.Male (dummy) -0.012 (0.012) 0.000 52927Birth order 0.178*** (0.068) 0.034 52927Single birth (dummy) 0.004 (0.007) 0.000 52927Mother’s age at birth (years) 0.260* (0.156) 0.094 52927Mother’s education (years) -0.598*** (0.200) 0.005 52927Mother’s experience of 0.009 (0.018) 0.004 52822terminated pregnancy (dummy)Conceived in rainy season -0.002 (0.012) 0.001 52927(dummy)Urban (dummy) 0.025 (0.024) 0.071 52927Longitude -0.022 (0.053) 0.347 52482Latitude 0.021 (0.054) 0.000 52482Elevation (m) 4.662 (6.292) 0.319 52482No. of battles (< 25km) 0.913 (0.792) 0.201 52927Malaria endemicity (0-1) -0.000 (0.003) 0.700 52927Mean temperature (× 10 ◦C), 1950-2000 0.208 (0.305) 0.142 52927Mean precipitation (mm), 1950-2000 2.479 (2.958) 0.356 52927
Notes: (1) Figures ( ) are standard errors. *** denotes significance at 1%, ** at 5%, and * at 10%. (2) Standarderrors are robust to heteroskedasticity and clustered residuals within each community.
79

Interim Report for Economic Analysis of Political Shocks, IDE-JETRO, FY 2015
Table A.3: Impacts of wartime pregnancy in malaria endemic areas (probit and hazard models)Dependent variables: One if die within Z months after the birth Months to
deathZ = 1 Z = 6 Z = 12 Z = 24 Z = 36 Z = 48 Z = 60Probit Probit Probit Probit Probit Probit Probit Hazard(ME) (ME) (ME) (ME) (ME) (ME) (ME) ratio
(a) (b) (c) (d) (e) (f) (g) (h)Panel (A): Conceived before the warMalaria endemicity 0.008 -0.004 -0.002 0.003 0.002 -0.001 0.001 0.957(50-100 percentile) (0.009) (0.014) (0.018) (0.020) (0.020) (0.020) (0.021) (0.099)Male (dummy) 0.008* 0.017** 0.021** 0.026*** 0.026*** 0.027*** 0.029*** 1.135***
(0.005) (0.007) (0.008) (0.009) (0.009) (0.009) (0.009) (0.051)Birth order 0.008*** 0.018*** 0.025*** 0.027*** 0.029*** 0.030*** 0.031*** 1.128***
(0.002) (0.003) (0.004) (0.004) (0.004) (0.004) (0.005) (0.024)Single birth (dummy) -0.210*** -0.276*** -0.299*** -0.314*** -0.335*** -0.338*** -0.330*** 0.434***
(0.035) (0.038) (0.040) (0.039) (0.037) (0.037) (0.038) (0.055)Mother’s age at birth -0.004*** -0.009*** -0.012*** -0.014*** -0.014*** -0.014*** -0.015*** 0.937***
(0.001) (0.001) (0.002) (0.002) (0.002) (0.002) (0.002) (0.009)Mother’s education -0.002** -0.007*** -0.002 -0.003 -0.004 -0.004 -0.004 0.969(years) (0.001) (0.001) (0.003) (0.003) (0.003) (0.003) (0.004) (0.020)Longitude 0.004 0.003 -0.020 -0.024 -0.017 -0.022 -0.022 0.958
(0.012) (0.017) (0.021) (0.024) (0.024) (0.025) (0.026) (0.139)Latitude 0.022 0.032 0.036 0.041 0.069* 0.067* 0.070* 1.563**
(0.022) (0.029) (0.035) (0.039) (0.038) (0.039) (0.040) (0.303)Elevation (m) -0.000* -0.000 -0.000 -0.000 -0.000** -0.000* -0.000* 0.998**
(0.000) (0.000) (0.000) (0.000) (0.000) (0.000) (0.000) (0.001)Shoenfeld res. (p-val.) - - - - - - - 0.259R-squared 0.070 0.077 0.059 0.055 0.055 0.055 0.054 -No. of obs. 9084 9126 9126 9126 9126 9126 9126 8607
(i) (j) (k) (l) (m) (n) (o) (p)Panel (B): Conceived after the outbreak of the warMalaria endemicity -0.003 0.004 0.012 0.018* 0.019* 0.022* 0.025** 1.200**(50-100 percentile) (0.004) (0.007) (0.009) (0.010) (0.011) (0.012) (0.010) (0.099)Male (dummy) 0.011*** 0.012*** 0.016*** 0.017*** 0.019*** 0.020*** 0.022*** 1.085***
(0.002) (0.002) (0.003) (0.004) (0.004) (0.004) (0.004) (0.030)Birth order 0.007*** 0.011*** 0.017*** 0.020*** 0.021*** 0.023*** 0.024*** 1.136***
(0.001) (0.001) (0.001) (0.002) (0.002) (0.002) (0.002) (0.013)Single birth (dummy) -0.142*** -0.195*** -0.215*** -0.230*** -0.236*** -0.232*** -0.235*** 0.424***
(0.014) (0.015) (0.016) (0.016) (0.017) (0.018) (0.019) (0.028)Mother’s age at birth -0.003*** -0.005*** -0.007*** -0.008*** -0.009*** -0.010*** -0.010*** 0.944***
(0.000) (0.000) (0.000) (0.001) (0.001) (0.001) (0.001) (0.004)Mother’s education -0.001* -0.001*** -0.001** -0.001* -0.001** -0.002** -0.002** 0.988**(years) (0.000) (0.000) (0.001) (0.001) (0.001) (0.001) (0.001) (0.006)Longitude 0.004 0.001 -0.009 -0.020* -0.022* -0.020 -0.021 0.883
(0.005) (0.008) (0.010) (0.011) (0.012) (0.013) (0.013) (0.076)Latitude 0.004 0.012 0.005 -0.007 -0.004 -0.009 -0.012 1.009
(0.008) (0.011) (0.016) (0.018) (0.019) (0.021) (0.022) (0.141)Elevation (m) -0.000 -0.000 -0.000 0.000 0.000 0.000 0.000 1.000
(0.000) (0.000) (0.000) (0.000) (0.000) (0.000) (0.000) (0.001)Shoenfeld res. (p-val.) - - - - - - - 0.264R-squared 0.062 0.067 0.064 0.060 0.059 0.055 0.053 -No. of obs. 42363 41129 39643 37125 34533 31806 29387 41230Mother’s religion FE Yes Yes Yes Yes Yes Yes Yes YesYear-of-conception FE Yes Yes Yes Yes Yes Yes Yes YesRound FE Yes Yes Yes Yes Yes Yes Yes YesCounty FE Yes Yes Yes Yes Yes Yes Yes Yes
Notes: (1) Figures ( ) are standard errors. *** denotes significance at 1%, ** at 5%, and * at 10%. (2) Standarderrors are robust to heteroskedasticity and clustered residuals within each community. (3) This study identified a countycorresponding to each DHS community by matching a community’s GPS latitude/longitude position with a map of Liberia.Consequently, the communities were categorized into 15 counties plus one group for which the ArcGIS failed to identifythe corresponding county, enabling the estimations to include 16 county-level fixed effects.
80

Interim Report for Economic Analysis of Political Shocks, IDE-JETRO, FY 2015
Table A.4: Long-term selection on education: 2013 DHS only
Dependent variable: Education (years)Sample: All All All All All Conceived Conceived
in 1989 in 1989and 1990 and 1990
OLS OLS OLS 2SLS 2SLS OLS OLS(a) (b) (c) (d) (e) (f) (g)
Conceived after the outbreak of the war× Malaria endemicity -0.726* - - - - - -
(10-20 percentile) (0.440)× Malaria endemicity -0.330 - - - - - -
(20-30 percentile) (0.484)× Malaria endemicity 0.753** - - - - - -
(30-40 percentile) (0.377)× Malaria endemicity 0.674 - - - - - -
(40-50 percentile) (0.440)× Malaria endemicity 0.946** - - - - - -
(50-60 percentile) (0.404)× Malaria endemicity -0.007 - - - - - -
(60-70 percentile) (0.352)× Malaria endemicity 0.430 - - - - - -
(70-80 percentile) (0.401)× Malaria endemicity 0.537 - - - - - -
(80-90 percentile) (0.389)× Malaria endemicity 0.241 - - - - - -
(90-100 percentile) (0.441)× Malaria endemicity - 0.319* - 0.364 - 0.113 -
(50-100 percentile) (0.190) (0.341) (0.896)× Malaria endemicity - - 1.574 - 2.006 - -0.270
(continuous measure) (0.957) (1.880) (2.833)× Temperature (× 10 ◦C) - - - -0.001 -0.004 - -
(0.003) (0.005)× Precipitation (mm) - - - -0.001 0.000 - -
(0.002) (0.002)
Birth order -0.018 -0.021 -0.021 -0.020 -0.020 -0.049 -0.047(0.027) (0.027) (0.027) (0.024) (0.024) (0.136) (0.137)
No. of alive siblings -0.015 -0.012 -0.012 -0.012 -0.013 0.104 0.101at age 10 (0.028) (0.028) (0.028) (0.024) (0.024) (0.147) (0.151)No. of late siblings 0.025 0.032 0.031 0.031 0.030 -0.109 -0.110at age 10 (0.042) (0.042) (0.042) (0.038) (0.038) (0.236) (0.237)Religion FE Yes Yes Yes Yes Yes Yes YesMonth-of-conception FE Yes Yes Yes Yes Yes Yes YesYear-of-conception FE Yes Yes Yes Yes Yes Yes YesCommunity FE Yes Yes Yes Yes Yes Yes YesR-squared 0.369 0.367 0.367 0.367 0.367 0.633 0.633No. of obs. 9197 9197 9197 9197 9197 640 6401st-stage coefficient on:Conceived after the outbreak of the war - - - -0.000*** -0.000*** - -× Temperature (× 10 ◦C) (0.000) (0.000)× Precipitation (mm)1st-stage F-statistics - - - 3223.10 4686.00 - -
Notes: (1) Figures ( ) are standard errors. *** denotes significance at 1%, ** at 5%, and * at 10%. (2) Standarderrors are robust to heteroskedasticity and clustered residuals within each community in all columns excluding (d)and (e).
81

Interim Report for Economic Analysis of Political Shocks, IDE-JETRO, FY 2015
Table A.5: Long-term selection on height-for-age with geographic and climate controls: 2013 DHS only(OLS)
Dependent variable: Height for age (z-scores)Malaria endemicity: 50-100 continuous 50-100 continuous 50-100 continuous 50-100 continuous
percentile measure percentile measure percentile measure percentile measure(a) (b) (c) (d) (e) (f) (g) (h)
Conceived after the outbreak of the war× Malaria endemicity 0.069 0.732 0.081 0.761* 0.031 0.371 0.095 0.920**
(0.086) (0.540) (0.091) (0.430) (0.087) (0.493) (0.098) (0.442)× Temperature (× 10 ◦C) 0.002 0.000 - - - - - -
(0.001) (0.002)× Precipitation (mm) -0.001 -0.000 - - - - - -
(0.001) (0.001)× Elevation (m) - - 0.000 -0.000 - - - -
(0.000) (0.000)× Slope (%) - - 0.288* 0.269 - - - -
(0.170) (0.173)× Terrain ruggedness index (100m) - - -0.754* -0.708* - - - -
(0.389) (0.398)× Nutrient availability - - - - 0.537 0.361 - -
(0.480) (0.539)× Nutrient retention capacity - - - - -0.192 -0.171 - -
(0.344) (0.349)× Rooting conditions - - - - -0.038 -0.031 - -
(0.160) (0.159)× Oxygen availability to roots - - - - -0.052 -0.030 - -
(0.094) (0.097)× Excess salts - - - - -0.213* -0.167 - -
(0.112) (0.130)× Workability - - - - 0.053 0.053 - -
(0.108) (0.106)× Longitude - - - - - - 0.022 0.002
(0.046) (0.041)× Latitude - - - - - - 0.026 -0.025
(0.055) (0.057)Individual controls Yes Yes Yes Yes Yes Yes Yes YesReligion FE Yes Yes Yes Yes Yes Yes Yes YesMonth-of-conception FE Yes Yes Yes Yes Yes Yes Yes YesYear-of-conception FE Yes Yes Yes Yes Yes Yes Yes YesRound FE Yes Yes Yes Yes Yes Yes Yes YesCommunity FE Yes Yes Yes Yes Yes Yes Yes YesR-squared 0.134 0.134 0.134 0.135 0.132 0.132 0.133 0.134No. of obs. 4576 4576 4576 4576 4450 4450 4576 4576
Note: (1) Figures ( ) are standard errors. *** denotes significance at 1%, ** at 5%, and * at 10%. (2) Standarderrors are robust to heteroskedasticity and clustered residuals within each community. (3) The individual controlsinclude birth order, no. of alive siblings at age 10, and no. of late siblings at age 10.
82

Interim Report for Economic Analysis of Political Shocks, IDE-JETRO, FY 2015
Table A.6: Long-term selection on height with geographic and climate controls: 2013 DHS only(OLS)
Dependent variable: Height (cm)Malaria endemicity: 50-100 continuous 50-100 continuous 50-100 continuous 50-100 continuous
percentile measure percentile measure percentile measure percentile measure(a) (b) (c) (d) (e) (f) (g) (h)
Conceived after the outbreak of the war× Malaria endemicity 0.345 4.071 0.458 4.711* 0.172 2.528 0.556 5.690**
(0.527) (3.366) (0.555) (2.674) (0.530) (3.121) (0.604) (2.727)× Temperature (× 10 ◦C) 0.012 0.003 - - - - - -
(0.008) (0.012)× Precipitation (mm) -0.006 -0.002 - - - - - -
(0.004) (0.005)× Elevation (m) - - 0.000 -0.001 - - - -
(0.002) (0.002)× Slope (%) - - 1.437 1.316 - - - -
(1.055) (1.082)× Terrain ruggedness index (100m) - - -4.512* -4.210* - - - -
(2.346) (2.411)× Nutrient availability - - - - 3.149 1.924 - -
(2.932) (3.365)× Nutrient retention capacity - - - - -1.069 -0.924 - -
(2.119) (2.155)× Rooting conditions - - - - -0.072 -0.017 - -
(1.061) (1.051)× Oxygen availability to roots - - - - -0.232 -0.069 - -
(0.567) (0.597)× Excess salts - - - - -1.423* -1.085 - -
(0.733) (0.853)× Workability - - - - 0.254 0.244 - -
(0.797) (0.780)× Temperature (× 10 ◦C) - - - - - - 0.151 0.016
(0.286) (0.254)× Precipitation (mm) - - - - - - 0.199 -0.125
(0.348) (0.360)Individual controls Yes Yes Yes Yes Yes Yes Yes YesReligion FE Yes Yes Yes Yes Yes Yes Yes YesMonth-of-conception FE Yes Yes Yes Yes Yes Yes Yes YesYear-of-conception FE Yes Yes Yes Yes Yes Yes Yes YesRound FE Yes Yes Yes Yes Yes Yes Yes YesCommunity FE Yes Yes Yes Yes Yes Yes Yes YesR-squared 0.141 0.141 0.142 0.142 0.138 0.138 0.140 0.141No. of obs. 4582 4582 4582 4582 4456 4456 4582 4582
Note: (1) Figures ( ) are standard errors. *** denotes significance at 1%, ** at 5%, and * at 10%. (2) Standarderrors are robust to heteroskedasticity and clustered residuals within each community. (3) The individual controlsinclude birth order, no. of alive siblings at age 10, and no. of late siblings at age 10.
83

Interim Report for Economic Analysis of Political Shocks, IDE-JETRO, FY 2015
Table A.7: Long-term selection on education with geographic and climate controls: 2013 DHS only(OLS)
Dependent variable: Education (years)Malaria endemicity: 50-100 continuous 50-100 continuous 50-100 continuous 50-100 continuous
percentile measure percentile measure percentile measure percentile measure(a) (b) (c) (d) (e) (f) (g) (h)
Conceived after the outbreak of the war× Malaria endemicity 0.231 2.312 0.132 0.760 0.102 0.466 0.262 0.875
(0.222) (1.462) (0.217) (1.188) (0.220) (1.403) (0.212) (1.100)× Temperature (× 10 ◦C) -0.000 -0.005 - - - - - -
(0.003) (0.005)× Precipitation (mm) -0.001 0.000 - - - - - -
(0.002) (0.002)× Elevation (m) - - 0.001* 0.001 - - - -
(0.001) (0.001)× Slope (%) - - -0.527 -0.537 - - - -
(0.408) (0.407)× Terrain ruggedness index (100m) - - 1.239 1.266 - - - -
(1.014) (1.010)× Nutrient availability - - - - 0.404 0.228 - -
(0.695) (0.927)× Nutrient retention capacity - - - - -0.679*** -0.659*** - -
(0.205) (0.230)× Rooting conditions - - - - -0.530 -0.522 - -
(0.374) (0.375)× Oxygen availability to roots - - - - 0.073 0.078 - -
(0.235) (0.236)× Excess salts - - - - -0.675** -0.656* - -
(0.310) (0.361)× Workability - - - - 0.338 0.353 - -
(0.346) (0.346)× Longitude - - - - - - 0.012 0.043
(0.100) (0.094)× Latitude - - - - - - 0.133 0.144
(0.131) (0.134)Individual controls Yes Yes Yes Yes Yes Yes Yes YesReligion FE Yes Yes Yes Yes Yes Yes Yes YesMonth-of-conception FE Yes Yes Yes Yes Yes Yes Yes YesYear-of-conception FE Yes Yes Yes Yes Yes Yes Yes YesRound FE Yes Yes Yes Yes Yes Yes Yes YesCommunity FE Yes Yes Yes Yes Yes Yes Yes YesR-squared 0.367 0.367 0.367 0.367 0.369 0.369 0.367 0.367No. of obs. 9197 9197 9197 9197 8961 8961 9197 9197
Note: (1) Figures ( ) are standard errors. *** denotes significance at 1%, ** at 5%, and * at 10%. (2) Standarderrors are robust to heteroskedasticity and clustered residuals within each community. (3) The individual controlsinclude birth order, no. of alive siblings at age 10, and no. of late siblings at age 10.
84

Interim Report for Economic Analysis of Political Shocks, IDE-JETRO, FY 2015
Table A.8: Impacts of wartime pregnancy in malaria endemic areas (2SLS)
Dependent variables: One if die within Height for age Height (cm)12 months after the (z-score)birth
Malaria endemicity: 50-100 Continuous 50-100 Continuous 50-100 Continuouspercentile measure percentile measure percentile measure
(a) (b) (c) (d) (e) (f)
Conceived after the outbreak of the war× Malaria endemicity 0.049*** 0.297*** -0.003 -0.015 -0.390 -2.138
(0.018) (0.105) (0.152) (0.832) (0.944) (5.170)× Temperature (× 10 ◦C) -0.000 -0.001** 0.002 0.002 0.015* 0.019
(0.000) (0.000) (0.001) (0.002) (0.008) (0.015)× Precipitation (mm) 0.000 0.000 -0.001 -0.001 -0.009* -0.010
(0.000) (0.000) (0.001) (0.001) (0.005) (0.007)
Male (dummy) 0.017*** 0.017*** - - - -(0.003) (0.003)
Birth order 0.013*** 0.013*** 0.008 0.008 0.045 0.045(0.001) (0.001) (0.011) (0.011) (0.068) (0.068)
Single birth (dummy) -0.240*** -0.240*** - - - -(0.011) (0.011)
Mother’s age at birth -0.006*** -0.006*** - - - -(0.000) (0.000)
Mother’s education -0.001*** -0.001*** - - - -(years) (0.000) (0.000)No. of alive siblings - - 0.007 0.007 0.053 0.054at age 10 (0.011) (0.011) (0.068) (0.068)No. of late siblings - - -0.018 -0.018 -0.162 -0.161at age 10 (0.017) (0.017) (0.108) (0.108)Religion FE Yes Yes Yes Yes Yes YesMonth-of-conception FE Yes Yes Yes Yes Yes YesYear-of-conception FE Yes Yes Yes Yes Yes YesRound FE Yes Yes NA NA NA NACommunity FE Yes Yes Yes Yes Yes YesR-squared 0.085 0.085 0.133 0.133 0.140 0.140Unit of obs. children children respondents respondents respondents respondentsNo. of obs. 49185 49185 4576 4576 4582 4582
1st-stage coefficient on:Conceived after the outbreak of the war -0.000*** -0.000*** -0.000*** -0.000*** -0.000*** -0.000***× Temperature (× 10 ◦C) (0.000) (0.000) (0.000) (0.000) (0.000) (0.000)× Precipitation (mm)1st-stage F-statistics 5210.75 7005.99 1578.33 2300.56 1571.50 2292.42
Note: (1) Figures ( ) are standard errors. *** denotes significance at 1%, ** at 5%, and * at 10%. (2) Standarderrors are robust to heteroskedasticity in columns (a) and (b).
85

Interim Report for Economic Analysis of Political Shocks, IDE-JETRO, FY 2015
Table A.9: Impacts of wartime pregnancy in malaria endemic areas: discontinuity sample (OLS)
Dependent variables: One if die within Height for age Height (cm)12 months after the (z-score)birth
Malaria endemicity: 50-100 Continuous 50-100 Continuous 50-100 Continuouspercentile measure percentile measure percentile measure
(a) (b) (c) (d) (e) (f)Conceived after the outbreak of the war× Malaria endemicity 0.064* 0.226 -0.174 2.367 -1.035 14.144
(0.037) (0.141) (0.832) (2.199) (4.964) (13.114)
Male (dummy) 0.027 0.026 - - - -(0.019) (0.019)
Birth order 0.022*** 0.022*** 0.004 0.002 0.026 0.011(0.008) (0.008) (0.117) (0.118) (0.700) (0.701)
Single birth (dummy) -0.400*** -0.400*** - - - -(0.068) (0.069)
Mother’s age at birth -0.014*** -0.014*** - - - -(0.003) (0.003)
Mother’s education -0.001 -0.001 - - - -(years) (0.002) (0.002)No. of alive siblings - - -0.051 -0.037 -0.302 -0.221at age 10 (0.139) (0.135) (0.828) (0.808)No. of late siblings - - -0.058 -0.076 -0.347 -0.453at age 10 (0.186) (0.193) (1.111) (1.150)Religion FE Yes Yes Yes Yes Yes YesMonth-of-conception FE Yes Yes Yes Yes Yes YesYear-of-conception FE Yes Yes Yes Yes Yes YesRound FE Yes Yes NA NA NA NACommunity FE Yes Yes Yes Yes Yes YesR-squared 0.272 0.272 0.660 0.668 0.660 0.668Unit of obs. children children respondents respondents respondents respondentsNo. of obs. 2556 2556 325 325 325 325
Note: (1) Figures ( ) are standard errors. *** denotes significance at 1%, ** at 5%, and * at 10%. (2) Standarderrors are robust to heteroskedasticity and clustered residuals within each community. (3) The estimations exploitdata on children [columns (a)―(b)] or respondents [columns (c)―(f)] conceived in 1989 and 1990.
86
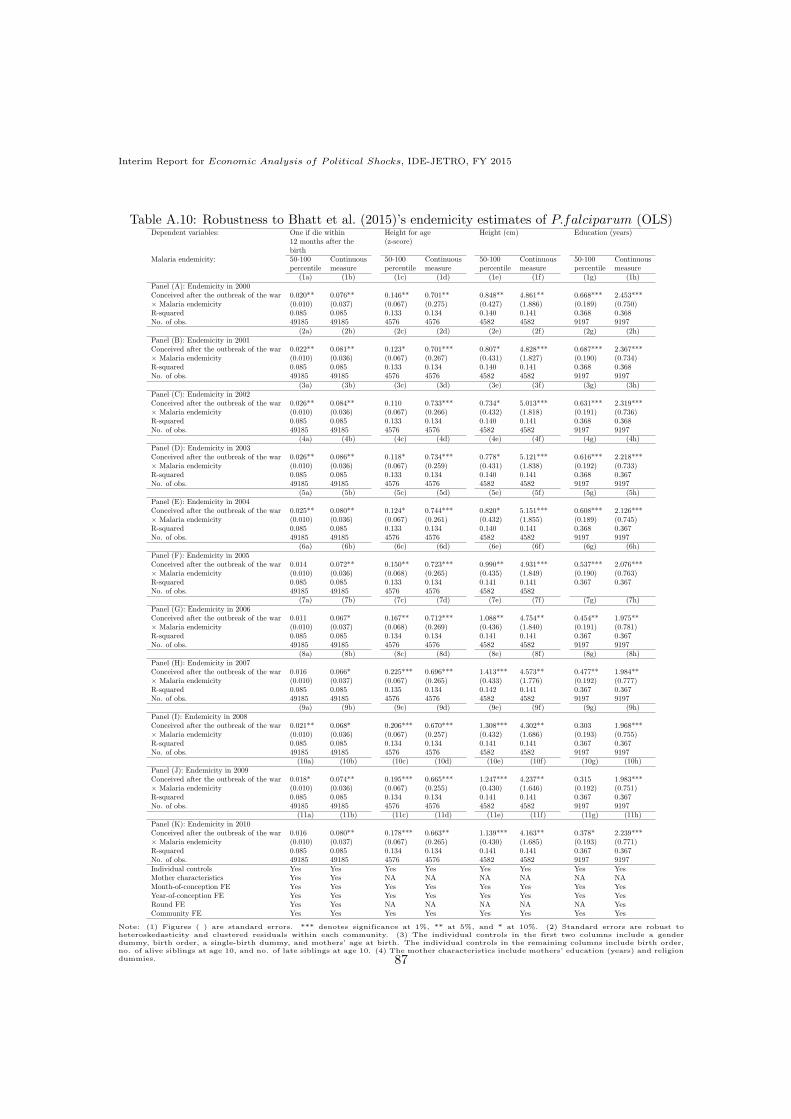
Interim Report for Economic Analysis of Political Shocks, IDE-JETRO, FY 2015
Table A.10: Robustness to Bhatt et al. (2015)’s endemicity estimates of P.falciparum (OLS)Dependent variables: One if die within Height for age Height (cm) Education (years)
12 months after the (z-score)birth
Malaria endemicity: 50-100 Continuous 50-100 Continuous 50-100 Continuous 50-100 Continuouspercentile measure percentile measure percentile measure percentile measure
(1a) (1b) (1c) (1d) (1e) (1f) (1g) (1h)Panel (A): Endemicity in 2000Conceived after the outbreak of the war 0.020** 0.076** 0.146** 0.701** 0.848** 4.861** 0.668*** 2.453***× Malaria endemicity (0.010) (0.037) (0.067) (0.275) (0.427) (1.886) (0.189) (0.750)R-squared 0.085 0.085 0.133 0.134 0.140 0.141 0.368 0.368No. of obs. 49185 49185 4576 4576 4582 4582 9197 9197
(2a) (2b) (2c) (2d) (2e) (2f) (2g) (2h)Panel (B): Endemicity in 2001Conceived after the outbreak of the war 0.022** 0.081** 0.123* 0.701*** 0.807* 4.828*** 0.687*** 2.367***× Malaria endemicity (0.010) (0.036) (0.067) (0.267) (0.431) (1.827) (0.190) (0.734)R-squared 0.085 0.085 0.133 0.134 0.140 0.141 0.368 0.368No. of obs. 49185 49185 4576 4576 4582 4582 9197 9197
(3a) (3b) (3c) (3d) (3e) (3f) (3g) (3h)Panel (C): Endemicity in 2002Conceived after the outbreak of the war 0.026** 0.084** 0.110 0.733*** 0.734* 5.013*** 0.631*** 2.319***× Malaria endemicity (0.010) (0.036) (0.067) (0.266) (0.432) (1.818) (0.191) (0.736)R-squared 0.085 0.085 0.133 0.134 0.140 0.141 0.368 0.368No. of obs. 49185 49185 4576 4576 4582 4582 9197 9197
(4a) (4b) (4c) (4d) (4e) (4f) (4g) (4h)Panel (D): Endemicity in 2003Conceived after the outbreak of the war 0.026** 0.086** 0.118* 0.734*** 0.778* 5.121*** 0.616*** 2.218***× Malaria endemicity (0.010) (0.036) (0.067) (0.259) (0.431) (1.838) (0.192) (0.733)R-squared 0.085 0.085 0.133 0.134 0.140 0.141 0.368 0.367No. of obs. 49185 49185 4576 4576 4582 4582 9197 9197
(5a) (5b) (5c) (5d) (5e) (5f) (5g) (5h)Panel (E): Endemicity in 2004Conceived after the outbreak of the war 0.025** 0.080** 0.124* 0.744*** 0.820* 5.151*** 0.608*** 2.126***× Malaria endemicity (0.010) (0.036) (0.067) (0.261) (0.432) (1.855) (0.189) (0.745)R-squared 0.085 0.085 0.133 0.134 0.140 0.141 0.368 0.367No. of obs. 49185 49185 4576 4576 4582 4582 9197 9197
(6a) (6b) (6c) (6d) (6e) (6f) (6g) (6h)Panel (F): Endemicity in 2005Conceived after the outbreak of the war 0.014 0.072** 0.150** 0.723*** 0.990** 4.931*** 0.537*** 2.076***× Malaria endemicity (0.010) (0.036) (0.068) (0.265) (0.435) (1.849) (0.190) (0.763)R-squared 0.085 0.085 0.133 0.134 0.141 0.141 0.367 0.367No. of obs. 49185 49185 4576 4576 4582 4582
(7a) (7b) (7c) (7d) (7e) (7f) (7g) (7h)Panel (G): Endemicity in 2006Conceived after the outbreak of the war 0.011 0.067* 0.167** 0.712*** 1.088** 4.754** 0.454** 1.975**× Malaria endemicity (0.010) (0.037) (0.068) (0.269) (0.436) (1.840) (0.191) (0.781)R-squared 0.085 0.085 0.134 0.134 0.141 0.141 0.367 0.367No. of obs. 49185 49185 4576 4576 4582 4582 9197 9197
(8a) (8b) (8c) (8d) (8e) (8f) (8g) (8h)Panel (H): Endemicity in 2007Conceived after the outbreak of the war 0.016 0.066* 0.225*** 0.696*** 1.413*** 4.573** 0.477** 1.984**× Malaria endemicity (0.010) (0.037) (0.067) (0.265) (0.433) (1.776) (0.192) (0.777)R-squared 0.085 0.085 0.135 0.134 0.142 0.141 0.367 0.367No. of obs. 49185 49185 4576 4576 4582 4582 9197 9197
(9a) (9b) (9c) (9d) (9e) (9f) (9g) (9h)Panel (I): Endemicity in 2008Conceived after the outbreak of the war 0.021** 0.068* 0.206*** 0.670*** 1.308*** 4.302** 0.303 1.968***× Malaria endemicity (0.010) (0.036) (0.067) (0.257) (0.432) (1.686) (0.193) (0.755)R-squared 0.085 0.085 0.134 0.134 0.141 0.141 0.367 0.367No. of obs. 49185 49185 4576 4576 4582 4582 9197 9197
(10a) (10b) (10c) (10d) (10e) (10f) (10g) (10h)Panel (J): Endemicity in 2009Conceived after the outbreak of the war 0.018* 0.074** 0.195*** 0.665*** 1.247*** 4.237** 0.315 1.983***× Malaria endemicity (0.010) (0.036) (0.067) (0.255) (0.430) (1.646) (0.192) (0.751)R-squared 0.085 0.085 0.134 0.134 0.141 0.141 0.367 0.367No. of obs. 49185 49185 4576 4576 4582 4582 9197 9197
(11a) (11b) (11c) (11d) (11e) (11f) (11g) (11h)Panel (K): Endemicity in 2010Conceived after the outbreak of the war 0.016 0.080** 0.178*** 0.663** 1.139*** 4.163** 0.378* 2.239***× Malaria endemicity (0.010) (0.037) (0.067) (0.265) (0.430) (1.685) (0.193) (0.771)R-squared 0.085 0.085 0.134 0.134 0.141 0.141 0.367 0.367No. of obs. 49185 49185 4576 4576 4582 4582 9197 9197Individual controls Yes Yes Yes Yes Yes Yes Yes YesMother characteristics Yes Yes NA NA NA NA NA NAMonth-of-conception FE Yes Yes Yes Yes Yes Yes Yes YesYear-of-conception FE Yes Yes Yes Yes Yes Yes Yes YesRound FE Yes Yes NA NA NA NA NA YesCommunity FE Yes Yes Yes Yes Yes Yes Yes Yes
Note: (1) Figures ( ) are standard errors. *** denotes significance at 1%, ** at 5%, and * at 10%. (2) Standard errors are robust toheteroskedasticity and clustered residuals within each community. (3) The individual controls in the first two columns include a genderdummy, birth order, a single-birth dummy, and mothers’ age at birth. The individual controls in the remaining columns include birth order,no. of alive siblings at age 10, and no. of late siblings at age 10. (4) The mother characteristics include mothers’ education (years) and religiondummies. 87
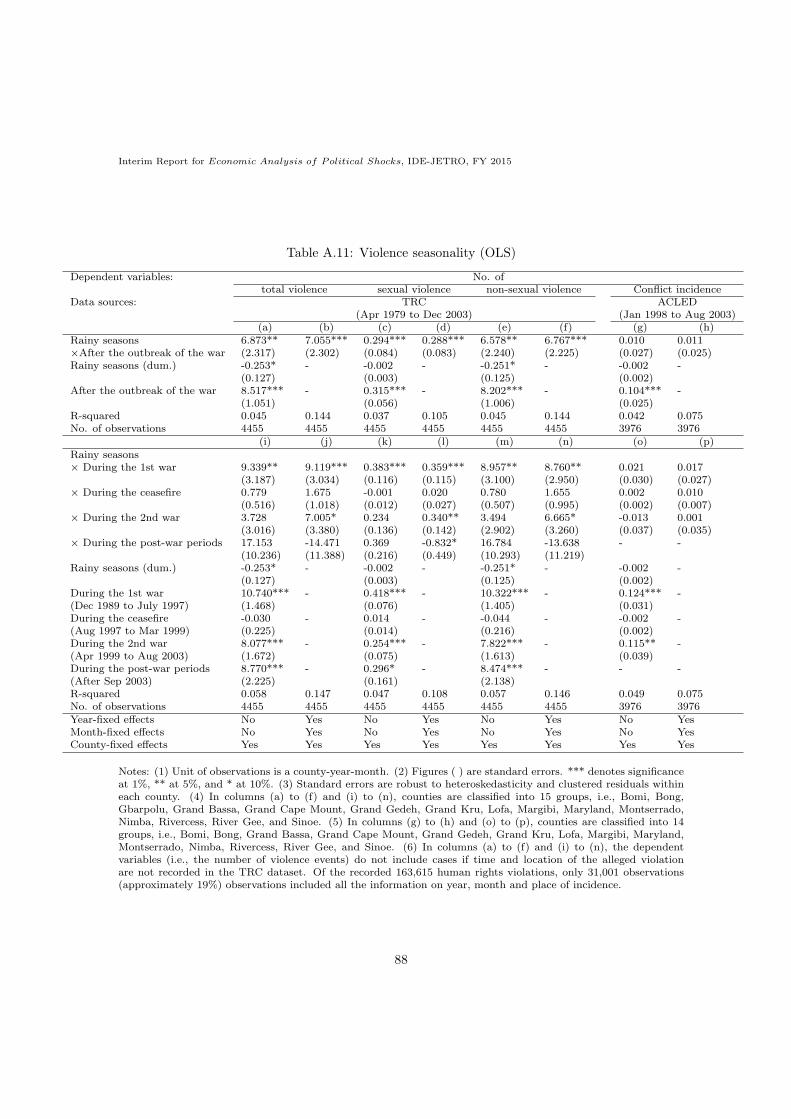
Interim Report for Economic Analysis of Political Shocks, IDE-JETRO, FY 2015
Table A.11: Violence seasonality (OLS)
Dependent variables: No. oftotal violence sexual violence non-sexual violence Conflict incidence
Data sources: TRC ACLED(Apr 1979 to Dec 2003) (Jan 1998 to Aug 2003)
(a) (b) (c) (d) (e) (f) (g) (h)Rainy seasons 6.873** 7.055*** 0.294*** 0.288*** 6.578** 6.767*** 0.010 0.011×After the outbreak of the war (2.317) (2.302) (0.084) (0.083) (2.240) (2.225) (0.027) (0.025)Rainy seasons (dum.) -0.253* - -0.002 - -0.251* - -0.002 -
(0.127) (0.003) (0.125) (0.002)After the outbreak of the war 8.517*** - 0.315*** - 8.202*** - 0.104*** -
(1.051) (0.056) (1.006) (0.025)R-squared 0.045 0.144 0.037 0.105 0.045 0.144 0.042 0.075No. of observations 4455 4455 4455 4455 4455 4455 3976 3976
(i) (j) (k) (l) (m) (n) (o) (p)Rainy seasons× During the 1st war 9.339** 9.119*** 0.383*** 0.359*** 8.957** 8.760** 0.021 0.017
(3.187) (3.034) (0.116) (0.115) (3.100) (2.950) (0.030) (0.027)× During the ceasefire 0.779 1.675 -0.001 0.020 0.780 1.655 0.002 0.010
(0.516) (1.018) (0.012) (0.027) (0.507) (0.995) (0.002) (0.007)× During the 2nd war 3.728 7.005* 0.234 0.340** 3.494 6.665* -0.013 0.001
(3.016) (3.380) (0.136) (0.142) (2.902) (3.260) (0.037) (0.035)× During the post-war periods 17.153 -14.471 0.369 -0.832* 16.784 -13.638 - -
(10.236) (11.388) (0.216) (0.449) (10.293) (11.219)Rainy seasons (dum.) -0.253* - -0.002 - -0.251* - -0.002 -
(0.127) (0.003) (0.125) (0.002)During the 1st war 10.740*** - 0.418*** - 10.322*** - 0.124*** -(Dec 1989 to July 1997) (1.468) (0.076) (1.405) (0.031)During the ceasefire -0.030 - 0.014 - -0.044 - -0.002 -(Aug 1997 to Mar 1999) (0.225) (0.014) (0.216) (0.002)During the 2nd war 8.077*** - 0.254*** - 7.822*** - 0.115** -(Apr 1999 to Aug 2003) (1.672) (0.075) (1.613) (0.039)During the post-war periods 8.770*** - 0.296* - 8.474*** - - -(After Sep 2003) (2.225) (0.161) (2.138)R-squared 0.058 0.147 0.047 0.108 0.057 0.146 0.049 0.075No. of observations 4455 4455 4455 4455 4455 4455 3976 3976Year-fixed effects No Yes No Yes No Yes No YesMonth-fixed effects No Yes No Yes No Yes No YesCounty-fixed effects Yes Yes Yes Yes Yes Yes Yes Yes
Notes: (1) Unit of observations is a county-year-month. (2) Figures ( ) are standard errors. *** denotes significanceat 1%, ** at 5%, and * at 10%. (3) Standard errors are robust to heteroskedasticity and clustered residuals withineach county. (4) In columns (a) to (f) and (i) to (n), counties are classified into 15 groups, i.e., Bomi, Bong,Gbarpolu, Grand Bassa, Grand Cape Mount, Grand Gedeh, Grand Kru, Lofa, Margibi, Maryland, Montserrado,Nimba, Rivercess, River Gee, and Sinoe. (5) In columns (g) to (h) and (o) to (p), counties are classified into 14groups, i.e., Bomi, Bong, Grand Bassa, Grand Cape Mount, Grand Gedeh, Grand Kru, Lofa, Margibi, Maryland,Montserrado, Nimba, Rivercess, River Gee, and Sinoe. (6) In columns (a) to (f) and (i) to (n), the dependentvariables (i.e., the number of violence events) do not include cases if time and location of the alleged violationare not recorded in the TRC dataset. Of the recorded 163,615 human rights violations, only 31,001 observations(approximately 19%) observations included all the information on year, month and place of incidence.
88

Interim Report for Economic Analysis of Political Shocks, IDE-JETRO, FY 2015
Table A.12: Recorded human rights violations
1979 1980 1981 1982 1983 1984 1985 1986 1987 1988 1989 1990 1991Abduction 1 13 0 0 1 0 58 9 1 0 56 2762 404Amputation 1 0 0 0 0 0 0 0 0 0 0 13 1Arbitrary detention 12 22 0 0 7 0 73 1 3 0 14 1043 185Assault 6 24 0 0 12 2 68 1 4 0 38 3293 444Cannibalism 0 0 0 0 0 0 0 0 0 0 0 22 2Drugging 0 0 0 0 0 0 0 0 0 0 0 11 0Exposure/deprivation 0 0 0 0 0 0 0 0 0 0 3 653 74Extortion 0 2 0 0 0 0 12 2 0 0 8 662 71Forced displacement 6 22 1 3 0 0 72 4 0 0 394 20256 1777Forced labor 0 4 0 0 0 0 8 0 0 0 5 1580 205Forced recruitment 0 0 0 0 0 0 0 9 0 0 4 415 76Ingesting taboo item 0 0 0 0 0 0 0 0 0 0 1 69 14Killing 29 55 2 0 2 2 133 0 1 0 104 9407 1001Looting 3 13 0 0 0 0 12 0 0 1 16 2116 222Missing 0 3 0 0 0 0 6 1 1 0 7 521 62Property destruction 3 2 0 0 0 0 5 0 0 0 21 1557 184Robbery 1 0 0 0 0 0 13 0 0 0 21 1535 172Torture 0 11 0 0 0 1 37 0 0 0 20 1240 189Rape/gang rape/multiple rape 0 8 0 0 0 2 1 0 0 0 5 764 121Sexual abuse 0 1 0 0 5 0 7 0 0 0 4 600 79Sexual slavery 0 0 0 0 0 0 0 0 0 0 2 231 45All crimes 62 180 3 3 27 7 505 27 10 1 723 48750 5328
1992 1993 1994 1995 1996 1997 1998 1999 2000 2001 2002 2003 TotalAbduction 965 1578 2227 501 273 56 37 186 324 406 984 2203 13045Amputation 2 10 8 2 4 0 0 1 1 0 6 9 58Arbitrary detention 288 454 579 153 132 32 31 47 44 46 147 704 4017Assault 797 1314 2252 458 401 76 59 121 166 243 531 2912 13222Cannibalism 6 12 20 4 3 0 0 0 2 1 5 9 86Drugging 4 15 4 1 0 0 0 2 2 1 12 29 81Exposure/deprivation 209 260 281 61 74 8 2 25 40 49 94 215 2048Extortion 123 170 235 59 30 19 28 19 25 30 81 519 2095Forced displacement 3740 5522 8167 1409 1274 131 172 861 1365 1834 2759 9080 58849Forced labor 461 910 1235 283 232 29 36 66 144 302 621 1439 7560Forced recruitment 104 127 202 54 31 2 22 43 72 129 216 527 2033Ingesting taboo item 11 20 39 10 4 1 1 5 4 3 6 67 255Killing 1897 3221 4138 1077 1052 117 109 236 446 587 893 3533 28042Looting 335 557 852 205 194 33 13 43 110 104 238 2552 7619Missing 93 118 185 32 34 4 1 13 35 67 61 192 1436Property destruction 321 650 1038 295 181 16 37 58 154 185 308 866 5881Robbery 312 470 748 167 156 29 23 58 74 117 271 1650 5817Torture 295 603 860 214 126 25 12 61 63 46 197 937 4937Rape/gang rape/multiple rape 289 375 675 112 119 11 11 41 56 90 174 626 3480Sexual abuse 99 186 367 89 62 3 4 30 12 39 73 371 2031Sexual slavery 45 126 187 35 23 1 3 9 24 23 52 217 1023All crimes 10396 16698 24299 5221 4405 593 601 1925 3163 4302 7729 28657 163615
Source: Truth and Reconciliation Commission (TRC)
89