Embed Size (px)
Citation preview

MALARIA:
BATTLING OLD DISEASE
WITH NEW STRATEGIES
DR ROSE NANI MUDIN
MINISTRY OF HEALTH
5TH PERAK HEALTH CONFERENCE
KINTA RIVERFRONT HOTEL, IPOH, PERAK
10 OCTOBER 2013

OUTLINE OF PRESENTATION
1. EPIDEMIOLOGY OF MALARIA
2. MALARIA PATHOPHYSIOLOGY, SYMPTOMS
3. HISTORY OF MALARIA ERADICATION AND CONTROL PROGRAM IN MALAYSIA
4. NATIONAL STRATEGIC PLANNING FOR ELIMINATION OF MALARIA
5. ACHIEVEMENTS
6. WAY FORWARD

MALARIA EPIDEMIOLOGY • CDC estimates that there are 300-500 million
cases of malaria each year, and more than 1 million people die from it.
• The World Health Organization estimates that in 2010 malaria caused 219 million clinical episodes, and 660,000 deaths.
• An estimated 91% of deaths in 2010 were in the African Region, followed by the South-East Asian Region (6%), and the Eastern Mediterranean Region (3%). About 86% of deaths globally were in children.
SOURCE: CDC, Atlanta, USA and WHO, Geneva

MALARIA PATHOPHYSIOLOGY • Malaria - caused by a parasite, passed from one human to another
by the bite of infected Anopheles mosquitoes.
• Four Plasmodium species – P. falcifarum, P. vivax, P. ovale, P. malaria, P. knowlesi
• After infection, the parasites (called sporozoites) travel through the bloodstream to the liver, where they mature and release another form, the merozoites. The parasites enter the bloodstream and infect red blood cells.
• The parasites multiply inside the red blood cells, which then break open within 48 to 72 hours, infecting more red blood cells.
• The first symptoms usually occur 10 days to 4 weeks after infection, but can appear as early as 8 days or as long as a year after infection. The symptoms occur in cycles of 48 to 72 hours.
• symptoms are caused by:
The release of merozoites into the bloodstream
Anemia resulting from the destruction of the red blood cells
Large amounts of free hemoglobin being released into circulation after red blood cells break open
SOURCE: A.D.A.M. Medical Encyclopedia, National Library of Medicine, PubMed Health.

MALARIA SYMPTOMS Symptoms
• Anemia
• Bloody stools
• Chills
• Coma
• Convulsion
• Fever
• Headache
• Jaundice
• Muscle pain
• Nausea
• Sweating
• Vomiting

HISTORY OF MALARIA ERADICATION AND
CONTROL PROGRAM
• The Malaria Eradication Programme was
established in 1967- to eradicate malaria in
Peninsular Malaysia by the year 1982.
• In 1986, Vector Borne Disease Control
Programme was establish through expansion
of the programme to dengue, filariasis,
typhus, JE, yellow fever & Plaque diseases

MALARIA TREND AND PROGRAM 1961-2012
243,
870
181,
49
5
151,
822
87,
432
44
,226
49
,526
48
,00
7
41,
708
55,0
68
69
,127
54,8
31
43,
545
36,8
53
39,8
90
58,9
58
59,2
08
51,9
21
26,6
49
13,4
91
11,1
06
12,7
05
12,7
80
11,0
19
6,3
38
6,1
54
5,56
9
5,29
4
5,4
56
7,39
0
7,0
10
6,6
50
5,30
6
4,7
25
0
50,000
100,000
150,000
200,000
250,000
300,000
196
1
196
5
1970
1975
198
0
198
5
198
6
198
7
198
8
198
9
199
0
199
1
199
2
199
3
199
4
199
5
199
6
199
7
199
8
199
9
200
0
200
1
200
2
200
3
200
4
200
5
200
6
200
7
200
8
200
9
2010
2011
2012
7
1961-1981 Malaria Eradication Programme
1982-2010 Malaria Control Programme
2011-2020 Strategic Plan:
Elimination of Malaria

INTERVENTIONS AND IMPACT ON MALARIA
CONTROL PROGRAM 1960-2008

2000 2001 2002 2003 2004 2005 2006 2007 2008 2009 2010 2011 2012
Total cases 12705 12780 11019 6338 6154 5569 5294 5456 7390 7010 6650 5306 4725
Indigenous cases 9273 8808 7652 4264 3989 3329 3917 4048 6071 5955 5194 4164 2050
Incidence rate 54.6 53.7 44.9 33.3 24.1 21.3 19.9 20.1 26.7 24.8 23.5 18.6 16.1
0
10
20
30
40
50
60
0
2000
4000
6000
8000
10000
12000
14000
Nu
mb
er
of
case
s
9
TOTAL CASES AND INCIDENCE RATE OF MALARIA FOR 2000-2012

0
1000
2000
3000
4000
5000
6000
2000 2010 2011 2012
TREND OF MALARIA CASES BY STATES (2000, 2010-2012)
10

43 47 25 23 27 35 40 25 27 21 35 46 39 21 36 33 21 18 30 26 33 18 16
0.09 0.12
0.07 0.06
0.05 0.06
0.08 0.09
0.20 0.19
0.28
0.36 0.35
0.25
0.58 0.59
0.40
0.33
0.41 0.37
0.50
0.34 0.34
0.00
0.10
0.20
0.30
0.40
0.50
0.60
0.70
0
5
10
15
20
25
30
35
40
45
50
199
0
199
1
199
2
199
3
199
4
199
5
199
6
199
7
199
8
199
9
200
0
200
1
200
2
200
3
200
4
200
5
200
6
200
7
200
8
200
9
2010
2011
2012
Malaria death Case fatality rate
MALARIA DEATHS AND CASE FATALITY RATE 1990-2012
11

0
100
200
300
400
500
600
700
800
2011 2012 Age Group
TREND OF MALARIA BY AGE GROUP 2012 & 2011
No. of Cases

Proportion of Malaria Parasites by Species In Malaysia (2006 – 2010)
0
20
40
60
80
P. falciparum P. vivax P. malariae P. knowlesi Mixed
Percentage of malaria species in West M'sia, 2006 - 2010
2006 2007 2008 2009 2010
0
50
100
P. falciparum P. vivax P. malariae P. knowlesi Mixed
Percentage of malaria species in Sarawak, 2006 - 2010
2006 2007 2008 2009 2010
0
20
40
60
P. falciparum P. vivax P. malariae P. knowlesi Mixed
Percentage of malaria species in Sabah, 2006 - 2010
2006 2007 2008 2009 2010

2007 2008 2009 2010 2011
% Pf 30 38 37 36 18
% Pv 63 51 50 50 56
0 10 20 30 40 50 60 70
Pe
rce
nta
ge
Proportion of Pf and Pv, West Malaysia, 2007 -2011
2007 2008 2009 2010 2011
% Pf 12 9 8 4 6
% Pv 59 63 48 79 54
0
20
40
60
80
100
Per
cen
tage
Proportion of Pf and Pv in Sarawak, 2007 - 2011
2007 2008 2009 2010 2011
% Pf 41 38 32 42 30
% Pv 47 47 48 37 31
0
10
20
30
40
50
60
Per
cen
tage
Proportion of Pf and Pv in Sabah, 2007 - 2011
2007 2008 2009 2010 2011
% Pf 33 31 27 25 18
% Pv 52 52 48 57 46
0 10 20 30 40 50 60 70
Per
cen
tage
Proportion of Pf and Pv in Malaysia,
2007 - 2011

NEW APPROACH :
NATIONAL STRATEGIC
PLANNING
FOR
ELIMINATION OF MALARIA 2011 - 2020

NATIONAL STRATEGIC PLANNING FOR ELIMINATION OF MALARIA 2011 - 2020
1. Surveillance system
2. Integrated Vector Management
3. Early detection and prompt treatment
4. Preparedness and outbreak response
5. Communication and Social Mobilization
6. Capacity Building
7. Operational Research
Seven strategies

NATIONAL STRATEGIC PLANNING FOR THE ELIMINATION OF MALARIA 2011 - 2020
Sabah and
Sarawak:
elimination by
2020.
Target: Elimination of locally acquired malaria in Malaysia by 2020
West Malaysia: elimination by 2015.
AREA CRITERIA
RED Incidence > 1 / 1000 population
YELLOW Incidence < 1 / 1000 population
GREEN No local transmission
24.5% pop. at risk
19.7% pop. at risk
0.4% pop. at risk
17

Malaria is notifiable disease by administrative Web based surveillance system - real time, accessibility and
monitoring at all level National malaria case registry: Vekpro-on-line
STRATEGY 1. SURVEILLANCE SYSTEM

Contents: a. Case registry b. Case Investigation c. Follow-up cases d. Investigation on malaria death e. Vector Control: - basic data (localities), vector control activities (spraying, ITN) e. Laboratory: number of slides and results
Standardised Forms
STRATEGY 1. SURVEILLANCE SYSTEM-2

DIVISION DISTRICT
SECTOR
No. of
locality
No of
houses Pop Inc 2006 Inc 2007 Inc 2008
Strati-
fication
0100 Kuching 0110 Lundu 1 0111 Sematan 80 2368 13148 10.19 4.64 4.72 Merah
0100 Kuching 0110 Lundu 2 0112 Lundu 95 2858 23376 2.22 0.73 0.43 Merah
0300 Sibu 0310 Kanowit 3 0311 Kanowit 150 2642 16464 1.03 0.97 1.28 Merah
0300 Sibu 0310 Kanowit 4 0312 Ngemah 111 2248 20784 1.4 0.82 0.48 Merah
0400 Miri 0410 Marudi 5 0411 Bario 81 1769 25297 1.58 1.42 14.98 Merah
0400 Miri 0410 Marudi 6 0412 Mulu 137 3720 34718 4.26 3.28 2.77 Merah
0400 Miri 0410 Marudi 7 0413 Loyang 79 2167 20111 2.98 2.49 2.699 Merah
0500 Limbang 0510 Limbang 8 0511 Mendamit 84 1481 17135 1.17 0.82 0.41 Merah
0500 Limbang 0520 Lawas 9 0521 Ba Kelalan 55 1263 10213 0.69 1.66 1.57 Merah
0600 Sarikei 0610 Julau 10 0611 Julau 126 1990 21573 0.74 1.9 0.93 Merah
0600 Sarikei 0640 Pakan 11 0641 Pakan 174 2585 20350 1.77 0.79 1.77 Merah
Foci registry
STRATEGY 1. SURVEILLANCE SYSTEM-3

Control measure – Insecticide Residual Spray (IRS) and used of treated bednets or Long Lasting Insecticide Nets (LLINs)
Other control measures such as environmental manipulation,
larvaciding, use of repellents
Vector surveillance
Community participation – e.g.Primary Health Care
Multi-agency collaboration
STRATEGY 2. INTERGRATED VECTOR MANAGMENT

1. Screening at health facilities. 2. Diagnosis - microscopy
3. Surveillance among high risk groups 4. PCD post and Sub-sector offices 5. Use of ACT.
STRATEGY 3 EARLY DETECTION AND PROMPT TREATMENT

Staff and assets Training
Early detection of outbreak.
Control of outbreak within 6 weeks
Improve knowledge and awareness among population at risk. Community mobilisation to control malaria.
Operational research
STRATEGY 4. PREPAREDNESS AND OUTBREAK RESPONSE
STRATEGY 5. SOCIAL MOBILIZATION AND COMMUNICATION
STRATEGY 6. CAPACITY BUILDING
STRATEGY 7. RESEARCH

REPORTING AND MONITORING SYSTEM
Passive Case Detection, Active Case Detection, Mass Blood Survey, Screening [clinics/hospitals/laboratories (both government and private) and field]
Positive BFMP
Case Investigation, Contact Investigation, Vector Control, Health Education, Case Follow-up
Notification to the nearest Health Office (Note: malaria is a notifiable disease)
Case Registration on line by District
Monthly Analysis and Reporting by State to MOH
•Monthly Analysis and Reporting by MOH •Monthly Field Visit by MOH and State Officers
•3 monthly reporting during Vector Technical Meeting •Yearly Report of activities, achievement/KPI and elimination progress

KEY PERFORMANCE INDICATORS
No Indicator Target
1 Annual reduction of cases 20%
2 Case fatality 0
3 Coverage of treated nets for population at risk 100%
4 Coverage of indoor residual spraying for
population at risk
100%
5 Number of cases investigated 100%
6 Number of cases completed treatment 100%
7 BSMP slides with inaccurate reading (error rate) < 1%
8 BFMP slides examined within the same day
(health clinics)
100%
9 Control of outbreak within 6 weeks 85%
10 Increased health education activities for
population at risk
10%
Note: Total indicators: 47 25

ACHIEVEMENT: MALARIA IR
26
MALAYSIA MDG (2000 baseline)
WPR (2007 baseline)
TARGET Reduction 75% Reduction 50%
Baseline IR (cases/ 100,000 pop.)
54.6 cases/ 100,000 20.1 cases/ 100,000
2012 Achievement 16.1 (↓ 71%) 16.1 (↓ 20%)
2015 target 13.6 cases/ 100,000 10.1 cases/ 100,000

ACHIEVEMENT: MALARIA DEATHS
27
MALAYSIA MDG (2000 baseline)
WPR (2007 baseline)
TARGET Number of death / rate with reduction
75%
Number of death / rate with reduction
50%
Baseline (number of death/ death rate (per 100,000 pop)
35 deaths /death rate 0.15
18/ death rate 0.07
2012 Achievement 16 (↓ 54%), death rate 0.05 (↓67%)
16 (↓ 11%), death rate 0.05 (↓29%)
2015 target 9 death/ death rate 0.05
9 death/ death rate 0.04

INTERAGENCY COLLABORATION
Plantations - since the 1990s
Plantations provide support for the malaria programme:
o housing and transport for government control malaria workers
o ITNs
o IRS insecticides and hire a contractors to conduct IRS
o Health clinics with microscopy
o Land or buildings for malaria subsector offices
28

COMMUNITY PARTICIPATION IN MALARIA
PREVENTION AND CONTROL
Primary Health Care (PHC) volunteers
o Involved in the control activities more 15 years
o Activities - Case follow up,
- Distribution on nets
- Conducting IRS
- MBS
- helping MOH in delivering treatment to
patient after diagnosis made by doctor
29
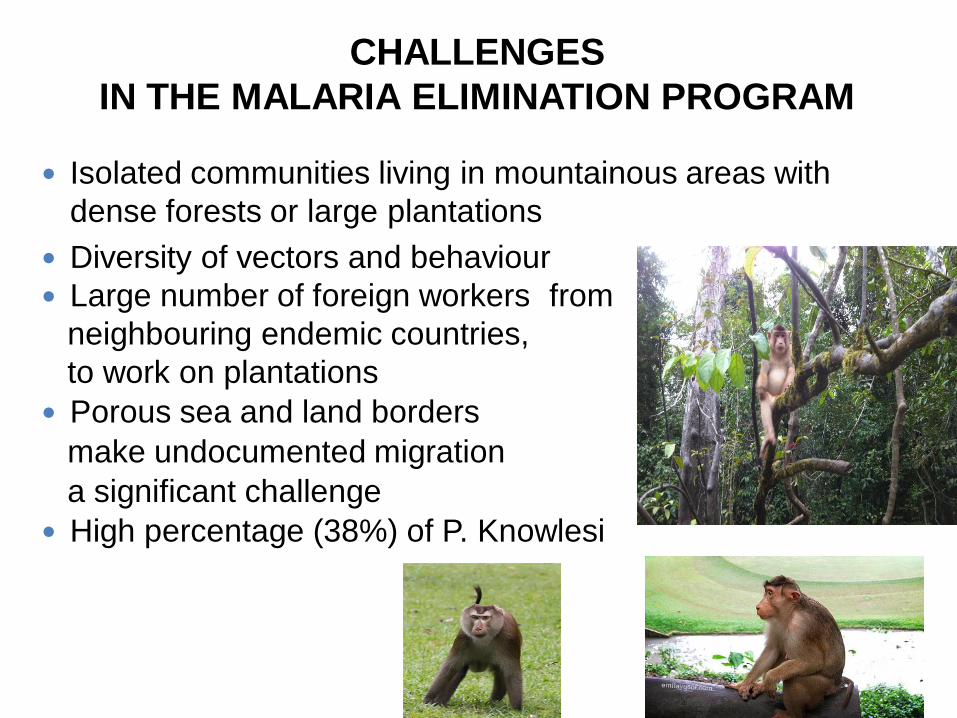
CHALLENGES
IN THE MALARIA ELIMINATION PROGRAM
Isolated communities living in mountainous areas with
dense forests or large plantations
Diversity of vectors and behaviour
Large number of foreign workers from
neighbouring endemic countries,
to work on plantations
Porous sea and land borders
make undocumented migration
a significant challenge
High percentage (38%) of P. Knowlesi
30

NO locally acquired Malaria cases in Peninsular Malaysia
by 2015 and in Sabah and Sarawak by 2017.
To sustain interagency collaboration and PHC volunteers
participation in Malaria control and prevention activities
Share best practices from Sabah programme partnerships
with other state vector offices
Identify new partners and share best practices with other
plantations
Find ways to quantitatively assess the success of these
partnerships
WAY FORWARD
31

TERIMA KASIH DIATAS PERHATIAN ANDA
32