Embed Size (px)
Citation preview
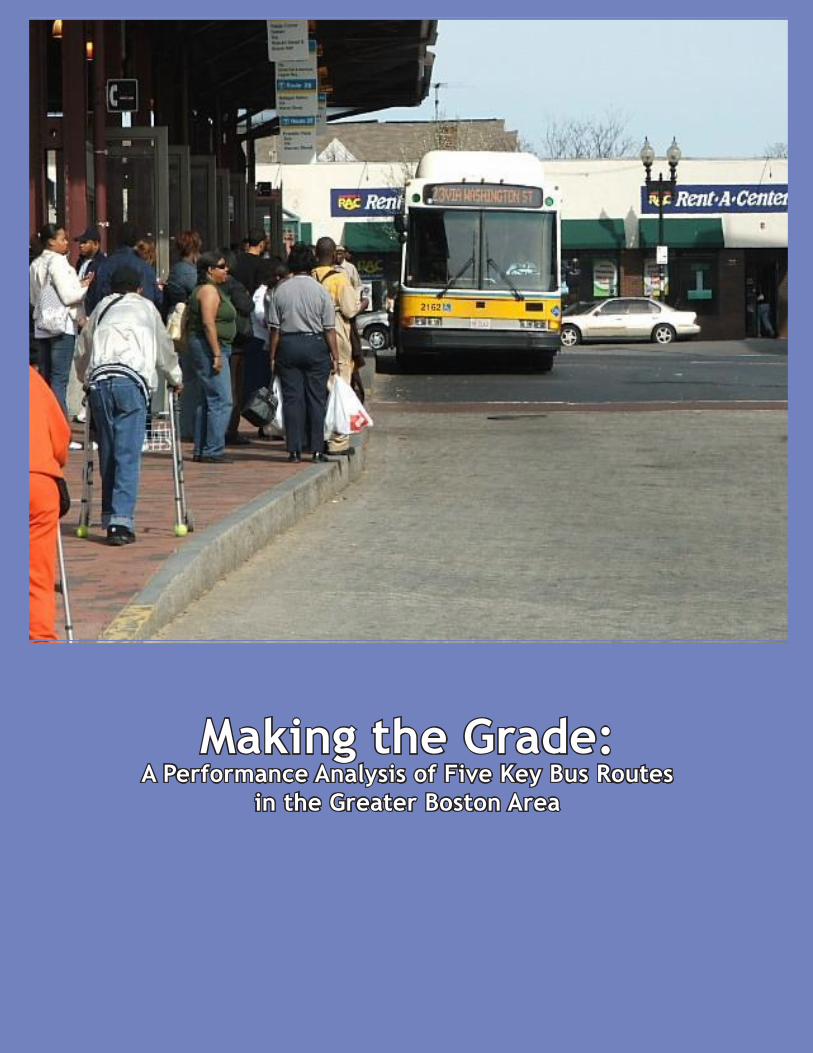
Making the Grade: A Performance Analysis of Five Key Bus Routes
in the Greater Boston Area


Making the Grade:A Performance Analysis of Five Key
Bus Routes in the Greater Boston Area
Report Produced by:Kari Hewitt
Courtney KnappJason KurianKara Sergeant
A collaboration of Tufts University’s Department of Urban and Environmental Policy and Planning and
Alternatives for Community and Environment (ACE)and the T Riders Union (TRU)

Making the Grade:A Performance Analysis of Five Key
Bus Routes in the Greater Boston Area
Abstract:This project represents a snapshot of the service performance of five key bus routes in the Massachusetts Bay Transit Authority’s (MBTA) transportation sys-tem. Five areas of service were assessed and graded according to criteria es-
tablished by the authors: timeliness, frequency, passenger crowding, on bus as-signments, and station/stop amenities. In determining what constitutes “quality service,” the MBTA’s standards are analyzed and an alternative vision that takes into consideration the specific needs of individual communities is offered. The authors argue that additional criteria such as transit mobility and affordability
must be evaluated by the transit authority to ensure that commuters are receiv-ing quality service for the fare that they pay. Fieldwork was conducted over the span of March 2007; results of the assessment reveal that three of the five bus routes are performing on average (each received a “C” grade). The remaining two buses performed below average, receiving a C- and D+, respectively. In ad-dition to assigning grades to the five lines, this report attempts to contextualize the service by offering socioeconomic profiles of the communities served by the routes as well as information about transit dependency. A history of the trans-portation justice struggle around bus services is also provided to paint a fuller
picture of ongoing transportation justice struggles.
Acknowledgements:This report would not have been possible without the guidance and sup-port of the following individuals and organizations: Penn Loh, Lee Mat-sueda, Khalida Smalls, Rene Mardones, Eugene Benson, and other mem-bers of ACE/TRU; Professors Rusty Russell, Justin Hollander, and Molly Mead; Teaching Assistants Elizabeth Saggesse, Christopher Mancini, and Mary Zagar; Hedda Steinhoff for her enormously helpful GIS mapping contributions; Barbara Parmenter; and all of our fellow students for
their constant support and feedback throughout the process.

Table of Contents:
Executive Summary p.1
Introduction p.3
Subsidy Analysis p.11
Evaluating Quality of Service p.13
Community Profiles p.22
Introduction to the Report Card p.41
Methodology p.42
The Report Card s p.46
Key Findings and Analysis p.51
Recommendations p.60
Appendices p.63
References p.93

1
Executive Summary
Making the Grade: An Analysis of Five Key Bus Routes in the Greater Boston Area is a report produced in collaboration between four Tufts Uni-versity graduate students and the T Riders Union, a public transportation organizing and advocacy group asso-ciated with Alternatives for Commu-nity and Environment (ACE). Over the course of four months, the stu-dent project team analyzed the per-formance and quality of service on five Massachusetts Bay Transporta-tion Authority (MBTA) bus lines in or-der to determine whether disparities exist between environmental justice (EJ) and non-EJ communities in the Greater Boston Metropolitan Area.
This report begins with a discussion of both historical and contemporary transportation justice issues-- in Bos-ton and beyond-- in order to set the ground for our critique of disparities in service quality standards along so-cioeconomic and racial lines. It is re-vealed that the long legacy of trans-portation-related social injustices in our country continue to inform trans-portation planning, funding, and ser-vice performance today, and particu-larly in the Boston area with the case of the MBTA.
From there, an analysis of “service quality standards” is offered. This section addresses both the measure-ments employed by the MBTA to assess “world class” service, as well as en-vironmental justice critiques of their
methods used. Points of criticism in-clude the arbitrary calculations used to determine a “safe and comfort-able” ride, the lack of consistency in evaluating service (in terms of ongo-ing and regular evaluation), and the absence of demand assessments to determine the actual transportation needs of diverse communities. The final point of this section is a discus-sion of what the researchers have determined is necessary for moni-toring performance and determining true “first class” service aboard the MBTA’s buses.
The “community profiles” section uses U.S. Census data collected in 2000 and GIS maps to further contex-tualize the five routes assessed in this report. Massachusetts’ Environmen-tal Justice Policy (2002) characterizes “environmental justice populations” in terms of socioeconomic and racial demographics. To that end, racial di-versity, income, and linguistic isola-tion profiles are offered for each of the communities served. Transporta-tion-related profiles, such as transit dependency, accessibility and mobil-ity are also discussed and compared across neighborhoods.
The crux of our analysis comes with the Report Card section of the report. Methodologies developed to assess major service components on each of the five routes are explained, and report card “grades” are assigned to each of the routes in five areas: bus
The long legacy of transportation-related social in-justices...continue to inform transportation planning, funding, and service performance...in the Boston area.
2
frequency, timeliness, crowding, on bus assignment and station ameni-ties. An overall grade is also assigned to each route.
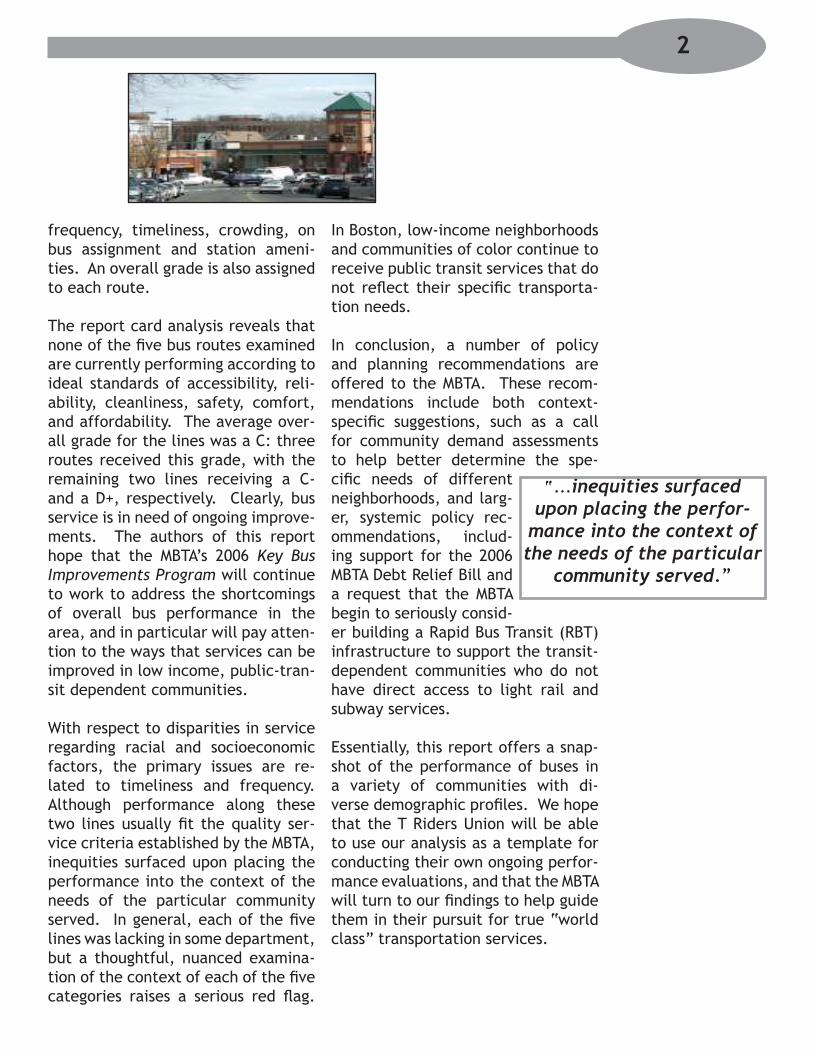
The report card analysis reveals that none of the five bus routes examined are currently performing according to ideal standards of accessibility, reli-ability, cleanliness, safety, comfort, and affordability. The average over-all grade for the lines was a C: three routes received this grade, with the remaining two lines receiving a C- and a D+, respectively. Clearly, bus service is in need of ongoing improve-ments. The authors of this report hope that the MBTA’s 2006 Key Bus Improvements Program will continue to work to address the shortcomings of overall bus performance in the area, and in particular will pay atten-tion to the ways that services can be improved in low income, public-tran-sit dependent communities.
With respect to disparities in service regarding racial and socioeconomic factors, the primary issues are re-lated to timeliness and frequency. Although performance along these two lines usually fit the quality ser-vice criteria established by the MBTA, inequities surfaced upon placing the performance into the context of the needs of the particular community served. In general, each of the five lines was lacking in some department, but a thoughtful, nuanced examina-tion of the context of each of the five categories raises a serious red flag.
In Boston, low-income neighborhoods and communities of color continue to receive public transit services that do not reflect their specific transporta-tion needs.
In conclusion, a number of policy and planning recommendations are offered to the MBTA. These recom-mendations include both context-specific suggestions, such as a call for community demand assessments to help better determine the spe-cific needs of different neighborhoods, and larg-er, systemic policy rec-ommendations, includ-ing support for the 2006 MBTA Debt Relief Bill and a request that the MBTA begin to seriously consid-er building a Rapid Bus Transit (RBT) infrastructure to support the transit-dependent communities who do not have direct access to light rail and subway services.
Essentially, this report offers a snap-shot of the performance of buses in a variety of communities with di-verse demographic profiles. We hope that the T Riders Union will be able to use our analysis as a template for conducting their own ongoing perfor-mance evaluations, and that the MBTA will turn to our findings to help guide them in their pursuit for true “world class” transportation services.
“...inequities surfaced upon placing the perfor-
mance into the context of the needs of the particular
community served.”

Introduction
The ProjectOur team is working with Alterna-tives for Community and Environment (ACE) and its T Riders Union (TRU) to document disparities in public trans-portation in the Boston metropolitan area. Our focus is on whether the Massachusetts Bay Transportation Authority, Boston’s public transpor-tation provider, provides a different level of service to low-income com-munities of color (environmental jus-tice or ‘EJ’ communities) versus more affluent areas. We are measuring bus service provided to the communities of Roxbury, Dorchester, Mattapan, and Chelsea and contrasting our find-ings to service provided beyond this area; areas such as Watertown and Cambridge. There has been consider-able anecdotal evidence of poor ser-vice in these areas and only recently have studies begun to show data to support this. Our aim is to document disparities in service based on our in-spections of service.
ACE selected five bus routes to be analyzed. Three serve primarily en-vironmental justice communities:
23 – Ruggles Station, Roxbury to Ashmont Station, Dorchester
28 – Ruggles Station, Roxbury to Mattapan Station, Mattapan
111 – Haymarket Station, Down-town Boston to Woodlawn, Everett via ChelseaOne serves more affluent and less di-verse areas:
•
•
•
57 – Kenmore Station, Fenway/Kenmore to Watertown Yard, Water-townThe remaining route serves both en-vironmental justice communities and more affluent areas:
1 – Dudley Square, Roxbury to Har-vard University, Cambridge
We evaluated the quality and quan-tity of bus service in five categories: crowding on the bus, timeliness of the bus, frequency of service, ameni-ties on the bus and at stops, as well as analyzing subsidy per passenger. These individual elements take into account the anecdotal evidence men-tioned above. With the limited scope of time and the MBTA implementing long-awaited service improvements along with a new fare collection sys-tem, our analysis functions as more of an inspection of current service, rather than a full documentation. It is hoped that our methodology will be useful so that documentation of bus service can continue into the future and provide a fuller picture.
One of the key goals for this report is to advocate for S. 2029: An Act Improving the Finances of the Mas-sachusetts Bay Transportation Au-thority. The bill, currently in the Massachusetts state legislature, will assist in relieving the MBTA of its $2.9 billion debt related to the mammoth Big Dig project. The Big Dig highway project was funded with federal money with the requirement
•
•
The ProjectThe HistoryACE and Transportation Equity
•••
3

that public transportation projects be built to mitigate the extra auto-mobile traffic that would accompany the Big Dig completion. The bill for the additional public transportation has gone directly to the MBTA, which must dedicate a large amount of its resources to fund the project. This has led to a series of fare increases (see Table 1), which take a large toll on low-income and transit dependent communities and impedes the effec-tiveness of the MBTA.
Year Bus Subway
1991 $0.65 $0.85
2001 $0.75 $1.00
2004 $0.90 $1.25
2007 $1.25/$1.50 $1.70/$2.00
Table 1: Fare Increases Since 1991
In the United States, the primary mode of transportation is usually a personal automobile. Unfortunately, in the urban environment, the cost of acquiring and maintaining auto-mobiles can be prohibitively expen-sive. In neighborhoods with a con-centration of low incomes residents, this creates a dependence on public transportation. In order to travel to work, school, and to provide food and other necessities, a dependable source of public transit is necessary, creating vulnerability for low-income residents dependent on its services.
The HistoryThe history of transportation in the United States is entwined with a lega-cy of discrimination, racism and clas-sism, institutional and otherwise. The federal government created equal protection for everyone, regardless of race, under the 14th Amendment in the US Constitution. In spite of this, a long period of segregation followed. Separate transportation facilities for non-whites originated in the case of Plessy v. Ferguson (1896). This case
of transportation racism became a justification for “separate but equal” fa-cilities for those who are not white. While the le-gal justification for segre-gation has been reversed for several decades, the legacy of discrimination still lingers. Transportation planning decisions may seem be-
nign after the discrimination of the past. However, those who design transportation plans have the ability to affect the lives of urban minor-ity communities, who represent 55% of transit riders, in a powerful way (American Public Transportation As-sociation, 2006, p.2). The equity in transportation decision making is de-rived from: quality of transportation, transportation costs, both direct and indirect, and the price structure of transportation, among others (Lit-man, 2005, p.2). For example, if
The equity in transportation decision making is derived from: quality of transportation, transporta-
tion costs, both direct and indirect, and the price structure of transportation....
4

diesel buses are the main source of transportation for the community, it has various impacts. If the diesel buses are old they probably pollute heavily and expose the community to health problems. If the buses charge a high fare, this can put a strain on the income of a poor family. If the bus does not run according to sched-ule, it adversely impacts those who must arrive at work on time. The eq-uity issue comes into play when situ-ations like this occur for one part of the community, perhaps an area with a high minority population, while oth-ers benefit from transportation deci-sions that have more positive impacts. The question remains: do the transit
dependent receive what they pay for?
Unfortunately, what per-sists today is descended from the sins of the past. In theory, the United States is a land of op-
portunity and, by law, the public and private sectors cannot discriminate on the basis of race. In practice, we are a nation largely divided by race and class. In the major cities of the United States, this translates into city segments that tend to be divided by race. Cities, with a few exceptions, tend to continue the segregated pat-terns of the past.
Los Angeles: Bus Riders UnionDisparities in service are clear-cut in Los Angeles, particularly with the bus service in minority and low-income communities. (Garcia, 2000, p.85-71). In Los Angeles, minority and low-income passengers make up the majority of bus ridership. The Los An-geles Metropolitan Transit Authority is the public transportation provider to
5
the city. Their rail lines serve mostly white and higher income ridership, but they received more funding than buses in order to create new lines. The riders of the buses were not hap-py with the spending disparity due to the fact that ridership on the rail lines was relatively low compared to buses. Even today, rail modes in Los Angeles average weekday boardings of approximately 250,000 compared to buses which average 1.3 million. This is not to say that rail is necessar-ily the culprit, but the bus lines were overcrowded, infrequent and needed better service. In spite of this, funds for buses were continuously cut and service was frequently reduced. Rid-ers were threatened with increased fares and the elimination of monthly discount passes.
The lack of concern for urban bus rid-ers spurred the creation of the Bus Riders Union (BRU). BRU actively op-posed the fare hikes and struggled to make the MTA provide better service. BRU sued Los Angeles for violating
The question remains: do the transit dependent
receive what they pay for?
Source: www.busridersunion.org

Title VI of the Civil Rights Act of 1964 and won a consent decree amounting to approximately $1 billion in service improvements over 10 years (Garcia, 2000, p.80). The MTA learned that community involvement is crucial when it comes to transportation de-velopment.
BRU has seen the need for constant vigilance as the consent decree that allowed for their victory has been al-lowed to expire. The judge presiding over the case decided that the MTA has done enough. BRU disagrees and has alleged that the MTA has not lived up to its promises. It is feared that the expiration of the consent decree will allow the MTA to continue on its former path of neglecting its bus rid-ers (Uranga, 2006, p.N1). This has seemingly come to pass as the MTA is proposing a new fare hike along with service cuts. This is being fought in a new battle by BRU.
Atlanta: MARTAAtlanta has long been an economic powerhouse of the United States. However, its sprawling legacy has created something akin to two sepa-rate cities. There is an affluent white Atlanta in its northern suburbs, and a poorer black Atlanta in its southern suburbs and inner-city regions. Eco-nomic development has given north-ern Atlanta 78.4% of jobs and south-ern Atlanta 20.3% between 1990 and 1997 (Bullard et al., 2004, pp.51-52). It is served by the Metropolitan At-lanta Rapid Transit Authority (MAR-TA). When the system was originally planned, it provided more service to white areas than black. The southern suburbs and inner-city regions felt neglected and the northern suburbs feared the black population would
encroach on white areas. Some in the latter areas referred to MARTA as “Moving Africans Rapidly Through At-lanta” (Bullard et al., 2004, p.53).
A MARTA plan eventually passed af-ter promises were made to the black community for more service in key black areas. This was never accom-plished. Racism and fear still dictate transportation access. MARTA re-ceives its money from the two coun-ties in which Atlanta resides: Fulton and DeKalb. Counties outside Atlanta with predominantly white populations have declined to join the system. One white suburban county, Cobb, formed its own transit authority in 1991 and runs buses straight into Atlanta, with few transfers to MARTA (Bullard et al., 2004, p.57). Park and Ride lots are used by residents of the outer counties, to the dis-may of the counties which pay for them. There are disparities in terms of bus shelter appropriation, mainte-nance and cleaning of stations, and the use of clean versus pollut-ing buses, that all fa-vor white regions of At-lanta and disadvantage the black community.
Several black groups have formed Metropolitan Atlanta Transportation Equity Coalition (MATEC) which filed a Title VI complaint with the Federal Transit Authority in 2000 (Bullard et al., 2004, p.64-69). Since this time, MARTA has begun to address discrimi-nation. It has “hired its first black
6
Source: DOT, Georgia
General Manager, upgraded several south Atlanta train stations, installed more bus shelters in poor neighbor-hoods and started to replace old diesel buses with buses that run on cleaner fuel” (Bluestein, 2004, p.1). These are the first steps towards cre-ating equity in the MARTA system.
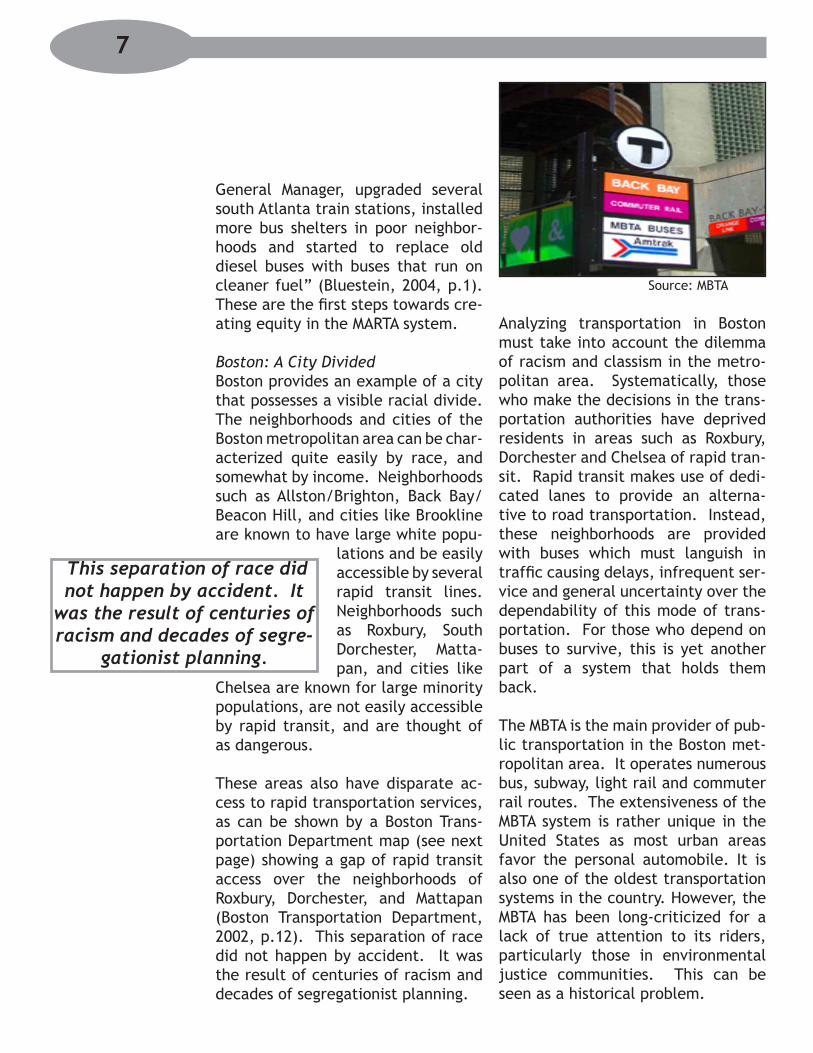
Boston: A City DividedBoston provides an example of a city that possesses a visible racial divide. The neighborhoods and cities of the Boston metropolitan area can be char-acterized quite easily by race, and somewhat by income. Neighborhoods such as Allston/Brighton, Back Bay/Beacon Hill, and cities like Brookline are known to have large white popu-
lations and be easily accessible by several rapid transit lines. Neighborhoods such as Roxbury, South Dorchester, Matta-pan, and cities like
Chelsea are known for large minority populations, are not easily accessible by rapid transit, and are thought of as dangerous.
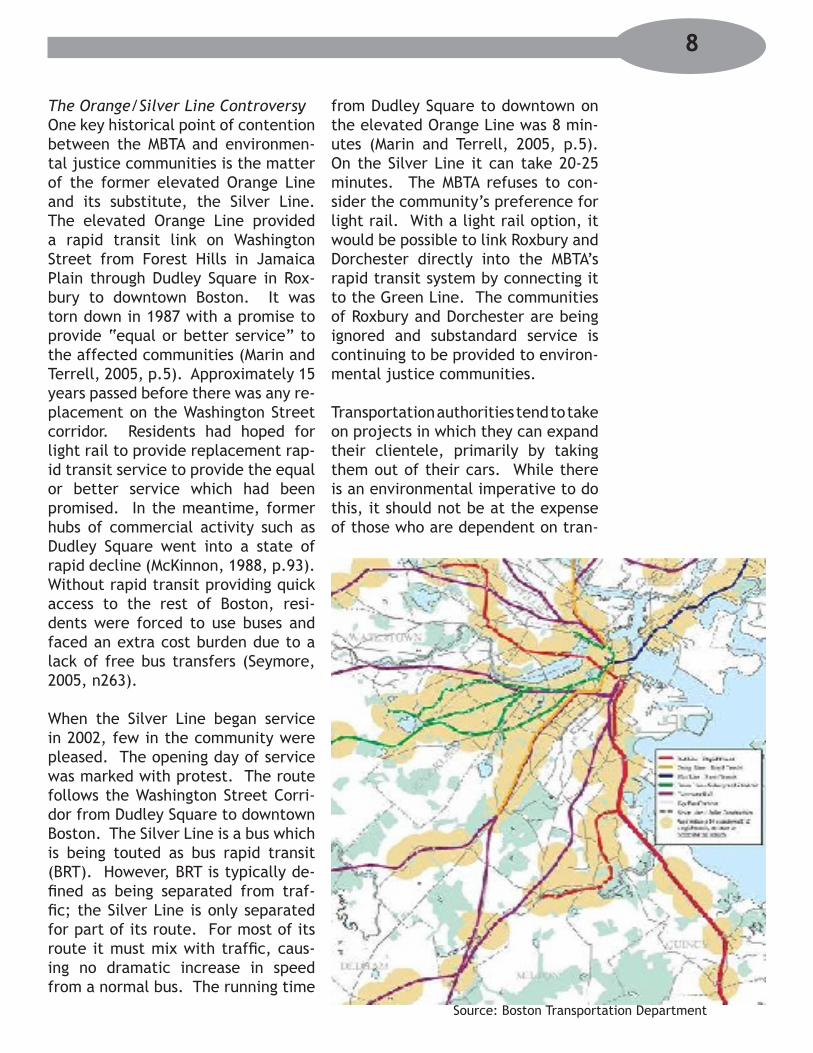
These areas also have disparate ac-cess to rapid transportation services, as can be shown by a Boston Trans-portation Department map (see next page) showing a gap of rapid transit access over the neighborhoods of Roxbury, Dorchester, and Mattapan (Boston Transportation Department, 2002, p.12). This separation of race did not happen by accident. It was the result of centuries of racism and decades of segregationist planning.
Analyzing transportation in Boston must take into account the dilemma of racism and classism in the metro-politan area. Systematically, those who make the decisions in the trans-portation authorities have deprived residents in areas such as Roxbury, Dorchester and Chelsea of rapid tran-sit. Rapid transit makes use of dedi-cated lanes to provide an alterna-tive to road transportation. Instead, these neighborhoods are provided with buses which must languish in traffic causing delays, infrequent ser-vice and general uncertainty over the dependability of this mode of trans-portation. For those who depend on buses to survive, this is yet another part of a system that holds them back.
The MBTA is the main provider of pub-lic transportation in the Boston met-ropolitan area. It operates numerous bus, subway, light rail and commuter rail routes. The extensiveness of the MBTA system is rather unique in the United States as most urban areas favor the personal automobile. It is also one of the oldest transportation systems in the country. However, the MBTA has been long-criticized for a lack of true attention to its riders, particularly those in environmental justice communities. This can be seen as a historical problem.
This separation of race did not happen by accident. It
was the result of centuries of racism and decades of segre-
gationist planning.
7
Source: MBTA
The Orange/Silver Line ControversyOne key historical point of contention between the MBTA and environmen-tal justice communities is the matter of the former elevated Orange Line and its substitute, the Silver Line. The elevated Orange Line provided a rapid transit link on Washington Street from Forest Hills in Jamaica Plain through Dudley Square in Rox-bury to downtown Boston. It was torn down in 1987 with a promise to provide “equal or better service” to the affected communities (Marin and Terrell, 2005, p.5). Approximately 15 years passed before there was any re-placement on the Washington Street corridor. Residents had hoped for light rail to provide replacement rap-id transit service to provide the equal or better service which had been promised. In the meantime, former hubs of commercial activity such as Dudley Square went into a state of rapid decline (McKinnon, 1988, p.93). Without rapid transit providing quick access to the rest of Boston, resi-dents were forced to use buses and faced an extra cost burden due to a lack of free bus transfers (Seymore, 2005, n263).
When the Silver Line began service in 2002, few in the community were pleased. The opening day of service was marked with protest. The route follows the Washington Street Corri-dor from Dudley Square to downtown Boston. The Silver Line is a bus which is being touted as bus rapid transit (BRT). However, BRT is typically de-fined as being separated from traf-fic; the Silver Line is only separated for part of its route. For most of its route it must mix with traffic, caus-ing no dramatic increase in speed from a normal bus. The running time
from Dudley Square to downtown on the elevated Orange Line was 8 min-utes (Marin and Terrell, 2005, p.5). On the Silver Line it can take 20-25 minutes. The MBTA refuses to con-sider the community’s preference for light rail. With a light rail option, it would be possible to link Roxbury and Dorchester directly into the MBTA’s rapid transit system by connecting it to the Green Line. The communities of Roxbury and Dorchester are being ignored and substandard service is continuing to be provided to environ-mental justice communities.
Transportation authorities tend to take on projects in which they can expand their clientele, primarily by taking them out of their cars. While there is an environmental imperative to do this, it should not be at the expense of those who are dependent on tran-
8
Source: Boston Transportation Department
sit. In his 2002 report for ACE, Masa-ya Otake identified several inequities in terms of subsidization of MBTA ser-vice. Instead of affluent communities subsidizing benefits for poorer com-munities, it is the reverse. The find-ings of this report caused the Federal Transit Administration to require the Boston Metropolitan Planning Organi-zation (to whom the MBTA submits its transportation plan for approval) to submit findings of inequities in trans-portation spending. Unfortunately, it would seem that this has since failed to provide any lasting action aside from having the MBTA provide more information to its service in minority and low-income communities (Asso-ciated Press, 2006, p.1). Neverthe-less, this is a sign that there is grow-ing awareness of the fact that there are disparities in the MBTA’s spending that adversely impact Boston’s low-income and minority neighborhoods.
ACE and Transportation EquityTo achieve equity in terms of trans-portation provision and access, one must ensure that funding for trans-portation gives those in low-income and minority neighborhoods the same access to mobility and the econom-ic opportunities of the metropolitan area, as those in more affluent com-munities. Transportation equity incor-
porates ideas of horizontal and verti-cal equity between socioeconomic groups in society. Basically no group should be disproportionately disad-vantaged in decision-making by those in power because of the position in society in which they are situated (Seymore, 2005, n30-47). No group should be discriminated against while another group reaps unequal reward stemming from decisions about who gets which quality of transit service.
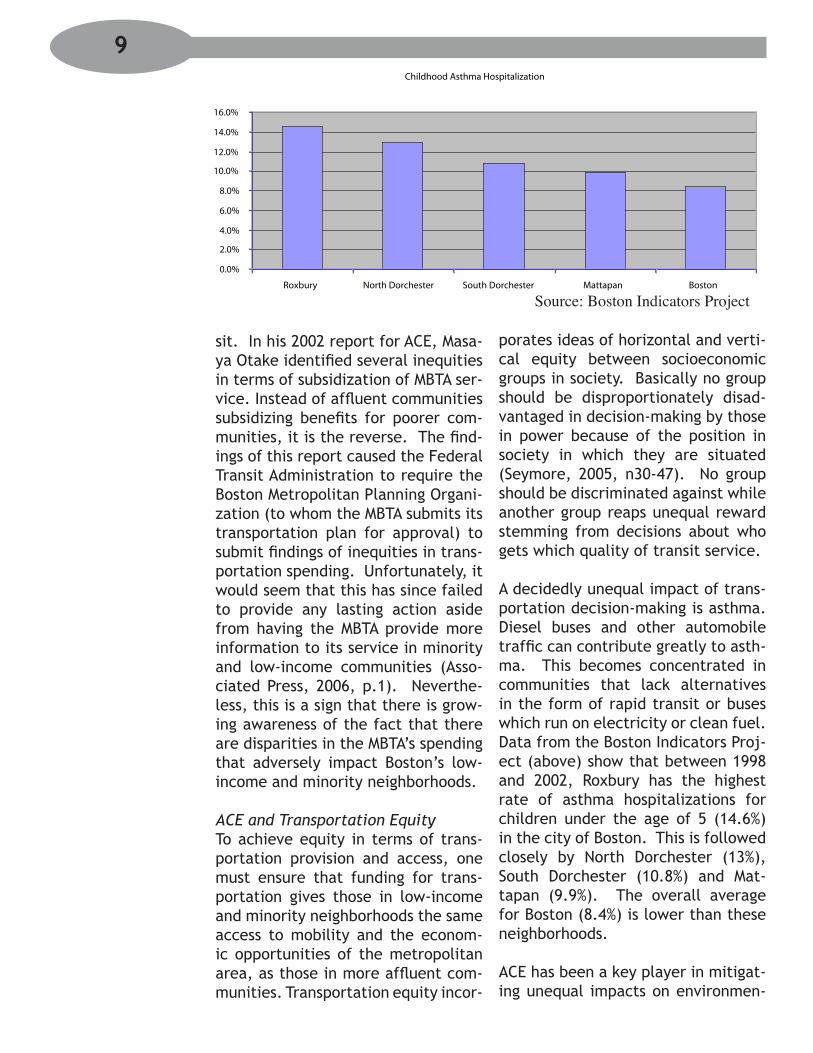
A decidedly unequal impact of trans-portation decision-making is asthma. Diesel buses and other automobile traffic can contribute greatly to asth-ma. This becomes concentrated in communities that lack alternatives in the form of rapid transit or buses which run on electricity or clean fuel. Data from the Boston Indicators Proj-ect (above) show that between 1998 and 2002, Roxbury has the highest rate of asthma hospitalizations for children under the age of 5 (14.6%) in the city of Boston. This is followed closely by North Dorchester (13%), South Dorchester (10.8%) and Mat-tapan (9.9%). The overall average for Boston (8.4%) is lower than these neighborhoods.
ACE has been a key player in mitigat-ing unequal impacts on environmen-
Childhood Asthma Hospitalization
0.0%
2.0%
4.0%
6.0%
8.0%
10.0%
12.0%
14.0%
16.0%
Roxbury North Dorchester South Dorchester Mattapan Boston
Source: Boston Indicators Project
9

tal justice communities. They were a part of the Clean Buses for Boston coalition which sought and won an agreement from the MBTA to replace diesel buses with buses that run on cleaner fuel which have been enter-ing service since 2001. In 2000, the T Riders Union (TRU) grew out of this campaign and was able to demand and win free transfers between bus-es. In 2001, as a result of advocacy by TRU and local governments, proper signage has been implemented start-ing at bus stops that inform the rider exactly which bus to expect as well as bus schedules. TRU was also in-strumental in getting an increase in bus shelters in 2001. When a plan for a fare hike in January 2007 was an-nounced, TRU and the On the Move coalition campaigned against it. Pos-sibly as a result of the pressure, the MBTA reduced the amount of the fare hike.
10

Subsidy Analysis
According to the 2000 Census, the statistics show that 41.8% of Roxbury residents did not own a vehicle, as opposed to just 18% in the whole area covered by the MBTA. Ideally, the re-sponse to this situation is to ensure that the area is well served by pub-lic transportation. However, it would seem the MBTA is willing to spend more in order to attract “choice” rid-ers to use their services as an alter-native to cars. In 2002, ACE publi-cized a report by Masaya Otake which showed a great disparity between the amounts with which the MBTA subsi-dizes its passengers. A subsidy is the
amount reflecting the difference be-tween the cost of running a route and the revenue received from its passen-gers divided by ridership. The MBTA bus subsidy for Roxbury equaled $0.69 - $0.71 per passenger compared to $6.89 per passenger on commuter rail trains that service the predominantly high income white suburbs (Otake, 2002, pp.22-28). Roxbury bus service
is also contrasted against bus service in other areas. Express buses which serve affluent Newton received $1.87 subsidy per passenger (Otake, 2002, p.44). Buses which serve primarily low-income South Boston received $1.31 subsidy per passenger (Otake, 2002, p.53).
Using weekday cost and ridership sta-tistics from the 2006 MBTA Service Plan (Table 2), one can still see a dif-ference when comparing the subsidy per passenger between 8 key routes in Roxbury and service to more afflu-ent communities. Ridership numbers
are based on the number of daily boardings. The 8 routes in Roxbury
receive an aver-age subsidy of $1.17 per pas-senger with an average week-day ridership of around 6471. Express buses from Newton have an average daily ridership of 1283 and a
subsidy per passenger of $2.08. Bus-es serving Watertown serve an aver-age of 3690 riders with a subsidy per passenger of $2.17. Even buses in a low-income community such as South Boston receive an average of $2.23 per passenger with average ridership of 2119.
Table 2: Subsidy per Passenger for Selected Bus Routes
11
The objective is not to call for the lowering of the subsidies for other routes, it is to create parity for subsidies between these routes.
The subsidy per passenger of bus routes in Roxbury, Dorchester and Mattapan in comparison to routes used in other areas highlights dispari-ties. However, the objective is not to call for the lowering of the subsidies for other routes, it is to create parity for subsidies between these routes. There should be an increased expen-
12
diture per passenger for the buses of Roxbury and Dorchester in order to lessen the health and financial bur-den in these environmental justice communities.
What Is Quality Service?MBTA’s Objectives and StandardsCritique of the MBTA StandardsDoes Evaluation Equal Action?What Standards Are Missing?
•••••
Evaluating Quality of Service
What is Quality Service?
Essential to evaluating how well a transit system is performing is under-standing what quality transit service should be. Transit service, of course, does not mean the same thing to every commuter. Quality service is subjec-tive and often context specific. The needs of commuters in Los Angeles are different than those in Atlanta, New York, or Boston. And more spe-
cifically, the needs of commuters with-in those cities will vary among their different neighbor-hoods. In measur-ing the quality of transit service in
Boston, one must first define what quality service should be. The writ-ers of this report believe that quality service should be accessible, reliable, clean, safe, comfortable, and afford-able, and should aim to meet each of these objectives through constant consideration of the needs of each community the system serves.
The MBTA describes its mission in the 2006 Service Delivery Policy in the fol-lowing way: “The MBTA is a dedicated world-class transit system built upon customer service excellence, acces-sibility, reliability, state-of-the-arttechnology, and a diverse workforce
“The MBTA is a dedicated world-class transit system built upon customer service excellence, acces-sibility, reliability, state-of-the-art technology, and a diverse workforce that reflects our commitment to the communities we serve.” -MBTA
that reflects our commitment to the communities we serve.” (MBTA Service Delivery Policy, 2006, p.4 )This seems a reasonable overall ser-vice objective for a transit system, but expressing this as a mission is not assurance enough that “world-class” service is actually being provided. Therefore, the MBTA has set out four service objectives, which the agency “believes represent the most impor-tant characteristics of a ‘world-class’ transit system.” (MBTA Service Deliv-ery Policy, 2006, p.4) These objectives are accessibility, reliability, safety and comfort, and cost-effectiveness. Note that the last factor in fact modi-fies the first four. In order to actually evaluate the performance around these objectives, the MBTA has also established service standards, each as a measure of a certain service ob-jective. The standards are outlined in Table 3.
MBTA’s Objectives & Standards:The first three standards/guide-lines - coverage, span of service, and frequency of service - are used to evaluate accessibility. Coverage is a guideline established to reflect the geographic coverage area of the system and is determined by geo-graphical distance by foot to exist-ing transit.� Span of service refers to
� MBTA defines minimum coverage on weekdays and Saturdays as “Access to transit service will
13

the minimum number of hours during which service is available. For the key bus routes evaluated for this report, the span of service is 6am to midnight on Monday through Saturday, and 7am to midnight on Sunday. Frequency of service, as related to bus service, is a standard used to measure how of-ten a bus passes by a stop/station. It can be used to determine a maximum expected wait time for a bus by es-tablishing headway times for types of bus routes at given time periods. Headway is defined as the number of minutes scheduled between trips on a route. (See Appendix A for time pe-riod, span of service, and frequency tables.)
To evaluate the reliability service ob-jective, the standard of schedule ad-herence is used. Schedule adherence is measured using two different tests, a trip test, both for scheduled depar-tures and for walk-ups, and a route test. The trip test sets a timeframe in which the bus must depart, arrive at the midpoint, and arrive at its final destination. Those timeframes differ depending on the headway. For a bus route to pass its route on-time test, 75% of its trips in both directions all day must be on time.
be provided within a 1/4 mile walk to residents of areas served by bus, light rail and/or heavy rail with a population density of greater than 5,000 persons per sq/mile.” That distance is increased to 1/2 mile on Sundays.
(See Appendix A.)The standard used by the MBTA for evaluating both safety and comfort service objectives is vehicle load. The standards vary depending on the type of vehicle, time of day, and in the case of buses, what portion of the trip the bus is on (surface vs. tunnel portions). The MBTA states that the vehicle load standards “establish the average maximum number of pas-sengers allowed per vehicle to pro-vide a safe and comfortable ride.” (MBTA Service Delivery Policy, 2006, p.13) For a bus to meet vehicle load standards, the load cannot exceed its maximum load number when av-eraged over 30-minute or 60-minute portions of a trip, depending on time of day. (See Appendix A for vehicle load standard table.)
Finally, the standard used to measure cost-effectiveness is the net cost per passenger, which is measured by subtracting the service revenue of a route from its operating costs and dividing it by the number of passen-gers. This amount is compared to an average for the entire bus system in order to determine which routes are cost effective. “This ratio reflects the benefits of a given service (measured in customers) against the public cost of operating the service.” (MBTA Ser-vice Delivery Policy, 2006, p.16) If a route’s net cost per passenger is
Table 3: Summary of MBTA Service Standards
14
greater than or equal to three times the system average, it is considered deficient in its cost-effectiveness. This measurement considers routes individually, which can be compared across the system, but does not con-sider costs as they may be linked or associated with other routes and/or forms of transit. Neither does it con-sider alternative costs or non-mone-tary costs to passengers, tax-payers, or to the MBTA.
Other Modes of TransitMBTA service objectives and stan-dards are the same for all forms of transportation in the MBTA system. However, measurement of the sys-tem’s meeting of those standards varies somewhat among the different forms of transit. This report focuses on MBTA bus standards, but following
is some addition-al information on the standards for light rail, heavy rail, commuter rail, and ferry boat, which may
highlight some of the similarities and the disparities among these different transit modes.
Accessibility:The coverage standard is the same for all forms of transportation. Span of service standards for heavy rail and light rail is the same as for the key bus routes, but the commuter rail runs less, typically ending much ear-lier in the evening than subway and bus service. See Table 2 of Apendix A. The MTBA evaluates frequency based om a minimum frequency, which var-
ies depending on the mode of transit and time period. These differences are outlined in Table 5 of Apendix A.
Reliability:Schedule adherence is measured sim-ilarly for buses and light/heavy rail. The key difference that should be noted for the purposes of this report is that buses meet the schedule ad-herence standard if 75% of trips on a route meet its trip test standards over the course of a day. Light, heavy, and commuter rail are held to a higher standard of 95% of its trips operat-ing within 5 minutes of the scheduled times throughout the day. Specific trip standards are described in Tables 7 and 8 of Apendix A.
Safety and Comfort:All modes are held to vehicle load standards using a passenger to seat ra-tio. These vehicle load standards are considerably inconsistent. Different subway lines have different standards for passenger to seat ratio and, like vehicle load on the bus, the standards change based on time of day. Time of day does affect amount of crowding. However, it does not affect safety or comfort. Standards should be set to meet safety and comfort needs, not to allow for variations in crowding at different times and in different places. The subway lines also permit more crowding within a “core area”
15
Standards should be set to meet safety and comfort needs, not to allow for variations in crowding at different
times and in different places.
even though the vehicle is not any different. In general, the commuter rail permits much less standing than buses or subways. Table 10 in Apendix A outlines ratios in more detail.
Cost-Effectiveness:Finally, the MBTA has only established a standard of cost-effectiveness for buses, the net cost per passenger. No measurements yet exist for other modes of transit.
Critique of the MBTA Standards:While the MBTA has been thorough in outlining its measurements for stan-dards of service aimed at evaluating its overall service objectives, there are some flaws with the standards and their measurement that require explication.
The coverage standard is only a geo-graphic guideline, which considers routes that are already in existence. Other accessibility issues, such as considering the types of nearby ser-vice and financial constraints for ac-cessing the transit system are not measured and seemingly not consid-ered at all. A standard for measur-ing accessibility should relate to the overall picture of transit mobility, not just proximity to existing service. The example provided by On the Move is that of Grove Hall and Coolidge Cor-ner, both similarly distanced to Cop-ley Square, but the travel time from Grove Hall is more than 25% longer than from Coolidge Corner. This is because Grove Hall residents are bus-dependent without access to subway service. (On the Move, 2002) To com-pound this, there may be residents in Grove Hall, for example, who require public transit service at non-peak times more than during peak times
and have no access to an automobile to compensate for lacking transit ser-vice when they need it.
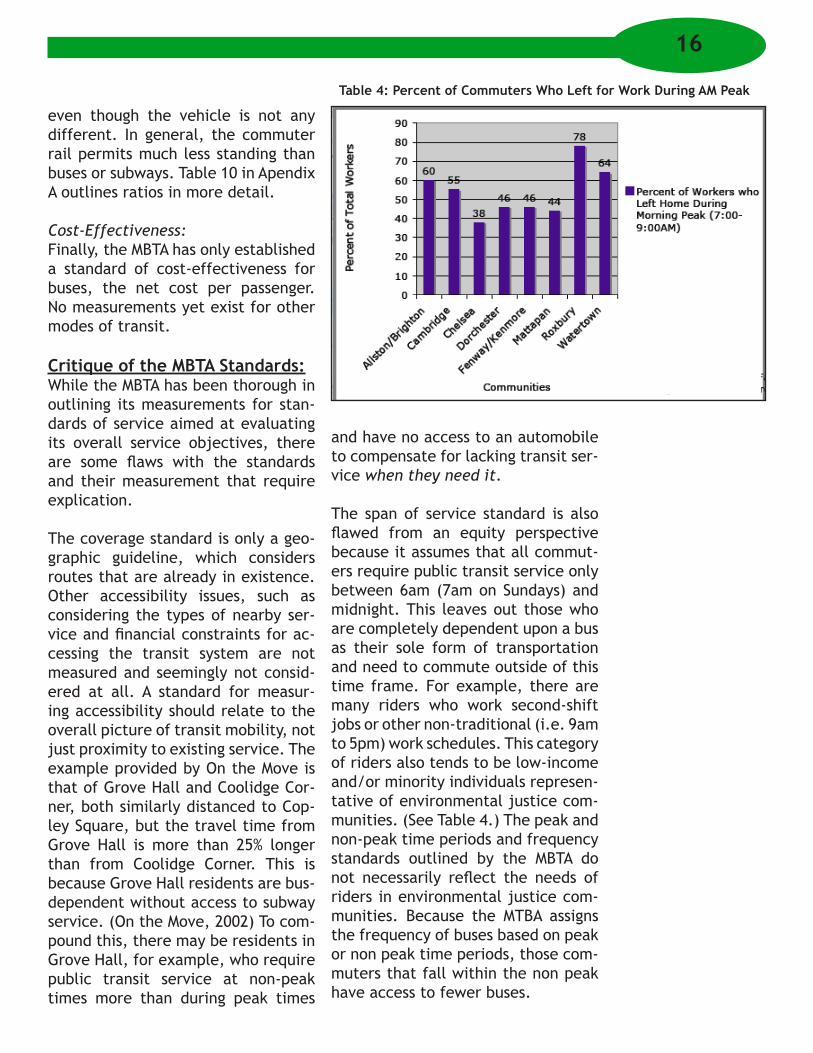
The span of service standard is also flawed from an equity perspective because it assumes that all commut-ers require public transit service only between 6am (7am on Sundays) and midnight. This leaves out those who are completely dependent upon a bus as their sole form of transportation and need to commute outside of this time frame. For example, there are many riders who work second-shift jobs or other non-traditional (i.e. 9am to 5pm) work schedules. This category of riders also tends to be low-income and/or minority individuals represen-tative of environmental justice com-munities. (See Table 4.) The peak and non-peak time periods and frequency standards outlined by the MBTA do not necessarily reflect the needs of riders in environmental justice com-munities. Because the MTBA assigns the frequency of buses based on peak or non peak time periods, those com-muters that fall within the non peak have access to fewer buses.
Table 4: Percent of Commuters Who Left for Work During AM Peak
16

Schedule adherence is an essential component to quality service and its importance is greater the more de-pendent a rider is on that transporta-tion service. If a rider is consistently made late to work, appointments, child care drop-offs, etc., this can reflect negatively on that person and could lead to potential conflicts with employers or others, and in some cas-es even termination. People who hold lower-paying jobs are often the ones whose work performance is more di-rectly measured by factors like get-ting to work on time. Again, be-cause of higher dependency on public transit in EJ communities, schedule adher-ence is highly important and failures to meet adherence stan-dards should be addressed quickly.
The vehicle load, or crowding, stan-dards are hard to evaluate. The MBTA Service Delivery Policy does not artic-ulate how specific passenger to seat ratios were determined to be “safe” or why that ratio is different depend-ing on the time of day or surface vs. tunnel location. Through conversa-tions with the Central Transportation Planning Staff (CTPS)2, we learned that crowding standards and opti-mal passenger-to-seat ratios were created from standards that exist in other states. In Massachusetts, the Department of Telecommunications and Energy (DTE) set transportation safety standards. DTE is no lon-
2 Central Transportation Planning Staff (CTPS) performs data analysis for the Boston Metropoli-tan Planning Organization (MPO).
ger in existence and transportation safety standards are now managed by the Department of Public Utilities (DPU). CTPS staff informed us that DTE merely utilized what was seen as “best practices”. There is acknowl-edgment from CTPS staff that with the multitude of buses with varying layouts in service, the current crowd-ing and safety standards need to be changed.
This standard cannot accurately mea-sure comfort of the passengers. First,
comfort is subjec-tive. While stand-ing on a bus may not seem uncom-fortable to some, many may not find it comfortable to hold onto a metal bar while standing and balancing as a bus turns and makes its way down a bumpy
road. And it is also fair to consider that when riders pay a fare to ride the bus, they expect a seat on it. It is unfair that riders are forced to stand when paying the same fare price as those who got a seat. This is particu-larly the case with elderly riders who may use the bus as their primary mode of transportation. Older and more in-firm riders are supposed to be given priority seating on the bus, however when the bus is crowded, they may be forced to stand. Second, measur-ing comfort from a passenger to seat ratio disregards the fact that passen-gers bring on strollers, grocery bags, dry cleaning, or other items that may make their comfort level or those around them different regardless of whether or not they have taken up additional seats.
17
There is acknowledgment from CTPS staff that with
the multitude of buses with varying layouts in service, the current crowding and safety standards need to
be changed.
This is especially important for rider groups who must ride the bus with babies or small children, or who are carrying multiple bags (or perhaps all of the above). These riders tend to be members of environmental justice communities who have limited access to non-bus forms of transportation to get themselves and their children from place to place. Visual observa-tions from bus riding have included seeing small children having to stand, sometimes getting separated from their accompanying adult in a crowd of people and sometimes struggling to keep their balance and not fall over as the bus moves, turns, starts or stops quickly. For people in this type of situation, standing-room-only is neither safe nor comfortable.
For safety and comfort to be met as quality service objectives, one also needs to look beyond vehicle load measurements. Safety and comfort are not just about how crowded a rid-er feels, but also how safe a bus stop or station is. Is there a safe place to wait? Are there lights there or are rid-ers standing in darkness at night? Is there a place to sit while they wait? Is it comfortable? Is there a shelter? Is it heated? Is there a schedule indicat-ing when to expect the next bus? Are the buses going through the neigh-borhood emitting high or low levels of pollution? Is the bus clean? If some-one needs a bike to get to the bus or to their destination from the bus, is there a bike rack available? Is heat-
ing or air conditioning working on the bus? Are stops being announced?
All of these questions touch on as-signment and amenity issues, which should also be evaluative categories for quality service. The MBTA does not include any standards for these in their current service delivery policy. These missing standards create a hole in the evaluation of service perfor-mance and, without such standards, this hole in service evaluation could lead to inequities between routes and communities.
Finally, cost-effectiveness is a severe-ly limited standard of measurement, which only speaks to the service de-livery as it relates to the MBTA and not to its riders. Cost-effectiveness is only measured with regard to the cost to the MBTA and not to the passenger without consideration of the effect of increasing a transit fare or the ex-isting disparities in subsidies among different types of MBTA passengers in different communities of the Greater Boston area. (See “Subsidy Analysis” section for more on this.) This, in ef-fect, means that the cost-effective-ness objective is not really a service objective, but rather an operations objective. True cost-effectiveness as an objective for service quality should be considered as providing the best possible service at the least possible cost to all parties involved, including not only the MBTA, but also the riders and Massachusetts tax-payers.
18
True cost-effectiveness as an objective for service quality should be considered as pro-viding the best possible service at the least
possible cost to all parties involved....
Source: MBTA
Does Evaluation Equal Action?For buses, the MBTA claims to evalu-ate service on an on-going basis while “implementation of service changes occur on a quarterly basis.” (2006 Service Delivery Policy, MBTA, p.17) It is not made clear by the MBTA to what extent this evaluation is conducted and the results of any data collected are not made readily available to the public on a regular basis. Through conversations with staff at CTPS, we were able to see how they are able to assist the MBTA in evaluating bus performance. The last time a full bus service evaluation was completed for all bus routes was in the period of 1997 through 1998. Since this mass evaluation, 40 routes per year have been evaluated. The results of these evaluations are used in the MBTA Ser-vice Delivery Plans that have been produced since then. Some routes’ performance evaluations are from the 1997-1998 period. When the data collection was conducted, CTPS per-sonnel timed bus activities by stop, seeing if the buses were on time as well as measuring total running time of a route.
The MBTA does have a Biennial Service Plan, which is more comprehensive in nature and can result in major ser-vice changes for routes. In the most recent evaluation of bus routes, all five of the bus routes evaluated for this report failed MBTA crowding and schedule adherence standards. How-ever, a sign of the limitations of MBTA
response, only two of the five routes have actually called for changes in service and only one route (the 111) has qualified for “major” improve-ments to service. (See Appendix B for detailed description of major changes to the 111 route.)
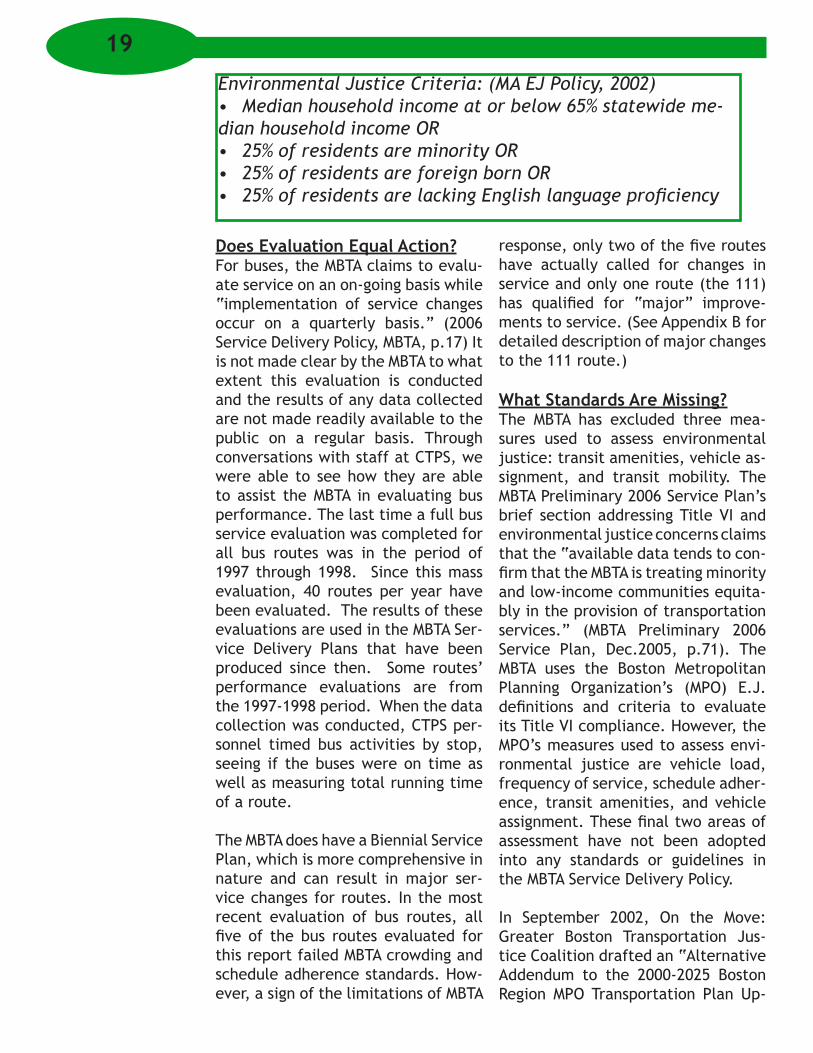
What Standards Are Missing?The MBTA has excluded three mea-sures used to assess environmental justice: transit amenities, vehicle as-signment, and transit mobility. The MBTA Preliminary 2006 Service Plan’s brief section addressing Title VI and environmental justice concerns claims that the “available data tends to con-firm that the MBTA is treating minority and low-income communities equita-bly in the provision of transportation services.” (MBTA Preliminary 2006 Service Plan, Dec.2005, p.71). The MBTA uses the Boston Metropolitan Planning Organization’s (MPO) E.J. definitions and criteria to evaluate its Title VI compliance. However, the MPO’s measures used to assess envi-ronmental justice are vehicle load, frequency of service, schedule adher-ence, transit amenities, and vehicle assignment. These final two areas of assessment have not been adopted into any standards or guidelines in the MBTA Service Delivery Policy.
In September 2002, On the Move: Greater Boston Transportation Jus-tice Coalition drafted an “Alternative Addendum to the 2000-2025 Boston Region MPO Transportation Plan Up-
19
Environmental Justice Criteria: (MA EJ Policy, 2002)Median household income at or below 65% statewide me-
dian household income OR25% of residents are minority OR25% of residents are foreign born OR25% of residents are lacking English language proficiency
•
•••

date.” The alternative addendum aimed to correct some of what was considered to be false assumptions in the MPO Addendum and to address environmental justice concerns. In this addendum, the “‘measures to test the achievement of Environmen-tal Justice’ (at least with respect to transit)” are vehicle load, scheduled frequency, schedule adherence, ve-hicle assignment, transit amenities, and mobility. (Alternative Addendum, On the Move, Sept.2002)3 Vehicle assignment and transit ame-nities measures are mentioned in the Title VI and EJ review section of the MBTA service policy. However, there are no specific standards or guide-lines established to evaluate these categories.
3 Achievement of environmental justice trans-lates into avoidance of environmental injustices and therefore implies transportation justice and quality service for all, not just designated EJ communities. Therefore, these measures should be part of a general policy, not taken as a sepa-rate set of evaluation criteria.
Perhaps the most essential piece of overall service quality that is miss-ing from the MBTA’s service standards is transit mobility. Transit mobility is defined as a just transit system that provides communities similarly distanced from a central destina-tion with similar transit times to that destination- without regard to race or income. (On the Move, p.11) This measure of “mobility” is not present in either the MPO Transportation Plan or the MBTA’s service policy.
Mobility is an area that could more di-rectly address the “accessibility” ser-vice objective. Following this idea, the coverage standard is inadequate for evaluating the accessibility of a tran-sit system. Measuring mobility is not just based on service performance, but on how well transit services are performing around the needs of the communities it serves. Quality service should be accessible, reliable, clean, safe, comfortable, and affordable. It should aim to meet these objectives within a context as closely related as
20Table 5: A Revised Summary of Service Standards

possible to the needs of each commu-nity it serves. For this reason, tran-sit mobility should be an evaluating standard. Measuring transit mobility should not just be thought of within the context of existing transit routes, but also whether these routes meet communities’ needs in terms of times available, geographic coverage, and cost. Frequency should be consid-ered, not only in terms of adher-ing to a set schedule, but in making sure that the scheduled frequency is meeting the dependency needs of its riders. If the riders of a route do not typically work a traditional 9am to 5pm schedule, increasing frequency during “peak” rush hours may not improve the overall service of that route for its riders.
21
Quality service should be accessible, reliable, clean,
safe, comfortable, and affordable. It should aim to meet these objectives within a context as closely related as possible to the needs of
each community it serves.
Key Bus Routes & Community ProfilesKey Bus Route ProfilesContextualizing the routesCommunity Profiles
-Race, Income, Linguistic Isolation, Transit Dependency
•••
22
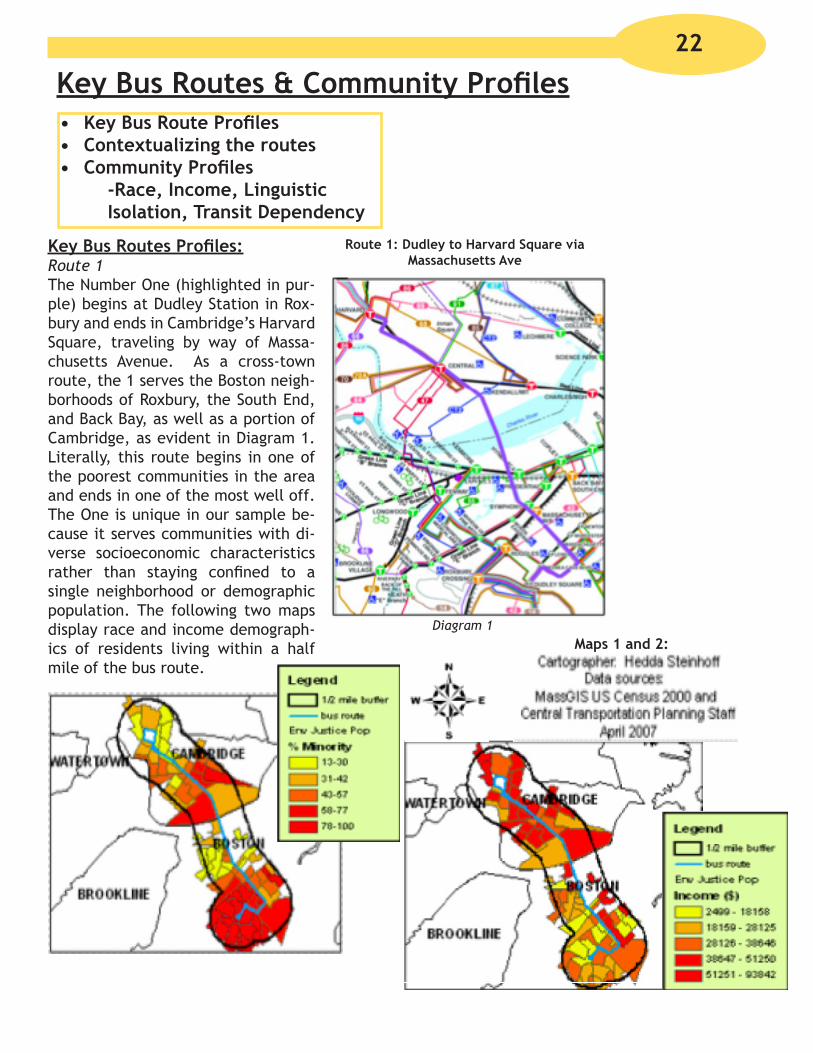
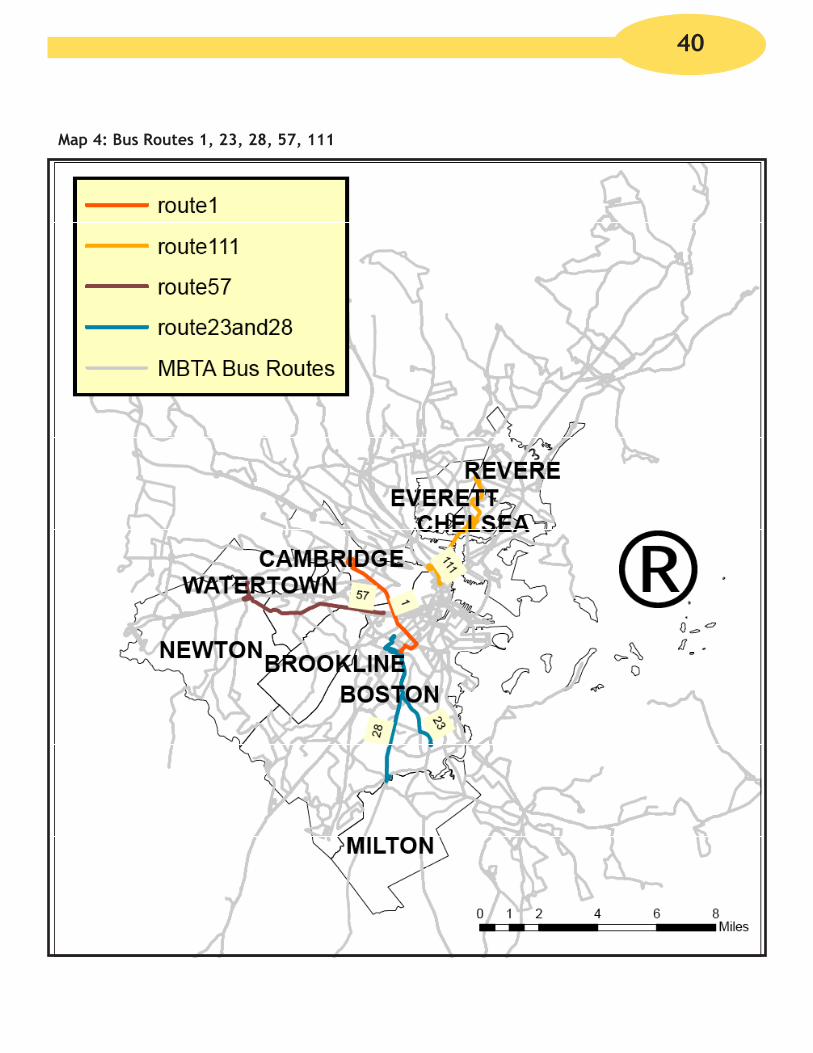
Key Bus Routes Profiles:Route 1The Number One (highlighted in pur-ple) begins at Dudley Station in Rox-bury and ends in Cambridge’s Harvard Square, traveling by way of Massa-chusetts Avenue. As a cross-town route, the 1 serves the Boston neigh-borhoods of Roxbury, the South End, and Back Bay, as well as a portion of Cambridge, as evident in Diagram 1. Literally, this route begins in one of the poorest communities in the area and ends in one of the most well off. The One is unique in our sample be-cause it serves communities with di-verse socioeconomic characteristics rather than staying confined to a single neighborhood or demographic population. The following two maps display race and income demograph-ics of residents living within a half mile of the bus route.
Route 1: Dudley to Harvard Square via Massachusetts Ave
Diagram 1Maps 1 and 2:
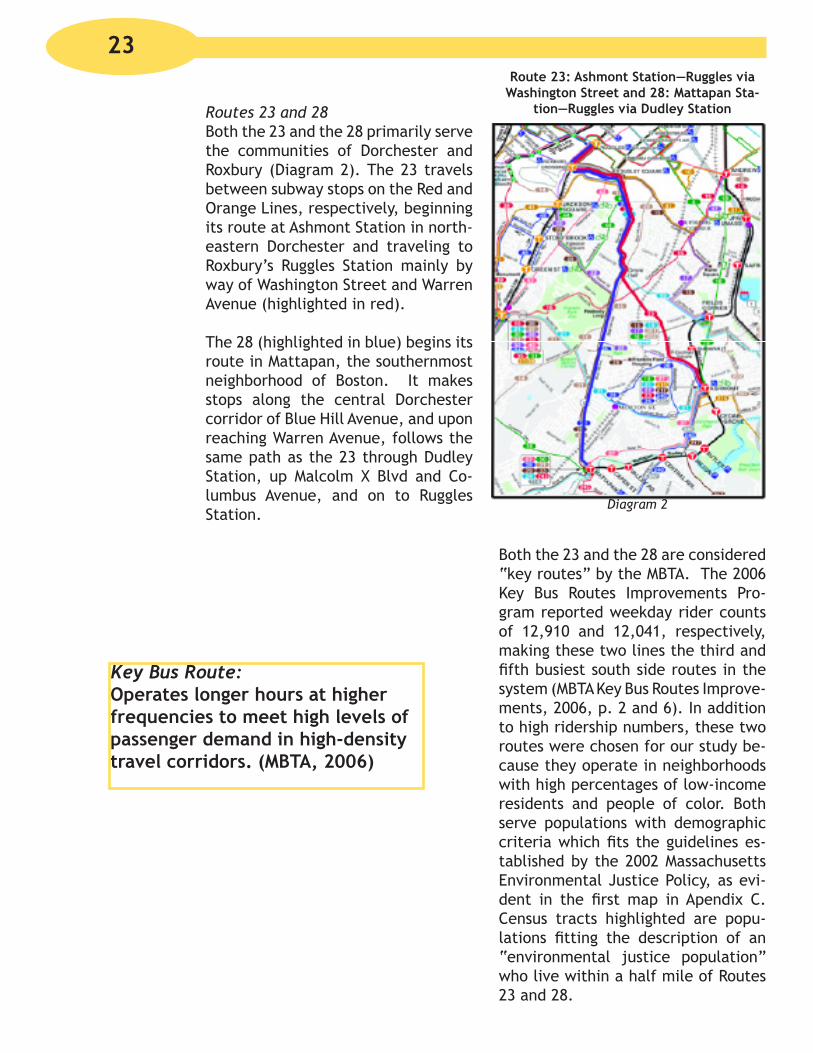
Route 23: Ashmont Station—Ruggles via Washington Street and 28: Mattapan Sta-
tion—Ruggles via Dudley StationRoutes 23 and 28Both the 23 and the 28 primarily serve the communities of Dorchester and Roxbury (Diagram 2). The 23 travels between subway stops on the Red and Orange Lines, respectively, beginning its route at Ashmont Station in north-eastern Dorchester and traveling to Roxbury’s Ruggles Station mainly by way of Washington Street and Warren Avenue (highlighted in red).
The 28 (highlighted in blue) begins its route in Mattapan, the southernmost neighborhood of Boston. It makes stops along the central Dorchester corridor of Blue Hill Avenue, and upon reaching Warren Avenue, follows the same path as the 23 through Dudley Station, up Malcolm X Blvd and Co-lumbus Avenue, and on to Ruggles Station.
Diagram 2
Both the 23 and the 28 are considered “key routes” by the MBTA. The 2006 Key Bus Routes Improvements Pro-gram reported weekday rider counts of 12,910 and 12,041, respectively, making these two lines the third and fifth busiest south side routes in the system (MBTA Key Bus Routes Improve-ments, 2006, p. 2 and 6). In addition to high ridership numbers, these two routes were chosen for our study be-cause they operate in neighborhoods with high percentages of low-income residents and people of color. Both serve populations with demographic criteria which fits the guidelines es-tablished by the 2002 Massachusetts Environmental Justice Policy, as evi-dent in the first map in Apendix C. Census tracts highlighted are popu-lations fitting the description of an “environmental justice population” who live within a half mile of Routes 23 and 28.
23
Key Bus Route:Operates longer hours at higher frequencies to meet high levels of passenger demand in high-density travel corridors. (MBTA, 2006)

24
Route 57: Watertown Yard—Kenmore Square via Newton Corner & Brighton Center
Diagram 3
Route 57Route 57 serves the upper income, predominantly white communities of Watertown, Brighton, Allston, and Kenmore Square. (See Apendix C for GIS maps.) Beginning in Watertown Yard, the 57 makes its way up Wash-ington Street and Brighton Avenue, and across to Commonwealth Avenue, whereupon it’s route parallels the B branch of the Green Line trolley line into Kenmore Square. Route 57 is il-lustrated in Diagram 3.
Given the relative affluence of the communities that the 57 serves, the T Riders Union requested that we ana-lyze this route as a point of compari-son. Such a comparison makes sense. Like Chelsea, Dorchester, Mattapan and Roxbury, Watertown and parts of Brighton fall outside of direct prox-imity to rail service. In this sense the residents who choose to commute by public transportation do so primarily by bus.
Moreover, the 57 is also one of the MBTA’s “key routes”, boasting the 7th highest ridership numbers on the south side. The most recent MBTA ridership count reported 8,879 week-day boardings (MBTA 2006, p.14).
Route 111The 111 is another line catering pre-dominantly to environmental justice populations. (See Apendix C for GIS maps.) Although the route begins at Haymarket in downtown Boston and goes through an area of Charlestown, the majority of the stops are in Chelsea-- a small, ethnically diverse work-ing class city just north of the city. Travel-ing up Broadway Street and through Bellingham Square, the 111 ends at the Woodlawn Cemetery in Everett.�
There are two motives for choosing to analyze the 111. First, like the 23 and the 28, the route caters predominantly to “environmental justice populations,” as defined by the 2002 EJ Policy.
Second, and perhaps more significantly, the 111 is the only direct public transportation link between
1 There is an extension on the route that con-tinues past Woodlawn to Broadway and Park in Revere, but this service only operates between 7:30 and 10:00pm.
Route 111: Woodlawn—Haymarket Station via Tobin Bridge
Diagram 4
Chelsea and Boston, as it traverses the Mystic River by way of the Tobin Bridge (Diagram 4). Many residents who live in Chelsea work in Boston; for those who cannot afford to own a car, the 111 becomes one of the only
viable trans-portation op-tions for dai-ly commuting into the city. This fact is reflected in the high lev-els of riders on this route.
The MBTA reported 8,692 weekday boardings, giving this route the high-est ridership numbers of any bus line operating within the north side of the system (MBTA 2006, p.30).
Contextualizing the Routes:In order to better understand the so-cioeconomic, cul-tural, and environ-mental contexts of the communities served by the five key bus lines, a more in-depth anal-ysis of some of the key demographic characteristics of the communities is needed. This sec-tion examines 2000 Census and GIS data in an effort to sketch more detailed portraits of the communities served by our five key routes. Eight neighborhoods and towns are compared: Allston/Brigh-ton, Cambridge, Chelsea, Dorchester, Fenway/Kenmore, Mattapan, Rox-
bury, and Watertown.
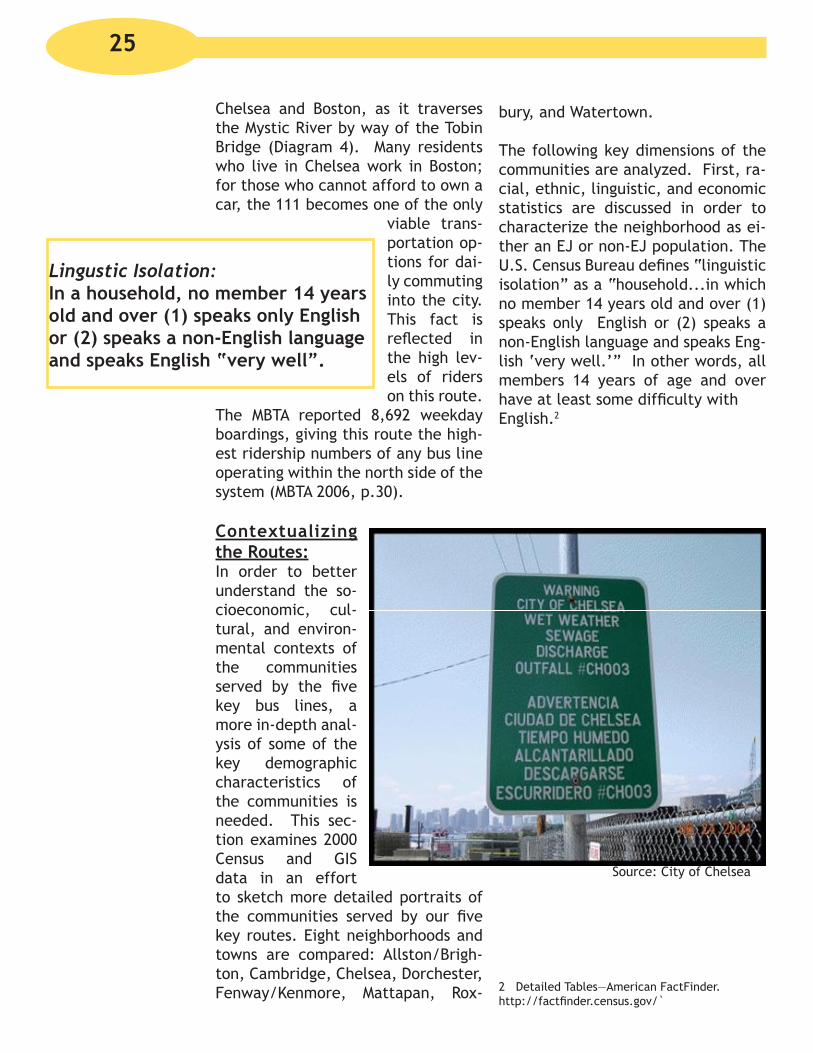
The following key dimensions of the communities are analyzed. First, ra-cial, ethnic, linguistic, and economic statistics are discussed in order to characterize the neighborhood as ei-ther an EJ or non-EJ population. The U.S. Census Bureau defines “linguistic isolation” as a “household...in which no member 14 years old and over (1) speaks only English or (2) speaks a non-English language and speaks Eng-lish ‘very well.’” In other words, all members 14 years of age and over have at least some difficulty with English.2
2 Detailed Tables—American FactFinder. http://factfinder.census.gov/`
Lingustic Isolation:In a household, no member 14 years old and over (1) speaks only English or (2) speaks a non-English language and speaks English “very well”.
25
Source: City of Chelsea

Graph 1: Racial Diversity of Communties
Graph 2: Lingusitic Isolation of Communities
26

From there, public transportation ac-cess and dependency is estimated by examining three statistics: the num-ber of residents living within a half mile of a bus route,� the percent-age of residents who reported taking some form of public transportation to work, and the rate of vehicle occu-pancy.
Related to the issue of transit de-pendency is the question of mobility.
1 Studies have declared that the average distance a person will walk to get to a public transit stop is 1/4 mile (Boston Indicators Project mentions this in their section on transportation). However, we decided to analyze census tracts within a one-half mile radius of each of the lines, assuming that a higher level of transportation dependency will necessitate a willingness to walk
further to catch a bus.
Whether residents work traditional 9am to 5pm jobs or must commute during non-peak hours of the day has an impact on how quickly and easily they will be able to get around on the bus. Mobility is determined by the availability of transportation services and the percentage of workers who commute during “peak” hours2 com-bined with the average travel time to work for those who commute via public transit.
2 As defined by the MBTA, “AM Peak” runs from 7:00-8:59am and “PM Peak” is 4:00-6:29pm.
Graph 3: Community Income Levels
27

Map 3: Transit Dependency
Graph 4: Time Traveled to Work for MBTA Commuters
28

Allston/Brighton1:Bus Route 57Partially considered an EJ community.
Census data reveals that the neighborhoods of Allston/Brighton are predominantly white, with a significant per-cent of Asian/Pacific Islander residents, as well. Linguistical-ly, 12,136 households speak a language other than English at home. Approximately
4,476 households are considered “lin-guistically isolated.” Despite hav-
ing a Median Household Income that is higher than the Boston average, the BRA estimates that 23% of Allston/Brighton residents live below the poverty level.
Transit DependencyWhen asked what mode of transpor-tation employed residents over the age of 16 take to get to work, 15,142 (38% of the 39,522 respondents) re-ported that they commute on the MBTA. Having access to both the bus and the train, 39% of public transit commuters living in Allston/Brighton ride the bus, while 61% opt for the
1 The Boston Redevelopment Authority defines the neighborhood of Allston-Brighton as census tracts 1.0, 2.01, 2.02, 3.01, 3.02, 4.01, 4.02, 5.01, 5.02, 6.01, 6.02, 7.01, 7.02, 8.01, and 8.02. All statistics factored into the community profile of the area are based on data available for these thirteen census tracts.
Table 6: Racial Diversity
train. Allston and Brighton are pri-marily served by the B and C green lines. More than three quarters be-
gin their commute during the morn-ing peak hours, suggesting traditional 9-5 schedules for most workers. The general efficiency of the trolley and buses during the AM peak is reflected in commute times: 22% of transit rid-ers reported travel times of less than thirty minutes and 67% spent between
30 and 59 minutes en route. Only 10% of workers had to spend more than an hour commuting each day. The neighborhoods have a high vehi-cle occupancy rate of 78% (N=8,377). This high rate of vehicle ownership suggests that people who do com-mute via public transportation do so for matters of convenience, not ne-cessity.
Percent of Linguisti-cally Isolated Households
Percent of Non-English Speaking Households
�5 40
Table 7: Linguistic Isolation
% Below Boston MHI
Median Household Income
Per Capita Income
78% $42,520 $22,849
Table 8: Income Profile
29
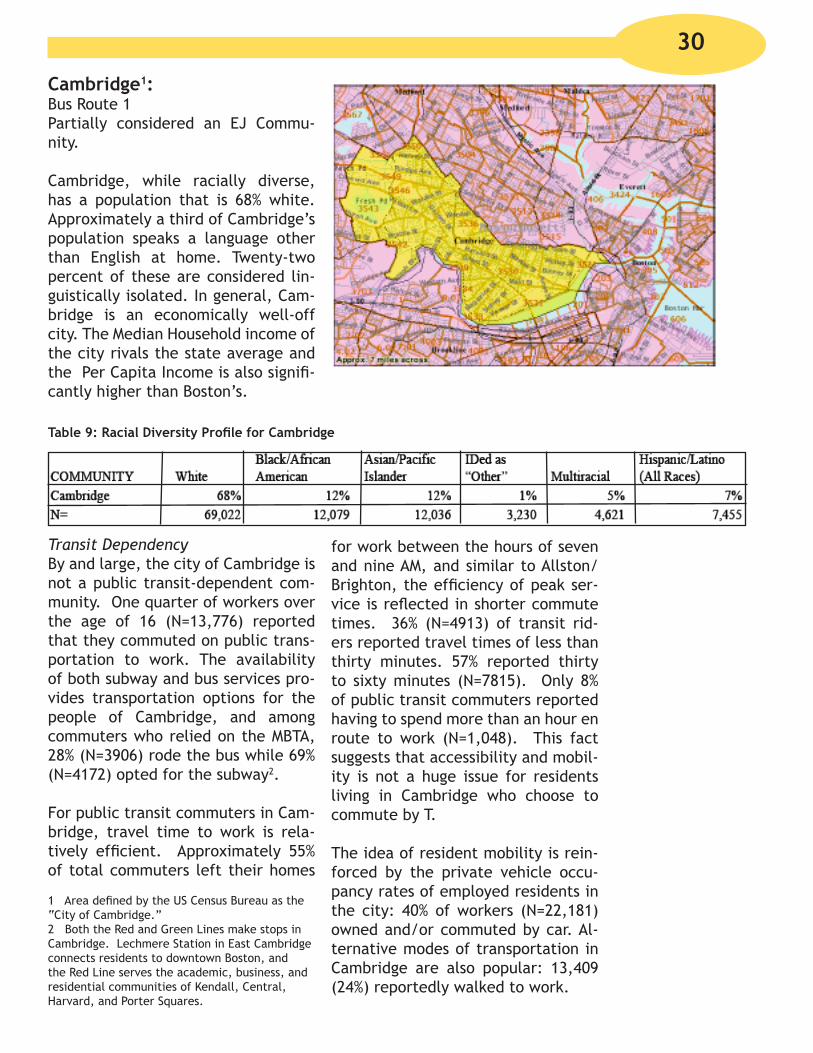
Cambridge1:Bus Route 1Partially considered an EJ Commu-nity.
Cambridge, while racially diverse, has a population that is 68% white. Approximately a third of Cambridge’s population speaks a language other than English at home. Twenty-two percent of these are considered lin-guistically isolated. In general, Cam-bridge is an economically well-off city. The Median Household income of the city rivals the state average and the Per Capita Income is also signifi-cantly higher than Boston’s.
Transit DependencyBy and large, the city of Cambridge is not a public transit-dependent com-munity. One quarter of workers over the age of 16 (N=13,776) reported that they commuted on public trans-portation to work. The availability of both subway and bus services pro-vides transportation options for the people of Cambridge, and among commuters who relied on the MBTA, 28% (N=3906) rode the bus while 69% (N=4172) opted for the subway2.
For public transit commuters in Cam-bridge, travel time to work is rela-tively efficient. Approximately 55% of total commuters left their homes
1 Area defined by the US Census Bureau as the “City of Cambridge.”2 Both the Red and Green Lines make stops in Cambridge. Lechmere Station in East Cambridge connects residents to downtown Boston, and the Red Line serves the academic, business, and residential communities of Kendall, Central, Harvard, and Porter Squares.
Table 9: Racial Diversity Profile for Cambridge
for work between the hours of seven and nine AM, and similar to Allston/Brighton, the efficiency of peak ser-vice is reflected in shorter commute times. 36% (N=4913) of transit rid-ers reported travel times of less than thirty minutes. 57% reported thirty to sixty minutes (N=7815). Only 8% of public transit commuters reported having to spend more than an hour en route to work (N=1,048). This fact suggests that accessibility and mobil-ity is not a huge issue for residents living in Cambridge who choose to commute by T.
The idea of resident mobility is rein-forced by the private vehicle occu-pancy rates of employed residents in the city: 40% of workers (N=22,181) owned and/or commuted by car. Al-ternative modes of transportation in Cambridge are also popular: 13,409 (24%) reportedly walked to work.
30
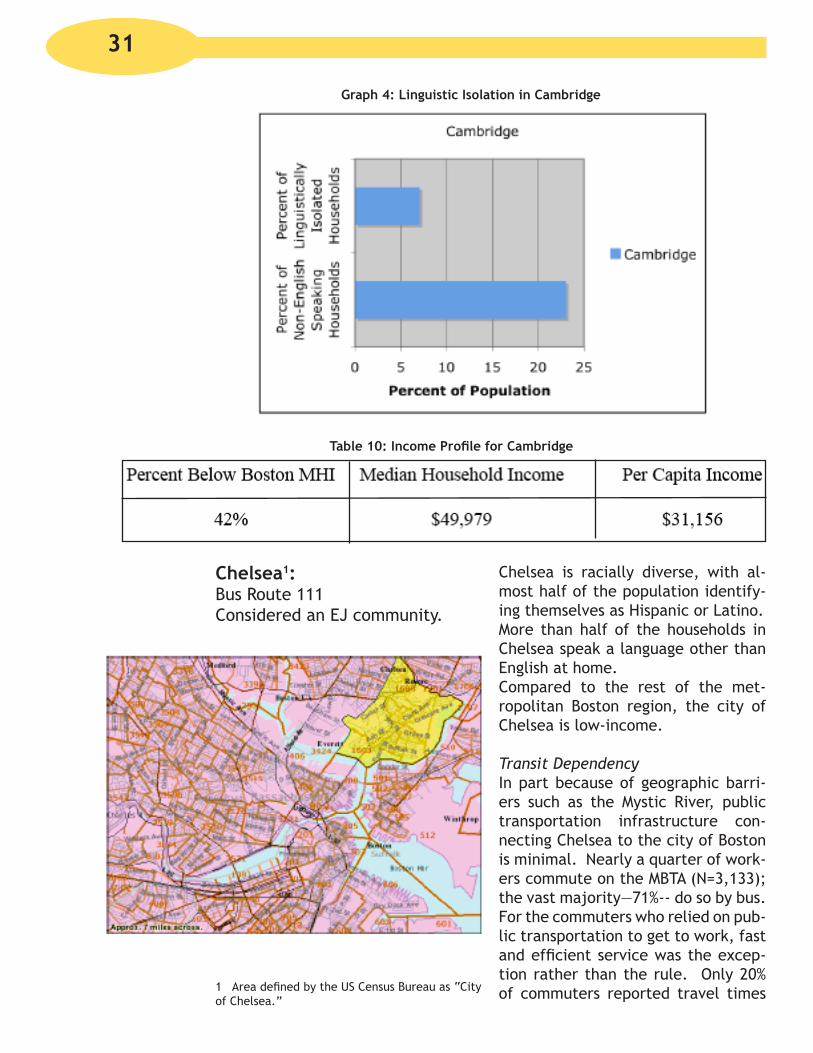
Table 10: Income Profile for Cambridge
Graph 4: Linguistic Isolation in Cambridge
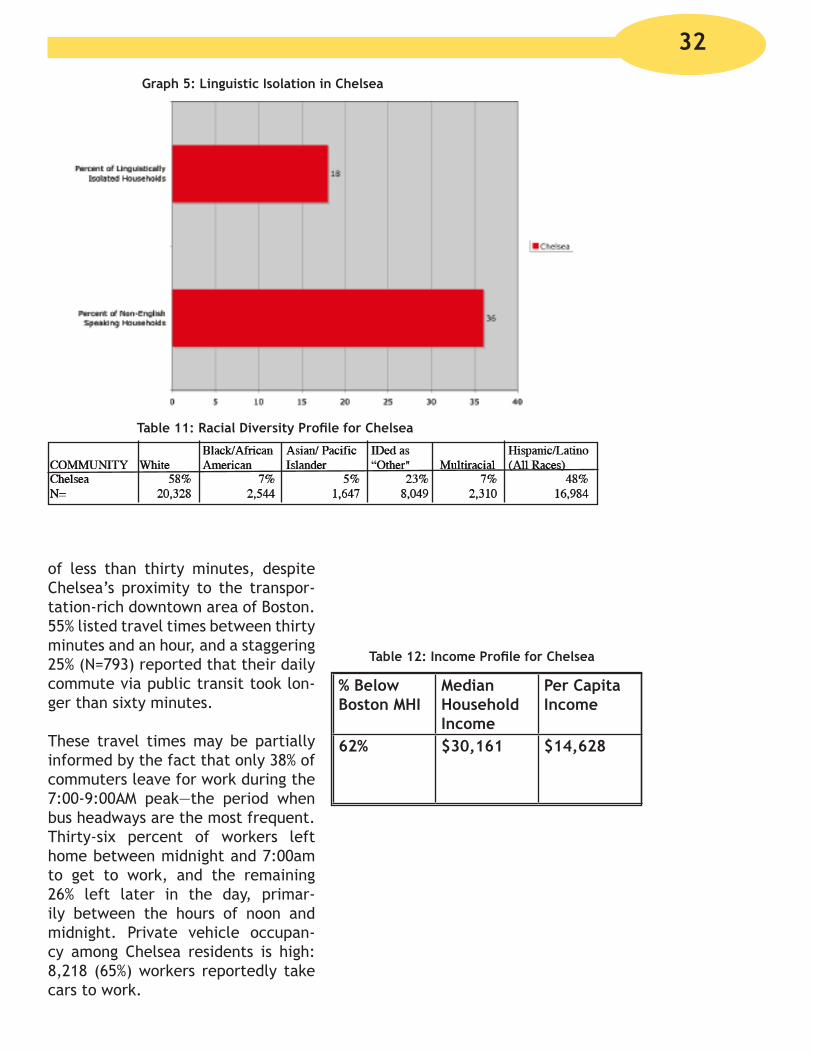
Chelsea1:Bus Route 111Considered an EJ community.
1 Area defined by the US Census Bureau as “City of Chelsea.”
Chelsea is racially diverse, with al-most half of the population identify-ing themselves as Hispanic or Latino.More than half of the households in Chelsea speak a language other than English at home. Compared to the rest of the met-ropolitan Boston region, the city of Chelsea is low-income.
Transit DependencyIn part because of geographic barri-ers such as the Mystic River, public transportation infrastructure con-necting Chelsea to the city of Boston is minimal. Nearly a quarter of work-ers commute on the MBTA (N=3,133); the vast majority—71%-- do so by bus. For the commuters who relied on pub-lic transportation to get to work, fast and efficient service was the excep-tion rather than the rule. Only 20% of commuters reported travel times
31
of less than thirty minutes, despite Chelsea’s proximity to the transpor-tation-rich downtown area of Boston. 55% listed travel times between thirty minutes and an hour, and a staggering 25% (N=793) reported that their daily commute via public transit took lon-ger than sixty minutes.
These travel times may be partially informed by the fact that only 38% of commuters leave for work during the 7:00-9:00AM peak—the period when bus headways are the most frequent. Thirty-six percent of workers left home between midnight and 7:00am to get to work, and the remaining 26% left later in the day, primar-ily between the hours of noon and midnight. Private vehicle occupan-cy among Chelsea residents is high: 8,218 (65%) workers reportedly take cars to work.
% Below Boston MHI
Median Household Income
Per Capita Income
62% $30,161 $14,628
Graph 5: Linguistic Isolation in Chelsea
Table 11: Racial Diversity Profile for Chelsea
Table 12: Income Profile for Chelsea
32

Dorchester1:Bus Route: 23 and 28Considered an EJ Community
According to the Bos-ton Redevelopment Authority, Dorches-ter is the largest and most culturally di-verse neighborhood in Boston. Dorchester has a high percent-age of non-English speaking households. More than half of the households in Dorchester earn in-comes less than the citywide average and the per capita income is much lower than the average of the MHI.
Transit Dependency
In 2000, 32% of Dorchester workers reported that they used public trans-portation to get to work (N= 12,195). Although much of the neighborhood is without proximate access to sub-way and rail services, the Ashmont and Braintree branches of the Red line serve the eastern edge of the neighborhood. The percentages of transit commuters who took the bus and train were 33% and 64%, respec-tively.
Average travel times reflect the di-versity of transit options as well as 1 Census Tracts 907, 913, 914, 915, 911, 910, 909, 918, 916, 917, 919, 920, 922, 921, 923, 1005, 1004, 1009, 100, 1007, 1006.01, 1006.02, as defined by the BRA. Racial Demographic infor-mation provided by the Boston Redevelopment Authority.
Table 13: Racial Diversity Profile for Dorchester
the schedules of workers. Less than half (46%) of workers reported leav-ing their homes during the AM Peak, suggesting that many Dorchester resi-dents who ride public transit to work
must travel during times when bus and train services are less frequent. 19% of MBTA commuters (N=2308) re-ported travel times of less than thirty minutes. The majority (61%) spent
between thirty and sixty minutes traveling, and the remaining 20% had commute times of more than one hour (N=2397). The majority of commuters own and commute by car (62%), sug-gesting that public transportation is not a preferred option for many work-ers living in the neighborhood.
% Below Boston MHI
Median Household Income
Per Capita Income
54% $37,874 $17,000
Table 14: Income Profile for Dorchester
33
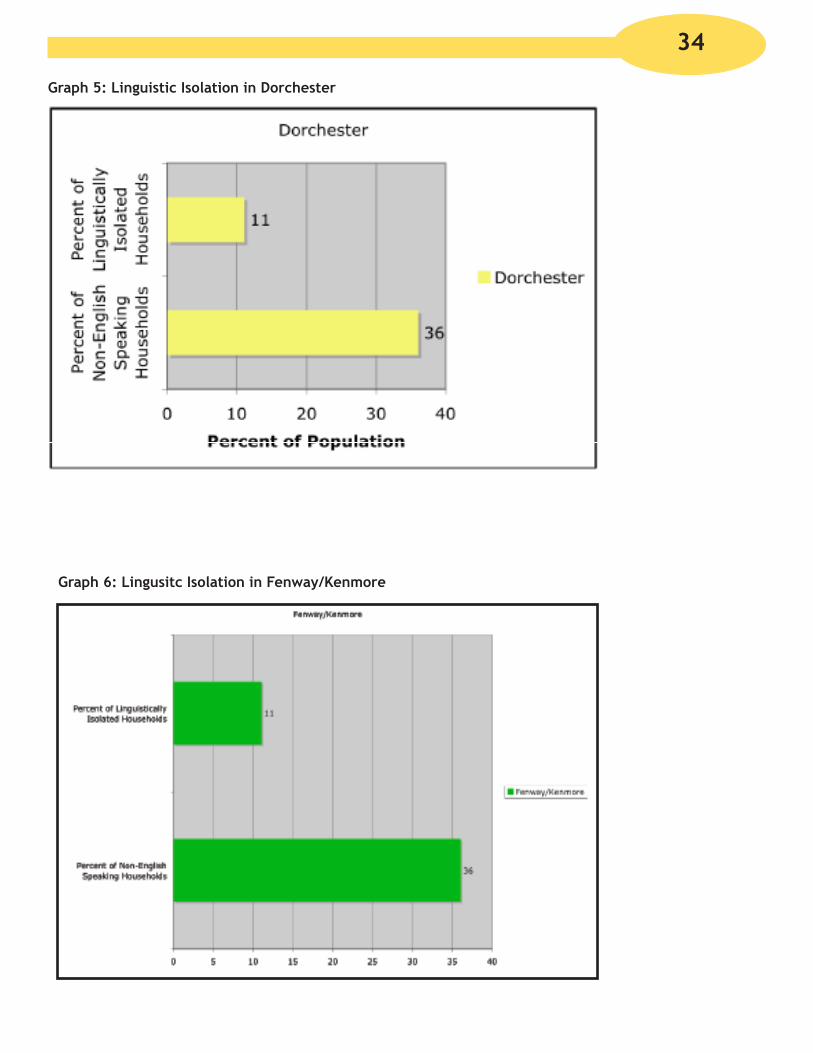
Graph 5: Linguistic Isolation in Dorchester
Graph 6: Lingusitc Isolation in Fenway/Kenmore
34

Fenway/Kenmore1:Bus Route- 57Not considered EJ Community
The Fenway/Kenmore area is predominately white. About a third of the residents do not speak English at home. Income levels are low-er in the city average, possibly due to the high percentage of students in the area.
Transit DependencyFour of the five lines we analyzed make stops in the Fenway/Kenmore neighborhood (all but 111); addi-tionally, the area is served by Green and Orange line train service. 37% of workers reported commuting on the MBTA (N=7521). The majority trav-eled by train (67%), leaving 23% of transit commuters reliant on bus ser-vices. This idea is supported by the average travel times experienced by public transit commuters. Forty-six percent (N=9269) of workers reported leaving home during the AM Peak: this number may be lower than average due to the nontraditional class and work schedules of students. Half of all MBTA commuters (N=3790) spent less than thirty minutes getting to work; another 43% (N=3147) report-
1 Census tracts 101.01, 101.02, 102.01, 102.02, 103, 104.01, 104.02, and 105. Racial Demo-graphics Courtesy of the Boston Redevelopment Authority
Table 15: Racial Diversity Profile for Fenway/Kenmore
ed travel times between thirty and fifty nine minutes. Finally, only 6% (N=484) of T riders living in the Fen-way/Kenmore neighborhoods claimed to spend longer than an hour en route to work.
In addition to the availability of tran-sit options, Fenway/Kenmore’s cen-tral location lends itself to alternative modes of transport, such as walking. In 2000, 41% of workers living in these neighborhoods reported that they walked to work. Vehicle occupancy is low (18%), suggesting that mobility in these neighborhoods is driven by the ability to easily board a bus or train or walk to a destination.
% Below Boston MHI
Median Household Income
Per Capita Income
66% $23,251 $17,981
Table 16: Income Profile-Fenway/Kenmore
35
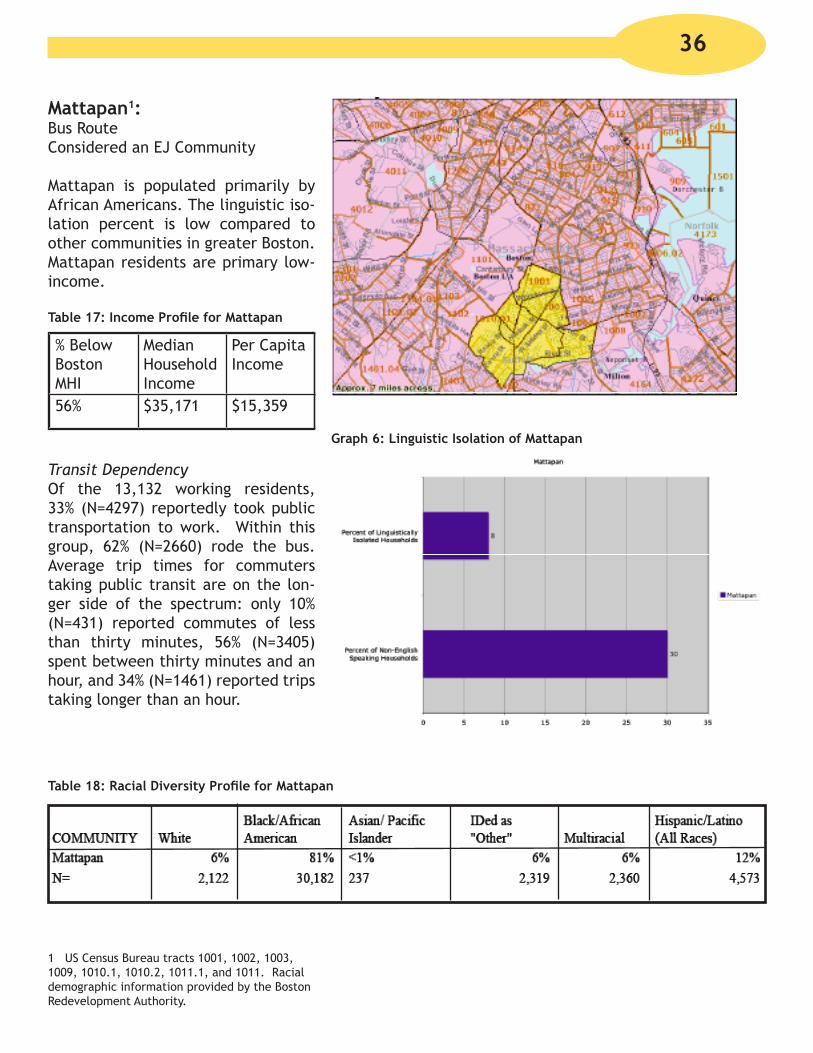
Mattapan1:Bus RouteConsidered an EJ Community
Mattapan is populated primarily by African Americans. The linguistic iso-lation percent is low compared to other communities in greater Boston. Mattapan residents are primary low-income.
Table 17: Income Profile for Mattapan
Transit DependencyOf the 13,132 working residents, 33% (N=4297) reportedly took public transportation to work. Within this group, 62% (N=2660) rode the bus. Average trip times for commuters taking public transit are on the lon-ger side of the spectrum: only 10% (N=431) reported commutes of less than thirty minutes, 56% (N=3405) spent between thirty minutes and an hour, and 34% (N=1461) reported trips taking longer than an hour.
1 US Census Bureau tracts 1001, 1002, 1003, 1009, 1010.1, 1010.2, 1011.1, and 1011. Racial demographic information provided by the Boston Redevelopment Authority.
% Below Boston MHI
Median Household Income
Per Capita Income
56% $35,171 $15,359
Graph 6: Linguistic Isolation of Mattapan
Table 18: Racial Diversity Profile for Mattapan
36

Roxbury1:Bus Routes 1, 23, 28Considered an EJ community
Roxbury is predomi-nately an African American neighbor-hood. Linguistic iso-lation afflicts eleven percent of Roxbury households. Roxbury is a relatively low-income neighbor-hood, with a high percent of house-holds earning below Boston MHI.
Transit DependencyRoxbury has often been at the heart of the environmental justice struggle in Boston, brought on by activity gen-erated by the MBTA. Dudley Station, located in the center of the neighbor-hood, is a locus of MBTA bus activity, with fifteen lines making stops at the station. Thirty seven percent of work-ers reported that they commuted via MBTA (N=7,934). 65% of T riders rode the bus (N=5179), versus 35% who opted for rail or subway service.
Mobility is an issue for the residents of Roxbury, though not as much as it is for neighboring communities such as Dorchester and Mattapan. More than three quarters of commuters
1 BRA defines Roxbury as census tracts 803, 801, 804, 806, 906, 904, 903, 902, 901, 821, 820, 818, 819, 817, 814, 815, 813, and 1203. Racial Demographics courtesy of the Boston Redevelop-ment Authority.
Table 19: Racial Diversity Profile for Roxbury
left their homes during the morning peak (N=8377), suggesting a signifi-cant portion of the population with traditional nine to five jobs. Among public transit commuters, 26% re-ported commute times of less than thirty minutes (N=1799), 62% thirty to fifty nine minutes (N=4306), and 13% longer than an hour (N=936). Vehicle occupancy is high (78%), which may speak to the fact that residents are choosing not to commute via MBTA despite having many transportation options because of the quality of ser-vice.
% Below Boston MHI
Median Household Income
Per Capita Income
67% $26,477 $13,476
Table 20: Income Profile for Roxbury
37
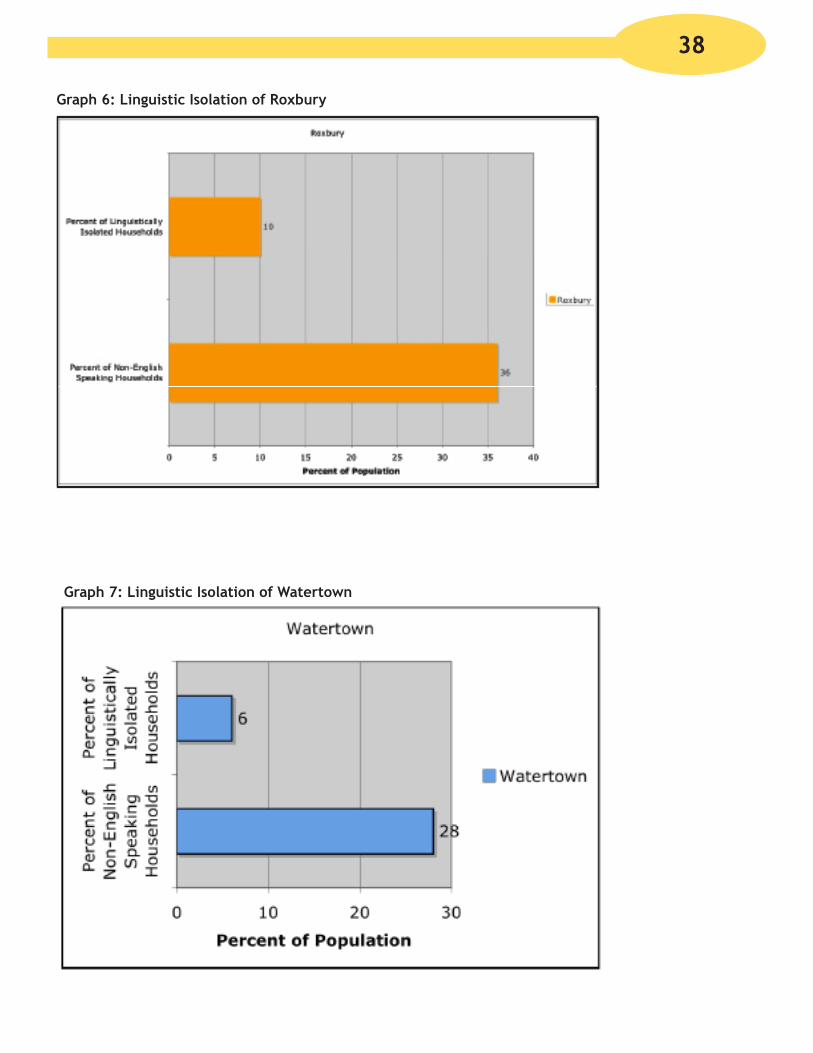
Graph 6: Linguistic Isolation of Roxbury
Graph 7: Linguistic Isolation of Watertown
38

Watertown1:Bus Route- 57Not considered an EJ Community
Watertown is pre-dominately white, has a low percent of linguistically isolated neighborhoods and its median house-hold and per capita incomes are signifi-cantly higher than Boston.
Transit DependencyAs a town located outside of MBTA’s rail service, the majority of Water-town public transit commuters ride the bus (72%). 64% of workers re-ported leaving their homes during the morning peak; among MBTA com-muters, 22% reported travel times of less than thirty minutes (N=636), 66% between thirty and an hour, and 13% more than one hour (N=371). Vehicle occupancy in the town is high (74%), which speaks to the idea that com-muting via MBTA is not a necessity for Watertown residents, but rather a convenience of urban living.
1 Area defined by the US Census Bureau as “Watertown City.” All information courtesy of American Factfinder.
Table 21: Racial Diversity Profile for Watertown
% Below Boston MHI
Median Household Income
Per Capita Income
32% $59,764 $33,262
Table 22: Income Profile for Watertown
39
40
Map 4: Bus Routes 1, 23, 28, 57, 111

Intro to the Report Card“Armed with initial data, riders can use the report cards to sup-port their fight for bus route improvements.”
How Do the Routes Compare?If people ride the same route every day, do they know how their line compares to other routes in their neighborhood or other neighborhoods in the city? Bus riders need data to support improvements or suggestions for their bus routes and they need it in a way that is easy to read and un-
derstand.
We designed report cards for each of the five bus routes to sum-marize the data col-lected in March 2007 for frequency, timing, crowding, and on and off bus amenities. Each
category is given an individual letter grade and a composite score to deter-mine the route’s overall grade. The route grades allow readers and riders to evaluate their route in comparison to other routes, while the individual category grades illustrate where the route is strongest or where it is lack-ing. The report card allows readers and riders to compare the routes in an easy-to-understand format.
Armed with initial data, riders can use the report cards to support their fight for bus route improvements. Data can be used to illustrate wheth-er the T is making progress with its Key Bus Improvements as released in December 2006, and demonstrate whether certain communities may be receiving different levels of service.
The report card approach is based on the New York Public Interest Group Straphanger Campaign- State of the Subways Report Card (New York PIRG Straphanger Campaign, “State of the Subways Report Card”, July 2006). The Campaign has evaluated New York City subway lines since the late 1990s and it is time Boston comes up with something just as valuable. The authors hope these initial five report cards are part of a larger campaign taken on by the T Riders Union and will provide a format for them to evaluate these routes and others over several years.
The five routes are part of 15 bus routes identified by the MBTA as Key Bus Routes, indicating the busiest lines in terms of schedule and riders. Three of the routes, the 23, 28, and the 111, run through low income and highly diverse communities of Rox-bury, Dorchester and Mattapan. The 57 runs through the high income and low diversity Watertown and the 1 starts from Cambridge, which is simi-lar to Watertown and ends in Roxbury. Part of the idea of report card was to illustrate if there was any difference in the quality and quantity of service amongst these communities from the data collected. The other part was to identify areas where the MBTA could make improvements. The analysis section will go into more detail about the results found.
41
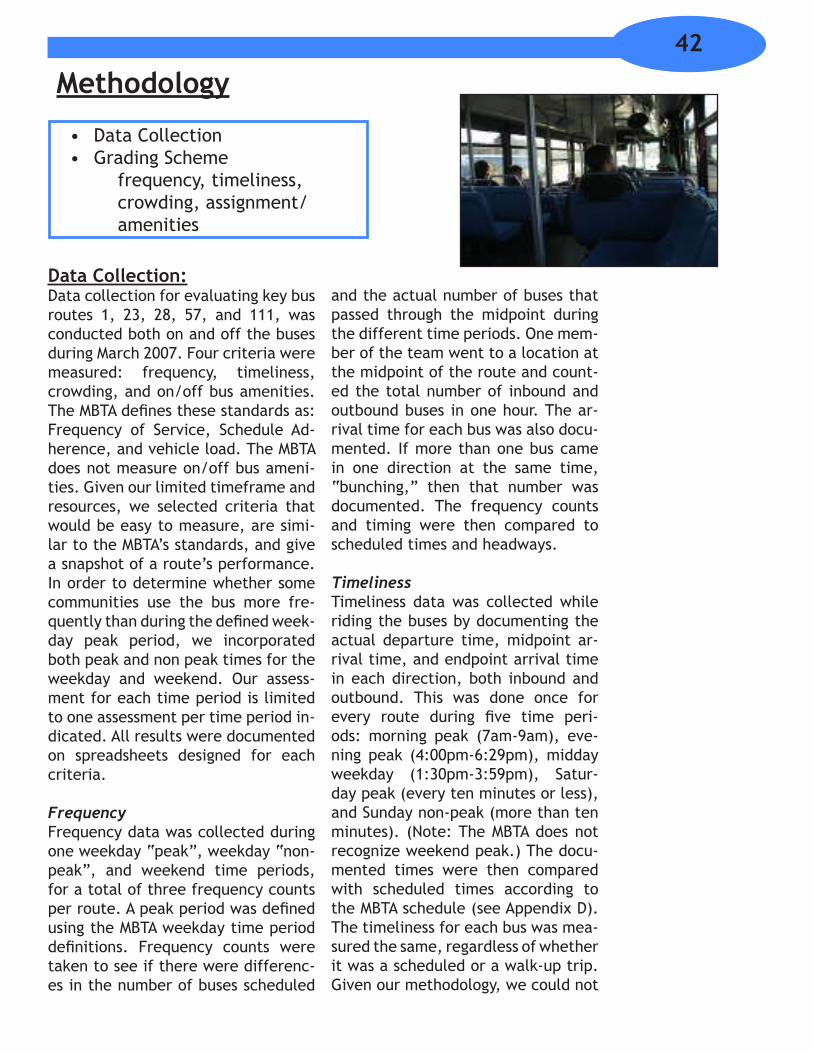
Methodology
Data CollectionGrading Scheme
frequency, timeliness, crowding, assignment/ amenities
••
Data Collection:Data collection for evaluating key bus routes 1, 23, 28, 57, and 111, was conducted both on and off the buses during March 2007. Four criteria were measured: frequency, timeliness, crowding, and on/off bus amenities. The MBTA defines these standards as: Frequency of Service, Schedule Ad-herence, and vehicle load. The MBTA does not measure on/off bus ameni-ties. Given our limited timeframe and resources, we selected criteria that would be easy to measure, are simi-lar to the MBTA’s standards, and give a snapshot of a route’s performance. In order to determine whether some communities use the bus more fre-quently than during the defined week-day peak period, we incorporated both peak and non peak times for the weekday and weekend. Our assess-ment for each time period is limited to one assessment per time period in-dicated. All results were documented on spreadsheets designed for each criteria.
FrequencyFrequency data was collected during one weekday “peak”, weekday “non-peak”, and weekend time periods, for a total of three frequency counts per route. A peak period was defined using the MBTA weekday time period definitions. Frequency counts were taken to see if there were differenc-es in the number of buses scheduled
and the actual number of buses that passed through the midpoint during the different time periods. One mem-ber of the team went to a location at the midpoint of the route and count-ed the total number of inbound and outbound buses in one hour. The ar-rival time for each bus was also docu-mented. If more than one bus came in one direction at the same time, “bunching,” then that number was documented. The frequency counts and timing were then compared to scheduled times and headways.
TimelinessTimeliness data was collected while riding the buses by documenting the actual departure time, midpoint ar-rival time, and endpoint arrival time in each direction, both inbound and outbound. This was done once for every route during five time peri-ods: morning peak (7am-9am), eve-ning peak (4:00pm-6:29pm), midday weekday (1:30pm-3:59pm), Satur-day peak (every ten minutes or less), and Sunday non-peak (more than ten minutes). (Note: The MBTA does not recognize weekend peak.) The docu-mented times were then compared with scheduled times according to the MBTA schedule (see Appendix D). The timeliness for each bus was mea-sured the same, regardless of whether it was a scheduled or a walk-up trip. Given our methodology, we could not
42

differentiate whether the individual bus was late or whether the whole bus route schedule was thrown off.
CrowdingCrowding data was collected while riding the buses to evaluate the safe-ty and comfort of the buses. At the departure point, the initial number of riders was documented. Whenever additional riders came on the bus, they were counted and documented in a “# of new riders” category. Passen-gers exiting the bus were not count-ed. A total number of riders for the entire trip was calculated based on these numbers. In addition, the num-ber of people standing were counted if they were standing for at least one stop. This did not include people who stood briefly as they were paying or getting ready to depart the bus. In order to distinguish those standing by choice from those standing by neces-sity, the number of available seats was also documented. This provided an overall passenger to seat ratio and a picture of varying levels of crowd-ing occurring at any given time along the route. This data was collected for each route during the same time cat-egories and at the same time as the timeliness data.
Assignment/AmenitiesOn-bus assignment/amenities were documented while riding each bus during the same time periods. The following features and their function-ality was noted: heat, Charlie Card machine, stop requests, announce-ments (digital display and intercom), and bike racks (located on the front of the buses). Route amenities were documented by two team members, either by riding the bus along a route in its entirety or by walking or cy-
cling along the route. The existence of shelters, route signs, and posted schedules was documented for each stop along the route. A percentage of stops possessing each of these ameni-ties was calculated for each route.
Grading Scheme:Quality service should be accessible, reliable, clean, safe, comfortable, and affordable. If a bus route met all of these objectives, it would score an A+ on the Report Card. However, we were not able to evaluate wheth-er the five bus routes were meeting these objectives in every manner that would be appropriate for evaluating real quality of service. We were able to evaluate relative accessibility, reli-ability, and safety and comfort based on the data collected above around standards of frequency, crowding, timeliness, on-bus assignment/ame-nities, and route stop amenities.
FrequencyAccording to the MBTA, a bus meets its frequency standard if the total number of buses counted in hour is equal to (or greater than) the num-ber scheduled. (10 points total for each time period – 5 points in each direction) It fails if fewer buses than scheduled. No gradations are allowed, since passengers depend on the bus to meet its schedule.
43

A bus meets its headway standard if the time between buses is regular. “Regular” means that the bus arrives within two minutes before or two min-utes after the scheduled headway be-tween buses. (10 points for each time period-5each direction) (1/2 credit for only one unmet headway) It fails the headway standard if bunching oc-curs more than once or if the time between buses is more or less than two minutes outside of scheduled headway more than once in the hour. (60 total points for each route)�
TimelinessFor a trip to be considered “on time”, it must leave its departure point no more than three minutes late and ar-rive at both the midpoint and arrival point no more than 5 minutes late. Each route will be scored out of 60 for timeliness. 6 points for each trip (one direction), 2 points each for de-parture, midpoint, and arrival, that is “on time.”
CrowdingIdeally, no passenger should have to stand (unless by choice), so a perfect score on this measure would mean that at no point on the trip was there no seat available to a passenger.
Points were awarded in the following ways:
If there is standing (with no seats available), but the number standing is 5 people or less for no more than 1/4 of the trip, the trip loses one point.
If 5 or less are standing for more than 1/4 of the trip, it loses an ad-
1 This methodology will require adjustment in the future to account for different # of buses scheduled in a time period. In other words, if 6 are scheduled for an hour, if one is late, impact is greater than if one were late when 8 are sched-uled.
•
•
ditional point.If there are 6-10 people standing
for no more than 1/4 of the trip, loses 2 points.
If 6-10 people standing for more than 1/4 of the trip, loses 3 points.
If 11-15 people standing for no more than 1/4, loses 3 points.
If 11-15 people standing for more than 1/4 of the trip, loses 4 points.
If 16-20 for no more than 1/4, los-es 4 points.
If 16-20 for more than 1/4, loses 5 points.
If more than 20 standing AT ANY POINT, loses 5 points. (Because it is unsafe, uncomfortable, and causes delays.)
Each route loses an additional 5 points if crowding of more than 10 people occurred for more than 1/4 of the trip during a non-peak time. There-fore, for each trip a score of 5 points is possible, plus 5 points for each route if non-peak crowding does NOT happen. The total number of possible points for each route is 55.
On bus assignment/amenitiesFor each trip, the bus route will re-ceive one point for each of the fol-lowing:
Functioning heatFunctioning Charlie card machineFunctioning stop requests
•
•
•
•
•
•
•
•••
44

Stop announcements (has to have either digital display or audible inter-com announcements)
Bike rack
The total possible points per trip is 5 and the total possible points per route is 50.
Route Stop/Shelter AmenitiesA percentage was calculated for num-ber of stops per route with a shelter, with schedules posted, and with signs. Percentages were then set out of 50 points (roughly 17 for each amenity) for total possible points of 50 per route.Total Possible Points for all categories is 275. Overall grade calculated from a percentage of total points earned out of 275.
A ModelSome of this grading may seem strict. In fact, given this grad-ing scheme and the current state of bus transit in the Greater Boston area, it is im-possible for any of our
routes to earn an A, for reasons such as: not every bus stop having a shel-ter; a bus that makes more passenger stops will take more time to com-plete a route than a trip that stops less. However, this strict scheme is used to illustrate the fact that buses are generally not performing as well as they could and to show how far they currently are from an ideal bus transit system.
The goal of creating this methodology and grading scheme was to establish a method for evaluating the service
•
•
performance of these five key bus routes. However, with limited time and resources, only a small sample of data was collected for each route. Therefore, more importantly, this methodology can serve as a model for future data collection and evaluation of these and other routes through-out the MBTA system. Over a longer time period, the data can be used to paint a comprehensive picture of bus service, draw conclusions about the successes and failures of bus service performance as well as document dis-parities between different communi-ties served by the bus system.
...this strict scheme is used to illustrate...how far they currently are from an ideal
bus transit system.
45

The Report Cards
The Routes: 1, 23, 28, 57, 111The Winners: Routes 23, 28, 57 (C)The Loser: Route 111 (D+)NO BUS PERFORMED WELL
••••
Route 1 earned a C- in its report card. With regard to frequency, service was lacking during midday and weekend periods. The factor most negatively impacting the evaluation was the is-sue of timeliness. Possibly due to the heavy traffic on Massachusetts Ave., the 1 had difficulty starting and arriv-ing at midpoints and destinations on time. This was consistent throughout all weekday inspection times. Crowd-ing was a negative issue particularly towards Dudley in the AM rush period
and towards Harvard in the PM rush. This route scored well in on-bus ame-nities with only slight problems with the automated fare collection ma-chine and onboard announcements not operating for a few stops. There were more comprehensive bus stop amenities provided than on most of the other bus routes observed. Per-formance seemed to lag more be-tween Dudley Square and Newbury St than in Cambridge.
46

Route 23 earned a C in its report card. Frequency was optimal for all times, although headways between buses were lacking in almost all time periods. Bunching of buses would oc-cur as traffic congestion became a factor on Blue Hill Avenue and War-ren Street in the vicinity of Grove Hall in Roxbury. Timeliness was not impressive and lagged particularly during the midday. Crowding was an issue during the midday and PM rush period. Route scored well for on-bus amenities and was mediocre for off-bus amenities.
47
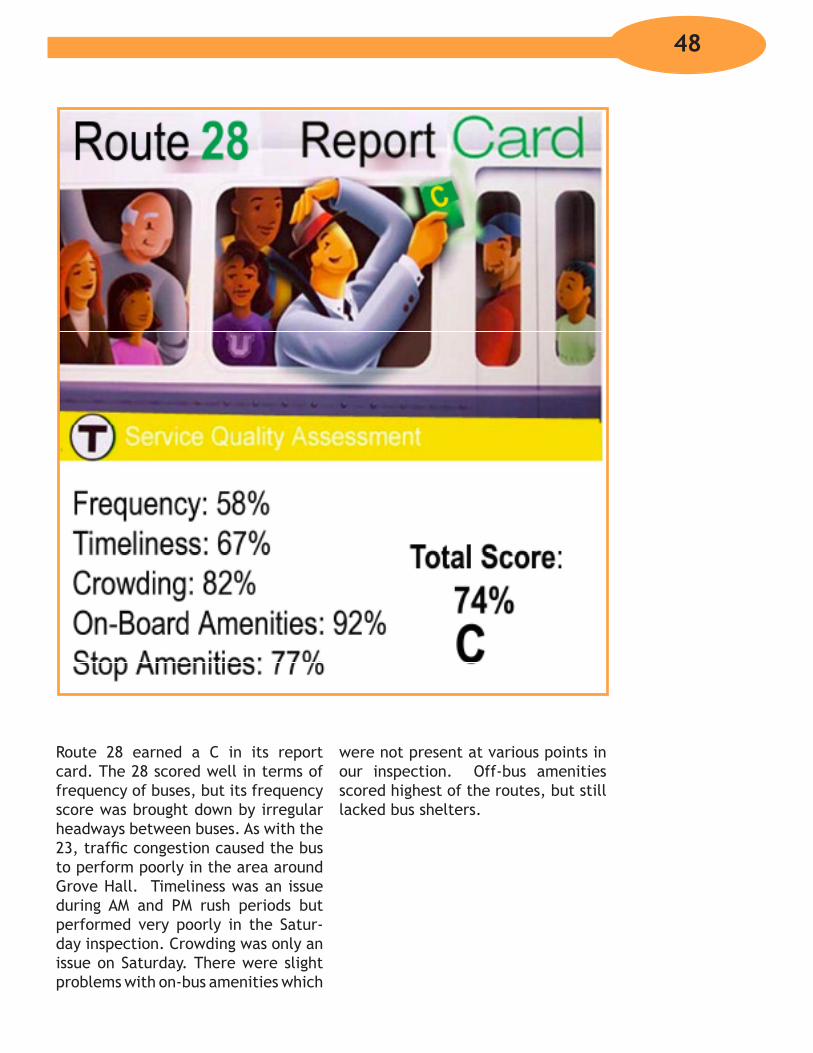
Route 28 earned a C in its report card. The 28 scored well in terms of frequency of buses, but its frequency score was brought down by irregular headways between buses. As with the 23, traffic congestion caused the bus to perform poorly in the area around Grove Hall. Timeliness was an issue during AM and PM rush periods but performed very poorly in the Satur-day inspection. Crowding was only an issue on Saturday. There were slight problems with on-bus amenities which
were not present at various points in our inspection. Off-bus amenities scored highest of the routes, but still lacked bus shelters.
48
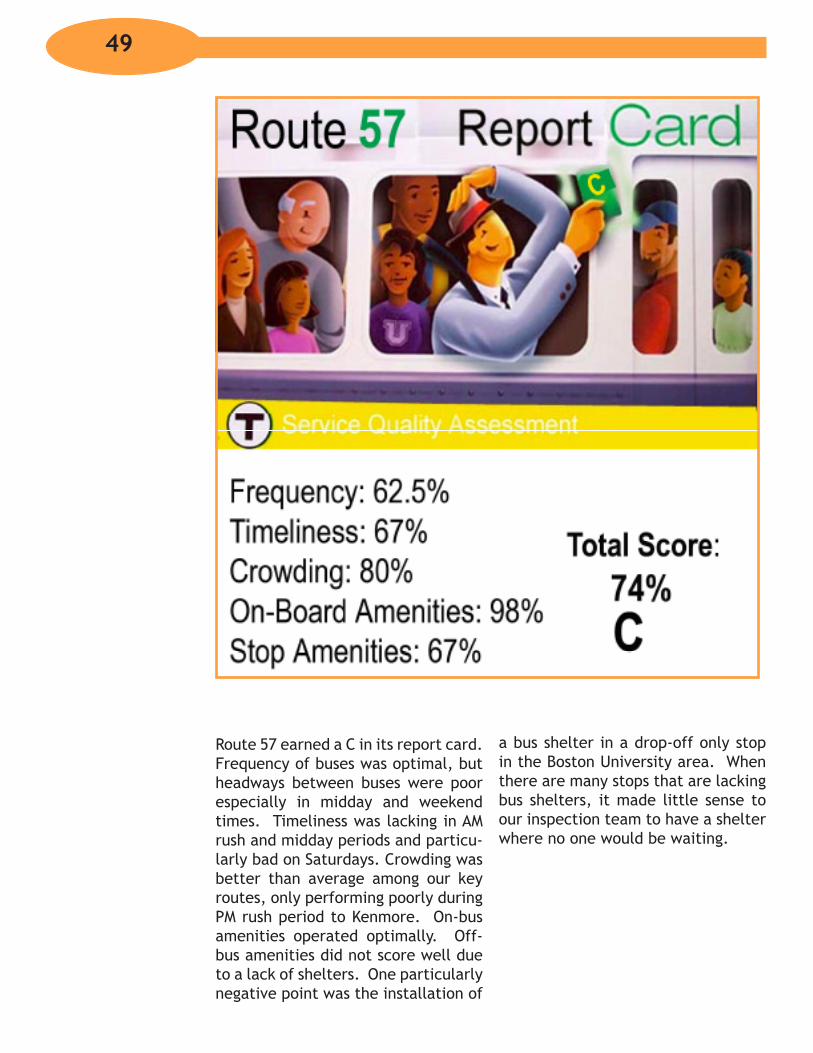
Route 57 earned a C in its report card. Frequency of buses was optimal, but headways between buses were poor especially in midday and weekend times. Timeliness was lacking in AM rush and midday periods and particu-larly bad on Saturdays. Crowding was better than average among our key routes, only performing poorly during PM rush period to Kenmore. On-bus amenities operated optimally. Off-bus amenities did not score well due to a lack of shelters. One particularly negative point was the installation of
a bus shelter in a drop-off only stop in the Boston University area. When there are many stops that are lacking bus shelters, it made little sense to our inspection team to have a shelter where no one would be waiting.
49

Route 111 earned a D+ on its report card, the worst marks among the key routes being graded. It performed quite poorly with regard to frequen-cy and headways. Buses were not frequent or operated with regular-ity. The route performed decently in terms of timeliness with problems oc-curring in the PM rush and on week-ends, particularly on Saturday where it failed to be on time consistently. Crowding was not a negative factor. On-bus amenities were average. Off-bus amenities suffered from a slight lack of proper signage containing bus routes and a low amount of shelters.
Tobin Bridge, Chelsea, MA: Part of 111 Route
50
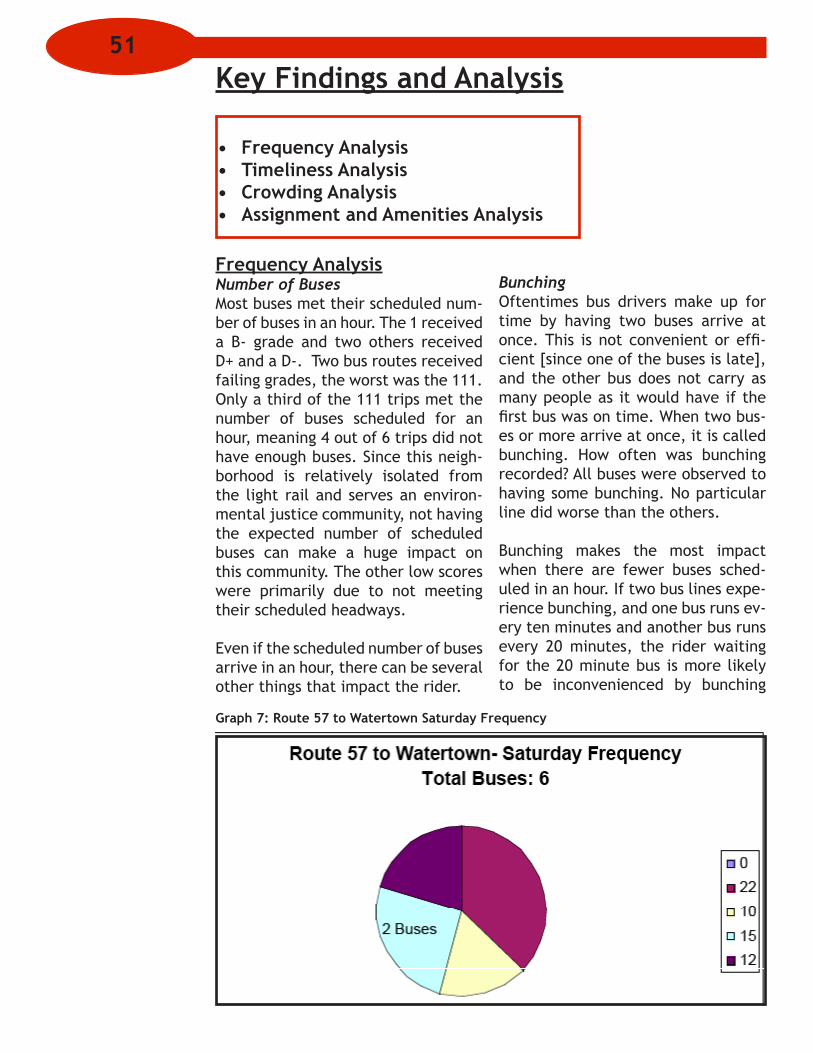
Key Findings and Analysis
Frequency AnalysisTimeliness AnalysisCrowding AnalysisAssignment and Amenities Analysis
••••
Frequency AnalysisNumber of BusesMost buses met their scheduled num-ber of buses in an hour. The 1 received a B- grade and two others received D+ and a D-. Two bus routes received failing grades, the worst was the 111. Only a third of the 111 trips met the number of buses scheduled for an hour, meaning 4 out of 6 trips did not have enough buses. Since this neigh-borhood is relatively isolated from the light rail and serves an environ-mental justice community, not having the expected number of scheduled buses can make a huge impact on this community. The other low scores were primarily due to not meeting their scheduled headways.
Even if the scheduled number of buses arrive in an hour, there can be several other things that impact the rider.
BunchingOftentimes bus drivers make up for time by having two buses arrive at once. This is not convenient or effi-cient [since one of the buses is late], and the other bus does not carry as many people as it would have if the first bus was on time. When two bus-es or more arrive at once, it is called bunching. How often was bunching recorded? All buses were observed to having some bunching. No particular line did worse than the others.
Bunching makes the most impact when there are fewer buses sched-uled in an hour. If two bus lines expe-rience bunching, and one bus runs ev-ery ten minutes and another bus runs every 20 minutes, the rider waiting for the 20 minute bus is more likely to be inconvenienced by bunching
Graph 7: Route 57 to Watertown Saturday Frequency
51
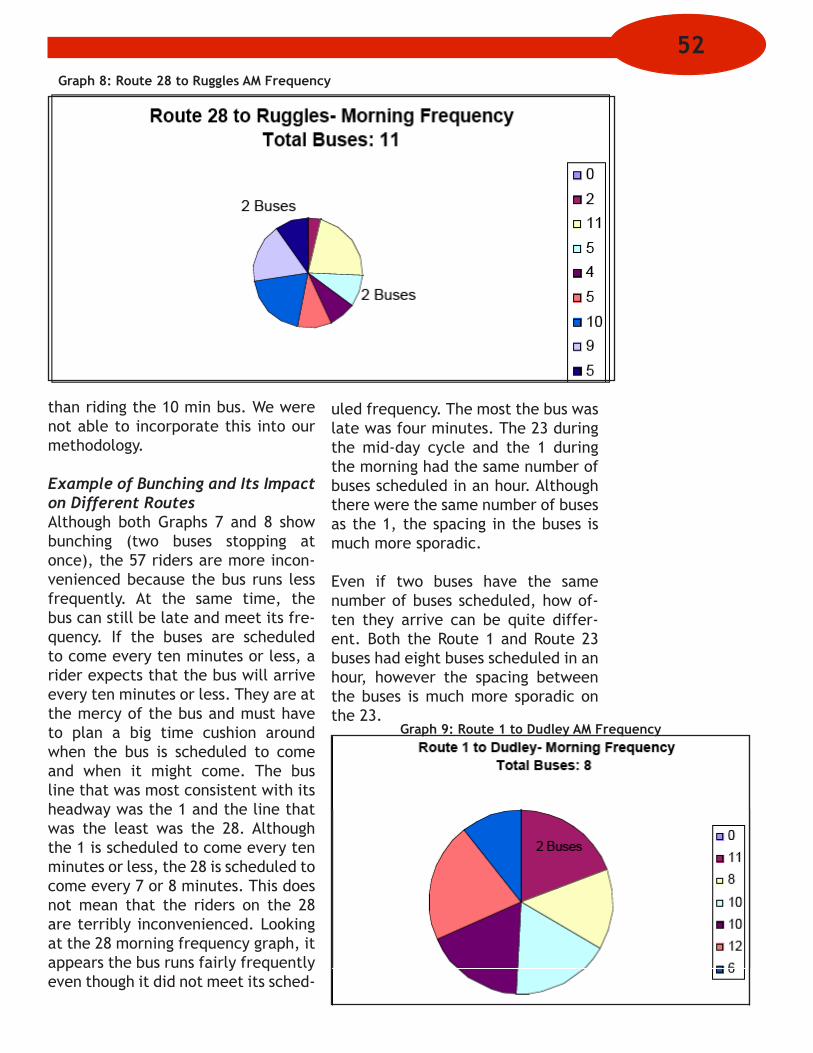
than riding the 10 min bus. We were not able to incorporate this into our methodology.
Example of Bunching and Its Impact on Different RoutesAlthough both Graphs 7 and 8 show bunching (two buses stopping at once), the 57 riders are more incon-venienced because the bus runs less frequently. At the same time, the bus can still be late and meet its fre-quency. If the buses are scheduled to come every ten minutes or less, a rider expects that the bus will arrive every ten minutes or less. They are at the mercy of the bus and must have to plan a big time cushion around when the bus is scheduled to come and when it might come. The bus line that was most consistent with its headway was the 1 and the line that was the least was the 28. Although the 1 is scheduled to come every ten minutes or less, the 28 is scheduled to come every 7 or 8 minutes. This does not mean that the riders on the 28 are terribly inconvenienced. Looking at the 28 morning frequency graph, it appears the bus runs fairly frequently even though it did not meet its sched-
Graph 8: Route 28 to Ruggles AM Frequency
uled frequency. The most the bus was late was four minutes. The 23 during the mid-day cycle and the 1 during the morning had the same number of buses scheduled in an hour. Although there were the same number of buses as the 1, the spacing in the buses is much more sporadic.
Even if two buses have the same number of buses scheduled, how of-ten they arrive can be quite differ-ent. Both the Route 1 and Route 23 buses had eight buses scheduled in an hour, however the spacing between the buses is much more sporadic on the 23.
Graph 9: Route 1 to Dudley AM Frequency
52
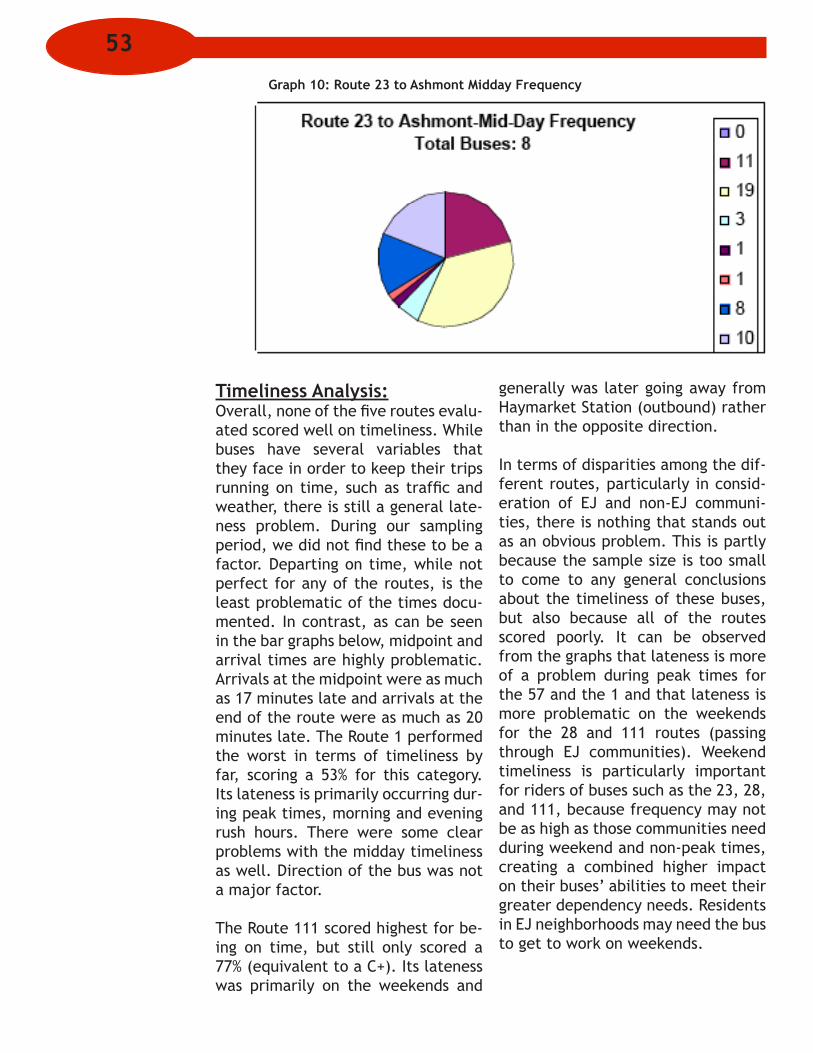
Graph 10: Route 23 to Ashmont Midday Frequency
Timeliness Analysis:Overall, none of the five routes evalu-ated scored well on timeliness. While buses have several variables that they face in order to keep their trips running on time, such as traffic and weather, there is still a general late-ness problem. During our sampling period, we did not find these to be a factor. Departing on time, while not perfect for any of the routes, is the least problematic of the times docu-mented. In contrast, as can be seen in the bar graphs below, midpoint and arrival times are highly problematic. Arrivals at the midpoint were as much as 17 minutes late and arrivals at the end of the route were as much as 20 minutes late. The Route 1 performed the worst in terms of timeliness by far, scoring a 53% for this category. Its lateness is primarily occurring dur-ing peak times, morning and evening rush hours. There were some clear problems with the midday timeliness as well. Direction of the bus was not a major factor.
The Route 111 scored highest for be-ing on time, but still only scored a 77% (equivalent to a C+). Its lateness was primarily on the weekends and
generally was later going away from Haymarket Station (outbound) rather than in the opposite direction.
In terms of disparities among the dif-ferent routes, particularly in consid-eration of EJ and non-EJ communi-ties, there is nothing that stands out as an obvious problem. This is partly because the sample size is too small to come to any general conclusions about the timeliness of these buses, but also because all of the routes scored poorly. It can be observed from the graphs that lateness is more of a problem during peak times for the 57 and the 1 and that lateness is more problematic on the weekends for the 28 and 111 routes (passing through EJ communities). Weekend timeliness is particularly important for riders of buses such as the 23, 28, and 111, because frequency may not be as high as those communities need during weekend and non-peak times, creating a combined higher impact on their buses’ abilities to meet their greater dependency needs. Residents in EJ neighborhoods may need the bus to get to work on weekends.
53
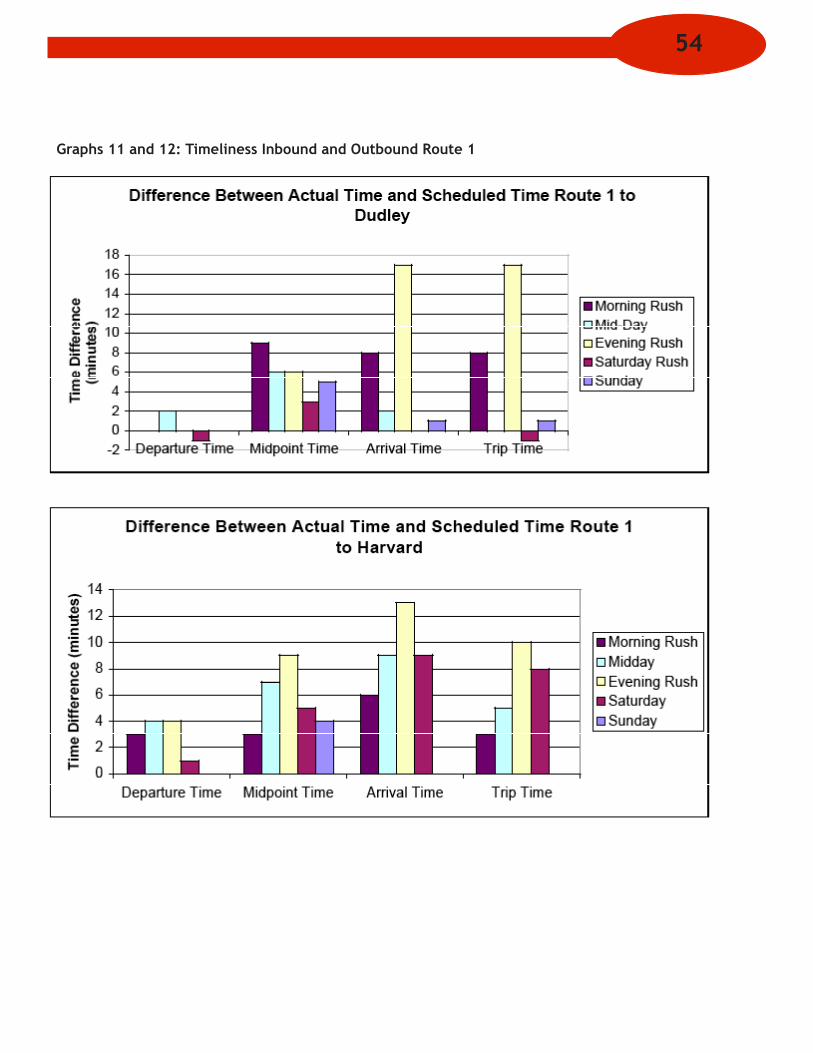
Graphs 11 and 12: Timeliness Inbound and Outbound Route 1
54
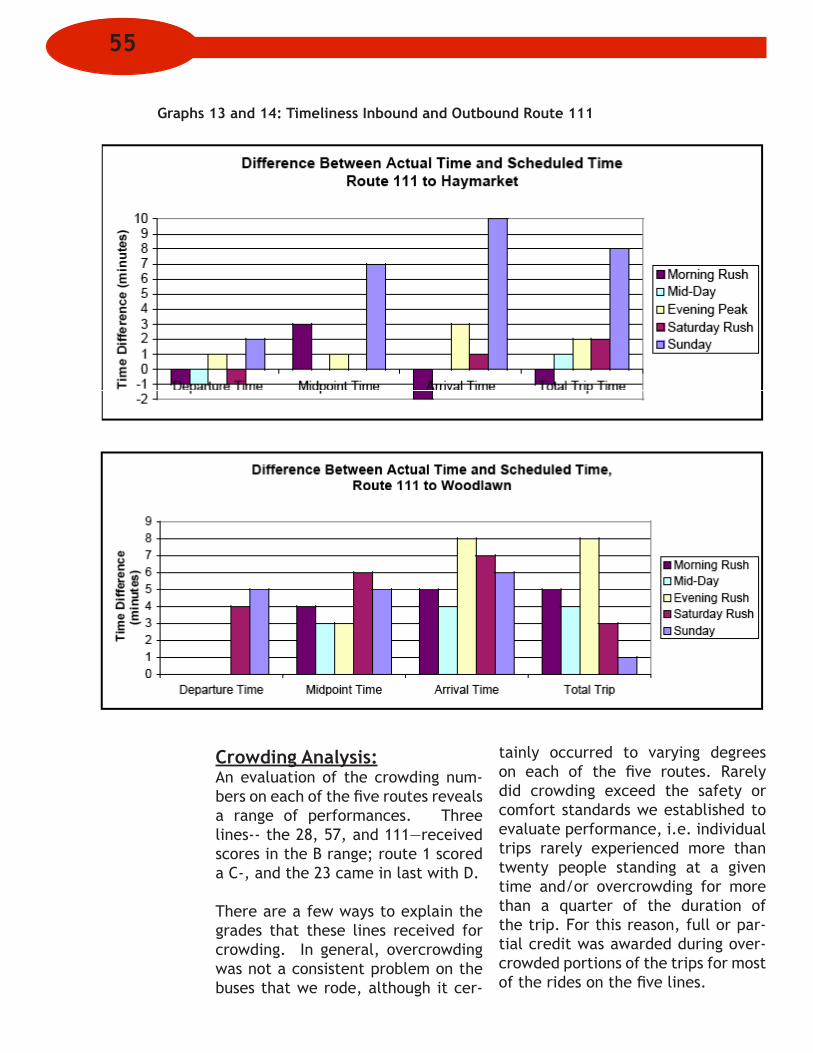
Graphs 13 and 14: Timeliness Inbound and Outbound Route 111
Crowding Analysis:An evaluation of the crowding num-bers on each of the five routes reveals a range of performances. Three lines-- the 28, 57, and 111—received scores in the B range; route 1 scored a C-, and the 23 came in last with D.
There are a few ways to explain the grades that these lines received for crowding. In general, overcrowding was not a consistent problem on the buses that we rode, although it cer-
tainly occurred to varying degrees on each of the five routes. Rarely did crowding exceed the safety or comfort standards we established to evaluate performance, i.e. individual trips rarely experienced more than twenty people standing at a given time and/or overcrowding for more than a quarter of the duration of the trip. For this reason, full or par-tial credit was awarded during over-crowded portions of the trips for most of the rides on the five lines.
55

Undoubtedly, the increased frequen-cies planned for the lines via the Key Bus Route Improvement Program has contributed to a mitigation in over-crowding. It is reassuring that the MBTA is finally responding to this problem, which is an issue that has historically been cited as a primary concern among riders.�
Even on the two routes receiving lower than average crowding scores (C- and D), serious overcrowding oc-curred only a handful of times. Three of the five lines—Route 1, 23, and 28—experienced at least one instance of having full credit deducted for unsafe and excessive crowding. The remain-ing two routes—the 57 and 111—had partial credit deducted during their evening peak rides.
AM Peak ServiceBuses and headways added to the AM peak times of each of the routes has had a positive impact on the morning commutes for riders in the communi-ties served by the five lines. With the exception of Route 1’s service from Harvard Square to Dudley Station and Route 57’s inbound trip to Kenmore Square, overcrowding did not occur between the hours of 7:00 and 9:00 AM. In fact, ridership during the AM peak period on routes 23, 28, and 111 was the lowest out of any other time frame assessed. The total number of riders for these three routes is dis-played in Graph 15.
As mentioned, Route 1 experienced extensive overcrowding during the ride from Harvard Square to Dudley Station, and consequently had full
1 Although we did not conduct any community surveys, conversations with the T Riders Union and research on customer impressions of the ser-vice spoke to the concerns about overcrowding.
Graph 15: AM Peak Ridership
credit revoked for the ride. A total of 119 passengers boarded the bus dur-ing this trip, and for seven stops had between 25 and 30 passengers stand-ing in addition to being out of seats.
In contrast, overcrowding on the 57 did not begin until more than half-way through the inbound trip. Based on these numbers, three out of five points were awarded to the trip. (See Appendix E for crowding graphs.)
Midday ServiceCrowding numbers during the mid-day period reveal a true disparity be-tween EJ and non-EJ communities. Whereas Route 57 and to an extent, Route 1, are utilized during the week primarily by workers to commute to jobs in the city (as indicated by their high peak and low non-peak rider-ship numbers), midday ridership on the remaining three routes paints a different picture of rider depen-dency. While overcrowding was not excessive, in general ridership num-bers were significantly higher than on routes catering primarily to 9-5 com-muters. The exceptions to this rule were Route 1’s service from Dudley Station to Harvard, which had a total
56
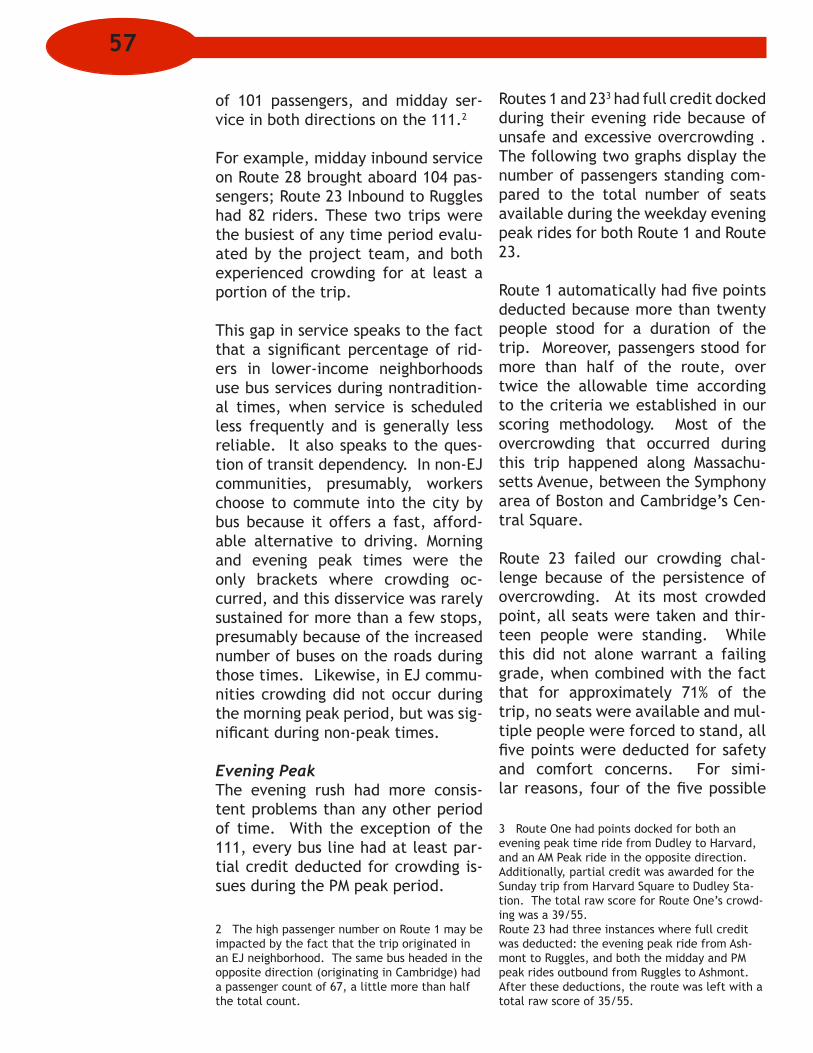
of 101 passengers, and midday ser-vice in both directions on the 111.2
For example, midday inbound service on Route 28 brought aboard 104 pas-sengers; Route 23 Inbound to Ruggles had 82 riders. These two trips were the busiest of any time period evalu-ated by the project team, and both experienced crowding for at least a portion of the trip.
This gap in service speaks to the fact that a significant percentage of rid-ers in lower-income neighborhoods use bus services during nontradition-al times, when service is scheduled less frequently and is generally less reliable. It also speaks to the ques-tion of transit dependency. In non-EJ communities, presumably, workers choose to commute into the city by bus because it offers a fast, afford-able alternative to driving. Morning and evening peak times were the only brackets where crowding oc-curred, and this disservice was rarely sustained for more than a few stops, presumably because of the increased number of buses on the roads during those times. Likewise, in EJ commu-nities crowding did not occur during the morning peak period, but was sig-nificant during non-peak times. Evening PeakThe evening rush had more consis-tent problems than any other period of time. With the exception of the 111, every bus line had at least par-tial credit deducted for crowding is-sues during the PM peak period.
2 The high passenger number on Route 1 may be impacted by the fact that the trip originated in an EJ neighborhood. The same bus headed in the opposite direction (originating in Cambridge) had a passenger count of 67, a little more than half the total count.
Routes 1 and 233 had full credit docked during their evening ride because of unsafe and excessive overcrowding . The following two graphs display the number of passengers standing com-pared to the total number of seats available during the weekday evening peak rides for both Route 1 and Route 23.
Route 1 automatically had five points deducted because more than twenty people stood for a duration of the trip. Moreover, passengers stood for more than half of the route, over twice the allowable time according to the criteria we established in our scoring methodology. Most of the overcrowding that occurred during this trip happened along Massachu-setts Avenue, between the Symphony area of Boston and Cambridge’s Cen-tral Square.
Route 23 failed our crowding chal-lenge because of the persistence of overcrowding. At its most crowded point, all seats were taken and thir-teen people were standing. While this did not alone warrant a failing grade, when combined with the fact that for approximately 71% of the trip, no seats were available and mul-tiple people were forced to stand, all five points were deducted for safety and comfort concerns. For simi-lar reasons, four of the five possible
3 Route One had points docked for both an evening peak time ride from Dudley to Harvard, and an AM Peak ride in the opposite direction. Additionally, partial credit was awarded for the Sunday trip from Harvard Square to Dudley Sta-tion. The total raw score for Route One’s crowd-ing was a 39/55.Route 23 had three instances where full credit was deducted: the evening peak ride from Ash-mont to Ruggles, and both the midday and PM peak rides outbound from Ruggles to Ashmont. After these deductions, the route was left with a total raw score of 35/55.
57
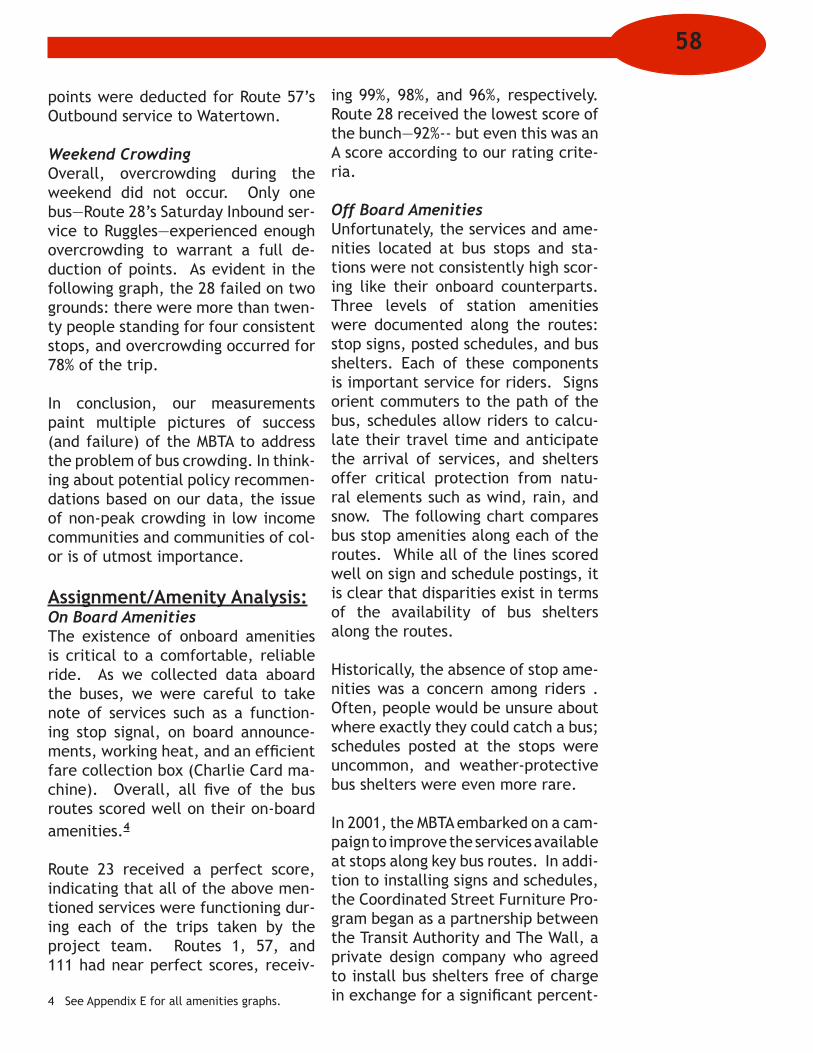
points were deducted for Route 57’s Outbound service to Watertown.
Weekend CrowdingOverall, overcrowding during the weekend did not occur. Only one bus—Route 28’s Saturday Inbound ser-vice to Ruggles—experienced enough overcrowding to warrant a full de-duction of points. As evident in the following graph, the 28 failed on two grounds: there were more than twen-ty people standing for four consistent stops, and overcrowding occurred for 78% of the trip.
In conclusion, our measurements paint multiple pictures of success (and failure) of the MBTA to address the problem of bus crowding. In think-ing about potential policy recommen-dations based on our data, the issue of non-peak crowding in low income communities and communities of col-or is of utmost importance.
Assignment/Amenity Analysis:On Board AmenitiesThe existence of onboard amenities is critical to a comfortable, reliable ride. As we collected data aboard the buses, we were careful to take note of services such as a function-ing stop signal, on board announce-ments, working heat, and an efficient fare collection box (Charlie Card ma-chine). Overall, all five of the bus routes scored well on their on-board amenities.4
Route 23 received a perfect score, indicating that all of the above men-tioned services were functioning dur-ing each of the trips taken by the project team. Routes 1, 57, and 111 had near perfect scores, receiv-
4 See Appendix E for all amenities graphs.
ing 99%, 98%, and 96%, respectively. Route 28 received the lowest score of the bunch—92%-- but even this was an A score according to our rating crite-ria.
Off Board AmenitiesUnfortunately, the services and ame-nities located at bus stops and sta-tions were not consistently high scor-ing like their onboard counterparts. Three levels of station amenities were documented along the routes: stop signs, posted schedules, and bus shelters. Each of these components is important service for riders. Signs orient commuters to the path of the bus, schedules allow riders to calcu-late their travel time and anticipate the arrival of services, and shelters offer critical protection from natu-ral elements such as wind, rain, and snow. The following chart compares bus stop amenities along each of the routes. While all of the lines scored well on sign and schedule postings, it is clear that disparities exist in terms of the availability of bus shelters along the routes.
Historically, the absence of stop ame-nities was a concern among riders . Often, people would be unsure about where exactly they could catch a bus; schedules posted at the stops were uncommon, and weather-protective bus shelters were even more rare.
In 2001, the MBTA embarked on a cam-paign to improve the services available at stops along key bus routes. In addi-tion to installing signs and schedules, the Coordinated Street Furniture Pro-gram began as a partnership between the Transit Authority and The Wall, a private design company who agreed to install bus shelters free of charge in exchange for a significant percent-
58
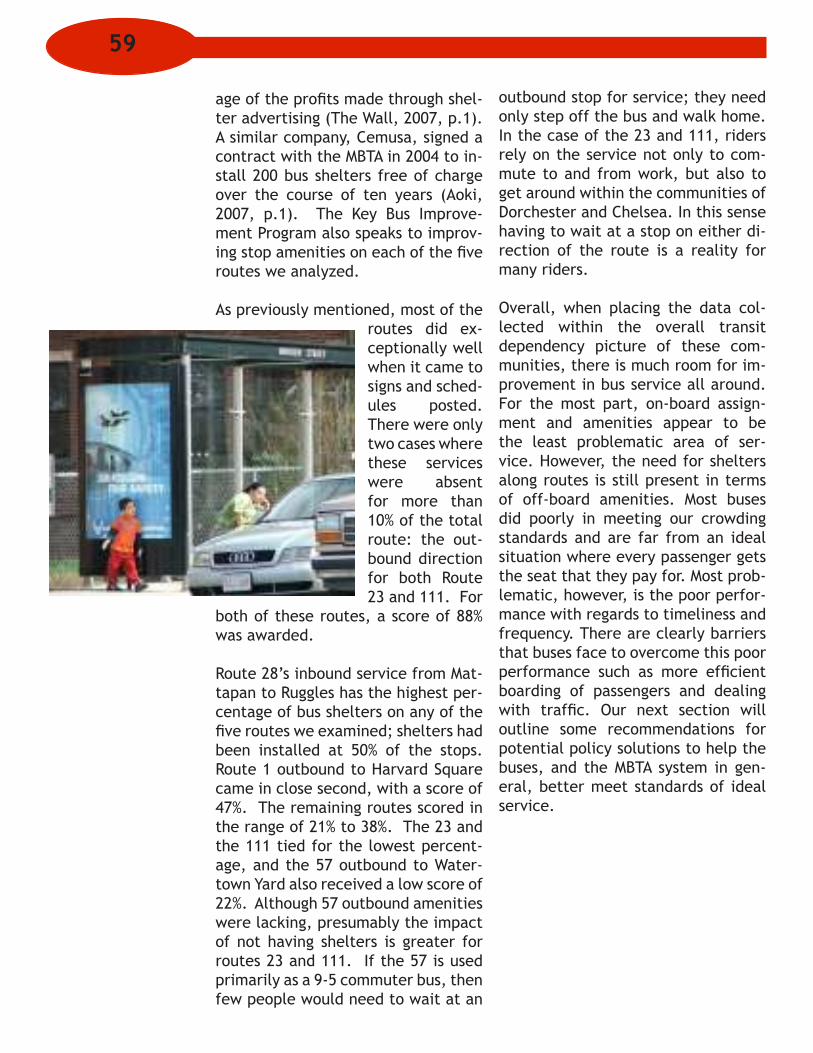
age of the profits made through shel-ter advertising (The Wall, 2007, p.1). A similar company, Cemusa, signed a contract with the MBTA in 2004 to in-stall 200 bus shelters free of charge over the course of ten years (Aoki, 2007, p.1). The Key Bus Improve-ment Program also speaks to improv-ing stop amenities on each of the five routes we analyzed.
As previously mentioned, most of the routes did ex-ceptionally well when it came to signs and sched-ules posted. There were only two cases where these services were absent for more than 10% of the total route: the out-bound direction for both Route 23 and 111. For
both of these routes, a score of 88% was awarded.
Route 28’s inbound service from Mat-tapan to Ruggles has the highest per-centage of bus shelters on any of the five routes we examined; shelters had been installed at 50% of the stops. Route 1 outbound to Harvard Square came in close second, with a score of 47%. The remaining routes scored in the range of 21% to 38%. The 23 and the 111 tied for the lowest percent-age, and the 57 outbound to Water-town Yard also received a low score of 22%. Although 57 outbound amenities were lacking, presumably the impact of not having shelters is greater for routes 23 and 111. If the 57 is used primarily as a 9-5 commuter bus, then few people would need to wait at an
outbound stop for service; they need only step off the bus and walk home. In the case of the 23 and 111, riders rely on the service not only to com-mute to and from work, but also to get around within the communities of Dorchester and Chelsea. In this sense having to wait at a stop on either di-rection of the route is a reality for many riders.
Overall, when placing the data col-lected within the overall transit dependency picture of these com-munities, there is much room for im-provement in bus service all around. For the most part, on-board assign-ment and amenities appear to be the least problematic area of ser-vice. However, the need for shelters along routes is still present in terms of off-board amenities. Most buses did poorly in meeting our crowding standards and are far from an ideal situation where every passenger gets the seat that they pay for. Most prob-lematic, however, is the poor perfor-mance with regards to timeliness and frequency. There are clearly barriers that buses face to overcome this poor performance such as more efficient boarding of passengers and dealing with traffic. Our next section will outline some recommendations for potential policy solutions to help the buses, and the MBTA system in gen-eral, better meet standards of ideal service.
59

RecommendationsWe’ve identified several ways the MBTA can improve
its bus service and give people the confidence and convenience they need in a bus system.
Our Methods:Snapshot of Service and Changes for the FutureBy collecting data on bus service qual-ity, our hope was to give a voice for bus riders in Greater Boston. While we agree it may not seem the most comprehensive set of data, it pro-vides us with something important, a snapshot of service. This small set of data clearly shows that communities use the bus differently and that more data is needed to understand when and why. Our intention is to provide a framework with which other groups, TRU in particular, can utilize to pro-vide a larger and ongoing analysis. While our team was limited with time and resources, we feel TRU will be able to use the data to create a more comprehensive picture of service. We feel that they will be able to collect multiple data to evaluate time peri-ods for each of the routes that will help them illustrate this picture. The report card we feel is a vital piece to presenting the results of the bus ser-vice evaluation. While the methodol-ogy of this grading is detailed and the results of each evaluated variable are consistent with each other, much of the system is improvised. However, the grading system used in the report card can be improved by making fur-ther observations.
Charlie Card Data for Each Route Should Be EvaluatedWhere’s Charlie? The Charlie Card, MBTA’s fare system, came in January 2007, brought on a new and higher
fare structure. However, informa-tion on Charlie was not integrated into our subsidy analysis. The sub-sidy analysis is based on information from the 2006 MBTA Service Delivery Plan which is the most current infor-mation regarding MBTA subsidies per passenger. However, it is out of date as of the fare hike of January 2007. The data assumed average fare col-lection figures that were based on a system-wide average. While the fare at the time of the delivery plan was $0.90, average fare paid was shown to be $0.60 due to the use of pass-es. Based on observations and an-ecdotal evidence, it is reasonable to expect that this underestimated the average fare paid in communi-ties such as Dorchester, Mattapan and Roxbury who may pay full fare more frequently. It is expected that the new CharlieCard automated fare col-lection will provide a more accurate picture of subsidy per passenger per route. A new subsidy analysis should be conducted at this time. We also highly recommend that TRU include an observation of whether people are paying with cash, CharlieTickets, or Charlie Cards since that impacts how much they pay. For those paying with Charlie Cards, a breakdown of those who use a monthly pass verses deduct a general monetary amount would be beneficial to determine the monetary impact on riders.
60

MBTA Service:Prioritize Bus Service by Commu-nity NeedsWe’ve identified several ways the MBTA can improve its bus service and give people the confidence and con-venience they need in a bus system. Based on our snapshot of service, sev-eral things became visible- bus riders needs often relate to the communi-ty they reside in. Simply increasing buses during traditional peak times is not the right prescription. The MBTA’s own evaluation of the service must expand to include other criteria to evaluate its objectives. Where tradi-tional buses do not seem to meet the communities’ needs, utilize Bus Rap-id Transit. While changes are associ-ated with increased costs, we realize that the MBTA is drowning in debt. We highly support relieving the MBTA of its debt. Ultimately, this is most im-portant way any of these changes can be made.
Increase Service in Non-Peak TimesWhere it fails particularly is deter-mining when to provide increased service. Increasing the frequency of buses during peak AM and PM week-day rush hours simply does not meet the need of all riders. Our observa-tions have shown that service in non-peak periods is lacking and tends to promote crowding. This was demon-strated particularly in the data we collected in transit-dependent com-munities of Roxbury and Dorchester. If the MBTA were to more closely analyze the needs of the communi-ties it served, it would notice that in transit-dependent communities need frequent service throughout the day. The MBTA service hours should be ex-panded beyond their current limits of (approximately) 5:30am to 1am to
better serve those who have non-tra-ditional work shifts during the night. Overall, the MBTA needs to figure out who its riders really are. Analyzing the CharlieCard usage data over time will provide one tool for MBTA to de-termine when riders use the bus the most.
Use Service Standard Criteria that MatterThe MBTA is due for a revamping of its evaluation procedures. While we ap-plaud the MBTA for evaluating its ser-vice, several key factors are missing from its current process. The evalua-tions should consider factors such as crime, pollution levels and safety is-sues where they provide service. We would ask that the On the Move coali-tion’s standards of measuring mobil-ity be considered seriously. Factors such as vehicle load, scheduled fre-quency, schedule adherence, vehicle assignment, transit amenities, and mobility do not consider the need of environmental justice communities. We ask that equal transit times based on distance be attained regardless of the communities being served. The MBTA should make more effort to consider this standard. Current bus routes also need to be evaluated as to whether they serve this purpose. An additional question to be asked of the current bus routes is whether they are enough.
Lifestyle issues should take into ac-count the transit-dependent nature of certain communities who use the bus to perform daily errands such as shopping and child care. The crowd-ing standards should be reevaluated in terms of the significant amounts of shopping bags and strollers which are brought onto the bus. Custom-
61
ers who prefer to use bicycles along with public transportation should also be considered with the expansion of bike racks on buses.
Use Elements of Bus Rapid TransitBuses tend to be late as a result of traffic congestion. The MBTA may at-tempt to correct issues of timeliness and frequency by providing more buses. However, with traffic conges-tion there is only so much effect that adding extra traffic can accomplish. Therefore it is recommended that the MBTA experiment with elements of Bus Rapid Transit techniques in problem areas of service. Bus Rapid Transit is characterized by the Fed-eral Transit Administration as provid-ing bus service with elements of rapid transit such as subways and light rail, notably the separation of the mode’s vehicles from traffic. Providing bus-only lanes in key congestion areas may allow its buses to achieve better time performance.
A recommended addition to this change would be to provide informa-tion via signage to riders as to when the next bus is expected. While it is not a cure, by giving priority to buses, it would be a major step in serving transit-dependent communities by giving more credence to their needs.
Debt Relief for the MBTA:The MBTA recently raised its fares in January 2007. This decision was based primarily on a bleak financial outlook as the MBTA must pay a substantial amount of debt payments. However, the MBTA is being forced to shoulder the burden of debts related to the Big Dig highway project. The MBTA is forced to pay for traffic mitigation projects in response to the easier
flow of automobile traffic. Instead of turning on its ridership and increase fares, the MBTA needed to assess the financial constraints of its riders, es-pecially the transit-dependent, and perhaps utilize other means of secur-ing a brighter financial future. It is highly recommended that an MBTA debt relief bill, currently in the Mas-sachusetts legislature, be passed. The focus of a transportation author-ity should be to provide more service to those who need it without making the lives of its riders less financially secure.
Vital to MBTA funding is the Massa-chusetts sales tax which provides a large source of revenue. This has been shown to fluctuate and provide the MBTA with an inconsistent source of funds. Transportation agencies across the US utilize a percentage of the gasoline tax. An increase in the gasoline tax would provide increased funding for the MBTA and an incentive to use public transportation instead of personal automobiles in general. This would have the added potential benefit of removing cars from the roads which frequently ensnarl buses in congestion.
Congestion Pricing:If there is to be any progress to be made with the twin difficulties of operating efficient bus service and transportation in general, conges-tion and funding issues need to be considered. A recommended course of action in this regard is congestion pricing. According to Transport for London, who have implemented this policy on a grand scale, this would in-volve charging a fee on automobiles driving into the congestion area (like-ly downtown and other congested
62
areas) during peak hours of the day. This action would be combined with making public transportation more frequent and efficient to carry those who would not drive. Funds from the charge would fund improvements in bus and rail transportation in the London region (Transport for London, 2007). This source of revenue would be vital to complement the efforts to relieve the MBTA of its mammoth debt.
Congestion pricing has been a proven success in London in fighting conges-tion and raising funds for public trans-portation. This would coincide with Boston Mayor Thomas Menino’s goal of making Boston a national leader in addressing environmental concerns and take it a step in a more mean-ingful direction (Mishra, 2007). New York City’s Mayor Michael Bloomberg has already announced that his city will be taking this step in combina-tion with expanding public transpor-tation options. This is part of a global paradigm shift for urban areas, one in which public transportation plays a vital role. Thus it is highly recom-mended that those who plan trans-portation in Boston pay attention to these events.
63


AppendicesAppendix A: Tables from MBTA Service Delivery Policy
65

66
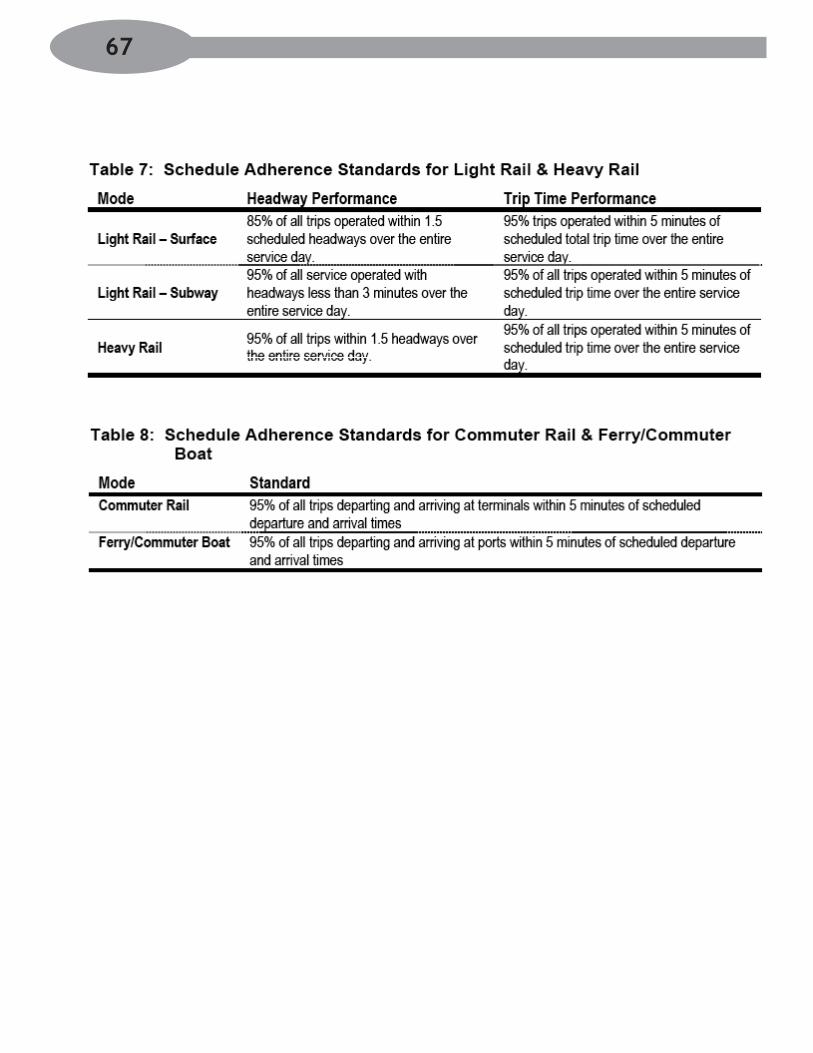
67

68
Appendix B: Route 111 Recommended Changes
Route ���: Woodlawn or Broadway & Park Ave. – Haymarket Station__ MAJOR Change RecommendedRoute ��� provides weekday early morning, AM peak, PM peak and evening service from Broadway & Park Avenue in Revere via Bellingham Square and North Station (Orange Line and Green Line) to Haymarket Station (Orange Line and Green Line) in Boston. Five short trips operate inbound only in the Early AM weekdays from Washington Avenue at Revere Beach Parkway to Haymarket. All day on Saturday and Sunday, and midday on weekdays, Route ��� operates from Woodlawn in Everett to Hay-market.
Route ��� fails the load standard on weekdays, Saturday, and Sunday. Route ��� also fails the schedule adherence standard on weekdays, Saturday, and Sunday. Since the last Service Plan, service changes have been made to alleviate load and schedule adherence problems on the Route ���. However, recent data collected on this route, as well as numerous customer complaints, indicate that growth in ridership has outpaced the increases in service. It is, therefore, recommended that the following additional chang-es be made to improve service on this route weekdays, Saturday, and Sunday.
It is recommended that weekday headways be improved to one bus every 5 minutes on Route ��� between Woodlawn and Haymarket (which is the most heavily used portion of the route) during the Early AM, AM Peak and PM Peak time periods. To accommodate this change, the Route ��� would no longer operate between Woodlawn and Broadway & Park during these time periods. The route had been extended to Broadway & Park in the Spring 200� rating due to an abutter’s concerns, and has attracted some ridership in the extended corridor. The proposed change would create some inconvenience for pas-sengers who currently board between Broadway & Park and Woodlawn; however, they represent a very small portion of the total Route ��� riders, and they would still be served by Route ��0. This change would substantially benefit the majority of current Route 111 riders, as it would reduce vehicle loads and should improve schedule adherence. It is estimated that there would be a net gain of �22 riders from the increased service, while the hours and miles of operation would remain essentially the same.
On Saturday, it is recommended that one trip be added at the beginning of the service day (at 5:00 AM), and that a vehicle be added from 5:00 to 9:00 AM, which would improve the headways from �5 minutes to �2 minutes during these hours. In addition, a vehicle would be added from noon until 4:00 PM, which would improve the headways from �2 minutes to �0 minutes during these hours. These changes would add eight hours and close to 88 miles of operation on Saturdays, would attract approximately 283 new passengers, and would ease the passenger load problems on the existing Saturday service.
Sunday service was improved on Route ��� during the Summer 2004 rating; however, passenger data that were collected shortly thereafter showed continuing load problems. It is, therefore, recommended that on Sunday a vehicle be added from 2:00 PM until 7:00 PM, which would improve the headways from 16 minutes to 12-13 minutes during these hours. This change would add five hours and 67 miles of operation on Sundays, would attract approximately 220 new passengers, and would ease the passenger load problems on the existing Sunday service.
69

Appendix C: GIS Maps (courtesy Hedda Steinhoff)
70
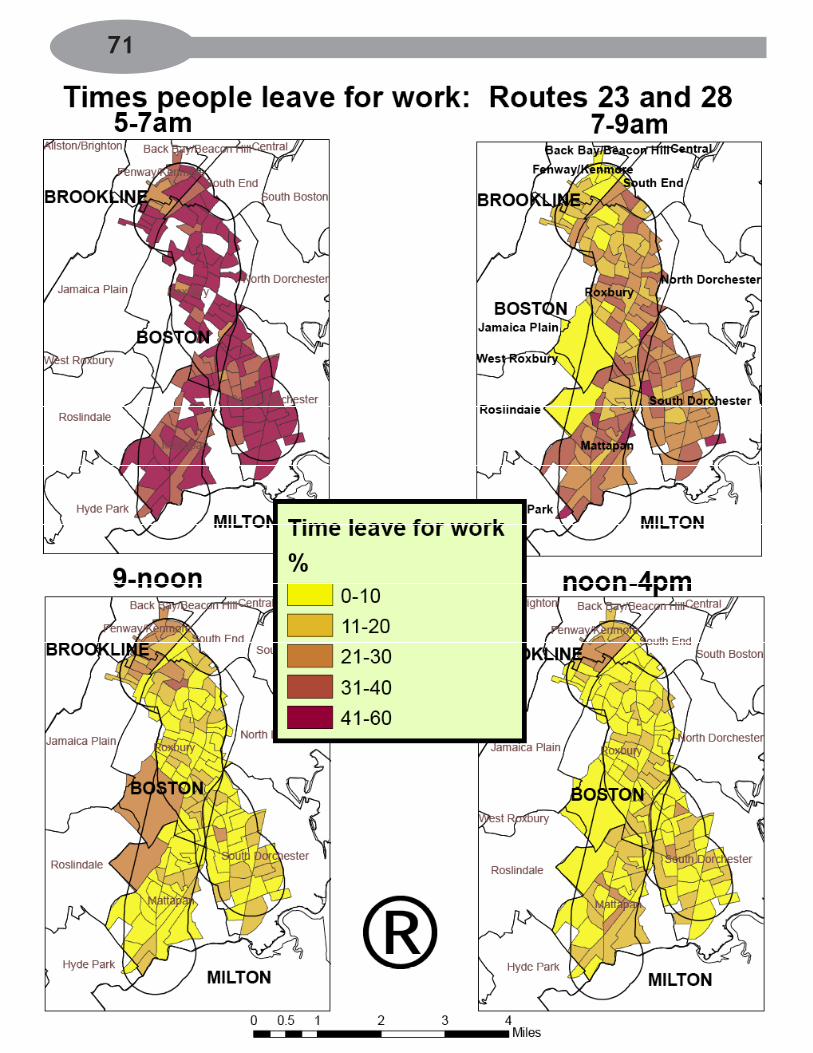
71
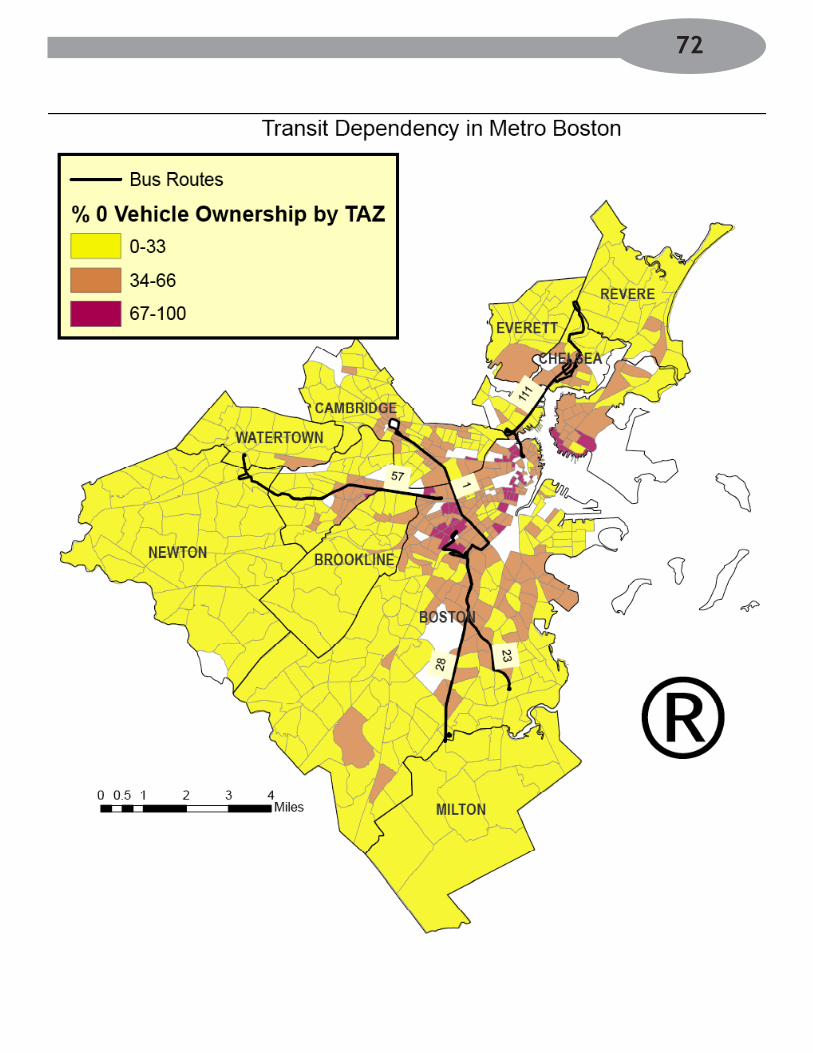
72
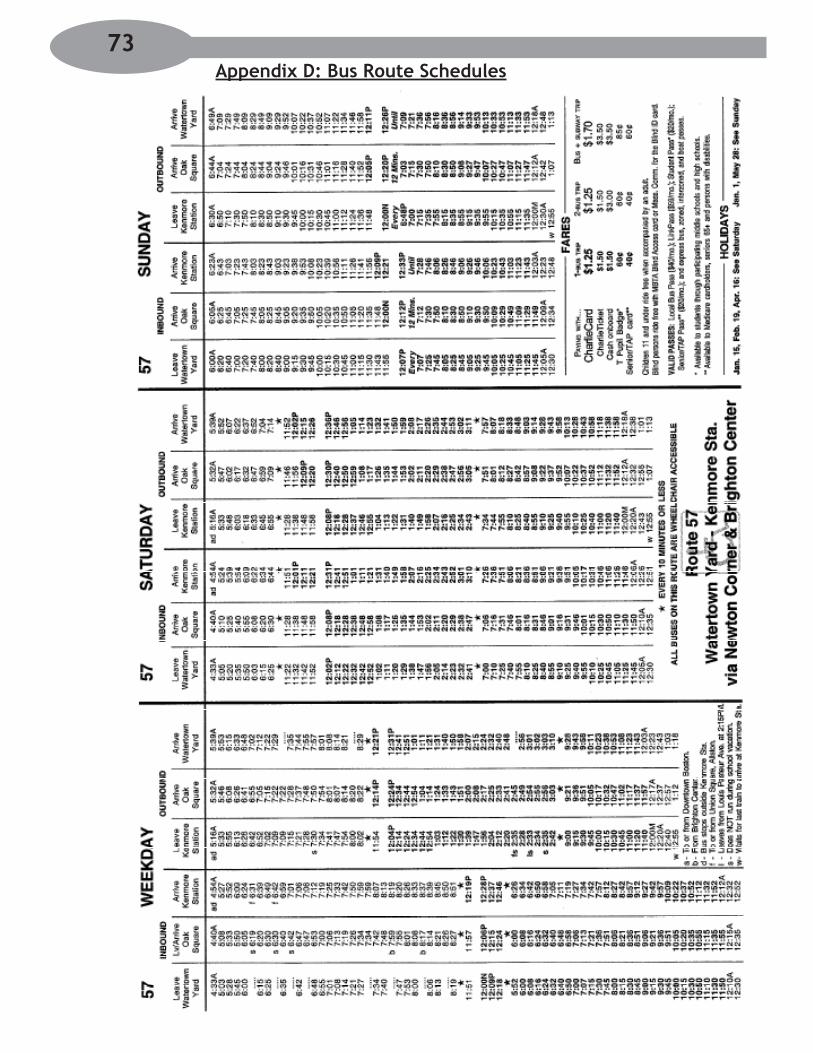
Appendix D: Bus Route Schedules 73

74

75
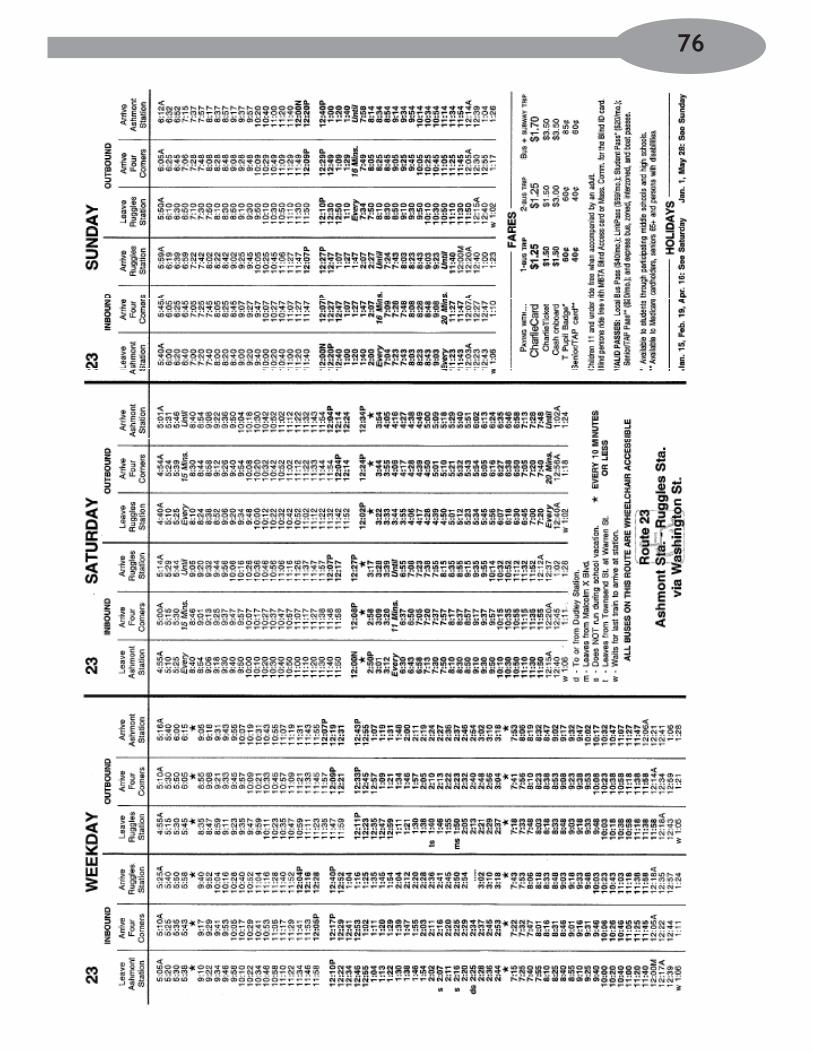
76

77
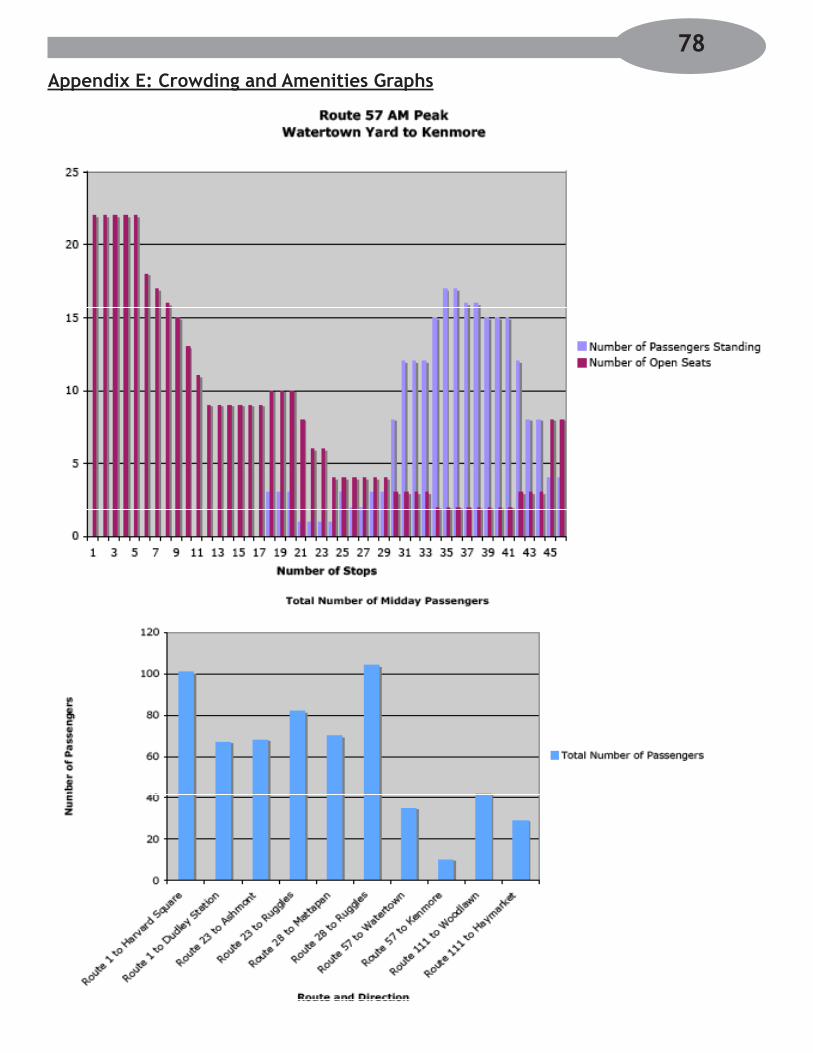
Appendix E: Crowding and Amenities Graphs
78
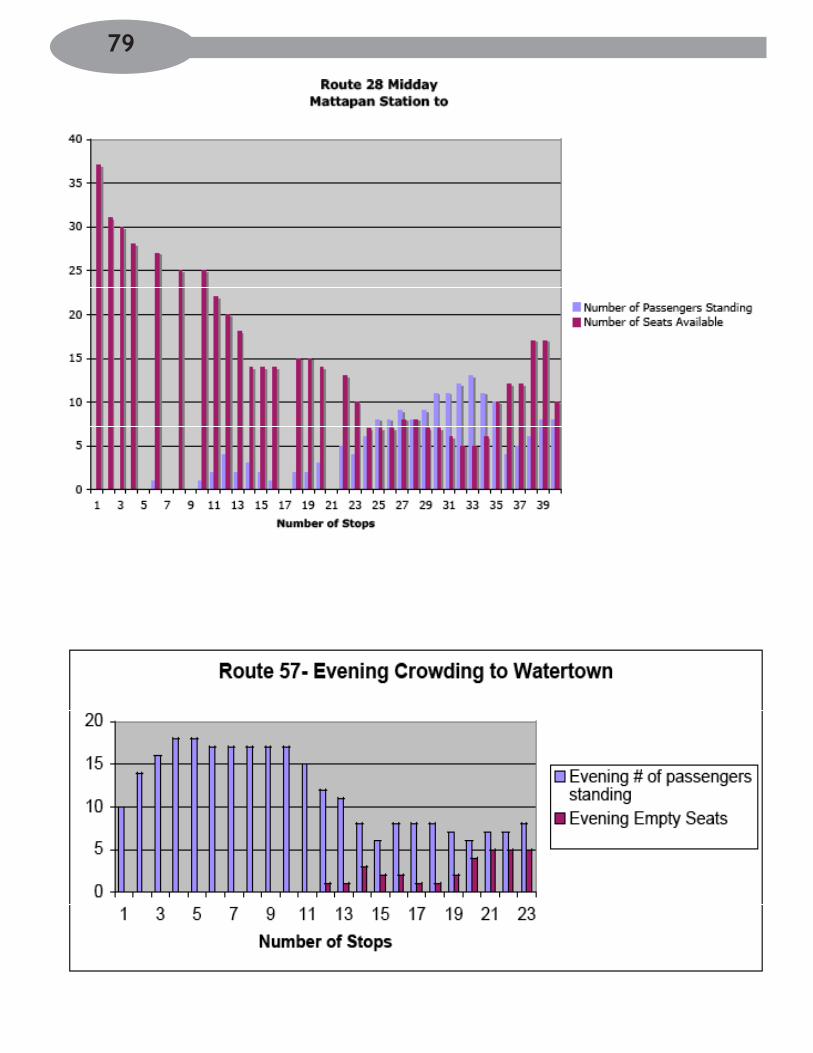
79
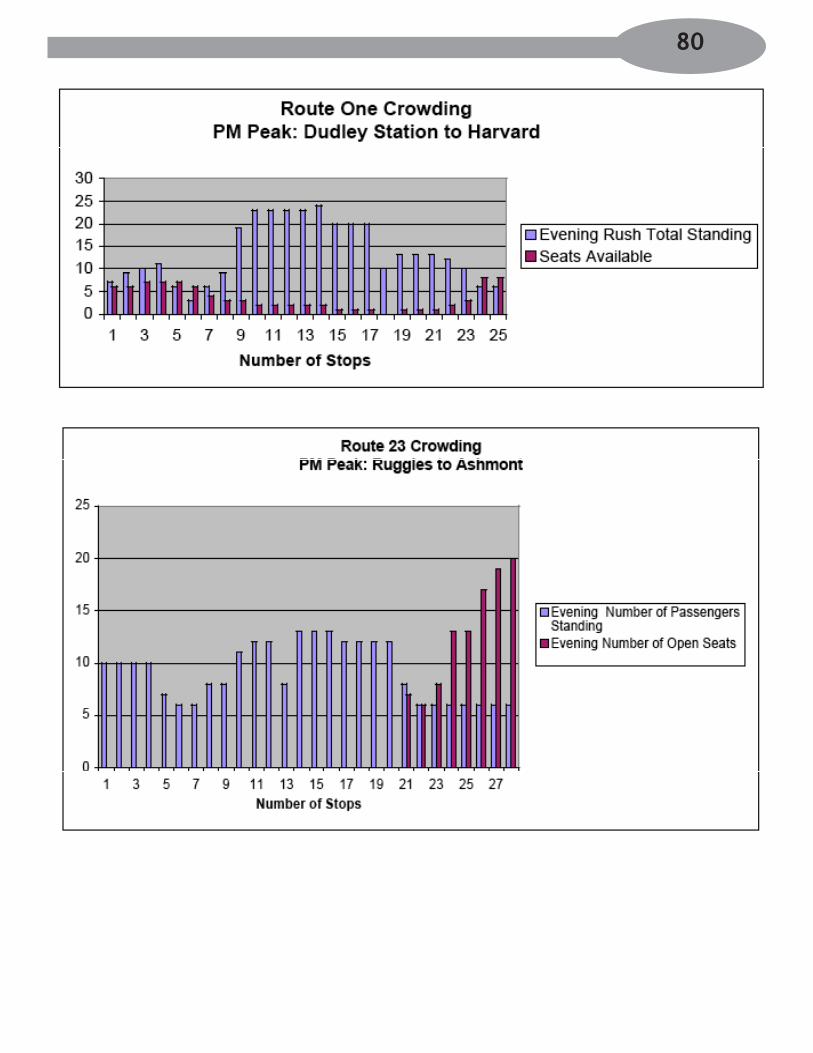
80
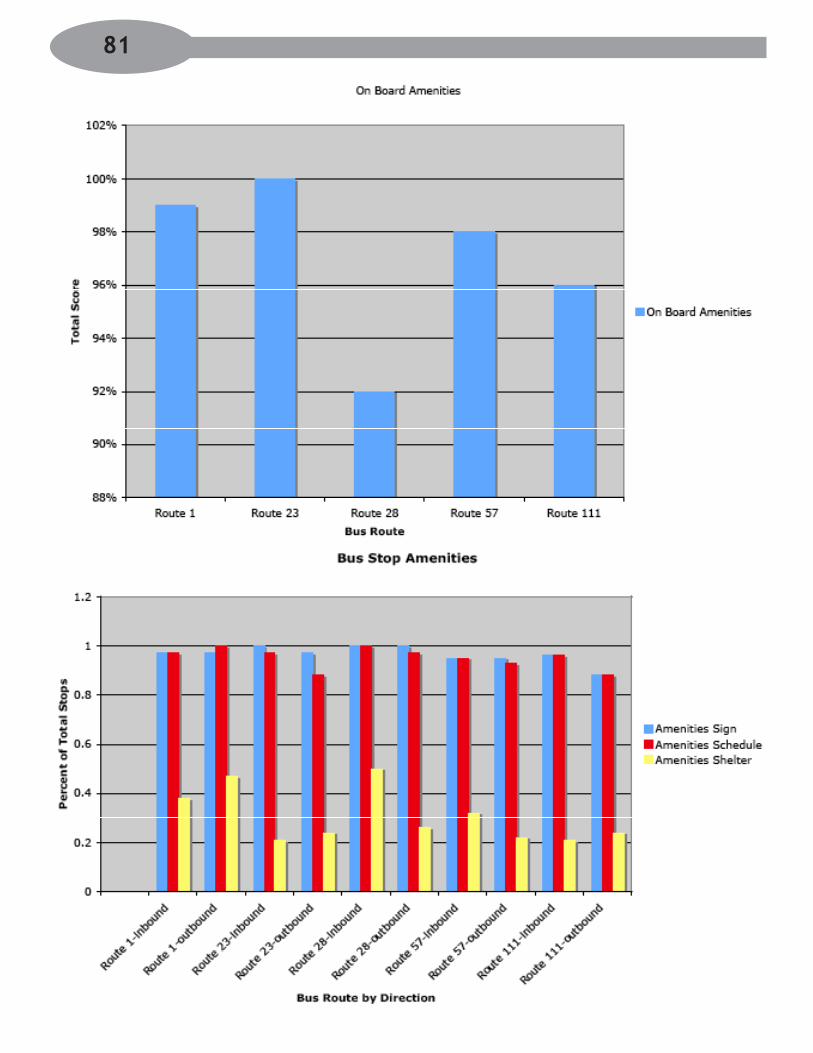
81
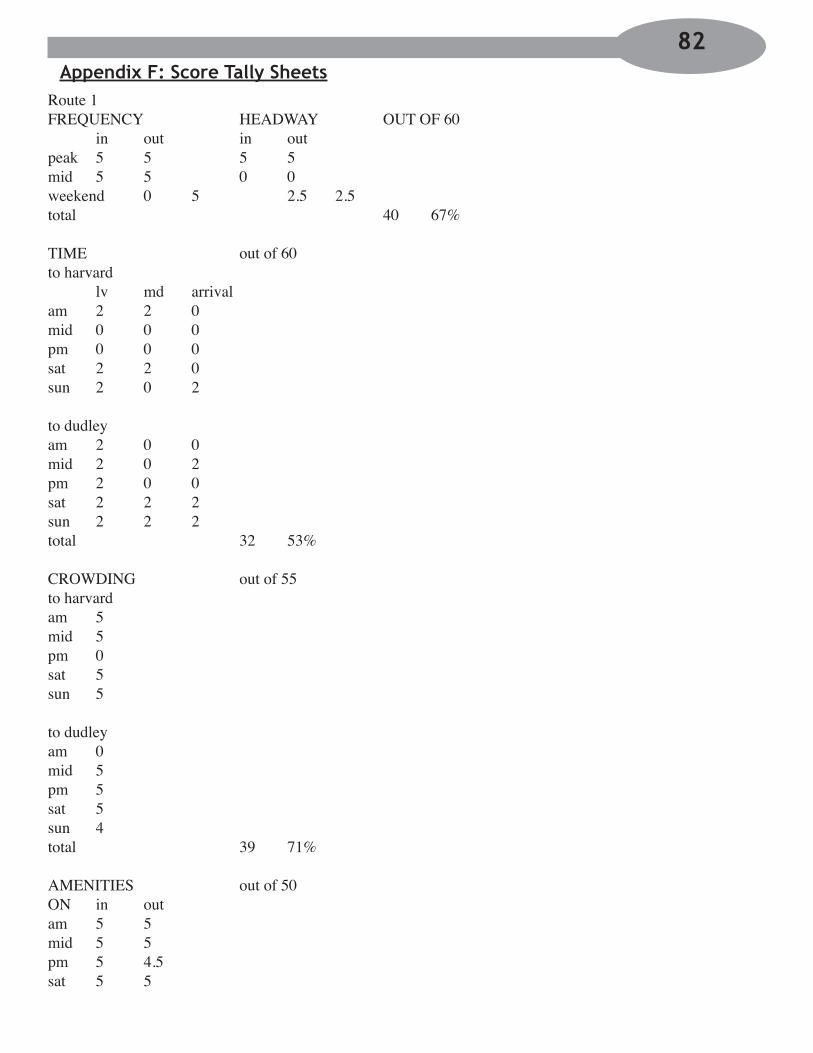
Appendix F: Score Tally SheetsRoute � FREQUENCY HEADWAY OUT OF 60 in out in out peak 5 5 5 5 mid 5 5 0 0 weekend 0 5 2.5 2.5 total 40 67% TIME out of 60 to harvard lv md arrival am 2 2 0 mid 0 0 0 pm 0 0 0 sat 2 2 0 sun 2 0 2 to dudley am 2 0 0 mid 2 0 2 pm 2 0 0 sat 2 2 2 sun 2 2 2 total 32 53% CROWDING out of 55 to harvard am 5 mid 5 pm 0 sat 5 sun 5 to dudley am 0 mid 5 pm 5 sat 5 sun 4 total 39 7�% AMENITIES out of 50 ON in out am 5 5 mid 5 5 pm 5 4.5 sat 5 5
82

sun 5 5 49.5 99% OFF in out out of 50 sign 7.8 7.8 schedule 8 7.8 shelter 3.8 3.� 38.3 77% TOTAL SCORE �98.8 72% 23 FREQUENCY HEADWAY OUT OF 60 in out in out peak 5 5 5 0 mid 5 5 0 2.5 weekend 5 5 2.5 0 TOTAL 40 67% TIME out of 60 TO ASHMONT lv md arrival am 2 2 2 mid 0 0 2 pm 2 0 2 sat 2 2 2 sun 2 2 0 TO RUGGLES am 2 2 0 mid 2 2 0 pm 2 2 2 sat 2 2 0 sun 2 0 2 TOTAL 44 73% CROWDING out of 55 TO ASHMONT am 5 mid 5 pm 0 sat 5 sun 5 TO RUGGLES am 5
83
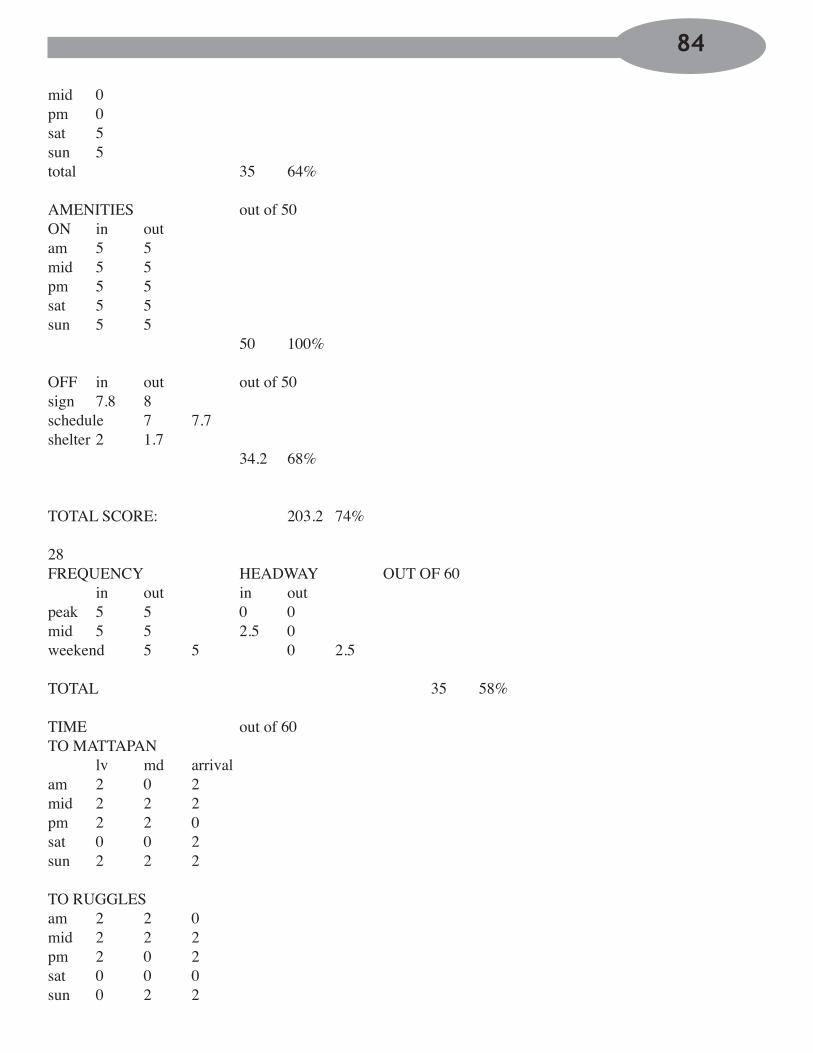
mid 0 pm 0 sat 5 sun 5 total 35 64% AMENITIES out of 50 ON in out am 5 5 mid 5 5 pm 5 5 sat 5 5 sun 5 5 50 �00% OFF in out out of 50 sign 7.8 8 schedule 7 7.7 shelter 2 �.7 34.2 68% TOTAL SCORE: 203.2 74% 28 FREQUENCY HEADWAY OUT OF 60 in out in out peak 5 5 0 0 mid 5 5 2.5 0 weekend 5 5 0 2.5 TOTAL 35 58% TIME out of 60 TO MATTAPAN lv md arrival am 2 0 2 mid 2 2 2 pm 2 2 0 sat 0 0 2 sun 2 2 2 TO RUGGLES am 2 2 0 mid 2 2 2 pm 2 0 2 sat 0 0 0 sun 0 2 2
84

TOTAL 40 67% CROWDING out of 55 TO MATTAPAN am 5 mid 5 pm 5 sat 5 sun 5 TO RUGGLES am 5 mid 5 pm 5 sat 0 sun 5 total 45 82% AMENITIES out of 50 ON in out am 4 4 mid 5 5 pm 5 5 sat 4 4 sun 5 5 TOTAL 46 92% OFF in out out of 50 sign 8 8 schedule 8 7.8 shelter 4 2.5 TOTAL 38.3 77% TOTAL SCORE: 204.3 74% 57 FREQUENCY HEADWAY OUT OF 60 in out in out peak 5 5 2.5 2.5 mid 5 5 2.5 0 weekend 5 5 0 0 TOTAL 37.5 63% TIME out of 60
85
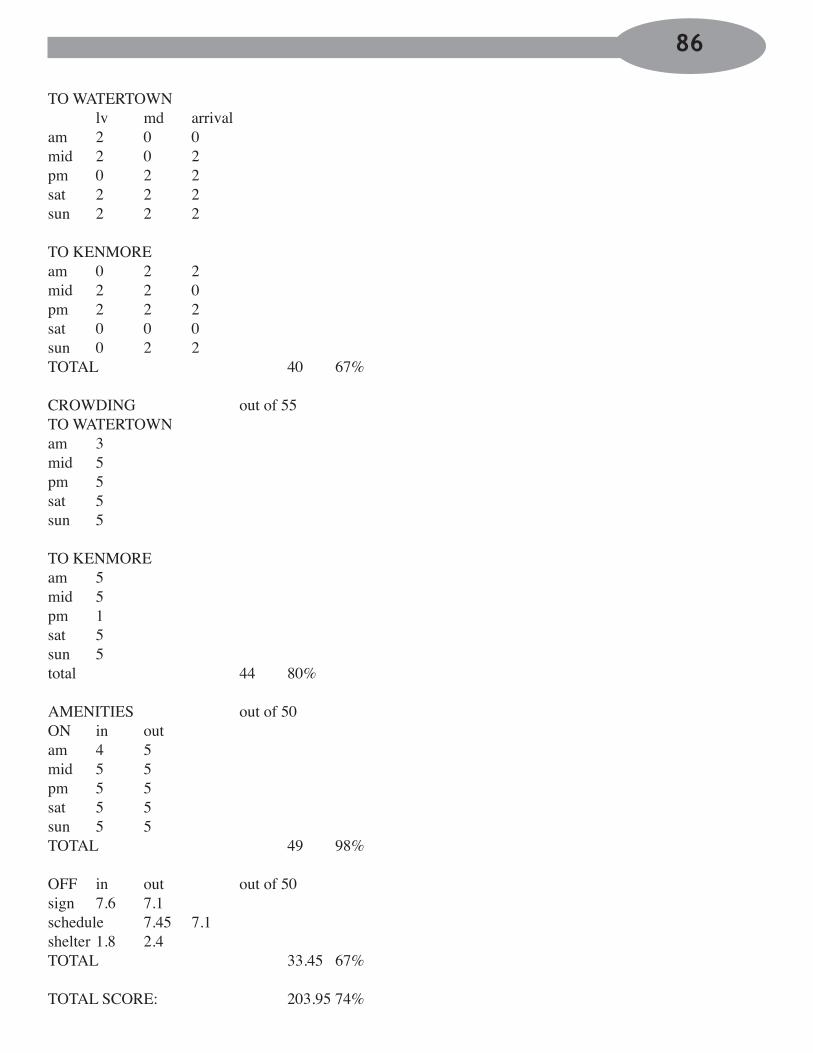
TO WATERTOWN lv md arrival am 2 0 0 mid 2 0 2 pm 0 2 2 sat 2 2 2 sun 2 2 2 TO KENMORE am 0 2 2 mid 2 2 0 pm 2 2 2 sat 0 0 0 sun 0 2 2 TOTAL 40 67% CROWDING out of 55 TO WATERTOWN am 3 mid 5 pm 5 sat 5 sun 5 TO KENMORE am 5 mid 5 pm � sat 5 sun 5 total 44 80% AMENITIES out of 50 ON in out am 4 5 mid 5 5 pm 5 5 sat 5 5 sun 5 5 TOTAL 49 98% OFF in out out of 50 sign 7.6 7.� schedule 7.45 7.� shelter �.8 2.4 TOTAL 33.45 67% TOTAL SCORE: 203.95 74%
86

��� FREQUENCY HEADWAY OUT OF 60 in out in out peak 5 0 0 5 mid 0 0 2.5 0 weekend 0 5 0 0 TOTAL �7.5 29.�7% TIME out of 60 TO HAYMARKET lv md arrival am 2 2 2 mid 2 2 2 pm 2 2 2 sat 2 0 0 sun 2 2 2 TO WOODLAWN am 2 2 2 mid 2 2 2 pm 2 2 0 sat 0 0 0 sun 2 2 0 TOTAL 46 76.67% CROWDING out of 55 TO HAYMARKET am 5 mid 5 pm 5 sat 5 sun 5 TO WOODLAWN am 5 mid 5 pm 3 sat 5 sun 5 total 48 87.27% AMENITIES out of 50 ON in out am 5 5
87
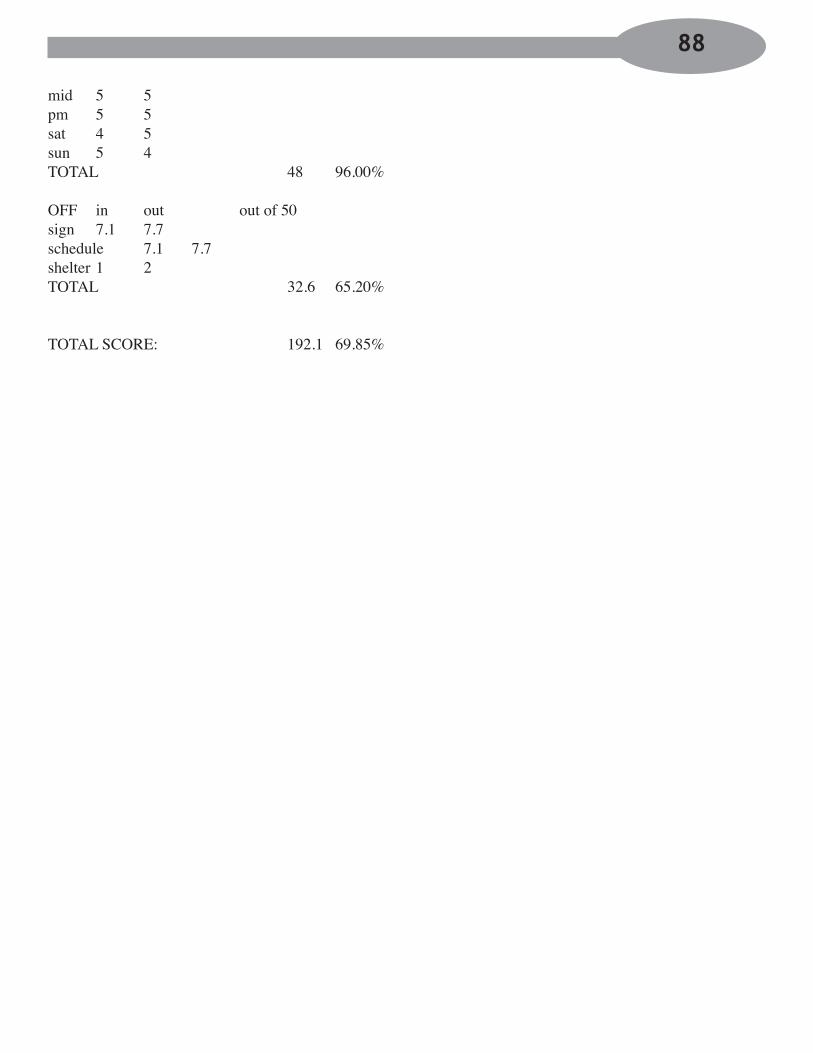
mid 5 5 pm 5 5 sat 4 5 sun 5 4 TOTAL 48 96.00% OFF in out out of 50 sign 7.� 7.7 schedule 7.� 7.7 shelter � 2 TOTAL 32.6 65.20% TOTAL SCORE: �92.� 69.85%
88

Appendix G: Signed Memorandum of Understanding
89

90
91
92

References 93
American Public Transportation Association (2006). Public Transportation Fact Book – 57th Edition. p. 11. Accessed from: http://www.apta.com/research/stats/factbook/index.cfm
An Act Improving the Finances of the Massachusetts Bay Transportation Authority. S. 2029. Massachusetts Senate. Accessed from: http://www.mass.gov/legis/bills/senate/185/st02/st02029.htm
Associated Press. “Feds reject discrimination claim against MBTA”. Boston Globe. 6 December 2006. Accessed from: http://www.boston.com/news/local/massachusetts/articles/2006/12/02/feds_reject_discrimina-tion_claim_against_mbta/
Bluestein, Greg (2004). “Work continues to bridge gap between blacks, environmental groups”. The Associated Press State & Local Wire. August 28, 2004. Accessed from: Lexis-Nexis: Tufts University, Tisch Library, Medford MA.
The Boston Indicators Project (2004). “7.4.2 Asthma hospitalization rates by race/ethnicity, age and Boston neighbor-hood”. The Boston Indicators Project 2004. Accessed from: http://www.tbf.org/indicators2004/publichealth/indicators.asp?id=2339
The Boston Indicators Project (2004). “Transportation”. The Boston Indicators Project 2004. Accessed from: http://www.tbf.org/indicators2004/transportation/overview.asp
Boston Metropolitan Planning Organization (2007). “Environmental Justice Definition”. Regional Equity. Accessed 15 March 2007 from: http://www.bostonmpo.org/bostonmpo/envjust/ej.htm
Boston Transportation Department (2002). Access Boston 2000-2010. p. 12. Accessed from: http://www.cityofboston.gov/transportation/accessboston/pdfs/front.pdf
Bullard, Robert D.; Johnson, Glenn S. & Torres, Angel O. (2004). “Dismantling Transit Racism in Metro Atlanta”. Highway Robbery – Transportation Racism & New Routes to Equity. Cambridge, MA: South End Press.
Epstein, Lee & Walker,Thomas G. (2004). “Plessy v. Ferguson”. Constitutional Law for a Changing America – Rights, Liberties and Justice. 5th ed. pp. 661-665.
Garcia, Robert (2000). “Mean Streets”. Forum for Applied Research and Public Policy. Vol. 15, No. 3. pp. 75-81.
Irons, Peter (2006). A People’s History of the Supreme Court: the Men and Women Whose Cases and Decisions Have Shaped Our Nation. New York: Penguin Books. p. 213
Levy, Leonard and Philips, Harlan (1951). “The Roberts Case: Source of the “Separate but Equal” Doctrine”. The American Historical Review. Vol. 56, No. 3. (Apr., 1951), pp. 510-518. Accessed from: http://www.libary.tufts.edu/ezproxy/ezproxy.asp?LOCATION=http://links.jstor.org/sici?sici=0002-8762%28195104%2956%3A3%3C510%3ATRCSOT%3E2.0.CO%3B2-J
Litman, Todd (2005). Evalutating Transportation Equity – Methods for Incorporating Distributional Impacts into Transportation Planning. Victoria BC: Victoria Transport Policy Institute. p. 2. Accessed from: www.vtpi.org/equity.pdf
McKinnon, Anne L. (1988). Perspectives on a transportation planning problem: Case Study, The Washington Street Corridor. Tufts University, Medford, MA.
Marin, Jeremy and Terrell, Robert (2005). MBTA’s Silver Line - Taxpayers Get Less for More. Sierra Club, Spring 2005. Accessed from: http://www.sierraclubmass.org/pdf/slreport.pdf
Massachusetts. Executive Office of Environmental Affairs (2002). Environmental Justice Policy of the Executive Office of Environmental Affairs. Accessed from: http://www.mass.gov/envir/ej/pdf/EJ_Policy_Eng-lish_Full_Version.pdf
Massachusetts Bay Transportation Authority (2007). Customer Bill of Rights. Accessed 11 February 2007 from: http://

94www.mbta.com/customer_support/customer_bill_of_rights/
Massachusetts Bay Transportation Authority (2006). Key Bus Routes Improvement Program. Accessed from: http://www.livablestreets.info/files/nov06_MBTA_keybusroutesimprovementprogram.pdf
Massachusetts Bay Transportation Authority (2006). Preliminary 2006 Service Plan. Accessed from: http://www.mbta.com/about_the_mbta/document_library/?lid=510&name=Service%20Plan
Mishra, Raja (2007). “Mayor aims to cut city’s greenhouse emissions”. Boston Globe. 13 April 2007. Accessed from: http://www.boston.com/news/local/massachusetts/articles/2007/04/13/mayor_aims_to_cut_citys_greenhouse_emissions/
New York PIRG Straphanger Campaign (2006). State of the Subways Report Card. Accessed from: http://www.straphangers.org/statesub06/index.html
On the Move: Greater Boston Transportation Justice Coalition (2002). Addendum to the 2002 Transportation Plan. On file with Alternatives for Community and Environment (ACE).
Otake, Masaya (2002). Analysis and Strategies for Transit Justice in Greater Boston. Harvard University. On file with Kennedy School of Government and Alternatives for Community and Environment.
Plessy v. Ferguson, 163 U.S. 537 (1896)
Seymore, Sean B (2005). “Set the Captives Free!: Transit Inequity in Urban Centers, and the Laws and Policies which Aggravate the Disparity”. George Mason University Civil Rights Law Journal. Vol. 16. No. 1. pp. 57 - 114. Accessed from: Lexis-Nexis. Tufts University Tisch Library, Medford, MA. 13 March 2007.
Transport for London (2006). “Central London Congestion Charging Impacts Monitoring”. Transport for London. Vol. 4, June 2006. Accessed from: http://www.tfl.gov.uk/assets/downloads/Fourth-Annual-Report-Overview.pdf
United States Census data (2000): Allston/Brighton. Accessed from: http://www.cityofboston.gov/bra/pdf/ResearchPublications//578All-Bright.pdf
United States Census data (2000): Cambridge. Accessed from:http://www.state.ma.us/dhcd/iprofile/049.pdf
United States Census data (2000): Chelsea. Accessed from: http://www.state.ma.us/dhcd/iprofile/049.pdf
United States Census data (2000): Fenway/Kenmore. Accessed from:http://www.tbf.org/indicators2004/geography/geography.asp?id=2847
United States Census data (2000): Mattapan. Accessed from:http://www.cityofboston.gov/bra/pdf/ResearchPublications//583Mattapan.pdf
United States Census data (2000): Roxbury. Accessed from: http://www.cityofboston.gov/bra/pdf/ResearchPublications//580Roxbury.pdf
United States Census data (2000): North Dorchester. Accessed from: http://www.cityofboston.gov/bra/pdf/ResearchPublications//581NDorch.pdf
United States Census data (2000): South Dorchester. Accessed from: http://www.cityofboston.gov/bra/pdf/ResearchPublications//582SDorch.pdf
United States Census data (2000): Watertown. Accessed from: http://www.mass.gov/dhcd/iprofile/321.pdf
United States Constitution. Amendment XIV. Section 1.
Uranga, Rachel (2006). “Court Lifts MTA Restraints; Critics Fear Action Could Bring Fare Hikes and Service Cuts by Agency”. Daily News of Los Angeles. N1. Accessed from: Lexis-Nexis. Tufts University Tisch Library, Medford, MA. 10 March 2007.


![RR [ ITALY ] RR [ ITALY ] RR [ ITALY ] RBT - V 610 RBT - V ...RPM - 3108 RBT - 18 CP RBT - 22 CP 1 1/4" [ 32mm] Plastic M18x1 Aerator M22x1 Aerator S' trap in Black [ Basin ] [ kitchen](https://img.pdfslide.us/doc/110x75/602c2521ce9a0870707587b7/rr-italy-rr-italy-rr-italy-rbt-v-610-rbt-v-rpm-3108-rbt-.jpg)