Embed Size (px)
Citation preview
Draft Document for Review October 23, 2014 2:10 pm 5141paper.fm
Redpaper
Making Smart Storage Decisions for DB2 in a Flash and SSD World
The tight integration that IBM DB2® for z/OS® has with the IBM System z® architecture and the z/OS environment creates a synergy that allows DB2 to use advanced z/OS platform functions.
This IBM® Redpaper™ publication provides a brief review of storage hard technology and the latest innovation in flash technology. It explains how solid-state drives (SSD) and High-Performance Flash Enclosures (HPFE) can contribute to the performance improvements of DB2 applications. It then provides a guide through disk configuration alternatives, which include Flash, SSDs, and spinning disks. It also explains how automated storage tiering, such as IBM Easy Tier®, can use the cost of flash storage to provide high value at minimal cost. This paper helps you to understand how performance improvements of storage technology can translate into better application performance by using IBM integration of hardware and software functions. The audience for this paper is anyone interested in the relationship between DB2 and storage performance and anyone who is looking for advice on deploying IBM storage advancements in DB2 environments.
This paper includes the following major topics:
� Introduction� Recent history of storage hardware technology enhancements� Easy Tier with SSD� High-Performance Flash Enclosure� DASD performance monitoring with multi-tier storage� Online DB2 REORG� Summary
Jeff BergerLee LaFrese
© Copyright IBM Corp. 2014. All rights reserved. ibm.com/redbooks 1
5141paper.fm Draft Document for Review October 23, 2014 2:10 pm
Introduction
SSDs have been available for IBM enterprise storage since 2009. Jeffrey Berger and Paolo Bruni first discussed this topic in an IBM Redguide™ publication in April 2009.1 In addition to the performance benefits, SSDs are also a much greener type of device than spinning disks, because they consume less energy and create less heat.
Much has changed in the world of storage since 2009. This year alone IBM has made two new capacity sizes for SSD available and has introduced an alternative type of flash storage called High-Performance Flash Enclosures (HPFE). IBM currently supports the following disk types in the DS8870 storage control unit:
� Flash (HPFE) and solid state
– 400 GB Flash FDE capable– 200/400/800 GB SSD FDE capable– 1.6 TB SSD FDE capable (R7.4 LIC required)
� Enterprise
– 146/300 GB 15,000 RPM FDE capable– 600 GB/900 GB/1.2 TB 10,000 RPM FDE capable– 600 GB 15,000 RPM FDE capable (R7.4 LIC required)
� Nearline
– 3 TB and 4 TB 7,200 RPM FDE capable
All disks are encryption capable. IBM classifies the disks into three classes or tiers. The fastest tier contains flash storage or SSDs. While SSDs have been available in IBM storage since 2009, HPFE were introduced in 2014. Compared to SSDs, HPFE improves random write I/O performance, while allowing you to reduce cost by achieving a higher I/O access density in a smaller footprint.
The next two tiers consist of the more traditional spinning disks. Enterprise storage is where you might store the majority of your active data bases. These can spin at either 15,000 RPM or a slower 10,000 RPM. With 10,000 RPM, you can save cost, but your I/O response times will be higher. In addition, these disks can handle roughly two-thirds the IOPS of the 15,000 RPM variety.
Finally, the nearline drives spin at a rate of only 7,200 RPM and have performance characteristics that are intermediate between enterprise class disk storage and tapes. Nearline disks are generally too slow to be used for random I/O, but they perform sequential I/O well, and thus they are good for DB2 image copies and archive log data sets.
With so many choices for configuring storage, customers can be confused as to what option is best for them. This paper takes a close look at SSDs and HPFE and attempts to walk you through the various disk configuration alternatives to help you to make a more informed decision about what type of storage to purchase and how to configure it.
We discuss questions such whether to go with an All-Flash solution or choose a hybrid solution. If you choose a hybrid solution, should you use a storage tiering solution, such as IBM Easy Tier? We include thoughts about performance monitoring, including examples using IntelliMagic Vision. We specifically examine how online REORGs with DB2 for z/OS are affected by this new hardware technology and address questions, such as will REORG cause the performance to become worse if you use Easy Tier? Or do you need to do REORGs if you purchase SSD or Flash?
1 Ready to Access DB2 for z/OS Data on Solid-State Drives, REDP-4537, which is available at:http://www.redbooks.ibm.com/abstracts/redp4537.html?Open
2 Making Smart Storage Decisions for DB2 in a Flash and SSD World
Draft Document for Review October 23, 2014 2:10 pm 5141paper.fm
Recent history of storage hardware technology enhancements
This section reviews technology advances that were introduced between 2009 and 2013, starting with IBM hardware enhancements.
In 2009, IBM and other storage vendors introduced SSDs for enterprise storage subsystems, such as IBM DS8000®. These SSDs were essentially a more reliable form of drives that were being used in consumer grade personal computers. No real changes were made to the design or architecture of the storage systems to accommodate these new drives. Instead, SSDs were simply inserted as though they were faster and more capable hard drives. This early generation of SSDs had low latency and high input/output operations per second (IOPS) for small I/Os but were not much better than hard drives when it came to throughput-oriented workloads. Thus, selecting the workloads that paired best with SSDs was both art and science.
Whereas the I/O response time for a 4 KB read from 15,000 RPM spinning disk might achieve response times of 4 milliseconds, an SSD in a DS8870 could achieve response times that were 10 times faster, and that is only 2.6 times slower than reading a 4 KB record from DS8870 memory (that is cache). The maximum I/O rate of two enclosures of SSD in a DS8870 is limited by the I/O capacity of a single device adapter (DA) pair, which is about 125,000 IOPS. Sub-millisecond response times are achievable, as long as the I/O rate remains below 42,000 IOPS.
Around the same time that SSD emerged into the enterprise system marketplace, IBM introduced High Performance FICON® for System z, known as zHPF. zHPF is both a channel protocol and a programming language that improves the performance efficiency of the channel subsystem. Among the lessons learned was that because SSDs enable higher throughput for the disk subsystem, they cause greater stress on the channel subsystem. Thus, zHPF and SSD are complementary to each other. However, initially in 2009, not all types of DB2 I/Os were supported with zHPF. Initially, the support was limited to DB2 synch I/Os and write I/Os of individual records. Gradually, support for other types of DB2 I/Os were added to zHPF. Today, all DB2 I/Os are supported, provided that the storage is a DS8000 with R6.2 LIC or later and that the processor is at least a z196.
In 2011, IBM introduced List Prefetch Optimizer for its DS8000 storage, which Jeffrey Berger and Paolo Bruni discussed in another IBM Redpaper publication.2 This List Prefetch Optimizer created synergy been DB2 and the storage microcode that significantly improved the performance of DB2 list prefetch I/O. List prefetch I/O is used for disorganized data and indexes or for skip-sequential I/O access patterns. Together, SSD and List Prefetch Optimizer provide for dramatically improved performance for disorganized DB2 data and indexes. List Prefetch Optimizer requires High Performance FICON. Furthermore, z/OS is the only operating system platform to achieve this level of performance, because list prefetch I/O is not supported on other platforms. Thus, DB2 for z/OS with a DS8000 is uniquely positioned to benefit from all these technology enhancements.
Support note: One important type of DB2 I/O that is not yet supported by non-IBM storage devices is DB2 list prefetch.
2 DB2 for z/OS and List Prefetch Optimizer, REDP-4862, which is available at:http://www.redbooks.ibm.com/abstracts/redp4862.html?Open
Making Smart Storage Decisions for DB2 in a Flash and SSD World 3
5141paper.fm Draft Document for Review October 23, 2014 2:10 pm
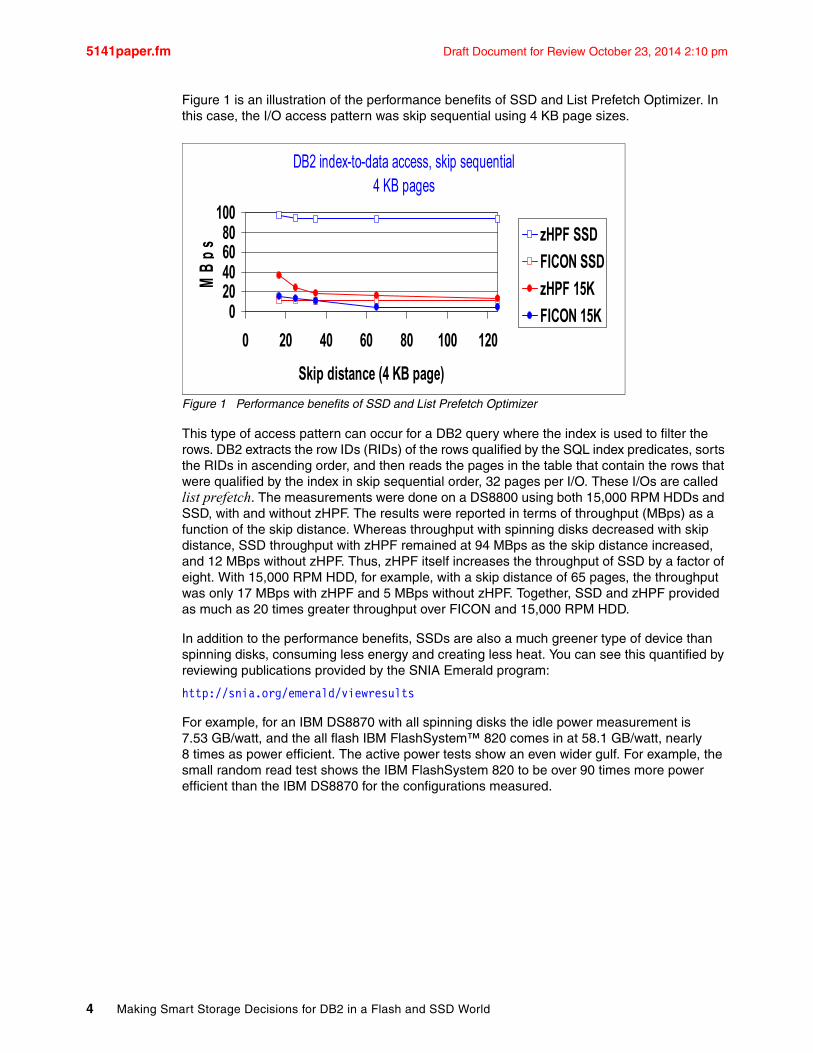
Figure 1 is an illustration of the performance benefits of SSD and List Prefetch Optimizer. In this case, the I/O access pattern was skip sequential using 4 KB page sizes.
Figure 1 Performance benefits of SSD and List Prefetch Optimizer
This type of access pattern can occur for a DB2 query where the index is used to filter the rows. DB2 extracts the row IDs (RIDs) of the rows qualified by the SQL index predicates, sorts the RIDs in ascending order, and then reads the pages in the table that contain the rows that were qualified by the index in skip sequential order, 32 pages per I/O. These I/Os are called list prefetch. The measurements were done on a DS8800 using both 15,000 RPM HDDs and SSD, with and without zHPF. The results were reported in terms of throughput (MBps) as a function of the skip distance. Whereas throughput with spinning disks decreased with skip distance, SSD throughput with zHPF remained at 94 MBps as the skip distance increased, and 12 MBps without zHPF. Thus, zHPF itself increases the throughput of SSD by a factor of eight. With 15,000 RPM HDD, for example, with a skip distance of 65 pages, the throughput was only 17 MBps with zHPF and 5 MBps without zHPF. Together, SSD and zHPF provided as much as 20 times greater throughput over FICON and 15,000 RPM HDD.
In addition to the performance benefits, SSDs are also a much greener type of device than spinning disks, consuming less energy and creating less heat. You can see this quantified by reviewing publications provided by the SNIA Emerald program:
http://snia.org/emerald/viewresults
For example, for an IBM DS8870 with all spinning disks the idle power measurement is 7.53 GB/watt, and the all flash IBM FlashSystem™ 820 comes in at 58.1 GB/watt, nearly 8 times as power efficient. The active power tests show an even wider gulf. For example, the small random read test shows the IBM FlashSystem 820 to be over 90 times more power efficient than the IBM DS8870 for the configurations measured.
DB2 index-to-data access, skip sequential4 KB pages
020406080
100
0 20 40 60 80 100 120
Skip distance (4 KB page)
MB
pszHPF SSDFICON SSDzHPF 15KFICON 15K
4 Making Smart Storage Decisions for DB2 in a Flash and SSD World
Draft Document for Review October 23, 2014 2:10 pm 5141paper.fm
SSDs continue to be much more expensive on a per gigabyte basis than traditional spinning disks. As a result, many customers use hybrid storage configurations that consist of a mixture of SSDs and hard disk drives (HDDs). These hybrid configurations can be managed either manually (using data set level analysis from the IBM FLASHDA tool or IntelliMagic Vision, for example) or by using an automated tiering solution, such as IBM Easy Tier. Two IBM Redbooks® publications describe the concepts, functions3, architecture, and implementation4 of Easy Tier.
With manual SSD management, you define specific volumes that reside entirely on SSDs. A pool of SSD volumes can be defined, and you can direct data sets that require SSD-like performance to the SSD storage pool. However, using manual management, an individual volume must reside either entirely on SSD or entirely on HDD, including any unused free space. Every volume needs some free space in order to allow new data set extents to be allocated or to allow new data sets to be defined. In the case of DB2, online REORG requires some free space to allocate the shadow data set. In the meantime, if the volume is an SSD volume, the free space is wasting precious SSD capacity. That function is an inefficiency of manual SSD management.
With automated storage tiering, such as Easy Tier, the space on a volume can be subdivided between SSDs and HDDs. The storage controller chooses what should be stored on SSDs and what should be stored on HDDs. Easy Tier tends to put free space on HDDs, thereby making more efficient use of valuable SSD space. The downside of automated tiering is that it is not application aware and cannot necessarily distinguish important data from hot data.
Easy Tier with SSD
Easy Tier is easy to use and makes more efficient use of the SSD space, because with Easy Tier unused free space never needs to occupy any of the SSD space as it would if you allocated SSD volumes. Thus, Easy Tier is an excellent way to achieve a performance improvement gain over spinning disks with a relatively small investment in SSDs.
3 IBM DS8000 Easy Tier, REDP-4667, which is available at:http://www.redbooks.ibm.com/redpieces/abstracts/redp4667.html?Open
4 IBM DS8870 Architecture and Implementation, SG24-8085, which is available at:http://www.redbooks.ibm.com/abstracts/sg248085.html?Open
Making Smart Storage Decisions for DB2 in a Flash and SSD World 5
5141paper.fm Draft Document for Review October 23, 2014 2:10 pm
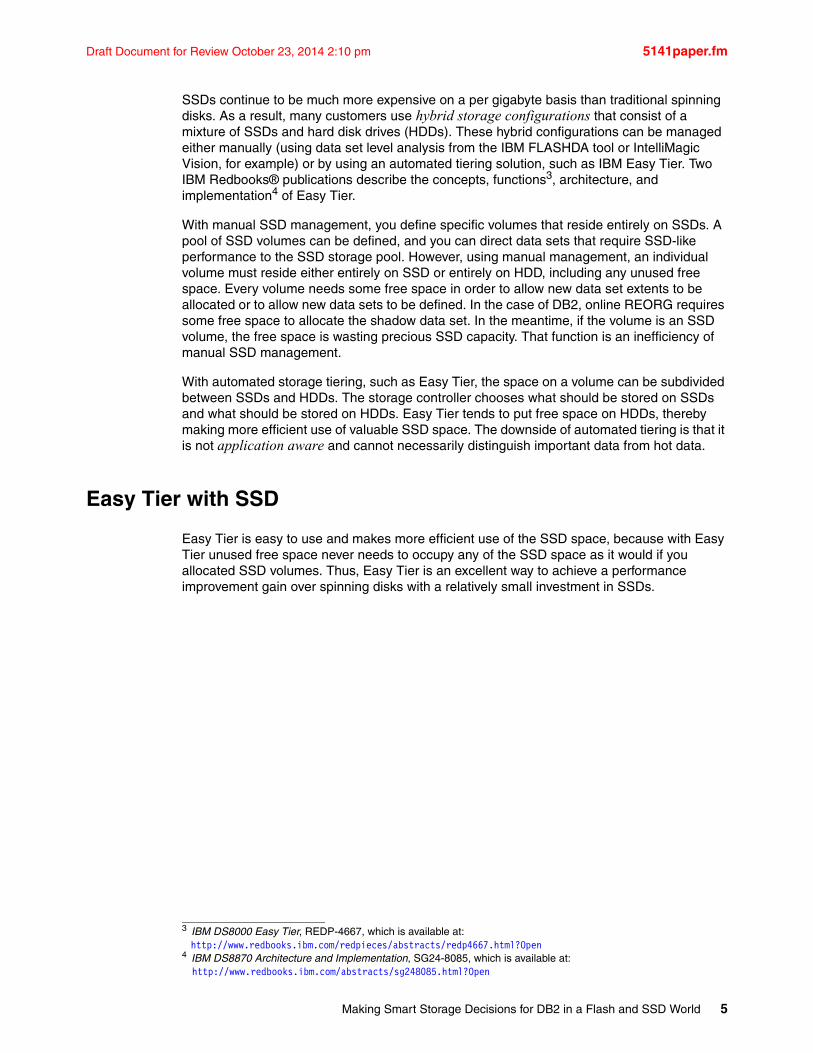
Figure 2 illustrates two hypothetical workload skews for the back-end drive level that are labeled Workload 1 and Workload 2.
Figure 2 I/O skew by workload
For this illustration, we define workload skew as the propensity for a relatively small percentage of the storage to be responsible for a larger percentage of the I/O activity. Workload 1 has a relatively low skew. In this case, 7% of the disk space contains 28% of the I/O, 17% of the disk space contains 50% of the I/Os, and 32% of the disk space contains 80% of the I/Os. In contrast, Workload 2 has a much higher skew, such that only 7% of the space is associated with 80% of the I/Os. Thus, an investment that converts 7% of the disk space to SSD and utilizes Easy Tier enables 80% of the I/Os of Workload 2 to run at SSD speeds, that is sub-millisecond I/O response time.
With Workload 1, 32% of the disk capacity must be SSD to enable 80% of the I/Os to achieve SSD speeds. If only 7% of the space is SSD, only 28% of the I/Os will run at SSD speeds, and if 17% of the space is SSD, 50% of the I/Os will run at SSD. Thus, you have the choice to determine how much you are willing to spend on SSD based on how much you want to reduce the I/O response time.
Actually Figure 2 is a simplistic view of storage that assumes that the workloads are static. In practice, Workload 1 might run over a period of weeks, and while the workload distribution shown in Figure 2 might stay the same, the tracks, data sets, or volumes that are associated with those I/Os might change significantly from week to week, or even day to day. Easy Tier is designed to adjust to these workload fluctuations. For example, if you studied the workload I/O distribution in January and studied it again in February, the I/Os might be going to different data sets in February than they were in January. However, this difference does not matter for performance, because Easy Tier continuously adjusts where the data sets live.
The next three figures illustrate the same two workloads as Figure 2, except that Workload 1 is labeled as two different workloads, 1a and 1b. In terms of the I/O workload distribution shown in Figure 2, workloads 1a and 1b are identical. However, Workload 1b is twice as I/O intensive as 1a. Therefore, to achieve equivalent I/O response time, 1b needs more SSD storage than 1a does. Instead of showing the percentage of I/O as a function of the percentage of capacity, Figure 3, Figure 4, and Figure 5 show SSD thousand I/O operations/second (KIOPS) as a function of the number of SSD terabytes when Easy Tier is used on a DS8870. These metrics can more directly be used to understand your SSD space requirements with Easy Tier than the metrics that were shown in Figure 1. With these metrics,
Workload Distribution
708090
100/O
s
2030405060
Perc
ent o
f I/
01020
0 10 20 30 40 50 60 70 80 90 100
Percent of capacityPercent of capacity
Workload 1 Workload 2
6 Making Smart Storage Decisions for DB2 in a Flash and SSD World
Draft Document for Review October 23, 2014 2:10 pm 5141paper.fm
free space does not enter into the equation, because free space is assumed to reside on the slowest tier.
Two questions need to be asked. First, how many terabytes of SSD do you need? And second, how many disk enclosures do you want to use, or, alternatively, how many DA pairs do you need for the SSD?
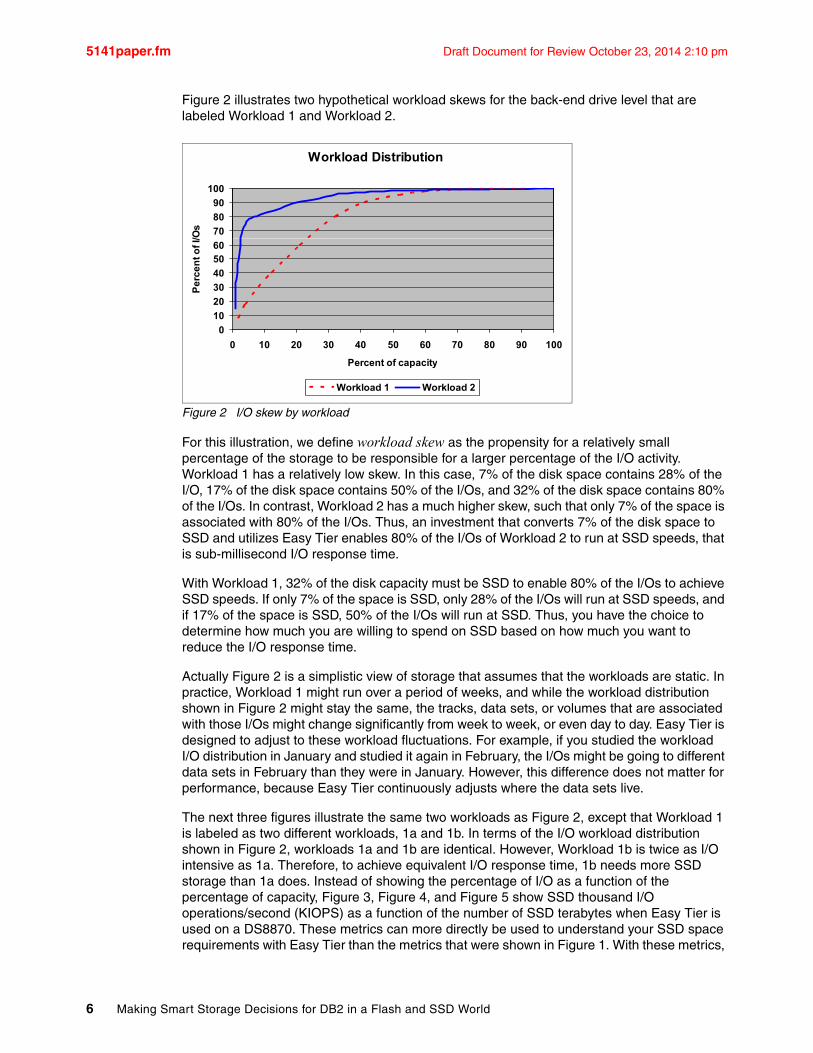
Figure 3 illustrates 200 GB SSD drives with up to 8 gigapacks, Figure 4 illustrates 400 GB SSD drives with up to 4 gigapacks, and Figure 5 illustrates 800 GB SSD drives with up to 2 gigapacks.
You can purchase as little as a single gigapack, which, with 200 GB SSD drives, gives you 22.5 of SSD capacity using RAID 5. See Figure 3. That configuration enables you to generate a maximum of 125 KIOPS if you divide the storage among the two DS8870 servers.
Figure 3 200 GB SSD drives with up to 8 gigapacks
With a single gigapack, each RAID rank uses a different DA port of a single DA pair. Easy Tier determines the hottest 22.5 terabytes of storage and moves them to SSD. With a single gigapack of 200 GB SSD drives, the SSD I/O rate will be 40 KIOPS for Workload 1a and 80 KIOPS for Workload 1b. With Workload 2, however, a single DA pair becomes saturated at 125 KIOPS. A second gigapack that is spread across an additional DA pair is necessary to increase the SSD I/O rate beyond 125 KIOPS.
200 GB SSD drives
020406080
100120140160180200
0 2 4 6 8 10 12 14 16 18 20
SSD Terabytes
SSD
KIO
PS
Workload 1a Workload 1b Workload 2
2 DA Pairs
1 DA Pair
1 2 4 8 # of gigapacks
Making Smart Storage Decisions for DB2 in a Flash and SSD World 7
5141paper.fm Draft Document for Review October 23, 2014 2:10 pm
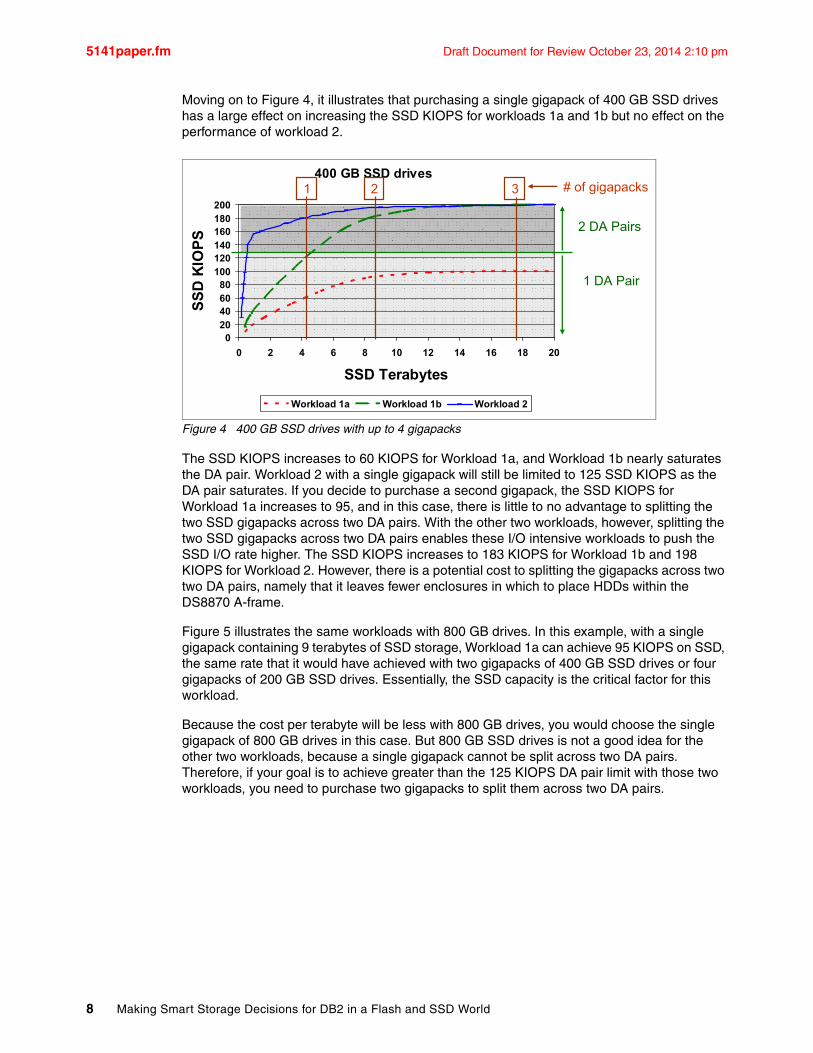
Moving on to Figure 4, it illustrates that purchasing a single gigapack of 400 GB SSD drives has a large effect on increasing the SSD KIOPS for workloads 1a and 1b but no effect on the performance of workload 2.
Figure 4 400 GB SSD drives with up to 4 gigapacks
The SSD KIOPS increases to 60 KIOPS for Workload 1a, and Workload 1b nearly saturates the DA pair. Workload 2 with a single gigapack will still be limited to 125 SSD KIOPS as the DA pair saturates. If you decide to purchase a second gigapack, the SSD KIOPS for Workload 1a increases to 95, and in this case, there is little to no advantage to splitting the two SSD gigapacks across two DA pairs. With the other two workloads, however, splitting the two SSD gigapacks across two DA pairs enables these I/O intensive workloads to push the SSD I/O rate higher. The SSD KIOPS increases to 183 KIOPS for Workload 1b and 198 KIOPS for Workload 2. However, there is a potential cost to splitting the gigapacks across two two DA pairs, namely that it leaves fewer enclosures in which to place HDDs within the DS8870 A-frame.
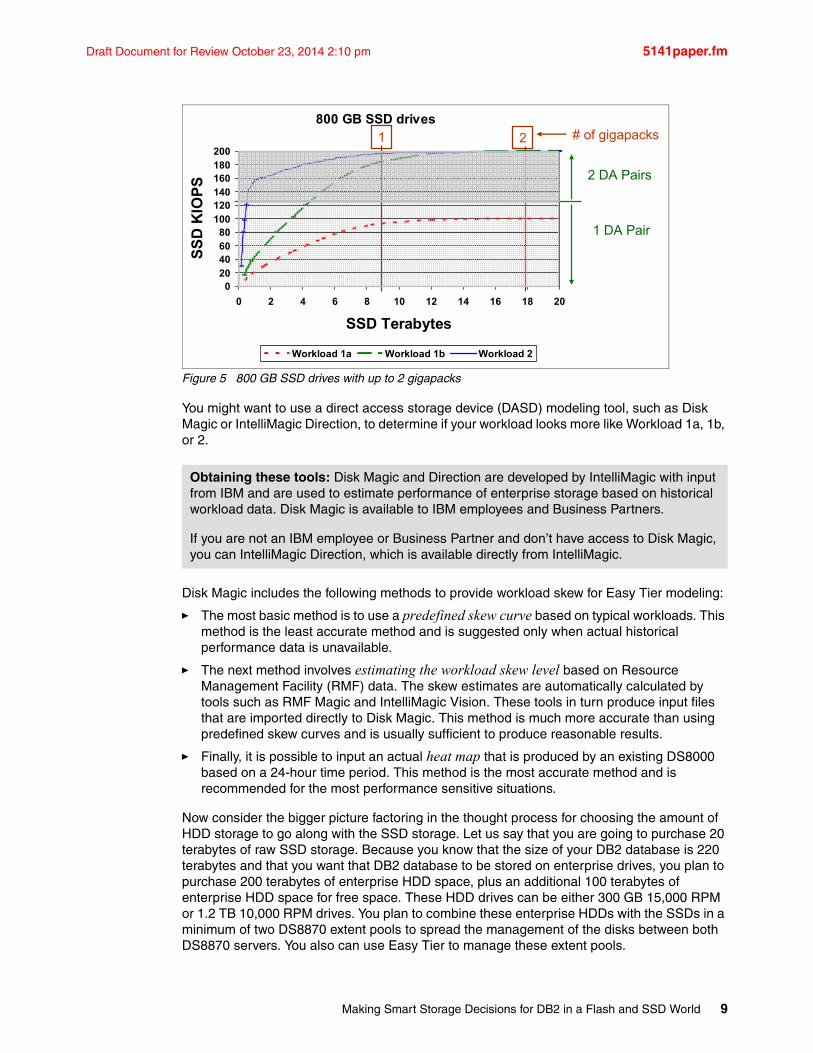
Figure 5 illustrates the same workloads with 800 GB drives. In this example, with a single gigapack containing 9 terabytes of SSD storage, Workload 1a can achieve 95 KIOPS on SSD, the same rate that it would have achieved with two gigapacks of 400 GB SSD drives or four gigapacks of 200 GB SSD drives. Essentially, the SSD capacity is the critical factor for this workload.
Because the cost per terabyte will be less with 800 GB drives, you would choose the single gigapack of 800 GB drives in this case. But 800 GB SSD drives is not a good idea for the other two workloads, because a single gigapack cannot be split across two DA pairs. Therefore, if your goal is to achieve greater than the 125 KIOPS DA pair limit with those two workloads, you need to purchase two gigapacks to split them across two DA pairs.
400 GB SSD drives
020406080
100120140160180200
0 2 4 6 8 10 12 14 16 18 20
SSD Terabytes
SSD
KIO
PS
Workload 1a Workload 1b Workload 2
2 DA Pairs
1 DA Pair
1 2 3 # of gigapacks
8 Making Smart Storage Decisions for DB2 in a Flash and SSD World
Draft Document for Review October 23, 2014 2:10 pm 5141paper.fm
Figure 5 800 GB SSD drives with up to 2 gigapacks
You might want to use a direct access storage device (DASD) modeling tool, such as Disk Magic or IntelliMagic Direction, to determine if your workload looks more like Workload 1a, 1b, or 2.
Disk Magic includes the following methods to provide workload skew for Easy Tier modeling:
� The most basic method is to use a predefined skew curve based on typical workloads. This method is the least accurate method and is suggested only when actual historical performance data is unavailable.
� The next method involves estimating the workload skew level based on Resource Management Facility (RMF) data. The skew estimates are automatically calculated by tools such as RMF Magic and IntelliMagic Vision. These tools in turn produce input files that are imported directly to Disk Magic. This method is much more accurate than using predefined skew curves and is usually sufficient to produce reasonable results.
� Finally, it is possible to input an actual heat map that is produced by an existing DS8000 based on a 24-hour time period. This method is the most accurate method and is recommended for the most performance sensitive situations.
Now consider the bigger picture factoring in the thought process for choosing the amount of HDD storage to go along with the SSD storage. Let us say that you are going to purchase 20 terabytes of raw SSD storage. Because you know that the size of your DB2 database is 220 terabytes and that you want that DB2 database to be stored on enterprise drives, you plan to purchase 200 terabytes of enterprise HDD space, plus an additional 100 terabytes of enterprise HDD space for free space. These HDD drives can be either 300 GB 15,000 RPM or 1.2 TB 10,000 RPM drives. You plan to combine these enterprise HDDs with the SSDs in a minimum of two DS8870 extent pools to spread the management of the disks between both DS8870 servers. You also can use Easy Tier to manage these extent pools.
Obtaining these tools: Disk Magic and Direction are developed by IntelliMagic with input from IBM and are used to estimate performance of enterprise storage based on historical workload data. Disk Magic is available to IBM employees and Business Partners.
If you are not an IBM employee or Business Partner and don’t have access to Disk Magic, you can IntelliMagic Direction, which is available directly from IntelliMagic.
800 GB SSD drives
020406080
100120140160180200
0 2 4 6 8 10 12 14 16 18 20
SSD Terabytes
SSD
KIO
PS
Workload 1a Workload 1b Workload 2
2 DA Pairs
1 DA Pair
1 2 # of gigapacks
Making Smart Storage Decisions for DB2 in a Flash and SSD World 9
5141paper.fm Draft Document for Review October 23, 2014 2:10 pm
For the image copies and archive logs, let us say that you purchase 400 terabytes of nearline drives. The image copies and archive logs will be stored in separate extent pools from the data base, because you don’t need Easy Tier to manage them. You also don’t want a new DB2 table space to be allocated on nearline drives under any circumstances, which is likely to happen if you mixed nearline drives with enterprise drives in the same Easy Tier extent pool.
High-Performance Flash Enclosure
In June 2014, IBM delivered High-Performance Flash Enclosures (HPFE) for the DS8870. HPFE is a new type of flash storage that achieves even higher I/O access densities than the more traditional 2.5-inch SSDs. With few exceptions, HPFE is superior to SSD in terms of both performance and cost. This section explains possible exceptions where SSD might achieve equal performance with lower cost or better performance with higher cost.
HPFE removes the DA limit that is associated with the previously supported standard 2.5-inch SSDs. HPFE connects directly to the high bandwidth, Peripheral Component Interconnect Express (PCIe) buses of the two DS8870 Power7+ processor complexes.
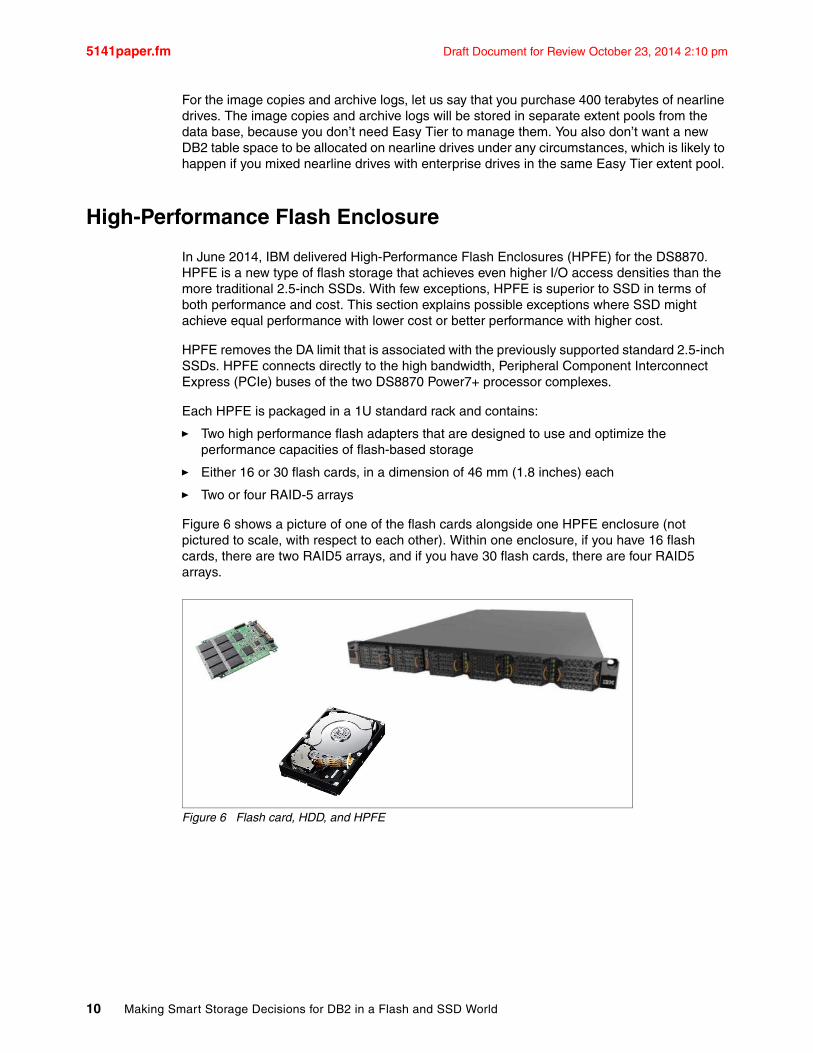
Each HPFE is packaged in a 1U standard rack and contains:
� Two high performance flash adapters that are designed to use and optimize the performance capacities of flash-based storage
� Either 16 or 30 flash cards, in a dimension of 46 mm (1.8 inches) each
� Two or four RAID-5 arrays
Figure 6 shows a picture of one of the flash cards alongside one HPFE enclosure (not pictured to scale, with respect to each other). Within one enclosure, if you have 16 flash cards, there are two RAID5 arrays, and if you have 30 flash cards, there are four RAID5 arrays.
Figure 6 Flash card, HDD, and HPFE
10 Making Smart Storage Decisions for DB2 in a Flash and SSD World
Draft Document for Review October 23, 2014 2:10 pm 5141paper.fm
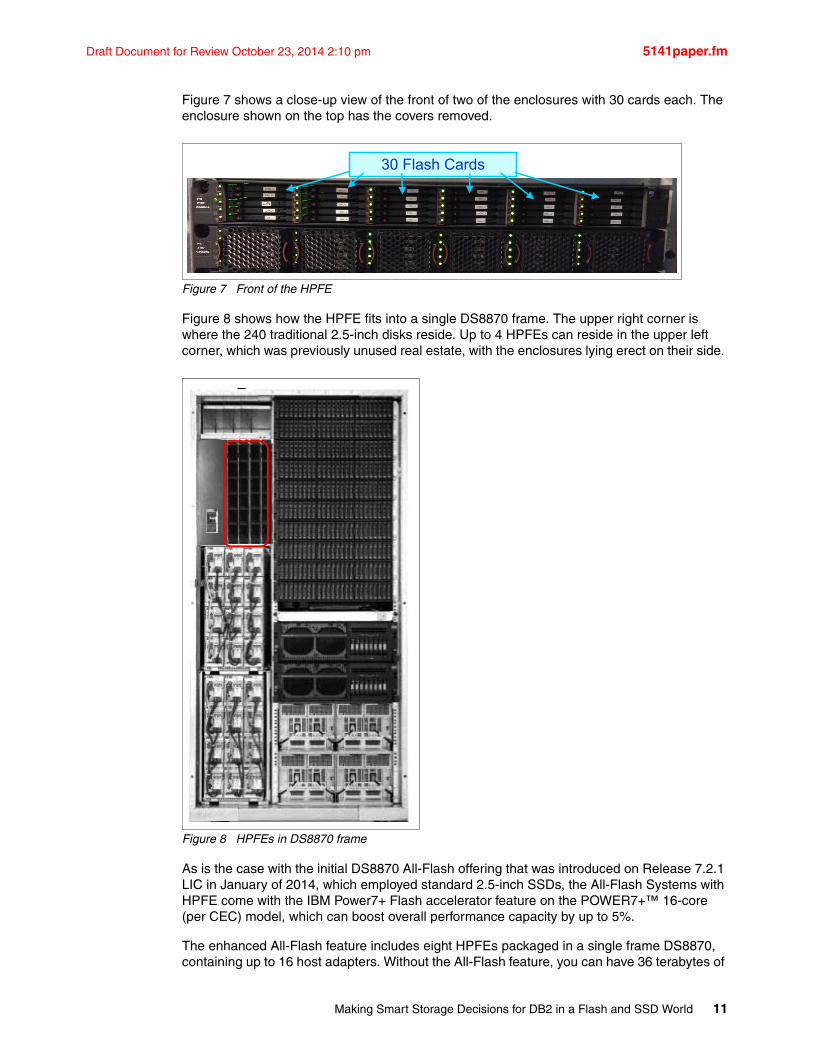
Figure 7 shows a close-up view of the front of two of the enclosures with 30 cards each. The enclosure shown on the top has the covers removed.
Figure 7 Front of the HPFE
Figure 8 shows how the HPFE fits into a single DS8870 frame. The upper right corner is where the 240 traditional 2.5-inch disks reside. Up to 4 HPFEs can reside in the upper left corner, which was previously unused real estate, with the enclosures lying erect on their side.
Figure 8 HPFEs in DS8870 frame
As is the case with the initial DS8870 All-Flash offering that was introduced on Release 7.2.1 LIC in January of 2014, which employed standard 2.5-inch SSDs, the All-Flash Systems with HPFE come with the IBM Power7+ Flash accelerator feature on the POWER7+™ 16-core (per CEC) model, which can boost overall performance capacity by up to 5%.
The enhanced All-Flash feature includes eight HPFEs packaged in a single frame DS8870, containing up to 16 host adapters. Without the All-Flash feature, you can have 36 terabytes of
30 Flash Cards
Making Smart Storage Decisions for DB2 in a Flash and SSD World 11
5141paper.fm Draft Document for Review October 23, 2014 2:10 pm
usable capacity in one frame; with the All-Flash feature, the total usable HPFE capacity in one frame increases to 72 terabytes. This DS8870 packing feature allows you to realize the full potential of an All-Flash, HPFE-based storage system by balancing the frontend (that is, host adapters) performance capacity with the backend (that is, disks) performance capacity in a much smaller package. With R7.4 LIC, you also have the option to purchase an additional 36 TB of HPFE capacity in a second frame, giving you up to 72 TB HPFE capacity in a dual frame DS8870, without sacrificing any of the space for HDD capacity.
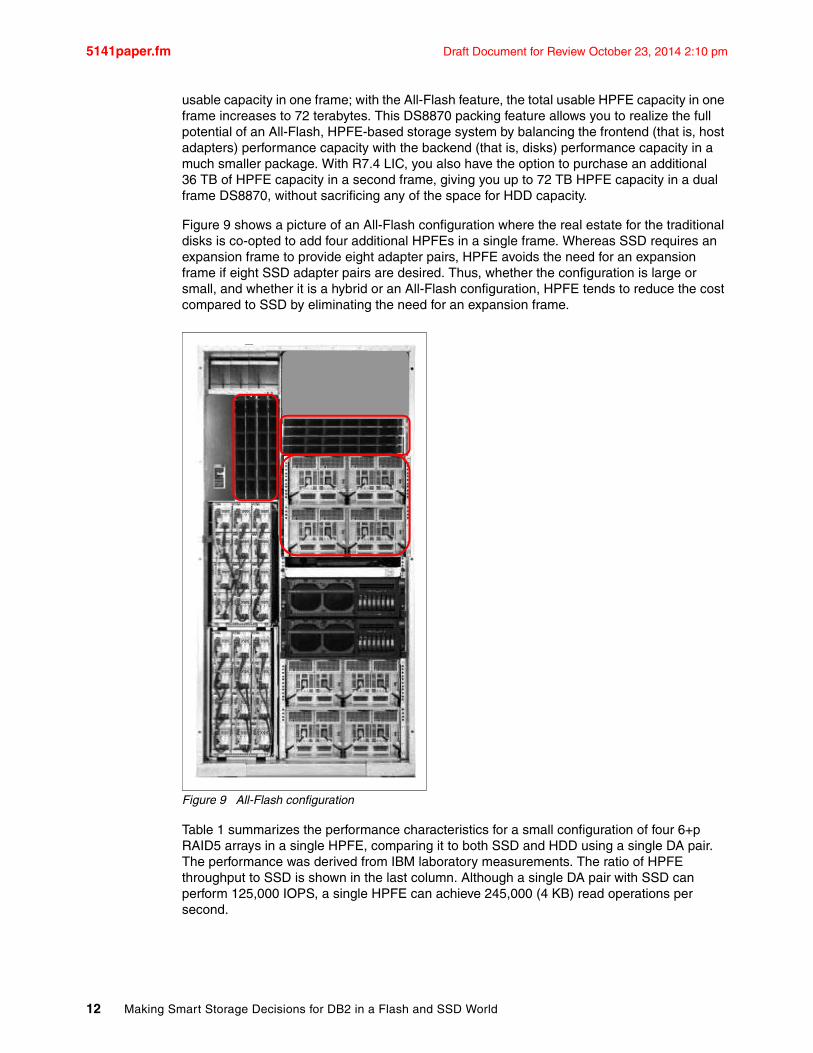
Figure 9 shows a picture of an All-Flash configuration where the real estate for the traditional disks is co-opted to add four additional HPFEs in a single frame. Whereas SSD requires an expansion frame to provide eight adapter pairs, HPFE avoids the need for an expansion frame if eight SSD adapter pairs are desired. Thus, whether the configuration is large or small, and whether it is a hybrid or an All-Flash configuration, HPFE tends to reduce the cost compared to SSD by eliminating the need for an expansion frame.
Figure 9 All-Flash configuration
Table 1 summarizes the performance characteristics for a small configuration of four 6+p RAID5 arrays in a single HPFE, comparing it to both SSD and HDD using a single DA pair. The performance was derived from IBM laboratory measurements. The ratio of HPFE throughput to SSD is shown in the last column. Although a single DA pair with SSD can perform 125,000 IOPS, a single HPFE can achieve 245,000 (4 KB) read operations per second.
12 Making Smart Storage Decisions for DB2 in a Flash and SSD World
Draft Document for Review October 23, 2014 2:10 pm 5141paper.fm
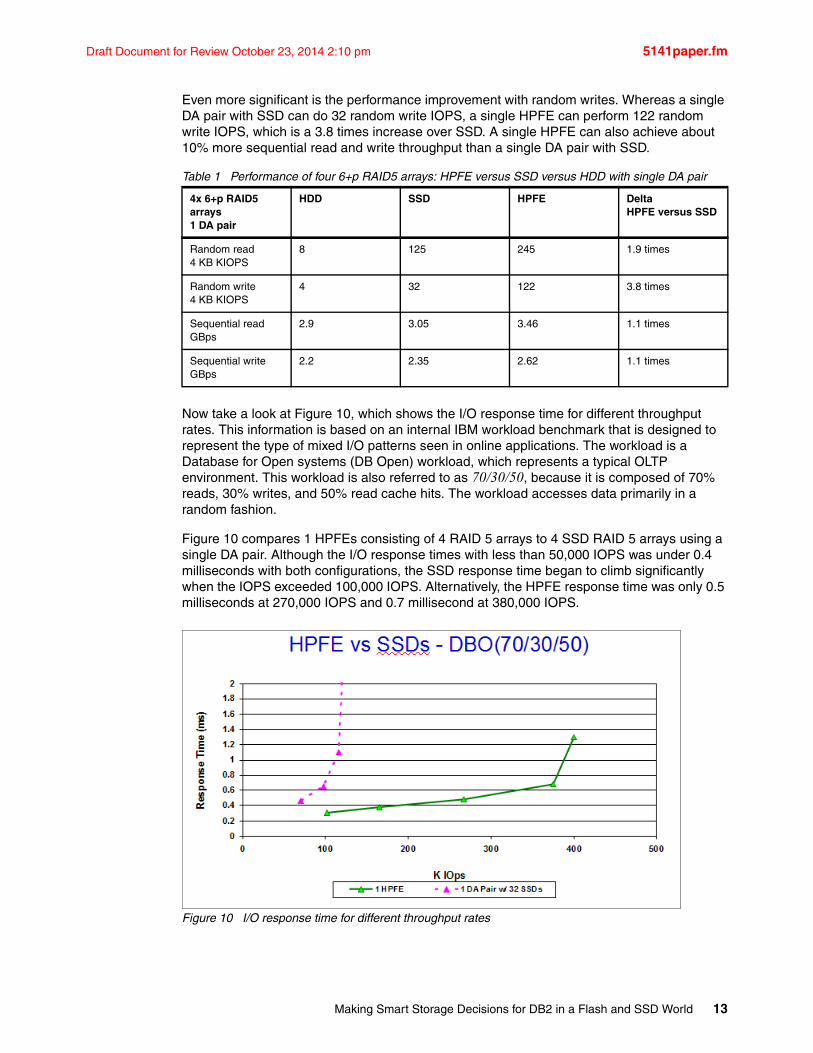
Even more significant is the performance improvement with random writes. Whereas a single DA pair with SSD can do 32 random write IOPS, a single HPFE can perform 122 random write IOPS, which is a 3.8 times increase over SSD. A single HPFE can also achieve about 10% more sequential read and write throughput than a single DA pair with SSD.
Table 1 Performance of four 6+p RAID5 arrays: HPFE versus SSD versus HDD with single DA pair
Now take a look at Figure 10, which shows the I/O response time for different throughput rates. This information is based on an internal IBM workload benchmark that is designed to represent the type of mixed I/O patterns seen in online applications. The workload is a Database for Open systems (DB Open) workload, which represents a typical OLTP environment. This workload is also referred to as 70/30/50, because it is composed of 70% reads, 30% writes, and 50% read cache hits. The workload accesses data primarily in a random fashion.
Figure 10 compares 1 HPFEs consisting of 4 RAID 5 arrays to 4 SSD RAID 5 arrays using a single DA pair. Although the I/O response times with less than 50,000 IOPS was under 0.4 milliseconds with both configurations, the SSD response time began to climb significantly when the IOPS exceeded 100,000 IOPS. Alternatively, the HPFE response time was only 0.5 milliseconds at 270,000 IOPS and 0.7 millisecond at 380,000 IOPS.
Figure 10 I/O response time for different throughput rates
4x 6+p RAID5 arrays1 DA pair
HDD SSD HPFE DeltaHPFE versus SSD
Random read 4 KB KIOPS
8 125 245 1.9 times
Random write 4 KB KIOPS
4 32 122 3.8 times
Sequential read GBps
2.9 3.05 3.46 1.1 times
Sequential write GBps
2.2 2.35 2.62 1.1 times
Making Smart Storage Decisions for DB2 in a Flash and SSD World 13
5141paper.fm Draft Document for Review October 23, 2014 2:10 pm
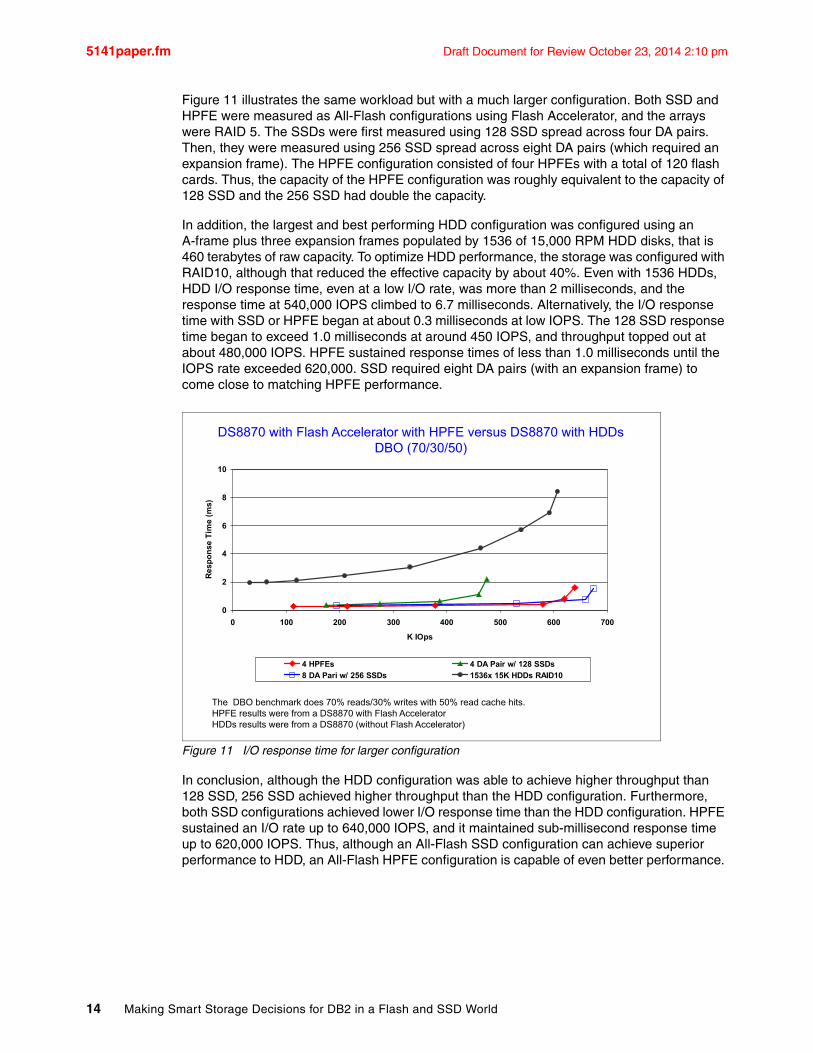
Figure 11 illustrates the same workload but with a much larger configuration. Both SSD and HPFE were measured as All-Flash configurations using Flash Accelerator, and the arrays were RAID 5. The SSDs were first measured using 128 SSD spread across four DA pairs. Then, they were measured using 256 SSD spread across eight DA pairs (which required an expansion frame). The HPFE configuration consisted of four HPFEs with a total of 120 flash cards. Thus, the capacity of the HPFE configuration was roughly equivalent to the capacity of 128 SSD and the 256 SSD had double the capacity.
In addition, the largest and best performing HDD configuration was configured using an A-frame plus three expansion frames populated by 1536 of 15,000 RPM HDD disks, that is 460 terabytes of raw capacity. To optimize HDD performance, the storage was configured with RAID10, although that reduced the effective capacity by about 40%. Even with 1536 HDDs, HDD I/O response time, even at a low I/O rate, was more than 2 milliseconds, and the response time at 540,000 IOPS climbed to 6.7 milliseconds. Alternatively, the I/O response time with SSD or HPFE began at about 0.3 milliseconds at low IOPS. The 128 SSD response time began to exceed 1.0 milliseconds at around 450 IOPS, and throughput topped out at about 480,000 IOPS. HPFE sustained response times of less than 1.0 milliseconds until the IOPS rate exceeded 620,000. SSD required eight DA pairs (with an expansion frame) to come close to matching HPFE performance.
Figure 11 I/O response time for larger configuration
In conclusion, although the HDD configuration was able to achieve higher throughput than 128 SSD, 256 SSD achieved higher throughput than the HDD configuration. Furthermore, both SSD configurations achieved lower I/O response time than the HDD configuration. HPFE sustained an I/O rate up to 640,000 IOPS, and it maintained sub-millisecond response time up to 620,000 IOPS. Thus, although an All-Flash SSD configuration can achieve superior performance to HDD, an All-Flash HPFE configuration is capable of even better performance.
DS8870 with Flash Accelerator with HPFE versus DS8870 with HDDs DBO (70/30/50)
0
2
4
6
8
10
0 100 200 300 400 500 600 700
K IOps
Res
pons
e Ti
me
(ms)
4 HPFEs 4 DA Pair w/ 128 SSDs8 DA Pari w/ 256 SSDs 1536x 15K HDDs RAID10
The DBO benchmark does 70% reads/30% writes with 50% read cache hits.HPFE results were from a DS8870 with Flash AcceleratorHDDs results were from a DS8870 (without Flash Accelerator)
14 Making Smart Storage Decisions for DB2 in a Flash and SSD World
Draft Document for Review October 23, 2014 2:10 pm 5141paper.fm
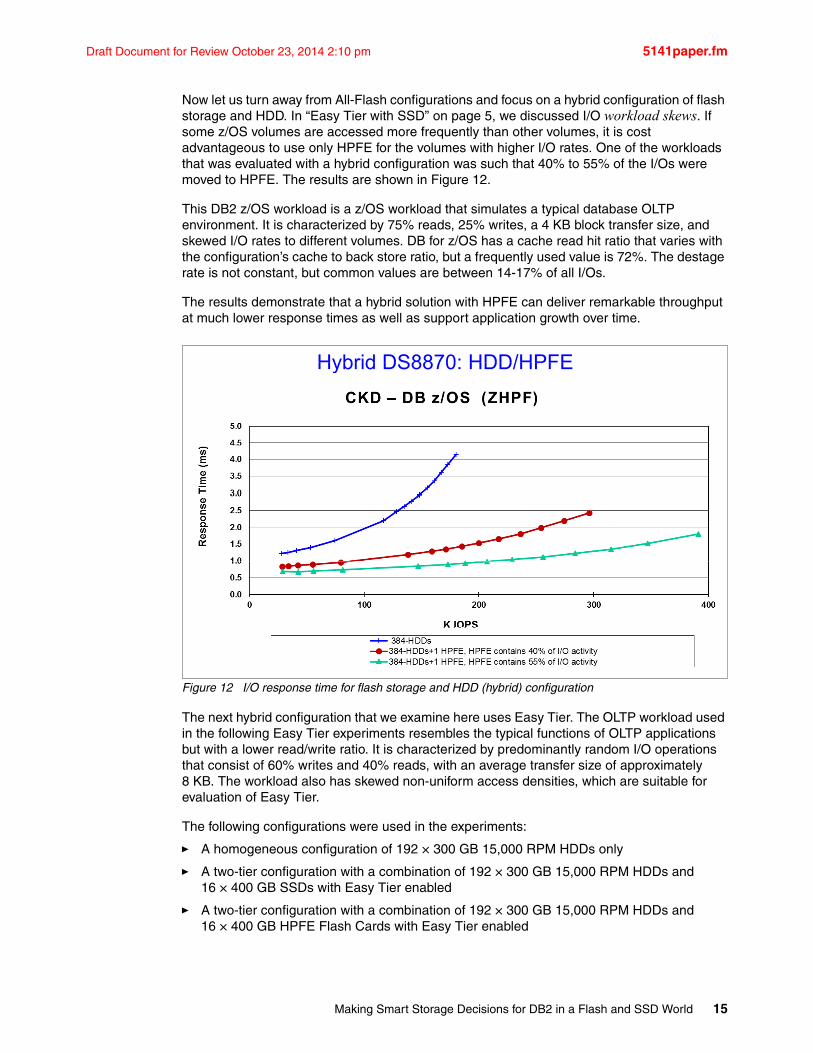
Now let us turn away from All-Flash configurations and focus on a hybrid configuration of flash storage and HDD. In “Easy Tier with SSD” on page 5, we discussed I/O workload skews. If some z/OS volumes are accessed more frequently than other volumes, it is cost advantageous to use only HPFE for the volumes with higher I/O rates. One of the workloads that was evaluated with a hybrid configuration was such that 40% to 55% of the I/Os were moved to HPFE. The results are shown in Figure 12.
This DB2 z/OS workload is a z/OS workload that simulates a typical database OLTP environment. It is characterized by 75% reads, 25% writes, a 4 KB block transfer size, and skewed I/O rates to different volumes. DB for z/OS has a cache read hit ratio that varies with the configuration’s cache to back store ratio, but a frequently used value is 72%. The destage rate is not constant, but common values are between 14-17% of all I/Os.
The results demonstrate that a hybrid solution with HPFE can deliver remarkable throughput at much lower response times as well as support application growth over time.
Figure 12 I/O response time for flash storage and HDD (hybrid) configuration
The next hybrid configuration that we examine here uses Easy Tier. The OLTP workload used in the following Easy Tier experiments resembles the typical functions of OLTP applications but with a lower read/write ratio. It is characterized by predominantly random I/O operations that consist of 60% writes and 40% reads, with an average transfer size of approximately 8 KB. The workload also has skewed non-uniform access densities, which are suitable for evaluation of Easy Tier.
The following configurations were used in the experiments:
� A homogeneous configuration of 192 × 300 GB 15,000 RPM HDDs only
� A two-tier configuration with a combination of 192 × 300 GB 15,000 RPM HDDs and 16 × 400 GB SSDs with Easy Tier enabled
� A two-tier configuration with a combination of 192 × 300 GB 15,000 RPM HDDs and 16 × 400 GB HPFE Flash Cards with Easy Tier enabled
Hybrid DS8870: HDD/HPFEHybrid DS8870: HDD/HPFE
Making Smart Storage Decisions for DB2 in a Flash and SSD World 15
5141paper.fm Draft Document for Review October 23, 2014 2:10 pm
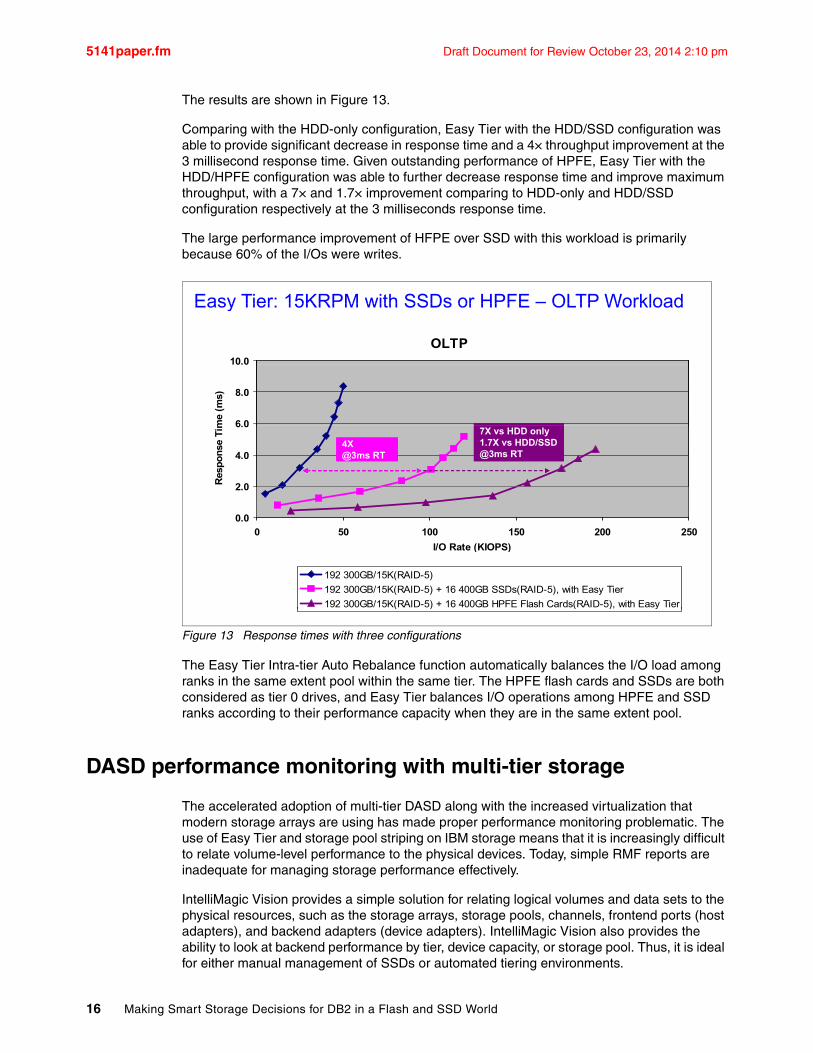
The results are shown in Figure 13.
Comparing with the HDD-only configuration, Easy Tier with the HDD/SSD configuration was able to provide significant decrease in response time and a 4× throughput improvement at the 3 millisecond response time. Given outstanding performance of HPFE, Easy Tier with the HDD/HPFE configuration was able to further decrease response time and improve maximum throughput, with a 7× and 1.7× improvement comparing to HDD-only and HDD/SSD configuration respectively at the 3 milliseconds response time.
The large performance improvement of HFPE over SSD with this workload is primarily because 60% of the I/Os were writes.
Figure 13 Response times with three configurations
The Easy Tier Intra-tier Auto Rebalance function automatically balances the I/O load among ranks in the same extent pool within the same tier. The HPFE flash cards and SSDs are both considered as tier 0 drives, and Easy Tier balances I/O operations among HPFE and SSD ranks according to their performance capacity when they are in the same extent pool.
DASD performance monitoring with multi-tier storage
The accelerated adoption of multi-tier DASD along with the increased virtualization that modern storage arrays are using has made proper performance monitoring problematic. The use of Easy Tier and storage pool striping on IBM storage means that it is increasingly difficult to relate volume-level performance to the physical devices. Today, simple RMF reports are inadequate for managing storage performance effectively.
IntelliMagic Vision provides a simple solution for relating logical volumes and data sets to the physical resources, such as the storage arrays, storage pools, channels, frontend ports (host adapters), and backend adapters (device adapters). IntelliMagic Vision also provides the ability to look at backend performance by tier, device capacity, or storage pool. Thus, it is ideal for either manual management of SSDs or automated tiering environments.
Easy Tier: 15KRPM with SSDs or HPFE – OLTP WorkloadEasy Tier: 15KRPM with SSDs or HPFE OLTP Workload
OLTP10.0
6.0
8.0
me
(ms)
2 0
4.0
6.0
Res
pons
e Ti
m
4X@3ms RT
7X vs HDD only1.7X vs HDD/SSD@3ms RT
0.0
2.0
0 50 100 150 200 250I/O Rate (KIOPS)I/O Rate (KIOPS)
192 300GB/15K(RAID-5)192 300GB/15K(RAID-5) + 16 400GB SSDs(RAID-5), with Easy Tier192 300GB/15K(RAID-5) + 16 400GB HPFE Flash Cards(RAID-5), with Easy Tier( ) ( ) y
16 Making Smart Storage Decisions for DB2 in a Flash and SSD World
Draft Document for Review October 23, 2014 2:10 pm 5141paper.fm
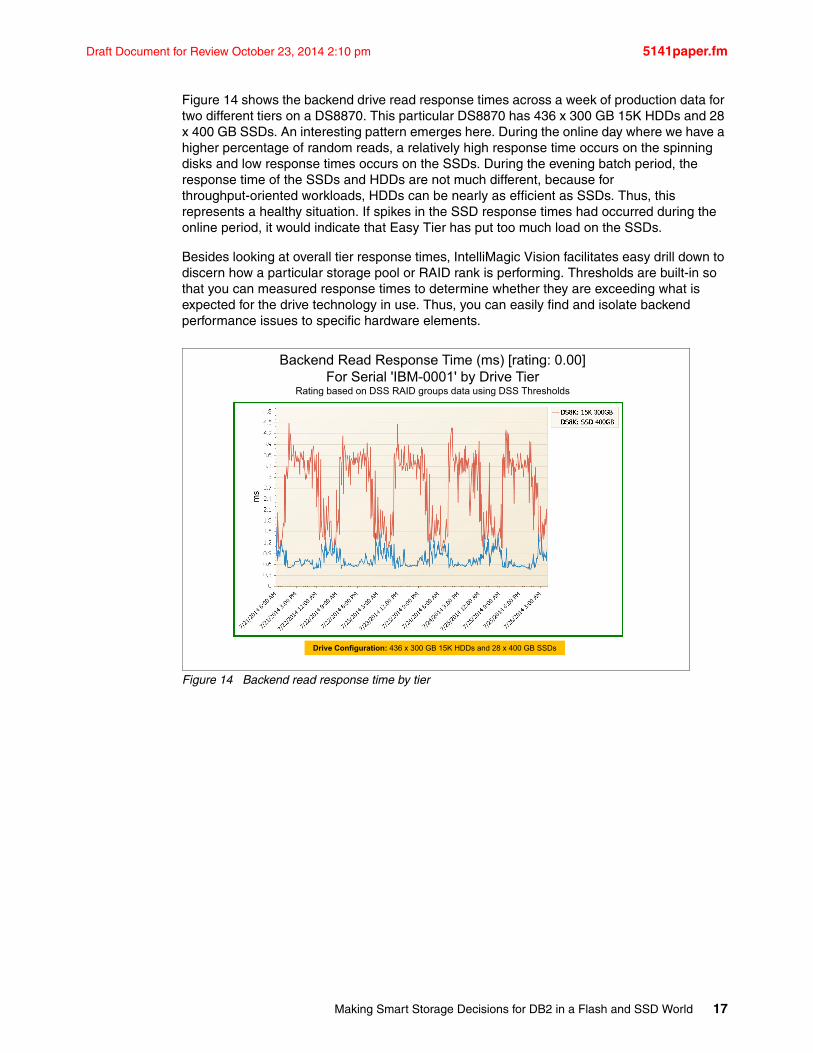
Figure 14 shows the backend drive read response times across a week of production data for two different tiers on a DS8870. This particular DS8870 has 436 x 300 GB 15K HDDs and 28 x 400 GB SSDs. An interesting pattern emerges here. During the online day where we have a higher percentage of random reads, a relatively high response time occurs on the spinning disks and low response times occurs on the SSDs. During the evening batch period, the response time of the SSDs and HDDs are not much different, because for throughput-oriented workloads, HDDs can be nearly as efficient as SSDs. Thus, this represents a healthy situation. If spikes in the SSD response times had occurred during the online period, it would indicate that Easy Tier has put too much load on the SSDs.
Besides looking at overall tier response times, IntelliMagic Vision facilitates easy drill down to discern how a particular storage pool or RAID rank is performing. Thresholds are built-in so that you can measured response times to determine whether they are exceeding what is expected for the drive technology in use. Thus, you can easily find and isolate backend performance issues to specific hardware elements.
Figure 14 Backend read response time by tier
Backend Read Response Time (ms) [rating: 0.00]For Serial 'IBM-0001' by Drive Tier
Rating based on DSS RAID groups data using DSS Thresholds
Drive Configuration: 436 x 300 GB 15K HDDs and 28 x 400 GB SSDs
Making Smart Storage Decisions for DB2 in a Flash and SSD World 17
5141paper.fm Draft Document for Review October 23, 2014 2:10 pm
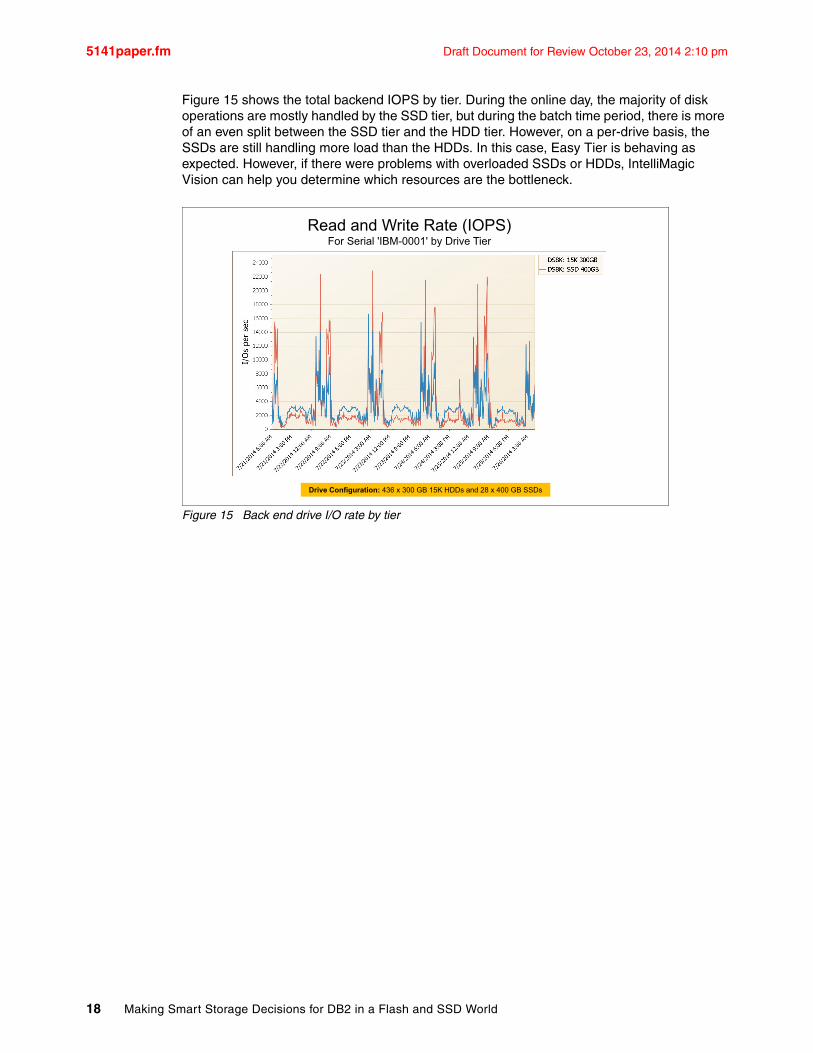
Figure 15 shows the total backend IOPS by tier. During the online day, the majority of disk operations are mostly handled by the SSD tier, but during the batch time period, there is more of an even split between the SSD tier and the HDD tier. However, on a per-drive basis, the SSDs are still handling more load than the HDDs. In this case, Easy Tier is behaving as expected. However, if there were problems with overloaded SSDs or HDDs, IntelliMagic Vision can help you determine which resources are the bottleneck.
Figure 15 Back end drive I/O rate by tier
Read and Write Rate (IOPS)For Serial 'IBM-0001' by Drive Tier
Drive Configuration: 436 x 300 GB 15K HDDs and 28 x 400 GB SSDs
18 Making Smart Storage Decisions for DB2 in a Flash and SSD World
Draft Document for Review October 23, 2014 2:10 pm 5141paper.fm
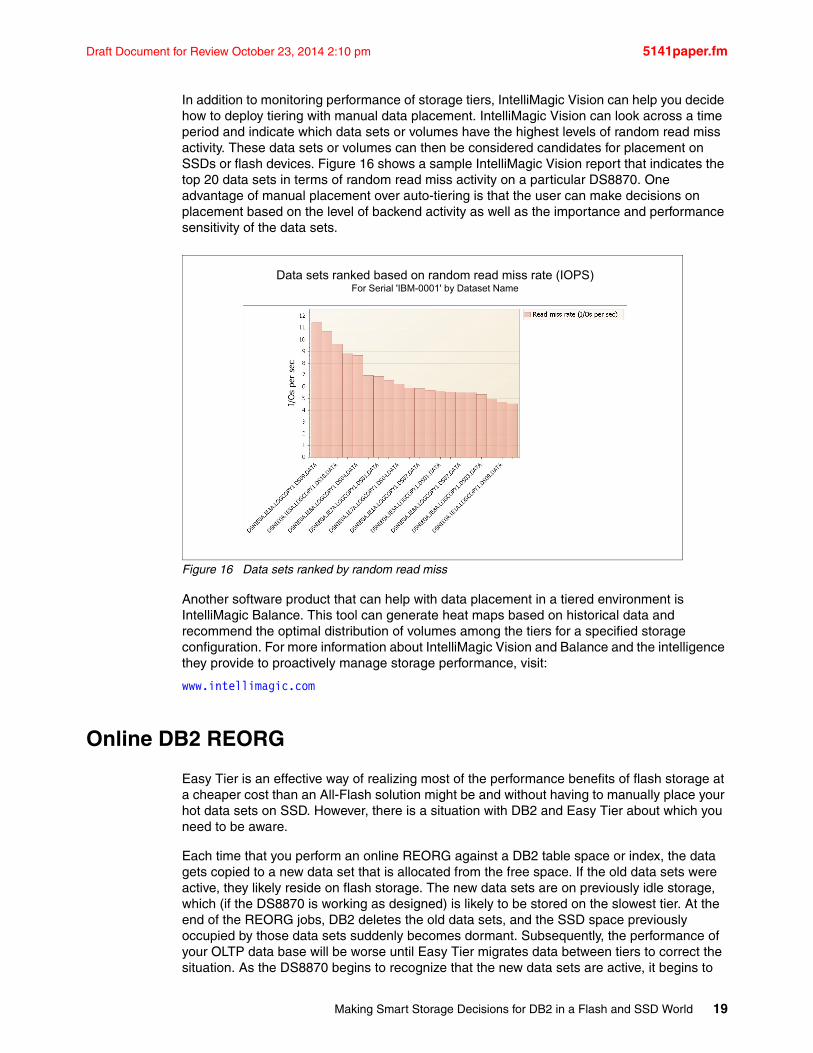
In addition to monitoring performance of storage tiers, IntelliMagic Vision can help you decide how to deploy tiering with manual data placement. IntelliMagic Vision can look across a time period and indicate which data sets or volumes have the highest levels of random read miss activity. These data sets or volumes can then be considered candidates for placement on SSDs or flash devices. Figure 16 shows a sample IntelliMagic Vision report that indicates the top 20 data sets in terms of random read miss activity on a particular DS8870. One advantage of manual placement over auto-tiering is that the user can make decisions on placement based on the level of backend activity as well as the importance and performance sensitivity of the data sets.
Figure 16 Data sets ranked by random read miss
Another software product that can help with data placement in a tiered environment is IntelliMagic Balance. This tool can generate heat maps based on historical data and recommend the optimal distribution of volumes among the tiers for a specified storage configuration. For more information about IntelliMagic Vision and Balance and the intelligence they provide to proactively manage storage performance, visit:
www.intellimagic.com
Online DB2 REORG
Easy Tier is an effective way of realizing most of the performance benefits of flash storage at a cheaper cost than an All-Flash solution might be and without having to manually place your hot data sets on SSD. However, there is a situation with DB2 and Easy Tier about which you need to be aware.
Each time that you perform an online REORG against a DB2 table space or index, the data gets copied to a new data set that is allocated from the free space. If the old data sets were active, they likely reside on flash storage. The new data sets are on previously idle storage, which (if the DS8870 is working as designed) is likely to be stored on the slowest tier. At the end of the REORG jobs, DB2 deletes the old data sets, and the SSD space previously occupied by those data sets suddenly becomes dormant. Subsequently, the performance of your OLTP data base will be worse until Easy Tier migrates data between tiers to correct the situation. As the DS8870 begins to recognize that the new data sets are active, it begins to
Data sets ranked based on random read miss rate (IOPS)For Serial 'IBM-0001' by Dataset Name
Making Smart Storage Decisions for DB2 in a Flash and SSD World 19
5141paper.fm Draft Document for Review October 23, 2014 2:10 pm
swap the contents of the old data sets (which have become free space) with contents of the new data sets. But, swapping the contents of these data sets takes time, and performance suffers until the swap is completed.
Therefore, reconsider the reasons why you did the REORGs in the first place. One of the reasons that you run REORG is to reduce the CPU utilization (and corresponding software costs) of your workloads. Another is to improve the I/O response time. Alternatively, consider that if Easy Tier keeps your data sets on SSD, the subsequent I/O performance problems after the REORG only make the performance worse, at least in the short term. So, if you decide to use Easy Tier to improve performance while reducing costs, understand that I/O performance might suffer for a time after the REORGs and that CPU utilization might increase.
Furthermore, consider the strategic importance of DB2 10 for z/OS. DB2 10 introduced the use of list prefetch for index scans when an index is disorganized. By using list prefetch in combination with List Prefetch Optimizer, index scan performance is greatly improved, especially when SSD is used. REORG against the index still improves the elapsed time of an index scan, but much less so with DB2 10 in combination with SSD and List Prefetch Optimizer.
DB2 10 also implements Row Level Sequential Detection (RLSD) when data is accessed using an index using dynamic prefetch to help avoid degrading index-to-data range scans into data synch I/Os, thereby reducing CPU costs and improving response times when the cluster ratio of the cluster index falls from 100% to say 80 to 90%. REORG restores the cluster ratio to 100%. RLSD is not by itself a panacea for avoiding REORGs, because synch I/Os persist for the unclustered rows unless a REORG is done, but it is part of the overall solution.
DB2 11, which became available in 2013, goes one step further towards reducing the need for DB2 REORGs, because it solves two problems. When a row is deleted from a table, the index entries for that table are not physically deleted but rather are marked as pseudo deleted. However, these entries continue to occupy physical space. These pseudo deleted index entries cause more getpages, which causes the CPU time to increase. Prior to DB2 11, the only way to remove these index entries is to REORG the index. DB2 11 solves this problem by automatically cleaning up these index entries using a background service task.
Another problem that exists prior to DB2 11 is indirect references. Indirect references occur as a result of a variable length row increasing in size and not having the available space on the page where the row was stored. Indirect references hurt the CPU time and I/O response time. DB2 11 solves this problem by managing free space differently so that the newly inserted rows will not consume all of the space, thereby reserving some free space for the existing rows to expand.
Nevertheless, DB2 11 is not a panacea for disorganized data. As noted previously when discussing RLSD, when dynamic prefetch is used for a poorly clustered table, a range scan that uses the cluster index will continue to do synch I/Os for unclustered rows. The only way to avoid the synch I/Os is to restore the cluster ratio to 100% by running REORG. In some cases, REORG also improves the buffer hit ratio for ordinary OLTP transactions. And yet, having chosen to replace your spinning disks with SSD for your most active DB2 objects, you can take comfort in the fact that your synch I/Os will perform significantly faster than before, even if you do not run REORG.
To summarize, you want the performance advantages of SSD, but the costs require that you configure a hybrid mixture of SSD and spinning disks. Micro-managing a hybrid storage can be difficult and inefficient. That’s why you choose Easy Tier as your solution. But, having chosen Easy Tier as your solution, online REORGs might temporarily hurt the performance.
20 Making Smart Storage Decisions for DB2 in a Flash and SSD World
Draft Document for Review October 23, 2014 2:10 pm 5141paper.fm
Using Easy Tier is not a major problem if you infrequently REORG a DB2 table space, but REORG is not something you should do frequently. If you really want to make an informed decision about the frequency of running REORG, do some measurements before and after the REORG using your own workload and storage environment. Given that each new DB2 version alleviates the need to use REORG, you need to re-evaluate the effect of REORGs.
If you want to keep things simple and avoid doing an evaluation of REORG, don’t use REORG for the purpose of improving performance. That does not mean, however, that you should never run REORG. The REORG utility is sometimes used to make online schema changes or to reclaim space. Certainly if you are using REORG to shrink a DB2 table space, the performance is not going to get worse even if you use Easy Tier. Online schema changes might improve the performance, depending on the type of schema changes you were making. Converting to use inline LOBs is an example of that.
Summary
The integration of HPFE with the latest generation of the DS8870 provides improvements in system performance. This offering delivers the sub-millisecond response time to which administrators employing flash-based DS8870 solutions have become accustomed while simultaneously making breakthrough gains in overall throughput. This was a common theme in the diverse set of experiments detailed in this paper, which demonstrates that HPFE integration with the DS8870 is the leading-edge enterprise flash technology. While maintaining the outstanding low response time, lab experiments demonstrated that HPFE can provide up to 4× random I/O throughput improvements over traditional SSDs.
Overall, the improvements attained by the incorporation of HPFEs result in a smaller storage footprint needed to meet a given set of performance requirements—in some cases as much as half. The smaller storage footprint in turn results in substantial energy savings and a significantly lower total cost of ownership.
In closing, there is now available a wide array of storage choices to be made that can improve the performance of your DB2 database. You can choose the more traditional 2.5-inch form factor of SSDs, or you can choose the HPFE. You can choose Easy Tier, or you can manage the SSD space yourself using the FLASHDA tool or IntelliMagic Vision. You can choose to use DB2 REORGs, or you can migrate to DB2 10. Or, better yet, migrate to DB2 11 to reduce the need for DB2 REORGs and avoid issues of online DB2 REORGs. Alternatively, you can simply cut the cord to spinning disks and opt for an All-Flash solution with higher performance at potentially reduced cost, without the effects of online DB2 REORGs. Hopefully this paper has provided you the background to make an informed decision.
References
For additional information, refer to these publications:
� IBM DB2 11 for z/OS Performance Topics, SG24-8222
� Ready to Access DB2 for z/OS Data on Solid-State Drives, REDP-4537
� DB2 for z/OS and List Prefetch Optimizer, REDP-4862
� IBM DS8000 Easy Tier, REDP-4667
� IBM DS8870 Architecture and Implementation, SG24-8085
Making Smart Storage Decisions for DB2 in a Flash and SSD World 21
5141paper.fm Draft Document for Review October 23, 2014 2:10 pm
� IntelliMagic Product Literature
https://www.intellimagic.net/resources/product-literature
� Does REORG Matter?
http://www.ibm.com/developerworks/data/library/dmmag/DMMag_2011_Issue4/ReOrg/?ca=drs
The team who wrote this paper
This paper was produced by a team of specialists working at the Silicon Valley Laboratory, Poughkeepsie.
Jeff Berger is a member of the DB2 for z/OS performance department in IBM Silicon Valley Laboratory. For most of his 35 years in IBM, Jeff has worked on system performance of IBM mainframes, specializing in DASD storage and database systems, both hardware and software. Jeff has contributed several patents, IBM Redbooks publications, and several papers, which were published by Computer Measurement Group and the DB2 IDUG Solutions Journal.
Lee LaFrese joined IntelliMagic as a senior storage performance consultant in March, 2012. Lee has worked at IBM for more than 30 years where he was the technical lead in product development for Enterprise Disk Storage Performance in Tucson, AZ. During his career, he has written over 20 white papers and made numerous technical presentations on a wide variety of performance topics spanning both mainframe and distributed storage. Lee is one of the best-known and respected storage performance experts in the industry.
Acknowledgements
The authors want to thank the people at IBM and IntelliMagic who reviewed this paper and for providing some insightful comments. These include Paolo Bruni, Yan Xu, and Sonny Williams of IBM, and Joseph Hyde, Brent Phillips, Gilbert Houtekamer, Brett Allison, and Jerry Street of IntelliMagic. The authors also want to thank the many people at IBM for completing the performance measurements evaluations of Flash and SSD storage and for writing an IBM white paper documenting their work, upon which this paper is based.
Now you can become a published author, too!
Here is an opportunity to spotlight your skills, grow your career, and become a published author—all at the same time! Join an ITSO residency project and help write a book in your area of expertise, while honing your experience using leading-edge technologies. Your efforts help to increase product acceptance and customer satisfaction, as you expand your network of technical contacts and relationships. Residencies run from two to six weeks in length, and you can participate either in person or as a remote resident working from your home base.
Find out more about the residency program, browse the residency index, and apply online at:
ibm.com/redbooks/residencies.html
22 Making Smart Storage Decisions for DB2 in a Flash and SSD World
Draft Document for Review October 23, 2014 2:10 pm 5141paper.fm
Stay connected to IBM Redbooks publications
� Find us on Facebook:
http://www.facebook.com/IBMRedbooks
� Follow us on Twitter:
http://twitter.com/ibmredbooks
� Look for us on LinkedIn:
http://www.linkedin.com/groups?home=&gid=2130806
� Explore new Redbooks publications, residencies, and workshops with the IBM Redbooks weekly newsletter:
https://www.redbooks.ibm.com/Redbooks.nsf/subscribe?OpenForm
� Stay current on recent Redbooks publications with RSS Feeds:
http://www.redbooks.ibm.com/rss.html
Making Smart Storage Decisions for DB2 in a Flash and SSD World 23

5141paper.fm Draft Document for Review October 23, 2014 2:10 pm
24 Making Smart Storage Decisions for DB2 in a Flash and SSD World
Draft Document for Review October 23, 2014 2:10 pm 5141paper-spec.fm
Notices
This information was developed for products and services offered in the U.S.A.
IBM may not offer the products, services, or features discussed in this document in other countries. Consult your local IBM representative for information on the products and services currently available in your area. Any reference to an IBM product, program, or service is not intended to state or imply that only that IBM product, program, or service may be used. Any functionally equivalent product, program, or service that does not infringe any IBM intellectual property right may be used instead. However, it is the user's responsibility to evaluate and verify the operation of any non-IBM product, program, or service.
IBM may have patents or pending patent applications covering subject matter described in this document. The furnishing of this document does not grant you any license to these patents. You can send license inquiries, in writing, to: IBM Director of Licensing, IBM Corporation, North Castle Drive, Armonk, NY 10504-1785 U.S.A.
The following paragraph does not apply to the United Kingdom or any other country where such provisions are inconsistent with local law: INTERNATIONAL BUSINESS MACHINES CORPORATION PROVIDES THIS PUBLICATION “AS IS” WITHOUT WARRANTY OF ANY KIND, EITHER EXPRESS OR IMPLIED, INCLUDING, BUT NOT LIMITED TO, THE IMPLIED WARRANTIES OF NON-INFRINGEMENT, MERCHANTABILITY OR FITNESS FOR A PARTICULAR PURPOSE. Some states do not allow disclaimer of express or implied warranties in certain transactions, therefore, this statement may not apply to you.
This information could include technical inaccuracies or typographical errors. Changes are periodically made to the information herein; these changes will be incorporated in new editions of the publication. IBM may make improvements and/or changes in the product(s) and/or the program(s) described in this publication at any time without notice.
Any references in this information to non-IBM websites are provided for convenience only and do not in any manner serve as an endorsement of those websites. The materials at those websites are not part of the materials for this IBM product and use of those websites is at your own risk.
IBM may use or distribute any of the information you supply in any way it believes appropriate without incurring any obligation to you.
Any performance data contained herein was determined in a controlled environment. Therefore, the results obtained in other operating environments may vary significantly. Some measurements may have been made on development-level systems and there is no guarantee that these measurements will be the same on generally available systems. Furthermore, some measurements may have been estimated through extrapolation. Actual results may vary. Users of this document should verify the applicable data for their specific environment.
Information concerning non-IBM products was obtained from the suppliers of those products, their published announcements or other publicly available sources. IBM has not tested those products and cannot confirm the accuracy of performance, compatibility or any other claims related to non-IBM products. Questions on the capabilities of non-IBM products should be addressed to the suppliers of those products.
This information contains examples of data and reports used in daily business operations. To illustrate them as completely as possible, the examples include the names of individuals, companies, brands, and products. All of these names are fictitious and any similarity to the names and addresses used by an actual business enterprise is entirely coincidental.
COPYRIGHT LICENSE:
This information contains sample application programs in source language, which illustrate programming techniques on various operating platforms. You may copy, modify, and distribute these sample programs in any form without payment to IBM, for the purposes of developing, using, marketing or distributing application programs conforming to the application programming interface for the operating platform for which the sample programs are written. These examples have not been thoroughly tested under all conditions. IBM, therefore, cannot guarantee or imply reliability, serviceability, or function of these programs.
© Copyright International Business Machines Corporation 2014. All rights reserved.Note to U.S. Government Users Restricted Rights -- Use, duplication or disclosure restricted by GSA ADP Schedule Contract with IBM Corp. 25
5141paper-spec.fm Draft Document for Review October 23, 2014 2:10 pm
®
Redpaper™
This document REDP-5141-00 was created or updated on October 23, 2014.
Send us your comments in one of the following ways:� Use the online Contact us review Redbooks form found at:
ibm.com/redbooks� Send your comments in an email to:
[email protected]� Mail your comments to:
IBM Corporation, International Technical Support OrganizationDept. HYTD Mail Station P0992455 South RoadPoughkeepsie, NY 12601-5400 U.S.A.
Trademarks
IBM, the IBM logo, and ibm.com are trademarks or registered trademarks of International Business Machines Corporation in the United States, other countries, or both. These and other IBM trademarked terms are marked on their first occurrence in this information with the appropriate symbol (® or ™), indicating US registered or common law trademarks owned by IBM at the time this information was published. Such trademarks may also be registered or common law trademarks in other countries. A current list of IBM trademarks is available on the Web at http://www.ibm.com/legal/copytrade.shtml
The following terms are trademarks of the International Business Machines Corporation in the United States, other countries, or both:
DB2®DS8000®Easy Tier®FICON®FlashSystem™
IBM FlashSystem™IBM®POWER7+™Redbooks®Redguide™
Redpaper™Redbooks (logo) ®RMF™System z®z/OS®
The following terms are trademarks of other companies:
Other company, product, or service names may be trademarks or service marks of others.
26 Making Smart Storage Decisions for DB2 in a Flash and SSD World


![Nutanix Platform Specifications - ServerProThai.com...HYBRID ALL FLASH HYBRID ALL FLASH HYBRID ALL FLASH 2x SSD: [960 GB, 1.92 TB or 3.84 TB], 4x HDD: [2 TB] 2x, 4x or 6x SSD:* [960](https://img.pdfslide.us/doc/110x75/5ec5c29d4b59e275ef4fa841/nutanix-platform-specifications-hybrid-all-flash-hybrid-all-flash-hybrid-all.jpg)