Embed Size (px)
Citation preview

Making Sense of Networks: Exploring How Network Participants Understand and Use Information From Social Network Analysis
John David Moore
Dissertation submitted to the faculty of the Virginia Polytechnic Institute and State University in partial fulfillment of the requirements for the degree of
Doctor of Philosophy
In Public Administration and Public Affairs
Robin H. Lemaire, Chair Max O. Stephenson Jr., Co-Chair
Karen M. Hult Stephanie L. Smith
(May 3, 2021) Blacksburg, VA
Keywords: collaboration, networks, sense-making

Making Sense of Networks: Exploring How Network Participants Understand and Use Information From Social Network Analysis
John David Moore
ABSTRACT
Many of today’s complex public issues are best addressed by multi-sectoral multi-organizational responses that include different types of organizations working together (Kettl, 2008; O’Toole, 1997). Social network analysis (SNA) of interorganizational networks has emerged as a useful tool for network managers to understand the structure and function of the complex networks in which they seek to manage (Human & Provan, 1997, 2000; Provan & Milward, 1995; Provan, Sebastian, & Milward, 1996; Provan, Veazie, Staten, & Teufel-Shone, 2005).
The output of an interorganizational SNA typically provides a range of information to network managers including network plots. The network plots provide visual representations of different aspects of the network by showing the kinds of ties between the actors in the network.
The information from network analyses can help network managers encourage systems thinking, see the different roles played by organizations, or identify links to outside resources among many other uses, but “will only have practical value to communities if it can be effectively presented, discussed, accepted, and acted on by community leaders and network participants [emphasis added].” (Provan et al., 2005, p. 610). However, little is currently known about if or how the information embedded in network plots is accepted or acted on by network participants.
The visual representations of the network (network plots) provided to network participants following a SNA are often open to a range of interpretations that may or may not align with the findings of the analyst or the intended use by network managers, raising many interesting questions. Little is currently known about how differently situated network participants might interpret the same network plots differently. Nor do we understand what factors might influence different individuals or organizations to come up with different interpretations.
After conducting a SNA and presenting it to network participants, I conducted interviews with a range of different representatives from participating organizations. I used a particular form of semi-structured interview, a situated micro-element interview from Dervin’s Sense Making Methodology (SMM) (Dervin, Foreman-Wernet, & Lauterbach, 2003). I then analyzed the interview transcripts using standard qualitative coding methods (Bailey, 2007) to see if themes emerged that addressed the research questions.
I found that most informants had trouble extracting information and meaning from their examination of the plots without that meaning and interpretation being provided by the expert analyst. I posit some potential explanations for why that might be so in the case I studied. I then turn to some interesting methodological considerations that emerged from taking the perspectives of network participants seriously.
Finally, I synthesize the subject area and methodological findings into a refined framework for sense-making around network plots and offer propositions and potential approaches for future research.

Making Sense of Networks: Exploring How Network Participants Understand and Use Information From Social Network Analysis
John David Moore
GENERAL AUDIENCE ABSTRACT
Many of today’s complex public issues are best addressed by multi-sectoral multi-organizational responses that include different types of organizations working together (Kettl, 2008; O’Toole, 1997). Social network analysis (SNA) of interorganizational networks has emerged as a useful tool for network managers to understand the structure and function of the complex networks in which they seek to manage (Human & Provan, 1997, 2000; Provan & Milward, 1995; Provan, Sebastian, & Milward, 1996; Provan, Veazie, Staten, & Teufel-Shone, 2005).
The output of an interorganizational SNA typically provides a range of information to network managers including network plots. The network plots provide visual representations of different aspects of the network by showing the kinds of ties between the actors in the network.
The information from network analyses can help network managers encourage systems thinking, see the different roles played by organizations, or identify links to outside resources among many other uses, but “will only have practical value to communities if it can be effectively presented, discussed, accepted, and acted on by community leaders and network participants [emphasis added].” (Provan et al., 2005, p. 610). However, little is currently known about if or how the information embedded in network plots is accepted or acted on by network participants.
The visual representations of the network (network plots) provided to network participants following a SNA are often open to a range of interpretations that may or may not align with the findings of the analyst or the intended use by network managers, raising many interesting questions. Little is currently known about how differently situated network participants might interpret the same network plots differently. Nor do we understand what factors might influence different individuals or organizations to come up with different interpretations.
After conducting a SNA and presenting it to network participants, I conducted interviews with a range of different representatives from participating organizations. I used a particular form of semi-structured interview, a situated micro-element interview from Dervin’s Sense Making Methodology (SMM) (Dervin, Foreman-Wernet, & Lauterbach, 2003). I then analyzed the interview transcripts using standard qualitative coding methods (Bailey, 2007) to see if themes emerged that addressed the research questions.
I found that most informants had trouble extracting information and meaning from their examination of the plots without that meaning and interpretation being provided by the expert analyst. I posit some potential explanations for why that might be so in the case I studied. I then turn to some interesting methodological considerations that emerged from taking the perspectives of network participants seriously.
Finally, I synthesize the subject area and methodological findings into a refined framework for sense-making around network plots and offer propositions and potential approaches for future research.

iv
Dedication
I dedicate this dissertation to my wife, Ronda Moore, and my children, Jesse Moore, Emma Moore and Abigail Moore. I greatly appreciate their perseverance and sacrifice on this long journey. I also dedicate it to my parents, who believed in me long before I believed in myself.

v
Acknowledgements
First, I would like to acknowledge Dr. Max Stephenson Jr., my mentor and colleague since 2003. His intellect and humanity have been an inspiration. I deeply appreciate the community of curious minds he has cultivated at the Institute for Policy and Governance where I am employed. His willingness, as co-chair of my committee, to give my chapters a first read-through has taught me much about clear writing and strong arguments—though admittedly, I still have much to learn.
Next, I would like to thank Dr. Robin Lemaire, my chair and the subject matter expert for my dissertation topic, for her many hours of work on the Social Network Analysis (SNA) that was the object of my study. I could not have done the study I did if she had not been willing to assist in creating a network analysis for me to study. I am fortunate she chose to come to Virginia Tech for her first academic appointment. I was stuck and likely would not have restarted my studies without access to such a leader within the field of my interest. It is hard to believe it has been seven years since we first met and discussed working together on SNA studies of some of the networks in which I was involved. I also appreciate her holding my feet to the fire to raise the level of scholarly engagement in my writing and for her expansive knowledge of the literature with which I have been trying to engage.
Next, I would like to thank Dr. Karen Hult for agreeing to serve on my committee. I was a student in one of her classes in the Spring of 2007 when the 4/16 shooting brought an abrupt end to the semester. I appreciate her willingness, years after the fact, to allow me to complete that course. It was in that same course where she exposed me to Flyvbjerg’s ideas about phronetic social science which have had a profound influence on how I see my work. I appreciate her for hanging in there with me.
Dr. Stephanie Smith was a late addition to the committee because a previous member had departed the university. I appreciate her for jumping in at the last minute.
I would also like to acknowledge the support of my other colleagues at the VT Institute for Policy and Governance, Mary Beth Dunkenberger, Liz Allen, Laura Nagel, Dr. Melony Price-Rhodes, Karen Boone and Heather Parrish. I could not have been successful in my funded project work while continuing my studies without their support.
I would also like to acknowledge the greater community at the Center for Public Administration and Policy, especially as it existed at the start of my studies many years ago. I was privileged to have taken classes from Dr. John Rohr, Dr. Gary Wamsley and Dr. Larkin Dudley. Although they were recently retired, Dr. Charles Goodsell and Dr. Orion White were still active and inspiring members of CPAP’s intellectual community. High Table, “Madeiras,” Thomas-Conner and the Blacksburg Manifesto all made the place unique and special and contributed greatly to my enthusiasm for an academic life.
I would also like to acknowledge the many nonprofit and public agency partners and collaborators that have been a part of the networks I have studied, including Smart Beginnings, the Giles Early Education Project, NRV Cares, New River Community Action, Total Action for Progress, the Western Virginia Workforce Development Board, the New River Valley/Mount Rogers Workforce Investment Board and the United Way of the Roanoke Valley. Additionally, I would like to acknowledge the contributions of every member of the network that I studied in this dissertation and their willingness to share their information and participate in the network study. I would especially like to

vi
acknowledge the key informants who sat with me for long complex interviews. I hope I have represented their sense-making well.
Lastly, though I have also dedicated this work to them, I want to acknowledge the support of my wife and children toward helping me complete this process. There have been many lost weekends and nights when my attention was taken by the dissertation process. I could not have done it without their understanding and support.

vii
Table of Contents
List of Tables ...................................................................................................................... x List of Figures .................................................................................................................... xi Chapter 1: Introduction ....................................................................................................... 1
Background ................................................................................................................... 2 Purpose of Study ........................................................................................................... 3 Guiding Questions ........................................................................................................ 5 Conceptual Frameworks ............................................................................................... 8 Research Approach ..................................................................................................... 11
Chapter 2: Relevant Frameworks ...................................................................................... 15 Part I: Phronetic Social Science .................................................................................. 15 Part II: Network Management in Public Administration ............................................ 16
Framework for network change. ........................................................................... 25 Definitions............................................................................................................. 26 Ideal types or scenarios. ........................................................................................ 30
Part III: The Sense-Making Methodology .................................................................. 40 Chapter 3: Methods ........................................................................................................... 48
Part I: Case Selection .................................................................................................. 48 Case selection background. ................................................................................... 49 Geographic delimitations. ..................................................................................... 50 Study timeline. ...................................................................................................... 50
Part II: Collection of Relationship Data ...................................................................... 51 Part III: Network Analysis .......................................................................................... 57 Part IV: Network Plots ................................................................................................ 58 Part V: Key Informant Selection and Recruitment ..................................................... 66 Part VI: Interview Methodology ................................................................................. 70 Part VII: Interview Questions/Protocol ...................................................................... 74 Part VIII: Analysis and Coding of Interview Data ..................................................... 74
Transcription. ........................................................................................................ 74 Open coding. ......................................................................................................... 74 Focused coding. .................................................................................................... 76 Theoretic coding. .................................................................................................. 77
Chapter 4: Subject Area Findings ..................................................................................... 86 Question 1a: Do Participants Make Sense of Network Plots? .................................... 86 Question 1b: Do They Do So in Ways That Could Influence Collaborative Actions? .................................................................................................................... 100 Question 2a: If So, How Do Participants Make Sense of Network Plots? ............... 102
Sense-making strategies. ..................................................................................... 104 Network, organization and individual perspectives. ........................................... 107 Past, present and future orientations. .................................................................. 109
Question 2b: What are the potential implications for network managers? ............... 111 Question 3a: If Not, Why Not (or How So)? ............................................................ 114 Question 3b: If Not, What Do Participants Think of Network Plots? ...................... 118 Question 3c: What Are the Potential Implications for Researchers and Analysts? ................................................................................................................... 118

viii
Question 4: What Factors Might Influence an Individual’s Sense-Making? ............ 123 Situation movement state. ................................................................................... 123 Alignment with cognitive social structures. ........................................................ 124 Individual versus group processes. ..................................................................... 128 Network change models. ..................................................................................... 128
Chapter 5: Methodological Findings .............................................................................. 132 The Sense-Making Methodology .............................................................................. 132 Boundary Setting and Sense Making ........................................................................ 133 Relationship Types and Sense Making ..................................................................... 136 Unconfirmed Ties and Sense Making ....................................................................... 138 Survey Response Patterns ......................................................................................... 142
Builder................................................................................................................. 143 Informer. ............................................................................................................. 144 Floater. ................................................................................................................ 144 Skipper. ............................................................................................................... 145 Completer. ........................................................................................................... 146 Mixer. .................................................................................................................. 146
The Egocentric View and Sense Making .................................................................. 151 The completing realist. ........................................................................................ 153 The mixing realist. .............................................................................................. 154 The low reality poser. ......................................................................................... 156 Above it all. ......................................................................................................... 157 The wall flower. .................................................................................................. 158 The ghost. ............................................................................................................ 159 Out to lunch......................................................................................................... 160 Wrapping up........................................................................................................ 161
Chapter 6: Synthesis and Conclusions ............................................................................ 163 Limitations ................................................................................................................ 163
Single case study. ................................................................................................ 163 Atypical approach to analysis design. ................................................................. 163 Non-representative informants. ........................................................................... 164 Non-response bias. .............................................................................................. 164 Unstructured interviewing approach. .................................................................. 165
Summary of Insights ................................................................................................. 165 Question 5a: What Existing Theories From the Literature Might Further Elaborate the Process? .............................................................................................. 175 Question 5b: What New Theories Could Be Developed or Tested? (Future Research) ................................................................................................................... 177
How to interpret and use Figure 35. .................................................................... 178 The information extraction threshold. ................................................................. 182 The information acceptance threshold. ............................................................... 185 The movement state threshold. ........................................................................... 189 The collaborative disposition threshold. ............................................................. 193
Future Methodological Research Directions ............................................................ 195 Response patterns. ............................................................................................... 195 Egocentric plots. ................................................................................................. 197

ix
User roles. ........................................................................................................... 199 Approaches to tie confirmation. .......................................................................... 199
Implications and Concluding Thoughts .................................................................... 201 References ....................................................................................................................... 205 Appendix A: Institutional Review Board Documents—Survey Phase .......................... 214 Appendix B: Institutional Review Board Documents—Interview Phase ...................... 255 Appendix C: Summary of Field Notes Concerning Sense Making Methodology
Objects and Elements ................................................................................ 287 Appendix D: Hypothetical Example of Sense Making Methodology Interview ............ 290 Appendix E: Sense Making Methodology Interview Questionnaire ............................. 293

x
List of Tables
Table 1 Summarizing the Phronetic Social Science Guidelines .................................. 17 Table 2 Type of Tie ...................................................................................................... 54 Table 3 Relationship Intensity ..................................................................................... 55 Table 4 System of Representations Used in Network Plots ......................................... 58 Table 5 Popularity of Plots for Interview Discussion (Out of 11) ............................... 67 Table 6 Interviews Targeted and Obtained .................................................................. 69 Table 7 Repeated Level 2 Triangulations and Probes .................................................. 73 Table 8 Interview Questions and Number of Times Used ........................................... 75 Table 9 Coding of What Informants Saw in Plots ....................................................... 78 Table 10 Coding of Suggested Uses of Plots ................................................................. 80 Table 11 Coding Missing Relationships and Other Problems With the Study .............. 83 Table 12 Perspectives of Informants .............................................................................. 84 Table 13 Sense-Making Strategies of Informants .......................................................... 85 Table 14 Is It Sense-Making? ........................................................................................ 90 Table 15 Distribution of Categories of Use Statements ................................................. 91 Table 16 Sense-Making Strategies With Examples ....................................................... 95 Table 17 Strongest Examples of Collaborative Actions Arising From Network
Plots ............................................................................................................... 102 Table 18 Collaborative Challenges .............................................................................. 105 Table 19 Participant Recognition of Study Limitations ............................................... 116 Table 20 The Situation Movement State ...................................................................... 124 Table 21 Builder Response Pattern .............................................................................. 144 Table 22 Informer Response Pattern ............................................................................ 144 Table 23 Floater Response Pattern ............................................................................... 145 Table 24 Skipper Response Pattern ............................................................................. 146 Table 25 Completer Response Pattern ......................................................................... 147 Table 26 Mixer Response Pattern ................................................................................ 147 Table 27 Distributions of Response Patterns Grouped by Dominant Response
Pattern ........................................................................................................... 148 Table 28 Organizations With Robust Ties ................................................................... 150 Table 29 Emerging Insights and Potential Implications .............................................. 166

xi
List of Figures
Figure 1 Theoretical framework. ..................................................................................... 6 Figure 2 Framework for network change. ..................................................................... 26 Figure 3 Static network at equilibrium (balanced fit). .................................................. 31 Figure 4 Network change (general model). ................................................................... 32 Figure 5 Endogenous network adaptation (in emergent networks). .............................. 33 Figure 6 Endogenous network evolution (in emergent networks). ............................... 35 Figure 7 Exogenous network redirection. ..................................................................... 36 Figure 8 Exogenous network enhancement. .................................................................. 37 Figure 9 Exogenous network restructuring. .................................................................. 39 Figure 10 Network awareness (general model). .............................................................. 40 Figure 11 Sense-making illustration. ............................................................................... 42 Figure 12 Any confirmed tie at the program level. ......................................................... 59 Figure 13 All confirmed relationships (organizational level). ........................................ 60 Figure 14 Most robust confirmed relationships (organizational level). .......................... 60 Figure 15 All four relationship-type plots side by side. .................................................. 61 Figure 16 Confirmed information sharing. ...................................................................... 61 Figure 17 Confirmed coordinated referrals. .................................................................... 62 Figure 18 Confirmed integrated services. ....................................................................... 62 Figure 19 Services fragmentation with removal of TAP and Salvation Army (and
RADAR, a nonrespondent). ............................................................................ 63 Figure 20 Confirmed shared resources. ........................................................................... 63 Figure 21 Resource fragmentation with removal of TAP and Goodwill (and
RADAR, a nonrespondent). ............................................................................ 64 Figure 22 Broader information sharing network. ............................................................ 64 Figure 23 Broader resource sharing network. ................................................................. 65 Figure 24 Gap priorities. ................................................................................................. 65 Figure 25 Linked gaps. .................................................................................................... 66 Figure 26 Robust relationships with response patterns identified. ................................ 149 Figure 27 The completing realist. .................................................................................. 153 Figure 28 The mixing realist. ........................................................................................ 155 Figure 29 The low-reality poser. ................................................................................... 156 Figure 30 Above it all. ................................................................................................... 157 Figure 31 The wall flower. ............................................................................................ 159 Figure 32 The ghost. ...................................................................................................... 160 Figure 33 Out to lunch. .................................................................................................. 161 Figure 34 A revised model for sensemaking in networks. ............................................ 177 Figure 35 Refined framework for sense-making in networks. ...................................... 179 Figure 36 Concepts for mapping. .................................................................................. 181

1
Chapter 1: Introduction
Many of today’s complex public issues are best addressed by multi-sectoral multi-
organizational responses that include different types of organizations working together
(Kettl, 2008; O’Toole, 1997). The field of network management has evolved to help
public network managers address the complexities of managing in multi-organization
environments (Agranoff & McGuire, 2001).
Social network analysis (SNA) of interorganizational networks has become a
useful tool for network managers to understand the structure and function of the complex
networks in which they seek to manage (Human & Provan, 1997, 2000; Provan &
Milward, 1995; Provan, Sebastian, & Milward, 1996; Provan, Veazie, Staten, & Teufel-
Shone, 2005). The output of an interorganizational SNA typically provides a range of
information to network managers including identification of network structures (bridges,
gaps, isolates, etc.), whole network variables (such as density and centralization),
findings that connect the study to the larger scholarly literature, recommendations from
the analyst, and the network plots. The information from network analyses can help
network managers encourage systems thinking, see the different roles played by
organizations, or identify links to outside resources among many other uses, but “will
only have practical value to communities if it can be effectively presented, discussed,
accepted, and acted on by community leaders and network participants [emphasis
added].” (Provan et al., 2005, p. 610).
However, little is currently known about if or how the information embedded in
network plots is accepted or acted on by network participants, which provides a challenge
for network managers seeking to improve performance through enhanced collaboration

2
by network participants. This study contributes to the literature on network management
by exploring what sorts of information network participants extracted from their
examination of network plots, what it meant to them, and how they thought they might
use it.
Background
As the implementation and administration of public programs has moved from
hierarchical and bureaucratic structures to complex forms of cross-sectoral organizational
collaboration, public administration researchers have increasingly turned to network
analyses of interorganizational relationships to understand governance and
implementation processes (Lecy, Mergel, & Schmitz, 2014). As the use of network
approaches has increased, there have also been increasing calls for public administrators
to be cognizant of the networked implementation environments in which they function
(O’Toole, 2015). The emerging field of network management draws from a range of
scholarly literatures to provide alternatives to bureaucratic or market-based management
approaches that include management strategies (Kickert, Klijn, & Koppenjan, 1997),
management processes (Agranoff & McGuire, 2001; McGuire, 2002), managerial
networking (Meier & O’Toole, 2005), collaborative governance (Ansell & Gash, 2008;
Emerson, Nabatchi, & Balogh, 2012), and executive functions (Lemaire, 2012) among
other approaches.
A purpose-oriented network is “a network comprised of three or more
autonomous actors who participate in a joint effort based on common purpose” (Carboni,
Saz-Carranza, Raab, & Isett, 2019, p. 210). Managing in purpose-oriented public
networks requires network managers to understand the interrelations between operating

3
context and a network’s performance toward its purposeful goals, the “dialectics between
engineered and emergent network processes and structures, and the interplay between
individual, organizational, dyadic and network [interests]” (Nowell & Kenis, 2019,
p. 192). The outputs of SNA, while focused on the structural aspect of the overall
network, also provide touchstones for developing a deeper understanding of the network
dynamics emanating from those interrelations, dialectics and tensions. Numerous studies
have shown that the findings and recommendations from network analysis can be used by
network managers to improve network performance (Gulati, Lavie, & Madhavan, 2011;
Herranz, 2010; Kenis & Provan, 2009; Lemaire & Provan, 2018).
Purpose of Study
However, more work is needed, particularly around the ways networking
behaviors shape performance, the tensions between management at the network and
organizational scales, and the factors that shift network dynamics (O’Toole, 2015).
Another area where more work is needed is improved engagement between researchers
and practitioners which builds theory grounded in the experience of practitioners (Isett,
Mergel, LeRoux, Mischen, & Rethemeyer, 2011). Network plots are one output of the
SNA that is both engaging and accessible to the practitioners within the networks that are
the objects of SNA’s analysis. However, T. A. Scott and Ulibarri (2019) caution against
the use of network plots and argue that they are neither legitimate evidence, nor a finding
of SNA. Though they rightly point out that network plots can be unintelligible, unsightly
and can take many potential layouts, they also claim that “while network visualization
can sometimes be suitable for demonstration, it is certainly not suitable as a basis for
robust theoretical inference” (T. A. Scott & Ulibarri, 2019, p. 94). And yet the process of

4
conducting SNA often requires that network participants provide researchers/analysts
with information about their relationships, which also sometimes requires that those
researchers/analysts provide network relationship data back to those network participants,
usually in the form of various network plots. Making inferences from those plots may not
be robust science, but I suggest that network participants routinely make inferences from
such plots, likely in ways poorly understood by researchers and with unknown
consequences for network dynamics.
The purpose of this study was to gain understanding about what information
network participants extracted from their examination of network plots, what that
information meant to them, and how they thought they might use it—a process I frame
theoretically as sense-making (Dervin, Foreman-Wernet, & Lauterbach, 2003). Because
network participant’s sense-making around network plots has the potential to connect
operating context to broader network goals, to differentiate between emergent and
engineered responses, and to highlight tensions between individual, organizational and
network interests, this research will contribute to new understandings about the network
dynamics emanating from those interrelations, dialectics and tensions in purpose-oriented
public networks (Nowell & Kenis, 2019). More specifically, because my study explores
how a novel information source, the network plot, influences the thinking of network
participants in ways that could lead to changes in networking behavior that in turn could
change network dynamics, it contributes to better understandings around some of the
remaining gaps in the research on networks and networking identified by O’Toole
(2015). My focus is on the perceptions and sense-making of network participants rather
than those of network managers or researchers. As such, because this research builds

5
theory grounded in the experience of practitioners, it has the potential to improve
engagement between researchers and practitioners as called for by Isett et al. (2011).
Finally, the research will enhance the value of SNA for communities by focusing the
attention of network managers on potential processes for the results of SNA to be
“effectively presented, discussed, accepted, and acted on by community leaders and
network participants” (Provan et al., 2005, p. 610).
Guiding Questions
The visual representations of a network (network plots) that researchers/analysts
or network managers sometimes provide to network participants following a SNA are
often open to a range of interpretations that may or may not align with the findings of the
analyst or the intended use by network managers, raising many interesting questions.
While it is well-understood that education and incentives do not always lead reliably to
behavior change (Strassheim, 2019), it is possible that the social nature of information
contained in a network plot also provide motivations for change that enhance the
usefulness of information. In that case, can considering the information in network plots
induce network participants to engage in different collaborative activities or jockey for an
improved position in the network that might influence network performance? Or, because
of their ambiguity and complexity, might there need to be processes of community
presentation and discussion to unlock the potential generative powers of the information
in the network plots? There is little in the literature that speaks to whether network
participants might use the information in network plots to advantage themselves or their
organization’s interests over the interests of the network.
6
Little is currently known about how differently situated network participants
might interpret the same network plots differently. Nor do we understand what factors
might influence different individuals or organizations to come up with different
interpretations. Are there certain types of plots or ways analysts present the plots that
make them more or less difficult to interpret or which lead to different interpretations of
the information contained therein? At this point, we just don’t know.
Addressing these many questions would likely require multiple studies of
different designs. As a starting point for probing these questions I have developed a basic
theoretical and conceptual framework which led directly to my specific research
questions (See Figure 1).
Figure 1. Theoretical framework.
At the most abstract level, my study examines thought that arises from an
encounter with previously unknown information, which could lead to action. Thought
and action are connected and inseparable through phronesis, which is defined as thought
capable of action (Flyvbjerg, 2001). As seen in the diagram above, I take that abstract

7
theoretical framework and map onto it the concepts specific to this study—the
information is the network plots, the thought is the sense-making by network participants,
and the potentially resulting action is collaboration.
The information source whose implications I explored was the collection of
network plots associated with a social network analysis of programmatic and
organizational relationships in a regional system of nonprofit and public sector human
service agencies that some network managers hoped would evolve into a purpose-
oriented network with new broad goals relating to poverty alleviation and family self-
sufficiency. I modeled the thought component of phronesis as the self-reported sense-
making of the individual participants involved in the network analysis. The sense-making
I use in this conceptual mapping is the sense-making methodology developed by Dervin,
which consists of ways of thinking about new information that can be used in
constructing/deconstructing bridges over gaps that inhibit action (Dervin, 2015). My
study explored if and how sense-making emerged for participants from examination of
the network plots. Also, within the conceptual mapping, sense-making may or may not
lead to the potential action of interest, which is collaboration. By better understanding the
collaborative choices that emerge from participants’ sense-making resulting from
contemplation of the network plots, this study contributes to a better understanding of
how network activities, structure and performance could be influenced by participants’
reactions to the information introduced to the network through the distribution of the
plots from a network analysis.

8
Mapping these specific concepts onto the abstract model in Figure 1 yields the
primary research questions. The primary research questions addressed in this study are as
follows:
1. Do network participants make-sense of network plots in ways that could
influence their collaborative actions?
2. If so, how do network participants make sense of network plots and what are
the potential implications for network managers?
3. If not, why not? In those cases, what do participants think of the network plots
and what are the potential implications for researchers and analysts?
4. What factors may influence the sense-making of individuals and how might it
vary?
5. Based on the results of the investigation, what existing theories from the
literature might further elucidate this process or what new theories could be developed
and tested?
Conceptual Frameworks
As I detail in Chapter 2, my approach for addressing these issues draws on three
distinct frameworks from different scholarly literatures--one analytic, one topical and one
methodological.
I drew analytic inspiration from the framework of phronetic social science
(Flyvbjerg, 2001) which promotes methodological guidelines such as focusing on values,
placing power at the core of analysis, getting close to reality, emphasizing little things,
looking at practice before discourse, studying cases and contexts, asking “how?,” joining
agency and structure and dialoging with a polyphony of voices. Though inspired by this

9
framework, I did not attempt to conduct pure phonetic social science in this research.
Instead, phronetic social science influenced the type of study that I wanted to do. I sought
to do a qualitative case study in which I looked at practice, considered context, asked
how and value questions, emphasized little things and drew from many voices. Although
I do not expect my study to make a contribution to the growing body of phronetic social
science research (Flyvbjerg, Landman, & Schram, 2012), it was key in my selection of
Dervin’s Sense-Making Methodology (Dervin et al., 2003) as a means of gathering
information from informants to address my research questions.
The topical filed to which my study contributes is the growing literature on public
network management (Agranoff & McGuire, 2001; Bryson, Crosby, & Stone, 2015; Isett
et al., 2011; O’Toole, 2015), more specifically to the body of network management
research under the Provan School for which SNA is an important analytic tool (Provan &
Kenis, 2008; Provan & Lemaire, 2012; Provan et al., 2005). Although my study looks at a
single point in time, I examine thought capable of action, potentially influencing network
participants’ subsequent collaborations and other network activities which reshape
network structure, both with consequences for network performance. For this reason, the
framework within network management to which my study contributes is an evolving
understanding of network dynamics (Ahuja, Soda, & Zaheer, 2012; Gulati & Gargiulo,
1999; Gulati et al., 2011; Provan, Huang, & Milward, 2009; Rho, 2013). I draw on a
range of ideas from the network dynamics and collaborative governance literatures such
as integrating levels of analysis (Berry et al., 2004), connecting collaborative processes
and outcomes (Ansell & Gash, 2008), distinguishing between antecedents and
consequences of network action nested within contexts (Emerson et al., 2012),

10
connecting agency and structure (Ahuja et al., 2012), and incorporation of exogenous
factors (Kenis & Provan, 2009). Though I draw from these various sources among others,
in Chapter 2 I develop my own simplified nomenclature and framework in which I can
delineate the contributions of my study. In future research, I may then be able to connect
my findings and frameworks to developments in network dynamics conceived by Nowell
and Kenis (2019) as an “architecture of complexity of purpose-oriented networks”
(p. 191).
Consonant with the philosophical perspectives of phronetic social science
research, I adopted Dervin’s sense-making methodology (Dervin et al., 2003) as my
methodological approach for gathering data from informants to address the research
questions.
In the most general sense, sense-making (that which is the focus of study in the Sense-Making approach) is defined as behavior, both internal (i.e. cognitive) and external (i.e. procedural) which allows the individual to construct and design his/her movement through time-space. Sense-making behavior, thus, is communicating behavior. Information seeking and use is central to sense-making (as it similarly is seen as central to all communicating) but what is meant by these terms is radically different than what is typically meant in the positivistic tradition. (Dervin, 1983, p. 3)
I selected this methodological framework because it 1) focuses on the cognitive
processes that mediate between information and action, 2) was designed to capture the
system user’s perspective independent of the system designer’s perspective, 3) provides
safeguards against the researcher introducing their own conceptual frameworks and
biases, and 4) provides a concrete approach for unearthing significant moments that
precede collaborative action and inaction (Dervin et al., 2003). Finally, one of the more
intriguing implications of using this methodology for the proposed research is the
opportunity to build on Dervin’s insight that time-space bound measures (specifically

11
situated movement states) “account for more variance in information uses than either
across time-space and a priori time-space measures” (i.e., demographics or assigned
roles; Dervin et al., 2003, p. 263). Because this particular flavor of sense-making is not
well known within public administration, I provide a brief overview of its components
and their alignment with the goals of this study in Chapter 2 before moving into a
description of its methodological approach to interviewing in Chapter 3.
Research Approach
To address these research questions, I conducted a single case study of a
prospective network of human service sub-networks in Roanoke, Virginia in the fall of
2016. The study focused on the United Way of the Roanoke Valley of Virginia’s family
self-sufficiency initiative, which is intended to facilitate collaborative action that will lift
10,000 families in that region out of poverty by 2030. Following development and
dissemination of a social network analysis of the interorganizational relationships
involved in the initiative, I collected data using semi-structured interviews of network
participants using Dervin’s Sense-Making Methodology (Dervin et al., 2003), specifically
her sense-making situated micro-element interview, to learn how participants make sense
of the network plots. I then followed a standard social science approach of qualitative
analysis of interview transcripts including open coding, focused coding, and theoretic
coding to identify potential themes (Bailey, 2007).
In Chapter 3, I begin by describing the case selection process and potential
limitations arising from this case. I then describe the collection of relationship data, the
conduct of the network analysis and the creation of the network plots that are the
information source studied in this research. Next, I discuss the process of selecting key

12
informants for the interview process and elaborate on the SMM interview methodology
and the resulting questionnaire and questioning process. Finally, I present the coding and
counts across interviews that emerged from the process of open, focused and theoretic
coding.
In Chapter 4, I take the themes that emerged from the interviews and apply them
to each of the research questions. In general, I found only weak or mixed support for the
notion that examination of network plots by network participants, by itself, led to sense-
making capable of leading to collaborative actions. The dominant theme that emerged, by
far, was a sense of something missing or a sense of confusion, both of which seemed to
limit the network participant’s sense-making and their perception of the usefulness of the
plots. I offer a range of possible explanations for why this might be so in the case I
studied, including the size or density of the network presented, the exogenous role of the
United Way in seeking to restructure the purpose of existing networks, the boundaries of
the network as defined by the United Way, lack of participatory processes in defining the
network and the network relationships—sometimes possibly resulting in tie confusion,
and finally the way unconfirmed ties are represented and not represented in the network
plots.
In Chapter 5, I take up some methodological considerations that emerged by
taking the perspectives of network participants seriously. First, I discuss how the sense-
making methodology itself helped and hindered the process of obtaining data from
informants and how the roster of questions may have led to the prevalence of certain
themes that emerged during analysis. Next, I draw on some of the observations shared by
informants to reinforce the importance of participatory processes in establishing network

13
boundaries and relationship types and which ultimately enhance the usefulness of SNA
for communities (Provan et al., 2005). Next, I turn to two findings related to the
collection and presentation of network data—survey response patterns and tie
confirmation. Several distinct patterns in the way different survey respondents filled in
the survey instrument could contribute to autocorrelation which would possibly bias the
representations of some network plots. For some plots, confusion around perceived
“missing ties” that were sometimes unreported and sometimes unconfirmed seemed to
confound the sense-making of some informants. Taking this perspective seriously, I
explore the potential utility of a different type of multiplex, first-order, ego-centric
network plot that explicitly shows all confirmed and unconfirmed ties of different types
for each organization in the network.
In Chapter 6, I consolidate the insights and potential propositions from both the
subject matter and methodological findings. I develop many of these into a layered model
of sense-making that incorporates the study findings with insights from Weick’s (1995)
framework for sensemaking in organizations. I posit some theoretical propositions that
might better elucidate the role of network plots as an information source that influences
network actions. Lastly, I suggest approaches to potential future research that may further
illuminate some of the methodological concerns I identified.
Given the increasing use and usefulness of SNA in understanding networks, it is
reasonable to expect that more and more network participants will begin to have access to
the novel information contained in network plots. In this study, I provide a start for better
understanding how network participants make-sense of network plots in ways that could
influence their collaborative choices. I develop propositions for future research that could

14
further expand that understanding. Continuing to build on these insights may help
network managers understand the implications of providing network plots to network
participants following SNA. The findings reinforce the importance of several aspects of
SNA design, implementation and dissemination and offer a few potentially important
new insights that researchers and analysts may consider in seeking to make network plots
more “sensible” to network participants. Continuing and expanding this work may help
researchers and analysts understand the potential impacts of their choices in how
networks are represented visually in network plots and underscore the importance of
participatory processes throughout the lifespan of the analysis if SNA is to have practical
value for communities.

15
Chapter 2: Relevant Frameworks
This chapter provides a review of three distinct frameworks I use in this study—
one analytic, one topical and one methodological—each of which comes from a different
scholarly literature. The analytic framework which inspires the type of study I sought to
conduct is Flyvbjerg’s phronetic social science. The topical framework from which I
draw and to which I seek to contribute findings is that of network management within
public administration. Finally, Dervin’s Sense-Making Methodology, in addition to
providing the methodological approach, provides a theoretical framework for connecting
the analytic tenets of phronetic social science to the practice of using network plots as an
information source by honing in on the information user’s perspective.
Part I: Phronetic Social Science
In the spirit of “ontological disclosure” (Wamsley, 1996), I drew analytic
inspiration from the framework of phronetic social science (Flyvbjerg, 2001). The
argument behind phronetic social science is that social science has lost relevance by
trying to emulate the natural sciences in seeking to produce explanatory and predictive
theory. Instead, Flyvbjerg argues, social science should focus its core strengths which are
to “contribute to reflexive analysis and discussion of values and interests” (Flyvbjerg,
2001, p. 3).
To operationalize this goal, phronetic social science promotes methodological
guidelines such as focusing on values, placing power at the core of analysis, getting close
to reality, emphasizing little things, looking at practice before discourse, studying cases
and contexts, asking “how,” joining agency and structure and dialoging with a polyphony
of voices. Though inspired by this framework, I did not attempt to conduct pure phonetic

16
social science in this research. Instead, phronetic social science influenced the type of
study that I wanted to do; a qualitative case study in which I looked at practice,
considered context, asked how and value questions, emphasized little things and drew
from many voices. Table 1 summarizes a chapter from Flyvbjerg’s (2001) “Making
Social Science Matter” that describes his phronetic social science guidelines, many of
which I have incorporated into this research, while others remain aspirational for future
directions this research could take.
Although I do not expect my study to make a contribution to the growing body of
phronetic social science research (Flyvbjerg et al., 2012), I see it as an important
additional lens into network management and network analysis. It strongly influenced the
type of study that I wanted to do, which was a qualitative case study in which I looked at
practice, considered context, asked how and value questions, emphasized little things and
drew from many voices. My respect for phronetic social science guidelines was also key
in my selection of Dervin’s Sense-Making Methodology (Dervin et al., 2003) as a means
of gathering information from informants to address my research questions.
Part II: Network Management in Public Administration
Organizational networks are increasingly used to implement policy and achieve
strategic objectives in communities as an alternative to integrated bureaucracies
comprising single organizations (Ulibarri & Scott, 2017). The transition to implementing
human services through networks is occurring in both the public sector and nonprofit
sectors, which are increasingly intermeshed in their operating environments (Bryson,
Crosby, & Stone, 2006; Bryson et al., 2015).

17
Table 1
Summarizing the Phronetic Social Science Guidelines
Guidelines How those guidelines influenced my approach Focusing on values
Balances instrumental rationality with value-rational questions such as Where are we going? Is it desirable? What should be done?
Rejects relativism by seeking “better” interpretations which build validity claims on previously valid interpretations, while also rejecting interpretations that can be shown to be invalid.
Placing power at the core of analysis
Poses questions of power and outcomes by asking: Who gains and who loses? Through what kinds of power relations? What possibilities are available to change existing power relations? And is it desirable to do so? What kinds of power relations are those asking these questions themselves a part?
Asks not only “Who Governs?” but what “governmental rationalities” are at work when those that govern govern?
Understands power conceptions as having six features. It is: 1. both productive and positive and not only restrictive and
negative 2. a dense net of omnipresent relations not localized in
institutions 3. ultradynamic, not just appropriated, but reappropriated in
relations of strength, tactics and strategies. 4. inseparable from knowledge, truth and rationality. Power is
knowledge and knowledge is power. 5. focused on process in addition to structure; how it is used,
not just who has it. 6. studied by engaging small questions, not just big ones.
Getting close to reality
Eschews “So what?” results. Stays close to the group being studied from data collection,
through data analysis, feedback and publication. Encourages researchers to consciously exposes themselves to
reactions from their surroundings, including negative ones. Emphasizing the little things
Asks little questions and gets thick descriptions. Engages with minutia in search of “important problems” because
small questions often lead to big answers. Takes its point of departure in local micropractices
Looking at practice before discourse
Recognizes that language can conceal practice. Disciplines discourse analysis with analysis of practice. Focuses on practical activity (actual daily practices) and
practical knowledge in everyday situations. Seeks to record events.

18
Guidelines How those guidelines influenced my approach Requires researcher initially take no position as to the truth-
value and significance ascribed by participants. Encourages researcher to attempt to understand the roles played
by practices studied in the total system of relations. Understands dubious rationalities in context and does not
dismiss them. Follows Nietzsche’s admonition that researchers should be
“curious to a vice, investigators to the point of cruelty, with uninhibited fingers for the unfathomable, with teeth and stomachs for the most indigestible…collectors from morning till late, misers of our riches and our crammed drawers.”
Studying cases and contexts
Focuses on particular circumstances and concrete examples. Understands practical rationality through cases in context. Judges in a way that is always context dependent.
Asking “How”? Focuses on dynamic questions “How?” rather than structural question “Why?”
Seeks both understanding and explanation. Seeks how best to get an honest story honestly told. Understands that narrative is our most fundamental form of
making sense of experience. Recognizes that narrative inquiries cannot start from explicit
theoretical assumptions. Joining agency and structure
Focuses on actor level and structural level and the relation between the two.
Encourages the “the internalization of externality and the externalization of internality.”
Connects macrolevel factors and actor’s choices. Seeks out information for answering questions about what
structural factors influence individual actions, how those actions are constructed, and their structural consequences.
Dialoging with a polyphony of voices
Includes many voices with none, including the researcher, claiming final authority.
Welcomes new interpretations for discussion. Employs a variety of perspectives as a substitute for objectivity. Understands that validity comes from dialog.
Summarized from Chapter 9 – Methodological guidelines for a reformed social science (Flyvbjerg, 2001).
Use of networks, rather than single organizations, has become particularly prevalent in
the field of human services where policymakers and funders task diverse groups of
organizations with service delivery to achieve collective goals (Provan & Lemaire, 2012).

19
Managing across inter-organizational networks, which are sometimes conceived
as a hybrid of market and hierarchy (Powell, 1990), to achieve a shared result can be a
fundamentally different enterprise than managing within a bureaucracy or executing
transactions in a market. Managing a network requires a different set of skills that may be
outside of many public manager’s experiences (Goldsmith & Eggers, 2004; Markovic,
2017; McGuire, 2002; Weber & Khademian, 2008), especially because managers cannot
exercise the same command and control functions over other actors in interorganizational
networks as they can over employees within organizations. For example, managers in
network contexts must put more focus on people-oriented behaviors than task-oriented
behaviors (Silvia & McGuire, 2010). Managing in networks often adds layers of
complexity to managers’ tasks because they must simultaneously manage within a
bureaucracy and across a network (O’Toole, 2015), which invoke different rationales,
motives and authorities (Hjern & Porter, 1981). Networks exist simultaneously at the
individual, organizational and interorganizational/network scales and rely on different but
interrelated foundations. Individual interpersonal networks build from actor similarity,
personality, proximity, and environmental factors; intra-organizational/interunit networks
build from interpersonal ties, functional ties, and organizational processes and control
mechanisms; and interorganizational networks build from motives, learning, trust, norms
and monitoring, equity and context (Brass, Galaskiewicz, Greve, & Tsai, 2004). Scholars
have recognized many uses that network research has for leaders and managers, including
needed competencies, process tools, governance structures, resource channels and
evaluation methods, as well as important open questions relating to accountability,
transparency, cross-sector platforms, trust and the role of adaptive systems (Kamensky,

20
2020). While the practice-turn in interorganizational network research has arguably
begun, it is still in the very early stages, meaning that researchers and scholars still have
little understanding of how network participants that are not leaders or managers operate
in interorganizational network contexts (Berthod, Grothe-Hammer, & Sydow, 2017).
Over the last 25 years, several dominant frameworks have emerged that still guide
scholar’s understanding of network management. The emerging field of network
management has evolved to meet the needs of network managers seeking to balance the
competing demands of managing at these multiple scales. To do so, network management
draws from a range of scholarly literatures to provide alternatives to bureaucratic or
market-based management approaches that include management strategies (Kickert et al.,
1997), management processes (Agranoff & McGuire, 2001; McGuire, 2002), managerial
networking (Meier & O’Toole, 2005), collaborative governance (Ansell & Gash, 2008;
Emerson et al., 2012), and executive functions (Lemaire, 2012) among other approaches.
In Managing Complex Networks (Kickert et al., 1997) offered a useful typology of
strategies for network management that looked at network level and game level
managerial activities aimed at influencing ideas and interactions within the network
context rather than controlling them. Agranoff and McGuire (2001) proposed a set of
management processes (or behaviors) for networks—activation, framing, mobilizing and
synthesizing—that offered an alternative to the textbook POSDCORB of management.
Activation, perhaps the most important of these processes, requires network managers to
be able to identify actors to incorporate into the network to help secure network
objectives; framing requires network managers to have an understanding of the roles of
network participants so that they can be arranged and integrated; mobilizing requires

21
network managers to recognize differing levels of agreement and commitment to network
goals held by network participants; and finally, synthesizing requires network managers
attend to the collaborative environment by conscientiously building relationships and
removing blockages to cooperation (McGuire, 2002). Effective managers in networks
must know who the key actors are in their networks and routinely engage with a wide
variety of those players (Meier & O’Toole, 2005). Lemaire (2012, 2020) and Lemaire
and Provan (2018) use social network analysis of a goal-directed human service network
(Provan, Fish, & Sydow, 2007) to underscore the importance of Barnardian (Barnard,
1938) functions of a network executive such as “providing a system of communication,
securing essential effort and formulating and defining purpose” (Lemaire, 2012, p. 27).
Within the three traditions in network research, the political science tradition
tends to focus on policy change and agenda setting, the sociological (social network
analysis) tradition tends to focus on aspects of network dynamics, and the public
management tradition tends to focus on management behavior and network performance
and outcomes (Berry et al., 2004). To understand how networks change as a result of the
interplay between managerial networking and network management, an area of
increasing importance within public administration, likely requires a combination of
these approaches (O’Toole, 2015; O’Toole & Meier, 2004). Over the past 20 years, the
“Provan School” has done much important work to bring together these streams to begin
to address the complex interrelationships between context, structure, management and
effectiveness. The work of the “Provan School” is extensive—too extensive to cover here
in its entirety—however, a brief overview of some of their work is helpful in showing the
contribution it has made by using SNA to connect network dynamics to performance

22
though the conscious efforts of network managers. Human and Provan (2000, 1997)
looked at connecting structure and strategy with internal network outcomes. Provan and
Sebastian (1998) looked at the multiplexity of ties and overlapping cliques (elements of
structure) and examined their effects on external network effectiveness. Kenis and Provan
(2009) extended this early work to more thoroughly examine antecedents and initial
conditions of network formation to begin building theory on evaluation and
accountability in network setting. Isett and Provan (2005) examined networks
longitudinally to begin forming theory of how the sector of participating organizations
(public, private or nonprofit) affects the evolution of network structure. Provan and Kenis
(2008) developed three general models of network governance (participant-governed,
lead organization and network administrative organization) and then began developing
predictors of which forms would be most effective in different contexts. Provan and
Huang (2012) and Huang and Provan (2007) have taken an ongoing longitudinal look at
the effects of resource tangibility on the interactions of network members. Social
Network Analysis in conjunction with other analytical techniques such as Qualitative
Comparative Analysis (QCA) can help identify theoretically possible causal connections
between elements of network structure and factors leading to improved network
performance, such as network members’ perceptions of congruence between
organizational and network purpose (Lemaire, 2020; Raab, Mannak, & Cambré, 2015).
In addition to the research findings coming from these various studies, many of
the studies also produced visual representations of the network being analyzed in the
form of various network plots. The output of an interorganizational SNA typically
provides a range of information including identification of network structures (bridges,

23
gaps, isolates, etc.), whole network variables (such as density and centralization),
findings that connect the study to the larger scholarly literature, recommendations from
the analyst, and the network plots.
The visual representations or plots are metaphors (Keast, Mandell, & Agranoff,
2013) and analogy that are not evidence or proof, but they can be means of
communicating perceived network structure and for activating new network activities to
address perceived shortcomings in network structure when researchers or analysts
provide them to network members. Network plots are an output of the SNA that is both
engaging and accessible to the practitioners within the networks that are the object of
SNA’s analysis. However, T. A. Scott and Ulibarri (2019) caution against the use of
network plots and argue that they are neither legitimate evidence, nor a finding of SNA.
Though they rightly point out that network plots can be unintelligible, unsightly and can
take many potential layouts, they also claim that “while network visualization can
sometimes be suitable for demonstration, it is certainly not suitable as a basis for robust
theoretical inference” (T. A. Scott & Ulibarri, 2019, p. 94). Making inferences from those
plots may not be robust science, but I suggest that network participants routinely make
inferences from such plots when they have access to them, likely in ways poorly
understood by researchers and with unknown consequences for network dynamics. When
provided back to the members of a network being studied, the information from network
analyses can help network managers encourage systems thinking, see the different roles
played by organizations, or identify links to outside resources among many other uses,
but “will only have practical value to communities if it can be effectively presented,
24
discussed, accepted, and acted on by community leaders and network participants
[emphasis added]” (Provan et al., 2005, p. 610).
Analysts have tremendous discretion in how they represent network data visually,
both numerically and graphically, which influences its effectiveness in communicating
information from the network analysis (Brandes, Kenis, Raab, Schneider, & Wagner,
1999). The network plots from a SNA can “provide network members the opportunity to
see the structure of the network and evaluate how it compares with what they expect or
want, and then to develop interventions on how to strengthen the network” (Lemaire &
Raab, 2020, p. 181-182).
Cognitive social structures (CSS) are defined as an individual’s perceived
cognitive representations of social networks (Krackhardt, 1987). Most network actors
have difficulty in accurately perceiving their social networks, especially at a distance
from relationships of which they are not a part (Krackhardt & Kilduff, 1999). Divergence
between an individual’s cognitive perceptions of networks and more concrete
representations provided by SNA are an increasing important topic for CSS research
(Brands, 2013; Burt, Kilduff, & Tasselli, 2013). Therefore, introducing network plots
from SNA to participants in a network has the potential to set up tensions between
participants’ individual CSS and the more tangible collective representations provided by
researchers/analysts and network managers, which could influence participants’
subsequent network actions and activities.
A “purpose-oriented network” is a broader conception of what might previously
have been labeled as a “goal-directed network” which recognizes that goal consensus is a
variable attribute of networks rather than a defining characteristic (Nowell & Kenis,

25
2019), which is an important distinction in the network I studied for this research.
Managing in purpose-oriented public networks requires network managers and
participants to understand the interrelations between operating context and a network’s
performance toward its purposeful goals, the dialectics between engineered and emergent
processes and structures, and the multi-level tensions between individual, organizational
and network interests (Nowell & Kenis, 2019). The outputs of SNA, while focused on the
structural aspect of the overall network, also provide touchstones for developing a deeper
understanding of the network dynamics emanating from those interrelations, dialectics
and tensions. Numerous studies have shown that the findings and recommendations from
network analysis can be used by network managers to improve network performance
(Gulati et al., 2011; Herranz, 2010; Kenis & Provan, 2009; Lemaire & Provan, 2018), but
thus far little attention has been paid to how the network plots influences the CSS of
network participants in ways that could influence their actions directly, with
consequences for network performance.
Framework for network change. To locate the aims and contributions of this
study within the broader network literature and to provide a vocabulary for discussing the
applications and limitations of my findings, I have developed a flexible framework for
modeling network change in purpose-oriented networks. In future chapters, I employ this
framework and its related nomenclature to provide a roadmap for future research
emerging from its findings and implications. I drew inspiration from the work of Ahuja et
al. (2012) but have sought in addition to bring together several other strands of network
scholarship to form my framework. In Figure 2, I present the various pieces of this
framework and how they come together in different ways. My aim was to craft a

26
framework amenable to a qualitative approach to building scenarios and cases to
understand network dynamics better, rather than a model for regression or other
mathematical techniques for determining correlation or causation among the various
factors in the framework. My intention was to develop a theoretical framework onto
which I could map the specific concepts of this study, much as I do with the concept
mapping in Chapter 1 (see Figure 1). Before discussing the individual elements of the
framework, I next provide definitions of key concepts.
Figure 2. Framework for network change.
Definitions. The subsections that follow define key terms.
Network dynamics. Network dynamics is the overall function of a network across
time (Ahuja et al., 2012), including changes in network structure, activity, and
performance. These dynamics cross different levels of analysis which are all
interconnected, including the network level, organizational/programmatic level and
individual level (Provan & Milward, 1995), and which can be analyzed from egocentric
27
or whole network perspectives (Provan & Lemaire, 2012). Network dynamics may
include factors beyond just a change in state such as the speed of change, buffers to
change, acceleration/deceleration of change or even the momentum of change over time.
Network change. Network change is any variation in the state of the network
environment, activities, structure or performance between two time periods. Of particular
importance is the change between the current state and a desired future state. Such shifts
can have a range of different antecedents and consequences (Brass et al., 2004). I
conceive of two types of network change based on the sources or antecedents of the
change—endogenous and exogenous. My logic in making a distinction between
endogenous and exogenous sources of change is that the while exogenous actors and
factors can influence the network, the participants within the network have relatively
little influence over those exogenous factors.
Operating environment. Networks exist within larger contexts, which I call the
network operating environment. I regard the operating environment as the local task
environment that is inexorably linked to the routine functioning of the network. Because
network participants have influence over their operating environment, I treat changes in
operating environments as an endogenous factor and a natural part of a network’s
evolution (Gulati, Wohlgezogen, & Zhelyazkov, 2012, p. 21).
Exogenous network change. Exogenous network changes arise from external
actors/participants or from the larger political, economic or social environment. With
exogenous factors there is a clearer relationship between cause (exogenous factor) and
effect (network change). Funders, both public and philanthropic, routinely seek to tap
into existing networks of organizations to achieve broader community goals, sometimes

28
seeking to change those aims or enhance network capacities to attain them (Eschenfelder,
2011).
Endogenous network change. Endogenous Network Change arises from network
actors/participants themselves or from changes in the operating environment to which
network actors react. With endogenous factors, the relations between cause and effect are
less clear since there are many feedback loops between operating environment, network
activities, network structure and network performance.
Network performance. Network performance is the ability of a network’s
members to meet their shared goals. It exists alongside organizational and individual
performance, which are persistently in tension, aligning at times and in conflict at other
times (Provan & Milward, 2001).
Network goals. Achieving network goals is one primary objective of network
activities. Collective community-wide goals may emerge from networks, especially
mature networks which recognize that larger community-wide factors influence their
operating environments (Innes & Booher, 1999). Community-wide goals can also be
established through public and private sector planning processes that involve a range of
stakeholders, including public agencies, interested community members and leaders,
affected populations, economic and political elites, and activists (Monroe & Butler,
2016).
Network activity. Network activity is any sort of activity conducted between or
among actors in the network. There are many models, frameworks and nomenclatures in
the literature addressing different aspects of network activity. Network activity includes
both political and community networking (Johansen & LeRoux, 2013; Meier & O’Toole,

29
2003). It can include a wide range of activities including activation, framing, mobilizing
and synthesizing (Agranoff & McGuire, 2001; McGuire, 2002). Types of network
activity can also form the basis of ties in a network such as the relationship dimensions
explored in this study—sharing information, coordinating referrals, integrating services
and sharing resources. These activities may form the basis of relationship types and
intensities, which become an element of structure.
Network structures. Network structures consists of actors (or nodes) and their
relationships (or ties). When actors and relationships are combined to form the network,
it yields a structure that has its own characteristics independent of the actors or
relationships, such as density, centralization, structural holes, bridges, isolates, etc. For
their part, actors have attributes such as the sector in which they work (public/private)
and their programmatic focus (health, education, income), organizational size and other
dimensions. Relationships may also exhibit a range of different types or intensities
(Lemaire & Raab, 2020).
Emergent networks. Emergent networks arise from consensus among network
actors to establish network performance goals and a shared willingness to engage in a
range of collaborative network activities intended to realize those aims (Provan &
Lemaire, 2012).
Mandated networks. Mandated networks are a special case of exogenous network
change in which a network is created or repurposed by outside actors, usually funders or
governmental agencies, who also play a dominant role in establishing performance goals,
determining network participants and prescribing acceptable network activities. (Ospina
& Dodge, 2005; Saz-Carranza, Iborra, & Albareda, 2016). More recent scholarship has

30
recognized that most networks, even mandated ones, contain a mix of both engineered
and emergent structures (Nowell & Kenis, 2019) that are dynamic over time.
Ideal types or scenarios. Next, I propose a set of idealized cases or ‘ideal types’
that connect the pieces of the framework in different ways that may have bearing on how
the information in network plots might be understood and used by network participants.
Network equilibrium. The network at equilibrium is a theoretical idealized case
where network activities and network structure are aligned to meet network performance
goals with little to no conflict with organizational or individual performance goals.
Network activities are ongoing through a stable network structure to consistently meet
performance goals. Network performance, defined as a network’s capacity to meet
network goals, results from a combination of network activities implemented through a
network structure (network actors within a set of network relationships) within a stable
operating environment (See Figure 3).
However, network performance is not always the sole objective of network actors.
In order for network activities to be performed by network actors, they often times must
align with the organizational activities focused on the organizational performance needs
of those participants. They may also need to align with individual activities linked to
personal performance needs. Likewise, network structures are not necessarily optimized
for network performance. Actors may seek particular positions within a network that
further individual or organizational performance goals rather than network performance.
While these competing objectives may be in a state of relative equilibrium or may exist in
a state of change, even when in equilibrium, they are probably only rarely completely
aligned, but at best persist in a state of balanced tension.

31
Figure 3. Static network at equilibrium (balanced fit).
Network change (general model). In the general model of network change,
changes in network performance arise from changes in network activities and/or network
structure (See Figure 4). Network performance could be improved or diminished as a
result. These changes generate feedback from organizational and individual performance
goals. Over time, network activities and network structure will find a new state of

32
equilibrium. Changes in network structure or activity themselves can arise from different
sources and in different ways, which I describe in the following types on network change.
Figure 4. Network change (general model).
Network adaptation. Network adaptation is a special case of network change
where changes in the operating environment induce a cumulative response of network
participants to change network structure or activities to maintain network performance.

33
When there are changes in the operating environment, endogenous network actors can
work together to adapt network activities and structure to maintain (or improve) network
performance. In either case, changes in network activities and structure emerge from
participating network actors, providing a general model of endogenous network
adaptation (See Figure 5).
Figure 5. Endogenous network adaptation (in emergent networks).

34
Network evolution. Network evolution is a special case of network change where
changes to network structure or activity arise from consensus among network participants
to improve network performance, which in turn precipitates changes to network structure
and/or activities. In similar fashion, actors can shift network performance toward new and
different types of goals. Participants can develop a level of consensus to improve
performance and/or also shift the goals of the network. In this case, changes in network
activities and structures result from actors aligning to support new performance goals,
providing a general model for endogenous network evolution (See Figure 6).
External actors can seek to influence network performance even though they do
not directly participate in network activities. External actors may include higher level
governmental institutions or philanthropic organizations funding network efforts.
External actors can also include social movement leaders and/or individual activists.
These external actors could seek to influence network performance in many ways.
Governmental entities could pass down new regulations, philanthropic organizations
could change funding priorities, and social movements or individual activists could
advocate or even demonstrate for change.
Network redirection. Network Redirection is a special case of exogenous network
change where external actors or forces promote a change in network goals to induce
network participants to shift network activities and structures (See Figure 7). The change
in goals is more than simply a change in the level of performance toward existing aims,
but the establishment of new and different goals not previously considered integral to
network performance. For example, external policymakers could take a system that
provides child care to working mothers and give it a new goal of ensuring that fathers
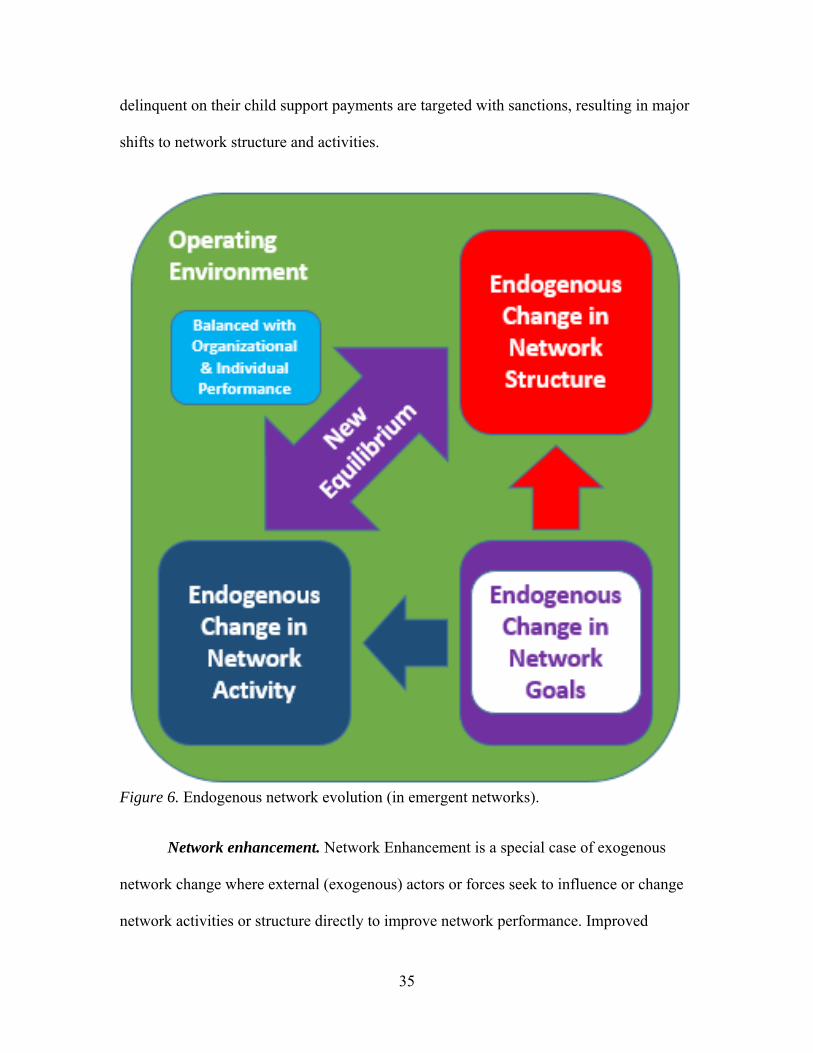
35
delinquent on their child support payments are targeted with sanctions, resulting in major
shifts to network structure and activities.
Figure 6. Endogenous network evolution (in emergent networks).
Network enhancement. Network Enhancement is a special case of exogenous
network change where external (exogenous) actors or forces seek to influence or change
network activities or structure directly to improve network performance. Improved

36
performance may be defined as more consistently meeting network goals or raising
performance targets for established goals (See Figure 8). Such shifts could seek a higher-
level attainment of existing goals or they could seek changes in those aspirations. In
either case, such efforts can be described by the basic model of network change presented
above in which shifts in network activities and structure lead to new levels of network
performance.
Figure 7. Exogenous network redirection.
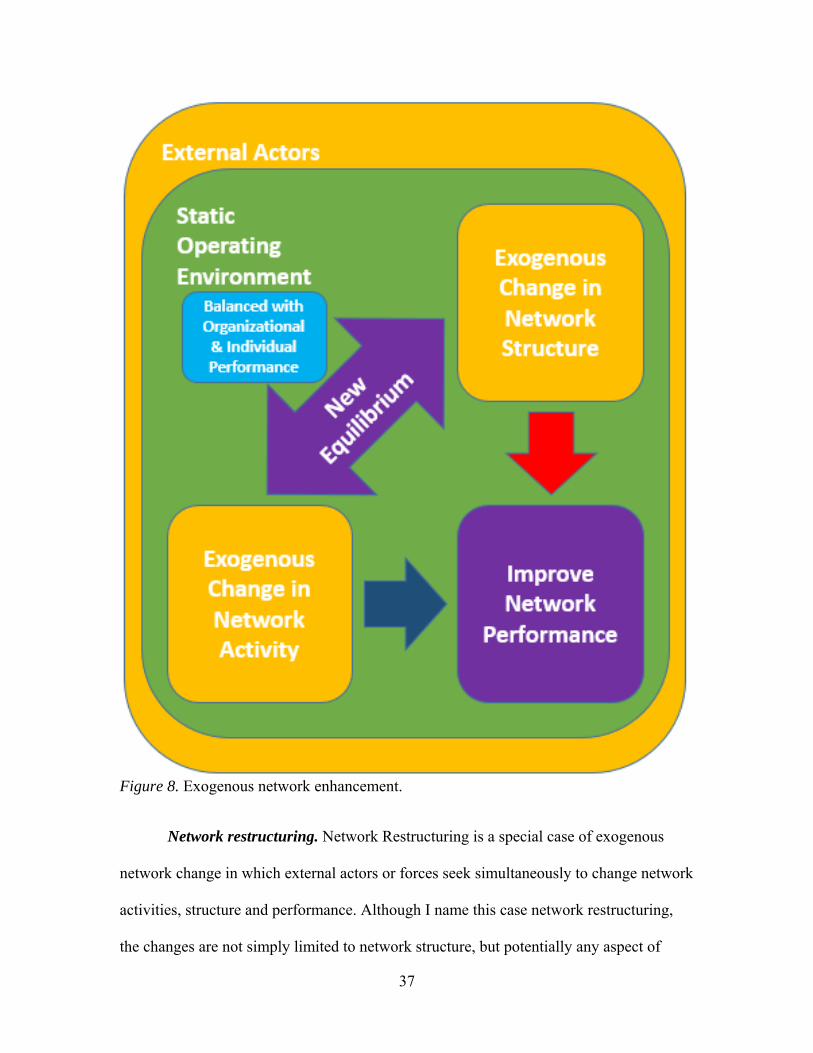
37
Figure 8. Exogenous network enhancement.
Network restructuring. Network Restructuring is a special case of exogenous
network change in which external actors or forces seek simultaneously to change network
activities, structure and performance. Although I name this case network restructuring,
the changes are not simply limited to network structure, but potentially any aspect of

38
network dynamics. External actors may elect to press for more comprehensive changes in
network activities, structure and performance goals at once through a process of
exogenous network restructuring (See Figure 9). Such a strategy may reflect external
actor frustrations with the prevailing levels of network actor motivation, direction,
resources or focus. Such efforts also sometimes reflect external actor interest in joining
smaller or informal networks into a new larger and/or more formal initiative, or it may
reflect a desire to change or introduce new network goals that require a fundamental
restructuring of network activities and structures.
I use these simplified ideal types or scenarios of network change in three ways—
1) to locate the antecedent and paths to changes in network performance based on the
introduction of network plots, 2) to provide a vocabulary to discuss implications of this
research in later chapters and 3) to delimit the bounds of potential findings.
I begin by constructing a scenario of network change from the introduction of
network plots by external actors (See Figure 10). The effect of introducing network plots
into a network by sharing them with network participants could vary based on the
network change scenario—network equilibrium, endogenous network adaptation,
endogenous network evolution, exogenous network redirection, exogenous network
enhancement, or exogenous network restructuring. In every case, the dynamic interaction
of network, organizational and individual performance may come into play. Network
analysis and the production of network plots introduces new information to network
managers and participants. By potentially reshaping the cognitive social structure of
participants, this new information could influence network activities and structure
because existing network participants may begin to “activate” (McGuire, 2002) new

39
participants to access resources. To understand how introduction of an information
source, the network plot, can affect these determinants of network performance, one must
first understand the sense-making processes of network participants.
Figure 9. Exogenous network restructuring.

40
Figure 10. Network awareness (general model).
Part III: The Sense-Making Methodology
In order for information to lead to action, it has to make sense to the human being
receiving the information. How we, as human beings, make sense of information shapes
our subsequent actions in response to that information. In order for the information in

41
network plots to lead to actions that change network structure or activity, participants
must first make sense of the information. Making sense of information can vary
significantly between different sense-makers. Graphical information such as network
plots are particularly open to different interpretations shaped by the sense-making of
different recipients. Network leaders, network analysts and each network participant may
interpret the information in network plots differently and make sense of it in different
ways.
To provide a theoretical framework and methodological approach for
understanding the sense-making that may emerge from introduction of the network plot, I
drew on Dervin’s Sense-Making Methodology. Because this view of sense-making is not
well known within public administration, I here provide a brief overview of its
components and their alignment with the goals of this study before outlining the
framework’s methodological approach to interviewing in Chapter 3.
Dervin and her protégées have used the sense-making methodology (SMM) to
study a wide range of information-seeking behaviors from the perspective of users, as
opposed to designers, in different systems and contexts, including health care, library
sciences, computer science, audience studies, advertising, gender studies and many other
fields (Dervin, 2015, p. 61; Dervin et al., 2003).
Figure 11 is one of the more concrete expressions of this framework of sense-
making.
Dervin has described the approach as follows:
The metaphor shows a human (M. Squiggly) moving through time-space, out of situational conditions, including history, experience, horizons (past, present, future), constraints, barriers, habits and skills. Squiggly carries an umbrella. It is described as including power structures and dynamics, organizational systems and

42
procedures, domain knowledge systems, cultures and communities. Collectively, these are labeled “context.” They are usually interpreted in research as structural arrangements within which individual agency operates. In SMM, even these seemingly static boundaries are conceptualized as gappy and open to phenomenological interpretation.
Squiggly is shown facing gaps (questions, confusions, muddles, riddles, angst). The bridges for moving onward are listed as ideas, cognitions, thoughts; attitudes, beliefs, values, feelings, emotions, intuitions; memories, stories, narratives. Sources (channels, media, people, institutions) are shown as potentially providing fodder for the bridges, although not unexpectedly, research has shown that when it comes to making sense, the most frequent source is named as an ever-evolving self. (Dervin, 2015, pp. 63–64)
Figure 11. Sense-making illustration. From “Dervin’s Sense-Making Theory,” by B. Dervin, in M. N. Al-Suqri and A. D. Al-Aufi (Eds.), Information Seeking Behavior and Technology Adoption: Theories and Trends (p. 63), 2015, Hershey, PA: IGI Global. Copyright 2008 by Brenda Devin. Reprinted with permission.

43
To my engineer’s mind, Dervin’s complex framework can be difficult to parse, yet
reducing it to its constituent parts also somehow diminishes its elegance—like trying to
dissect a kitten to determine why it is cute. While Dervin’s own descriptions of her
methodology sometimes border on the flamboyant, they are also often poetic. I believe
her own words can offer a better sense for what SMM is than any reductionist
deconstruction could. For example, focusing on change and movement, Dervin has
explained that SMM’s foundational concepts
provide the framework for attending to movement and involve conceptualizing sense-makers as: a) moving through time-space so it cannot be assumed a priori that behavior (e.g. information behavior) will be habitual or static because circumstances (internal and external) may change; b) struggling with or aided by force, power, and energy, sometimes with forces blocking movement, sometimes aiding, sometimes from behind, sometimes by one’s side, sometimes in front; c) facing gaps always phenomenologically experienced and sometimes presented as well with brutal force from external or internal sources; d) moving out of a situation with history and horizons, past, present, and future; e) moving sometimes in flexible and fluid ways, facing change, or chaos; f) moving sometimes in stable, constant, rigid ways or passing through time-space in inertia. (Dervin, 2015, p. 67)
Dervin has further described
SMM as a methodology [that conceptualizes] the human as a body-mind-heart-spirit living in a time-space, moving from a past, in a present, to a future anchored in material conditions, yet at the same time with an assumed capacity to sense-make abstractions, dreams, memories, plans, ambitions, fantasies, stories, pretenses that can both transcend time-space and last beyond specific moments in time-space. (Dervin, 2015, p. 64)
The metaphor (Figure 11) depicts, “the pervasive gappiness assumption. The road
is filled with holes. Even the gap is gappy. The stones in the bridge have their own holes.
The umbrella, meant to picture the most material aspects of sense-making and sense-
unmaking, is itself filled with holes. And, Squiggly is deliberately squiggly” (Dervin,
2015, p. 65). In sum, the SMM theoretical framework, “consists in its simplest form as a

44
gappy road with each step starting in a situation, moving across gaps over bridges, and
arriving at outcomes” (Dervin, 2015, p. 64).
There are several reasons why Dervin’s approach may help researchers
understand how network actors may conceive of network plots.
SMM focuses on the cognitive processes that mediate between information and
action. In the analysis presented here, network plots are the information source, sense-
making is the mediating cognitive thought process and potential collaborative actions that
(re)shape network structures and performance are the actions of interest that may arise
from individual and collective sense-making. Understanding how information from
network plots translates into action helps us understand the implications of introducing
network plots to network participants.
Dervin designed SMM to capture the system users’ perspectives independent of
the system designer’s perspective. The designers of collaborative human service policy
implementation networks may be far removed from those who participate in these
administrative arrangements. Their fundamental assumptions and priorities may also not
match those of network participants, especially in mandated networks. The move toward
more distributed and decentralized implementation structure for delivery of human and
social services have long been the product of ideological assumptions and thinking and
not of careful analyses of administrative feasibility or workability. The designers of such
systems often give litle attention to those charged with making those arrangements
operate. Moreover, the way policy makers design and deploy distributed policy
implementation structures across networks offer few opportunities for individuals and
organizations with less power in the network to challenge an approach led by more

45
powerful interests. To address this distorted discourse, SMM finds “ways to bridge gaps
across discourse differences without privileging one or the other” (Dervin, 2015, p. 60).
Within SMM, “being able to hear another’s experiences requires facilitating
‘conscientization’ – bringing to consciousness deeply hidden struggles that society or
social structures have a vested interest in silencing” (Dervin, 2015, p. 64).
SMM provides safeguards against the researcher introducing their own conceptual
frameworks and biases. Researchers and policy makers often employ a language that can
differ significantly from that of network participants, which runs the risk of imposing
their theoretical frameworks onto the information provided from participants instead of
allowing theory to emerge from the language of participants. “The intent of SMM is to
try to yield research results from which researchers can make inferences and connections
within their own discourse communities with more confidence that the results have not
been pre-ordained by the imposition of discourse-enscribed expertise and/or societal
power arrangements” (Dervin, 2015, p. 66). With this insight in mind, instead of asking
my research questions directly, I employed SMM’s oblique, indirect and non-leading
interview approach. I did so to reflect the fact that, “SMM assumes that the vocabularies
of normative scholarly expertise are not user-oriented and are removed from the world of
everyday experience” (Dervin, 2015, p. 65). SMM “requires moving from noun-oriented
interviewing approaches to what SMM terms ‘verbings’” to address this concern (Dervin,
2015, p. 65). As will be seen in the selected interview questions (Table 9), aside from the
critical entry that contains the researcher’s nouns to direct the interviewee’s attention to
the object of interest, all SMM questions are verb-oriented, providing space for
participants to choose their own nouns to describe their world and experience.

46
By engaging informants as co-researchers in this way, SMM opens possibilities
for new processes of praxis-based learning among network researchers, analysts,
managers and participants: “SMM has been developed not to capture ephemeral states of
being, but rather fundamentally as a tool for dialogue that can be usefully built into
societal, organizational, community, family, and all interactive communication
processes” (Dervin, 2015, p. 75). This dialog can serve as a precursor to the collaborative
action needed to elicit network change. Because the SMM philosophy privileges users,
incorporating it into the discourse around collaborative action in networks may help
generate a more authentic discourse.
Dervin’s sensemaking frame provides a concrete approach to gathering deep
descriptions of the small yet significant moments that precede collaborative action and
inaction. SMM focuses “on how humans communicatively make and unmake sense using
many diverse kinds of inputs” (Dervin, 2015, pp. 60-61). The methodology’s approach
investigates, “how acts of communication make and unmake society, structures,
organizations, communities as well as identity, personality, self, and other” (Dervin,
2015, p. 62). The choices of network participants can unmake macro-level network
collaborative processes and goals as easily as they can construct them. While shared
sense-making may lead to environments that facilitate actions in otherwise highly
contingent environments, sense-unmakings can also inhibit choice-making and lead to
levels of uncertainty that inhibit network change.
Finally, one of the more intriguing implications of using this methodology for this
research was the opportunity to explore Dervin’s insight that time-space bound measures
(specifically, situated movement states) account for more variance in the use of

47
information sources than across-time-space and a priori-time-space measures (i.e.,
demographics or assigned roles) do (Dervin et al., 2003, p. 263). I therefor develop
propositions emerging from the study for how awareness of participants’ situated
movement state could provide network managers and other participants with key insights
into why others in the network may use or not use the information contained in SNA
plots or how they might do so.
Next, I describe my methodological approach and how I used Dervin’s
sensemaking framework to develop a methodology to collect and analyze data to examine
whether and how network plots are used as an information source for network change.

48
Chapter 3: Methods
This chapter presents the data collection methods I employed to gather
information for examining my research questions. I begin with an explanation of the
relationship data collection which provided the basis of the network plots that I presented
to key informants for the interviews. I provide an overview of the network analysis of the
relationship data and the development of the network plots. I then present the sense-
making approach to interviewing and how I applied that method to the development of
the interview questions I employed, the selection of key informants with whom I spoke
and the conduct of the interviews. Finally, I describe the analytical approach I used to
code the interview data as a foundation for the findings and implications presented in the
following chapters.
Part I: Case Selection
I used a single case study design to address my research questions (Yin, 2003).
The case I selected was instrumental in nature, meaning that it was intended “to provide
insight into an issue or refinement of theory” (Flyvbjerg, 1998, p. 88). It was also
heuristic/exploratory in character because it served as “a vehicle for seeking to
understand a phenomenon or process” (Flyvbjerg, 1998, p. 88) and a plausibility probe
which could help “determine whether potential validity may reasonably be considered
great enough to warrant the pains and costs of testing” (Eckstein, 1992, p. 140-141).
My selection of the case was opportunistic and convenience factored heavily in its
selection. Nonetheless, the case I chose for analysis suited the objectives of my inquiry. It
was a new initiative, so I could examine sense-making at the beginning of the network
change process. It was a diverse network with multiple types of agencies across many

49
service sectors that potentially offered a polyphony of voices. Its aims were
consequential—reducing poverty. I was familiar with many of the types of organizations
and their missions from my own involvement in similar networks, yet I was not a familiar
actor to most in this region. I had a sponsor, the United Way, that facilitated participation
in the SNA by using their influence with many participants. However, I likely
underappreciated how the United Way’s approach to network change would shape my
participant’s sense-making. In retrospect, the network we studied ended up being much
larger than I initially anticipated, perhaps diminishing the ability of participants to make
sense of large plots.
Case selection background. I initially envisioned studying an early childhood
network in the region close to where I live; however, the leaders of the administrative
organization that oversaw that network, the United Way of the Roanoke Valley,
requested that I consider several existing networks and coalitions with which they were
involved plus other organizations they wished to engage in a new effort called the Family
Self-Sufficiency Initiative. The United Way had completed a lengthy planning process
involving its funded partner agencies, community leaders, residents and other
stakeholders. The key understanding that emerged from that effort was an impression that
United Way had historically spread its investments across too many low-impact
organizations that were more focused on meeting the urgent basic needs of their
respective clienteles, rather than working collaboratively with other organizations to
address the root causes of poverty in the community. The United Way, therefore, adopted
a new investment strategy to provide increased funding to a smaller number of
organizations that agreed to work collaboratively on high impact projects focused on

50
systems change. United Way leaders believed that a Social Network Analysis of a larger
collection of agencies, organizations and programs could inform their future choices as
they implemented their organization’s new strategy.
Geographic delimitations. This study occurred in Roanoke Virginia, an urban
center in southwestern Virginia. Network participants served various localities within the
region. The population of the Roanoke Metropolitan Statistical Area (MSA) was 314,515
in 2018. Roanoke is less than an hour’s drive from Virginia Tech and Blacksburg, where
I live and work, making it a convenient geographic site for conducting data collection.
Study timeline. This analysis reflected a single point in time in the winter of
2016/17 and the interviews reflect participant sense-making during the spring and early
summer of 2017. The study developed as follows: In the summer and early fall of 2016,
my advisor and I negotiated the scope and character of the network analysis, including
the roster of programs/organizations to be included, and the final contents of the survey
instrument with its facilitator/sponsor, the United Way of Roanoke Valley. I collected the
organizational and relationship data through group and online surveys in November and
December of 2017. My advisor and I conducted the analysis of network data and
produced the initial network plots in January and February of 2017. My advisor presented
the results of the network study, including its plots, to a large group of participants and
stakeholders on February 24, 2017 (images of the plots were presented/shared, but not
provided to participants). I conducted additional data validation and refinement of the
network plots in March and April 2017 before providing them to informants for the
qualitative interview portion of the study. I interviewed a sample of key informant
interviews in May and June of 2017 (See Part V below for a full description of the

51
selection protocol). My advisor and I prepared a final report on the network study,
including its plots and analysis, which was distributed broadly to all participants in late
June 2017 by the United Way; however, that report did not include any information from
or treatment of the key informant interviews I had conducted. Thereafter, I had the
interviews transcribed and I analyzed them over the summer and fall of 2017.
Part II: Collection of Relationship Data
My dissertation advisor served as the lead investigator for the network analysis
phase of the study in order to preserve my objectivity when conducting the key informant
interviews about the network plots. I and my advisor worked closely during the network
analysis portion of the research, but with my advisor in a lead role. To gain access to the
research field for this study, the research team (candidate and advisor) worked with a
sponsor/facilitator, the United Way of the Roanoke Valley. As the sponsor/facilitator of
the project, the United Way’s representatives influenced the definition of the network, its
boundaries, and the types of relationships explored. The research team met numerous
times with a group from the United Way during the summer and fall of 2016 to establish
the network boundaries, the types of network relationships that would be explored, other
questions that would be addressed during the inquiry, and how that data would be
collected. The discussions were collaborative, as all involved sought both to address the
scholarly aims of the research team and the strategic goals of the United Way.
For its part, the United Way sought to understand more fully the existing network
of relationships currently among its partner organizations (community nonprofits it was
funding) and other agencies and organizations with the goal of developing ways and
means to engage the entire group in an initiative aimed at reducing the total number of

52
families living in poverty in its service region. This effort was known as the Family Self-
Sufficiency Initiative. The United Way leaders intended to restructure their
organization’s grant making to encourage collaborations amongst those it funded to
secure that overarching goal.
Initially, the boundary for the network study consisted of current United Way
partner organizations and a few additional stakeholders identified by that organization’s
leaders as significant to the new initiative. Following discussion, the study’s planning
team eventually decided to include many additional public and nonprofit agencies that
were not current United Way partners, but which could play roles in helping families
achieve self-sufficiency. Ultimately, we identified two distinct groups as important for
the study—public and nonprofit human service agencies that would be engaged directly
in relevant service delivery and a broader network of supporting and peripheral
organizations. The core group consisted of single- and multi-program agencies with
specialties in education, health and/or income. Some agencies had cross-cutting programs
that spanned many of these foci, while others provided offerings with different foci. Still
other entities offered single programs with specific foci. The broader network was
comprised of area businesses and employers, government units, schools and ancillary
nonprofits and an array of faith-based organizations. While the United Way’s leaders
considered including additional programs and organizations suggested by the research
team that group ultimately decided which entities to include. In several cases, the
charity’s leaders chose to include only a few selected programs from larger multi-
program organizations. The final roster included 72 programs in five categories—21
cross-cutting, 18 education-focused, 22 health-focused and 7 income/employment-

53
focused programs, plus 4 United Way coalitions. The broader support network was
comprised of 10 ancillary/faith/community programs, 11 governmental units, 15
business/employers, 3 institutions of higher education and 7 public schools for a total of
46 support organizations. Although potentially important, broader network participants
were less connected and involved in the family self-sufficiency initiative and would
generally not have had all the types of relationships we were exploring. We were also less
interested in their relationships with each other than with their relationships to
organizations in the core network. For these reasons, we decided to survey the two groups
separately asking the broader network only about a subset of relationship types with
organizations in the core network.
United Way representatives identified respondents from each program or
organization to complete the study survey. In some cases, the charity’s leaders worked
through organizational or program leaders to identify appropriate program
representatives. In a few cases, they identified multiple respondents per program. In some
cases, the initially selected respondent was not available and the organization provided a
substitute to complete the survey.
The study principals worked with United Way leaders to identify four types of
relationships we believed to be significant for understanding the network and how the
United Way wanted it to begin functioning. Those relationships included information
sharing, coordinated referrals, integrated services and shared resources. The research
team and United Way leaders developed a set of definitions and examples to help
respondents understand what each term described (See Table 2).

54
Table 2
Type of Tie
Information Sharing
Relationships that involve routine conversations between program staff, sharing information about the other program with your clients, making referrals to that program (but not actively connecting clients to the other program)
Example: A client is enrolled in your employment program and your staff provides information about a counseling program. Your staff does not follow through to see if the client is eligible, if he seeks the service, or what the outcome is.
Coordinated Referrals
Formal relationships for channeling and managing referrals that ensure follow up, prescreening referrals for eligibility for the other program, joint client applications/intake, referral confirmation, and consent to share client information across agencies programs
Example: A client is enrolled in your substance abuse recovery program and your staff assists the client in getting connected with a job training program. Your staff follows up on the referral and ensures the client is enrolled and participating. Your staff and the job training staff jointly support the client until a job is secured.
Integrated Services
Planned service coordination, collaborative case management, cross-agency staffing, shared personnel, co-location, or shared data tracking
Example: Clients in your early childhood program needs access to healthy foods. The food distribution program sets up on-site, your two programs track improvement in healthy food consumption for clients and share responsibility for educating clients on nutrition.
Shared Resources
Shared financial resources, purchased services, grant partnerships, or contractual obligations
Example: Your shelter program works alongside 4 other programs to apply for a collaborative grant and share the resources to serve the same target population. Clients are collaboratively case managed.
To help distinguish between relationships that might be critical to network
function and those that might be ancillary, the researchers asked each respondent to
identify the intensity (low, medium or high) of each relationship type they had with
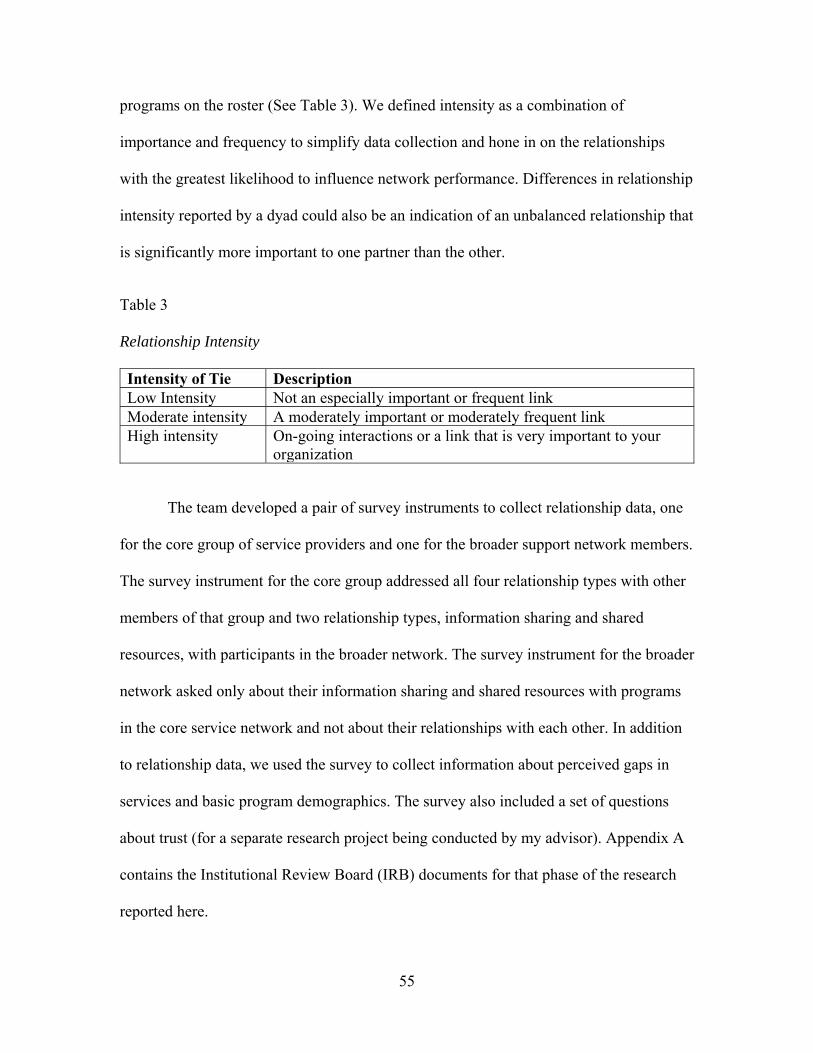
55
programs on the roster (See Table 3). We defined intensity as a combination of
importance and frequency to simplify data collection and hone in on the relationships
with the greatest likelihood to influence network performance. Differences in relationship
intensity reported by a dyad could also be an indication of an unbalanced relationship that
is significantly more important to one partner than the other.
Table 3
Relationship Intensity
Intensity of Tie Description Low Intensity Not an especially important or frequent link Moderate intensity A moderately important or moderately frequent link High intensity On-going interactions or a link that is very important to your
organization
The team developed a pair of survey instruments to collect relationship data, one
for the core group of service providers and one for the broader support network members.
The survey instrument for the core group addressed all four relationship types with other
members of that group and two relationship types, information sharing and shared
resources, with participants in the broader network. The survey instrument for the broader
network asked only about their information sharing and shared resources with programs
in the core service network and not about their relationships with each other. In addition
to relationship data, we used the survey to collect information about perceived gaps in
services and basic program demographics. The survey also included a set of questions
about trust (for a separate research project being conducted by my advisor). Appendix A
contains the Institutional Review Board (IRB) documents for that phase of the research
reported here.

56
We offered respondents from the core service group several opportunities to
complete the survey in a group setting, providing computers for attendees to respond to
the online survey. That approach allowed the research team to provide additional
contextual information and instructions to respondents. It also provided those individuals
an opportunity to ask questions and obtain clarifications (Lemaire & Raab, 2020). We
used Qualtrics, an online survey instrument, for data collection. If at least one
representative from a program/organization could not attend any of the group sessions,
the United Way sent them a link to an online version of the survey and offered them the
opportunity to complete that instrument on their own. We only offered respondents from
the broader support network a link to complete the survey independently. The United
Way offered a drawing for a $50 gift certificate in each session to incentivize
participation in the group surveys.
Since network analyses require a very high response rate, the team undertook
significant efforts to obtain replies from all organizations in the core group. United Way
staff members led efforts to secure responses through multiple email, phone and in-
person contacts. Ultimately, representatives of 69 of 72 targeted programs/organizations
in the core services group responded (a 96% response rate), although during follow-up
efforts, United Way staff inadvertently sent 4 core group members the survey instrument
for the broader network. That fact meant that the investigators could only gather data on
information sharing and shared resources from those responses. Only 14 of 46 targeted
respondents in the broader support network (a 30% response rate) returned a completed
survey. That low response rate meant only limited use of that data was possible in
analysis.

57
Part III: Network Analysis
As mentioned above, in order to preserve participant’s perceptions of my
objectivity, my dissertation advisor conducted most of the network analysis. I provided
limited technical support. My advisor selected and prepared the network plots included in
the network analysis report.
The research team used only confirmed ties for the network plots for the core
group. For research studies of this type, researchers generally prefer confirmed ties
because it is argued that confirmed ties represent stronger and more significant
relationships (Lemaire & Provan, 2018). Because of the low response rate from the
broader support network, we used a mixture of confirmed and unconfirmed ties for plots
for that group.
For the few programs that had multiple respondents, we aggregated their
responses to generate a single relationship profile for their program/organization.
Because of the large number of programs in the core service network, only one plot
showed relationships at the program level, all other plots displayed relationships
aggregated to the organizational level. In two instances, because of significant differences
in the types of relationships reported, we decided to present some programs separately
from their parent organizations. We represented TAP Head Start and 211 separately from
the other programs in their home organization, for example.
To provide consistency across plots, we used a standard system to translate
network data to visual representations. Table 4 presents our strategy for doing so.

58
Table 4
System of Representations Used in Network Plots
Symbol Meaning Node Color For the core service network, we used color to indicate the
programmatic focus of the program/organization—red for cross-cutting, green for education, yellow for income/employment and blue for health.
Node Shape For the core service network, we represented all programs/organizations as squares, except for coalitions, which were represented as darkened squares with an internal colored circle. For the broader network, shapes represented specific types of organization—circle for ancillary/faith-based/community organizations, diamonds for businesses/employers, double triangles for governmental units, up-triangles for public schools and down-triangles for higher education. We used circles to depict shared priorities in the Gap Priorities plot.
Node Size Node size represented total number of ties. Node Borders Thick node borders indicated that the program/organization responded
to the survey. Thin node borders indicated non-respondents. Node Labels We used node labels to name programs/organizations. Names are
somewhat larger than is typically used (up to 15 characters) to provide a phonetic representation of the organization name, allowing viewers to identify the program/organization without using a key.
Line Thickness
We used line thickness to reflect relationship intensity. Thinner lines represented less intense relationships and thicker ones more intense ties.
Line Color We used line color in one plot to represent relationship multiplexity—red for all four relationships, orange for three relationships, blue for two relationships and grey for one relationship.
In addition to the network plots, we calculated whole network statistics. However,
we presented only density and centralization in the network plots. Density is the number
of ties relative to the number of possible ties and centralization is a measure of how
important central actors are to the function of the network (Wasserman & Faust, 1994).
Part IV: Network Plots
The plots in Figures 12–25 emerged from the network analysis. I used these
visuals as the objects of interest in the sense-making phase of this research. My advisor

59
presented these images to a large group of respondents and stakeholders during a
program in February of 2017, but we did not distribute paper or digital copies of the plots
at that time. I provided key informants for the sense-making phase of the study a PDF of
the plots (and the relationship definitions) to review prior to their interviews. In addition,
the United Way made the full report, including the network plots, available on its website
following completion of my key informant interviews in the summer of 2017.
Figure 12. Any confirmed tie at the program level.

60
Figure 13. All confirmed relationships (organizational level).
Figure 14. Most robust confirmed relationships (organizational level).

61
Figure 15. All four relationship-type plots side by side.
Figure 16. Confirmed information sharing.

62
Figure 17. Confirmed coordinated referrals.
Figure 18. Confirmed integrated services.

63
Figure 19. Services fragmentation with removal of TAP and Salvation Army (and RADAR, a nonrespondent).
Figure 20. Confirmed shared resources.

64
Figure 21. Resource fragmentation with removal of TAP and Goodwill (and RADAR, a nonrespondent).
Figure 22. Broader information sharing network.

65
Figure 23. Broader resource sharing network.
Figure 24. Gap priorities.

66
Figure 25. Linked gaps.
Table 5 presents the number of times that informants identified the plot or group
of plots as an object that they wished to discuss in their follow-up sense-making
interview with me.
Part V: Key Informant Selection and Recruitment
I selected most interview candidates from responding programs/organizations
based on their service area focus and network position. Additionally, I selected a few
other interview candidates from key stakeholders in the United Way strategic planning
process. I selected a diverse range of potential interviewees to represent different network
positions, including central actors, bridges, outliers and isolates.

67
Table 5
Popularity of Plots for Interview Discussion (Out of 11)
Plot Group Number of times identified for discussion
Any Confirmed Tie at the Program Level 7 All Confirmed Relationships (Organization Level) & Most Robust Confirmed Relationships
0
All Four Relationship Type Plots Side-by-Side 0 Confirmed Information Sharing (Organization Level)
2
Confirmed Coordinated Referrals (Organizational Level)
1
Confirmed Integrated Services (Organizational Level) & Service Fragmentation with Removal of TAP & Salvation Army (and RADAR – a Non-respondent)
6
Confirmed Shared Resources (Organizational Level) & Resource Fragmentation with Removal of TAP & Goodwill (and RADAR – a Non-respondent)
3
Broader Information Sharing Network 0 Broader Resource Sharing Network 2 Gap Priorities 5 Linked Gaps 2
I also sought diversity with respect to the type of program or service offered within the
United Way’s family self-sufficiency framework (See Table 6). My goal was to obtain a
variety of perspectives from actors occupying different positions within and outside the
network. Although my initial intention was to conduct only individual interviews, some
informants working in different programs within the same organization requested to be
interviewed together as a group. As a result, in addition to 8 individual interviews, I
conducted 3 group interviews with multi-program organizations where I included an
additional 11 informants representing different programs from within those organizations

68
that matched my selection criteria. To distinguish between the two types of interviews, I
label individual interviews with the word ‘Interview’ followed by the assigned informant
number and I label group interviews with the word ‘Group’ followed by the range of
assigned informant numbers for those present. By including some group interviews in
addition to the individual interviews, I was able to observe how the group dynamic of
sensemaking differed from individual sense-making. I conducted interviews until I
reached information saturation and obtained a diverse pool of responses (ultimately 11
individual or group interviews). I recruited potential informants by email and/or
telephone and emailed them a copy of the informed consent form before scheduling their
interview. As a part of the actual interview, I asked if they had any questions about their
participation in the study, solicited permission to record the interview and obtained their
signature on the consent documents. I audio recorded all interviews. Table 6 presents the
categories for targeted interviews and the results of my attempts to obtain respondents for
each category. If I was able to schedule an interview with my first-choice informant, I
indicate “Target interview obtained.” If I was not able to schedule an interview with my
first choice, but could identify an alternate with a similar program focus and network
position, I indicate “Alternate interview obtained.” If I was unable to secure an interview
with anyone in the category, I indicate “No interview obtained.”
I contracted with a service to transcribe the interview audio recordings. I asked a
representative of the firm to sign a declaration indicating that its employees would honor
the confidentiality of the responses they transcribed. I assigned numerical study codes to
each informant to help preserve informants’ confidentiality as promised in the consent
documents. I identify interviewees below only by their assigned codes, although the

69
content of some discussions could potentially reveal the identity of an informant to
someone familiar with their service network. I sought to do all I could to preserve
interviewee confidentiality. I maintained a code book linking study codes to actual
informants in a secure file cabinet.
Table 6
Interviews Targeted and Obtained
Program Focus
Network Position Central or Bridging Peripheral or Isolate
Adult Education
Target interview obtained. Unable to schedule targeted interview, previous person left and new person in role indicated they do not have adequate knowledge. Substitute identified from a different organization and included in a group interview. Alternative interview obtained.
Child/Youth Education
Targeted individual too busy to be interviewed. Substitute interviewee from alternative organization identified. Alternative interview obtained.
Target interview obtained.
Health Services Target interview obtained. Three attempts with different organizations. One was leaving the position and two others suggested they were too busy for an interview. No viable substitutes available. No interview obtained.
Income/ Workforce
Target interview obtained. Target Interview obtained
Other Human Service
Target interview obtained. Targeted individual unavailable. Substitute from a different organization identified and agreed to be interviewed. Alternative interview obtained.
Coalitions Targeted individual missed initial interview date. Unable to commit to new time. Substitute from a different
Target interview obtained.

70
organization identified and included in another group interview. Alternative interview obtained.
External Stakeholders
Target interview obtained. Target interview obtained.
Part VI: Interview Methodology
SMM interviews can be quite long (consuming as much as two hours) and quite
repetitive. Before beginning a SMM interview it is important for the researcher to
acknowledge the length and repetition, but to assure the informant that it is intentional
and aimed at deepening the communication. The interviewer should also give
interviewees permission to pass on addressing a query or indicate that they have already
talked about an item or concern. To gauge interview duration and evaluate the depth of
responses gained, I conducted a test interview with a participant from a different SNA
study. That individual found it difficult to understand what information I was seeking to
elicit. Based on that experience, I developed a more direct probing question to add to
each category of sense-making questions (i.e. situations, gaps, bridges and outcomes).
I addressed the research questions associated with this study with data obtained
from key informants using Dervin’s SMM situated micro-element interview method. The
plots presented above served as the objects of the sense-making explored in the
interviews. Dervin’s highly developed approach to interviewing aligns with SMM’s
overall philosophical approach and intellectual commitments. I employed the situated
micro-element interview (described below) as the primary framework for selecting
objects of inquiry and for exploring those objects from user (interviewee) perspectives.
Appendix B contains the IRB documentation for the interview phase of this research.

71
Before the interviews, I provided informants with a copy of the network plots
from the SNA presentation for reference and a copy of the informed consent form for
them to review and sign. At the beginning of the interview, I read them a brief description
of the SMM interview process that included instructions for how to respond if they felt
the questions were getting redundant or if they felt they had already addressed the
question. I also gave interviewees a chance to review the consent form once more and ask
any questions about it. They then signed the consent form before the interview
proceeded.
The SMM interviewing approach prohibits interviewers from injecting their own
nouns (frameworks, conceptions, vocabularies) to “leave the informant entirely free to
name and map the world” (Dervin, 2015, p. 69). Within SMM, the “critical entry” is the
one occasion when the researcher can introduce their nouns by focusing the informants’
attention to the object or phenomenon being studied. For this study, the critical entry took
the following form:
Please take a look through the network plots to refresh your memory. Please think back to the presentation of the data from the network study and your subsequent review and study of the network plots. Are there two or three of the network plots which you found most interesting and informative? Which? Any others? Which three were most important? Any others? Which were the most important?
The plots selected by informants served as the objects for follow-up SMM
interview questions. The interviews focused on up to three objects (network plots)
identified by the informant as interesting or significant, one at a time. I offered the
following prompt for each object identified, followed by the SMM questions (See Table 9
for the of interview questions): “What do you see in this that makes it important? What
did you learn from it? What does it mean? What do you take away??”

72
All SMM questions come from a theory-driven list of open-ended non-leading
questions, developed and adapted during many years of use and testing. Although very
prescriptive overall, there is also “both room and necessity to adapt the interviewing
approach to specific research needs” (Dervin, 2015, p. 67). However, the interviewer
must, “limit their questions to the SMM core set while at the same time being flexible in
their use” (Dervin, 2015, p. 69). For this research, I grouped SMM questions into four
sections designed to tap the situation, the gaps, the bridges and the helps/outcomes.
The idea of Level 2 triangulation is central to the SMM approach. Level 2
triangulation in this method is the practice of taking a response to a Level 1 question
(called an SMM element), and applying the same battery of questions to elicit additional
thoughts and insights concerning it through elaboration. According to Dervin (2015),
“interviewers do not necessarily do a complete level 2 triangulation on each element
elicited in level 1” (p. 70) but can be selective in targeting seemingly significant
responses. For this study, I selected no more than one or two responses from each
category (situations, gaps, bridges and helps/outcomes) as a Level 2 element. I then asked
additional questions from the listing about those elements to unpack them with
interviewees. To aid in this process, I kept hand written notes to help identify interesting
elements and I added those SMM elements to the grid on the question sheet. I explored
each of the SMM objects through Level 2 triangulation on selected SMM elements with
each interviewee before turning to the next object. Appendix C contains a summary of
my field notes concerning the objects selected by informants and potential elements that
emerged from Level 1 questioning that I noted as potential elements for Level 2
triangulation, although I did not explore all items noted at Level 2. Appendix D contains

73
a hypothetical overview of an invented SMM interview as an illustrative example of the
process.
Table 7 presents the Level 2 elements and other probes explored in the interviews
that emerged more than once. Many elements and probes only emerged one time, but
only those that emerged multiple times are included in the table.
Table 7
Repeated Level 2 Triangulations and Probes
Inte
rvie
w_0
01
Inte
rvie
w_0
02
Inte
rvie
w_0
03
Gro
up_0
04_0
07
Inte
rvie
w_0
08
Inte
rvie
w_0
09
Inte
rvie
w_0
10
Inte
rvie
w_0
11
Gro
up_0
12_0
13
Gro
up_0
14_0
18
Inte
rvie
w_0
19
Tot
al
01 : Elements & Probes (Total) 14 8 8 6 8 6 4 9 4 3 3 73 03 : Big corporate vs little grassroots 1 0 1 0 1 1 0 0 0 0 0 4 09 : Centrality of own org 0 1 0 1 0 0 0 0 0 0 0 2
14 : Competition for resources (fixed pie) 0 0 1 0 0 0 0 1 0 0 0 2 17 : Education and income (missing) 1 0 0 1 0 1 0 0 1 0 0 4 20 : Fragmentation 1 0 0 1 1 1 0 0 1 0 0 5 27 : Large Jurisdiction 0 1 0 0 0 0 0 1 0 0 0 2 30 : Missed Opportunities 0 0 0 0 0 0 0 1 0 0 0 1 31 : Missing (General) 1 0 0 0 0 0 1 1 0 1 1 5 34 : Outliers and Isolates 0 0 0 1 0 0 0 0 1 0 0 2 43 : Self Sufficiency System 1 0 1 1 0 0 0 0 0 0 0 3 51 : UW Framing 0 1 0 0 1 0 1 0 0 0 0 3

74
Part VII: Interview Questions/Protocol
The battery of questions used in the sense-making interview has evolved over
time and has taken somewhat different forms in different studies (Dervin et al., 2003).
For this study, I separated the questions into categories designed to help tap situations,
gaps, bridges and helps/outcomes. I did not ask all questions concerning each object or
element. In addition, I sometimes used general probing questions—typically in the form
of “Please tell me more about X.” Table 8 presents the SMM questions and the number of
times I asked each during the interviews I conducted. Appendix E contains a reproduction
of the SMM interview questionnaire that I used.
Part VIII: Analysis and Coding of Interview Data
Transcription. Once the interviews were completed, I assigned a study code to
the audio recording of each interview and provided the audio recordings to a commercial
transcription service (TranscribeMe.com). Although I had planned to begin coding each
interview immediately upon receipt, rather than waiting for all interviews to be
completed, the quick pace of the scheduled interviews and a slight delay in securing the
transcription service meant that I did not begin coding until after I had completed all the
interviews. Once I received the interview transcripts from the transcription service, I
loaded them into NVivo 11 for coding and analysis. I then conducted several iterations of
coding, starting with open coding and moving toward more focused coding as patterns
began emerging and then to theoretic coding when the patterns identified appeared to
have implications for the research questions I had posed.
Open coding. I undertook open coding in two blended phases. Initially, rather
than assigning specific codes, I reviewed transcripts and identified “significant

75
quotations.” These were responses that seemed significant on review and which I thought
might be important to later analysis. As the coding process proceeded, patterns in
responses began to emerge and I assigned specific codes to significant informant
observations. As the analysis progressed, I abandoned the “significant quotations”
placeholder and began assigning specific codes instead. Later, I returned to the portions
of the transcripts initially assigned as a “significant quote” and coded them with more
specific codes.
Table 8
Interview Questions and Number of Times Used
Question Times asked
Number of Interviews
1. What do you see in this that makes it important? What did you learn from it? What does it mean? What do you take away?
39 11
a. What has been happening that makes it important? 34 10 b. What have you been trying to deal with? 6 4 c. What led up to this? What brought you to this point? 2 2 d. How does that connect with past events? 13 8 e. Have you experienced this before? Explain? 3 3 f. What in the current situation empowers or constrains? 7 5 g. And how has this affected how you see yourself? 0 0
2. To tap gaps: What situations could this help you address? 7 5 a. What have been your big questions? 2 2 b. What has been confusing? What have you been trying to
unconfuse, figure out, learn about? 17 7
c. What have you struggled with? 1 1 d. What has been missing? 22 10 e. What has had you stuck? 5 3 f. How has that stood in the way? 9 6 g. How has this prevented you from getting help? 0 0
3. To tap bridges: How would you use it? 7 5 a. What conclusions/ideas have you come to? 4 4 b. What emotions/feelings have you come to? 10 8 c. What leads you to that conclusion/idea/emotion/feeling? 1 1 d. How would that evaluation connect with your situation? 1 1 e. What has been limited or incomplete about that? 0 0

76
Question Times asked
Number of Interviews
4. To tap outcomes sought or obtained: What would happen from using it?
0 0
a. Where is this all going? 7 5 b. How might that help? And how might that help? 19 8 c. How might that hinder? And how might that hinder? 4 3 d. How might that harm you? And how might that harm
you? 0 0
e. How might that constrain you? 2 2 f. How might that empower you? 1 1 g. If you had a magic wand, where would you take this? 3 3 h. What would that allow you to do/achieve/think? 0 0
5. Probing questions. Generally of the form of “Please tell me more about X.”
55 10
Within the open coding scheme, I assigned a code, usually of one to three words (but
sometimes more), to provide a meaningful label to the passage I was examining. Many of
these codes ended up being unique, or not recurring often. For those that emerged
repeatedly, I used the same code. Occasionally, I merged codes if they were very similar,
but to which I had initially assigned different labels. Eventually, categories of similar
codes began to emerge allowing for grouping, which facilitated the open coding process.
These were codes relating to the following concerns:
1. What informants saw in the plots
2. Potential uses of the plots
3. Problems with the study
4. Impediments to collaboration
5. Other issues
Focused coding. Based on the groups that emerged from open coding, I
developed a scheme for focused and theoretic coding and I reviewed all transcripts
seeking to identify statements related to those focused codes. I conducted focused coding

77
concerning three themes that emerged from interviewee responses—1) what they saw in
the plots, 2) any potential uses of the plots, and 3) missing relationships and other
suggested problems with the study. I did not attempt additional focused coding around
impediments to collaboration or other issues that interviewees raised, as the coding
appeared adequate for use in addressing my research questions. Tables 9–11 present the
frequency of focused codes across the interviews.
Theoretic coding. I conducted theoretic coding concerning two theory-driven
themes that emerged from a confluence of the open coding with the network and sense-
making theory underpinning this research—1) the perspectives of informants and 2) their
sense-making strategies. According to the analytical framework I presented in Chapter 2,
the perspectives of informants could provide some insight into alignment, misalignment
or tensions among individual, organizational or network levels of performance and how
those relate to perceived changes in network action and network structure.
The interviewees’ sense-making strategies potentially illuminate the extent to
which the new information with which they were presented (the network plots) led each
to thought capable of action (phronesis). Tables 12 and 13 present the frequency of
theoretic codes across the interviews.
The next chapter presents examples from the various coding schemes and the
analysis of the qualitative coding as it applies to the research questions.

78
Table 9
Coding of What Informants Saw in Plots
Inte
rvie
w_0
01
Inte
rvie
w_0
02
Inte
rvie
w_0
03
Gro
up_0
04_0
07
Inte
rvie
w_0
08
Inte
rvie
w_0
09
Inte
rvie
w_0
10
Inte
rvie
w_0
11
Gro
up_0
12_0
13
Gro
up_0
14_0
18
Inte
rvie
w_0
19
Tot
al R
efer
ence
s
# In
terv
iew
s R
efer
ence
d
1 : Big multi-program orgs play connective role 0 0 0 0 0 0 0 0 0 3 0 3 1 2 : Clustering of colors 0 0 0 0 0 0 0 0 0 2 0 2 1 3 : Clusters working together 0 0 0 0 0 0 0 0 0 2 0 2 1 4 : Coalitions functioning 0 0 0 0 0 0 0 0 0 1 0 1 1 5 : Confirmation 0 0 0 0 0 0 0 0 0 1 0 1 1 6 : Connections I think are missing 0 0 0 0 0 0 0 0 0 0 1 1 1 7 : Education at the edges 0 0 0 0 0 0 0 0 0 1 0 1 1 8 : Everybody has room 0 0 0 0 0 0 0 0 0 1 0 1 1 9 : Fragility and dependence 0 0 0 0 0 0 0 0 0 1 0 1 1 10 : General level of connectivity 0 0 0 0 0 0 0 0 0 1 0 1 1 11 : Groups I already knew were working together 0 0 0 0 0 0 0 0 0 2 0 2 1 12 : Insiders and outsiders 0 0 0 0 0 0 0 0 0 0 1 1 1 13 : Lack of Income Employment 0 0 0 0 0 1 0 0 1 1 0 3 3 14 : Less isolates 0 0 0 0 0 0 0 0 1 0 0 1 1 15 : Little guys over-excelling 0 0 0 0 0 0 0 0 0 0 1 1 1 16 : Missing actors 1 0 0 0 0 0 0 0 0 0 1 2 2 17 : Redundancy 0 0 0 0 0 0 0 0 0 0 2 2 1

79
Inte
rvie
w_0
01
Inte
rvie
w_0
02
Inte
rvie
w_0
03
Gro
up_0
04_0
07
Inte
rvie
w_0
08
Inte
rvie
w_0
09
Inte
rvie
w_0
10
Inte
rvie
w_0
11
Gro
up_0
12_0
13
Gro
up_0
14_0
18
Inte
rvie
w_0
19
Tot
al R
efer
ence
s
# In
terv
iew
s R
efer
ence
d
18 : Silos 3 0 1 1 2 0 0 0 0 0 0 7 4 19 : Still collaboration without bridges 0 0 0 0 0 0 0 0 1 0 0 1 1 20 : Still Fragmented 0 0 0 0 0 0 0 0 0 0 1 1 1 21 : Things I/we did 0 0 0 0 0 0 0 0 0 1 0 1 1 22 : Tie Confusion 1 0 0 1 0 0 0 0 0 0 0 2 2 23 : Tiny guys doing OK 0 0 0 0 0 0 0 0 1 0 0 1 1 24 : Validation of beliefs 0 0 0 0 0 0 0 0 0 1 0 1 1 25 : We collaborate 0 0 0 0 0 0 0 0 0 0 1 1 1

80
Table 10
Coding of Suggested Uses of Plots
Inte
rvie
w_0
01
Inte
rvie
w_0
02
Inte
rvie
w_0
03
Gro
up_0
04_0
07
Inte
rvie
w_0
08
Inte
rvie
w_0
09
Inte
rvie
w_0
10
Inte
rvie
w_0
11
Gro
up_0
12_0
13
Gro
up_0
14_0
18
Inte
rvie
w_0
19
Tot
al R
efer
ence
s
# In
terv
iew
s R
efer
ence
d
1 : Any real utility 0 0 0 0 0 0 0 0 0 3 0 3 1 2 : Are an organization’s own programs working together 0 0 0 0 0 0 0 0 0 3 0 3 1 3 : Benchmarking - comparing 0 0 0 0 0 0 0 0 1 0 0 1 1 4 : Building Clusters 0 0 0 0 0 0 0 0 0 1 0 1 1 5 : Clarifying Relationships 0 0 0 2 0 0 1 0 0 1 0 4 3 6 : Corporate interests 0 0 0 0 0 0 0 0 1 0 0 1 1 7 : Cross Sector connections 0 0 0 0 0 0 0 0 0 1 1 2 2 8 : Debunking United Way control 0 0 0 0 0 0 0 0 0 2 0 2 1 9 : Expedite planning by narrowing 0 0 0 0 0 0 0 0 0 1 0 1 1 10 : Facilitate differently 0 0 0 0 0 0 0 0 0 1 0 1 1 11 : Forces questions 0 0 0 0 0 0 0 0 0 1 0 1 1 12 : Get funding 0 0 0 0 0 0 0 3 0 0 0 3 1 13 : ground-setting 0 0 0 0 0 0 0 0 0 1 0 1 1 14 : Here I am. We are documented. Are we connected around this issue? 0 0 0 0 0 0 0 0 0 1 0 1 1

81
Inte
rvie
w_0
01
Inte
rvie
w_0
02
Inte
rvie
w_0
03
Gro
up_0
04_0
07
Inte
rvie
w_0
08
Inte
rvie
w_0
09
Inte
rvie
w_0
10
Inte
rvie
w_0
11
Gro
up_0
12_0
13
Gro
up_0
14_0
18
Inte
rvie
w_0
19
Tot
al R
efer
ence
s
# In
terv
iew
s R
efer
ence
d
15 : Identify broader roles 0 0 0 0 0 0 0 0 1 0 0 1 1 16 : Identify conveners 0 0 0 0 0 0 0 0 1 0 0 1 1 17 : Identifying Hubs or backbones 0 0 0 0 0 0 0 0 0 2 0 2 1 18 : Knowledge Sharing 0 0 0 0 0 0 0 0 1 0 0 1 1 19 : Management seeing their connections 0 0 0 0 0 0 0 0 0 1 0 1 1 20 : Messaging 0 0 0 0 0 0 0 1 0 0 0 1 1 21 : New opportunities 0 0 0 0 0 4 0 1 4 1 0 10 4 22 : New partners or collaborators 0 0 0 0 0 0 0 0 1 0 0 1 1 23 : None 0 0 0 0 1 0 0 0 0 0 0 1 1 24 : One Stop - Central Intake 1 0 0 0 4 0 1 0 2 0 1 9 5 25 : Realign 0 0 1 0 0 0 0 0 0 0 0 1 1 26 : Reality Check 0 0 0 0 0 0 0 0 1 0 0 1 1 27 : Reducing complexity for funders 0 0 0 0 0 0 0 0 2 0 0 2 1 28 : Reference 0 0 0 0 0 0 0 0 0 2 0 2 1 29 : Self-reflective criticism or critique 0 0 0 0 0 0 0 0 0 1 0 1 1 30 : Shared interests 0 0 0 0 0 0 0 0 1 0 0 1 1 31 : Sharing reality 0 0 0 1 0 0 0 0 0 0 0 1 1 32 : Shows natural landscape 0 0 0 0 0 0 0 0 0 1 0 1 1 33 : Something to build on 0 0 0 0 0 0 0 0 0 1 0 1 1

82
Inte
rvie
w_0
01
Inte
rvie
w_0
02
Inte
rvie
w_0
03
Gro
up_0
04_0
07
Inte
rvie
w_0
08
Inte
rvie
w_0
09
Inte
rvie
w_0
10
Inte
rvie
w_0
11
Gro
up_0
12_0
13
Gro
up_0
14_0
18
Inte
rvie
w_0
19
Tot
al R
efer
ence
s
# In
terv
iew
s R
efer
ence
d
34 : Survival 0 0 0 0 1 0 1 0 0 0 0 2 2 35 : Trigger Discussion 0 0 0 0 0 0 0 0 0 1 0 1 1 36 : Unlikely suspects 0 0 0 0 0 0 0 0 0 0 2 2 1 37 : Unrealized Potential 0 0 0 0 0 3 0 0 0 0 0 3 1 38 : What is the point? 0 0 0 0 0 0 0 0 0 1 0 1 1 39 : Who is at the table? 0 0 0 0 0 0 0 0 0 0 1 1 1 40 : Who is the interpreter? 0 0 0 0 0 0 0 0 0 1 0 1 1 Total 1 0 1 3 6 7 3 5 16 28 5 75 10

83
Table 11
Coding Missing Relationships and Other Problems With the Study
Inte
rvie
w_0
01
Inte
rvie
w_0
02
Inte
rvie
w_0
03
Gro
up_0
04_0
07
Inte
rvie
w_0
08
Inte
rvie
w_0
09
Inte
rvie
w_0
10
Inte
rvie
w_0
11
Gro
up_0
12_0
13
Gro
up_0
14_0
18
Inte
rvie
w_0
19
Tot
al R
efer
ence
s
# In
terv
iew
s R
efer
ence
d
1 : Academic 0 0 0 0 0 0 0 0 0 1 0 1 1 2 : Arbitrary groupings 0 0 0 0 0 0 0 0 0 1 0 1 1 3 : Can't show multiple program foci 0 0 0 0 0 0 0 0 1 0 0 1 1 4 : Certain Organizations diminished or rendered invisible 0 0 0 0 0 0 0 0 9 0 0 9 1 5 : Confirmation (unconfirmed ties) 0 0 0 0 0 0 0 0 2 0 0 2 1 6 : Cross sector culture clash 0 0 0 0 0 0 0 0 0 0 1 1 1 7 : Graph separation 0 0 0 0 0 0 0 0 1 0 0 1 1 8 : Is this what I really said 0 0 0 0 0 0 0 0 3 3 0 6 2 9 : Labeling 0 0 0 1 0 0 0 0 0 1 0 2 2 10 : Leadership 0 0 0 0 0 0 0 0 0 0 1 1 1 11 : Need program and top-level responses to be complete 0 0 0 0 0 0 0 0 0 2 0 2 1 12 : No Two-Step Verification 0 0 0 0 1 0 0 0 1 0 0 2 2 13 : Not My Reality 0 0 0 5 7 0 7 0 4 4 0 27 5 14 : Partial Roll Up 0 0 0 4 1 0 0 0 1 1 0 7 4 15 : Presentation confusion 0 0 0 0 0 0 0 0 0 1 0 1 1 16 : Quality 0 0 0 0 0 0 2 0 0 0 0 2 1 17 : Questioning methodology 0 0 0 0 0 0 0 0 3 1 0 4 2 18 : Relationship Type Confusion 0 0 0 0 0 0 0 0 7 4 0 11 2 19 : Resources 0 0 0 1 0 0 2 3 0 0 0 6 3

84
Inte
rvie
w_0
01
Inte
rvie
w_0
02
Inte
rvie
w_0
03
Gro
up_0
04_0
07
Inte
rvie
w_0
08
Inte
rvie
w_0
09
Inte
rvie
w_0
10
Inte
rvie
w_0
11
Gro
up_0
12_0
13
Gro
up_0
14_0
18
Inte
rvie
w_0
19
Tot
al R
efer
ence
s
# In
terv
iew
s R
efer
ence
d
20 : Respondents from big organizations know all relationships 0 0 0 0 0 0 0 0 0 1 0 1 1 21 : Snapshot in time 0 0 0 0 0 0 0 0 0 2 0 2 1 22 : UW Lens 1 0 0 0 0 0 0 0 2 2 0 5 3 23 : Visual Representation 0 0 0 0 0 0 0 0 3 5 0 8 2 24 : Wrong Respondent(s) 0 0 0 0 1 0 0 1 0 5 0 7 3 Total 1 0 0 11 10 0 11 4 37 34 2 110 7
Table 12
Perspectives of Informants
Inte
rvie
w_0
01
Inte
rvie
w_0
02
Inte
rvie
w_0
03
Gro
up_0
04_0
07
Inte
rvie
w_0
08
Inte
rvie
w_0
09
Inte
rvie
w_0
10
Inte
rvie
w_0
11
Gro
up_0
12_0
13
Gro
up_0
14_0
18
Inte
rvie
w_0
19
Tot
al R
efer
ence
s
# In
terv
iew
s R
efer
ence
d
1 : Business-like 0 0 0 0 0 0 0 3 0 0 0 3 1 2 : Client 2 1 1 0 3 0 1 1 1 0 0 10 7 3 : Community 1 0 1 0 0 0 0 0 0 1 2 5 4 4 : Family 3 0 5 0 0 0 0 1 0 0 1 10 4 5 : Network 8 1 0 0 0 2 0 1 0 2 0 14 5 6 : Own Organization 2 8 5 2 0 0 1 1 1 4 2 26 9 7 : Partner(s) 0 0 0 0 0 0 0 0 0 3 0 3 1 8 : Individual/Personal 0 0 0 0 0 0 0 0 0 0 0 0 0 9 : Regional 0 0 0 0 0 0 0 2 0 0 0 2 1

85
Table 13
Sense-Making Strategies of Informants
Inte
rvie
w_0
01
Inte
rvie
w_0
02
Inte
rvie
w_0
03
Gro
up_0
04_0
07
Inte
rvie
w_0
08
Inte
rvie
w_0
09
Inte
rvie
w_0
10
Inte
rvie
w_0
11
Gro
up_0
12_0
13
Gro
up_0
14_0
18
Inte
rvie
w_0
19
Tot
al R
efer
ence
s
# In
terv
iew
s R
efer
ence
d
1 : Confuses - Missing or incomplete 4 2 0 0 5 3 7 2 11 10 3 47 9 2 : Confuses - Presentation (or does not see anything much) 0 0 1 0 0 0 4 0 6 8 2 21 5 3 : Surprises - Contradicts current understanding (about self or own organization) 0 0 1 5 1 0 0 0 0 0 0 7 3 4 : Surprises - Contradicts current understanding (about situation or others) 0 2 1 3 0 0 0 0 7 2 1 16 6 5 : Makes Sense - Confirms what I already believe (about self or own organization) 1 2 0 1 0 0 0 0 2 1 0 7 5 6 : Makes Sense - Confirms what I already believe (about situation or others) 4 1 2 3 0 0 0 0 4 6 1 21 7 7 : Makes Sense - New Information 1 0 0 0 0 0 0 0 1 2 3 7 4 Total References 10 7 5 12 6 3 11 2 31 29 10 126 # strategies used 4 4 4 4 2 1 2 1 6 6 5 7

86
Chapter 4: Subject Area Findings
This chapter presents the subject area findings from the case and addresses the
first four research questions. Question 5 is addressed in Chapter 6.
To review, I set out to investigate the following research questions in this study:
1. Do network participants make-sense of network plots in ways that could
influence their collaborative actions?
2. If so, how do network participants make sense of network plots and what are
the potential implications of that sense-making for network managers?
3. If not, why not? In those cases, what do participants think of the network plots
and what are the potential implications for researchers and analysts?
4. What factors may influence the sense-making of individuals and how might
sense-making vary based on those factors?
5. Based on the results of the investigation, what existing theories from the
literature might further elucidate this process or what new theories could be developed
and tested?
The first four questions are addressed in turn below.
Question 1a: Do Participants Make Sense of Network Plots?
According to Dervin, sense-making is “behavior, both internal (i.e. cognitive) and
external (i.e. procedural) which allows the individual to construct and design his/her
movement through time-space. Sense-making behavior, thus, is communicating behavior.
Information seeking and use is central to sense-making” (Dervin, 1983, p. 3). Although
Dervin defines sense-making as “behavior,” I did not construct this study to garner its
findings from observable behavior. Like most of Dervin’s own work on sense-making, I

87
used informant’s self-reported cognitions and perceptions of potential uses or actions
arising from information.
It may be clearer to define sensemaking in terms of what it is not, rather than what
it is. Based on Dervin’s definition, information that does not lead to action which helps
an individual construct or design their movement trough time-space, is not part of sense-
making. Likewise, if an individual is not able to extract information from a purported
information source or if it is meaningless to them, then it cannot lead to sense-making in
Dervin’s terms. Lastly, if an individual deems extracted information to be unreliable, it is
unlikely to lead to sense-making; although, it could be an example of sense-unmaking
where individuals draw on alternate information sources to resist powerful actors’
interpretations and taken-for-granted implications for the uses of information that
contradict an individual’s own experiences, values, interests or sense of self. In some
cases, an individual’s sense-making/unmaking may present as a justification for inaction
based on suppositions or unsubstantiated alternative explanations arising from sources
other than the information being considered. Just because a plot “did not make sense” to
an observer, does not necessarily mean that there is no sense-making going on. Similarly,
just because a plot “did make sense” does not mean that they did engage in sense-making.
Not every thought that arises by considering an information source constitutes sense-
making. Finally, individuals may engage in sense-making, but that sense-making may not
be related at all to the plots.
To help “make sense” of all these different situations, I present a typology in
Table 14 of the intersections between cognition and actions that either do or do not
constitute sense-making based on the patterns of responses I observed in my interviews.

88
Sense-making exists at the intersection of types of information extracted and potential
uses of that information. I identified three different uses of information that constituted
different types of sensemaking—two that represented movement and one that represented
non-movement. For sense-making with uses related to movement, the sense-making
could either support change or support resistance to change (which I treat as sense-
unmaking). In the non-movement flavor of sense-making, individuals use information to
reinforce or justify the status quo. In this table, I infer possible connections between the
sense-making strategies I encountered in my interviews, with the likely hood that it could
relate to a particular use. These inferences did not arise from my interviews because it
was rare that I was able to get an informant to discuss potential uses in the context of how
they were making sense of information they extracted from a plot. Instead these are
inferred but logical connections that I will synthesize into a refined framework in Chapter
6.
Most informants in this study displayed multiple sense-making strategies across
their interview since they were examining multiple pieces of information embedded in
different plots. Additionally, informants potentially extracted information both from what
was seen in the plots and from what was not seen. There were only a few examples where
informants clearly connected the information that they extracted from the plots with
related potential actions on their part, such as occurred in the following exchange:
Interviewer: Okay. So, if you want to flip to the coordinated referrals. Start there. All right. So, what do you see in this that makes it important? What do you learn from it, what does it mean, or what do you take away?
Informant: Okay. What I see in it that makes it important is that there seems to be a great deal of players in this, but they may not all be utilized.
…[probes on meaning, importance, feelings, things missing, etc.]… Interviewer: How could you use this sort of view of what's out there
happening and not happening within your own programs?

89
Informant: Well, I know that personally I’d definitely start reaching out to some of these places, and finding out what they do have, like a RADAR. Transportation is often a huge issue for our families and they may qualify based on many of them have disabilities or children with disabilities and different things--so that might be a place I would reach out to. Continue reaching out to Carilion and even try to reestablish a relationship with LEAP. Start looking into Big Brothers Big Sisters again, just seeing if they have an interest in getting back into a more coordinated referral type thing where we can refer students for a mentor. So yeah, I think it's a very useful tool to look and see who is connected and who is not, and where we can establish those connections. (Interview 009, 5/30/2017)
In this exchange, the informant connected the observation that the plot showed
many unutilized players with a motivation to begin reaching out to establish coordinated
referrals—one of the few clear indications I heard connecting information from a plot
with a potential collaborative action. Informants rarely connected specific information
with potential future actions without encouragement to do so. Of the 11 interviews I
conducted, 7 had 0-5 statements coded as possible uses. Another 2 had 6-10 statements
coded as uses and only 2 had more than 10, one of which was the sponsor, the United
Way. Of the 67 unique statements coded as relating to usefulness, I only categorized
eight as strong, indicating that the respondent seemed confident of a specific use for
themselves that they intended to act upon. I coded more statements, ten, as negative,
meaning that the informant questioned the utility of the plot or suggested it would not be
useful. I coded most statements as either weak, meaning the informant offered only
probable uses for themselves or speculative uses by others, or as exploratory, meaning
that the informant identified only questions that they might need to explore. In the case of
both weak and exploratory statements, it seemed less likely that any actions would
emerge from the thoughts arising from consideration of the plots that were reported by
informants. See Table 15 below for the distribution of counts of use statements across
cases.

90
Table 14
Is It Sense-Making?
Type of information extracted
Uses of Information Non-movement Movement
Not Sense-making
Sense-making reinforcing
the status quo
Sense-making supporting
change
Sense-unmaking supporting
resistance to change
Objects that “Don’t Make Sense”
Information not extracted: No Information Useless Information
Information that does not come from the object of inquiry
Yes, but may not
relate back to object of
interest
More Likely Possibly More Likely
Information that confuses: because unintelligible
Not Likely Not Likely Not Likely
because incomplete
Possibly Likely, if not addressed
Likely, if addressed
More likely
because perceived as invalid
More likely Not Likely Less Likely Possibly
because perceived as biased
Not Likely Possibly Less Likely Very Likely
Information that contradicts: beliefs about self/organization
Possibly Not Likely Less Likely More Likely
beliefs about situation/others
Possibly Not Likely More Likely Less Likely
Objects that “Make Sense”
Information that confirms: beliefs about self/organization
Possibly More likely More likely Possibly

91
Type of information extracted
Uses of Information Non-movement Movement
Not Sense-making
Sense-making reinforcing
the status quo
Sense-making supporting
change
Sense-unmaking supporting
resistance to change
beliefs about situation/others
Possibly Less likely Less likely Possibly
Information that educates: New Information Any Any Any Any
Table 15
Distribution of Categories of Use Statements
Categories of use statements Count of Coded Statements
Interviews Represented
Strong: Informant seemed confident of a specific use for themselves that they intended to act upon
8 5
Weak: Informant offered only probable uses for themselves or speculative uses by others.
19 6
Exploratory: Informant identified only questions that arose that might need to be explored.
13 4
Negative: Informant questioned utility or suggested that it would not be useful
10 4
Not from Plot: The statement emerged related to other elements of inquiry, not from the plots.
17 7
Total 67 10
Per the theoretical framework illustrated in Figure 1, thought not capable of action
would not constitute sense-making. Of the many and varied thoughts that informants
shared as having emerged from consideration of the plots, few met the definition of
sense-making that I modeled on phronesis—thought capable of action.
In the interviews, I only asked a variation of the question “How would you use
it?” seven times about plots. I coded two of those use responses as strong use responses,

92
two as weak, one as negative and two did not offer any use—offering instead something
akin to a non-sequitur.
At times, when prompted for potential uses, there seemed to be less connection or
nexus between the information informants extracted and any contemplation of action.
Consider, for example, the following exchange:
Interviewer: Okay, so let's look at the integrated services ... So what do you see in this that makes it important? What do you learn from it, what does it mean, or what do you take away from it?
[Extended Silence followed by Informant 012 going back over the study’s definition of integrated services]
Informant 013: Well, on the flip side of that, what stood out when I looked at it was how big this list is over here of isolated organizations and programs, which, as you mentioned, just kind of grows as you go through the four different types of relationships.
Informant 012: Yeah, that's a good point. I'd kind of forgotten that that's what that was over there.
… Interviewer: So, if you were to try and use this plot to do something, what
situations would it help you address if any? Informant 12: I mean, I think it might be if we wanted to set up a new
service, or a new program, or a grant, we might be able to look at this and say, ‘In the realm of one of these issues-’ I mean, for us, it would be income and employment probably, would be our bucket that we should be in. Is there anybody on here that's doing something that we would want to explore further? So, if they're providing an integrated service, how are they doing that? And what information do they have? I mean, I don't know if we could pull in other examples. But the SwiftStart program with TAP, we've actually– maybe you've been made aware of this, but we pulled some of the templates from that into the new [employment] program. So, I think that's an example of a real-world knowledge, but maybe in the future, we could look at something like this and say, ‘Huh, Salvation Army, Council of Community Services are doing something together here.’ And I'm familiar with the missions of both those organizations. That's an interesting pairing. What are they doing? And what will we– if we were running into work in that realm, maybe we would think Salvation Army. Our organization is probably more similar to the Council of Community Services because we're a bigger umbrella group that's supposed to work with a broader group of stakeholders out there. So we might compare ourselves to some like groups in here as well, I would think. (Group 012_013, 6/7/2017)
In this exchange, the informants reported that the plot might be useful for tapping
into the network for a future new program of their own; however, that potential use had a

93
somewhat unclear link to the primary information they were initially able to extract, the
existence of many isolates. Based on the extended pauses in responses to questions about
meaning and uses which can be heard in the interview recordings, my sense was that
some respondents may have been struggling to extract meaningful information from the
plots or any potential uses of that information. Instead, consideration of the plot, at times,
seemed to offer informants an opportunity to discuss other perceptions and concerns
arising from their understanding of the goals of the self-sufficiency initiative, such as in
the following exchange:
Interviewer: So, thinking again of those missing relationships, what's been happening that makes that important that they're not there?
Informant: Well, like I said, my impression is that this is going to be used to inform funding decisions. And I'm going to guess the more robust relationships, the more money. So, if your particular relationships are not representing, well, then you're going to be perceived as not having as big an impact in the community. That is what I would think. I could be wrong about that. But, I mean, if we want the whole picture, we want the whole picture.
… Interviewer: So, let's see. What leads you to that conclusion? Informant: Well, we know that the funding pie is shrinking. And we saw it
pretty dramatically with what’s happened with United Way. So, we're getting–and I count us fortunate, too–but we're getting considerably less than 50% of what the original award was, which I understand given the climate. And then the City of Roanoke had to reduce funding, as well. So, they got to decide how to allocate money. And I'm going to think, of course you're going to put it where you think it's going to do the most good. And with organizations that– you're going to look at the number of people touched and you're going to look at the success of their interventions to determine that's where the best investment is. That's only common sense. That's as is should be. It would be a mistake to keep funding programs that don't have an impact. (Interview 010, 6/5/2017)
In this exchange, the interviewee attributes their thoughts to the impression that
their ties are not well represented on the plots, but quickly moves to an understanding of
a new funding environment in which decisions are strongly influenced by numbers of
clients served and the success of interventions, which is not information contained in the
plots.

94
The predominant themes that emerged across interviews were confusion because
of missing information or unintelligible presentation. However, a variety of other sense
making strategies did arise from the key informant interviews. Table 16 presents the
broad sense-making strategies that emerged from the study, along with a few selected
examples, many of which I return to unpack in later sections. See Table 13 in the
previous chapter for counts of sense-making strategy codes by interview. See Table 14
for how sense-making strategies might connect to potential uses. I address those
strategies that could constitute sense-making in section 2a of this chapter concerning how
participants make sense of network plots. I address those strategies that may not have
constituted sense-making in section 3b that describes what participants thought about the
network plots in those circumstances.
Because of the open non-directive SMM interviewing strategy, which allowed me
to pick and choose questions during the interview and the fact that some of the questions
happened to align with the coding scheme I developed, counts of coded responses may
not necessarily correlate with important themes. Had I instead used a more structured
interview or survey, asking the same questions about each plot, those counts of coded
responses might be more meaningful. So, while I do at times reference the prevalence of
the coding associated with certain types of responses, I believe it is the substance of the
responses that best illuminate my research questions. That said, the coding that emerged
the most often across the largest number of respondents related to confusion from a sense
of incompleteness or missing pieces emerging from their examination of the plots (47
coded statements across 9 interviews).

95
Table 16
Sense-Making Strategies With Examples
Strategies Illustrative examples from the coding 1 : Confuses - Missing or incomplete 47 coded statements across 9 interviews
“So, my observation is that there's more connections here than you see on this piece of paper (Interview 008, 5/30/2017).”
“…Now a lot of people that we have ties with at [the] program level are not on this chart (Interview 010, 6/5/2017).”
“And so, I feel– one of the things that stands out to me is that I feel like there are some relationships that have been missed in particular with regards to services that we share, or information that we share with the other agencies (Interview 011, 6/7/2017).”
2 : Confuses - Presentation (or does not see anything much) 21 coded statements across 9 interviews
“Well, this is crazy, I don't know how anybody would interpret that because you couldn't even– when you get in here you can't even see where the– is it that one (Interview 010, 6/5/2017)?”
“Because I need a magnifying glass and it's not the font. It's like information overload for me. …Visually, this gives me just as much heartburn as the last one [laughter]. I mean, it seems like visually there would be a better way to represent this than this kind of graph (Group 012_013, 6/7/2017).”
“I mean, even in this [plot] … I would pull that one out as an example of what doesn't work. And it's not because it didn't try to work. It's because it's literally– maybe my mind doesn't work like this, but I don't have the capacity to look at this and see connections in a way that helps me extrapolate meaning (Group 014_018, 6/12/2017).”
3 : Surprises - Contradicts current understanding (about self or own organization 7 coded statements across 3 interviews
“Well, if you need to be liked in the community, it's not the job for you. But it also takes heart, makes us have to work harder at building relationships. And to try to not get defensive about people throwing us under the bus, but try to take every opportunity that we can to educate people about what we do and how we do it (Interview 003, 5/15/2017).”

96
Strategies Illustrative examples from the coding “Well, certainly Head Start should be connected with all
three. So how that happened– that's real interesting, that’s major– especially Smart Beginnings and Greenvale School are not connected to Head Start (Group 004_007, 5/22/2017).”
4 : Surprises - Contradicts current understanding (about situation or others) 16 coded statements across 6 interviews
“You know what surprised me was the Local Office on Aging being kind of at the perimeter of a lot of places, of a lot of the charts (Interview 002, 5/11/2017).”
“Well, it does surprise me that TAP is such a central player in all of this, because I mean, I think TAP has some good programs but I don't think TAP has very good follow-through (Interview 003, 5/15/2017).”
“Why does Greenvale, who's a central, really almost downtown Roanoke non-profit where all the other non-profits are, why are they so removed from everybody else (Group 004_007, 5/22/17)?”
“I, just as an outside observer, some of the ones that are outliers, I actually see where there is a connection between them and some of these other organizations. So, it's kind of a little shocking to me that there was not a connection (Interview 019, 6/26/2017).”
5 : Makes Sense - Confirms what I already believe (about self or own organization) 7 coded statements across 5 interviews
“And probably because I'm only new to the Valley … by three years that this in many ways kind of confirms what I thought, that we've kind of connected in a lot of different ways through a lot of different people (Interview 002, 5/11/2017).”
“So, you can look at it, and you can say, ‘Okay. Clearly, the homelessness continuum is strong.’ And you can see specifically who the key players are in that continuum (Group 014_018, 6/12/2017).”
6 : Makes Sense - Confirms what I already believe (about situation or others) 21 coded statements across 7 interviews
“I, mean looking at it, it makes total sense that Goodwill and TAP are sort of in the center, and Workforce Board is removed (Group 004_007, 5/22/17).”
“Just looking at these relationships, I'm pretty aware of some of these. And it makes sense. I don't see any on here that shock me (Group 012_013, 6/7/2017).”

97
Strategies Illustrative examples from the coding
“But there's this very clear substance abuse group at the top, and then there's the housing group, and there's the childcare group that's off to the side not connected with anybody else. So, there's some very clear clusters of folks that I know because I work in the field, that I know are working in coalition. And so, this shows me that those coalitions are functioning (Group 014_018, 6/12/2017).”
7 : Makes Sense - New Information 7 coded statements across 4 interviews
“I found the most interesting and informative plots to be the one between your shared information networks and the one that has established formal relationships. And so, in the presentation as well as in the slides, it talks about the difference between the two and how people perceive that they have relationships with others informally, but then when you have the formal relationship plots, it's a very different story. So, I found that very informative, found very surprising (Interview 001, 5/11/2017).”
“Well, I'd say we can find out who our core players are in our community, who we may consider strong advocates in our community, agencies that if they were to go away, they could have a great detriment to our community with the services that they provide. And some of them, as you mentioned, is if you have two outliers but there is one core connector, somehow, that does bring those together. So, I think that's clearly what those might demonstrate to us (Interview 019, 6/26/2017).
Some of the prevalence of that coding may have arisen because “What has been
missing?” is one of the direct questions on the SMM question roster and is one that I
asked often (22 times across 10 interviews – see Table 8 for the prevalence of all
questions across interviews). However, respondents offered these sorts of responses
easily with compelling anecdotes and explanations. According to the coding, informants
were less likely to engage in sense-making that confirmed existing beliefs (28 coded
responses over 7 interviews) or were somewhat less likely to think it worth discussing in
their interviews. As evidenced by the long pauses which may be heard in interview

98
recordings, some informants struggled to offer any meaningful response to what they saw
in the plots that they thought was important or useful. Take, for example, the following
exchange:
Interviewer: Feel free to kind of re-familiarize yourself with this, or if you like, I can go through it. What we will want to do is pick two or three of those plots that you find most interesting, or informative, or curious, or just that you want to talk about and I'll make notes of those and then I'll ask you my questions about each of the three.
[20+ seconds of silence] Informant: Are you waiting for me to do something? Interviewer: So, I'm just giving you a chance to look through there, and
then what I'll ask you to do is, after you've gotten through there, to go back and pick three.
Informant: Oh. How in the world would I do that? Based on what? (Interview 010, 6/5/2017)
While not as clearly expressed as in the exchange above, there were other
instances in which informants seemed to be stretching to identify something in the plots
in response to the specific prompting of the interview. Although all informants were
provided with copies of the network plots well in advance of the interview, some
admitted that they had not looked at them and it is possible that some of them came into
the interview without having developed a pre-established understanding of meanings
arising for them from the plot. Instead, it is possible that some of my informants had
spent little time examining the plots and were attempting to sense-make of them on the
fly. This may have accounted for some of the struggles evident in some interviews.
Therefore, my sense-making findings may be skewed to a very early stage of a longer
ongoing sense-making process.
Perhaps because of this difficulty, a few informants implied that there might be
some underlying flaw with the study that caused it to deviate from their perceived
understanding of reality. Take for example the following statements:

99
That doesn't even make any sense, and so, if you're looking to address community need, then that– your priorities are only going to be as good as the information you've got. Right? So, I feel like somehow you don't have the information you need from us and I don't know how I failed in that… Well, and I think that's what I'm– and that's what I came away from that meeting, feeling like that maybe I wasn't trusting the data that had been gathered. And maybe it's better than I think it is, but if you look at this, you're looking at that being what informs the community what changed and how you allocate resources, then the accuracy of that data is pretty important, as far as I'm concerned. (Interview 010, 6/5/2017)
And it frustrates that it doesn't look like what I know it should look like, and I think we saw that in the room too. There's just a lot of frustration to look at that. Even if you put all the limitations out on the table, and you know it's not the full network, and you know it's just a snapshot in time, and you know that all your partners weren't there, but it's still just like, ‘I just want to fix it [laughter].’ (Group 014_018, 6/12/2017)
“Why is CHIP over in isolation up here? Is that a mistake?” (Group 014_018, 6/12/2017).
While it is possible to conclude that network participants were making sense of
network plots in different ways, in particular by challenging them, the net result was that
they were often dismissive of the potential usefulness of the plots because of perceived
flaws. Still, these circumstances could be examples of sense-unmaking. Take, for
example, this blunt statement:
If we showed it to people and said, ‘Here's what the system looks like,’ it could hurt us because you might be missing some crucial links on here. So, if you're asking me would we use this, is that the basic question? …The answer for [us] would be no. (Interview 008, 5/30/2017)
Identification and incorporation of new information was one of the least common
responses coded (7 coded responses over 4 interviews). It is significant that of the two
quotations I provide in Table 14 that were coded as new information, one came from the
leader of a large governmental agency not involved in the day-to-day work of
collaboration and the other from an external stakeholder who likewise was not personally
involved in service level collaborations. It may be that individuals less engaged in
100
network activities are more likely to find new or useful information from the plots than
participants who are engaged in day-to-day network activity.
When informants identified something that confirmed their existing beliefs, they
tended to accept it uncritically, while when they saw something that contradicted an
existing belief, they often associated it with an element of doubt. For example,
LEAP seems to be more the bridge between the healthcare groups than anything else, which is very interesting because LEAP is just a tiny, little nonprofit that has like barely any staff. So, I would expect to see New Horizons as more of a bridge rather than LEAP. New Horizons has a lot of resources, good bit of resources. (Group 012_013, 6/7/2017)
In general, the plots did not seem to move informants towards a new, improved or
different belief or understanding. Even when informants identified some information that
was new or that conformed with their existing beliefs, they usually identified other
aspects that were confusing or surprising (See Table 13). Only one informant (Interview
001) offered more statements coded as confirmation or new information than confusion
or contradiction. Four informants made no responses coded as confirmation or new
information.
Therefore, the most accurate answer to question 1a—“Do network participants
make-sense of network plots?”—is that they sometimes did, but there appear to be many
impediments to them doing so. One significant finding from this study is the
understanding that these impediments are an inherent part of a sense-making process that
is more layered that my initial conceptual model—a concept I develop further in Chapter
6.
Question 1b: Do They Do So in Ways That Could Influence Collaborative Actions?
Some informants indicated that they thought they could use the information in the
plots for collaboration, although over a third of the statements I coded as relating to uses

101
of the plots that enable change came from my interview with employees of the United
Way, which may be more representative of a network manager’s perspective than a
network participant’s. Out of over 18 hours of interviews, Table 17 presents the strongest
statements I heard from my informants connecting information from plots to potential
collaborative actions. To organize these, I have aligned them with Agranoff and
McGuire’s (2001) conception of network management processes; however, the
terminology of activation, framing, mobilizing and synthesizing was not how my
informants conceived of these activities themselves.
Throughout the interviews, informants referenced collaborative challenges,
although such comments usually emerged from probing questions, not as information
arising directly from their examination of the network plots. Table 18 presents some of
the collaborative challenges raised repeatedly by multiple informants.
There was little indication from the interviews that the network plots provided
much assistance in helping participants discover ways to expand collaboration toward
network goals. Therefore, the most fitting answer to question 1b—“Do they do so in
ways that could influence collaborative actions?”—is that there was not a strong
indication from the interviews that interviewees would. Instead, informants seemed to
reinforce their existing conceptions of collaborative obstacles and impediments, further
justifying their current patterns of action/inaction rather than learning possible new
approaches from examination of the plots.

102
Question 2a: If So, How Do Participants Make Sense of Network Plots?
How participants attempted to make sense of network plots varied substantially.
There was little indication that that sense-making was an intermediary step between
information and actions as I posited in my initial conceptual framework.
Table 17
Strongest Examples of Collaborative Actions Arising From Network Plots
Network Management Processes
Examples of collaborative actions from interviews
Activation requires network managers to be able to identify actors to incorporate into the network to help secure network objectives
“Yeah, so it varies out, depending. But I think I would take it and go back and look and say, ‘Okay, well, who do I think I have integrated services with, and why don't they see our services as integrated?’ I think it could help me set up some meetings as we're working on grants, to look at, okay, what needs to be stronger, or what's less, or how do we talk about what we do together, and make sure we're on the same page because that's one of the things I noticed is, obviously, a lot of our partners don't see us the same was as I see it, I would think (Group 004_007, 5/22/2017).” “Well, again I think that if you're an individual agency [that] might be managing a $100,000 [budget] or something like that, or less than a million. You are struggling these days, big time and you don't know what the federal government's budget is going to do because that's not going to happen for a while, but you're worried about what you hear. So, what you want to do is figure out, how am I going to survive? And, I think maybe that's the best time to get people to the table to figure out how to survive. I think you can show people things like this and say, ‘Even up at New River Valley there's probably a lot of services there that nobody even knows about.’ If you do this for the New River Valley people, look I say, ‘Wow, I did nothing.’ That's my experience. When I look at things like this, I don't realize how many resources we have. I've been here about 16 years. I've done some of

103
Network Management Processes
Examples of collaborative actions from interviews these exercises before, and once you start to draw things out you're like whoa there is something. We did that for [a past initiative] one time, and we never finished the job because [laughter] it got too complicated. I mean you've got the graphing ability to do that kind of thing right here, but when you step back and you look it, it's like crap there's a whole bunch of things that we could do here. But if you keep it in these little small silos, we will just kind of slowly go down and never really service the people that– not do the mission kind of work we're committed to doing. So that might be the first thing you can do with this stuff is show people the pictures of all this stuff and show all the different services that are out there and say ‘Now, if you were to build this thing brand new, would you build it this way?’ And they'd say, ‘Oh no, it's terrible.’ ‘Well, what would you build?’ See where it goes from there, and that would take a while to figure out, but you would build new– it's a design issue. I think in the 21st Century design is the name of the game. How you design things that are more efficient, more effective, more local, and accountable (Interview 008, 5/30/2017)?”
Framing requires network managers to have an understanding of the roles of network participants so that they can be arranged and integrated
And part of that has to do with having the time and the space to do that, and maybe we're not necessarily the agency that is going to be doing all of those things. But in terms of helping people think about it and how to get there, because TAP and Goodwill and some of the other ones play such a large role in the community, that it's really about– you have to decide where to put your effort. And if what we're seeing is those are the gaps that are there, then maybe it's time for [our organization], for example, to– with the help of some of the other partner agencies, say, ‘All right. How do we fix this?’ because it took us [many] years to get really good at what we're doing right now. If part of the problem that we're seeing are these other things, then we need to start now [laughter] trying to anticipate what some of those other needs are going to be and filling those particular gaps because if there's no one here who can do it really well, then you've got to create something that's going to do it.
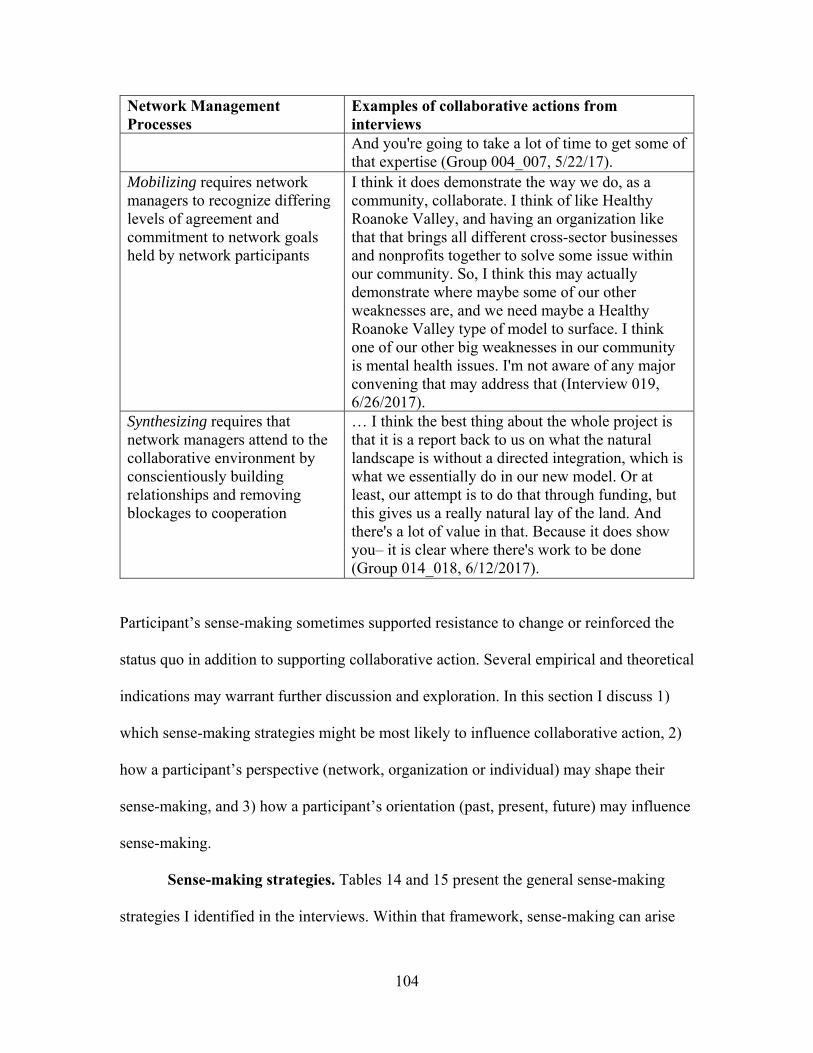
104
Network Management Processes
Examples of collaborative actions from interviews And you're going to take a lot of time to get some of that expertise (Group 004_007, 5/22/17).
Mobilizing requires network managers to recognize differing levels of agreement and commitment to network goals held by network participants
I think it does demonstrate the way we do, as a community, collaborate. I think of like Healthy Roanoke Valley, and having an organization like that that brings all different cross-sector businesses and nonprofits together to solve some issue within our community. So, I think this may actually demonstrate where maybe some of our other weaknesses are, and we need maybe a Healthy Roanoke Valley type of model to surface. I think one of our other big weaknesses in our community is mental health issues. I'm not aware of any major convening that may address that (Interview 019, 6/26/2017).
Synthesizing requires that network managers attend to the collaborative environment by conscientiously building relationships and removing blockages to cooperation
… I think the best thing about the whole project is that it is a report back to us on what the natural landscape is without a directed integration, which is what we essentially do in our new model. Or at least, our attempt is to do that through funding, but this gives us a really natural lay of the land. And there's a lot of value in that. Because it does show you– it is clear where there's work to be done (Group 014_018, 6/12/2017).
Participant’s sense-making sometimes supported resistance to change or reinforced the
status quo in addition to supporting collaborative action. Several empirical and theoretical
indications may warrant further discussion and exploration. In this section I discuss 1)
which sense-making strategies might be most likely to influence collaborative action, 2)
how a participant’s perspective (network, organization or individual) may shape their
sense-making, and 3) how a participant’s orientation (past, present, future) may influence
sense-making.
Sense-making strategies. Tables 14 and 15 present the general sense-making
strategies I identified in the interviews. Within that framework, sense-making can arise

105
from new information or from data that confirms or contradicts beliefs. This study raises
questions about how these different sense-making strategies might influence later
collaborations and how those relationships could, in theory, vary based on the
individual’s sense-making strategy.
Table 18
Collaborative Challenges
Categories Examples of Collaborative Challenges Lack of Collaborative Slack
“…you get so focused on those things that you need to do in your program that it's hard sometimes to think– I don't want to say outside the box–but it's hard sometimes to make those connections when you don't have the space to really consider them and think about them. … You're pulled, your attention is pulled in so many different directions and you're like, ‘I've got to take care of this and this, this thing and I've got 15 grants going on over here, and I've got 20,000 meetings that I need to attend,’ that sometimes that dilution of your attention means that sometimes maybe you don't notice Greenvale hanging out over here, right, because you're so busy trying to meet all of the other mandates that you have, that, relationships are important, and building them is important, but sometimes you just don't notice the things that maybe you could do a little bit better until something like this is put in front of you, and you're like, ‘Why isn't Head Start connected to Greenvale? [They] work with them all the time’ [laughter] (Group 004_007, 5/22/2017).” “Number one, when you work for a non-profit especially, you wear a lot of different hats, and in doing so, you don't always have time to find out what the next person is doing (Interview 009, 5/30/2017).” “Time, right? I mean, we are all trying to do so much with so little. There's just very little time for us all to actually get together and sit down and say, "Here's what we're at and here's what we're doing (Interview 011, 6/7/2017).”
Competition for Resources
“We're all fighting for sometimes the same money (Interview 009, 5/30/2017).”

106
Categories Examples of Collaborative Challenges “We are competing against every single person on here for that dollar, for that person to say who they're going to give their dollars to (Interview 011, 6/7/2017).” “I think that as a community, we oftentimes fight too much over very limited resources, and grants, and other funding sources, so we have to know as a community when it's best to step aside because somebody else may be doing it better than you and not constantly fighting over that funding source (Interview 019, 6/26/2017).”
Collaborative Disposition or Skill
“The constraining factors simply are an ability to work together. You can call it political will, you can call it collaborative skills. … It takes some management skills, leadership skills, change of management skills, all of which are in short supply. Am I depressing you now [laughter]? … That should be taught in school. Because if you have social workers that come out, they just want to deal with one kind of client. They don't care about the rest of the universe (Interview 008, 5/30/2017).” “And some of it, we've got some people that have been in leadership positions for 30 years and their idea of collaboration is very different than what my idea of collaboration is (Interview 011, 6/7/2017).” “And there's so much red tape that we have to jump through. Well, they have to fill out this paperwork, and they have to meet with this person, and they have to be that. And so eventually people get tired of agency time, trying to figure out what it is, and I get tired of it (Interview 009, 5/30/2017).”
Logically, new information that an individual deems to be useful is potentially most
likely to influence collaborative actions. Take as evidence the following statement where
new or surprising information was received as helpful and instigated a challenge to
improve collaborations:
It's interesting. I came in late to this presentation, and I had my resource development officer there to hear the first part of it, and I really came in probably about one of these slides here. And I remember personally being really disappointed that [our organization] wasn't– not disappointed, but it really stood out to me that [we] didn't have kind of higher standing in the nonprofit community here than it does, and that's actually really good for me to see. So, I

107
appreciated that kind of, I don't know, outsiders view of where this organization stands within the community. I thought that was actually really good for us to hear. For me to hear… it gives me some pretty clear direction on what has been missing with regards to our messaging. It helps me understand that I'm not only trying to cultivate a sustained donor base, but I really have to make sure that everyone knows what it is we do here… but then to see it on paper and to see it reflected in the greater nonprofit world as well because I remember at that point in time I was really coming from the business world, but to see that other nonprofits really didn't know about us either [laughter], it's not a good thing see, but I'll take anything as a challenge and try and overcome it. (Interview 011, 6/7/2017)
Information that confirms an individual’s existing beliefs may be the least likely
to influence collaborative actions. Information that contradicts perceptions or
perspectives may not lead to any sense-making resulting in collaborative action if the
individual deems its source unreliable; or, it might have the opposite effect of strongly
motivating collaborative action if the individual accepts the information as valid and
within the scope of their ability to influence. These inferences and insights provide a
foundation for a more refined model of sense-making and research questions that I could
address through potential future studies, which I discuss in Chapter 6.
Network, organization and individual perspectives. Informants often expressed
the perspective of their organization (26 coded statements across 9 interviews), rather
than that of the network (14 coded statements across 5 interviews) or of themselves as
individuals. In fact, I did not identify any informants as expressing an individual or
personal perspective, or at least their responses did not appear self-interested. However, I
did not ask the SMM question, “And how has this affected how you see yourself?,”
which could have elicited such a view. Only one informant consistently demonstrated a
network perspective in their responses (8 of their 16 coded responses portraying a
perspective). For example, below are three coded statements from that respondent
indicating a network perspective. “We don't want to duplicate the services that we're

108
providing and we want to meet the need, whatever we can, where we have the
infrastructure to do so” (Interview 001, 5/11/2017).
And a lot of them are your youth education things. Your Boys and Girls Club, your Methodist Community center, Big Brothers Big Sisters, Craig Child Care. They don't have those confirmed ties. And if you're going to build families that are sustainable and that are going to be self-sufficient, they need to have those ties to the broader network that are in the middle, so the TAP, the Salvation Army, the Family Services, those places, and they don't have them. (Interview 001, 5/11/2017)
“Or as if there were a way for them to understand, their reach would be far greater if they
pooled their resources, not even just financial stuff, but just in communicating”
(Interview 001, 5/11/2017).
However, most informants expressed either a client, community or family
perspective (25 coded responses across 9 interviews). The following statements illustrate
this new ‘beneficiary’ perspective.
I look at it from the perspective that financial fitness for a household, or when they are unhealthy or unfit or not being responsible with their funding, that creates a lot of stress on the household. Sometimes that's the biggest cause of divorce is over money or arguing over money. And then if somebody is stressed out over money, are they neglecting or abusing their children as a result of that stress in the household? (Interview 019, 6/26/17)
“Well then, you’re not meeting all the needs of the community, or you're not meeting all
the needs of your client base” (Interview 003, 5/15/17).
So, if you want to put it in [the] graph up there you almost want to put the person needing help in the middle of that whole graph and you could do this for every single person that needs help. But what kind of services might they need? How do you make it so that they don't have to run around on five different buses or spend days from work in trying to go to these different programs? Can be more like the one-stop concept of more of what the old fashioned settlement house, if you know what that means? (Interview 008, 5/30/2017)
These three orientations were not a part of my initial models of network change. It
seems likely that network participants are disposed to distinguish between the needs of

109
those they serve and the aims of the organizations that exist to serve them. Perhaps
unsurprisingly, network performance may not only be influenced by alignment between
network goals and those of their constituent organizations, but also by network
participant’s perception of the alignment between network goals and community needs
independent of the goals of their own organizations. However, the beneficiary
perspective of those served (client, family, community), might also mask an
organizational perspective if the informant believes their organization is well-positioned
to address that service need. For example, the organization of the individual quoted above
suggesting a one-stop settlement house approach would best serve clients’ needs, has
already established a large campus in a distressed community with a range of programing
available. I suspect that while the dominant perspective of an individual would likely
shape their collaborative choices, sense-making may involve how they frame any choice
in a good light, such as a concern for the needs of beneficiaries. This new understanding
of when sense-making comes into play and how individuals use it provides a foundation
for a revised framework for sense-making and new research questions that I or other
researchers could address through potential future studies, which I discuss in Chapter 6.
Past, present and future orientations. The SMM list of interview questions
explicitly probe for connections to past experience, the present situation and future
possibilities. Logically, network participants all come to the sense-making moment with
different experiences that shape how they interpret information, such as the data
presented in network plots. Each person or organization also exists and operates in their
own unique current situation which can also influence sense-making. If there is little
consensus on the goals of the network or its future direction, then it follows that

110
variations in those orientations may also influence sense-making and collaborative
activities. Based on the interview responses, informants did not exhibit a dominant
overarching orientation (past, present, future) across the interview, but instead switched
between these orientations based on the question I was asking. Instead, the clearest theme
that emerged was a concern that United Way’s change in funding strategy would create a
break from past practice, leading to an uncertain future for many organizations. However,
there was no clear connection between either the level of concern expressed or the fit of
the respondent’s organization in the new funding scheme with the potential for
collaborative activities that might emerge from the information extracted from network
plots. Some programs who expressed concern about their ability to fit into the new
scheme engaged in constructive sense-making with an orientation to collaboration, while
others used a range of information from the plots and other sources to resist the pending
changes. Likewise, some prominent organizations, ones that were central to the network
plots in key strategic positions allowing them to benefit from the potential changes,
engaged in sense-making that might lead to collaborations addressing network goals,
while others were dismissive. Therefore, I could not make any determination concerning
how those orientations could influence collaborative activities. Nevertheless, the idea that
the network plots invoke a perception of a potential discontinuity into the past-present-
future orientation of the network participant provides a foundation for more refined
research questions that could be addressed through potential future studies, which I
discuss in Chapter 6.

111
Question 2b: What are the potential implications for network managers?
Although in this study I identified limited sense-making of the sort potentially
leading to collaboration, that finding could be a result of certain impediments (discussed
under question 3 below) that network managers should consider. However, interviewee
responses did evidence a lack of uniformity in sense-making among interviewees which
is itself a potentially significant insight. Left to their own devices, network participants
could exhibit a great variety of sense-making strategies emerging from examination of
network plots that may lead to an even greater variety of responses affecting future
collaborative actions that may or may not align with the goals of network managers.
While in some circumstances, the reaction of network participants to plots may not be a
significant factor in managing a network thereafter, there are probably many situations
when network managers should carefully consider the potential repercussions of
introducing network plots before doing so. An important use of SNA and network plots is
to show what may be missing in a network by providing “network members the
opportunity to see the structure of the network and to evaluate how it compares with what
they expect or want” (Lemaire & Raab, 2020). Plots are useful for identifying gaps in
network structure such as isolates and fragments with no (or little) connection to the
broader network. However, based on the feedback from informants in this study, network
managers should recognize that network participants may interpret what is not shown in
network plots as something that was missed rather than something that is missing. These
perceived ‘overlooked’ elements are sometimes as important to network participants, if
not more important, than what is depicted. If the representation of their own organization
and close relationships is not plausible in their own estimation, some network participants

112
may deem the overall findings of the study to be invalid or conclude that the entire
process is illegitimate.
The potential that network participants might not use network plots to enable
collaboration, but also to resist change or reinforce the status quo, underscores the
importance of establishing an ongoing process of conscientization among network
participants that brings hidden struggles and vested interests to the surface. Or, as Provan
et al. (2005) have observed, the result of an SNA “will only have practical value to
communities if it can be effectively presented, discussed, accepted, and acted on by
community leaders and network participants” (p. 610). I suggest that this process should
begin even before the network analysis is conducted and should involve participants, not
just managers, deeply in the design of the study. Authentic balanced communication
among network managers, participants and analysts throughout the process is likely
crucial if network plots are to have meaning and usefulness to participants beyond the
abstracted meanings and recommendations provided to them by analysts and managers.
Network managers and analysts would also be poorer for failing to appreciate and
incorporate the perspectives of network participants, especially when they contradict
established expectations, norms and practices.
As a researcher/analyst, I found it disconcerting when my informants questioned
the accuracy of the SNA and resulting plots or when they inferred some flaw in the
analysis. All social network analyses have limitations and I went into the sense-making
phase of the study aware of the limitations of the SNA portion of the research. Gaining
access to the field meant compromising with the United Way on study boundaries, which
are known to have a strong influence on SNA findings (Nowell et al., 2018). Relying on

113
participant self-reports for identifying ties, especially organizational ties, also has well-
understood reliability limitations because of the vagaries of human recollection
(Calloway, Morrissey, & Paulson, 1993; Marsden, 1990). To allow me to examine
participant’s raw sense-making, we planned a process that intentionally offered little
engagement between researchers and participants during study design, data collection,
analysis and presentation. In fact, as a part of the study design, we purposefully provided
only a one-time, cursory presentation of plots with limited interpretation to a large group
of network members and we did not distribute any report containing the plots to the
network members until after I had conducted my sense-making interviews with selected
informants. While these choices could explain some of the situations where informants
thought relationships or actors were missing from plots, I selected the SMM interview
approach to privilege the perspectives of network participants (information users) over
my own as a researcher (information designer), so I was resolved to take their concerns
seriously and not to dismiss them as known limitations of the study. As a result, I felt
obligated to review the data collection and analysis process in a search for potential errors
that could have led to their sense-making frustrations. As a result, although I did not
identify any errors, I did identify a range of methodological choices that had the potential
to influence participant sense-making that I discuss further in Chapter 5. While these
issues may be of more interest to researchers/analysts, network managers should
understand that some choices that enhance the ability of researchers to answer important
research questions using SNA can have repercussions for network participant’s ability to
make sense of network plots.

114
Question 3a: If Not, Why Not (or How So)?
Although it was clear from the interviews that network participants sometimes
had trouble making sense of the network plots, it was initially less clear why they
struggled. By taking their struggles seriously and resisting the urge to conclude that the
network participants simply lacked the technical and scholarly foundation to interpret the
plots appropriately, I eventually came to understand two primary explanations relating to
how participants struggled to make sense of network plots: 1) their inability to extract
meaningful information and 2) irreconcilable disagreements between the graphical
representation of the plot and their cognitive social structure.
In general, sense-making can be stymied if individuals are unable to extract
meaningful information from an information source, in this case the network plots. In
SNA, it is not uncommon for network plots to be of a size or density that can exceed an
observer’s ability to process the information visually. This was almost certainly the case
with the broader network diagrams from this study (see Figures 22 and 23). Sometimes
termed the “hairball effect,” SNA diagrams may have a signal-to-noise ratio that is just
too low for observers to extract useful information, meaning that the amount of useful
information was too small compared to the background “noise” of meaningless data. Off
the record, one informant referred to the plots a “Skittles on spaghetti.” Other informants
shared similar views: “Well, this is crazy, I don't know how anybody would interpret that
because you couldn't even– when you get in here you can't even see where the– is it that
one?” (Interview 010, 6/5/2017). “I don't know how you would make any order out of
this process [laughter], to be honest with you” (Interview 019, 6/26/2017).
Because I need a magnifying glass and it's not the font. It's like information overload for me. …Visually, this gives me just as much heartburn as the last one

115
[laughter]. I mean, it seems like visually there would be a better way to represent this than this kind of graph. (Group 012_013, 6/7/2017)
I mean, even in this one, that any confirmed tie at the program level. I would pull that one out as an example of what doesn't work. And it's not because it didn't try to work. It's because it's literally– maybe my mind doesn't work like this, but I don't have the capacity to look at this and see connections in a way that helps me extrapolate meaning. (Group 014_018, 6/12/17)
A second broad reason that individuals might not make sense of SNA information
is if they reject it as invalid or unreliable, although their justifications for that assessment
could potentially be considered a form of sense-making that results in resistance to action
as opposed to action toward shared network goals. In the case I studied, the underlying
reason some of my informants seemed to reject the information from the network plots
was because it did not match their existing cognitive social structure. When that conflict
exists, individuals have two potential logical approaches. They may accept the new
information and update their conceptions of their social structures, or they may reject the
information to preserve their cognitive social structure (CSS). Those that accept the
information and respond are engaging in sense-making concerning new data that could
result in collaborative actions. Those that reject the information are unlikely to be
motivated toward collaborative actions based on information from the plots and are
instead engaging in a form of sense-making that supports resistance to change or
reinforces the status quo. One reason that the plots may have not have matched some
individual’s CSS is because unconfirmed ties are not displayed, meaning that
relationships that they reported (and therefore exist in their CSS) do not appear on most
plots. Chapter 5 explores some methodological considerations and approaches related to
how some representations (or non-representations) of unconfirmed ties might affect
sense-making.

116
Some informants recognized known limitations of SNAs, including this study,
such as framing of the study by the United Way, difficulty in accessing appropriate
respondents, that the study reflected a snapshot in time, or that there might be some
confusion or discrepancy in how participants categorized relationship types and
intensities. The statements in Table 19 illustrate those understandings by some
participants.
Table 19
Participant Recognition of Study Limitations
Limitations Examples from Interviews United Way Framing
“Actually, the third program that United Way partners with [us on] isn't even on here. It didn't come up on anything, just our two [other programs] did… I'd say in the past, [United Way’s program] has definitely competed with [ours]. And then we tried to complement what [they were] doing, and the structure doesn't work, well, how it's fallen out. A couple months ago, they asked for our [program] training manual to which I said no [laughter] (Interview 001, 5/11/2017).” “Okay. So, I looked at this when I was there at the afternoon session way, way back when and what I thought is that, this is mostly programs, mostly, that United Way funds. So, if you don't get funded by United Way you're not included in this network… So again, it’s more of in a United Way centric view of the world (Interview 008, 5/30/2017).”
Difficulty accessing appropriate respondents
“Well, I think that it's accurate as far as it's goes, but I think they're probably more arrows on here than they're showing and I'm guessing that that goes back to whoever filled this out didn't really think it through fully enough. So, what you have is maybe a picture that could be 80% good, maybe 75% accurate (Interview 008, 5/30/2017).” “I mean, the other survey thing that really sticks out to me in all of this is that we did a really bad job of figuring out how to get a valid– like a good response from Carilion… But I think that probably, we should've asked Community Outreach to fill out a partner survey in some way, and we didn't do that (Group 014_018, 6/12/2017).”

117
Limitations Examples from Interviews “Yeah, the data was collected before I came onboard here at [my organization]. And so, I feel– one of the things that stands out to me is that I feel like there are some relationships that have been missed… (Interview 011, 6/7/2017).”
Snapshot in time “To me, just because it's been right about six months, this is to me is– when I look at it, it's like a past picture. I feel if you were to ask the same people the same questions today, it would look very different for [one component of our organization], and it wouldn't be so isolated out there. (Group 014_018, 6/12/2017).”
Relationship type confusion
“So shared resources, but I think going in, we thought that might be– and even you could integrate services without actually sharing resources, but, again, it's a fuzzy line, people say, I'm sure… Well, I think it's your definition, too. And as I look at this definition, I still think maybe the integration is harder to achieve to some extent, and maybe that's why the data is showing some of that, too, because the definition here is kind of sharing a grant or some resources (Group 012_013, 6/7/2017).” “But what I was frustrated by was when we looked at the four the first time, what I saw were Happy Healthy Cooks not connected to TAP. And it was like, "I think they're mis-categorizing what type of relationship they have." And so, the reason I pushed for this was it didn't matter if I called it resource sharing and you called integrated services, at least we're just showing, ‘Hey we are connected (Group 014_018, 6/12/2017).’”
However, the most common doubts expressed in interviews was that the SNA and
the resulting plots had somehow missed existing ties, meaning that the plot did not
represent relationships that existed in the mind of the informant. As stated above, this was
perhaps the only clear theme that emerged from the interviews.
When noting discrepancies between the plot and their CSS, a few informants
acknowledged that they felt the representation of the plots somehow disadvantaged them:
If we showed it to people and said, ‘Here's what the system looks like,’ it could hurt us because you might be missing some crucial links on here. So, if you're asking me would we use this, is that the basic question? …The answer for [us] would be no. (Interview 008, 5/30/2017)
118
However, the dismissals of validity (or statements of implausibility) were rarely
that clear. Instead, in most interviews the informants did not seek to qualify or explain the
discrepancy, they simply reported it with an implication that their CSS was superior to
the plot. Though there is evidence that cognitive networks can differ substantially from
more objective measures of relationships (Marsden, 1990), it may not in fact matter much
to participant’s sense-making which is more accurate. For some informants, it was as if
the perceived discrepancy lowered their estimation of the validity of the data, perhaps
below some plausibility threshold needed to accept information that could lead to
collaborative action.
Question 3b: If Not, What Do Participants Think of Network Plots?
Although it did not show up directly in most recorded interviews, there were some
off-the-record comments from some participants at various times that they perceived this
study to be an effort by United Way to justify the elimination of funding to smaller
nonprofits in favor of larger collaborative investments intended to create a larger impact.
In cases where informants disputed the information in the plots, it could be an example of
sense-unmaking, where individuals challenge information provided by powerful actors
that they see as intended to disadvantage or control them.
Question 3c: What Are the Potential Implications for Researchers and Analysts?
I identified four potential implications for researchers and analysts based on what
I learned from informants. First, network managers and participants often look to
researchers and analysts as experts to interpret the meaning of the data embedded in
network plots. Take for example the following conversation among three network
managers about how to interpret the plots.
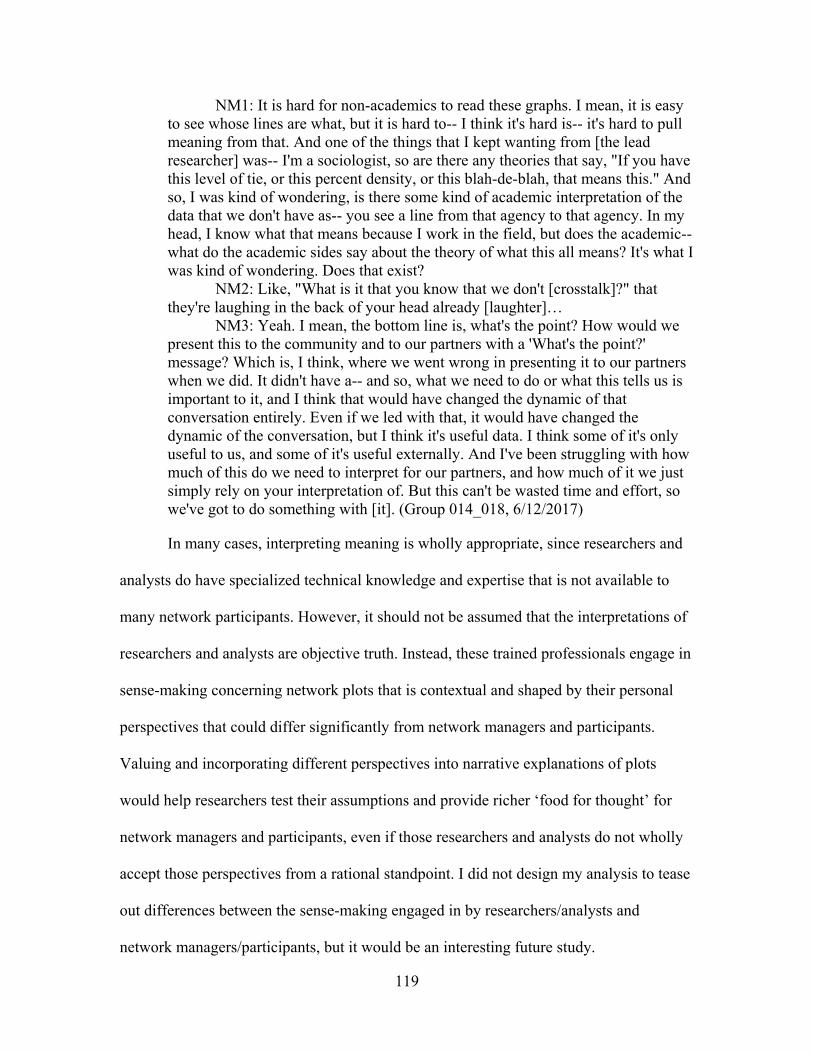
119
NM1: It is hard for non-academics to read these graphs. I mean, it is easy to see whose lines are what, but it is hard to-- I think it's hard is-- it's hard to pull meaning from that. And one of the things that I kept wanting from [the lead researcher] was-- I'm a sociologist, so are there any theories that say, "If you have this level of tie, or this percent density, or this blah-de-blah, that means this." And so, I was kind of wondering, is there some kind of academic interpretation of the data that we don't have as-- you see a line from that agency to that agency. In my head, I know what that means because I work in the field, but does the academic-- what do the academic sides say about the theory of what this all means? It's what I was kind of wondering. Does that exist?
NM2: Like, "What is it that you know that we don't [crosstalk]?" that they're laughing in the back of your head already [laughter]…
NM3: Yeah. I mean, the bottom line is, what's the point? How would we present this to the community and to our partners with a 'What's the point?' message? Which is, I think, where we went wrong in presenting it to our partners when we did. It didn't have a-- and so, what we need to do or what this tells us is important to it, and I think that would have changed the dynamic of that conversation entirely. Even if we led with that, it would have changed the dynamic of the conversation, but I think it's useful data. I think some of it's only useful to us, and some of it's useful externally. And I've been struggling with how much of this do we need to interpret for our partners, and how much of it we just simply rely on your interpretation of. But this can't be wasted time and effort, so we've got to do something with [it]. (Group 014_018, 6/12/2017)
In many cases, interpreting meaning is wholly appropriate, since researchers and
analysts do have specialized technical knowledge and expertise that is not available to
many network participants. However, it should not be assumed that the interpretations of
researchers and analysts are objective truth. Instead, these trained professionals engage in
sense-making concerning network plots that is contextual and shaped by their personal
perspectives that could differ significantly from network managers and participants.
Valuing and incorporating different perspectives into narrative explanations of plots
would help researchers test their assumptions and provide richer ‘food for thought’ for
network managers and participants, even if those researchers and analysts do not wholly
accept those perspectives from a rational standpoint. I did not design my analysis to tease
out differences between the sense-making engaged in by researchers/analysts and
network managers/participants, but it would be an interesting future study.

120
Second, researchers and analysts should take seriously how the representation (or
non-representation) of ties could influence the sense-making of network participants if it
creates a conflict between the CSS of participants and the information that is represented
in the plots. In some circumstances, if the information is accepted by the participant, it
could represent new information and learning that they could use to engage in sense-
making that supports change. However, if they reject the implications of the discrepancy
and hold fast to their existing CSS, they may reject the usefulness of the plot or use it to
resist change or reinforce the status quo. The multiplex, first-order, egocentric plots
developed in the next chapter are one possible way to begin thinking about how to
identify and address this issue as a part of social network analysis. The experience of one
youth organization in the study illustrates this point. In the quotation below, the new
executive director of that organization struggled to make sense of the limited connections
their organization had on the network plots.
I feel– one of the things that stands out to me is that I feel like there are some relationships that have been missed in particular with regards to services that we share, or information that we share with the other agencies. I don't know if it's because it wasn't reported on our end, which is very possible…I think that it's important to note the missing relationships because I mean, the clearest example I can give is [a large multi-program agency]. I mean, we work very closely with [them] to provide opportunities for our kids here in [our organization]. Because of that, we are able to send our kids on field trips and we're able to do college visits that we couldn't do otherwise. [They are] able to confirm a certain number of units of service that they wouldn't be able to confirm otherwise. So, that's the one that really jumps out at me on that on the confirm tie level. Other people that we work with here... just looking through, [nutrition organization], for example. We work with [them], [and mentoring organization]. We have mentors that actually come here to this location through [that mentoring organization] to mentor and tutor kids that we have here on a daily basis. I'm trying to think what else. I will tell you too that this helps to point out to me some places where we're really missing an opportunity to partner. For example, [local faith-based organization] is right up the street from us, and that's been one that's really been on my mind recently as an opportunity that we haven't been fostering that relationship here at [our organization]. (Interview 011, 6/7/2017)

121
This organization reported many relationships to eight other programs, only one
of which was confirmed by those programs. Nine other programs reported relationships
with this organization, only one of which was confirmed by this programs. Of the three
missing relationships discussed by the interview informant, none of them was identified
by the individual completing the survey for this organization and only one was reported
by the other party, but not confirmed by them. Given the number of relationships reported
that were not reflected on any network plots, it is unsurprising that the informant from
this organization struggled to reconcile the plots with their own CSS. In Chapter 5, I
explore some methodological approaches to illuminate and address this issue and help
understand how it might affect sense-making in more detail.
Third, relationship type confusion affects sense-making in multiple ways. During
data collection, SNA survey respondents may conceive and categorize relationships
differently from representatives of those programs with which they have connections.
This can result in ties that exist, but which participants understand differently, being
rendered invisible in many plots. However, perhaps more importantly, my interview
informants seemed to struggle with understanding that most of the plots showed only one
type of relationship. The very idea that there are different representations of the same
network based on different types of relationship confused some informants. For example,
informants would sometimes interpret no relationship existing on one particular plot as
no relationship existing at all, as in the following statement from an informant with an
employment-oriented program.
Well, immediately, the one I see, for me, is it worries me that my only connection to [education institution] that's really showing up for integrated services is if I'm going through the [workforce program]. And I don't really see that that's how it functions, but that's how it represents. And so, obviously, I think [our programs]

122
need to be doing more work for [them], and not through the [other organization] but on its own. (Group 004_007, 5/22/2017)
In reality, this employment-oriented program and the educational institution had
two types of confirmed relationships—information sharing and coordinated referrals. To
the best of my understanding, this entity’s relationship with the educational institution did
not meet the definition of integrated services, so it should be unsurprising that the
relationship was absent from that plot. Instead, the informant found it troubling that the
workforce program looked like an intermediary between the two, even though both the
employment program and the educational institution clearly did have integrated service
relationships with the workforce program through their colocation at a shared facility. If
network participants are not engaged in identifying and defining the relationship types
important for the network, they may be less likely to be able to make sense of them later.
Take for example the following statement from the coordinator of an initiative, a network
participant that also happened to be affiliated with the network management organization
which did have a role in selecting and defining the relationship categories used in the
study: “I also just think that the four services that we-- the four types of relationships that
we put them into don't highlight the strengths of our initiatives” (Group 014_018,
6/12/2017).
Finally, all of these findings support the importance of the broad community-wide
processes of communication, sense-making and conscientization discussed in section 2b
above. Researchers and analysts can play an important role in those processes by helping
balance all voices and helping bring “to consciousness deeply hidden struggles that
society or social structures have a vested interest in silencing” (Dervin, 2015, p. 64).

123
Question 4: What Factors Might Influence an Individual’s Sense-Making?
Situation movement state. As stated in Chapter 2, Dervin has explored how an
individual’s situation movement state might be a predictor of information uses. Table 20
contains an expanded listing of situation movement steps developed by Dervin et al.
(2003). I did not observe as many waiting states as are exhibited in this table and I saw
more diversity of movement related states. I therefore identified two additional situated
movement states that I felt better characterized what I heard in my interviews—cruising
and groping along. In this table I also attempt to identify potential connections between
movement states and the uses of information from network plots, though these are
speculative on my part based on definitional connections rather than being drawn from
information provided by my informants.
Based on the interviews I undertook, it was difficult to establish any informant’s
situation movement state clearly because of the general non-directive questions that I
used in the interview. More direct questions or even asking informants to identify their
own situation movement state might yield a more precise categorization. My analysis of
interviews uncovered no clear themes connecting situation movement states and reported
potential uses of information. A relationship may exist, but it would take a differently
designed study to tease them out. I discuss alternate approaches for gathering information
to determine situated movement states and ways to connect them with potential uses
relevant to network management in Chapter 6. There were, however, several other factors
that seemed more likely to be relevant to sense-making concerning network plots—
alignment with existing cognitive social structure, group vs. individual processes, and the
idealized type of network change that I developed in Chapter 2.

124
Alignment with cognitive social structures. Whether and how an individual
makes sense of network plots may depend on the plot’s alignment with their preexisting
CSS, especially their first order relationships. Some of the informants that struggled to
make sense of the plots suggested that the plots did not properly reflect their relationships
as they understood them. I identified several reasons that informants expected
relationships might not be represented on the network plots.
Table 20
The Situation Movement State
State Description Reinforcing Status Quo
Supporting Change
Supporting Resistance to Change
Previously identified by Dervin and colleagues Decision Being at a point where
you need to choose between two or more roads that lie ahead
+
Problematic Being dragged down a road not of your own choosing
Spin-Out Not having a road - Wash-Out Being on a road and
having it suddenly disappear
-
Barrier Knowing where you want to go but someone or something is blocking the way
+
Being Led Following another on a road because he or she knows more and can show you the way
+
Waiting Spending time waiting on something in particular
+
Passing Time
Spending time waiting on nothing in particular
-
Out to Lunch
Tuning out

125
State Description Reinforcing Status Quo
Supporting Change
Supporting Resistance to Change
Observing Watching without being concerned with movement
Moving Seeing self as proceeding unblocked in any way and without the need to observe
-
Newly identified in this study Cruising Not happy with current
road, but proceeding forward while looking for a better road
+
Groping along
Seeing self as proceeding blindly with a need to explore and test the environment to chart a path
-
: Individuals in this state may engage in this sort of use -: Individuals in this state may follow along with this sort of use +: Individuals in this state may lead this sort of use Note. From Sense-Making Methodology Reader: Selected Writings of Brenda Dervin (p. 262), by B. Dervin, L. Foreman-Wernet, and E. Lauterbach, 2003, Cresskill, NJ: Hampton. Copyright YYYY by Copyright Holder. Adapted with permission.
Some reasons are just part and parcel of SNA, while researchers/analysts could
address others with changes in study design. For example, some network participants
may have important relationships that are not represented on the plots because the object
of that relationship fell outside the boundaries established for the study that we developed
in collaboration with the United way using a nominalist approach (Laumann, Marsden, &
Prensky, 1989; Wasserman & Faust, 1994) based on the inclusion criteria inherent in
their new self-sufficiency initiative. This is not a new finding and researchers have a
variety of ways to address it via study design (Lemaire & Raab, 2020), including realist
and relational approaches where members are engaged in determining what programs are

126
included. What emerged as a potential issue with this analysis is the strong role that
United Way had in determining which programs and organizations would be within the
boundaries of the study, without broad consultation of other network participants in
establishing the roster used for the survey. Two specific examples illustrate this point.
First, in one interview, one large multi-program organization reported that although some
of their programs were included on the roster, one very important one was left off,
possibly because the United Way itself ran a virtually identical initiative, which they had
copied from this organization, and which was not included on the roster. As a result, only
a fraction of this non-profit’s relationships showed up in the network plots. Second,
another organization that was mentioned often in the interviews as being absent on the
plots, but which did rank highly as admired in the community based on an open ended
question, was not surveyed nor included on the roster because the United Way deemed
that they would be unresponsive to the survey, unlikely to participate as a funded partner
in the self-sufficiency initiative and had a reputation for working independent of other
organizations in the community due to their financial autonomy. Both situations could
have been addressed if the organization providing access to the field of research had
taken a less central role in establishing the network boundaries and roster. However, if
researchers are more inclusive of additional programs or organizations, it might not result
in a “better” or more accurate plot of the whole network, because it could also result in
providing too much extraneous information. However, it might improve the sense-
making ability of some participants and reduce delegitimization of the information
provided in the plots.

127
Another similar issue arises for all multi-program organizations when only some
of their constituent parts are listed on the roster. Exclusion of some organizational
elements may be completely legitimate for the purposes of the SNA (unlike the example
in the previous paragraph); however, these exclusions still have the potential to frustrate
the sense-making ability of some participants. One potential way researchers sometimes
address this is to include an “organizational remainder” on the survey that allows
respondents to identify relationships with any other programs run by the organization.
In some, but not all circumstances, the misalignment between the plots and CSS
could have occurred because unconfirmed relationships did not appear on most plots.
This study collected relationship data from participant self-reports. However, this sort of
data collection sometimes fails to provide an objective indication of an actual
relationships, therefore the analysis and presentations focused on “the more reliable
confirmed links, where both partners in every link had to indicate on the questionnaire
that the particular relationship actually took place” (Provan, Veazie, Teufel-Shone, &
Huddleston, 2004, p. 177). In a way, this is how researchers/analysts help make-sense of
network plots and make them more useful for the defined purposes of the particular study
they are undertaking. However, from the perspective of some network participants, it can
significantly frustrate their sense-making ability, even to the point of rousing them to
perceive the plots as “useless.” This is not to imply that unconfirmed ties should be
represented on network plots, but instead that researchers/analysts and network managers
should consider the position this places some network participants in when they seek to
make sense of the plots and how they might react differently from others in the network
when presented with the information in the plots. In Chapter 5, I present a kind of

128
multiplex first-order ego-centric network representation that I develop into different
categories of alignment between network plots and CSS. My hope is that these might
assist in predicting if or how specific participants might make sense of network plots.
Individual versus group processes. In Dervin’s model of sense-making, the
process is largely individual, internal and cognitive. This contrasts sharply with Weick’s
conception of sensemaking as socially constructed (Weick, 1995). While most of my
interviews were individual interviews, which placed my informants in a position where
they were compelled to make-sense of the plots on their own, I did also conduct three
group interviews in which participants could work together to “talk-out” their sense-
making collaboratively. There were obvious differences in the two settings. In the groups,
the informants were much more likely to identify things they wanted to talk about, often
to the extent that I did not get to ask as many probing questions because they probed each
other’s statements on their own. I did not design my study to explore the differences in
these two sense-making settings, but it seemed that there was richer sense-making
happening in the groups as evidenced by the greater number of statements coded as
sense-making using a wide range of strategies and uses (see Table 13). A differently
designed analysis might be able to identify some distinctions, but more importantly could
explore how the properties of Weick’s sensemaking apply to network plots—properties
such as rooting in identity, the retrospective perspective, the enacted evolution of
understanding, its social construction, its iterative ongoingness, its use of extracted cues,
and the sensemaker’s reliance on plausibility over accuracy (Weick, 1995).
Network change models. The type of network change happening within the
network is another factor that could influence sense-making around network plots. The

129
case I studied is an example of exogenous network restructuring (see Figure 9). Since
some informants raised concerns about the United Way’s new funding approach and
since they saw this network analysis as supporting that process, participant’s sense-
making could have been shaped due to concerns about how the United Way would use
the information.
In the network restructuring model, there are several things happening at once that
could confound sensemaking. First, change is driven by an actor exogenous to the
network. By identifying the actor as exogenous, it does not mean that they are wholly
separated from the network, but that the network has relatively little influence over them
or their choices. The United Way itself is being driven toward its new funding approach
by exogenous actors in business and government. Exogenous actors can take several
different approaches to instituting change through the network restructuring model.
While the approach could be consultative, it could also be relatively arbitrary, leaving
network participants with little sense of agency or control. Regardless of where the
exogenous actor’s approach lies along that spectrum, network participants are likely to
evidence some resistance to information if they are opposed to the changes being
introduced or even if they are just uncertain or confused about the possible implications
for their own organization. Network participants may also be less trusting of network
managers and other network participants in mandated or exogenously driven network
change initiatives than they would endogenously-driven ones, leading to greater
resistance to their change efforts (Segato & Raab, 2019).
Second, by definition, exogenous network restructuring results in direct changes
to the structure of a network. In this case, the United Way sought to connect multiple

130
different networks, each working on different issues, together with each other and with
new actors not previously involved in their work. These changes had the potential to put
some network participants in powerful and important positions within the new larger
network while marginalizing others. At the time of my study, the United Way had
communicated these intentions to network participants, but had not yet instituted them
through its new grantmaking strategies. It was unclear to network participants who would
be the “winners” and “losers” in the new system. Since that time, the United Way has
engaged in three years of increased investment in “System Innovation Partnerships”
where network participants identify a lead agency to serve as a backbone to coordinate
the collaborative activities of a group of agencies working on shared goals. Logically, the
agencies that received those grants could become more central, connected and influential
than previously, with greater control over resources and process decisions. How network
participants perceive potential changes to their network position through restructuring
could have a significant impact on how they make sense of current structures represented
in plots.
Third, exogenous network restructuring seeks to change the network activities
that constitute the relationship ties in networks. For example, they may seek to shift
relationships from information sharing toward coordinated referral, integrated service or
resource sharing relationships. These more intensive types of network ties mean some
network actors could lose a modicum of control or autonomy since they would
potentially become more dependent on other programs for those things that they formerly
controlled themselves. Resistance to that loss of autonomy could also shape network
participant’s sense-making, especially if the new network activities take away from other

131
activities that the agencies value as important for obtaining their organizational
performance goals.
Finally, exogenous network restructuring seeks to change the goals of the
network. In the case I studied, the United Way introduced a new and ambitious goal of
lifting 10,000 families out of poverty over a roughly 13-year period. While most network
participants likely saw this as a laudable aspiration, it had the potential to pull them away
from core service work to their target populations. Also, much of the impetus for this
strategic change came from donors and local leaders who expressed beliefs that
nonprofits had not been using their resources wisely or they would surely have eliminated
poverty already. This questionable assumption likely flies in the face of the experience
the nonprofit leaders that are a part of this network. Some participants may have been
concerned that these lofty ambitions would not be matched with resources commensurate
to achieving them, thus leaving their organizations to appear ineffective.
Though these are possible explanations based on the network restructuring model
and are consistent with some interviewee observations, it would take comparison with
sense-making in networks undergoing other types of change and more direct questioning
to determine the extent that these factors influence sense-making in this or other similar
cases. The next chapter explores some methodological issues that emerged from taking
the perspectives of network participants seriously.

132
Chapter 5: Methodological Findings
The Sense-Making Methodology
My use of Dervin’s sense-making methodology as a method of inquiry proved at
once to be both useful and problematic. It can be a difficult methodology to implement
and requires practice and experience to implement effectively. I found selecting elements
for second level triangulation challenging as doing so often took the conversation away
from the objects (the plots) and away from my primary research questions. I also tended
to ask many of the same questions from the roster repeatedly, while using others
sparingly or not at all. For example, I often asked informants “What is missing or
incomplete?” which could be largely responsible for the emergence of that issue as a
major theme. It is arguable that a more direct and directive approach to interviewing
might have better addressed the primary research questions, discovered some useful
patterns in sense-making and illuminated sense-making concerning network plots as
mechanism of network change. Nonetheless, the SMM did prove helpful in uncovering
some interesting and relevant insights into how the collection, analysis and visual
presentation of network data might be improved from the perspective of network
participants. The philosophy underpinning SMM allowed these insights to surface
precisely because it valorizes and respects the insights and observations of informants
that experience the phenomenon being studied.
While informants did not have access to the information needed for the
observations shared in this chapter, their insistence that the plots failed to capture much
of what they ‘knew,’ even about their own relationships, challenged me to revisit the
network data again and again, to review it from the perspectives of participants. And,

133
upon closer examination, I found it understandable why plots sometimes failed to “make
sense” to participants. I present those insights, as they related to five interrelated areas,
below.
1. Boundary setting and sense making
2. Relationship types and sense making
3. Unconfirmed ties and sense making
4. Survey response patterns
5. The egocentric view and sense making
Boundary Setting and Sense Making
Setting the boundaries for social network analysis is always a challenge since,
unlike many physical networks, there is rarely a material edge to a social network.
Nonetheless, “it is common for SNA studies in the management field to be silent or
underplay important issues relating to boundary-setting, informant response rates, and
decisions concerning visualizations” (Conway, 2014, p. 103). Choices concerning which
programs/organizations analysts include on rosters, and those they choose to survey, arise
from multiple theoretical, practical and relational considerations associated with the
purpose(s) of the study, the resources available for it and access to survey respondents.
Unfortunately, the field often gives limited consideration to how different methods
emphasize some network features while ‘systematically obscuring’ others (Nowell et al.,
2018). Wasserman and Faust (1994) discuss two broad approaches developed by
Laumann et al. (1989) to establishing network boundaries—the realist approach where
actors in the network set boundaries and membership and the nominalist approach where
researchers set boundaries based on theoretical concerns.

134
Because we relied heavily on United Way engagement for access to the field and
identification of suitable survey respondents, this study tended toward a nominalist
approach that identified members of the ‘core service network’ as those programs
working, or potentially working, on family self-sufficiency in the Roanoke Valley. In the
process of establishing the survey roster, the United Way did reach out to some network
participants for input on what programs/organization to include or exclude, but this likely
fell short of a relational strategy (Knoke & Yang, 2008) or snowball approach (Borgatti,
Everett, & Johnson, 2018) where network participants define membership through
multiple rounds of nomination. Thus, we used a more nominalist approach to boundary
setting with the United Way as the final arbiter of who to include and who to exclude on
the survey rosters. However, the researchers were able to negotiate the inclusion of three
“name generators” (Marsden, 1987) or open-ended questions asking respondents to name
organizations which they deemed important, influential or admired (up to 5 organizations
for each category), regardless of whether they were listed on the roster or whether the
respondent had an existing relationship with them or not. Although we did not add any
new programs/organizations identified by these questions to those represented in the plots
we produced for the study (because those organizations were not surveyed about their
relationships), it gave the researchers some insight into who might have been excluded
from the initial survey and offered the possibility for us to include them in potential
future data gathering efforts.
When researchers, analysts or sponsors establish network boundaries using a
nominalist approach without the engagement of network participants, network
participants might have difficulty “making sense” of the resulting network plots. Having

135
the network boundaries defined through an inclusive process by network participants
themselves requires extra rounds of data collection and may not always be practical.
However, engaging network participants in establishing the boundaries, even if there are
only subtle differences in where boundaries are set as a result, could redound to a more
sensible network for participants because it may contain actors who are important to
those participants that might otherwise be missing. If it is a goal of a SNA to yield plots
that are sensible to network participants, then engaging network participants in the
boundary setting process may be especially important.
When examining networks at the organizational scale, whose members may each
operate multiple programs, some of which may be included within the network while
others are not, analysts must make decisions about what to do with the “organizational
remainder” or those initiatives that do not fall within a network study’s boundaries.
Multiple informants for this analysis expressed confusion on this count. For example,
I was not surprised to see TAP be an integral part of this just because of their reach. I was a little more surprised to see Goodwill not as integral because it has struck me that they have as many or maybe more programs. And when they saw the big list of programs that were included, TAP had 8, or 9, 10 different ones. And Goodwill had maybe like three or something like that? And I was just like, ‘Where did all their programs go [laughter]?’ (Group 012_013, 6/7/2017)
Even if all programs in an organization are included within a study’s delimited
network boundaries (and on the survey roster), some relationships occur at an
organization or multi-program level rather than with a single discrete program. Including
an organizational remainder node for organizations with only some of their programs
within a demarcated boundary might make the resulting network plot more sensible to
participants. While it may be difficult to confirm ties to organizational remainders,
including them on the roster of first round surveys of relationships may be a prudent first

136
step to provide analysts with information to help determine if they should be included in
subsequent analyses. Confirming organizational remainder relationships would probably
require a separate confirmation step, since it may be difficult to identify and engage an
appropriate respondent that could confirm those relationships in an initial survey. Again,
if a goal of the analysis is for network participants to make sense of network plots, then
including organizational remainders in the boundary setting process may be an important
methodological consideration.
Relationship Types and Sense Making
Relationship type confusion was another factor I identified that could limit
participant’s sense-making abilities. We drew the relationship types employed in this
study—information sharing, coordinated referrals, integrated services and shared
resources—from the broader literature on collaboration and networks and from previous
studies we had conducted. We also focused on relationship types that were of interest to
the study’s sponsor. In some cases, respondents identified that a relationship with another
actor existed, but reported it as a different type than their counterpart did, meaning that
neither relationship could formally be confirmed and therefore did not appear on most
plots—the exception being the plot of Any Confirmed Tie at the Program Level
(Figure 12) that showed confirmed ties independent of the relationship type. Although we
provided detailed definitions and examples to survey respondents for this study, these
relationship types did not emerge from network participants and there did not appear to
be a shared understanding of their meaning emerging from existing or ongoing network
activities that I was able to discern in my interviews. While the approach we used has
merits from a research perspective, especially to aid in comparing studies conducted on

137
different networks, if it is a goal of the analysis for participants to make sense of network
plots, then I suggest that the research design should incorporate approaches for mitigating
relationship type confusion, though each such approach will present challenges of their
own.
I suggest that there are two general approaches for increasing a shared
understanding of relationship types among network participants. First, the framework
used to define ties among network participants could be developed through an extended
process involving those participants themselves. Researchers could use open non-
directive qualitative approaches such as SMM to gain an understanding of how actors
conceive of the different types of relationships at play in the network. Relationship type
and intensity (the two tie attributes examined in this study) may not be the appropriate
dimensions for quantifying relationships for this network, no matter how they are
defined. For example, we could have chosen relationship types distinguishing between
personal and professional relationships and could have quantified them by levels of trust
or mutual benefit. My point is, in the case of this study, we did not involve network
participants in the process of selecting those measures, but instead the project team and
the sponsor selected them to align with their aims for the study. While this is completely
appropriate and defensible, participants might have had less relationship type confusion
had they been engaged in the process of defining those attributes.
A second potential approach that could be used to address relationship type
confusion is for network leaders to operationalize those categories and measures used in
the study within the network across an extended period prior to data collection. If the
network actors become accustomed to using these relationship categories and measures in

138
their normal operations, in time a shared understanding may begin to emerge. For
example, United Ways have long labeled the organizations to which they donate as
“partner agencies” while dubbing those from which they fundraise as “employer
partners.” In this long established and operationalized conception, United Ways are
situated between these two sets of organizations/actors. The network initiative I studied
was attempting to make a major break in these traditional partnerships and it was likely
unclear to most network participants what types of new relationships would emerge. If a
network change agent intends to use exogenous network restructuring as an approach to
refocusing network performance, then a participatory process that collaboratively defines
and operationalizes new relationship types could be an important first step.
Depicting complex organizational and human relationships in numbers for a
network graph will always have its limitations, but selecting relationship categories and
measures that are more sensible to network participants could be one important factor for
ensuring the resulting plots are more sensible. The significance of members
understanding and sharing conceptions of relationship types also emerged in my
exploration of survey response patterns and can be seen visually in the egocentric
network views, both of which I discuss in the following sections.
Unconfirmed Ties and Sense Making
I collected relationship data for this project from participant self-reports and then
used a process known as ‘reciprocal nomination’ to identify confirmed relationships. In
that process, a link is considered confirmed only if reported by both actors in the dyad
independently (Stork & Richards, 1992). Perhaps, the process I used could be better
described a blind reciprocal nomination, because neither party knows whether or not the

139
other party reported a relationship about them. Survey participants are not actually
confirming a relationship that others have said exits; rather, I as the researcher am using
the reciprocal nomination process to confirm those relationships. Some confusion among
network participants may exist by referring to these simply as confirmed relationships,
which may imply that they are respondent confirmed relationships rather than researcher
confirmed relationships. Most plots from this study presented researcher confirmed ties
rather than unconfirmed ties, meaning that both parties independently reported a
relationship of the same type. Of course, some relationship types can be directional (and
not reciprocal) and some can be either directional or reciprocal. I was interested in
reciprocal relationships in this study and I developed all the relationship definitions to be
reciprocal in nature. For example, I could have chosen to define information flows as
directional by asking who participants obtained information from and who they provided
information to; instead, I defined information sharing as a reciprocal relationship
involving “routine conversations between program staff.” Given that focus, removing
unconfirmed ties from the analysis (and the plots) accomplished several important things.
As discussed in (Conway, 2014), unconfirmed ties could represent an attempt by one
respondent to overstate the number or importance of their relationships to present a
distorted ‘self-presentation’ (Goffman, 1973) to create a ‘hoped-for-possible-self’ (Zhao,
Grasmuck, & Martin, 2008). Removing such ties is appropriate in many cases. However,
when one individual fails to report a tie reported by another, researchers commonly
interpret that non-response as indicating that the connection is less significant, weaker or
somehow qualitatively different than a confirmed relationship (Provan et al., 2004) and
that, therefore, it is appropriate to omit it from some graphical representations and

140
analyses. These ‘hidden’ relationships (unconfirmed ties not shown on plots) inhibited
sense-making among some informants, as in the following passage which I have
discussed previously.
I think that it's important to note the missing relationships because I mean, the clearest example I can give is [a certain large multi-program nonprofit]. I mean, we work very closely with [them] to provide opportunities for our kids here in [our organization]. Because of that, we are able to send our kids on field trips and we're able to do college visits that we couldn't do otherwise. [They are] able to confirm a certain number of units of service that they wouldn't be able to confirm otherwise. So, that's the one that really jumps out at me on that on the confirm tie level. (Interview 011, 6/7/2017)
Had the plot shown unconfirmed relationships, the informant may have felt quite
different. For this program, there were 51 reported relationships involving 17 alters, but
only one was confirmed. Interestingly, the implication made in this passage is that the
survey respondent for the large multi-program nonprofit had not confirmed the
relationship discussed which they assumed had been reported by the survey respondent
for the informant’s own organization (which was someone other than the informant),
when, in fact, the respondent for the youth services program of the large multi-program
nonprofit had indicated a relationship, but the survey respondent for the informant’s own
organization had not indicated a relationship with them. However, there was no way for
informants (or survey respondents) to be aware of that fact because the data concerning it
was not accessible to them.
There are several possible methodological explanations for “real” relationships
that are unconfirmed, including the survey respondent’s unfamiliarity with all
organizational relationships, relationship type confusion, and even response patterns. I
have addressed relationship type confusion above and offered potential ways to address
it. Survey response patterns are a specific instance of relationship type confusion that I

141
will discuss in a later section. A survey respondent’s potential unfamiliarity with all
organizational relationships is an issue in any study of inter-organizational relationships.
Especially for large organizations with many connections, identifying and securing
participation from informed respondents with knowledge of those relationships is
difficult. In any SNA, analysts expend much effort to get a very high (close to 100%)
response from all organizations/programs on the roster because of the sensitivity to
missing data (Huisman, 2009) that can lead to misleading conclusions and representations
(Borgatti & Molina, 2003). However, it is challenging to secure effective participation
from one or more respondents from each organization/program who has adequate
knowledge of all relationships and it is difficult to measure and establish the adequacy of
the response when in the midst of conducting a survey.
Much of my informants’ confusion around unconfirmed ties may have been
prompted by the research design choice of using a single point in time survey to collect
ties and then confirm them through reciprocal nomination. In this design, survey
respondents identify relationships without knowing whether other network members are
indicating a relationship with them. Alternatively, another potential approach for
researchers to confirm ties is a two-step survey process in which connections are
identified in a first survey and then confirmed, refuted or otherwise qualified by
respondents in a second survey. While a two-step process may not be appropriate for
some whole network analysis projects, it may be prudent when using the introduction of
network plots to catalyze network change. Researchers would have to discern ways to
address social pressure for respondents to confirm more ties than they would have
otherwise out of fear of causing offence to potential future network partners who may
142
have a different conception of the relationship. This could be addressed by some sort of
graded response (such as relationship intensity) that allows options other than simply
dismissing the existence of a tie. One of my informants, after the interview was over,
suggested a Tinder-like swipe left, swipe right system for relationship confirmation,
which while effective in the world of online hookups, may be ill-fitting for long-term
collaborative spaces. In Chapter 6, I discuss how to design a study to explore the benefits
and tradeoffs of an alternative approach to tie confirmation.
Survey Response Patterns
One of the most interesting findings from this study, for me at least, emerged
directly from the intersection of the method (SMM) and the primary emerging theme
(The Missing). As noted above, some participants experienced such a sense of unreality
about the place of their organizations on the plots that they surmised some sort of error or
flaw had occurred in the research. Taking informants at their word, instead of simply
trying to communicate the limitations of a study of this sort, required that I double and
triple check each step of the data collection and analysis process, starting with the
element of the inquiry that would logically connect most closely with the participant’s
view of the network, their initial survey responses. Respondents completed the survey
instrument online and the investigators extracted the network data into matrix form for
further analysis without necessarily examining the responses in their raw form. Upon
printing the surveys and comparing them to the information in the plots, I observed some
interesting response patterns that were not readily evident to me in the whole network
analysis. These appeared to explain some of the sensemaking troubles experienced by

143
participants. They also could affect interpretation of the network analysis results in
interesting ways.
Someone could interpret the four relationship types surveyed in this study as
progressive, each building on the next from left to right in the way they were ordered on
the survey. That is, one could assume coordinated referral relationships build on the
relational foundation of information sharing; integrated services relationships in turn
build on coordinated referrals; and resource sharing relationships build on integrated
services. However, in the materials we provided to participants we did not define the
relationships that way and we gave leave to participants to interpret the connections
between relationship types as they saw fit. While it is difficult to understand how
coordinated referrals, integrated services or shared resources could exist without
information sharing, they are otherwise independent types of ties as defined in the study
materials we provided to study participants (see Table 2).
To aid in understanding how survey respondents had different understandings of
the relationships between ties, I have categorized several common response patterns as
builder, informer, floater, skipper, completer and mixer. I describe each of these below
and provide examples derived from respondent surveys. I coded individuals’ survey
responses to the assigned pattern if there were no more than two exceptions to the
dominant pattern at the line item level, otherwise, I coded them as a mixer.
Builder. Builders tended to fill in the columns from left to right, stopping at a
certain point before moving to the next row. They rarely if ever chose to leave a column
blank and then provide additional responses further to the right. These respondents
appeared to view each relationship type on the right as deriving from those to its left on

144
the form and that could not exist without the lower level relationships. This pattern is
illustrated in Table 21.
Table 21
Builder Response Pattern
Information Sharing
Coordinated Referrals
Integrates Services
Shared Resources
Program 01 1 Program 02 3 3 3 3 Program 03 2 2 Program 04 1 1 Program 05 1 1 1 Program 06 3 3 3 3
Informer. Informers tended to identify all their relationships as information
sharing only, as illustrated in Table 22.
Table 22
Informer Response Pattern
Information Sharing
Coordinated Referrals
Integrates Services
Shared Resources
Program 01 2 Program 02 1 Program 03 2 Program 04 1 Program 05 2 Program 06 1 Program 07 3 Program 08 1 Program 09 2 Program 10 2 …
Floater. Floaters typically provided one response per row, leaving all others
blank, as illustrated in Table 23. This example also illustrates another observation I made

145
about response patterns—often, if there was a variation from a pattern, it occurred in the
first response. Perhaps Floaters misunderstood the survey instructions and thought that
they were supposed to provide only one response for the tie type that best fit the
relationship. Alternatively, perhaps respondents faced with making choices concerning so
many relationships across multiple dimensions may have employed a sort of shorthand to
help them expedite the process.
Table 23
Floater Response Pattern
Information Sharing
Coordinated Referrals
Integrates Services
Shared Resources
Program 01 3 1 Program 02 3 Program 03 3 Program 04 3 Program 05 2 Program 06 3 Program 07 3 Program 08 3 Program 09 3 Program 10 2 …
Skipper. Skippers, as the name implies, often omitted lower-level relationships
on the left to provide responses for higher order ties to the right, as when they indicate an
information sharing relationship, then skip responding to the coordinated referrals
relationship to indicate a relationship involving integrated services or shared resources.
This could indicate that they thoughtfully considered the relationship definitions and only
provided indications of connection intensities for those that met the descriptions. Their

146
response patterns also suggest that they conceived that all higher order relationships were
based on information sharing, as illustrated in Table 24.
Table 24
Skipper Response Pattern
Information Sharing
Coordinated Referrals
Integrates Services
Shared Resources
Program 01 1 Program 02 1 3 3 Program 03 1 3 3 Program 04 1 3 Program 05 1 2 Program 06 1 2 Program 07 1 Program 08 1 Program 09 1 3 Program 10 1 …
Completer. Completers provided a response for each relationship type if the
connection existed at all, as illustrated in Table 25. They seemed to believe they should
provide a response for each blank on the survey instrument. In many cases, the reported
intensity decreases for relationship types further to the right, but they are never left blank.
Mixer. Mixers did not appear to use any one strategy, as illustrated in Table 26.
Like Skippers, their responses could indicate that they thoughtfully considered the
relationship definitions and only provided relationship intensities for those ties that fit
each description.
Table 27 presents the distribution of response patterns grouped by the
respondent’s dominant pattern.

147
Table 25
Completer Response Pattern
Information Sharing
Coordinated Referrals
Integrates Services
Shared Resources
Program 01 2 2 1 2 Program 02 3 3 3 3 Program 03 3 3 3 3 Program 04 3 3 3 1 Program 05 3 3 3 1 Program 06 1 1 1 1 Program 07 3 3 3 2 Program 08 3 3 2 1 Program 09 1 2 1 1 Program 10 3 3 3 2 Program 11 3 3 3 3
Table 26
Mixer Response Pattern
Information Sharing
Coordinated Referrals
Integrates Services
Shared Resources
Program 01 1 2 Program 02 1 Program 03 1 Program 04 1 2 Program 05 2 3 3 Program 06 3 3 3 Program 07 1 1 Program 08 1 1 Program 09 3 2 2 Program 10 3 1 3 3 …
These response patterns suggest several potential implications. First, although the
latter three relationship types are independent, all logically (and definitionally) rest on a
foundation of information sharing. When Floaters failed to indicate an information
sharing relationship when indicating one of the higher order relationship types, it resulted

148
in fewer confirmed information sharing ties. One potential way to address this is for
researchers to deduce the existence of information sharing relationships in those cases
and represent them on relevant plots.
Table 27
Distributions of Response Patterns Grouped by Dominant Response Pattern
Responder’s Dominant Pattern
Count of Response Patterns
Total Line-item Responses
Line-item response patterns Build Float Inform Skip Complete Blank
Builder 13 215 121 1 61 3 20 9 Floater 19 330 1 180 85 2 0 62 Informer 5 102 0 1 88 0 0 13 Skipper 6 83 5 3 36 36 2 1 Completer 14 164 3 0 1 0 151 9 Mixer 6 100 28 6 27 20 12 7 NA 1 0 0 0 0 0 0 0 Total 64 994 158 191 298 61 185 101
Second, Floaters were more likely to be involved in relationship type confusion,
in which one respondent indicated a relationship of a particular type, but the other
individual in the dyad defined the tie differently, resulting in an unconfirmed tie for both
relationship types that did not appear in plots. Interestingly, Floaters were also the most
likely of all respondents to indicate a relationship by selecting the boxes in the first part
of the questionnaire and then not indicating the intensity for all relationship types (62 of
330 responses or 19%).
Third, because Completers defined all their relationship as containing all four
relationship types studied, we were more likely to represent them as participating in
robust relationships—defined as relationships that consist of three or four of the different
relationship types. Of the 994 line item responses across all surveys, 185 indicated all

149
four relationship types to be present (unconfirmed robust ties). Of those 185, 151 arose
from 14 of the 64 respondents (82% arising from 22% of respondents). Of those 14
respondents, 11 were associated with one of the organizations evidencing confirmed
connections across all four relationship types (see Figure 13). At the organizational level
of aggregation, eleven organizations evinced confirmed ties for all four relationship types
with at least one other organization (see Figure 26). Of those eleven, five respondents
were Completers and four were Builders.
Figure 26. Robust relationships with response patterns identified.
Respondents’ use of these two strategies make it more likely that the analysts
would show them as participating in a robust relationship in Figure 13. Table 28 presents
organizations with robust ties.
Completers may not have been necessarily indicating the presence of all four
relationship types as much as they apparently assumed that they were supposed to

150
provide a response for each blank on the survey form. Researchers may address some of
this phenomenon by using processes to confirm relationships and SNA-specific statistical
techniques to address autocorrelation. However, it is also possible that completers’
indication of a relationship intensity of 1 (defined as “Not an especially important or
frequent link”) may have been equivalent to a blank or non-response for individuals using
other response patterns. I had assumed as I began this inquiry that humans’ predilection
to find patterns would result in sensemaking concerning the meaning of the plots.
However, that penchant for patterns appears to have evidenced itself even earlier—in
responses to the survey instrument.
Table 28
Organizations With Robust Ties
Org Patterns 4 confirmed ties 3 confirmed ties SalArmy Completer 5 CCS Completer 4 1 RoaCiCentInt Completer 3 Goodwill Completer 2 2 WorkDevBrd Completer 1 FamServ Builder 3 1 PresComCent Builder 1 BRBehavHlth Builder 1 PrevCounc Builder 1 RoaYthSACoal Mixer 2 1 TAP Mixer (aggregate) 5 3 BlueRidgeLegal Completer 1 BlueRidgeLit Completer 2 ARCH Builder 2 GreenvaleSch Builder 1 SmartBeg Skipper 2 CraigChildCare Mixer 1 UMethComOut Skipper 1 LEAP Mixer 1 TAP_HeadStart Floater 1

151
The Egocentric View and Sense Making
The plots provided to participants showed a large landscape of collaborations
across different dimensions, but for network participants observing the plots, the portrait
of the ego was left lacking, perhaps causing a failure in sensemaking as they searched for
cues for a plausible explanation that fit their CSS. Network studies often focus on either
the whole network or the egocentric network in their analysis. The whole network plots
provided in this study did not show everything that respondents reported about their
relationships, nor all that was reported by others about their ties with them. There are
important differences between egocentric network analysis and whole network analysis;
however, when participant sense-making is important, a method bridging the two
approaches may be warranted (Kilduff & Tsai, 2003). An egocentric view could be useful
to both participants and researchers, especially for sense-making. This sort of plot, which
I call a multiplex, first-order, ego-centric plot, illuminates unseen patterns and makes
some of the “missing” ties reported by interview informants more visible. Researchers
may have legitimate ethical concerns about giving participants such a clear view of what
others say about them; however, interested participants could deduce most of that
information from standard plots, especially if researchers used a two-step tie verification
process or they retained records of the responses provided on behalf of their own
organization. The remainder of this section presents some of these plots that illuminate
some of the different sense-making positions respondents may have experienced when
viewing the plots provided to them. This type of plot is potentially a useful tool for
examining the unconfirmed ties discussed above. For example, it could provide a quick

152
indication that perhaps the survey respondent(s) had inadequate knowledge of
relationships to act as a reliable confirmer.
While there were nearly 70 survey respondents, there were only informants from
11 organizations represented in my interviews, so there is not enough information from
this study to correlate egocentric views with sense-making approaches, but there may be
enough hints to build some testable theories about potential correlations if data could be
collected from a larger sample of network participants in a fresh study.
Below I use a single plot to represent the 1st order egocentric network across all
relationship types for several programs and discuss what they could potentially reveal.
Blue ties were reported by the ego, but were unconfirmed. Red ties indicate confirmed
ties. Green ties were relationships reported by others that were not confirmed by the ego.
The thickness of the tie represents reported relationship intensity; for confirmed ties,
where each party in the dyad reported different intensities, the thickness represents the
minimum intensity reported by either respondent. In my own attempt at sensemaking, I
quantified the level of potential ‘unreality’ that a respondent might encounter based on
the pattern of confirmed and unconfirmed ties. I calculated the number of alters, the
number of ties and the total tie intensities for all three situations—unconfirmed ties
reported by the ego, confirmed ties, and unconfirmed ties reported by alters. In
Figures 27–33, the first number was reported by the ego, but not confirmed, the second
was confirmed and the final was reported by others, but not confirmed by the ego. For the
alter unreality numbers, the number following the + sign is additional alters that might
have been confirmed except for tie confusion (meaning that it would show up on a “Any

153
Confirmed Tie at Program Level Plot,” but would not have appeared on any of the
relationship specific plots.
The completing realist. Figure 27 depicts a program with a relatively high
number of confirmed alters, 9 of the 12 reported (75%).
Figure 27. The completing realist.
The ego depicted in this plot reported only three alters that did not confirm ties and only
6 other alters (programs) reported relationships that the ego did not confirm. Of the
unconfirmed relationships reported by others, most were reported as low intensity, which
may mean that the ego did not consider them relevant enough to report. Three of the six
unconfirmed alters were TAP programs. Ego did report a relationship with TAP’s
Veterans Services, which that program reported as both intense and robust (comprising

154
all four relationship types). This may mean that they saw many other TAP programs as
being related or bound up in that one relationship. Interestingly, TAP Veterans Services
only confirmed the resource sharing relationship with ego, which might indicate that they
saw the relationship purely in financial terms—that is, until you consider the response
patterns of both. The ego’s response pattern is Completer, while the respondent for
TAP’s Veterans Services was a Floater (meaning they almost always picked only one
relationship type as comprising the connection). So, the results of this analysis of ties
may have more to do with response patterns than the nature of the relationship(s) shown
on the provided graphs. When examining ties and intensity only 20 of 48 reported ties
were confirmed (41.6%) with a cumulative confirmed intensity of 54 of 113 reporting
(47.8%). While lower than the percentage of confirmed alters, these are still relatively
high confirmation rates when compared with others in the network. This could possibly
mean that, for this respondent, the plots might have had less hidden information, making
it easier for them to make sense of the plots. Finally, the relatively low number of
unconfirmed alters could be an indication that the survey respondent was well positioned
to have knowledge of the program’s relationships.
The mixing realist. Figure 28 shows an organization in a similar position. One
potentially significant difference is that ego’s response pattern is that of a Mixer rather
than a Completer, meaning that they perhaps provided more considered responses about
the nature and extent of their reported relationships.
Again, we see a high confirmation rate among alters—11 of 14 or 78.6%. This
included one alter (Greenvale School) that illustrated tie confusion, since the ego defined
the connection as integrated services, while the the alter described it as information

155
sharing and coordinated referrals. The tie confirmation rate (41.7%) and intensity
confirmation rate (37.2%) in this instance were slightly lower than the previous example,
but still relatively high. However, this presentation suggests visually that the confirmed
relationship types tended to skew toward information sharing and shared resources. This
may mean that while the ego saw many of their relationships as containing a combination
of three or four relationship types, partners tended to see those ties as primarily
information sharing and occasionally as shared resources, but in only one case each as
coordinated referrals or integrated services. Again, this diagram depicts very few
unconfirmed alters, meaning that the respondent likely had extensive knowledge of the
program’s relationships.
Figure 28. The mixing realist.

156
The low reality poser. Figure 29 shows a program that reported many more ties
than were confirmed. Only 20% of the alters reported by ego were confirmed by alters,
about the same confirmation rate as the number of reported ties.
Figure 29. The low-reality poser.
Two additional alters might have been confirmed except for tie confusion. In
particular, the image indicates many information sharing and coordinated referral
relationships reported by ego that were not confirmed by alters. Analysts may interpret
these many reported but unconfirmed relationships as an attempt by the ego to overstate
the extent of their ties in the network, but it could also be an artifact of the Builder
response pattern manifested by the respondent. Irrespective of which of these may have

157
occurred, the result could have led the respondent to a sense of unreality that could have
inhibited their sensemaking.
Interestingly, this adult program respondent did not confirm a relationship with
either the youth or domestic violence programs within the same organization—two of
only six programs indicating a relationship with ego that were not confirmed. Given that
ego had confirmed a robust relationship (all four relationship types) with TAP’s domestic
violence program, it is possible that the respondent thought it unnecessary to report ties
with programs within its own organization.
Above it all. Figure 30 depicts a program that reported only 4 alters and 5 ties, yet
had 12 alters with 24 ties reported by others that did not confirm them.
Figure 30. Above it all.

158
The result was a program with many relationships reported by others in the network that
shows only a single connection to those entities. One might suppose that perhaps the
survey respondents were not in a good position to know the program’s relationship.
However, this small initiative had two respondents (a new director and a former director)
whose responses were aggregated for the programs. They should have had a good
understanding of the initiative’s ties. While there were a few differences, each respondent
identified a relatively small number of low intensity connections, primarily information
sharing, with a small number of other programs. Perhaps the respondents had a very
different conception of relationships from their partners. The ego in this case was a
coalition run by the convening partner, the United Way. Therefore, it is also possible that
many other organizations sought to promote weak or non-existent relationships with that
initiative as more significant than they were in order to curry favor with the United Way
and demonstrate their willingness to collaborate in the future. It is possible that the
diminished connectivity of this program as seen on the standard network plot could
contribute to a broader sense of unreality among a larger group of network participants
that could have undermined some measure of sense-making among them. At the same
time, because it shows only confirmed ties, the plots might offer an accurate
representation of the actual relationships.
The wall flower. Figure 31 shows a program that wound up as an isolate because
all of its ties were unconfirmed. The ego reported three ties with three programs, but none
of those was confirmed. Three programs reported relationships with the ego, but that
respondent did not confirm them. So, even though the program was represented as an
isolate in all network plots, the reality was slightly more complex. Nevertheless, the

159
conclusion that this program was relatively unimportant to the network appears to be a
justified one.
Figure 31. The wall flower.
The ghost. Figure 32 is similar to Figure 31 in that the program, indeed the whole
organization, was represented as an isolate, despite having a number of ties reported in
the survey. In this case, the issue may have resulted because the respondent for the ego
completed the survey from the perspective of a single program, Meals-on-Wheels, while
other initiatives responded to the survey thinking more broadly about the range of
services offered by the ego.

160
Figure 32. The ghost.
Out to lunch. Figure 33 is an example of an organization that wound up with
only two confirmed ties, both information sharing.
The ego reported only 4 unidimensional relationships with 4 programs. However, many
other programs reported numerous and varied relationships with the ego. It appears that
either many programs over reported their relationships to ego or the respondent for ego
had insufficient knowledge of those ties or did not take the survey seriously. As a result, a
potentially important organization was significantly underrepresented in the network
plots. In a situation such as this, there may be justification for researchers to adjust the
network analysis and ‘symmetrize’ representations to show unconfirmed relationships
(Scott, 2000) as is sometimes done for important non-respondents such as RADAR,
which was a non-respondent that was represented on some plots. Or alternatively, early

161
identification of the situation (difficult prior to analysis) could have led to a decision to
identify additional respondents or to use a two-step tie verification process as discussed
above. Regardless, it is completely understandable that the diminished representation of
this organization on network plots could inhibit sense-making and led observers to search
for other ways to account of what they saw or did not see on the plots.
Figure 33. Out to lunch.
Wrapping up. There are many other multiplex first-order ego-centric plots that
are equally informative and potentially useful for understanding participant’s sense-
making. Although problematic because of the clarity of information they reveal about
what respondents say about each other’s relationships, their usefulness as a visually
informative data validation tool for researchers and analysts warrants further exploration.

162
Because the representation of one’s own program/organization may be particularly
important in sense-making, these plots may also be useful in identifying
individuals/organizations that might struggle to make sense of network plots, which could
be useful to understand when network leaders attempt to use information in the plots for
decision-making.
In Chapter 6, I synthesize my emerging subject area and methodological insights
and potential propositions from chapters 4 and 5 and suggests potential directions for
future inquiry.

163
Chapter 6: Synthesis and Conclusions
In this research, I set out to explore how network participants made sense of
network plots. I did so to gain insights into how that sense-making might influence
collaboration and network performance. In an effort to privilege the perspectives of
network participants, I used an open-ended, non-directive interviewing approach—
Dervin’s SMM situated micro-element interview method. Partially as result of that
choice, I had difficulty using the information I obtained from interviews to address my
primary research questions directly. However, the wide-ranging character of the
conversations I conducted did offer a wealth of insights that challenged some of my
fundamental assumptions and prompted me to consider several new directions discussed
below.
Limitations
There are several limitations of this study that bound its relevance and constitute
validity threats to broad generalization.
Single case study. This research is based on a single case. The characteristics of
that case likely limit its applicability. It was a new initiative attempting to redirect the
work of several diverse networks and a broad group of other actors. The nature of
network change aborning had many exogenous and engineered aspects that were in a
state of flux as I embarked on the study. There was not yet broad consensus among
network participants on the appropriateness of the change efforts afoot. My findings may
be most appropriately applied to cases with similar circumstances.
Atypical approach to analysis design. To avoid influencing the sense-making of
my informants, my advisor and I implemented the SNA portion of the analysis with

164
limited interaction with network participants. We did not wish to ‘colonize’ their sense-
making with our own theories, frameworks and assumptions prior to data collection. This
approach was a break from our preferred practice of deep participant engagement
throughout study design, implementation, analysis and dissemination. Therefore, my
findings may not be typical and may not apply as directly to networks where
researchers/analysts, network managers and participants work more closely throughout
the process.
Non-representative informants. I selected my informants to provide a
polyphony of voices from diverse perspectives in different structural positions within the
network. The 19 informants I interviewed were not necessarily representative of the over
72 programs in the core network. A larger, more representative sample would be required
to reliably address research questions connecting sense-making strategies to uses of
information and later collaborative choices.
Non-response bias. I was not able to obtain interviews from several candidates
that I initially selected for an interview and attempted to recruit. They declined interviews
for a variety of stated reasons, usually citing scheduling difficulty or saying they were too
busy. It is possible that other factors, such as the nature of proposed changes in the
United Way funding approach could have led to a reluctance to speak while being
recorded even with assurances of confidentiality. It is possible that those individuals
declining interviews might have held perspectives that differed from those held by those
that consented to be interviewed, leading to a bias in my findings toward issues that were
more comfortable to discuss. However, given the candor of many of my interview

165
informants on a range of uncomfortable and controversial issues, the effect could have
been quite small.
Unstructured interviewing approach. The unstructured approach to SMM
interviewing that I undertook in this research was effective in raising important new
questions. However, a more structured approach for an SMM interview that asked
informants the same set of questions about the same objects would better address
research questions.
Summary of Insights
Table 29 presents a summary snapshot of the insights discussed in previous
chapters along with potential propositions emerging from those findings. This chapter
synthesizes many of those observations into a framework for researching and
understanding how network participants make sense of network plots. Those threads I do
not employ for that purpose require further development.

166
Table 29
Emerging Insights and Potential Implications
Domain Emerging Insights/Findings Potential Implications Issues relating to the case
1. Some participants exhibited significant ambiguity and anxiety about pending changes to the United Way’s funding allocation processes that seemed to influence their sense-making strategies regarding network plots.
2. This was a large network and informants had difficulty making sense of plots with many alters and ties.
1. The type of network change at play in a given network at the time of analysis (see Chapter 2) is likely to influence the sense-making strategy of network participants when considering network plots.
2. There may be an upper threshold to network size or density allowing for visual sense-making of network plots. The larger and denser the plot gets, the more difficult it may be for network participants to extract useful information visually.
Sense-making from network plots
1. Informants made sense of network plots not just to enable change, but also to enable resistance to perceived change and to reinforce the status quo.
2. The dominant sense-making strategy that emerged in the interviews was one of confusion, resulting from a sense that participants referred to as something missing.
1. There may be important relationships between the information individuals extract from a source, their sensemaking strategy, and the use they make of that information that could be uncovered by a differently designed study.
2. Sense-making may have little to do with how individuals use information to make decisions or form beliefs. Instead it may be a way of reconstituting a plausible representation of the self in the light of sometimes contradictory actions and/or beliefs or it may be evidence of dissonant perceptions of oneself by others.
Use of information from plots
1. Relatively few interviewees evidenced a strong inclination toward a particular use of information extracted from a network plot;
1. My approach to Dervin’s interview method was not effective in extracting connections among information extracted from plots, sense-making strategies, and potential uses of that data. A more

167
Domain Emerging Insights/Findings Potential Implications more statements suggested either weak or exploratory use of extracted information.
2. On a few occasions there appeared to be little logical connection between the information that informants reported extracting from plots and the potential uses they posited they would make of that information.
3. I did not ask the question about potential uses consistently.
focused interviewing approach might have yielded a pattern of connections.
2. Some characteristics of this study’s focus may have made the resulting plots less useful to network participants than they might have been otherwise, including
a. The size of the network b. The diversity of the network c. The nominalist approach to setting
boundaries d. The anticipated mode of network change e. Lack of participatory processes defining
relationship types and attributes f. Trust in the process
Collaboration 1. There were some statements indicating that informants might use the information from the plots for collaborative actions.
2. Informants offered many statements related to collaborative challenges.
1. Participant’s past dispositions toward collaboration are likely to be reflected in their sense-making related to potential uses of information from network plots.
a. Participants with a predisposition toward collaboration will be more likely to engage in sense-making strategies that enable collaborative action.
b. Participants with a predisposition against collaboration will be more likely to engage in sense-making that enables resistance to collaborative action or reinforces the status quo.
2. The model of network change at play may shape patterns of sense-making when participants consider information presented in network plots.

168
Domain Emerging Insights/Findings Potential Implications a. Participants in networks with more
emergent aspects and structures, as opposed to those that are more engineered/mandated, will be more likely to use information from network plots through various sense-making strategies to engage in collaborative activities toward network goals.
b. Participants in networks undertaking endogenous approaches to network change, as opposed to those engaged in exogenously driven network change, will be more likely to use information from network plots through various sense-making strategies to engage in collaborative activities toward whole network goals.
How participants make sense of plots
1. Informants discussed information and understandings that emanated from sources other than the plots in their attempts to make sense of them.
2. Informants rarely expressed an individual perspective on the plots (what it meant to them personally or professionally).
3. Informants often displayed a perspective I had not initially looked for—that of the client, family or community, which I label as the beneficiary perspective.
4. Informants switched orientations between past, present and future depending on the questions I
1. The information from a network plot is just one source of information for network participants that they must integrate with a range of other information sources and perspectives.
2. In some cases, informants may display perspectives that they put forth as that of the client, family or community, that surreptitiously privilege their own organization, thus masking their organizational perspective as a beneficent regard for those they serve.
3. Rather than sense-making being affected by an individual’s general orientation to past, present or future, a greater influence may be 1) a recent

169
Domain Emerging Insights/Findings Potential Implications asked rather than exhibiting a sense-making strategy around one dominant temporal orientation.
change or discontinuity between past and present or 2) a pending change or discontinuity between present and future.
Implications for network managers
1. The sense that network participants make of network plots will not necessarily align with that of network managers.
2. In addition to supporting possible collaborative action, sense-making could also reinforce the status quo or support resistance to change.
3. Some informants articulated known limitations of SNAs, which are true for this study and for SNA more generally, such as framing of the study by the United Way, difficulty in accessing appropriate respondents, that the study reflected a snapshot in time, or that there might be some confusion or discrepancy in how participants categorized relationship types and intensities.
1. If a goal of SNA is for network participants to make use of plots to enable collaborative actions to achieve network goals, then participatory processes, starting with setting network boundaries and defining relationships, will be important to encourage sense-making that supports progress toward network goals.
2. If a network plot creates a conflict with network participants’ CSS, then they are less likely to use the network plot to guide their collaborative activities in the network.
If unable to make sense of plots, what did they make of them?
1. Some informants saw the SNA as a way for the United Way to justify defunding smaller nonprofits that were not perceived as working to address that entity’s new priorities.
1. If a participant was unable to extract any useful information from the network plots for themselves, they may dismiss the utility of the entire analysis for the whole network.
2. If a participant perceives that the information presented in network plots is biased, they will marshal other information sources to resist the implications of the study.
Implications for researchers
1. As a researcher/analyst, my sense-making approaches were different from those displayed by most participants.
1. Network participants, network managers and researchers/analysts will make sense of network plots in different ways.

170
Domain Emerging Insights/Findings Potential Implications 2. Informants were confused and frustrated when
their important relationships were not shown on network plots.
a. Sometimes the relationships were not shown because they were unconfirmed by the other party in the relationship.
b. Sometimes the relationships were not shown because they were not reported by the survey respondent for informant’s program/organization.
c. Sometimes the relationships were not shown because the other program/organization was outside of the network boundary.
d. Sometimes the relationships were not shown because relationships of a particular type were unconfirmed because of relationship type confusion.
2. Because researchers/analysts will often lack the context and experience that participants, who are embedded in the network, will use in their sense-making around network plots, they are likely to make sense of network plots in very different ways than participants.
3. When network managers and participants make sense of plots in substantially different ways, it may inhibit network change and performance.
4. If a network participant’s important relationships are not represented on a plot, they may switch their sense-making strategy from one that enables collaboration to one that resists change or reinforces the status quo.
Factors influencing sense-making
Situation Movement State 1. It was difficult for me to discern an overall
situation movement state for informants based on their responses to my interview questions.
2. I identified two additional movement related situation movement states – Cruising and Groping along.
3. There were not always clear logical connections between situation movement states and the three primary uses of information emerging from this study.
Conflicts with CSS
Situation Movement State 1. The connection between situation movement state
and uses of information from SNA may not warrant further exploration; however, a survey approach to gathering data from a larger group of participants might yield more useful insights.
Conflicts with CSS 2. If network participants perceive that network plots
do not accurately represented their own first order relationships, they will be less likely to use information from the plots to engage in sense-making encouraging change through collaboration

171
Domain Emerging Insights/Findings Potential Implications 4. Informants identified several potentially
important organizations or programs that were left off the survey roster because of the influence of the organization providing access to the field.
5. [See #2 in cell above] Individual vs. group sense-making 6. The sense-making seemed to come easier and
faster in group interviews vs. individual interviews.
Type of network change at play 7. Some informants expressed uncertainty,
anxiety or concern about the United Way’s pending shift in funding strategy.
and more likely to engage in sense-unmaking to resist change.
Individual vs. group sense-making 3. In individual interviews, informants tended to
engage in their sense-making out loud rather than have long silent pauses following questions. In group interviews, some respondents could continue reflecting silently on my questions while others spoke, allowing them to refine their sense-making while also building on the sense-making of others.
4. A collective model of sensemaking (Weick, 1995) may be better suited to exploring these questions further.
Type of network change at play 5. The type of network change at play in a given
network may influence how network participants make sense of plots.
a. Endogenous approaches to network change may be better suited to constructive sense-making enabling collaboration.
b. Exogenous approaches to network change may find participants more likely to engage in sense-making strategies that enable resistance to change or reinforcement of the status quo.
SMM interview methodology
1. Second order triangulation took informants’ discussion away from the immediate objects of interest, the network plots, and away from the stated research questions.
1. A more focused set of standard questions asked about the information extracted from each object might have better elucidated participant’s sense-making.

172
Domain Emerging Insights/Findings Potential Implications 2. SMM’s open, non-directive approach to
interviewing did lead to many interesting and unlooked-for insights which were not directly related to the stated research questions.
3. Informants engaged in richer sense-making during group interviews.
a. In particular, questions about what information individuals extract from an object, what it means to them and how they might use that information should be closely linked.
2. Broader SMM questioning still has potential value, however, researchers may want to complete exploration of all first order objects before turning attention to second order triangulation on emerging elements.
Boundary setting 1. Some potentially important programs identified through the name generator questions were not included on the survey roster.
2. Some informants expressed surprise at which programs were included or excluded from the study.
1. When researchers, analysts or sponsors establish network boundaries using a nominalist approach, without the engagement of network participants, network participants might have difficulty “making sense” of the resulting network plots.
2. If it is important for network participants to be able to make sense of network plots, then a realist or relational approach to boundary setting may be more appropriate.
3. When researchers include only a portion of an organization’s programs on a roster used to collect and confirm relationships, aggregating those programs to the organizational scale (combining all listed programs house within an organization into a single node), some observers may have trouble making sense of the organizations position in the network.
Relationship types 1. Some relationships were not shown on particular plots because they were unconfirmed due to relationship type confusion.
1. If it is important for network participants to be able to make sense of network plots, then it may also be important for them to have developed a

173
Domain Emerging Insights/Findings Potential Implications 2. When looking at a plot of one particular
relationship type, informants sometimes misinterpreted the lack of a line between two nodes as meaning there was no relationship of any type (forgetting that other plots may show a relationship).
shared understanding of the relationship dimensions and attributes prior to researchers collecting relationship data.
2. Individuals may have difficulty visually processing network relationships one dimension (relationship type) at a time.
Tradeoffs between confirmed and unconfirmed ties
1. Informants expressed difficulty making sense of the network plots that displayed many nodes and many unconfirmed ties, such as the broader information sharing or broader resource sharing networks.
2. Some of the instances where informants struggled to make sense of plots because they perceived some important relationships to be missing were possibly the result of unconfirmed ties not being shown on most plots.
1. When collecting relationship data from a single point-in-time survey using reciprocal nomination, it may be a misnomer to label relationships reported by only one party as unconfirmed, because the other party was not asked to either confirm or refute the reported relationship.
2. If it is important for network participants to be able to make sense of network plots, it may be important for researchers to use a multi-step relational approach to establish an initial roster, identify potential relationships for each respondent and then gather data to confirm those relationships.
Survey response patterns
1. Different survey respondents used different patterns of responses that may have reflected differing assumptions about the interrelation of the relationship types.
1. Respondents using a floater response pattern may underreport base information relationships, potentially warranting correction.
2. Respondents using a floater response pattern may be more likely to be involved in relationship type confusion, potentially warranting correction.
3. Respondents using a completer pattern may be overrepresented as participating in robust relationships, potentially warranting correction.
Multiplex, first-order, ego-centric plots
1. I personally found the multiplex, first-order, ego-centric plots to be visually informative and
1. The multiplex, first-order, ego-centric plots likely contain too much information, presented too

174
Domain Emerging Insights/Findings Potential Implications useful in understanding the sense-making challenges of some informants.
clearly, for researchers to provide them to participants when survey respondents are promised confidentiality.
2. If survey respondents are not promised confidentiality, and provide informed consent for their relationship data to be shared with others in the network, there may be certain conditions where it is both appropriate and beneficial to share multiplex, first-order, ego-centric plots; however, lack of confidentiality of responses may introduce other threats to validity.
3. The multiplex, first-order, ego-centric plots may be useful for researchers to visually identify situations when the survey respondent may not have adequate knowledge of relationships to provide a complete response on behalf of the organizational/program.

175
Question 5a: What Existing Theories From the Literature Might Further Elaborate
the Process?
The primary theory from the literature that might further elaborate network
participant’s sense-making around information from network plots is Weick’s (1995)
version of sensemaking, which he developed for organizational contexts. I intentionally
avoided applying Weick’s framework to the network context until I had first explored
Dervin’s model of sense-making, which has a focus on individual sense-making that
enables movement resulting from one’s use of information from novel sources (Dervin et
al., 2003). I credit the “verbings” element of Dervin’s SMM model, as it is implemented
through the open and non-directive interviewing approach, with allowing me to hear my
informant’s perspectives, respecting and honoring their own meanings and labels, which
challenged my own preconceptions and which led to some of the more important insights
that I gained. However, the overall model elements of context, situation, gaps, bridges,
relevances, sources and outcomes (See Figure 11), were less useful in the case I studied,
perhaps because of the difficulty I had in identifying connections between those elements
from my interview data. I did not have a SMM mentor to guide me through what was my
first attempt using the methodology, so the fault may be my own. However, at the end of
the day, Mr. Squiggly was a little too squiggly and the labels that Dervin uses within her
own model did not emerge as relevant to the same extent as the elements of Weick’s
(1995) framework, which is discussed below.
Weick’s version of sensemaking incorporates several important elements. It
1. is rooted in identity,
2. employs a retrospective perspective,

176
3. seeks to reveal the enacted evolution of understanding,
4. is the product of social construction,
5. is iterative and ongoing in character,
6. posits that practitioners extract cues from other actors and forces beyond their
own specific frames,
7. understands that those practicing it rely on plausibility more than accuracy
(Weick, 1995).
First, let me address the question of a retrospective perspective. Figure 34 depicts
my initial framework for sense-making, which I modeled on phronesis or “thought
capable of action” overtop an updated version informed by this study’s insights. The
initial model describes sense-making as an internal cognitive process that allows an
individual to translate information into actions allowing movement across time-space.
For this study, the information source was network plots from SNA and the action of
interest was collaboration. This updated figure provides a study-derived framework that
more closely reflects the insights I gleaned from those I interviewed (shown below my
initial framework and concept mapping)—a process incorporating much more than just
information extracted from network plots, resulting in more potential uses of information.
In this depiction, sensemaking emerges as a retrospective approach to justify an actor's
choices to various audiences.

177
Figure 34. A revised model for sensemaking in networks.
None of this is to suggest that I did not observe the type of sensemaking that I set
out to explore. I did; however, it was embedded within a larger layered framework of
sense-making in which participants seemed to have to cross certain cognitive thresholds
to be able to advance to higher-order sense-making. The following section applies many
of the concepts that I employed or that emerged from this study and incorporates them
along with Weick’s (1995) elements of sensemaking to create a new, more robust,
framework for sense-making in networks.
Question 5b: What New Theories Could Be Developed or Tested? (Future Research)
Figure 35 provides a visual representation of a refined framework for sense-
making in networks. This analytical approach suggests that individuals must cross

178
identifiable sense-making thresholds to progress to higher level sense-making and
collaborative action. As they move from left to right across each threshold in Figure 35,
new uses of information supported by additional sense-making strategies become
available to them. If they fail to cross a threshold, they are likely to remain limited to the
uses and strategies that occur below it and further to the left.
How to interpret and use Figure 35. In the first instance, if individuals are
unable to navigate the information extraction threshold, they would be unlikely to
participate in any meaningful sense-making that results in use of information. They may
simply be unable to extract any information, or they may explain that whatever they
obtained was meaningless or unintelligible to them.
If they can extract information they perceive as meaningful, they proceed to the
next threshold—information acceptance. If individuals do not accept the information
perceived, they may engage in a form of sense-unmaking, a kind of sense-making that
prompts resistance to change, or they may make no-sense of the information, thus taking
no action at all on it. They may explain this as confusion arising from information that is
incomplete, invalid or biased. Additionally, they may explain it as conflicting with
current understandings about themselves, their organization or others. The information
may disadvantage them, challenge some aspect of their identity, or may simply conflict
with other data they deem to be more reliable. However, these distinctions might be
difficult for an outside observer to discern from how the individual is likely to present
their sense-making.

179
Figure 35. Refined framework for sense-making in networks.
If they successfully navigate this threshold and accept the information, they then
proceed to the movement state threshold. Navigating this stage requires that individuals
be open to change. If they are not so disposed, they may use the information to reinforce
the status quo, they may acknowledge they have acquired new information or they may
frame the information as confirming existing beliefs about themselves, their
organizations or others. They may still utilize the information uses and strategies further
to the left to engage in resistance to change or dismissal of relevance by referencing
confusions and contradictions. When such occurs, those dispositions de facto undergird
and support the status quo.

180
If individuals do find themselves in a situation movement state open to change,
they still must successfully navigate the collaborative disposition threshold to engage in
sense-making that supports change (through collaboration in this context). If individuals
are not able to navigate this final threshold because they are not disposed to collaborate
or they perceive the challenges of collaboration to outweigh the benefits, they will be
limited to sense-making that reinforces the status quo and the uses and strategies to the
left. Only if individuals can navigate this last threshold are they able to engage in sense-
making that enables change through collaboration, but could still possibly engage in any
of the information uses and sense-making strategies to the left along the spectrum of
forms of dispositions. Only when they can navigate all these thresholds are individuals
able to engage in the type of sense-making that was the initial object of my study. Not all
informants in this study were able to navigate all these thresholds with information
extracted from a plot and, as a result, some attained only other forms of sense-making
that I had not initially considered within my conceptual framework.
Next, I bring some of the various concepts explored in this study (See Figure 36)
into this framework along with understandings derived from Weick’s (1995) version of
sensemaking. I offer suggestions related to SNA conduct and sense-making study design
to help enrich findings from future studies. Finally, I propose preliminary propositions

181
Figure 36. Concepts for mapping.

182
tied to each sense-making threshold. In each proposition, I identify the broadest group to
which the prediction applies, network participants, information participants or
individuals. By information participants, I mean information users that are also, in part,
the source of the information considered.
The information extraction threshold. In Weick’s (1995) framework,
individuals base sensemaking on “extracted cues.” Weick contended that for individuals
to begin the sensemaking process, they must first be able to extract useful information
from some source. According to Weick, information does not necessarily need to be
accurate, but simply plausible, to be useful to an individual for sensemaking. Numerous
factors can inhibit a user’s ability to extract useful cues from information in a network
plot.
Both the size of a network (number of nodes) and its density (number of ties
relative to the maximum), may limit the ability of users to make sense of network plots.
The network I analyzed was large compared to other networks I have studied in which
sensemaking seemed richer. For example, I cannot myself extract much useful
information from large dense plots such as the Broader Information Sharing Network we
developed for this study (Figure 22). British anthropologist Dunbar (1992) has
hypothesized that primates, including humans, can maintain no more than 150
relationships (known as Dunbar’s number). Likewise, there may be a measurable upper
limit to the size or density of a social network that humans can process visually.
Therefore, the ability of individuals to navigate the sense-making information extraction
threshold successfully may diminish as the size or density of the network plot increases,
dropping to zero at some point.

183
Determining such limits to perception and cognition would likely require research
undertaking a large-N study applying standard statistical techniques to identify both
upper boundaries and the extent to which the ability to extract cues diminishes as size or
density increases. However, my findings suggest that the density of the information
presented in visuals may impact the ability of an individual to navigate the sense-making
information extraction because humans’ cognitive ability to perceive and process some
information visually may fluctuate based on the amount and density of information
contained in a single information source.
Proposition 1. Proposition 1 is that the amount or density of data presented in
network visuals may influence the sense-making information extraction threshold of
individuals.
The network I studied was a composite of many sub-networks, including early
childhood, education, health, housing, employment and other ancillary anti-poverty
initiatives. A network-of-networks such as that I investigated will contain many
programs/organizations within the study boundary that are outside of the normal working
relationships of others to the point of being unfamiliar to many beyond their immediate
sub-network. Although the term “silo” is often used in a pejorative manner, network
clusters are expected structures that sometimes evolve for a purpose; however, improving
network participant’s understanding of existing clusters offers opportunities for bridging
and bonding activities that could be beneficial. However, using SNA as a tool to help
network participants see past their existing silos may be an iterative process that
necessarily proceeds in small steps that should cycle between visualization/recognition
and engagement/connection as new working network boundaries expand. Because

184
individuals sometimes find it easier to understand familiar objects, the ability of
individuals to navigate the sense-making information extraction threshold successfully
using visual representations may diminish as the amount of new information or
unfamiliar objects increases.
Proposition 2. Proposition 2 is that the amount of new information or unfamiliar
objects presented in network visuals may influence the sense-making information
extraction threshold of individuals.
The plot that my informants discussed most frequently in their interviews, Any
Confirmed Tie at the Program Level (Figure 12), was one of only two that attempted to
show all relationship types, rather than depicting only one relationship type. In contrast,
no informants wished to discuss the other of those two plots, one that showed the
robustness of relationships aggregated to the organizational level of analysis (Figures 13
and 14). At times, my interview informants became confused when looking at plots
showing a network comprised of only one relationship type, assuming the absence of a tie
on that plot meant the absence of a relationship overall. Because some psychological
concepts are a gestalt rather than an agglomeration of distinct elements, the ability of
individuals to navigate the sense-making information extraction threshold successfully
may decrease when concepts they consider a gestalt are fragmented across visual
representations.
Proposition 3. Proposition 3 is that the fragmentation of relationships across
network visuals may influence the sense-making information extraction threshold of
individuals.

185
Making sense of network plots takes time and experience. Many of this study’s
informants were sharing ‘first impressions’ in their interviews. In Weick’s (1995)
conception, sensemaking is iterative, ongoing and socially constructed. Although it was
not my intent, the group interviews I conducted allowed those informants to ‘construct’
meaning socially and those interactions helped some group participants to move
iteratively through their own sensemaking. I conducted one of my later interviews with a
group of five informants from the United Way. Because some of them had been involved
in the study design and in preparations for an earlier presentation of findings to network
participants, some of them had had multiple exposures to the network plots and a longer
time the “make sense of them” than most other informants enjoyed. As a result, as a
group, they displayed many more attempts at sense-making using a larger range of
strategies than I saw in some of my other interviews.
Proposition 4. Proposition 4 is that the ability of individuals to navigate the sense-
making information extraction threshold from network visuals successfully will increase
with repeated attempts at sense-making and with group interactions.
The information acceptance threshold. Barriers to navigating the information
acceptance threshold can arise from characteristics of the network participant, the nature
of the network, the modes of network change at play or even from aspects of the way
researchers conduct network analysis. In Weick’s (1995) conception, sensemaking is
rooted in identity and depends on plausibility over accuracy. If information in a network
plot challenges a viewer’s identity (or the identity of their program/organization), they
may engage in a form of sense-making that supports resistance to change. Alternatively,

186
if the representation of the self seems plausible to the observer, even if not completely
accurate, they may remain open to a range of sensemaking possibilities.
Proposition 5. Proposition 5 is that the ability of information participants to
navigate the sense-making information acceptance threshold successfully will increase if
they feel the network visual plausibly conforms to their cognitive representation of
themselves or their programs/organizations within the network.
The type of network change at play during a SNA can vary substantially. In
Chapter 2, I identified a collection of scenarios or “ideal types” of such change across a
spectrum of approaches ranging from endogenous to exogenous. The case I studied was
an example of what I termed Network Restructuring, the most extreme form of
exogenous change. Indeed, some interviewees expressed anxiety about various aspects of
the anticipated changes that could have potentially shaped their sense-making approach.
Because individuals may be resistant to externally driven change for which they are not
yet ready, the willingness of network participants to navigate the sense-making
information acceptance threshold successfully will increase if the mode of network
change is endogenous rather than exogenous.
Proposition 6. Proposition 6 is that the willingness of information participants to
navigate the sense-making information acceptance threshold from network visuals
successfully will increase if the driver of change is endogenous (internal) rather than
exogenous (external).
The way in which researchers/analysts conduct a SNA can result in subtle
differences to network plots that may be significant for sense-making. For example, how
researchers/analysts or network managers set network boundaries and how they select

187
programs/organizations for inclusion or exclusion on survey rosters can trigger
participant confusion and impede capacity to navigate across information thresholds. In
this study, I used a nominalist approach to boundary setting based on the program
planning needs of the sponsor who provided access to the field rather than a realist or
relational approach that engaged network participants in generating the
programs/organizations included. In some cases, because of the nominalist approach
used, the plots I provided did not include programs or organizations important to
informants, which possibly lowered their acceptance of the information provided.
Because individuals may be more likely to accept information that incorporates their
understandings and which they have had a role in developing, the willingness of network
participants to navigate the sense-making information acceptance threshold successfully
may increase if researchers/analysts or network managers use a realist or relational
approach to setting study boundaries and establishing rosters of programs/organizations
on which to collect relationship data.
Proposition 7. Proposition 7 is that the willingness of information participants to
navigate the sense-making information acceptance threshold from network visuals
successfully will increase if the creators of the network visuals engage them in
information production through authentic participatory processes.
The research team selected the relationship types for this study because we
deemed them important for the type of change sought by the United Way and because
some of them aligned with other network studies, allowing cross case analysis and
learning. United Way representatives helped craft the relationship type definitions to
identify the sorts of ties they were interested in encouraging. Meanwhile, members of the

188
research team focused on providing conceptual clarity to the definitions. Network
participants were not involved in selecting or defining the study relationships and
although we provided them with detailed definitions and examples, the relationship types
we had identified did not necessarily coincide with the way they thought of their ties with
others in the network. As a result, there was sometimes confusion concerning how to
characterize a relationship and that confusion sometimes resulted in ties remaining
unconfirmed on analysis. Because groups of individuals may be more likely to have
shared understandings of concepts if they have been involved collectively in developing
those concepts, the ability of network participants to navigate the sense-making
information acceptance threshold successfully may increase if they are involved in
selecting and defining the study relationships (tie types) through a participatory process.
Proposition 8. Proposition 8 is that the ability of information participants to
navigate the sense-making information acceptance threshold of network visuals
successfully will increase if they are involved in selecting and defining core concepts
through a participatory process.
An alternative to defining core concepts through a participatory process is to
select concepts that are consistent with implementation in practice. Although the United
Way was interested in encouraging the types of relationships I studied as a part of their
new strategic funding approach, the selected relationship types were aspirational and had
not yet been broadly implemented in practice, meaning network participants possibly
interpreted them in different ways. Because groups of individuals may be more likely to
have shared understandings of concepts if they have been engaging in activities defined
by those concepts over a period of time, the ability of network participants to navigate the

189
sense-making information acceptance threshold successfully may increase if relationship
(tie) types have been operationalized in network activities.
Proposition 9. Proposition 9 is that the ability of information participants to
navigate the sense-making information acceptance threshold of network visuals
successfully will increase if concepts have been operationalized in their shared practices.
The movement state threshold. One of the intriguing insights emerging from
Dervin et al.’s (2003) SMM is that time-space bound measures (specifically, situation
movement states) account for more variance in the use of information sources than do
across-time-space and a priori-time-space measures (i.e. demographics or assigned roles).
In the study I conducted, I could not clearly discern the situation movement states of my
informants based on analysis of the interview transcripts. Informant’s situation movement
states may have been clearer if I had provided informants with a list of those states and
asked them to identify that which they perceived as the best fit. Alternatively, I could
have developed a standard set of questions that might have more clearly indicated a
specific situation movement state for each interviewee. I remain curious about the
potential importance of the situation movement state for understanding how network
participants might make use of network plots, but additional research would be required
to explore that concern. I was able to identify three primary uses of information that
aligned with my theoretical thresholds—uses supporting change, uses supporting
resistance to change and uses reinforcing the status quo. Logically, there is likely also a
use that challenges the status quo, but it did not emerge from my coding of interview
transcripts as a significant use in this case. Table 20 identified potential alignments
between the situation movement states and participants’ uses of information. Establishing

190
those connections empirically would require a larger N study of network participants that
explicitly gathered situation movement states and potential uses of information to
establish possible associations. I offer the following two propositions, one based on
navigating the movement state threshold and one based on potential uses of information,
both of which align with my inferences in Table 20, and which could be tested in such a
study.
First, the ability of network participants to navigate the sense-making movement
state threshold successfully will be influenced by their situation movement state. Those in
states of Decision, Barrier, Being Led, Waiting or Cruising are looking for and seeking
change, so may be more ready to attempt navigating the movement state threshold. Those
in states of Spin-Out, Wash-Out, Passing Time, Moving or Groping Along are uncertain
about the prospects of their current situation, but may not yet have clear ideas about
improved alternative future states, so may be willing, but less motivated to attempt
navigating the movement state threshold. Those in situation movement states of
Problematic, Out-to-Lunch or Observing are unconcerned with movement, so may be
unwilling or resistant to navigating the movement state threshold.
Proposition 10. Proposition 10 is that the willingness of individuals to navigate
the sense-making movement state threshold successfully will increase substantially if
their situation movement state is Decision, Barrier, Being Led, Waiting or Cruising, will
increase moderately if their situation movement state is Spin-Out, Wash-Out, Passing
Time, Moving or Groping Along, and will decrease if their situation movement state is
Problematic, Out-to-Lunch or Observing.

191
As for potential uses of information, because they are somewhat satisfied with
their current situation, individuals in situation movement states of Waiting, Passing Time,
Out-to-Lunch, Observing or Moving may use information to reinforce the status quo.
Because they have concerns about the direction of future changes, network participants
with situation movement states of Problematic, Spin-Out, Wash-Out or Barrier may use
information to enable resistance to change. Network participants with situation
movement states of Spin-Out, Wash-Out, Being Led, Passing Time, Moving and Groping
are potentially ambivalent about their current situation and open to potential change
without preference for a particular direction; therefore, they may use information to
support passive acceptance of change. Finally, network participants with situation
movement states of Decision, Barrier, Waiting, and Cruising may use information to
support active leadership of change because they are actively looking for something
better than their current situation.
Proposition 11. Proposition 11 is that those individuals in states of Waiting,
Passing Time, Out-to-lunch, Observing or Moving may use information to reinforce the
status quo, those in situation movement states of Problematic, Spin-Out, Wash-Out or
Barrier may use information to enable resistance to change, those in situation movement
states of Spin-Out, Wash-Out, Being Led, Passing Time, Moving and Groping Along
may use information to support passive acceptance of change, and those individuals in
situation movement states of Decision, Barrier, Waiting, and Cruising may use
information to support active acceptance of change.
As stated previously, my interviews did not provide an indication that informants’
temporal orientation (past, present, future) were factors influencing sense-making

192
strategies. Instead, it is possible that discontinuities between past and present or perceived
disruptions between present and future might be more important. The ability of network
participants to navigate the sense-making movement state threshold successfully may
increase if they have experienced a recent disruption between past and present situations.
Such discontinuities might disrupt the status quo in ways that might lead some
individuals towards sense-making that supports movement, but not necessarily so. Some
individuals might insist on holding fast to a vanished or vanishing status quo. In terms of
the sense-making movement state threshold, I offer the following insights that I may
explore in future research.
Because they have recent experience with significant change, the ability of
individuals to navigate the sense-making movement state threshold successfully may
increase if they have experienced a recent disruption between past and present situations.
Because they are anticipating inevitable change, the ability of individuals to navigate the
sense-making movement state threshold successfully may increase if they perceive a
pending disruption between their present and future situations. Even if a recent or
pending disruption to the status quo increases a network participant’s ability to navigate
the sense-making movement state threshold successfully, other factors will influence
whether they select strategies to support change, resist change or reinforce a vanished or
vanishing status quo. Because individual may react to changes in the status quo in a range
of ways, even if a recent or pending disruption to the status quo increases an individual’s
ability to navigate the sense-making movement state threshold successfully, other factors
may influence whether they select strategies to support change, resist change or reinforce
a vanished or vanishing status quo.

193
The collaborative disposition threshold. Just because an individual (or their
program/organization) is ready for change, does not necessarily mean they are open or
prepared for collaboration to accomplish that change. Additional SMM-based research
could investigate the movement state propositions above and provide a stronger
foundation for new propositions relating to the final threshold—the collaborative
disposition threshold. Specifically, I would suggest an interview approach that first
probes to establish the informant’s situation movement state, then asks the following four
questions about network plots.
1. What do you see? What do you learn from it? What do you take away?
2. What about it surprises or confuses, or does it confirm your current
understandings?
3. How would you use that?
4. What does that mean to you? Why is that important?
Only after using these questions to connect the information that an interviewee
has gleaned from examining a plot with their sense-making strategies and the potential
use of information, would I suggest returning to each response that indicated a use
supporting change to explore as a second-level element with a broader roster of SMM
questions. Such a study might better illuminate the ways network plots could influence
collaborative potentials. This approach might identify patterns that align with Agranoff
and McGuire’s (2001) conception of network management processes (See Table 17). Or,
its results might align with other theories of collaboration or network change. However,
to gain and be able to share such insights, informants need to be able first to navigate the

194
collaborative disposition threshold. Below are some insights relating to a network
participant’s ability to navigate that final threshold that I may explore in future research.
Where command and control mechanisms are weak, the ability of individuals to
navigate the sense-making collaborative disposition threshold successfully may increase
if the collaborative motivations are endogenous rather than exogenous. Because
individuals tend to act in their own best interest, the ability of a individuals to navigate
the sense-making collaborative disposition threshold successfully may increase if their
goals align with those of their collaborators.
I anticipate that further interviews as described above could shed additional light
on factors that assist or inhibit network participant’s abilities to navigate the collaborative
disposition barrier. For example, for those network participants that seem to be in a
theoretically suitable situation movement state as posited above, but are unable to cross
the collaborative disposition threshold, what factors may be responsible? They may be
ready for change, but not always collaboration. Also, which collaborative challenges
identified in this research (lack of collaborative slack, competition for resources, or lack
of disposition or skills to do so) present the greatest obstacles and how could they be
measured? I offer the following preliminary insights concerning this issue that I may
explore in future research.
Because collaboration takes time and is sometimes inefficient, the ability of
individuals to navigate the sense-making collaborative disposition threshold successfully
may decrease if they lack collaborative slack. Because collaboration requires compromise
and loss of some control, the ability of individuals to navigate the sense-making
collaborative disposition threshold successfully may decrease if they lack a collaborative

195
disposition. Because collaboration sometimes requires specialized skills, the ability of
individuals to navigate the sense-making collaborative disposition threshold successfully
may decrease if they lack collaborative skills. Lastly, because collaboration sometimes
changes current resource allocations, the ability of individuals to navigate the sense-
making collaborative disposition threshold successfully may decrease if they perceive
competition for resources.
Future Methodological Research Directions
Response patterns. I remain curious about the impact of response patterns on
resulting network plots of robustness or multiplexity. I wonder if the phenomenon
appears in other network studies using a survey instrument similar to the one I used.
Although other researchers may be limited in their ability or interest in sharing such
information, it is something I may try to explore. If response patterns do emerge in other
similar situations, are they a problem that researchers need to address? Although I am not
familiar with the specific techniques, there are a variety of ways researchers have used
theories such as homophily to predict ties based on node attributes, among other factors
(Abdolhosseini-Qomi et al., 2020). I wonder if response patterns were treated as a node
attribute, what power that characteristic would have when predicting ties, specifically
multiplex ties.
In a way, the Completer response pattern is a tautology. Respondents are more
likely to be represented as having robust multiplex ties, because they define all their
relationships as robust and multiplex by the way they complete the survey instrument. It
would be interesting to interview individuals displaying different response patterns to
discern their thinking. If interviews indicate that Completers interpreted a tie intensity of

196
1 in a way similar to the way individuals with other response patterns thought of a
blank/no response, there may be some justification for researchers to adjust responses to
address this issue. Perhaps researchers could produce plots that only represent ties
confirmed with an intensity of 2 or greater to address the issue, as has been done in other
analyses where low intensity ties had the potential to skew results (Lemaire, Provan,
Mercken, & Leischow, 2017). Comparing the two approaches to see which plots make
more sense to network participants might be another interesting research thread to
investigate. I had no informant select the multiplexity/robustness plots for discussion, so I
was not able to gain any insights into that issue.
Lastly, when some survey respondents do not consider the logical or definitional
connections between tie types, there may be justification for researchers to infer such
connections from available data. For example, in this study, information sharing served
as a logical precursor to coordinated referrals, integrated services or resource sharing.
Individuals displaying a Floater response pattern often indicated higher order
relationships without indicating an information sharing relationship. If interviewed about
their thinking, they might indicate that the information sharing relationship was implied
in their response instead of being made explicit. In that case, investigators might be safe
in making the same assumption. In the case of this inquiry, this adjustment would have
made the Information Sharing Network the same as the Any Confirmed Tie at the
Program Level representation. This may or may not have made much of a difference to
participant’s sense-making for this inquiry, but it would be an interesting issue to explore
further.

197
Egocentric plots. I am also interested in further investigating the potential uses
and limitations of the visual representations of multiplex, first-order ego-centric network
plots as they relate to sense-making. If researchers promise respondents confidentiality,
that may limit the ability of researcher to provide these plots to network participants for
use in their own sense-making, but plots may still be useful to researchers as visual tools
to identify patterns or issues that are not obvious in raw numerical data. I would be
interested in working with other network researchers to produce the plots for some of the
networks they are studying and then doing a modified SMM interview with qualitative
analysis to see what information researchers are able to extract visually from such plots
and how they might use it. I suspect that certain characteristics of such plots would allow
researchers to predict which program/organizational representatives might have difficulty
navigating the sense-making information acceptance threshold. I also suspect these
visualizations could indicate to researchers when they might have a survey respondent
who is not fully representing their program/organization, indicating a need to identify and
survey additional respondents. Determining the potential usefulness to researchers would
be a necessary first step to see if any further efforts along this research thread are
warranted.
If multiplex, first-order ego-centric plots are a useful visualization for researchers,
the next hurdle would be making them more generally accessible and easier to create. My
effort to create such plots required extensive manual effort. Some of that process could be
streamlined by creating an algorithm to generate the required matrix for each node from a
standard set of matrices (usually x n × n matrices where x is the number of distinct tie
types and n is the number of nodes in the network). I did this work manually with a

198
combination of MS Access and MS Excel to create the matrices for input into UCINet.
However, perhaps I could identify some collaborators with whom to work to design and
code an automated matrix manipulation process to integrate into network analysis
software to create such translations. I also manually manipulated the standard output
from NetDraw to group alters with similar relationship patterns—a very time-consuming
process. Perhaps I could also identify collaborators to design and code a specific process
to make available within the network rendering software to facilitate that process. My
point in laying out some of these potential tools-related paths arising from this inquiry
that tools sometimes drive innovation as they have throughout the evolution of SNA
(Klovdahl, 1981). If improved tools make this form of analysis more accessible and
easier to use, then researchers and analysts are more likely utilize them when appropriate.
Although I acknowledge that network participants’ use of these visualizations by
network participants may be limited when respondent confidentiality must be maintained,
there may be circumstances when confidentiality may not be a necessary condition of
data collection. For example, a small high-trust endogenously-driven network might wish
to conduct a SNA for its members’ own purposes and these visualizations such as those
described here might help them to make sense of their network. However, even if
research ethics and IRB protocols are not factors in a particular study, anyone using this
approach with informed consent but without offering confidentiality to survey
respondents should understand the social threats to validity that could result with
individuals answering questions less honestly or forthrightly because their answers might
be discernable to others in their networks. Providing confidentiality is a trade-off that
produces different threats to validity when it is in place and when it is not.

199
User roles. Although it was not one of the central purposes of my research to
explore differences in sense-making approaches utilized by network participants,
managers and researchers/analysts, I do believe this case demonstrated that such
differences exist and that they are an important reason to continue to explore this research
approach. Addressing such differences would probably require a multiple case study
design and a quantitative approach to identify correlations between information user roles
(participant, manager, researcher/analyst) and sense-making strategies. However, finding
network managers and researchers willing to put their sense-making to the scrutiny of
this sort of analysis may prove difficult.
Approaches to tie confirmation. In this study we collected relationship data
from participant self-reports using a single point-in-time survey. We used a two-step
process to confirm relationships within that survey instrument. First, we asked
respondents to identify all programs/organizations with which they had service
relationships from a roster. In a subsequent question, we asked respondents to identify the
relationship type and intensity for those programs/organizations they identified in the first
step. We considered relationships to be confirmed if the same relationship type was
reported by both parties in the potential dyad. This approach is known as ‘reciprocal
nomination’ (Stork & Richards, 1992), or perhaps it would be more accurate to label it as
blind reciprocal nomination because no respondent knows who other respondents have
nominated. Many potentially existing relationships were not reported or were reported by
only one party, causing sense-making challenges for some participants. When researchers
use subjective self-reported data as the basis for ties in SNA, rather than using more
objective measures, it becomes important to confirm ties by some method in order to

200
address limitations in human recollection of relationships (Freeman, Romney, &
Freeman, 1987; Marsden, 1990) and to address some forms of survey response bias such
as the response patterns discussed above (Wasserman & Faust, 1994). However, there are
several approaches researchers can use to confirm ties, each of which has trade-offs. For
example, researchers could attempt to confirm ties collected from a survey instrument
through participant observation, secondary sources or in-depth interviews, all of which
may be prohibitively labor intensive.
I am interested in exploring an alternative approach to tie confirmation that might
improve participant sense-making without being unduly labor intensive or potentially
skewing whole network analysis. To understand when this approach might be most
appropriate, I would explore two cases, one where researchers use a nominalist approach
to establishing the study boundaries and survey roster, and one where they use a realist or
relational approach. In both cases, I would use a two-step data collection process using
two point-in-time surveys separated by a short interval, preferably about one week. In the
first survey, I would ask respondents to identify their relevant relationships from a roster,
just as we did in this study. However, instead of collecting relationship type and intensity
in the first survey, I would collect it in the second survey. In that survey, I would create
an individualized roster for each respondent that consists of relationships with other
organizations that they reported and relationships that other organizations reported with
them. In addition to collecting both relationship type and intensity (or some other
measure of tie strength) in this survey, I would give the respondent the opportunity to
indicate explicitly that no relationship exists or to provide the name of another individual
with their organization that might be able to provide the needed information.

201
Although there is a potential threat to validity from respondent morbidity (those
programs/organizations that respond to the first survey, but fail to respond to the second)
the approach I outline has the benefit of preserving the data from the blind reciprocal
nomination approach that I can compare with the alternative method. From this data, I
can produce two sets of network plots and whole network statistics—one that uses only
those relationships confirmed blindly in the first survey and one that uses all relationships
confirmed through the second survey. I could then use a SMM interview approach to
explore network participants’ sense-making around each version. I expect that
participants might find it easier to cross the sense-making information acceptance
threshold with the plots from the alternative approach, because it might better represent
their first order relationships. However, I also expect that the additional network density
that would result from adding additional confirmed ties could reduce the ability of
network participant to observe structural elements such as isolates, fragments, sub-
networks or bridges—perhaps making it more difficult to cross the earlier information
extraction threshold. I am less sure how the two confirmation methods might affect whole
network variables, other than obviously increasing density somewhat with the alternative
approach. However, I would need to also consider those repercussions to determine the
sense-making verses analytic trade-offs or to identify situations where the alternative
approach might be warranted.
Implications and Concluding Thoughts
It was a formidable challenge to study and write about sense-making in the era of
the Donald Trump presidency, COVID-19, the 2020 election and the Capitol
insurrection—a time when strained sense-making was on daily display. It spurred me to

202
consider sense-making in broader terms than I had initially intended. These external
influences played no small part in my eventual concession that sense-making did not act
as an intermediary between information and action, but rather as a retrospective
justification for sometimes illogical beliefs or forgone conclusions. Our failure to grasp
the opaque dynamics of sense-making in social media networks certainly seems more
profound and important than what participants in human service networks make of
network plots. Although my case ended up being somewhat ill-suited to exploring the
sense-making that precedes collaborative action, finding ways to make
interorganizational SNA of practical use to participants in networks seeking to improve
performance remains my main interest.
The refined framework for sense-making in networks (Figure 35) that I developed
in this chapter is intentionally broad and could apply across many other contexts beyond
network management and could address the use of information from many sources for a
range of collaborative or public purposes. Network plots are an interesting and intriguing
focal point for sense-making in networks, but there are certainly others. Most networks
operate without the benefit of SNA or network plots and those likely evidence similar
sense-making dynamics around other, more traditional, focal objects such as strategic
plans, goal setting processes or even SWOT analyses. The sense-making framework I
developed in this chapter could be applied broadly to many such focal objects and events
that inform collaborative enterprises. If network managers and researcher/analysts present
information from any source to network participants, it would be wise for those
individuals to understand better how participants might use the information provided.
This investigation showed that network participants may not always use information from

203
SNA in ways that conduce to collaboration toward network goals and the same would
probably be the case for many other types of information. My research raised fresh
questions and much work remains to understand sense-making in networks and how such
contributes to or detracts from network performance.
In a similar fashion, the survey response patterns that I identified could also be an
important but hidden phenomenon that has underappreciated influences on other kinds of
efforts using participant self-reported data collected through online survey instruments.
When researchers use data that has been stripped from the context in which it was
collected, even is that context is as simple as the layout of a survey questionnaire, they
may miss patterns that illuminate the assumptions of their data sources. The trend toward
transparency and open data reporting for scholarly publications (King, 1995; Lupia &
Elman, 2014) may make it easier to explore this potential issue and its broader
repercussions.
The simplified models of network change that I developed in Chapter 2 are
potentially useful for delimiting findings from many kinds of network studies to help
researchers bound phenomena and communicate to others where their findings might be
most relevant; though I have significant work to make them useful as ideal types of
network change. Regardless, I and other researchers could use them to model additional
factors, beyond the introduction of network plots, that could affect network performance.
Much as I did above, I or others could develop propositions for how changes in the
model’s variables might affect each scenario differently.
I have suggested several approaches to network analysis that may help
participants cross sense-making thresholds to reach a point where the information from

204
plots is more useful to them for collaboration, most of which involve including network
members in participatory processes beginning with study design. Likewise, as Provan et
al. (2005) have asserted, SNA “will only have practical value to communities if it can be
effectively presented, discussed, accepted, and acted on by community leaders and
network participants [emphasis added]” (p. 610). Ongoing cultivation of networks with
SNA at the center of engaged and participatory processes is an exciting and fruitful
research agenda for translating research into practice (Berthod et al., 2017), and I hope to
be a part of future translational scholarly efforts with that aim.

205
References
Abdolhosseini-Qomi, A. M., Jafari, S. H., Taghizadeh, A., Yazdani, N., Asadpour, M., & Rahgozar, M. (2020). Link prediction in real-world multiplex networks via layer reconstruction method. Royal Society Open Science, 7. doi:10.1098/rsos.191928
Agranoff, R., & McGuire, M. (2001). Big questions in public network management research. Journal of Public Administration Research and Theory, 11(3), 295–326. doi: 10.1093/oxfordjournals.jpart.a003504
Ahuja, G., Soda, G., & Zaheer, A. (2012). The genesis and dynamics of organizational networks. Organization Science, 23(2), 434–448. doi:10.1287/orsc.1110.0695
Ansell, C., & Gash, A. (2008). Collaborative governance in theory and practice. Journal of Public Administration Research and Theory, 18(4), 543–571. doi:10.1093/jopart/mum032
Bailey, C. A. (2007). A guide to qualitative field research (2nd ed.). Thousand Oaks, CA: Pine Forge Press.
Barnard, C. (1938). The functions of the executive. Cambridge, MA: Harvard University Press.
Berry, F. S., Brower, R. S., Choi, S. O., Goa, W. X., Jang, H., Kwon, M., & Word, J. (2004). Three traditions of network research: What the public management research agenda can learn from other research communities. Public Administration Review, 64(5), 539–552. doi:10.2307/3542536
Berthod, O., Grothe-Hammer, M., & Sydow, J. (2017). Network ethnography: A mixed-method approach for the study of practices in interorganizational settings. Organizational Research Methods, 20(2), 299–323. doi:10.1177/1094428116633872
Borgatti, S. P., Everett, M. G., & Johnson, J. C. (2018). Analyzing social networks (2nd ed.). Los Angeles, CA: Sage.
Borgatti, S. P., & Molina, J. L. (2003). Ethical and strategic issues in organizational social network analysis. Journal of Applied Behavioral Science, 39(3), 337–349. doi: 10.1177/0021886303258111
Brandes, U., Kenis, P., Raab, J., Schneider, V., & Wagner, D. (1999). Explorations into the visualization of policy networks. Journal of Theoretical Politics, 11(1), 75–106. doi: 10.1177/0951692899011001004
Brands, R. A. (2013). Cognitive social structures in social network research: A review. Journal of Organizational Behavior, 34(Suppl. 1), S82–S103. doi:10.1002/job.1890

206
Brass, D. J., Galaskiewicz, J., Greve, H. R., & Tsai, W. (2004). Taking stock of networks and organizations: A multilevel perspective. Academy of Management Journal, 47, 795–817. doi:10.2307/20159624
Bryson, J. M., Crosby, B. C., & Stone, M. M. (2006). The design and implementation of cross-sector collaborations: Propositions from the literature. Public Administration Review, 66, 44–55. doi:10.1111/j.1540-6210.2006.00665.x
Bryson, J. M., Crosby, B. C., & Stone, M. M. (2015). Designing and implementing cross-sector collaborations: Needed and challenging. Public Administration Review, 75, 647–663. doi:10.1111/puar.12432
Burt, R. S., Kilduff, M., & Tasselli, S. (2013). Social network analysis: Foundations and frontiers on advantage. Annual Review of Psychology, 64(1), 527–547. doi:10.1146/annurev-psych-113011-143828
Calloway, M., Morrissey, J. P., & Paulson, R. I. (1993). Accuracy and reliability of self-reported data in interorganizational networks. Social Networks, 15(4), 377–398. doi:10.1016/0378-8733(93)90013-B
Carboni, J. L., Saz-Carranza, A., Raab, J., & Isett, K. R. (2019). Taking dimensions of purpose-oriented networks seriously. Perspectives on Public Management and Governance, 2(3), 187–201. doi:10.1093/ppmgov/gvz011
Conway, S. (2014). A cautionary note on data inputs and visual outputs in social network analysis data inputs and visual outputs in social network analysis. British Journal of Management, 25(1), 102–117. doi:10.1111/j.1467-8551.2012.00835.x
Dervin, B. (1983, Month). An overview of sense-making research: Concepts, methods and results. Paper presented at the International Communication Association Annual Meeting, Dallas, TX. Retrieved from http://faculty.washington.edu/wpratt/MEBI598/Methods/An%20Overview%20of%20Sense-Making%20Research%201983a.htm
Dervin, B. (2015). Dervin’s sense-making theory. In M. N. Al-Suqri & A. D. Al-Aufi (Eds.), Information seeking behavior and technology adoption: Theories and trends (pp. 59–80). Hershey, PA: IGI Global.
Dervin, B., Foreman-Wernet, L., & Lauterbach, E. (2003). Sense-making methodology reader: Selected writings of Brenda Dervin. Cresskill, NJ: Hampton.
Dunbar, R. I. M. (1992). Neocortex size as a constraint on group size in primates. Journal of Human Evolution, 22(6), 469–493. doi:10.1016/0047-2484(92)90081-J
Eckstein, H. (1992). Case study and theory in political science. In Regarding Politics (pp. 117-178). Oxford, England: University of California Press.

207
Emerson, K., Nabatchi, T., & Balogh, S. (2012). An integrative framework for collaborative governance. Journal of Public Administration Research and Theory, 22(1), 1–29. doi:10.1093/jopart/mur011
Eschenfelder, B. (2011). Funder-initiated integration partnership challenges and strategies. Nonprofit Management & Leadership, 21(3), 273–288. doi:10.1002/nml.20025
Flyvbjerg, B. (1998). Case studies. In N. K. Denzin & Y. S. Lincoln (Eds.), Strategies of qualitative inquiry (pp. PP–PP). Thousand Oaks, CA: Sage.
Flyvbjerg, B. (2001). Making social science matter: Why social inquiry fails and how it can succeed again. Oxford, United Kingdom: Cambridge University Press.
Flyvbjerg, B., Landman, T., & Schram, S. (2012). Real social science: Applied phronesis. Cambridge, United Kingdom: Cambridge University Press.
Freeman, L. C., Romney, A. K., & Freeman, S. C. (1987). Cognitive structure and informant accuracy. American Anthropologist, 89(2), 310–325. doi: 10.1525/aa.1987.89.2.02a00020
Goffman, E. (1973). The presentation of self in everyday life. New York, NY: Overlook Press.
Goldsmith, S., & Eggers, W. (2004). Governing by network: The new shape of the public sector. Washington, DC: Brookings Institution Press.
Gulati, R., & Gargiulo, M. (1999). Where do interorganizational networks come from? American Journal of Sociology, 104, 1439–1493. doi:10.1086/210179
Gulati, R., Lavie, D., & Madhavan, R. (2011). How do networks matter? The performance effects of interorganizational networks. Research in Organizational Behavior, 31, 207–224. doi:10.1016/j.riob.2011.09.005
Gulati, R., Wohlgezogen, F., & Zhelyazkov, P. (2012). The two facets of collaboration: Cooperation and coordination in strategic alliances. Academy of Management Annals, 6, 531–583. doi:10.1080/19416520.2012.691646
Herranz, J. (2010). Multilevel performance indicators for multisectoral networks and management. American Review of Public Administration, 40(4), 445–460. doi:10.1177/0275074009341662
Hjern, B., & Porter, D. O. (1981). Implementation structures: A new unit of administrative analysis. Organization Studies, 2(3), 211–227. doi:10.1177/017084068100200301
208
Huang, K., & Provan, K. G. (2007). Resource tangibility and patterns of interaction in a publicly funded health and human services network. Journal of Public Administration Research and Theory, 17(3), 435–454. doi:10.1093/jopart/mul011
Huisman, M. (2009). Imputation of missing network data: Some simple procedures. Journal of Social Structure, 10, 1-29. doi:10.1007/978-1-4614-6170-8_394
Human, S. E., & Provan, K. G. (1997). An emergent theory of structure and outcomes in small-firm strategic manufacturing networks. Academy of Management Journal, 40(2), 368–403. doi:10.2307/256887
Human, S., & Provan, K. (2000). Legitimacy building in the evolution of small-firm multilateral networks: A comparative study of success and demise. Administrative Science Quarterly, 45(2), 327–365. doi:10.2307/2667074
Innes, J. E., & Booher, D. E. (1999). Consensus building and complex adaptive systems—A framework for evaluating collaborative planning. Journal of the American Planning Association, 65(4), 412–423. doi:10.1080/01944369908976071
Isett, K. R., Mergel, I. A., LeRoux, K., Mischen, P. A., & Rethemeyer, R. K. (2011). Networks in public administration scholarship: Understanding where we are and where we need to go. Journal of Public Administration Research and Theory, 21, I157–I173. doi:10.1093/jopart/muq061
Isett, K. R., & Provan, K. G. (2005). The evolution of dyadic interorganizational relationships in a network of publicly funded nonprofit agencies. Journal of Public Administration Research and Theory, 15(1), 149–165. doi:10.1093/jopart/mui008
Johansen, M., & LeRoux, K. (2013). Managerial networking in nonprofit organizations: The impact of networking on organizational and advocacy effectiveness. Public Administration Review, 73(2), 355–363. doi:10.1111/puar.12017
Kamensky, J. M. (2020). Practitioners. In J. Voets, R. Keast, & C. Koliba (Eds.), Networks and collaboration in the public sector: Essential research approaches, methodologies and analytic tools (pp. PP–PP). London, United Kingdom: Routledge.
Keast, R., Mandell, M. P., & Agranoff, R. (2013). Network theory in the public sector: Building new theoretical frameworks. London, United Kingdom: Taylor & Francis.
Kenis, P., & Provan, K. G. (2009). Towards an exogenous theory of public network performance. Public Administration, 87(3), 440–456. doi:10.1111/j.1467-9299.2009.01775.x

209
Kettl, D. (2008). The next government of the United States. New York, NY: W.W. Norton.
Kickert, W. J. M., Klijn, E.-H., & Koppenjan, J. F. M. (1997). Managing complex networks. London, United Kingdom: Sage.
Kilduff, M., & Tsai, W. (2003). Social networks and organizations. London, United Kingdom: Sage.
King, G. (1995). Replication, replication. PS: Political Science and Politics, 28(3), 444–452. doi:10.2307/420301
Klovdahl, A. S. (1981). A note on images of networks. Social Networks, 3(3), 197–214. doi:10.1016/0378-8733(81)90016-2
Knoke, D., & Yang, S. (2008). Social network analysis. doi:10.4135/9781412985864
Krackhardt, D. (1987). Cognitive social structures. Social Networks, 9(2), 109–134. doi:10.1016/0378-8733(87)90009-8
Krackhardt, D., & Kilduff, M. (1999). Whether close or far: Social distance effects on perceived balance in friendship networks. Journal of Personality and Social Psychology, 76, 770–782. doi:10.1037/0022-3514.76.5.770
Laumann, E. O., Marsden, P. V., & Prensky, D. (1989). The boundary specification problem in network analysis. In Ronald Burt and Michael Minor (Eds.), Research methods in social network analysis (pp. 18–34). Fairfax, VA: George Mason University Press.
Lecy, J. D., Mergel, I. A., & Schmitz, H. P. (2014). Networks in public administration: Current scholarship in review. Public Management Review, 16, 643–665. doi:10.1080/14719037.2012.743577
Lemaire, R. H. (2012). The functions of the network executive: A case study of network management, leadership and governance. Tucson, AZ: University of Arizona.
Lemaire, R. (2020). What is our purpose here? Network relationships and goal congruence in a goal-directed network. American Review of Public Administration, 50(2), 176–192. doi:10.1177/0275074019879506
Lemaire, R. H., & Provan, K. G. (2018). Managing collaborative effort: How Simmelian ties advance public sector networks. The American Review of Public Administration, 48(5), 379–394. doi:10.1177/0275074017700722
Lemaire, R. H., Provan, K. G., Mercken, L., & Leischow, S. J. (2017). Shaping the evolution of the information flow: The centralizing mechanisms in the evolution of the North American Tobacco Quitline Consortium. International Public Management Journal, 20(3), 467–488. doi:10.1080/10967494.2016.1276034

210
Lemaire, R. H., & Raab, J. (2020). Social and dynamic network analysis. In J. Voets, R. Keast, & C. Koliba (Eds.), Networks and collaboration in the public Sector: Essential research approaches, methodologies and analytic tools: London: Routledge.
Lupia, A., & Elman, C. (2014). Openness in political science: Data access and research transparency. PS: Political Science & Politics, 47(1), 19–42. doi:10.1017/S1049096513001716
Markovic, J. (2017). Contingencies and organizing principles in public networks. Public Management Review, 19(3), 361–380. doi:10.1080/14719037.2016.1209237
Marsden, P. V. (1987). Core discussion networks of Americans. American Sociological Review, 52(1), 122–131. doi:10.2307/2095397
Marsden, P. V. (1990). Network data and measurement. Annual Review of Sociology, 16(1), 435–463. doi:10.1146/annurev.so.16.080190.002251
McGuire, M. (2002). Managing networks: Propositions on what managers do and why they do it. Public Administration Review, 62(5), 599–609. doi:10.1111/1540-6210.00240
Meier, K. J., & O’Toole, L. J. (2003). Public management and educational performance: The impact of managerial networking. Public Administration Review, 63(6), 689–699. doi:10.1111/1540-6210.00332
Meier, K. J., & O’Toole, L. J. (2005). Managerial networking—Issues of measurement and research design. Administration & Society, 37(5), 523–541. doi:10.1177/0095399705277142
Monroe, A. S., & Butler, W. H. (2016). Responding to a policy mandate to collaborate: Structuring collaboration in the collaborative forest landscape restoration program. Journal of Environmental Planning and Management, 59, 1054–1072. doi:10.1080/09640568.2015.1053562
Nowell, B. L., & Kenis, P. (2019). Purpose-oriented networks: The architecture of complexity. Perspectives on Public Management and Governance, 2(3), 169–173. doi:10.1093/ppmgov/gvz012
Nowell, B. L., Velez, A.-L. K., Hano, M. C., Sudweeks, J., Albrecht, K., & Steelman, T. (2018). Studying networks in complex problem domains: Advancing methods in boundary specification. Perspectives on Public Management and Governance, VV, PP–PP. doi:10.1093/ppmgov/gvx015
O’Toole, L. J. (1997). Treating networks seriously: Practical and research-based agendas in public administration. Public Administration Review, 57(1), 45–52. doi:10.2307/976691

211
O’Toole, L. J. (2015). Networks and networking: The public administrative agendas. Public Administration Review, 75(3), 361–371. doi:10.1111/puar.12281
O’Toole, L. J., & Meier, K. J. (2004). Public management in intergovernmental networks: Matching structural networks and managerial networking. Journal of Public Administration Research and Theory, 14(4), 469–494. doi:10.1093/jopart/muh032
Ospina, S. M., & Dodge, J. (2005). It’s about time: Catching method up to meaning—The usefulness of narrative inquiry in public administration research. Public Administration Review, 65(2), 143–157. doi:10.1111/j.1540-6210.2005.00440.x
Powell, W. W. (1990). Neither market nor hierarchy: network forms of organization. In Staw, B. M. & Cummings. L. L. (Eds.), Research in Organizational Behavior, 12, pp. 295-336. Greenwich, CT: JAI Press.
Provan, K. G., Fish, A., & Sydow, J. (2007). Interorganizational networks at the network level: A review of the empirical literature on whole networks. Journal of Management, 33(3), 479–516. doi:10.1177/0149206307302554
Provan, K. G., & Huang, K. (2012). Resource tangibility and the evolution of a publicly funded health and human services network. Public Administration Review, 72(3), 366–375. doi:10.1111/j.1540-6210.2011.02504.x
Provan, K. G., Huang, K., & Milward, H. B. (2009). The evolution of structural embeddedness and organizational social outcomes in a centrally governed health and human services network. Journal of Public Administration Research and Theory, 19, 873–893. doi:10.1093/jopart/mun036
Provan, K. G., & Kenis, P. (2008). Modes of network governance: Structure, management, and effectiveness. Journal of Public Administration Research and Theory, 18(2), 229–252. doi:10.1093/jopart/mum015
Provan, K. G., & Lemaire, R. H. (2012). Core concepts and key ideas for understanding public sector organizational networks: Using research to inform scholarship and practice. Public Administration Review, 72, 638–648. doi:10.1111/j.1540-6210.2012.02595.x
Provan, K. G., & Milward, H. B. (1995). A preliminary theory of interorganizational network effectiveness—A comparative-study of 4 community mental-health systems. Administrative Science Quarterly, 40(1), 1–33. doi:10.2307/2393698
Provan, K. G., & Milward, H. B. (2001). Do networks really work? A framework for evaluating public-sector organizational networks. Public Administration Review, 61(4), 414–423. doi:10.1111/0033-3352.00045

212
Provan, K. G., & Sebastian, J. G. (1998). Networks within networks: Service link overlap, organizational cliques, and network effectiveness. Academy of Management Journal, 41(4), 453–463. doi:10.2307/257084
Provan, K. G., Sebastian, J. G., & Milward, H. B. (1996). Interorganizational cooperation in community mental health: A resource-based explanation of referrals and case coordination. Medical Care Research and Review, 53(1), 94–119. doi:10.1177/107755879605300105
Provan, K. G., Veazie, M. A., Staten, L. K., & Teufel-Shone, N. I. (2005). The use of network analysis to strengthen community partnerships. Public Administration Review, 65, 603–613. doi:10.1111/j.1540-6210.2005.00487.x
Provan, K., Veazie, M., Teufel-Shone, N., & Huddleston, C. (2004). Network analysis as a tool for assessing and building community capacity for provision of chronic disease services. Health Promotion Practice, 5, 174–181. doi:10.1177/1524839903259303
Raab, J., Mannak, R. S., & Cambré, B. (2015). Combining structure, governance and context: A configurational approach to network effectiveness. Journal of Public Administration Research and Theory, 25(2), 479–511. doi:10.1093/jopart/mut039
Rho, E. (2013). Network dynamics in local governments: Exogenous and endogenous determinants of changes in managerial networking. Athens: The University of Georgia.
Saz-Carranza, A., Iborra, S. S., & Albareda, A. (2016). The power dynamics of mandated network administrative organizations. Public Administration Review, 76(3), 449–462. doi:10.1111/puar.12445
Scott, J. (2000). Social network analysis: A handbook (2nd ed.). London, United Kingdom: Sage.
Scott, T. A., & Ulibarri, N. (2019). Taking network analysis seriously: Methodological improvements for governance network scholarship. Perspectives on Public Management and Governance, 2(2), 89–101. doi:10.1093/ppmgov/gvy011
Segato, F., & Raab, J. (2019). Mandated network formation. The International Journal of Public Sector Management, 32(2), 191–206. doi:10.1108/IJPSM-01-2018-0018
Silvia, C., & McGuire, M. (2010). Leading public sector networks: An empirical examination of integrative leadership behaviors. Leadership Quarterly, 21(2), 264–277. doi:10.1016/j.leaqua.2010.01.006
Stork, D., & Richards, W. D. (1992). Nonrespondents in communication network studies problems and possibilities. Group & Organization Management, 17(2), 193–209. doi:10.1177/1059601192172006
213
Strassheim, H. (2019). Behavioural mechanisms and public policy design: Preventing failures in behavioural public policy. Public Policy and Administration, 63(2), 187–204. doi:10.1177/0952076719827062
Ulibarri, N., & Scott, T. A. (2017). Linking network structure to collaborative governance. Journal of Public Administration Research and Theory, 27(1), 163–181. doi:10.1093/jopart/muw041
Wamsley, G. L. (1996). A public philosophy and ontological disclosure as the basis for normatively grounded theorizing in public administration. In G. L. Wamsley & J. F. Wolf (Eds.), Refounding democratic public administration: Modern paradoxes, postmodern challenges (pp. 351–380). Thousand Oaks, CA: Sage.
Wasserman, S., & Faust, K. (1994). Social network analysis: Methods and applications. Cambridge: Cambridge University Press.
Weber, E. R., & Khademian, A. M. (2008). Wicked problems, knowledge challenges, and collaborative capacity builders in network settings. Public Administration Review, 68(2), 334–349. doi:10.1111/j.1540-6210.2007.00866.x
Weick, K. E. (1995). Sensemaking in organizations. Thousand Oaks, CA: Sage.
Yin, R. K. (2003). Case study research: Design and methods. Thousand Oaks, CA: Sage.
Zhao, S., Grasmuck, S., & Martin, J. (2008). Identity construction on Facebook: Digital empowerment in anchored relationships. Computers in Human Behavior, 24, 1816–1836. doi:10.1016/j.chb.2008.02.012

214
Appendix A
Institutional Review Board Documents—Survey Phase
Recruitment Letter – Main Group
Dear ***:
I write to invite you to participate in a new project being launched in collaboration between the United Way Roanoke Valley (UWRV) and researchers at the Center for Public Administration and Policy (CPAP) at Virginia Tech. The aim of the project is to gather baseline information that will help launch a community initiative to enhance family self-sufficiency. The effort to help families in any community reach their full potential never takes place in a vacuum: health/wellness, education, economic circumstance, home life, and myriad other factors affect a family’s ability to develop, learn, and grow. By bringing together all of those committed to family self-sufficiency in the Roanoke Valley, the goal is to integrate efforts to address the problems that exist for so many families across the Roanoke Valley and for the organizations committed to serving those families.
You are being invited to voluntarily participate in the UWRV Family Self-Sufficiency Network research project. The purpose of this project is to document the relationships between and among organizations across the Roanoke Valley that are committed to helping families achieve self-sufficiency, as well as opportunities for developing shared solutions. You are being invited because your organization/program has been identified as providing a service related to family self-sufficiency in the region and therefore your knowledge and insights are important.
If you agree to participate, you will be invited to attend a meeting hosted by the United Way Roanoke Valley. At this meeting, you will be asked to complete a survey indicating which organizations/programs your organization/program works with and your perceptions of opportunities for developing shared solutions to assist the Roanoke community in enhancing its efforts to address family self-sufficiency. The survey should take approximately 30-45 minutes to complete and the research team will be present on site to answer any questions you may have during the process. If you are unable to attend the in-person meeting, you will be able to complete the survey online and the research team will be available by phone to answer any questions you may have during the process.
While there are no direct monetary benefits or other compensation associated with participation in this research, individuals who attend one of the group sessions will be included in a door prize drawing for a $50 gift certificate from the United Way. You are free to decline participation at any time. Aside from your time, there are no costs for taking part in the study. The results of this survey will be aggregated with other survey data, and will in no way be linked back to you as an individual. Any

215
identifying information you submit will be used for tracking purposes only, and access to this information will be limited to the principle investigator. The results of this study may be published, and will be shared (in aggregate form) with the UWRV for purposes of informing their future efforts to enhance the capacity of community-wide efforts to address family self-sufficiency and help lift families out of poverty.
The information gathered through this project should benefit the children and families in the region by providing an analysis of the current state of collaboration and integration of services and activities to family self-sufficiency. The findings will be used to assist the organizations involved in these issues to improve the way they work together to advance the goals of family self-sufficiency. Therefore, we sincerely hope you are willing to participate.
A staff member at the United Way of Roanoke Valley will soon send an invitation to the in-person meeting at which time you will be able to notify us of your intent to attend the meeting, complete the survey online on your own, or not participate in the project. In the meantime, if you have any questions, or would like more information about this research, please contact Robin Lemaire at [email protected] or 540-231-0664.
Sincerely,
Robin H. Lemaire, PhD. Principle Investigator Asst. Professor Center for Public Administration and Policy School of Public and International Affairs Virginia Tech (540) 231‐0664 [email protected]

216
Recruitment Letter – Secondary Group Dear ***:
I write to invite you to participate in a new project being launched in collaboration between the United Way Roanoke Valley (UWRV) and researchers at the Center for Public Administration and Policy (CPAP) at Virginia Tech. The aim of the project is to gather baseline information that will help launch a community initiative to enhance family self-sufficiency. The effort to help families in any community reach their full potential never takes place in a vacuum: health/wellness, education, economic circumstance, home life, and myriad other factors affect a family’s ability to develop, learn, and grow. By bringing together all of those committed to family self-sufficiency in the Roanoke Valley, the goal is to integrate efforts to address the problems that exist for so many families across the Roanoke Valley and for the organizations committed to serving those families.
You are being invited to voluntarily participate in the UWRV Family Self-Sufficiency Network research project. The purpose of this project is to document the relationships between and among organizations across the Roanoke Valley that are committed to helping families achieve self-sufficiency, as well as opportunities for developing shared solutions. You are being invited because your organization/program has been identified as having important relationships with other organizations providing a service related to family self-sufficiency in the region and therefore your knowledge and insights are important.
If you agree to participate, you will be asked to complete an online survey indicating which organizations/programs your organization/program works with and your perceptions of opportunities for developing shared solutions to assist the Roanoke community in enhancing its efforts to address family self-sufficiency. The survey should take approximately 15-20 minutes to complete and the research team will be present on site to answer any questions you may have during the process. The research team will be available by phone to answer any questions you may have during the process.
There are no direct monetary benefits or other compensation associated with participation in this research, and you are free to decline participation at any time. Aside from your time, there are no costs for taking part in the study. The results of this survey will be aggregated with other survey data, and will in no way be linked back to you as an individual. Any identifying information you submit will be used for tracking purposes only, and access to this information will be limited to the principle investigator. The results of this study may be published, and will be shared (in aggregate form) with the UWRV for purposes of informing their future efforts to enhance the capacity of community-wide efforts to address family self-sufficiency and help lift families out of poverty.

217
The information gathered through this project should benefit the children and families in the region by providing an analysis of the current state of collaboration and integration of services and activities to family self-sufficiency. The findings will be used to assist the organizations involved in these issues to improve the way they work together to advance the goals of family self-sufficiency. Therefore, we sincerely hope you are willing to participate.
A member of the research team will soon follow-up with an invitation to complete the survey online on your own, or not participate in the project. In the meantime, if you have any questions, or would like more information about this research, please contact Robin Lemaire at [email protected] or 540-231-0664.
Sincerely,
Robin H. Lemaire, PhD. Principle Investigator Asst. Professor Center for Public Administration and Policy School of Public and International Affairs Virginia Tech (540) 231‐0664 [email protected]

218
Recruitment E-mail – United Way Good afternoon United Way Partners and Friends,
As many of you know, the United Way Board of Directors approved the vision to “elevate 10,000 families to self-sufficiency by 2030” in late 2015. While staff continues to work on the tactical plan supporting our strategic direction, we are also mindful to begin engaging you in these conversations as early as we can.
Therefore, we are excited to announce our next engagement opportunity, which is a network analysis study scheduled for the week of [insert]. The study will be conducted by Virginia Tech Assistant Professor Dr. Robin Lemaire and Senior Research Faculty member David Moore. The network analysis is intended to document partnerships across currently funded programs, as well as other community entities that play a key role in helping families achieve self-sufficiency. The findings of the study will be shared with partners to stimulate discussion and exploration of partnership opportunities that will help connect families with other resources and programs as we continue our journey to bring our community to self-sufficiency. In addition, this year’s Community Investment reporting process will include questions that will begin introducing the guiding principles which make up United Way’s self-sufficiency framework and gather information from programs on how they are addressing these areas in their work with families.
Provided below are registration links to attend one of four sessions that are part of the network analysis study. The first 30 minutes of each session will focus on the content of this year’s Community Investment Process – Reporting Process, and the remainder of the time will be on the network analysis itself.
It will be helpful to have the staff member who is filling out the United Way report to be present for the first thirty minutes. Additionally, many of you may have multiple programs funded through our process. Please note that each program will need a contact person for this survey, and our staff will be reaching out to you to identify those additional persons who can represent your programs in this process.
Please see the dates below for this important study, and make sure that the person most knowledgeable of program operations can attend and participate in one of them. The meeting will be held at the Roanoke Higher Education Center, and each session can accommodate around 24 people at most.
[Insert dates/times for sessions and hyperlinks for registering]
Thank you for your continued interest in partnering with United Way and each other as we prepare to embark on this life-changing journey for families in our community! Abby Abby Verdillo / Vice President, Community Impact (540) 777-4206/ [email protected]

219
United Way of Roanoke Valley (540) 777-4206/ Fax: (540) 344-4304 325 Campbell Avenue, S.W. Roanoke, VA 24016 www.uwrv.org

220
Consent Form – Main Group
VIRGINIA POLYTECHNIC INSTITUTE AND STATE UNIVERSITY
Informed Consent for Participants in Research Projects Involving Human Subjects
Title of Project: United Way Roanoke Valley Family Self-Sufficiency Network Analysis
Investigator(s): Robin Lemaire, PhD: [email protected] / 540-231-0664 David Moore, MPA: [email protected] / 540-553-1454
I. Purpose of this Research Project
Research has shown that lifting families out of a cycle of poverty and into self-sufficiency requires two-generation approaches and a range of supports that cross the boundaries of education, income and health. Achieving self-sufficiency is not simply about addressing a lack of financial resources; it also includes addressing unstable or crowded housing, unemployment, food insecurity, exposure to violence, addiction, incarceration, and undereducated adults. Attaining the range of support, though, involves trying to make sense of a complex system and connecting with numerous agencies to get help.
The purpose of this research is to document the relationships between and among organizations across the Roanoke Valley that are seeking to work collaboratively to lift families out of poverty.
The research will examine the current state of collaboration and integration of services and activities to benefit family self-sufficiency. This information will in turn be used to analyze where there are opportunities to assist the organizations involved in family self-sufficiency issues to improve the way they work together to advance the goals of poverty alleviation in the region. The information gathered through this project should benefit the Roanoke Valley and ultimately the children and families in the region by providing a comprehensive network map of the organizations involved across the spectrum of family self-sufficiency in the area and where the opportunities are for integration.
It is expected that approximately 90-130 survey participants may be involved in the research. The aggregated research results may be published in a dissertation, academic journals and provided in a report to the United Way of the Roanoke Valley to support its efforts to fund integration initiatives.
II. Procedures
By clicking “I agree” below, you will be led through an online survey that should require approximately 30-45 minutes to complete. The survey consists of questions inquiring which organizations or programs your organization/program works with and your perceptions opportunities for developing shared solutions to assist the Roanoke community in enhancing its efforts to address family self-sufficiency.
III. Risks
There are no apparent physical, mental, or emotional risks resulting associated with participation in this research.

221
IV. Benefits
While there are no direct monetary benefits or other compensation associated with participation in this research, individuals who attend one of the group sessions will be included in a door prize drawing for a $50 gift certificate from the United Way. You are free to decline participation at any time. The findings, however, will inform the organizations involved in family self-sufficiency issues how to improve the way they work together to advance the goals of family self-sufficiency across the region.
No promise or guarantee of benefits has been made to encourage you to participate.
V. Extent of Anonymity and Confidentiality
All data collected through surveys and interviews will be kept confidential. Only essential information that identifies individual respondents will be collected (name, physical or mailing addresses, email address, phone number, etc.). The research team will have exclusive access to the data during the collection and analysis process, and all stored data will be password protected. The aggregate data (void of identifying information) may be shared with the United Way of the Roanoke Valley.
Visual depictions of network ties will be shared back with all study participants in a way that identify the type, number, intensity and reciprocity of ties. Ties and other data related to relationship quality will not be depicted in ways that identify respondents.
The Virginia Tech (VT) Institutional Review Board (IRB) may view the study’s data for auditing purposes. The IRB is responsible for the oversight of the protection of human subjects involved in research.
VII. Subject's Consent
I have read the Consent Form and conditions of this project. I have had all my questions answered. I hereby acknowledge the above and give my voluntary consent (please confirm by clicking “I have read the attached consent form and agree to participate in this research” below).
VIII. Freedom to Withdraw
You are free to withdraw from this study at any time without penalty. You are free to choose not to answer any questions that you choose, or not respond to what is being asked of you, without penalty.
Please note that there may be circumstances under which the investigator may determine that a subject should not continue as a subject.
IX. Questions or Concerns
Should you have any questions about this study, you may contact one of the research investigators whose contact information is included at the beginning of this document.
Should you have any questions or concerns about the study’s conduct or your rights as a research subject, or need to report a research-related injury or event, you may contact the VT IRB Chair, Dr. David M. Moore at [email protected] or (540) 231-4991.

222
------------------------------------------------------------------------------------------------------------------

223
Consent Form – Secondary Group
VIRGINIA POLYTECHNIC INSTITUTE AND STATE UNIVERSITY
Informed Consent for Participants in Research Projects Involving Human Subjects
Title of Project: United Way Roanoke Valley Family Self-Sufficiency Network Analysis
Investigator(s): Robin Lemaire, PhD: [email protected] / 540-231-0664 David Moore, MPA: [email protected] / 540-553-1454
I. Purpose of this Research Project
Research has shown that lifting families out of a cycle of poverty and into self-sufficiency requires two-generation approaches and a range of supports that cross the boundaries of education, income and health. Achieving self-sufficiency is not simply about addressing a lack of financial resources; it also includes addressing unstable or crowded housing, unemployment, food insecurity, exposure to violence, addiction, incarceration, and undereducated adults. Attaining the range of support, though, involves trying to make sense of a complex system and connecting with numerous agencies to get help.
The purpose of this research is to document the relationships between and among organizations across the Roanoke Valley that are seeking to work collaboratively to lift families out of poverty.
The research will examine the current state of collaboration and integration of services and activities to benefit family self-sufficiency. This information will in turn be used to analyze where there are opportunities to assist the organizations involved in family self-sufficiency issues to improve the way they work together to advance the goals of poverty alleviation in the region. The information gathered through this project should benefit the Roanoke Valley and ultimately the children and families in the region by providing a comprehensive network map of the organizations involved across the spectrum of family self-sufficiency in the area and where the opportunities are for integration.
It is expected that approximately 90-130 survey participants may be involved in the research. The aggregated research results may be published in a dissertation, academic journals and provided in a report to the United Way of the Roanoke Valley to support its efforts to fund integration initiatives.
II. Procedures
By clicking “I agree” below, you will be led through an online survey that should require approximately 15-20 minutes to complete. The survey consists of questions inquiring which organizations or programs your organization/program works with and your perceptions opportunities for developing shared solutions to assist the Roanoke community in enhancing its efforts to address family self-sufficiency.
III. Risks
There are no apparent physical, mental, or emotional risks resulting associated with participation in this research.

224
IV. Benefits
There are no direct monetary benefits or individual recognition resulting from participation in this research. The findings, however, will inform the organizations involved in family self-sufficiency issues how to improve the way they work together to advance the goals of family self-sufficiency across the region.
No promise or guarantee of benefits has been made to encourage you to participate.
V. Extent of Anonymity and Confidentiality
All data collected through surveys and interviews will be kept confidential. Only essential information that identifies individual respondents will be collected (name, physical or mailing addresses, email address, phone number, etc.). The research team will have exclusive access to the data during the collection and analysis process, and all stored data will be password protected. The aggregate data (void of identifying information) may be shared with the United Way of the Roanoke Valley.
Visual depictions of network ties will be shared back with all study participants in a way that identify the type, number, intensity and reciprocity of ties. Ties and other data related to relationship quality will not be depicted in ways that identify respondents.
The Virginia Tech (VT) Institutional Review Board (IRB) may view the study’s data for auditing purposes. The IRB is responsible for the oversight of the protection of human subjects involved in research.
VII. Subject's Consent
I have read the Consent Form and conditions of this project. I have had all my questions answered. I hereby acknowledge the above and give my voluntary consent (please confirm by clicking “I have read the attached consent form and agree to participate in this research” below).
VIII. Freedom to Withdraw
You are free to withdraw from this study at any time without penalty. You are free to choose not to answer any questions that you choose, or not respond to what is being asked of you, without penalty.
Please note that there may be circumstances under which the investigator may determine that a subject should not continue as a subject.
IX. Questions or Concerns
Should you have any questions about this study, you may contact one of the research investigators whose contact information is included at the beginning of this document.
Should you have any questions or concerns about the study’s conduct or your rights as a research subject, or need to report a research-related injury or event, you may contact the VT IRB Chair, Dr. David M. Moore at [email protected] or (540) 231-4991.

225
------------------------------------------------------------------------------------------------------------------

226
Survey Handout

227

228

229
Survey – Main Group

230

231

232

233

234

235

236

237

238

239

240

241

242

243

244
Survey – Secondary Group

245

246

247

248

249

250
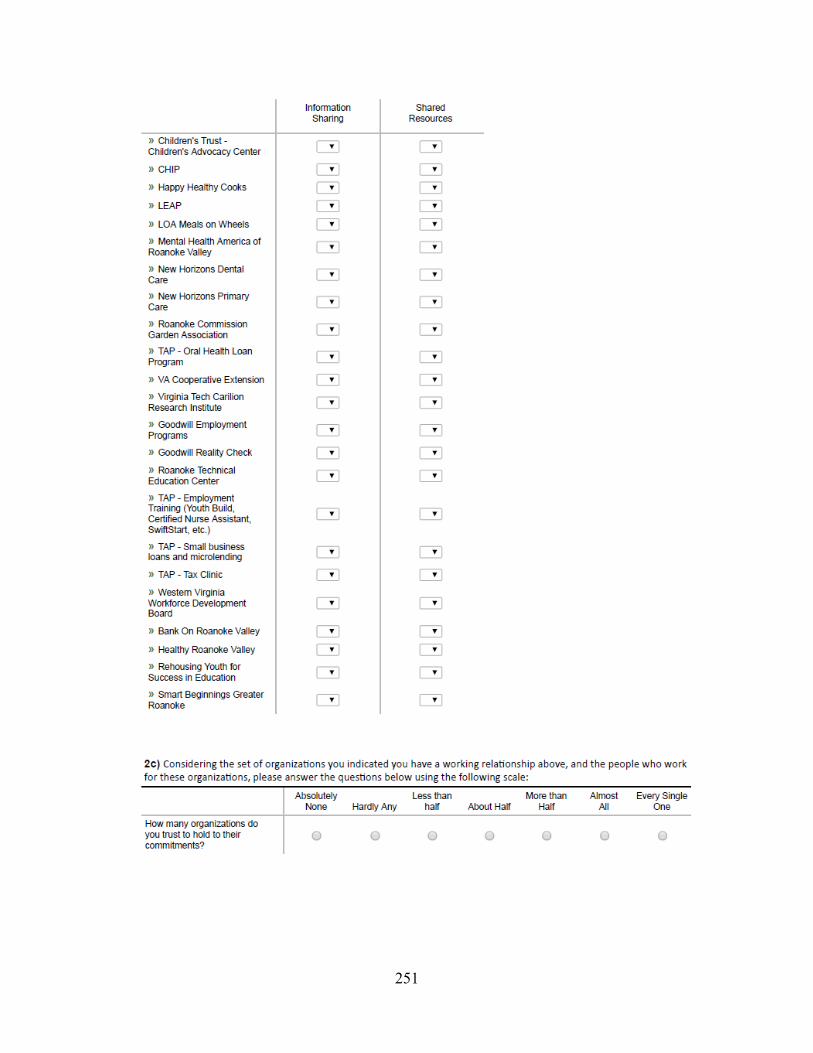
251

252

253

254

255
Appendix B
Institutional Review Board Documents—Interview Phase
Recruitment Letter
Dear [Informant]
My name is David Moore and I am a doctoral candidate at the Virginia Tech Center for Public Administration and Policy. I have been working with Dr. Robin Lemaire on the network study of the United Way’s Family Self-Sufficiency Network. For my dissertation work, I have proposed to explore how participants and stakeholders in human service networks make sense of the network plots associated with network analyses. I would like to interview you as one of 12-15 key informants to go over the network plots from the study and discuss what you take away from them. The interview can be conducted at a time and place of your convenience and would take 60-90 minutes. I am attaching a copy of the informed consent disclosure which explains more about the study and your potential participation. If you are willing to participate, I will send you a copy of the network plots and we can schedule a time to meet in person for the interview. If you would not like to participate, please let me know and I will find another informant for my study. Thank you for your consideration.

256
Consent Form – Individual

257

258
Consent Form – Group

259

260
Interview Introduction

261
Interview Question Guide

262
Plots Used for Interviews

263

264

265

266

267
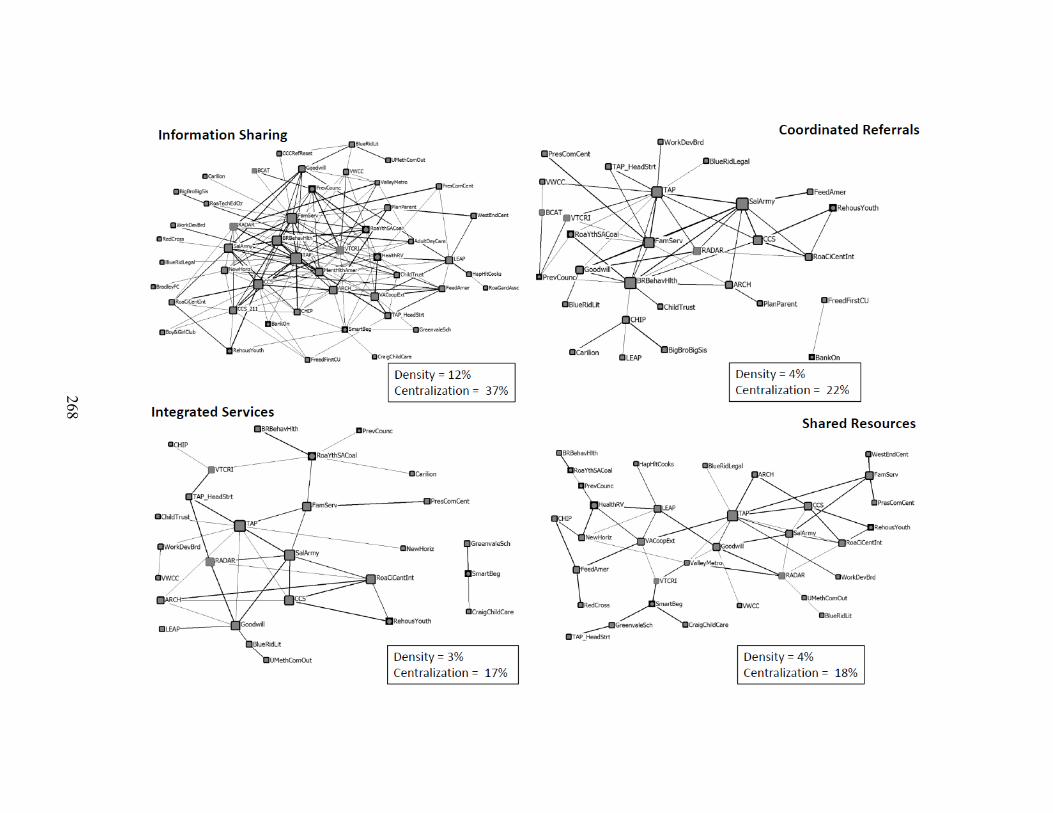
268
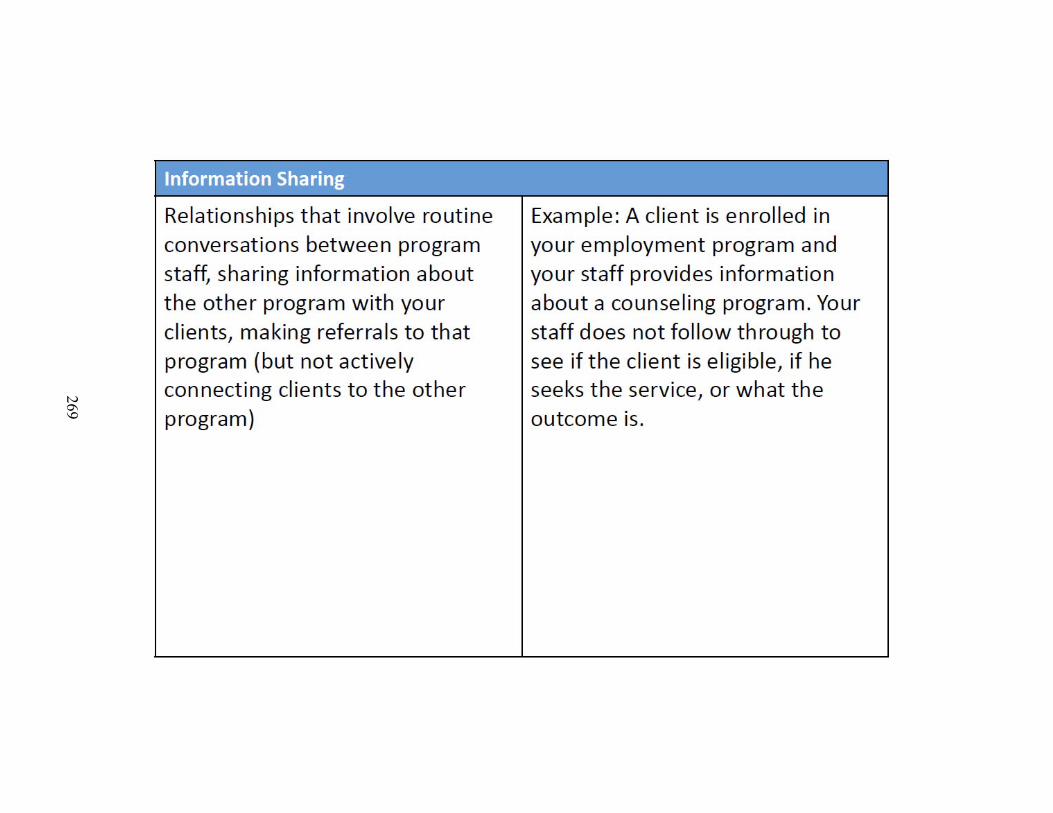
269

270

271

272

273

274

275

276

277

278

279
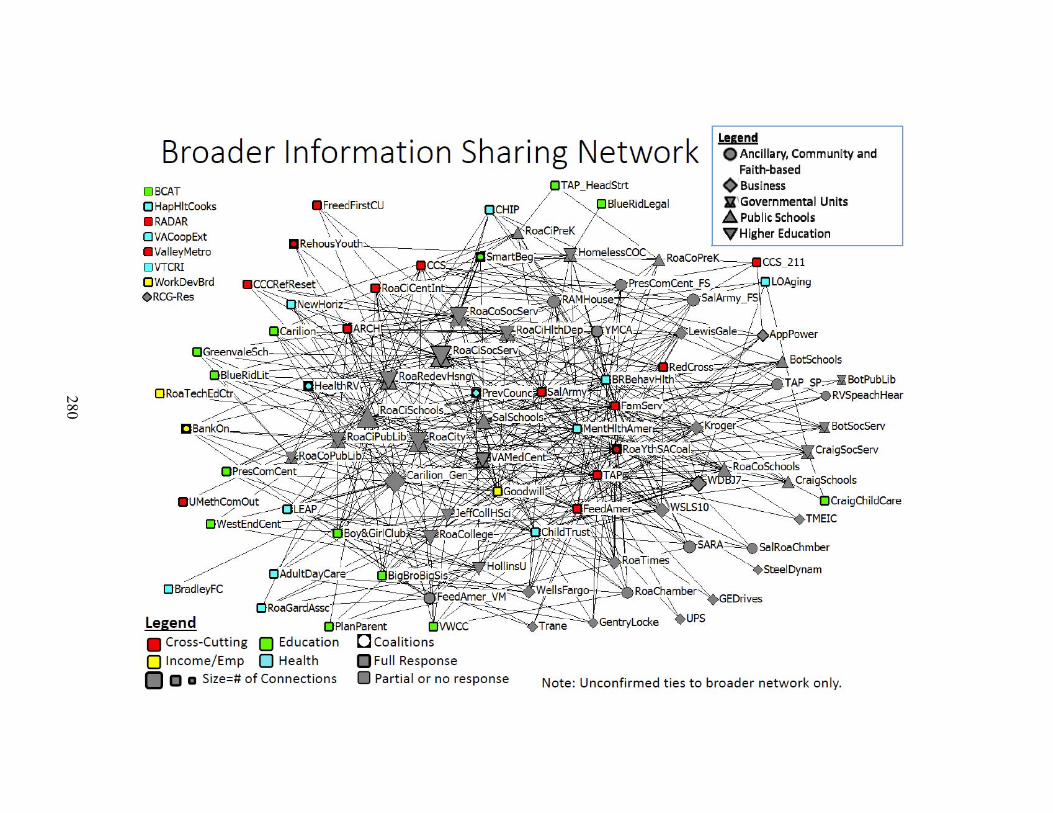
280

281
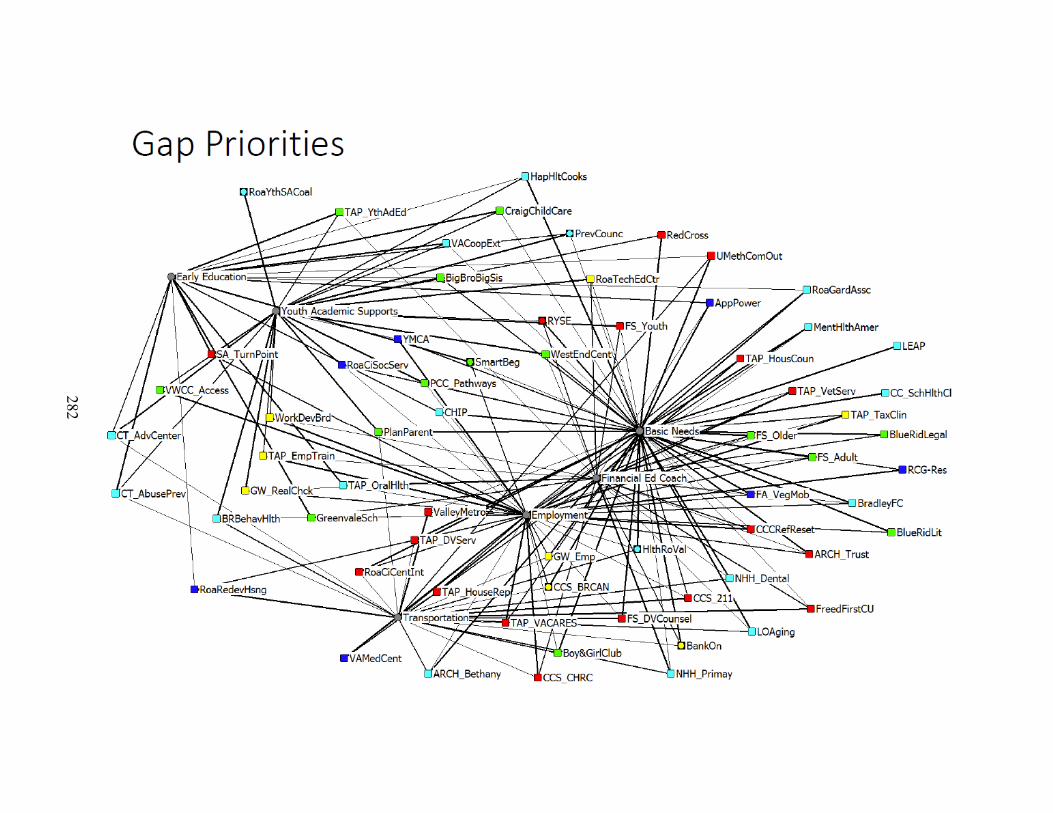
282

283

284

285

286

287
Appendix C
Summary of Field Notes Concerning Sense Making Methodology Objects and Elements
Objects and elements explored through SMM Interviews
Interview Objects
Object 1 Elements Object 2 Elements Object 3 Elements
001 – Individual
Any Confirmed Tie
Information Sharing
Integrated Services
Any Confirmed Tie Program Level
Education and income missing
Gaps in services
Information Sharing
Confidentiality Breach
HAT/BRICH/ COC
Integrated Services
So Many TAP Gov
fund/SA Not UW Plan Silos
002 – Individual
Any Confirmed Tie
Integrated Services
Gap Priorities
Any Confirmed Tie Program Level
Centrality Stigma Homelessness LOA Edge VA Hospital
Integrated Services
Housing Eligibility Criteria Steals precious
resources
Gap Priorities
Transportation Sustainable
Resources Capitalism So many
meetings and projects
5 jurisdictions 003 – Individual
Integrated Services
Broader Network
Resource Sharing
Integrated Services
Silos City Deficits Budget Today Overwhelms
family Overlap/Redunda
ncy
Broader Network Resource Sharing
None
NA
004-007 – Group
Information Sharing
Shared Resources
Linked Gaps
Information Sharing
Outliers Number of
questions
Shared Resources
Fragmentation by sector
WDB Funding Sources
Linked Gaps
Prevention Early Education TAP Central

288
Objects and elements explored through SMM Interviews
Interview Objects
Object 1 Elements Object 2 Elements Object 3 Elements
2 agencies holding web together
Missing links 008 – Individual
Any Confirmed Tie
Broader Network
Resource Sharing
Integrated Services
Any Confirmed Tie Program Level
Understand You UW View Incompleteness Collaborative
Skills
Broader Network Resource Sharing
Partial View So many Collaboration School Logistics Mind Blown
Integrated Services
Survival Data Leadership New vs
Strengthening
009 – Individual
Coordinated
Referrals
Shared Resources
Gap Priorities
Coordinated Referrals
Schools Missing Repay?? Begging Branches Missing out Facility Housing Healthcare Chose to Leave
Shared Resources
$$ SE Quadrant
Gap Priorities
Early Education
010 – Individual
Any Confirmed Tie
Gap Priorities
Any Confirmed Tie Program Level
Missing Relationships
Information Community Wide Resources
Don’t know what they do
Central Intake
Gap Priorities
Eye problem disability (respondent has)
NA

289
Objects and elements explored through SMM Interviews
Interview Objects
Object 1 Elements Object 2 Elements Object 3 Elements
Sophisticated at Navigation
011 – Individual
Any Confirmed Tie
Gap Priorities
Any Confirmed Tie Program Level
Missing Existing Missing Ops Redundant Frustrated
Gap Priorities
Divided and segregated
Invisible poverty Wide Service Area
NA
012-013 – Group
Integrated Services
Shared Resources
Gap Priorities
Integrated Services
Top Down Push More Isolates Goodwill Under
represented
Shared Resources
Coalitions Fewer Isolates Goodwill
Gap Priorities
Zeroed in Printed way Lists
014-018 – Group
Integrated Services
Linked Gaps
Any Confirmed Tie
Integrated Services
Things missing Key players Hubs TAP Internal Accenting as
Correct
Linked Gaps
None
Any Confirmed Tie Program Level
Not a lot of employment
Colors/ Boundaries
Age type Emotions Out
019 – Individual
Any Confirmed Tie
Any Confirmed Tie Program Level
Missing Links Areas that are
not… Other
communities Powerful
organizations Health Other agencies
NA NA

290
Appendix D
Hypothetical Example of Sense Making Methodology Interview
Example of SMM Interview Approach: The following fictitious and simplified
example illustrate this interview method. In response to the critical entry question, this
hypothetical informant indicated three network plots most interesting to them, one
showing relationships based on information sharing, one indicating multiplex
relationships and one manifesting an affiliation network based on shared interests.
Beginning with the first object (the plot of information sharing relationships), the
researcher would ask the first situation/learning question followed by many of SMM
questions designed to tap the situation. The researcher takes notes relating to their
responses to see whether any of the responses should become a Level 2 SMM element
that could warrant additional exploration. For example, the informant might indicate that
they learned that their organization was not sharing information with as many partners as
other similar entities and that as a result they may not be getting as many referrals as they
need. Subsequent questions in the situation battery of questions might uncover that they
recently lost a grant funded home visiting project due to not having enough participants.
“Loss of home visiting project” might become a SMM element for potential Level 2
triangulation and the researcher would note it in the grid for potential follow up. The
researcher would continue through the questions on gaps, bridges and outcomes/help,
keeping notes and identifying responses within each battery of questions that might serve
as elements for Level 2 triangulation. For example, through the questions tapping the
gaps, the interviewee might share that they were confused that newer initiatives had more
information sharing relationships than their program, even though they have been around

291
much longer and should be better known within the network—leaving them feeling old
and forgotten. “Old and forgotten” might become a SMM element for Level 2
triangulation and the researcher would write it in the grid for potential follow up. In the
battery of questions about bridges, the informant might indicate that they came to the
conclusion that staff turnover might be a factor in having fewer relationships. “Staff
turnover” might become a SMM element for Level 2 triangulation and the interviewer
would note it in the grid for potential follow up.
After completing the entire battery of questions for the first object, the researcher
would select one or two Level 2 elements (responses to Level 1 questioning) to explore
through the same questions. For example, given how much time had elapsed exploring
the first Level 1 object, the researcher might decide to explore only one Level 2
element—“Old and forgotten.” The researcher would then ask something like “Thinking
about feeling old and forgotten, what else happened or was happening?” Then the
researcher would proceed through the rest of the questions inserting language about being
old and forgotten such as “How did feeling old and forgotten connect with past events?”
Once the researcher has completed sufficient questions from the battery to extract the
informant’s insights, they would turn to the second Level 1 SMM object, the network plot
of multiplexity, and repeat the process. Perhaps two Level 2 elements would emerge from
those questions that seemed significant enough for Level 2 triangulation given the time
remaining—“Lost grant writer” and “Bigwigs on board.” The researcher would then ask
the select questions from the battery for each of those elements before turning attention to
the third SMM object, the plot of affiliations based on shared interests.

292
In addition to Level 2 triangulation questioning, the researcher may also ask
probing questions. Probing questions seek more detail from interviewees concerning
previous responses. They often take the form of, “Tell me more about _____.” Probing
questions may also be integrated with questions from the SMM question list such as,
“You mentioned _________, what led up to that?” Although the researcher may probe
issues brought up by informants in response to Level 1 or 2 questioning, SMM guidelines
suggest they refrain from injecting their own framing and nomenclature and should
attempt instead to employ the wording used by interviewees.

293
Appendix E
Sense Making Methodology Interview Questionnaire