Embed Size (px)
Citation preview
Making RTI WorkA practical guide to using data for a successful response to intervention program
WHITE PAPER

Reports and software screens may vary from those shown as enhancements are made.
©Copyright 2016 by Renaissance Learning, Inc. All rights reserved. Printed in the United States of America. All logos, designs, and brand names for Renaissance Learning’s products and services, including but not limited to Accelerated Math, Accelerated Reader, MathFacts in a Flash, Renaissance Home Connect, Renaissance, Star Assessments, Star Early Literacy, Star Math, and Star Reading, are trademarks of Renaissance Learning, Inc., and its subsidiaries, registered, common law, or pending registration in the United States and other countries. All other product and company names should be considered the property of their respective companies and organizations.
This publication is protected by U.S. and international copyright laws. It is unlawful to duplicate or reproduce any copyrighted material without authorization from the copyright holder. For more information, contact:
RENAISSANCE LEARNINGP.O. Box 8036Wisconsin Rapids, WI 54495-8036(800) [email protected]
9/16

ContentsIntroduction .....................................................................................................................................................................................1
What is RTI? .....................................................................................................................................................................................2
The challenges of RTI ....................................................................................................................................................................9
Nine principles of a successful RTI program ........................................................................................................................ 12
Curriculum-based measurement—And alternatives ............................................................................................................ 19
Implementing RTI—An overview .............................................................................................................................................. 24
Appendix: Glossary of common terms ................................................................................................................................... 32
Bibliography .................................................................................................................................................................................. 36
Acknowledgements .................................................................................................................................................................... 43
FiguresFigure 1. Tiered delivery model ....................................................................................................................................................2
Figure 2. Goal of Response to Intervention ..............................................................................................................................4
Figure 3. Problem-solving model ................................................................................................................................................7
Figure 4. Problem solving in all tiers...........................................................................................................................................7
Figure 5. The value and cost of information ..........................................................................................................................10
Figure 6. Star Early Literacy Student Diagnostic Report ..................................................................................................... 22
Figure 7. Star Reading Diagnostic Report .............................................................................................................................. 22
Figure 8. Star Math Diagnostic Report ................................................................................................................................... 23
©Copyright 2016 Renaissance Learning, Inc. All rights reserved. i

IntroductionResponse to Intervention (RTI)—also known as a multi-tiered system of supports (MTSS)—is rapidly becoming the leading model for school improvement in the United States. Supported by federal legislation and mandated by an increasing number of states, RTI has generated great excitement, but also some confusion and apprehension. What exactly is RTI, and what makes it different from all the other programs introduced into schools in recent years? Is RTI just another requirement educators must fit into their crowded schedules, or is it really change for the better?
Renaissance believes that RTI is potentially the most promising educational development in many years—if it is understood and implemented in the right ways. We base this belief on more than two decades of hands-on experience with the essential element of RTI: educators using student data in the classroom to accelerate learning for all. We know RTI can work because we have seen this essential element work, time and time again, for students of all ethnicities and socioeconomic status, at all grade levels, in reading, math, and across the curriculum.
But we also know—from experience with thousands of educators and hundreds of thousands of students—that RTI will not work automatically. It is not a quick fix or a simple add-on. RTI is a different approach to looking at students and allocating resources so all are served appropriately. Like any new approach, its success depends on how well it is understood and implemented. Based on years of experience developing tools and methods to help educators benefit from student data, Renaissance has prepared this guide on making RTI the success it ought to be.
Ultimately, RTI can succeed because, properly understood, it is fundamentally practical. As we will see in the pages that follow, it is not based on new theories or experimental ideas. Rather, it is a way of putting into practice the things research has always taught us we should be doing—a way of taking what works and making it workable. Therefore, schools must exercise care in selecting the tools they will use to implement RTI. How well those tools are designed and used will make a tremendous difference in reaping the benefits of a sustainable RTI program, while avoiding potential pitfalls.
The next generation of Response to InterventionThis paper, first published in 2009, provides fundamental information about RTI, the traditional three-tiered model, and the screen, intervene, and monitor-progress protocol. In 2016, Renaissance created a follow up to this report that looks ahead to the next generation of RTI, noting the subtle, and not-so-subtle, shifts in focus from the first implementations in 2004 to what we see now in US schools well into our second decade in 21st century classrooms. To draw upon the lessons learned in the first generation of RTI and explore ways the next generation offers greater promise for each student, teacher, and educational leader, see The Next Generation of Response to Intervention: Using data-fueled insight, decisions, and resources to respond to challenge, intervention, and growth.
Technology for RTI According to leading RTI experts, “In the absence of technology, the data burden becomes unmanageable” (Kurns & Tilly, 2008).
©Copyright 2016 Renaissance Learning, Inc. All rights reserved. 1
©Copyright 2016 Renaissance Learning, Inc. All rights reserved. 1
What is RTI?DefinitionsDefining RTI in a useful way can be challenging because a multi-tiered system of supports is not a program or theory, or even derived from a single body of research. Its advocates and architects use words such as practice, method, and system in their definitions. Its exact components vary considerably from state to state and even from school to school. This variability reflects the flexibility of the concept; it is not limited to a single type of tool or pedagogy, but is defined more by how we organize what we do with our students to ensure all get the help needed to succeed.
A commonly cited definition describes RTI as “the practice of providing high-quality instruction and interventions matched to student need, monitoring progress frequently to make decisions about changes in instruction or goals, and applying child response data to important educational decisions” (National Association of State Directors of Special Education, 2006). This definition stresses three critical components: (1) quality differentiated instruction, (2) frequent monitoring of student progress, and (3) adjusting what is done with students based on data from that monitoring. These components, however, either separately or together, do not differentiate RTI very clearly from general statements of “elements of effective instruction” or “data-driven decision making.”
Our experience in the classroom and extensive research with RTI experts have led us to the following definition:
While this definition also leaves room to flesh out more details—which we will do throughout this paper—we feel it aids in understanding RTI by stressing two points:
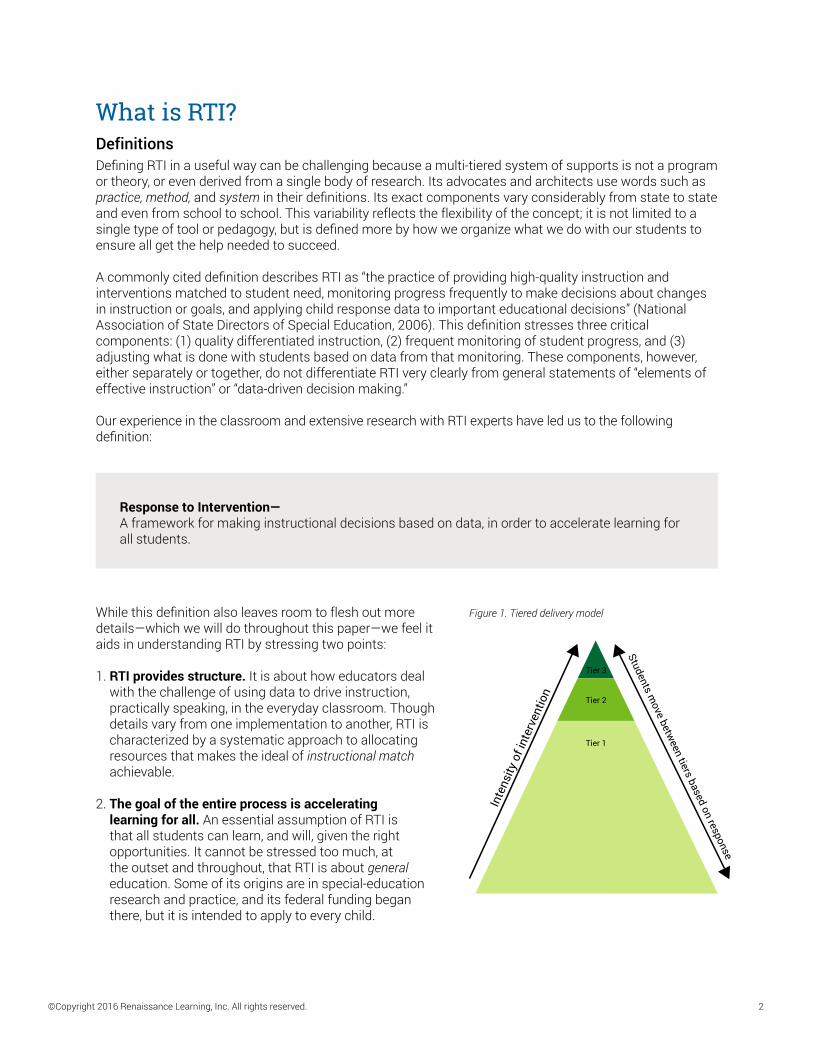
1. RTI provides structure. It is about how educators deal with the challenge of using data to drive instruction, practically speaking, in the everyday classroom. Though details vary from one implementation to another, RTI is characterized by a systematic approach to allocating resources that makes the ideal of instructional match achievable.
2. The goal of the entire process is accelerating learning for all. An essential assumption of RTI is that all students can learn, and will, given the right opportunities. It cannot be stressed too much, at the outset and throughout, that RTI is about general education. Some of its origins are in special-education research and practice, and its federal funding began there, but it is intended to apply to every child.
Response to Intervention—A framework for making instructional decisions based on data, in order to accelerate learning for all students.
Inte
nsity
of i
nter
vent
ion
Students move betw
een tiers based on response
Tier 3
Tier 2
Tier 1
Figure 1. Tiered delivery model
©Copyright 2016 Renaissance Learning, Inc. All rights reserved. 2

©Copyright 2016 Renaissance Learning, Inc. All rights reserved. 3
There are two very specific concepts generally associated with descriptions of RTI, one of which is intrinsic to it and helpful in understanding it, and the other not so. These concepts are the multi-tiered delivery model and curriculum-based measurements (CBMs), respectively.
The multi-tiered delivery modelThe “tiered” model (see figure 1) is central to RTI. Each level represents a grouping of students whose differing needs are met with more intensive (sometimes different) instructional approaches.
Tier 1, the base or largest level, represents the majority of students, largely served by the core instructional program, which is monitored for effectiveness. Ideally, at least 80% of students will experience success with instruction provided at Tier 1. Even within the core, however, instruction should be differentiated and personalized as much as possible to produce the best results for higher and lower achieving students.
Tier 2 represents a smaller grouping of students who may require additional help—interventions—in addition to (though not replacing) the core, to achieve the learning rate necessary to meet academic benchmarks. This tier should represent no more than 10–15% of students. Tier 2 interventions are commonly called strategic, targeted, or supplemental. They may or may not be different from the core, but they are always more. Generally, students in Tier 2 receive standard protocol interventions—selected evidence-based programs delivered in small groups. For example, if the core program provides for 30 minutes per day working math problems aligned to standards, students in Tier 2 might receive 45 minutes with additional coaching available.
Tier 3 represents a still smaller group who need even more assistance—intensive interventions—to achieve the same goals. This tier is meant to include perhaps 5–10% of students. Tier 3 interventions are generally individualized, though whether they are totally different from the core program or further extensions of it depends on the outcome of the problem-solving process (discussed in the What makes RTI different section, p. 5).
As we will see in more detail later, this concept of tiers or levels is a very important piece of what makes RTI unique. But two points should be kept in mind. One is that the definitions, and even the number, of tiers can vary. The tiers generally differ more in degree than kind—there can be interventions in Tier 1, for example; and core instruction is retained, not replaced, in all tiers. At least one state prefers to illustrate the tiers as a continuum rather than separate layers (Kansas: http://www.kansasmtss.org/index.htm) to emphasize that the important point is to create a structure for resource allocation, not just to create categories.
Which leads to the other point to bear in mind: the tiers represent actions, not classifications. The tiers, and groups of students who will receive common interventions, are achievement groupings, not the "ability" groupings of years gone by. There is no such thing as a Tier 2 student; there are students who are, at a given time and in a given subject, receiving Tier 2 interventions. The same applies to Tier 1 and Tier 3. None of these tiers—generally, not even Tier 3—is “special ed.” Students move between the tiers during the course of the year, in both directions, as indicated by assessment data. The goal of the whole structure is to end the year with the vast majority of students—80% or more—performing to benchmark standards within the core instructional program.
So the point of RTI is not to identify which students are in the center of a standard normal distribution curve and which ones are relegated to the “tail” of low performers. As depicted in figure 2 (next page), the point of RTI is to move the curve and accelerate learning for all students.
The point of RTI is to move the curve and accelerate learning for all students.

©Copyright 2016 Renaissance Learning, Inc. All rights reserved. 3
©Copyright 2016 Renaissance Learning, Inc. All rights reserved. 4
Figure 2. Goal of Response to Intervention
The question of CBMRTI is a framework for using data efficiently. It is not a particular type of assessment. While assessments known as curriculum-based measurements are often associated with RTI, CBM and RTI are not synonyms. There are other sources of data that complement, and often replace, CBMs as the primary data source.
The goal of RTI is not to use CBMs—rather, it is to generate high-quality data and use them to guide important educational decisions. Computer-based assessments, such as Renaissance Star Assessments®, generate a broad range of data using less teacher time, therefore providing more thorough and detailed data to guide important instructional decisions. For a more detailed comparison between conventional paper-based CBMs and computer-based assessment, see Curriculum-based measurement—And alternatives, page 19.
History of RTISome of the techniques used in what is now called RTI go back more than 30 years. In the 1970s and ’80s, researchers such as Stanley Deno and Phyllis Mirkin (1977) found that short, frequent assessments helped manage special-education students’ Individual Education Plans (IEPs). Around the same time, Benjamin Bloom’s (1980) “mastery learning” experiments demonstrated that using formative assessments as a basis to modify curriculum and instruction improved average student performance dramatically—in effect, shifting the entire distribution curve in a positive direction (similar to what is shown in figure 2 above). Black and Wiliam’s 1998 meta-analysis further documented how using assessment results to set goals and determine interventions improves performance and is particularly effective in reducing achievement gaps between subgroups. Other researchers during the ’90s, in Minnesota, Iowa, Texas, and elsewhere, demonstrated that lower achieving students were less likely to require special-education referrals, or remained in special education less time, when these techniques were applied systemwide (Bollman, Silberglitt, & Gibbons, 2007; Marston, Muyskens, Lau, & Canter, 2003).
The three-tier structure originated in the ’90s with researchers like Sugai and Horner (1994) seeking ways to deal with behavioral problems in general-education settings. (There is a parallel structure for behavior interventions that usually accompanies the academic RTI model, but this paper focuses strictly on the academic.) The initials RTI may have been first used by Gresham in 1991 in the sense of “resistance to intervention,” but it was not long before the positive results from continuous measurement of outcomes led
MinimumProficiency
MinimumProficiency
Identify those studentslikely to struggle
Intervene quickly to minimizethe number of students
not meeting benchmarks
Low
Achievement Achievement
To Go From Here To Here
High Low High
Adapted from: Tilly, W. D., III. (2007, January). Response to intervention on the ground: Diagnosing the learning enabled. Presentation to Alaska Department of Education and Early Development Winter Education Conference, Informing Instruction: Improving Achievement, Johnston, IA.
CBM and RTI are not synonyms.

©Copyright 2016 Renaissance Learning, Inc. All rights reserved. 5
to the positive focus on “response to instruction” or “response to intervention.”
It became clear to be most useful in identifying and addressing academic problems, measurement should not focus only on the level of student achievement versus expectation—as in the old discrepancy model based on I.Q. tests to define special-education students. Instead, a dual-discrepancy model developed (Fuchs, 2003), measuring both the level of achievement (compared to expected achievement based on many factors) and also the rate of student growth (how that rate compares to the growth required to hit benchmarks in a timely fashion), as well as how both the level and the rate respond to instruction or intervention. This dual-discrepancy model and the growing success of tiered intervention techniques began to attract federal funding in the 1997 amendments to the Individuals with Disabilities Act (IDEA).
Entering the new millennium, emphasis on research-based interventions and improving results for all students increased with No Child Left Behind. The dual-discrepancy model was formally incorporated into the revised Individuals with Disabilities Education Improvement Act of 2004 (IDEIA) that went into effect in 2005. This act provides that school systems may use a percentage of IDEIA Part B funds for programs using a problem-solving approach (a key concept of RTI) and allows local educational agencies to “use a process that determines if the child responds to scientific, research-based intervention” in dealing with lower achieving students. In this statement, the word responds equates to the concept of RTI (Batsche, 2006).
The power of dual-discrepancy thinking and tiered interventions has led to their becoming firmly established as general-education models. Many states have RTI initiatives going back several years, from exploratory pilot programs to full-fledged mandates. In applying this approach to schoolwide improvement, RTI initiatives bring together many well-established and proven elements: the problem-solving model (Minneapolis Public Schools, 2001); using formative assessment and time-series graphing to improve outcomes (Fuchs & Fuchs, 1986; Kavale & Forness, 1999); brain research showing the value of early direct intervention (Papanicolaou et al., 2003); use of professional learning communities (Batsche et al., 2008); differentiated instruction (Tomlinson, 1999); and academic engaged time (AET) (Berliner, 1991; Karweit, 1982).
RTI, as mentioned earlier, is not new research or new theory. It is a framework, 30 years in the making, for systematically determining how well instruction is working for each child or group of children and making adjustments to accelerate learning for all.
What makes RTI differentThe consistency of RTI with much accepted research and practice does not mean there is nothing new about RTI. For example, RTI’s emphasis on data recalls data-driven decision making, which has become a standard part of the educational vocabulary during the past decade. But simply testing frequently and looking at data do not automatically constitute RTI. RTI provides a specific framework for what data should be considered, when, on what children,
Key elements of RTI • Emphasis on resource allocation• Tier 2• Progress monitoring• Problem solving• Fidelity of instruction
RTI is not new research or new theory. It is a framework for systematically determining how well instruction is working and making adjustments to accelerate learning for all.
©Copyright 2016 Renaissance Learning, Inc. All rights reserved. 5
©Copyright 2016 Renaissance Learning, Inc. All rights reserved. 6
and with what resulting actions. And, as has been stressed, it provides a model for allocating resources where they will do the most good, according to those same data (Burns & Gibbons, 2008). Adopting an RTI framework will require adjustments even for schools that are already data driven, in most, if not all, cases.
The good news is, quite often, existing assessment and data systems can be adapted to an RTI model with judicious adjustments, additions, and professional development—so that required investments of money and time can be incremental, not completely new, expenditures. Resources being limited in any school system, making such a cost-effective conversion of existing systems should be a key consideration in RTI planning.
The following is a summary of key elements that distinguish RTI from other change models—aside from the many attributes they have in common.
• Emphasis on resource allocation. As described previously, the three-tier (or more) model provides a convenient way of sorting out students who may require more intensive intervention and whose performance should be monitored more closely. The biggest benefit to this way of thinking is improvement in service efficiency (Batsche, 2006). While the results of all students should be monitored regularly, and instruction and practice modified accordingly, some students have greater needs than others, and the tiered model places more focus on those who need the most help at any given time.
• Tier 2. The middle tier (or tiers) is particularly important in distinguishing RTI as a general-education model. Without a middle level, the analysis could all too easily fall back into a special ed mode, “creating the current schism between special education and regular education services; have and have not” (Tilly, 2003). The middle tier emphasizes that these are general-education students who are at risk because their level and growth rate will not produce satisfactory results without additional help, and encourages a focus on intensifying the intervention-assessment-adjustment process to see what it takes to get them back on track. (Note: In most RTI models, even Tier 3 is not special education but general education with more intensive interventions—though special-education referral is a possible outcome of Tier 3, if the intensive interventions still do not produce the desired results.) Dealing with the majority of underachieving students with small-group, shared interventions in Tier 2 also minimizes the number of individual interventions—which are immensely resource intense.
• Progress monitoring. While multiple types of assessment play parts in RTI, progress-monitoring assessments play the biggest role in management of the tier system. Progress-monitoring measures are short, efficient, frequent assessments to track growth rate as well as level—the dual-discrepancy model explained on page 5. For example, progress monitoring for a student who is behind goal in reading due to insufficient vocabulary might track his rate of vocabulary acquisition in terms of number of new words mastered per week. Progress monitoring increases in frequency as the need for intervention increases—though the ideal system provides for continuous progress monitoring so that robust series of data are always available. Continuous progress monitoring is practical only with the use of computer technology. An authoritative definition of RTI calls for “using learning rate over time and level of performance” by means of an “integrated data collection/assessment system” (Batsche et al., 2008). For more details on integrated data systems, see Nine principles of a successful RTI program, page 12.
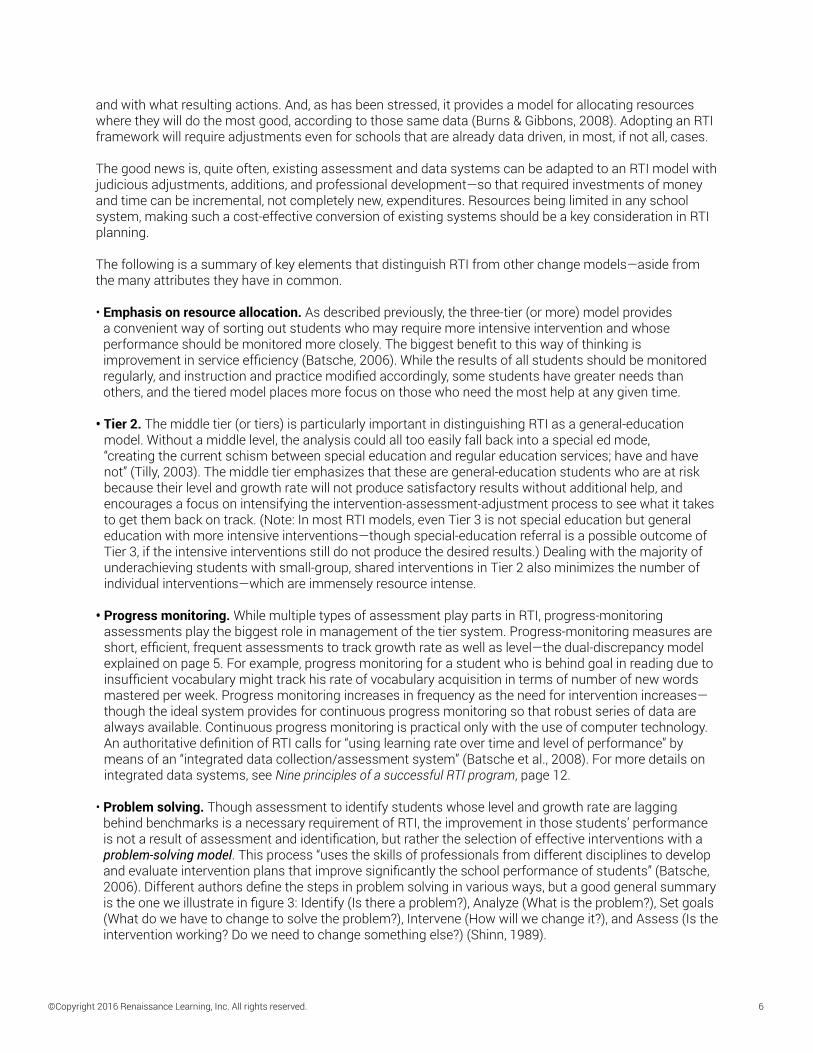
• Problem solving. Though assessment to identify students whose level and growth rate are lagging behind benchmarks is a necessary requirement of RTI, the improvement in those students’ performance is not a result of assessment and identification, but rather the selection of effective interventions with a problem-solving model. This process “uses the skills of professionals from different disciplines to develop and evaluate intervention plans that improve significantly the school performance of students” (Batsche, 2006). Different authors define the steps in problem solving in various ways, but a good general summary is the one we illustrate in figure 3: Identify (Is there a problem?), Analyze (What is the problem?), Set goals (What do we have to change to solve the problem?), Intervene (How will we change it?), and Assess (Is the intervention working? Do we need to change something else?) (Shinn, 1989).
©Copyright 2016 Renaissance Learning, Inc. All rights reserved. 7
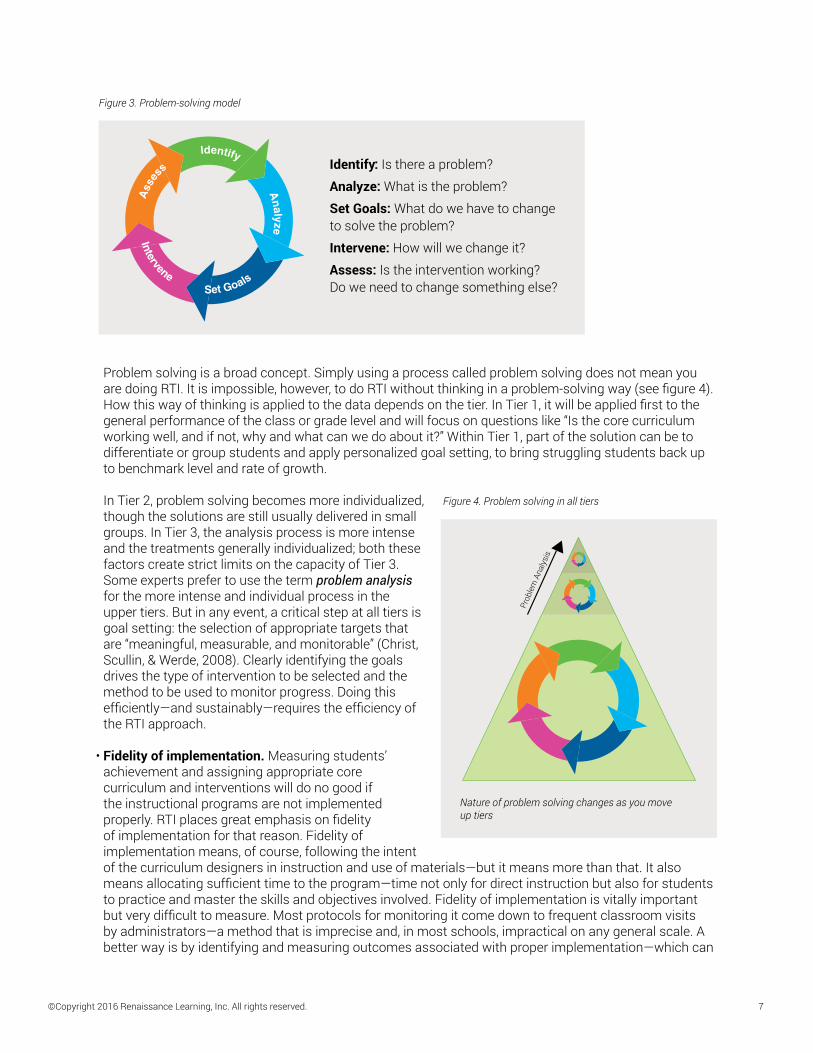
Problem solving is a broad concept. Simply using a process called problem solving does not mean you are doing RTI. It is impossible, however, to do RTI without thinking in a problem-solving way (see figure 4). How this way of thinking is applied to the data depends on the tier. In Tier 1, it will be applied first to the general performance of the class or grade level and will focus on questions like “Is the core curriculum working well, and if not, why and what can we do about it?” Within Tier 1, part of the solution can be to differentiate or group students and apply personalized goal setting, to bring struggling students back up to benchmark level and rate of growth. In Tier 2, problem solving becomes more individualized, though the solutions are still usually delivered in small groups. In Tier 3, the analysis process is more intense and the treatments generally individualized; both these factors create strict limits on the capacity of Tier 3. Some experts prefer to use the term problem analysis for the more intense and individual process in the upper tiers. But in any event, a critical step at all tiers is goal setting: the selection of appropriate targets that are “meaningful, measurable, and monitorable” (Christ, Scullin, & Werde, 2008). Clearly identifying the goals drives the type of intervention to be selected and the method to be used to monitor progress. Doing this efficiently—and sustainably—requires the efficiency of the RTI approach.
• Fidelity of implementation. Measuring students’ achievement and assigning appropriate core curriculum and interventions will do no good if the instructional programs are not implemented properly. RTI places great emphasis on fidelity of implementation for that reason. Fidelity of implementation means, of course, following the intent of the curriculum designers in instruction and use of materials—but it means more than that. It also means allocating sufficient time to the program —time not only for direct instruction but also for students to practice and master the skills and objectives involved. Fidelity of implementation is vitally important but very difficult to measure. Most protocols for monitoring it come down to frequent classroom visits by administrators—a method that is imprecise and, in most schools, impractical on any general scale. A better way is by identifying and measuring outcomes associated with proper implementation—which can
Figure 4. Problem solving in all tiers
Prob
lem
Ana
lysis
Nature of problem solving changes as you move up tiers
Identify: Is there a problem?
Analyze: What is the problem?
Set Goals: What do we have to change to solve the problem?
Intervene: How will we change it?
Assess: Is the intervention working? Do we need to change something else?
Identify An
alyze
Ass
ess
Intervene Set Goals
Figure 3. Problem-solving model

©Copyright 2016 Renaissance Learning, Inc. All rights reserved. 7
©Copyright 2016 Renaissance Learning, Inc. All rights reserved. 8
be done with proper systems for “practice progress monitoring,” as described on page 15, and tools such as an informative dashboard. Another key element to achieving fidelity of implementation is professional development (see p. 17).
RTI with high-achieving studentsImportant as it is to bring low-achieving students up to benchmarks, RTI planners should not neglect high-achieving students. Indeed, the same principles of efficiently allocating resources to groups of students who could benefit from extra instruction can be applied to accelerating the learning of gifted and talented students.
At some point in implementation, if not at the very outset, RTI schools should identify a cut score above which students will be eligible for enrichment or supplemental learning activities that build on, but go beyond, the core program. This is not a departure from, but rather a different application of, the principles of RTI.
For example, just as standard protocol group interventions are usually the first approach to helping students in Tier 2, the school should identify programs gifted and talented students will be assigned to exercise their abilities. Possibilities include additional reading of higher level books (personalized to each student’s reading level), writing responses to challenging prompts connected with core programs, advanced math problems, and various cooperative projects. The key element here, as with intervention for below-benchmark students, is providing additional academic engaged time (for more on AET, see p. 13). Any of the approaches to scheduling outlined in Implementing RTI–An overview ( p. 24) provide time slots during which high-achieving students can engage in challenging activities. The acceleration of learning by these students can be tracked by the same periodic screening the RTI team uses to track remediations. Daily or weekly progress of reading and math practice can easily be monitored using practice progress-monitoring tools.
©Copyright 2016 Renaissance Learning, Inc. All rights reserved. 9
The challenges of RTIWe have reviewed the conceptual basis, history, research, and essential elements of RTI, and why it holds out such promise for improving education. But like all large-scale initiatives, it is not without risk and cost. The section following this one will outline nine principles to minimize these risks and maximize chances of success. But first, we must take a candid look at the potential downsides.
Systemic changeRTI, or a multi-tiered system of supports, is “a different way of doing business” (Batsche, 2006). Regularly identifying students who can succeed with extra assistance, but may not succeed without it, imposes an obligation to provide that extra assistance in a methodical, effective manner. Routines must change, schedules must change, and often the culture within a school must change. More than anything else, RTI requires—and also helps enable—focus. Obviously, RTI schools focus on the students who need extra assistance the most. But schools implementing RTI find they also must focus their curricula on the most important activities and objectives. And to succeed, instruction on those objectives must be backed up with sufficient time for students to practice critical skills. Both of these points will be expanded upon in the next section, Nine principles of a successful RTI program.
Successful RTI implementation means recognizing that it will not be easy or automatic. Time is the biggest issue. Time must be found to review the data to make the tiered model work. Time must be found in the school day for additional intervention. Resources must be found to deliver the interventions. Because bringing in more resources is usually not an option, they must be found within. That can mean assigning instructional duties to personnel who have the necessary expertise but may not usually think of themselves as "teachers." It probably means identifying activities currently occupying staff members’ time that can be reduced or eliminated to produce additional instructional time. It certainly involves a gradual but significant change in culture toward more collaborative work in instructional teams, regular examination of specific types of data, and acceptance of data as signals for needed interventions, not occasions to blame the teacher. Especially, it means identifying integrated data systems that are easy for teachers to use and that can be used as reliable, time-saving tools in RTI assessment.
Implementing RTI, like any systemic change, also takes time—multiple years. That means it needs a commitment to find ways to do what is necessary and to stay the course until it is completed. But the goal is worth the effort: accelerating learning for all students.
Cost of informationAs we have seen, RTI requires regular assessments, increasing in frequency, as students move through the tiers. What is the cost of those assessments? According to Gersten et al. (2008),
Challenges of RTI • Systemic change• Cost of information• Usefulness of information
Successful RTI implementation means identifying integrated data systems that are easy for teachers to use and that can be used as reliable, time-saving tools in RTI assessment.

©Copyright 2016 Renaissance Learning, Inc. All rights reserved. 9
©Copyright 2016 Renaissance Learning, Inc. All rights reserved. 10
Costs in both time and personnel should also be considered when selecting screening measures. Administering additional measures requires additional staff time and may displace instruction. Moreover, interpreting multiple indices can be a complex and time-consuming task. Schools should consider these factors when selecting the number and type of screening measures. (p. 14)
Too often, schools—like other institutions—underestimate costs by considering only the initial cash outlay for a program or system. However, solutions that seem initially inexpensive but generate long-term inefficiencies often wind up far more expensive in the long run. Two elements must be calculated: the total cost of ownership, and the value generated by that total cost. In the case of assessment systems, these factors constitute a “return on information” expressed by the formula Value = I/C shown in figure 5.
Figure 5. The value and cost of information
Taking the cost element first, suppose an assessment is distributed at no charge but requires paper administration and therefore requires copying of test instruments, scoring sheets, record sheets, and so forth. The cost of those paper copies, multiplied by the number of times that assessment will be delivered during the school year, adds to the total cost of ownership. Even more significantly, if the assessment is teacher administered, the cost of that teacher’s time must be considered. A “one-minute probe” manually administered to a single student, in reality, may occupy as many as 10 minutes, on average, of the teacher’s time per student per administration (Laurits R. Christensen Associates, 2010), between preparing the materials, calling on the student, explaining the assessment, administering the probe, recording and entering the results, and returning to the teacher’s other duties. Using the average 10-minute calculation, even if only three students in the classroom require testing, that may be half an hour lost from instruction every time the test is administered (at least weekly), multiplied by the number of measures that need to be taken. Next to the cost of the intervention itself, the biggest cost of RTI is often teacher time diverted from instruction to assessment.
This cost then must be compared to the value generated. If the 10 minutes of testing produce only one data point on one student, the return on the teacher’s time is low. If the same amount of time can generate multiple data points, and/or can be applied to multiple students at the same time, the return on that same amount of time increases exponentially. A broad-based computerized assessment that is administered simultaneously to a whole classroom, and automatically records results in a database, provides far more information, a much higher rate of return on the teacher’s time, and therefore a much lower cost per piece of information—even if the initial cost of the system is higher than the “free” assessment.
If the assessment software can be used for multiple types of assessment (e.g., both screening and diagnostic), the cost-effectiveness goes up still more. This is another advantage of computer-based tests like the Star Assessments.
Usefulness of informationMaking regular instructional decisions based on data requires that the data be meaningful. This means the data must be quickly understood, provide useful indicators of progress, and, especially, be psychometrically reliable.
I=
CVALUEof an assessment
Information—Amount of reliable & useful information produced by assessment
Cost—Total resources required, including price of acquisition; materials per administration; teacher time to administer, score, record, and interpret results; & time diverted from instruction

©Copyright 2016 Renaissance Learning, Inc. All rights reserved. 11
For the purposes of efficient understanding and use of data, RTI implementations commonly establish cut scores that provide simple guidelines as to where a student’s assessment probably places him or her— in Tier 1 or an intervention tier, or possibly on a borderline that requires differentiation within Tier 1. Based on a review of proficiency cut scores from several state assessments and guidance from RTI experts, Renaissance uses the 40th percentile as the default screening benchmark—the minimum expected student performance or achievement level, below which students require some form of intervention to accelerate their growth and bring them into benchmark range. Most experts and state assessments consider performance around the 40th to 50th percentile to be a proxy for “working at grade level.” The 40th percentile is the software default and can be altered by educators to fit local needs. However, experts caution against lowering the benchmark below the 40th percentile.
Cut scores and benchmarks do not replace professional judgment; they inform it. But they are very helpful in achieving the efficiency required for making RTI work. (For more information, see Implementing RTI— An overview, p. 24.)
Assessments used in RTI also need to be broad enough to cover key instructional objectives. An assessment that provides data on all the major domains of reading, for instance, is more valuable than one that provides only a single measure at a time (e.g., oral reading fluency). And while many RTI implementations initially focus solely on reading, math is usually added within a year or two, so it is wise to select a family of assessments that can measure and track math objectives as well as reading.
Finally, the assessments selected must be statistically reliable in repeated administrations with a given child and sensitive to small changes in performance throughout the year. This issue will be considered in more detail in Curriculum-based measurement—And alternatives, page 19.
With meaningful, efficient assessments, RTI is powerful. Simply increasing testing, or adding more tests, generally does more harm than good.
With meaningful, efficient assessments, RTI is powerful. Simply increasing testing, or adding more tests, generally does more harm than good.
©Copyright 2016 Renaissance Learning, Inc. All rights reserved. 11
©Copyright 2016 Renaissance Learning, Inc. All rights reserved. 12
Nine principles of a successful RTI programThe discussion and research cited on the previous pages have probably made the case that RTI presents a great deal of promise for improving schools, but also potential risk and expense without proper forethought to the practicalities of implementation. Based on more than 25 years of experience with the use of data in the classroom, Renaissance recommends the following nine principles for successful implementation, which have been developed through extensive consultation with leading experts on Response to Intervention.
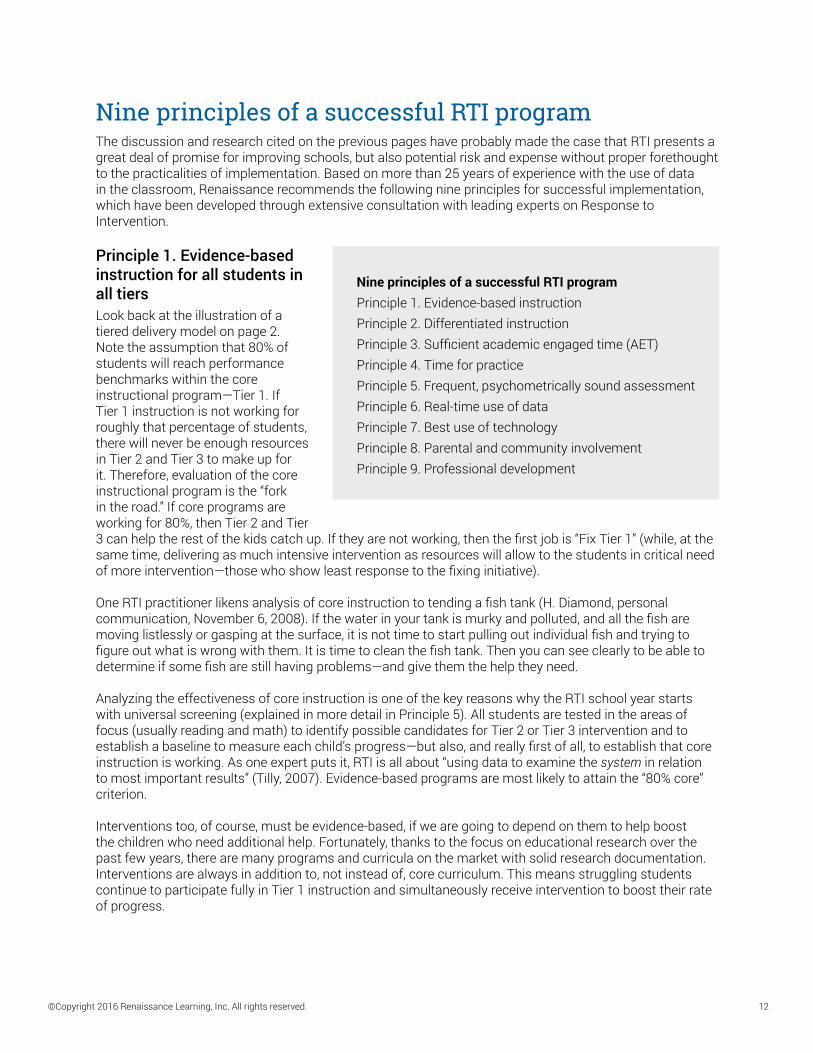
Principle 1. Evidence-based instruction for all students in all tiers Look back at the illustration of a tiered delivery model on page 2. Note the assumption that 80% of students will reach performance benchmarks within the core instructional program—Tier 1. If Tier 1 instruction is not working for roughly that percentage of students, there will never be enough resources in Tier 2 and Tier 3 to make up for it. Therefore, evaluation of the core instructional program is the “fork in the road.” If core programs are working for 80%, then Tier 2 and Tier 3 can help the rest of the kids catch up. If they are not working, then the first job is “Fix Tier 1” (while, at the same time, delivering as much intensive intervention as resources will allow to the students in critical need of more intervention—those who show least response to the fixing initiative).
One RTI practitioner likens analysis of core instruction to tending a fish tank (H. Diamond, personal communication, November 6, 2008). If the water in your tank is murky and polluted, and all the fish are moving listlessly or gasping at the surface, it is not time to start pulling out individual fish and trying to figure out what is wrong with them. It is time to clean the fish tank. Then you can see clearly to be able to determine if some fish are still having problems—and give them the help they need.
Analyzing the effectiveness of core instruction is one of the key reasons why the RTI school year starts with universal screening (explained in more detail in Principle 5). All students are tested in the areas of focus (usually reading and math) to identify possible candidates for Tier 2 or Tier 3 intervention and to establish a baseline to measure each child’s progress—but also, and really first of all, to establish that core instruction is working. As one expert puts it, RTI is all about “using data to examine the system in relation to most important results” (Tilly, 2007). Evidence-based programs are most likely to attain the “80% core” criterion.
Interventions too, of course, must be evidence-based, if we are going to depend on them to help boost the children who need additional help. Fortunately, thanks to the focus on educational research over the past few years, there are many programs and curricula on the market with solid research documentation. Interventions are always in addition to, not instead of, core curriculum. This means struggling students continue to participate fully in Tier 1 instruction and simultaneously receive intervention to boost their rate of progress.
Nine principles of a successful RTI programPrinciple 1. Evidence-based instructionPrinciple 2. Differentiated instructionPrinciple 3. Sufficient academic engaged time (AET)Principle 4. Time for practicePrinciple 5. Frequent, psychometrically sound assessmentPrinciple 6. Real-time use of dataPrinciple 7. Best use of technologyPrinciple 8. Parental and community involvementPrinciple 9. Professional development

©Copyright 2016 Renaissance Learning, Inc. All rights reserved. 13
Principle 2. Differentiated instruction at all tiers, with personalized goal setting that allows intervention to be delivered immediately (instead of “waiting to fail”)The term differentiated instruction here does not imply any specific instructional methodology or model that may be taught or published under the same label. It simply means fitting the material to the child. Even with evidence-based instruction, it is never true that “one size fits all.” As one researcher puts it, “There is no guarantee that an evidence-based instructional approach will work for a given student. This is precisely why progress monitoring is so critical” (Ysseldyke, 2008). And any instructional approach works best if assignments are geared to the student’s level and interests, not to mention focused on educational objectives the student is ready to learn. For example, students in classrooms using Renaissance Accelerated Reader® will practice reading skills with books at individualized reading levels and self-selected for interest, while in Renaissance Accelerated Math®, objectives can be automatically assigned based on each student’s performance on daily practice work.
Differentiated instruction in RTI should not be limited to students formally designated to receive interventions—it should apply within the core (Tier 1) classroom as well. It is true that differentiated instruction is difficult—because it inherently implies setting, and monitoring, individual goals. Only technology can make it a reality,by processing performance data on which to base differentiated assignments, helping the teacher make those assignments, and automatically generating a flow of data to the teacher, student, and parent(s) that makes it easy to tell that individual goals are being met.
Principle 3. Sufficient academic engaged time (AET), increasing with the level of intervention AET predicts achievement better than any other variable (Batsche, 2007; Gettinger & Stoiber, 1999). The first thing that changes as students move up in the tiers—or even qualify for supplemental differentiation in Tier 1—is time to learn. Just as an example, if core daily time in a key subject is 90 minutes, that time might increase by 30 minutes in Tier 2 and perhaps double to 180 minutes in Tier 3 (Batsche, 2006). The actual times will vary depending on school circumstances, of course, but the key point is that if a student is progressing with existing instruction, increasing AET may be the only change needed to accelerate progress.
But simply increasing time spent in class does not automatically increase AET. Time studies of classroom activities regularly demonstrate that up to 80% of time is often consumed by administrative chores, testing, or just transitioning from task to task (Marzano, 2003), so it is vital to keep non-learning time to a minimum. One way to do that is to automate assessments and record-keeping using technology (e.g., computer-administered rather than teacher-administered tests). Technology can also help by directly measuring AET so it can be monitored and increased as necessary. Accelerated Reader and Accelerated Math, for instance, use assessments of reading practice and math objectives to estimate how much time students have spent actually reading authentic literature at appropriate instructional levels (Treptow, Burns, & McComas, 2007) and working math problems keyed to personalized objectives.
It is vital to keep non-learning time to a minimum. One way to do that is to automate assessments and record-keeping using technology.

©Copyright 2016 Renaissance Learning, Inc. All rights reserved. 13
©Copyright 2016 Renaissance Learning, Inc. All rights reserved. 14
Principle 4. Time for practice of key skills, personalized and with feedback to student and teacher Research shows that AET is not limited to time spent in direct instruction (Berliner, 1991). Direct instruction is one element of AET, but equally important is practice time to build fluency of math operations, increase exposure to vocabulary through reading, and so forth (Szadokierski & Burns, 2008). One way to ensure hat such practice is occurring for a sufficient amount of time is to provide automatic feedback to both the teacher and student—and that means provided by technology.
Such technology can also provide a type of progress monitoring that has been somewhat overlooked in RTI research. Perhaps because progress-monitoring assessments often originated in special-education evaluations, these probes usually measure outcomes such as oral reading fluency (a surrogate for, though not a direct measurement of, reading comprehension). But it is also extremely valuable to measure the underlying tasks that contribute to growth in the skills to be measured by the outcome measurements, and to gauge the student’s progress toward personal goals. We might call such task measurement (or mastery measurement) “practice progress monitoring.” With appropriate technology—such as Accelerated Reader, Accelerated Math, or Renaissance MathFacts in a Flash®—practice progress monitoring, and the monitoring of progress toward personal goals, can take place daily and provide literally continuous data to show how each student is progressing before progress is measured by even weekly progress monitoring.
Principle 5. Frequent, psychometrically sound assessment at all three levels: screening, progress monitoring, and diagnosticThe What is RTI? section recounted the key role assessment plays in RTI. As opposed to summative assessments like unit tests or end-of-year state tests, the three kinds of interim assessments used in RTI provide data that help inform and improve instruction, and are therefore more formative:
• Screening. All students are tested on the key skills that drive benchmark performance. Often called universal screening or sometimes benchmark assessment, these tests are always administered as close to the beginning of the school year as possible, then usually repeated two or three times throughout the year to chart progress. The initial screening matches instruction to the skill development of each learner. It serves as a check on your Tier 1 program, provides a baseline against which to measure growth, and identifies students who may need differentiated or Tier 2 instruction (Tilly, 2007). For ease in interpreting screening results, cut scores are often identified to help determine whether a student’s results place him or her at risk, or predict if a student will make sufficient growth to meet a benchmark by the end of the year. Such cut scores do not replace educator judgment; instead they provide educators additional information with which to make decisions while saving classroom time and ensuring uniformity of treatment throughout the school. See Implementing RTI—An overview, page 24, for more discussion of approaches to determining cut scores.
Three types of assessments used in RTI provide data to inform and improve instruction:• Screening• Progress monitoring• Diagnostic If a single assessment can serve all three purposes, it saves time and expense.
With appropriate technology, “practice progress monitoring” can provide literally continuous data to show how each student is progressing.

©Copyright 2016 Renaissance Learning, Inc. All rights reserved. 15
Because screening is done with all students, it should be computerized to keep from impinging on AET. Screening tests should also measure the critical skills, be repeatable and easy to score, and, especially, provide results from which statistically valid inferences can be drawn. There can be added value to using norm-referenced tests as screeners, so long as they are tests designed for repeated classroom use (such as Star Assessments) rather than end-of-year summative assessments.
• Progress monitoring. Between screenings, progress-monitoring assessments track growth in any student identified for differentiation or intervention. The more intense the intervention, the more frequently progress should be monitored. The most effective monitoring is daily, achievable through daily practice progress monitoring, described in Principle 4 (including monitoring progress toward personal goals). Practice progress monitoring, because it is universal, can provide feedback about all Tier 1 students as well as students designated for interventions. This feedback can not only help catch the few lagging students who might have slipped past identification in screening, but also provide regular information as to the effectiveness of Tier 1 core programs. For intervention students, the combination of practice progress monitoring with outcome measurements provides a more robust student profile for problem solving. Here is a key point: if a progress-monitoring assessment does not provide information as to what students need to learn and how to help them learn it, that progress- monitoring tool is not a formative assessment and will not provide the best educational value.
• Diagnostic use. When students are identified as needing intervention, especially in Tier 2 or Tier 3, the interventions need to target specific deficiencies to be improved. This is not diagnosis in a clinical sense, but identification of academic areas of weakness. For instance, if the student’s reading comprehension is below benchmark, is the problem with decoding or vocabulary? This type of analysis can be used to group students for Tier 2 standard protocol interventions (Burns & Gibbons, 2008) and becomes most intensive in Tier 3 (Howell, Patton, & Deiotte, 2008) as the student gets closer to possible special-education referral, when documenting the basis for instructional conclusions becomes important. Nevertheless, it is more a process than a product, with multiple sources of information used. If the assessments used in screening and progress monitoring can report on a variety of skills (rather than a single outcome as in most conventional, paper-based CBM probes), thereby providing diagnostic information, obviously it can save considerable time and expense. It is essential that any assessment used in RTI be psychometrically sound. This means the test must be valid (measure the attribute we really want to predict, such as reading comprehension) and reliable (really measure differences in performance, between students and between administrations to the same student). There is a certain amount of random variation (standard error) in any test. Assessments should be selected based on published reliability data. (Such data are published for Renaissance assessments.) Also, use of statistical tools such as item response theory in test development can help ensure that sequential administrations of a test—even through different forms of the test—are equivalent and really measuring the growth we are trying to measure. Conventional paper-based measures have been criticized in recent research because their multiple forms are not really comparable. See Curriculum-based measurement—And alternatives, page 19, for more on these points.
Principle 6. Real-time use of data to make decisions for instruction and interventions Use of data is a key part of RTI. Researchers point out the need “to understand data-based decision making and the set of rules on which it is based, and be able to apply those rules in the interpretation of the data” (Kurns & Tilly, 2008). But data that require a long time to assemble, record, and interpret do little good. For example, the earlier in the year that educators start using data from universal screening to help students who need differentiated instruction, the better the odds that those students can catch up (Wright, 2007). A manually administered test makes such quick response very difficult, if not impossible. And within the tiers, being able to fine-tune on a weekly—or even daily—basis vastly improves differentiation and, therefore, the probability of success.
©Copyright 2016 Renaissance Learning, Inc. All rights reserved. 15
©Copyright 2016 Renaissance Learning, Inc. All rights reserved. 16
In the previous section, The challenges of RTI, we stressed that time is the biggest hurdle in RTI implementation (and, indeed, in any school-improvement approach). Data generation and access must not be allowed to become a “time roadblock” in RTI, or the reform will be neither scalable nor sustainable. Based on our more than 25 years of experience with data in classrooms, supplying data regularly and in a form usable for efficient decision making requires technology.
Principle 7. Best use of technology: Using computers for efficient assessment, data access, and documentation, with usage and data integrated across all tiers The previous points, and many that preceded them, add up to one clear requirement for successful RTI: computer technology must play an integral role. Research clearly states the importance of “an integrated data collection/assessment system to inform decisions at each tier of service delivery” (Batsche, 2006). This clearly means a system that operates in the classroom as well as in the school and district offices—and delivers performance data to teachers on demand in a readily usable form.
Computers are necessary for efficiency in universal screening because of the number of students who must be screened at one time; in progress monitoring, because of the frequency of testing; and in diagnostic use, because of the need for quick access to all data. Technology will not make instructional decisions nor drive instruction—rather, it will provide the necessary information to the instructional team so that educators can make decisions efficiently and effectively. To cite a conclusion from considerable RTI field work, “In the absence of technology, the data burden becomes unmanageable” (Kurns & Tilly, 2008).
Having a unified database of assessment results can also be extremely valuable when documenting and communicating intervention decisions to parents—a legal requirement of RTI and the next principle we will explore.
Principle 8. Parental and community involvementThere are two key elements to involving the school community—especially parents—in RTI. One is generating overall support for the initiative. The other is garnering parental support of decisions about individual students.
As should be clear from The challenges of RTI section, RTI involves some fundamental changes in school operations. Change can be threatening or encouraging, depending on how it is perceived. So announcement of the principles of RTI and its goals of accelerating learning for all should start at the beginning of the year, with bulletins as the program proceeds. The regularly generated assessment data should provide news of overall progress that you will want to share with the community.
When it comes to individual students who require intervention, involving parents in decisions to move to Tier 2or Tier 3 is at least prudent if not legally required. The exact legal requirements of RTI are not yet clear, but it is clear that documentation and parental notification are required if a special-education determination must eventually be made. In the RTI model provided by IDEIA, documentation would include intervention data on which the determination will be at least partially based (Assistance to States for the Education of Children with Disabilities and Preschool Grants for Children with Disabilities, Final Rule, 2006).
“In the absence of technology, the data burden becomes unmanageable.”
Kurns & Tilly, 2008

©Copyright 2016 Renaissance Learning, Inc. All rights reserved. 17
Because RTI is a general-education model that involves all students, and because it cannot be known in advance which students may be candidates for special education, the time to begin documentation and notifying parents is when intervention starts. Parents should be notified of Tier 1 differentiation or Tier 2 group interventions, invited to meet with the instructional team when individual interventions are discussed, and given ready access to progress-monitoring data as intervention proceeds. A web-based information system, such as Renaissance Home Connect, provides not only access to the data, but also a means to measure and document whether parents have availed themselves of the opportunity to access information on their child. Renaissance Home Connect also helps improve outcomes by involving parents in the student’s personal goals for practice and achievement. Thus, all three stakeholders—student, parents, and teacher—are working toward the same goals with shared understanding and common language.
Principle 9. Professional development Success with RTI, like any educational initiative, requires an effective professional development strategy. For example, the website for the National Center on Student Progress Monitoring states, “Teachers and other practitioners need support in translating progress-monitoring research into easily implemented, usable strategies” (http://www.studentprogress.org/progresmon.asp). Professional development should be job-embedded to provide support as needed throughout the school year. Core topics to consider in planning for RTI professional development include the following:
• Overview of RTI—a general understanding of RTI concepts and goals as well as specific procedures adopted by the school or district
• Delivery of the selected core and intervention instructional programs, with fidelity of implementation• Understanding and using assessment data—intensive training for core staff such as the school RTI
coordinator; more general orientation for all others involved• Understanding and using formative assessments in the classroom• RTI coaching (for the data or RTI coordinator)• Working in RTI learning teams• Differentiating instruction—may include use of curriculum management technology to assign and
track different levels of practice work (e.g., Accelerated Reader and Accelerated Math), setting individual goals, monitoring progress, and using data time effectively
Provision of this professional development should begin well in advance of implementation—at least during the summer prior to initial launch. Implementing RTI—An overview, page 24, sketches out a timetable for applying all these principles to an RTI program.
“Teachers and other practitioners need support in translating progress-monitoring research into easily implemented, usable strategies.”
National Center on
Student Progress Monitoring

©Copyright 2016 Renaissance Learning, Inc. All rights reserved. 17
Implementing RTI in secondary schoolsLike most school-change movements, RTI originated in elementary, and that is where most implementations are still focused. Nonetheless, there are some promising examples of secondary RTI in states such as Illinois, Minnesota, and Pennsylvania, and many other states’ RTI plans include expansion to secondary over time.
Secondary RTI utilizes the same principles of universal screening, prompt tiered intervention, and progress monitoring. The biggest differences are in scheduling, as the “grade-level” approach that works so well in elementary is not appropriate in most secondary schools. Secondary RTI requires the same whole-school planning as elementary, but scheduling is trickier. There are essentially two approaches depending on the type of day schedule a school uses:
• Traditional day schedule (40- to 50-minute periods for individual subjects): The school selects a period during the day—sometimes homeroom period, if it is long enough—during which students can receive additional instruction and/or practice. Usually the subject addressed is reading, but the same approach can work with math. The challenge in this “homeroom” approach is that usually there are insufficient instructional resources available to provide flexible grouping during the period, so the standard protocol intervention must be selected with special care. Software that individualizes practice assignments—reading practice, math problems—can alleviate this problem as well as provide tracking of mastery.
• Block schedule (90-minute periods with multiple teachers): Reading interventions can be scheduled into block classes with one of the teachers managing the Tier 2 activity while the other teachers work with the Tier 1 program on enrichment activities. Most subject areas incorporated into block scheduling approaches lend themselves to reading assignments geared to the content area. Here as with the traditional schedule approach, use of software to individualize assignments and tracking of mastery, providing feedback to student and teacher, is extremely helpful.
• Accelerated Reader, Accelerated Math, and MathFacts in a Flash programs provide content appropriate for all achievement levels through grade 12, and the Renaissance Star Reading® and Renaissance Star Math® assessments provide screening and progress monitoring throughout the secondary grades as well.
©Copyright 2016 Renaissance Learning, Inc. All rights reserved. 18

©Copyright 2016 Renaissance Learning, Inc. All rights reserved. 19
Curriculum-based measurement—And alternativesThere is a common misconception that teacher-administered assessments known as curriculum-based measurement (CBM) are an inherent part of RTI. On the contrary, these paper-based tests neither are required for RTI nor are necessarily the best way to meet the large, continual, and varied data needs of an efficient implementation of a multi-tiered system of supports. This section presents the history of CBMs, new research concerning their limitations, and a modern, technology-enhanced alternative.
Background of CBMCBMs were first introduced in the ’70s through the work of such special-education pioneers as Stanley Deno (Marston, Fuchs, & Deno, 1986), who sought to provide direct feedback to teachers about the effect of their instructional strategies on student learning. CBMs were originally so called because they were based on existing curriculum materials. But researchers soon moved from “curriculum-based” to “curriculum-like” materials (Christ & Ardoin, 2009), recognizing that better-controlled materials could produce more accurate data for decision making. Today’s CBMs share three main characteristics: (1) they are concise measurements of specific skills, (2) they are repeatable at short intervals, and (3) they produce data to track growth over time (Wedl, 2005).
When considering CBMs for use in a full-fledged RTI implementation, the following points should be taken into account:
• There is growing evidence their psychometric usefulness for predicting student outcomes or comparing them over time is highly variable.
• Because they are manually administered one-on-one, and manually scored, they are costly in terms of teacher time in a general-education setting.
• By design, they collect only narrow types of data, so they provide very limited guidance for instruction (Burns, Dean, & Klar, 2004).
Shortcomings of teacher-administered, paper-based CBMsLet's examine these points in more detail.
• Psychometric concerns. Assessments in RTI must demonstrate certain psychometric qualities. They must validly predict eventual student outcomes (screening), produce scores that can reliably be compared from one administration to another (screening and progress monitoring), and measure growth between administrations that reflects student changes more than variability in the testing instrument. With regard to predictivity, the skill most often tested for progress monitoring with CBMs, oral reading fluency (ORF), is not even a part of most curricula and “cannot give a full picture of students’ reading proficiency” (Gersten et al., 2008). Apart from oral reading fluency, there is very little evidence that most CBM probes are predictive of student outcomes, and two of the leading CBMs have been shown to significantly under identify at-risk students when used as screening assessments (Nelson, 2008, 2009). “Ultimately, decisions made on such limited data [wcpm] are destined to waste time and money, fail to achieve the larger goal of improving student learning, and fall short in meeting the needs of the students most at risk. Schools and teachers need to put wcpm data in perspective and to base programmatic and instructional directions on more complete assessments of students’ needs” (Valencia et al., 2010, p. 288). Accurate growth measurement is another issue. If a child’s scores over time are used to estimate rate of learning, educators must be confident that variances are not due to fluctuations in the difficulty of the measure. The form-equivalence problem still plagues CBMs today, despite the creation of test-specific materials (Betts, Pickart, & Heistad, 2009; Francis
Shortcomings of teacher-administered, paper-based CBMs• Psychometric concerns• Inefficiency and cost of administration• Lack of data to drive instruction

©Copyright 2016 Renaissance Learning, Inc. All rights reserved. 19
©Copyright 2016 Renaissance Learning, Inc. All rights reserved. 20
et al., 2008). In fact, one very recent study (Christ & Ardoin, 2009) demonstrated variability between “forms” of oral reading fluency probes that amounted to as much as 20 times the actual student growth normally expected between weekly administrations of such probes. Another problem is lack of a common scale of measurement—there is no way, for instance, to equate measures words correct per minute with words correct in a maze passage. Therefore, it is impossible to set consistent growth targets in different interventions, to equate growth from student to student, or to compare growth across grade levels. Finally, any paper-based test creates potential variation in test administration and scoring, contributing to standard error.
• Inefficiency and cost of administration. Though a single CBM probe may require only a few minutes to arrange, administer, score, and record, assessing all students in a class this way (as in universal screening) can easily take most of a day or more. This is costly in terms of teacher time, and doubly costly in terms of time lost from instruction. Even the most widely used web system for consolidating and reporting CBM data still requires manual administration, scoring, and uploading. Modern computer-administered tests, by contrast, can be administered to large numbers of students at once in the same time required for one CBM probe, or less, and can be repeated over time with the same efficiency.
• Lack of data to drive instruction. CBMs may indicate there is a problem but provide little or no information as to what to do about it. For example, an ORF probe may warn of a fluency deficit but provide no clue as to the probable cause of that deficit, nor any detail on other reading skills. A computer-administered test like Renaissance Star Early Literacy®, by contrast, can provide 5 to 10 times as much data out of the same testing time, as well as instructional recommendations (see figure 6, p. 22). In addition, because the Star Assessments are normed or validated with large groups of students, useful inferences can be drawn based on how the student is performing at a given time compared to a representative population.
The CAT/IRT approach to RTI assessmentThe past few years have seen tremendous breakthroughs in assessment technology, which overcome the disadvantages outlined above. The Renaissance assessments described on the following pages incorporate two powerful advantages in their design and implementation: computer-adaptive testing (CAT) and item response theory (IRT). CATs are time efficient to a degree that is simply out of reach of paper-based assessments, while IRT ensures equivalence of forms and comparability of data. And because these assessments capture huge amounts of test data on an ongoing basis, their predictive power is high and continually growing.
With old paper-based tests, the only way to increase psychometric reliability is to administer more items. This is why traditional norm-referenced tests take so long: a significant number of items at a variety of levels must be administered to place students accurately. This length, and the difficulty of creating multiple equivalent forms due to the vast amount of statistical data required, is why classical norm-referenced tests are not useful to measure short-term student growth—one reason why CBMs were developed in the first place (Marston et al., 1986).
Computer-adaptive tests overcome this difficulty by using the power of the computer to select items as the test progresses, based on the pattern of the student’s answers up to that point. By eliminating redundant questions at too-low or too-high levels, CATs can often reach conclusions and determine a score in 10 minutes or less. The reliability of these scores is equal or superior to classical paper tests. In fact, reliability of CATs is actually much higher than traditional tests when assessing students far below (or above) expected achievement for their grade level. “Adaptive tests are useful for measuring achievement because they limit the amount of time children are away from their classrooms and reduce the risk of ceiling or floor effects in the test score distribution—something that can have adverse effects on measuring achievement gains” (Agdonini & Harris, 2010, p. 215). The adaptive nature of a CAT “makes its scores more reliable than conventional test scores near the minimum and maximum scores on a given form....The Star Reading test is not subject to this shortcoming because of its adaptive branching and large item bank” (Renaissance Learning, 2010).
Item response theory adds a major advantage in test-retest reliability and equivalence of scores. IRT uses advanced techniques to measure the difficulty of each test item, as well as the probability that a student at that achievement level will get the item right. A CAT/IRT test matches the known difficulty of items to the student’s

©Copyright 2016 Renaissance Learning, Inc. All rights reserved. 21
previous performance, so scores are always comparable to the previous administration. Therefore, CAT/IRTs are perfectly suited for measuring growth throughout the school year. Statistics on item difficulty also enable generation of a scaled score—scores on an equal-interval scale that measure growth in constant units, unlike such measures as “numbers of words correct” which vary unpredictably. Scaled scores from tests like the Star Assessments can also be vertically equated across grades, allowing valid comparison of students’ scores as they progress through multiple years—particularly an issue in some Tier 2 interventions.
Computerized CAT/IRT assessments can serve as efficient screeners—administered to all students quickly in a lab setting—and repeated as frequently as necessary in a progress-monitoring application, where their time efficiency is also an advantage. Finally, the richness of the resulting data produce instructional guidance that makes them true formative assessments.
A major advantage of Renaissance CAT/IRT assessments is that educators have access to a scientific method for setting appropriate, achievable, and challenging progress-monitoring goals for students. Because thousands of schools use these applications through web-hosted versions, Renaissance is able to observe how students grow. Using this longitudinal data on the learning patterns of more than 75,000 students for early literacy, more than 1 million students for reading, and nearly 350,000 students for math, the Star Assessments provide educators with critical information about how students grow over time. Specifically, the Goal-Setting Wizard in Star Assessments uses this information to help educators set progress-monitoring goals tailored to each student—goals that result in setting challenging but reasonable expectations for that particular student.
How CAT/IRT assessment works in readingStar Early Literacy and Star Reading are efficient and reliable screening, progress-monitoring, and diagnostic assessments for reading using the CAT/IRT model. Each is completely computer administered and requires about 10 minutes of total administration time per student to achieve reliable scores (Because it is computer administered, multiple students can be tested simultaneously using multiple networked computers). Star Early Literacy, primarily used in pre-K–3, provides skill scores on 41 emergent reading skills in seven early literacy domains (see figure 6). Star Reading, used once students are able to read independently, tests reading comprehension directly and provides an accurate estimate of oral reading fluency plus suggestions as to skill development for instructional match (see figure 7). Scaled scores from the two assessments can be linked to provide a unified measurement scale for reading development from pre-literacy through grade 12.
Typically, Star Early Literacy would be administered to all students as a universal screener in pre-K–3, with Star Reading being added for independent readers starting in first or second grade. Both produce valid and reliable criterion-referenced scores, and Star Reading is nationally normed. Cut scores based on national data can be used (or adjusted to local distributions if preferred). Because either assessment can be repeated as often as weekly if necessary due to their computer-adaptive nature, the same tools can be used for progress monitoring in intervention situations throughout the year, with great time efficiency. Star Early Literacy can also be used as a diagnostic tool in higher grades in cases of suspected skills deficiencies.
Star Reading, Star Early Literacy, and Star Math are reliable, efficient, and data-rich assessments for screening, progress monitoring, and diagnostic use.

©Copyright 2016 Renaissance Learning, Inc. All rights reserved. 21
How CAT/IRT assessment works in mathAs RTI implementations expand beyond reading, new assessment demands are arising that old-style CBMs are completely unprepared to meet. Research done on predictive power and reliability of reading CBMs has no applicability to math at all.
An example of the CAT/IRT model applied to math is Star Math. Computer administered and requiring less than 15 minutes per student (multiple students testable simultaneously with multiple networked computers), Star Math provides scaled scores, grade equivalents, and instructional-match recommendations (see figure 8, next page). The assessment would be administered to all students in first grade and higher as a universal screener and as often as required thereafter, so it can also serve as the progress-monitoring tool.
Figure 7. Star Reading Diagnostic Report
Figure 6. Star Early Literacy Student Diagnostic Report
Printed Tuesday, January 27, 2015 10:30:31 AM
School: East Elementary School
Student Diagnostic Report Skill Set Scores
Reporting Period: 8/1/2014 - 7/31/2015
(2014 - 2015)
Gray, MalanaClass: - Student's Age (yrs):
Teacher: Grade:
SS: 686 (Scaled Score)
T. Johnson
Mr. Johnson's class
1
10072ID:Test Date: 01/26/2015
Sub-Domains Score
Alphabetic Principle
Concept of Word
Visual Discrimination
Phonics
Structural Analysis
Vocabulary
Sentence-Level Comprehension
85
85
90
64
64
56
65
Phonemic Awareness
Paragraph-Level Comprehension
Early Numeracy
60
55
79
Literacy Classification
Early EmergentReader
SS 300-487
ProbableReader
SS 775-900
TransitionalReader
SS 675-774
Late EmergentReader
SS 488-674
Est. ORF is available for tests taken in grades 1-3.
24Estimated Oral Reading Fluency (Words Correct Per Minute):
Final Consonant Sounds
Initial Consonant Sounds
Short Vowel Sounds
Medial Phoneme Discrimination
Comprehension at the Sentence Level
Initial and Final Phonemes
Blending PhonemesSentence-Level Comprehension
Blending Word Parts
SynonymsRhyming and Word Families
Antonyms
Consonant Blends (PA)
Word FacilityPhonemic Awareness
Vocabulary
Sound-Symbol Correspondence: Consonants
Sound-Symbol Correspondence: Vowels
Other Vowel Sounds
Consonant Digraphs
Word Families/Rhyming
Print Concepts: Word borders
Print Concepts: Letters and Words
Print Concepts: Word length
Word Building
Alphabetic Sequence
Alphabetic Knowledge
Letter Sounds
PhonicsAlphabetic Principle
Skill Sets Within Each Sub-Domain
Skill Set
Letters
Identification and Word Matching
Visual Discrimination
Early Numeracy
Skill set scores, ranging from 0-100, estimate the student 's percent of mastery of skills in each set.
90
76
66
86
92
91
80
94
84
82
80
75
37
59
52
63
50
78
64
55
54
57
60
ScoreScoreSkill Set
Concept of Word
Phoneme Segmentation
Phoneme Isolation/Manipulation
Phonics
Structural Analysis
Compound Words
Syllabification
Words with Affixes
Long Vowel Sounds
Paragraph-Level Comprehension
Comprehension of Paragraphs
Number Naming and Number Identification
Number Object Correspondence
Sequence Completion
Composing and DecomposingVariant Vowel Sounds
MeasurementConsonant Blends (PH)
}}
}
}
}
}
}}
}
}
}}
}}
}
}
}
}
}
}
}}}
}
62
65
80
70
57
66
66
63
62
79
58
61
58
83
75
74
87
78
} Next Steps: These are the skill sets the student is ready to learn and practice, based on their Scaled Score. Skill sets with a score below 40 may not have been presented to the student yet or may be too difficult at this time.
Diagnostic Report Printed Tuesday, May 17, 2011 11:15:20 AM
School: Oakwood Elementary School Test Date: May 13, 2010 9:12 AM
a Est. ORF: Estimated Oral Reading Fluency is only reported for tests taken in grades 1-4.
1 of 1
Bosley, Matthew ID: BOSLM Class: Grade 4 (Adams) Grade: 4 Teacher: Mrs. M. Adams
This report presents diagnostic information about the student's general reading skills, based on the student's performance on aSTAR Reading test.
Time for First Part: 7 minutes 57 seconds Time for Second Part: 4 minutes 35 seconds
SS GE PR PR Range IRL Est. ORFa ZPD ATOS 2000 ZPD 2000
550 5.1 57 45-61 4.5 127 3.5-5.5 771 530-860
This student's Grade Equivalent (GE) score is 5.1. His reading skills are therefore comparable to those of an average fifth grader after the first month of the school year. Matthew also achieved a national Percentile Rank (PR) of 57. This score is in the average range and means that Matthew scored greater than 57% of students nationally in the same grade. The PR Range indicates that, if this student had taken the STAR Reading test numerous times, most of his scores would likely have fallen between 45 and 61. It reflects the amount of statistical variability in a student's PR score.
These scores indicate that Matthew is probably learning to apply his reading skills to different academic areas. Matthew likelyuses textbooks and other nonfiction resources to achieve his content area goals. Matthew is also developing study skills to support his reading skills. He is learning to set a purpose for reading. He is also learning to use different reading skills whenreading for pleasure and when reading for information. Also, Matthew is beginning to apply pre-reading and post-reading strategies to increase his understanding of nonfiction text.
For optimal reading growth, Matthew needs to: • Maintain a minimum of 30 to 60 minutes of guided independent reading practice daily • Practice reading unfamiliar material, especially expository text • Select a wide range of reading materials to improve reading skills and expand vocabulary • Continue to develop listening comprehension
This student’s Zone of Proximal Development (ZPD) for independent reading is book level 3.5 - 5.5. If Accelerated Reader™ reading management software is being used in your classroom or school, Matthew should be encouraged to select books with book levels in the ZPD. These books will provide optimal reading challenge without frustration. The ZPD, however, is approximate. Success at any book level also depends on the student’s interest and prior knowledge of a book’s content. Matthew’s ZPD 2000 is 530-860. The ZPD 2000 score is the ZPD converted to a 2000-point scale.
The following techniques will also help ensure the student’s continued growth in reading: • Guide reading practice so that Matthew averages at least 85 percent on Accelerated Reader Reading Practice Quizzes. • Once Matthew is able to maintain an 85% average, encourage him to raise his average to 90% or higher. High averages
are associated with the greatest reading gain. • Use the Accelerated Reader Diagnostic Report and Student Record Report for more detailed information about the
student’s reading practice. • Teach Matthew how to select books throughout his ZPD. • Help Matthew establish a minimum book level, minimum percent correct, and point goals for each marking period.
©Copyright 2016 Renaissance Learning, Inc. All rights reserved. 22

©Copyright 2016 Renaissance Learning, Inc. All rights reserved. 23
Summary—Advantages of CAT/IRT assessments
• Time efficient—quickly administered• Valid and reliable—especially for students
substantially below (or above) grade-level expectations, for test/retest comparisons at various times of year, and for comparing scores across years
• Richer data for informing instruction—a purpose for which CBMs are limited (Fuchs, Fuchs, Hosp, & Hamlett, 2003)
• Ready access to data—through online databases
• Single assessment can serve multiple functions (screening, progress monitoring, diagnostic use)
Figure 8. Star Math Diagnostic Report
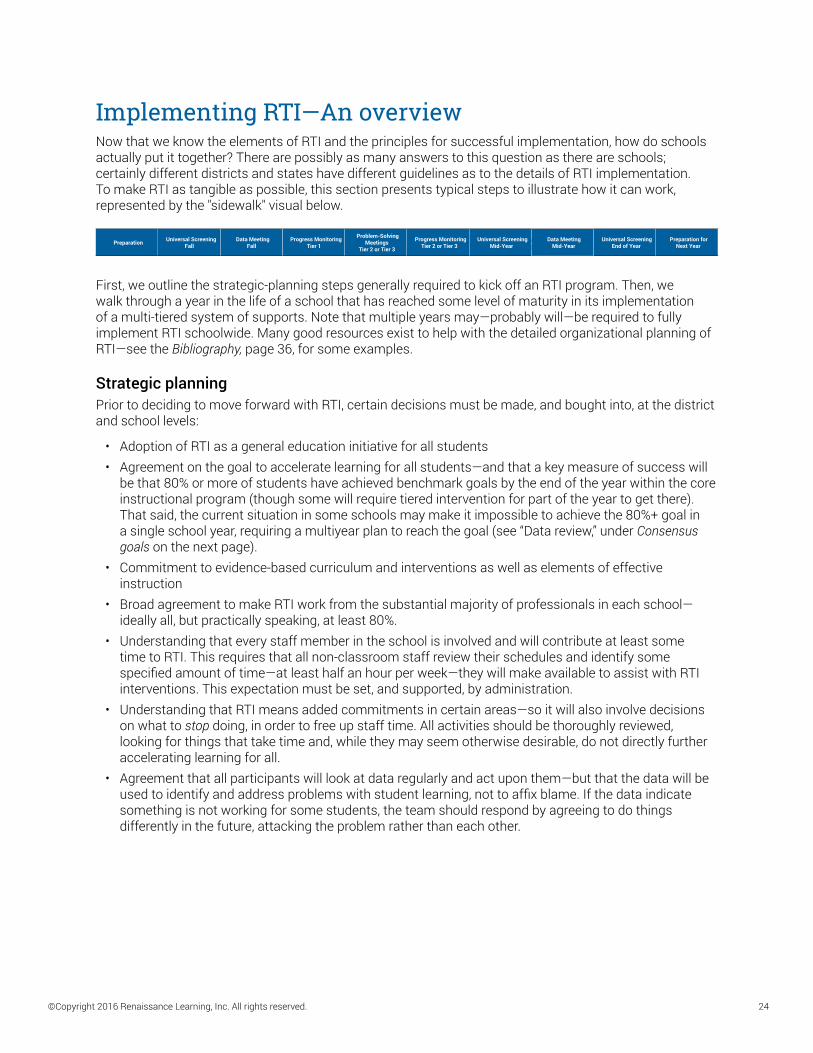
©Copyright 2016 Renaissance Learning, Inc. All rights reserved. 23
©Copyright 2016 Renaissance Learning, Inc. All rights reserved. 24
Implementing RTI—An overviewNow that we know the elements of RTI and the principles for successful implementation, how do schools actually put it together? There are possibly as many answers to this question as there are schools; certainly different districts and states have different guidelines as to the details of RTI implementation. To make RTI as tangible as possible, this section presents typical steps to illustrate how it can work, represented by the "sidewalk" visual below.
First, we outline the strategic-planning steps generally required to kick off an RTI program. Then, we walk through a year in the life of a school that has reached some level of maturity in its implementation of a multi-tiered system of supports. Note that multiple years may—probably will—be required to fully implement RTI schoolwide. Many good resources exist to help with the detailed organizational planning of RTI—see the Bibliography, page 36, for some examples.
Strategic planningPrior to deciding to move forward with RTI, certain decisions must be made, and bought into, at the district and school levels:
• Adoption of RTI as a general education initiative for all students• Agreement on the goal to accelerate learning for all students—and that a key measure of success will
be that 80% or more of students have achieved benchmark goals by the end of the year within the core instructional program (though some will require tiered intervention for part of the year to get there). That said, the current situation in some schools may make it impossible to achieve the 80%+ goal in a single school year, requiring a multiyear plan to reach the goal (see “Data review,” under Consensus goals on the next page).
• Commitment to evidence-based curriculum and interventions as well as elements of effective instruction
• Broad agreement to make RTI work from the substantial majority of professionals in each school—ideally all, but practically speaking, at least 80%.
• Understanding that every staff member in the school is involved and will contribute at least some time to RTI. This requires that all non-classroom staff review their schedules and identify some specified amount of time—at least half an hour per week—they will make available to assist with RTI interventions. This expectation must be set, and supported, by administration.
• Understanding that RTI means added commitments in certain areas—so it will also involve decisions on what to stop doing, in order to free up staff time. All activities should be thoroughly reviewed, looking for things that take time and, while they may seem otherwise desirable, do not directly further accelerating learning for all.
• Agreement that all participants will look at data regularly and act upon them—but that the data will be used to identify and address problems with student learning, not to affix blame. If the data indicate something is not working for some students, the team should respond by agreeing to do things differently in the future, attacking the problem rather than each other.
Figure 26: Accelerated Math Screen
Progress MonitoringTier 2 or Tier 3
Universal ScreeningMid-Year
Universal ScreeningEnd of Year
Preparation for Next YearPreparation Universal Screening
FallProgress Monitoring
Tier 1Data Meeting
Fall
Problem-Solving Meetings
Tier 2 or Tier 3
Data MeetingMid-Year

©Copyright 2016 Renaissance Learning, Inc. All rights reserved. 25
PreparationPrior to kicking off an RTI implementation—at latest, before summer professional development—the following must be in place at each school:
• Consensus goals. All involved, from the district superintendent on down, agree on what RTI is intended to accomplish and how it will be measured: ‒ Benchmarks are set for performance to identify which students require additional help. Some states
and districts have generated official RTI benchmarks in relation to proficiency standards. In absence of such standards, one rule of thumb is to use the 40th percentile as measured against national norms (for more information, see p. 11) to set a minimum level below which additional action is required (whether differentiation in Tier 1 or possible moves into Tier 2). But in some schools, the 40th percentile standard is unattainable at the beginning because it would push more students into Tier 2 than can be handled at once (generally, no more than 20% of students can be served even with group interventions). There are various ways to handle this situation (see Data meeting—Fall, p. 27); data review in advance can help with choosing alternatives.
‒ Data review. Leadership team reviews past years’ assessment data at the school level and by grade level. If the historical distribution of scores makes it clear that use of the 40th-percentile standard would push far more students into Tier 2 than can be handled with the school’s intervention resources, a more restrictive standard for Tier 2 may have to be set (e.g., the lowest 20% of students). But such a distribution is also a red flag for a thorough examination of core programs to see what changes can be made to boost overall results.
‒ Once benchmarks are established, goals are set for end of year that accord with standards and are supported by the assessments selected. Goals must be “meaningful, measurable, and monitorable” (Christ et al., 2008). Cut scores are set to determine potential student placement in intervention categories (see Assessment selection, next page).
• Leadership team. While every staff member in each school is involved, certain people assume key functions in driving and monitoring the RTI change process. This core group will meet regularly to discuss progress (many such teams meet weekly for a short time). These functions should be filled by existing personnel—RTI is not a mandate to add staff. The most important roles are ‒ Principal—overall leadership and accountability ‒ Grade-level leads—planning, implementation, and resource coordination across the grade level.
(Secondary schools can also make this breakdown at grade level by homeroom [see p. 18], but due to size they may have to further organize teachers into pods within grade levels. The key is to represent every major sector of the school.)
‒ Data coordinator or RTI mentor—responsible for thoroughly understanding the assessment and reporting systems (i.e., software), and coaching other team members in understanding and using the data. This person may be the school psychologist, if there is one, but could also come from the ranks of media specialists, Title I coordinators, reading specialists, counselors, interventionists, and so forth.
Grade-level teams are also critically important in regular monitoring of the program and in assigning interventions. Grade-level teams usually consist of a grade lead, all grade teachers, the data or RTI coordinator, and the principal or assistant principal. In some RTI models, a separate problem- solving team is also created to help the grade teams determine individual interventions (Burns & Gibbons, 2008).
• Instruction and intervention review. The leadership team leads a curriculum review to agree on the evidence-based materials and programs that, at each grade level and in each subject (at least reading and math), will be considered core (universal—all students), differentiated (struggling students and high-achieving students within Tier 1), strategic, targeted, or supplemental (Tier 2), and intensive (Tier 3). Fewer interventions with strong evidence backing and good teacher familiarity are better than a scattershot approach.
Preparation

©Copyright 2016 Renaissance Learning, Inc. All rights reserved. 25
©Copyright 2016 Renaissance Learning, Inc. All rights reserved. 26
• Scheduling. Decisions are made on the following: ‒ Schedule for the year, especially dates of professional development, universal screenings (usually
three, sometimes four), grade-level reviews, and time slots wherein problem-solving meetings can be scheduled
‒ Daily and weekly class schedules, to allow enough flexibility to assign students who require any level of intervention to receive additional instructional and practice time. Many elementary schools identify a period each day (e.g., Tier Time, Power Hour) during which students receive more intensive interventions based on assessed skill levels. Others schedule core subjects (reading and math) at different times for different grades so intervention resources can move around.
‒ Intervals between group data-review meetings (grade-wide) ‒ Amount of time allowed for different levels of intervention, before deciding whether an
intervention is working or the student needs to be moved to a more intensive level (state and district guidelines will sometimes dictate these time guidelines)
• Assessment selection. Reliable, efficient instruments are in place for screening, progress monitoring, and diagnostic use (skills analysis). See Principle 5 in Nine principles of a successful RTI program, page 14, for more detail on each of these three categories. These instruments are computerized to the greatest extent possible, for efficiency in administration and reporting, and to maintain and consolidate data for tracking and potential future referrals. CAT/IRT model assessments should be strongly considered. For each screening assessment, in light of benchmarks previously selected (see Consensus goals, opposite page), cut scores are selected to group students: at or above benchmark, potentially at risk or “on watch,” or in need of immediate intervention.
• Technology setup. Pursuant to the previous point, computer systems are prepared for the assessment activities required. For special consideration: hardware requirements, the need to set up student records prior to start of school, and especially, networking requirements so data can be shared across the school, and preferably throughout the district. Parental access should be part of this plan. Hosted technology systems that allow secure web access for all constituencies—including parents—are the most effective way to ensure efficient and effective data distribution.
• Professional development. Arrangements should be made for some of the types of training outlined in the discussion of professional development in Principle 9 in Nine principles of a successful RTI program, page 17.
• Parental and community outreach plan. From the initial general announcement to specific communications to parents whose students require intervention, materials and schedules should be in place before the first day of school. For discussion of the potential legal aspects of setting up this plan, see Principle 8 in Nine principles of a successful RTI program, page 16.
Universal screening—FallAs soon as possible after school begins—preferably by the end of the second week, at least within the first month—all students take a standardized assessment in each of the areas in the RTI plan (at minimum, reading; preferably at least reading and math). The assessments must be efficient enough to test all students with minimal cost and disruption to the instructional schedule, but powerful enough to predict end-of-year student outcomes from their current levels of performance. Computer-adaptive tests like Star Assessments meet teachers’ needs to identify the appropriate level of instruction for each student and to facilitate matching instruction to individual student level of skill development.
Universal ScreeningFall

©Copyright 2016 Renaissance Learning, Inc. All rights reserved. 27
Data meeting—FallWithin no more than a week after completion of fall screening, the RTI coordinator provides reports to the leadership team on overall school- and grade-level performance, and to each classroom teacher on his/her class results. (Teachers have access to these reports on their own, as well, and are trained in their use.) Meetings at each grade level (or in pods as determined for secondary schools—see Leadership team, p. 25) are scheduled to discuss the following:
• First half of meeting: overall situation ‒ General level of achievement and distribution of scores ‒ Is core instruction working? Are any major adjustments required to ensure overall proficiency goals
will be met during the year? ‒ Initial recommendations from the leadership team based on screening results
• The second half of the meeting is devoted to making sure instruction is matched to the skill development level of each learner. Questions to be answered (problem solving): ‒ How many students are below benchmark, and how will they receive interventions (differentiated
instruction), according to the curricular decisions previously made? ‒ Specifically, who are the students below benchmark?
• Students below benchmark are dealt with in various ways, depending on the severity of their shortfalls and available resources in a school. As indicated in the diagram of RTI tiers on page 2, it is assumed that about 80% of students will be serviced within the core classroom. This percentage does not automatically assume that 80% of students will always be within range of benchmark status—such is certainly not the case in many schools. Rather, it is a rule of thumb acknowledging the resource limitations that normally constrain how many students can be provided with additional services, versus being accommodated in the core.
• Differentiation strategies begin within the core classroom. On one end of the scale, students only mildly below benchmark may be placed on watch for some supplementary differentiation and more frequent monitoring. If national norms are used as benchmark criteria, students between the 40th and 25th percentiles are often considered on watch. At the other end, students well above benchmark should receive enrichment activities to further accelerate their growth (see p. 8 for strategies for gifted and talented students).
• Below a certain point, students should be considered for Tier 2 intervention. Often 25th percentile or below is adopted as a cut score for Tier 2. In some populations, however, cutting at the 25th percentile would yield far too many students for available remediation resources. In such cases, the school or district may choose to start with a lower cutoff and gradually move the standard higher as interventions take effect.
• Typically Tier 2 interventions are standard protocol—a few selected, proven procedures that attack the most common causes of shortfalls, such as vocabulary, oral reading fluency, computational fluency, and so forth. Such interventions are usually administered in groups at certain times during the school day. And they
Data MeetingFall
Computer-adaptive tests like the Star Assessments meet teachers’ needs to identify the appropriate level of instruction for each student and to facilitate matching instruction to individual student level of skill development.
©Copyright 2016 Renaissance Learning, Inc. All rights reserved. 28
©Copyright 2016 Renaissance Learning, Inc. All rights reserved. 27
are always supplemental to, not replacements for, core instruction. How students are assigned to such groups depends on the population: ‒ In a strict problem-solving model—more accurately called problem analysis, see page 6—individual
meetings will be scheduled for each Tier 2 candidate. Practically speaking, this approach works only if there are very few such students (considerably less than 20%) because of the time required to schedule and implement a large number of individual meetings.
‒ In most schools, Tier 2 candidates will be reviewed at the same time (during the data meeting) and assigned to intervention groups by common deficiencies. This is an example of how using a screening assessment that generates more information (see pp. 9–11, 20–23) is extremely helpful; no single data point should be considered sufficient for Tier 2 assignment. (Assessments that serve a dual function [e.g., screening and progress monitoring] are particularly useful because one measure, using the same scoring scale, can help identify students needing help as well as track their progress and responsiveness to intervention.) If data on certain students suggest more complex or unusual problems, these students, and only these, would be scheduled for individual problem-solving meetings. In any event, parents should be notified when students are placed in Tier 2 interventions.
• For schools with a “classwide problem” (Burns & Gibbons, 2008)—where considerably more than 20% of students, perhaps a majority, are below the norm or cut score for intervention, the team may specify a classwide intervention. In this scenario, the entire class is provided additional time and a supplemental learning activity in the problem subject. For example, 20–30 minutes might be added each day for additional reading practice or skill building, or math skills practice, at levels targeted to each student’s need. (Accelerated Reader, Accelerated Math, and MathFacts in a Flash are ideal for this type of classwide intervention.) The group is then retested biweekly. Often, within a few weeks, the class will have made enough progress to reduce the number of students requiring Tier 2 intervention to a more manageable number. Parents should be notified when classwide intervention is used.
Progress monitoring—Tier 1For all Tier 1 students, practice progress monitoring—monitoring of progress by measuring performance of tasks that contribute to growth toward benchmarks, such as reading practice and math problems—provides a good continuous check on core instruction and a way to identify struggling students who may have been missed by screening. It also provides the means to measure each student’s progress toward personal goals.
Students below benchmark but remaining in Tier 1 (with differentiated instruction or Tier 1 interventions) are also monitored with an achievement assessment—ideally, the same assessment used in screening. Such monitoring is commonly scheduled at least monthly; some states or districts may have other requirements. Reports are reviewed by the classroom teacher for instructional guidance and for discussion at monthly data meetings. These reviews are made much more effective and less burdensome on the teacher if the assessment software system provides for input of individual goals after the data meetings—often the responsibility of the RTI coordinator. This is the point where it becomes critical that, as outlined in the discussion of the problem-solving model in What is RTI?, pages 6–7, the goals for the intervention are stated in terms the progress-monitoring assessment can measure, and that the results from the progress-monitoring assessment can reliably predict where the student will wind up at the end of the year given level and rate of growth (e.g., whether mastery of a certain number of specific math objectives will result in a specific improvement on the math progress-monitoring measure).
RTI review meetings
Progress MonitoringTier 1
Grade-level meetings should occur regularly throughout the year—ideally monthly, but some schools achieve good results with meetings every 6 weeks. The first agenda item of these meetings is to discuss any issues of the RTI implementation in general—Did we do what we said we would do? Are we implementing instruction and interventions with fidelity? Then, discussion turns to progress of Tier 1 interventions, looking at data on those students. On this subject, three outcomes are possible:
• Intervention has worked: Learning has accelerated enough to predict benchmark performance on the next screening (according to the assessment trend line), so Tier 1 intervention may be discontinued.
• Intervention is working: Learning has accelerated, but more progress is needed to assure benchmark performance (trend-line slope has increased but not enough). Two possible recommendations:
• Continue current intervention, possibly with more time for practice and instruction or other fine-tuning.
• Introduce another intervention, either instead of or in addition to the current intervention (obviously this also involves allotting more instructional and/or practice time).
• Intervention is not working, or working too slowly to predict benchmark performance by the end of the year (trend-line slope is not increasing, or not enough to expect sufficient further improvement): Schedule a problem-solving meeting to discuss elevation of intervention to Tier 2.
If a classwide intervention is in process, this would be the time to do similar analysis on those students. In all cases, fidelity of intervention delivery should be checked when results are reviewed.
In keeping with the agreement outlined in the last bullet under Strategic planning, page 24, these meetings are focused on instruction and student outcomes, and on fixing problems—not on teacher performance.
Individual problem-solving meetings—Tier 2 or Tier 3For each student designated for Tier 2 or Tier 3 intervention after a period of lower tier intervention (not the initial Tier 2 assignments in fall), a meeting is scheduled with the grade-level team or a dedicated problem-solving team, and the student’s parents if possible. Additional resource personnel, such as a reading specialist, a school psychologist, or other interventionist, may also be involved as suggested by assessment results. Each meeting, lasting 15–30 minutes, results in a documented plan for the student, involving:
• Establishing measurable goals to accelerate academic growth to bring the student within benchmark range by the end of the school year—or, if this is not reasonably possible due to the severity of the shortfall in academic level, as far above the current level as can be projected from intervention
• Selecting interventions to further supplement core instruction: if Tier 2, generally standard protocol (small group); if Tier 3, more likely individualized
• Scheduling of additional academic engaged time (AET) for the student in the area of the shortfall, including increased practice time
• Scheduling of a progress-monitoring assessment (biweekly or weekly, or according to state or district standards) to check progress toward the established goal. As mentioned earlier, this process is made more effective and efficient if student goals can be set in the assessment software by the RTI coordinator after the meeting.
Problem-Solving Meetings
Tier 2 or Tier 3
Generally, Tier 2 interventions are done in small groups.
©Copyright 2016 Renaissance Learning, Inc. All rights reserved. 29

©Copyright 2016 Renaissance Learning, Inc. All rights reserved. 30
• Planning for the duration of the intervention—usually a minimum of 8 weeks• Scheduling follow-up meetings to review results, and notification of parents if not present at the
meeting
In follow-up meetings after initial placement in an intervention, data are reviewed to see if sufficient change is being made in the slope of the student’s trend line to predict achievement of benchmark. If not, a set of questions should be asked in the problem-solving process, including:
• Is the current intervention producing results? If so, is additional intervention required? If not: ‒ Was it implemented with fidelity? ‒ Was it implemented with sufficient AET (including practice time)? ‒ Is additional skills analysis required to determine why it is not working?
• If additional intervention and more time are required after a reasonable length of time in a Tier 2 intervention, the decision may be made to elevate to Tier 3. That will call for more AET (see Principle 3 in Nine principles of a successful RTI program, page 13, for an example of AET guidelines), more frequent progress monitoring, and more frequent follow-up meetings.
Note: Students are usually assigned to Tier 3 only after Tier 2 has failed to produce enough “response to intervention.” In some cases, however, students may be put directly into Tier 3. This should not be done mechanically based on some predetermined screening score, but after evaluation and determination that the nature and extent of Tier 2 intervention will likely be insufficient.
A final point on all such meetings: they should be kept as short as possible with a keen focus on data and problem solving. Clear agendas are a must.
Progress monitoring—Tier 2 or Tier 3Assessments are administered weekly or biweekly, and the classroom teacher and a representative of the leadership team review the results. Possible outcomes of these reviews are similar to those from Tier 1 meetings: continue intervention, supplement intervention, escalate to the next tier (Tier 2 meetings only), or, if the trend line indicates the student is approaching expected level and growth rate, move back into a lower tier.
In the event Tier 3 intervention has not worked despite additional AET, skills analysis, and a range of interventions, it may be a case for special-education evaluation. In that event, all data collected since the beginning of the year will be used to help determine eligibility using the dual-discrepancy model authorized under IDEIA.
Universal screening—Mid-yearAll students are assessed on the same instrument(s) used in fall, either at the end of fall semester or the beginning of spring, depending on school schedule (but in any event, no later than early February).
Data meeting—Mid-yearSimilar to fall meetings, the leadership team conducts grade-level meetings, equipped with data reports showing results from both fall and mid-year screenings, to identify possible mid-course corrections in core instruction, review results of interventions (numbers of students, progress made in returning to Tier 1 or advancing within Tier 2, referrals to Tier 3),
Universal ScreeningMid-Year
Progress MonitoringTier 2 or Tier 3
Data MeetingMid-Year
©Copyright 2016 Renaissance Learning, Inc. All rights reserved. 29
©Copyright 2016 Renaissance Learning, Inc. All rights reserved. 31
and look for any students requiring intervention who were previously missed. This is also an opportunity to predict school performance on end-of-year summative assessments (district or state) and discuss any problems that can be foreseen.
Universal screening—End of yearLate in the year, generally in May, screening assessment is repeated, with review of statistics as at mid-year but with three sets of data points now available. These meetings serve not only as a recapitulation of the successes and opportunities for improvement from the past year but also as the beginning of the planning cycle for the next year—Are changes required to the core? Is additional or alternative professional development required? Were some interventions more effective than others? What additional resources might be required?
Universal ScreeningEnd of Year
Preparation for Next Year

©Copyright 2016 Renaissance Learning, Inc. All rights reserved. 31
©Copyright 2016 Renaissance Learning, Inc. All rights reserved. 32
Appendix: Glossary of common termsAcademic engaged time (AET): Also time on task. Amount of time students are actually engaged in learning. Generally agreed to be highly predictive of achievement; increasing AET is perhaps the most important element in intervention. Usually measured by direct observation, which is not only labor-intensive but inexact; better measured by outputs, as in Accelerated Reader’s direct estimates of each student’s time spent practicing reading. (Note: AET is sometimes called Academic Learning Time (ALT), but strictly speaking, ALT is a more specific measurement that takes into account challenge level and other variables in addition to engaged time.)
Benchmark: Minimum expected student performance or achievement level, below which students require some form of intervention to accelerate their growth and bring them into the benchmark range.
Benchmark assessment: Also universal screening. Periodic assessment (three times per year or more) of all students, compared to standards for students’ ages or grade levels.
Classwide problem: Situation where such a high percentage of students fall below the intervention criteria—30–40% or more—that conventional Tier 2 grouping is essentially impossible. Such cases often call for a classwide intervention to raise the median of the entire group to the point where it is feasible to start Tier 2 interventions with students who are still below the cut score.
Curriculum-based measurement (CBM): Short assessments (sometimes called “probes”) "for measuring student competency and progress in the basic skill areas," (RTI Action Network Glossary: http://www.rtinetwork.org/glossary) especially reading and math. While often used in RTI, use of conventional paper-based CBMs is neither identical with nor required for RTI. Because they are teacher administered, conventional CBMs are quite costly in terms of the amount of useful data generated, and often not reliable in frequent repeated administrations (as in Tier 2 and Tier 3). They also do not usually generate data to inform instruction.
Cut scores: Also cut-point. Scores on screening assessments used to determine which students fall into the benchmark, strategic, and intensive groups. While they do not replace teacher judgment, proper determination of cut scores is key to successful RTI implementation—thus, sensitivity and reliability of the screening instrument are very important. See benchmark
Diagnostic: (As applied to assessments.) Capable of generating or validating hypotheses as to skills deficits that may be causing students’ performance shortfalls, and thereby suggesting interventions. In RTI, this term does not imply diagnosis in any clinical sense, as the data collected and analyzed in RTI are based on student performance. See progress monitoring and screening
Differentiated instruction: Process of designing lessons and practice plans that meet the specific needs of learners, individually and in groups. Differentiated instruction is assumed in RTI, even at Tier 1, but it is not the same as RTI.
Dual discrepancy: Measuring deficiencies in academic performance in terms of shortfalls in both level of skill (assessment scores compared to benchmark performance at that time of year) and rate of growth of that skill (again compared to benchmark—the rate required to sustain or reach benchmark level). Contrasts with the old discrepancy model used to determine eligibility for special-education students, which compared I.Q. or other summative assessment results with norms but did not take growth rate into account or evaluate the student’s response to, or the adequacy of, instruction.

Evidence-based: Educational practices/instructional strategies supported by relevant scientific research studies. Similar to scientifically based research, but “evidence-based” does not convey the implicit requirement that the specific curriculum or tool be validated in experimental design studies that are rigorous and usually require many months or years to complete. All instruction and intervention in RTI should be evidence-based.
Fidelity of implementation: Using a program or method of instruction as it was intended to be used. An important element of RTI but conventionally measured by direct observation in the classroom, which is time-consuming and often inaccurate. A better way is by measuring objective outputs in terms of class- or schoolwide student progress and AET, for example, using reports of math objectives mastered per class via Accelerated Math.
Formative assessment: Classroom measures of student progress that inform instructional decision making. It is how data are used (to drive teaching and instructional match) rather than how they are generated that make assessments “formative” or not. Proven by research to have a strong positive impact on performance, formative assessments must be time efficient in relation to data generated; therefore, they generally should be computerized, student driven, and brief.
Goal line: Line on a graph representing expected student growth over time, based on current level and predicted rate of growth. See trend line
IDEA: Individuals with Disabilities Education Act, originally enacted in 1975 and most recently reauthorized (2004) as the Individuals with Disabilities Education Improvement Act (IDEIA or IDEA 2004). Federal statute relative to public education and services to students with disabilities ages 3 through 21. IDEIA specifically authorizes the use of RTI standards in disability identification and makes more funding available for RTI implementation.
Instructional match: Creating material and delivery for the appropriate growth of every child, a key component of RTI.
Intensive interventions: Academic and/or behavioral interventions characterized by increased length, frequency, and duration of implementation: Tier 3.
Intervention: A strategy designed to help a student improve performance relative to a specific goal. Commonly assumed to be additional instructional programs, but actually can be increased intensity of current programs. Applies to all tiers, including differentiated strategies in Tier 1; never replaces core instruction.
Learning rate: Average progress over a period of time, for example, one year’s growth in one year’s time. A vital element in the dual-discrepancy model and a major point that differentiates RTI.
Local norms: Standards against which students will be measured to determine if they are candidates for Tier 2, Tier 3, or beyond. Because in many cases measuring against national norms would mean putting the whole class immediately into Tier 2, the school or district must decide what norm to apply from the outset—whether by school, grade level across the district, state, or, in some cases, national norms.
Oral reading fluency (ORF): Usually measured by the number of words read aloud correctly per minute. ORF is a common probe used in CBMs to show correlation to overall reading ability at some grade levels, but is labor-intensive to measure because it requires teacher administration. Computer-adaptive measures such as Star Early Literacy and Star Reading can directly measure overall reading ability and simultaneously provide an accurate estimate of the student's oral reading fluency (words read correctly per minute), based on research linking Star Early Literacy and Star Reading scores to student performance on the DIBELS oral reading fluency measure.
©Copyright 2016 Renaissance Learning, Inc. All rights reserved. 33

©Copyright 2016 Renaissance Learning, Inc. All rights reserved. 34
PBIS: Also PBS. Positive behavior interventions and supports—a tiered model of working with student behavior problems very similar to, and developed in somewhat parallel fashion with, RTI. This paper focuses on the academic and data aspects of RTI, but many RTI implementations have a behavioral aspect.
Parental involvement: Consistent, organized, and meaningful two-way communication between school staff and parents with regard to student progress and related school activities (National Research Center on Learning Disabilities, 2007). A key component in most RTI models, both to assure home support and to satisfy legal requirements for notification about interventions in the event of an eventual special-education referral. For the latter reason, parental communication should be a regular, and verifiable, element for all parents in RTI; this is best done with an integrated web system such as Renaissance Home Connect.
Problem solving: Approach to determining appropriate treatment for a child on watch in Tier 1, or in Tier 2 or Tier 3, which involves a series of steps from problem identification to evaluating the intervention chosen to solve the problem (close the achievement gap). Sometimes used in contrast to standard protocol, but as the term is used in this paper, RTI interventions always encompass a problem-solving approach, even if the outcome of a particular problem-solving session is to apply a standard-protocol intervention or to improve core curriculum. Some experts prefer the term problem analysis for the individual process.
Progress monitoring: (As applied to assessments.) A set of assessment procedures for determining the extent to which students are benefiting from classroom instruction. Frequency increases with increased intensity of intervention; the best progress monitoring is continuous monitoring of task-level outcomes as with Accelerated Reader. Progress-monitoring tools must be reliable, efficient, and provide easy access to data; they should be part of an integrated technology system. See diagnostic and screening
Psychometrically sound: Statistically proven reliable and valid (more than just face validity). Many of the conventional paper-based CBMs lack psychometric proof of reliability and/or validity.
Reliability: The extent to which a test yields consistent results from one test administration to another. To be useful, tests must yield consistent results.
Screening: (As applied to assessments.) Often called universal screening or schoolwide screening. An assessment characterized as a quick, low-cost, repeatable test of age-appropriate critical skills. In RTI, assessment used three or more times during school year to determine overall level of class and school, set baselines for all students, and identify individual students who require more intense differentiated instruction and may be at risk, possibly requiring further intervention in Tier 2 or Tier 3. Reliability and comparability of different administrations are extremely important when selecting screening measures, as is time efficiency—which virtually dictates using a computer-administered assessment. See diagnostic, progress monitoring, and benchmark assessment
Secondary intervention: Interventions that relate directly to an area of need, are different from or supplementary to primary interventions, and are often implemented in small group settings: Tier 2.
Standard-protocol intervention: Also standard treatment protocol. Use of the same empirically validated intervention for all students with similar academic or behavioral needs, administered in a group; facilitates quality control. Generally the type of intervention used in Tier 2.
Targeted intervention: Term sometimes used for Tier 2 interventions. See secondary intervention
Tertiary intervention: Interventions that relate directly to an area of need, are supplementary to or different from primary and secondary interventions, and are usually implemented individually or in very small group settings: Tier 3 and above.
©Copyright 2016 Renaissance Learning, Inc. All rights reserved. 33

©Copyright 2016 Renaissance Learning, Inc. All rights reserved. 35
Tiers: Levels of instructional intensity and increased AET within a tiered RTI model. Most models have three tiers, with special-education placement resulting if instruction in Tier 3 does not have the desired effect; some models have four tiers.Tier 1 is the universal level of core instruction.
Trend line: Line on a graph that connects data points; compare against goal line to determine responsiveness to intervention. See goal line
Universal screening: Fundamental principle of RTI: all students must be tested to place them in proper levels of instruction, and also to assure that core instruction is performing satisfactorily for the majority of students (usually at least 80%). Screening is typically done three times per year: beginning, middle, and end. See screening and benchmark assessment
Validity: The degree to which a test measures what it is intended to measure.

©Copyright 2016 Renaissance Learning, Inc. All rights reserved. 35
©Copyright 2016 Renaissance Learning, Inc. All rights reserved. 36
BibliographyReferences citedAgdonini, R., & Harris, B. (2010). An experimental evaluation of four elementary school math curricula. Journal of Research on Educational Effectiveness, 3(3), 199–253.
Assistance to States for the Education of Children with Disabilities and Preschool Grants for Children with Disabilities, Final Rule, 71 Fed. Reg. 46540, 46663 (Aug. 14, 2006) (to be codified at 34 C.F.R. Pt. 300.311(a)(7)).
Batsche, G. (2006). Problem solving and response to intervention: Implications for state and district policies and practices. Warner Robins, GA: Council of Administrators of Special Education. Retrieved from
http://www.casecec.org/powerpoints/rti/CASE%20Dr.%20George%20Batsche%201-25-2006.ppt
Batsche, G. (2007). Response to intervention: Overview and research-based impact on over-representation. Florida RTI Update, 1(1), 2. Florida Department of Education & University of South Florida.
Batsche, G., Elliott, J., Graden, J. L., Grimes, J., Kovaleski, J. F., Prasse, D., ... & Tilly III, W. D. (2008). Response to intervention: Policy considerations and implementation. Alexandria, VA: National Association of State Directors of Special Education.
Berliner, D. (1991). What’s all the fuss about instructional time? In M. Ben-Peretz & R. Bromme (Eds.), The nature of time in schools: Theoretical concepts, practitioner perceptions. New York, NY: Teachers College Press. Retrieved from
http://courses.ed.asu.edu/berliner/readings/fuss/fuss.htm.
Betts, J., Pickart, M., & Heistad, D. (2009). An investigation of the psychometric evidence of CBM-R passage equivalence: Utility of readability statistics and equating for alternate forms. Journal of School Psychology, 47(1), 1–17.
Black, P., & Wiliam, D. (1998). Inside the black box: Raising standards through classroom assessment. Phi Delta Kappan, 80, 139–148.
Bloom, B. S. (1980). All our children learning. New York, NY: McGraw-Hill.
Bollman, K. A., Silberglitt, B., & Gibbons, K. A. (2007). The St. Croix River Education District model: Incorporating systems-level organization and a multi-tiered problem-solving process for intervention delivery. In S. Jimerson, M. K. Burns, & A. M.
VanDerHeyden (Eds.), Handbook of response to intervention: The science and practice of assessment and intervention (pp. 319–330). New York, NY: Springer.
Burns, M. K., Dean, V. J., & Klar, S. (2004). Using curriculum-based assessment in the responsiveness to intervention diagnostic model for learning disabilities. Assessment for Effective Intervention, 29, 47–56.
Burns, M. K., & Gibbons, K. (2008). Response to intervention implementation in elementary and secondary schools: Procedures to assure scientific-based practices. New York, NY: Routledge.
Christ, T. J., & Ardoin, S. P. (2009). Curriculum-based measurement of oral reading: Passage equivalence and probe-set development. Journal of School Psychology, 47, 55–75.
Christ, T. J., Scullin, S., & Werde, S. (2008, March). Response to intervention: Subskill analysis of reading fluency. Presented at Minnesota School Psychologists Association Midwinter Conference, St. Paul, MN. Retrieved from
http://www.mspaonline.net/Conference2008/Problem_Analysis_and_Subskill_Analysis_of_Reading_Fluency_S.pdf
Deno, S. L., & Mirkin, P. K. (1977). Data-based program modification: A manual. Reston, VA: Council for Exceptional Children.
Francis, D. J., Santi, K. L., Barr, C., Fletcher, J. M., Varisco, A., & Foorman, B. R. (2008). Form effects on the estimation of students’ oral reading fluency using DIBELS. Journal of School Psychology, 46, 315–342.
Fuchs, L. S. (2003). Assessing intervention responsiveness: Conceptual and technical issues. Learning Disabilities: Research & Practice,18, 172–186.
Fuchs, L. S., & Fuchs, D. (1986). Effects of systematic formative evaluation on student achievement: A meta-analysis. Exceptional Children, 53, 199–208.

©Copyright 2016 Renaissance Learning, Inc. All rights reserved. 37
Fuchs, L. S., Fuchs, D., Hosp, M. K., & Hamlett, C. L. (2003). The potential for diagnostic analysis within curriculum-based measurement. Assessment for Effective Intervention, 28, 13–22.
Gersten, R., Compton, D., Connor, C. M., Dimino, J., Santoro, L., Linan-Thompson, S., & Tilly, W. D., III. (2008). Assisting students struggling with reading: Response to intervention and multi-tier intervention for reading in the primary grades. A practice guide. (NCEE 2009-4045). Washington, DC: U.S. Department of Education, Institute of Education Sciences, National Center for Education Evaluation and Regional Assistance.
Gettinger, M., & Stoiber, K. C. (1999). Excellence in teaching: Review of instructional and environmental variables. In C. R. Reynolds & T. B. Gutkin (Eds.), The handbook of school psychology (3rd ed., pp. 933–958). New York, NY: John Wiley.
Gresham, F. M. (1991). Conceptualizing behavior disorders in terms of resistance to intervention. School Psychology Review, 20, 23–36.
Howell, R., Patton, S., & Deiotte, M. (2008). Understanding response to intervention (pp. 65–69). Bloomington, IN: Solution Tree.
Individuals with Disabilities Education Improvement Act of 2004, 20 U.S.C. § 1414 (b)(6) (2005).
Karweit, N. (1982). Time on task: A research review (Report No. 332). Baltimore, MD: Johns Hopkins University, Center for Social Organization of Schools; Washington, DC: National Commission on Excellence in Education.
Kavale, K. A., & Forness, S. R. (1999). Effectiveness of special education. In C. R. Reynolds & T. B. Gutkin (Eds.), The handbook of school psychology (3rd ed., pp. 984–1024). New York, NY: Wiley.
Kurns, S., & Tilly, W. D., III. (2008, May). Response to intervention blueprints for implementation: School building level. Alexandria, VA: National Association of State Directors of Special Education. Retrieved from
http://www.nasdse.org/Portals/0/SCHOOL.pdf
Laurits R. Christensen Associates. (2010). A cost analysis of early literacy, reading, and mathematics assessments: Star, AIMSweb, DIBELS, and TPRI. Madison, WI: Author. Retrieved from http://doc.renlearn.com/KMNet/R003711606GF4A4B.pdf
Marston, D., Fuchs, L. S., & Deno, S. (1986). Measuring pupil progress: A comparison of standardized achievement tests and curriculum related measures. Assessment for Effective Intervention, 11(2), 77–90. Retrieved from
http://aei.sagepub.com/cgi/content/abstract/11/2/77
Marston, D., Muyskens, P., Lau, M., & Canter, A. (2003). Problem-solving model for decision making with high-incidence disabilities: The Minneapolis experience. Learning Disabilities Research and Practice, 18(3), 187–200.
Marzano, R. (2003). What works in schools: Translating research into action. Alexandria, VA: National Association of State Directors of Special Education.
Minneapolis Public Schools. (2001). Problem solving model: Introduction for all staff. Minneapolis, MN: Author.
National Association of State Directors of Special Education and Council of Administrators of Special Education. (2006). Response to intervention: NASDSE and CASE white paper on RTI. Retrieved from
http://www.nasdse.org/Portals/0/Documents/Download%20Publications/RtIAnAdministratorsPerspective1-06.pdf
National Research Center on Learning Disabilities. (2007). School-based RTI practices: Parent involvement. Retrieved from http://www.nrcld.org/rti_practices/index.html
Nelson, J. M. (2008). Beyond correlational analysis of the Dynamic Indicators of Basic Early Literacy Skills (DIBELS): A classification validity study. School Psychology Quarterly, 23(4), 542–552.
Nelson, J. M. (2009). Psychometric properties of the Texas Primary Reading Inventory for early reading screening in kindergarten. Assessment for Effective Intervention, 35(1), 45–53.

©Copyright 2016 Renaissance Learning, Inc. All rights reserved. 37
©Copyright 2016 Renaissance Learning, Inc. All rights reserved. 38
Papanicolaou, A., Simos, P., Breier, J., Fletcher, J., Foorman, B., Francis, D., ... Davis, R.N. (2003). Brain mechanisms for reading in children with and without dyslexia: A review of studies of normal development and plasticity. Developmental
Neuropsychology, 24(2 & 3), 593–612. Retrieved from http://www.informaworld.com/smpp/content~content=a784400507~db=all
Renaissance Learning. (2010). Star Reading: Technical manual. Wisconsin Rapids, WI: Author. Available by request to [email protected]
Shinn, M. (1989). Curriculum-based measurement: Assessing special children. New York, NY: Guilford.
Sugai, G., & Horner, R. (1994). Including students with severe behavior problems in general education settings: Assumptions, challenges and solutions. In J. Marr, G. Sugai, & G. Tindal (Eds.), The Oregon Conference Monograph, Vol. 6 (pp. 102–120).
Eugene: University of Oregon.
Szadokierski, I., & Burns, M. K. (2008). Analogue evaluation of the effects of opportunities to respond and ratios of known items within drill rehearsal of Esperanto words. Journal of School Psychology, 46, 593–609.
Tilly, W. D., III. (2003, December). How many tiers are needed for successful prevention and early intervention? Heartland Area Education Agency’s evolution from four to three tiers. Presented at National Research Center on Learning Disabilities RTI
Symposium, Kansas City, MO.
Tilly, W. D., III. (2007, January). Response to intervention on the ground: Diagnosing the learning enabled. Presentation to Alaska Department of Education and Early Development Winter Education Conference, Informing Instruction: Improving
Achievement, Johnston, IA. Retrieved from http://www.eed.state.ak.us/nclb/2007wc/tilly_3phases_of_implementation_breakout.ppt
Tomlinson, C. (1999). The differentiated classroom: Responding to the needs of all learners. Alexandria, VA: Association for Supervision and Curriculum Development.
Treptow, M. A., Burns, M. K., & McComas, J. J. (2007). Reading at the frustration, instructional, and independent levels: Effects of student time on task and comprehension. School Psychology Review, 36, 159–166.
Valencia, S. W., Smith, A. T., Reece, A. M., Li, M., Wixon, K. K., Newman, H. (2010). Oral reading fluency assessment: Issues of construct, criterion, and consequential validity. Reading Research Quarterly, 45(3), 270–291.
Wedl, R. (2005). Response to intervention: An alternative to traditional eligibility criteria for students with disabilities. Retrieved from http://www.educationevolving.org/pdf/Response_to_Intervention.pdf
Wright, J. (2007). RTI toolkit: A practical guide for schools (p. 55). Port Chester, NY: National Professional Resources.
Ysseldyke, J. (2008). Frequently asked questions about response to intervention (RTI): It’s all about evidence-based instruction, monitoring student progress, and data-driven decision making. Wisconsin Rapids, WI: Renaissance Learning.
General RTIBijou, S. W. (1970). What psychology has to offer education: Now. Journal of Applied Behavior Analysis, 3(1), 65–71.
Burns, M. K., Appleton, J. J., & Stehouwer, J. D. (2005). Meta-analysis of response-to-intervention research: Examining field-based and research-implemented models. Journal of Psychoeducational Assessment, 23, 381–394.
Burns, M. K., Hall-Lande, J., Lyman, W., Rogers, C., & Tan, C. S. (2006). Tier II interventions within response-to-intervention: Components of an effective approach. National Association of School Psychologists Communiqué, 35(4), 38–40.
Christ, T. J., Burns, M. K., & Ysseldyke, J. (2005). Conceptual confusion within response-to-intervention vernacular: Clarifying meaningful differences. NASP Communique, 34(3). Retrieved from wwwnasponline.org
Daly, E. J., Glover, T., & McCurdy, M. (2006). Response to intervention: Technical assistance document. Lincoln, NE: Nebraska Department of Education, RtI Ad-Hoc Committee & the University of Nebraska.

Daly, E. J., Kupzyk, S., Bossard, M., Street, J., & Dymacek, R. (2008). Taking RTI “to scale”: Developing and implementing a quality RTI process. Journal of Evidence-Based Practices for Schools, 9(2), 102–126.
Fuchs, D., Mock, D., Morgan, P., & Young, C. (2003). Responsiveness-to-intervention: Definitions, evidence, and implications for the learning disabilities construct. Learning Disabilities: Research and Practice, 18, 157–171.
Griffiths, A. J., Parson, L. B., Burns, M. K., VanDerHyden, A. M., & Tilly, W. D., III. (2007). Response to intervention: Research for practice. Alexandria, VA: National Associtaion of State Directors of Special Education.
Heller, K. A., Holtzman, W., & Messick, S. (Eds.). (1982). Placing children in special education: A strategy for equity. Washington, DC: National Academy Press.
Jimerson, S., Burns, M. K., & VanDerHeyden, A. M. (Eds.). (2007). The handbook of response to intervention: The science and practice of assessment and intervention. New York, NY: Springer.
Johnson, E., Mellard, D.F., Fuchs, D., & McKnight, M.A. (2006). Responsiveness to intervention (RTI): How to do it. Lawrence, KS: National Research Center on Learning Disabilities. Retrieved from http://nrcld.org/rti_manual/index.html
Kovaleski, J. F. (2007). Potential pitfalls of response to intervention. In S. R. Jimerson, M. K. Burns, & A. VanDerHeyden (Eds.), Handbook of response to intervention: The science and practice of assessment and intervention (pp. 80–92).
New York, NY: Springer.
Kovaleski, J. F. (2007). Response to intervention: Considerations for research and systems change. School Psychology Review, 36(4), 638–646.
Kovaleski, J. F., & Pedersen, J. A. (2007). Best practices in data-analysis teaming. In A. Thomas & J. Grimes (Eds.), Best practices in school psychology V (Chapter 6, Vol. 2). Wakefield, UK: The Charlesworth Group.
Mesmer, E. M., & Mesmer, H. E., (2008). Response to intervention (RTI): What teachers of reading need to know. The Reading Teacher, 62(4), 280–290.
National Center on Response to Intervention, American Institutes for Research. www.rti4success.org (Supported by U.S. Department of Education, Office of Special Education Programs)
Pennsylvania Department of Education. (n.d.). Response to intervention (RtI): What it is and what it’s not! Harrisburg, PA: Pennsylvania Department of Education, Bureau of Special Education, Pennsylvania Training and Technical
Assistance Network.
Samuels, C. A. (2008). Embracing response to intervention. Education Week. Retrieved from www.edweek.org
Samuels, C. A. (2008). Response to intervention sparks interest, questions. Education Week. Retrieved from www.edweek.org
Shapiro, E. S. (2000). School psychology from an instructional perspective: Solving big, not little problems. School Psychology Review, 29, 560–572.
Speece, D. L., & Case, L. P. (2001). Classification in context: An alternative approach to identifying early reading disability. Journal of Educational Psychology, 93(4), 735–749.
Sugai, G. (2006, July). The history of the three tier model. Paper presented at the Annual OSEP Project Director’s Conference, Washington, DC.
Tilly, W. D., III. (2006, June). Response to intervention on the ground: Diagnosing the learning enabled. Presentation to Orange County Department of Education.
U.S. Department of Education, Institute of Education Sciences: What Works Clearing House. (2007). Beginning reading [Review of Accelerated Reader]. Washington, DC: Author.
©Copyright 2016 Renaissance Learning, Inc. All rights reserved. 39

©Copyright 2016 Renaissance Learning, Inc. All rights reserved. 39
U.S. Department of Education, Office of Special Education and Rehabilitative Services. (2002). A new era: Revitalizing special education for children and their families. Washington, DC: Author.
U.S. Department of Education, Office of Special Education. (2006). Toolkit on teaching and assessing students with disabilities. Washington, DC: Author. Retrieved from www.osepideasthatwork.org/toolkit/index.asp
Yeh, S. S. (2007). The cost-effectiveness of five policies for improving student achievement. American Journal of Evaluation, 28(4), 416–436.
Academic engaged time (AET)Brady, M., Clinton, D., Sweeney, J. Peterson, M., & Poynor, H. (1977). Instructional dimensions study. Washington, DC: Kirschner Associates.
Burns, M. K., & Dean, V. J. (2005). Effect of drill ratios on recall and on-task behavior for children with learning and attention difficulties. Journal of Instructional Psychology, 32, 118–126.
Carroll, J. (1963). A model of school learning. Teachers College Record, 64, 723–733.
Ellis, T. I. (1984). Extending the school year and day (ERIC Digest No. 7). Eugene, OR: ERIC Clearinghouse on Educational Management. Retrieved from http://eric.ed.gov/PDFS/ED259450.pdf
Fisher, C. W., Filby, N. N., Marliave, R. S., Cahen, L. S., Dishaw, M. M., Moore, J. E., & Berliner, D. C. (1978). Teaching behaviors: Academic learning time and student achievement: Final report of phase III-B, Beginning teacher evaluation study. San Francisco, CA: Far West Laboratory for Educational Research and Development.
Frederick, W. C. (1977). The use of classroom time in high schools above or below the median reading score. Urban Education, 21(4), 459–465.
Gettinger, M. (1984). Achievement as a function of time spent in learning and time needed for learning. American Educational Research Journal, 21(3), 617–628.
Gettinger, M. (1985). Time allocated and time spent relative to time needed for learning as determinants of achievement. Journal of Educational Psychology, 77(1), 3–11.
Gettinger, M. (1989). Effects of maximizing time spent and minimizing time needed for learning on pupil achievement. American Educational Research Journal, 26(1), 73–91.
Kuceris, M. (1982). Time on the right task can boost student success. Executive Educator, 4(8), 17–19.
Squires, D., Huitt, W., & Segars, J. (1983). Effective schools and classrooms: A research-based perspective. Alexandria, VA: Association for Supervision and Curriculum Development.
Stallings, J., & Kaskowitz, D. (1974). Follow through classroom observation evaluation, 1972–1973. Menlo Park, CA: Stanford Research Institute.
AssessmentBloom, B. S., Hastings, J. T., & Madaus, G. F. (1971). Handbook on formative and summative evaluation of student learning. New York, NY: McGraw-Hill.
Burns, M. K. (2007). Reading at the instructional level with children identified as learning disabled: Potential implications for response-to-intervention. School Psychology Quarterly, 22, 297–313.
Deno, S. L., Mirkin, P. K., & Chiang, B. (1982). Identifying valid measures of reading. Exceptional Children, 49(1), 36–45.
Jenkins, J. R., & Johnson, E. (n.d.). Universal screening for reading problems: Why and how should we do this? Retrieved from www.rtinetwork.org
McLeod, S., & Ysseldyke, J. (2007). Best practices in digital technology usage by data-driven school psychologists. In A. Thomas & J. Grimes (Eds.), Best practices in school psychology V (Chapter 117, Vol. 5). Wakefield, UK: The Charlesworth Group.
©Copyright 2016 Renaissance Learning, Inc. All rights reserved. 40

Salvia, J., Ysseldyke, J., & Bolt, S. (2010). Assessment: In special and inclusive education (11th ed.). Belmont, CA: Wadsworth Publishing.
Shapiro, E. S. (1992). Assessment of special education students in regular education programs: Linking assessment to instruction. Elementary School Journal, 92, 283–296.
Shapiro, E. S. (1996). Academic skills problems: Direct assessment and intervention (2nd ed.). New York, NY: Guilford Press.
Shapiro, E. S. (2007). Best practices in setting progress monitoring goals for academic skill improvement. In A. Thomas & J. Grimes (Eds.), Best practices in school psychology V (Chapter 8, Vol. 2). Wakefield, UK: The Charlesworth Group.
Shapiro, E. S., Edwards, L., & Zigmond, N. (2005). Progress monitoring of mathematics among students with learning disabilities. Assessment for Effective Intervention, 30, 15–32.
Stiggins, R. (2005). From formative assessment to assessment for learning: A path to success in standards-based schools. Phi Delta Kappan, 87, 324–328.
Wiliam, D. (2006). Formative assessment: Getting the focus right. Educational Assessment, 11, 283–289.
Ysseldyke, J., & Bolt, D. M. (2007). Effect of technology-enhanced continuous progress monitoring on math achievement. School Psychology Review, 35(3), 453–467.
Curriculum-based measurement (CBM)Ardoin, S. P., & Christ, T. J. (2009). Curriculum-based measurement of oral reading: Standard errors associated with progress monitoring outcomes from DIBELS, AIMSweb, and an experimental passage set. School Psychology Review, 38(2), 266–283.
Burns, M. K. (2008). Response to intervention at the secondary level. Principal Leadership, 12–15.
Christ, T. J. (2006). Short term estimates of growth using curriculum-based measurement of oral reading fluency: Estimates of standard error of the slope to construct confidence intervals. School Psychology Review, 35(1), 128–133.
Christ, T. J., & Schanding, G. T. (2007). Curriculum-based Measures of computational skills: A comparison of group performance in novel, reward, and neutral conditions. School Psychology Review, 36(1), 147–158.
Christ, T. J., & Silberglitt, B. (2007). Estimates of the standard error of measurement for curriculum-based measures of oral reading fluency. School Psychology Review, 36(1), 130–146.
Embretson, S. E. (1996). The new rules of measurement. Psychological Assessment, 8, 341–349.
Fuchs, D., Fuchs, L. S., McMaster, K. N., & Al Otaiba, S. (2003). Identifying children at risk for reading failure: Curriculum-based measurement and the dual-discrepancy approach. In H. L. Swanson, K. R. Harris, & S. Graham (Eds.), Handbook of learning
disabilities (pp. 431–449). New York, NY: Guildford Press.
Hintze, J., & Christ, T. (2004). An examination of variability as a function of passage variance in CBM progress monitoring. School Psychology Review, 33, 204–217.
Hintze, J., Daly, E., & Shapiro, E. (1998). An investigation of the effects of passage difficulty level on outcomes of oral reading fluency progress monitoring. School Psychology Review, 27, 433−436.
Poncy, B., Skinner, C., & Axtell, P. (2005). An investigation of the reliability and standard error of measurement of words read correctly per minute using curriculum based measurement. Journal of Psychoeducational Assessment, 23, 326−338.
Shapiro, E. S., Keller, M. A., Lutz, J. G., Santoro, L. E., & Hintze, J. M. (2006). Curriculum-based measures and performance on state assessment and standardized tests: Reading and math performance in Pennsylvania. Journal of
Psychoeducational Assessment, 24(1), 19–35.
Shapiro, E. S., Solari, E., & Petscher, Y. (2008). Use of a measure of reading comprehension to enhance prediction on the state high stakes assessment. Learning and Individual Differences, 18(3), 316–328.
©Copyright 2016 Renaissance Learning, Inc. All rights reserved. 41
©Copyright 2016 Renaissance Learning, Inc. All rights reserved. 41
VanDerHyden, A. M., & Burns, M. K. (2008). Examination of the utility of various measures of mathematics proficiency. Assessment for Effective Intervention, 33(4), 215–224.
Van Hook, J. A., III. (2008). The reliability and validity of screening measures in reading (Unpublished doctoral dissertation). Louisiana State University, Baton Rouge, Louisiana.
Positive behavior supportSandomierski, T., Kincaid, D., & Algozzine, B. (n.d.). Response to intervention and positive behavior support: Brothers from different mothers or sisters with different misters? Positive Behavioral Interventions and Supports Newsletter, 4(2).
Retrieved from www.pbis.org
Sugai, G., Horner, R. H., Sailor, W., Dunlap, G., Eber, L., Lewis, T., ... Nelson, M. (2005). School-wide positive behavior support: Implementers’ blueprint and self-assessment. Eugene: University of Oregon.
Walker, H. M., Horner, R. H., Sugai, G., Bullis, M., Sprague, J. R., Bricker, D., & Kaufman, M. J. (1996). Integrated approaches to preventing antisocial behavior patterns among school-age children and youth. Journal of Emotional and Behavioral Disorders,
4, 194–209.
Problem-solving teamsBurns, M. K. (2007). RTI will fail, unless . . . National Association of School Psychology Communiqué, 35(5), 38–40.
Burns, M. K., Peters, R., & Noell, G. H. (2008). Using performance feedback to enhance the implementation integrity of the problem-solving team process. Journal of School Psychology, 46, 537–550. Doll, B., Haack, K., Kosse, S., Osterloh, M., Siemers, E., & Pray, B. (2005). The dilemma of pragmatics: Why schools don’t use quality team consultation practices. Journal of Educational & Psychological Consultation, 16, 127–155.
Graden, J. L., Casey, A., & Christenson, S. L. (1985). Implementing a pre-referral intervention system: Part I. The model. Exceptional Children, 51, 377–384.
Ikeda, M. J., Tilly, D. W., III, Stumme, J., Volmer, L., & Allison, R. (1996). Agency-wide implementation of problem-solving consultation: Foundations, current implementation, and future directions. School Psychology Quarterly, 11, 228–243.
Kovaleski, J. F., Gickling, E. E., Morrow, H., & Swank, P. R. (1999). High versus low implementation of instructional support teams: A case for maintaining program fidelity. Remedial and Special Education, 20, 170–183. Kovaleski, J. F., & Glew, M. C. (2006). Bringing instructional support teams to scale: Implications of the Pennsylvania experience. Remedial and Special Education, 27(1), 16–25.
Kovaleski, J. F., Tucker, J. A., & Duffy, D. J. (1995). School reform through instructional support: The Pennsylvania initiative (Part I). Communique, 23(8).
Prasse, D. P. (2006). Legal supports for problem-solving systems. Remedial and Special Education, 27, 7–15.
Telzrow, C. F., McNamara, K., & Hollinger, C. L. (2000). Fidelity of problem-solving implementation and relationship to student performance. School Psychology Review, 29, 443–461.
Student practiceDehaene, S. (1999). The number sense: How the mind creates mathematics. New York, NY: Oxford University Press. Dehaene, S. (2009). Reading in the brain: The science and evolution of a human invention. New York, NY: Viking.
Gladwell, M. (2008). Outliers: The story of success. New York, NY: Little, Brown and Company. Willingham, D. T. (2009). Why don't students like school? A cognitive scientist answers questions about how the mind works and what it means for the classroom. San Francisco, CA: John Wiley & Sons.
©Copyright 2016 Renaissance Learning, Inc. All rights reserved. 42

Acknowledgements Renaissance sincerely thanks the following individuals for lending their expertise in Response to Intervention to the creation of this guide.
Matthew K. Burns, Ph.D., is associate dean for research at the University of Missouri. Prior to this post, he served as an associate professor of educational psychology and coordinator of the School Psychology Program at the University of Minnesota. He has authored more than 100 national publications including co-editing the Handbook of Response-to-Intervention: The Science and Practice of Assessment and Intervention and co-authoring three additional books about RTI. Burns also frequently conducts trainings regarding RTI at the national, state, local, and school building levels, and he has assisted in local school district implementation efforts in dozens of districts across many states. Burns is editor of Assessment for Effective Intervention, associate editor for School Psychology Review, and on the editorial board of three other journals. He was a member of the task force and co-author of School Psychology: A Blueprint for Training and Practice III. Before becoming an academic, Burns was a practicing school psychologist and special education administrator in three districts across two states.
Joseph F. Kovaleski, D.Ed., is a professor of educational and school psychology and director of the Program in School Psychology at Indiana University of Pennsylvania. He is also co-principal investigator for the Pennsylvania RTI Project through the Pennsylvania Training and Technical Assistance Network (PaTTAN). Kovaleski earned his doctorate in school psychology from the Pennsylvania State University in 1980. During 32 years in the field, Kovaleski has worked as a school psychologist, coordinator of preschool handicapped services, and supervisor of clinical services for school districts and regional agencies. During the 1990s, he directed Pennsylvania’s Instructional Support Team (IST) Project. He has consulted with school districts and departments of education throughout the US.
The late Edward S. Shapiro, Ph.D., was a professor of school psychology and director of the Center for Promoting Research to Practice in the College of Education at Lehigh University. He was the 2006 winner of the American Psychological Association’s Senior Scientist Award, was recognized in 2007 by the Pennsylvania Psychological Association, and received Lehigh University’s Eleanor and Joseph Lipsch Research Award. Shapiro authored 10 books and was best known for his work in curriculum-based assessment and non-standardized methods of assessing academic skills problems. Among his many projects, Shapiro co-directed a federal project focused on the development of a multi-tiered, RTI model in two districts in Pennsylvania, and he was awarded a U.S. Department of Education grant to train school psychologists as facilitators of RTI processes. He also collaborated with the Pennsylvania Department of Education in developing and facilitating the implementation of the state’s RTI methodology. James Ysseldyke, Ph.D., is Emma Birkmaier Professor of Educational Leadership in the Department of Educational Psychology at the University of Minnesota. He has been educating school psychologists and researchers for more than 35 years. Ysseldyke has served the University of Minnesota as director of the Minnesota Institute for Research on Learning Disabilities, director of the National School Psychology Network, director of the National Center on Educational Outcomes, director of the School Psychology Program, and associate dean for research. Professor Ysseldyke’s research and writing have focused on enhancing the competence of individual students and enhancing the capacity of systems to meet students’ needs. He is an author of major textbooks and more than 300 journal articles. Ysseldyke is conducting a set of investigations on the use of technology-enhanced progress-monitoring systems to track the performance and progress of students in urban environments. Ysseldyke chaired the task forces that produced the three Blueprints on the Future of Training and Practice in School Psychology, and he is former editor of Exceptional Children, the flagship journal of the Council for Exceptional Children. Ysseldyke has received awards for his research from the School Psychology Division of the American Psychological Association, the American Educational Research Association, and the Council for Exceptional Children. The University of Minnesota presented him a distinguished teaching award, and he received a distinguished alumni award from the University of Illinois.
©Copyright 2016 Renaissance Learning, Inc. All rights reserved. 43
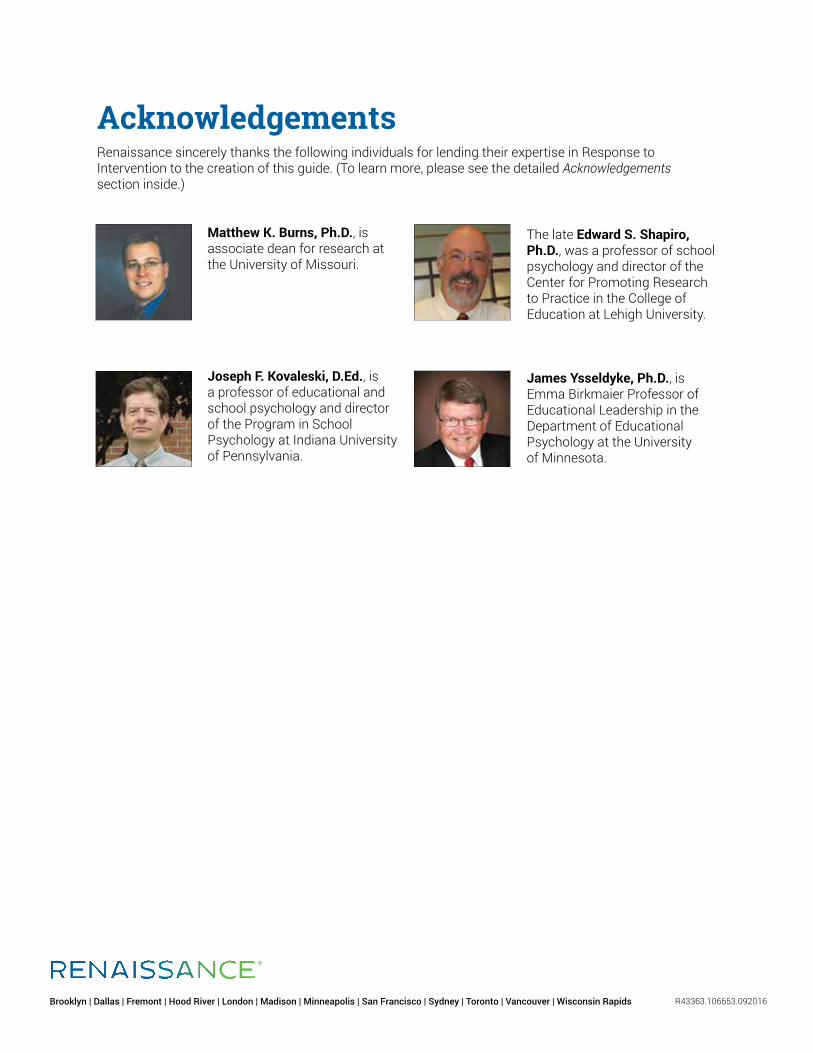
©Copyright 2016 Renaissance Learning, Inc. All rights reserved. 43
Acknowledgements Renaissance sincerely thanks the following individuals for lending their expertise in Response to Intervention to the creation of this guide. (To learn more, please see the detailed Acknowledgements section inside.)
Matthew K. Burns, Ph.D., is associate dean for research at the University of Missouri.
Joseph F. Kovaleski, D.Ed., is a professor of educational and school psychology and director of the Program in School Psychology at Indiana University of Pennsylvania.
The late Edward S. Shapiro, Ph.D., was a professor of school psychology and director of the Center for Promoting Research to Practice in the College of Education at Lehigh University.
James Ysseldyke, Ph.D., is Emma Birkmaier Professor of Educational Leadership in the Department of Educational Psychology at the University of Minnesota.
R43363.106653.092016Brooklyn | Dallas | Fremont | Hood River | London | Madison | Minneapolis | San Francisco | Sydney | Toronto | Vancouver | Wisconsin Rapids