Embed Size (px)
Citation preview

Making Personal TravelPlanning Work:Research Report
December 2007
Integrated Transport Planning Ltd32a Stoney StreetThe Lace Market
Nottingham NG1 1LL
Tel: 0115 988 6904Fax: 0115 924 7101
Contact: Jon ParkerE-mail: [email protected]
www.itpworld.net
Jon Parker, Integrated Transport Planning LtdLynsey Harris, Integrated Transport Planning Ltd
Kiron Chatterjee, University of the West of England, BristolRichard Armitage, Richard Armitage Transport Consultancy
Jo Cleary, Cleary Stevens ConsultingPhil Goodwin, University of the West of England, Bristol
While the Department for Transport (DfT) has made every effort to ensure theinformation in this document is accurate, DfT does not guarantee the accuracy,completeness or usefulness of that information and it cannot accept liability for anyloss or damages of any kind resulting from reliance on the information or guidancethis document contains. The views expressed are those of the authors and notnecessarily the organisations they represent, or the Department for Transport, or the many contributors and authors of the references used, whose help is gratefullyacknowledged.
Department for TransportGreat Minster House76 Marsham StreetLondon SW1P 4DR
Telephone 020 7944 8300Web site www.dft.gov.uk
© Queen’s Printer and Controller of Her Majesty’s Stationery Office, 2007, exceptwhere otherwise stated
Copyright in the typographical arrangement rests with the Crown.
This publication, excluding logos, may be reproduced free of charge in any formator medium for non-commercial research, private study or for internal circulationwithin an organisation. This is subject to it being reproduced accurately and notused in a misleading context. The copyright source of the material must beacknowledged and the title of the publication specified.
To reproduce maps, contact Ordnance Survey via their web sitewww.ordnancesurvey.gov.uk/copyright or write to Customer Service Centre,Ordnance Survey, Romsey Road, Southampton SO16 4GU.
For any other use of this material, apply for a Click-Use Licence atwww.opsi.gov.uk/click-use/index.htm, or by writing to the Licensing Division, Officeof Public Sector Information, St Clements House, 2–16 Colegate, Norwich NR31BQ, fax 01603 723000, e-mail [email protected]
This is a value added publication which falls outside the scope of the Public SectorInformation Click-Use Licence.
To order further copies contact:DfT PublicationsPO Box 236Wetherby LS23 7NB
Tel: 0870 1226 236Fax: 0870 1226 237Textphone: 0870 1207 405E-mail: [email protected] online via www.dft.gov.uk
Printed in Great Britain December 2007 on paper containing at least 75% recycled fibre.
Product Code 78CRN02908A
Cover photo acknowledgementsFrom left to right: Photofusion Picture Library/Alamy; Smarter Travel Sutton;Nottingham City Transport Limited (top); Nottingham City Council (bottom); Brightonand Hove City Council; J. Bewley Sustrans/Socialdata
ContentsPage
Acknowledgements 6
Executive summary 7
1 Introduction 11
2 Study objectives 12
Project steering group 12Project study team 13
3 Study methodology 14
Stage 1: Literature review 14Stage 2: Selection of case studies 14Stage 3: Expert panel 15Stage 4: Case study and practitioner interviews 16Stage 5: Reporting and best practice guidelines 16
4 Background 17
Some standard definitions 18
5 Objective 1: The key elements of success 27
The reported success of the case study sites 27What makes an effective project? 39Project process 39Stage 1: Planning 39Stage 2: Pre-intervention stage 50Stage 3: Contact and advice stage 57Stage 4: Post-project evaluation 65Geographic and population context 65
6 Objective 2: Barriers (and solutions) 78
Scepticism 78Lack of political support 79Lack of funding 80Risk of failure 81Inadequate scale 81Lack of interest of targeted audience 82PTP fatigue 82Project branding/identity 83Contact barriers 84Lack of engagement 84Poor first impressions of travel advisors 84Lack of staff continuity and recruiting enough staff 85Negative media 85Inadequate recording procedures 85Lack of adequate information materials and incentives 86Coincidence with the introduction of new infrastructure or services 87

Poor quality of existing infrastructure 88Difficulty in achieving home visits 88Lack of transparent data analysis 89Inadequate evaluation methodology 90Limited consultancy competition 90
7 Objective 3: The business case 92
Context 92Cost–benefit analysis: background 92Cost–benefit analysis of PTP schemes 93UK PTP projects 95Project budget allocations 96Long-term cost-effectiveness – economies of scale 97
8 Objective 4: Funding 100
Current funding 100Future funding 102
9 Objective 5: Evaluation 107
Introduction 107Reasons for evaluating PTP outcomes 107Sufficiency of existing evidence on PTP 108Principles of evaluation 109How survey methodology addresses evaluation principles 110Statistical inference 114Past experience of PTP evaluation 115Lessons from past PTP evaluations 116Current experience from PTP evaluations 118Critical assessment of the evaluations 124Recommendations on future evaluation needs 127
10 Objective 6: Long-term sustainability 130
UK evidence 130Overseas experience 131Other issues 133
11 Other issues and opportunities 136
References 142
Appendix A review of theory and practice of PTP 150
Theoretical principles of travel behaviour and marketing 151Theories and principles relevant to social marketing 155How current PTP approaches relate to theory and principles 158Insights on behavioural change from research studies 162References 164

|
List of tablesTable 4.1 Summary of definitionsTable 4.2 Mechanics of behavioural changeTable 5.1 PTP case study project detailsTable 5.2 Changes in modal split measured in project areasTable 5.3 Changes in modal split attributed to PTP in project areasTable 5.4 Changes in car use in project areasTable 5.5 Reported change in mobility by participants
(mean values, per day)Table 5.6 Information materials issuedTable 5.7 Incentives distributedTable 5.8 Segmentation by PTP approachTable 5.9 Household response rates by segmented groupsTable 5.10 A comparison of project performance and accessibility (Perth)Table 5.11 Change in car trips (by time of day, age and gender)Table 5.12 Reported change in trips (by spatial distribution)Table 5.13 Effectiveness and cost-effectiveness of marketing techniquesTable 5.14 Key performance indicators (Melbourne PTP)Table 7.1 Perth assessment of first year rate of returnTable 7.2 Cost-effectiveness of different PTP projectsTable 7.3 Example project cost breakdownTable 8.1 Funding mechanismsTable 9.1 How survey methodology address evaluation principlesTable 9.2 Case study evaluationsTable 9.3 Theoretical assessment of case study evaluations
against survey criteria
List of figuresFigure 4.1 TravelSmart/IndiMark processFigure 4.2 Map of locations of residential PTP projectsFigure 5.1 Impact of control groups (1)Figure 5.2 Impact of control groups (2)Figure 7.1 Long-term economies of scale (case studies)Figure 7.2 Long-term economies of scale (Transport for London)Figure 10.1 Gloucester long-term behavioural changesFigure 10.2 Sustainability of South Perth projectFigure 10.3 Long-term bus patronage changes (Perth)
6
AcknowledgementsIn preparing this report, the project team are grateful for the contributions of a number ofindividuals and organisations who have offered their time and energy to assist in the widerunderstanding of Personal Travel Planning. In particular, we would wish to thank the following:
Case studies
Cat Ainsworth (Worcestershire County Council)
Colin Ashton Graham
(Government of Western Australia)
Howerd Booth (Lancashire County Council)
Stuart Croucher (Brighton and Hove City Council)
Katherine Evans (Victoria State Government)
Sinead Flavin (Transport for London)
Claire Fleming (Nottinghamshire County Council)
Andy Gibbons (Nottingham City Council)
Mike Ginger (Bristol City Council)
Andrew Gordon (Smarter Travel Sutton)
Beth Hiblin (Peterborough City Council)
Martin Higgitt (Steer Davies Gleave)
Bruce James (Queensland Transport)
Syd Jerram (Noosa Council)
Gary John (Government of Western Australia)
Dan Johnson (Transport for London)
Graham Lunney (Queensland Transport)
Penny Marshall (Government Office North East)
Peter May (Transport for London)
Dawid Maciejewski (First Midland)
Jennie Maybury (Nottingham City Council)
Neil Smith (Sustrans)
Dean Spears (Brighton and Hove City Council)
Alton Twine (Brisbane City Council)
Emilie van de Graaff (Worcestershire County Council)
Any Wardell (Peterborough City Council)
Nigel Walker (Noosa Council)
Charlotte Welch (Brighton and Hove City Council)
Owen Wilson (Darlington Borough Council)
Doug Woodbury (Brisbane City Council)
Alice Woodruff (Victoria State Government)
Steering group
Jacqui Wilkinson (Department for Transport)
Daniel Barrett (Department for Transport)
Tracey Budd (Department for Transport)
Martin Ellis (Department for Transport)
Jeremy Ketley (Department for Transport)
Lisa Buchanan (Steer Davies Gleave)
Sinead Flavin (Transport for London)
James Ryle (Sustrans)
Emilie van de Graaff (Worcestershire County Council)
Expert panel Lynda Addison (Addison and Associates)
Cat Ainsworth (Worcestershire County Council)
Professor Peter Bonsall (Leeds University)
Werner Brög (Socialdata)
Sally Cairns (Transport Research Laboratories and
University College London)
Claire Fleming (Nottinghamshire County Council)
Satoshii Fujii (Tokyo Institute of Technology)
Geoff Gardner (North Yorkshire County Council)
Bruce James (Queensland Transport)
Syd Jerram (Noosa Council)
Rose McArthur (Colin Buchanan)
Professor Stephen Potter (Open University)
Lynn Sloman (Transport for Quality of Life)
Neil Smith (Sustrans)
Any Wardell (Peterborough City Council)
Professor John Whitelegg (York University)
Owen Wilson (Darlington Borough Council)
Other professionalsRichard Ball (Herefordshire County Council)
Franz Barta (Socialdata)
Ric Bravery (Wolverhampton City Council)
Tom Cohen (Steer Davies Gleave)
Sarah Dewar (TravelWise Merseyside)
Derek Halden (Derek Halden Consultancy)
Peter Huntley (Go North East)
Titus Jennings (Socialdata)
Carol Kearney (Calderdale Council)
Professor Peter Stopher (The University of Sydney)
Executive summaryPersonal Travel Planning (PTP) is an approach to delivering targeted informationdirectly to travellers, to help them make sustainable travel choices. It seeks toovercome habitual use of the car, enabling more journeys to be made on foot,bike, bus, train or in shared cars. It can also seek to discourage unnecessarytravel, through the provision of local or site-specific information.
PTP can be applied in a number of contexts, for example schools, workplacesand residential communities. This report considers residential-based PTP. Itcontains evidence collated from an initial review of the literature accompaniedby 12 in-depth case studies, 10 smaller vignette case studies and contributionsfrom a panel of 17 experts in the field of PTP and smarter choices measures.The case study sites provide extensive evidence, collectively accounting forPTP programmes that have targeted 229,000 households.
The report is structured around the six objectives established by theDepartment for Transport for the project, with a synopsis of the findingssummarised below. A seventh objective was to produce a best practice guidefor local authority practitioners on the effective implementation of large-scalepersonal travel planning (built around case studies). This is due to be publishedin early 2008.
Objective 1: Describe the key elements for running a successfulproject and achieving measurable benefits.
Within the UK, PTP has been reported to reduce car driver trips by 11%(amongst the targeted population) and reduce the distance travelled by car by12%. In terms of mode share, this represents a decrease in car driver trips of 4 percentage points, with walking the main beneficiary, having, on average, a reported increase of 3 percentage points. Follow-on benefits from theseimpacts can be expected in terms of wider community benefits, including theimproved health of participants, a greater propensity to use local services, andimproved local air quality.
Whilst evidence suggests that PTP can be applied to any community (reductions in car use are generally consistent across all project areas), practitioners generally agree that the greatest success is likely to be delivered where PTP is based inan area of discrete, self-contained communities with appropriate local facilities,good community networks and locally recognised problems of traffic congestion. The area should ideally have good levels of accessibility (by all sustainabletransport modes), combined with excess capacity on the public transportsystem. A stable (non-transient) population, together with a wider sustainabletransport investment programme, will further enhance the capability of theprogramme to achieve success.
The effectiveness of PTP is enhanced where the project is led by a strongadvocate with commitment and enthusiasm for PTP. This, accompanied byeffective project management and staff who are committed and motivated toachieve the objectives of the PTP project, further improves performance.Increasing the scale of the project has a positive impact upon its cost-effectiveness.
7
Objective 2: Describe the key risks and barriers to running asuccessful project, and how these have been avoidedand/or overcome.
As PTP is a relatively new transport strategy tool, there are a number of barriers to its effective, successful implementation and development. The most important are:
Attitudinal barriers – most notably general scepticism over the validity of theclaims of success, and a lack of understanding/acceptance of projects frompolitical and media interests, as well as the general public.
Localised barriers – including high traffic speeds, a poor public transport offer, and an ‘unfriendly’ street scene, which restricts a possible shift tosustainable modes.
Organisational barriers – such as the availability of (revenue) funding, a lack of organisational capacity to deliver programmes and a lack of businessplanning and project management skills within the transport planning sector.
Assessment barriers – pertaining to the ability to demonstrate the performanceof the projects, including difficulties associated with transparent data analysisand the overall evaluation methodology.
Evidence from large-scale UK projects has demonstrated how all of thesebarriers can be reduced through rigorous planning, political and mediaengagement, creative funding models, robust (yet appropriate) evaluation tools and supporting investment in sustainable transport networks.
Objective 3: Describe the experience that exists in making asuccessful business case.
There is a limited (but growing) body of evidence on the cost-effectiveness of PTP, which draws upon experience both in the UK and more extensivelyoverseas. Effective cost–benefit analysis takes account of a broad range ofimpacts (across different sectors), and typically reports positive cost–benefitfigures in the order of 1:30 over a 10-year period.
The cost-effectiveness of PTP is improved as the scale of implementation isincreased. Large-scale UK PTP projects have demonstrated a value for moneyestimate (in the first year) of between £0.02 and £0.13 per vehicle kilometresaved. PTP typically costs between £20 and £38 per household targeted.
Objective 4: Identify how local authorities have funded campaigns,beyond central Government or European grant.
There has been a strong emphasis on central Government or European grantfunding for PTP projects to date. However, it is generally accepted that, although this has been beneficial to PTP in the short term (enabling the case for PTP tobe established), there is now a need to identify more sustainable long-termfunding sources to develop the implementation of PTP in the future.
8
Department for Transport | Making Personal Travel Planning Work
There is some limited experience of securing annual PTP budgets from LTP and internal funds. PTP project partners (for example, bus operators) havetypically contributed through staff time and project resources (rather thanfinancial contributions).
There is scope for more innovative future funding mechanisms, as the evidencebase grows and project evaluation results lead to greater confidence beingplaced upon the predicted outcomes of planned projects. This could includeregional funding opportunities, contributions from related sectors, developercontributions and sponsorship of promotional materials and information.
Objective 5: Define the key aspects for monitoring and reportingresults. State whether the common framework forevaluating PTP projects developed by DfT’s OperationalResearch Unit has been used, whether it works or hasbeen improved.
The benefits from PTP projects arise from changes in travel behaviour andcontingent impacts, therefore a key part of the evaluation of PTP projects is asystematic investigation of travel behaviour changes and resultant effects.Robust monitoring and evaluation techniques are therefore essential tosubstantiate claims of PTP effectiveness. Evaluation serves both the purpose ofassessing value for money and adaptive learning about PTP design.
Before reviewing the case studies in this project it was apparent that there aremixed signals and opinions on the future need for evaluation of PTP. Resultsfrom a large number of studies are consistent in showing reductions in car useand increases in the use of alternative modes of transport, but some doubtshave been raised that the scale of impacts reported may be exaggerated, and itis suggested that improved evaluation procedures are used to examine this.
The methods selected for evaluation should seek to ensure that, as far aspossible, measured outcomes are valid and reliable. Validity refers to measuringwhat is intended, outcomes being attributable to intervention (and not externalfactors) and outcomes being generalisable to other situations. Reliability refersto repeatability of measured outcomes and is largely related to survey samplesizes used.
Consistency in the evaluations conducted for different PTP projects enablesresults to be compared and synthesised. For large-scale projects, the approachprescribed by the DfT ORU has been largely applied.
While the evaluation results show consistent results, there are some gaps inunderstanding and reporting that are identified (process of behavioural changeexperienced by individuals, disaggregation of results for different participanttypes, sampling errors/confidence intervals, corroborating data for aggregatetravel). It is recommended that independent in-depth evaluations are conductedfor a limited number of projects to further the understanding of the effectivenessof different PTP approaches and their endurability. This will enable futureevaluations to adopt a more pragmatic, limited ‘light touch’ evaluation.
9
Ex Executive Summary
Objective 6: Set out the evidence on the sustainability of results fromprevious campaigns.
There is only limited evidence with which to assess the long-term sustainabilityof previous campaigns due to the ‘young’ age of many UK PTP projects.Additionally, sustained monitoring of PTP projects is very expensive, and hencehas not been a prominent feature of projects delivered to date. In practicalterms, it is often difficult to contact the original participants in the intervention,and monitoring using corroborative data is unreliable if major infrastructure ortransport improvements have taken place in the period since the intervention.As such it is not possible to fully ascertain the long-term impacts of PTPinterventions.
The limited evidence that does exist suggests that travel behaviour is sustainedin the immediate years following the intervention (up to five years afterwards),although further work is required to fully validate these findings.
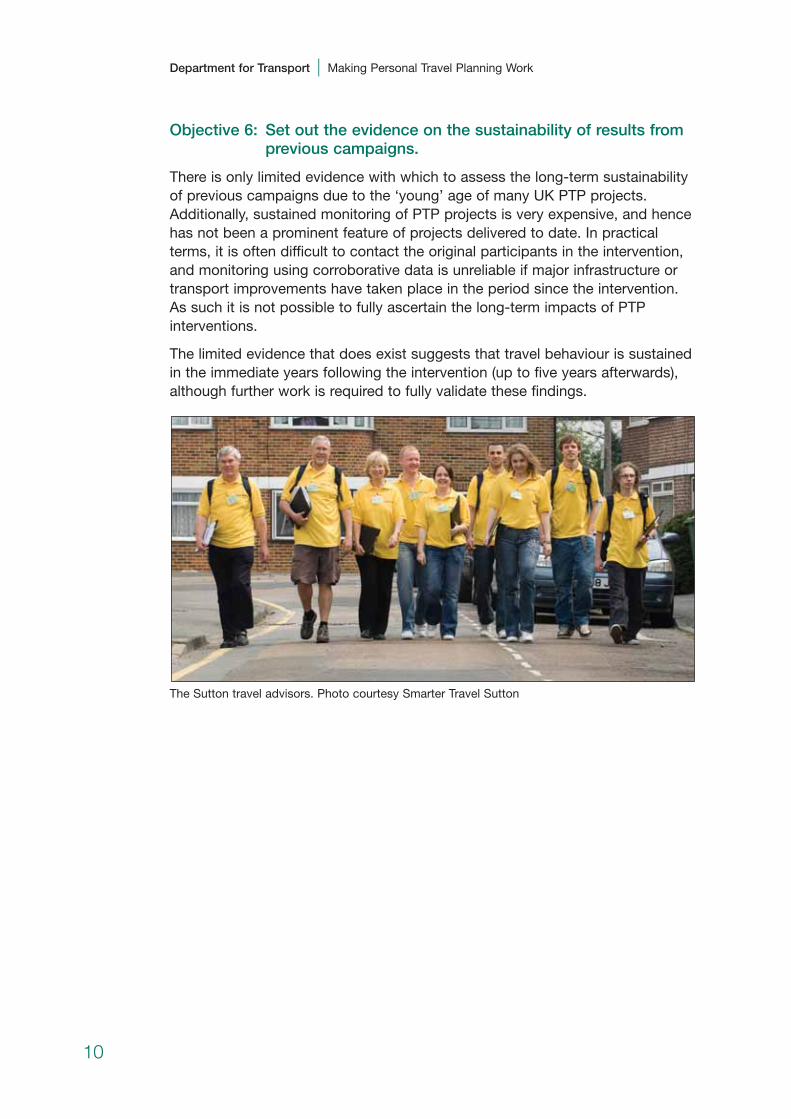
The Sutton travel advisors. Photo courtesy Smarter Travel Sutton
10
Department for Transport | Making Personal Travel Planning Work
1 Introduction1.1 Integrated Transport Planning Ltd, in partnership with Richard Armitage
Transport Consultancy Ltd., Cleary Stevens Consulting and the University of the West of England (UWE), Bristol, has been commissioned by theDepartment for Transport (DfT) to undertake a ‘Review of the effectiveness of Personal Travel Planning’.
1.2 Personal Travel Planning (PTP)1 is defined as a:
a targeted marketing technique providing travel advice based uponpersonal trip patterns that seeks to induce voluntary travel behaviourchanges in favour of more sustainable modes of transport.
1.3 Whilst PTP techniques can be applied in many contexts, this study, inaccordance with the DfT brief, has focused solely on residential-basedPTP schemes.
1.4 PTP provides a relatively new approach to delivering targeted informationdirectly to travellers, to help them make longer-term, sustainable travelchoices. It seeks to overcome psychological barriers to sustainabletransport, enabling more journeys to be made on foot, bike, bus, train orin shared cars. It is unlike typical transport measures, drawing upon the‘principles of persuasion’ and ‘social marketing’ to engage in one-to-onedialogue with project participants. It has been deployed in many differentlocations, on different scales, both in the UK and more extensively overseas.
1.5 This final study report summarises the findings of the six-month study. It examines best practice in PTP, explores in detail different approachesand scales of operation, and critically appraises (within the boundaries of the study objectives) the successes and failures to date (primarilyfocused upon reported findings within the UK, but drawing uponoverseas experience where appropriate).
1.6 In addition to this final report, the outcome of the study is supported bycase study summaries, and a best practice guide (due to be published in2008) aimed at local authority practitioners seeking to deliver future PTPprogrammes. This best practice guide (Objective 7) seeks to shed light onthe key aspects of delivering successful PTP projects, drawing uponsuccessful case study examples to demonstrate how local authoritiescan deliver projects with tangible benefits. It presents a generic process,independent of any one particular commercial consultancy approach,enabling local authorities to be better informed when commissioning theirPTP partner(s), or indeed taking a more active role in delivering their ownprojects in house.
1 PTP has also commonly been known as Personalised Travel Planning, Individualised TravelMarketing and Personalised Journey Planning. 11
2 Study objectives2.1 The specific objectives of the study were defined in the DfT brief, and for
clarity, are as follows:
Objective 1: Identify the key elements for running a successful projectand achieving measurable and cost-effective benefits in terms of carmileage reductions, carbon emissions and other policy objectives. Thisshould consider both the procuring of services to run the campaign, andtraining to run campaigns in house.
Objective 2: Identify the key risks and barriers to running a successfulproject and achieving measurable and cost-effective benefits, and howthese have been avoided and/or overcome.
Objective 3: Successful practice in making a business case.
Objective 4: Identify how local authorities have funded campaigns,beyond central Government or European grant (e.g. the authorities’ ownrevenue budgets, Local Area Agreements, developer contributions).
Objective 5: Identify the key aspects for monitoring and reporting results,including whether the common framework for monitoring and evaluatingfuture personal travel planning projects developed by DfT’s OperationalResearch Unit was used, whether it works or has it been improved.
Objective 6: Identify and assess evidence on the sustainability of resultsfrom previous campaigns.
Objective 7: Draft good practice guidelines for local authoritypractitioners on the effective implementation of large-scale personaltravel planning, built around case studies.
Project steering group
2.2 Whilst the study was led by officers from the DfT, the client teamcomprised a wider steering group, consisting of:
• Jacqui Wilkinson, Martin Ellis, Daniel Barrett, Tracey Budd, JeremyKetley (DfT);
• James Ryle, Neil Smith (Sustrans);
• Lisa Buchanan (Steer Davies Gleave);
• Emilie Van De Graaff (Worcestershire County Council);
• Sinead Flavin (Transport for London).
2.3 Members of the steering group also partook in the expert paneldiscussion (see Chapter 3).
12
Project study team
2.4 The project team comprised a number of practitioners and academicswith experience in developing, delivering and evaluating ‘smarterchoices’ measures. The named individuals are:
• Jon Parker, Integrated Transport Planning Ltd (Project Manager);
• Lynsey Harris, Integrated Transport Planning Ltd;
• Rebecca Laws, Integrated Transport Planning Ltd;
• Richard Armitage, Richard Armitage Transport Consultancy;
• Kath Tierney, Richard Armitage Transport Consultancy;
• Jo Cleary, Cleary Stevens Consulting;
• Dr. Kiron Chatterjee, University of the West of England, Bristol;
• Professor Phil Goodwin, University of the West of England, Bristol.
13
| 2. Study Objectives

3 Study methodology3.1 The study is divided into the following distinct phases:
Stage 1: Literature review
3.2 The Literature Review was undertaken during a four-week period,commencing January 2007, and an internal project report was submittedto the Department for Transport and the study steering group in February2007. The aim of the literature review was to identify potential case studysites for further detailed investigation and case study interview.
Stage 2: Selection of case studies
3.3 Based upon the schemes identified in stage 1, and the response to apress release inviting case study leaders to nominate themselves (issuedto the transport and planning journals and the Local Transport PlanningNetwork of local government officers), the case studies were selected inconsultation with the Department for Transport, with consideration of thefollowing factors:
• geographic coverage;
• variety of approach to PTP;
• scale of scheme;
• scheme maturity;
• scheme performance.
3.4 The sites identified for full case study interview were:
• Lancashire
• Brighton
• London (Kingston, Sutton, Haringey)
• Bristol
• Worcester
• Darlington
• Peterborough
• Nottingham (two separate projects)
• Brisbane (Australia)
• Perth (Australia)
• Melbourne (Australia)
14
3.5 In addition to the sites identified for full, detailed case-study interviews, a number of sites of interest were identified which were either of smallerscale, or adopted a less intensive approach to PTP, and were consideredworthy of telephone discussion or short half-day site visits. These sites were:
• Doncaster
• Queen Elizabeth Park, Surrey
• Gloucester
• Merseyside
• Wolverhampton
• Halifax
• Hereford
• Weston-super-Mare
Stage 3: Expert panel
3.6 Within the emerging ‘smarter choices’ arena, there are a number ofpractitioners with broad cross-cutting experience, with whom it was feltan active dialogue would assist the study. As such, an expert panel wasconvened by the project team to provide external support to the study.This support was forthcoming in two ways: first, through attendance at a one-day brainstorming workshop midway through the study; and,second, through the provision of comments on the draft final report. The members of the expert panel were:
• Amy Wardell (Peterborough Sustainable Travel Town);
• Owen Wilson (Darlington Sustainable Travel Town);
• Howerd Booth (Lancashire County Council);
• Professor Peter Bonsall (Leeds University);
• Rose McArthur (Colin Buchanan);
• Werner Brög (Socialdata);
• Lynn Sloman (TfQoL);
• Sally Cairns (TRL and UCL);
• Cat Ainsworth (Worcestershire County Council);
• Claire Fleming (Nottinghamshire County Council);
• Geoff Gardner (North Yorkshire County Council);
• Professor Stephen Potter (Open University);
• Lynda Addison (Addison and Associates);
• Professor John Whitelegg (York University);
• Bruce James (Queensland Transport); 15
| 3. Study Methodology
• Satoshii Fujii (Tokyo Institute of Technology);
• Syd Jerram (Noosa Council).
Stage 4: Case study and practitioner Interviews
3.7 Interviews were held with scheme promoters (and, where appropriate,project partners, including consultants and public transport operators). A standard interview pro forma was adopted across all sites to collatebasic and consistent data, supplemented by open discussion to explorelocal issues arising. The case studies are reported in a separate technicalnote and have been audited by the sites themselves prior to publication.
Stage 5: Reporting and best practice guidelines
3.8 The final stage of the study involved the preparation of the final researchreport, a summary report, case study summaries and a best practiceguide. The best practice guide draws directly upon the findings of thestudy (due to be published in early 2008).
16
Department for Transport | Making Personal Travel Planning Work
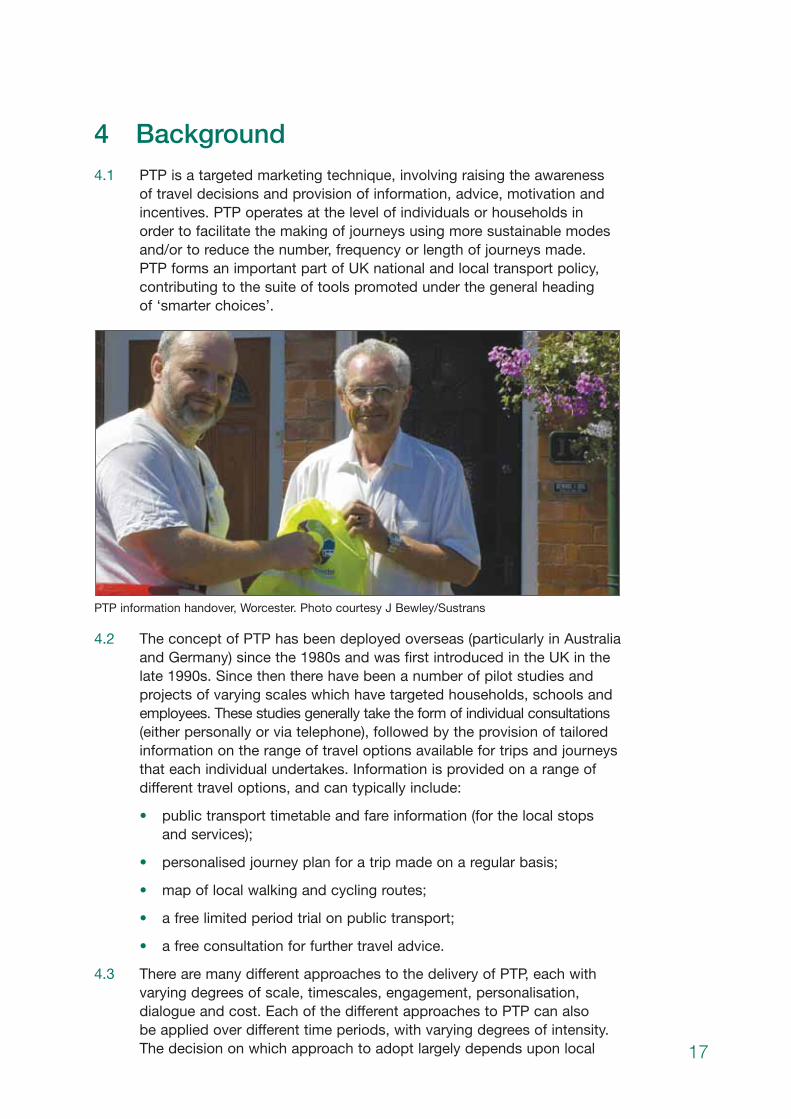
4 Background4.1 PTP is a targeted marketing technique, involving raising the awareness
of travel decisions and provision of information, advice, motivation andincentives. PTP operates at the level of individuals or households inorder to facilitate the making of journeys using more sustainable modesand/or to reduce the number, frequency or length of journeys made. PTP forms an important part of UK national and local transport policy,contributing to the suite of tools promoted under the general heading of ‘smarter choices’.
PTP information handover, Worcester. Photo courtesy J Bewley/Sustrans
4.2 The concept of PTP has been deployed overseas (particularly in Australiaand Germany) since the 1980s and was first introduced in the UK in thelate 1990s. Since then there have been a number of pilot studies andprojects of varying scales which have targeted households, schools andemployees. These studies generally take the form of individual consultations (either personally or via telephone), followed by the provision of tailoredinformation on the range of travel options available for trips and journeysthat each individual undertakes. Information is provided on a range ofdifferent travel options, and can typically include:
• public transport timetable and fare information (for the local stopsand services);
• personalised journey plan for a trip made on a regular basis;
• map of local walking and cycling routes;
• a free limited period trial on public transport;
• a free consultation for further travel advice.
4.3 There are many different approaches to the delivery of PTP, each withvarying degrees of scale, timescales, engagement, personalisation,dialogue and cost. Each of the different approaches to PTP can also be applied over different time periods, with varying degrees of intensity. The decision on which approach to adopt largely depends upon local 17
circumstances: for example, the ambition and needs of the localcommunity; the availability of funding; the scale of other supportinginfrastructure improvements. Decisions can also relate to the expectationof the delivery funding body and the stakeholders of the delivery board –for example, at Transport for London (TfL) there is an embeddedexpectation to extend the reach of PTP each year to more households,participants and London boroughs.
Some standard definitions
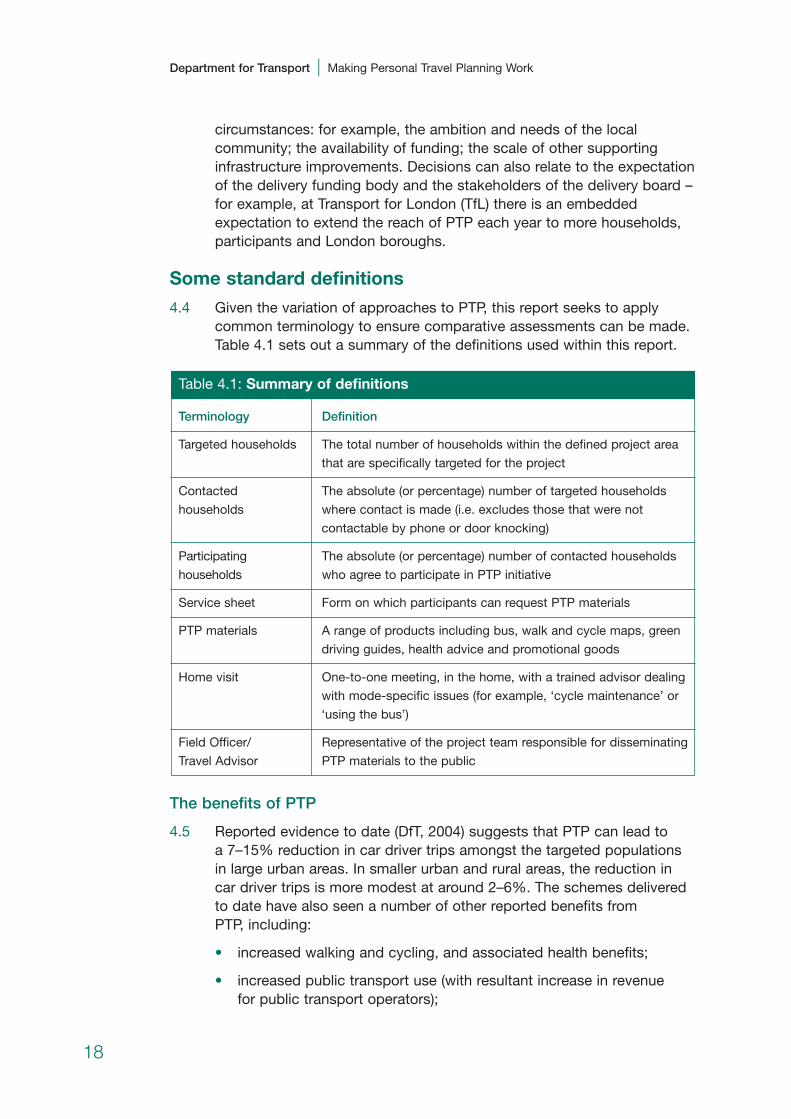
4.4 Given the variation of approaches to PTP, this report seeks to applycommon terminology to ensure comparative assessments can be made.Table 4.1 sets out a summary of the definitions used within this report.
The benefits of PTP
4.5 Reported evidence to date (DfT, 2004) suggests that PTP can lead to a 7–15% reduction in car driver trips amongst the targeted populations in large urban areas. In smaller urban and rural areas, the reduction in car driver trips is more modest at around 2–6%. The schemes deliveredto date have also seen a number of other reported benefits from PTP, including:
• increased walking and cycling, and associated health benefits;
• increased public transport use (with resultant increase in revenue for public transport operators);
Table 4.1: Summary of definitions
Terminology Definition
Targeted households The total number of households within the defined project area
that are specifically targeted for the project
Contacted The absolute (or percentage) number of targeted households
households where contact is made (i.e. excludes those that were not
contactable by phone or door knocking)
Participating The absolute (or percentage) number of contacted households
households who agree to participate in PTP initiative
Service sheet Form on which participants can request PTP materials
PTP materials A range of products including bus, walk and cycle maps, green
driving guides, health advice and promotional goods
Home visit One-to-one meeting, in the home, with a trained advisor dealing
with mode-specific issues (for example, ‘cycle maintenance’ or
‘using the bus’)
Field Officer/ Representative of the project team responsible for disseminating
Travel Advisor PTP materials to the public
18
Department for Transport | Making Personal Travel Planning Work

• increased viability of local shops and businesses;
• improved interaction between different players within the community.
4.6 In 2003, the DfT part-funded 14 pilot studies to test different approachesto PTP (DfT, 2005). Of these pilot studies, those that targeted residentialpopulations (rather than employers or schools) were the most effective at reducing car kilometres and increasing use of sustainable modes. All seven residential pilots saw a modal shift away from car use, withestimated reductions in car use over a year ranging between 0.05 millionand 6.2 million car kilometres. The cost per car kilometre saved variedbetween 3p and 18p per kilometre (or between 2p and 10p if monitoringand evaluation costs are excluded). The effectiveness of the residentialpilots appeared to be largely due to well-chosen target populations,sizeable intervention groups, and well orchestrated individualised marketing and personal travel planning. In addition, the consistent methodologyused in five of these pilots made comparison of results possible.
4.7 Whilst there has been a degree of debate surrounding the reliability and validity of the scale of improvement claimed by some PTP projects(discussed in more detail in Chapter 9), the general consensus amongstpractitioners is that PTP brings real, tangible benefits to local communities. In Australia, where the greatest experience of PTP programmes has beengained over the last 10 years, the Australian Road Research Boardreported in 2004 ‘TravelSmart Household has been demonstrated, inPerth and elsewhere in Australia and overseas, to be a highly effectivemeans of achieving voluntary travel behaviour change, substantiallyreducing the level of car use.’
PTP procurement options
4.8 In addition to the diversity of different approaches to PTP, there are alsoa number of different procurement options that can be applied. Thesecan be broadly defined as:
• In house delivery of PTP – local authority led schemes, where all ofthe resources necessary to deliver the PTP programme are managedby the local authority (for example, the latest Nottingham City CardPTP Programme);
• Outsourced delivery of PTP – local authority secures a preferredpartner to deliver the entire PTP programme (for example, the PTPcomponent of the Worcester Sustainable Travel Town project);
• Partnering – local authority appoints consultancy partner to workjointly on the delivery of the PTP programme (for example, TfLappointed Steer Davies Gleave to provide strategic guidance andassist with the management and delivery of the PTP programme);
• Training/mentoring – local authority appoints consultancy partner tooffer training and strategic support (for example Brighton and Hoveappointed Steer Davies Gleave in Year 1 of their PTP programme toundertake background work whilst officers were being appointed, andto subsequently train those officers to enable them to take a lead rolein following years); 19
| 4. Background

• Developer-led PTP – developer tasked with delivering a PTPprogramme through an appropriate planning condition (for example,at Queen Elizabeth Park in Surrey, where PTP formed an importantpart of the residential travel plan for the site).
The process of behavioural change
4.9 PTP seeks to overcome individual psychological barriers to the use ofsustainable travel options, and hence its development has been informedby ideas and theories relating to behaviour and marketing. The Appendixprovides a summary of relevant theories and considers how PTP approaches used in practice relate to these. It also reports some key findings fromresearch studies that have examined in depth the behavioural impacts ofPTP-type interventions and which allow insights to be gained on PTP design.
4.10 Table 4.2 summarises how travel behaviour can be influenced to changeand ‘levers’ which PTP can use to achieve this.
Table 4.2: Process of behavioural change
How behaviour can be influenced What are the levers?
• Deliberation of behaviour • Visible project in community
• Personal contact
• Travel conversation
• Offer of free materials
• Changing perceptions • Information
• Marketing
• Increasing behavioural control • Personal advice and support
• Changing social norms • Working with media/community
organisations
• Use of role models
• Encouraging word-of-mouth
communication
• Involving all household members
• Making behavioural plan • Personal journey plan
• Setting behavioural goal • Personal commitment
• Experimenting with behaviour • Incentive (e.g. free bus ticket)
• Reinforcing behaviour • Gifts
• Positive feedback
• Loyalty club
20
Department for Transport | Making Personal Travel Planning Work
What techniques can be used?
4.11 Within the UK PTP market, two distinct commercial providers of servicesand PTP delivery techniques currently dominate, based upon techniquesdeveloped by the early adopters of PTP. These providers are:
• Sustrans/Socialdata, who promote TravelSmart®2 (using the IndiMark3 technique developed by Socialdata and promoted togetherwith Sustrans in the UK); and
• Steer Davies Gleave (SDG).
4.12 These providers offer different types of service, broadly summarised below.
Sustrans/Socialdata: TravelSmart/IndiMark
4.13 This approach was originally aimed at infrequent users of sustainablemodes who indicated that they would like to change their travelbehaviour. It initially provided specific information, motivation and systemexperience relating to public transport services with the idea that, byhaving public transport information provided to them, the target groupwould be more likely to use those services. The process has developedover time and has become more targeted towards encouraging a modalshift for specific journeys, discouraging car use and encouraging publictransport as well as more sustainable modes – in essence, a processbuilt around the principles of dialogue marketing.
4.14 Research conducted by Brög and Mense, in support of the IndiMarkapproach to PTP, suggests that convincing people that they only neededto change their travel behaviour to sustainable modes once or twice aweek, rather than making a complete change in lifestyle, can have agreat effect on overall levels of car use on a given day. This ‘homeopathic’ approach to changing travel behaviour is advocated though the followingflow mechanism:
motivation and empowerment → partnership and dialogue →personalised and customised → ‘possible trips’ and ‘small changes’.
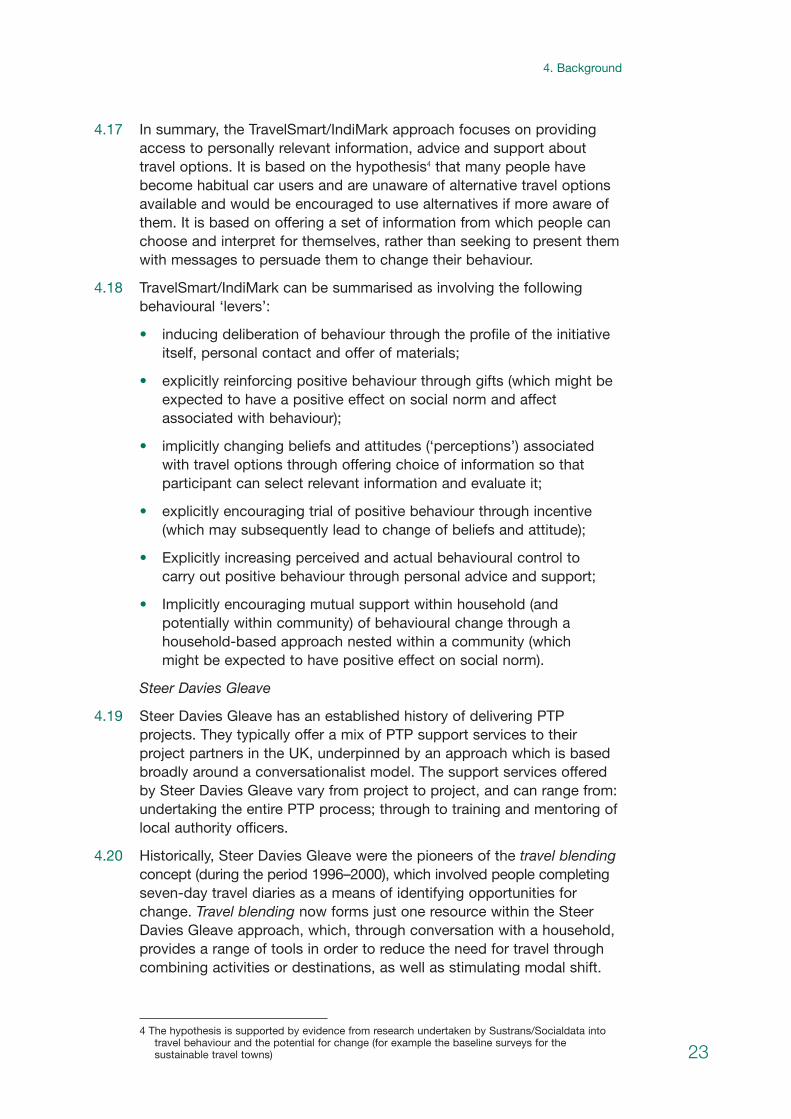
4.15 Brög and Mense summarise the IndiMark approach as: direct contact →motivation → information → system experience. Market segmentationundertaken within the process enables material to be effectively targetedand ensures resources are placed where they are most likely to have apositive effect on travel behaviour. Harbutt and Meiklejohn state that thekey determinants of successfully encouraging travel behaviour changethrough the IndiMark process are identified as:
• voluntary involvement of households, which helps to ensure that onlythose residents that have a genuine interest in altering their travelbehaviour are encouraged by the schemes;
• direct contact to help identify an individual’s travel needs;
• focus on specific individual benefits to encourage change in travel behaviour;
2 TravelSmart is registered by Sustrans as a trademark in the UK.
3 IndiMark is registered by Socialdata as a trademark in Germany. 21
| 4. Background

• provide practical and realistic travel and activity information;
• facilitate initial experiences of sustainable travel through motivationand incentives;
• provide feedback of the study as a whole to the target groups inorder to provide positive reinforcement of sustainable travel choices;
• connect people to existing organisations for their ongoing travel andactivity information needs.
4.16 The TravelSmart/IndiMark process is shown in Figure 4.1.
22
Department for Transport | Making Personal Travel Planning Work
Figure 4.1: TravelSmart/IndiMark process
Evaluation
Target Population
Personal contact by phone or on the
doorstep
Regular user of sustainable modes
w/out info needs
Regular user of sustainable modes
with info needs
Interestedin using sustainable
modes
Not interestedin using sustainable
modes
Eco-driving info/ no further contact
Reward only Information pack
(+ reward for regular users)
By post Personal delivery Personal delivery
Home advice sessions
4.17 In summary, the TravelSmart/IndiMark approach focuses on providingaccess to personally relevant information, advice and support abouttravel options. It is based on the hypothesis4 that many people havebecome habitual car users and are unaware of alternative travel optionsavailable and would be encouraged to use alternatives if more aware ofthem. It is based on offering a set of information from which people canchoose and interpret for themselves, rather than seeking to present themwith messages to persuade them to change their behaviour.
4.18 TravelSmart/IndiMark can be summarised as involving the followingbehavioural ‘levers’:
• inducing deliberation of behaviour through the profile of the initiativeitself, personal contact and offer of materials;
• explicitly reinforcing positive behaviour through gifts (which might beexpected to have a positive effect on social norm and affectassociated with behaviour);
• implicitly changing beliefs and attitudes (‘perceptions’) associatedwith travel options through offering choice of information so thatparticipant can select relevant information and evaluate it;
• explicitly encouraging trial of positive behaviour through incentive(which may subsequently lead to change of beliefs and attitude);
• Explicitly increasing perceived and actual behavioural control to carry out positive behaviour through personal advice and support;
• Implicitly encouraging mutual support within household (andpotentially within community) of behavioural change through ahousehold-based approach nested within a community (which might be expected to have positive effect on social norm).
Steer Davies Gleave
4.19 Steer Davies Gleave has an established history of delivering PTPprojects. They typically offer a mix of PTP support services to theirproject partners in the UK, underpinned by an approach which is basedbroadly around a conversationalist model. The support services offeredby Steer Davies Gleave vary from project to project, and can range from:undertaking the entire PTP process; through to training and mentoring oflocal authority officers.
4.20 Historically, Steer Davies Gleave were the pioneers of the travel blendingconcept (during the period 1996–2000), which involved people completing seven-day travel diaries as a means of identifying opportunities forchange. Travel blending now forms just one resource within the SteerDavies Gleave approach, which, through conversation with a household,provides a range of tools in order to reduce the need for travel throughcombining activities or destinations, as well as stimulating modal shift.
4 The hypothesis is supported by evidence from research undertaken by Sustrans/Socialdata intotravel behaviour and the potential for change (for example the baseline surveys for thesustainable travel towns) 23
| 4. Background

4.21 For projects that are managed by Steer Davies Gleave in their entirety,the following summarises the key components:
• Pre-engagement phase: Learning about the community and theirperceptions of the area.
• Engagement: Initial contact is made by letter (providing advancewarning of contact), followed by direct contact through phone, door-knocking, presence at community events/activities and approachesfrom the public at the local project office.
• The conversation: Involves a trained travel advisor exploring thevalues of the household (e.g. potential motivators – time, money,health, environment or independence) and explaining the project tools.
• Time for change: Project tools are delivered to households who aregiven the opportunity to trial sustainable travel alternatives.
• Reinforcement: Feedback on the findings of the trial through anycombination of local events, a presence at meeting places andcongratulations.
4.22 In summary, the Steer Davies Gleave approach to PTP, which has beenemployed in Bristol and Darlington and informed the approaches taken inBrighton and London, involves personal contact with individuals in targetareas by travel advisors and engagement of participants in a short, door-step conversation. The travel advisors are trained to listen out forcharacteristics of travel needs, behaviour and key motivators and todetermine what type of message and information are relevant to theparticipant. At the end of the conversation it is mutually agreed whatinformation and incentives are to be provided.
4.21 The Steer Davies Gleave approach can be summarised as involving thefollowing behavioural ‘levers’:
• inducing deliberation of behaviour through the profile of the initiativeitself, personal conversation and offer of materials;
• implicitly changing beliefs and attitudes (‘perceptions’) associatedwith travel options through suggesting relevant information for evaluation;
• explicitly encouraging trial of positive behaviour through incentive(which may subsequently lead to change of beliefs and attitude) and challenge;
• explicitly increasing perceived and actual behavioural control to carry out positive behaviour through personal advice and support;
• implicitly encouraging mutual support within household (andpotentially within community) of behavioural change through ahousehold-based approach nested within a community (which might be expected to have positive effect on social norm);
24
Department for Transport | Making Personal Travel Planning Work
• explicitly reinforcing positive behaviour through loyalty club (whichcan have positive effect on social norm and affect associated with behaviour).
4.22 There are a number of commonalities between the TravelSmart/IndiMarkand Steer Davies Gleave approaches. One difference of emphasisbetween the two approaches is that the travel advisors used in SteerDavies Gleave PTP seek themselves to identify appropriate resourcesrelevant to the participant, whereas in TravelSmart/IndiMark participantsare provided with a menu of information from which to select. Whatappears to be a convergence of PTP in the UK to a common approach in many respects may be considered to be a consequence of learningwhat is effective from past experience (for example, in achieving highparticipation rates) and/or a consequence of common requirements from clients.
Other approaches
4.25 In addition to the approaches delivered by Sustrans and Socialdata, andSteer Davies Gleave, there are additional models which are emergingfrom recent UK projects. These are:
• area-wide PTP delivered through direct mailing to households oftimetable specific information (as developed by Nottingham CityCouncil for the City Card project);
• community delivery models (for example the Merseytravel CATCHproject, which uses trusted sources within the community to deliver PTPadvice, followed up by detailed analysis and highly personalised advice).
4.26 Internationally, PTP has adopted similar principles to those beingemployed in the UK, with the exception being Japan, where a greateremphasis is placed upon engagement and subscription by the individual– in particular the importance placed upon the setting of behaviouralgoals. In Fujii and Taniguchi’s meta-analysis of Japanese PTP casestudies, they noted that PTP projects differed based on whether they:
• motivate a change in travel behaviour (e.g. referring to social impactsof transport);
• request a goal and/or plan from participant for changing travelbehaviour;
• provide customised or general information.
UK PTP locations
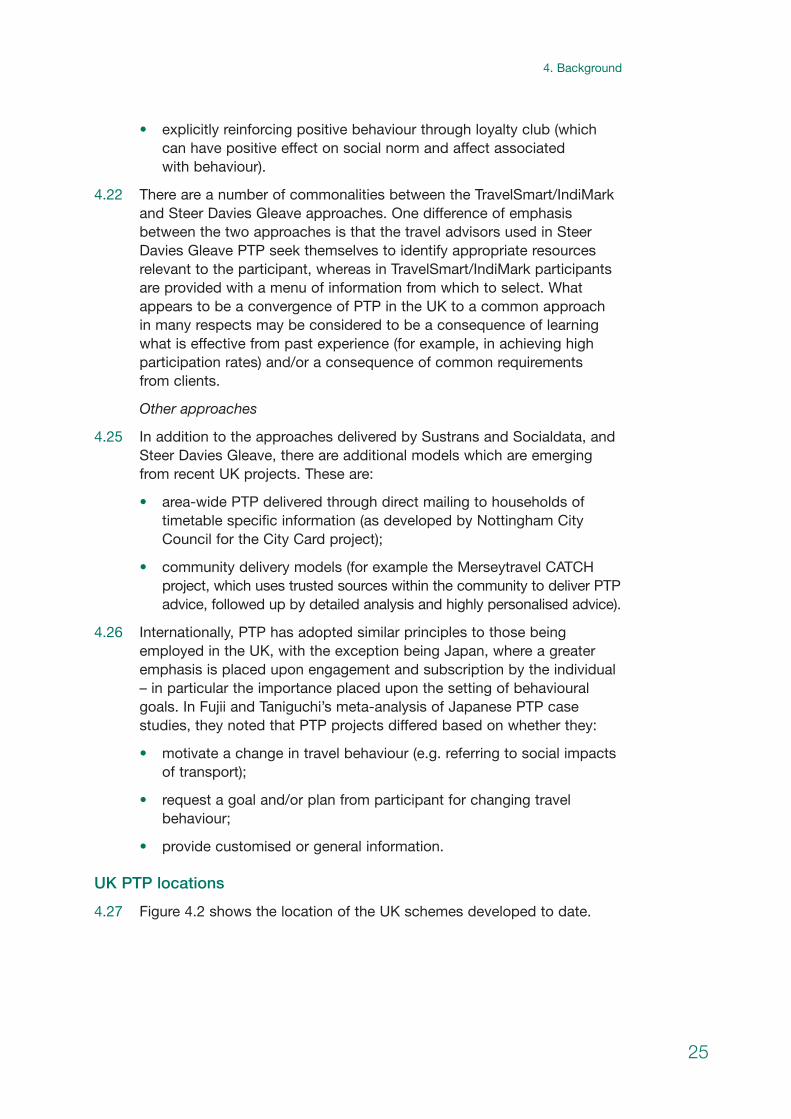
4.27 Figure 4.2 shows the location of the UK schemes developed to date.
25
| 4. Background
26
Department for Transport | Making Personal Travel Planning Work
Figure 4.2: Locations of residential PTP projects
Inverness[2007]
Targeted households
Small (less than 1,000)
Medium (1,000-10,000)
Large (10,000-100,000)
Very Large (100,000+)
Case study areas
Aberdeen[2003-05]
Edinburgh[2005]
Cramlington[2003-04]
Darlington[2005-08]
York[2003-04]
Sheffield[2003-04]
Nottingham [2003-04, 2006-07]
Peterborough[2005-08]
Doncaster[2006]
Glasgow[2003-05]
South Lanarkshire[2004-05]
Ripon[2002]
Lancashire[2006-09]
Merseyside[2004]
Worcester[2005-08]
Frome[2002]
Bristol[2003 onwards]
Bracknell[2003-04]
Gloucester[2002]
London[2003 onwards]
Brighton[2006 onwards]
5 Objective 1: The key elements of success
The reported success of the case study sites
5.1 Before examining the characteristics of projects that determine success,this chapter firstly summarises the reported success of the case studies.It is difficult to generalise findings from single case studies, and hence ameta-analysis is provided, where results are presented and synthesisedfor the different case studies. When reviewing the figures within this chapter, it is important to note that details on the evaluationmethodologies and analyses conducted for each project are providedin Chapter 9 (including issues associated with statistical inference),and readers are advised to refer to this for a fuller appreciation of thecontext and reliability of these results and the issues arising.
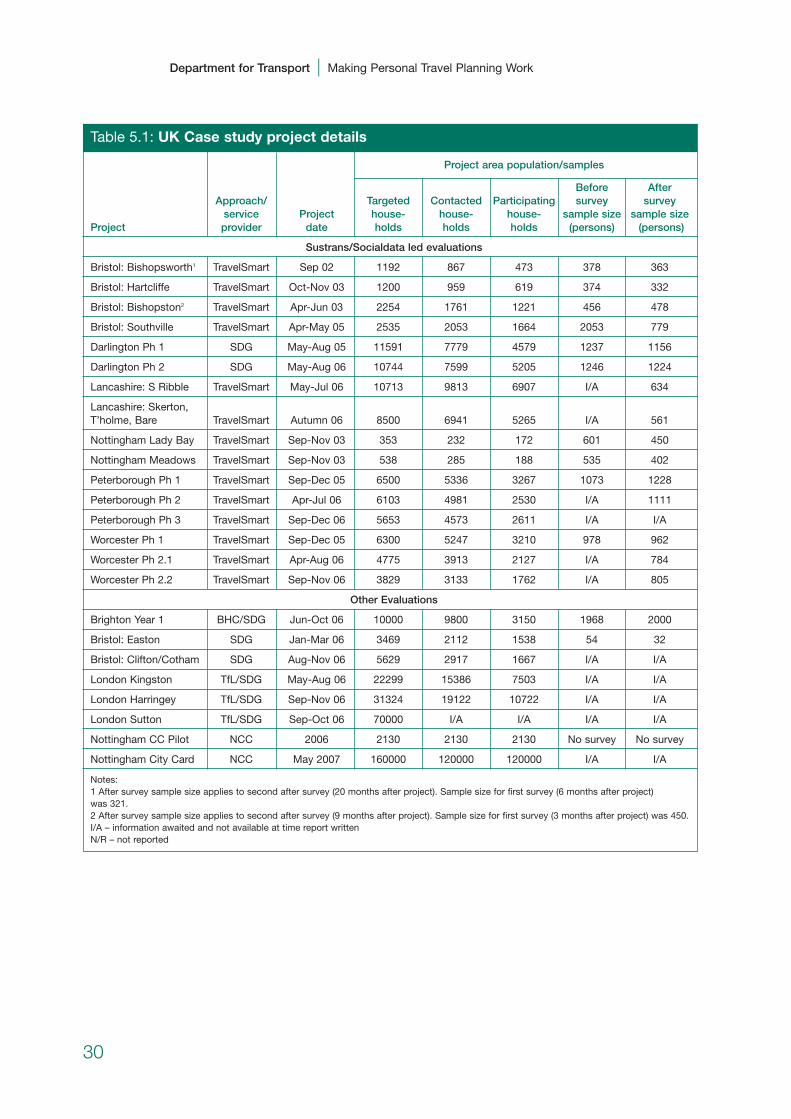
5.2 Table 5.1 provides background information on the dates of the projects,the number of households involved in the project, and the number ofpersons surveyed in project areas. Reported impacts on travel behaviourof the PTP projects are presented in Tables 5.2 to 5.4. These are based on results from travel surveys, as reported in project evaluationdocuments. Limited information is available from other sources withwhich to compare and corroborate survey results.
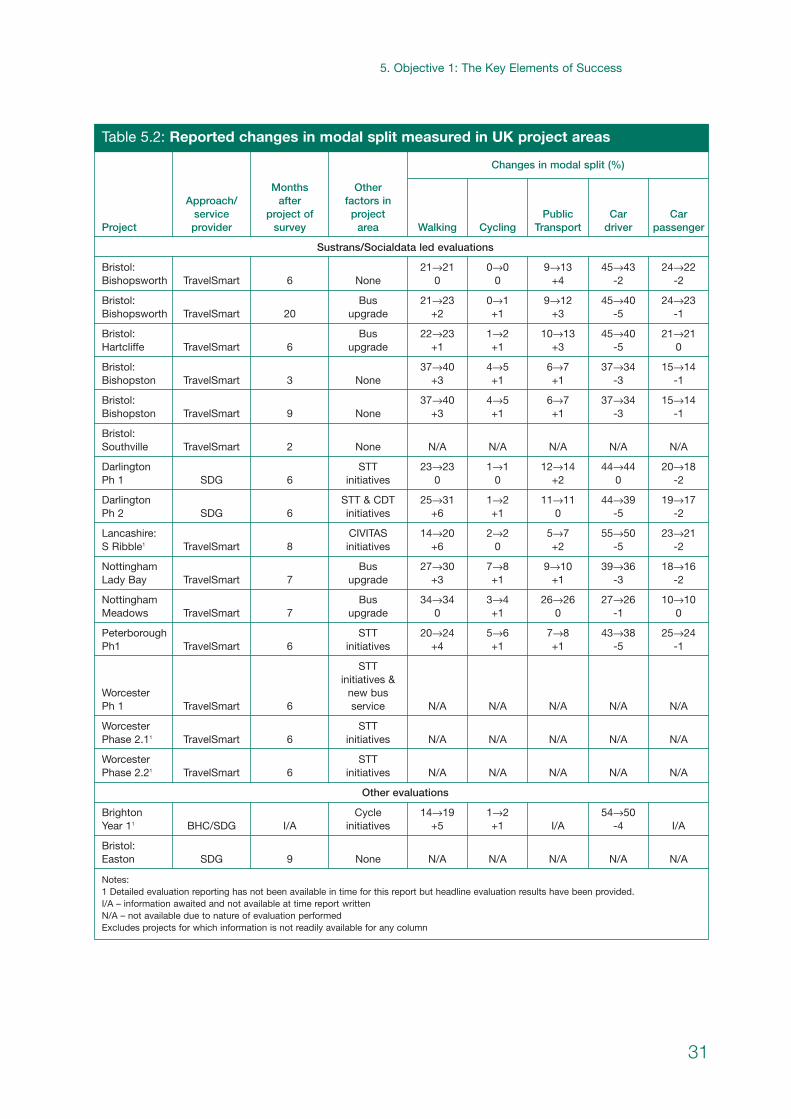
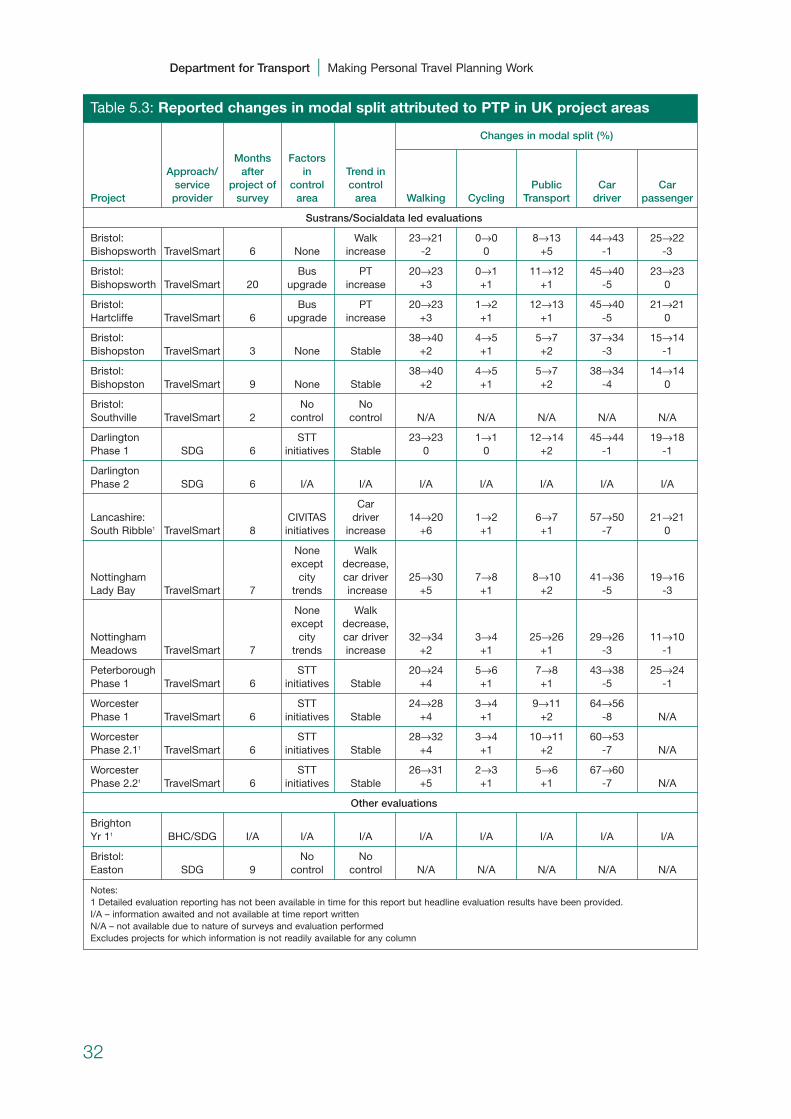
5.3 Table 5.2 reports the changes in modal split (for personal trips) measuredfrom the before and after surveys of the targeted households in theproject areas. This does not take account of background trends in travelbehaviour (counterfactual). Table 5.3 reports the changes in modal split(for personal trips) attributed to PTP projects. In the latter case theresults attempt to take into account the counterfactual (what would havehappened if PTP projects had not taken place) and are based on thebefore-and-after surveys of the targeted households adjusted to take intoaccount the before and after surveys of the control group households(there are important implications of this which are discussed later).
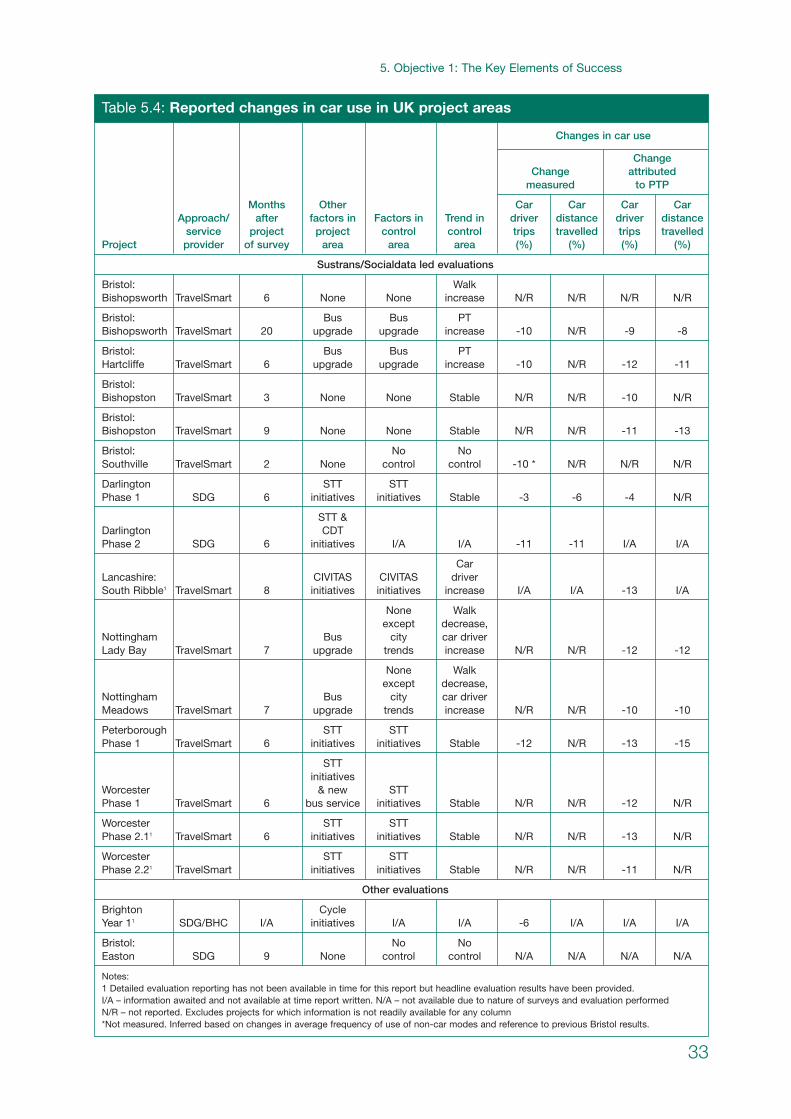
5.4 Table 5.4 reports changes in car use in terms of car driver trips and car distance travelled. Where possible, these are reported in terms ofboth changes measured from surveys and changes attributed to PTP (asexplained in paragraph 5.3). Note that we do not report the percentagechange in the use of other modes, as these can be misleading,particularly when a mode is little used in the before situation (a smallincrease in the number of trips can represent a large percentage change).
5.5 The distinction between the control group and target group is animportant one. The following graphs seek to conceptualise how thecontrol group effect is taken account, and are included for illustrativepurposes only.
27

5.6 Figure 5.1 represents a scenario where car use in the control group has increased whilst car use in the target group has decreased whencompared to an assumed ‘do nothing’ scenario (i.e. where car use isdefined as remaining static between the before and after surveys). Thisindicates that the total ‘change attributable to the PTP intervention’ isgreater than the ‘change measured’.
5.7 Figure 5.2 shows a scenario where the ‘change attributable to PTP’ isless than the ‘change measured’. This is due to the level of car use in thecontrol group and the target group falling concurrently.
Figure 5.1: Impact of control groups (1)
PTP Intervention
Post Intervention
Do nothing
Target Group
Control Group
Cha
nge
mea
sure
d
Cha
nge
in c
ar u
sage
Cha
nge
attr
ibut
able
to P
TP
28
Department for Transport | Making Personal Travel Planning Work
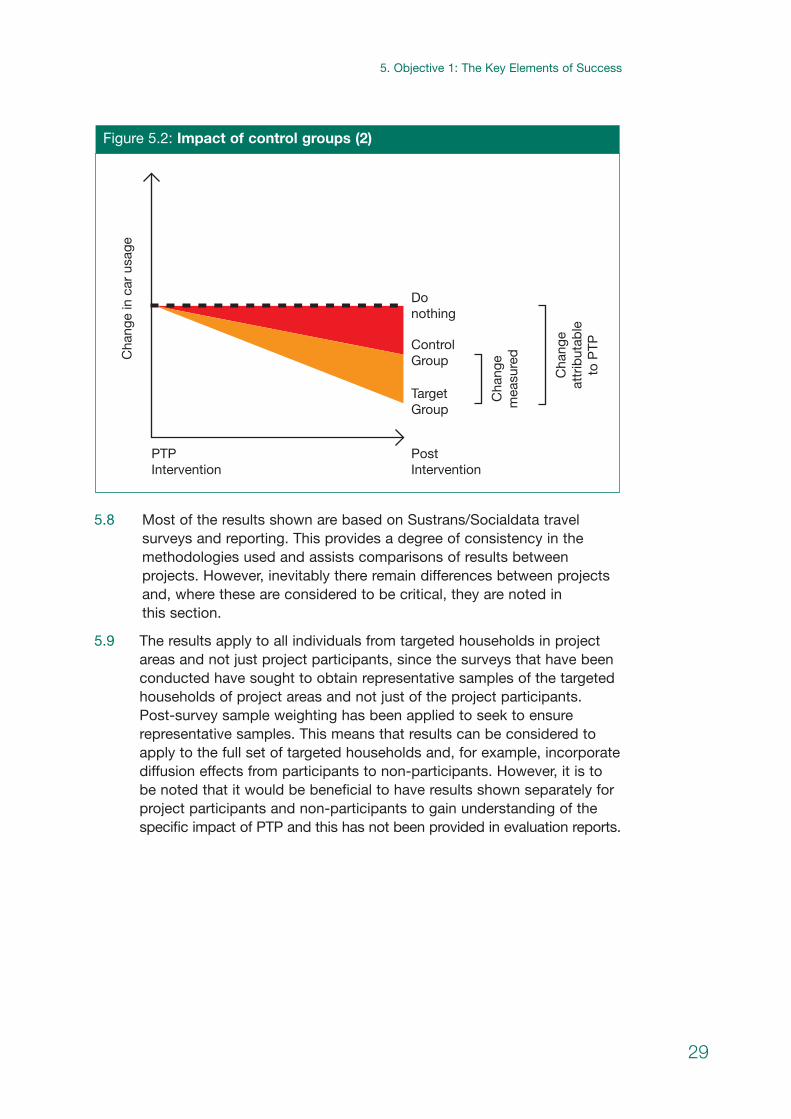
5.8 Most of the results shown are based on Sustrans/Socialdata travelsurveys and reporting. This provides a degree of consistency in themethodologies used and assists comparisons of results betweenprojects. However, inevitably there remain differences between projectsand, where these are considered to be critical, they are noted in this section.
5.9 The results apply to all individuals from targeted households in projectareas and not just project participants, since the surveys that have beenconducted have sought to obtain representative samples of the targetedhouseholds of project areas and not just of the project participants. Post-survey sample weighting has been applied to seek to ensurerepresentative samples. This means that results can be considered toapply to the full set of targeted households and, for example, incorporatediffusion effects from participants to non-participants. However, it is tobe noted that it would be beneficial to have results shown separately forproject participants and non-participants to gain understanding of thespecific impact of PTP and this has not been provided in evaluation reports.
Figure 5.2: Impact of control groups (2)
PTP Intervention
Post Intervention
Do nothing
Target Group
Control Group
Cha
nge
mea
sure
d
Cha
nge
in c
ar u
sage
Cha
nge
attr
ibut
able
to P
TP
29
| 5. Objective 1: The Key Elements of Success
30
Department for Transport | Making Personal Travel Planning Work
Table 5.1: UK Case study project details
Project area population/samples
Before AfterApproach/ Targeted Contacted Participating survey survey
service Project house- house- house- sample size sample size Project provider date holds holds holds (persons) (persons)
Sustrans/Socialdata led evaluations
Bristol: Bishopsworth1 TravelSmart Sep 02 1192 867 473 378 363
Bristol: Hartcliffe TravelSmart Oct-Nov 03 1200 959 619 374 332
Bristol: Bishopston2 TravelSmart Apr-Jun 03 2254 1761 1221 456 478
Bristol: Southville TravelSmart Apr-May 05 2535 2053 1664 2053 779
Darlington Ph 1 SDG May-Aug 05 11591 7779 4579 1237 1156
Darlington Ph 2 SDG May-Aug 06 10744 7599 5205 1246 1224
Lancashire: S Ribble TravelSmart May-Jul 06 10713 9813 6907 I/A 634
Lancashire: Skerton, T’holme, Bare TravelSmart Autumn 06 8500 6941 5265 I/A 561
Nottingham Lady Bay TravelSmart Sep-Nov 03 353 232 172 601 450
Nottingham Meadows TravelSmart Sep-Nov 03 538 285 188 535 402
Peterborough Ph 1 TravelSmart Sep-Dec 05 6500 5336 3267 1073 1228
Peterborough Ph 2 TravelSmart Apr-Jul 06 6103 4981 2530 I/A 1111
Peterborough Ph 3 TravelSmart Sep-Dec 06 5653 4573 2611 I/A I/A
Worcester Ph 1 TravelSmart Sep-Dec 05 6300 5247 3210 978 962
Worcester Ph 2.1 TravelSmart Apr-Aug 06 4775 3913 2127 I/A 784
Worcester Ph 2.2 TravelSmart Sep-Nov 06 3829 3133 1762 I/A 805
Other Evaluations
Brighton Year 1 BHC/SDG Jun-Oct 06 10000 9800 3150 1968 2000
Bristol: Easton SDG Jan-Mar 06 3469 2112 1538 54 32
Bristol: Clifton/Cotham SDG Aug-Nov 06 5629 2917 1667 I/A I/A
London Kingston TfL/SDG May-Aug 06 22299 15386 7503 I/A I/A
London Harringey TfL/SDG Sep-Nov 06 31324 19122 10722 I/A I/A
London Sutton TfL/SDG Sep-Oct 06 70000 I/A I/A I/A I/A
Nottingham CC Pilot NCC 2006 2130 2130 2130 No survey No survey
Nottingham City Card NCC May 2007 160000 120000 120000 I/A I/A
Notes:1 After survey sample size applies to second after survey (20 months after project). Sample size for first survey (6 months after project) was 321.2 After survey sample size applies to second after survey (9 months after project). Sample size for first survey (3 months after project) was 450.I/A – information awaited and not available at time report written N/R – not reported
31
| 5. Objective 1: The Key Elements of Success
Table 5.2: Reported changes in modal split measured in UK project areas
Changes in modal split (%)
Months OtherApproach/ after factors in
service project of project Public Car CarProject provider survey area Walking Cycling Transport driver passenger
Sustrans/Socialdata led evaluations
Bristol: 21→21 0→0 9→13 45→43 24→22Bishopsworth TravelSmart 6 None 0 0 +4 -2 -2
Bristol: Bus 21→23 0→1 9→12 45→40 24→23Bishopsworth TravelSmart 20 upgrade +2 +1 +3 -5 -1
Bristol: Bus 22→23 1→2 10→13 45→40 21→21Hartcliffe TravelSmart 6 upgrade +1 +1 +3 -5 0
Bristol: 37→40 4→5 6→7 37→34 15→14Bishopston TravelSmart 3 None +3 +1 +1 -3 -1
Bristol: 37→40 4→5 6→7 37→34 15→14Bishopston TravelSmart 9 None +3 +1 +1 -3 -1
Bristol: Southville TravelSmart 2 None N/A N/A N/A N/A N/A
Darlington STT 23→23 1→1 12→14 44→44 20→18Ph 1 SDG 6 initiatives 0 0 +2 0 -2
Darlington STT & CDT 25→31 1→2 11→11 44→39 19→17Ph 2 SDG 6 initiatives +6 +1 0 -5 -2
Lancashire: CIVITAS 14→20 2→2 5→7 55→50 23→21S Ribble1 TravelSmart 8 initiatives +6 0 +2 -5 -2
Nottingham Bus 27→30 7→8 9→10 39→36 18→16Lady Bay TravelSmart 7 upgrade +3 +1 +1 -3 -2
Nottingham Bus 34→34 3→4 26→26 27→26 10→10Meadows TravelSmart 7 upgrade 0 +1 0 -1 0
Peterborough STT 20→24 5→6 7→8 43→38 25→24Ph1 TravelSmart 6 initiatives +4 +1 +1 -5 -1
STTinitiatives &
Worcester new bus Ph 1 TravelSmart 6 service N/A N/A N/A N/A N/A
Worcester STTPhase 2.11 TravelSmart 6 initiatives N/A N/A N/A N/A N/A
Worcester STTPhase 2.21 TravelSmart 6 initiatives N/A N/A N/A N/A N/A
Other evaluations
Brighton Cycle 14→19 1→2 54→50Year 11 BHC/SDG I/A initiatives +5 +1 I/A -4 I/A
Bristol: Easton SDG 9 None N/A N/A N/A N/A N/A
Notes:1 Detailed evaluation reporting has not been available in time for this report but headline evaluation results have been provided.I/A – information awaited and not available at time report written N/A – not available due to nature of evaluation performed Excludes projects for which information is not readily available for any column
32
Department for Transport | Making Personal Travel Planning Work
Table 5.3: Reported changes in modal split attributed to PTP in UK project areas
Changes in modal split (%)
Months FactorsApproach/ after in Trend in
service project of control control Public Car CarProject provider survey area area Walking Cycling Transport driver passenger
Sustrans/Socialdata led evaluations
Bristol: Walk 23→21 0→0 8→13 44→43 25→22Bishopsworth TravelSmart 6 None increase -2 0 +5 -1 -3
Bristol: Bus PT 20→23 0→1 11→12 45→40 23→23Bishopsworth TravelSmart 20 upgrade increase +3 +1 +1 -5 0
Bristol: Bus PT 20→23 1→2 12→13 45→40 21→21Hartcliffe TravelSmart 6 upgrade increase +3 +1 +1 -5 0
Bristol: 38→40 4→5 5→7 37→34 15→14Bishopston TravelSmart 3 None Stable +2 +1 +2 -3 -1
Bristol: 38→40 4→5 5→7 38→34 14→14Bishopston TravelSmart 9 None Stable +2 +1 +2 -4 0
Bristol: No NoSouthville TravelSmart 2 control control N/A N/A N/A N/A N/A
Darlington STT 23→23 1→1 12→14 45→44 19→18Phase 1 SDG 6 initiatives Stable 0 0 +2 -1 -1
Darlington Phase 2 SDG 6 I/A I/A I/A I/A I/A I/A I/A
CarLancashire: CIVITAS driver 14→20 1→2 6→7 57→50 21→21South Ribble1 TravelSmart 8 initiatives increase +6 +1 +1 -7 0
None Walkexcept decrease,
Nottingham city car driver 25→30 7→8 8→10 41→36 19→16Lady Bay TravelSmart 7 trends increase +5 +1 +2 -5 -3
None Walkexcept decrease,
Nottingham city car driver 32→34 3→4 25→26 29→26 11→10Meadows TravelSmart 7 trends increase +2 +1 +1 -3 -1
Peterborough STT 20→24 5→6 7→8 43→38 25→24Phase 1 TravelSmart 6 initiatives Stable +4 +1 +1 -5 -1
Worcester STT 24→28 3→4 9→11 64→56Phase 1 TravelSmart 6 initiatives Stable +4 +1 +2 -8 N/A
Worcester STT 28→32 3→4 10→11 60→53Phase 2.11 TravelSmart 6 initiatives Stable +4 +1 +2 -7 N/A
Worcester STT 26→31 2→3 5→6 67→60Phase 2.21 TravelSmart 6 initiatives Stable +5 +1 +1 -7 N/A
Other evaluations
Brighton Yr 11 BHC/SDG I/A I/A I/A I/A I/A I/A I/A I/A
Bristol: No NoEaston SDG 9 control control N/A N/A N/A N/A N/A
Notes:1 Detailed evaluation reporting has not been available in time for this report but headline evaluation results have been provided.I/A – information awaited and not available at time report written N/A – not available due to nature of surveys and evaluation performedExcludes projects for which information is not readily available for any column
33
| 5. Objective 1: The Key Elements of Success
Table 5.4: Reported changes in car use in UK project areas
Changes in car use
ChangeChange attributed
measured to PTP
Months Other Car Car Car CarApproach/ after factors in Factors in Trend in driver distance driver distance
service project project control control trips travelled trips travelledProject provider of survey area area area (%) (%) (%) (%)
Sustrans/Socialdata led evaluations
Bristol: WalkBishopsworth TravelSmart 6 None None increase N/R N/R N/R N/R
Bristol: Bus Bus PTBishopsworth TravelSmart 20 upgrade upgrade increase -10 N/R -9 -8
Bristol: Bus Bus PTHartcliffe TravelSmart 6 upgrade upgrade increase -10 N/R -12 -11
Bristol: Bishopston TravelSmart 3 None None Stable N/R N/R -10 N/R
Bristol: Bishopston TravelSmart 9 None None Stable N/R N/R -11 -13
Bristol: No NoSouthville TravelSmart 2 None control control -10 * N/R N/R N/R
Darlington STT STTPhase 1 SDG 6 initiatives initiatives Stable -3 -6 -4 N/R
STT &Darlington CDTPhase 2 SDG 6 initiatives I/A I/A -11 -11 I/A I/A
CarLancashire: CIVITAS CIVITAS driverSouth Ribble1 TravelSmart 8 initiatives initiatives increase I/A I/A -13 I/A
None Walkexcept decrease,
Nottingham Bus city car driverLady Bay TravelSmart 7 upgrade trends increase N/R N/R -12 -12
None Walkexcept decrease,
Nottingham Bus city car driverMeadows TravelSmart 7 upgrade trends increase N/R N/R -10 -10
Peterborough STT STTPhase 1 TravelSmart 6 initiatives initiatives Stable -12 N/R -13 -15
STTinitiatives
Worcester & new STTPhase 1 TravelSmart 6 bus service initiatives Stable N/R N/R -12 N/R
Worcester STT STTPhase 2.11 TravelSmart 6 initiatives initiatives Stable N/R N/R -13 N/R
Worcester STT STTPhase 2.21 TravelSmart initiatives initiatives Stable N/R N/R -11 N/R
Other evaluations
Brighton CycleYear 11 SDG/BHC I/A initiatives I/A I/A -6 I/A I/A I/A
Bristol: No NoEaston SDG 9 None control control N/A N/A N/A N/A
Notes:1 Detailed evaluation reporting has not been available in time for this report but headline evaluation results have been provided.I/A – information awaited and not available at time report written. N/A – not available due to nature of surveys and evaluation performedN/R – not reported. Excludes projects for which information is not readily available for any column*Not measured. Inferred based on changes in average frequency of use of non-car modes and reference to previous Bristol results.
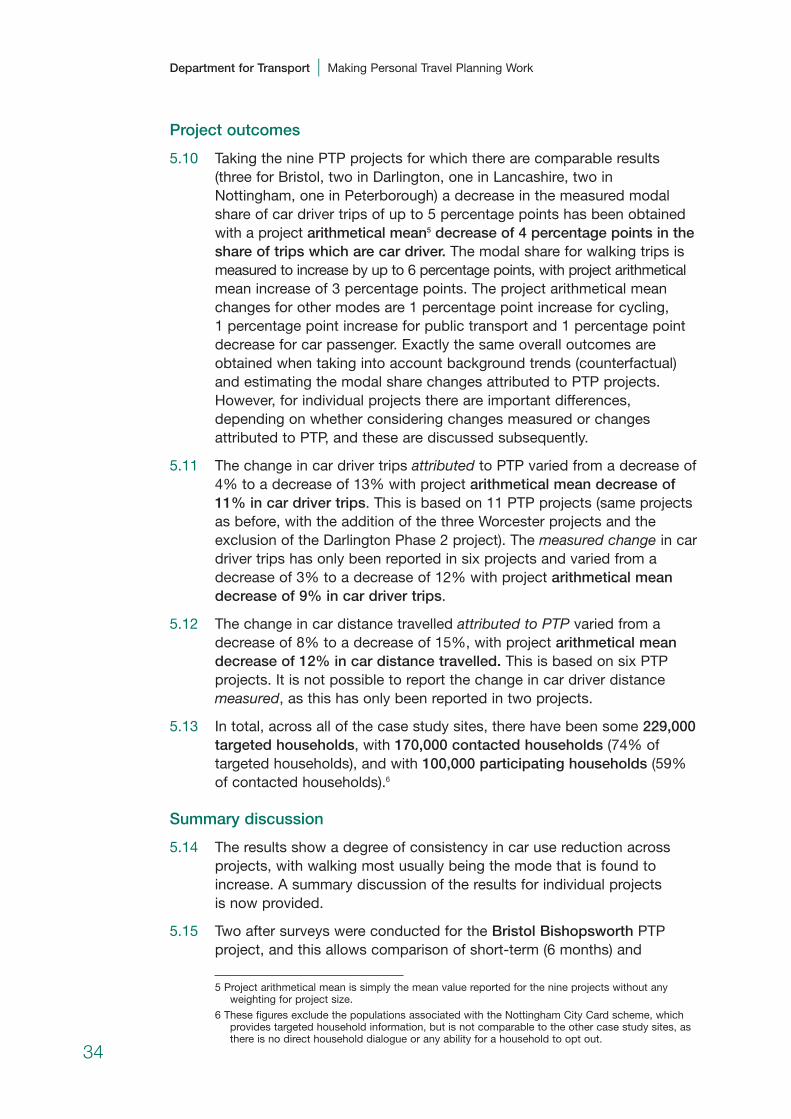
Project outcomes
5.10 Taking the nine PTP projects for which there are comparable results(three for Bristol, two in Darlington, one in Lancashire, two inNottingham, one in Peterborough) a decrease in the measured modalshare of car driver trips of up to 5 percentage points has been obtainedwith a project arithmetical mean5 decrease of 4 percentage points in theshare of trips which are car driver. The modal share for walking trips ismeasured to increase by up to 6 percentage points, with project arithmetical mean increase of 3 percentage points. The project arithmetical meanchanges for other modes are 1 percentage point increase for cycling, 1 percentage point increase for public transport and 1 percentage pointdecrease for car passenger. Exactly the same overall outcomes areobtained when taking into account background trends (counterfactual)and estimating the modal share changes attributed to PTP projects.However, for individual projects there are important differences,depending on whether considering changes measured or changesattributed to PTP, and these are discussed subsequently.
5.11 The change in car driver trips attributed to PTP varied from a decrease of4% to a decrease of 13% with project arithmetical mean decrease of11% in car driver trips. This is based on 11 PTP projects (same projectsas before, with the addition of the three Worcester projects and theexclusion of the Darlington Phase 2 project). The measured change in cardriver trips has only been reported in six projects and varied from adecrease of 3% to a decrease of 12% with project arithmetical meandecrease of 9% in car driver trips.
5.12 The change in car distance travelled attributed to PTP varied from adecrease of 8% to a decrease of 15%, with project arithmetical meandecrease of 12% in car distance travelled. This is based on six PTPprojects. It is not possible to report the change in car driver distancemeasured, as this has only been reported in two projects.
5.13 In total, across all of the case study sites, there have been some 229,000targeted households, with 170,000 contacted households (74% oftargeted households), and with 100,000 participating households (59%of contacted households).6
Summary discussion
5.14 The results show a degree of consistency in car use reduction acrossprojects, with walking most usually being the mode that is found toincrease. A summary discussion of the results for individual projects is now provided.
5.15 Two after surveys were conducted for the Bristol Bishopsworth PTPproject, and this allows comparison of short-term (6 months) and
5 Project arithmetical mean is simply the mean value reported for the nine projects without anyweighting for project size.
6 These figures exclude the populations associated with the Nottingham City Card scheme, whichprovides targeted household information, but is not comparable to the other case study sites, asthere is no direct household dialogue or any ability for a household to opt out.
34
Department for Transport | Making Personal Travel Planning Work
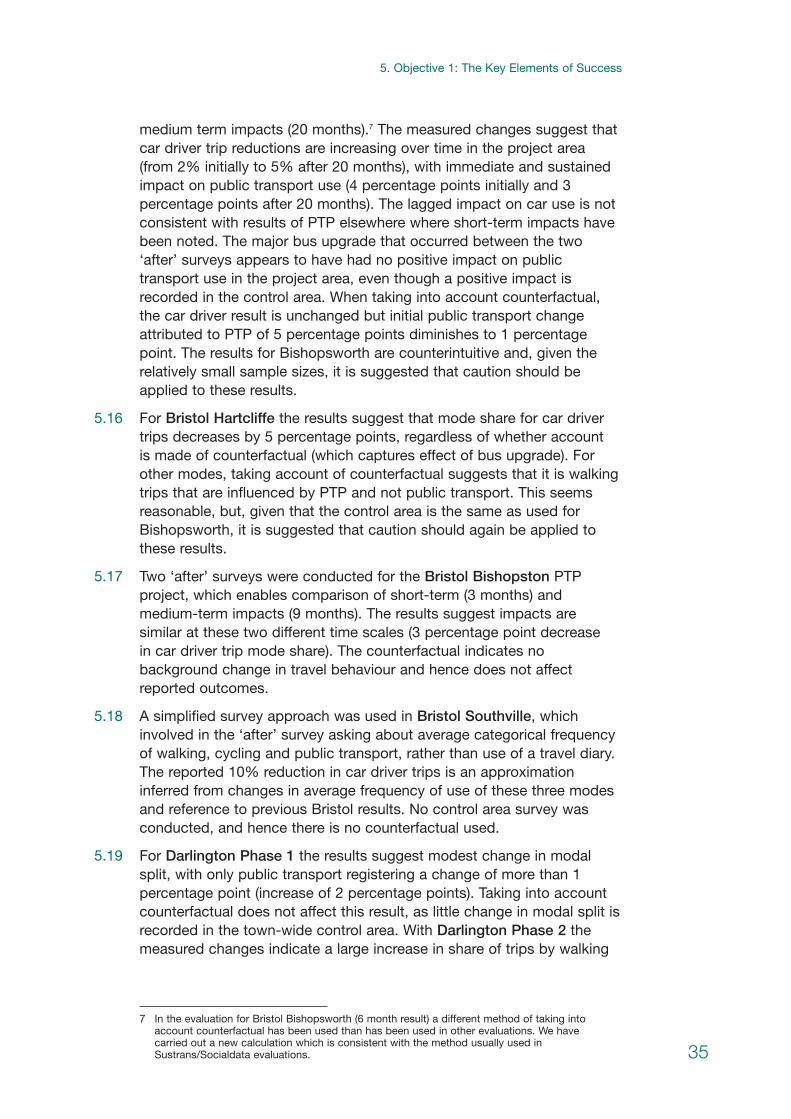
medium term impacts (20 months).7 The measured changes suggest that car driver trip reductions are increasing over time in the project area(from 2% initially to 5% after 20 months), with immediate and sustainedimpact on public transport use (4 percentage points initially and 3percentage points after 20 months). The lagged impact on car use is notconsistent with results of PTP elsewhere where short-term impacts havebeen noted. The major bus upgrade that occurred between the two‘after’ surveys appears to have had no positive impact on publictransport use in the project area, even though a positive impact isrecorded in the control area. When taking into account counterfactual,the car driver result is unchanged but initial public transport changeattributed to PTP of 5 percentage points diminishes to 1 percentagepoint. The results for Bishopsworth are counterintuitive and, given therelatively small sample sizes, it is suggested that caution should beapplied to these results.
5.16 For Bristol Hartcliffe the results suggest that mode share for car drivertrips decreases by 5 percentage points, regardless of whether account is made of counterfactual (which captures effect of bus upgrade). Forother modes, taking account of counterfactual suggests that it is walkingtrips that are influenced by PTP and not public transport. This seemsreasonable, but, given that the control area is the same as used forBishopsworth, it is suggested that caution should again be applied tothese results.
5.17 Two ‘after’ surveys were conducted for the Bristol Bishopston PTPproject, which enables comparison of short-term (3 months) andmedium-term impacts (9 months). The results suggest impacts aresimilar at these two different time scales (3 percentage point decrease in car driver trip mode share). The counterfactual indicates nobackground change in travel behaviour and hence does not affectreported outcomes.
5.18 A simplified survey approach was used in Bristol Southville, whichinvolved in the ‘after’ survey asking about average categorical frequencyof walking, cycling and public transport, rather than use of a travel diary.The reported 10% reduction in car driver trips is an approximationinferred from changes in average frequency of use of these three modesand reference to previous Bristol results. No control area survey wasconducted, and hence there is no counterfactual used.
5.19 For Darlington Phase 1 the results suggest modest change in modalsplit, with only public transport registering a change of more than 1percentage point (increase of 2 percentage points). Taking into accountcounterfactual does not affect this result, as little change in modal split isrecorded in the town-wide control area. With Darlington Phase 2 themeasured changes indicate a large increase in share of trips by walking
7 In the evaluation for Bristol Bishopsworth (6 month result) a different method of taking intoaccount counterfactual has been used than has been used in other evaluations. We have carried out a new calculation which is consistent with the method usually used inSustrans/Socialdata evaluations. 35
| 5. Objective 1: The Key Elements of Success

(6 percentage points) and a large decrease in the share of trips by cardriver (5 percentage points). The data taking account of the town-widecontrol group is currently being re-analysed and will be reported fully inearly 2008.
5.20 For Lancashire South Ribble detailed evaluation reporting has not beenavailable in time for this report, but headline evaluation results have beenprovided. These show that, similarly to Darlington Phase 2, a large increasein share of trips by walking (6 percentage points) and large decrease inshare of trips by car driver (5 percentage points) is measured. Taking intoaccount the town-wide control trend suggests the decrease in the shareof car driver trips attributable to PTP is even higher at 7 percentagepoints. This suggests that any broader initiatives being taken in the townare not being effective, and indicates the need for careful checking ofcounterfactual, and for close attention to be paid to the validity of thecontrol data results.
5.21 The Nottingham Lady Bay results suggest an increase in share of tripsby walking (3 percentage points) and a decrease in the share of trips bycar driver (3 percentage points). Taking into account city-wide controltrend magnifies the estimated change in the mode share of these twomodes to 5 percentage points. Again, corroboration for whether themeasured city-wide trends recorded from the control data were validwould have been helpful. This should have been possible from other dataavailable in Nottingham. For Nottingham Meadows the results of thesurvey of the target area suggest no significant change in modal split buttaking into account the same background trend as Nottingham Lady Bayindicates car driver decrease of 3 percentage points. For both theseproject areas bus upgrades occurred at the same time as PTP and maycontribute to the impacts.
5.22 The Peterborough Phase 1 results suggest an increase in share of tripsby walking (4 percentage points) and decrease in share of trips by cardriver (5 percentage points). There is no change in modal split in controldata, representing wider town background trend, hence taking this intoaccount does not affect these results. It might have been expected thatwider initiatives in town would have influenced modal split and the effectof PTP would have been lower than that measured when taking this intoaccount. Again, reference to town-wide travel trends to confirm thevalidity of the counterfactual would have been beneficial.
5.23 In Worcester detailed evaluation reporting has been available in time for this report for Phase 1 but only headline evaluation results have beenavailable for Phases 2.1 and 2.2. In Worcester the after surveys in thetarget areas have asked about average categorical frequency of walking,cycling, public transport and car, rather than involved travel diary. To estimate change in trips requires assumptions about relationshipbetween average categorical frequencies and number of trips (which has been achieved using baseline travel survey data). Similar city-widesurveys have been conducted at the same time as the ‘after’ surveys and are used as controls. This has enabled estimates of car driver tripreduction of 12% for Phase 1, 13% for Phase 2.1 and 11% for Phase
36
Department for Transport | Making Personal Travel Planning Work

2.2. In the area targeted in Phase 1 (Warndon) a new bus servicecoincided with the PTP project in 2005 and may have contributed to themeasured effect, although bus patronage data suggests this is not thecase (longstanding bus services serving the area experienced increasesin patronage). The control data shows a small city-wide increase in caruse, which is surprising, given other Sustainable Travel Town initiativesbeing delivered across the city. If this is invalid, then the car reductioneffect of PTP will have been exaggerated.
5.24 For Brighton Year 1 detailed evaluation reporting has not been availablein time for this report, but headline evaluation results have been providedwhich suggest measured increases in mode share for walking trips of 5percentage points, cycling trips of 1 percentage point and a reduction incar driver trips of 4 percentage points. It is assumed that these initiallyreported results apply to all persons in project area and not only PTPparticipants. It has not been identified that any surveys are being carriedout in a control area.
5.25 In Bristol Easton limited resources were available for evaluation, withsmall survey sample sizes one consequence of this (the reporting of thefigures within the final evaluation report which clearly sets out theconstraints and limitations of the data analysis is to be commended). The travel survey conducted in the project area achieved 54 responses in the before survey (from 500 posted surveys) and 32 responses in aftersurvey, therefore there is a large amount of uncertainty associated withthe results. The results showed a 7 percentage point reduction in theshare of ‘car-as-driver’ trips (from 41% to 34%) amongst participants,whilst non-participants increased their share of ‘car-as-driver’ trips by 6 percentage points (from 33% to 39%). Given the low sample sizes, asupporting survey was undertaken to provide supplementary information.It was distributed to 1,555 people who had participated in the projectand from the 262 responses 40% said they had decreased car drivertrips and 10% said they had increased car driver trips. No surveys werecarried out in a control area in this project. The reliability of survey resultsis an issue to consider for all the survey results and is discussed furtherin Chapter 9.
37
| 5. Objective 1: The Key Elements of Success
Control group effect
5.26 The discussion of project results has shown that, at the level of theindividual project, the estimate of the counterfactual can have a largebearing on the result obtained for the effect of PTP. There are a numberof important aspects raised by the use of control groups, includingwhether the control area is representative (i.e. directly comparable to thetarget area) and whether sufficient sample sizes are used. It is alsoimportant that the results for the control data are corroborated with otherdata (aggregate data for car traffic, for example) before being used inestimating PTP effect. To date, this has only been undertaken on alimited number of occasions.
5.27 For this reason it is suggested that reference is made to both the measured changes in travel behaviour (Table 5.2) and the changes in travelbehaviour attributed to PTP (Table 5.3) when reviewing PTP findings. In referring to measured changes, regard will need to be paid to otherfactors than PTP that could have affected results (some information onother factors is provided in Tables 5.2–5.4).
Other reported findings
5.28 Other information on personal travel is reported in some of the evaluationreports than that presented and discussed so far. For completeness, a summary of this data (where available, and as reported) is shown inTable 5.5.
38
Department for Transport | Making Personal Travel Planning Work
Table 5.5: Reported change in mobility by participants (mean values, per day)attributed to PTP
DistanceActivities Travel time Trips (miles)
Approach/serviceProject provider before after before after before after before after
Bristol Bishopsworth TravelSmart 1.4 1.4 50 52 2.4 2.4 15 16
Bristol Hartcliffe TravelSmart 1.5 1.5 56 57 2.5 2.5 16 17
Bristol Bishopston TravelSmart 1.7 1.7 57 57 3 3 15 15
Nottingham Lady Bay TravelSmart 1.7 1.7 62 62 3.1 3.1 20 19
Nottingham Meadows TravelSmart 1.5 1.5 56 57 2.7 2.7 14 13
Darlington Phase 1 SDG 1.7 1.6 58 57 2.9 2.9 23 20
Overall average 1.6 1.6 57 57 2.8 2.8 17 17
Note: Figures include the effect of the control group. Figures are ‘as reported’ in project evaluation reports, and have not been tested for levels ofstatistical significance
5.29 It has often been found that the proportion of trips carried out in a localarea increases after a PTP project, which supports the general result thatwalking increases at the expense of car trips. Changes in the purposes of trips undertaken (in total or by mode) have not shown any consistent trend.
What makes an effective project?
5.30 An examination of the characteristics of the case study sites, combinedwith in-depth discussion with practitioners has enabled the project toexplore the components of the PTP process and characteristics of sitesthat are most likely to lead to successful outcomes. Reference has alsobeen made to experience outside the case studies in other PTP projectsconducted worldwide. The findings that follow are largely based onqualitative insights. It has not been possible to conduct a statisticalmeta-analysis of quantitative impacts from the case studies and relatethese to determining factors. There are a number of reasons for this,most notably that results are only available for a fairly modest number of projects (between ten and fifteen), and that unidentified differencesbetween sites are likely to make it unreliable to attribute project impactsto particular case study characteristics.
5.31 In broad terms, the success of a PTP project can be broken down into:
• the project process;
• the geographic and population context.
5.32 Each of these is discussed in detail below.
Project process
Important operational aspects
5.33 The scale and complexity of PTP projects demands strong projectmanagement skills, and an imperative for a detailed project plan. The components of the project plan, and their importance in projectperformance, are discussed below.
Stage 1: Planning
5.34 Management arrangements: An important early consideration is todetermine how the PTP project will be undertaken, i.e. whether it will beundertaken solely by the local authority, outsourced, or in partnershipwith a consultancy. This decision will help to shape the entire project –for example, Brighton and Hove are responsible for the management oftheir PTP project but have worked with Cycling England and a consultantpartner on planning the project and staff recruitment (to be discussed ina later section), whereas Worcestershire, Peterborough and Darlingtonwork closely in partnership with their consultancy partner to deliver thePTP component of larger scale sustainable transport projects.
39
| 5. Objective 1: The Key Elements of Success
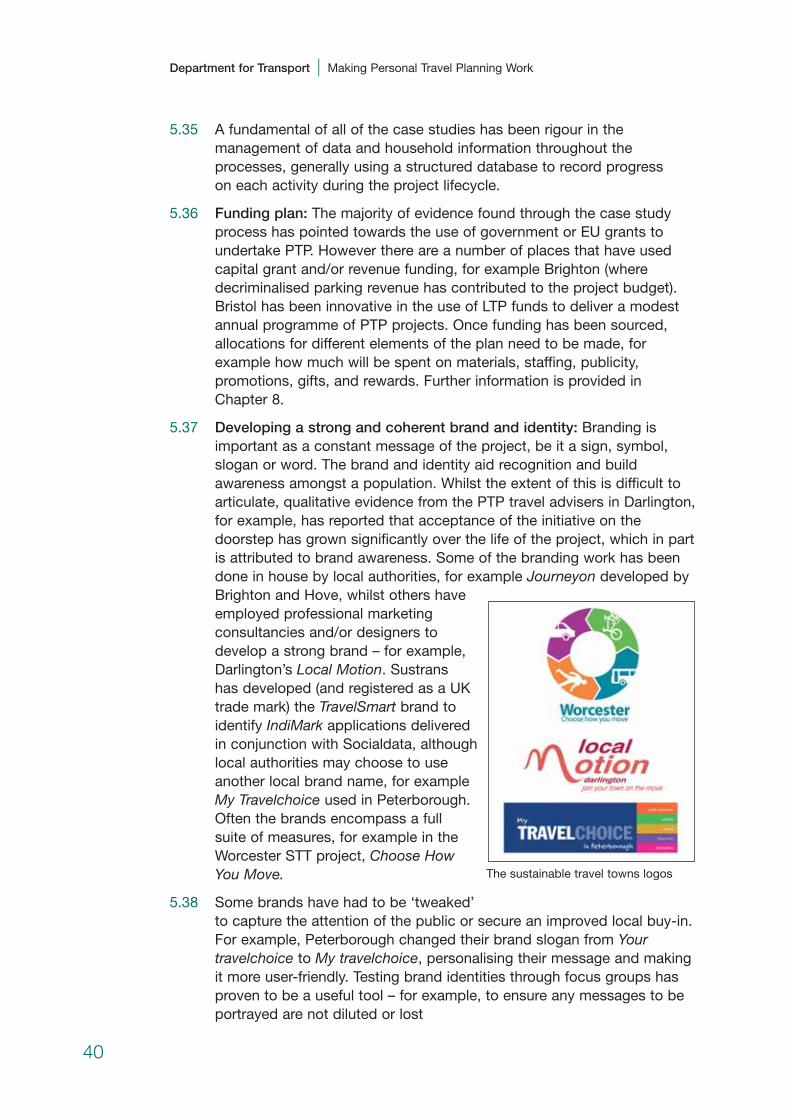
5.35 A fundamental of all of the case studies has been rigour in themanagement of data and household information throughout theprocesses, generally using a structured database to record progress on each activity during the project lifecycle.
5.36 Funding plan: The majority of evidence found through the case studyprocess has pointed towards the use of government or EU grants toundertake PTP. However there are a number of places that have usedcapital grant and/or revenue funding, for example Brighton (wheredecriminalised parking revenue has contributed to the project budget).Bristol has been innovative in the use of LTP funds to deliver a modestannual programme of PTP projects. Once funding has been sourced,allocations for different elements of the plan need to be made, forexample how much will be spent on materials, staffing, publicity,promotions, gifts, and rewards. Further information is provided inChapter 8.
5.37 Developing a strong and coherent brand and identity: Branding isimportant as a constant message of the project, be it a sign, symbol,slogan or word. The brand and identity aid recognition and buildawareness amongst a population. Whilst the extent of this is difficult toarticulate, qualitative evidence from the PTP travel advisers in Darlington,for example, has reported that acceptance of the initiative on thedoorstep has grown significantly over the life of the project, which in partis attributed to brand awareness. Some of the branding work has beendone in house by local authorities, for example Journeyon developed byBrighton and Hove, whilst others have employed professional marketing consultancies and/or designers to develop a strong brand – for example, Darlington’s Local Motion. Sustrans has developed (and registered as a UK trade mark) the TravelSmart brand to identify IndiMark applications delivered in conjunction with Socialdata, although local authorities may choose to use another local brand name, for example My Travelchoice used in Peterborough. Often the brands encompass a full suite of measures, for example in the Worcester STT project, Choose How You Move.
5.38 Some brands have had to be ‘tweaked’to capture the attention of the public or secure an improved local buy-in.For example, Peterborough changed their brand slogan from Yourtravelchoice to My travelchoice, personalising their message and makingit more user-friendly. Testing brand identities through focus groups hasproven to be a useful tool – for example, to ensure any messages to beportrayed are not diluted or lost
40
Department for Transport | Making Personal Travel Planning Work
The sustainable travel towns logos
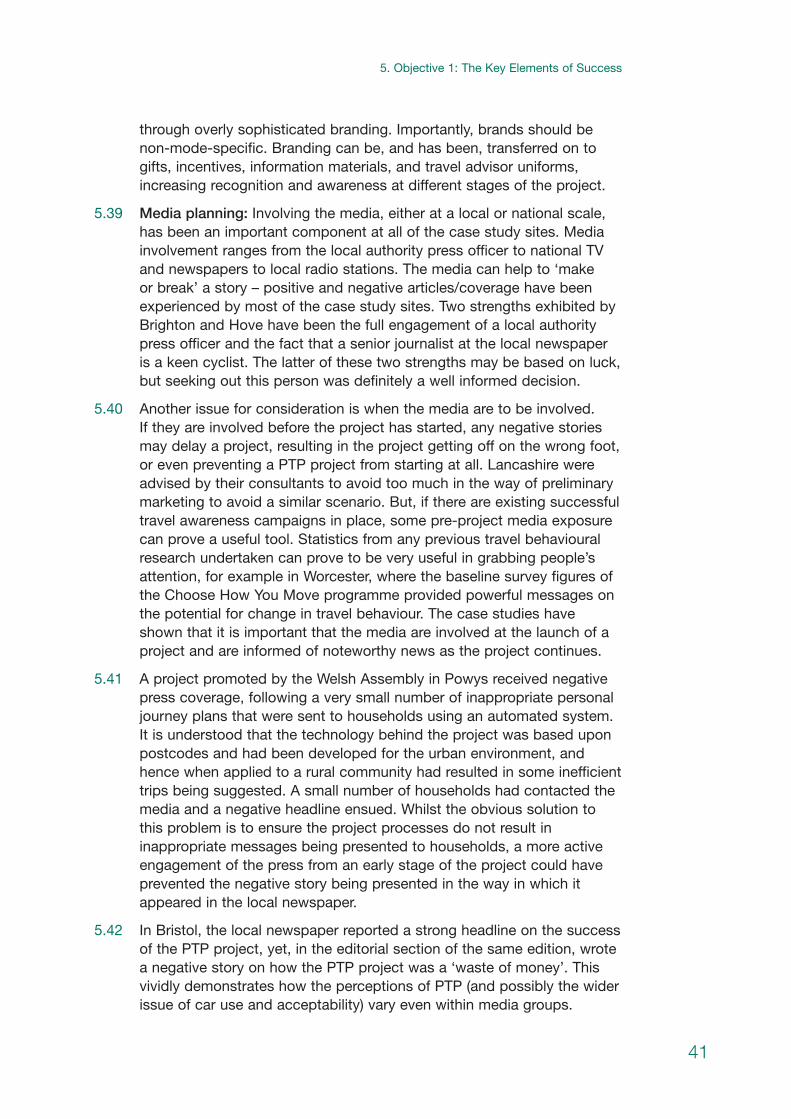
through overly sophisticated branding. Importantly, brands should benon-mode-specific. Branding can be, and has been, transferred on togifts, incentives, information materials, and travel advisor uniforms,increasing recognition and awareness at different stages of the project.
5.39 Media planning: Involving the media, either at a local or national scale,has been an important component at all of the case study sites. Mediainvolvement ranges from the local authority press officer to national TVand newspapers to local radio stations. The media can help to ‘make or break’ a story – positive and negative articles/coverage have beenexperienced by most of the case study sites. Two strengths exhibited byBrighton and Hove have been the full engagement of a local authoritypress officer and the fact that a senior journalist at the local newspaperis a keen cyclist. The latter of these two strengths may be based on luck,but seeking out this person was definitely a well informed decision.
5.40 Another issue for consideration is when the media are to be involved. If they are involved before the project has started, any negative storiesmay delay a project, resulting in the project getting off on the wrong foot,or even preventing a PTP project from starting at all. Lancashire wereadvised by their consultants to avoid too much in the way of preliminarymarketing to avoid a similar scenario. But, if there are existing successfultravel awareness campaigns in place, some pre-project media exposurecan prove a useful tool. Statistics from any previous travel behaviouralresearch undertaken can prove to be very useful in grabbing people’sattention, for example in Worcester, where the baseline survey figures ofthe Choose How You Move programme provided powerful messages onthe potential for change in travel behaviour. The case studies haveshown that it is important that the media are involved at the launch of aproject and are informed of noteworthy news as the project continues.
5.41 A project promoted by the Welsh Assembly in Powys received negativepress coverage, following a very small number of inappropriate personaljourney plans that were sent to households using an automated system.It is understood that the technology behind the project was based uponpostcodes and had been developed for the urban environment, andhence when applied to a rural community had resulted in some inefficienttrips being suggested. A small number of households had contacted themedia and a negative headline ensued. Whilst the obvious solution tothis problem is to ensure the project processes do not result ininappropriate messages being presented to households, a more activeengagement of the press from an early stage of the project could haveprevented the negative story being presented in the way in which itappeared in the local newspaper.
5.42 In Bristol, the local newspaper reported a strong headline on the successof the PTP project, yet, in the editorial section of the same edition, wrotea negative story on how the PTP project was a ‘waste of money’. Thisvividly demonstrates how the perceptions of PTP (and possibly the widerissue of car use and acceptability) vary even within media groups.
41
| 5. Objective 1: The Key Elements of Success
5.43 Event planning: Careful planning of PTP specific events (pre-launch andduring the contact stage), or piggy-backing on other sustainabilityevents, can bring positive benefits to the project. They can be used toboth promote the PTP project and/or to receive feedback from the publicon ways to improve the process.
5.44 Members of the TfL PTP team arranged a highly successful bike party(with professional support from an event management company) whichattracted local media coverage and achieved a recollection figure of 47%amongst the target area (irrespective of attendance). Many of the casestudies make efforts to link in with national campaign days, e.g. In TownWithout My Car and local events such as the London to Brighton bikeride. The launch events for the Local Motion project in Darlington used a Kylie Minogue look-alike to attract media and public attention in thestreets of Darlington.
Brighton JourneyOn event. Photo courtesy of Brighton and Hove City Council
5.45 Engaging with partners: Partners play a significant role in any successfulPTP project, including any appointed consultancy support. Whilst theformal relationship between the local authority and consultant will bebound by the terms of contract, there is evidence from the case studysite practitioners that engagement between the local authority and theconsultancy partner, at all stages of the PTP process, is important increating an inclusive project, which is perceived as contributing to amore effective project process. This includes regular meetings, combinedwith ad-hoc visits to field offices, call centres, even undertaking door todoor sessions with PTP households.
5.46 In Perth (Australia), the maturity of the PTP market place has enabledthem to create a PTP framework contract, which enables them tostreamline the process of deploying PTP teams for future projects.Melbourne have also adopted alternative models of consultancy
42
Department for Transport | Making Personal Travel Planning Work
partnership through the appointment of three separate teams of consultants, each working at the same time, to the same brief, but in different sectorsof the city. This has enabled Melbourne to independently verify theoutcomes of the PTP process (rather than a particular consultancymodel), with all 3 consultancy outcomes independently evaluated and audited.
5.47 Other partners generally include the local bus (and rail) operator, local bike shops, contacts in the health sector, pubs/bars and localattractions. Despite experience to date in the UK only demonstratingsmall increases in bus use as a result of PTP interventions, local busoperators are important for several reasons. They can provide:
• valuable knowledge of bus network and timetable changes during the course of the study (and can work with the project team to ensurea degree of consistency during the project phases);
• up-to-date marketing material (including timetables and bus routemaps) relevant to the project (either to be used directly or as thebasis for project specific material);
• bus drivers to undertake any public transport focussed home visits;
• valuable corroborative data on the impacts of the intervention;
• (free of charge or at discounted rates) day, week or travel passes thatcan be given to participants as gifts or be used as an incentive.
5.48 PTP has to date provided only limited tangible outcomes for busoperators, in terms of patronage (and farebox revenue) and improved bus satisfaction (Peterborough has seen its BVPI for bus satisfactionincrease from 45% (2003) to 62% (2006), and satisfaction with transportinformation increase from 43% (2003) to 53% (2006) during theimplementation of the PTP programme). Bus operators involved in thePTP process have also used the process as a source of feedback and to gain a greater understanding of the issues affecting their customers.
5.49 It is however, important to note some caution over the acceptability ofPTP amongst all bus operators – for example, a discussion with a UKbus operator identified that the case has still not been fully made for PTP,and that, in their view, a significantly more cost-effective way is to delivertargeted advice and timetable updates through direct mail shot. This is atodds with the evidence from Perth (Australia) presented later in Table5.13, and later in Chapter 10, although it does accord with the evidenceof the Number 30 pilot project delivered in Nottingham in 2006, whichadopted a semi-personalised approach more akin to direct marketing ofthe service (see case studies summary report for further information).Some practitioners believe that the argument over whether or not PTPtruly works will only ever be resolved when hard evidence relating to bususe (and/or walk, cycle, car counts) is demonstrated.
43
| 5. Objective 1: The Key Elements of Success
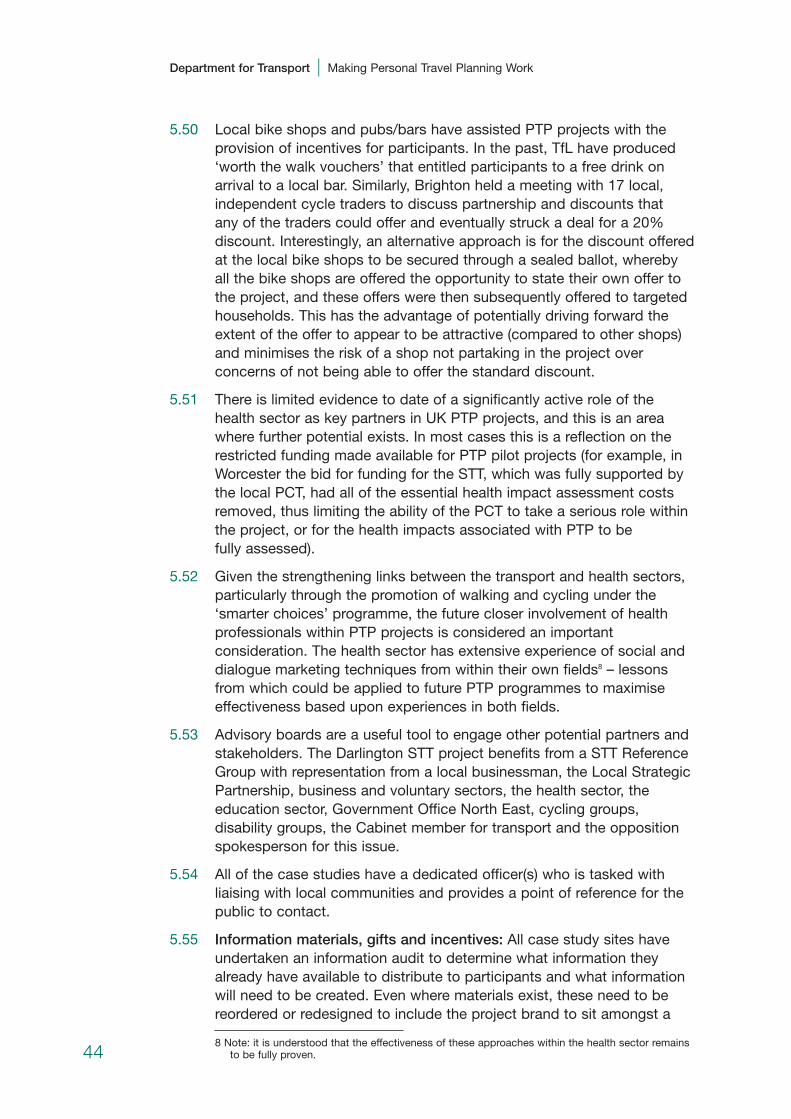
5.50 Local bike shops and pubs/bars have assisted PTP projects with theprovision of incentives for participants. In the past, TfL have produced‘worth the walk vouchers’ that entitled participants to a free drink onarrival to a local bar. Similarly, Brighton held a meeting with 17 local,independent cycle traders to discuss partnership and discounts that any of the traders could offer and eventually struck a deal for a 20%discount. Interestingly, an alternative approach is for the discount offeredat the local bike shops to be secured through a sealed ballot, whereby all the bike shops are offered the opportunity to state their own offer tothe project, and these offers were then subsequently offered to targetedhouseholds. This has the advantage of potentially driving forward theextent of the offer to appear to be attractive (compared to other shops)and minimises the risk of a shop not partaking in the project overconcerns of not being able to offer the standard discount.
5.51 There is limited evidence to date of a significantly active role of thehealth sector as key partners in UK PTP projects, and this is an areawhere further potential exists. In most cases this is a reflection on therestricted funding made available for PTP pilot projects (for example, inWorcester the bid for funding for the STT, which was fully supported bythe local PCT, had all of the essential health impact assessment costsremoved, thus limiting the ability of the PCT to take a serious role withinthe project, or for the health impacts associated with PTP to be fully assessed).
5.52 Given the strengthening links between the transport and health sectors,particularly through the promotion of walking and cycling under the‘smarter choices’ programme, the future closer involvement of healthprofessionals within PTP projects is considered an importantconsideration. The health sector has extensive experience of social anddialogue marketing techniques from within their own fields8 – lessonsfrom which could be applied to future PTP programmes to maximiseeffectiveness based upon experiences in both fields.
5.53 Advisory boards are a useful tool to engage other potential partners andstakeholders. The Darlington STT project benefits from a STT ReferenceGroup with representation from a local businessman, the Local StrategicPartnership, business and voluntary sectors, the health sector, theeducation sector, Government Office North East, cycling groups,disability groups, the Cabinet member for transport and the oppositionspokesperson for this issue.
5.54 All of the case studies have a dedicated officer(s) who is tasked withliaising with local communities and provides a point of reference for thepublic to contact.
5.55 Information materials, gifts and incentives: All case study sites haveundertaken an information audit to determine what information theyalready have available to distribute to participants and what informationwill need to be created. Even where materials exist, these need to bereordered or redesigned to include the project brand to sit amongst a
8 Note: it is understood that the effectiveness of these approaches within the health sector remainsto be fully proven.44
Department for Transport | Making Personal Travel Planning Work
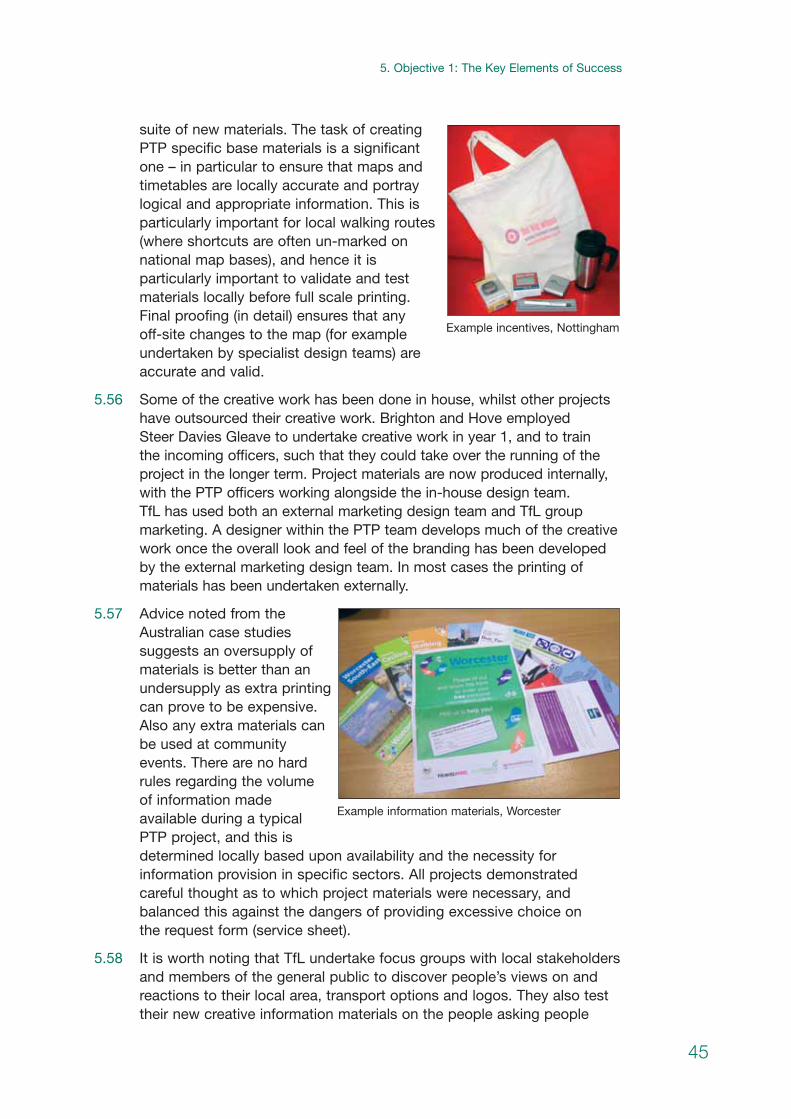
suite of new materials. The task of creatingPTP specific base materials is a significantone – in particular to ensure that maps andtimetables are locally accurate and portraylogical and appropriate information. This isparticularly important for local walking routes(where shortcuts are often un-marked onnational map bases), and hence it isparticularly important to validate and testmaterials locally before full scale printing.Final proofing (in detail) ensures that any off-site changes to the map (for exampleundertaken by specialist design teams) are accurate and valid.
5.56 Some of the creative work has been done in house, whilst other projectshave outsourced their creative work. Brighton and Hove employed Steer Davies Gleave to undertake creative work in year 1, and to train the incoming officers, such that they could take over the running of theproject in the longer term. Project materials are now produced internally,with the PTP officers working alongside the in-house design team. TfL has used both an external marketing design team and TfL groupmarketing. A designer within the PTP team develops much of the creativework once the overall look and feel of the branding has been developedby the external marketing design team. In most cases the printing ofmaterials has been undertaken externally.
5.57 Advice noted from theAustralian case studiessuggests an oversupply ofmaterials is better than anundersupply as extra printingcan prove to be expensive.Also any extra materials canbe used at communityevents. There are no hardrules regarding the volume of information made available during a typical PTP project, and this is determined locally based upon availability and the necessity forinformation provision in specific sectors. All projects demonstratedcareful thought as to which project materials were necessary, andbalanced this against the dangers of providing excessive choice on the request form (service sheet).
5.58 It is worth noting that TfL undertake focus groups with local stakeholdersand members of the general public to discover people’s views on andreactions to their local area, transport options and logos. They also testtheir new creative information materials on the people asking people
45
| 5. Objective 1: The Key Elements of Success
Example incentives, Nottingham
Example information materials, Worcester
about the colours used, logo placement, type of paper, etc. The originalcreative designs for the Sutton information materials were considered bythe PTP project team to be not fully supportive of the messages to beportrayed, and this was reinforced by the focus group participants, whoindicated that the print was too glossy, printed on non-recycled paper,and looked dated, cheap and uninspiring. This resulted in the designersgoing back to the drawing board and the end result was informationmaterials printed on recycled paper, with a simple, green coloured theme and a dandelion as a logo (naturalistic and representative of the environment). It is also worth noting that the public like to see localpictures on information leaflets.
5.59 The use of organisational logos on information materials can influencethe way the material will be viewed by the public. This depends on theiropinion of the organisation in question, in particular the local authority,therefore thought needs to go into whether the local authority’s nameand logo should be used or not. The overall views expressed during thecase study interviews where that the use of local authority logos shouldbe avoided (or at least minimised) and that it is the local brand for theproject that dominates.
5.60 There have been some notable differences between the case studies asto the use of gifts/rewards to give to people who are already travellingsustainably. Worcester and Peterborough distribute gifts to people whoalready use sustainable transport (and request a gift), whilst in Brightonresources (monetary and a range of incentives) are clearly focused onincentivising people to change their travel behaviour. It is uncertain as towhat extent an understanding of behavioural theories has contributed tothese decisions (further discussion on behavioural theories underpinningPTP is provided in the Appendix).
5.61 TfL are currently giving serious consideration to who gifts/rewards should be given to and at what stage of the PTP process should they be distributed. For example, should a gift be given to residents toencourage them to participate, halfway through the project to supporttheir on-going involvement or at the end of the project as a thank you for participating?
5.62 The case study sites that used gifts and/or incentives had to considerwhat to buy early in the project life cycle. Incentives that offer participants the opportunity to trial new modes are particularly successful, as thetrialling of new modes is seen as a key element for encouraging peopleto change their travel behaviour (noted by many of the case studyinterviewees). Gifts and incentives need to directly target the audiencethey are addressing. A good example of this comes from Perth, wherethe delivery team have really tried to get ‘into the minds’ of the targetaudience. Four branded items have been produced to remind thehouseholder of the PTP intervention at ‘point of decision’ times – forexample, the coffee mug provides a reminder at the breakfast table, anda key ring carries a direct message to remind the householder that sometrips may be possible without the car.
46
Department for Transport | Making Personal Travel Planning Work
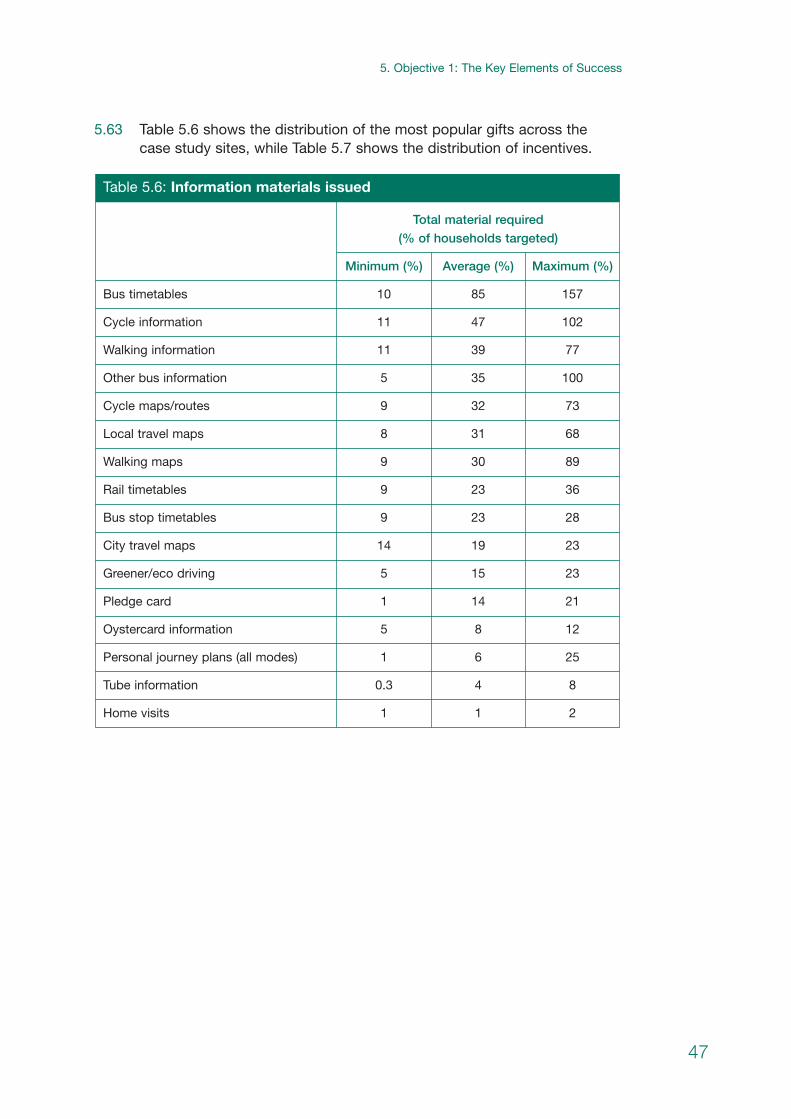
5.63 Table 5.6 shows the distribution of the most popular gifts across thecase study sites, while Table 5.7 shows the distribution of incentives.
Table 5.6: Information materials issued
Total material required
(% of households targeted)
Minimum (%) Average (%) Maximum (%)
Bus timetables 10 85 157
Cycle information 11 47 102
Walking information 11 39 77
Other bus information 5 35 100
Cycle maps/routes 9 32 73
Local travel maps 8 31 68
Walking maps 9 30 89
Rail timetables 9 23 36
Bus stop timetables 9 23 28
City travel maps 14 19 23
Greener/eco driving 5 15 23
Pledge card 1 14 21
Oystercard information 5 8 12
Personal journey plans (all modes) 1 6 25
Tube information 0.3 4 8
Home visits 1 1 2
47
| 5. Objective 1: The Key Elements of Success

5.64 Agree an evaluation process: Evaluation issues need to be consideredfrom the outset of the project, as all evaluations should include someform of pre-intervention survey to record a baseline of existing travelbehaviour. Surveys should also be undertaken after the intervention,and, for the larger scale case studies, interim surveys have been used to assess performance during the course of the project. The use ofcorroborative data and qualitative information should also be consideredat an early stage in the project process.
5.65 The overall effectiveness of any PTP project is generally quantified interms of either: project processes (or outputs); and project outcomes.
Project processes (outputs)
5.66 Given the relatively recent addition of PTP to transport planning(particularly in the UK), PTP projects typically report success based uponboth output and outcome indicators. Project output indicators include:
• number of targeted households approached;
• number of contacted Households (number and percentage of targeted households);
• number of participating households (number and percentage of contacted households);
• number of requests for information (number and percentage of participating households);
• average number of days from request of information to delivery;
• number of additional household visits.
Table 5.7: Incentives distributed
Incentives/gifts required
(% of households targeted)
Minimum (%) Average (%) Maximum (%)
Shopping bag 32 40 49
Other (retail vouchers etc) 15 24 33
Free bus tickets (day tickets) 0.1 21 100
FM radio 7 17 24
Alarm clock 6 13 19
Pen 5 10 16
Mug 6 10 15
Pedometer 0.3 0.4 0.7
Cycle computer 0.3 0.4 0.4
48
Department for Transport | Making Personal Travel Planning Work

5.67 In essence these relate to the performance of the process, as well asproviding a solid indication on the scale and deliverability of the projectand the efficiency with which the project was completed.
Project outcomes
5.68 In addition to project output indicators, outcome-focused indicators areused to measure the change in travel behaviour or attitudes as a result of the PTP intervention. Typical project outcome indicators include:
• reduction in vehicle kilometres travelled;
• change in walking (trips and percentage change);
• change in cycling (trips and percentage change);
• change in bus use (trips and percentage change);
• change in train use (trips and percentage change);
• change in car share (trips and percentage change);
• change in total trips;
• change in trip length;
• participating household satisfaction;
• satisfaction of additional household visits;
• programme recognition and familiarity;
• change in attitudes/beliefs;
• LTP and best value performance indicators relating to the transportnetwork (most notably satisfaction with public transport andsatisfaction with public transport information).
5.69 In accordance with other areas of transport planning (particularly sincethe introduction of guidance for Local Transport Plans), there is a generalfocus on outcome indicators, although, within the full evaluation reportsfor each of the case studies, there remains a strong willingness to reporton project processes (in effect the efficiency of the project delivery). Thisis true for both outsourced and in-house PTP programmes, recognisingthat, particularly on large-scale projects, the link between projectefficiencies and overall project performance remains an important one.As the market continues to mature and a greater emphasis is placedupon value for money, it is likely that the success may well be measuredthrough a smaller number of focused (and consistent) indicators that canbe readily evaluated without significant burden on the project budget.
5.70 Evaluation methods, techniques, processes and procedures arediscussed in much more detail in Chapter 9.
49
| 5. Objective 1: The Key Elements of Success
5.71 Phasing of PTP: To date (particularly overseas), there is some experienceof smaller-scale (often referred to as pilot) schemes being used to test arange of PTP delivery tools and to facilitate an initial understanding ofhousehold motivators for change. Whilst there is no necessity to undertake a smaller-scale project as a first phase, adopting this approach doesallow the delivery team to ‘iron-out’ any problems for future rollouts(evaluation issues, contact strategies, responses to information materials)and estimate the changes in travel behaviour, value for money and publicperception of the project.
5.72 Delivery plan: Early consideration should be given to the production of a detailed delivery plan, which includes timelines for each task involvedin the process, interdependencies, roles and responsibilities andprocedures to record and report activity. Larger scale PTP projects haveused a memorandum of understanding between all partners to securethe ‘buy-in’ and certainty of all tasks in the project process.
Stage 2: Pre-intervention stage
Gathering address/telephone details
5.73 Gathering information that is required to inform the contact stagerequires significant effort. The use of as many sources as possible willhelp to produce an accurate and robust list of contact details. Sources ofinformation include the electoral roll, standard and commercial telephonedatabases, and lists of registered businesses. The Data Protection Act is applicable to all data gathering exercises.
5.74 The data gathered is usually set up and stored in a database where each household is allocated a household ID number that allows for therecording of information concerning all the households in the target area,such as the information gained by the travel advisor visit/phone call, and the current status of each household and future activities required.
5.75 The efficiency with which the household details are collated and stored isan important component of the overall effectiveness of the project process.
Local stakeholder engagement and support
5.76 Engagement with local stakeholders to inform them of the PTP project isessential. It provides the opportunity to provide validated and accuratefindings of the project and helps to secure senior level buy-in to theproject. It also provides the opportunity to gain additional useful localknowledge. The field team manager in Sutton made contact with mobilitygroups in the area and as a result managed to find out about additionalservices that had not been picked up at the planning stage, e.g. mobilityservices. He also contacted, and worked with, the ethnicity officer at thelocal authority.
5.77 Although there is only limited UK experience of involvement of the healthsector, PTP practitioners generally agree that further engagement withthe health sector would be advantageous. A means of increasingengagement levels amongst health professionals might be to provide 50
Department for Transport | Making Personal Travel Planning Work
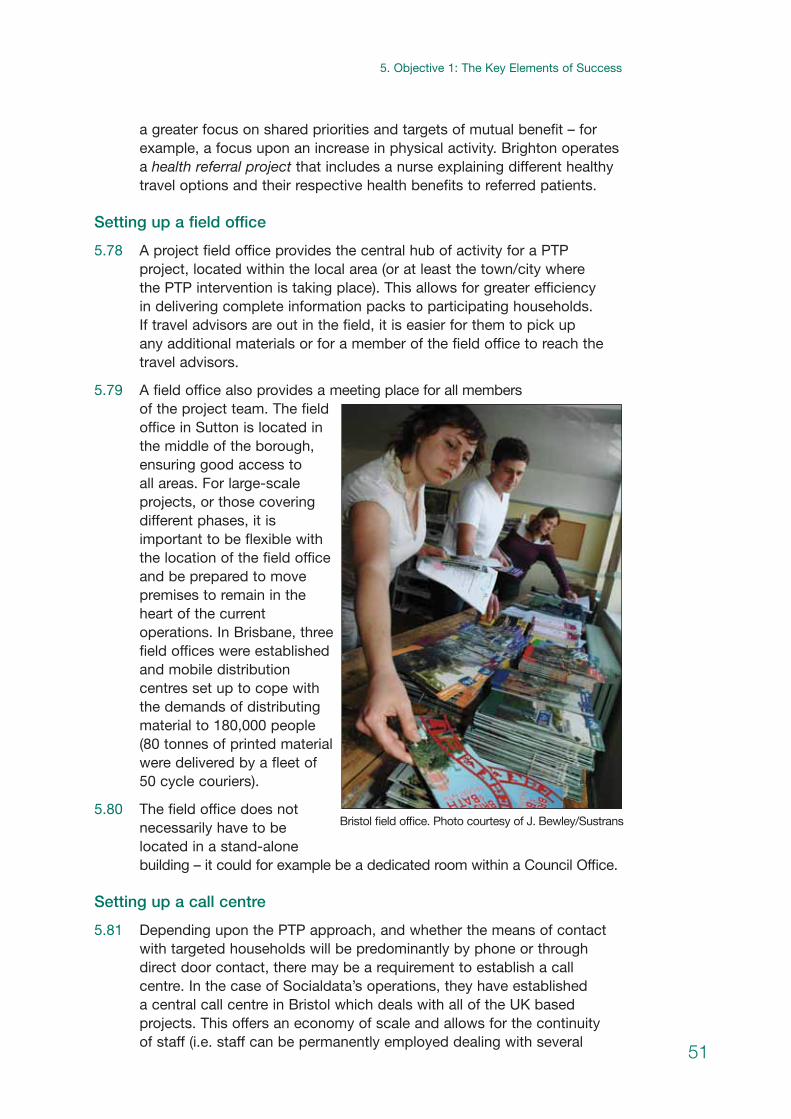
a greater focus on shared priorities and targets of mutual benefit – forexample, a focus upon an increase in physical activity. Brighton operatesa health referral project that includes a nurse explaining different healthytravel options and their respective health benefits to referred patients.
Setting up a field office
5.78 A project field office provides the central hub of activity for a PTPproject, located within the local area (or at least the town/city where the PTP intervention is taking place). This allows for greater efficiency in delivering complete information packs to participating households. If travel advisors are out in the field, it is easier for them to pick up any additional materials or for a member of the field office to reach thetravel advisors.
5.79 A field office also provides a meeting place for all membersof the project team. The fieldoffice in Sutton is located inthe middle of the borough,ensuring good access to all areas. For large-scaleprojects, or those coveringdifferent phases, it isimportant to be flexible withthe location of the field officeand be prepared to movepremises to remain in theheart of the currentoperations. In Brisbane, threefield offices were establishedand mobile distributioncentres set up to cope withthe demands of distributingmaterial to 180,000 people(80 tonnes of printed materialwere delivered by a fleet of 50 cycle couriers).
5.80 The field office does notnecessarily have to be located in a stand-alonebuilding – it could for example be a dedicated room within a Council Office.
Setting up a call centre
5.81 Depending upon the PTP approach, and whether the means of contactwith targeted households will be predominantly by phone or throughdirect door contact, there may be a requirement to establish a callcentre. In the case of Socialdata’s operations, they have established a central call centre in Bristol which deals with all of the UK basedprojects. This offers an economy of scale and allows for the continuity of staff (i.e. staff can be permanently employed dealing with several
51
| 5. Objective 1: The Key Elements of Success
Bristol field office. Photo courtesy of J. Bewley/Sustrans
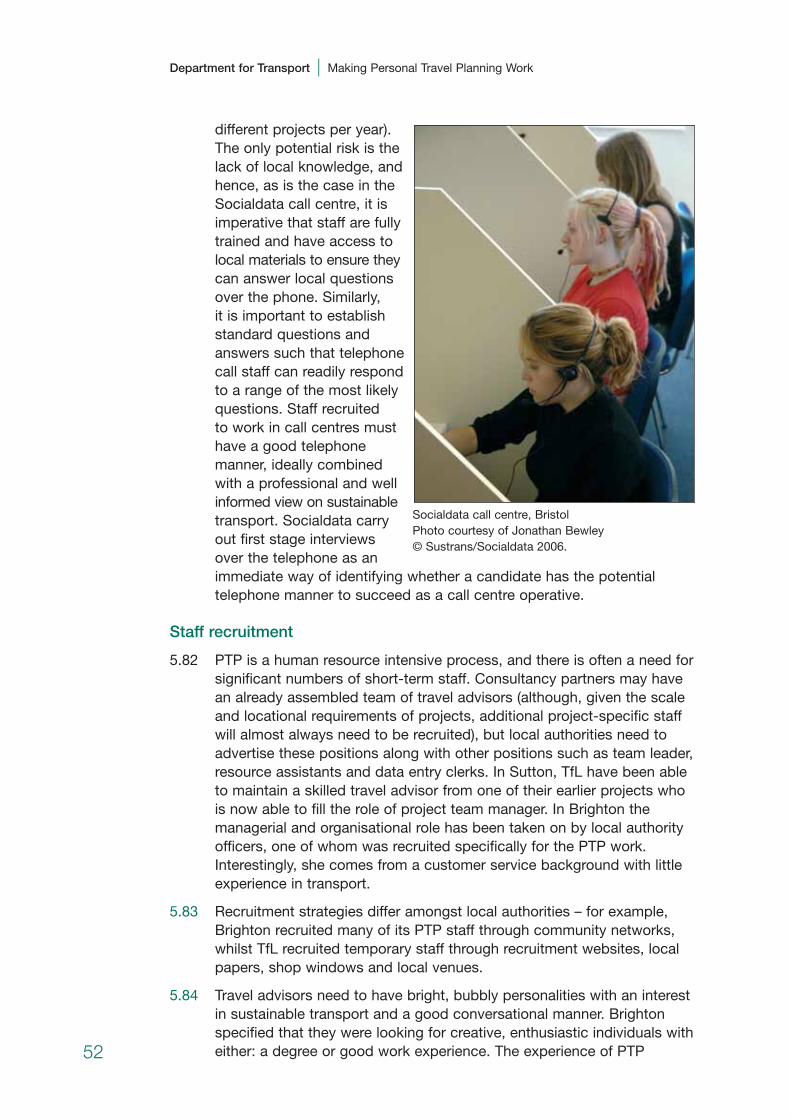
different projects per year).The only potential risk is thelack of local knowledge, andhence, as is the case in theSocialdata call centre, it isimperative that staff are fullytrained and have access tolocal materials to ensure theycan answer local questionsover the phone. Similarly, it is important to establishstandard questions andanswers such that telephonecall staff can readily respondto a range of the most likelyquestions. Staff recruited to work in call centres musthave a good telephonemanner, ideally combinedwith a professional and wellinformed view on sustainabletransport. Socialdata carryout first stage interviews over the telephone as animmediate way of identifying whether a candidate has the potentialtelephone manner to succeed as a call centre operative.
Staff recruitment
5.82 PTP is a human resource intensive process, and there is often a need forsignificant numbers of short-term staff. Consultancy partners may havean already assembled team of travel advisors (although, given the scaleand locational requirements of projects, additional project-specific staffwill almost always need to be recruited), but local authorities need toadvertise these positions along with other positions such as team leader,resource assistants and data entry clerks. In Sutton, TfL have been ableto maintain a skilled travel advisor from one of their earlier projects whois now able to fill the role of project team manager. In Brighton themanagerial and organisational role has been taken on by local authorityofficers, one of whom was recruited specifically for the PTP work.Interestingly, she comes from a customer service background with littleexperience in transport.
5.83 Recruitment strategies differ amongst local authorities – for example,Brighton recruited many of its PTP staff through community networks,whilst TfL recruited temporary staff through recruitment websites, localpapers, shop windows and local venues.
5.84 Travel advisors need to have bright, bubbly personalities with an interestin sustainable transport and a good conversational manner. Brightonspecified that they were looking for creative, enthusiastic individuals witheither: a degree or good work experience. The experience of PTP52
Department for Transport | Making Personal Travel Planning Work
Socialdata call centre, BristolPhoto courtesy of Jonathan Bewley© Sustrans/Socialdata 2006.
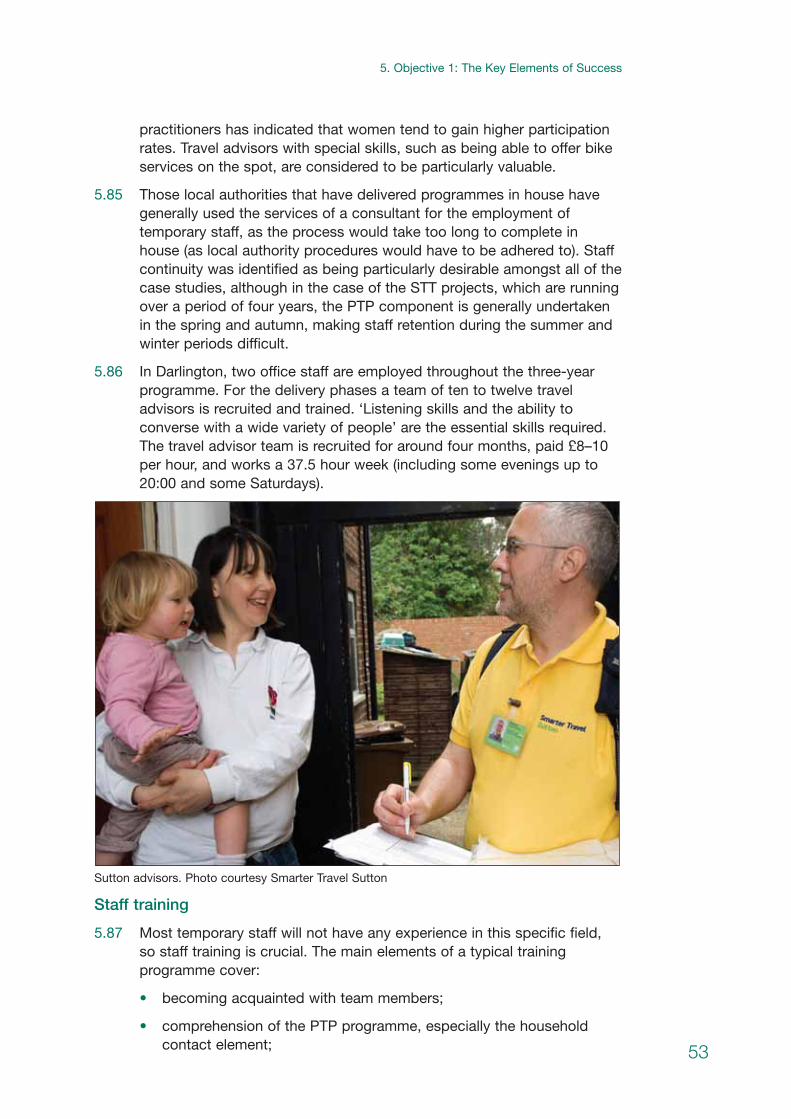
practitioners has indicated that women tend to gain higher participationrates. Travel advisors with special skills, such as being able to offer bikeservices on the spot, are considered to be particularly valuable.
5.85 Those local authorities that have delivered programmes in house havegenerally used the services of a consultant for the employment oftemporary staff, as the process would take too long to complete inhouse (as local authority procedures would have to be adhered to). Staffcontinuity was identified as being particularly desirable amongst all of thecase studies, although in the case of the STT projects, which are runningover a period of four years, the PTP component is generally undertakenin the spring and autumn, making staff retention during the summer andwinter periods difficult.
5.86 In Darlington, two office staff are employed throughout the three-yearprogramme. For the delivery phases a team of ten to twelve traveladvisors is recruited and trained. ‘Listening skills and the ability toconverse with a wide variety of people’ are the essential skills required.The travel advisor team is recruited for around four months, paid £8–10per hour, and works a 37.5 hour week (including some evenings up to20:00 and some Saturdays).
Sutton advisors. Photo courtesy Smarter Travel Sutton
Staff training
5.87 Most temporary staff will not have any experience in this specific field, so staff training is crucial. The main elements of a typical trainingprogramme cover:
• becoming acquainted with team members;
• comprehension of the PTP programme, especially the householdcontact element; 53
| 5. Objective 1: The Key Elements of Success

• becoming familiar with the different types of paperwork;
• learning about the information materials and to whom each piece ofinformation is most suited;
• appreciating some of the complexities of changing travel behaviour;
• learning different conversational techniques;
• becoming familiar with the scheme area;
• learning strategies for dealing with challenging situations.
5.88 In Sutton, travel advisors have been given yellow t-shirts embroideredwith the Smarter Travel Sutton logo as well as a blue rain coat. Theseuniforms help to increase visibility of the project and also provide thetravel advisors with a degree of credibility. There is evidence to suggestthat public recognition of the travel advisors, coupled with a pleasantdoorstep experience reflects well on the local authority.
5.89 Case studies have noted that the ‘recycling’ of travel advisors for furtherprojects is ideal, as the training they undertake is very specific and anyprevious specific experience is an advantage.
Pre-intervention surveys
5.90 Pre-intervention surveysprovide important knowledgeof the backgroundcharacteristics of the localpopulation, and when usedand presented effectively, can have a strong impact insteering the direction of theproject. There are severaladvantages to a well planned and delivered pre-intervention survey:
• providing baseline data to inform the scope of the PTP project(although this needs to ensure it does not conflict with the need toprovide an independent baseline survey for evaluation purposes);
• providing missing knowledge on local perceptions and attitudestowards transport;
• providing knowledge to inform local stakeholders of the opportunityfor travel behaviour change;
• identifying deficiencies in the sustainable transport networks that canbe delivered alongside the PTP programme;
• informing the targets to be adopted by the PTP project;
• inform other transport strategy and policy areas (for example the localtransport plan and regional transport strategy).
54
Department for Transport | Making Personal Travel Planning Work
Baseline survey data collectionPhoto courtesy of Jonathan Bewley © Sustrans/Socialdata 2006
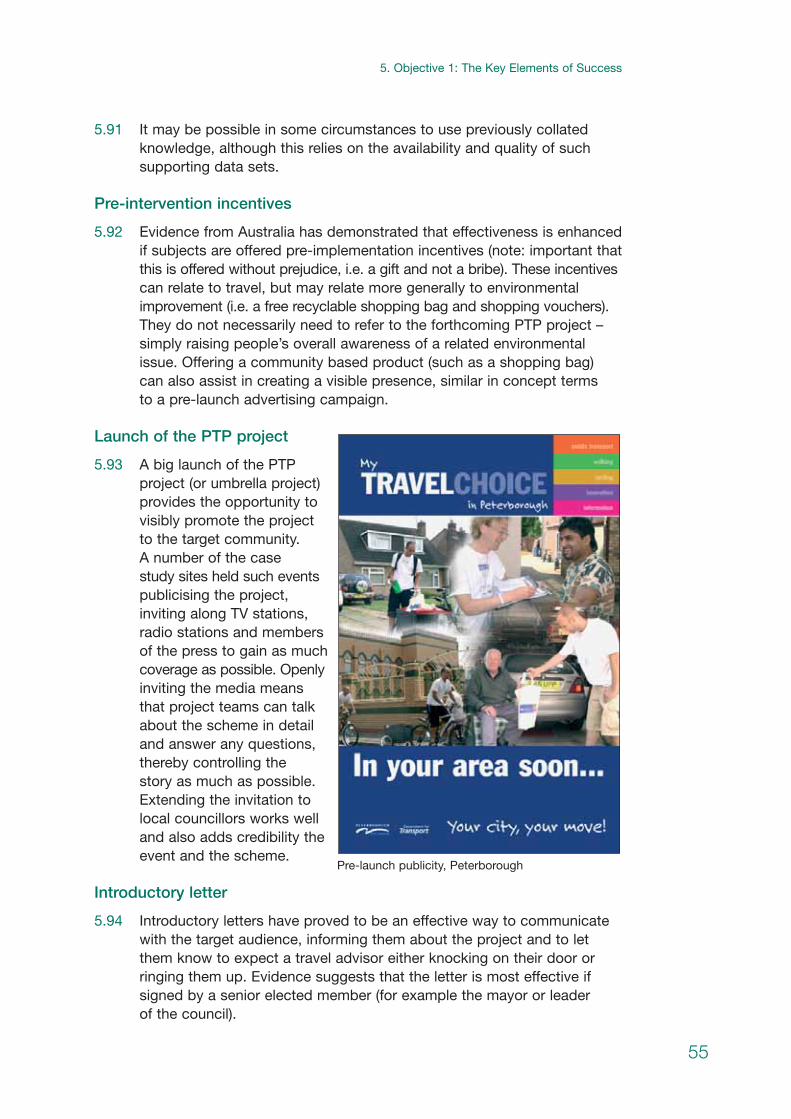
5.91 It may be possible in some circumstances to use previously collatedknowledge, although this relies on the availability and quality of suchsupporting data sets.
Pre-intervention incentives
5.92 Evidence from Australia has demonstrated that effectiveness is enhancedif subjects are offered pre-implementation incentives (note: important thatthis is offered without prejudice, i.e. a gift and not a bribe). These incentives can relate to travel, but may relate more generally to environmentalimprovement (i.e. a free recyclable shopping bag and shopping vouchers). They do not necessarily need to refer to the forthcoming PTP project –simply raising people’s overall awareness of a related environmentalissue. Offering a community based product (such as a shopping bag)can also assist in creating a visible presence, similar in concept terms to a pre-launch advertising campaign.
Launch of the PTP project
5.93 A big launch of the PTPproject (or umbrella project)provides the opportunity tovisibly promote the project to the target community. A number of the case study sites held such events publicising the project,inviting along TV stations,radio stations and membersof the press to gain as muchcoverage as possible. Openlyinviting the media means that project teams can talkabout the scheme in detailand answer any questions,thereby controlling the story as much as possible.Extending the invitation tolocal councillors works welland also adds credibility theevent and the scheme.
Introductory letter
5.94 Introductory letters have proved to be an effective way to communicatewith the target audience, informing them about the project and to letthem know to expect a travel advisor either knocking on their door orringing them up. Evidence suggests that the letter is most effective ifsigned by a senior elected member (for example the mayor or leader of the council).
55
| 5. Objective 1: The Key Elements of Success
Pre-launch publicity, Peterborough
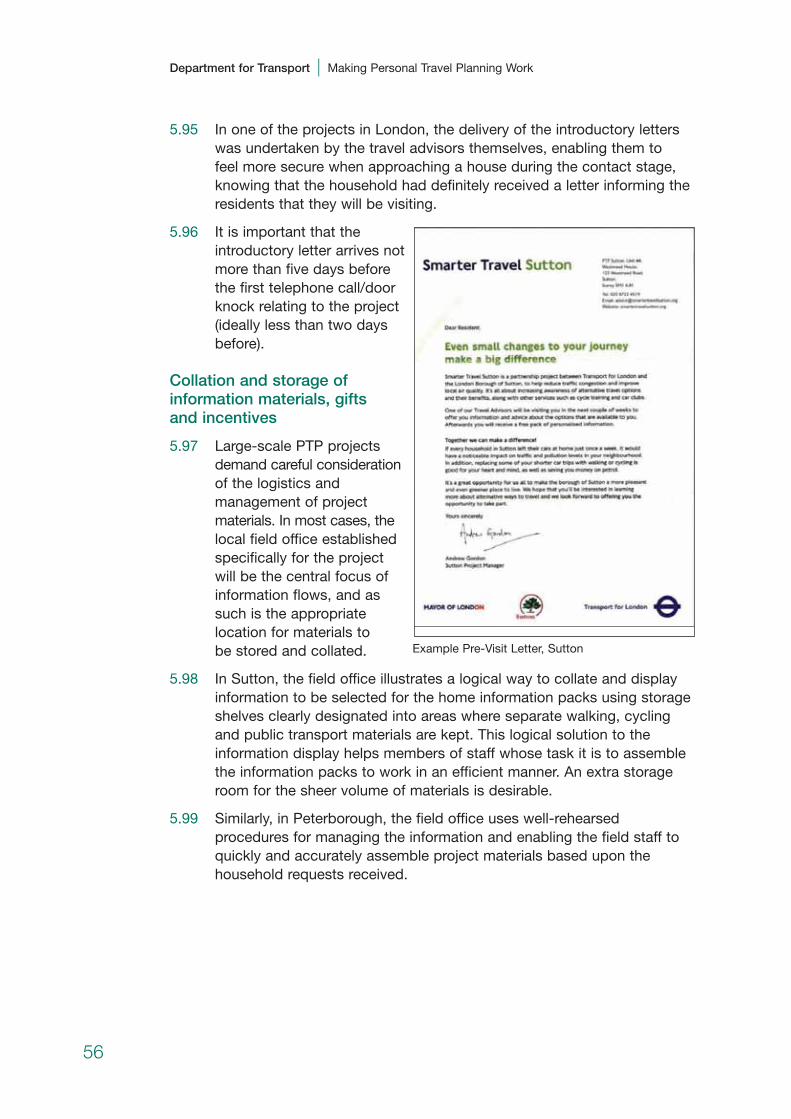
5.95 In one of the projects in London, the delivery of the introductory letterswas undertaken by the travel advisors themselves, enabling them to feel more secure when approaching a house during the contact stage,knowing that the household had definitely received a letter informing theresidents that they will be visiting.
5.96 It is important that theintroductory letter arrives notmore than five days beforethe first telephone call/doorknock relating to the project(ideally less than two daysbefore).
Collation and storage ofinformation materials, gifts and incentives
5.97 Large-scale PTP projectsdemand careful consideration of the logistics andmanagement of projectmaterials. In most cases, the local field office establishedspecifically for the project will be the central focus ofinformation flows, and assuch is the appropriatelocation for materials to be stored and collated.
5.98 In Sutton, the field office illustrates a logical way to collate and displayinformation to be selected for the home information packs using storageshelves clearly designated into areas where separate walking, cyclingand public transport materials are kept. This logical solution to theinformation display helps members of staff whose task it is to assemblethe information packs to work in an efficient manner. An extra storageroom for the sheer volume of materials is desirable.
5.99 Similarly, in Peterborough, the field office uses well-rehearsedprocedures for managing the information and enabling the field staff toquickly and accurately assemble project materials based upon thehousehold requests received.
56
Department for Transport | Making Personal Travel Planning Work
Example Pre-Visit Letter, Sutton

Stage 3: Contact and advice stage
5.100 The contact and advice stage forms the main component of the PTPprogramme and comprises the one-to-one interaction with households.
5.101 In assessing the case studies, a number of operational issues haveemerged, each of which has an impact on overall project effectiveness,and these are outlined below.
Provision of contact data to travel advisors/telephone callers
5.102 Efficiency in the use of contact details established during the planningstage is important. PTP demands rigour within the process to ensure thatconsistent messages are portrayed and households receive appropriatecontact. For large-scale projects, the project team will be tasked withcontacting several thousand households, each of whom may becontactable through different means (telephone and/or door knocking),and on several different occasions. Hence efficiency in the managementof household details is essential, demanding a systematic approach tothe contact process. In all cases, data used throughout the PTP processis managed through a database management system, which provides anessential resource to monitor the progress of the project and ensureconsistency in how information is handled and used.
Timing of contact
5.103 Evidence from London, where the method of contact is through knockingon doors, shows it is best to contact households as soon as possibleafter the introductory letter has been delivered, ideally between 24 and48 hours after the letter has been delivered. This short lag time helps toensure that residents have heard about the project and the details arehopefully still fresh in their mind.
5.104 It is also important that the project team are persistent in their pursuit ofthe initial contact (whether by phone or door knocking), in order to achieve good participation rates (inevitably, on the first contact households maynot be available). Projects differ in how they deal with this issue, and insome case studies use was made of the pre-intervention survey todetermine the amount of effort that would be placed during different time periods (for example where the greatest opportunity for change isidentified as being local trips made by mothers, then the timing of thecontact was placed upon the daytime 10:00–14:00 period).
5.105 As a minimum, every household should receive at least three attempts tocontact (one during the weekday daytime period, one during the weekday evening period, and one during the weekend period). Where the contactis by telephone, it may be possible to increase the number of attemptsmade to contact, as fewer resources are required for each attempt (atelephone call rather than personal visit to the household).
5.106 If a household is not contactable within the framework established forthe project, then as a last resort a service sheet and accompanying lettershould be hand-delivered, inviting the household to participate and torequest appropriate information materials directly. 57
| 5. Objective 1: The Key Elements of Success
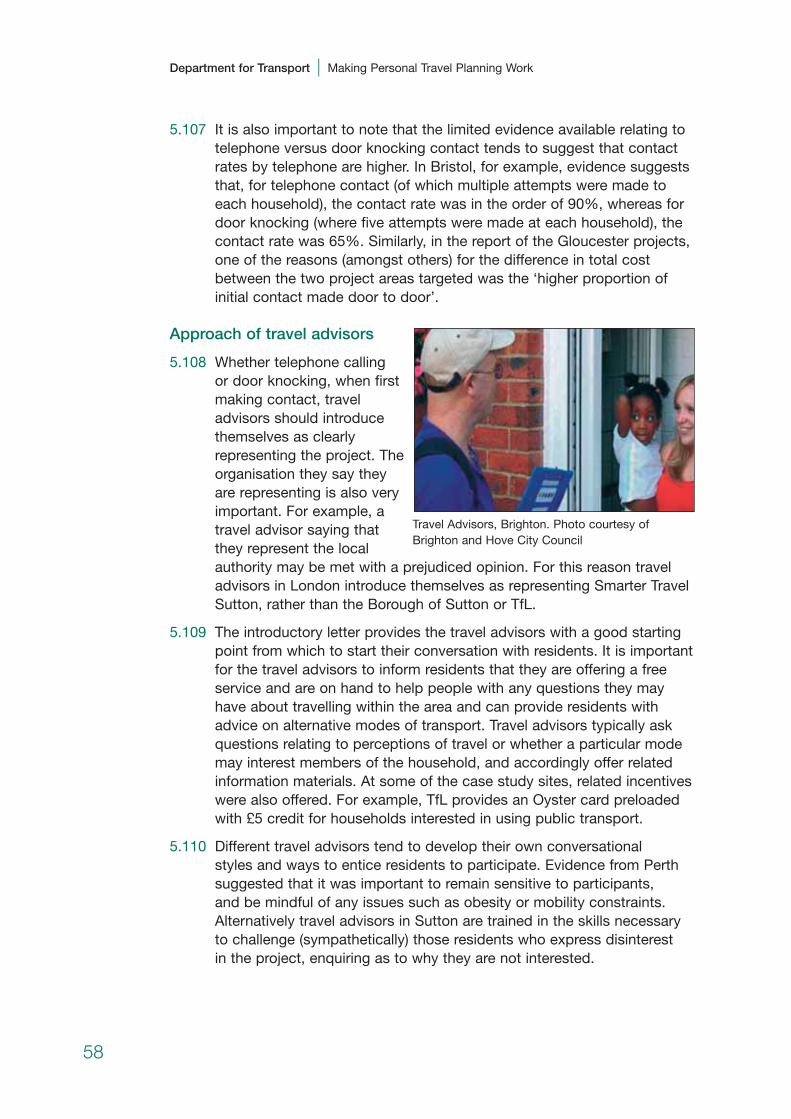
5.107 It is also important to note that the limited evidence available relating totelephone versus door knocking contact tends to suggest that contactrates by telephone are higher. In Bristol, for example, evidence suggeststhat, for telephone contact (of which multiple attempts were made toeach household), the contact rate was in the order of 90%, whereas fordoor knocking (where five attempts were made at each household), thecontact rate was 65%. Similarly, in the report of the Gloucester projects,one of the reasons (amongst others) for the difference in total costbetween the two project areas targeted was the ‘higher proportion ofinitial contact made door to door’.
Approach of travel advisors
5.108 Whether telephone calling or door knocking, when firstmaking contact, traveladvisors should introducethemselves as clearlyrepresenting the project. Theorganisation they say theyare representing is also veryimportant. For example, atravel advisor saying thatthey represent the local authority may be met with a prejudiced opinion. For this reason traveladvisors in London introduce themselves as representing Smarter TravelSutton, rather than the Borough of Sutton or TfL.
5.109 The introductory letter provides the travel advisors with a good startingpoint from which to start their conversation with residents. It is importantfor the travel advisors to inform residents that they are offering a freeservice and are on hand to help people with any questions they mayhave about travelling within the area and can provide residents withadvice on alternative modes of transport. Travel advisors typically askquestions relating to perceptions of travel or whether a particular modemay interest members of the household, and accordingly offer relatedinformation materials. At some of the case study sites, related incentiveswere also offered. For example, TfL provides an Oyster card preloadedwith £5 credit for households interested in using public transport.
5.110 Different travel advisors tend to develop their own conversational styles and ways to entice residents to participate. Evidence from Perthsuggested that it was important to remain sensitive to participants, and be mindful of any issues such as obesity or mobility constraints.Alternatively travel advisors in Sutton are trained in the skills necessaryto challenge (sympathetically) those residents who express disinterest in the project, enquiring as to why they are not interested.
58
Department for Transport | Making Personal Travel Planning Work
Travel Advisors, Brighton. Photo courtesy ofBrighton and Hove City Council

5.111 The travel advisors in Darlington emphasise the principle of reciprocity at the end of their conversations stating words to the effect of ‘I’m goingto send you x, y and z and you’re going to have a look at the resources I send you and see if you can try this’, rendering the conversationaloutcome as a deal.
5.112 Travel advisors that are contacting households via door knocking use anumber of procedures that help to improve their safety whilst alsoincreasing their visibility. Travel advisors tend to stay close togetherworking in neighbouring roads and streets, and are also able to contacteach other via mobile phone. Regular ‘meet-ups’ during the day are alsoimportant to discuss any recent issues/worries.
5.113 Depending upon the incentives available in a project, the travel advisorsmay be able to carry examples with them. For example, many of thetravel advisors in Sutton use a bicycle to travel around and so wear thesnap bands that are offered to households as incentives. Households areable to view the incentive first hand (its value and quality), which mayhave a positive impact and outcome.
5.114 Travel advisors have reported that people sometimes want tocomplain/comment about other things affecting their locality – forexample, overgrown trees and rubbish collection. To provide assistancefor situations like this, the Sutton travel advisors carry a ‘get out of jailfree’ card with telephone numbers for the appropriate local authoritydepartment or local organisations, for example local churches, help forcarers etc.
5.115 It is also important for the travel advisors to discuss the broaderhousehold requirements, ensuring that materials appropriate to allhousehold members are requested. Having engaged with a member ofthe household it is important to maximise the value to be gained fromthis contact, by ensuring that messages, information and motivation aredistilled by the primary contact to other household members.
5.116 For PTP projects where the primary contact is through telephone, it isimportant to use the conversation to engage with the household, inessence encouraging them to participate and to complete the servicesheet (the request mechanism for project materials) during the telephoneconversation. However, time pressures on households can sometimesmake this difficult, and if an alternative call back time is not welcomed,then the travel advisors should always try to encourage the manualcompletion of the service sheet, to be mailed back to the project office at a later stage.
Replenishing of paperwork
5.117 Often the travel advisors that are contacting households via doorknocking cannot carry everything that they may need in a shift. Theopportunity for a fellow colleague to bring additional paperwork or relievethe travel advisors of completed paperwork is a useful tool to make thetravel advisors job easier.
59
| 5. Objective 1: The Key Elements of Success

Completed householdsheet/service sheets
5.118 Completed sheets detailinghousehold details andinformation requests need to be analysed and actionedquickly, providing a fastturnaround from the point ofrequest to delivery. Projectsdiffer on how this is achieved,although generally use adatabase managementsystem to record andprocess requests for eachhouseholds. This has several advantages:
• it enables a record of theproject to be maintained;
• it provides rigour in theway data is managed,accessed and stored;
• it enables the processing of service sheets to be undertaken remotelyfrom the activities of the field office;
• it enables database procedures to be used to automate theproduction of household information requests, which can then bedirectly delivered to the assembly staff within the field office.
Team meetings
5.119 Team meetings during thecontact stage are animportant part of the PTPprocess – motivating thetravel advisors and field staffand maintaining momentumwithin the study, combinedwith the ability to feedback to the wider project team the local issues arising.
60
Department for Transport | Making Personal Travel Planning Work
Peterborough service sheet
Sutton Field Office.Photo courtesy Smarter Travel Sutton

5.120 Field offices (and the call centre) for all Sustrans/Socialdata led projectsrecord and publish a ‘quote of the day’. These are posted on the walls ofthe offices and are also relayed to the client. They serve as a strongmotivational tool for the project team.
Community events
5.121 Community events provide an additional platform for contacting segments of the community who were not contactable by either telephone or doorknocking. This method was used in Brighton, where travel advisors wererequired to staff travel stalls at events on Saturdays (predominantly in thetarget area). This was seen as a worthwhile use of time, as the stallshave attracted the general public’s attention, potentially increasingcontact and participation rates. Additionally, piggy-backing on other localauthority or transport related events is considered particularly relevant.
5.122 In Brisbane, PTP cafés have been established to support the project, inessence providing a drop-in centre for travel advice. The cafés offer freetea, coffee and soft drinks and the opportunity to discuss travel issueswith an advisor.
Segmentation
5.123 The process of segmentation is an important part of the process of thecontact stage. People are placed into different groups which differ fromproject to project and between consultancies. Examples of differentsegmentation styles are shown in Table 5.8.
Table 5.8: Segmentation by PTP approach
Approach Segmentation
TravelSmart/IndiMark • Interested
• Regular user with wish for information
• Regular user with no wish for information
• Not interested
Steer Davies Gleave • No generic segmentation. Use is made of the ‘conversation’ to
PTP ascertain which information is most relevant and/or placed into
project specific segmentation group
London • Participants – took resource
• Already travelling sustainably
• Non-participants (three separate reasons)
Nottingham CityCard • Targets all households
Merseyside • Discontented drivers
• Aspiring environmentalists
• Complacent car addicts
• Reluctant riders
• Die-hard drivers/no hopers
• Car-less crusaders
61
| 5. Objective 1: The Key Elements of Success

5.124 Segmentation is recognised as offering the potential for better targeteduse of resources and more effective delivery in marketing. Anable et al.(2006) argue that psychographic methods (based on attitudinal andaspirational profiles) offer advantages over socio-demographic orbehavioural based segmentation of travellers. Seven travel segmentshave been defined from a Scottish survey of travel awareness. InMerseyside six of these segments have been used (as listed above). It is argued that priority should be given to targeting the most amenablesegments (e.g. discontented drivers, aspiring environmentalists) and thatit may be most productive to encourage those already using alternativesto the car to do so a little more, to encourage experimentation withalternatives by those expressing willingness to try these and to increaseawareness of those with no apparent inclination. A difficulty of thisapproach is identification in which segments people belong without initialresearch. A further concern currently with segmentation based on cross-sectional data of current attitudes/behaviour is that it may not be helpfulin inferring what change in behaviour could occur. With further researchon this (involving monitoring of pilot studies) this concern could be addressed.
Treatment of the segmentation groups
5.125 Significant differences have been noted among case studies regardingthe treatment of different segmentation groups. No conclusions havebeen drawn as to which treatment style is the most successful, but thedifferent approaches are worthy of note. For example, projects using theTravelSmart/IndiMark approach typically (although not always) send outan ‘eco-driving’ pack to ‘not interested households’, whilst householdsthat are deemed to be a regular user of sustainable modes are offeredthe choice of whether to receive information or not.
5.126 On the other hand, the approach taken by TfL to residents who are notinterested is to count them as non-participants, with no furtherinvolvement in the project, whilst people who agree to the receipt ofgreen driving information are counted as participants. Furthermore, TfLsegment residents who are already travelling sustainably as participantsirrespective of information requests or not.
5.127 Table 5.9 shows the split between the different segmented groups withinthe case studies examined (figures refer to the percentage of contactedhouseholds).
62
Department for Transport | Making Personal Travel Planning Work

Delivery of advice
5.128 Typically PTP advice comprises aninformation pack (with incentives if required/requested), delivered to the household containing all the requested materials.
5.129 Projects generally collate the informationpacks at a field office, in accordance with the requirements of each specifichousehold as defined on the service sheet. Experience of field office visits inPeterborough and London conducted as part of this study has demonstrated that they are well managed and efficiently laid out to ensure the right information is inserted in each pack for each household, and thatthe scheduling of the delivery of packs is managed as the packs areproduced (for example by working through the neighbourhood in alogical sequence of streets and house numbers). 63
| 5. Objective 1: The Key Elements of Success
Table 5.9: Household response rates by segmented groups
Regular ST Regular STApproach/ user with user without Not Non
service Interested information information Interested Participating participatingProject provider (%) needs (%) needs (%) (%) (%) (%)
Bristol Bishopsworth TravelSmart 28 18 9 45 55 45
Bristol Hartcliffe TravelSmart 35 21 8 35 65 35
Bristol Bishopston TravelSmart 43 14 12 31 69 31
Bristol Southville, Bedminster, WH TravelSmart 55 15 11 19 81 19
Bristol Clifton Gotham SDG – – – – 57 43
Bristol Easton SDG – – – – 67 33
Darlington Phase 1 SDG – – – – 59 41
Darlington Phase 2 SDG – – – – 68 32
Lancashire South Ribble TravelSmart 49 12 9 30 70 30
Lancashire Skerton, Torrisholme, Bare TravelSmart 51 15 10 24 76 24
London Kingston TfL/SDG – – – – 47 53
London Harringey TfL/SDG – – – – 56 44
Nottingham Lady Bay TravelSmart 49 21 20 10 90 10
Nottingham Meadows TravelSmart 26 29 31 14 86 14
Peterborough Phase 1 TravelSmart 50 11 10 29 71 29
Peterborough Phase 2 TravelSmart 45 13 10 32 68 32
Peterborough Phase 3 TravelSmart 49 18 9 25 75 25
Worcester Phase 1 TravelSmart 44 14 10 32 68 32
Worcester Phase 2.1 TravelSmart 51 13 12 24 76 24
Worcester Phase 2.2 TravelSmart 56 11 9 24 76 24
Total (average percentage) 45 16 12 27 69 31
Worcester ‘Choose How You Move’Photo courtesy J Bewley/Sustrans
5.130 Interestingly, TfL have trialled both internal and outsourced collation ofproject material, with the most recent projects being undertaken in-house. This is considered (by TfL) as a more sustainable and reliable way of carrying out the task.
5.131 The case studies displayed different methods of delivering householdinformation packs, some projects have sent them through the post byRoyal Mail, whilst others have delivered them by hand using bikecouriers. The use of a bike courier is a particularly appropriate way ofpromoting the use of sustainable modes and adds credibility andvisibility to the project. This method can also allow for personal deliveryof a pack straight into the hands of a member of the household, andpotentially a travel advisor could discuss issues with a household as they open their pack to encourage, motivate and answer any questions.
5.132 Another important factor in the delivery of packs is to personalise thepacks by including the name of the person who initially answered thetelephone or door. This helps to make people feel that they have beenconsidered individually, that it is their pack with their requestedinformation rather than a standard pack of information materials.
5.133 It is also important to issue the packs to people as soon as possible after they have requested information, so the project is still fresh in theirmemory and people can take advantage of the information. Quickresponse rates and turnaround times are important at all stages of thePTP process, and information packs should be issued within five days of receipt of a service sheet from a particular household.
Further services
5.134 Different further services have been distinguished from the case studies.Projects involving Sustrans/Socialdata offer home visits to householdswith a particular interest in walking, cycling or public transport. Interestingly, it is at the home visit stage where incentives that involve trialling differentmodes are typically available, for example the offer of a one-month public transport test ticket in Worcester. Issuing the incentive at this stage helpsto ensure that the household in question is serious about changing theirtravel behaviour, and targets resources effectively. However, the numberof these visits has been consistently low (at around 1% of targetedhouseholds) and it has meant that few people receive such incentives.
5.135 In other projects, for example Brighton, one-day test tickets are givenaway at stalls or by travel advisors to encourage people to participate,whilst in London TfL offer the pre-loaded Oyster cards to people basedon the initial conversation held and the travel advisor’s feeling that thehousehold would benefit from the Oyster card.
5.136 An interesting approach has been the use of bus drivers to conductpublic transport oriented home visits (for example, as employed inWorcester). Bus drivers are well prepared to deal with a whole range ofquestions that households may have and are considered (by projectpromoters to date) to be more likely to be trusted and be viewed as acredible source because of experience in the industry. In Perth the project has assembled a bus driver guidance note for undertaking such visits.64
Department for Transport | Making Personal Travel Planning Work
5.137 Home visits tend to have a low take-up (typically 1% of the targetedhouseholds). For households where home visits are conducted, they aregenerally very well received (as recorded in the satisfaction feedbackfrom participants).
5.138 For their 2007 PTP project, Brighton and Hove has made onefundamental development: in addition to offering a PTP package to allresidents within the area, 100 people will be selected at the doorstep toform part of an intensive group, who will each receive a unique tailoredpackage of £270 each for whatever they need to get them cycling. Travel advisors work with local cycle retailers and go with the individualcyclist to a local bike shop to offer a continuum of support. A tailoredmonitoring package, comprising travel diaries, will provide theopportunity to monitor carefully the impact of being part of this intensivegroup. A bespoke financial monitoring methodology has been developedto monitor resources carefully.
5.139 To maintain on-going contact (and commitment), Darlington havelaunched the Local Motion Club, which people can voluntarily sign up tojoin. Members benefit from a loyalty card and receive a newsletter everytwo months. The newsletter is used to launch periodic challenges andinvitations to take part in special active travel programmes using the offer of free goodies to encourage participation. An example is the10,000-steps challenge with a free T-shirt, pedometer and record card for the first 300 people to register. Four thousand people are currentlyregistered. A similar pledge card is offered in Peterborough, using thegood going brand (originally developed by TfL) to encouragesubscription to a sustainable transport lifestyle, to which 1,500households have subscribed.
Stage 4: Post-project evaluation
5.140 To gain an insight into how well the project has achieved its objectivesand targets, it is vital to conduct a post-project evaluation exercise. All of the case studies have undertaken, or have plans in place toundertake, a post-project evaluation, with all projects measuring theamount of behavioural change that has taken place (both directmeasurements through surveys and indirect measurements usingcorroborative data).
5.141 Post-project evaluation issues are fully dealt with in Chapter 9.
Geographic and population context
The types of places and populations that have the greatest potential
5.142 There is no clear definition of how to choose the right area in which tocommence a PTP project. The case study sites for which reliableevaluations have been undertaken have demonstrated similar results forcar trip reduction across all projects.9
9 A full spatial analysis of the availability and accessibility of local facilities of each of the projectareas has not been possible within this study, although it is considered unlikely that theavailability of local facilities will be consistently rich in all areas. 65
| 5. Objective 1: The Key Elements of Success
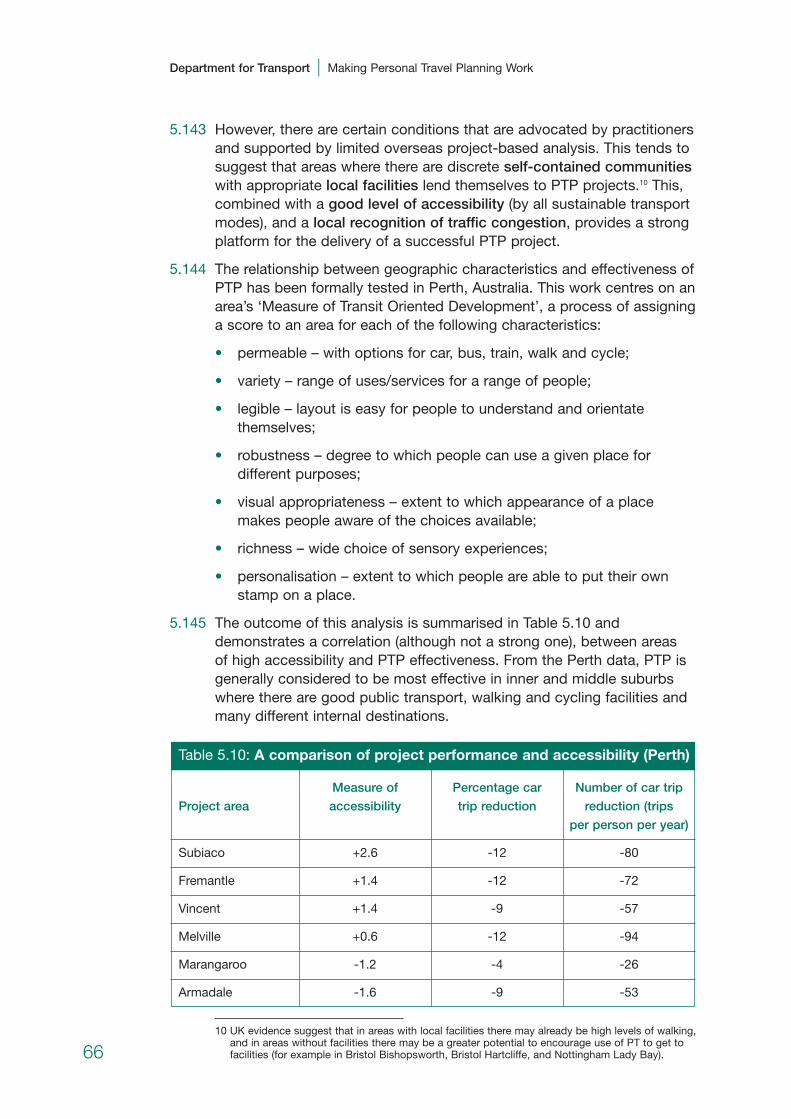
5.143 However, there are certain conditions that are advocated by practitionersand supported by limited overseas project-based analysis. This tends tosuggest that areas where there are discrete self-contained communitieswith appropriate local facilities lend themselves to PTP projects.10 This,combined with a good level of accessibility (by all sustainable transportmodes), and a local recognition of traffic congestion, provides a strongplatform for the delivery of a successful PTP project.
5.144 The relationship between geographic characteristics and effectiveness ofPTP has been formally tested in Perth, Australia. This work centres on anarea’s ‘Measure of Transit Oriented Development’, a process of assigninga score to an area for each of the following characteristics:
• permeable – with options for car, bus, train, walk and cycle;
• variety – range of uses/services for a range of people;
• legible – layout is easy for people to understand and orientatethemselves;
• robustness – degree to which people can use a given place fordifferent purposes;
• visual appropriateness – extent to which appearance of a placemakes people aware of the choices available;
• richness – wide choice of sensory experiences;
• personalisation – extent to which people are able to put their ownstamp on a place.
5.145 The outcome of this analysis is summarised in Table 5.10 anddemonstrates a correlation (although not a strong one), between areas of high accessibility and PTP effectiveness. From the Perth data, PTP isgenerally considered to be most effective in inner and middle suburbswhere there are good public transport, walking and cycling facilities andmany different internal destinations.
Table 5.10: A comparison of project performance and accessibility (Perth)
Measure of Percentage car Number of car trip
Project area accessibility trip reduction reduction (trips
per person per year)
Subiaco +2.6 -12 -80
Fremantle +1.4 -12 -72
Vincent +1.4 -9 -57
Melville +0.6 -12 -94
Marangaroo -1.2 -4 -26
Armadale -1.6 -9 -53
10 UK evidence suggest that in areas with local facilities there may already be high levels of walking,and in areas without facilities there may be a greater potential to encourage use of PT to get tofacilities (for example in Bristol Bishopsworth, Bristol Hartcliffe, and Nottingham Lady Bay).66
Department for Transport | Making Personal Travel Planning Work
5.146 Areas with strong community networks assist with getting peopleinvolved and creating chatter amongst residents, and ultimately createmomentum (findings from Taniguchi and Fujii (2007) reported in theAppendix indicate the impact that can occur when word-of-mouthcommunication assists the PTP process). This becomes particularlyevident across wider geographic programmes (for example, the whole-city effect evidenced in Peterborough), whereby a project can touchthose not directly targeted by the intervention through word of mouthand association. Whilst this is desirable in terms of overall projectperformance, it does have implications on the ability to determine anindependent control area for the purposes of evaluation.
5.147 It is notable that some of the case study sites particularly target areas of high car ownership and/ or high car usage, combined with goodpublic transport accessibility and/or a good walking/cycling network(i.e. areas where the greatest gap between the use of the car and theavailability of alternatives exist). For example, Worcestershire hastargeted high car ownership areas towards the suburbs of Worcester city. This approach has also been employed in London, where areasoutside central London with higher than average car ownership havebeen targeted.
5.148 A new and emerging work area to select potentially fertile areas for PTPtreatment is the use of MOSAIC social area segmentation, ACORN socialprofiling and/or census based social profiling. Brighton utilises all threemethods as well as various GIS mapping solutions observing generalaccessibility and indices of multiple deprivation across the city. Tosupport the data analysis, site visits were also conducted to get a feel for the different areas, and to identify local facilities and issues such astopography/congestion that can be difficult to get from other sources.
5.149 TfL utilise a tool developed by Steer Davies Gleave called Smart LifestyleMaps. These have been created using the results from a TfL surveyshowing which types of people in London had a propensity to changetheir travel habits, in conjunction with MOSAIC social profiling. SmartLifestyle Maps segment the population into different social profiles withassociated lifestyle and travel behaviour characteristics. Whilst there isno firm evidence (to date) that this profiling can increase levels ofbehavioural change, TfL have identified a number of segments that theytarget specifically, and have a range of criteria that potential PTPlocations are tested against in order to choose a potentially good area.The criteria are:
• a high proportion of targeted smart lifestyle segments (defined as citylife, family focus, detached prosperity and younger minded);
• good public transport accessibility level (PTAL) scores;
• consideration of how the London borough is investing its transportfunds;
• cycling and walking networks, especially good cycling opportunities;
• discrete self-contained locations away from central London;67
| 5. Objective 1: The Key Elements of Success
• borough officer support and resources if possible;
• consideration of a political balance;
• local political support;
• high awareness levels amongst general public in the borough;
• links with new services and future developments, for example, theOlympics, East London Transit and regeneration areas.
5.150 Another area characteristic that signifies a potentially good area for PTPcan be the levels of environmental awareness. Residents that alreadyemploy green lifestyle choices, such as recycling, may be receptive totravel behaviour change, understanding the detrimental effect that highcar usage can contribute to climate change and global warming, as well as the issue of finite resources. This is supported by cognitivedissonance theory, which suggests that people prefer consistency invalues, attitudes and behaviour, and highlighting inconsistencies can be used to change people’s behaviour. This was one of the main reasons why TfL chose the Borough of Sutton for a PTP programme.Sutton promotes itself as the greenest borough in London, somethinglocal residents are aware and proud of, and, as such, TfL feel that thepopulation are the most amenable to PTP. The PTP intervention in Suttonis also part of a wider partnership programme between TfL and theLondon Borough of Sutton, which combines PTP, school and workplacetravel planning. Similarly, the London borough of Camden has aligned its sustainable travel campaign with the active travel health campaign,building bridges between the health promotion and active travelpromotion activities.
The importance of transport alternatives – availability, price and capacity
5.151 Areas where there are good, existing sustainable transport networks withspare capacity are strong potential areas for PTP. Participants can beinformed of existing infrastructure which they may or may not be overlyfamiliar with, and more information about this infrastructure is likely toinduce people to try and use it. Spare capacity is essential, as encouraging people to use an already heavily used bus service, for example, isunlikely to produce a pleasant or practical experience. Practitioners inMelbourne found the existence of this characteristic to be an absolutemust when identifying fruitful areas in which to launch PTP (given thehigh levels of patronage on many PT services across the city).
5.152 Internationally, PTP projects have also been reportedly used to maintainbus usage during periods of rationalisation or price increases and/or toexplain the rationale for changes and maintain customer involvement – in the belief that it is potentially not just the most fruitful locations where PTP can be effectively delivered. However within the current UK environment, and in the early stages of PTP developments, it isconsidered sensible to focus on the areas with most potential. Evidencefrom the UK (Leeds) suggests that active promotion of bus use duringwhat turned out to be a period of fare increases and indifferent service68
Department for Transport | Making Personal Travel Planning Work
had negative impacts on bus use (in the Leeds case it was thought thatthe negative impacts were associated with the fact that people’sattention was being drawn to bus services at an unflattering stage).
5.153 There remains some debate amongst practitioners as to whether theexisting offer of public transport within the UK is good enough to activelypromote PTP in all urban areas. Strong advocates of PTP argue that thebaseline data collated as part of the sustainable travel towns researchhas clearly demonstrated that there is sufficient demand for short localtrips, with options already available, for PTP to be deployed in mostlocations. For each of the sustainable travel towns, the baseline surveyswere similar, demonstrating that approximately 40% of current car tripswere local, and could, in theory, be undertaken by alternative meansthrough the provision of information and motivation (i.e. PTP), and afurther 40% of car trips could be influenced by PTP (i.e. there is apropensity to change), but would also require some network changes.Although this conclusion has been challenged, for example for failing torecognise the complexity of behaviour (e.g. self-identity associated withcar for young male drivers, short trips made by car by parents becauseof very busy schedules), the consistency of results to date from theprojects delivered worldwide, suggests that PTP can be effective forareas of the type studied so far irrespective of the sustainable transport offer.
5.154 In Darlington, there is a growing acknowledgement among thoseresponsible for delivering the programme that, while it is useful to tie PTP initiatives into infrastructure and service improvements, this is not an absolute requirement. This supports the theory that around half ofchanges in behaviour relate to personal values and beliefs, rather thanexternal factors. It then follows that those who consider that PTP is onlyeffective on the back of tangible changes in the sustainable travel ‘offer’,overlook what personal travel planning can do alone. As the DarlingtonPTP delivery manager put it: ‘Change comes from inside people and thatoften happens in spite of the transport services around them. Clearly,tying an ITM programme to infrastructure and service improvements is a good idea, but a lack of such improvements should not be seen as a reason not to do it.’
5.155 PTP can also have a role to play in tackling social exclusion, by targetinghouseholds living in areas of deprivation and/or excluded through poortransport networks. For example in Worcester, two of the city wardsaddressed by the Choose How You Move project fall into the top 10% of wards on the index of multiple deprivation, with the PTP componentworking with those households to understand their particular circumstances and addressing them through a mix of information, motivation andinfrastructure improvements. In Darlington, social inclusion issues wereinfluential in the decision to include all households in their PTP programme, irrespective of the fact that this may not have been the most cost-effective approach.
69
| 5. Objective 1: The Key Elements of Success

Accompanying improvements to transport alternatives
5.156 The launch of new infrastructure or services in an area is identified as agood opportunity to launch PTP (for example, the implementation of newcycle routes or improvements to an existing cycle route or a new busservice). In Worcestershire the first phase of their PTP coincided with the launch of new bus routes through the targeted area, and the secondphase coincided with improvements to existing cycling routes.
5.157 Amongst their range of criteria, Brighton and Hove employ a slightlydifferent tactic when considering the issue of infrastructure. Employingadvice from Cycling England, Brighton and Hove launched PTP in anarea that had been the subject of improvements to the cycling andwalking network in the previous financial year. This allows the newimprovements to bed in for approximately 6–12 months, giving residentstime to notice the difference, raise queries and become accustomed tothe change. PTP projects then activate or incentivise the population living near to the recently implemented infrastructure/engineering measure.
Population and trip types
5.158 In the majority of the case studies examined contextual analysis wascarried out to look at factors which could affect the ability of participantsto change the mode of transport they use. These included factors such as:
• access to public transport, cycle paths and good footpaths in an area;
• the road accident rate in the area for pedestrians and residentialcyclists (used as a proxy for perceived road safety);
• age profile of the residents of an area;
• the household composition for an area;
• the level of vehicle ownership in the area, and the proportion of people in an area who already use public transport whilst owning a car;
• economic activity in an area;
• average distance to work for people living in an area;
• current modal splits for travel to work for an area.
5.159 Table 5.11 summarises reported change in trips, by time of day and bygender (including the effect of the control group). The most noticeabletrend is for consistently higher reductions in car use by females than males.
70
Department for Transport | Making Personal Travel Planning Work
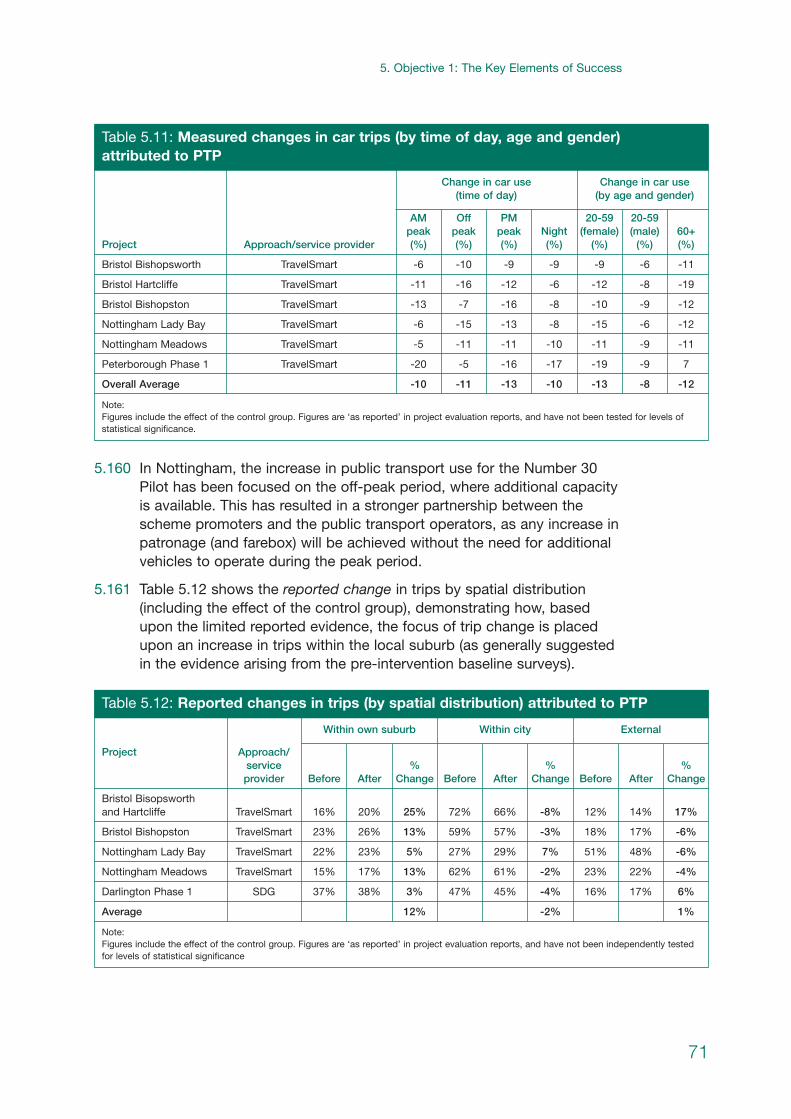
5.160 In Nottingham, the increase in public transport use for the Number 30Pilot has been focused on the off-peak period, where additional capacityis available. This has resulted in a stronger partnership between thescheme promoters and the public transport operators, as any increase inpatronage (and farebox) will be achieved without the need for additionalvehicles to operate during the peak period.
5.161 Table 5.12 shows the reported change in trips by spatial distribution(including the effect of the control group), demonstrating how, basedupon the limited reported evidence, the focus of trip change is placedupon an increase in trips within the local suburb (as generally suggestedin the evidence arising from the pre-intervention baseline surveys).
71
| 5. Objective 1: The Key Elements of Success
Table 5.11: Measured changes in car trips (by time of day, age and gender) attributed to PTP
Change in car use Change in car use (time of day) (by age and gender)
AM Off PM 20-59 20-59peak peak peak Night (female) (male) 60+
Project Approach/service provider (%) (%) (%) (%) (%) (%) (%)
Bristol Bishopsworth TravelSmart -6 -10 -9 -9 -9 -6 -11
Bristol Hartcliffe TravelSmart -11 -16 -12 -6 -12 -8 -19
Bristol Bishopston TravelSmart -13 -7 -16 -8 -10 -9 -12
Nottingham Lady Bay TravelSmart -6 -15 -13 -8 -15 -6 -12
Nottingham Meadows TravelSmart -5 -11 -11 -10 -11 -9 -11
Peterborough Phase 1 TravelSmart -20 -5 -16 -17 -19 -9 7
Overall Average -10 -11 -13 -10 -13 -8 -12
Note: Figures include the effect of the control group. Figures are ‘as reported’ in project evaluation reports, and have not been tested for levels ofstatistical significance.
Table 5.12: Reported changes in trips (by spatial distribution) attributed to PTP
Within own suburb Within city External
Project Approach/service % % %provider Before After Change Before After Change Before After Change
Bristol Bisopsworth and Hartcliffe TravelSmart 16% 20% 25% 72% 66% -8% 12% 14% 17%
Bristol Bishopston TravelSmart 23% 26% 13% 59% 57% -3% 18% 17% -6%
Nottingham Lady Bay TravelSmart 22% 23% 5% 27% 29% 7% 51% 48% -6%
Nottingham Meadows TravelSmart 15% 17% 13% 62% 61% -2% 23% 22% -4%
Darlington Phase 1 SDG 37% 38% 3% 47% 45% -4% 16% 17% 6%
Average 12% -2% 1%
Note: Figures include the effect of the control group. Figures are ‘as reported’ in project evaluation reports, and have not been independently testedfor levels of statistical significance
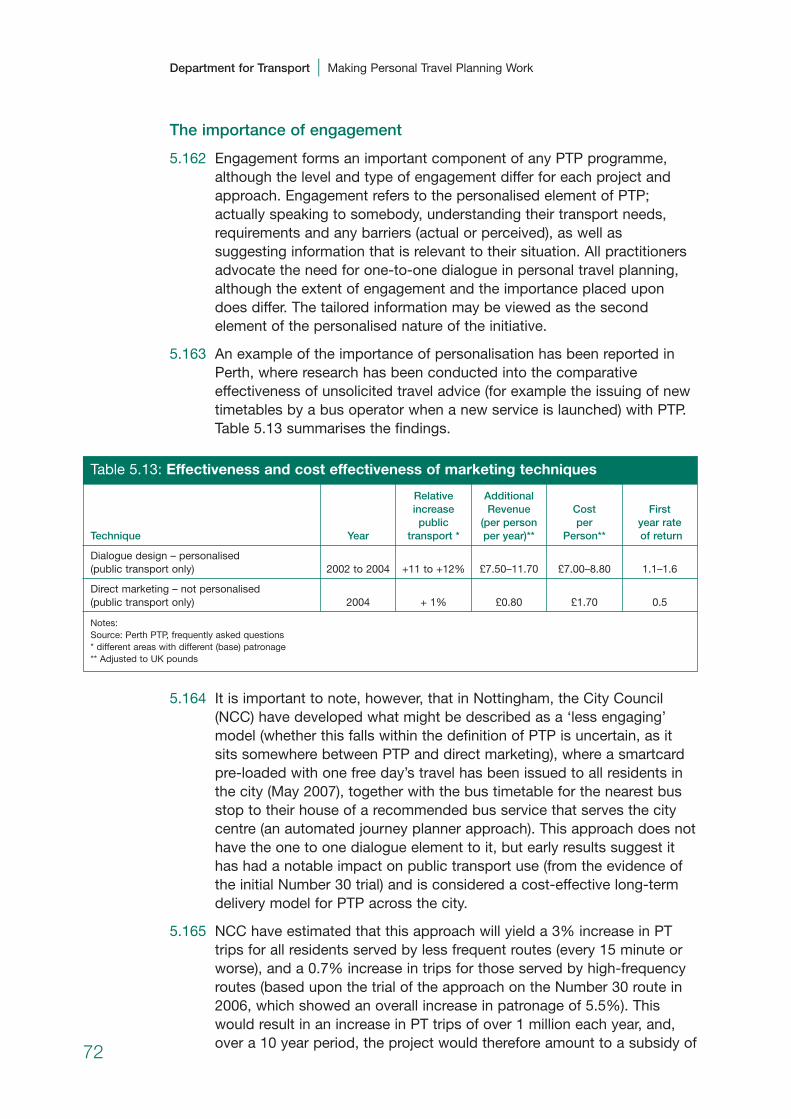
The importance of engagement
5.162 Engagement forms an important component of any PTP programme,although the level and type of engagement differ for each project andapproach. Engagement refers to the personalised element of PTP;actually speaking to somebody, understanding their transport needs,requirements and any barriers (actual or perceived), as well assuggesting information that is relevant to their situation. All practitionersadvocate the need for one-to-one dialogue in personal travel planning,although the extent of engagement and the importance placed upondoes differ. The tailored information may be viewed as the secondelement of the personalised nature of the initiative.
5.163 An example of the importance of personalisation has been reported inPerth, where research has been conducted into the comparativeeffectiveness of unsolicited travel advice (for example the issuing of newtimetables by a bus operator when a new service is launched) with PTP.Table 5.13 summarises the findings.
5.164 It is important to note, however, that in Nottingham, the City Council(NCC) have developed what might be described as a ‘less engaging’model (whether this falls within the definition of PTP is uncertain, as itsits somewhere between PTP and direct marketing), where a smartcardpre-loaded with one free day’s travel has been issued to all residents inthe city (May 2007), together with the bus timetable for the nearest busstop to their house of a recommended bus service that serves the citycentre (an automated journey planner approach). This approach does nothave the one to one dialogue element to it, but early results suggest ithas had a notable impact on public transport use (from the evidence ofthe initial Number 30 trial) and is considered a cost-effective long-termdelivery model for PTP across the city.
5.165 NCC have estimated that this approach will yield a 3% increase in PTtrips for all residents served by less frequent routes (every 15 minute orworse), and a 0.7% increase in trips for those served by high-frequencyroutes (based upon the trial of the approach on the Number 30 route in2006, which showed an overall increase in patronage of 5.5%). Thiswould result in an increase in PT trips of over 1 million each year, and,over a 10 year period, the project would therefore amount to a subsidy of72
Department for Transport | Making Personal Travel Planning Work
Table 5.13: Effectiveness and cost effectiveness of marketing techniques
Relative Additionalincrease Revenue Cost Firstpublic (per person per year rate
Technique Year transport * per year)** Person** of return
Dialogue design – personalised (public transport only) 2002 to 2004 +11 to +12% £7.50–11.70 £7.00–8.80 1.1–1.6
Direct marketing – not personalised (public transport only) 2004 + 1% £0.80 £1.70 0.5
Notes:Source: Perth PTP, frequently asked questions* different areas with different (base) patronage** Adjusted to UK pounds

£0.08 per trip generated. Whilst it is too early to measure the impact atthe time of writing (May 2007), over 30,000 cards have been used andover 500 subsequently topped up with further travel by the resident.Over 5,000 residents have registered online – making it much cheaper to carry out subsequent promotions.
5.166 The Perth projects have considered the issue of engagement carefully,with the following a summary of the issues raised by the project team.
5.167 When combined with regulations, enforcement and community basedprogrammes, broad reach media have been an effective component ofbehavioural change programmes (for example in the areas of smokingand road safety), although the UK Making Smarter Choices Work studyidentified debate regarding the relative contributions of the media andregulatory aspects of these behaviour changes.
5.168 The ‘smarter choices’ agenda in the UK is less focused upon regulation,and hence it is uncertain whether broad reach media can on their ownever be considered effective. The UK Government invested almost £20million in the Do Your Bit campaign, which addressed travel behaviour inthe context of media marketing exercises and incentives for sustainabilitybehaviours affecting climate change. The evaluation of this campaignfound that ‘there had only been small changes in consumer attitudes orbehaviour’. The report recommended that future campaigns be modifiedto: overcome barriers, reinforce activity at a local level and rewardconsumers. The report concluded that ‘advertising by itself is unlikely tobe effective’.
5.169 The European Commission DGVII project INPHORMM (1995–1998)reviewed over 120 campaigns in Europe and investigated the impacts oftransport information, publicity and marketing in changing travel attitudesand behaviour to reduce car use and encourage cycling, walking and theuse of public transport. The findings of this study suggest that, whilstmass media campaigns are inappropriate methods on their own tointroduce new travel ideas or explain new policies or measures, they canact as a trigger to encourage one-off or short-term behaviour change(such as a reminder to participate in a car-free day), but have little effecton long-term behaviour changes.
The importance of scale of activity
5.170 Scale is an important factor in the strategic success of PTP. Delivering a programme across an entire city has a number of advantages:
• it creates a momentum and word-of-mouth phenomenon, whichstrengthens the outcomes;
• it provides a visible message to the population (in terms ofpromotional goods, for example shopping bags, and the teams ofadvisors on street);
• it enables corroborative data to be used to test the outcomes (as the impacts should be identified on walk, cycle and public transportnetworks across the city).
73
| 5. Objective 1: The Key Elements of Success
5.171 There is also an important relationship between scale of activity andproject timescales. It is interesting to compare, for example, the city-wide approach adopted in Peterborough (every other household targetedacross the city, 25,000 in total, undertaken over a four-year period), withBrisbane, where 180,000 people have been targeted over an intensivesix-month period. Clearly the logistics, management and costs associated with the latter approach are significant, but do create a wave of momentum simply not possible when either smaller projects are delivered and/orcity-wide projects are delivered over longer time periods. PTP practitioners are generally of the view that large-scale projects can create momentumand chatter amongst a community, which in turn can benefit the projectby raising interest levels that can help to increase contact andparticipation rates.
5.172 The UK STTs are choosing to undertake their PTP programmes in stagesand target approximately the same number of households at each stage.In Worcester and Peterborough, the targeted number of households isapproximately 6,500 at the different stages, whilst in Darlington at eachstage the targeted number of households is between 12,000 and 14,500.This method has practical advantages, for example the stock ordernumbers and the number of travel advisors needed are likely to stayapproximately the same for each stage of the study.
5.173 The direction in which a project is conducted can create waves ofinterest. In Sutton, the project has started in the north-west corner of theborough and the travel advisors are gradually working their way throughthe neighbourhoods. As the travel advisors are quite visible, withbranded uniforms (to be discussed in a later section), they have beennoticed and people have asked them what they are doing. People oftenask them when they will be coming to their area. This interaction,together with any publicity that has taken place, helps to create word ofmouth, and word of mouth is a highly successful tool in getting themessage ‘out into the community’.
5.174 Larger-scale projects also create a hive of media activity, for example inSutton, where in 2007, 70,000 households are being targeted, local andnational newspaper and television stations have reported the scheme.This level of publicity has helped to raise recognition of the project, againpotentially assisting with increased participation rates. Within the UKthere has not been a project to match the scale and intensity of some of the large-scale Australian projects.
5.175 There are some concerns raised by practitioners surrounding veryintensive PTP projects (i.e. investing significantly in a small number ofhouseholds), and/or small scale pilots, as it is uncertain as to whethersuch approaches can be rolled out cost-effectively as large-scaleprogrammes. This may account for the move away from more intensiveapproaches to the current approaches. Further evidence should besought as to whether less-intensive PTP projects (involving moreparticipants) achieve larger behavioural change impacts than intensiveprojects (involving fewer participants but potentially larger individual-level change) for the same-cost resource.
74
Department for Transport | Making Personal Travel Planning Work
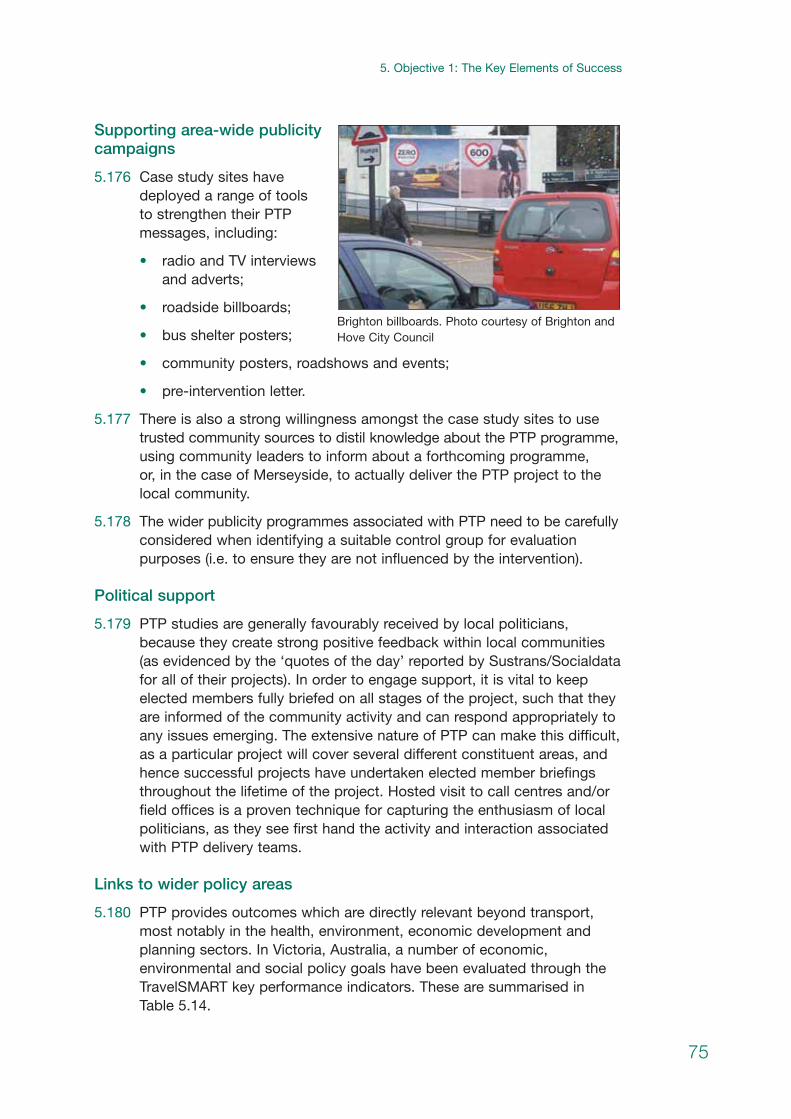
Supporting area-wide publicitycampaigns
5.176 Case study sites havedeployed a range of tools to strengthen their PTPmessages, including:
• radio and TV interviewsand adverts;
• roadside billboards;
• bus shelter posters;
• community posters, roadshows and events;
• pre-intervention letter.
5.177 There is also a strong willingness amongst the case study sites to usetrusted community sources to distil knowledge about the PTP programme, using community leaders to inform about a forthcoming programme, or, in the case of Merseyside, to actually deliver the PTP project to thelocal community.
5.178 The wider publicity programmes associated with PTP need to be carefully considered when identifying a suitable control group for evaluationpurposes (i.e. to ensure they are not influenced by the intervention).
Political support
5.179 PTP studies are generally favourably received by local politicians,because they create strong positive feedback within local communities(as evidenced by the ‘quotes of the day’ reported by Sustrans/Socialdatafor all of their projects). In order to engage support, it is vital to keepelected members fully briefed on all stages of the project, such that theyare informed of the community activity and can respond appropriately toany issues emerging. The extensive nature of PTP can make this difficult,as a particular project will cover several different constituent areas, andhence successful projects have undertaken elected member briefingsthroughout the lifetime of the project. Hosted visit to call centres and/orfield offices is a proven technique for capturing the enthusiasm of localpoliticians, as they see first hand the activity and interaction associatedwith PTP delivery teams.
Links to wider policy areas
5.180 PTP provides outcomes which are directly relevant beyond transport,most notably in the health, environment, economic development andplanning sectors. In Victoria, Australia, a number of economic,environmental and social policy goals have been evaluated through theTravelSMART key performance indicators. These are summarised inTable 5.14.
75
| 5. Objective 1: The Key Elements of Success
Brighton billboards. Photo courtesy of Brighton andHove City Council
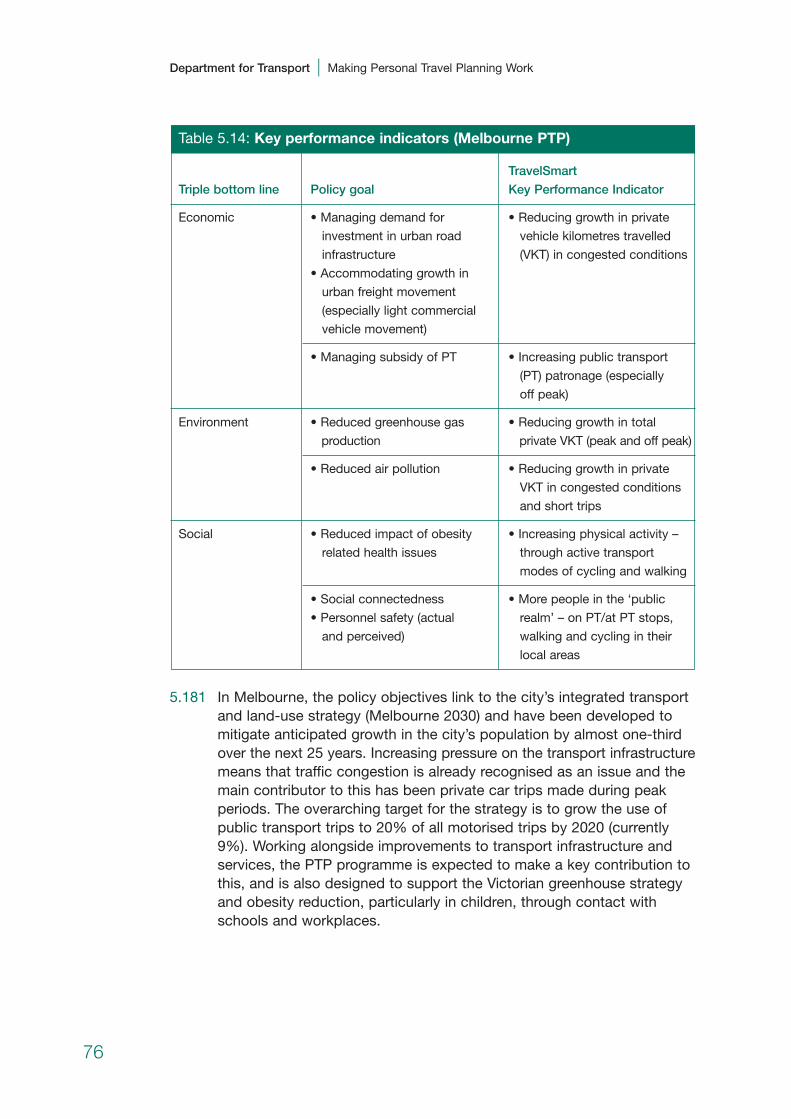
5.181 In Melbourne, the policy objectives link to the city’s integrated transportand land-use strategy (Melbourne 2030) and have been developed tomitigate anticipated growth in the city’s population by almost one-thirdover the next 25 years. Increasing pressure on the transport infrastructure means that traffic congestion is already recognised as an issue and themain contributor to this has been private car trips made during peakperiods. The overarching target for the strategy is to grow the use ofpublic transport trips to 20% of all motorised trips by 2020 (currently9%). Working alongside improvements to transport infrastructure andservices, the PTP programme is expected to make a key contribution tothis, and is also designed to support the Victorian greenhouse strategyand obesity reduction, particularly in children, through contact withschools and workplaces.
Table 5.14: Key performance indicators (Melbourne PTP)
TravelSmart
Triple bottom line Policy goal Key Performance Indicator
Economic • Managing demand for • Reducing growth in private
investment in urban road vehicle kilometres travelled
infrastructure (VKT) in congested conditions
• Accommodating growth in
urban freight movement
(especially light commercial
vehicle movement)
• Managing subsidy of PT • Increasing public transport
(PT) patronage (especially
off peak)
Environment • Reduced greenhouse gas • Reducing growth in total
production private VKT (peak and off peak)
• Reduced air pollution • Reducing growth in private
VKT in congested conditions
and short trips
Social • Reduced impact of obesity • Increasing physical activity –
related health issues through active transport
modes of cycling and walking
• Social connectedness • More people in the ‘public
• Personnel safety (actual realm’ – on PT/at PT stops,
and perceived) walking and cycling in their
local areas
76
Department for Transport | Making Personal Travel Planning Work
Summary
• Evaluations of PTP consistently report benefits in terms of areduction in vehicle kilometres travelled, combined withassociated community benefits.
• PTP can be applied to any community.
• Practitioners generally agree that the greatest success is likely tobe delivered where:
• PTP is combined with a wider sustainable transport investmentprogramme;
• there are discrete self contained communities with appropriatelocal facilities, good community networks;
• there are good levels of accessibility (by all sustainabletransport modes), combined with excess capacity on thepublic transport system, and a local recognition of theproblems associated with traffic congestion;
• there is a stable (not transient) community.
• The effectiveness of PTP is enhanced where:
• scale is increased;
• a proven technique is used;
• effective project management is deployed;
• staff are committed and motivated to the objectives of the PTPproject;
• the project is led by a strong advocate, with commitment andenthusiasm.
77
| 5. Objective 1: The Key Elements of Success
6 Objective 2: Barriers (and solutions)6.1 Whilst there are many successful elements of PTP projects to date, there
have been a number of barriers to overcome, some of which still presentproblems, and some that may present problems in the future.
6.2 In the academic literature surrounding PTP, there are some commonthemes emerging which are worthy of consideration. In particular,Seethaler and Rose identify the following key barriers to successful travelbehaviour change projects:
• external barriers: Economic constraints, low quality of alternativepublic transport, long commuting distances;
• internal barriers: Perceptions of alternatives to the car, negativeattitudes towards public transport, unawareness of benefits resultingfrom sustainable behaviour; and
• the habitual nature of the decision-making process underlying travelbehaviour patterns.
6.3 Internal barriers are cited as the toughest to change, because they arepersonal to the individual and reflect the particular view of the individualwhen making a decision about travel behaviour. While there are commonbenefits (e.g. less pollution and traffic congestion) to choosing not totravel by car, these are often overlooked because of the self-interest ofthe person making the decision.
6.4 The following provides a general commentary against each of the issuesarising from the case studies undertaken for the study.
Scepticism
6.5 One of the key barriers to the implementation of PTP projects isscepticism, doubts about whether PTP really does work, and whetherthe reported results are robust. This is inevitable in a process ofbehavioural change, where the outcomes are difficult to visualise(particularly for small-scale pilot projects), and where the impacts can be potentially diluted by a whole range of external factors across thetransport network.
6.6 One of the prime causes of the scepticism has been the debatesurrounding the statistical validity of reported results and the nature ofthe evaluation processes adopted. This is discussed further in Chapters5 and 9. Scepticism is further compounded by the perception of high cost.
6.7 Scepticism is also derived from discrepancies associated with thephilosophical beliefs of transport economists – i.e. whether they believethat attitudes and behaviour can be changed by components other thanpricing mechanisms and/or the physical status of the transport network.
78
Solution to barrier: Scepticism
6.8 The obvious solution to the issue of scepticism is to counter theevaluation concerns about PTP and previous reported results and/orproduce new defensible evidence on the effectiveness of the PTPapproach.
6.9 At the local level this requires strong leadership and a full belief andunderstanding of the evaluation process embedded within each project,and for those projects to ‘stand up’ and widely promote the outcomessuch that this can provide confidence to future projects. Given that theevaluation process has generally been the area of greatest scrutiny (andsome limited debate has arisen over the validity of some reportedfindings), this will require particularly strong confidence in the outcomes,in order to ensure PTP can stake its claim against other transportmeasures.
6.10 The work of the University of Leeds in independently auditing theDarlington and Peterborough evaluations will be particularly important in this context, as was the work of the Greenhouse Office in Australiaand the independent audits of the Perth projects – which themselveshave enabled regional governments in Australia to move forward withconfidence and increased investment. The review of the evaluationprocedures within this study report (Chapter 9) provides further evidenceon the robustness of previous evaluations and will provide an importantadditional evidence base for UK local authorities seeking to deliver PTP.
6.11 The evaluation processes within any PTP are complex, demanding anunderstanding of a complex pattern of trip-making within both the targetand control groups. This has inevitably come at a cost, which hasrestricted some of the early projects in their ability to produce strongcost–benefit analysis. Reducing the evaluation burden would provide astronger investment profile (as less money would be spent on the costlyevaluation components), but can only occur once initial confidence hasbeen gained.
Lack of political support
6.12 Because PTP is a new policy area in the UK, it is seen as unfamiliarterritory for most local politicians and, therefore, can be seen in theireyes as a potential risk. Despite being included with the DfT’s ‘smarterchoices’ suite of measures, it remains a relatively new tool, with limitedcase studies delivered in the UK to date. Local politicians may notappreciate the potential positive outcomes of PTP, and therefore thefunding for an approach that has not been done before (in ‘their area’)can be a difficult to secure (combined with the issue of scepticismdiscussed above).
79
| 6. Objective 2: Barriers (And Solutions)

Solution to barrier: Lack of political support
6.13 Political support is best achieved through a better understanding of the PTP process amongst local authority officers, and the outcomesachieved from typical projects, such that they can provide a well-reasoned case for elected members to consider. Greater understandingof the business case and cost–benefit will provide tangible evidence ofthe outcomes of PTP. Briefing sessions for elected members shouldallow the opportunity for queries, questions or reservations that thereceiving groups may harbour. It is also worth stressing the broaderbenefits that PTP brings – the ‘quotes of the day’ from previous studies,and the direct link between the transport strategy and the localpopulations. In the experience of this study, local people (and hencelocal politicians) are generally very supportive of PTP once they haveundertaken a local project.
Lack of funding
6.14 Funding a PTP project is a large barrier to the implementation of PTP.Interviews held with failed STT local authority bidders found that not onehad gone on to implement a major scheme of this nature, and the mainreason was funding. In particular, a key barrier is the lack of revenuefunding, and the perception that funding for PTP cannot therefore bedelivered through conventional LTP funds.
6.15 Another problem associated with funding is making the most of themoney that is available, i.e. ensuring cost-effectiveness of any monetaryoutlay, as to date there is little collective experience of what constitutes a cost-effective project process (discussed in Chapter 5).
Solution to barrier: Lack of funding
6.16 The case studies have demonstrated that long-term programmes can be funded. The key issue is to create a viable business case thatdemonstrates the cost-effectiveness of the proposed PTP project, andhow it supports, enhances, and in some occasions competes with, othertransport projects. There is also evidence that PTP is more likely tosecure funding if it is embedded within a larger project of which PTP isjust one element, for example the PTP project in Lancashire is just oneelement of 26 measures that form the CIVITAS-funded programmepromoting more sustainable travel patterns in the county.
6.17 There is also evidence of the use of revenue and LTP funds to fund PTP projects. Brighton and Hove were originally planning to run a PTPproject before they were awarded the Cycling Demonstration Townstatus. For the initial project they were planning on using revenue funds(decriminalised parking) and some LTP funding. In order to continue theirPTP programme on an annual basis, Bristol has allocated approximately£70,000 of its capital programme (comprising both LTP and councilresources) to an on-going programme of PTP projects across the city.
80
Department for Transport | Making Personal Travel Planning Work
6.18 The best way to ensure cost-effectiveness (of the project process) is toproduce a comprehensive and secure funding plan and project plan withrealistic allocations of money to certain tasks. This helps to minimise therisk of cost over-runs (by identifying risk for each stage of the processfrom the outset) and ensures that money is well spent.
Risk of failure
6.19 The risk of failure is a pertinent issue surrounding PTP projects. Thepotential lack of interest of the targeted households and the potentiallack of travel behaviour change are primary concerns of PTP projectmanagers. Stakeholders may wish to see a measurable, positiveoutcome of a project and require a certain degree of success to justifythe costs of this as well as further projects.
Solution to barrier: Risk of failure
6.20 This can be overcome by planning the project as precisely as possible –for example, initially tackling the most fertile areas, adopting a proventechnique, being able to offer suitable alternative sustainable transport,using a successful contact strategy, providing the right materials andincentives, and having a robust evaluation process in place. Thoughtneeds to be applied to all of the issues raised in Chapter 5, which set out the successful components of previous PTP projects.
Inadequate scale
6.21 The scale of a project can impact on many other areas of a project. If it is too small, then the benefits may be deemed as imperceptible, non-replicable at the larger scale, and/or of little value. Large-scale projectscan (be seen to) have large costs attached to them (even though the costper participant is reduced through economies of scale).
Solution to barrier: Inadequate scale
6.22 Evidence from Australia illustrates the now commonplace approach of large-scale projects, for example the targeting of 45,000 householdsplus at the same time in Melbourne, Brisbane and Perth. UK projects are not at the same level of maturity as Australian projects, but the full UK projects that have been investigated have targeted betweenapproximately 6,000 and 30,000 households at a time, with theexception of TfL, which has launched the largest-scale UK project in the summer of 2007, targeting 70,000 households (the entire Borough ofSutton). Positive benefits of large-scale projects are described in Chapter5, and it is recommended that future implementations focus on larger-scale projects to maximise the cost-effectiveness of the approach.
81
| 6. Objective 2: Barriers (And Solutions)

Lack of interest among targeted audience
6.23 This is slightly different from ‘risk of failure’ and relates to the role of thetravel advisor. Upon approaching the public, either by phone or on theirdoorstep, travel advisors from all projects have reported a degree ofapathy (on various scales) towards the PTP project (in addition to strongpositive feedback from those engaged with the process).
6.24 The ability to make contact with a specifically targeted audience that hasthe propensity to change is also identified as a specific problem. Lifestylecharacteristics of the social groups may mean they are often out of thehouse and so, despite their potential for participation, they may end upnot participating (because of being unavailable).
Solution to the barrier: Lack of interest amongst targeted audience
6.25 In order to overcome the issue of apathy, a general approach taken bytravel advisors is to enquire about all members of the family, for examplechildren in the house or extended family living within the households. Agood knowledge of services and transport in the area can help the traveladvisors to make a breakthrough.
6.26 Travel advisors in Sutton are trained in the skills necessary to challenge(sympathetically) those residents who express no interest in the project,enquiring as to why they are not interested. A non-accusatory butassertive manner is required to perform this task, but the end resultcould be the participation of a person or, at worst, qualitative feedbackabout the lack of interest, which may help to inform future projects.
6.27 Making contact with the ‘right’ people (people who are amenable tochange) can be enhanced through persistency of contact (trying eachhousehold between 3 and 10 times, depending on method of contact,before a general participation letter and service sheet is distributed).However, this can only be followed to a point, as this practice will start to become cost-ineffective and tends to be more appropriate where thecontact is made by telephone. Leaving ‘we missed you’ cards at targetedhouseholds is also a way to try to make contact, in the hope that theoccupant will want to participate.
PTP fatigue
6.28 A risk identified by TfL is the worry that the public will lose interest inhearing about sustainable transport from a range of sources and theirapathy levels will increase. This is particularly pertinent in Sutton, where,in the 2006/07 financial year, a small-scale initiative was implemented,whilst in 2007/08 the whole of the borough is being targeted. At thesame time, employer and school travel planning initiatives are being launched.
82
Department for Transport | Making Personal Travel Planning Work

Solution to barrier: PTP fatigue
6.29 Well-managed PTP programmes must integrate with other sustainabletransport programmes seeking to enhance the overall offer to the public.In particular, PTP should seek to support sustainable transportinfrastructure projects (for example, new bus showcase corridors orcycle routes) and should complement other components of the ‘smarterchoices’ strategy. For example, in Brisbane the ‘rush hour’ is targetedthrough employer travel planning, the school run through school travelplans, and the off-peak period through PTP. A single team managing allof these components ensures that consistent and complementarymeasures are delivered.
Poor project branding/identity
6.30 A lack of project branding can prove to be a barrier in reaching thegeneral public, engaging with them and gaining their support. There isnothing for the community to recognise, let alone identify with andbecome part of. Similarly the use of the local authority name and/logocan prove to be a barrier, if the local authority is viewed as ‘telling peoplewhat they should do’, or if there are any wider historic issues affectingthe perception of the local authority.
Solution to barrier: Poor project branding/identity
6.31 For most large-scale projects, marketing agencies have been appointedto develop a project brand that is applied to all stages of the PTPprocess. For example, Darlington had to go through a re-brandingexercise for their STT project after the first year, as the first slogan ‘a town on the move’ was not working in capturing the people’simagination. The measured reductions in car driver trips for the targetpopulation were 3% in Phase 1 and 11% in Phase 2, indicating that thischange in branding may have assisted in increasing effectiveness of PTP.In Darlington the marketing agency also advised the council to removeits name from all of the literature and replace it with the new projectname ‘Local Motion’. This removal of a local authority name/logo, forexample, can also apply to the travel advisor role when they areintroducing the PTP project to households.
6.32 Interestingly, in Australia all of the state governments have adopted acommon identity for the suite of ‘smarter choices’ measures promotedwithin their authority area, known as TravelSmart.11 This brand is issuedunder licence by the Western Australia state government. Within theTravelSmart brand, regional government have some flexibility in creatinglocal identities and programmes, although they must ensure a pre-determined quality standard for all TravelSmart-related projects if theyare to be given on-going permission to continue to use the licence(maintaining a national quality element to the TravelSmart brand).
11 The use of the TravelSmart brand differs between Australia and the UK. In Australia it describes awhole range of behaviour change programmes focusing on employers, schools etc., as well ascommunities, while in the UK it is registered as a trade mark by Sustrans to identify PTP projectsdelivered with Socialdata using the IndiMark approach. 83
| 6. Objective 2: Barriers (And Solutions)
Contact barriers
6.33 An increasing number of the general public are signing up to theTelephone Preference Service, meaning that they are non-contactable forPTP projects where the preferred method of contact is by telephone.
Solution to barrier: Contact barriers
6.34 Increased sign-up to the Telephone Preference Service can be overcomeby supporting the telephone contact approach with ‘in-fill’ door knocking, or adopting an entirely door knocking approach. However one of thecase study sites raised the issue that door-to-door contact may also be ruled out in the future for various reasons. One suggested alternativeis the use of e-mail. However, this method of contact presents a wholenew set of barriers, not least that it gives potential participants a goodopportunity to walk away without engaging in any personal dialogue. E-mail is not a suitable medium for initial contact and could only be seen as a means of continuing dialogue in future years.
Lack of engagement
6.35 One other contact issue is the amount of personal dialogue that isundertaken between a travel advisor and participants. The personalisednature of the dialogue is seen to be one of the most important elementsof the whole process, as travel advisors discuss an individual’s travelneeds, requirements and options.
Solution to barrier: Lack of engagement
6.36 Evidence from Australia shows that continued dialogue, along withmotivation and encouragement, helps to engage more with residents andpotentially secures a greater level of travel behaviour change. UK casestudies have tried to maintain contact with participants by setting up‘travel clubs’ for people to join. PTP delivery teams can then keep incontact with participants via e-mail, newsletter, mail shot etc., continuingthe messages of encouragement and motivation.
Poor first impressions of travel advisors
6.37 Travel advisors contacting households on doorsteps can face a problemlegitimising their position and their purpose. Door-to-door contact isoften associated with ‘double-glazing sales’ and therefore is not alwaysparticularly well received.
Solution to barrier: Poor first impressions of travel advisors
6.38 This negative perception can be overcome by the travel advisor clearlystating the purpose of their visit at the start of the conversation with anappealing but assertive manner (stressing the ‘no sale’ element to thediscussion). Working in groups across communities helps to reinforce thecorporate nature of the message, as does the use of common uniforms,name badges and access by foot or cycle.
84
Department for Transport | Making Personal Travel Planning Work

Lack of staff continuity and recruiting enough staff
6.39 There is evidence to show that discontinuity of staff can mean a projectmay not be as successful as it could have been. Local authority staffworking in the PTP market have specialised skills and can be hard to find, and then to replace. Another staffing concern relates to thetemporary fieldworkers recruited, as these form the public face of muchof the PTP activity – in essence, despite being carefully picked, they arean unknown quantity.
6.40 The number of staff can also be a risk to a project, as a shortage maycause unforeseen delays. A lack of staff to compile householdinformation packs may mean that travel advisors have to help out, whichin turn means that the travel advisors may fall behind with contactinghouseholds.
Solution to barrier: Lack of staff continuity and recruiting enough staff
6.41 Local authority staff should remain flexible when drawing up appropriatecontracts for the staff involved, potentially involving them with otherlonger-term aspects of the sustainable transport strategy. The use of a consultancy partner to recruit temporary staff to deliver the PTPprogramme can also overcome the staffing barrier.
Negative media
6.42 The media can be both an ally and an enemy, able either to present a strong positive story, or turn good news into bad.
Solution to the barrier: Negative media
6.43 The best way to avoid this is to be open with the press and sell all of the positive aspects of the scheme, namely the voluntary nature ofparticipation, the offer of free personalised advice, and clearly articulateany validated evaluation findings. Press should be given regular briefingson progress, and a consistent and available contact point within the PTPteam should be promoted to all local press.
6.44 Overcoming a bad story that has already been published is more difficult.A common response is to attempt to counter the bad story with a goodone, featuring a participant who has embraced the project and haschanged their travel behaviour, or coverage of a specific project-relatedevent. It may even be that members of the public write in to a localnewspaper praising the project and related promotional material (as has happened in Brighton and Hove).
Inadequate recording procedures
6.45 PTP projects contain and gather a huge amount of data, with a clearpotential for either corruption or accidental mismanagement.
85
| 6. Objective 2: Barriers (And Solutions)
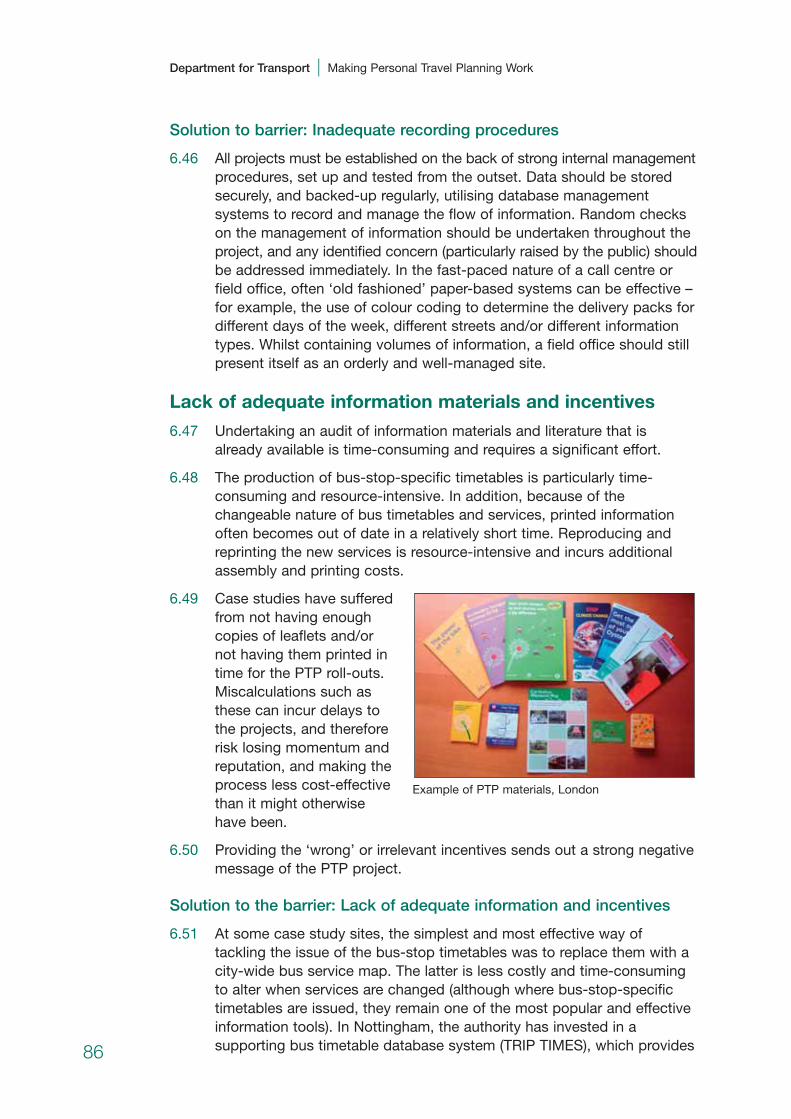
Solution to barrier: Inadequate recording procedures
6.46 All projects must be established on the back of strong internal management procedures, set up and tested from the outset. Data should be storedsecurely, and backed-up regularly, utilising database managementsystems to record and manage the flow of information. Random checkson the management of information should be undertaken throughout theproject, and any identified concern (particularly raised by the public) should be addressed immediately. In the fast-paced nature of a call centre orfield office, often ‘old fashioned’ paper-based systems can be effective –for example, the use of colour coding to determine the delivery packs fordifferent days of the week, different streets and/or different informationtypes. Whilst containing volumes of information, a field office should stillpresent itself as an orderly and well-managed site.
Lack of adequate information materials and incentives
6.47 Undertaking an audit of information materials and literature that isalready available is time-consuming and requires a significant effort.
6.48 The production of bus-stop-specific timetables is particularly time-consuming and resource-intensive. In addition, because of thechangeable nature of bus timetables and services, printed informationoften becomes out of date in a relatively short time. Reproducing andreprinting the new services is resource-intensive and incurs additionalassembly and printing costs.
6.49 Case studies have sufferedfrom not having enoughcopies of leaflets and/or not having them printed intime for the PTP roll-outs.Miscalculations such asthese can incur delays to the projects, and thereforerisk losing momentum andreputation, and making theprocess less cost-effectivethan it might otherwise have been.
6.50 Providing the ‘wrong’ or irrelevant incentives sends out a strong negativemessage of the PTP project.
Solution to the barrier: Lack of adequate information and incentives
6.51 At some case study sites, the simplest and most effective way oftackling the issue of the bus-stop timetables was to replace them with acity-wide bus service map. The latter is less costly and time-consumingto alter when services are changed (although where bus-stop-specifictimetables are issued, they remain one of the most popular and effectiveinformation tools). In Nottingham, the authority has invested in asupporting bus timetable database system (TRIP TIMES), which provides86
Department for Transport | Making Personal Travel Planning Work
Example of PTP materials, London

real-time bus timetables for each stop on the network. This enables bus-stop-specific timetables to be produced quickly, easily and cheaply, aswell as providing important information for other functions within thecouncil. It is worth considering these issues well in advance of a PTPproject – establishing an appropriate infrastructure for public transportinformation that can be plugged into by the PTP project.
6.52 Another way to overcome the changeable nature of transport services,especially public transport services, is to provide participants with asmall card that tells them where to phone or a website where furtherinformation and information regarding changes can be found. This helpsto future-proof the materials by giving people a reference point for furtheruse. The potential role of Transport Direct (www.transportdirect.info) ininforming the future delivery of PTP information services should becarefully considered.
6.53 The incurring of further costs through reprinting of materials that haverun out can be overcome by carefully planning printing timetables andthoroughly checking the quantity of each material required. Oversuppliescan always be used at community events or distributed to libraries,community facilities etc. An estimate of the likely requirements forinformation and incentives (based upon the evidence gathered from the UK case studies) is shown in Tables 5.6 and 5.7.
6.54 The choice of incentives to be marketed can be informed by briefresearch into incentives used in other projects to gain an idea of whatwill and won’t work. A PTP delivery team also needs to be flexible inwhat they offer to targeted households and be willing to change anincentive if it does not work. For example, in their first year, Brighton andHove offered a discounted voucher for cycle purchases. Usage of thevoucher was low and Brighton concluded that this was because manypeople already have bikes. The next year the discounted voucher waschanged to apply to cycle accessories to enable people to enhance theircycling experience.
6.55 Future projects may need to consider their method of delivery ofinformation materials, as more local authorities would like to explore new ways of disseminating information, mainly via e-technology. Localauthority project managers have commented that the printed materialsare ‘wasteful of paper’ – however, others hold the view that using hardcopies of information is a proven methodology. Also they hold the viewthat people are more responsive to personal contact and havingsomething tangible in their hand rather than being bombarded withelectronic information that requires action on their part.
Coincidence with the introduction of new infrastructure or services
6.56 Despite new infrastructure being a potential trigger for launching PTPprojects, some case studies have experienced difficulty with thisapproach. The launch of a PTP project and a new bus service, forexample, can be a huge strain on human resources, particularly where
87
| 6. Objective 2: Barriers (And Solutions)

staff are new or inexperienced. The launch of a new bus service cancreate confusion among a population and, coupled with the launch of aPTP project, can increase this confusion – brands and principles caneasily become diluted.
Solution to the barrier: Coincidence with the introduction of newinfrastructure or services
6.57 The best way to mitigate confusion amongst a population is withexcellent marketing. For example, in Worcester the new bus serviceswere clearly branded and marketed as ‘Project Express’, and the PTPproject which promoted the services (as well as walking, cycling and carshare) as ‘Choose How You Move’. Keeping these brand identities was a conscious decision and ensured that any negative feedback from oneprogramme would not adversely affect the other.
6.58 It has also been noted that new services need time to bed in and forpeople to become accustomed to them, possibly before they are thesubject of a marketing campaign to encourage people to use them.
Poor quality of existing infrastructure
6.59 The launch of a PTP project in an area where the sustainable transportoffer is less than desirable, for example an unfriendly street scene or abusy road, can sometimes prevent participants from changing theirbehaviour, because of their own perceptions or perhaps health andsafety issues. If there is not a good quality bus service or network ofwalking/cycling routes in the area, then people are less likely to bemotivated by PTP.
Solution to barrier: Poor quality of existing infrastructure
6.60 Chapter 5 highlighted that the outcomes of PTP tend to be consistentacross all project areas, thus suggesting that this is a perceived barrier,rather than an actual one. The background research for the STTs hasshown that, consistent with other worldwide studies, people’s views ofthe alternatives and the realities of the sustainable transport networks are often very different (for example, in Worcester respondents to thebaseline survey significantly overstated the actual time of bus journeysand by a similar margin underestimated the actual journey time by car forregular journeys).
Difficulty in achieving home visits
6.61 Home visits, despite offering the purest type of PTP (direct engagement),have generally not been extensively taken up within the UK case studies(although, for those that do, they tend to receive a high degree ofsatisfaction). This may be because people do not want to be pressured(perceived pressure) in their own home, or they simply do not want to invite a stranger into their home, or perhaps they are not interested in fullyengaging in the project to the highest level, or they may feel that theinformation and motivation are good enough for them to change behaviour.
88
Department for Transport | Making Personal Travel Planning Work
6.62 The use of bus drivers to conduct public transport oriented home visits is considered to be a good idea in principle and works well. However, the sacrifice of trained bus drivers can impact upon the bus companyand services.
6.63 Another barrier to home visits is finding a time to suit both thehouseholds and the travel advisors. Timetabling the visits has beenproblematic and has been seen by some bus companies as an inefficient use of time.
Solution to barrier: Difficulty in achieving home visits
6.64 Possible solutions to this could be ‘travel surgeries’ or a certain placewhere people can go if they require any further specific advice orinformation. However, it is important to note that, where PTP projectoffices have been ‘open access’ (and the public encouraged to visit),there has been little uptake, and hence it is only likely to be successful iflinked to other activities (for example the travel cafés concept developedby Brisbane), and linked to a strong sustainable transport culture.
6.65 To ameliorate the situation regarding the use of bus drivers, First inWorcester have withdrawn their current drivers from making home visitsand have replaced them with ex-drivers.
Lack of transparent data analysis
6.66 There is a need for data to be accessible by the main organisationsinvolved in a project, i.e. the local authority and consultancy partner. In essence, all data should be freely and proactively shared, includingaccess to full evaluation data and household-based information for bothcontrol and target groups. Without this free transfer of data, projects runthe risk of losing confidence if one party is felt to be privy to particularareas of knowledge and understanding. However, the constraintsimposed by the Data Protection Act restrict the ability for all householddata to be shared in this way.
Solution to barrier: Lack of transparent data analysis
6.67 The most notable way of overcoming the data protection legislation hasbeen to provide anonymised data sets at the end of the evaluation process.
6.68 Local authorities have also tackled this issues through a clear, well-defined contract, where necessary negotiated prior to the signing ofcontracts, enabling the ability to access (some specified) data sets by allparties. Worcester negotiated 50:50 ownership of the intellectual propertyof their STT project data with their consultancy partner.
6.69 The appointment of an independent auditor to the process who workswithin the data protection codes of conduct and moderates andoversees all data flows within the project provides a further potentialoption, although to date this has been limited to external checks on the anonymised data after the evaluation is complete.
89
| 6. Objective 2: Barriers (And Solutions)
Inadequate evaluation methodology
6.70 The evaluation methodology is important to PTP projects. Concernsregarding the validity, robustness and reporting of PTP evaluations haspotentially restricted the growth of the PTP market.
Solution to barrier: Inadequate evaluation methodology
6.71 Project delivery teams should ensure that they are using a robust anddefensible evaluation methodology that considers and employs theappropriate evaluation techniques, sample sizes and is ideally supportedwith corroborative data. The use of independent evaluations and auditorsis worth considering. Further details are reported in Chapter 9.
Limited consultancy competition
6.72 A potential barrier to future PTP projects is the small number ofconsultancies that specialise in PTP, as this arrangement lowerscompetition, resulting in less choice for local authorities. This is viewedby local authorities as being an undesirable situation.
Solution to barrier: Limited consultancy competition
6.73 There is no simple solution to the fact there are very few consultanciesthat specialise in PTP, as those that specialise in the field have beendeveloping their approaches over many years and offer a product which they believe to be the most effective. They have also establishedprocedures and operational requirements (such as field offices and call centres), which make them cost-effective in the bidding process,combined with extensive project experience.
6.74 However, as the PTP market develops in the UK, it is certain that themarket will react, expanding the availability of genuine competition forPTP projects. In Australia, two interesting approaches have emerged:
• in Perth, the authority have appointed a PTP panel and, although onlyone consultancy has been appointed from this panel so far, as futureopportunities arise, and testing of different approaches is considered,this may change; and
• in Melbourne, the authority issued a generic PTP process forcommercial partners to respond to, and split the project into threedifferent geographic areas, stating that any one consultancy partnercould undertake only one geographic area – thus stimulatingcompetition and encouraging others to enter the market.
90
Department for Transport | Making Personal Travel Planning Work
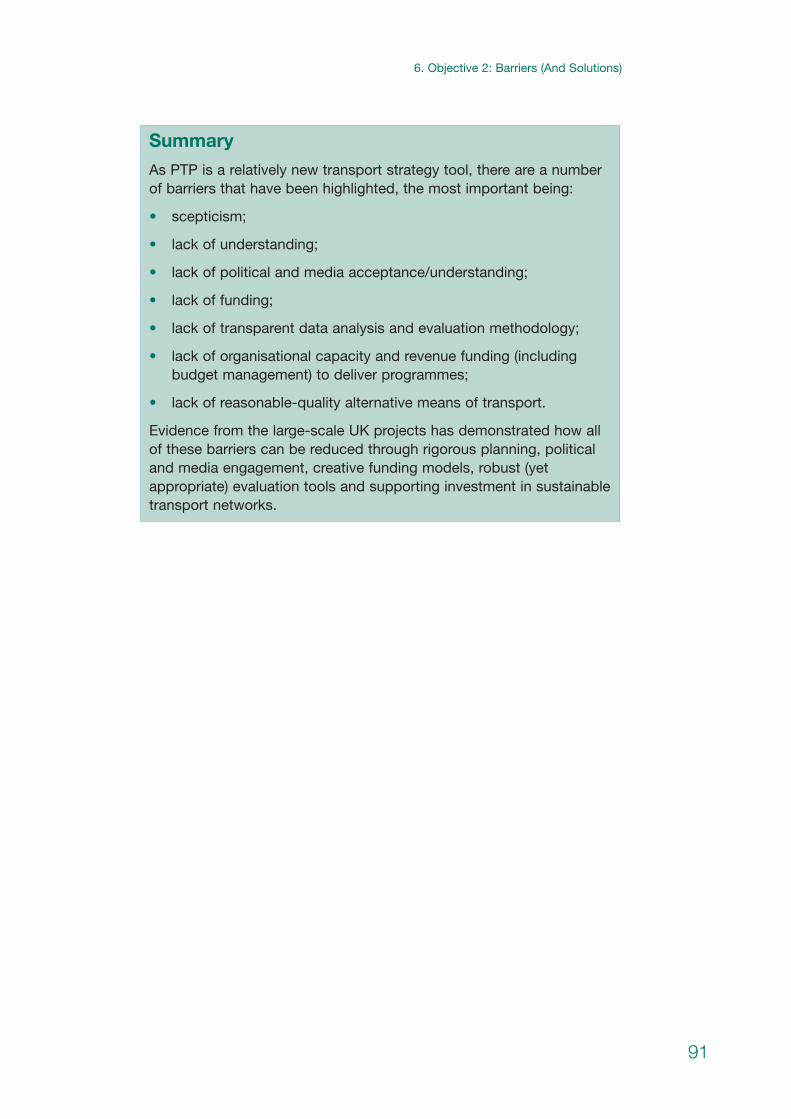
Summary
As PTP is a relatively new transport strategy tool, there are a numberof barriers that have been highlighted, the most important being:
• scepticism;
• lack of understanding;
• lack of political and media acceptance/understanding;
• lack of funding;
• lack of transparent data analysis and evaluation methodology;
• lack of organisational capacity and revenue funding (includingbudget management) to deliver programmes;
• lack of reasonable-quality alternative means of transport.
Evidence from the large-scale UK projects has demonstrated how allof these barriers can be reduced through rigorous planning, politicaland media engagement, creative funding models, robust (yetappropriate) evaluation tools and supporting investment in sustainabletransport networks.
91
| 6. Objective 2: Barriers (And Solutions)

7 Objective 3: The business case
Context
7.1 There is very limited experience of business cases being developed forUK PTP projects. This is primarily related to the fact that the funding hasgenerally been through central government or European Union grant, andwhilst this has been provided to local authorities on a competitive basis,it has not demanded the rigour of a full business case (as, for example,might be expected for a major transport scheme bid). All of the projectsfall below the typical threshold of £5 million, for which a full businesscase would typically be required to justify the award of funding fortransport schemes.
7.2 There is, however, some experience of developing cost–benefit analysis(CBA) of PTP projects, and the issues associated with this are discussedin this chapter.
Cost–benefit analysis: background
7.3 The Treasury best practice guide, Appraisal and Evaluation in CentralGovernment, (the ‘Green Book’), published in 2003, is used by all centralgovernment departments and agencies to appraise and evaluate policiesand capital projects. The Green Book recommends that options shouldbe appraised using cost–benefit analysis, with supplementary techniquesto be used for weighing up those costs and benefits that remainunvalued. The Treasury defines cost–benefit analysis as ’Analysis whichquantifies in monetary terms as many of the costs and benefits of aproposal as feasible, including items for which the market does notprovide a satisfactory measure of economic value’. This definition clearlystates that both qualitative and quantitative pieces of information aretaken into consideration when assessing the value of a project.
7.4 The Department for Transport’s New Approach to Appraisal (NATA)(available at www.webtag.org.uk) provides an appraisal framework fortransport projects that has cost–benefit analysis embedded within it.Typically used for the assessment of large-scale infrastructure schemes,NATA includes an assessment of the economic performance of a scheme(alongside environment, safety, accessibility and integration impacts).Recent guidance issued on the use of the NATA framework for theevaluation of small-scale walking and cycling schemes (Sustrans, 2006)may well be important to PTP assessments in the future (for exampleenabling the health benefits associated with measures to promotewalking and cycling to be more clearly articulated).
7.5 In all cost–benefit analysis, a common unit of measurement must beused when quantifying costs and benefits, the most usual unit beingmoney. The value must be discounted and therefore is usually written as‘present value at b% discount’. When valuing benefits, it is importantthat the values used are not what people think their time/health etc. isworth or what policy evaluators think people’s time/health etc. is worth,
92
but what people reveal their time/health etc. is worth by the choices they make. A simplistic example: if, through their behaviour, peopledemonstrated a willingness to spend £5 more to get to work 5 minutesearlier, the value of their time would be £1 per minute.
7.6 Externally generated figures for the cost–benefit analysis are updated inline with inflation. In the transport field, particularly for measures aimedat managing demand, many of the project benefits result from reductionsin vehicle kilometres travelled (VKT) and it is therefore important thataccurate and robust estimates of changes in VKT are made as part ofthe cost–benefit analysis.
7.7 The capability of an organisation to produce an accurate cost–benefitanalysis for a proposed transport scheme may have an effect on theirability to generate funding to implement the scheme, and can facilitatecomparisons between PTP and other hard and soft transport measures.
Cost–benefit analysis of PTP schemes
7.8 Full CBA of PTP was not reported in the Making Smarter Choices Work(2004) study. However, cost impact ratios were investigated to provide amethod for gauging the impact if the schemes were scaled up. This is a relatively simple way of generating a tangible ‘cost per car kilometresaved’ figure that can be compared with other transport schemes. In the case of the schemes included in the Smarter Choices report, thecalculations indicated a cost of between 0.7 and 3.4 pence per vehiclekilometre saved. However, the lower values were predictions forproposed schemes rather than being based on actual performance. Interms of quantifying the benefits in this case, a brief attempt was madeto measure the benefit of reduced congestion. This was done using theDfT and Strategic Rail Authority figures regarding shifting sensitive lorrymiles from road to rail. These figures can be adapted for car transport,and the resulting cost–benefit ratio for a reduction in congestion was 1:10.
7.9 In Australia attempts have been made to produce more detailedcost–benefit analyses for TravelSmart and Travel Blending. A cost–benefit analysis was produced for Travel Blending in Dulwich, a suburbof Adelaide, by Peter Tisato and Tim Robinson in 1999. The data wasextrapolated from Dulwich to a larger area of Adelaide to predict thecost–benefit ratio of the project. The benefits quantified in this caseincluded travel time savings, reduced vehicle operating costs, accidentcost reductions, network travel time savings, and pollution reduction. The first two were classified as personal savings and the latter three ascommunity savings. Increased fitness from walking and cycling, reducedcommunity severance and utility gained by Travel Blenders by helping a good social cause were thought to be too difficult to quantify.
7.10 A more recent attempt at a CBA was made for the TravelSmart project inSouth Perth, undertaken by Ian Ker, the independent auditor appointedto evaluate the effectiveness of the PTP programme. Congestion was notincluded in this CBA, but it did include:
93
| 7. Objective 3: The Business Case
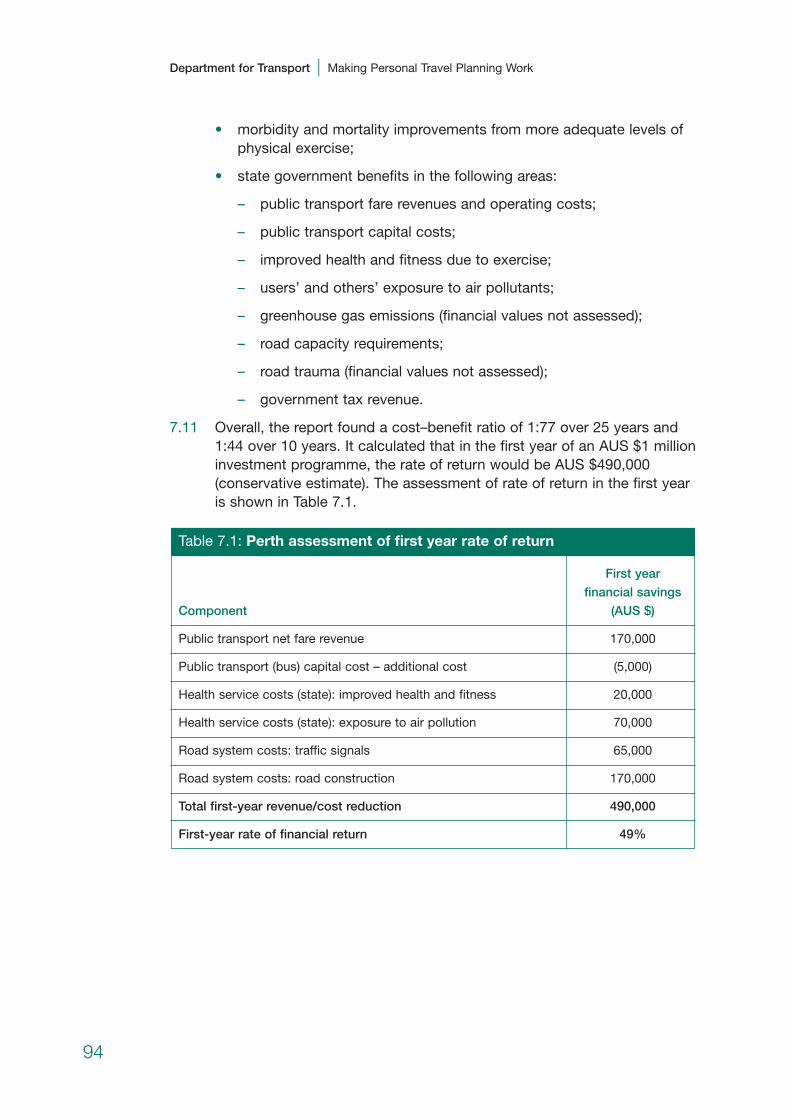
• morbidity and mortality improvements from more adequate levels ofphysical exercise;
• state government benefits in the following areas:
– public transport fare revenues and operating costs;
– public transport capital costs;
– improved health and fitness due to exercise;
– users’ and others’ exposure to air pollutants;
– greenhouse gas emissions (financial values not assessed);
– road capacity requirements;
– road trauma (financial values not assessed);
– government tax revenue.
7.11 Overall, the report found a cost–benefit ratio of 1:77 over 25 years and1:44 over 10 years. It calculated that in the first year of an AUS $1 millioninvestment programme, the rate of return would be AUS $490,000(conservative estimate). The assessment of rate of return in the first yearis shown in Table 7.1.
Table 7.1: Perth assessment of first year rate of return
First year
financial savings
Component (AUS $)
Public transport net fare revenue 170,000
Public transport (bus) capital cost – additional cost (5,000)
Health service costs (state): improved health and fitness 20,000
Health service costs (state): exposure to air pollution 70,000
Road system costs: traffic signals 65,000
Road system costs: road construction 170,000
Total first-year revenue/cost reduction 490,000
First-year rate of financial return 49%
94
Department for Transport | Making Personal Travel Planning Work

7.12 The authors of the Perth CBA concluded (2002) that ‘the development,implementation, monitoring and evaluation of PTP should be morecomprehensively documented in a structured way that allows forcontinual improvement and updating. This will provide much moreeffective support for informed decision-making.’
UK PTP projects
7.13 Within the UK there is less evidence of comprehensive CBA. In general,more efforts have been placed upon articulating the costs, and thenundertaking a basic cost-effectiveness assessment based upon the costfor each vehicle kilometre reduced (to enable some basic comparisonsamong different approaches to be made). Whilst this is helpful inunderstanding the cost-effectiveness of different ‘smarter choices’measures, it does not necessarily enable such measures, particularlydeployed extensively over large urban areas, to be accurately comparedagainst more traditional infrastructure-based alternatives.
7.14 TfL have analysed their previous projects from a business perspective,resulting in positive and encouraging cost–benefit ratios. The first pilotprojects undertaken by TfL were analysed and produced a 1:31cost–benefit ratio, indicating a strong business case for PTP. It was onthe back of these ratios that TfL decided to pursue PTP as a measure to induce travel behaviour change.12
7.15 Table 7.2 summarises the performance of the PTP case studiesexamined (where information is available). It is important that this table isread in conjunction with the issues surrounding evaluation in Chapters 5and 9. The figures assume that basic evaluation costs are included (an annual survey, but excluding any significant baseline or post-projectsurvey) within the total project costs. Total costs exclude local authoritystaff time (as these were not available for most case studies examined)and the costs associated with printing materials (as an estimate, basedupon the limited case studies for which data were available, theseexcluded costs would increase total project costs by roughly 33%). The figures are calculated for a single year, with the cost of PTP for thatyear divided by the reduction in vehicle kilometres travelled measured,to determine a cost-effectiveness value. No account has been taken forfuture year reductions in car use derived from the PTP intervention (asdemonstrated in Chapter 10), and hence can be considered aconservative estimate of the level of benefit.
12 Evidence surrounding the TfL business case has not been examined as part of this study 95
| 7. Objective 3: The Business Case
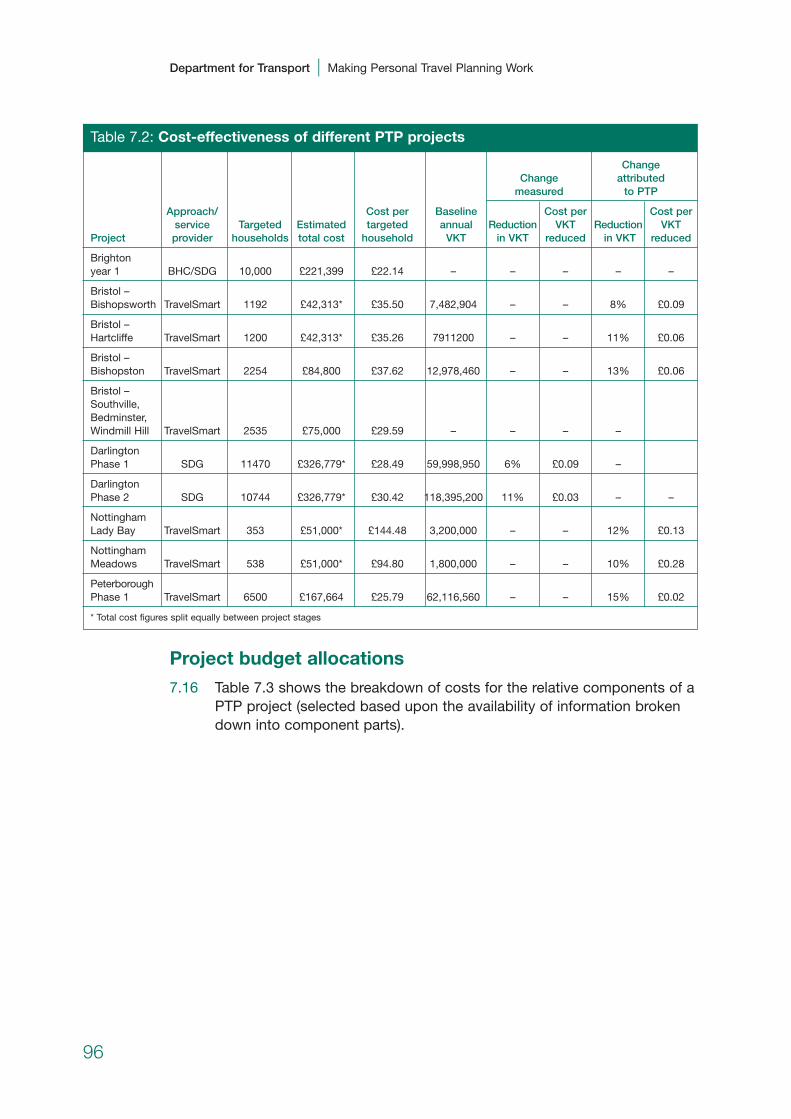
Project budget allocations
7.16 Table 7.3 shows the breakdown of costs for the relative components of aPTP project (selected based upon the availability of information brokendown into component parts).
96
Department for Transport | Making Personal Travel Planning Work
Table 7.2: Cost-effectiveness of different PTP projects
ChangeChange attributed
measured to PTP
Approach/ Cost per Baseline Cost per Cost perservice Targeted Estimated targeted annual Reduction VKT Reduction VKT
Project provider households total cost household VKT in VKT reduced in VKT reduced
Brighton year 1 BHC/SDG 10,000 £221,399 £22.14 – – – – –
Bristol – Bishopsworth TravelSmart 1192 £42,313* £35.50 7,482,904 – – 8% £0.09
Bristol – Hartcliffe TravelSmart 1200 £42,313* £35.26 7911200 – – 11% £0.06
Bristol – Bishopston TravelSmart 2254 £84,800 £37.62 12,978,460 – – 13% £0.06
Bristol – Southville, Bedminster, Windmill Hill TravelSmart 2535 £75,000 £29.59 – – – –
Darlington Phase 1 SDG 11470 £326,779* £28.49 59,998,950 6% £0.09 –
Darlington Phase 2 SDG 10744 £326,779* £30.42 118,395,200 11% £0.03 – –
Nottingham Lady Bay TravelSmart 353 £51,000* £144.48 3,200,000 – – 12% £0.13
Nottingham Meadows TravelSmart 538 £51,000* £94.80 1,800,000 – – 10% £0.28
PeterboroughPhase 1 TravelSmart 6500 £167,664 £25.79 62,116,560 – – 15% £0.02
* Total cost figures split equally between project stages
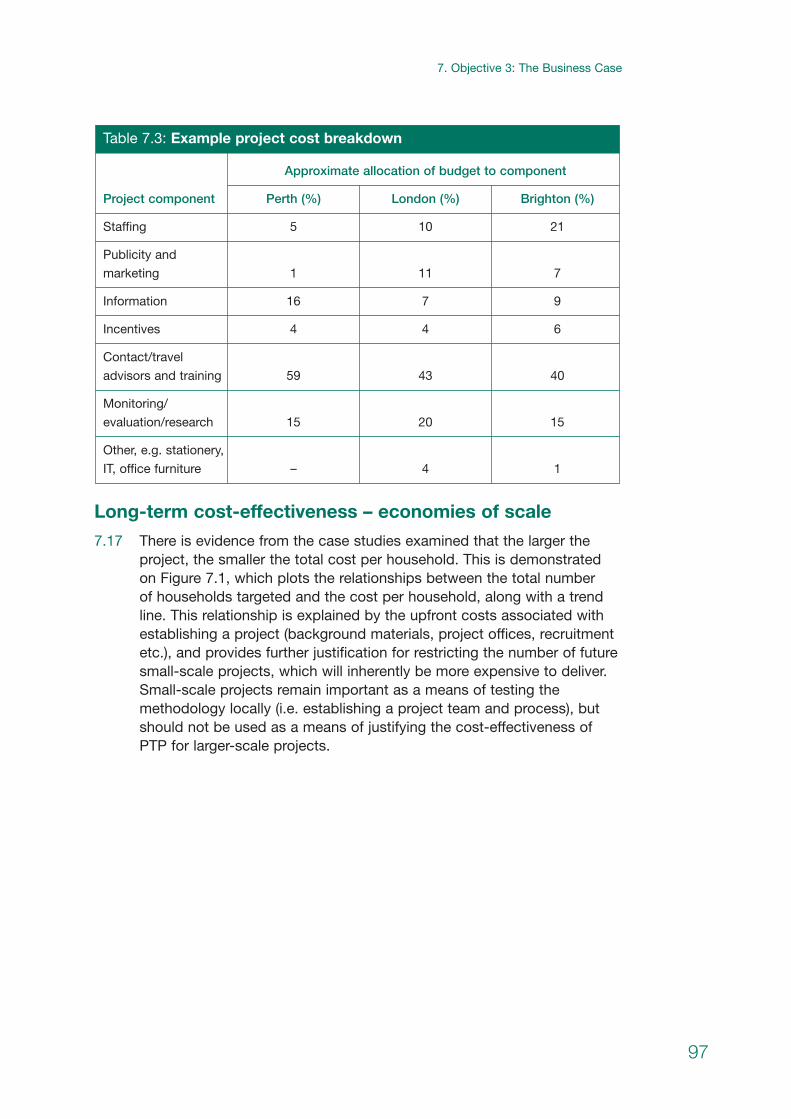
Long-term cost-effectiveness – economies of scale
7.17 There is evidence from the case studies examined that the larger theproject, the smaller the total cost per household. This is demonstratedon Figure 7.1, which plots the relationships between the total number of households targeted and the cost per household, along with a trendline. This relationship is explained by the upfront costs associated withestablishing a project (background materials, project offices, recruitmentetc.), and provides further justification for restricting the number of futuresmall-scale projects, which will inherently be more expensive to deliver.Small-scale projects remain important as a means of testing themethodology locally (i.e. establishing a project team and process), butshould not be used as a means of justifying the cost-effectiveness ofPTP for larger-scale projects.
Table 7.3: Example project cost breakdown
Approximate allocation of budget to component
Project component Perth (%) London (%) Brighton (%)
Staffing 5 10 21
Publicity and
marketing 1 11 7
Information 16 7 9
Incentives 4 4 6
Contact/travel
advisors and training 59 43 40
Monitoring/
evaluation/research 15 20 15
Other, e.g. stationery,
IT, office furniture – 4 1
97
| 7. Objective 3: The Business Case
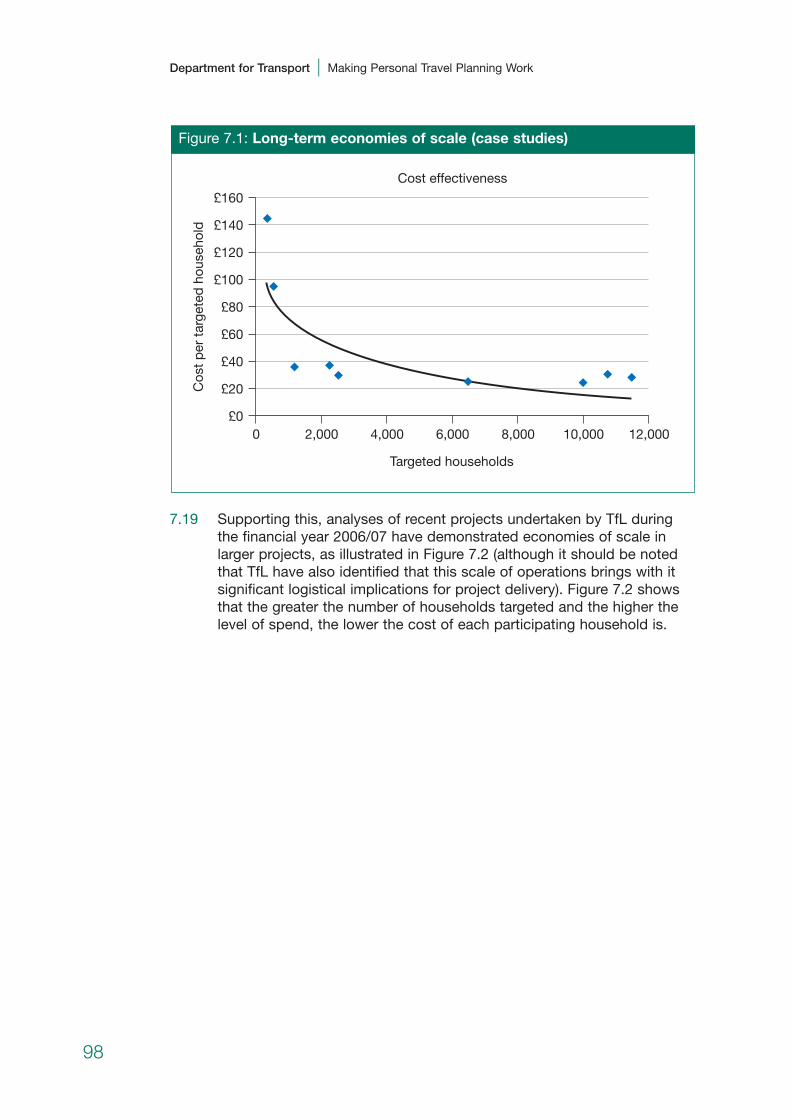
7.19 Supporting this, analyses of recent projects undertaken by TfL duringthe financial year 2006/07 have demonstrated economies of scale inlarger projects, as illustrated in Figure 7.2 (although it should be notedthat TfL have also identified that this scale of operations brings with itsignificant logistical implications for project delivery). Figure 7.2 showsthat the greater the number of households targeted and the higher thelevel of spend, the lower the cost of each participating household is.
Figure 7.1: Long-term economies of scale (case studies)
Cos
t p
er t
arge
ted
hou
seho
ld
12,00010,0008,0006,000
Targeted households
Cost effectiveness
4,0002,000
£160
£140
£120
£100
£80
£60
£40
£20
£00
98
Department for Transport | Making Personal Travel Planning Work

Summary
• There is a growing evidence base on the cost-effectiveness ofPTP, drawing upon experience both in the UK and, moreextensively, overseas.
• PTP typically costs between £20 and £38 per household, with anequivalent cost of between £0.02 and £0.13 per vehicle kilometretravelled saved.
• Effective cost–benefit analysis takes account of a broad range ofimpacts (across different sectors) and typically reports positivebenefit:cost figures in the order of 30:1.
• There is emerging evidence that cost-effectiveness is improved asthe scale of implementation is increased.
Figure 7.2: Long-term economies of scale (Transport for London)
£900,000 25
20
15
10
5
0£0
£100,000
£200,000
£300,000
£400,000
£500,000
£600,000
£700,000
£800,000
30k HH 35k HH
PTP Budget projections (economy of scale)
Tota
l cos
t
Cos
t/ho
useh
old
40k HH 50k HH£678,318 £729,001 £722,047 £851,266
22.61Cost/total projectCost/HH
Cost/total projectCost/HH
20.83 19.30 17.03
99
| 7. Objective 3: The Business Case

8 Objective 4: Funding
Current funding
8.1 It is clear that the current emphasis has been upon grant funding and that, whilst this has helped to support PTP projects to date, andstimulate interest and knowledge in PTP techniques, it is generallyaccepted that this cannot be maintained in the long term. Henceauthorities will increasingly seek to identify how PTP schemes can be delivered without significant on-going revenue support.
8.2 Table 8.1 illustrates the funding mechanisms of each of the UK casestudies.
8.3 A brief commentary on some of the project specific funding issues ispresented below.
Table 8.1: Funding mechanisms
Name of case study Funding mechanism
Brighton Primarily Cycling Demonstration Town project funding, topped
up with Local Transport Plan (LTP) and internal revenue funding
(decriminalised parking)
London TfL (part of wider ‘smarter choices’ programme with money
ring-fenced from London Congestion Charge scheme)
Nottingham (Meadows 2003/04 DfT pilot, match-funded by partner funds including
and Lady Bay) LA and bus operator staff time and resources
Nottingham (CityCard) LTP capital funds and East Midlands Development
Agency/Greater Nottingham Transport Partnership
Bristol (2007) LTP and internal capital programme – previous studies
funded through DfT Grant Support, match funding and EU
CIVITAS programme
Darlington Sustainable Travel Town
Peterborough Sustainable Travel Town
Worcester Sustainable Travel Town
Lancashire CIVITAS (EU) initiative/LTP
100
London
8.4 TfL have been undertaking PTP schemes of varying scales since 2003and gathered much experience in the field. Over the years, evaluationsand cost–benefit analyses of the projects have illustrated a modal shiftand value for money respectively, and therefore PTP has been adoptedby the Mayor of London as one measure through which to achieve theMayor’s transport strategy. Ring-fenced revenue from the LondonCongestion Charge scheme is allocated to the ‘smarter choices’programme for London, enabling the large-scale PTP projects currentlyunder way to be appropriately funded.
Brighton
8.5 The current funding streams are from the Cycling Demonstration Town(CDT) project and the council’s Local Transport Plan (LTP) funds (bothrevenue and capital). Funds from the council are made up of:
• Revenue from decriminalised parking from 2005/06, carried over to2006/07;
• £80,000 per annum from LTP2 funding to 2010/11.
8.6 The CDT funding of £1.5 million is awarded in three equal sums over the three-year period to 2008/09, and is match funded by the Council.Officially 2009 is the year of walking and cycling, and during this yearapproximately 40% of the entire capital budget will be spent onmeasures to support these modes.
8.7 Brighton and Hove City Council would like to continue the PTPprogramme after the CDT project has finished. The council is already amember of the European Union’s CIVITAS consortium and is hoping toobtain EU funding to take the PTP programme forward. The council isalso able to commit approximately £20,000 from LTP2 funding and£80,000 revenue from decriminalised parking enforcement in future years.
Nottingham
8.8 Nottingham undertook a PTP pilot in 2003/04 (with central Governmentgrant support), but could not identify a future funding mechanism on thescale required to deliver a similar programme to other areas of the city.As a result, they have developed a modified PTP programme, combiningone-off public transport personal journey plans, with a smartcard (andpre-loaded free ticket), which also combines the functionality of a librarycard and leisure centre access card.
8.9 The Nottingham Citycard PTP project has been funded through a mixtureof LTP capital funds and successful capital and revenue bids to the EastMidlands Development Agency and the Greater Nottingham TransportPartnership.
101
| 8. Objective 4: Funding
Bristol
8.10 Bristol has undertaken a number of separate PTP projects (each yearsince 2002). Evaluation results in the first three phases (which werefunded by EU grant funding from the CIVITAS programme, and DfT pilotproject pump-priming) encouraged LA officers that PTP was worthpursuing. In order to continue their PTP programme on an annual basis,Bristol has allocated approximately £70,000 of its capital programme(comprising both LTP and council resources). Given the results fromearlier projects, Bristol has since undertaken a much-reduced evaluationprogramme that simply provides an indication of improvement, making itmore cost-effective per targeted household, as the money is focusedprimarily on the delivery of PTP (rather than evaluation).
Future funding
8.11 During the case study interview, time was taken to discuss future fundingmechanisms, which provided a useful insight into potential alternativefunding models. A commentary on the emerging issues is presented below.
Local Transport Plan
8.12 Whilst restricted to capital funding, the LTP spending flexibilities offeredto local authorities (in particular those classified as excellent) couldprovide a potential platform for PTP investment, provided the long-termsecured benefits can be proved and sustained. This could, for example,relate to supporting measures such as marketing material, call centreresources, walk/cycle incentives and public transport information.Coordination with other LTP investment plans is likely to become anincreasingly important issue for PTP projects.
8.13 The DfT ‘smarter choices’ research, 2004, stated ‘The Department forTransport believes that many of the most effective transport interventionsare revenue programmes. Some of the smarter choice programmes maybe classed as capital (and can therefore be funded from the local transport capital settlement) – local authorities should resolve any issues about theprecise definition of capital with their auditors.’.
8.14 If LTP funding is to be considered, then it is vital to seek the views (and approval) of the local authority and DfT auditors.
Local authority funding
8.15 Over and above the capital grant funding offered through the LocalTransport Plan, local authorities have discretion to fund local schemes of importance. Whilst historically this has generally been used to support public transport subsidies (for non-commercial services), roadmaintenance, road safety, road improvement schemes or bridge works,there is no reason why PTP could not be funded through internal localauthority funding if the evidence base demonstrates a strong level of effectiveness. The key issue is to create a convincing case forinvestment, based upon robust case study evaluation, and todemonstrate how PTP performs against a range of alternative options.102
Department for Transport | Making Personal Travel Planning Work
Regional funding allocation
8.16 For major transport schemes (currently all schemes over £5 million), thereis a necessity for schemes to secure a position on the regional fundingallocation and regional prioritisation process (initially through thedevelopment of a Regional Appraisal Summary Table and supportingbusiness case). Whilst PTP programmes are not subject to this atpresent (because of the smaller scale of investment involved), as themarket matures and larger-scale pilots are delivered this may change.There is likely to be an increasing role for embedding PTP (and other‘smarter choices’ measures) within the Regional Transport Strategybuilding process (as part of the Regional Spatial Strategy).
Transport Innovation Fund (TIF)
8.17 Currently allocated as two distinct components (TIF Productivity and TIF Congestion), TIF provides the opportunity (to successful authorities in the bidding process) to inject significant resources into major transportschemes of local and regional importance. For the productivitycomponent this is currently primarily focused on rail infrastructure, and,for the congestion component, a greater emphasis is placed upon roaduser charging combined with supporting measures. However, for bothelements, there is a recognition of the role that ‘smarter choices’measures can play in support of major infrastructure components, andhence there are likely to be real opportunities to integrate PTP projectswithin large-scale TIF proposals at the delivery stage. Early considerationneeds to be placed on embedding PTP within such proposals at thebidding stage.
8.18 The ten largest cities have each developed congestion targets as part ofthe LTP2 process. They receive significant funding to deliver congestionstrategies, up to 50% of which may be allocated for revenue-fundedschemes.
Growth Area Fund (GAF) and Community Infrastructure Fund (CIF)
8.19 Both GAF and CIF provide large-scale funding to facilitate developmentin designated growth areas (generally focused on the South East, wheredevelopment pressures are greatest). This provides the opportunity todeliver the necessary major transport schemes to facilitate thedevelopment opportunity. Restricted to capital investment projects ofregional significance, they are unlikely to provide a realistic prospect of direct PTP funding, although they do provide important context –particularly if ‘smarter choices’ measures become more integrated withconventional transport planning approaches.
Developer contributions
8.20 There is a growing and likely more significant contribution fromdevelopers as PTP techniques become more embedded within theresidential travel planning process (in particular since the launch of theMaking Residential Travel Planning Work guidance and the subsequent
103
| 8. Objective 4: Funding
Guidance on Transport Assessment). The work at Queen Elizabeth Park(Surrey) and College Gardens (Doncaster) demonstrates how PTPprojects can be delivered within a new residential environment.
8.21 The College Gardens project is being led by Sustrans/Socialdata, whohave recently contacted 100 households (new residents), with very highlevels of interest (60% segmented as ‘Interested’). Evaluation is morecomplex than other Sustrans/Socialdata projects, as there is no‘baseline’ data on behaviour of people who have just moved into newhomes, but an assessment of impact will be undertaken in due coursethrough a post-implementation telephone survey. Sustrans/Socialdataare also conducting a standard PTP project at the same time inDoncaster (Bessacarr), and, whilst the evaluation report is not yetcomplete, the headline figures indicate a 7 percentage point change in the mode share as car driver.
8.22 There is also the potential to develop area-wide PTP programmes part-funded by several developers (for example, funded through pooledcontributions from different developers, an approach already explored in Nottinghamshire through the Integrated Transport Planning Statement,and currently being implemented through the sustainable transportSupplementary Planning Documents being developed by Worcestershiredistricts as part of their evolving Local Development Frameworks). Asimilar model is being deployed within the planning profession (generallyknown as an ‘infrastructure tariff’ or ‘roof tax’), and is already being usedin Milton Keynes and Northamptonshire (amongst others) to provide apool of resources to enable the local authority to co-ordinate supportingmeasures to ensure development is delivered in a sustainable way.
8.23 Worcestershire County Council has been successful in gainingcontributions that can be allocated to a PTP project on a new residentialdevelopment. A possible disadvantage to this funding source is theamount and what can be achieved with it. For example, Worcestershirehave managed to secure £50,000 from the developer, but in relativeterms this may not be enough to undertake all aspects of a PTP processto a defensible level.
Partnership support
8.24 As demonstrated in several case studies, partnership support providesthe ability to bolster PTP projects. The main potential is likely to be frombus/rail operators, who have a direct vested interest in the outcome of thePTP project (in terms of patronage and farebox revenue). Bus operatorshave already invested in the UK case studies – for example, in Worcester,where First Group are represented on the project steering group andcontribute both staff time and project resources to the PTP project.
8.25 It is, however, worth noting that, as set out in Chapter 5, not all busoperators are yet convinced that the case for PTP has been fully made,and there remains a view within the industry that targeted advice andtimetable updates through direct mail shot are a more cost-effectivemeans of delivery.
104
Department for Transport | Making Personal Travel Planning Work
8.26 The InfoMotion study in Hampshire was an early pioneer of PTP in theUK, which focused solely upon public transport and was based around astreamlined approach to IndiMark. InfoMotion also includes PSA fundingand multi-bus operator involvement. Hampshire have included the futureextension of InfoMotion as a key measure within their ‘smarter choices’programme for the LTP2 period.
Related sectors
8.27 Whilst PTP is focused upon travel behaviour change, and thereforeallocated within the transport funding streams, there may beopportunities to work more closely with other funding sectors to create adeliverable and cost-effective scheme. For example, the issuing of greenrecycling bags ‘pre-intervention’ is a good example of how the PTPprogramme benefits the recycling market (and vice versa), and similarmodels could be developed with the health sector (promoting walkingand cycling as both preventative and rehabilitation tools) and educationsector (promoting safe and healthy school travel behaviour, leading tobetter attendance and attainment of results).
Other transport budgets
8.28 PTP can bring a range of benefits to local authorities – for example,reduced car usage can mean that road maintenance projects can bescaled down, therefore effectively freeing up money with a pre-plannedbudget. This remaining money could be contributed towards a PTP fund.Whilst in principle this might appear an appropriate solution, the practicalability to secure funds this way has yet to be fully tested (for example,additional costs associated with increased investment in footways,cycleways and bus services would need to be included within any assessment).
Sponsorship of leaflets and information materials
8.29 The sponsorship of information materials by local or even nationalbusinesses and companies may help to contribute towards PTP costs.There is a strong pitch to present to interested parties, not least of whichare the potential audience numbers of the materials that will carry abusiness’s logo. Another way to capture funds through advertisementrevenues is to approach local services and businesses and offer tospecifically locate their services on walking, cycling and public transportmaps (although this would need to be carefully managed to ensure itdoes not compromise the overall mobility options available to any oneparticular service or suggest that the advice might not be unbiased).
Including PTP in relevant policy documents
8.30 At the strategic level, the correct policy framework must be in place to support PTP projects. This means that positive statements must beincluded in the correct documents upon which decisions are made. This includes documents such as the Local Development Framework,Regional Transport Strategies, Local Transport Plans, Local Area
105
| 8. Objective 4: Funding

Agreements, Local Delivery Plan, and Supplementary PlanningDocuments. These documents form the framework through which thedevelopment industry and planners operate and also through which theyharness resources through the new ‘pooling approach’ to sustainabletravel and ‘smarter choices’ initiatives.
8.31 Darlington have realised the importance of this potential fundingmechanism and are planning to include PTP and related activities in theforthcoming Darlington Community Plan, which will represent a strategicvision of what the priorities in the borough will be in future years. TheDarlington Partnership, which is tasked with developing the plan, has setup an Environment and Transport theme group. Transport officers arepresenting evidence to the group on a wide range of measures, including‘smarter choices’ initiatives.
Summary
• There has been a strong emphasis on central Government orEuropean grant funding for PTP projects to date.
• Some authorities have secured annual PTP budgets from LTP andinternal funds.
• PTP project partners have typically contributed through staff timeand project resources (rather than financial contributions).
• There is scope for more innovative future funding mechanisms, asthe evidence base grows and greater confidence is placed on theexpected outcomes.
106
Department for Transport | Making Personal Travel Planning Work
9 Objective 5: Evaluation
Introduction
9.1 Evaluation of PTP projects is a challenging and complex issue, requiringcareful consideration from the outset. Throughout this chapter, the termevaluation refers to the monitoring and reporting of outcomes (travelbehaviour results) of PTP projects.
9.2 First in this section the role of evaluation is clarified. Then keyrequirements for evaluation are outlined, taking into account theoreticalprinciples as well as methodological options. Past experience fromevaluations of PTP conducted worldwide is reviewed, includingimplications for evaluation methodology, before then presenting findingsfrom the case studies examined in this project. This leads to futurerecommendations on evaluation.
Reasons for evaluating PTP outcomes
9.3 Evaluation concerns the investigation of the effectiveness of anintervention in achieving improvements to society.
9.4 The first and perhaps foremost purpose of evaluation is to informdecision makers of whether PTP projects are a good choice for thespending of resources, compared to other options. The benefits fromPTP projects arise from changes in travel behaviour and contingentimpacts, therefore a key part of the evaluation of PTP projects is asystematic investigation of travel behaviour changes and resultanteffects. Systematic investigation of the costs of delivery of PTP projectsis the other main requirement of evaluation and is dealt with in Chapter7. Evaluating for the purpose of assessing value for money is known assummative evaluation and concerns measuring impacts compared withexpected impacts, impacts of alternative actions or impacts of not doinganything (counterfactual).
9.5 A second purpose of evaluation is formative evaluation, which isconcerned with understanding how a project achieved its impacts andwhy and under what conditions this happened. This supports adaptivelearning from experience and can enable understanding to be gained onhow to employ PTP in future.
9.6 A third possible purpose of evaluation is as an integral part of the PTPprocess. A dialogue about travel behaviour with participants is usuallypart of the initial stage of the PTP process, which offers the prospect of collecting ‘before’ travel data, and, if feedback is involved, furtherdialogue with participants may occur to see how they have fared withtrying alternative travel options, which offers the prospect of collecting‘after’ travel data. Also, it may be considered part of the informalcontract between the PTP project team and the general public that thepublic is informed of the effect it has on the community.
107
Sufficiency of existing evidence on PTP
9.7 Many PTP projects have now been undertaken in the UK and worldwide,and this section seeks to establish what is known from these about thevalue of PTP and how PTP can be effectively applied.
9.8 The evaluation of the DfT PTP pilot projects in 2003/04 (DfT, 2005)concluded that it is ‘…difficult to evaluate how easily the results fromthese pilots could be replicated in other areas across the country…There is sufficient evidence to suggest that well tailored personal travelplanning projects undertaken in carefully chosen areas should realisecost-effective car km per year savings.’
9.9 Cairns et al. (2004) in reviewing a wider selection of projects for the DfTMaking Smarter Choices Work report state that ‘results so far availablesuggest that personal travel planning may lead to reductions in car drivertrips of 7–15% amongst targeted populations in urban areas’ and ‘evenwhere challenges have been made claiming that these results overstatethe efficacy of personal travel planning, alternative figures suggested,while lower, are still within the same range as the figures quoted aboveand evidence that personal travel planning can reduce car use by asignificant amount is accepted by those who challenge the technique as well as its supporters’.
9.10 A report to the Australian Government (AGO, 2006) concludes that there is ‘…little further need to undertake major evaluations of householdprojects, as…data is in broad agreement’ and in Australia ‘largerhousehold projects routinely show decreases in car use of 4–15%’. The report goes on to suggest that ‘Decision-makers should be lookinginstead to implement what has been learnt at a much larger scale –further attempts at refinement will yield little return.’
9.11 However, some contrasting opinions exist. Stopher (2005) considersevaluation of travel behaviour changes the most difficult aspect of PTPand ‘there is a clear need for the development of much better short- and long-term evaluation procedures…’. Cairns et al. (2004) refer toprofessional disputes in Australia over the statistical validity of PTPimpacts and note that in reported evaluations ‘the complexity of theprocesses and adjustments involved; the fact that those advocating the initiatives are sometimes also responsible for monitoring them; andthe fact that the data is largely the preserve of commercial companies,released in a variety of formats, with a range of detail, and onlysometimes subject to independent auditing has led to a lack ofconfidence in conclusions amongst some professionals’.
9.12 An important further question to ask is whether evaluations have beenseeking appropriate information to investigate impacts. Past evaluationshave generally emphasised the reporting of changes in modal split. In thebrief for this project it is identified as being a requirement to measure carmileage and carbon emissions. It has been noted that these have beenreported only in a minority of projects (Cairns et al., 2004; AGO, 2006). Ifthese are to be measured, then consideration has to be given to whethercurrent survey methods provide a suitable tool for measurement.108
Department for Transport | Making Personal Travel Planning Work

9.13 Past evaluations have also emphasised the reporting of disaggregateoutcomes (at level of individuals or households). Gärling and Fujii (2006)state that ‘…in a large-scale program, aggregated level evaluation, suchas change in traffic volume, regional modal share of car and publictransport, frequency and duration of traffic congestion, and number ofpassengers in bus or trains are as important as disaggregated-levelevaluation’. Furthermore, there may be interest in a broader set ofimpacts from PTP than the travel outcomes that have usually receivedattention. These include attitudes towards transport modes/services,levels of physical activity, use of local facilities and social inclusion.
9.14 The recently published review of the take-up of ‘smarter choices’ inLocal Transport Plans (DfT, 2007) suggests that reluctance to adoptsmarter choices ‘revolves around the belief that that there is a lack ofevidence, or a lack of relevant evidence’ and a belief that benefits ofmeasures are not observed in the short term, although measures arehelpful in guiding attitudes towards sustainable travel choices. It issuggested that, even where local authorities are active in ‘smarterchoices’, lack of monitoring is preventing adaptive learning. Thesecomments suggest that, even with consistency in reported benefits fromPTP, there is scepticism among local authorities about the tangibility ofPTP benefits and transferability of PTP benefits to their areas.
9.15 It is apparent that there are mixed signals and opinions on the futureneed for evaluation of PTP. Results from a large number of studies areconsistent in showing reductions in car use and increases in the use ofalternative modes of transport, but some doubts have been raised thatthe scale of impacts reported may be exaggerated and suggestimproved evaluation procedures are used to examine this. This impliesfurther need for summative evaluation. There is less certainty within the literature about what methods are most effective in PTP and in what locations and with which groups of the population PTP is mosteffectively applied. Gärling and Fujii (2006) suggest that ‘…furtherrefinement and evaluation of travel feedback programs, both theireffectiveness and cost-effectiveness, are called for, drawing more closelyon relevant behavioural theories…’. This implies further need forformative evaluation as well as summative evaluation. Hence in thisproject the need for both purposes of evaluation are considered.
Principles of evaluation
9.16 In seeking to measure whether an intervention results in a change inoutcome, there are a number of fundamental requirements for achievingrobust results. These are listed below in a sequential order, where onerequirement on the list should be addressed before addressing the next one:
Construct validity – ensuring that measurements are assessing whatthey are intended to measure (threatened by ambiguous phrasing ofquestions in a survey, for example).
109
| | 9. Objective 5: Evaluation

Internal validity – ensuring that the intervention actually causes theoutcome (threatened by other factors than PTP influencing behaviour, for example).
Reliability – ensuring that result would be repeatable if conducted again(threatened by the use of a small sample in a survey, for example).
External validity – ensuring that results are generalisable to othersituations (threatened by the context of the intervention area not beingwell understood, for example).
9.17 It is also important that evaluations have credibility, with there beingsufficient detail in reporting for credibility of results to be assessed.Some further specific requirements can be identified with respect toevaluating the impacts of PTP in case studies in this project:
Conceptual validity – ensuring that the theoretical explanation for theoutcome is supported by the data (threatened by the evaluation notmeasuring determinants of behavioural change such as attitudes, for example).
Unintended consequences – ensuring that other relevant outcomeshave not occurred which would affect evaluation (threatened by selectionof geographically too narrow a population in a survey, for example).
Endurability – ensuring that outcomes are endurable over time(threatened by failure to monitor outcomes over a significant period oftime, for example).
9.18 A further consideration for this project in comparing case studies is:
Consistency – ensuring that there has been consistency in evaluationsamong different PTP projects (threatened by the use of different surveydesigns, for example), so that results can be compared and synthesised.
How survey methodology addresses evaluation principles
9.19 The standard approach used to measure the impact of PTP is self-reporttravel surveys (on one occasion before and one occasion after PTP isconducted). Although collected in some studies, aggregate-levelobservations of travel (i.e. vehicle or passenger counts) are generallyconsidered to be unsuitable as the primary basis for evaluation, due tothe difficulty in defining locations of appropriate specificity to PTPprojects (which are unaffected by the behaviour of wider populationsthan those participating in project).
9.20 Table 9.1 examines how aspects of a self-report travel survey addresseach of the evaluation principles discussed above. It is assumed that ameasurement indicator such as car kilometres travelled during a day isbeing collected in the survey.
110
Department for Transport | Making Personal Travel Planning Work
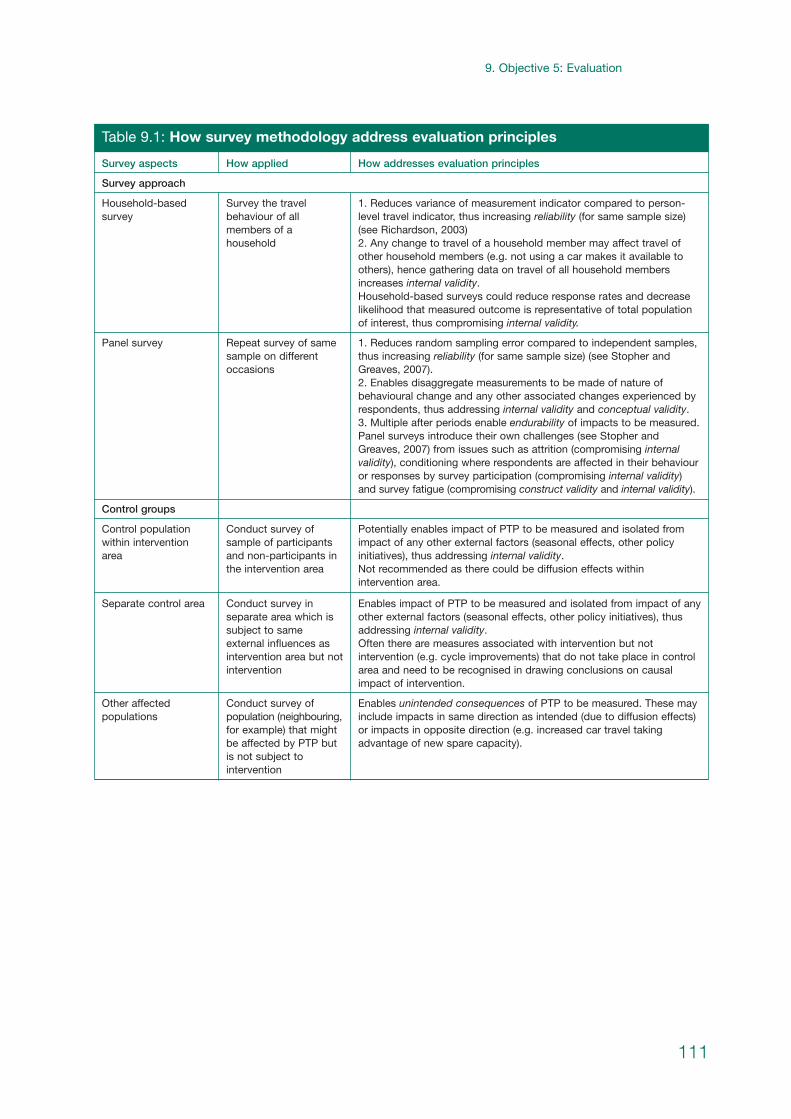
111
| 9. Objective 5: Evaluation
Table 9.1: How survey methodology address evaluation principles
Survey aspects How applied How addresses evaluation principles
Household-basedsurvey
Survey the travelbehaviour of allmembers of ahousehold
1. Reduces variance of measurement indicator compared to person-level travel indicator, thus increasing reliability (for same sample size)(see Richardson, 2003)2. Any change to travel of a household member may affect travel ofother household members (e.g. not using a car makes it available toothers), hence gathering data on travel of all household membersincreases internal validity.Household-based surveys could reduce response rates and decreaselikelihood that measured outcome is representative of total populationof interest, thus compromising internal validity.
Control populationwithin interventionarea
Conduct survey ofsample of participantsand non-participants inthe intervention area
Potentially enables impact of PTP to be measured and isolated fromimpact of any other external factors (seasonal effects, other policyinitiatives), thus addressing internal validity. Not recommended as there could be diffusion effects withinintervention area.
Separate control area Conduct survey inseparate area which issubject to sameexternal influences asintervention area but notintervention
Enables impact of PTP to be measured and isolated from impact of anyother external factors (seasonal effects, other policy initiatives), thusaddressing internal validity. Often there are measures associated with intervention but notintervention (e.g. cycle improvements) that do not take place in controlarea and need to be recognised in drawing conclusions on causalimpact of intervention.
Panel survey Repeat survey of samesample on differentoccasions
1. Reduces random sampling error compared to independent samples,thus increasing reliability (for same sample size) (see Stopher andGreaves, 2007).2. Enables disaggregate measurements to be made of nature ofbehavioural change and any other associated changes experienced byrespondents, thus addressing internal validity and conceptual validity. 3. Multiple after periods enable endurability of impacts to be measured.Panel surveys introduce their own challenges (see Stopher andGreaves, 2007) from issues such as attrition (compromising internalvalidity), conditioning where respondents are affected in their behaviouror responses by survey participation (compromising internal validity)and survey fatigue (compromising construct validity and internal validity).
Survey approach
Control groups
Other affectedpopulations
Conduct survey ofpopulation (neighbouring, for example) that mightbe affected by PTP butis not subject tointervention
Enables unintended consequences of PTP to be measured. These mayinclude impacts in same direction as intended (due to diffusion effects)or impacts in opposite direction (e.g. increased car travel takingadvantage of new spare capacity).

112
Department for Transport | Making Personal Travel Planning Work
Table 9.1: How survey methodology address evaluation principles continued
Survey aspects How applied How addresses evaluation principles
Well-designed surveyinstrument
Phrase questions toavoid question non-response, non-reportingand response biases.
Ensures as far as possible that measurements represent what isintended to be measured and addresses construct validity. Alsoincreases response rate which reduces potential sampling bias andhence increases internal validity.
Survey completionincentives
Avoid survey incentivesthat risk influencingbehaviour and surveyresponses
As above, seeks to minimise ‘conditioning’, thus addressing internalvalidity. Also ensures measurements represent what is intended to bemeasured and addresses construct validity.
Neutral design ofsurvey
Neutral design of surveythat avoids increasingawareness of behaviourunder question andinfluencing it
Seeks to minimise ‘conditioning’, where the survey itself influences thebehaviour being measured, and the risk that respondents may seek toco-operate in survey to receive a positive evaluation from experimenter(Hawthorne effect). It thus addresses internal validity.
Survey design
Process measures Include questions onconstructs such asawareness, beliefs,attitudes, norms andintentions and habit
Enables understanding to be gained on antecedent psychologicalconstructs to reported behaviour, potentially contributing to internalvalidity (impacts resulted from intervention) and conceptual validity(confirmation that intervention’s theorized causal impact occurred).However there is a risk that measuring these constructs could influenceresponses on behaviour.
Consistency of surveydesign
Use same surveyinstrument on all surveyoccasions and for allsurvey respondents
Increases internal validity as differences in measurements couldotherwise be due to survey instrument rather than intervention.
Sampling
Defining population tobe sampled
The population can bedefined based on allhouseholds in an area,those households listedfor an area, thosehouseholds contactedand offered PTP or onthose that participate in PTP
The basis of defining the population can affect capability of addressingexternal validity (since boundaries, listings, contactability andparticipation may differ in other situations) and capability of measuringof unintended consequences.
Sample size Draw larger sample Reduces random sampling error, thus increasing reliability (see Stopherand Greaves, 2007)
Random sample orrandom stratifiedsample of population
Sampling procedurethat pays attention toavoiding sampling bias(which can becontributed to bycoverage bias, sampleselection bias,non-contact bias andnon-response bias)
Minimises sampling bias, increasing likelihood that measured outcomeis representative of total population of interest, thus addressing internalvalidity.Sampling bias is very challenging to address especially where samplediffers from population due to travel characteristics/attitudes, ratherthan socio-demographics, and hence post-sample weighting cannotcorrect bias. It can be minimised by using as complete as possiblesample frame, random draws from sample frame, persistent and variedattempts at contact and encouraging survey response (throughreminders, incentives).
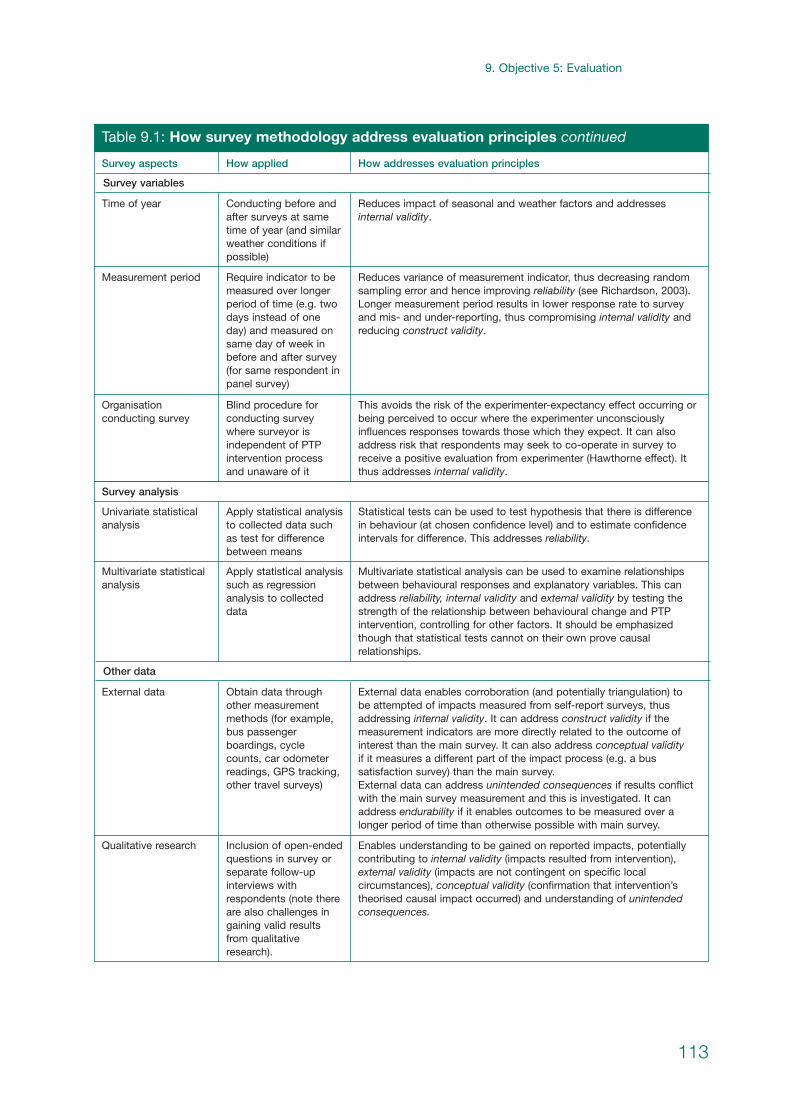
113
| 9. Objective 5: Evaluation
Measurement period Require indicator to bemeasured over longerperiod of time (e.g. twodays instead of oneday) and measured onsame day of week inbefore and after survey(for same respondent inpanel survey)
Reduces variance of measurement indicator, thus decreasing randomsampling error and hence improving reliability (see Richardson, 2003).Longer measurement period results in lower response rate to surveyand mis- and under-reporting, thus compromising internal validity andreducing construct validity.
Organisationconducting survey
Blind procedure forconducting surveywhere surveyor isindependent of PTPintervention processand unaware of it
This avoids the risk of the experimenter-expectancy effect occurring orbeing perceived to occur where the experimenter unconsciouslyinfluences responses towards those which they expect. It can alsoaddress risk that respondents may seek to co-operate in survey toreceive a positive evaluation from experimenter (Hawthorne effect). Itthus addresses internal validity.
Survey variables
Time of year Conducting before andafter surveys at sametime of year (and similarweather conditions ifpossible)
Reduces impact of seasonal and weather factors and addressesinternal validity.
Table 9.1: How survey methodology address evaluation principles continued
Survey aspects How applied How addresses evaluation principles
Univariate statisticalanalysis
Apply statistical analysisto collected data suchas test for differencebetween means
Statistical tests can be used to test hypothesis that there is differencein behaviour (at chosen confidence level) and to estimate confidenceintervals for difference. This addresses reliability.
Multivariate statisticalanalysis
Apply statistical analysissuch as regressionanalysis to collecteddata
Multivariate statistical analysis can be used to examine relationshipsbetween behavioural responses and explanatory variables. This canaddress reliability, internal validity and external validity by testing thestrength of the relationship between behavioural change and PTPintervention, controlling for other factors. It should be emphasizedthough that statistical tests cannot on their own prove causalrelationships.
Survey analysis
Qualitative research Inclusion of open-endedquestions in survey orseparate follow-upinterviews withrespondents (note thereare also challenges ingaining valid resultsfrom qualitativeresearch).
Enables understanding to be gained on reported impacts, potentiallycontributing to internal validity (impacts resulted from intervention),external validity (impacts are not contingent on specific localcircumstances), conceptual validity (confirmation that intervention’stheorised causal impact occurred) and understanding of unintendedconsequences.
Other data
External data Obtain data throughother measurementmethods (for example,bus passengerboardings, cyclecounts, car odometerreadings, GPS tracking,other travel surveys)
External data enables corroboration (and potentially triangulation) to be attempted of impacts measured from self-report surveys, thusaddressing internal validity. It can address construct validity if themeasurement indicators are more directly related to the outcome ofinterest than the main survey. It can also address conceptual validityif it measures a different part of the impact process (e.g. a bussatisfaction survey) than the main survey.External data can address unintended consequences if results conflictwith the main survey measurement and this is investigated. It canaddress endurability if it enables outcomes to be measured over alonger period of time than otherwise possible with main survey.
Statistical inference
9.21 We briefly explain the role of statistical inference in evaluating PTPinterventions and discuss the issues of sampling error and sampling bias.Interest typically lies in whether PTP reduces car use, and a hypothesistest can be used to assess the evidence on whether a difference in themeasured car use before and after the intervention is likely to have arisenby chance or whether some other factor is responsible for the difference.The null hypothesis of no difference in car use before and after the PTPintervention should be used as the basis for statistical testing. Rejectingthe null hypothesis will provide a ‘statistically significant’ finding.
9.22 Data on car use (e.g. daily car trips) is collected for a sample of thetarget population before and after the intervention. Statistics such as thesample mean and standard deviation can be calculated for each of thesamples. Sampling error (or random sampling error) arises whenever asample is taken of a population and where we cannot be certain that the sample mean is the same as the population mean. Sampling errorneeds to be calculated so that a confidence interval can be found withinwhich there is a certain probability (or confidence level) that thepopulation mean lies. For a given confidence level (e.g. 95%), the size of the sampling error increases proportionally with the standard deviation(inherent variability) of the item being measured and the inverse of thesquare root of the sample size. Hence other things being equal:
• the more variability in the item being measured, the larger thesampling error;
• the smaller the sample size, the larger the sampling error;
• the higher the confidence level desired (for example, 99% instead of95%), the larger the sampling error.
9.23 For the null hypothesis of no difference in car use before and after thePTP intervention, the difference between the sample means can becalculated and the sampling error is a function of the variability of theitem being measured (daily car trips), the sample sizes of the twosamples and the confidence level required. Again, the more variability in the item being measured, the smaller the sample sizes and the higherthe confidence level desired the larger the sampling error. With a largesampling error, even when there is a large difference between thesamples means there will be insufficient statistical evidence to reject thenull hypothesis. Hence, efforts should be made to reduce the samplingerror by increasing the sample size and, where possible, selecting ameasurement item with low variability.
9.24 A way of reducing the sampling error for the same sample size andmeasurement item is to use paired samples (i.e. panel survey where thesame people are surveyed in before-and-after survey) instead ofindependent samples. However, acquiring repeated data from the samerespondents is challenging, and a reduced response rate in the ‘after’survey (‘attrition’) can to lead to sampling bias.
114
Department for Transport | Making Personal Travel Planning Work
9.25 Sampling error affects the uncertainty or precision associated with ameasured item and hence its reliability. It should be differentiated fromsampling bias, which affects the expected value or accuracy obtained for a measured item and hence its internal validity. Sampling bias ariseswhen the sample obtained is not representative of the population. Whilesampling error cannot be eliminated unless the full population issurveyed, sampling bias can be virtually eliminated by careful samplesurvey design that ensures the sampling frame does not systematicallyeliminate certain people and that the sample is obtained from the sampleframe in a random manner. A low response rate to a survey presents aserious risk to achieving a random sample and efforts should be made to avoid this. There are other potential sources of systematic bias whichshould also be minimised in a survey (for example, response bias, whererespondents consistently under-report or over-report travel).
Past experience of PTP evaluation
9.26 Two overlapping UK reviews of PTP projects have been carried out. The evaluation of DfT’s PTP pilot projects (DfT, 2005) found PTP projects‘…achieved reasonably consistent reductions in mode share of car drivertrips ranging from three to six percentage points’ and reductions in totalannual car kilometres of between 50,000 and 6,200,000, depending onscale of project. The Smarter Choices report (Cairns et al., 2004)concluded from UK and international projects (Australia, Germany,Sweden, US) that ‘personal travel planning typically reduces car drivertrips amongst targeted populations by 7–15% in urban areas, and (basedon rather less evidence and therefore a considerably less certainconclusion) by 2–6% in rural areas’. (Note that a change in car driver tripmode share will equate to a larger relative reduction in car driver tripsand hence the larger figures for reduction in car driver trips noted byCairns et al. (2004).)
9.27 AGO (2006) found that household PTP projects in Australia routinelyshow ‘decreases in car use of 4–15%’ and there is ‘a small amount ofevidence that changes appear to be sustained for at least five years’.Results from Perth show public transport boarding increasescorroborating the impacts obtained from travel surveys.
9.28 Gärling and Fujii (2006) found from a meta-analysis of PTP projects inJapan that PTP reduced car use (varying in definition across projectsfrom being based on car trips or car distance) by 6–27%. A comparisonof the outcomes obtained for different PTP designs indicated that caseswhere participants were asked to set a behavioural goal had largeroutcomes for car use reduction. Taniguchi, Suzuki and Fujii (2007) notethat case studies in Japan have been small-scale compared to Australiaand UK and have not involved corroboration with aggregate-level data.
115
| 9. Objective 5: Evaluation
Lessons from past PTP evaluations
9.29 There has been a keen debate on the results from Australian PTPprojects. Stopher and Bullock (2003) have suggested that the impacts of IndiMark in Australia have been over-stated due to factors such asunder-representation of large households and non-contacted/non-participating households in surveys and under reporting of trips insurveys. Roth et al. (2003) have sought to address these criticisms bypresenting detailed information about the survey data used.
9.30 In an audit of South Perth PTP (reported in Socialdata, 2003) it is concluded that ‘…assessment follows high standard of practice’ and analysis of thedifferences in behaviour of those receiving information and those not shows that the claim is supported that change was motivated by participation in PTP. The auditor (Professor Goulias) conducted his own multivariateregression analysis of the data to relate trip-level mode choice toexplanatory variables and identify the effect of PTP participation separatefrom other effects (Goulias et al., 2002). In the audit it is recommendedthat evaluation practice could be improved by including details of sampleweighting procedures, etc. in technical appendices and reporting of standard deviations and sample sizes, allowing the reader to obtain confidenceintervals. It is also recommended that use of more sophisticated statistical analysis (paired tests for means, regression analysis) can improverobustness of findings, but it is stated that the simpler methods that havebeen used yield the same conclusion in the South Perth case reviewed.
9.31 O’Fallon and Sullivan (2003) have concern with respect to inadequatesample sizes and failure to report sampling errors (and hence confidenceintervals), leading to uncertainty about the reliability of results. They alsosuggest that composition of samples may be biased towards thoseinterested in participating in PTP. Stopher (2005) contends that ‘theevaluations … are indicative of the effects … but cannot be consideredto provide reliable information on the overall levels of travel behaviourchange that can be achieved’. His main concerns relates to lack ofcontrol groups, too small sample sizes and over-reliance on results from self-completion travel diaries. It is suggested that sustainability of changes needs to be investigated and that ‘evaluation should beperformed by disinterested third party’.
9.32 Despite concluding that there is ‘…little further need to undertake majorevaluations of household projects, as…data is in broad agreement’ (AGO,2006) considers that there have been ‘misunderstandings of statisticalmethods used to interpret results, and hence problems in the samplesizes, sampling methods and evaluation periods employed’. It also notesthe problem of self-selection in surveys. It recommends development ofa common framework across Australian States for ‘gathering, analyzingand reporting data’ on travel behaviour. It is considered this will assist inlong-term monitoring, especially with regards to vehicle mileage andcarbon emissions. As regards methods, the report suggests paper-basedtravel diaries (one- or two-day trip diaries) are used for small-scale pilotsand GPS for large-scale pilots with the use of odometer readings totriangulate findings.116
Department for Transport | Making Personal Travel Planning Work
9.33 In reviewing UK case studies Cairns et al. (2004) comment onevaluations noting that ‘the complexity of the processes and adjustmentsinvolved; the fact that those advocating the initiatives are sometimes alsoresponsible for monitoring them … has led to a lack of confidence inconclusions amongst some professionals’. They consider that futureopportunities should be seized by suggesting that ‘monitoring of planned large-scale projects…as part of the DfT’s Sustainable TravelDemonstration Towns project may help to provide more convincingevidence about the effects of such schemes. It is also important thatsuch monitoring is seen to be independent and transparent.’
9.34 Following the review of DfT-funded pilot PTP projects, an evaluationframework was prepared by the ORU (DfT, 2005; Annex B) for use infuture projects. It ‘lists the key components, defines them, states at whatstage of the project they should be considered, and provides furtherdetail and explanation to assist with implementing each component’. The components are:
• define aims and objectives;
• choose the target population (stated to be entire group whosebehaviour is trying to be changed);
• select the experiment group;
• select the control group;
• choose the incentives;
• specify the intervention period (stated that impact should beassessed immediately before and after intervention and some monthsafter intervention);
• carry out the ‘before’ survey;
• carry out the ‘after’ survey (stated that same questionnaire should be used as ‘before’ survey);
• analyse the results (stated that this should recognise control groupimpact and seasonal factors)
9.35 Separate guidance is given on travel behaviour surveys. It is suggestedthese should gather information on trips during last week, includingpurpose, mode used and distance travelled. It should also seekperceptions of different modes of transport. It is suggested that thoseoffered opportunity but not participating in PTP should be included insurvey. A sample size from the target population of approximately 400valid responses is recommended.
9.36 Fujii and Taniguchi (2006) have noted that ‘some researchers haveascribed all the TFP effectiveness to the possibility that TFP participantswere mainly ‘aspiring environmentalists’ who were already very likely togive up their cars’. They dismiss this by noting that where all householdshave been successfully contacted in an area similar results have beenobtained. For evaluation Fujii and Taniguchi (2006) emphasise theimportance of randomised control groups, the collection of process
117
| 9. Objective 5: Evaluation
measures (e.g. attitudes) as well as effects measures (e.g. behaviour) andfor large-scale projects the use of aggregate-level data. Meta-analysis(as conducted by the authors for Japan) is put forward as a method forassessing generalisability of PTP impacts.
9.37 Some recent work has built on reviews of PTP evaluations to studyevaluation issues in detail. Stopher and Greaves (2007) outline statisticalmethods to determine sample sizes required to measure impacts ofintervention from before-and-after data (panel or independent cross-sections). This is based on specifying confidence interval and level ofstatistical significance expected and making estimates for variance(before and after) and covariance. Calculations illustrate how panelsurvey and use of two-day data instead of one-day data reduce samplesize requirement.
9.38 Stopher, Swann and Bertoia (2006) have been involved in an independentevaluation of two pilot PTP projects in New South Wales that has soughtto address identified issues of concern in previous evaluations. Theyinvestigated the ‘before’ and ‘after’ data to see if statistically significantdifferences in travel behaviour could be measured with 95% confidencelevel. The evaluation involved two-wave panel survey with target groupsdivided into participating and non-participating households, and withcontrol groups from different geographic areas. The survey instrumentsinvolved a two-day trip diary for each member of household and ahousehold and vehicle information form that collected odometer readingsas well as other information. The paper analyses survey response ratesand survey results for number of trips, mode share of trips and vehiclekilometres travelled. It found that PTP participants significantly reducedvehicle kilometres but with no significant change in mode share.
Current experience from PTP evaluations
9.39 The headline results for travel behaviour outcomes from the case studiesare reported in Chapter 5. In this section some salient details of theevaluations that produced these results are described. It should be notedthat most of the evaluations that have produced extensive results for theimpact of PTP (‘before’ and ‘after’ results) have been conducted bySustrans/Socialdata and adopt a common process, albeit with somedifferences according to circumstances. The New Kontiv® travel surveyhas been used in most cases. The Sustrans/Socialdata process istherefore now described with respect to the components of the ORUevaluation framework.
• Objective – to measure change in mode choice and other keyindicators of personal travel behaviour.
• Target population – all households in project area.
• Experiment group – all households or a random sample ofhouseholds in project area.
• Control group – all households in a nearby area which is selected tobe as similar as possible to target area and subject to sameinfluences apart from intervention.118
Department for Transport | Making Personal Travel Planning Work

• Incentives – these are a feature of the PTP process and are describedin Chapter 5.
• Intervention period – survey typically carried out six months beforeand after intervention. Additional after surveys carried out in Bristol(Bishopsworth) and Bristol (Bishopstone).
• Travel survey – in most cases the ‘before’ and ‘after’ samples areeach drawn randomly from experiment population (and control grouppopulation) without matching the samples (i.e. not panel survey),although panel surveys have been used in Nottingham. Samplesexceeding 300 have usually been achieved. The survey instrument isself-completion paper-based household questionnaire which includesset of individual travel diaries for each household member fornominated day of week. An announcement letter is sent (usually from local authority) followed by survey and two reminder letters and reminder telephone calls (which also offer assistance withcompleting survey).
• Travel analysis – the prime focus of the analysis is to compare theproportion of person trips by mode between the ‘before’ data and‘after’ data. The counterfactual is taken into account by applying thecontrol group trend to the ‘before’ data and comparing the adjusted‘before’ data result to the ‘after’ data result. This is the result usuallyreported, although in some projects the measured (unadjusted) resultis also reported. In some evaluations a statistical inference (based on independent samples) is conducted to test for difference inproportion of total car driver trips before and after PTP intervention.Statistical significance levels have been reported but sampling errorsand confidence intervals have not been reported. Results are alsoreported from the data for changes in:
• daily personal mobility (number of activities, total travel time,number of trips, distance);
• purposes of travel;
• car usage (used during day, trips, duration, distance, occupancy);
• changes in mode choice by time of day, age/gender and travelpurpose;
• time spent travelling by different modes;
• annual number of trips by mode;
• annual car kilometres travelled (note that trips over 100 kilometresare excluded from distance analysis, with reason given that theycould skew results).
9.40 The evaluation process used by Sustrans/Socialdata does not differsignificantly from that set out in the ORU evaluation framework. The NewKontiv® travel survey applies to one day only (travel during past week ismentioned in ORU evaluation framework) and does not include questionsabout perceptions of travel modes.
119
| 9. Objective 5: Evaluation

9.41 Specific relevant details of the case study evaluations are set out in Table 9.2.
120
Department for Transport | Making Personal Travel Planning Work
Table 9.2: Case study evaluations
Bristol BishopsworthSept 2002
May 2002 (b)March 2003 (a)Partial matched (panel) samples Control group inadjacent area
New KontivHouseholds with phone details onlyTarget b/a samples = 378/321(rr = 70%/69%)Control b/a samples = 484/342 (rr = 72%/67%)
Weighting to match distribution ofsegments.Mode share car driver tripsreported as 45–42%. Note: a different method of takinginto account counterfactual hasbeen used in this case than inother evaluations. We havecarried out a new calculationwhich is consistent with themethod usually used inSustrans/Socialdata evaluations.This indicates mode share cardriver trips 44–43% (45–43%w/out control trend).
Bristol BishopsworthSept 2002 (PTP plus busimprovement)
May 2002May/June 2004Partial matched (panel)samplesControl group inadjacent area
New KontivHouseholds with phone details onlyTarget b/a samples = 378/363(rr = 70%/76%)Control b/a samples = 484/313 (rr = 72%/70%)
Weighting to match distribution ofsegments.Mode share car driver trips45–40% (45–40% with busimprovement)Car driver trips reduction -9% (-10% with bus improvements)Car distance reduction -8%.Confidence level of 90% formode share change.Note: In the evaluation for thiscase the counterfactual has beencalculated based on change intravel behaviour for control areabetween first after survey andsecond after survey. To isolate PTPimpact from background trends(including bus improvement) thecounterfactual would normallyhave been calculated based onchange in travel behaviour changebetween before survey andsecond after survey.
Bristol HartcliffeOct–Nov 2003(PTP plus busimprovement)
March 2003May/June 2004Independent samples Control group inadjacent area
New KontivHouseholds with phone details onlyTarget b/a samples = 374/332(rr = 61%/66%)Control b/a samples = 342/313 (rr = 67%/70%)
Weighting to match distribution ofsegments.Mode share car driver trips45–40% (45–40% with busimprovement).Car driver trips reduction -12%(-10% with bus improvements).Car distance reduction -11%.Confidence level of 90% formode share change.
Bristol Bishopston Apr–Jun 2003
March/April 2003Sept/Oct 2003Partial matched (panel)samplesControl group inadjacent area
New KontivHouseholds with phone details onlyTarget b/a samples = 456/450(rr = 71%/78%)Control b/a samples = 448/415 (rr = 74%/73%)
Weighting to match distribution ofsegments.Mode share car driver trips37–34% (37–34% w/out controltrend).Car driver trips reduction -10%.
ProjectSurvey approach andcontrol groups Sampling and survey design Survey analysis and other data
Sustrans/Socialdata evaluations
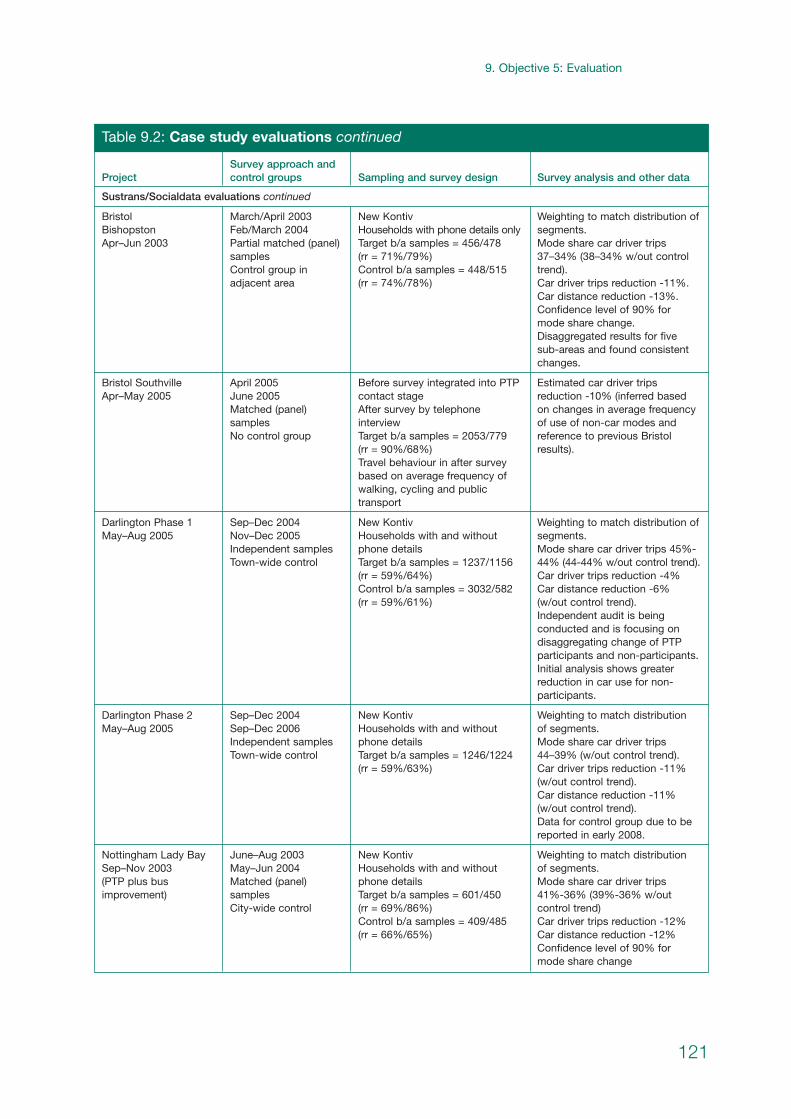
121
| 9. Objective 5: Evaluation
Table 9.2: Case study evaluations continued
Bristol Bishopston Apr–Jun 2003
March/April 2003Feb/March 2004Partial matched (panel)samplesControl group inadjacent area
New KontivHouseholds with phone details onlyTarget b/a samples = 456/478(rr = 71%/79%)Control b/a samples = 448/515 (rr = 74%/78%)
Weighting to match distribution ofsegments.Mode share car driver trips37–34% (38–34% w/out controltrend).Car driver trips reduction -11%.Car distance reduction -13%.Confidence level of 90% formode share change.Disaggregated results for fivesub-areas and found consistentchanges.
Bristol SouthvilleApr–May 2005
April 2005June 2005Matched (panel)samplesNo control group
Before survey integrated into PTPcontact stageAfter survey by telephoneinterviewTarget b/a samples = 2053/779 (rr = 90%/68%)Travel behaviour in after surveybased on average frequency ofwalking, cycling and publictransport
Estimated car driver tripsreduction -10% (inferred basedon changes in average frequencyof use of non-car modes andreference to previous Bristolresults).
Darlington Phase 1May–Aug 2005
Sep–Dec 2004Nov–Dec 2005Independent samplesTown-wide control
New KontivHouseholds with and withoutphone detailsTarget b/a samples = 1237/1156(rr = 59%/64%)Control b/a samples = 3032/582 (rr = 59%/61%)
Weighting to match distribution ofsegments.Mode share car driver trips 45%-44% (44-44% w/out control trend).Car driver trips reduction -4%Car distance reduction -6%(w/out control trend).Independent audit is beingconducted and is focusing ondisaggregating change of PTPparticipants and non-participants.Initial analysis shows greaterreduction in car use for non-participants.
Darlington Phase 2 May–Aug 2005
Sep–Dec 2004Sep–Dec 2006Independent samplesTown-wide control
New KontivHouseholds with and withoutphone detailsTarget b/a samples = 1246/1224(rr = 59%/63%)
Weighting to match distribution of segments.Mode share car driver trips44–39% (w/out control trend).Car driver trips reduction -11%(w/out control trend).Car distance reduction -11%(w/out control trend).Data for control group due to bereported in early 2008.
Nottingham Lady Bay Sep–Nov 2003(PTP plus busimprovement)
June–Aug 2003May–Jun 2004Matched (panel)samplesCity-wide control
New KontivHouseholds with and withoutphone detailsTarget b/a samples = 601/450(rr = 69%/86%)Control b/a samples = 409/485 (rr = 66%/65%)
Weighting to match distribution of segments.Mode share car driver trips 41%-36% (39%-36% w/outcontrol trend)Car driver trips reduction -12% Car distance reduction -12% Confidence level of 90% formode share change
ProjectSurvey approach andcontrol groups Sampling and survey design Survey analysis and other data
Sustrans/Socialdata evaluations continued
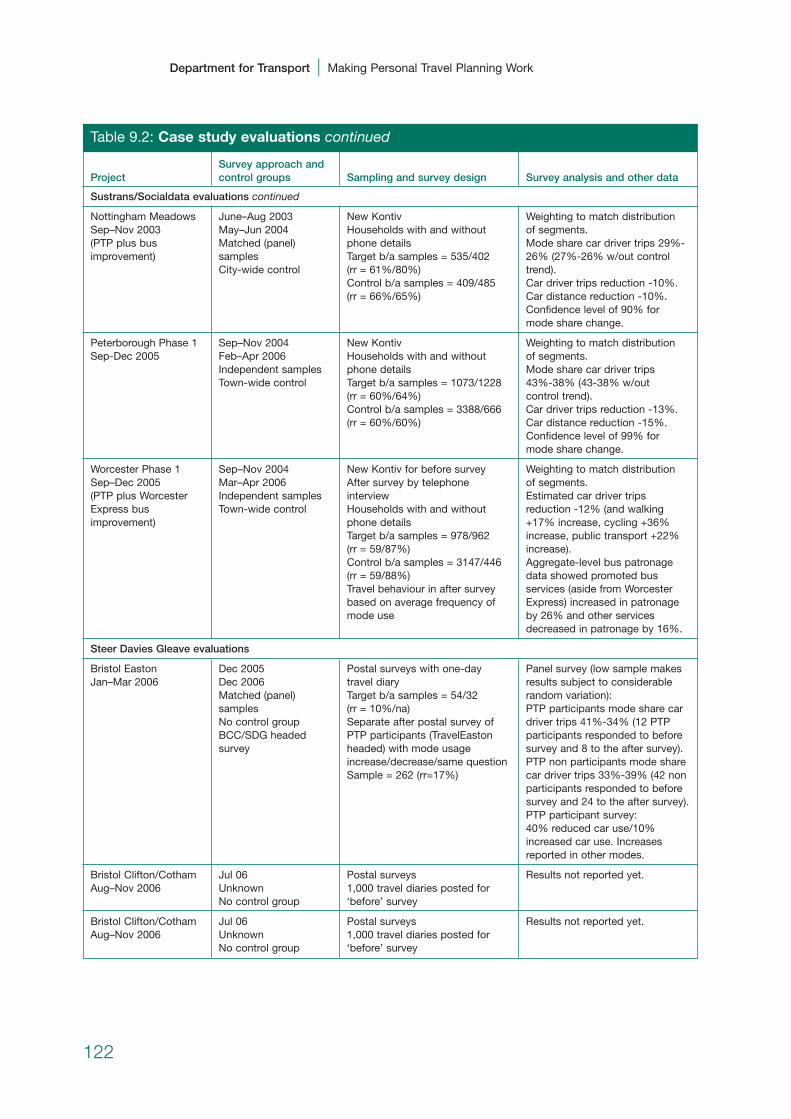
122
Department for Transport | Making Personal Travel Planning Work
Table 9.2: Case study evaluations continued
Nottingham Meadows Sep–Nov 2003(PTP plus busimprovement)
June–Aug 2003May–Jun 2004Matched (panel)samplesCity-wide control
New KontivHouseholds with and withoutphone detailsTarget b/a samples = 535/402(rr = 61%/80%)Control b/a samples = 409/485 (rr = 66%/65%)
Weighting to match distribution of segments.Mode share car driver trips 29%-26% (27%-26% w/out controltrend).Car driver trips reduction -10%.Car distance reduction -10%.Confidence level of 90% formode share change.
Peterborough Phase 1 Sep-Dec 2005
Sep–Nov 2004Feb–Apr 2006Independent samplesTown-wide control
New KontivHouseholds with and withoutphone detailsTarget b/a samples = 1073/1228(rr = 60%/64%)Control b/a samples = 3388/666 (rr = 60%/60%)
Weighting to match distribution of segments.Mode share car driver trips 43%-38% (43-38% w/out control trend).Car driver trips reduction -13%. Car distance reduction -15%. Confidence level of 99% formode share change.
Worcester Phase 1 Sep–Dec 2005(PTP plus WorcesterExpress busimprovement)
Sep–Nov 2004Mar–Apr 2006Independent samplesTown-wide control
New Kontiv for before surveyAfter survey by telephoneinterviewHouseholds with and withoutphone detailsTarget b/a samples = 978/962(rr = 59/87%)Control b/a samples = 3147/446 (rr = 59/88%)Travel behaviour in after surveybased on average frequency ofmode use
Weighting to match distribution of segments.Estimated car driver tripsreduction -12% (and walking+17% increase, cycling +36%increase, public transport +22%increase).Aggregate-level bus patronagedata showed promoted busservices (aside from WorcesterExpress) increased in patronageby 26% and other servicesdecreased in patronage by 16%.
Bristol EastonJan–Mar 2006
Dec 2005Dec 2006Matched (panel)samplesNo control groupBCC/SDG headedsurvey
Postal surveys with one-daytravel diaryTarget b/a samples = 54/32 (rr = 10%/na) Separate after postal survey ofPTP participants (TravelEastonheaded) with mode usageincrease/decrease/same questionSample = 262 (rr=17%)
Panel survey (low sample makesresults subject to considerablerandom variation): PTP participants mode share cardriver trips 41%-34% (12 PTPparticipants responded to beforesurvey and 8 to the after survey).PTP non participants mode sharecar driver trips 33%-39% (42 nonparticipants responded to beforesurvey and 24 to the after survey).PTP participant survey:40% reduced car use/10%increased car use. Increasesreported in other modes.
Bristol Clifton/CothamAug–Nov 2006
Jul 06UnknownNo control group
Postal surveys1,000 travel diaries posted for‘before’ survey
Results not reported yet.
Bristol Clifton/CothamAug–Nov 2006
Jul 06UnknownNo control group
Postal surveys1,000 travel diaries posted for‘before’ survey
Results not reported yet.
ProjectSurvey approach andcontrol groups Sampling and survey design Survey analysis and other data
Sustrans/Socialdata evaluations continued
Steer Davies Gleave evaluations

9.42 Comments that can be made from Table 9.2 are the following:
• Survey response rates are exceptionally high, particularly for Sustrans/Socialdata surveys, and this is a key strength of the evaluation processes adopted. Note: despite this, a concern is always likely to remain thatsampling bias due to ‘self-selection’ affects results and therefore efforts should be made to compare characteristics of survey respondents toarea population characteristics (using census data) and to corroborate survey findings through other data (aggregate-level data).
• Pre-analysis weighting of samples has been conducted to enable matching of distribution of PTP segment groups with experiment population.Information has not been provided in evaluation reports on theweighting process, and it would aid transparency if this was provided.
• Results are usually reported for changes in behaviour attributed toPTP projects taking into account counterfactual (control group trend),rather than the measured changes in behaviour (for the experimentgroup). Implications of this are discussed in Chapter 5.
• There is a general absence of disaggregation of results by participation segments within the UK evaluation reports, which would assist inexamining differences in behavioural change for those householdsengaging in PTP and those not. This is a focus for investigation of the independent auditor of the Darlington Phase 1 evaluation.
• Hypothesis testing has been conducted on the difference in theproportion of trips made in the target area that are car driver in the‘before’ and ‘after’ surveys. For this measurement indicator, it isuncertain what is the appropriate sample size that should be used for statistical tests (neither number of persons or number of trips isstrictly appropriate). Hence a preferable alternative would be toconduct statistical tests on household or person daily car trips or 123
| 9. Objective 5: Evaluation
Table 9.2: Case study evaluations continued
BrightonPTP Jun–Oct 2006
Mar/April 2006Before Nov 2006
Before doorstep surveys withone-day travel diary1,968 households participated in‘before’ surveyNo information on samplingprocedure, contact rate, etc. After doorstep survey with about2,000 households
Only headline evaluation resultsavailable from analysis. Mode share car driver trips 54%-50% (assumed to be w/out anycontrol trend taken into account). Car driver trips reduction -6%(assumed to be w/out any controltrend taken into account). Purposive sample of 25 personsinterviewed after PTP to gainqualitative insights.
London Camden Panel surveyControl group
Telephone surveySeeking samples of 500 for targetand control groupsQuestions about monthlyfrequency of use of modes
Survey not conducted yet
ProjectSurvey approach andcontrol groups Sampling and survey design Survey analysis and other data
Social Research Associates evaluations
Synovate evaluations
Key: b = before survey, a = after survey, rr = response rate, hh = household
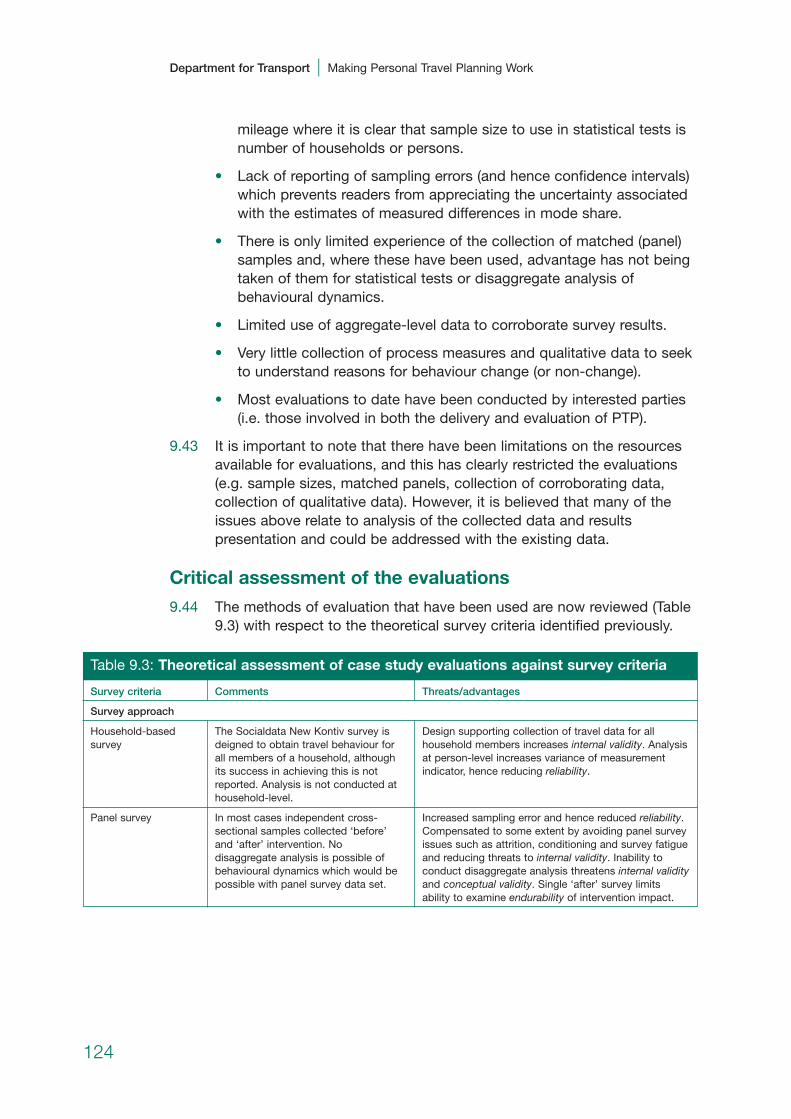
mileage where it is clear that sample size to use in statistical tests isnumber of households or persons.
• Lack of reporting of sampling errors (and hence confidence intervals)which prevents readers from appreciating the uncertainty associatedwith the estimates of measured differences in mode share.
• There is only limited experience of the collection of matched (panel)samples and, where these have been used, advantage has not beingtaken of them for statistical tests or disaggregate analysis ofbehavioural dynamics.
• Limited use of aggregate-level data to corroborate survey results.
• Very little collection of process measures and qualitative data to seekto understand reasons for behaviour change (or non-change).
• Most evaluations to date have been conducted by interested parties(i.e. those involved in both the delivery and evaluation of PTP).
9.43 It is important to note that there have been limitations on the resourcesavailable for evaluations, and this has clearly restricted the evaluations(e.g. sample sizes, matched panels, collection of corroborating data,collection of qualitative data). However, it is believed that many of theissues above relate to analysis of the collected data and resultspresentation and could be addressed with the existing data.
Critical assessment of the evaluations
9.44 The methods of evaluation that have been used are now reviewed (Table9.3) with respect to the theoretical survey criteria identified previously.
124
Department for Transport | Making Personal Travel Planning Work
Table 9.3: Theoretical assessment of case study evaluations against survey criteria
Survey criteria Comments Threats/advantages
Household-basedsurvey
The Socialdata New Kontiv survey isdeigned to obtain travel behaviour forall members of a household, althoughits success in achieving this is notreported. Analysis is not conducted athousehold-level.
Design supporting collection of travel data for allhousehold members increases internal validity. Analysisat person-level increases variance of measurementindicator, hence reducing reliability.
Panel survey In most cases independent cross-sectional samples collected ‘before’and ‘after’ intervention. Nodisaggregate analysis is possible ofbehavioural dynamics which would bepossible with panel survey data set.
Increased sampling error and hence reduced reliability.Compensated to some extent by avoiding panel surveyissues such as attrition, conditioning and survey fatigueand reducing threats to internal validity. Inability toconduct disaggregate analysis threatens internal validityand conceptual validity. Single ‘after’ survey limitsability to examine endurability of intervention impact.
Survey approach
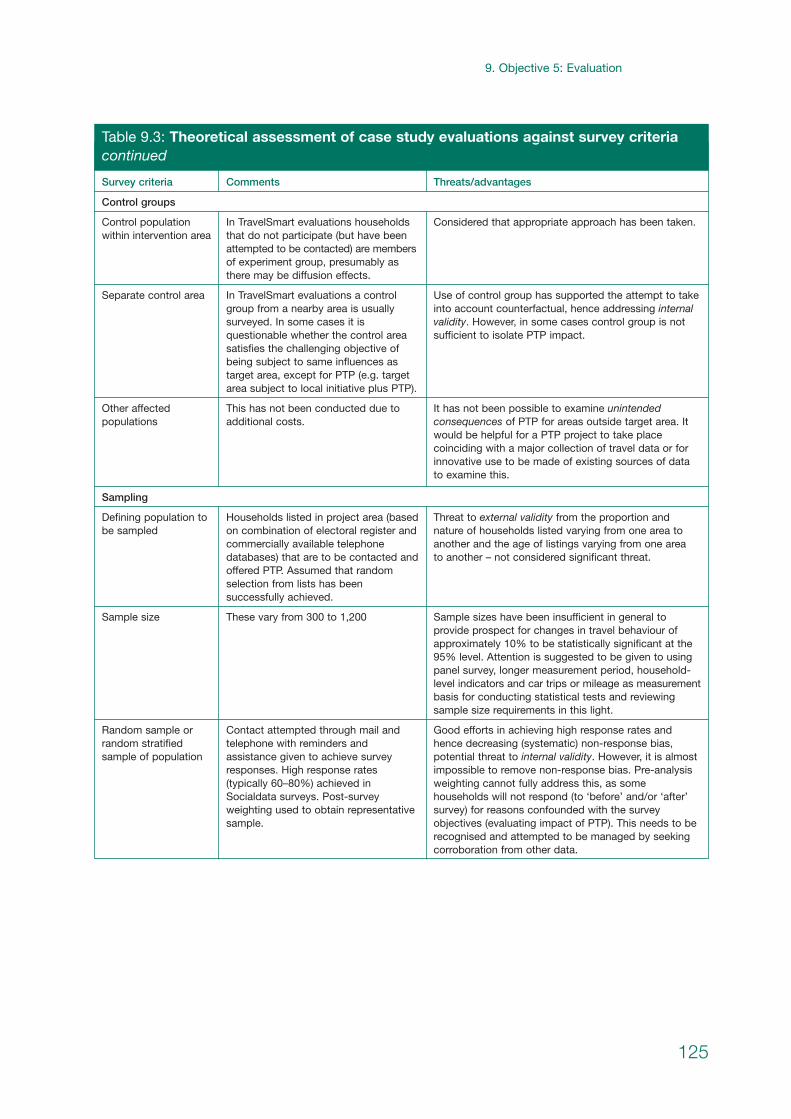
125
| 9. Objective 5: Evaluation
Control populationwithin intervention area
In TravelSmart evaluations householdsthat do not participate (but have beenattempted to be contacted) are membersof experiment group, presumably asthere may be diffusion effects.
Considered that appropriate approach has been taken.
Separate control area In TravelSmart evaluations a controlgroup from a nearby area is usuallysurveyed. In some cases it isquestionable whether the control areasatisfies the challenging objective ofbeing subject to same influences astarget area, except for PTP (e.g. targetarea subject to local initiative plus PTP).
Use of control group has supported the attempt to takeinto account counterfactual, hence addressing internalvalidity. However, in some cases control group is notsufficient to isolate PTP impact.
Other affectedpopulations
This has not been conducted due toadditional costs.
It has not been possible to examine unintendedconsequences of PTP for areas outside target area. Itwould be helpful for a PTP project to take placecoinciding with a major collection of travel data or forinnovative use to be made of existing sources of datato examine this.
Control groups
Table 9.3: Theoretical assessment of case study evaluations against survey criteriacontinued
Survey criteria Comments Threats/advantages
Defining population tobe sampled
Households listed in project area (basedon combination of electoral register andcommercially available telephonedatabases) that are to be contacted andoffered PTP. Assumed that randomselection from lists has beensuccessfully achieved.
Threat to external validity from the proportion andnature of households listed varying from one area toanother and the age of listings varying from one area to another – not considered significant threat.
Sample size These vary from 300 to 1,200 Sample sizes have been insufficient in general toprovide prospect for changes in travel behaviour ofapproximately 10% to be statistically significant at the95% level. Attention is suggested to be given to usingpanel survey, longer measurement period, household-level indicators and car trips or mileage as measurement basis for conducting statistical tests and reviewingsample size requirements in this light.
Random sample orrandom stratifiedsample of population
Contact attempted through mail andtelephone with reminders andassistance given to achieve surveyresponses. High response rates(typically 60–80%) achieved inSocialdata surveys. Post-surveyweighting used to obtain representativesample.
Good efforts in achieving high response rates andhence decreasing (systematic) non-response bias,potential threat to internal validity. However, it is almostimpossible to remove non-response bias. Pre-analysisweighting cannot fully address this, as somehouseholds will not respond (to ‘before’ and/or ‘after’survey) for reasons confounded with the surveyobjectives (evaluating impact of PTP). This needs to berecognised and attempted to be managed by seekingcorroboration from other data.
Sampling
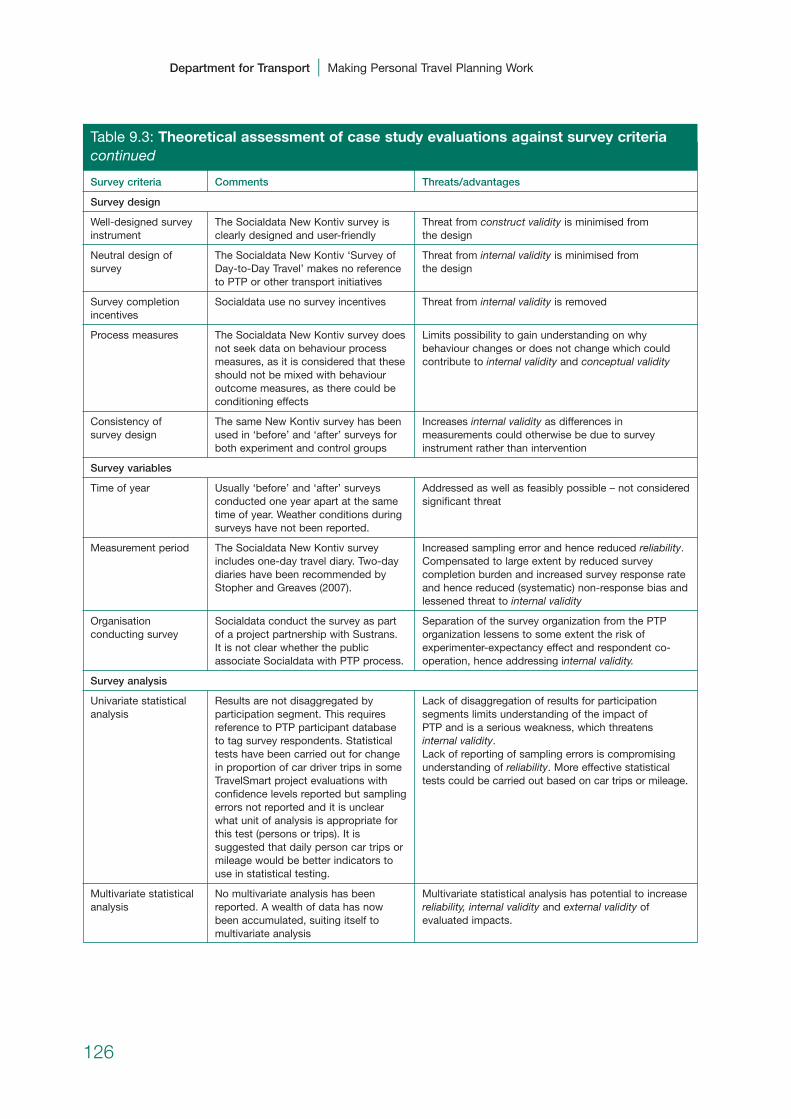
126
Department for Transport | Making Personal Travel Planning Work
Table 9.3: Theoretical assessment of case study evaluations against survey criteriacontinued
Survey criteria Comments Threats/advantages
Univariate statisticalanalysis
Results are not disaggregated byparticipation segment. This requiresreference to PTP participant databaseto tag survey respondents. Statisticaltests have been carried out for changein proportion of car driver trips in someTravelSmart project evaluations withconfidence levels reported but samplingerrors not reported and it is unclearwhat unit of analysis is appropriate forthis test (persons or trips). It issuggested that daily person car trips ormileage would be better indicators touse in statistical testing.
Lack of disaggregation of results for participationsegments limits understanding of the impact of PTP and is a serious weakness, which threatensinternal validity. Lack of reporting of sampling errors is compromisingunderstanding of reliability. More effective statisticaltests could be carried out based on car trips or mileage.
Multivariate statisticalanalysis
No multivariate analysis has beenreported. A wealth of data has nowbeen accumulated, suiting itself tomultivariate analysis
Multivariate statistical analysis has potential to increasereliability, internal validity and external validity ofevaluated impacts.
Survey analysis
Well-designed surveyinstrument
The Socialdata New Kontiv survey isclearly designed and user-friendly
Threat from construct validity is minimised from the design
Neutral design ofsurvey
The Socialdata New Kontiv ‘Survey ofDay-to-Day Travel’ makes no referenceto PTP or other transport initiatives
Threat from internal validity is minimised from the design
Survey completionincentives
Socialdata use no survey incentives Threat from internal validity is removed
Process measures The Socialdata New Kontiv survey doesnot seek data on behaviour processmeasures, as it is considered that theseshould not be mixed with behaviouroutcome measures, as there could beconditioning effects
Limits possibility to gain understanding on whybehaviour changes or does not change which couldcontribute to internal validity and conceptual validity
Consistency of survey design
The same New Kontiv survey has beenused in ‘before’ and ‘after’ surveys forboth experiment and control groups
Increases internal validity as differences inmeasurements could otherwise be due to surveyinstrument rather than intervention
Time of year Usually ‘before’ and ‘after’ surveysconducted one year apart at the sametime of year. Weather conditions duringsurveys have not been reported.
Addressed as well as feasibly possible – not consideredsignificant threat
Survey design
Measurement period The Socialdata New Kontiv surveyincludes one-day travel diary. Two-daydiaries have been recommended byStopher and Greaves (2007).
Increased sampling error and hence reduced reliability.Compensated to large extent by reduced surveycompletion burden and increased survey response rateand hence reduced (systematic) non-response bias andlessened threat to internal validity
Organisationconducting survey
Socialdata conduct the survey as partof a project partnership with Sustrans. It is not clear whether the publicassociate Socialdata with PTP process.
Separation of the survey organization from the PTPorganization lessens to some extent the risk ofexperimenter-expectancy effect and respondent co-operation, hence addressing internal validity.
Survey variables

Recommendations on future evaluation needs
9.45 An immediate priority is for further analysis of existing data sets to beconducted to examine differences in behavioural responses for thosehouseholds/persons engaging in PTP and those not. This is a focus forinvestigation of the independent auditor of the Darlington Phase 1evaluation and promises to provide key evidence for whether it is thePTP intervention that is responsible for reported behavioural change orwhether behavioural change is an artefact of the characteristics of thosepeople that complete the surveys or the way in which they report their behaviour.
9.46 Additionally, further independent analysis of existing data sets could be carried out using car trips and car mileage as the measurementindicators for statistical tests. These indicators are more appropriate for statistical testing. There is also potential for multivariate statisticalanalysis (e.g. regression analysis) to examine factors influencingbehaviour and behaviour change.
9.47 As reported in Chapter 5 (Tables 5.2, 5.3 and 5.4), and summarised inTable 9.2, the impact of the control group can have a large effect on theoverall level of change reported. In addition to the issues discussed inChapter 5, when considering the role of control groups it is important torecognise that the measurement of the effect of other smarter choicesinterventions (e.g. school and workplace travel plans, public transportmarketing) is typically based on simple before/after surveys, with nocontrol group adjustment, and it is considered helpful if practitionerswere able to make direct comparisons between UK smarter choicesinterventions.
9.48 For future PTP evaluations it is therefore recommended to include controlgroups within the evaluation process, and to report the impacts takingthis into account (as it is fully recognised that properly-conducted controlgroups, supported by robust corroborative data, provide a valuableinsight into the magnitude of change associated with PTP). However, thisshould not be at the detriment of reporting the measured effects for thetarget households, which should also be included within all evaluation reports.
127
| 9. Objective 5: Evaluation
External data In a few cases bus passenger data hasbeen available and results have beenconsistent with travel survey results.
There has been limited corroboration attempted oftravel survey results with aggregate-level data, thusthreatening internal validity and measurement ofendurability.
Table 9.3: Theoretical assessment of case study evaluations against survey criteriacontinued
Survey criteria Comments Threats/advantages
Qualitative research This has only been conducted inBrighton.
The lack of qualitative research has limited theopportunity to address internal validity, external validity,conceptual validity and unintended consequences.
Other data
9.49 Further analysis of existing data can help to address some of the issues identified in paragraph 9.42, but it seems likely there will remainoutstanding issues such as endurability of impacts and lack ofunderstanding of the process of behavioural change resulting from PTP. It is recommended therefore that immediate priority is given for in-depthevaluations (for which suitable scale resources are allocated) to becarried out for a small number of PTP projects (these could be currentprojects if suitable ‘before’ data has been collected). This should involvesome of the following characteristics:
• evaluator independent of PTP provider;
• panel survey with multiple ‘after’ periods;
• use of target and control group (with the full reporting of both);
• random samples from target and control group households;
• household-based, postal questionnaire;
• one-day travel diaries or longer-period travel diaries (the latter onlywhere it is possible to provide survey support through survey staffvisits/telephone calls to assist survey completion);
• odometer readings;
• strong survey management protocols based on local travel survey(lTS) guidance or national travel survey;
• qualitative interviews with random sample of experiment group tobetter understand opinions and reactions to PTP and the behaviouralchange process;
• collection of project-area relevant aggregate-level data for publictransport boardings and vehicle and pedestrian counts;
• testing of the use of GPS (either ‘in-vehicle’ and/or ‘personaldevices’) for collecting travel data as an alternative to self-completiontravel surveys.
9.50 Guidance on conducting household travel surveys is provided by LTSguidance issued by DfT (2006), and this provides a good basis forplanning and designing a household survey. Many aspects of the travelsurvey procedures adopted in the PTP projects to date are alsocommended, particularly the survey design and managementprocedures, resulting in high response rates.
128
Department for Transport | Making Personal Travel Planning Work
9.51 If the issues identified in paragraphs 9.42 and 9.49 are able to beaddressed (via further analysis of existing data and independent in-depthevaluations of project(s)), then, for most future projects, a morepragmatic, limited ‘light touch’ evaluation is likely to be warranted. Area-wide travel surveys can only provide reliable and valid results whensufficient attention is paid to aspects such as achieving good responserates, so it is suggested these are best deployed when sufficientresources are available for conducting them. Where this is not feasible,emphasis should be placed on: qualitative interviews with small randomsamples of PTP experiment group which seek information on behaviouralchanges; and on collecting relevant aggregate-level data for the projectarea. These would enable adaptive learning to be undertaken.
Summary
• The key aspects for monitoring and reporting results are to ensurethat:
• measurements are assessing what they are intended tomeasure;
• the intervention actually causes the outcome;
• the result would be repeatable if measured again;
• the results are generalisable to other situations;
• the theoretical explanation for the outcome is supported by the data;
• other relevant outcomes have not occurred which would affectevaluation;
• outcomes are endurable over time;
• there has been consistency in evaluations between differentPTP projects so that results can be compared andsynthesised.
• For large-scale projects, the approach prescribed by the DfT ORUhas been largely applied.
• There is consistency in the reported outcomes from PTP projects,but there are some gaps in information reported and inunderstanding which need to be addressed as a short-termpriority.
• It is recommended that immediate priority is given to in-depthindependent evaluations of a small number of projects whichshould lead to more limited ‘light touch’ evaluations being possiblesubsequently.
129
| 9. Objective 5: Evaluation
10 Objective 6: Long-term sustainability10.1 Most UK PTP projects are still relatively ‘young’ in nature, and as such
are still in the process of undertaking post intervention evaluation.Therefore much of the information relating to long-term sustainability is based upon information collated overseas, notably Australia. Workundertaken in Gloucester provides a UK example of longer-termmonitoring of impacts.
10.2 The issue of sustained monitoring can be complicated, which is mostlydown to costs but also the ability to contact the original people that tookpart in the initial intervention, as populations are changing. Another factor is that any sustained monitoring through corroborative data maybe distorted if major infrastructure or service improvements to publictransport have been completed in a local area subsequent to a PTP intervention.
UK evidence
10.3 An examination of the UK evidence relies on evidence sourced fromGloucester. Figure 10.1 illustrates travel behaviour change that has beensustained from the Gloucester pilot project undertaken in 2001 with arandom sample of 500 people in the area of Quedgeley. A control groupwas used to compare the behaviour and results of the sample group.
10.4 Figure 10.1 illustrates how the percentage of trips per person bytransport mode of the participants, over a period of two years, comparesto the control group results. The percentage figures for walking are stillhigher than the control group figures, as are the percentage figures forcycling and public transport. The increase in percentage of publictransport trips has been sustained, as has the reductions in thepercentage of car as driver trips.
130

Overseas experience
10.5 Figure 10.2 show the mode choice of South Perth residents two and ahalf years after the PTP intervention. The results are encouraging,showing that, whilst the number of trips people make each day has notchanged, the use of more sustainable modes of transport has increased.
Figure 10.1: Gloucester long-term behavioural changes
0 Without
PTP With PTP –
Feb 02With PTP –
Oct 03 With PTP –
Mar 04
5
10
15
20
25
30
35
40
45
50
Gloucester pilot – long term changes
Per
cent
age
WalkingCycling
MotorbikeCar (driver)
Car (passenger)Public transport
131
| 10. Objective 6: Long-term Sustainability
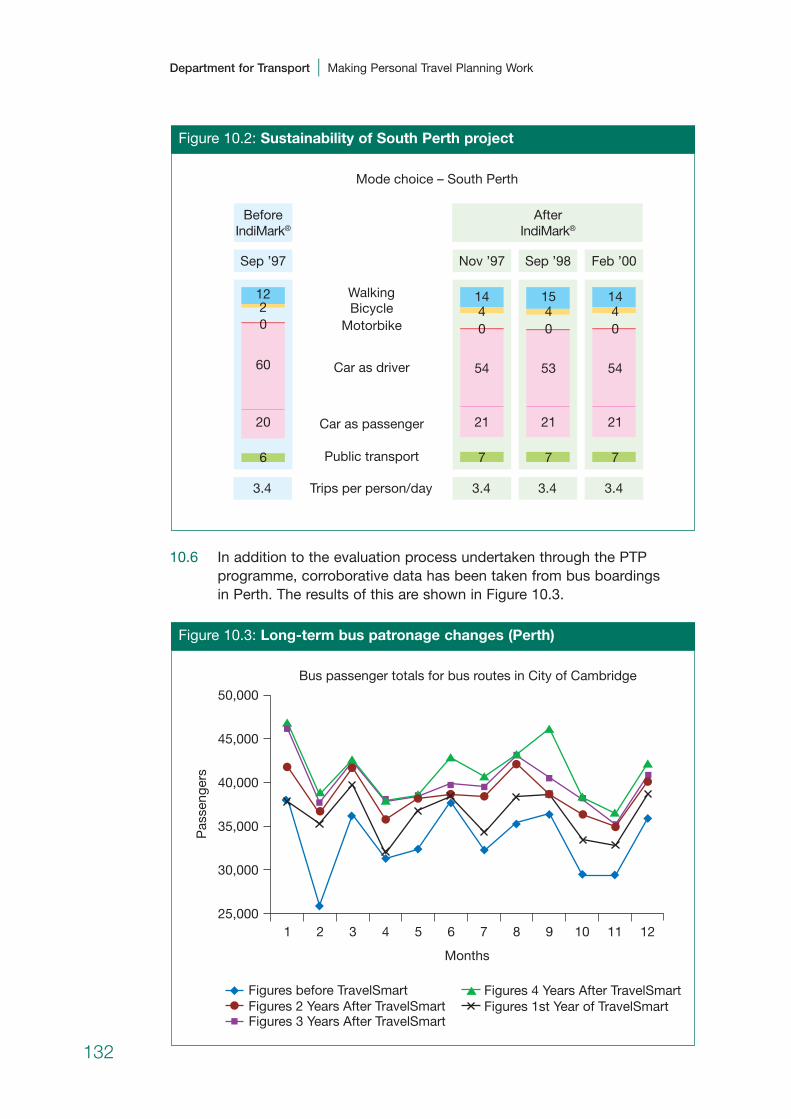
10.6 In addition to the evaluation process undertaken through the PTPprogramme, corroborative data has been taken from bus boardings in Perth. The results of this are shown in Figure 10.3.
Figure 10.3: Long-term bus patronage changes (Perth)
1 2 3 4 5 6 7
Months
8 9 10 11 1225,000
30,000
35,000
40,000
45,000
50,000
Pas
seng
ers
Bus passenger totals for bus routes in City of Cambridge
Figures before TravelSmart Figures 2 Years After TravelSmart
Figures 4 Years After TravelSmartFigures 1st Year of TravelSmart
Figures 3 Years After TravelSmart
Figure 10.2: Sustainability of South Perth project
Sep ’98Nov ’97 Feb ’00
AfterIndiMark®
Walking
Mode choice – South Perth
BicycleMotorbike
Car as driver
Car as passenger
Public transport
Trips per person/day 3.43.4 3.4 3.4
7
21
54
0414
7
21
54
0414
6
20
60
0212
Sep ’97
BeforeIndiMark®
7
21
53
0415
132
Department for Transport | Making Personal Travel Planning Work
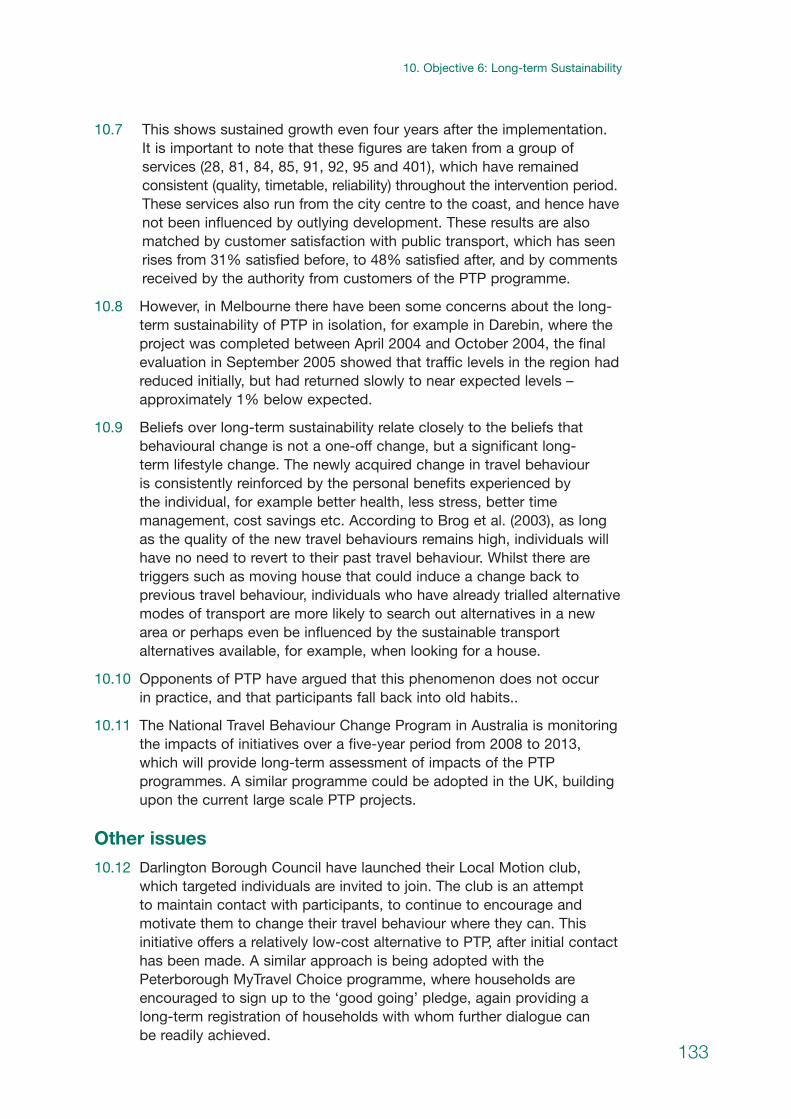
10.7 This shows sustained growth even four years after the implementation. It is important to note that these figures are taken from a group ofservices (28, 81, 84, 85, 91, 92, 95 and 401), which have remainedconsistent (quality, timetable, reliability) throughout the intervention period.These services also run from the city centre to the coast, and hence havenot been influenced by outlying development. These results are alsomatched by customer satisfaction with public transport, which has seenrises from 31% satisfied before, to 48% satisfied after, and by commentsreceived by the authority from customers of the PTP programme.
10.8 However, in Melbourne there have been some concerns about the long-term sustainability of PTP in isolation, for example in Darebin, where theproject was completed between April 2004 and October 2004, the finalevaluation in September 2005 showed that traffic levels in the region hadreduced initially, but had returned slowly to near expected levels –approximately 1% below expected.
10.9 Beliefs over long-term sustainability relate closely to the beliefs thatbehavioural change is not a one-off change, but a significant long-term lifestyle change. The newly acquired change in travel behaviour is consistently reinforced by the personal benefits experienced by the individual, for example better health, less stress, better timemanagement, cost savings etc. According to Brog et al. (2003), as longas the quality of the new travel behaviours remains high, individuals willhave no need to revert to their past travel behaviour. Whilst there aretriggers such as moving house that could induce a change back toprevious travel behaviour, individuals who have already trialled alternativemodes of transport are more likely to search out alternatives in a newarea or perhaps even be influenced by the sustainable transportalternatives available, for example, when looking for a house.
10.10 Opponents of PTP have argued that this phenomenon does not occur in practice, and that participants fall back into old habits..
10.11 The National Travel Behaviour Change Program in Australia is monitoringthe impacts of initiatives over a five-year period from 2008 to 2013,which will provide long-term assessment of impacts of the PTPprogrammes. A similar programme could be adopted in the UK, buildingupon the current large scale PTP projects.
Other issues
10.12 Darlington Borough Council have launched their Local Motion club,which targeted individuals are invited to join. The club is an attempt to maintain contact with participants, to continue to encourage andmotivate them to change their travel behaviour where they can. Thisinitiative offers a relatively low-cost alternative to PTP, after initial contacthas been made. A similar approach is being adopted with thePeterborough MyTravel Choice programme, where households areencouraged to sign up to the ‘good going’ pledge, again providing along-term registration of households with whom further dialogue can be readily achieved.
133
| 10. Objective 6: Long-term Sustainability
10.13 In Nottingham, the long-term contact with individuals is sought throughsubscription to the Citycard smartcard – in effect all recipients of thecard must register either on line or via telephone to activate the card andstart claiming the benefits associated. This provides a powerful directcontact database of willing participants, with whom Nottingham CityCouncil will be able to issue direct electronic updates on publictransport, walk and cycle promotions in the future, along with regularnewsletters on events, activities and promotions.
10.14 In Australia, the concept of the transport café has been developed byBrisbane City Council as a possible alternative delivery mechanism tothe traditional form of PTP – instead of bringing information directly into households (via telephone and mail), a central point of contact wasselected where households regularly visit (i.e. a shopping centre). At this ‘delivery point’, a compressed version of the PTP ‘dialogue’ isundertaken, in conjunction with the distribution of relevant brochures,timetables, maps etc. Bus drivers were also on hand to answer resident’s questions regarding public transport use.
10.15 Comparative evaluation of this delivery mechanism vs PTP indicated a number of issues which need to be addressed if the transport café isto be considered a more robust methodology. This includes:
• the reluctance of some people to engage in a meaningfulconversation about their travel behaviour in this physical environment.The familiarity of the home environment and the ability of people inthis context to consider travel behaviour at their leisure is seeminglyan important aspect;
• the ephemeral nature of the transport café precludes people comingback to ask more questions/resolve issues etc. A feedback telephoneline helped, but at the core of this issue is that the traditional PTPprocess goes on for a reasonable period of time, whereas transportcafés in the two Brisbane applications only went for a couple ofweeks. A longer application time is required;
• some people missed out on the cafés, as they were away or went to the shops outside the times of the café. Hence there is a need fora more intensive presence at the shopping centre during the time ofthe project.
10.16 On the positive side, the transport cafés showed:
• they were much cheaper to deliver;
• they had a very high recognition factor with the public. They werealso highly regarded by the public and did much to boost thecouncil’s image. The shopping centres also regarded them highly and waived the normal fee for using internal space;
• they were highly regarded by local councillors, who used theopportunity to engage with their communities;
134
Department for Transport | Making Personal Travel Planning Work
• they were very popular with people who just wanted generalinformation on walking, cycling and public transport (i.e. not adetailed conversation about personal journey planning).
10.17 An independent evaluation commissioned by the Council showed thatthe traditional form of PTP demonstrated travel behaviour change inaccordance with the expected target for change. Whilst the transportcafé didn’t deliver this quantum of change, it was still a cost-effectivemethod of delivering travel behaviour change and has considerablepotential for growth. Ideally, the transport café could be used as anadjunct to household delivery or as a reinforcing methodology tocommunities who have already engaged in a wider PTP programme.
Summary
• There is only limited evidence on which to assess the long-termsustainability of previous campaigns, and as such it is not possibleto fully ascertain the long-term impacts of PTP interventions.
• The limited evidence that does exist, suggests that travelbehaviour is sustained in the immediate years following theintervention (up to 5 years afterwards), although further work isrequired to fully validate these findings.
135
| 10. Objective 6: Long-term Sustainability
11 Other issues and opportunIties11.1 Throughout the course of the study a number of issues have been
identified, which, though not directly related to the core objectives of the study, are worthy of note. These are set out below.
The profile of PTP and smarter choices
11.2 The work of the DfT’s Operational Research Unit has highlighted the lack of profile (or in some case acknowledgement) of ‘smarter choices’measures, and PTP in particular, within many of the second LocalTransport Plans submitted by all local authorities in March 2006. For PTP to gain a wider subscription this needs to change, and a focusedprogramme of support to local authorities, combined with the publicationof clear and defensible impacts of such measures, must be a priority.
Telephone contact
11.3 Land-line telephone contact is becoming problematic in cities and formobile populations. Increasingly, younger people are choosing a mobile-only phone option. Telephone preference lists are also reducing theproportion of households contactable by phone. In London, TfLabandoned the phone option as the primary contact method for reachinghouseholds – in theory it was believed that 60% of residents would be accessible by phone – the actual phone coverage was 35–40% ofresidents. In the future the development of computer-based phonesystems such as Skype is likely to reduce traditional landline phoneseven further. Once the number of households contactable by phonereaches a certain level, it may not be a practical option for PTP. Thelandline phone system as a marketing tool in other sales areas is anoption that is contracting.
Reliance on paper
11.4 Paper-based PTP approaches for ordering materials and notinghouseholder availability have been identified by a number of practitionersas being potentially wasteful of resources. They reduce the opportunityto make use of all the information that could make the schemes runmore smoothly. One alternative approach would be to make better use of mobile communications (personal digital assistants or mobile laptops).This would clearly require further investment in the process, and wouldneed to be carefully tested to ensure it doesn’t affect the quality ofcontacts with households, restricting the advisors’ ability to engage in a friendly conversation. Historically, successful PTP approaches usehard-copy records at the interface with households, phone and door,combined with a computer database for managing household records.
136

11.5 The benefits of such an approach would be (some of which are alreadyavailable with existing paper-based systems, combined with an efficientmanagement database):
• the materials order can be transferred directly to the database – noinput staff are required. There is then only one place where an error in recording can be made, and that is at the door;
• this could mean that the delivery of packs would be next-day;
• a new contact household list can be produced for the following day,automatically allocating ‘none’ respondents to appropriate time slotson the next day;
• information on household contacts in particular types of area couldbe used to target staff ‘first knocks’ more effectively – for example,flats in area A are more likely to be occupied by single, workingprofessionals who are traditionally contacted at weekends or mid-week evenings;
• each PDA download session and materials order will be attributableto an individual travel advisor– allowing checks to be made onnumber of household visits, successful visits, whether there is anytravel advisor bias in materials ordered, e.g. fewer than averagecycling information requests;
• information can be produced to show ‘best times’ for catchingresidents at home, as each ‘no show’ or ‘conversation’ can be time-allocated;
• monitoring and evaluation information about materials ordered will be registered immediately and future re-ordering of materials can behandled more efficiently.
Future dissemination of information
11.6 Two of the case study sites expressed an interest in consideringalternative methods of disseminating information to households (post-completion of their current projects), making use of existing travelwebsite, online journey planning and electronic timetables.
11.7 Lancashire would like to investigate the idea of diversifying theinformation delivery through the web and using mobile phonetechnology. In the later stages of the current TravelSmart programme,households are being asked to register for a free e-mail update serviceonce they have received their information packs.
11.8 It is, however, important to recognise the importance of engagementwithin the PTP process, and practitioners are generally in agreement thatthis must form an essential component if travel behaviour change is tobe seriously tackled. Further work will be required to identify whetherless-intensive approaches are able to deliver similar levels of long-termbehavioural change, or help sustain changes achieved by more intensive approaches.
137
| 11. Other Issues and Opportunities

Life changes
11.9 Whilst PTP projects have demonstrated effective outcomes based uponarea-wide approaches, there remains a further long-term opportunity topotentially support this work by building upon existing networks andcommunication channels to target people during life-changing moments,when individuals may be most likely to deliberate about travel behaviourand break habits. For example:
• moving house (when you register for Council Tax or the electoralregister) – as developed by Nottingham through closer integrationwith the council search team;
• moving school (crèches, nurseries, primary school year 6, secondaryschool year 11);
• applying for a new job – though links with JobCentre Plus andaccessibility partnerships;
• getting a place at college or university – the student population canbe up to 20% in some university towns, and PTP in this environmenttherefore needs to be a rolling programme and information needs to go out regularly to home locations;
• applicants for an over-60 public transport pass;
• active travel packs and referrals from GPs, leisure centre staff, sports clubs – for concentrated support on cycling and walkingoptions locally;
• when a public transport service improvement reduces travel time on a key route;
• when car parking charges are introduced, or parking charges areincreased, at workplaces or in shopping areas;
• when considering applying for a driving licence – for example,offering PTP advice during the course of driving lessons and/or whenindividuals are required to re-apply for a driving licence. For example,in Kyoto, Japan, drivers seeking to renew a licence are provided withPTP relating to sensible use of the car, and options available forpublic transport for the individual and their trips;
• along routes where a planned temporary or permanent road changeis about to increase travel time for car users with viable alternativepublic transport options.
Business skills within the transport sector
11.10 One of the challenges to PTP is that individuals working in the ‘smarterchoices’ transport sector are generally not trained to produce businesscases and cost–benefit analyses. This is a weakness that needs to berectified if PTP (and other measures associated with the wider ‘smarterchoices’ agenda) is to gain widescale buy-in. Although the best practiceguide accompanying this research report sets out some generic
138
Department for Transport | Making Personal Travel Planning Work
guidance, additional detail or directly delivered advice may also be required to give local authority officers confidence in their actions and decisions.
Home Information Packs
11.11 Any future introduction of Home Information Packs (HIPs) would presenta unique way of accessing new movers, a group that is seen asparticularly amenable to travel behaviour change because of the lack ofestablishment of habitual travel behaviour. In Nottingham, the ‘publictransport team’ work closely with the ‘searches team’ to integrate thesmartcard contact database and ‘searches request’ database to ensurethat all new residents and house movers receive a personal journeyplanner each time they move. TfL also are investigating similar approaches.
Travel cafés
11.12 The Brisbane case study raises the concept of travel cafés as a possiblealternative method of delivering PTP (or supporting future PTP projects).This delivery mechanism serves to provide a central point of contact inan area where households regularly visit, for example a shopping centre.At this ‘delivery point’ a compressed version of the PTP dialogue can beundertaken in conjunction with the distribution of the relevant informationmaterials. Whilst this offers a potentially lower-cost alternative, it doesnot have the ability to extensively cover whole communities (it is limitedto those that seek out the café), and hence may well prove to be moreeffective as a supporting tool, or as a reinforcing tool within previous PTPcommunities.
Links to broader environmental programmes
11.13 Evidence from the London, Perth and Melbourne case studies hashighlighted linkages between PTP and a broader environmental agenda.Evidence from Perth compares PTP average engagement rates withacceptance rates for a similar exercise in energy management. PTPrelating to transport issues has generally achieved around a 50%engagement rate with households (i.e. willing to accept information), with similar exercises for energy management demonstrating acceptancerates of around 80%. This raises the possibility of pooling programmesto ‘piggy back’ on other areas of environmental improvement.
11.14 Further evidence from TfL supports this suggestion. Travel advisors have remarked that, when households realise the purpose of the visit,they often volunteer information about other practices that they employthat relate to a greener lifestyle, for example ‘I recycle’, especially in the Borough of Sutton, which promotes itself as the greenest Londonborough. The residents can see the link between sustainable modes of transport, car usage and the effect on, and linkage with, theenvironmental agenda.
139
| 11. Other Issues and Opportunities

Different message for different parts of the UK
11.15 Evidence from Darlington suggests that people’s values and thereforemotivators for change are different in various parts of the UK. TheDarlington case study raised the issue that using congestion to marketPTP did not suit a town like Darlington, or indeed many areas outside the South East of England, as it is not a particularly tangible problem. InDarlington, the sustainable travel-related messages that respondents aremore responsive to relate to health, cost, quality time with friends andfamily, and the environment. This is indeed in contrast to London, wherecongestion is a serious issue, and in Brighton, where the environmentalfactor is generally limited to a discussion on carbon footprints.
Impacts on LA departments and other staff.
11.16 The recruitment of new local authority staff in Brighton has had a positiveinfluence on existing staff, helping to create a ‘can do’ and ‘push theboundaries’ attitude to transport projects in the city. The integration of information between the Nottingham transport department and thesearches team provides a good example of joined-up thinking andworking within a local authority.
Car sharing
11.17 The evidence collected as part of his study has highlighted that carsharing is often not heavily promoted as part of PTP. The evaluationfindings demonstrate that car sharing generally either decreases (slightly)or remains neutral as a result of PTP interventions.
11.18 Given the strong investment by UK local authorities in area-wide carsharing, and the importance of electronic matching services (demandinghigh subscription to be truly effective), it would appear that greateropportunity could be made of registering potential car sharers during the ‘contact and advice’ stage of PTP projects.
Personal journey plans
11.19 The study has identified a number of cases where personal journey plans(rather than generic local guides) have been provided to households. Ithas not been possible within the study to explore the relative importanceof such approaches (or any additional value that might be accrued). Inorder to cope with the scale of future PTP projects, personal journeyplanners are likely to be only considered feasible if they can be produced(reliably) using an automated system (with some degree of manualvalidation). In Nottingham, personal journey plans have been issued to all households across the city (May 2007, as part of the smartcardimplementation), and the findings of this work (when reported) shouldprovide a valuable insight into the effect of such an approach (on busboardings) when delivered on a city-wide scale. Similarly, in NorthYorkshire, a semi-personalised personal journey planning system hasbeen developed to map the journey to school for individual pupils, which forms an important part of the school travel planning process.
140
Department for Transport | Making Personal Travel Planning Work
11.20 A key issue arising from the use of personal journey planners is the needfor good, reliable automated journey planner systems (for example asdeveloped by Nottingham TripTimes). Future PTP projects could sensiblybe fed by Transport Direct, provided it can be proven to be 100% reliableat the local level (in addition to the local validation issues, further workwould be required to be able to batch-process requests for journeysbased upon origins and destinations arising). It is also likely that someform of manual checking would be required (possibly at the point ofpacking the materials pack) to ensure the route suggested is logical and appropriate.
Smartcards
11.21 The future development of a national system (or at least a greater uptakeat the local level) of bus-based smartcard payments would potentiallyenhance the ability of PTP to improve its offer (for example, making theissuing of free tickets easier to administer). It would also improve theavailability of corroborative data, as individual trip-making behaviourcould be more readily tracked (enabling PTP-influenced trips to be moreaccurately monitored).
Accessibility planning
11.22 Evidence relating to the impact of PTP and levels of accessibility islimited, and the current delivery of accessibility strategies by all UK local authorities could provide a platform for:
• testing the relationship between PTP and accessibility; and
• creating a future PTP project structure that maximises the networksafforded by the accessibility partnerships (or the Local StrategicPartnerships).
Future markets
11.23 During the course of the study, a number of local authorities approachedthe study team seeking information and knowledge on the PTP processto inform their future transport strategy and growth area aspirations. Awell delivered and heavily promoted best practice guide (produced as an outcome of this study), or a retained advisor available ‘on call’ forlocal authority advice, should further stimulate interest, and hence it is suggested that there is likely to be long-term and wide-scale futureopportunities for PTP in the UK.
‘Locking in’ the benefits
11.24 A key challenge for PTP will be to consider how best to ‘lock in’ thebenefits (for example, increasing the physical capacity/priority for pedestrians, cyclists and public transport users in response to measured behaviouralchange). This would ensure that any gains associated with the PTPintervention are captured in the longer term, and that any latent demandfor travel by car (for example resulting from an induced traffic effect)does not erode the benefits gained. This approach was also recommended for consideration by the DfT ‘smarter choices’ research, 2004. 141
| 11. Other Issues and Opportunities

ReferencesAmpt, E., 2003. Understanding voluntary travel behaviour change. In: 26th Australasian Transport Research Forum, Wellington, NZ, 1–3 October.
Ampt, E. M., Wundke, J. and Stopher, P., 2006. Households on the Move: Experience of a new approach to voluntary travel behaviourchange. Institute of Transport and Logistics Studies (working paper),Sydney, Australia.
Anable, J., Lane, B. and Kelay, T., 2006. An evidence base review ofpublic attitudes to climate change and transport behaviour: Final report.DfT, London.
Ashton-Graham, C. and John, G., 2006. TravelSmart householdsprogram: Frequently asked questions in travel demand management and dialogue marketing. Department for Planning and Infrastructure(working paper), Perth, Australia.
Asia-Pacific Environmental Innovation Strategies (APEIS), 2004.Awareness raising for wise use of automobiles by the travel feedbackprogramme in Sapporo. Available athttp://www.iges.or.jp/APEIS/RISPO/inventory/db/pdf/0070.pdf Cited22nd May 2006.
Australian Greenhouse Office, 2005. Evaluation of TravelSmart projects in the ACT, South Australia, Queensland, Victoria and Western Australia:2001–2005. Commonwealth of Australia, Canberra.
Barta, F. and Brög, W., 2007. National demonstration project:Individualized marketing demonstration project. In: TransportationResearch Board Annual Meeting 2007, Paper #07-1627, Washington DC, 21–25 January.
Black, P., (2007). Personalised travel planning: Travel behaviour interviewsfinal report (Brighton and Hove). Brighton and Hove City Council.
Brighton and Hove City Council, (2006). PTP Stage One – Initial dataanalysis report. Research and Consultation Team, Chief ExecutivesOffice, Brighton and Hove City Council.
Brög, W., Erl, E. and Mense, N., 2002. Individualised marketing: changingtravel behaviour for a better environment. In: OECD Workshop:Environmentally Sustainable Transport, Berlin, 5th June.
Brög, W. and Schädler, M., 1999. More passengers, higher profits forpublic transport – (im)possible expectation!? In: 53rd UITP Conference,May 1999, Toronto, Canada.
City of Portland, Office of Transportation, 2006. SmartTrips NortheastHub comprehensive evaluation report. City of Portland Office ofTransportation, Portland, USA.
Cooper, C., 2007. Successfully changing individual travel behaviour:Applying community-based social marketing to travel choice. In:Transportation Research Board Annual Meeting 2007, Paper #07-3098,Washington DC, 21–25 January.
142
Department for Transport, 2005. Personalised travel planning: Evaluationof fourteen pilots part funded by the DfT. Available online athttp://www.dft.gov.uk/pgr/sustainable/travelplans/ptp/personalisedtravelplanningev5 774 Last accessed 30 January 2007.
Department for Transport, 2004. Smarter Choices: Changing the way we travel. DfT, London.
DHC, 2005. Individualised marketing in Merseyside: Final report.Merseytravel, Liverpool.
Fujii, S., 2007. Communication with non-drivers for promoting long-term pro-environmental travel behaviour. Transportation ResearchPart D, 12, 99–102.
Fujii, S. and Taniguchi, A., 2006. Determinants of the effectiveness of travel feedback programs – a review of communicative mobilitymanagement measures for changing travel behaviour in Japan.Transport Policy, 13, 339-348.
Gärling, T. and Fujii, S., 2006. Travel behavior modification: Theories,methods, and programs. In: IATBR conference, Kyoto, Japan, 16–20 August.
Gärling, T., Eek, D., Loukopoulos, P., Fujii, S., Johansson-Stenman, O., Kitamura, R., Pendyala, R. and Vilhelmson, B., 2002. A conceptualanalysis of the impact of travel demand management on private car use. Transport Policy, 9, 59–70.
Gibbons, A., 2007. Youth opportunities card (Nottingham): Testingbarriers to accessing leisure facilities via a transport based Smartcard.Nottingham City Council, Nottigham.
Goulias, K.G., 2001. Audit of South Perth individualized marketingevaluation survey. Western Australia Transport, Perth, Australia.
Harbutt, P. and Meiklejohn, D., 2003. The development of the VictorianTravelSmart Program. In: 26th Australasian Transport Research Forum,Wellington, New Zealand, 1–3 October 2003.
Ker, I., 2003. Travel demand management: Public transport businesscase. Department of Infrastructure, Victoria, Australia.
Ker, I., 2002. Contract report – Preliminary evaluation of financial impactsand outcomes of TravelSmart individualised marketing program – Update.WA Department of Planning and Infrastructure, Perth, Western Australia.
Ker, I. and James, B., 1999. Evaluating behavioural change in transport: acase study of individualised marketing in South Perth, Western Australia.In 23rd Australasian Transport Research Forum, 29 September – 3October, Perth, Western Australia, pp. 703–719.
Jackson, T., 2005. Motivating sustainable consumption. SDRN briefing 1,Policy Studies Institute, London.
Litman, T., 2007. Valuing Transit: Service quality improvement –Considering comfort and convienience in transport project evaluation..Victoria Transport Policy Institute, Victoria, Canada.
Litman, T., 2006. If health matters: Integrating public health objectives in transportation planning. Victoria Transport Policy Institute, Victoria, Canada. 143
| References

Litman, T., 2006. Transportation cost analysis spreadsheet. VictoriaTransport Policy Institute, Victoria, Canada.
Litman, T., 2002. Transportation cost analysis: Techniques, estimates and implications – executive summary. Victoria Transport Policy Institute,Victoria, Canada.
Litman, T., 1999. Evaluating criticism of transport costing. VictoriaTransport Policy Institute, Victoria, Canada.
Litman, T., 1999. Transportation cost analysis: summary. VictoriaTransport Policy Institute, Victoria, Canada.
National Institute for Health and Clinical Excellence, 2006. Transportinterventions promoting safe cycling and walking: Evidence briefing.NHS, London.
National Social Marketing Centre, 2006. Its our health: realising thepotential of effective social marketing. NSMC, London.
Nottingham City Council, 2006. Service 30 Personalised Travel Plan Pilot Project (Draft Results). Nottingham City Council, Nottingham.
Nottingham City Council and Nottinghamshire County Council, 2004.TravelSmart pilot: Greater Nottingham and the Meadows final report.Nottingham City Council and Nottinghamshire County Council,Nottingham.
O’Fallon, C. and Sullivan, C., 2003. Personalised Marketing – Improvingevaluation. Revised version of paper for 26th Australasian TransportResearch Forum, Wellington, New Zealand, 1–3 October 2003.
Ohnishi, K., Shimada, K., Kashimura, G., and Fujii, S. (2007) Mobilitymanagement using an opportunity of a lecture for the drivers to renewtheir driving licenses in Kyoto prefecture, presented at 2nd JapaneseConference On Mobility Management, Sapporo, Japan.
Pbai Australia and Bartley Consulting, 2005. TravelSmart Communitiesproject: Moonee Valley B: Final report. Department of Infrastructure,Melbourne, Australia.
Pinkard, J., Unknown. Facilitating travel behaviour change. VIPRE, Woking.
Queensland Government, 2002. TravelSmart Suburbs Brisbane pilot:Final report of the project manager. Queensland Government, Brisbane, Australia.
Richardson, A.J., 2005. North-Eastern suburbs travel survey (NESTS)2005: After survey procedural results report. The Urban TransportInstitute, Victoria, Australia.
Richardson, A.J., 2003. Temporal variability of car usage as an input to the design of before & after surveys. In: TRB Annual Meeting,Washington, 12–16 January 2003.
Richardson, A.J., Ampt, E.S. and Meyburg, A.H., 1995. Survey methodsfor transport planning. Eucalyptus Press, Australia.
Richardson, A.J., Davis, M.B. and Harbutt, P.L., 2005. Using before andafter household travel surveys to evaluate a TravelSmart program. In: 28thAustralasian Transport Research Forum, Sydney, 28–30 September 2005.
144
Department for Transport | Making Personal Travel Planning Work
Richardson, A.J., Roddis, S., Arblaster, D., Attwood, D. and Newman, J., 2005. The role of trend analysis in the evaluation of a TravelSmartProgram. In: 28th Australasian Transport Research Forum, Sydney, 28–30 September 2005.
Roth, M., Ker, I., James, B., Brög, W., Ashton-Graham, C., Ryle, J.,Goulias, K. and Richardson, E., 2003. A dialogue on individualisedmarketing: addressing misconceptions. In: 26th Australasian TransportResearch Forum, Wellington, 1–3 October.
Seethaler, R., and Rose, G., 2005. Using the six principles of persuasionto promote travel behaviour change: Findings of a TravelSmart pilot test.In: 28th Australasian Transport Research Forum, Sydney, Australia, 28–30 September.
Seethaler, R.K., and Rose G., 2003. Application of psychologicalprinciples to promote travel behaviour change. In: 26th AustralasianTransport Research Forum ATRF, 1–3 October.
Socialdata, 2006. TravelSmart Household Program Perth: Integrated dataevaluation (Workbook). Department for Planning and Infrastructure, Perth, Australia.
Socialdata Australia, 2006. Victorian 2005 TravelSmart communityproject: City of Maribyrnong. Department of Infrastructure, Melbourne, Australia.
Socialdata Australia, 2004. TravelSmart Households Program City ofFremantle (Final Report). Department for Plannning and Infrastructure,Perth, Australia.
Socialdata and Sustrans, 2007. My Travelchoice in Peterborough:Individualised travel marketing programme: Stage 3: Bretton September –December 2006. Peterborough City Council, Peterborough.
Socialdata and Sustrans, 2007. My Travelchoice in Peterborough:Individualised travel marketing programme: Additional report on customersatisfaction (Stage 3: Bretton September – December 2006).Peterborough City Council, Peterborough.
Socialdata and Sustrans, 2006. Worcester Choose how you move ITM programme: Stage 2.1 Field Report Battenhall and Nunnery April –September 2006. Worcestershire County Council, Worcester.
Socialdata and Sustrans, 2006. Interim evaluation of ITM programme(Stage 1). Worcestershire County Council, Worcester.
Socialdata and Sustrans, 2006. Worcester Choose how you move ITMprogramme: Stage 2.2 Field Report St Peters September – November2006. Worcestershire County Council, Worcester.
Socialdata and Sustrans, 2006. Interim evaluation of ITM programme:Stage One. Peterborough City Council, Peterborough.
Socialdata and Sustrans, 2006. My Travelchoice in Peterborough:Individualised travel marketing program – Stage 2: Werrington April – July 2006. Peterborough City Council, Peterborough.
145
| References

Socialdata and Sustrans, 2006. My Travelchoice in Peterborough:Individualised travel marketing programme – Additional report oncustomer satisfaction (Stage 2: Werrington April – July 2006).Peterborough City Council, Peterborough.
Socialdata and Sustrans, 2005. Travel behaviour research baselinesurvey. Worcestershire County Council, Worcester.
Socialdata and Sustrans, Unknown. My Travelchoice in Peterborough:Individualised travel marketing programme stage one field report(executive summary). Socialdata and Sustrans, Bristol.
Socialdata and Sustrans, Unknown. Worcester Choose how you Move: Analysis of bus patronage following stage one of the WorcesterChoose how you Move individualised travel marketing programme.Worcestershire County Council, Worcester.
Steer Davis Gleave, 2007. Personalised travel planning in Haringly:Consultancy support (Revised report). Transport for London, London.
Steer Davis Gleave, 2007. Travel Easton final report. Bristol City Council, Bristol.
Steer Davis Gleave, 2006. Personalised travel planning in Sutton:Consultancy support Transport for London, London.
Steer Davis Gleave, 2006. Personalised travel planning in the RoyalBorough of Kingston upon Thames: Consultancy support report.Transport for London, London.
Steer Davis Gleave, 2006. Travel Clifton Cotham: PTP Interim Report(Draft). Bristol City Council, Bristol.
Steer Davis Gleave, 2006. Travel Easton Interim Report. Bristol CityCouncil, Bristol.
Steer Davis Gleave, 2006. TravelSmart communities Moonee Valley A: Final report. Department of Infrastructure, Melbourne, Australia.
Steer Davis Gleave, 2003. A travel behaviour change tool forcommunities in Victoria: Supplementary reports. Department ofInfrastructure, Melbourne, Australia.
Stopher, P., 2005. Voluntary travel behaviour change. In. Button K. andHensher, D. (Eds), Handbook of Transport Strategy, Policy & Institutions ,Elsevier, pp. 561–579.
Stopher, P. and Bullock, P., 2003. Travel behaviour modification: A criticalappraisal. In: 26th Australasian Transport Research Forum, Wellington,New Zealand, 1–3 October.
Stopher, P., FitzGerald, C. and Biddle, T., 2006. Pilot testing a GPS panelfor evaluating TravelSmart. Institute of Transport and Logistics Studies(Working Paper), University of Sydney, Australia.
Stopher, P., Swann, N. and Bertoia, T., 2006. Evaluation of a pilotTravelSmart program for New South Wales. In: 29th AustralasianTransport Research Forum, Gold Coast, Queensland, Australia, 27–29September 2006.
Sustrans, 2006. TravelSmart: Leading the way in travel behaviour change.Sustrans, London.
146
Department for Transport | Making Personal Travel Planning Work
Sustrans, Unknown. TravelSmart – Leading the way in travel behaviourchange: Information Sheet FF36. Sustrans, Bristol.
Sustrans and Socialdata, 2006. My Travelchoice in Peterborough:Individualised Travel Marketing Programme: Stage one field report.Peterborough City Council, Peterborough.
Sustrans and Socialdata, 2006. My Travelchoice in Peterborough:Individualised Travel Marketing Programme: Additional report oncustomer satisfaction (Stage 1). Peterborough City Council,Peterborough.
Sustrans and Socialdata, 2006. Worcester Choose how you Moveindividualised travel marketing programme: Stage 1 Field report –Warndon. Worcestershire County Council, Worcester.
Sustrans (2006). Economic Appraisal of Local Walking and CyclingRoutes. Methodology. Available from Sustrans website.
Svenson, O., 1990. Some propositions for the classification of decisionssituations. In Borcherding, K., Larichev, O. L., and Messick, D.M., (Eds.).Contemporary issues in decision making. Amsterdam: Elsevier.
Taniguchi, A. and Fujii, S. (2007). Promoting public transport usingmarketing techniques in mobility management and verifying theirquantitative effects. Transportation, 34(1), 37–49.
Taniguchi, A. and Fujii, S., 2007. A process model of voluntary travelbehaviour modification and effects of travel feedback programs. In:Transportation Research Board Annual Meeting 2007 Paper #07-2727,Washington DC, 21–25 January.
Taniguchi, A. and Fujii, S., 2007. Analysis of Effects on WorkplaceMobility Management Targeting Commuter Transport. In: TransportationResearch Board Annual Meeting 2007 Paper #07-2729.
Taniguchi, A., Suzuki, H. and Fujii, S., 2007. Mobility Management inJapan: ITS Development and Meta-Analysis of Travel FeedbackPrograms. In Transportation Research Board Annual Meeting 2007 Paper #07-2657, Washington DC, 21–25 January.
Woodruff, A., Unknown. Darebin Communities Project: Evaluation andresults. Department of Infrastructure, Victoria, Australia.
Evaluation-specific references
AGO (2006). Evaluation of Australian TravelSmart Projects in the ACT,South Australia, Queensland, Victoria and Western Australia 2001–2005.Report to Australia Greenhouse Office, Department of the Environmentand Heritage.
Cairns, S., Sloman, L., Newson, C., Anable, J., Kirkride, A. and Goodwin,P. (2004). Smarter Choices – Changing the Way We Travel. Report to DfT.Available from www.dft.gov.uk on Sustainable Travel Section.
DfT (2005). Personalised travel planning: Evaluation of fourteen pilotspart funded by the DfT. Available online athttp://www.dft.gov.uk/pgr/sustainable/travel plans/ptp/personalisedtravelplanningev5774. Last accessed 11 June 2007.
DfT (2006). LTS Guidance. Local Household Travel Survey (TookitComponent B) v1.0r. Released March 2006. Available at: www.dft.gov.uk 147
| References
DfT (2007). Review of the Take-Up of Smarter Choices in Local TransportPlans. Case Study Findings. Prepared by the Operational Research Unitfor Sustainable Travel Initiatives Branch. Available at: www.dft.gov.uk
Fujii, S. and Taniguchi, A. (2006). Determinants of the effectiveness oftravel feedback programs – a review of communicative mobilitymanagement measures for changing travel behaviour in Japan. TransportPolicy 13, 339–348.
Gärling, T. and Fujii, S. (2006). Travel Behavior Modfication: Theories,Methods and Programs. Resource paper for the IATBR Conference,Kyoto, Japan, August 16–20.
Goulias, K.G., Brög, W.W., James, B. and Graham, C. (2002). Travelbehavior analysis of the South Perth Individualized MarketingIntervention. Transportation Research Record, 1807, 77–86.
O’Fallon, C. and Sullivan, C. (2003). Personalised Marketing – ImprovingEvaluation. Revised version of paper presented at 26th AustralasianTransport Research Forum, 1-3 October 2003, Wellington, New Zealand.
Richardson, A.J., Ampt, E.S. and Meyburg, A.H. (1995). Survey Methodsfor Transport Planning. Eucalyptus, Sydney. Available online athttp://www.transportsurveymethods.com.au/
Richardson, A.J. (2003). Temporal variability of car usage as an input to the design of before and after surveys. Cd-rom Proceedings ofTransportation Research Board 2003 Annual Meeting.
Roth, M., Ker, I., James, B., Brög, W., Ashton-Graham, C., Ryle, J.,Goulias, K. and Richardson, E., 2003. A Dialogue on IndividualisedMarketing: Addressing Misconceptions. Paper presented at 26thAustralasian Transport Research Forum, 1-3 October 2003, Wellington,New Zealand.
Socialdata (2003). Travel Behaviour Change Programme for the City ofSouth Perth under the TravelSmart Program: Technical Appendix. Reportto Department for Planning and Infrastructure.
Stopher, P.R. (2005). Voluntary travel behavior change. In: Handbook ofTransport Strategy, Policy and Institutions (Eds: Button, K.J. and Hensher,D.A.), Elsevier, Amsterdam, pp 561–579.
Stopher, P.R. and Bullock, P. (2003). Travel Behaviour Modification: ACritical Appraisal. Paper presented at 26th Australasian TransportResearch Forum, 1-3 October 2003, Wellington, New Zealand.
Stopher, P., Swann, N. and Bertoia, T. (2006). Evaluation of a PilotTravelSmart Program for New South Wales. Paper presented at 29thAustralasian Transport Research Forum, 2006.
Stopher, P.R. and Greaves, S.P. (2007). Guidelines for samplers:measuring a change in behaviour from before and after surveys.Transportation, 34, 1–16.
Taniguchi, A., Suzuki, H. and Fujii, S. (2007). Mobility Management inJapan: Its development and meta-analysis of travel feedback programs(TFPs). CD-ROM Proceedings of 86th Transportation Research BoardAnnual Meeting 2007.
148
Department for Transport | Making Personal Travel Planning Work
Evaluation-specific references: project reports
Black, P. (2007). Personalised Travel Planning Travel BehaviourInterviews. Final Report. February 2007.
Bonsall, P. (2006). Audit of travel surveys conducted for DarlingtonBorough Council in connection with the Sustainable Travel Initiative. April 2006. Unpublished.
Brighton & Hove City Council (2006). PTP Phase 1 – Initial Data AnalysisReport. June 2006 (revised September 2006).
Steer Davies Gleave (2006). Travel Easton Interim Report. May 2006.
Steer Davies Gleave (2006). Travel Clifton Cotham Interim Report. Draft.November 2006.
Steer Davies Gleave (2007). Travel Easton Final Report. January 2007.
Sustrans/Socialdata (2004). Greater Nottingham TravelSmart (Lady Bayand the Meadows). July 2004.
Sustrans/Socialdata (2004). Bishopstone TravelSmart 2003–04. A reporton the Individualised Marketing project funded through the Departmentfor Transport’s Personalized Travel Planning Demonstration Programme.August 2004.
Sustrans/Socialdata (2004). TravelSmart Bristol (Southville, Bedminster,Windmill Hill). A Report on Bristol’s third VIVALDI Individualised TravelMarketing Project. August 2004.
Sustrans/Socialdata (2005). Darlington: Sustainable Travel DemonstrationTown. Travel Behaviour Research. Baseline Survey 2004. February 2005.
Sustrans/Socialdata (2005). TravelSmart Bristol (Bishopsworth andHartcliffe). A report on Bristol’s first VIVALDI Individualised TravelMarketing project. September 2005.
Sustrans/Socialdata (2006). Darlington: Sustainable Travel DemonstrationTown. Interim Travel Behaviour Research. Final Report. April 2006.
Sustrans/Socialdata (2006). Worcester: Sustainable Travel DemonstrationTown. Interim Evaluation of ITM Programme (Stage 1). May 2006.
Sustrans/Socialdata (2006). Peterborough: Sustainable TravelDemonstration Town. Interim Evaluation of ITM Programme (Stage 1).July 2006.
Sustrans/Socialdata (2007). Darlington: Sustainable Travel DemonstrationTown. Second Interim Travel Behaviour Research. Final Report. March 2007.
149
| References

Appendix: A review of theory andpractice of PTP
Theoretical principles of travel behaviour and marketing
There are no universal theories or models of travel behaviour. Manyalternative theories originating from different fields have been proposedand reported in the literature. In this section some of the more widelyused theories and models are briefly outlined and used as a basis forconsideration of PTP. Theories and principles relevant to marketing arealso summarised in this respect. Reviews by Jackson (2005), Anable etal. (2006) and Gärling and Fujii (2006) have been drawn upon in thisreview, and readers are referred to these for more detailed information.After reviewing theories, it is considered how PTP approaches used inpractice relate to these. Finally, the findings are summarised from someresearch studies that have examined in depth the behavioural impacts ofPTP-type interventions. This allows some potential insights to be gainedon design of PTP.
Theories of behaviour
In Table A1 the main features of behavioural theories and models aresummarised and the implications of these for those seeking to influencetravel choices are subsequently interpreted.
150
Table A1: Theories of behaviour relevant to PTP
Rational choice theory (RCT)
Decision makers select optionwhich maximises benefits(expected utility) to them.
Decision makers have accessto complete information andare fully capable of evaluating it.
Change benefits and costassociated with options.
Bounded rationality Decision makers seek toachieve a minimum level ofbenefits (they are ‘satisficing’).
Decision makers cannot becertain about future conditionsand cannot obtain all relevantinformation.
Provide decision makers withinformation about benefits andcost associated with options.
Theory of plannedbehaviour (TPB)
Attitudes towards behaviour,social norm and perceivedbehavioural control combineto influence behaviouralintention which in turninfluences behaviour mediatedby actual behavioural control.
Behaviour based onconscious evaluation processas with rational choice theory.Beliefs and their evaluationdetermine attitudes, socialnorm and perceivedbehavioural control.
Change beliefs andevaluations of them through(objective) changes to optionsor through (subjective)marketing. Change actualability to perform behaviour.
Value belief normtheory (VBN)
Awareness of consequencesof behaviour and acceptanceof responsibility forconsequences influencepersonal norms whichinfluence behaviour.
Awareness and acceptanceare assumed to depend uponpersonal values. Ignores self-interest and situational factors(that influence behaviouralcontrol).
Educate about consequencesfor others of behaviour andpossibility of personallymaking a difference to theseconsequences.
Habit Behaviour that is automatic(non deliberate) and whichoccurs in response tosituational cues.
Habitual behaviour is morelikely with repeated behaviour,a stable and supportingenvironment and behaviourthat is rewarding.
Raise awareness of behaviouror change situational context.
Theory Description Assumptions Policy implications
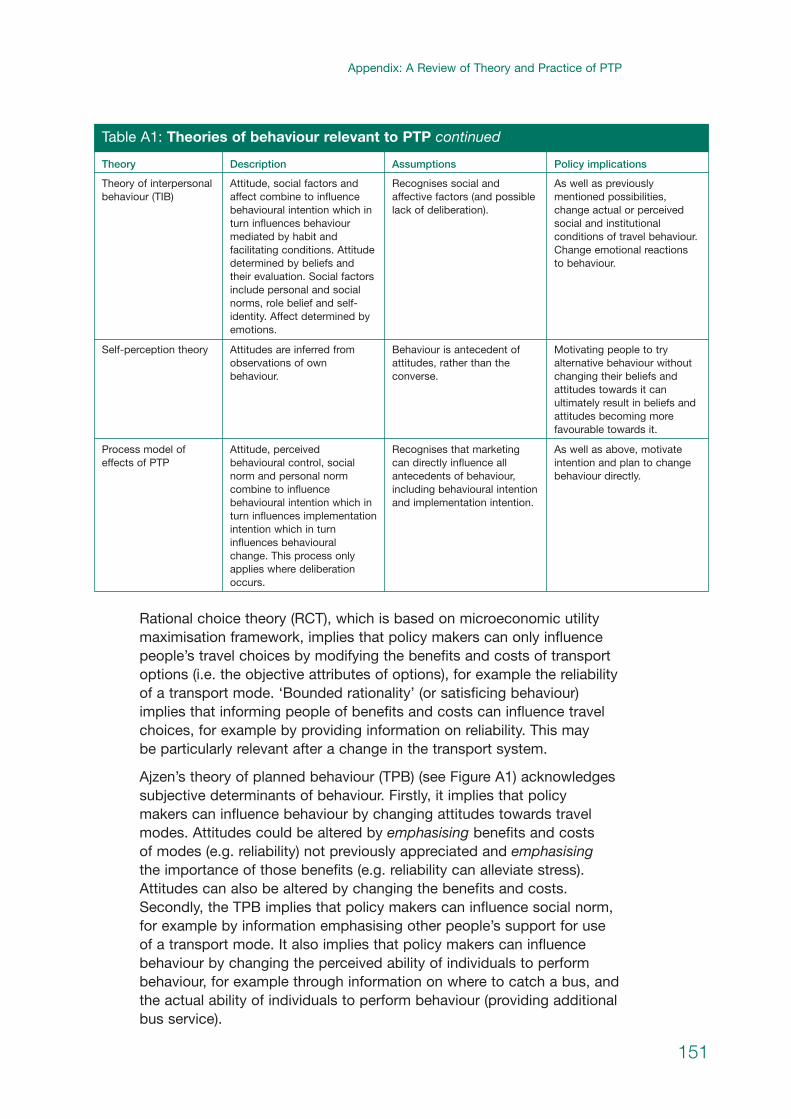
Rational choice theory (RCT), which is based on microeconomic utilitymaximisation framework, implies that policy makers can only influencepeople’s travel choices by modifying the benefits and costs of transportoptions (i.e. the objective attributes of options), for example the reliabilityof a transport mode. ‘Bounded rationality’ (or satisficing behaviour)implies that informing people of benefits and costs can influence travelchoices, for example by providing information on reliability. This may be particularly relevant after a change in the transport system.
Ajzen’s theory of planned behaviour (TPB) (see Figure A1) acknowledgessubjective determinants of behaviour. Firstly, it implies that policy makers can influence behaviour by changing attitudes towards travelmodes. Attitudes could be altered by emphasising benefits and costs of modes (e.g. reliability) not previously appreciated and emphasisingthe importance of those benefits (e.g. reliability can alleviate stress).Attitudes can also be altered by changing the benefits and costs.Secondly, the TPB implies that policy makers can influence social norm,for example by information emphasising other people’s support for useof a transport mode. It also implies that policy makers can influencebehaviour by changing the perceived ability of individuals to performbehaviour, for example through information on where to catch a bus, andthe actual ability of individuals to perform behaviour (providing additionalbus service).
151
| Appendix: A Review of Theory and Practice of PTP
Table A1: Theories of behaviour relevant to PTP continued
Theory of interpersonalbehaviour (TIB)
Attitude, social factors andaffect combine to influencebehavioural intention which inturn influences behaviourmediated by habit andfacilitating conditions. Attitudedetermined by beliefs andtheir evaluation. Social factorsinclude personal and socialnorms, role belief and self-identity. Affect determined byemotions.
Recognises social andaffective factors (and possiblelack of deliberation).
As well as previouslymentioned possibilities,change actual or perceivedsocial and institutionalconditions of travel behaviour.Change emotional reactions to behaviour.
Self-perception theory Attitudes are inferred fromobservations of ownbehaviour.
Behaviour is antecedent ofattitudes, rather than theconverse.
Motivating people to tryalternative behaviour withoutchanging their beliefs andattitudes towards it canultimately result in beliefs andattitudes becoming morefavourable towards it.
Process model ofeffects of PTP
Attitude, perceivedbehavioural control, socialnorm and personal normcombine to influencebehavioural intention which inturn influences implementationintention which in turninfluences behaviouralchange. This process onlyapplies where deliberationoccurs.
Recognises that marketingcan directly influence allantecedents of behaviour,including behavioural intentionand implementation intention.
As well as above, motivateintention and plan to changebehaviour directly.
Theory Description Assumptions Policy implications
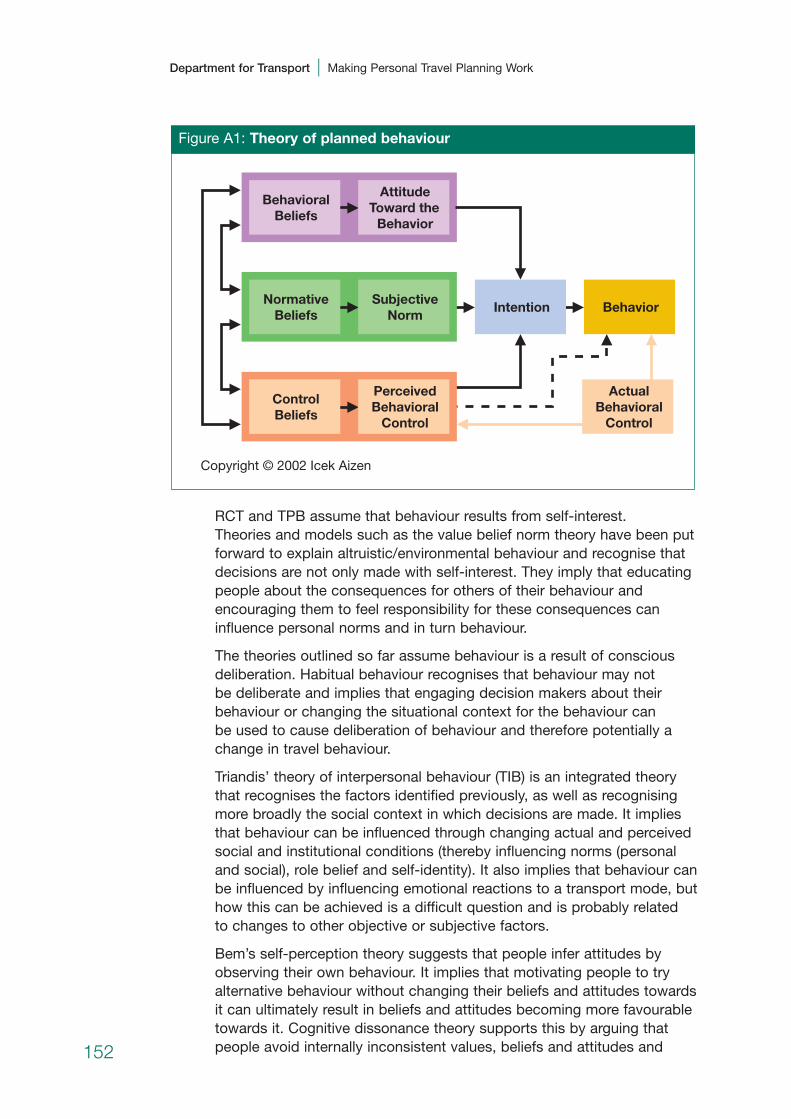
RCT and TPB assume that behaviour results from self-interest. Theories and models such as the value belief norm theory have been putforward to explain altruistic/environmental behaviour and recognise thatdecisions are not only made with self-interest. They imply that educatingpeople about the consequences for others of their behaviour andencouraging them to feel responsibility for these consequences caninfluence personal norms and in turn behaviour.
The theories outlined so far assume behaviour is a result of consciousdeliberation. Habitual behaviour recognises that behaviour may not be deliberate and implies that engaging decision makers about theirbehaviour or changing the situational context for the behaviour can be used to cause deliberation of behaviour and therefore potentially achange in travel behaviour.
Triandis’ theory of interpersonal behaviour (TIB) is an integrated theorythat recognises the factors identified previously, as well as recognisingmore broadly the social context in which decisions are made. It impliesthat behaviour can be influenced through changing actual and perceivedsocial and institutional conditions (thereby influencing norms (personaland social), role belief and self-identity). It also implies that behaviour canbe influenced by influencing emotional reactions to a transport mode, buthow this can be achieved is a difficult question and is probably related to changes to other objective or subjective factors.
Bem’s self-perception theory suggests that people infer attitudes byobserving their own behaviour. It implies that motivating people to tryalternative behaviour without changing their beliefs and attitudes towardsit can ultimately result in beliefs and attitudes becoming more favourabletowards it. Cognitive dissonance theory supports this by arguing thatpeople avoid internally inconsistent values, beliefs and attitudes and
Figure A1: Theory of planned behaviour
Behavioral Beliefs
Attitude Toward the
Behavior
Normative Beliefs
Subjective Norm
Intention Behavior
Control Beliefs
Copyright © 2002 Icek Aizen
Perceived Behavioral
Control
Actual Behavioral
Control
152
Department for Transport | Making Personal Travel Planning Work

implies that where a gap between attitude and behaviour exists anadjustment will be made to either attitude or behaviour. This impliesbehaviour can be influenced by inducing people to try behaviour afterwhich attitude towards the behaviour will become more positive.However, it has been noted that this is only likely where the outcome of the behaviour is positive.
An integrated process model designed specifically for considering PTP is suggested by Gärling and Fujii (2006). It is a model of behaviouralchange unlike the previous theories, which are concerned with explainingbehaviour. It draws on self-regulation theories, which consider the role of goal-setting in behavioural decisions. It is believed that a strongcommitment to a goal and the setting of a large goal increase thelikelihood of the goal being attained. Setting of a goal can be self-imposed or forced on an individual. Its additional contribution to that of TPB or TIB is that it implies that behaviour can be influenced by directlymotivating decision makers to have intention to change behaviour and/or to form implementation intention (or plan) to change behaviour.
Anable et al. (2006) conclude from reviewing behavioural theories appliedto environmental behaviours that knowledge and attitudes are mediatedby many other factors in influencing behaviour. They conclude thatchanging attitudes is not sufficient to influence behaviour. They suggesta set of factors or barriers to environmental behaviours and organisethese into a typology (see Table A2) involving four categories: individualsubjective (e.g. values, self efficacy), individual objective (e.g. knowledge,personal capabilities), collective subjective (social dilemmas, groupcultures), collective objective (e.g. contextual factors, communicationand the media). It is recognised that these factors are inter-related andthere are dynamic feedback effects between them.
Table A2: Typology of barriers to travel behaviour change from Anable et al. (2006)
Individual subjective Individual objective
Values Knowledge/awareness of consequences
Frames Habit
Moral norms Personal capabilities
Perceived behavioural control Actual resource constraints
Self efficacy or agency
Denial
Instrumental attitudes
Affective attitudes
Identity and status
Collective subjective Collective objective
Social dilemmas Contextual/situational factors
Group cultures/shared norms Communication and the media
Trust in others and in government Nature of climate change problem
153
| Appendix: A Review of Theory and Practice of PTP

Theories and principles relevant to social marketing
Jackson (2005) notes that successful persuasion has traditionally been said to be a function of credibility of source, persuasiveness of arguments and responsiveness of the recipient. The elaborationlikelihood model (ELM) is a theory of attitude change which differentiatesbetween the peripheral route and the central route to informationprocessing, with the former based on simple inferences and latter basedon critical evaluation. It has been suggested that central route processingis more likely to lead to enduring change in attitude and requires thedecision maker to be motivated and able to engage with message.However, peripheral processing (e.g. association of celebrity withbehaviour) can lead directly to change in behaviour without criticalevaluation and can be sustained as long as positive experience results. It is suggested that attention to target audience is important to gainpersonal involvement regardless of which route is used for messages.
If the information approach to persuasion is to be used, then the problemhas been noted that too much information can induce helplessness inrecipients and therefore have no effect on attitudes or behaviour. Thishas been found in relation to environmental behaviour. Kaplan hassuggested therefore that a participatory approach should be used wherepeople are helped to understand the problem and invited to come upwith solutions to it.
It has also been noted that attitude and behaviour can change withoutassimilation of a persuasion message. For example, people preferconsistency in values, attitudes and behaviour and highlightinginconsistencies (e.g. can be used to change people’s behaviour (this draws on cognitive dissonance theory).
Drawing together the above, Bator and Cialdini suggest successfulpersuasion messages require:
• emotional, imaginative appeal;
• immediacy, directness and relevance;
• use of commitments (e.g. badges, loyalty schemes) to signalinvolvement;
• use of retrieval cues so that people can be prompted to recall message.
As an alternative to conversational approaches to persuasion, it hasbeen argued that people change behaviour from trial and error, observingwhat others do and observing other people’s responses to their ownbehaviour. Bandura’s social learning theory suggests that behaviour isexplained by continuous reciprocal interaction between cognitive,behavioural and environmental influences. In other words, behaviour isinfluenced by learning from others as well as personal experiences. Thetheory also suggests that we learn most from those we identify with,implying the use of role models to convey knowledge and skills.
154
Department for Transport | Making Personal Travel Planning Work
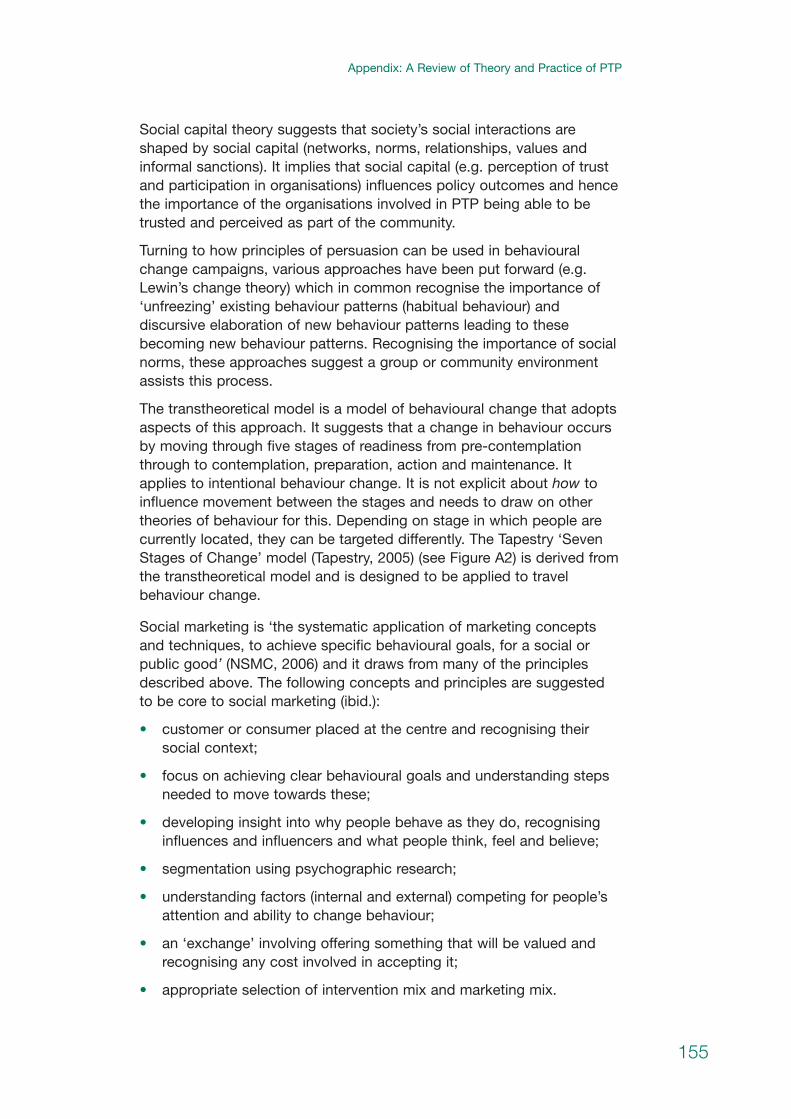
Social capital theory suggests that society’s social interactions areshaped by social capital (networks, norms, relationships, values andinformal sanctions). It implies that social capital (e.g. perception of trustand participation in organisations) influences policy outcomes and hencethe importance of the organisations involved in PTP being able to betrusted and perceived as part of the community.
Turning to how principles of persuasion can be used in behaviouralchange campaigns, various approaches have been put forward (e.g.Lewin’s change theory) which in common recognise the importance of‘unfreezing’ existing behaviour patterns (habitual behaviour) anddiscursive elaboration of new behaviour patterns leading to thesebecoming new behaviour patterns. Recognising the importance of socialnorms, these approaches suggest a group or community environmentassists this process.
The transtheoretical model is a model of behavioural change that adoptsaspects of this approach. It suggests that a change in behaviour occursby moving through five stages of readiness from pre-contemplationthrough to contemplation, preparation, action and maintenance. Itapplies to intentional behaviour change. It is not explicit about how toinfluence movement between the stages and needs to draw on othertheories of behaviour for this. Depending on stage in which people arecurrently located, they can be targeted differently. The Tapestry ‘SevenStages of Change’ model (Tapestry, 2005) (see Figure A2) is derived fromthe transtheoretical model and is designed to be applied to travelbehaviour change.
Social marketing is ‘the systematic application of marketing conceptsand techniques, to achieve specific behavioural goals, for a social orpublic good’ (NSMC, 2006) and it draws from many of the principlesdescribed above. The following concepts and principles are suggestedto be core to social marketing (ibid.):
• customer or consumer placed at the centre and recognising theirsocial context;
• focus on achieving clear behavioural goals and understanding stepsneeded to move towards these;
• developing insight into why people behave as they do, recognisinginfluences and influencers and what people think, feel and believe;
• segmentation using psychographic research;
• understanding factors (internal and external) competing for people’sattention and ability to change behaviour;
• an ‘exchange’ involving offering something that will be valued andrecognising any cost involved in accepting it;
• appropriate selection of intervention mix and marketing mix.
155
| Appendix: A Review of Theory and Practice of PTP
Kurani considers that social marketing involves a six-step process oflistening, planning, structuring, pre-testing, implementing and monitoring.Jackson (2005) suggests that community-based social marketing can bemore effective than individual-based social marketing, since changingbehaviour is easier within a supportive community. A community-basedapproach can be conducted at different scales including the household.
Segmentation is recognised as offering the potential for better targeteduse of resources and more effective delivery in marketing. Anable et al.(2006) argue that psychographic methods (based on attitudinal andaspirational profiles) offer advantages over socio-demographic orbehavioural based segmentation of travellers. Seven travel segmentshave been defined from a Scottish survey of travel awareness. It isargued that priority should be given to targeting the most amenablesegments, and that it may be most productive to encourage thosealready using alternatives to car to do so a little more, to encourageexperimentation with alternatives by those expressing willingness to trythese and to increase awareness of those with no apparent inclination.
Figure A2: Tapestry ‘Seven Stages of Change’ model (Tapestry, 2005)
7. Habitual behaviour
Long-term adoption of sustainable modes?
6. Experimental behaviour
Trying out new travel choices?
5. Making a choice
Really intend to modify behaviour?
4. Evaluation of options
Is there actually a viable alternative?
3. Perception of options
Perception of sustainable modes?
2. Accepting responsibility
Accept personal/corporate responsibility?
1. Awarenes of problem
Aware of the issue of traffic congestion?
156
Department for Transport | Making Personal Travel Planning Work
A difficulty of this approach is identification in which segments peoplebelong without initial research. A further concern currently withsegmentation based on cross-sectional data of current attitudes/behaviour is that it may not be helpful in inferring what change inbehaviour could occur. With further research on this (involving monitoring of pilot studies) this concern could be addressed.
How current PTP approaches relate to theory and principles
The TravelSmart®/IndiMark approach13 focuses on providing access topersonally-relevant information, advice and support about travel options.It is based on the hypothesis that many people have become habitualcar users and are unaware of alternative travel options available andwould be encouraged to use alternatives if more aware of them. It isbased on offering a set of information from which people can chooseand interpret for themselves, rather than seeking to present them withmessages to persuade them to change their behaviour.
TravelSmart/IndiMark can be summarised as involving the followingbehavioural ‘levers’:
• inducing deliberation of behaviour through the profile of initiativeitself, personal contact and offer of materials;
• explicitly reinforcing positive behaviour through gifts (which might beexpected to have positive effect on social norm and affect associatedwith behaviour);
• implicitly changing beliefs and attitudes (‘perceptions’) associatedwith travel options through offering choice of information so thatparticipant can select relevant information and evaluate it;
• explicitly encouraging trial of positive behaviour through incentive(which may subsequently lead to change of beliefs and attitude);
• explicitly increasing perceived and actual behavioural control to carryout positive behaviour through personal advice and support;
• implicitly encouraging mutual support within household (andpotentially within community) of behavioural change through ahousehold-based approach nested within a community (which mightbe expected to have positive effect on social norm).
TravelSmart/IndiMark seeks to initiate deliberation of behaviour andinfluence beliefs and attitudes. It can be considered to explicitly addressindividual subjective factors (instrumental attitudes, perceivedbehavioural control) and individual objective factors (habit, personalcapabilities) that determine behaviour. It also implicitly addresses socialnorms in various ways. It could be suggested that the TPB and theoriesof habitual behaviour are the most relevant behavioural theories forIndiMark.
13 TravelSmart is a trade mark registered by Sustrans for use in the UK describing PTP initiativesundertaken with Socialdata using the latter’s IndiMark method. 157
| Appendix: A Review of Theory and Practice of PTP

In terms of persuasion, TravelSmart/IndiMark adopts an approach of seeking to ‘unfreeze’ existing behaviour and induce discursiveelaboration of new behaviour. It seeks to achieve central processing of information without generating information overload. It involvespersonalised contact but is rooted within communities. It seeks toengender trust in the organisations involved. It includes some attentionto core aspects of social marketing but not all are involved (behaviouralgoals and steps) or are fully addressed (psychographic research-basedsegmentation).
The Steer Davies Gleave approach to PTP has been employed in Bristoland Darlington and informed the approaches taken in Brighton andLondon. It involves personal contact with individuals in target areas by travel advisors and engagement of participants in a short, door-stepconversation. The travel advisors are trained to listen out forcharacteristics of travel needs and behaviour, as well as key motivators,and to determine what type of message and information is relevant tothe participant. At the end of the conversation it is mutually agreed whatinformation and incentives are to be provided.
In Darlington, PTP participants could also join a loyalty club (LocalMotion Club) involving pledge card, newsletters, challenges andincentives. The loyalty club is aimed at reinforcing the impact of the initial conversation and package of information and incentives. In thenewsletter stories about the positive behaviour of members of thecommunity are reported (which may be expected to act to alter social norms).
The Steer Davies Gleave approach can be summarised as involving thefollowing behavioural ‘levers’:
• inducing deliberation of behaviour through the profile of initiativeitself, personal conversation and offer of materials;
• implicitly changing beliefs and attitudes (‘perceptions’) associatedwith travel options through suggesting relevant information for evaluation;
• explicitly encouraging trial of positive behaviour through incentive(which may subsequently lead to change of beliefs and attitude) and challenge;
• explicitly increasing perceived and actual behavioural control to carryout positive behaviour through personal advice and support;
• implicitly encouraging mutual support within household (andpotentially within community) of behavioural change through ahousehold-based approach nested within a community (which might be expected to have positive effect on social norm);
• explicitly reinforcing positive behaviour through loyalty club (whichcan have positive effect on social norm and affect associated withbehaviour).
158
Department for Transport | Making Personal Travel Planning Work
There are a number of commonalities between the TravelSmart/IndiMarkand Steer Davies Gleave approaches. One difference of emphasisbetween the two approaches is that the travel advisors used in SteerDavies Gleave PTP seek themselves to identify appropriate resourcesrelevant to the participant, whereas in TravelSmart/IndiMark participantsare provided with a menu of information from which to select. Whatappears to be a convergence of PTP in UK to a common approach inmany respects may be considered to be a consequence of learning what is effective from past experience (for example, in achieving highparticipation rates) and/or a consequence of common requirements from clients.
There have been varying degrees of pre-project publicity used to raiseawareness of PTP projects, regardless of approach. These have oftenbeen informed by travel behaviour surveys (or focus groups in the caseof London) for the area concerned. For example, publicity has been usedto emphasise the local improvements possible if fewer short journeys aremade by car. This example suggests that there can be opportunity toincrease the self-efficacy or agency of residents to make a difference to their lives through travel behaviour choices.
Projects have also varied in the amount of wider travel awareness workconducted alongside PTP, as well as the use of community groups andevents to publicise projects and recruit participants. These can assist ininfluencing the community subjective factors identified by Anable et al.(2006) that can act as barriers to behavioural change.
Looking at PTP approaches used elsewhere, Cooper (2007) describesresults of community-based social marketing PTP projects in differentareas in King County, Washington State, US. The projects are notable inembedding their activities within the community context, involving use ofposters/signs, project participation website and links with localbusinesses. A core component of the projects was requiring participantsto pledge to reduce car alone trips during a 10–14 week project period.Rewards (travel vouchers, ‘Count Me In’ signs) were given for successfulachievement of the pledge during the project period. Feedback fromparticipants indicated the initial pledge was the primary motivator for achange in behaviour and timely feedback on their performance againstthe pledge supported their continual engagement. Reductions in caralone trips of between 24% and 50% have been reported in differentareas for participants. Telephone surveys suggest though that onlybetween 6% and 10% of persons receiving project mailings haveresponded to the project and pledges have been offered from three-quarters of responding persons. It is possible, of course, that behaviouralimpacts have spread more widely than project participants and bus-boarding counts have shown positive impacts in project areas.
DHC (2005) reports a PTP project in south-east Liverpool which has paid close attention to behaviour theory and research elements of socialmarketing. The emphasis in project was on changing perceptions. It isassumed perceptions adjust to experience, and thereforeexperimentation with travel options should be encouraged where there
159
| Appendix: A Review of Theory and Practice of PTP
is most scope for perceptions to be adjusted positively. The project usedprevious research and a new interview survey to study transport modeperceptions. This resulted in saving money and improving health beingidentified as ‘constructs’ to use as foci in the project given that potentialfor these to be perceived positively for alternatives to the car was high.
Recognising that people have more trust in messages from trustedsources, the project used local community organisations, localnewspaper and local businesses to distribute leaflets containinginformation, motivation and invitation to participate in project. Thosepeople responding were sent a questionnaire on their travel attitudes and behaviour and this was analysed in order to segment them into sixattitude groups based on previous research by Anable (Anable et al.,2006). Different marketing approach was used for each group andinformation and advice was tailored to individuals based on a journeyreported in travel diary. Journey plans (in Healthy Travel Packs) wereprovided to 115 households.
It was found that 543 people (2.9% of the population) actively soughtparticipation in PTP project. Evaluation of individual responses measuredthrough follow-up questionnaire to those receiving Healthy Travel Packssuggested 0.4% of the population of the area (77 people) reported thatthey intended to maintain a behavioural change to a journey that hadbeen recommended to them. This project raises the question of whetheran approach that involves careful individualised analysis may result inlarge positive impacts for the participating individuals but have limitedpotential to directly engage a large proportion of the population. Whatcould be most relevant to find out is the level of impact on the behaviourof non-participants.
Reference should also be made to past PTP approaches and experiencefrom these. The Living Neighbourhoods/Living Change approach of SteerDavies Gleave focused on entering into conversation with households to discuss the problems they face relating to transport and inviting them into dialogue to solve them. Solutions could involve supplyinginformation, journey plans and incentives. Travel Blending whichsometimes formed a part of this involves members of householdcompleting seven day diaries after which advice is given on reducingoverall travel, and then these ideas are practised and further diarycompleted. The philosophy is that an achievable goal can be set ratherthan vague exhortation. This approach demands a high degree ofengagement (required from both project staff and participants) and hence it has not been extensively proven as to whether it is feasible toserve and engage high proportions of the population.
In PTP projects in Japan (Fujii and Garling, 2006) it is reported that someprojects have asked participants to make car reduction goals, and thesehave shown larger impacts on car use. It has also been found that askingparticipants to make implementation plans to change their behaviourresults in larger impacts than when this is not requested. These impactsapply to project participants, and it is not reported whether the extraburden (and possibly perceived imposition) associated with setting
160
Department for Transport | Making Personal Travel Planning Work
goals and plans compared to other PTP projects results in lowerparticipation rates.
Insights on behavioural change from research studies
A brief review is provided of findings from in-depth research studiesseeking to test the behaviour theories outlined previously and in somecases involving PTP-type interventions. This can indicate whichbehavioural factors are more likely to be important determinants ofbehaviour and are amenable to influence and can therefore inform on design of PTP.
Bamberg, Ajzen and Schmidt (2003) studied the impact of a prepaid busticket on bus use of 580 students at the University of Giessen, Germany.Analysis of bus intention and use before (two months) the interventionand after (eight months) the intervention showed that the interventioninfluenced attitudes, social norm, behavioural control, intentions andbehaviour towards bus use and supported the TPB as a model forexplaining behaviour both before and after intervention. It also indicatedthat a measure of past behaviour helped explanation of bus use beforethe intervention but not afterwards, indicating the intervention changedthe decision context. A measure of habit was not found to mediate theeffect of past behaviour on current behaviour before the intervention, andit is concluded that mode choice is a deliberate decision.
Fujii and Kitamura (2003) monitored the effect of a one-month free busticket on a sample of 23 car drivers and compared it to monitoring of asample of 20 drivers in a control group. Surveys before, immediatelyafter and one month after the intervention showed for the experimentalgroup attitude towards bus and use of bus increased and habit to usecar decreased, although these changes were lower in magnitude in thesecond ‘after’ survey. Given the small sample sizes, statisticallysignificant results were not obtained.
Garvill, Marell and Nordlund (2003) studied the impact of awarenessraising information in Umeå, Sweden, on an experiment group of 66participants and control group of 54 participants. The information wasincluded as part of the travel diary survey instrument and includedprompting to consider the situational context of planned journeys andthe alternatives to the car available. The findings from this study werethat no change occurred in the relationship between attitude andbehaviour (expected to become stronger), the relationship between habitand behaviour (weaker relationship expected) but that decreased car usewas found for experimental group and especially those with strong habitto use car. It is suggested that this impact may have been due to thosewith strong habits having been influenced by specific situational factorsor specific situational attitudes. It is concluded that breaking habits isimportant and increasing awareness of alternatives for specific journeyscan achieve this (and it is hypothesised therefore that actual objectivechanges to situational factors would be effective).
Beale and Bonsall (2007) report the results of two controlled trialsinvolving bus marketing by post in West Yorkshire. The first trial aimed at 161
| Appendix: A Review of Theory and Practice of PTP

a range of people was designed to address mis-perceptions of theattributes of bus and car (that had been found in another study) andinvolved a standard letter, leaflet and route and timetable informationpack. Results showed no substantial overall difference in the change inattitudes and behaviour for the treatment group compared to the controlgroup (declining trend in both cases) and some indication of positiveeffect on frequent users and females and negative effect on non-usersand males. It is suggested that the marketing aligned with the positivebeliefs about the bus of frequent users (such that they identified with themessage) and had the opposite effect on non-users. A second marketingintervention was conducted specifically aimed at infrequent or non-bususers, and results suggest lowered attitude ratings but increased bususe. It is suggested that this incongruence between attitudes andbehaviour may be explained by the role of self-identity, where themarketing intervention succeeded in enabling non-bus users to acceptthe bus in relation to their values or goals even if their perceptions didnot become more positive. Conclusions from the study are that there arelimitations of using a standard marketing approach and differences inbeliefs, attitudes, self-image, aspirations and ways of thinking andprocessing information should be recognised.
Taniguchi and Fujii (2007) tested the impact of PTP to motivate use of apilot community demand responsive bus service in Obihiro, Japan. PTPtook the form of an advertising leaflet, two free bus tickets (valid for onemonth) and a household questionnaire survey which included abehavioural plan sheet. The latter requested the recipient to write downan implementation plan to use the bus service. A second survey wasconducted two months after the first survey. Compared to a controlgroup, the results showed that the self-reported frequency of use of thebus service of the experiment group was statistically significantly higherand this was sustained for the month after the free bus ticket was valid.The after survey asked respondents whether they had recommended useof the bus service or been recommended use of it. It was found thatreceiving a recommendation increased use of the bus service and thatuse of the bus service increased likelihood of recommending it. Thissuggests the importance of word-of-mouth communication in promotinguse of new public transport service and that explicit encouragement of this may have potential value in PTP design.
There appear to be mixed findings from these studies. Some studies (Bamberg, Ajzen and Schmidt, 2003; Fujii and Kitamura, 2003)suggest that the TPB explains well the behavioural effect of PTP-typeinterventions (involving information and incentives) with change inattitude, etc. associated with change in behaviour. However, findingsfrom Garvill, Marell and Nordlund (2003) and Beale and Bonsall (2007)show behaviour change occurring without attitude change when peopleare provided with information or incentive that addresses a relevantspecific journey. It is unclear whether change will be sustained though if a positive attitude towards behaviour does not develop. Taniguchi andFujii (2007) provide insight that word-of-mouth communication can play a role in bringing about behavioural change amongst a community.
162
Department for Transport | Making Personal Travel Planning Work

References
Anable, J., Lane, B. and Kelay, T. (2006). An Evidence Base Review ofPublic Attitudes to Climate Change and Travel Behaviour. Report toDepartment for Transport. Available athttp://www.dft.gov.uk/stellent/groups/dft_susttravel/documents/page/dft_susttravel_612225.pdf
Bamberg, S., Ajzen, I. and Schmidt, P. (2003). Choice of travel mode inthe theory of planned behaviour: The roles of past behaviour, habit andreasoned action. Basic and Applied Social Psychology 25(3), 175–187.
Beale, J.R. and Bonsall, P.W. (2007). Marketing in the bus industry: A psychological interpretation of some attitudinal and behaviouraloutcomes. Transportation Research Part F, 10(4), 271–287.
Cooper, C. (2007). Successfully Changing Individual Travel BehaviorMobility: Applying Community-Based Social Marketing to Travel Choice.CD-ROM Proceedings of 86th Transportation Research Board AnnualMeeting 2007.
DHC (2005). Individualised Marketing in Merseyside. Final Report. July 2005.
Fujii, S. and Kitamura, R. (2003) What does a one-month free bus ticketdo to habitual drivers? An experimental analysis of habit and attitudechange. Transportation, 30(1), 81–95.
Gärling, T. and Fujii, S. (2006). Travel Behavior Modfication: Theories,Methods and Programs. Resource paper for the IATBR Conference,Kyoto, Japan, 16–20 August.
Garvill, J., Marell, A. and Nordlund, A. (2003). Effect of increasedawareness on choice of travel mode. Transportation, 30(1), 63–79.
Jackson, T. (2005) Motivating Sustainable Consumption: A review ofevidence on consumer behaviour and behavioural change. Report to theSustainable Development Research Network. Available at http://www.sd-research.org.uk/researchreviews/documents/MotivatingSCfinal.pdf
NSMC (2006). It’s our health! Realising the potential of effective socialmarketing. National Social Marketing Centre, National Consumer Council.
Taniguchi, A. and Fujii, S. (2007). Promoting public transport usingmarketing techniques in mobility management and verifying theirquantitative effects. Transportation, 34(1), 37–49.
Tapestry (2005). Making Campaigning for Smarter Choices Work:Guidelines for Local Authorities. Tapestry Project and Department forTransport. May 2005.
163
| Appendix: A Review of Theory and Practice of PTP


![Untitled-2 [] · Title: Untitled-2 Author: Market-lynsey Created Date: 8/7/2006 3:01:30 PM](https://img.pdfslide.us/doc/110x75/5f7056730513c16b97710766/untitled-2-title-untitled-2-author-market-lynsey-created-date-872006-30130.jpg)