Embed Size (px)
Citation preview

Celebrating 30 years
Annual & Sustainability Report 2016
Making money do good

Mercury Energy’s Ohakuri Hydro Power Station in New Zealand. When investing in hydro electricity we balance the benefits of renewable energy with the social, animal and environmental harms of some hydro projects. Photo credit: Mercury Energy
For 30 years Australian Ethical has proven that you can make money while doing good.Phil Vernon, Managing Director, Australian Ethical
1Annual and Sustainability Report 2016 Celebrating 30 years

About this reportWelcome to Australian Ethical Investment Limited’s Annual and Sustainability Report 2016, a combined overview of our financial and sustainability disclosures.
This report has been developed in accordance with the ‘Comprehensive’ requirements of the Global Reporting Initiative’s G4 guidelines. We have outlined our performance for the period 1 July 2015 to 30 June 2016 for Australian Ethical Investment Limited and its wholly owned subsidiary Australian Ethical Superannuation Pty Ltd. References to the activities of Australian Ethical Foundation Limited are also included.
This year, we focus on the key trends affecting the superannuation and investments sector, and have identified material topics that we as a business can and must influence.
To make it easy to navigate, the report has been divided into three sections: Foundations, This Year and Essentials.
KPMG have audited the financial statements and have also assured selected sustainability disclosures made in this report. Additional details of assurance are available on page 121-122.
We welcome your feedback on this report. Please feel free to contact Tom May, General Counsel and Company Secretary, Australian Ethical Investment Limited on 02 8276 6294 or at [email protected].
Our Corporate Governance Statement is available at australianethical.com.au/shareholders/corporate-governance/.
2 Annual and Sustainability Report 2016Celebrating 30 years

Contents
FOUNDATIONS
Managing Director’s and Chairman’s review 4
Our year in numbers 6
Our story 8
Our Ethical Charter 10
Creating impact 12
THIS YEAR
Key industry trends 14
What matters most 16
Delivering returns in a volatile market 18
Investing in a sustainable future 24
Our commitment to the community 36
Transitioning towards a lower carbon economy 40
Delivering a great experience 52
Investing in our people 56
ESSENTIALS
Leadership 62
Directors’ Report 65
Remuneration Report 68
Lead Auditor’s Independence Declaration 79
Independent Auditor’s Report 80
Consolidated financial statements 82
Shareholder information 119
Company directory 121
3Annual and Sustainability Report 2016 Celebrating 30 years
Foundations / Managing Director’s and Chairman's review
Ahead of the curve for 30 yearsThis year Australian Ethical celebrated a significant milestone – we turned 30.
Over the past three decades, we’ve seen a significant shift in attitudes towards investments and super. Ethical investing is now part of the mainstream – or at least the enlightened mainstream. We are proud of the important part Australian Ethical has played in this journey. Our track record shows that investors do not have to compromise returns in order to do what’s right. And the great news is, we continue to go from strength to strength.
In FY16, I’m thrilled to report we’ve increased our net flows by 78%, bringing our total funds under management (FUM) to more than $1.5 billion. In addition, our net profit after tax was up 53% to $3.0 million.
Many of our managed funds continue to outperform the market. Our Australian Shares Fund was in the top quartile for performance over FY16 and is the #1 best performing Australian shares fund over the last 10 years (compared to both ethical and non-ethical funds).
Our superannuation membership also grew by 24% in FY16. Over 5,000 new members joined us in that period, with a high proportion opting to roll over their entire super balance to us.
Focused on clients, shareholders, employees and the communityThere’s a bit of an art to balancing the needs of various stakeholders in a values-based business. We believe in doing what’s best not only for our shareholders, but also for employees, clients and the wider community.
On 30 June 2016, we lowered fees on our superannuation fund by 0.22%, which represents a total reduction of 1.3% – over half the fee for a member in our MySuper product – since 2013. As we grow, we will continue to share the benefits of scale with our clients and prospective new members.
Our share price has increased from $58.80 on 30 June 2015 to $81.11 on 30 June 2016, benefiting shareholders – even while we lower fees. In FY16, our total shareholder return was 43%.
None of this would be possible without our employees. In FY16, we launched an office expansion that aims to have our team working in a modern, collaborative environment and allow for growth. We also continue to support employees in their professional and personal lives, with the belief that these two areas are inextricably linked. To ensure that the goals of employees and the company are aligned, each employee is also a shareholder in the business.
4 Annual and Sustainability Report 2016Celebrating 30 years

Our grants program remains a source of immense pride for us. This year we supported 18 community projects – from animal welfare to environmental conservation to helping alleviate poverty. To date, we have donated over $2 million to community projects, and our recently established Foundation will provide additional flexibility in how we support charitable organisations in the future.
Operating within the global investment landscape The pressure to deliver short-term returns can drive companies to deplete the resource base (economic, natural and human) that underpins their own future prosperity. We’ve been pleased to see increasing discussion on how we can change this trend within international markets and focus capital markets more on the longer term.
At Australian Ethical we’re committed to:
• focusing capital on delivering long-term value, and
• shifting financial markets towards a more responsible and sustainable footing.
Global capital is the most dominant force in the world today. Our purpose is to make sure that capital is used for the good of people and the planet. Through our ownership of companies, on behalf of our clients, we are recalibrating businesses to focus on creating sustainable, long-term value.
One of the biggest threats facing our world today is climate change. We’re proud to say that each day at Australian Ethical we’re taking action to address this issue. By refusing to invest in environmentally damaging industries such as coal and old-growth logging, and by investing in clean energy solutions such as solar and wind,
we’re directing capital towards sustainable and future-driven industries. We’re doing this not only for the prosperity of our company and the nation’s economy, but also for the prosperity of our planet.
Looking to the futureWe have a clear vision for our business. We aim to be the financial services company of choice for conscious consumers. This year we’ve shown we’re on track to achieve this vision, and remain a leader in the field of ethical investing.
We have a goal of reaching $5 billion in FUM by 2020. Ambitious, sure – but we’re committed to reaching it. We know this type of growth would allow us to:
• deliver broader services to our clients,
• have greater impact in society for positive change, and
• continue to deliver strong returns for our shareholders.
A 30-year milestone is a great opportunity to reflect. After three decades of ethical investing, we’re stronger as a business than ever before. And our core priority – to make money do good for people and the planet – will allow us to operate a thriving, sustainable business well into the future.
Steve GibbsChairman
Phil VernonManaging Director
5Annual and Sustainability Report 2016 Celebrating 30 years

Foundations / Highlights
Our year in numbers
26,000+
24% increase since FY15
Super members
77%2
$395,314provisioned for
community impact
Employee engagement
2016:#1
‘BEST RESPONSIBLE INVESTMENT
REPORT’ 2015 1
27%
Companies Fund AN INNOVATIVE NEW PRODUCT LAUNCHED
Emerging
RETURN ON EQUITY
1 Responsible Investor Reporting Awards 2 Externally benchmarked by AON Hewitt.
6 Annual and Sustainability Report 2016Celebrating 30 years
4 Emissions of Australian Ethical share investments compared to benchmark of S&P ASX 200 Index (for Australian share fund holdings) and MSCI World Index ex Australia (for international share fund holdings). Calculated as at 31 December 2015.
5 Mercer Survey, June 2016
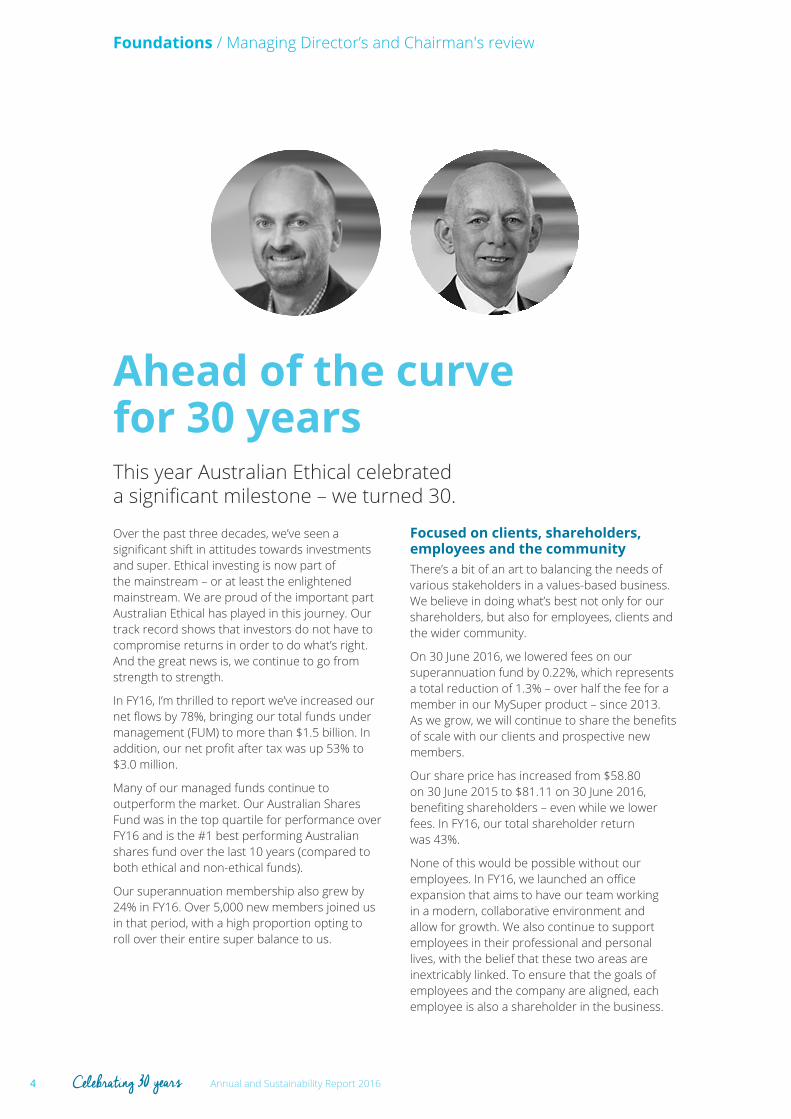
$23 millionrevenue
282Cearnings per share
60,259 TONNES LESS CO2
4
$1.5 billionOVER
IN FUNDS UNDER MANAGEMENT
for performanceOUR AUSTRALIAN SHARES FUND
OVER THE PAST 12 MONTHS5
Top quartile
$3.00
$3.0 millionprofit after
tax
DIVIDENDS
7Annual and Sustainability Report 2016 Celebrating 30 years
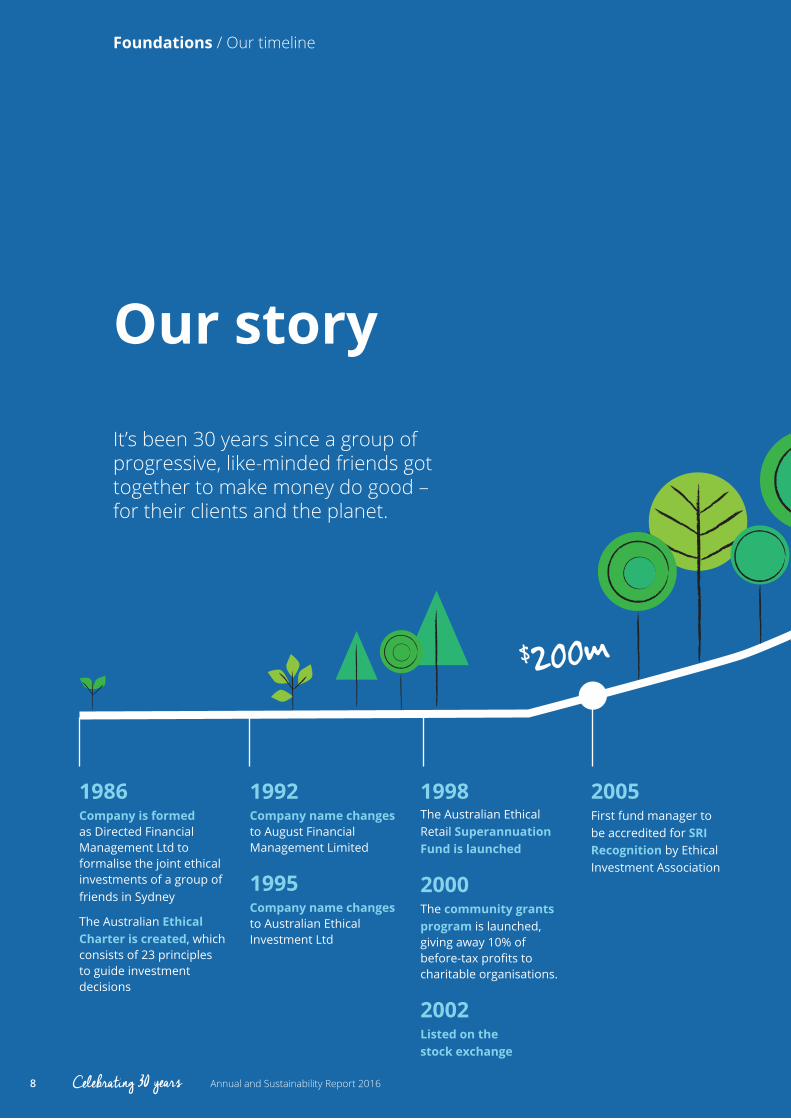
Our story
$ 200m
It’s been 30 years since a group of progressive, like-minded friends got together to make money do good – for their clients and the planet.
1986Company is formed as Directed Financial Management Ltd to formalise the joint ethical investments of a group of friends in Sydney
The Australian Ethical Charter is created, which consists of 23 principles to guide investment decisions
1992Company name changes to August Financial Management Limited
1995Company name changes to Australian Ethical Investment Ltd
1998The Australian Ethical Retail Superannuation Fund is launched
2000The community grants program is launched, giving away 10% of before-tax profits to charitable organisations.
2002Listed on the stock exchange
2005First fund manager to be accredited for SRI Recognition by Ethical Investment Association
8 Annual and Sustainability Report 2016Celebrating 30 years
Foundations / Our timeline

$500m
billion
$1.5
2006Hit $500m in funds under management
2008Infinity Award winner Winner of the SuperRatings Infinity Award for the most environmental and socially conscious superannuation fund
2010Over $1 million donated to community projects since 2000
Current CEO and Managing Director Phil Vernon is appointed
2011Ethical Investor Fund of the Year Named Ethical Fund of the Year for the Australian Shares Fund by the Australian Sustainability Awards
2013Head office moves from Canberra to Sydney
Super fund named 'Rising Star' by SuperRatings
2014Received B Corp certification
2015Awarded Best For the World status by B Corp, which ranks the top 10% of B corps worldwide
Money Management Responsible Fund of the Year Award
2016Hit $1.5b in funds under management with over 26,000 Super members
9Annual and Sustainability Report 2016 Celebrating 30 years
Foundations / Charter
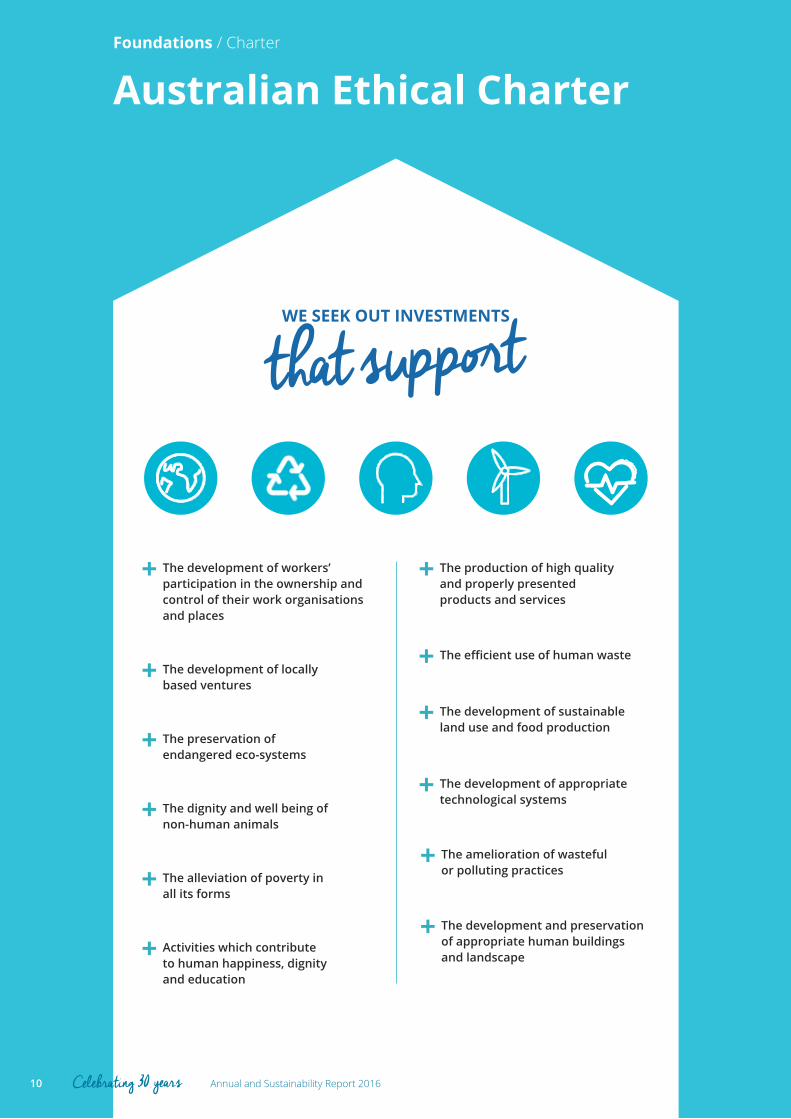
Australian Ethical Charter
that supportWE SEEK OUT INVESTMENTS
+ The development of workers’ participation in the ownership and control of their work organisations and places
+ The production of high quality and properly presented products and services
+ The development of locally based ventures
+ The development of appropriate technological systems
+ The development of sustainable land use and food production+ The preservation of
endangered eco-systems
+ Activities which contribute to human happiness, dignity and education
+ The dignity and well being of non-human animals
+ The efficient use of human waste
+ The alleviation of poverty in all its forms
+ The development and preservation of appropriate human buildings and landscape
+ The amelioration of wasteful or polluting practices
10 Annual and Sustainability Report 2016Celebrating 30 years

WE AVOID INVESTMENTS
– Pollute land, air or water
– Create, encourage or perpetuate militarism or engage in the manufacture of armaments
– Entice people into financial over-commitment
– Market, promote or advertise, products or services in a misleading or deceitful manner
– Create markets by the promotion or advertising of unwanted products or services
– Acquire land or commodities primarily for the purpose of speculative gain
– Exploit people through the payment of low wages or the provision of poor working conditions
– Destroy or waste non-recurring resources
– Discriminate by way of race, religion or sex in employment, marketing, or advertising practices – Contribute to the inhibition
of human rights generally
– Extract, create, produce, manufacture, or market materials, products, goods or services which have a harmful effect on humans, non-human animals or the environment
that harm
11Annual and Sustainability Report 2016 Celebrating 30 years

OUR PURPOSE
The detai l s
Make money do good – for you and
for the planet.
OUR VALUES• Respect • Compassion • Trust • Leadership • Authenticity
OUR BELIEFS & VALUES
OUR VALUES AND BELIEFS
Creating impact
Our beliefs are central to our business and underpin everything
we do. Our values guide our actions and our investments.
EXTERNAL ENVIRONMENT
OUR BELIEFS•A new model for business is needed
not focused solely on profits•Ethical and financial outcomes can
be achieved together – no need to compromise on either
•Money has power to make a difference
• Individuals have power through their investment and consumption choices
•We take action and lead to inspire others
EXTERNAL ENVIRONMENT
The external environment encompasses market instability, economic conditions, societal issues and environmental challenges, all of which may influence our operations. We are working to operate sustainably in an environment of constant disruption, political and regulatory change and increasing competition.
12 Annual and Sustainability Report 2016Celebrating 30 years
Foundations / Values

$$
TARGETS OUR OUTCOMES
The magic
=
THE MAGIC
Using a process of investment, monitoring, screening,
engagement and where required divestment, we are able to use
our clients’ money to create a clean, clever and humane
tomorrow that is both ethically and financially stable.
OUR AMBITION
•High conviction ethical screening
•Professional portfolio management
•Active ownership of companies to improve their behaviour
•Divestment if they don’t
• Fully featured products for our clients
•Exceptional service
•Net zero emissions for portfolio by 2050
•$5 billion in FUM by 2020•Gender balance in our
candidate shortlists when recruiting
• Industry leading Net Promoter Score
Our financial and sustainability targets guide our day-to-day actions and operations and motivate us
to stay focused.
To be the financial services company of choice for conscious consumers
TARGETS
EXTERNAL ENVIRONMENT
DELIVERING VALUE FOR THE
LONG TERMDelivering value for our clients goes beyond the dollars. We work to deliver sustainable and long-term returns, provide insurance protection, enable adequate savings for our retirees and do good for the planet
through meeting social and environmental performance standards.
13Annual and Sustainability Report 2016 Celebrating 30 years
•Our clients – competitive returns, fees, products and service
•Our planet – strong growth, greater positive impact
•Our people – inspiring workplace, purpose alignment, share in company’s performance
•Our shareholders – exceptional shareholder returns
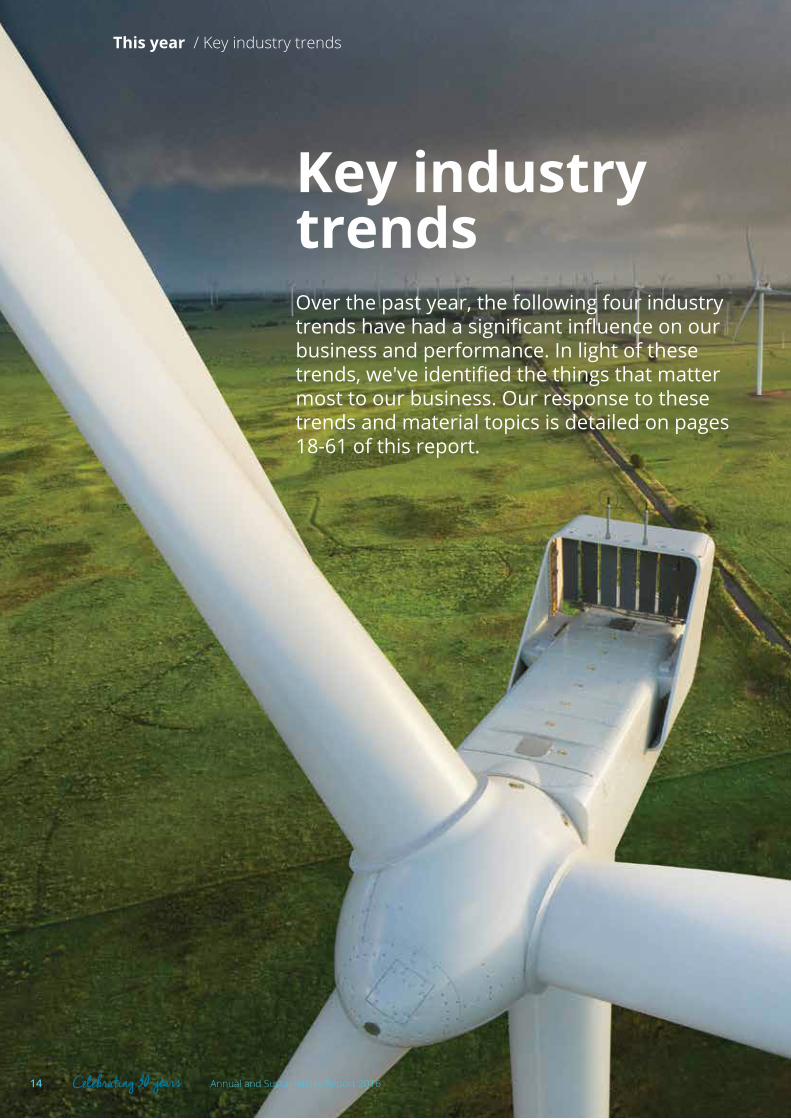
Key industry trends
This year / Key industry trends
Over the past year, the following four industry trends have had a significant influence on our business and performance. In light of these trends, we've identified the things that matter most to our business. Our response to these trends and material topics is detailed on pages 18-61 of this report.
14 Annual and Sustainability Report 2016Celebrating 30 years
Phot
o cr
edit:
Ves
tas
Win
d Sy
stem
s
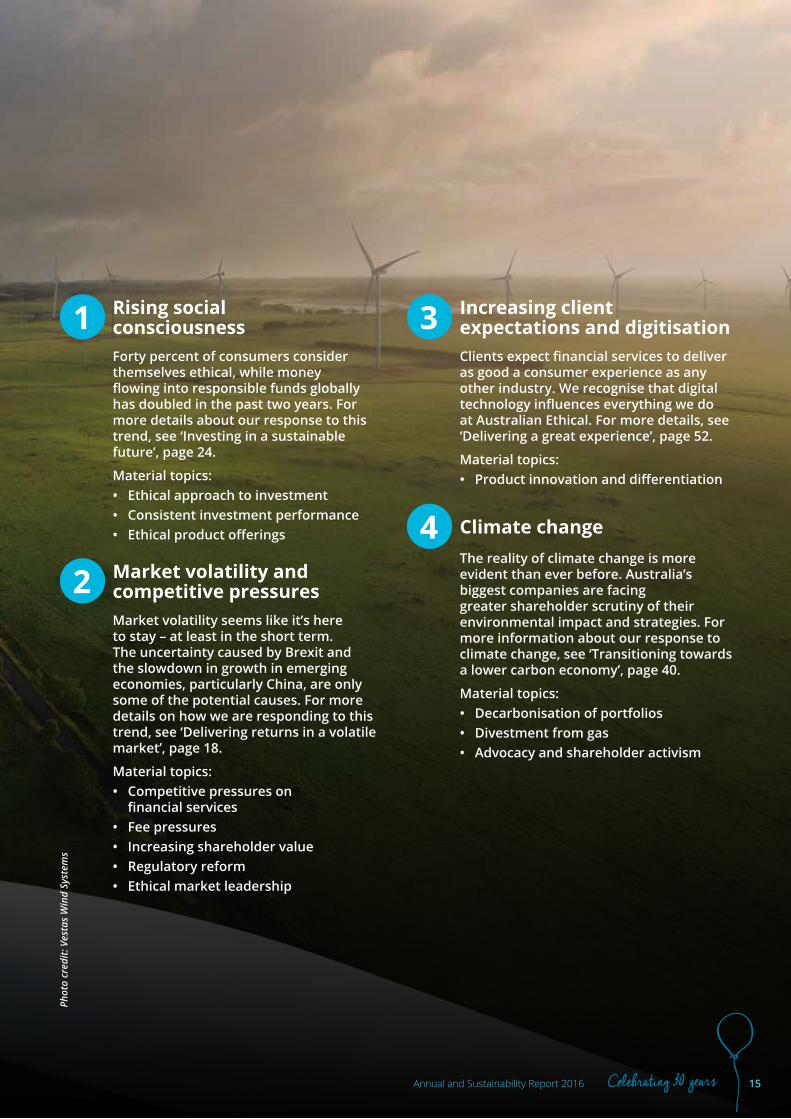
1 Rising social consciousnessForty percent of consumers consider themselves ethical, while money flowing into responsible funds globally has doubled in the past two years. For more details about our response to this trend, see ‘Investing in a sustainable future’, page 24.
Material topics:• Ethical approach to investment• Consistent investment performance• Ethical product offerings
2 Market volatility and competitive pressuresMarket volatility seems like it’s here to stay – at least in the short term. The uncertainty caused by Brexit and the slowdown in growth in emerging economies, particularly China, are only some of the potential causes. For more details on how we are responding to this trend, see ‘Delivering returns in a volatile market’, page 18.
Material topics:• Competitive pressures on
financial services• Fee pressures• Increasing shareholder value• Regulatory reform• Ethical market leadership
3 Increasing client expectations and digitisationClients expect financial services to deliver as good a consumer experience as any other industry. We recognise that digital technology influences everything we do at Australian Ethical. For more details, see ‘Delivering a great experience’, page 52.
Material topics:• Product innovation and differentiation
4 Climate changeThe reality of climate change is more evident than ever before. Australia’s biggest companies are facing greater shareholder scrutiny of their environmental impact and strategies. For more information about our response to climate change, see ‘Transitioning towards a lower carbon economy’, page 40.
Material topics:• Decarbonisation of portfolios• Divestment from gas• Advocacy and shareholder activism
15Annual and Sustainability Report 2016 Celebrating 30 years
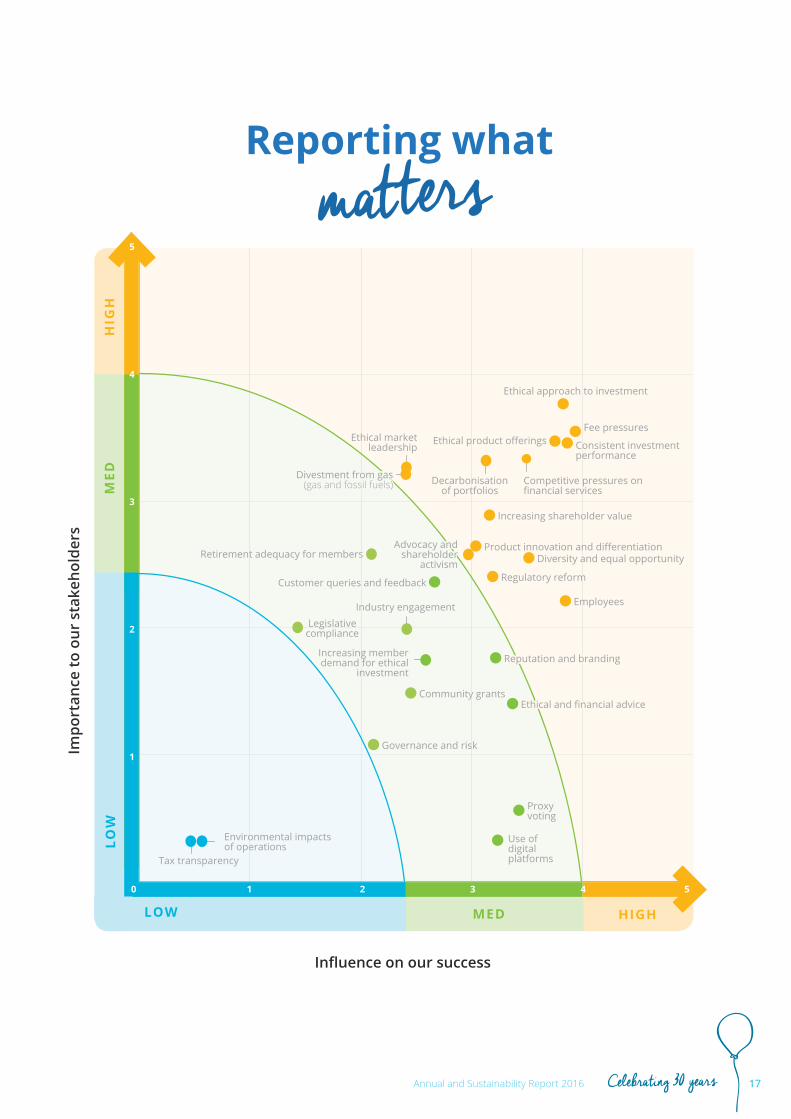
We applied the principles of the Global Reporting Initiative (GRI), a global benchmark for sustainability reporting, to define what matters most to our company.
We engaged Ernst & Young to support the implementation of the GRI’s four-step process of assessing material topics for inclusion in this report. This involved:
identification of material topics and their boundaries which might have an impact on us as a business and influence our stakeholders;
prioritisation of material topics using stakeholder engagement and assessments, such as a review of peers, media articles, news stories, policies, industry trends and our corporate strategy;
validation of material topics through an internal workshop with our senior management team6;
review and a final sign-off by our Non-Executive Directors and Managing Director.
Engaging with stakeholdersWe identify our key stakeholders as people who our business has a direct or indirect impact on, and those who have an impact on us. This includes our clients, shareholders, employees, employers, financial advisers and the wider community.
Talking to our stakeholders strengthens our relationship with them and also helps us obtain their views on material topics. Material topics are those that attract significant stakeholder interest and have the potential to impact our economic, environmental or social performance. This helps inform the content of our annual and sustainability report. Throughout this report, you will see examples of how we have engaged with stakeholders.
This year’s material topics have been assessed against a background of the key trends affecting the investment and superannuation sector (shown on page 15). Throughout this report, we have attempted to explain how these industry trends affect our business and how we as a company are working to influence positive change in society.
What matters most
This year / What matters most
6 Senior Management Team refers to Australian Ethical Investment Limited’s Key Management Personnel (KMP)
16 Annual and Sustainability Report 2016Celebrating 30 years
Diversity and equal opportunity
Regulatory reform
Community grants
Influence on our success
HIGH
LOW
LOW
HIG
HM
ED
MED
Reporting what
Increasing shareholder value
Ethical product offerings
Retirement adequacy for members
Customer queries and feedback
Governance and risk
Environmental impacts of operations
Tax transparency
Impo
rtan
ce to
our
sta
keho
lder
s
Ethical market leadership
Decarbonisation of portfolios
5
4
3
2
1
Industry engagement
Divestment from gas (gas and fossil fuels)
Advocacy and shareholder
activism
Reputation and branding
Ethical and financial advice
Legislative compliance
Increasing member demand for ethical
investment
matters
Product innovation and differentiation
Employees
Proxy voting
Use of digital platforms
Competitive pressures on financial services
Consistent investment performance
Ethical approach to investment
Fee pressures
0 1 2 3 4 5
17Annual and Sustainability Report 2016 Celebrating 30 years

Phot
o cr
edit:
Tas
sal
Sharp falls in share prices, high private and public sector debt levels, monetary policy settings, increased government intervention in the economy, tax transparency measures and falling resource prices have all played a part in creating market volatility.
We understand the concern this causes our clients and remain committed to delivering competitive returns as the volatile market plays out.
Our managed funds were some of the best performing during the Global Financial Crisis. Our Australian Shares Fund has returned an average of 10% per annum over the last 20 years. Over the 12 months ending 30 June 2016, the Australian Shares Fund again significantly outperformed the S&P/ASX 200 Accumulation index returning 12.7% vs 0.6%. For periods greater than one year not only has the Fund consistently outperformed but has done so with lower volatility.
Delivering returns in a volatile marketIn recent years, Australians have grown accustomed to the seesawing share market.
This year / Delivering returns in a volatile market
18 Annual and Sustainability Report 2016Celebrating 30 years
Delivering returns in
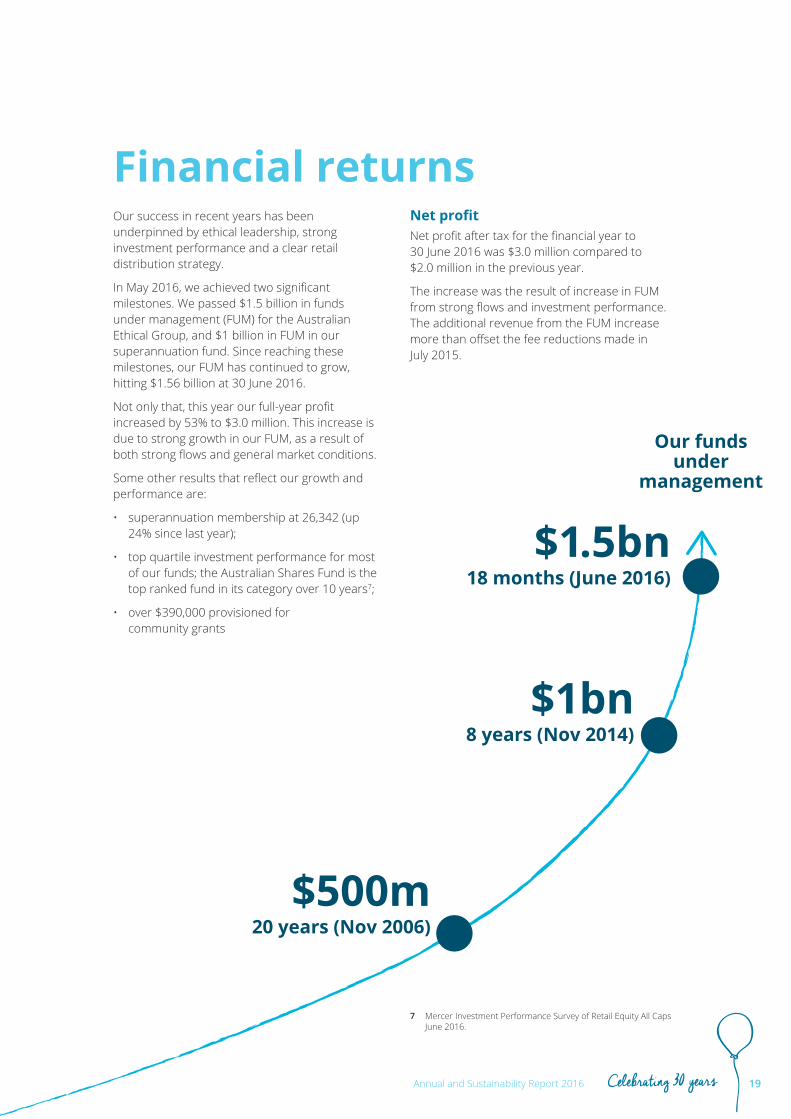
Financial returnsOur success in recent years has been underpinned by ethical leadership, strong investment performance and a clear retail distribution strategy.
In May 2016, we achieved two significant milestones. We passed $1.5 billion in funds under management (FUM) for the Australian Ethical Group, and $1 billion in FUM in our superannuation fund. Since reaching these milestones, our FUM has continued to grow, hitting $1.56 billion at 30 June 2016.
Not only that, this year our full-year profit increased by 53% to $3.0 million. This increase is due to strong growth in our FUM, as a result of both strong flows and general market conditions.
Some other results that reflect our growth and performance are:
• superannuation membership at 26,342 (up 24% since last year);
• top quartile investment performance for most of our funds; the Australian Shares Fund is the top ranked fund in its category over 10 years7;
• over $390,000 provisioned for community grants
Net profitNet profit after tax for the financial year to 30 June 2016 was $3.0 million compared to $2.0 million in the previous year.
The increase was the result of increase in FUM from strong flows and investment performance. The additional revenue from the FUM increase more than offset the fee reductions made in July 2015.
$500m20 years (Nov 2006)
$1bn8 years (Nov 2014)
$1.5bn18 months (June 2016)
7 Mercer Investment Performance Survey of Retail Equity All Caps June 2016.
Our funds under
management
19Annual and Sustainability Report 2016 Celebrating 30 years
RevenuesRevenue increased by 9% to $23.0 million, up from $21.2 million recorded for the previous year.
Net inflows increased by 78% to $319 million for the year, compared to last year’s net inflows of $179 million.
FUM for the full year increased 33% to $1.6 billion, up from $1.2 billion in the previous corresponding period. This growth in FUM has been driven by a combination of new inflows and asset management performance.
The impact of superannuation fee reductions at the end of the previous financial year was
offset by increases in net flows and growth of FUM this year. An additional fee reduction of 0.22%, reducing superannuation administration asset based fees to 0.41%, occurred on 30 June 20168. We continue our medium-term strategy to progressively reduce fees to a more competitive level, taking into account business needs and shareholder returns.
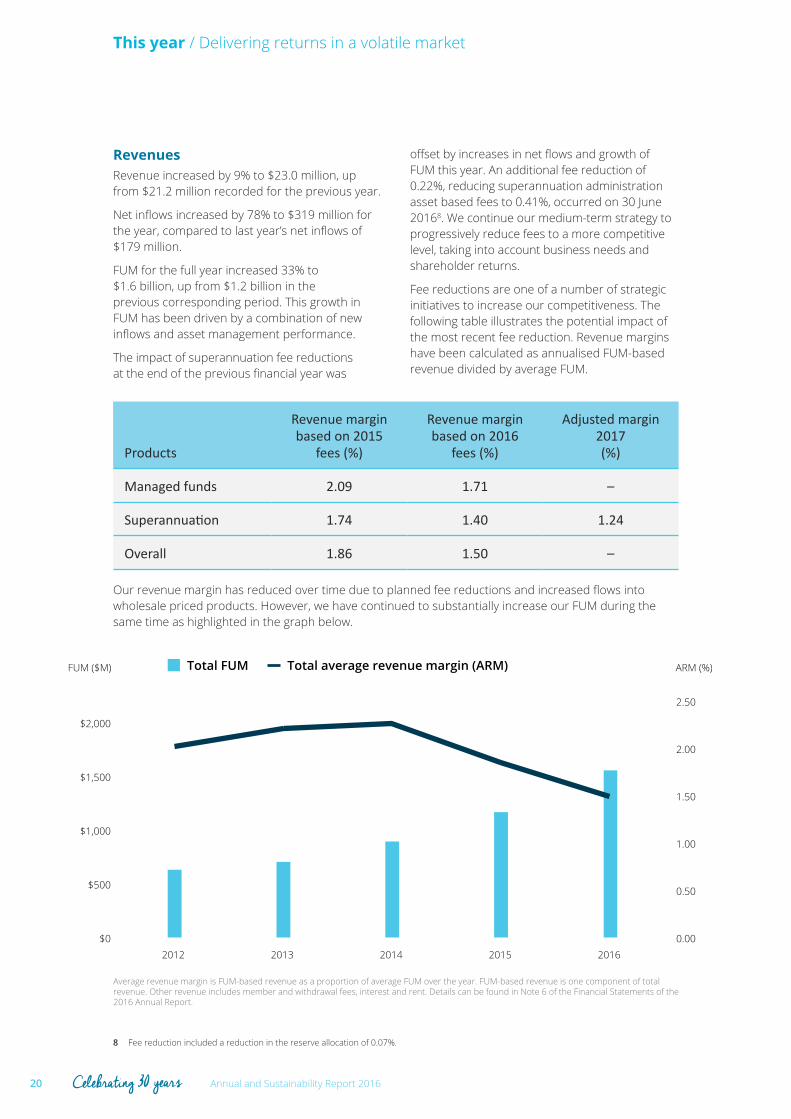
Fee reductions are one of a number of strategic initiatives to increase our competitiveness. The following table illustrates the potential impact of the most recent fee reduction. Revenue margins have been calculated as annualised FUM-based revenue divided by average FUM.
Products
Revenue margin based on 2015
fees (%)
Revenue margin based on 2016
fees (%)
Adjusted margin 2017 (%)
Managed funds 2.09 1.71 –
Superannuation 1.74 1.40 1.24
Overall 1.86 1.50 –
Our revenue margin has reduced over time due to planned fee reductions and increased flows into wholesale priced products. However, we have continued to substantially increase our FUM during the same time as highlighted in the graph below.
This year / Delivering returns in a volatile market
8 Fee reduction included a reduction in the reserve allocation of 0.07%.
0.00
0.50
1.00
1.50
2.00
2.50
$0
$500
$1,000
$1,500
$2,000
2012 2013 2014 2015 2016
FUM ($M) ARM (%)Total FUM Total average revenue margin (ARM)
Average revenue margin is FUM-based revenue as a proportion of average FUM over the year. FUM-based revenue is one component of total revenue. Other revenue includes member and withdrawal fees, interest and rent. Details can be found in Note 6 of the Financial Statements of the 2016 Annual Report.
20 Annual and Sustainability Report 2016Celebrating 30 years

Final dividendA fully franked final dividend of $1.80 per share was declared for the full year ended 30 June 2016, bringing the total dividend for the year to $3.00 per share. The record date for the dividend is 9 September 2016, with payment on 23 September 2016.
ExpensesTotal expenses increased by $0.8 million (4.3%). Expenses increased due to the following:
• Marketing: an increase in marketing activity drove the increase in flows with costs increasing by $0.6 million over the previous year.
• External services: costs to outsource providers increased by $0.1 million as a result of increased audit fees and platform fees. Fund-related costs increased by $0.4 million due to increases in FUM and client numbers.
• Income tax expense: the effective tax rate was 36%, a decrease on the previous year’s rate of 45%. Our effective tax rate is impacted by items that are not deductible for tax purposes, which are detailed in Note 4b of the Consolidated Financial Report.
• Property: due to further weakening in the Canberra commercial property market our property in Canberra reduced in value by a further $0.18m.
• Provision for remediation: A provision of $0.9 million has been made in relation to remediating superannuation members for unit pricing errors with investigations continuing. The Group is committed to ensuring that members are not materially disadvantaged as a result of these errors and rectification is expected to be finalised in FY17.
The above expense increases were offset by:
• Employee benefits expense: costs have decreased by $0.8 million or 9.2% over the previous year due to the prior year containing a number of transition impacts. There is one series of share performance rights remaining in respect of the employee incentive scheme (these share performance rights have been replaced by a different scheme referred to as deferred shares). Due to the increase in share price over the year expenses related to these rights were $0.9m. Salary costs increased by $0.1 million.
Financial positionWe retain a strong balance sheet position with no debt. Net assets increased by $1.7 million over the year to $12.8 million. The majority of assets are held in cash to meet our Australian Financial Services Licence (AFSL) requirements. The only significant non-cash asset is a property held in Canberra, which is discussed in detail in Note 7 of the Consolidated Financial Report. The assets held in excess of the
licence requirements provide a buffer in the event of a sustained market downturn.
Over the year we achieved $319 million in net flows, a 78% increase on the flows for the previous year of $179 million. An increase in online marketing contributed to the improved flows, which were supported by strong investment performance.
Celebrating 30 years 21Annual and Sustainability Report 2016
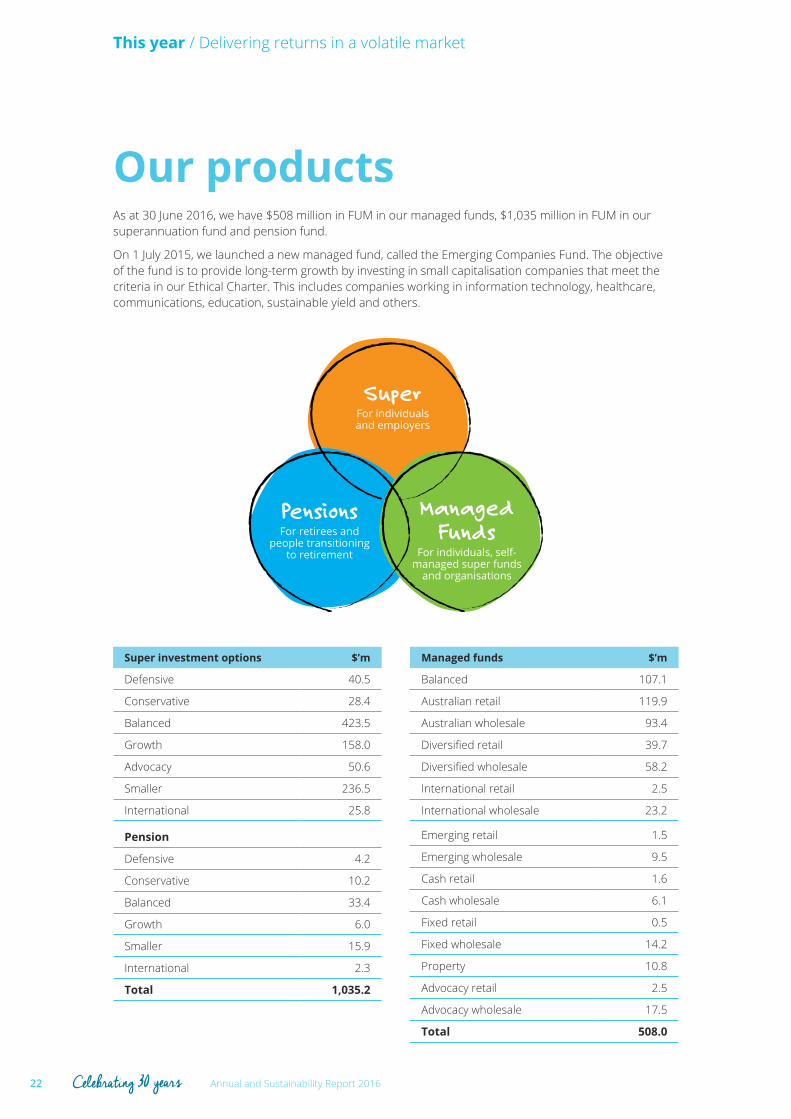
As at 30 June 2016, we have $508 million in FUM in our managed funds, $1,035 million in FUM in our superannuation fund and pension fund.
On 1 July 2015, we launched a new managed fund, called the Emerging Companies Fund. The objective of the fund is to provide long-term growth by investing in small capitalisation companies that meet the criteria in our Ethical Charter. This includes companies working in information technology, healthcare, communications, education, sustainable yield and others.
This year / Delivering returns in a volatile market
SuperFor individuals and employers
PensionsFor retirees and
people transitioning to retirement
Managed Funds
For individuals, self-managed super funds
and organisations
Our products
Super investment options $’m
Defensive 40.5
Conservative 28.4
Balanced 423.5
Growth 158.0
Advocacy 50.6
Smaller 236.5
International 25.8
Pension
Defensive 4.2
Conservative 10.2
Balanced 33.4
Growth 6.0
Smaller 15.9
International 2.3
Total 1,035.2
Managed funds $’m
Balanced 107.1
Australian retail 119.9
Australian wholesale 93.4
Diversified retail 39.7
Diversified wholesale 58.2
International retail 2.5
International wholesale 23.2
Emerging retail 1.5
Emerging wholesale 9.5
Cash retail 1.6
Cash wholesale 6.1
Fixed retail 0.5
Fixed wholesale 14.2
Property 10.8
Advocacy retail 2.5
Advocacy wholesale 17.5
Total 508.0
22 Annual and Sustainability Report 2016Celebrating 30 years

In December 2014, the Financial System Inquiry (FSI) released the Murray Report. To give you an idea of the influence of the FSI, previous reports in 1981 and 1997 led to the floating of the Australian dollar and the restructure of financial regulator ASIC.
Among other recommendations, the Murray Report called for the nation’s $1.8 trillion superannuation system to deliver better retirement outcomes, and for the powers of the regulators to be increased. At Australian Ethical, we support these initiatives to improve retirement outcomes.
Changes to superannuation were also announced in the FY17 Budget. The majority of these changes are proposals and will only apply if changes to the law are passed.
Super regulatory reform
Operating in a competitive market As social consciousness grows and the demand for ethical investing expands, competition is set to increase.
In the past three years, we’ve seen niche superannuation funds target consumers who have concerns around particular issues. At the same time, large superannuation funds are seeking to appeal to ethical consumers by launching sustainable options within their mainstream offering.
At the most basic level, this growth means that consumers want their money to benefit the planet and themselves and as a result are demanding more from professional money managers and superannuation funds.
We have benefited immensely from this increased demand. By leveraging digital platforms like Facebook and Google, we’ve met potential clients online and grown the interest and awareness of Australian Ethical Investment immensely.
Having honed our position in the market for 30 years, we welcome the current competition as it increases awareness of ethical investing and challenges us to keep our edge. We’ve been guided by our Ethical Charter since 1986, and compared to niche funds our prices are lower, and our products are more fully featured.
We are, and aim to remain, the voice of ethical investment in Australia.
23Annual and Sustainability Report 2016 Celebrating 30 years
Phot
o cr
edit:
Mer
idia
n En
ergy
9 The 2014 Nielsen Global Survey on Corporate Social Responsibility, http://www.nielsen.com/us/en/press-room/2014/global-consumers-are-willing-to-put-their-money-where-their-heart-is.html
10 Figures according to the Responsible Investment Benchmark Report 2016 by Responsible Investment Association Australia (RIAA). http://responsibleinvestment.org/resources/benchmark-report/aus-2016/
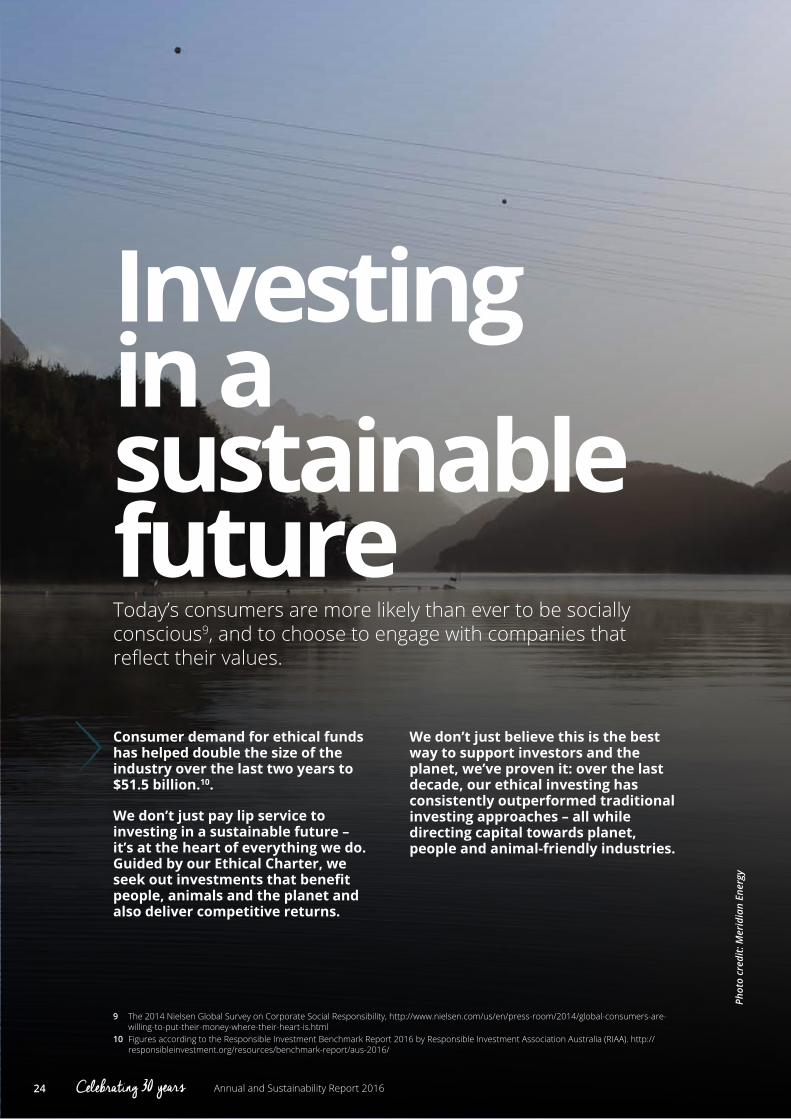
Consumer demand for ethical funds has helped double the size of the industry over the last two years to $51.5 billion.10.
We don’t just pay lip service to investing in a sustainable future – it’s at the heart of everything we do. Guided by our Ethical Charter, we seek out investments that benefit people, animals and the planet and also deliver competitive returns.
We don’t just believe this is the best way to support investors and the planet, we’ve proven it: over the last decade, our ethical investing has consistently outperformed traditional investing approaches – all while directing capital towards planet, people and animal-friendly industries.
Today’s consumers are more likely than ever to be socially conscious9, and to choose to engage with companies that reflect their values.
sustainable future
Investing in a
24 Annual and Sustainability Report 2016Celebrating 30 years

What is the number one concern you hear from potential clients about investing with Australian Ethical? The biggest concern is whether we can generate the same level of returns as mainstream funds. That’s an easy one for us to answer, because we have been consistently outperforming the mainstream market for years.
How does your team deliver investment returns as well as adhering to ethical standards?Once an investment passes our ethical filters, we try to maximise returns and generate the best performance we can, just like every other fund manager. I would argue that everyone filters the universe in some way, and then they apply their processes to try to generate the best outcome. We do the same thing, except the environmental and social issues are considered at the start of the process, not at the end.
What are the benefits of investing ethically?One of the biggest benefits – and this is really a driving force for us – is that if everyone invested ethically, we would be living in a much better world than we currently live in. Capital would be directed towards good things, such as cleaner energy and medical research, and investment decisions would not be based purely on self-interest.
The other major benefit of investing ethically, which people often don’t consider, is that we tend to have a higher level of research than traditional fund managers and super funds. At Australian Ethical, we look at environmental and social issues in great detail, well before mainstream managers started applying ESG research to their process. This level of detail tends to give us an advantage; we become aware of risks that others perhaps are not aware of, helping inform our investment decision.
How do you answer people who say that choosing to invest ethically comes at a risk to their retirement savings?I would tell them that is a myth. We have demonstrated that you can achieve competitive returns from ethical investments. We have proven that you do not have to compromise either on your values or on investment performance in order to save for your retirement future. We have shown that we can consistently outperform other funds and believe we will continue to do so, as long as we continue to follow our well established process, which I have every intention of ensuring we do!
Busting theinvestment mythQ&A with David Macri, Chief Investment Officer
25Annual and Sustainability Report 2016 Celebrating 30 years

How do you answer people who say that investing ethically is unlikely to change the world, because there will always be people willing to invest in things like tobacco, weapons and fossil fuels?There are still many people investing in things like weapons and tobacco, but ethical investing is gaining traction around the world, and the more that funds are invested this way, the bigger the impact. If a big proportion of the investment market stopped investing in coal, the cost of capital would go up, it would become difficult for coal companies to do business and the industry would find it tough. Divestment also sends a message that it’s not just civil society groups who take action against the social and environmental damage of unsustainable products. Serious investment managers are also deeply concerned by this harm and the threat it poses to the financial security of their clients. The investment market is incredibly influential. We can direct the world to a better place and to navigate some of the big risks like climate change. I think it is negligent of us not to use that influence in a positive way.
What will be some of the biggest challenges facing the ethical investment market moving forward?There are a large number of descriptions being assigned to funds these days – from ESG to sustainable, responsible and ethical. While there are differences between each approach, there is no conforming minimum standard. I think Responsible Investment Association Australasia (RIAA) have done a lot of good work trying to educate and certify products which help people make informed decisions. We urge investors who consider an ethical or responsible approach to look through the marketing material and ask whether the product does in fact meet their standard. We are the first to admit that we may not be suitable for everybody, but we at least pride ourselves on being fully transparent in how we invest.
What is Australian Ethical's investment outlook going forward?We expect global markets to remain volatile until a sustained economic recovery is more evident. In the near term prospects of recovery are being held back by sluggishness in Europe and the slowdown in growth in emerging economies particularly China.
In Australia we have subdued growth expectations. Employment growth has been slowing and signs of underemployment are visible, with much of 2016’s jobs growth coming from part-time not full-time roles. Wages growth has been slow, and in turn inflation has come in at a level well below the Reserve Bank’s target band.
Internationally, while the initial impacts on markets of the Brexit vote have subsided, the impact on global growth remains uncertain. In an attempt to prop up investor sentiment the European Central Bank expanded its ‘Quantitative Easing’ program and now includes corporate bonds.
In the US, recent payroll data has seen a bounce back to trend and the market is again pricing some possibility of the Federal Reserve resuming its tightening cycle. The biggest inhibitor for the Fed is that its tightening is out of step with otherwise accommodative global monetary policy and any moves to “go it alone” will see US dollar strength that could damage the recovery process.
This year / Investing in a sustainable future
26 Annual and Sustainability Report 2016Celebrating 30 years
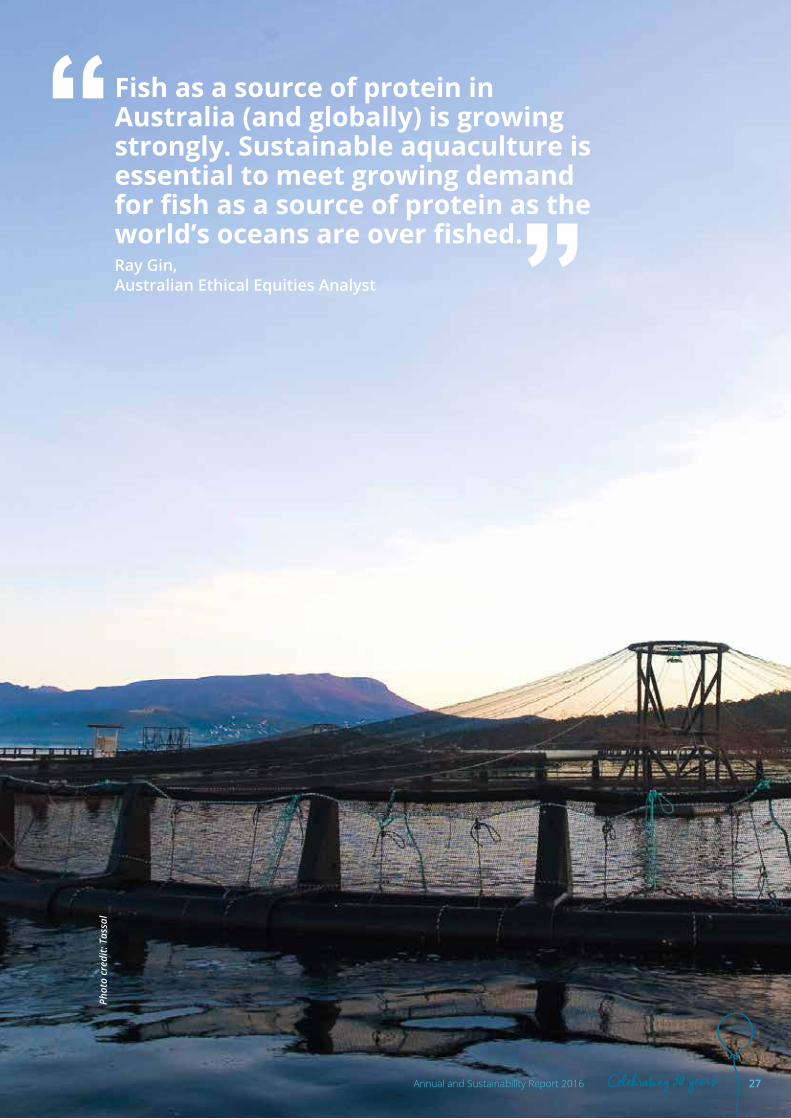
Fish as a source of protein in Australia (and globally) is growing strongly. Sustainable aquaculture is essential to meet growing demand for fish as a source of protein as the world’s oceans are over fished.Ray Gin, Australian Ethical Equities Analyst
Phot
o cr
edit:
Tas
sal
27Annual and Sustainability Report 2016 Celebrating 30 years

This year / Investing in a sustainable future
Did you know we are:
* One of the 9 largest super funds in Australia holding core responsible investments
* 6th largest investment manager of core responsible investments in Australia
* $1.56 billion funds under management at 30 June 2016
What’s happening in Australia?
Figures according to the Responsible Investment Benchmark Report 2016 Australia Report (pages 4, 9, 7, 11) by Responsible Investment Association Australia (RIAA). http://responsibleinvestment.org/wp-content/uploads/2016/07/RIA413_Benchmark_Report_A4_OZ_v4.pdfThe Responsible Investment Benchmark Report 2015, responsibleinvestment.org.
Largest asset managers of core responsible investments ($millions)
Generation Investment Management 961965
20142015
UCA Funds Management 971990
Hunter Hall Investment Management 1,0121,064
Uniting Financial Services 1,0611,039
Australian Ethical Investments 1,0381,366
Perpetual Investments 1,7011,860
BT Investment Management 1,8612,080
New Forests 2,4932,909
Investa Property Group 2,9053,257
AMP Capital 4,2324,237
That’s almost
half of all assets
professionally managed
in Australia
That
includes
us!
$ 633.2bn is the total responsible
investment industry accounted for at 31 Dec 2015
62% Growth in core
responsible investing bringing it to $51.5bn
28 Annual and Sustainability Report 2016Celebrating 30 years

REJECTION OF INVESTMENT
INVESTMENT IDEA
ETHICS ASSESSMENT
AND ANALYSIS FOR PORTFOLIO
INCLUSION
CONTINUAL MONITORING
OF INVESTMENT
APPROVAL OF INVESTMENT OR
The Australian Ethical approach to investingOur investment process is guided by our Ethical Charter, which has been in place since 1986. Follow the steps in the diagram below to see for yourself how every investment goes from being an idea to part of our portfolio.
Chief Investment Officer approves or rejects the investment. If approved a limit is established for the investment.
The following tools are used to ethically assess investments:
• Our Ethical Charter – investments are screened against both the positive and negative principles in the charter
• Industry-based and/or issue-based frameworks – developed by our Ethical Advisory Group, these help us to interpret our charter and make investment decisions.
Portfolios and investments are regularly reviewed by the Chief Investment Officer, Ethics Research Team and Portfolio Managers to ensure the following:
• ongoing compliance with our Ethical Charter
• investment remains suitable for portfolio inclusion
29Annual and Sustainability Report 2016 Celebrating 30 years

This year / Investing in a sustainable future
Investment performanceIn FY16, once again our performance across our funds and superannuation options has been excellent with many funds delivering above median performance over the year11.
Managed funds return to 30 June 2016
Fund
1 year 3 years 5 years 7 years 10 years
Return Quartile Return Quartile Return Quartile Return Quartile Return Quartile
Cash 1.5% 4 2.4% 2 3.2% 2 3.8% 1 4.0% 2
Fixed Interest 5.5% 3 5.2% n/a n/a n/a n/a n/a n/a n/a
Fixed Interest Wholesale 6.4% 3 n/a n/a n/a n/a n/a n/a n/a n/a
Balanced 5.6% 1 9.1% 1 8.2% 1 7.0% 4 4.2% 2
Diversified Shares 6.9% 1 13.0% 1 11.7% 1 8.9% 3 4.4% 2
Diversified Shares – Wholesale 8.3% 1 14.5% 1 n/a n/a n/a n/a n/a n/a
Advocacy 6.8% 1 13.3% 1 11.3% 1 n/a n/a n/a n/a
Advocacy – Wholesale 8.2% 1 14.8% 1 n/a n/a n/a n/a n/a n/a
Australian Shares 12.7% 1 15.4% 1 12.5% 1 11.1% 1 9.3% 1
Australian Shares – Wholesale 14.6% 1 17.2% 1 n/a n/a n/a n/a n/a n/a
International Shares 0.5% 1 12.7% 2 9.2% 4 5.8% 4 n/a n/a
International Shares – Wholesale 1.4% n/a n/a n/a n/a
Emerging Companies 16.4% n/a n/a n/a n/a
Emerging Companies – Wholesale 17.2% n/a n/a n/a n/a
Property 1.5% (0.9)% (0.4)% 1.8% n/a
Super accumulation return to 30 June 2016
Fund
1 year 3 years 5 years 7 years 10 years
Return Quartile Return Quartile Return Quartile Return Quartile Return Quartile
Defensive 0.9% 3 1.6% 2 2.3% 2 2.8% 2 3.1% 2
Conservative 3.5% 1 4.0% 3 4.1% 4 n/a n/a n/a n/a
Balanced 2.6% 1 7.1% 1 7.1% 2 5.9% 4 3.7% 2
Growth 0.8% 2 7.5% 1 7.8% 1 6.0% 4 2.8% 4
Smaller Companies 8.4% 1 12.9% 1 11.9% 1 10.3% 1 8.7% 1
International Equities (5.7)% 3 7.7% 3 6.9% 4 4.2% 4 n/a n/a
Advocacy 2.4% 1 10.6% 1 10.0% 1 n/a n/a n/a n/a
11 The rate of return has been calculated by Australian Ethical based on the periods to 30 June 2016. The calculation of the quartile is based on Mercer’s Peer Group category as at 30 June 2016.
30 Annual and Sustainability Report 2016Celebrating 30 years
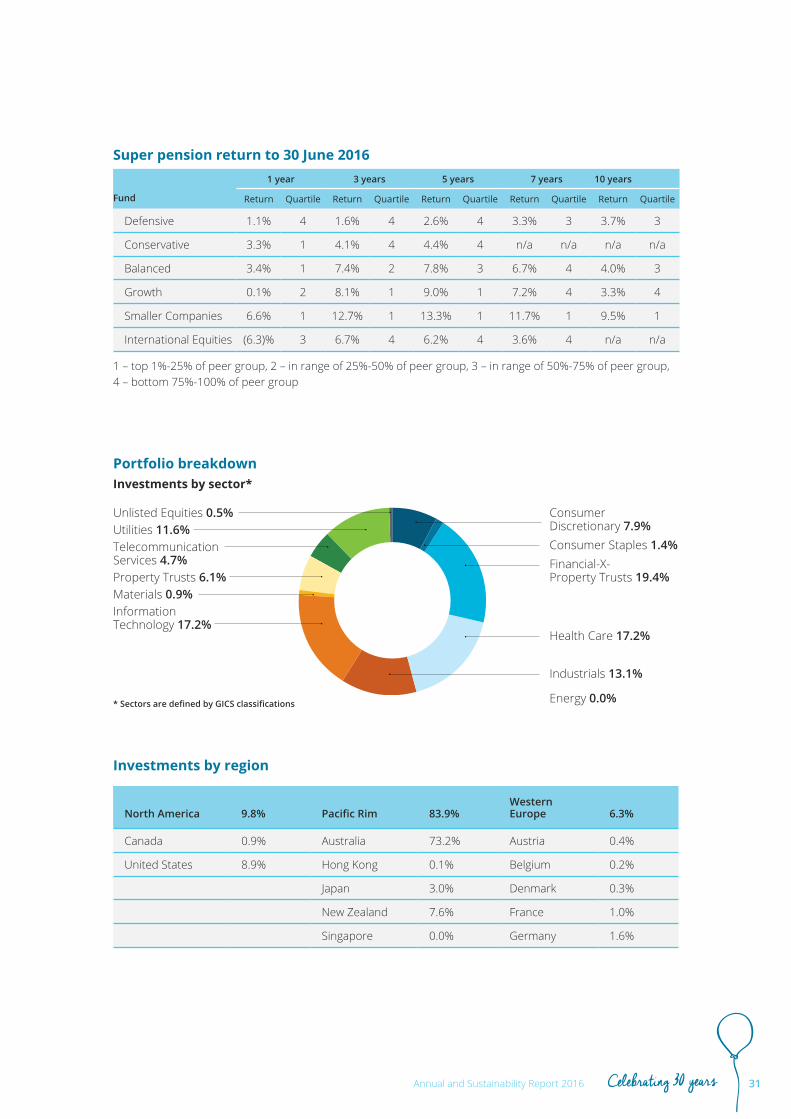
Super pension return to 30 June 2016
Fund
1 year 3 years 5 years 7 years 10 years
Return Quartile Return Quartile Return Quartile Return Quartile Return Quartile
Defensive 1.1% 4 1.6% 4 2.6% 4 3.3% 3 3.7% 3
Conservative 3.3% 1 4.1% 4 4.4% 4 n/a n/a n/a n/a
Balanced 3.4% 1 7.4% 2 7.8% 3 6.7% 4 4.0% 3
Growth 0.1% 2 8.1% 1 9.0% 1 7.2% 4 3.3% 4
Smaller Companies 6.6% 1 12.7% 1 13.3% 1 11.7% 1 9.5% 1
International Equities (6.3)% 3 6.7% 4 6.2% 4 3.6% 4 n/a n/a
1 – top 1%-25% of peer group, 2 – in range of 25%-50% of peer group, 3 – in range of 50%-75% of peer group, 4 – bottom 75%-100% of peer group
Portfolio breakdownInvestments by sector*
Investments by region
Consumer Discretionary 7.9%Consumer Staples 1.4%Financial-X- Property Trusts 19.4%
Health Care 17.2%
Industrials 13.1%
Energy 0.0%
North America 9.8% Pacific Rim 83.9%Western Europe 6.3%
Canada 0.9% Australia 73.2% Austria 0.4%
United States 8.9% Hong Kong 0.1% Belgium 0.2%
Japan 3.0% Denmark 0.3%
New Zealand 7.6% France 1.0%
Singapore 0.0% Germany 1.6%
Unlisted Equities 0.5%Utilities 11.6%Telecommunication Services 4.7%Property Trusts 6.1%Materials 0.9%Information Technology 17.2%
* Sectors are defined by GICS classifications
31Annual and Sustainability Report 2016 Celebrating 30 years
This year / Investing in a sustainable future
We have an impact by our choices of who we will and won’t invest in. We are also a positive influence by actively engaging with companies to support them to comply with our Charter.
We work to:
• enquire with a company or other third parties to test alignment with the Ethical Charter following identification of a significant event.
• engage and explore identified areas of non-alignment or potential non-alignment with the Charter. We may also engage on topics which may increase alignment with positive elements of the Charter.
• advocate privately, through collaborative influence or public advocacy for specific change to address identified areas of nonalignment with the Charter.
In FY16, we worked on a total of 76 distinct engagements on social and environmental issues. In a nutshell, here’s what we advocated for last year:
• Respect for human rights and employees
• Animal welfare
• Better government policy
• Better understanding of fiduciary responsibilities of Directors, trustees and investors
• Responsible lending
• Climate action
• Purpose driven business
• Improved banking sector conduct
• Sustainable agriculture and less use of antibiotics
• Responsible corporate lobbying
• More recycling
• Sustainable supply chains
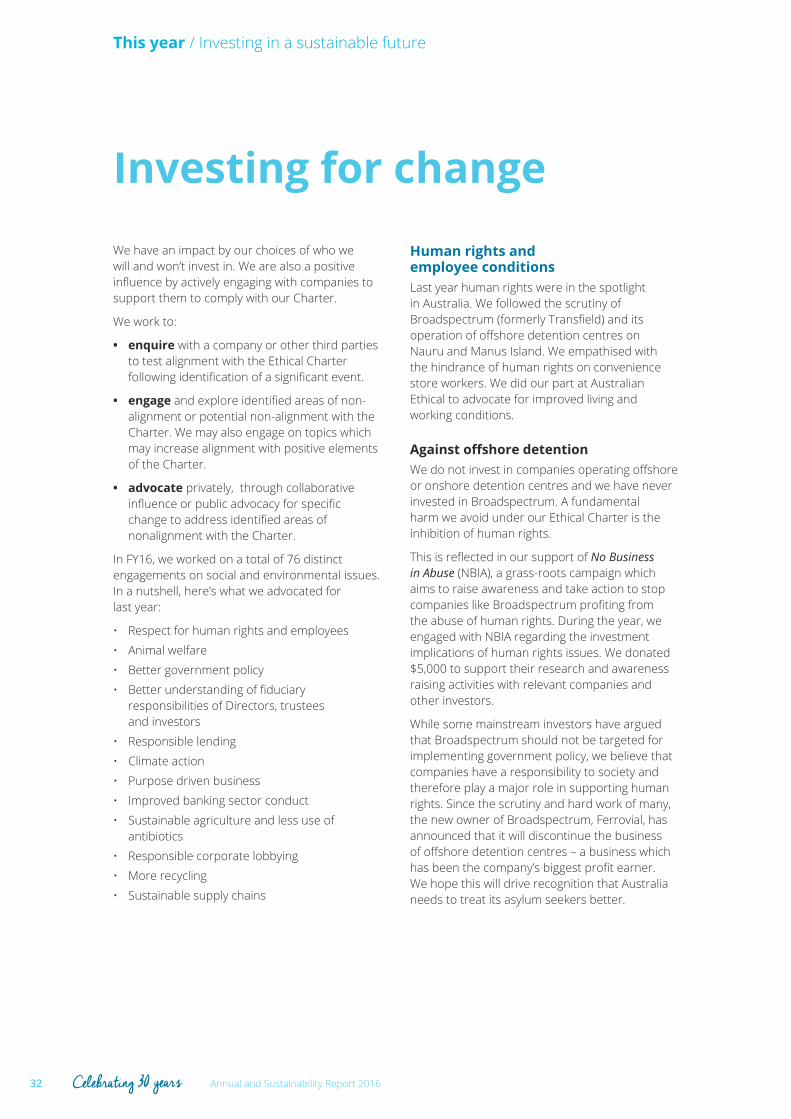
Human rights and employee conditionsLast year human rights were in the spotlight in Australia. We followed the scrutiny of Broadspectrum (formerly Transfield) and its operation of offshore detention centres on Nauru and Manus Island. We empathised with the hindrance of human rights on convenience store workers. We did our part at Australian Ethical to advocate for improved living and working conditions.
Against offshore detentionWe do not invest in companies operating offshore or onshore detention centres and we have never invested in Broadspectrum. A fundamental harm we avoid under our Ethical Charter is the inhibition of human rights.
This is reflected in our support of No Business in Abuse (NBIA), a grass-roots campaign which aims to raise awareness and take action to stop companies like Broadspectrum profiting from the abuse of human rights. During the year, we engaged with NBIA regarding the investment implications of human rights issues. We donated $5,000 to support their research and awareness raising activities with relevant companies and other investors.
While some mainstream investors have argued that Broadspectrum should not be targeted for implementing government policy, we believe that companies have a responsibility to society and therefore play a major role in supporting human rights. Since the scrutiny and hard work of many, the new owner of Broadspectrum, Ferrovial, has announced that it will discontinue the business of offshore detention centres – a business which has been the company’s biggest profit earner. We hope this will drive recognition that Australia needs to treat its asylum seekers better.
Investing for change
32 Annual and Sustainability Report 2016Celebrating 30 years
Improving working conditionsDid you know we’re part of an international group of investors working to improve the reporting of working conditions and other human rights impacts of business around the world? The group advocates for a new reporting framework for business compliance with the UN Guiding Principles on Business and Human Rights. The framework is a guide for companies to identify and explore the human rights issues in their operations and supply chains and to develop policies, systems and practices that safeguard human rights.
This year we used the framework in a number of engagements with Australian and global companies to investigate concerns about restrictions on employee union participation, compulsory overtime and handling of asbestos-related claims. In most cases we saw positive improvements in company practices.
Supporting animal welfareAustralia also has a long way to go in protecting and supporting animal rights. This year, we became the first Australian fund to join international investors to promote ethical agriculture using the Business Benchmark on Farm Animal Welfare. The Benchmark ranks global food producers and supermarkets (including Woolworths and Coles) according to their management and reporting of impacts on the wellbeing of farm animals. As you can probably imagine there is much room for improvement by the Australian supermarkets.
We’ve also joined the Farm Animal Investment Risk & Return Initiative, working to harness investor influence to improve animal treatment in food production. Through this, we recently supported a campaign targeting the excessive use of antibiotics in livestock production. Indiscriminate antibiotic use is concerning for many reasons. It facilitates overcrowding of farm animals; there’s an impact on animal wellbeing when used to promote growth rates; and the encouragement of antibiotic-resistant bacteria poses great risk to the health of both humans and animals.
Better governmentBetter government is always an interest of ours, and this year we have been advocating for improving policy around:
• Corporate reporting and reduction of emissions – in our submission to the Senate inquiry into Carbon Risk Disclosure in March 2016, we argued that increased corporate monitoring and reporting of emissions is fundamental to ensuring companies set accountable emissions reduction targets. We proposed specific disclosure requirements and also contributed to pro-transparency submissions made by the Investor Group on Climate Change and Financial Services Council. Refer to ‘Corporate climate lobbying’ on page 47 for more information.
• Unconventional gas mining – in March 2016, we called for a moratorium on unconventional gas mining in our submission to the Senate inquiry into regulation of that sector. We don’t invest in the sector because of the risk of water contamination and fugitive methane emissions, alongside other adverse community and environmental impacts of the sector. Read our full submission here: aph.gov.au/Parliamentary_Business/Committees/Senate/Gasmining/Gasmining/Submissions.
33Annual and Sustainability Report 2016 Celebrating 30 years
This year / Investing in a sustainable future
• Recycling – in February 2016, we supported the introduction of a container deposit scheme in NSW to raise recycling rates. We’re happy to see that the NSW Government has announced plans for such a scheme (start saving those bottles!). Full details are on our website.
• Businesses impact on climate change – in April 2016 we presented at an Australian Labour Party event hosted by the Financial Services Council called The good business of managing climate change. Shadow treasurer Chris Bowen also presented.
• Lobbying at Parliament House – Our CEO joined a group of investors meeting with members of parliament in Canberra to build support for the opportunities in impact investing.
Fiduciary dutyFor many years companies and investment managers have claimed that they can’t decrease their impact on global warming because of their legal duties. This is often offered as a reason for inaction but it misunderstands fiduciary legal responsibilities. (Note: we don’t buy it!)
This year we continued to advocate publicly and privately for change to these entrenched attitudes. Our Managing Director recently challenged the status quo in industry magazine Superfunds, arguing that it’s not the law that constrains action, but inertia and a lack of will. Our Head of Ethics Research discussed the importance of business purpose at a two-day conference in Sydney. As part of a B Corp Working Group, we are exploring how changes in legislation and regulation can help.
The B Corp movement represents an emerging group of companies that are using the power of business to create a positive impact on the world. By becoming a certified B Corp and using other B Corps for service delivery, we aim to support and grow the better business community.
Banking culture in AustraliaYou’ve probably heard or seen or experienced poor conduct in the banking sector. With excessive fees, inappropriate financial advice, rejection of insurance claims and manipulation of interest rates there is much media debate about the state of bank ‘culture’. Additionally, banks also need to be accountable for the impacts that their lending decisions can have.
We like to think of ourselves as helping transform banking culture and lending decisions from within the financial services sector. We argue that banks need to say more about how they are creating organisations of integrity and be transparent about the impacts of their lending activities (See the “Big four banks and climate” on page 47 for more information on this).
We're not prescribing a particular corporate culture, we're simply saying that companies need to put customers back at the centre of their decision making. With greater consumer awareness, companies, particularly banks, will need to get their acts together... culturally speaking.
34 Annual and Sustainability Report 2016Celebrating 30 years
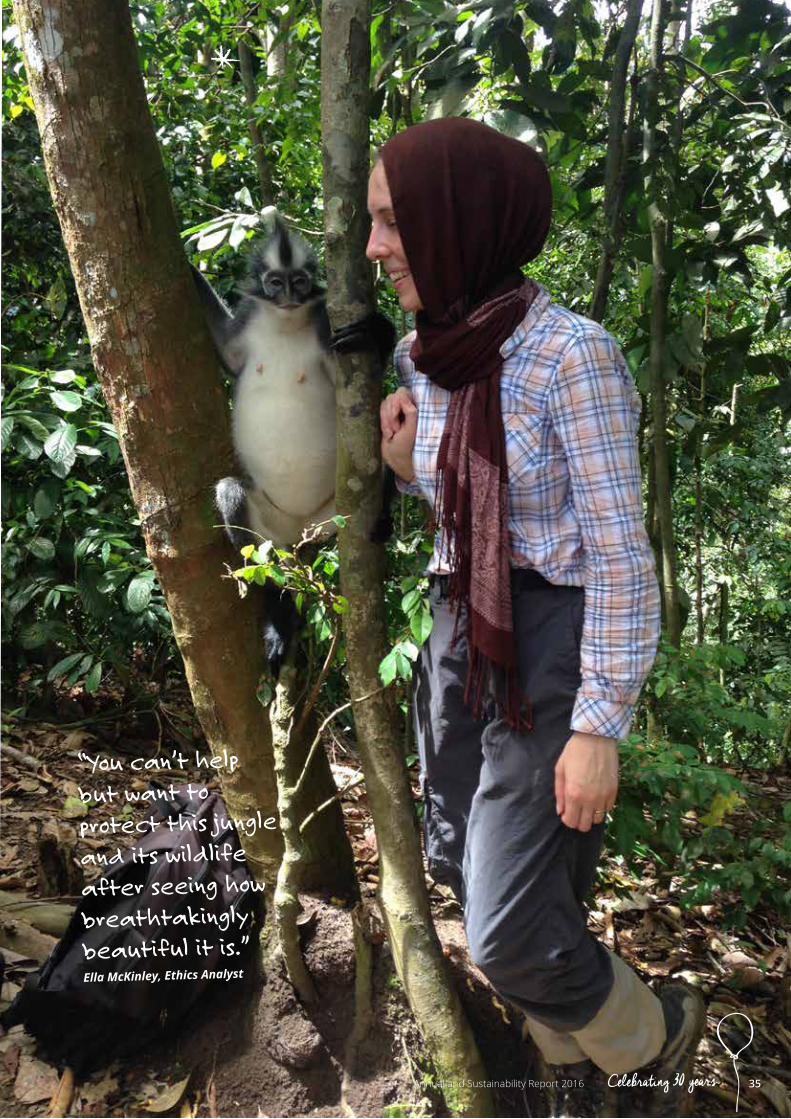
“You can’t help
but want to
protect this jungle
and its wildlife
after seeing how
breathtakingly
beautiful it is.”Ella McKinley, Ethics Analyst
35Annual and Sustainability Report 2016 Celebrating 30 years
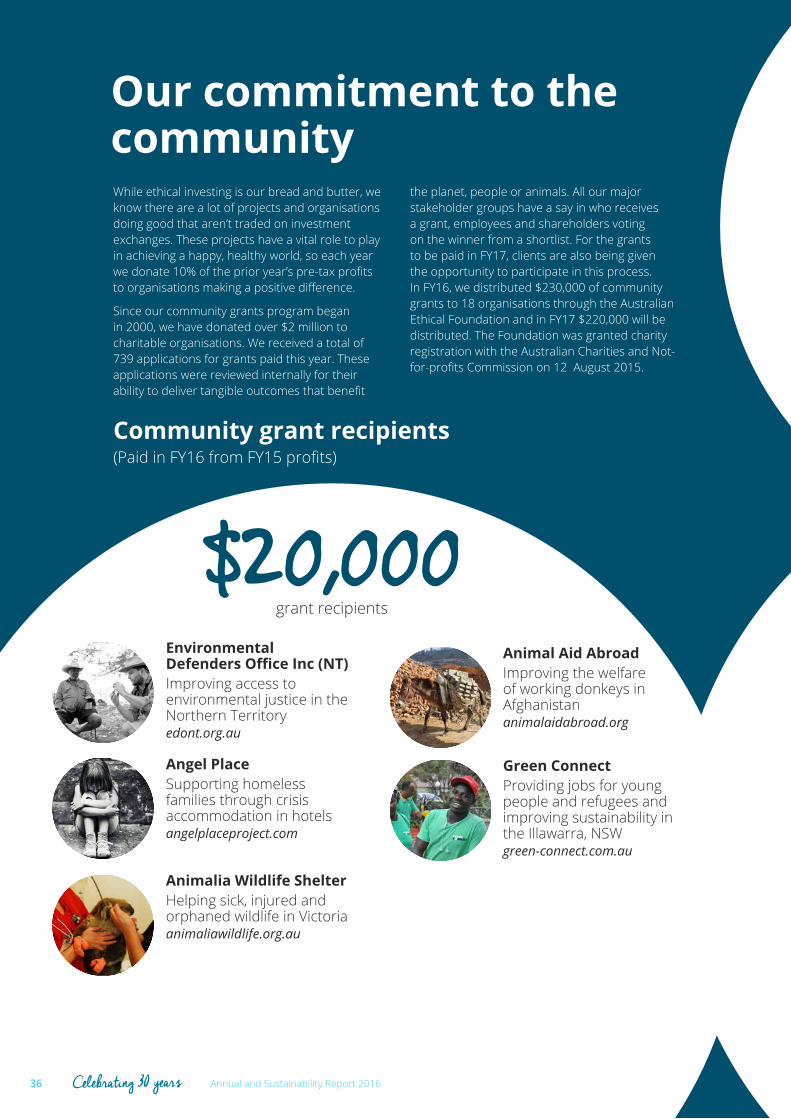
While ethical investing is our bread and butter, we know there are a lot of projects and organisations doing good that aren’t traded on investment exchanges. These projects have a vital role to play in achieving a happy, healthy world, so each year we donate 10% of the prior year’s pre-tax profits to organisations making a positive difference.
Since our community grants program began in 2000, we have donated over $2 million to charitable organisations. We received a total of 739 applications for grants paid this year. These applications were reviewed internally for their ability to deliver tangible outcomes that benefit
the planet, people or animals. All our major stakeholder groups have a say in who receives a grant, employees and shareholders voting on the winner from a shortlist. For the grants to be paid in FY17, clients are also being given the opportunity to participate in this process. In FY16, we distributed $230,000 of community grants to 18 organisations through the Australian Ethical Foundation and in FY17 $220,000 will be distributed. The Foundation was granted charity registration with the Australian Charities and Not-for-profits Commission on 12 August 2015.
Our commitment to the community
Community grant recipients(Paid in FY16 from FY15 profits)
Environmental Defenders Office Inc (NT)Improving access to environmental justice in the Northern Territoryedont.org.au
Angel PlaceSupporting homeless families through crisis accommodation in hotelsangelplaceproject.com
Animalia Wildlife ShelterHelping sick, injured and orphaned wildlife in Victoria animaliawildlife.org.au
Animal Aid AbroadImproving the welfare of working donkeys in Afghanistananimalaidabroad.org
Green ConnectProviding jobs for young people and refugees and improving sustainability in the Illawarra, NSWgreen-connect.com.au
$20,000grant recipients
36 Annual and Sustainability Report 2016Celebrating 30 years
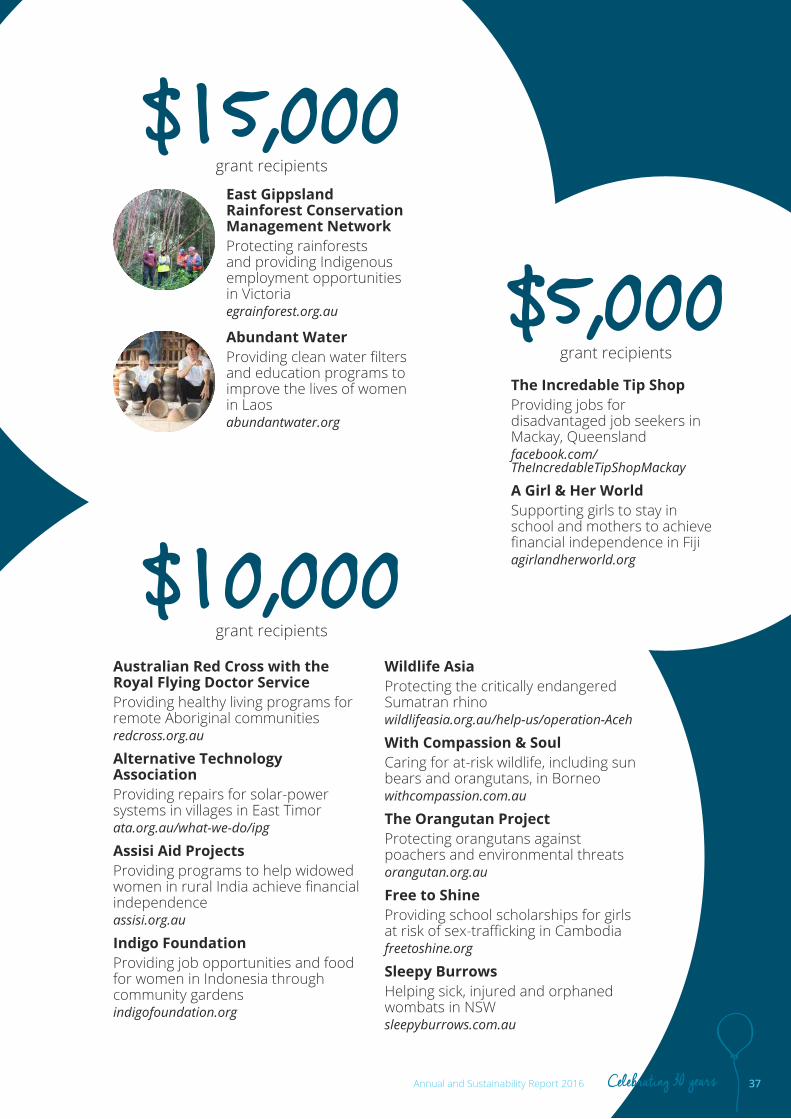
East Gippsland Rainforest Conservation Management NetworkProtecting rainforests and providing Indigenous employment opportunities in Victoriaegrainforest.org.au
Abundant WaterProviding clean water filters and education programs to improve the lives of women in Laos abundantwater.org
Australian Red Cross with the Royal Flying Doctor ServiceProviding healthy living programs for remote Aboriginal communitiesredcross.org.au
Alternative Technology AssociationProviding repairs for solar-power systems in villages in East Timorata.org.au/what-we-do/ipg
Assisi Aid ProjectsProviding programs to help widowed women in rural India achieve financial independence assisi.org.au
Indigo FoundationProviding job opportunities and food for women in Indonesia through community gardens indigofoundation.org
Wildlife AsiaProtecting the critically endangered Sumatran rhinowildlifeasia.org.au/help-us/operation-Aceh
With Compassion & SoulCaring for at-risk wildlife, including sun bears and orangutans, in Borneowithcompassion.com.au
The Orangutan ProjectProtecting orangutans against poachers and environmental threats orangutan.org.au
Free to ShineProviding school scholarships for girls at risk of sex-trafficking in Cambodiafreetoshine.org
Sleepy BurrowsHelping sick, injured and orphaned wombats in NSWsleepyburrows.com.au
The Incredable Tip ShopProviding jobs for disadvantaged job seekers in Mackay, Queenslandfacebook.com/TheIncredableTipShopMackay
A Girl & Her WorldSupporting girls to stay in school and mothers to achieve financial independence in Fijiagirlandherworld.org$10,000
grant recipients
$15,000grant recipients
$5,000grant recipients
37Annual and Sustainability Report 2016 Celebrating 30 years
This year / Our commitment to the community
Giving back our timeWe know it’s important to donate time – not just money – to charitable organisations. That’s why we encourage our employees to volunteer with the organisations we support, so they can see first-hand the good work these organisations do.
In FY16, each Australian Ethical employee was given two full working days to volunteer. This meant, as a team, we donated a total of 315 volunteering hours between our 31 employees. Employees can also organise their own volunteering activities as part of the two-day allocation.
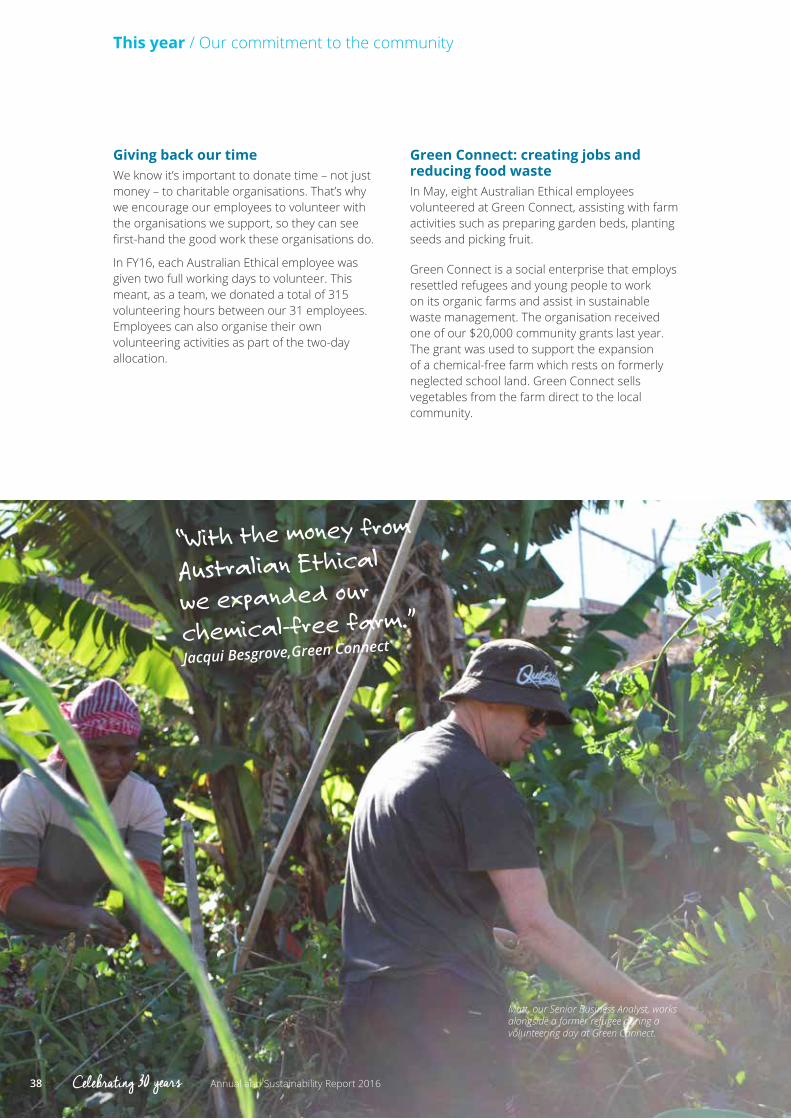
Green Connect: creating jobs and reducing food wasteIn May, eight Australian Ethical employees volunteered at Green Connect, assisting with farm activities such as preparing garden beds, planting seeds and picking fruit.
Green Connect is a social enterprise that employs resettled refugees and young people to work on its organic farms and assist in sustainable waste management. The organisation received one of our $20,000 community grants last year. The grant was used to support the expansion of a chemical-free farm which rests on formerly neglected school land. Green Connect sells vegetables from the farm direct to the local community.
Matt, our Senior Business Analyst, works alongside a former refugee during a volunteering day at Green Connect.
“With the money from
Australian Ethical
we expanded our
chemical-free farm.”
Jacqui Besgrove,Green Connect
38 Celebrating 30 years Annual and Sustainability Report 2016
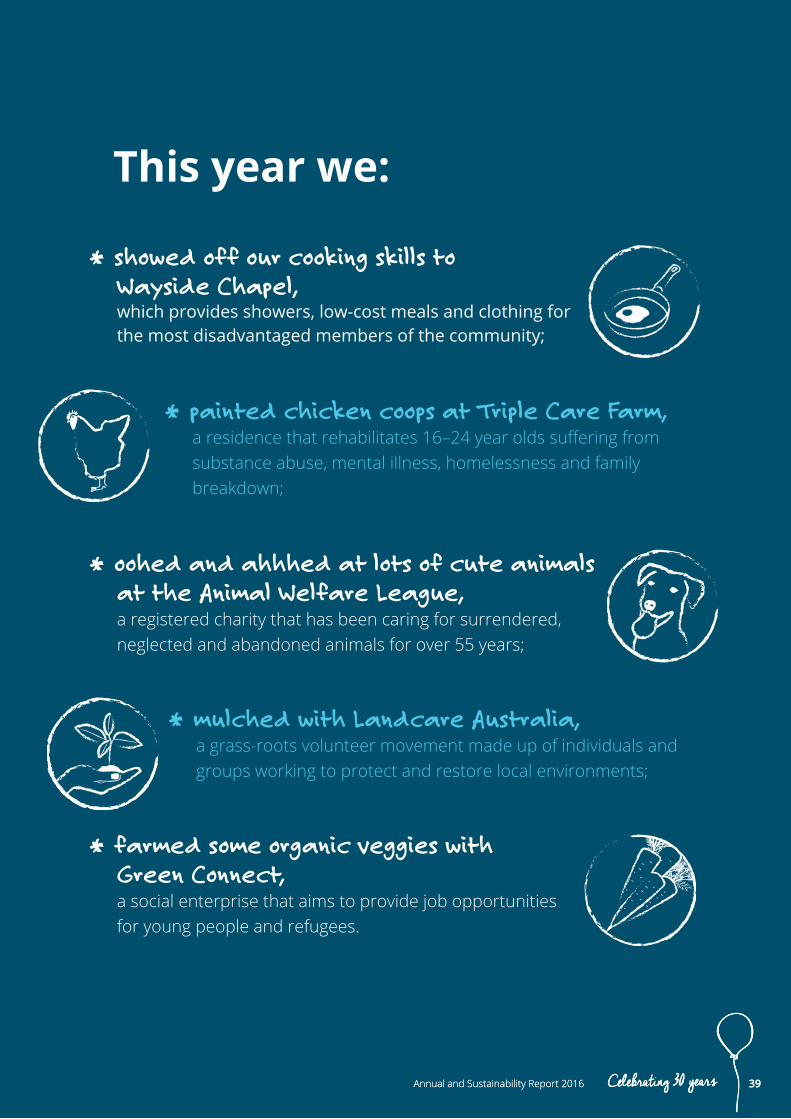
* showed off our cooking skills to Wayside Chapel, which provides showers, low-cost meals and clothing for the most disadvantaged members of the community;
* painted chicken coops at Triple Care Farm,a residence that rehabilitates 16–24 year olds suffering from substance abuse, mental illness, homelessness and family breakdown;
* oohed and ahhhed at lots of cute animals at the Animal Welfare League, a registered charity that has been caring for surrendered, neglected and abandoned animals for over 55 years;
* mulched with Landcare Australia, a grass-roots volunteer movement made up of individuals and groups working to protect and restore local environments;
* farmed some organic veggies with Green Connect, a social enterprise that aims to provide job opportunities for young people and refugees.
This year we:
39Annual and Sustainability Report 2016 Celebrating 30 years 39Annual and Sustainability Report 2016 Celebrating 30 years

Transitioning towards a lower carbon economy
The international community negotiated a new global climate agreement at the end of 2015 in Paris. We support this agreement to limit the planet’s temperature rise to well below 2° celsius.
We know this is the only way to ensure a fair and sustainable future for people, animals and the planet. The transition to a lower-carbon economy has begun, and as fund managers we’re driving change in three ways:
Our investment choices (avoiding climate unfriendly sectors and targeting climate friendly sectors); our advocacy on climate policy; reducing and offsetting our own operational emissions.
We recognise that climate change presents a specific series of risks for investors, super fund members and shareholders. The economy’s reliance on energy from fossil fuels can’t continue. Reductions in carbon emissions require a fundamental change in the energy mix that underpins business and investment activity and we all have a responsibility to act.
Transitioning towards a lower carbon economy
40 Annual and Sustainability Report 2016Celebrating 30 years

Making it happen through climate commitments
Our decarbonisation commitment is designed to:
Drive right outcomes
• A process that creates incentives to invest in all aspects of clean energy by taking into account positive and negative impacts of investments.
• Addresses structural changes needed across the economy and society.
• Drives capital to zero emissions energy production (e.g. wind and solar); low energy use sectors (e.g. software and digital content); and technologies which increase the efficiency of energy use (e.g. LED lighting, recycling and smart energy products).
Be practical to implement
• Integrates the target into our portfolio management to continue to meet our dual objectives of ethical and high-performing investments.
Ensure transparency
• Transparency of progress against our targets creates internal and external accountability and shows clients the impact of their choices.
Inspire others
• Shows leadership, sharing tools which other investors and companies can adopt, leveraging our impact as an ethical investor beyond our own portfolios.
We’ve set a zero emissions target for our investment portfolio. As far as we know, we’re the only Australian-based fund to have done so.
We are committed to:
• targeting our portfolios to be zero emissions intensive by 205012 following a pathway consistent with keeping warming below 2° Celsius.
• disclosing the emissions intensity of our portfolios, starting with the intensity of our equities portfolio and moving to other asset classes in the future.
We’re part of two international climate action initiatives, the Montreal Pledge and Portfolio Decarbonisation Coalition, which are driving investor disclosure and decarbonisation.
We believe that all investment funds should disclose the emissions intensity of their portfolios and set emissions reduction targets. While it is easy to simply focus on the fossil fuel industry as the most emissions-intensive sector, it is not enough. To fully meet the urgent challenge of global warming, the entire economy needs to ‘decarbonise’.
12 The 2050 target has been set in line with recommendations of the Australian Climate Change Authority. We will continue to work to move more quickly.
41Annual and Sustainability Report 2016 Celebrating 30 years
This year / Transitioning towards a lower carbon economy
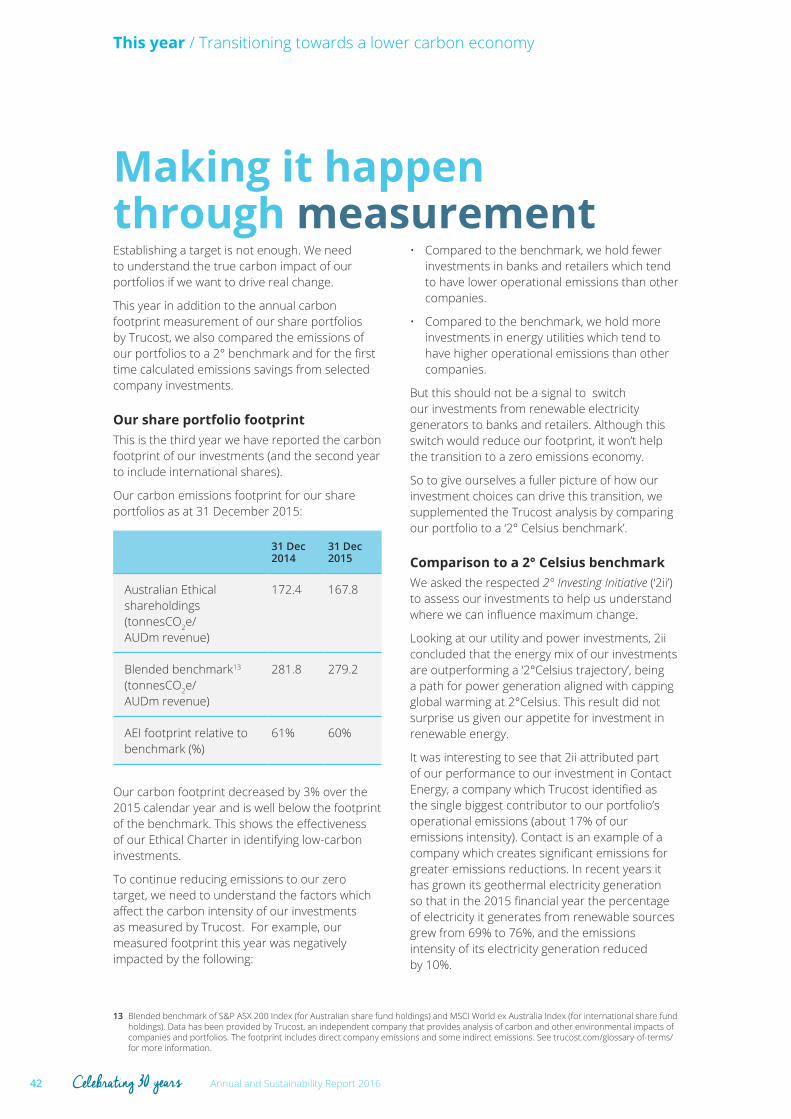
Establishing a target is not enough. We need to understand the true carbon impact of our portfolios if we want to drive real change.
This year in addition to the annual carbon footprint measurement of our share portfolios by Trucost, we also compared the emissions of our portfolios to a 2° benchmark and for the first time calculated emissions savings from selected company investments.
Our share portfolio footprintThis is the third year we have reported the carbon footprint of our investments (and the second year to include international shares).
Our carbon emissions footprint for our share portfolios as at 31 December 2015:
31 Dec 2014
31 Dec 2015
Australian Ethical shareholdings (tonnesCO2e/AUDm revenue)
172.4 167.8
Blended benchmark13 (tonnesCO2e/AUDm revenue)
281.8 279.2
AEI footprint relative to benchmark (%)
61% 60%
Our carbon footprint decreased by 3% over the 2015 calendar year and is well below the footprint of the benchmark. This shows the effectiveness of our Ethical Charter in identifying low-carbon investments.
To continue reducing emissions to our zero target, we need to understand the factors which affect the carbon intensity of our investments as measured by Trucost. For example, our measured footprint this year was negatively impacted by the following:
• Compared to the benchmark, we hold fewer investments in banks and retailers which tend to have lower operational emissions than other companies.
• Compared to the benchmark, we hold more investments in energy utilities which tend to have higher operational emissions than other companies.
But this should not be a signal to switch our investments from renewable electricity generators to banks and retailers. Although this switch would reduce our footprint, it won’t help the transition to a zero emissions economy.
So to give ourselves a fuller picture of how our investment choices can drive this transition, we supplemented the Trucost analysis by comparing our portfolio to a ‘2° Celsius benchmark’.
Comparison to a 2° Celsius benchmarkWe asked the respected 2° Investing Initiative (‘2ii’) to assess our investments to help us understand where we can influence maximum change.
Looking at our utility and power investments, 2ii concluded that the energy mix of our investments are outperforming a ‘2°Celsius trajectory’, being a path for power generation aligned with capping global warming at 2°Celsius. This result did not surprise us given our appetite for investment in renewable energy.
It was interesting to see that 2ii attributed part of our performance to our investment in Contact Energy, a company which Trucost identified as the single biggest contributor to our portfolio’s operational emissions (about 17% of our emissions intensity). Contact is an example of a company which creates significant emissions for greater emissions reductions. In recent years it has grown its geothermal electricity generation so that in the 2015 financial year the percentage of electricity it generates from renewable sources grew from 69% to 76%, and the emissions intensity of its electricity generation reduced by 10%.
Making it happen through measurement
13 Blended benchmark of S&P ASX 200 Index (for Australian share fund holdings) and MSCI World ex Australia Index (for international share fund holdings). Data has been provided by Trucost, an independent company that provides analysis of carbon and other environmental impacts of companies and portfolios. The footprint includes direct company emissions and some indirect emissions. See trucost.com/glossary-of-terms/ for more information.
42 Annual and Sustainability Report 2016Celebrating 30 years

We invest in REC Silicon
REC Silicon produces silicon
Silicon is used in manufacturing solar PV panels
Solar PV panels generate renewable
electricity
Renewable electricity reduces
emissions by avoiding generation
of electricity from fossil fuels
Because we think it’s crucial to better understand these positive impacts of renewable energy – and of insulation, recycling and other ‘energy productivity’ technologies we invest in – we also worked this year with international accounting firm EY to actually quantify these emissions savings benefits.
Capturing emissions savingsThe lifecycle emissions experts at EY helped us analyse the positive impacts of selected companies in our portfolio who are doing good things like making household insulation and bicycles, generating renewable electricity and recycling waste metals. One of the companies we looked at was REC Silicon. REC Silicon is identified by Trucost as one of our highest emitters because silicon production is an energy intensive process. But silicon is part of the climate solution, not the climate problem (see diagram at right).
We calculated the emissions savings from our investment in REC Silicon during 2015 as 1,248 tonnes of CO2e. We explain how we worked this out on the next page.
So even though our investment in REC Silicon was identified by Trucost as one of the 10 biggest contributors to our emissions footprint, our work with EY indicates that when you look at the bigger picture this investment is actually lowering global emissions. We’ll continue to develop and refine this method for estimating the emissions saved by our investments. We’ll also look for ways to combine emissions savings with our carbon footprint calculations to provide a more complete picture of the climate impact of our investing.
43Annual and Sustainability Report 2016 Celebrating 30 years

Transitioning towards a lower carbon economy
Savings from switching to PV solar 0.58 tonnes CO2e per MWh of electricity
Electricity production from solar panels built with the silicon that REC Silcon produced in 2015
41,847,000 MWh of electricity
Total emissions savings from this electricity 24,271,260 tonnes CO2e 41,847,000 x 0.58 = 24,271,260
Price of this electricity $3,046 million (present value calculated by EY)
REC Silicon’s 2015 revenue from the sale of silicon used for this electricity, less direct external input costs
$100.7 million
REC Silicon’s share of emission savings 802,402 tonnes CO2e 100.7/3,046 (i.e. 3.3%) x 24,271,260 = 802,402
REC Silicon’s 2015 emissions from silicon production
386,554 tonnes CO2e From REC Silicon annual report
REC Silicon’s net emission savings 415,848 tonnes CO2e 802,402 – 386,554 = 415,848
Our ownership of REC Silicon at end 2015 0.3% (of enterprise value)
Emissions savings from our investment in REC Silicon in 2015
1,248 tonnes CO2e 0.3% x 415,848 = 1,248
14 This is gross avoided emissions, based on a global average emissions intensity estimate for fossil fuel generation calculated using the IEA 2 degree climate change scenario. The calculation takes account of reducing solar PV electricity generation over the 25 year assumed lifetime of the solar panels. It also includes the IEA assumptions about carbon capture and storage for fossil fuel generators. The emissions avoided from PV solar will be greater if these assumptions are overly optimistic, as we fear they are.
REC Silicon produces silicon used for PV solar electricity generation. EY calculates that typical solar panels avoid 0.58 tonnes of CO2e per MWh of electricity generated14. They also calculate that solar panels built using silicon produced by REC Silicon in 2015 will generate around 41,847,000 MWh of electricity over their lifetime. Multiplying these two numbers together gives total lifetime avoided emissions of around 24 million tonnes of CO2e from solar panels using silicon from REC Silicon.
REC Silicon can’t take all the credit for this. The next step is to share these avoided emissions between REC Silicon and the other businesses involved in solar electricity generation (from the manufacturers of other PV solar components through to the panel fabricators and installers and the electricity distributors). For this sharing of emissions savings, our ethics research team
developed an innovative method to calculate REC Silicon’s contribution to the total ‘value chain’ for production of PV solar electricity. We calculate this value contribution as 3.3% of the end price of the electricity generated from the company’s silicon production. See ‘Sharing the blame and credit’ which follows for more on our allocation approach.
Putting this all together means that around 802,402 tonnes of CO2e emissions will be avoided because of REC Silicon’s 2015 silicon production. But producing this silicon emits carbon, so we deduct the company’s 2015 production emissions to give net avoided emissions of 415,848 tonnes.
Finally, based on the 0.3% of the company we owned at the end of 2015, we can put our hand on our heart and claim credit for around 1,248 tonnes of CO2e emissions savings from our investment in REC Silicon during 2015.
Saving emissions at REC Silicon
Panels at Nyngen Solar Farm
44 Celebrating 30 years Annual and Sustainability Report 2016
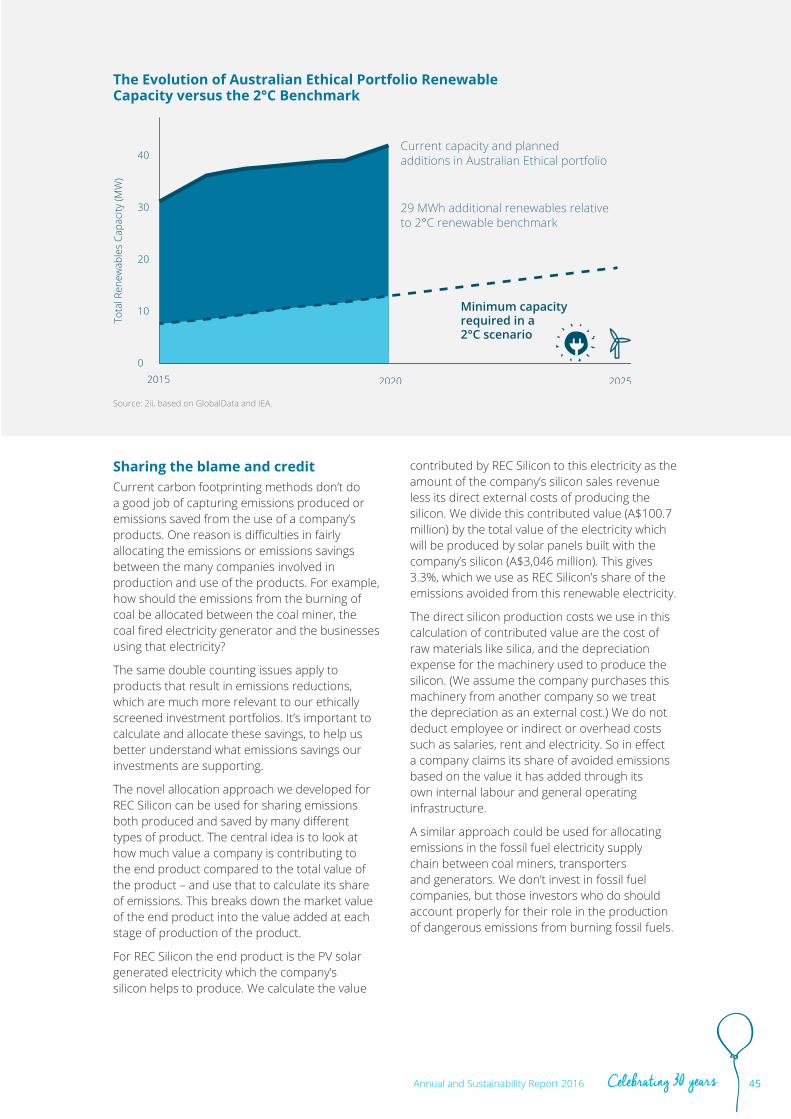
Current capacity and planned additions in Australian Ethical portfolio
29 MWh additional renewables relative to 2°C renewable benchmark
Minimum capacity required in a 2°C scenario
2015 2020 2025
Tota
l Ren
ewab
les
Capa
city
(MW
)
40
30
20
10
0
Source: 2ii, based on GlobalData and IEA.
Sharing the blame and creditCurrent carbon footprinting methods don’t do a good job of capturing emissions produced or emissions saved from the use of a company’s products. One reason is difficulties in fairly allocating the emissions or emissions savings between the many companies involved in production and use of the products. For example, how should the emissions from the burning of coal be allocated between the coal miner, the coal fired electricity generator and the businesses using that electricity?
The same double counting issues apply to products that result in emissions reductions, which are much more relevant to our ethically screened investment portfolios. It’s important to calculate and allocate these savings, to help us better understand what emissions savings our investments are supporting.
The novel allocation approach we developed for REC Silicon can be used for sharing emissions both produced and saved by many different types of product. The central idea is to look at how much value a company is contributing to the end product compared to the total value of the product – and use that to calculate its share of emissions. This breaks down the market value of the end product into the value added at each stage of production of the product.
For REC Silicon the end product is the PV solar generated electricity which the company’s silicon helps to produce. We calculate the value
contributed by REC Silicon to this electricity as the amount of the company’s silicon sales revenue less its direct external costs of producing the silicon. We divide this contributed value (A$100.7 million) by the total value of the electricity which will be produced by solar panels built with the company’s silicon (A$3,046 million). This gives 3.3%, which we use as REC Silicon’s share of the emissions avoided from this renewable electricity.
The direct silicon production costs we use in this calculation of contributed value are the cost of raw materials like silica, and the depreciation expense for the machinery used to produce the silicon. (We assume the company purchases this machinery from another company so we treat the depreciation as an external cost.) We do not deduct employee or indirect or overhead costs such as salaries, rent and electricity. So in effect a company claims its share of avoided emissions based on the value it has added through its own internal labour and general operating infrastructure.
A similar approach could be used for allocating emissions in the fossil fuel electricity supply chain between coal miners, transporters and generators. We don’t invest in fossil fuel companies, but those investors who do should account properly for their role in the production of dangerous emissions from burning fossil fuels.
The Evolution of Australian Ethical Portfolio Renewable Capacity versus the 2°C Benchmark
45Annual and Sustainability Report 2016 Celebrating 30 years

This year / Transitioning towards a lower carbon economy
46 Annual and Sustainability Report 2016Celebrating 30 years
Making it happen through our investment screens
We have never invested in coal or oil. In 2011, as evidence emerged of the impact of coal seam gas (CSG) on the artesian basin, we divested from companies involved in CSG but maintained holdings in natural gas pipelines as a transitional fuel to accelerate the closure of coal electricity generation.
Rapid advancements in renewable energy technology, in particular energy storage technology and production, means we are now confident that divesting from natural gas will not push demand back to coal-fired power.
From 1 July 2016 we are now free from all companies whose main business is fossil fuels, as well as diversified companies that earn some fossil fuel revenue and aren’t creating positive impact with their other activities. We may invest in a diversified company which is having a positive impact in other ways such as producing renewable energy, provided its fossil fuel revenue
is sufficiently low (a maximum of 5% to 33% depending on the fuel). For example, we invest in Contact Energy whose electricity production is 76% renewables. They earn some revenue from gas, but we think they are worth supporting as they continue to invest in renewables and help us get to 100% clean energy.
Alongside our fossil fuel exclusion we pursue climate friendly investments in:
• Renewable energy like solar, wind, geothermal, hydro and tidal power.
• Energy efficiency like LED lighting, more efficient motors and smart energy management technologies.
• Other products and activities reducing energy usage like recycling, insulation and battery storage.
Mercury Energy Ngatamariki Geothermal Power Station. Photo credit: Mercury Energy
Making it happen through advocacyWe are the voice for climate action.
Through our advocacy work we want to influence how climate change risks and opportunities are managed. That is why we are constantly engaging with government and the private sector.
COP21 – and beyond Our Managing Director, Phil Vernon, was in Paris in December 2015 participating in meetings and forums for investors and other companies to advocate for decisive climate action. We support the COP21 agreement, which reinforces our long-standing commitment to:
• take action through our day-to-day investing and purchasing decisions, with a 2 degree world in mind, and
• pressure governments to implement the specific climate policies needed.
On this front, we participate in two international groups targeting corporate lobbying practices, which obstruct positive policy change. We also lead the market with our own commitment to decarbonise our investments, and advocate for others to do the same.
Big four banks and the climateThe 2015 end-of-year reporting and annual general meeting season for the four big Australian banks brought greater openness about their lending to climate-sensitive sectors, as well as some encouraging new commitments to align their businesses with a 2° world.
Around the same time, the US investment manager, Boston Common Asset Management, published a report examining the management of climate-related risk and opportunity by 61 of the world’s largest banks. Based on 18 months of research, where we led the engagement with the four big Australian banks, the report showed strong performance from Australian banks relative to international peers. Conscious Australian investors and dedicated climate
campaigners like 350.org and Market Forces can claim considerable credit for the progress that Australian banks have made.
At the ANZ annual general meeting on 17 December 2015, we used our Advocacy Fund’s nominal shareholding in ANZ to support a shareholder resolution calling for an improved response to global warming. The resolution demanded better climate disclosure and setting targets. There was progress with 5.4% support, up from 3.1% of the vote for the 2014 climate resolution.
We believe that more needs to be done by the banks. They need to continue to enhance their carbon monitoring and reporting, and move beyond disclosure to making tangible changes to the way they lend and invest. They need to be clearer about the practical climate action they are taking – including increased renewables lending and no new fossil fuel lending. We’ll continue our efforts in FY17.
Corporate climate lobbyingIn 2016, as part of our submission to the Senate inquiry into Carbon Risk Disclosure, we argued that increased corporate monitoring and reporting of emissions is fundamental to ensure companies set accountable emissions reduction targets.
We made specific recommendations to lower reporting thresholds under the national greenhouse and energy reporting scheme; require disclosure on scope 3 emissions and broaden the scope to include financed emissions from the investment and super sectors.
We also contributed to the pro-transparency submissions made by the Investor Group on Climate Change and Financial Services Council.
The inquiry was put on hold due to the federal election; however, the submissions generated positive media interest.
47Annual and Sustainability Report 2016 Celebrating 30 years

Making it happen through operational emissionsAs an investor cutting the carbon intensity of our investments has the greatest impact. But we are also committed to reducing the carbon footprint of our operations. This year we joined Carbon Disclosure Project/World Wildlife Fund ‘Science Based Targets’, an initiative to drive ambitious climate action by businesses, inspiring them to commit to greenhouse gas emission reduction targets in line with climate science.
In FY16, we had 44.2 tonnes of scope 1&2 emissions (direct emissions from our operations and the generation of electricity used in those operations). Our scope 3 emissions from travel was 75.4 tonnes. We offset 100% of all these emissions. This year we purchased premium offsets from the Kariba REDD+ project which aims to teach farmers to sustainably increase their productivity, which in turn prevents further land clearing.
44.2tonnes
75.4tonnes
Emissions from direct operations and generation of electricity used in those operations Emissions from travel
This year we purchased premium offsets from the Kariba REDD+ project which aims to teach farmers to sustainably increase their productivity, which in turn prevents further land clearing.
This year / Transitioning towards a lower carbon economy
48 Annual and Sustainability Report 2016Celebrating 30 years
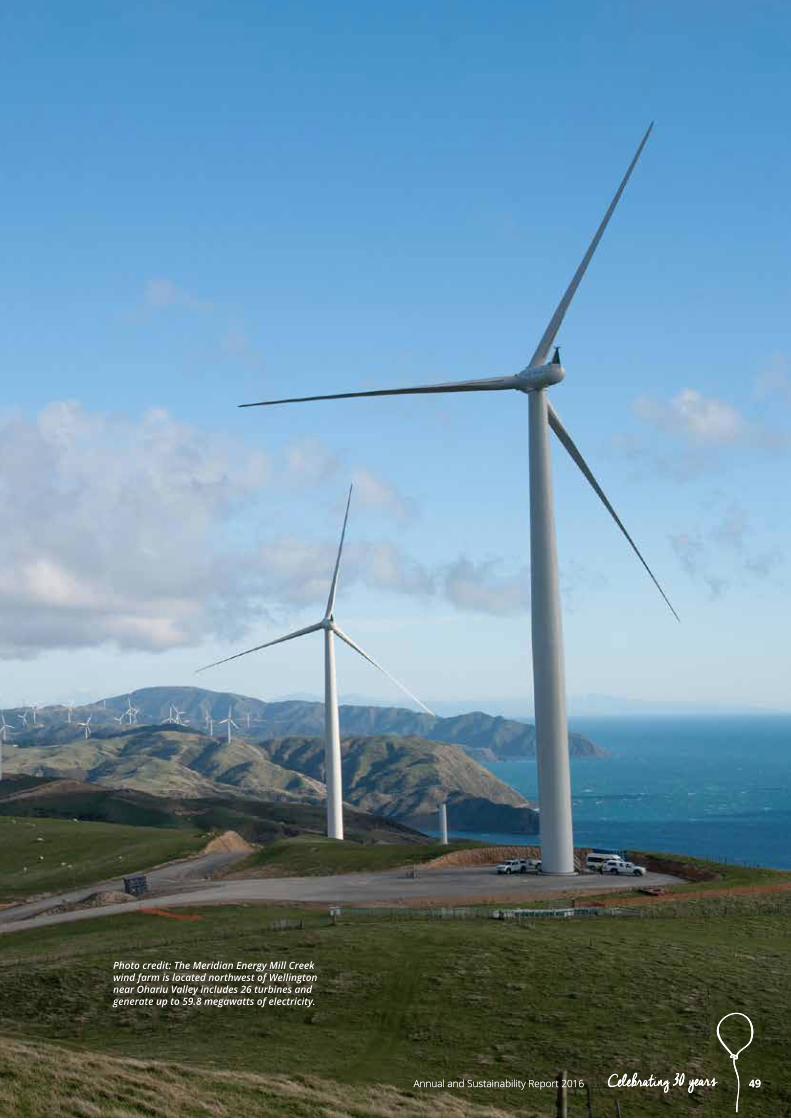
Photo credit: The Meridian Energy Mill Creek wind farm is located northwest of Wellington near Ohariu Valley includes 26 turbines and generate up to 59.8 megawatts of electricity.
49Annual and Sustainability Report 2016 Celebrating 30 years 49Annual and Sustainability Report 2016 Celebrating 30 years

North America * Signed letters to major food companies including McDonalds, Wendy’s and Domino’s (companies we don’t invest in) to rule out antibiotics in animal growth promotion and factory farming.
New York * Signed up to the United Nations Women’s Empowerment Principles.
United Kingdom * Signed an open letter published in the Financial Times to BP, Chevron, ENI, ExxonMobil, Shell, Statoil and Total (companies we don’t invest in) calling on them to ‘put limiting climate change to well below 2°C, and preferably 1.5°C, at the heart of your businesses’ plans for the future’.
* First Australian fund to join international investors to promote ethical agriculture using the Business Benchmark on Farm Animal Welfare.
We are having a global impact
50 Annual and Sustainability Report 2016Celebrating 30 years
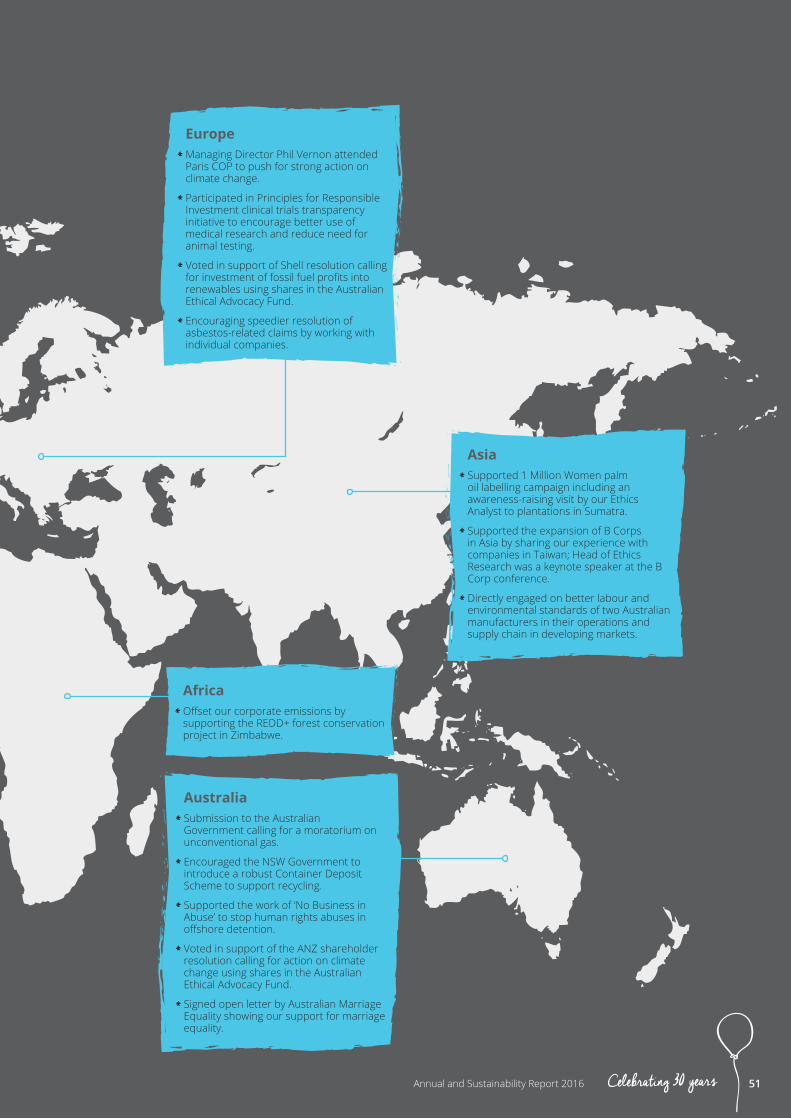
Australia * Submission to the Australian Government calling for a moratorium on unconventional gas.
* Encouraged the NSW Government to introduce a robust Container Deposit Scheme to support recycling.
* Supported the work of ‘No Business in Abuse’ to stop human rights abuses in offshore detention.
* Voted in support of the ANZ shareholder resolution calling for action on climate change using shares in the Australian Ethical Advocacy Fund.
* Signed open letter by Australian Marriage Equality showing our support for marriage equality.
Africa * Offset our corporate emissions by supporting the REDD+ forest conservation project in Zimbabwe.
Europe * Managing Director Phil Vernon attended Paris COP to push for strong action on climate change.
* Participated in Principles for Responsible Investment clinical trials transparency initiative to encourage better use of medical research and reduce need for animal testing.
* Voted in support of Shell resolution calling for investment of fossil fuel profits into renewables using shares in the Australian Ethical Advocacy Fund.
* Encouraging speedier resolution of asbestos-related claims by working with individual companies.
Asia * Supported 1 Million Women palm oil labelling campaign including an awareness-raising visit by our Ethics Analyst to plantations in Sumatra.
* Supported the expansion of B Corps in Asia by sharing our experience with companies in Taiwan; Head of Ethics Research was a keynote speaker at the B Corp conference.
* Directly engaged on better labour and environmental standards of two Australian manufacturers in their operations and supply chain in developing markets.
51Annual and Sustainability Report 2016 Celebrating 30 years

Our clients don’t tend to be the people drifting through life unaware of what’s going on. They take an active role in making the world a better place.So our commitment to 100% transparency really works for them.
With one of the highest levels of client satisfaction in the industry15, we make sure clients are at the forefront of everything we do. And that means listening. When our clients told us they wanted us to make things easier, we simplified our application forms and fund names. When they told us we were too expensive, we worked on lowering our fees.
We’ve built a vibrant community online to hear from customers.
We know our key role is to connect good people with positive investments. So we need to serve our customers as well as we do their money.
Delivering a great experience
15 Based on an independent member satisfaction telephone survey conducted by the CSBA Link Group for the period of October 2014 to March 2015.
52 Annual and Sustainability Report 2016Celebrating 30 years

Who are our clientsOur clients are values driven and care about the impact their money has. Our target markets this year are superannuation members, managed fund investors, employers and financial advisers.
In the last six months, our members continued to display strong satisfaction towards us. We recorded a strong Net Promoter Score of +55. Net Promoter is the most commonly accepted measure of client loyalty and +55 puts us above industry standard. Members’ growing satisfaction is largely driven by our ethical stance and their satisfaction with knowing they can do good for themselves and the planet.
Growing client baseWe know that good people like doing good business. By meeting ethically minded people through social networks, we’ve been able to rapidly expand our member base. New clients averaged 550 per month this year compared to 384 per month last year.
“ My super is invested according to my conscience and they provide a service that is consistently responsive and transparent.”
Shruti, Super member since 2008
16 Based on an independent member satisfaction telephone survey spanning 207 calls and 60 interviews with a response rate of 29% conducted by the CSBA Link Group for the period of October 2014 to March 2015.
5,619 6,740
8,001 8,892
10,647 11,352 12,567 13,230 13,864 13,826
14,868
17,663
21,196
26,342
0
5,000
10,000
15,000
20,000
25,000
30,000
2003 2004 2005 2006 2007 2008 2009 2010 2011 2012 2013 2014 2015 2016
Number of Members 2003–201516
53Annual and Sustainability Report 2016 Celebrating 30 years

This year / Providing good service
Responding to clients’ needsWe know our clients want to choose from a range of high quality products and services. Our approach to product innovation and differentiation sees us working hard to respond to develop products and services that optimise investment outcomes.
New clientsIn FY15, clients told us they wanted an easier way to join and invest with Australian Ethical. This year, we simplified our application forms for super and managed funds. Our forms are now a quarter of the size and less complex, making them easier to understand and faster to complete.
Portfolio names have also been simplified to better reflect what the investment options actually are. On 1 July 2015, we changed the names of the Smaller Companies Trust and Larger Companies Trust to Australian Shares Fund and Diversified Shares Fund respectively. We also changed all ‘Trusts’ to ‘Funds’ as a fund is a term that is more commonly understood.
InvestorsWe also introduced the Emerging Companies Fund for retail and wholesale investors. The Emerging Companies Fund provides clients with the opportunity to invest in small capitalisation companies on the basis of their social, environmental and financial credentials.
Additionally, wholesale investors can now invest in the Australian Ethical International Shares Fund and the Australian Ethical Cash Fund, with a minimum investment of $25,000. Since wholesale fees are lower than retail, this is a win for our high-value clients.
Finally, in July 2015 we listed our managed funds on the ASX’s mFund platform, making it easier for investors who want to transact online. The mFund platform allows investors the ability to diversify their investments across a range of asset classes in a cost effective way.
Financial advisersOver the years we have also been engaging with our financial advisers to understand how we can ease their work. In FY15, our financial advisers told us that they require additional information on ethical and social products to educate their clients. We have responded with a ‘Fact Find’ questionnaire – a quick, easy-to-read source of information advisers can use when talking to clients. We have made ourselves available for our advisers’ clients who can contact us directly for additional information on ethical products and services.
EmployersWe have found that our employer groups need a better way to communicate the Australian Ethical Superannuation offering to their new and existing employees. To this end we have developed tailored induction kits which outline our superannuation offering including information on default insurance. It also introduces our ethical approach and the types of investments that our screening directs us to.
Into the futureWe want to give the very best service and advice to customers and we are currently redefining our customer experience strategy and operating model. This includes consideration of how we provide financial advice and services to delight our customers every day.
54 Annual and Sustainability Report 2016Celebrating 30 years

Our digital presenceThe financial services sector is experiencing great change with the evolution of digital technologies. Over the past decade, companies have transitioned from face-to-face interaction with a few clients to digital experiences across a range of client groups.
During FY16, we’ve continued to build a significant digital community for Australian Ethical clients. From virtually nothing a few years ago, the total number of our social media followers is now close to 100,000. This online community is highly engaged, with nearly 6,000 people engaging with our Facebook posts each week.
We know this growth isn’t just us ‘being’ online. There are many companies who have entered the world of social media but not gained the engagement they expected – especially in financial services.
Our audience engagement and growth has been no small feat. We’ve worked hard to produce original, interesting content and respond to clients’ questions and comments online. We know clients come to us for our belief and understanding of ethical issues and making their money do good.
Early this year, we invested in a full-time Communications Specialist to produce high-quality, original content for all our digital channels. In January 2016, we released an ethical fashion guide which has been downloaded by more than 600 people. We’ve also published over 40 articles on our blog and have grown our partners’ relationships to collaborate on niche content for specific audiences like young women.
1 Million Women, a grassroots movement empowering women to take action on climate change, repost many of our blogs, and recently one of our team members contributed a blog to their site. We’ve also engaged with speakers from the Festival of Dangerous Ideas to offer exclusive content to Australian Ethical clients in Good Money magazine.
Another important area we’ve emphasised is making sure we respond to people online. The great thing about online communities is that people can easily ask us questions and comment on what we’re doing every single day. We’ve taken this as a real opportunity and used it to bust myths around ethical investing and educate the community. Our Head of Ethics Research, Stuart Palmer, personally responds to several queries a week. You can see for yourself in the graphic above.
55Annual and Sustainability Report 2016 Celebrating 30 years
Our culture is shaped by our purpose, values and commitment to fostering a happy and fulfilling work environment.
But most importantly, it’s shaped by our people.
Every single one of our employees has an impact on Australian Ethical and how we get things done. Over the past 30 years, we’ve achieved many milestones – and we have the
opportunity to achieve many more as we work collectively towards our 2020 goals. Having the capability to deliver on these goals is key. We’re focused on engaging and developing our people so they can grow and develop Australian Ethical into the future.
Investing in our people
56 Annual and Sustainability Report 2016Celebrating 30 years

A collaborative cultureWe don’t believe in traditional office hierarchical structures. The workplace and team landscape is constantly changing. To build a high-performance, collaborative culture that is focused, efficient, customer-centric, agile and self-managing we know people have to love their jobs and feel connected to something bigger.
Living our valuesMost people have worked for a company where the values are hanging on walls around the office but no one really knows what they mean or how they influence daily life and behaviours.
That’s why this year we worked on bringing our values of respect, trust, leadership, authenticity, compassion and kindness to life. We held three collaborative workshops with employees to understand how employees’ individual values align with the company’s. The emphasis was on both individual expression and the collective.
We recognise that to develop an inclusive, strong workplace culture it’s important that every employee has the opportunity to contribute to broader, organisation-wide discussions. As part of this process, we have begun the journey of defining how our values translate into action in our day-to-day business. These ‘ways of being’ will be formalised in the coming months.
Expanding our workplaceAs Australian Ethical grows, we want to continue to build a flourishing workplace that reflects our purpose, values and culture.
This year we will be growing the office in Sydney by expanding to the neighbouring office space on our floor. Construction will commence in FY17.
As part of the expansion process, an external design consultant was commissioned to design the interior so our working environment better matches who we are as a company and people. The final concept looks to meet the needs of our multi-generational workforce and our various working styles. Current work practices, preferred work practices, inclusive working environments and visual design were factored in.
Sustainability will be a leading driver in the new fit-out with an environment and sustainability consultant engaged to guide the process.
Engaging our employeesOur annual employee survey is one of our key indicators of employee engagement. In FY16, our employee participation rate remained steady at 94% and we have maintained our top quartile presence in the AON Hewitt Best Employer Group scores in Australia and New Zealand.
It is good to see that our employee engagement score has increased once again to 77%; up 4% from FY15, outperforming the Financial Services sector.
Based on employee feedback from last year, we invested in learning and development initiatives and strengthened our performance management
processes this year. We also continue to develop our manager – employee relationship. It is no surprise that increased collaboration is a key theme employees are more satisfied with.
We recognise that there is more work to do, especially in the areas of providing additional career opportunities, increasing diversity and inclusion and supporting work life balance. We will be working with our employees in the coming months to understand expectations and develop programs that respond to these identified areas.
57Annual and Sustainability Report 2016 Celebrating 30 years
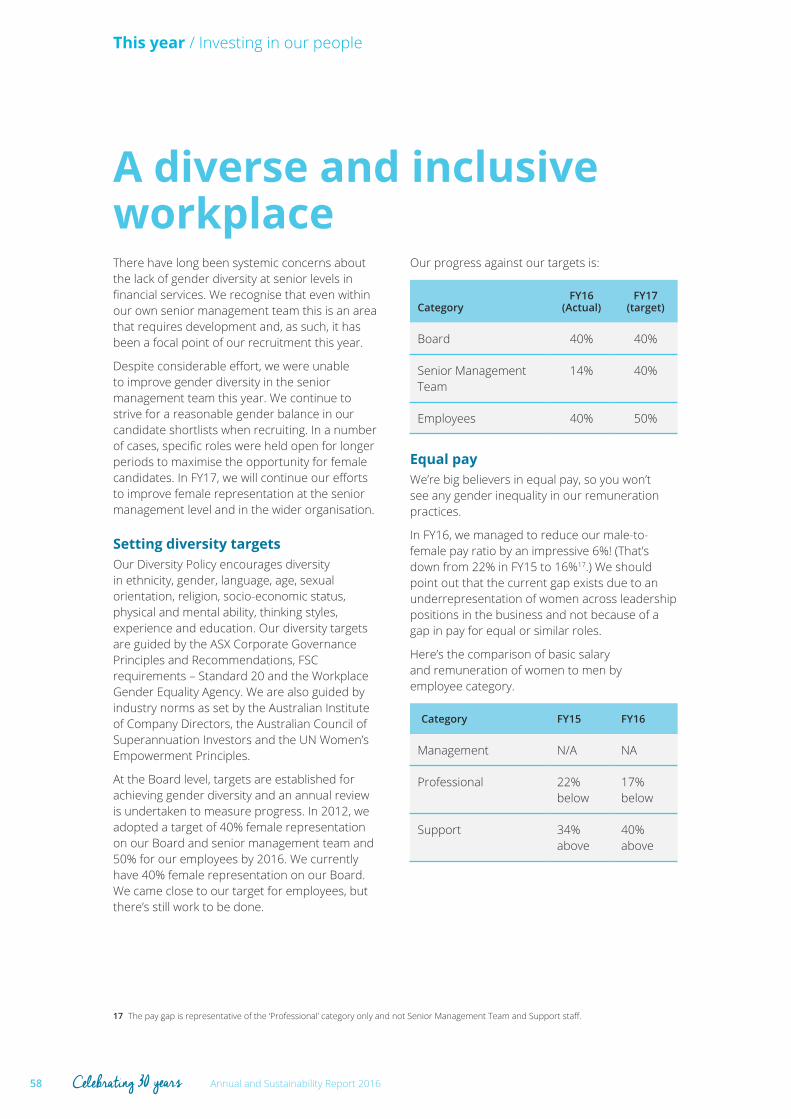
This year / Investing in our people
A diverse and inclusive workplaceThere have long been systemic concerns about the lack of gender diversity at senior levels in financial services. We recognise that even within our own senior management team this is an area that requires development and, as such, it has been a focal point of our recruitment this year.
Despite considerable effort, we were unable to improve gender diversity in the senior management team this year. We continue to strive for a reasonable gender balance in our candidate shortlists when recruiting. In a number of cases, specific roles were held open for longer periods to maximise the opportunity for female candidates. In FY17, we will continue our efforts to improve female representation at the senior management level and in the wider organisation.
Setting diversity targetsOur Diversity Policy encourages diversity in ethnicity, gender, language, age, sexual orientation, religion, socio-economic status, physical and mental ability, thinking styles, experience and education. Our diversity targets are guided by the ASX Corporate Governance Principles and Recommendations, FSC requirements – Standard 20 and the Workplace Gender Equality Agency. We are also guided by industry norms as set by the Australian Institute of Company Directors, the Australian Council of Superannuation Investors and the UN Women’s Empowerment Principles.
At the Board level, targets are established for achieving gender diversity and an annual review is undertaken to measure progress. In 2012, we adopted a target of 40% female representation on our Board and senior management team and 50% for our employees by 2016. We currently have 40% female representation on our Board. We came close to our target for employees, but there’s still work to be done.
Our progress against our targets is:
CategoryFY16
(Actual)FY17
(target)
Board 40% 40%
Senior Management Team
14% 40%
Employees 40% 50%
Equal payWe’re big believers in equal pay, so you won’t see any gender inequality in our remuneration practices.
In FY16, we managed to reduce our male-to-female pay ratio by an impressive 6%! (That’s down from 22% in FY15 to 16%17.) We should point out that the current gap exists due to an underrepresentation of women across leadership positions in the business and not because of a gap in pay for equal or similar roles.
Here’s the comparison of basic salary and remuneration of women to men by employee category.
Category FY15 FY16
Management N/A NA
Professional 22% below
17% below
Support 34% above
40% above
17 The pay gap is representative of the ‘Professional’ category only and not Senior Management Team and Support staff.
58 Annual and Sustainability Report 2016Celebrating 30 years
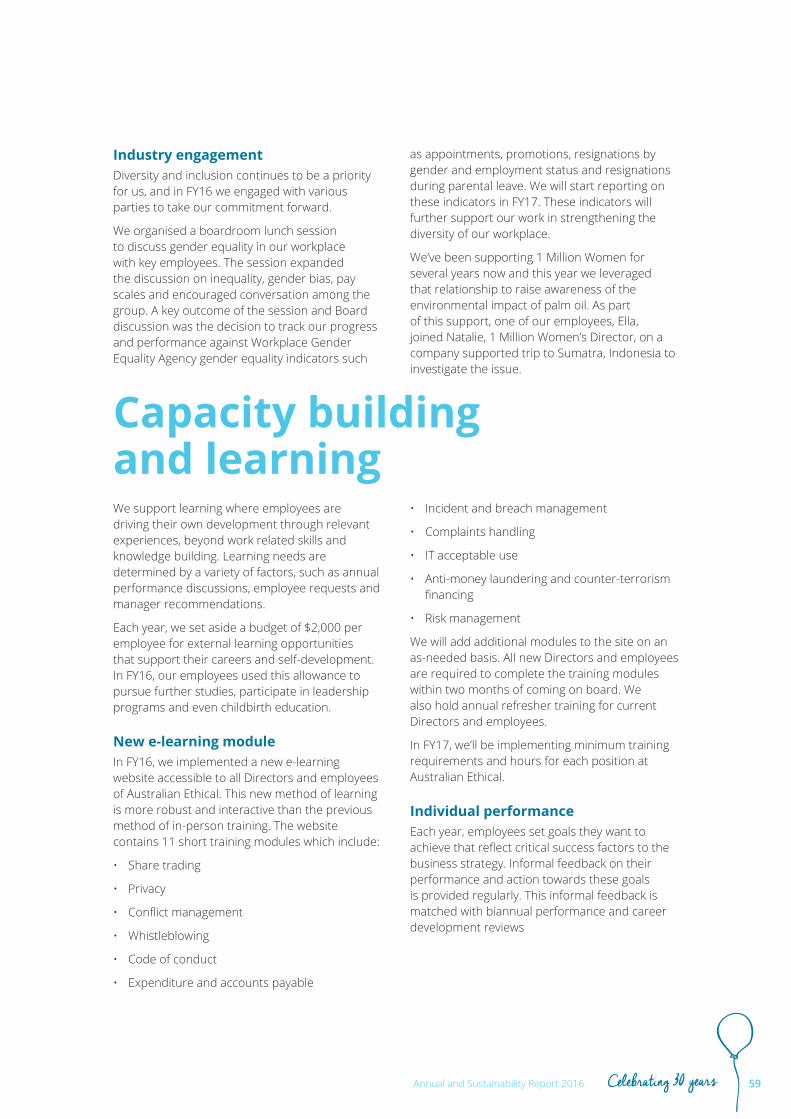
Industry engagementDiversity and inclusion continues to be a priority for us, and in FY16 we engaged with various parties to take our commitment forward.
We organised a boardroom lunch session to discuss gender equality in our workplace with key employees. The session expanded the discussion on inequality, gender bias, pay scales and encouraged conversation among the group. A key outcome of the session and Board discussion was the decision to track our progress and performance against Workplace Gender Equality Agency gender equality indicators such
as appointments, promotions, resignations by gender and employment status and resignations during parental leave. We will start reporting on these indicators in FY17. These indicators will further support our work in strengthening the diversity of our workplace.
We’ve been supporting 1 Million Women for several years now and this year we leveraged that relationship to raise awareness of the environmental impact of palm oil. As part of this support, one of our employees, Ella, joined Natalie, 1 Million Women’s Director, on a company supported trip to Sumatra, Indonesia to investigate the issue.
Capacity building and learningWe support learning where employees are driving their own development through relevant experiences, beyond work related skills and knowledge building. Learning needs are determined by a variety of factors, such as annual performance discussions, employee requests and manager recommendations.
Each year, we set aside a budget of $2,000 per employee for external learning opportunities that support their careers and self-development. In FY16, our employees used this allowance to pursue further studies, participate in leadership programs and even childbirth education.
New e-learning moduleIn FY16, we implemented a new e-learning website accessible to all Directors and employees of Australian Ethical. This new method of learning is more robust and interactive than the previous method of in-person training. The website contains 11 short training modules which include:
• Share trading
• Privacy
• Conflict management
• Whistleblowing
• Code of conduct
• Expenditure and accounts payable
• Incident and breach management
• Complaints handling
• IT acceptable use
• Anti-money laundering and counter-terrorism financing
• Risk management
We will add additional modules to the site on an as-needed basis. All new Directors and employees are required to complete the training modules within two months of coming on board. We also hold annual refresher training for current Directors and employees.
In FY17, we’ll be implementing minimum training requirements and hours for each position at Australian Ethical.
Individual performanceEach year, employees set goals they want to achieve that reflect critical success factors to the business strategy. Informal feedback on their performance and action towards these goals is provided regularly. This informal feedback is matched with biannual performance and career development reviews
59Annual and Sustainability Report 2016 Celebrating 30 years

This year / Investing in our people
Health and wellbeingIf you ever stop by our office, you’re likely to see Australian Ethical employees enjoying vegan treats or heading out to their weekly netball game. Our employees care about health and feeling good – and we do our part to support that.
Safety is an important consideration in day-to-day work. While we work in an environment that does not have a high incidence of workplace injury, we take steps to ensure both the physical and mental wellbeing of all our employees. In FY16, two minor injuries were sustained at our head office with 14 hours of lost time recorded. During the reporting period, a WHS audit was carried out in both office locations and actions taken to increase safety at work.
We are continually improving our health and wellbeing programs in consultation with employees. We continue to run a lunchtime movie series which started in early 2015 and weekly meditation sessions. Last month, we watched ‘That Sugar Film’ and learned about the harmful effect of excess sugar on our health.
The wellbeing room, that was created last year, has been popular for meetings, as well as being used as a ‘mindful’ space for creativity and for quarterly massages.
The benefits that form part of the annual wellbeing program include weekly sessions of meditation for a period during the year, free flu vaccinations and health screening, weekly organic fruit, an annual ergonomic check and return-to-work coaching for employees who return to the workplace after a period of prolonged absence.
Other employee benefits include travel insurance, novated car leasing at fleet prices, contribution for employee personal development activities such as health memberships and public speaking courses, recognition-of-service bonuses for every five years of employment, two weeks’ paid paternity leave for new dads and twelve weeks’ paid parental leave and super contributions while an employee is on parental leave up to twelve months.
60 Annual and Sustainability Report 2016Celebrating 30 years
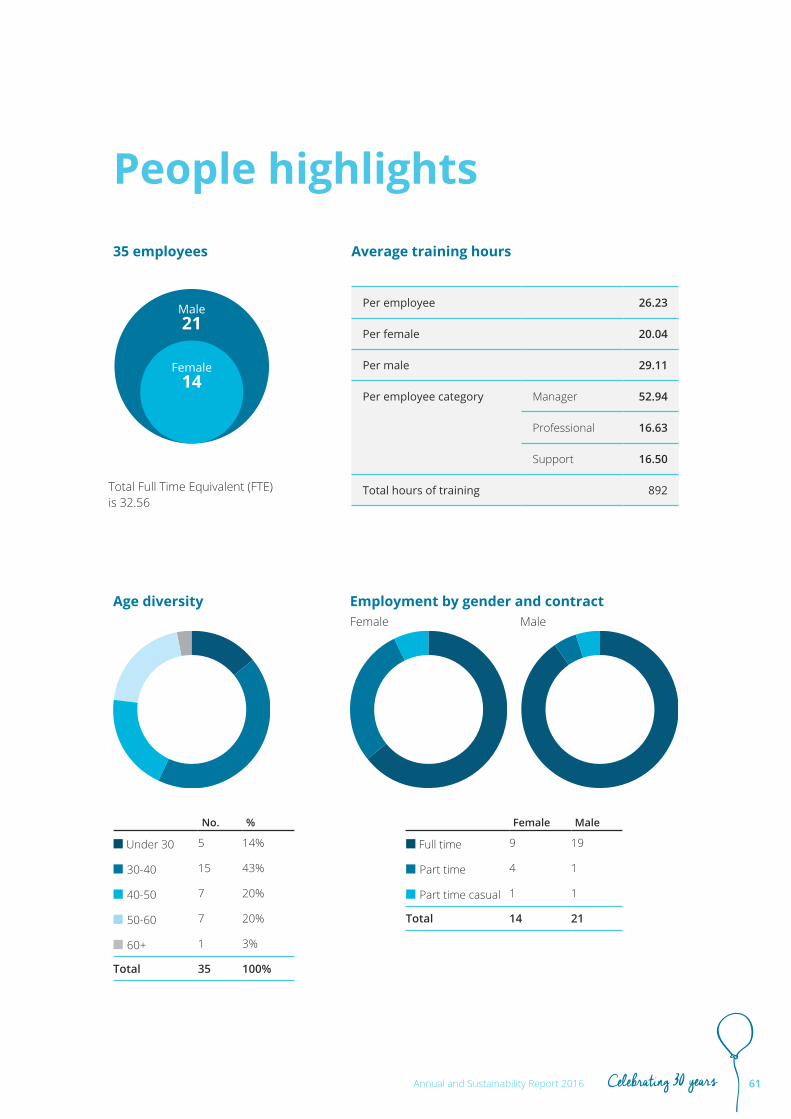
35 employees Average training hours
People highlights
Age diversity
No. %
■ Under 30 5 14%
■ 30-40 15 43%
■ 40-50 7 20%
■ 50-60 7 20%
■ 60+ 1 3%
Total 35 100%
Female Male
■ Full time 9 19
■ Part time 4 1
■ Part time casual 1 1
Total 14 21
Employment by gender and contractFemale Male
Total Full Time Equivalent (FTE) is 32.56
Male 21
Female14
Per employee 26.23
Per female 20.04
Per male 29.11
Per employee category Manager 52.94
Professional 16.63
Support 16.50
Total hours of training 892
61Annual and Sustainability Report 2016 Celebrating 30 years
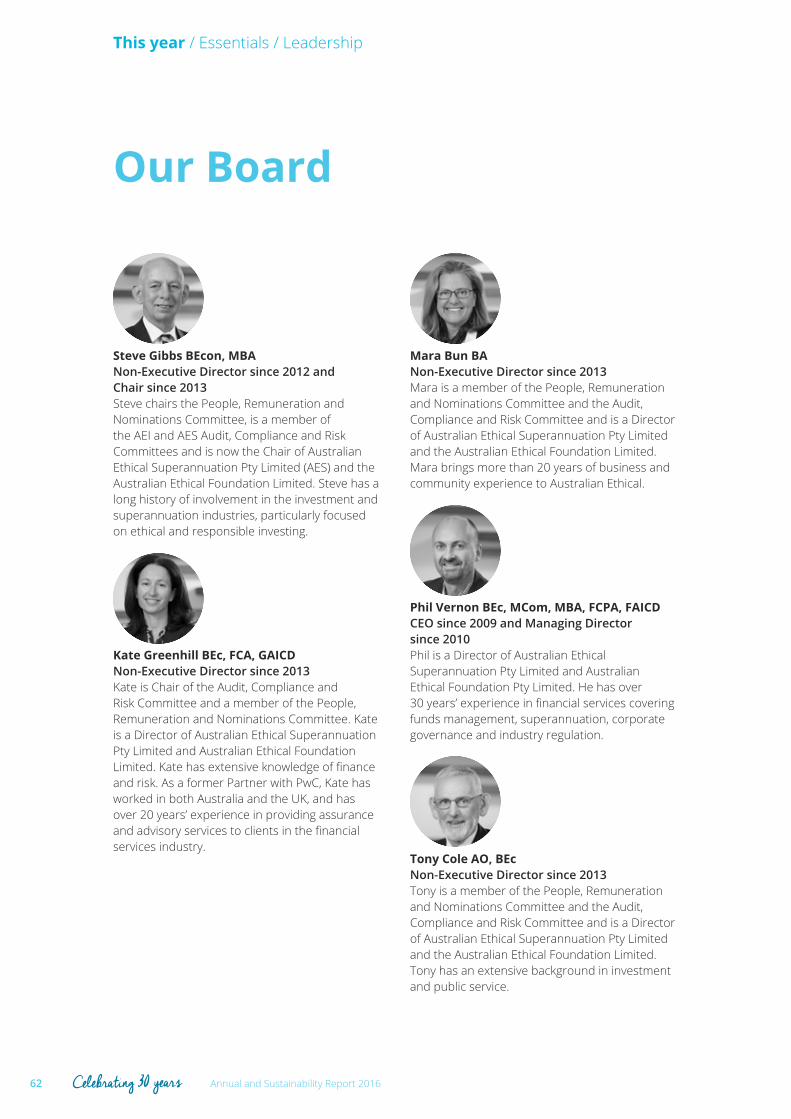
This year / Essentials / Leadership
Our Board
Steve Gibbs BEcon, MBANon-Executive Director since 2012 and Chair since 2013Steve chairs the People, Remuneration and Nominations Committee, is a member of the AEI and AES Audit, Compliance and Risk Committees and is now the Chair of Australian Ethical Superannuation Pty Limited (AES) and the Australian Ethical Foundation Limited. Steve has a long history of involvement in the investment and superannuation industries, particularly focused on ethical and responsible investing.
Kate Greenhill BEc, FCA, GAICDNon-Executive Director since 2013Kate is Chair of the Audit, Compliance and Risk Committee and a member of the People, Remuneration and Nominations Committee. Kate is a Director of Australian Ethical Superannuation Pty Limited and Australian Ethical Foundation Limited. Kate has extensive knowledge of finance and risk. As a former Partner with PwC, Kate has worked in both Australia and the UK, and has over 20 years’ experience in providing assurance and advisory services to clients in the financial services industry.
Mara Bun BANon-Executive Director since 2013Mara is a member of the People, Remuneration and Nominations Committee and the Audit, Compliance and Risk Committee and is a Director of Australian Ethical Superannuation Pty Limited and the Australian Ethical Foundation Limited. Mara brings more than 20 years of business and community experience to Australian Ethical.
Phil Vernon BEc, MCom, MBA, FCPA, FAICDCEO since 2009 and Managing Director since 2010Phil is a Director of Australian Ethical Superannuation Pty Limited and Australian Ethical Foundation Pty Limited. He has over 30 years’ experience in financial services covering funds management, superannuation, corporate governance and industry regulation.
Tony Cole AO, BEcNon-Executive Director since 2013Tony is a member of the People, Remuneration and Nominations Committee and the Audit, Compliance and Risk Committee and is a Director of Australian Ethical Superannuation Pty Limited and the Australian Ethical Foundation Limited. Tony has an extensive background in investment and public service.
62 Annual and Sustainability Report 2016Celebrating 30 years
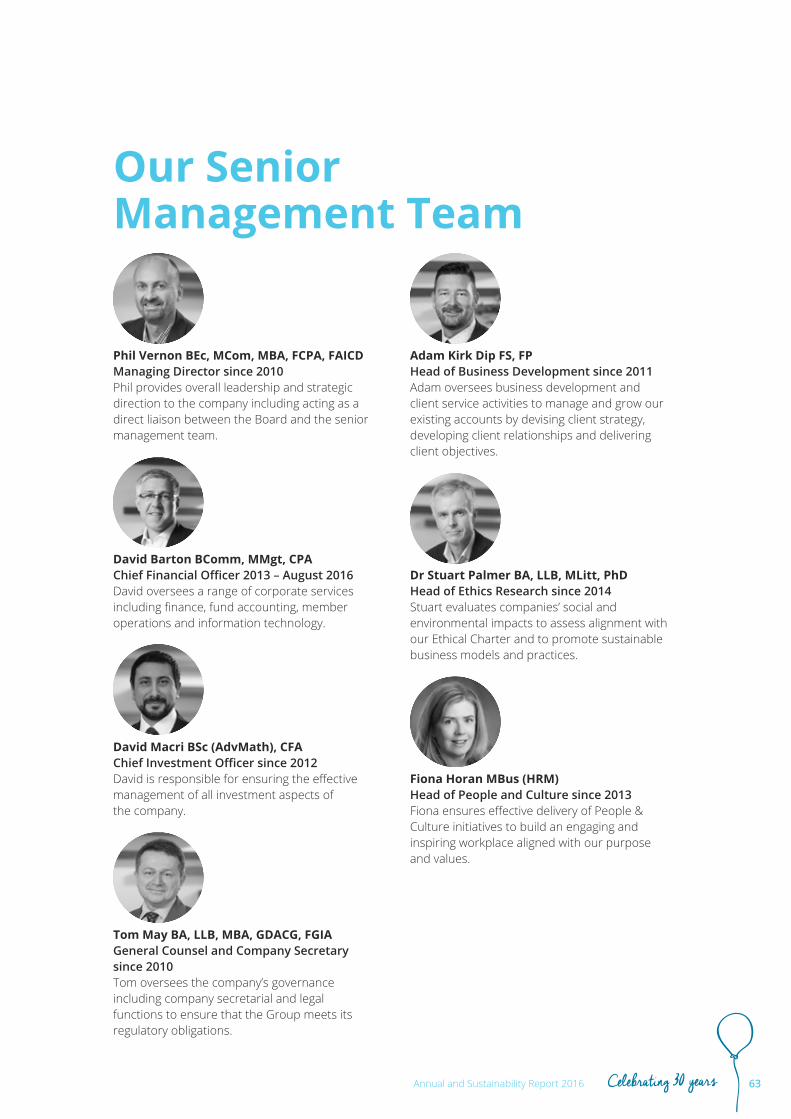
Our Senior Management Team
Phil Vernon BEc, MCom, MBA, FCPA, FAICDManaging Director since 2010Phil provides overall leadership and strategic direction to the company including acting as a direct liaison between the Board and the senior management team.
David Barton BComm, MMgt, CPAChief Financial Officer 2013 – August 2016David oversees a range of corporate services including finance, fund accounting, member operations and information technology.
David Macri BSc (AdvMath), CFAChief Investment Officer since 2012David is responsible for ensuring the effective management of all investment aspects of the company.
Tom May BA, LLB, MBA, GDACG, FGIAGeneral Counsel and Company Secretary since 2010Tom oversees the company’s governance including company secretarial and legal functions to ensure that the Group meets its regulatory obligations.
Adam Kirk Dip FS, FPHead of Business Development since 2011Adam oversees business development and client service activities to manage and grow our existing accounts by devising client strategy, developing client relationships and delivering client objectives.
Dr Stuart Palmer BA, LLB, MLitt, PhDHead of Ethics Research since 2014Stuart evaluates companies’ social and environmental impacts to assess alignment with our Ethical Charter and to promote sustainable business models and practices.
Fiona Horan MBus (HRM) Head of People and Culture since 2013Fiona ensures effective delivery of People & Culture initiatives to build an engaging and inspiring workplace aligned with our purpose and values.
63Annual and Sustainability Report 2016 Celebrating 30 years
Financial Report
Contents Page
Directors’ Report 65
Remuneration Report 68
Lead Auditor’s Independence Declaration 79
Independent Auditor’s Report 80
Consolidated Statements of Comprehensive Income 82
Consolidated Statements of Financial Position 83
Consolidated Statement of Changes in Equity 84
Consolidated Statements of Cash Flows 86
Notes to the Consolidated Financial Statements 87
Directors’ declaration 118
64 Annual and Sustainability Report 2016Celebrating 30 years
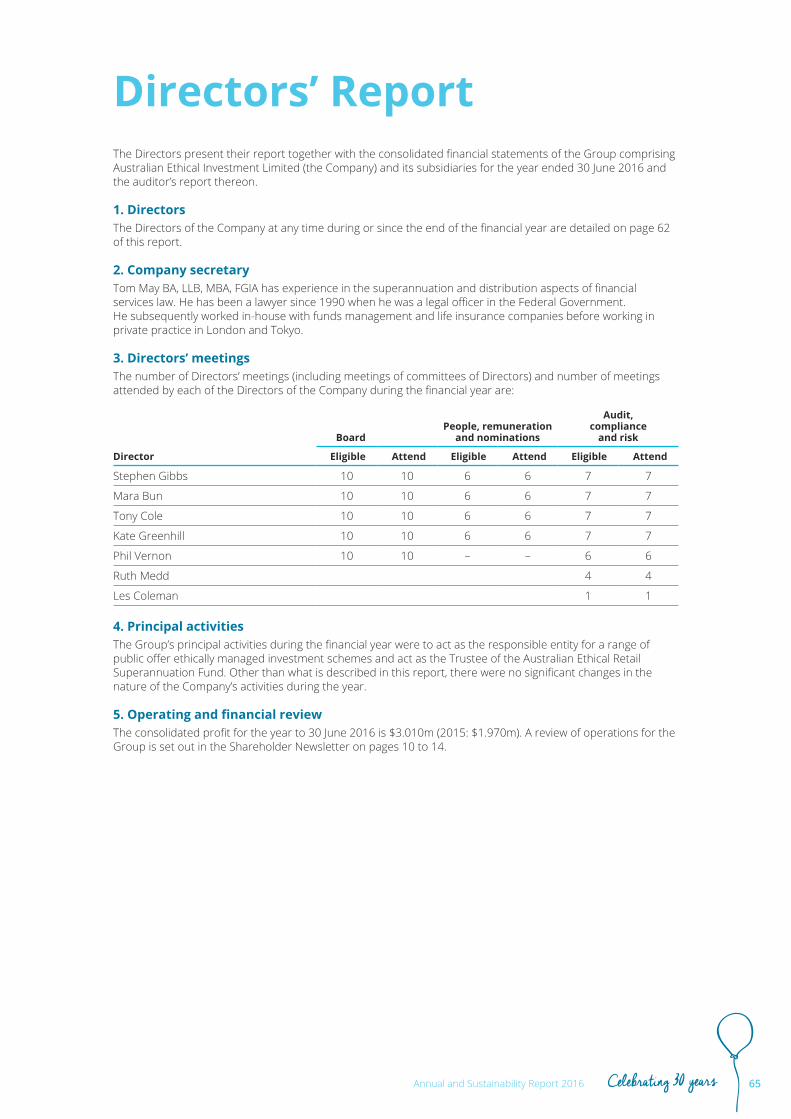
The Directors present their report together with the consolidated financial statements of the Group comprising Australian Ethical Investment Limited (the Company) and its subsidiaries for the year ended 30 June 2016 and the auditor’s report thereon.
1. DirectorsThe Directors of the Company at any time during or since the end of the financial year are detailed on page 62 of this report.
2. Company secretaryTom May BA, LLB, MBA, FGIA has experience in the superannuation and distribution aspects of financial services law. He has been a lawyer since 1990 when he was a legal officer in the Federal Government. He subsequently worked in-house with funds management and life insurance companies before working in private practice in London and Tokyo.
3. Directors’ meetingsThe number of Directors’ meetings (including meetings of committees of Directors) and number of meetings attended by each of the Directors of the Company during the financial year are:
Director
BoardPeople, remuneration
and nominations
Audit, compliance
and risk
Eligible Attend Eligible Attend Eligible Attend
Stephen Gibbs 10 10 6 6 7 7
Mara Bun 10 10 6 6 7 7
Tony Cole 10 10 6 6 7 7
Kate Greenhill 10 10 6 6 7 7
Phil Vernon 10 10 – – 6 6
Ruth Medd 4 4
Les Coleman 1 1
4. Principal activitiesThe Group’s principal activities during the financial year were to act as the responsible entity for a range of public offer ethically managed investment schemes and act as the Trustee of the Australian Ethical Retail Superannuation Fund. Other than what is described in this report, there were no significant changes in the nature of the Company’s activities during the year.
5. Operating and financial reviewThe consolidated profit for the year to 30 June 2016 is $3.010m (2015: $1.970m). A review of operations for the Group is set out in the Shareholder Newsletter on pages 10 to 14.
Directors’ Report
65Annual and Sustainability Report 2016 Celebrating 30 years
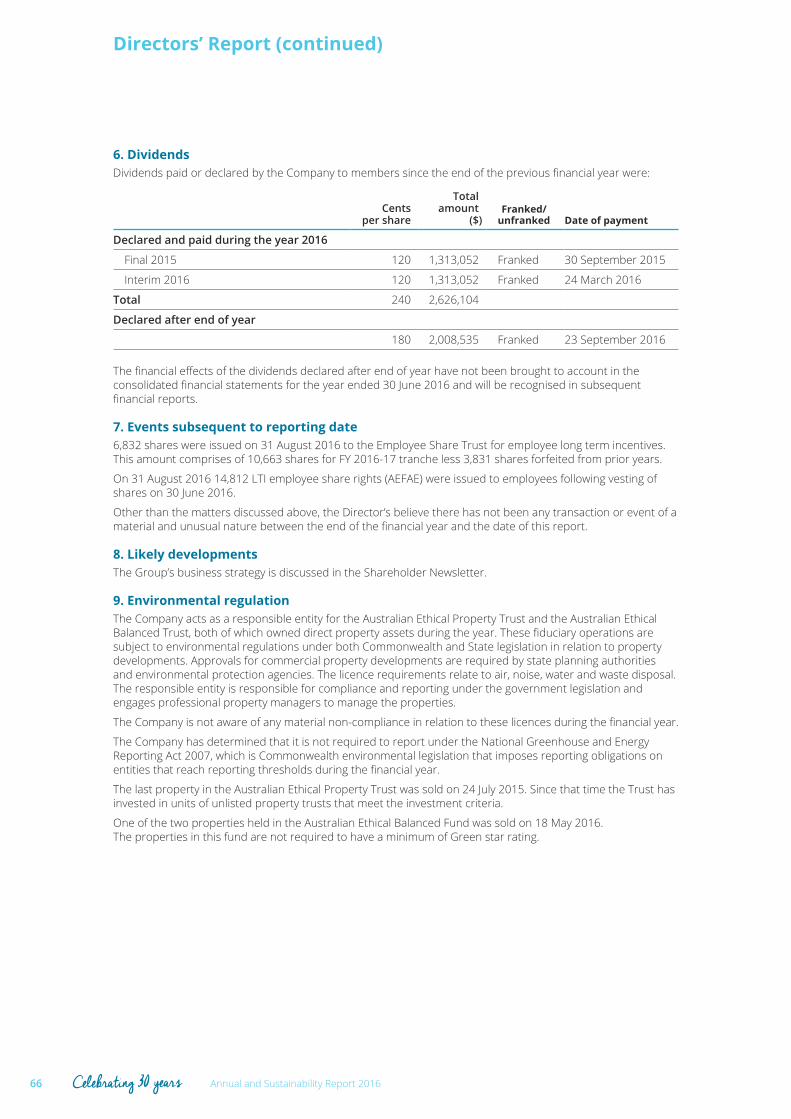
6. DividendsDividends paid or declared by the Company to members since the end of the previous financial year were:
Cents per share
Total amount
($)Franked/
unfranked Date of payment
Declared and paid during the year 2016
Final 2015 120 1,313,052 Franked 30 September 2015
Interim 2016 120 1,313,052 Franked 24 March 2016
Total 240 2,626,104
Declared after end of year
180 2,008,535 Franked 23 September 2016
The financial effects of the dividends declared after end of year have not been brought to account in the consolidated financial statements for the year ended 30 June 2016 and will be recognised in subsequent financial reports.
7. Events subsequent to reporting date6,832 shares were issued on 31 August 2016 to the Employee Share Trust for employee long term incentives. This amount comprises of 10,663 shares for FY 2016-17 tranche less 3,831 shares forfeited from prior years.
On 31 August 2016 14,812 LTI employee share rights (AEFAE) were issued to employees following vesting of shares on 30 June 2016.
Other than the matters discussed above, the Director’s believe there has not been any transaction or event of a material and unusual nature between the end of the financial year and the date of this report.
8. Likely developmentsThe Group’s business strategy is discussed in the Shareholder Newsletter.
9. Environmental regulationThe Company acts as a responsible entity for the Australian Ethical Property Trust and the Australian Ethical Balanced Trust, both of which owned direct property assets during the year. These fiduciary operations are subject to environmental regulations under both Commonwealth and State legislation in relation to property developments. Approvals for commercial property developments are required by state planning authorities and environmental protection agencies. The licence requirements relate to air, noise, water and waste disposal. The responsible entity is responsible for compliance and reporting under the government legislation and engages professional property managers to manage the properties.
The Company is not aware of any material non-compliance in relation to these licences during the financial year.
The Company has determined that it is not required to report under the National Greenhouse and Energy Reporting Act 2007, which is Commonwealth environmental legislation that imposes reporting obligations on entities that reach reporting thresholds during the financial year.
The last property in the Australian Ethical Property Trust was sold on 24 July 2015. Since that time the Trust has invested in units of unlisted property trusts that meet the investment criteria.
One of the two properties held in the Australian Ethical Balanced Fund was sold on 18 May 2016. The properties in this fund are not required to have a minimum of Green star rating.
Directors’ Report (continued)
66 Annual and Sustainability Report 2016Celebrating 30 years

10. Shares issued during the year and prior to the issue of the reportDuring the year and prior to the release of this report the following shares were issued:
DateNumber of
shares Issued Reason
Balance 30 June 2015 1,053,817
31 August 2015 11,899 Conversion of STI performance rights (AEFAG)
31 August 2015 16,834 Conversion of LTI performance rights (AEFAC)
31 August 2015 11,659 Issued to the Employee Share Trust as long term incentives
Balance 30 June 2016 1,094,209
31 August 2016 6,832 Issued to the Employee Share Trust as long term incentives
31 August 2016 14,812 Conversion of LTI performance rights (AEFAE)
Balance 31 August 2016 1,115,853
No further shares have been issued or are planned from the date of this report. No amounts are unpaid on any of the shares.
11. Indemnification of Directors’ and Officers
IndemnificationThe Company and its controlled entity indemnify the current Directors and officers of the Company and the controlled entity against all liabilities to another person (other than the Company or a related body corporate) that may arise from their position as Directors of the Group, except where the liabilities arise out of conduct involving a lack of good faith. The Company and its controlled entity will meet the full amount of any such liabilities, including costs and expenses.
InsuranceThe Company has paid premiums to insure each of the Directors and officers of the Company against liabilities for costs and expenses incurred by them in defending any legal proceedings arising out of their conduct while acting in the capacity of Directors and officers of the Company, other than conduct involving a wilful breach of duty in relation to the Company. Details of the amount of the premium paid in respect of the insurance policies are not disclosed as such disclosure is prohibited under the terms of the contract.
12. Auditor’s Independence DeclarationA copy of the Auditor’s independence declaration as required under section 307C of the Corporations Act 2001 is set out on page 79.
67Annual and Sustainability Report 2016 Celebrating 30 years
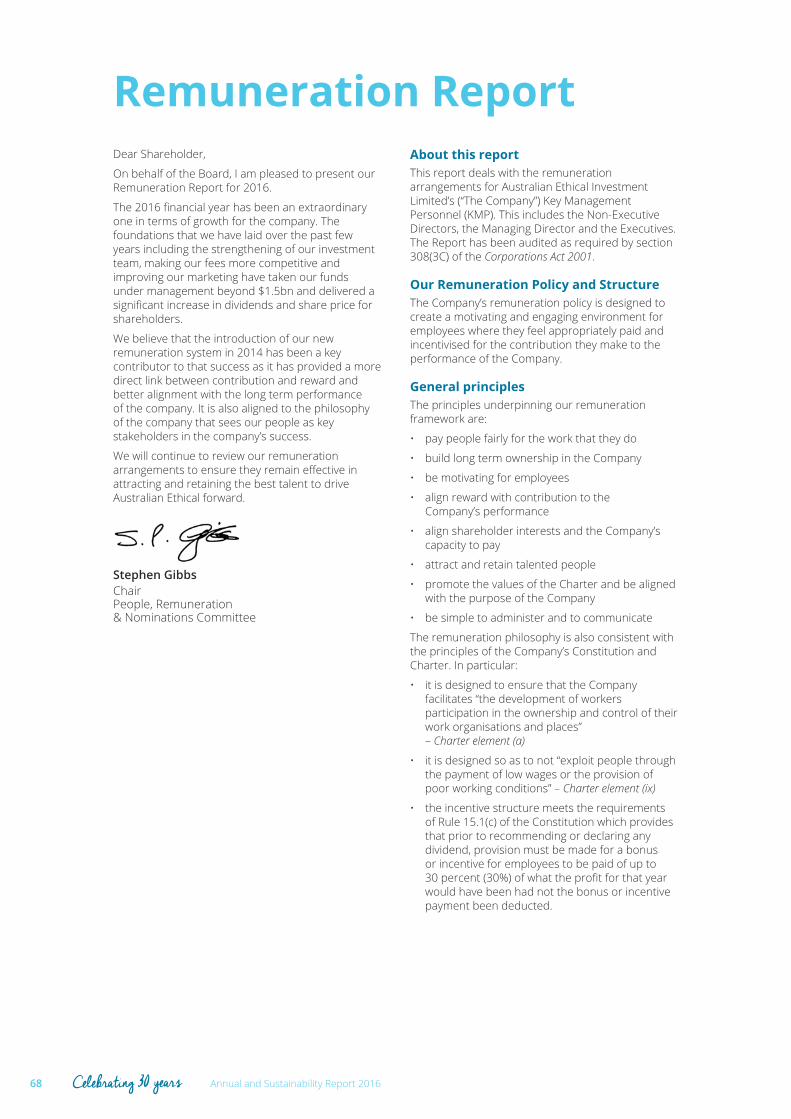
Dear Shareholder,
On behalf of the Board, I am pleased to present our Remuneration Report for 2016.
The 2016 financial year has been an extraordinary one in terms of growth for the company. The foundations that we have laid over the past few years including the strengthening of our investment team, making our fees more competitive and improving our marketing have taken our funds under management beyond $1.5bn and delivered a significant increase in dividends and share price for shareholders.
We believe that the introduction of our new remuneration system in 2014 has been a key contributor to that success as it has provided a more direct link between contribution and reward and better alignment with the long term performance of the company. It is also aligned to the philosophy of the company that sees our people as key stakeholders in the company’s success.
We will continue to review our remuneration arrangements to ensure they remain effective in attracting and retaining the best talent to drive Australian Ethical forward.
Stephen Gibbs Chair People, Remuneration & Nominations Committee
About this reportThis report deals with the remuneration arrangements for Australian Ethical Investment Limited’s (“The Company”) Key Management Personnel (KMP). This includes the Non-Executive Directors, the Managing Director and the Executives. The Report has been audited as required by section 308(3C) of the Corporations Act 2001.
Our Remuneration Policy and StructureThe Company’s remuneration policy is designed to create a motivating and engaging environment for employees where they feel appropriately paid and incentivised for the contribution they make to the performance of the Company.
General principlesThe principles underpinning our remuneration framework are:
• pay people fairly for the work that they do
• build long term ownership in the Company
• be motivating for employees
• align reward with contribution to the Company’s performance
• align shareholder interests and the Company’s capacity to pay
• attract and retain talented people
• promote the values of the Charter and be aligned with the purpose of the Company
• be simple to administer and to communicate
The remuneration philosophy is also consistent with the principles of the Company’s Constitution and Charter. In particular:
• it is designed to ensure that the Company facilitates “the development of workers participation in the ownership and control of their work organisations and places” – Charter element (a)
• it is designed so as to not “exploit people through the payment of low wages or the provision of poor working conditions” – Charter element (ix)
• the incentive structure meets the requirements of Rule 15.1(c) of the Constitution which provides that prior to recommending or declaring any dividend, provision must be made for a bonus or incentive for employees to be paid of up to 30 percent (30%) of what the profit for that year would have been had not the bonus or incentive payment been deducted.
Remuneration Report
68 Annual and Sustainability Report 2016Celebrating 30 years

Remuneration Framework Summary
Element Key Driver Quantum How Paid Criteria
Fixed remuneration (FR)
Pay people fairly Assessed against market data based on position and skills and experience brought to the role. Target remuneration is based around the median of the relevant comparator group for each job role
Paid fortnightly Continued employment
Short term incentive (STI)
Incentivises and rewards for achieving annual objectives
Percentage of fixed remuneration based on market assessment
Paid annually on last pay period in September. Timing allows for the inclusion of financial results in performance assessments
Objectives include (depending on role):
• Profit
• Growth
• Investment performance
• Individual objectives
• Culture
Long term incentive (LTI)
Retention and fostering an interest in the Company’s long term performance
Percentage of fixed remuneration based on market assessment
Shares held in trust and vest after three years
Shares subject to three year vesting as follows:
• 50% based on remaining employed with the Company
• 50% based on compound annual growth in Earnings per Share (EPS) and remaining employed with the Company
69Annual and Sustainability Report 2016 Celebrating 30 years

Remuneration framework
Short term incentiveThe aim of the short term incentive scheme is to incentivise and reward employees for performance against annual objectives.
The maximum incentive paid each year is based on a percentage of each employee’s fixed remuneration and their role and responsibility and benchmarked against market data.
It is paid in cash in September of each year following the finalisation of annual results and performance reviews.
Outcomes are assessed based on performance against a “balanced scorecard” of objectives. The actual objectives and percentage vary depending on the role and cover the following:
Measure Description
Profit A portion of the incentive is based on meeting annual profit targets determined by the Board
Growth Focussed on building long term growth. Measures include growth in client numbers and net inflows
Investment performance
Assessed according to performance against investment benchmarks
Individual objectives
Each employee will have certain individual objectives to achieve for the year
Culture Employees have an obligation to adhere to certain cultural standards. These include abiding by the Company’s values and risk management requirements
Long term incentive schemeThe aim of the long term incentive scheme is to foster an interest in the long term performance of the Company, to encourage participation in the affairs of the Company and to encourage the retention of employees.
The maximum incentive paid each year is based on a percentage of each employee’s fixed remuneration and role, benchmarked against market data.
Shares are issued at the commencement of each financial year and held in trust for three years. They vest in the name of the employee after three years, provided that the employee remains employed and that long term financial performance hurdles are met. Whilst the shares remain unvested, employees participate in dividends and have voting rights.
The Deferred Share scheme operates as follows:
Deferred share scheme
Description Shares are issued or bought on market at the commencement of the three year performance period and held on trust. At the end of the period, subject to performance hurdles being met, shares transfer into the name of the employee.
Performance hurdles
50% will vest if the employee remains with the Company after three years. 50% will vest on the following basis:
• If EPS growth18 is less than 5% pa, on average, zero will vest.
• If EPS growth is greater than 10% pa, on average, 100% will vest.
• If EPS growth is between 5% and 10% pa, on average, a pro rata amount will vest.
Dividends Dividends paid on unvested shares; which:
• provides real value that employees lose if they leave the Company.
• provides a direct real interest in the six monthly dividend performance of the Company and hence alignment with shareholders’ interests
Voting Employees can vote on unvested shares
Expense to company
Cost of shares is fixed at time of issue and expensed over a three year period
Tax impact on company
Fully deductible in year of issue
Tax impact on employees
Tax crystallises only on exit from the employee share trust and therefore the payment of tax is more in the control of the employee.
Remuneration report (continued)
18 Growth in EPS is defined as compound average annual growth in the Company’s earnings per share comprising basic earnings per share (after tax). The Board may adjust EPS for items that do not reflect management and employee performance and day-to-day business operations and activities.
70 Annual and Sustainability Report 2016Celebrating 30 years
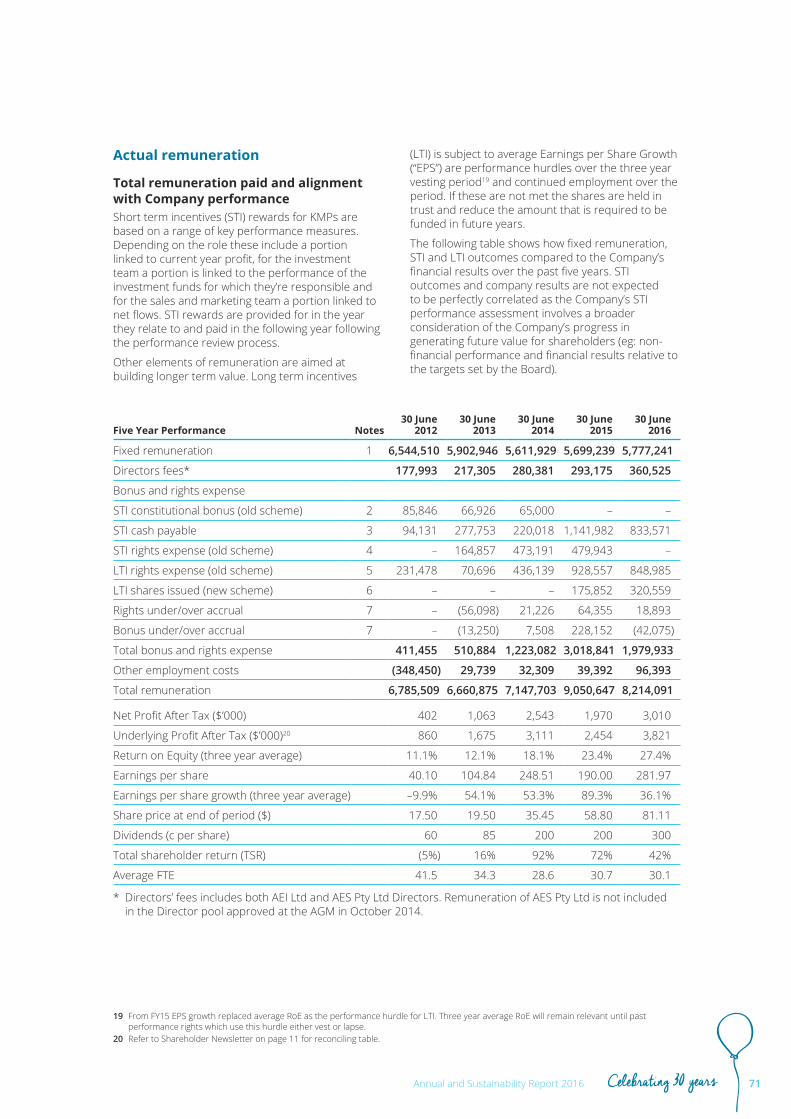
Actual remuneration
Total remuneration paid and alignment with Company performanceShort term incentives (STI) rewards for KMPs are based on a range of key performance measures. Depending on the role these include a portion linked to current year profit, for the investment team a portion is linked to the performance of the investment funds for which they’re responsible and for the sales and marketing team a portion linked to net flows. STI rewards are provided for in the year they relate to and paid in the following year following the performance review process.
Other elements of remuneration are aimed at building longer term value. Long term incentives
(LTI) is subject to average Earnings per Share Growth (“EPS”) are performance hurdles over the three year vesting period19 and continued employment over the period. If these are not met the shares are held in trust and reduce the amount that is required to be funded in future years.
The following table shows how fixed remuneration, STI and LTI outcomes compared to the Company’s financial results over the past five years. STI outcomes and company results are not expected to be perfectly correlated as the Company’s STI performance assessment involves a broader consideration of the Company’s progress in generating future value for shareholders (eg: non-financial performance and financial results relative to the targets set by the Board).
19 From FY15 EPS growth replaced average RoE as the performance hurdle for LTI. Three year average RoE will remain relevant until past performance rights which use this hurdle either vest or lapse.
20 Refer to Shareholder Newsletter on page 11 for reconciling table.
Five Year Performance Notes30 June
201230 June
201330 June
201430 June
201530 June
2016
Fixed remuneration 1 6,544,510 5,902,946 5,611,929 5,699,239 5,777,241
Directors fees* 177,993 217,305 280,381 293,175 360,525
Bonus and rights expense
STI constitutional bonus (old scheme) 2 85,846 66,926 65,000 – –
STI cash payable 3 94,131 277,753 220,018 1,141,982 833,571
STI rights expense (old scheme) 4 – 164,857 473,191 479,943 –
LTI rights expense (old scheme) 5 231,478 70,696 436,139 928,557 848,985
LTI shares issued (new scheme) 6 – – – 175,852 320,559
Rights under/over accrual 7 – (56,098) 21,226 64,355 18,893
Bonus under/over accrual 7 – (13,250) 7,508 228,152 (42,075)
Total bonus and rights expense 411,455 510,884 1,223,082 3,018,841 1,979,933
Other employment costs (348,450) 29,739 32,309 39,392 96,393
Total remuneration 6,785,509 6,660,875 7,147,703 9,050,647 8,214,091
Net Profit After Tax ($’000) 402 1,063 2,543 1,970 3,010
Underlying Profit After Tax ($’000)20 860 1,675 3,111 2,454 3,821
Return on Equity (three year average) 11.1% 12.1% 18.1% 23.4% 27.4%
Earnings per share 40.10 104.84 248.51 190.00 281.97
Earnings per share growth (three year average) –9.9% 54.1% 53.3% 89.3% 36.1%
Share price at end of period ($) 17.50 19.50 35.45 58.80 81.11
Dividends (c per share) 60 85 200 200 300
Total shareholder return (TSR) (5%) 16% 92% 72% 42%
Average FTE 41.5 34.3 28.6 30.7 30.1
* Directors’ fees includes both AEI Ltd and AES Pty Ltd Directors. Remuneration of AES Pty Ltd is not included in the Director pool approved at the AGM in October 2014.
71Annual and Sustainability Report 2016 Celebrating 30 years
Notes:
1 Fixed remuneration has decreased and stabilised over time as the business has become more efficient operating with fewer people. Average salaries have increased as the Company has progressively moved people to market equivalent remuneration.
2 In 2015 the “Constitutional Bonus” paid to staff not in the STI scheme was discontinued as the STI scheme was rolled out to all employees.
3 (a) The STI cash component increased significantly in 2015 due to:
i. The inclusion of all employees in the Scheme
ii The move to pay STI as 100% cash rather than 50% cash and 50% performance rights. The cash payable under the new scheme includes 100% of the FY15 year STI expense compared to only 50% under the old scheme.
(b) The STI cash component for 2016 includes the accrual for expected bonuses in respect of meeting performance hurdles in the 2016 financial year which will be paid in the 2017 financial year. These performance hurdles included investment performance, flows and profit targets.
4 The final STI rights vested on 30 June 2015.
5 This is the final year for which there will be an item for LTI rights expense under the old scheme as the scheme rolls off to be replaced by the new scheme. In 2016 the amount has remained high despite it being in respect of only one year’s worth of amortisation due to:
(a) The increased share price. Performance rights are amortised based on the prevailing share price at the end of the period
(b) Increased likelihood of meeting hurdles due to the increased RoE.
This item will reduce to zero in the financial year ended 30 June 2017 as the new scheme (Note 6) increases.
6 For 2016 this is two years amortisation of the first issue of shares and one year’s amortisation of the second issue of shares under the new share scheme. This will increase over time as further issues are made. Once the shares have been purchased any future share price changes do not impact expenses for the Company.
7 Over/under accruals are due to needing to finalise accounts prior to finalisation of performance assessments and are accrued based on “target”.
Non-financial outcomesAs described earlier, in addition to profit targets, a number of non-financial objectives are used to determine incentive outcomes. Many of these develop the long-term sustainability of the business and so are not necessarily correlated to short-term financial performance. These objectives are applied in varying degrees depending on the role. Performance against some of these objectives in the past financial year have been:
Measure 2016 performance
Growth Total net flows of $319m, a 78% increase on the previous year.
Superannuation members increased by 24% over the year.
Investment performance
Regular top quartile investment performance in a number of funds.
Culture Employee engagement score considered to be in “Best Employer” range.
Risk and compliance measures included in all employee objectives.
Remuneration report (continued)
72 Annual and Sustainability Report 2016Celebrating 30 years
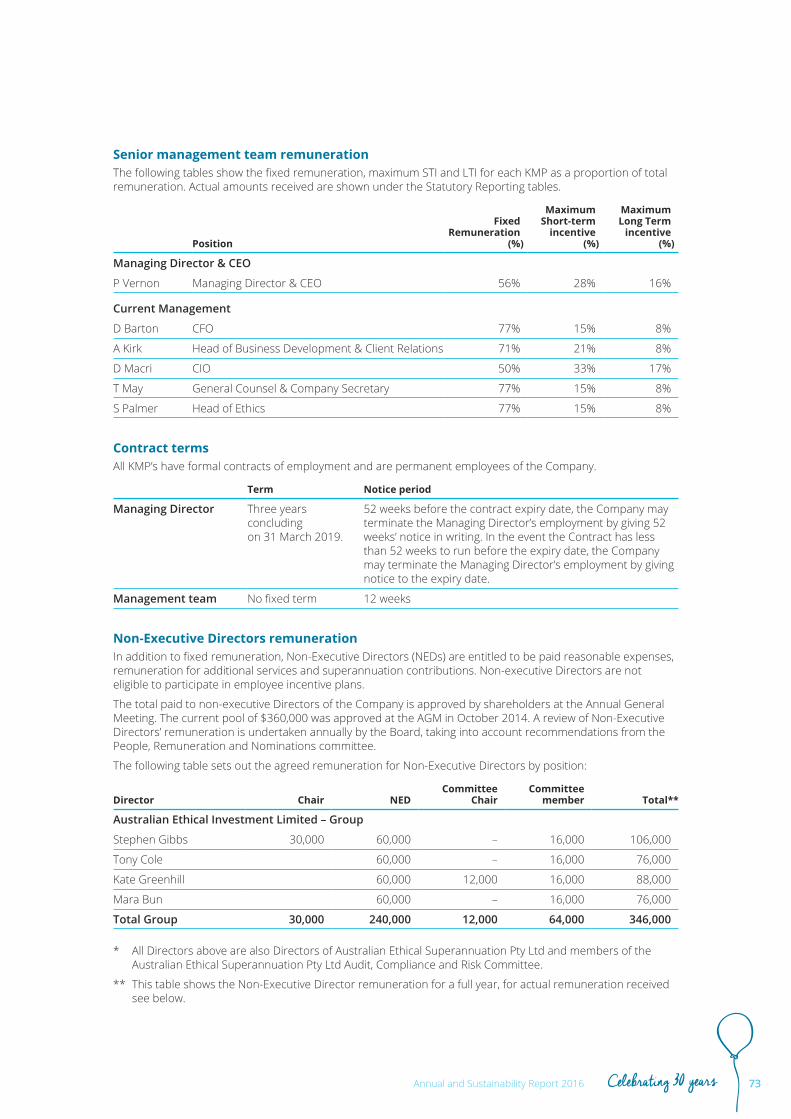
Senior management team remunerationThe following tables show the fixed remuneration, maximum STI and LTI for each KMP as a proportion of total remuneration. Actual amounts received are shown under the Statutory Reporting tables.
Position
Fixed Remuneration
(%)
Maximum Short-term
incentive(%)
Maximum Long Term
incentive(%)
Managing Director & CEO
P Vernon Managing Director & CEO 56% 28% 16%
Current Management
D Barton CFO 77% 15% 8%
A Kirk Head of Business Development & Client Relations 71% 21% 8%
D Macri CIO 50% 33% 17%
T May General Counsel & Company Secretary 77% 15% 8%
S Palmer Head of Ethics 77% 15% 8%
Contract termsAll KMP’s have formal contracts of employment and are permanent employees of the Company.
Term Notice period
Managing Director Three years concluding on 31 March 2019.
52 weeks before the contract expiry date, the Company may terminate the Managing Director’s employment by giving 52 weeks’ notice in writing. In the event the Contract has less than 52 weeks to run before the expiry date, the Company may terminate the Managing Director’s employment by giving notice to the expiry date.
Management team No fixed term 12 weeks
Non-Executive Directors remunerationIn addition to fixed remuneration, Non-Executive Directors (NEDs) are entitled to be paid reasonable expenses, remuneration for additional services and superannuation contributions. Non-executive Directors are not eligible to participate in employee incentive plans.
The total paid to non-executive Directors of the Company is approved by shareholders at the Annual General Meeting. The current pool of $360,000 was approved at the AGM in October 2014. A review of Non-Executive Directors’ remuneration is undertaken annually by the Board, taking into account recommendations from the People, Remuneration and Nominations committee.
The following table sets out the agreed remuneration for Non-Executive Directors by position:
Director Chair NEDCommittee
ChairCommittee
member Total**
Australian Ethical Investment Limited – Group
Stephen Gibbs 30,000 60,000 – 16,000 106,000
Tony Cole 60,000 – 16,000 76,000
Kate Greenhill 60,000 12,000 16,000 88,000
Mara Bun 60,000 – 16,000 76,000
Total Group 30,000 240,000 12,000 64,000 346,000
* All Directors above are also Directors of Australian Ethical Superannuation Pty Ltd and members of the Australian Ethical Superannuation Pty Ltd Audit, Compliance and Risk Committee.
** This table shows the Non-Executive Director remuneration for a full year, for actual remuneration received see below.
73Annual and Sustainability Report 2016 Celebrating 30 years

Statutory reporting
Management team remunerationThe table below outlines Executive reward as calculated in accordance with accounting standards and the Corporations Act 2001 requirements. The amounts shown are equal to the amount expensed in the Company’s financial statements.
Name Year
Short Term Benefits
Post-Employment
Benefits EquityLong Term
Benefits
Salary, Fees and
Leave($)
Cash Bonus
($)
Super-annuation
($)
Settled Share-based
payments($)
Total($)
Performance Based
Proportion($)
Long Service
Leave($)
Managing Director & CEO
P Vernon 2016 355,753 139,342 19,307 258,661 773,063 51.5% 11,8712015 337,458 76,162 18,782 103,904 536,306 33.6% 10,842
Current Management
D Barton 2016 247,193 37,183 19,252 33,281 336,909 20.9% 5,7322015 238,513 21,282 18,782 – 278,577 7.6% 5,915
A Kirk 2016 232,324 55,247 19,233 114,836 421,640 40.3% 5,7192015 212,000 30,502 18,782 11,344 272,628 15.3% 5,778
D Macri 2016 298,144 132,033 19,307 186,043 635,527 50.0% 10,0842015 280,124 67,179 18,782 100,574 466,659 35.9% 12,086
T May 2016 201,678 29,679 19,308 82,849 340,364 33.1% 6,9522015 193,356 17,696 18,782 21,376 251,210 15.6% 5,631
S Palmer 2016 178,449 26,451 19,465 8,761 233,126 15.1% 3,9702015 164,307 5,605 16,142 – 186,054 3.0% 4,167
Departed Management
P Smith 2016 – – – – – – –2015 83,488 – 7,469 12,053 103,010 11.70% –
Total 2016 1,513,541 419,935 115,872 684,432 2,733,780 40.40% 44,3282015 1,509,246 218,426 117,521 249,251 2,094,443 22.30% 44,419
For details on the performance criteria for each tranche of performance rights and deferred shares refer to Note 11 of the Notes to the Consolidated Financial Statements.
Notes in relation to the Management team remuneration:
1. The short term incentive bonus is for performance during the prior financial year using agreed KPI’s. The amount was finally determined in September 2015 after performance reviews were completed and approved by the PRNC.
2. The value of share based payment is based on the market value of shares on the day they vest.
Remuneration report (continued)
74 Annual and Sustainability Report 2016Celebrating 30 years
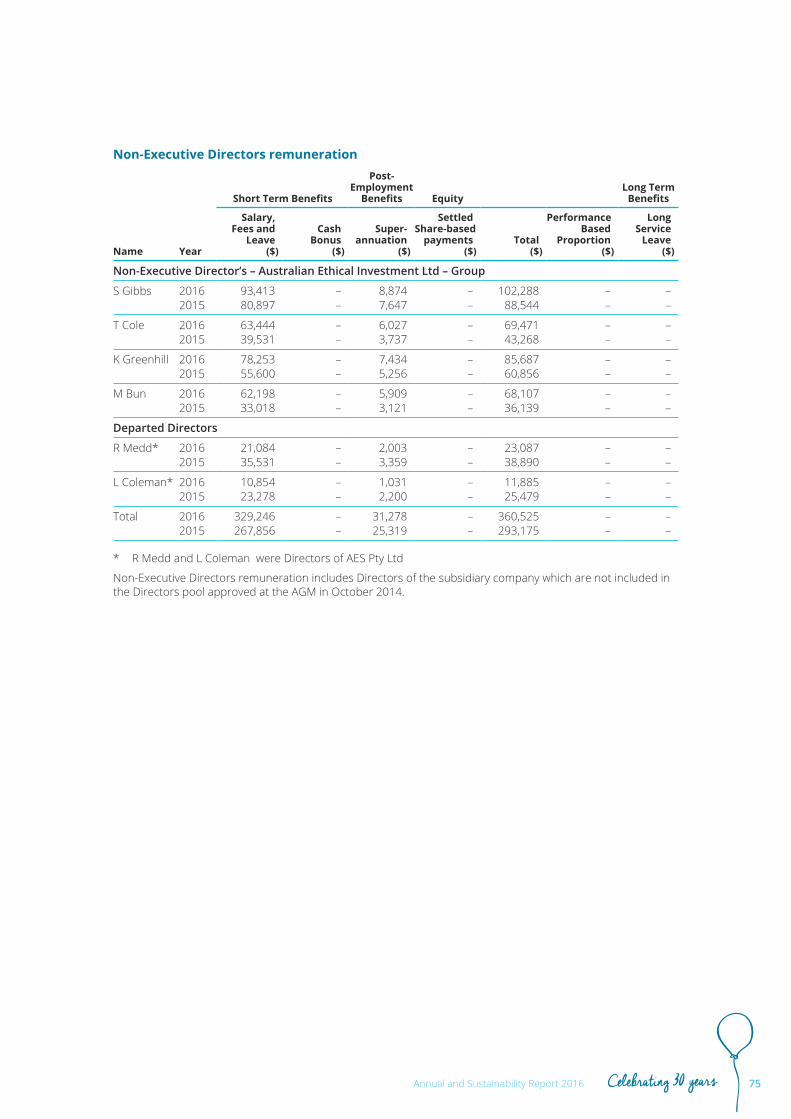
Non-Executive Directors remuneration
Name Year
Short Term Benefits
Post-Employment
Benefits EquityLong Term
Benefits
Salary, Fees and
Leave($)
Cash Bonus
($)
Super-annuation
($)
Settled Share-based
payments($)
Total($)
Performance Based
Proportion($)
Long Service
Leave($)
Non-Executive Director’s – Australian Ethical Investment Ltd – Group
S Gibbs 2016 93,413 – 8,874 – 102,288 – –2015 80,897 – 7,647 – 88,544 – –
T Cole 2016 63,444 – 6,027 – 69,471 – –2015 39,531 – 3,737 – 43,268 – –
K Greenhill 2016 78,253 – 7,434 – 85,687 – –2015 55,600 – 5,256 – 60,856 – –
M Bun 2016 62,198 – 5,909 – 68,107 – –2015 33,018 – 3,121 – 36,139 – –
Departed Directors
R Medd* 2016 21,084 – 2,003 – 23,087 – –2015 35,531 – 3,359 – 38,890 – –
L Coleman* 2016 10,854 – 1,031 – 11,885 – –2015 23,278 – 2,200 – 25,479 – –
Total 2016 329,246 – 31,278 – 360,525 – –2015 267,856 – 25,319 – 293,175 – –
* R Medd and L Coleman were Directors of AES Pty Ltd
Non-Executive Directors remuneration includes Directors of the subsidiary company which are not included in the Directors pool approved at the AGM in October 2014.
75Annual and Sustainability Report 2016 Celebrating 30 years

Unvested performance rights, unvested shares and ordinary sharesThe movement during the reporting period in the number of rights over ordinary shares and ordinary shares in the Company, held directly, indirectly or beneficially, by each key management person, including their related parties is as follows:
NameRights/Shares Class
Balance at beginning
of yearNo.
grantedNo. forfeited/ Expired/ Sold
No. vested & exercised
Balance at the end of year
Managing Director & CEO
P Vernon AEFAC 2,432 – – (2,432) –
AEFAG 1,967 – – (1,947) –
AEFAE 4,037 – – – 4,037
Deferred Shares 2,412 1,913 – – 4,325
AEF Ordinary shares 5,013 – – 4,399 9,412
2016 Total 15,861 1,913 – – 17,774
2015 Total 12,218 4,379 (736) – 15,861
Current Management
D Barton AEFAG 566 – – (566) –
Deferred Shares 604 479 – – 1,083
AEF Ordinary shares – – – 566 566
2016 Total 1,170 479 – – 1,649
2015 Total – 1,170 – – 1,170
A Kirk AEFAC 1,142 – – (1,142) –
AEFAG 811 – – (811) –
AEFAE 856 – – – 856
Deferred Shares 537 426 – – 963
AEF Ordinary shares 28 – (1,900) 1,953 81
2016 Total 3,374 426 (1,900) – 1,900
2015 Total 2,346 1,348 (320) – 3,374
D Macri AEFAC 1,379 – – (1,379) –
AEFAG 1,785 – – (1,785) –
AEFAE 3,223 – – – 3,223
Deferred Shares 2,313 1,834 – – 4,147
AEF Ordinary shares – – (2,263) 3,164 901
2016 Total 8,700 1,834 (2,263) – 8,271
2015 Total 9,767 4,483 (5,550) – 8,700
Remuneration report (continued)
76 Annual and Sustainability Report 2016Celebrating 30 years

NameRights/Shares Class
Balance at beginning
of yearNo.
grantedNo. forfeited/ Expired/ Sold
No. vested & exercised
Balance at the end of year
T May AEFAC 939 – – (939) –
AEFAG 470 – – (470) –
AEFAE 720 – – – 720
Deferred Shares 501 398 – – 899
AEF Ordinary shares – – (1,409) 1,409 –
2016 Total 2,630 398 (1,409) – 1,619
2015 Total 2,641 971 (982) – 2,630
S Palmer AEFAG 149 – – (149) –
AEF Ordinary shares 382 341 – – 723
Deferred Shares – – – 149 149
2016 Total 531 341 – – 872
2015 Total – 531 – – 531
Management who have departed during the prior year
P Smith AEFAC – – – – –
AEFAE – – – – –
AEFAF – – – – –
AEF Ordinary shares 629 – – – 629
2016 Total 629 – – – 629
2015 Total 2,303 – (1,674) – 629
For details on the performance criteria for each tranche of performance rights and deferred shares refer to Note 11 of the Notes to the Consolidated Financial Statements.
Future vesting scheduleType Issue year Fair Value Vesting date Number
Rights* FY 2011 – 12 $1,201,401 31/08/2016 14,812
Deferred Shares FY 2013 – 14 $1,005,277 31/08/2017 12,394
Deferred Shares FY 2014 – 15 $840,137 31/08/2018 10,358
Deferred Shares** FY 2015 – 16 $864,876 31/08/2019 10,663
Total $3,911,691 48,227
* On 31 August 2016 14,812 LTI employee share rights (AEFAE) were issued to employees following vesting of shares on 30 June 2016.
** 6,832 shares were issued on 31 August 2016 to the Employee Share Trust for employee long term incentives. This amount comprises of 10,663 shares for FY 2016-17 tranche less 3,831 shares forfeited from prior years.
77Annual and Sustainability Report 2016 Celebrating 30 years
Governance
The Role of the People, Remuneration and Nominations CommitteeThe role of the People, Remuneration and Nominations Committee (PRNC) is to help the Board fulfil its responsibilities to shareholders through a strong focus on governance, and in particular, the principles of accountability and transparency. The PRNC operates under delegated authority from the Board.
The terms of reference include oversight of remuneration as well as executive development, talent management and succession planning.
The PRNC members for the 2015/16 financial year were:
• Stephen Gibbs (Chair);
• Mara Bun;
• Kate Greenhill; and
• Tony Cole.
The PRNC met six times during the year.
Attendance at these meetings is set out in the Directors’ Report. At the PRNC’s invitation, the Managing Director and the People and Culture Consultant attended all meetings except where matters associated with their own performance evaluation; development and remuneration were to be considered. The PRNC considers advice and views from those invited to attend meetings and draws on services from a range of external sources, including remuneration consultants.
Managing Director and KMP PerformanceAn annual assessment of the Managing Director is completed by the Chairman and is overseen by the Board, with input from the PRNC. The review includes a 360 review process, measurement of performance against agreed KPI’s and Company performance.
The bonus received by the Managing Director during 2015/16 is shown in Statutory Reporting table and relates to the previous financial year of 2014/15. This flows from a formula linking the bonus to year on year profit changes and reflects an increase in the results for that previous financial year.
The Managing Director is responsible for reviewing the performance of Executives and determining whether their performance requirements were met. Both quantitative and qualitative data is used to determine whether performance criteria are achieved.
Annually an assessment is made on the eligibility for vesting of deferred shares issued under the long term incentive scheme.
Hedging PolicyExecutives participating in the Company’s equity-based plans are prohibited from entering into any transaction which would have the effect of hedging or otherwise transferring to any other person the risk of any fluctuation in the value of any unvested entitlement in the Company’s securities.
Trading restrictions and windowsAll Directors and employees are constrained from trading the Company during “blackout periods”. These periods occur between the end of the half year and full year and two days after the release of the half year and full year results.
Outcomes of votes at Annual General MeetingsAt the 2015 AGM, the Remuneration report received 29.2% of the vote against it out of 52.6% of shareholders that voted on the report. This result constituted a ‘first strike’.
In setting the remuneration structure we have carefully considered comments made by shareholders, sought advice from remuneration consultants and reviewed practises of our peers. We believe that the structure we have adopted is the most appropriate for our people, shareholders and the business providing the right balance between motivation, retention and alignment of interests between employees and shareholders.
The Directors’ report, incorporating the Remuneration report, is signed is accordance with a resolution of the Board of Directors.
Phil Vernon Managing Director & Chief Executive Officer
31 August 2016
Remuneration report (continued)
78 Annual and Sustainability Report 2016Celebrating 30 years

Lead Auditor’s Independence Declaration
79Annual and Sustainability Report 2016 Celebrating 30 years
Independent Auditor’s Reportto the Members of Australian Ethical Investment Limited
80 Annual and Sustainability Report 2016Celebrating 30 years

81Annual and Sustainability Report 2016 Celebrating 30 years

Consolidated entity Parent entity
Notes2016$’000
2015$’000
2016$’000
2015$’000
Revenue from continuing operations 2 23,039 21,171 19,656 18,240
Expenses
External services 3 (1,821) (1,714) (1,598) (1,330)
Employee benefits expense 10 (8,214) (9,051) (8,077) (8,956)
Occupancy costs 3 (365) (406) (365) (406)
Marketing and communication costs 3 (1,382) (762) (1,364) (748)
Fund related expenses 3 (3,322) (2,916) (1,004) (952)
Other expenses 3 (2,448) (1,627) (1,454) (1,514)
Depreciation and amortisation expense 3 (182) (186) (182) (186)
Gain/(loss) of disposal of assets 7 (74) 7 (74)
Community grants expense 3 (395) (373) (395) (373)
Impairment of property, plant and equipment 7 (181) (484) (181) (484)
Total expenses (18,303) (17,593) (14,613) (15,023)
Profit before tax 4,736 3,578 5,043 3,217
Tax expense 4(b) (1,726) (1,608) (1,011) (605)
Net profit for the year 3,010 1,970 4,032 2,612
Total comprehensive income for the year 3,010 1,970 4,032 2,612
2016Cents
2015Cents
Earnings per share for profit attributable to the ordinary equity holders of the Group:Basic earnings per share 21(a) 281.97 190.00
Diluted earnings per share 21(b) 271.80 180.69
The above Consolidated Statements of Comprehensive Income should be read in conjunction with the accompanying notes.
Consolidated Statements of Comprehensive IncomeFor the year ended 30 June 2016
82 Annual and Sustainability Report 2016Celebrating 30 years

Consolidated Statements of Financial PositionAs at 30 June 2016
Consolidated entity
AtParent entity
At
Notes
30 June2016$’000
30 June2015$’000
30 June2016$’000
30 June2015$’000
ASSETS
Current assets
Cash and cash equivalents 5 14,072 12,227 12,349 8,566
Trade and other receivables 6 495 1,780 149 1,757
Other current assets 368 323 313 272
Total current assets 14,935 14,330 12,811 10,595
Non-current assets
Property, plant and equipment 7 1,823 2,068 1,823 2,068
Capitalised website development costs – 57 – 57
Deferred tax assets 4(d) 914 772 641 742
Investment in subsidiary 17 – – 316 316
Total non-current assets 2,737 2,897 2,780 3,183
Total assets 17,672 17,227 15,591 13,778
LIABILITIES
Current liabilities
Trade and other payables 8 2,014 3,191 1,632 1,930
Current tax liabilities 605 1,177 412 617
Provisions 9 900 – – –
Employee benefits 10 1,169 1,435 1,169 1,435
Total current liabilities 4,688 5,803 3,213 3,982
Non-current liabilities
Trade and other payables 8 69 142 69 142
Employee benefits 10 99 130 99 130
Total non-current liabilities 168 272 168 272
Total liabilities 4,856 6,075 3,381 4,254
Net assets 12,816 11,152 12,210 9,524
EQUITY
Issued capital 14 8,693 7,004 8,693 7,004
Reserves 15 1,929 2,338 1,929 2,338
Retained earnings 2,194 1,810 1,588 182
Total equity 12,816 11,152 12,210 9,524
The above Consolidated Statements of Financial Position should be read in conjunction with the accompanying notes.
83Annual and Sustainability Report 2016 Celebrating 30 years

Notes
Issued capital
$’000
Asset revaluation
reserve $’000
Share-based
payments reserves
$’000
Retained earnings
$’000Total$’000
Consolidated entity
Balance at 1 July 2014 6,432 (4) 1,122 1,933 9,483
Net profit for the year – – – 1,970 1,970
Other comprehensive loss for the year – 4 – (4) –
Total comprehensive income for the year – 4 – 1,966 1,970
Transactions with owners in their capacity as owners:
Shares issued due to rights vesting during the year 14, 15 572 – (572) – –
Dividends provided for or paid 16 – – – (2,089) (2,089)
Employee share scheme – Rights 15 – – 1,472 – 1,472
Employee share plan – Deferred shares 15 – – 316 – 316
572 – 1,216 (2,089) (301)
Balance at 30 June 2015 7,004 – 2,338 1,810 11,152
Balance at 1 July 2015 7,004 – 2,338 1,810 11,152
Net profit for the year – – – 3,010 3,010
Other comprehensive income for the year – – – – –
Total comprehensive income for the year – – – 3,010 3,010
Transactions with owners in their capacity as owners:
Shares issued due to rights vesting during the year 14, 15 1,689 – (1,689) – –
Dividends provided for or paid 16 – – – (2,626) (2,626)
Employee share scheme – Rights 15 – – 868 – 868
Employee share plan – Deferred shares 15 – – 412 – 412
1,689 – (409) (2,626) (1,346)
Balance at 30 June 2016 8,693 – 1,929 2,194 12,816
The above Statement of Changes in Equity should be read in conjunction with the accompanying notes.
Consolidated Statement of Changes in EquityFor the year ended 30 June 2016
84 Annual and Sustainability Report 2016Celebrating 30 years

Notes
Issued capital
$’000
Asset revaluation
reserve $’000
Share-based
payments reserves
$’000
Retained earnings
$’000Total$’000
Parent entity
Balance at 1 July 2014 6,432 (4) 1,122 (337) 7,213
Net profit for the year – – – 2,612 2,612
Other comprehensive loss for the year – 4 – (4) –
Total comprehensive income for the year – 4 – 2,608 2,612
Transactions with owners in their capacity as owners:
Shares issued due to rights vesting during the year 14, 15 572 – (572) – –
Dividends provided for or paid 16 – – – (2,089) (2,089)
Employee share scheme – Rights 15 – – 1,472 – 1,472
Employee share plan – Deferred shares 15 – – 316 – 316
572 – 1,216 (2,089) (301)
Balance at 30 June 2015 7,004 – 2,338 182 9,524
Balance at 1 July 2015 7,004 – 2,338 182 9,524
Net profit for the year – – – 4,032 4,032
Other comprehensive income for the year – – – – –
Total comprehensive income for the year – – – 4,032 4,032
Transactions with owners in their capacity as owners:
Shares issued due to rights vesting during the year 14, 15 1,689 – (1,689) – –
Dividends provided for or paid 16 – – – (2,626) (2,626)
Employee share scheme – Rights 15 – – 868 – 868
Employee share plan – Deferred shares 15 – – 412 – 412
1,689 – (409) (2,626) (1,346)
Balance at 30 June 2016 8,693 – 1,929 1,588 12,210
The above Statement of Changes in Equity should be read in conjunction with the accompanying notes.
85Annual and Sustainability Report 2016 Celebrating 30 years

Consolidated entity Parent entity
Notes2016$’000
2015$’000
2016$’000
2015$’000
Cash flows from operating activities
Receipts from customers 23,981 36,273 18,402 31,028
Payments to suppliers and employees (16,946) (28,399) (13,400) (25,940)
Interest received 216 205 172 133
Income taxes paid (2,348) (1,426) (1,022) (746)
Community grants paid (481) (200) (481) (200)
Net cash inflow from operating activities 12 4,422 6,453 3,671 4,275
Cash flows from investing activities
Payments for property, plant and equipment 7 (58) (67) (58) (67)
Proceeds from sale of property, plant and equipment – 5 – 5
Proceeds from sale of investments – 1 – 1
Payments for website development costs – (26) – (26)
Dividends received from subsidiary – – 2,689 2,988
Net cash (outflow)/inflow from investing activities (58) (87) 2,631 2,901
Cash flows from financing activities
Dividends paid to the Company’s shareholders (2,519) (2,089) (2,519) (2,089)
Net cash (outflow) from financing activities (2,519) (2,089) (2,519) (2,089)
Net increase in cash and cash equivalents 1,845 4,277 3,783 5,087
Cash and cash equivalents at the beginning of the year 12,227 7,950 8,566 3,479
Cash and cash equivalents at the end of year 5 14,072 12,227 12,349 8,566
Consolidated Statements of Cash FlowsFor the year ended 30 June 2016
86 Annual and Sustainability Report 2016Celebrating 30 years
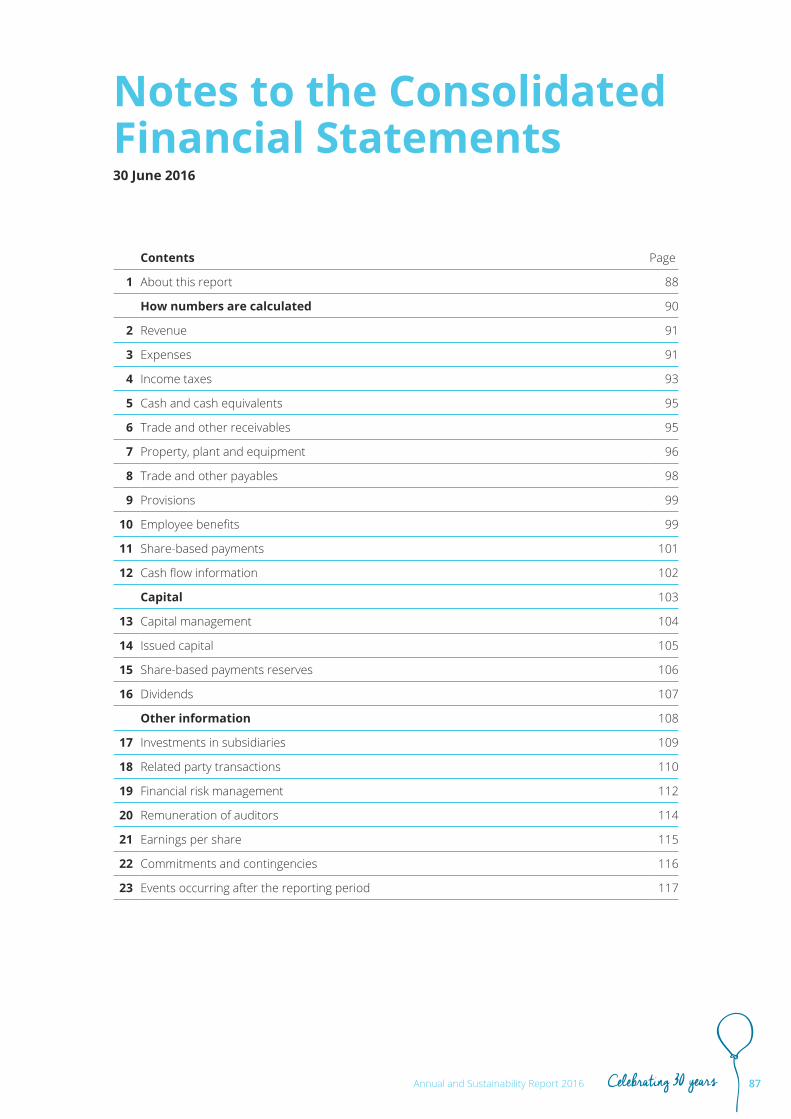
Contents Page
1 About this report 88
How numbers are calculated 90
2 Revenue 91
3 Expenses 91
4 Income taxes 93
5 Cash and cash equivalents 95
6 Trade and other receivables 95
7 Property, plant and equipment 96
8 Trade and other payables 98
9 Provisions 99
10 Employee benefits 99
11 Share-based payments 101
12 Cash flow information 102
Capital 103
13 Capital management 104
14 Issued capital 105
15 Share-based payments reserves 106
16 Dividends 107
Other information 108
17 Investments in subsidiaries 109
18 Related party transactions 110
19 Financial risk management 112
20 Remuneration of auditors 114
21 Earnings per share 115
22 Commitments and contingencies 116
23 Events occurring after the reporting period 117
Notes to the Consolidated Financial Statements30 June 2016
87Annual and Sustainability Report 2016 Celebrating 30 years

Notes to the Consolidated Financial Statements (continued)
1 About this reportThe financial report covers the consolidated entity of Australian Ethical Investment Limited, the ultimate parent entity, and its wholly owned subsidiaries (together referred to as the ‘Group’ and individually as ‘Group entities’) and Australian Ethical Investment Limited as an individual parent entity. Australian Ethical Investment Limited is a listed public company (ASX: AEF) and both the parent and wholly owned entities are incorporated and domiciled in Australia.
The Group is a for-profit entity for the purposes of preparing financial statements.
The consolidated financial report was authorised for issue by the Directors on 31 August 2016.
(a) Basis of preparationThe principal accounting policies adopted in the preparation of these consolidated financial statements are set throughout the report. These policies have been consistently applied to all the years presented, unless otherwise stated.
These general purpose financial statements have been prepared in accordance with Australian Accounting Standards and interpretations issued by the Australian Accounting Standards Board and the Corporations Act 2001.
The consolidated financial statements are presented in Australian dollars, which is the Group’s functional currency.
Accounting Standard Requirement Impact on Financial Statements
AASB 9 Financial Instruments and consequential amendments
AASB 9 addresses the classification, measurement and derecognition of financial assets, financial liabilities and hedging. This standard becomes mandatory for the June 2019 financial year, and will be applied prospectively.
The Group is assessing the potential impact on its consolidated financial statements resulting from the application of AASB 9.
AASB 15 Revenue from Contracts with Customers
AASB 15 provides a new five step model for recognising revenue earned from a contract with a customer and will replace the existing AASB 118 Revenue and AASB 111 Construction Contracts. The standard become mandatory for the June 2019 financial year and will be applied retrospectively.
The potential effect of this standard is yet to be determined.
(i) Compliance with IFRSThe consolidated financial statements of the Australian Ethical Investment Limited and its Controlled Entities and the separate financial statements of Australian Ethical Investment Limited also comply with International Financial Reporting Standards (IFRS) as issued by the International Accounting Standards Board (IASB).
(ii) Historical cost conventionThese financial statements have been prepared under the accruals basis and are based on historical cost convention, as modified by the revaluation of available-for-sale financial assets and property, plant and equipment.
(iii) New standards and interpretations not yet adoptedCertain new accounting standards and interpretations have been published that are not mandatory for 30 June 2016 reporting periods and have not been early adopted by the Group. The Group’s assessment of the impact of these new standards and interpretations is set out below.
88 Annual and Sustainability Report 2016Celebrating 30 years

1 About this report (continued)
(a) Basis of preparation (continued)There are no other standards that are not yet effective and that would be expected to have a material impact on the Group in the current or future reporting periods and on foreseeable future transactions.
(b) Rounding of amountsThe Group is an entity of a kind referred to in ASIC Corporations (Rounding in Financial/Directors’ Reports) Instrument 2016/191 issued by the Australian Securities and Investments Commission (ASIC) relating to the “rounding off” of amounts in the financial statements. Amounts in the financial statements have been rounded to the nearest thousand dollars in accordance with that ASIC Corporations Instrument, unless otherwise indicated.
(c) ComparativesWhere necessary, comparative information has been reclassified to be consistent with current reporting period.
(d) Critical accounting estimates and judgementsThe preparation of financial statements requires the use of accounting estimates which, by definition, will seldom equal the actual results. Management also needs to exercise judgement in applying the Group’s accounting policies.
The areas involving significant estimates or judgements are:
• Assessment of impairment of property, plant and equipment - Note 7
• Recognition and measurement of share based payments - Note 11
• Recoverability of deferred tax assets - Note 4
• Measurement of the amount of the provision for remediation - Note 9
Estimates and judgements are continually evaluated and are based on historical experience and other factors, including expectations of future events that may have a financial impact on the Group and that are believed to be reasonable under the circumstances.
(e) Segment informationThe Group determines and represents operating segments based on the information that is internally provided to the Managing Director (MD), who is the Group’s chief operating decision maker.
An operating segment is a component of the Group that engages in business activities from which it may earn revenues and incur expenses, including revenues and expenses that relate to transactions with any of the Group’s other components. The Group comprises of one main operating segment being Funds Management.
89Annual and Sustainability Report 2016 Celebrating 30 years
Notes to the Consolidated Financial Statements (continued)
How numbers are calculatedThis section provides additional information about those individual line items in the consolidated financial statements that the Directors consider most relevant in the context of the operations of the Group, including:
(a) accounting policies that are relevant for an understanding of the items recognised in the financial statements. These cover situations where the accounting standards either allow a choice or do not deal with a particular type of transaction
(b) analysis and sub-totals
(c) information about estimates and judgements made in relation to particular items.
2 Revenue
3 Expenses
4 Income taxes
5 Cash and cash equivalents
6 Trade and other receivables
7 Property, plant and equipment
8 Trade and other payables
9 Provisions
10 Employee benefits
11 Share-based payments
12 Cash flow information
90 Annual and Sustainability Report 2016Celebrating 30 years

2 RevenueConsolidated entity Parent entity
2016$’000
2015$’000
2016$’000
2015$’000
From continuing operations
Management and performance fees (net of rebates) 16,069 13,642 16,674 15,096
Member and withdrawal fees 2,018 1,675 – –
Administration fees 4,615 5,609 – –
Interest income 246 205 202 133
Other income 91 40 91 23
Dividends – – 2,689 2,988
23,039 21,171 19,656 18,240
Revenue recognitionRevenue is measured at the fair value of the consideration received or receivable.
(i) Fee revenueFee revenue is earned from provision of services to customers outside the consolidated entity. Revenue is recognised when services are provided.
(ii) DividendsDividends are recognised as revenue when the right to receive payment is established.
(iii) Interest incomeInterest income is recognised using the effective interest method.
3 ExpensesConsolidated entity Parent entity
2016$’000
2015$’000
2016$’000
2015$’000
External services
Ethical research 134 164 134 164
Audit 543 594 420 320
Consultants 325 379 237 293
Legal services 118 126 115 109
Other 701 451 692 444
1,821 1,714 1,598 1,330
Depreciation and amortisation expense
Depreciation 126 134 126 134
Amortisation 56 52 56 52
182 186 182 186
91Annual and Sustainability Report 2016 Celebrating 30 years
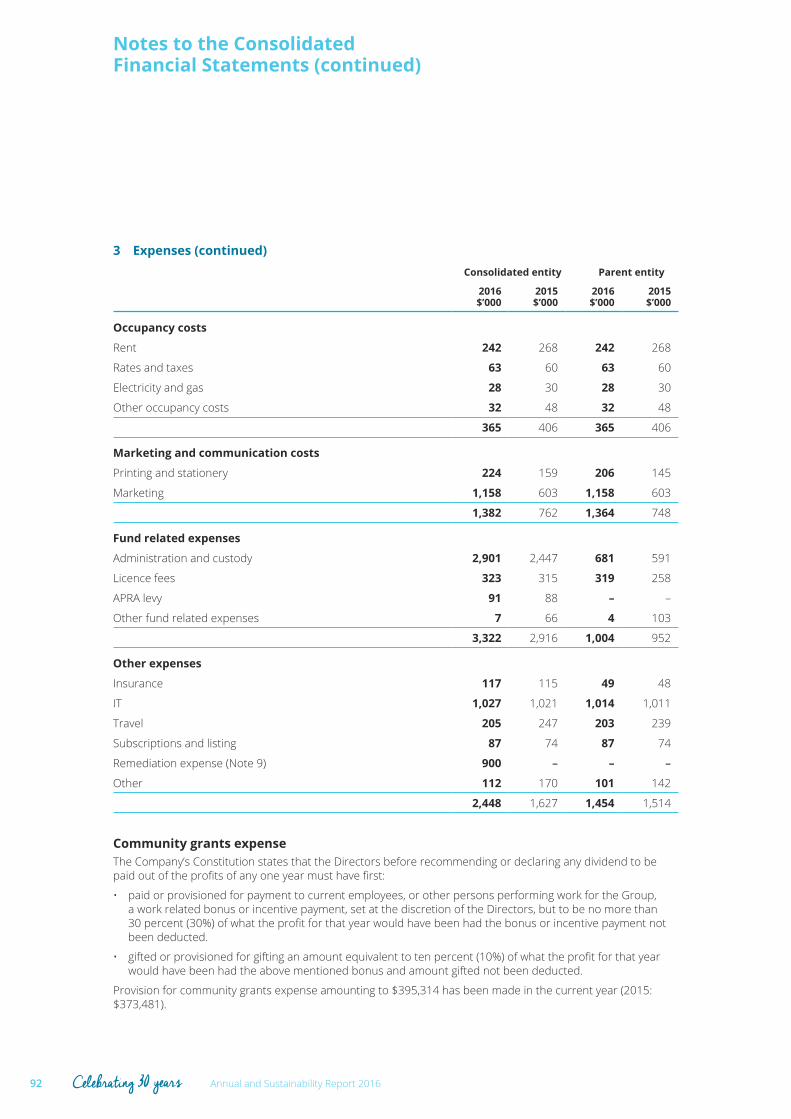
Notes to the Consolidated Financial Statements (continued)
3 Expenses (continued) Consolidated entity Parent entity
2016$’000
2015$’000
2016$’000
2015$’000
Occupancy costs
Rent 242 268 242 268
Rates and taxes 63 60 63 60
Electricity and gas 28 30 28 30
Other occupancy costs 32 48 32 48
365 406 365 406
Marketing and communication costs
Printing and stationery 224 159 206 145
Marketing 1,158 603 1,158 603
1,382 762 1,364 748
Fund related expenses
Administration and custody 2,901 2,447 681 591
Licence fees 323 315 319 258
APRA levy 91 88 – –
Other fund related expenses 7 66 4 103
3,322 2,916 1,004 952
Other expenses
Insurance 117 115 49 48
IT 1,027 1,021 1,014 1,011
Travel 205 247 203 239
Subscriptions and listing 87 74 87 74
Remediation expense (Note 9) 900 – – –
Other 112 170 101 142
2,448 1,627 1,454 1,514
Community grants expenseThe Company’s Constitution states that the Directors before recommending or declaring any dividend to be paid out of the profits of any one year must have first:
• paid or provisioned for payment to current employees, or other persons performing work for the Group, a work related bonus or incentive payment, set at the discretion of the Directors, but to be no more than 30 percent (30%) of what the profit for that year would have been had the bonus or incentive payment not been deducted.
• gifted or provisioned for gifting an amount equivalent to ten percent (10%) of what the profit for that year would have been had the above mentioned bonus and amount gifted not been deducted.
Provision for community grants expense amounting to $395,314 has been made in the current year (2015: $373,481).
92 Annual and Sustainability Report 2016Celebrating 30 years
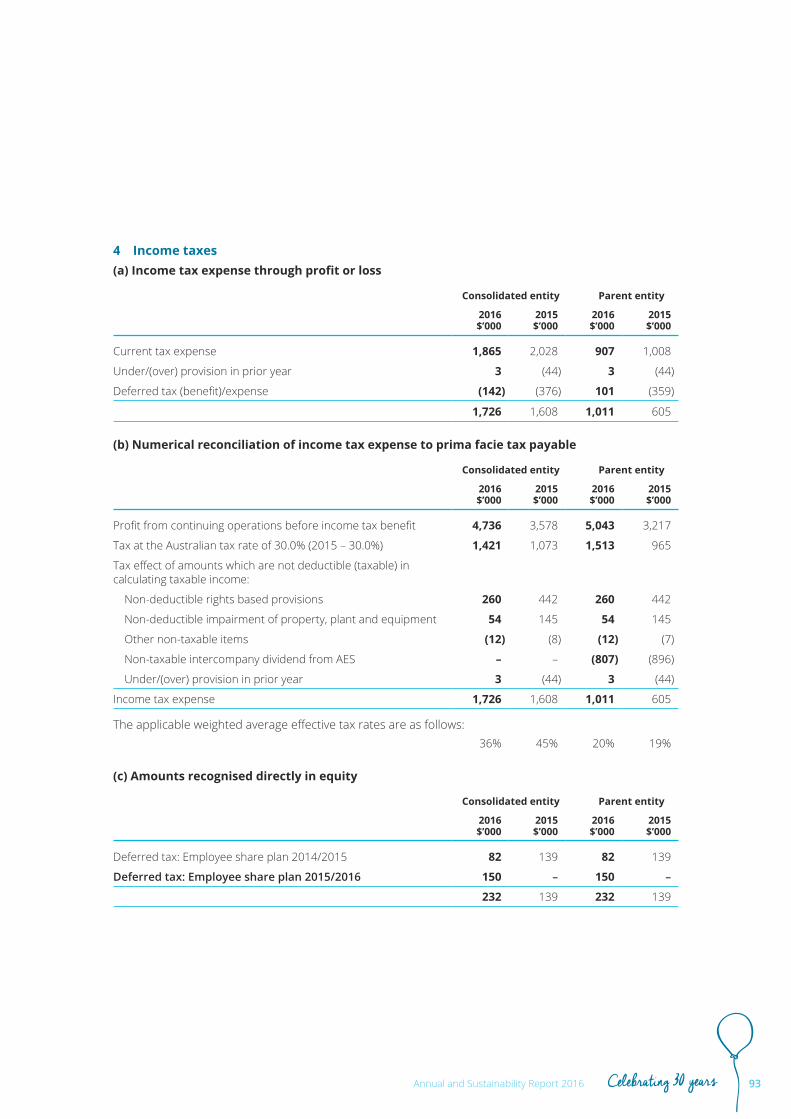
4 Income taxes(a) Income tax expense through profit or loss
Consolidated entity Parent entity
2016$’000
2015$’000
2016$’000
2015$’000
Current tax expense 1,865 2,028 907 1,008
Under/(over) provision in prior year 3 (44) 3 (44)
Deferred tax (benefit)/expense (142) (376) 101 (359)
1,726 1,608 1,011 605
(b) Numerical reconciliation of income tax expense to prima facie tax payable
Consolidated entity Parent entity
2016$’000
2015$’000
2016$’000
2015$’000
Profit from continuing operations before income tax benefit 4,736 3,578 5,043 3,217
Tax at the Australian tax rate of 30.0% (2015 – 30.0%) 1,421 1,073 1,513 965
Tax effect of amounts which are not deductible (taxable) in calculating taxable income:
Non-deductible rights based provisions 260 442 260 442
Non-deductible impairment of property, plant and equipment 54 145 54 145
Other non-taxable items (12) (8) (12) (7)
Non-taxable intercompany dividend from AES – – (807) (896)
Under/(over) provision in prior year 3 (44) 3 (44)
Income tax expense 1,726 1,608 1,011 605
The applicable weighted average effective tax rates are as follows:36% 45% 20% 19%
(c) Amounts recognised directly in equity
Consolidated entity Parent entity
2016$’000
2015$’000
2016$’000
2015$’000
Deferred tax: Employee share plan 2014/2015 82 139 82 139
Deferred tax: Employee share plan 2015/2016 150 – 150 –
232 139 232 139
93Annual and Sustainability Report 2016 Celebrating 30 years

Notes to the Consolidated Financial Statements (continued)
4 Income taxes (continued)(d) Deferred tax assets
Consolidated entity at Parent entity at
2016$’000
2015$’000
2016$’000
2015$’000
The balance comprises temporary differences attributable to:
Other employee benefits 250 342 250 342
Audit fees 45 66 42 36
Community grants 119 144 119 144
Provision for remediation 270 – – –
Provision for employee leave 230 220 230 220
Total deferred tax assets 914 772 641 742
Consolidated entity Parent entity
2016$’000
2015$’000
2016$’000
2015$’000
Movements:
Opening balance 772 396 742 383
Charged/credited:
– to profit or loss 142 376 (101) 359
Closing balance 914 772 641 742
Recognition and measurementTax expense comprises of current and deferred tax expense recognised in the profit and loss except where related to items recognised directly in equity. Tax expense is measured at the tax rates that have been enacted or substantially enacted based on the national tax rate for each applicable jurisdiction at the reporting date.
Current tax is the expected tax payable or receivable on taxable income or loss for the year and any adjustment in respect of previous years.
Deferred tax is recognised in respect of temporary differences between the carrying amounts of assets and liabilities.
Deferred tax assets and liabilities arise from timing differences between the recognition of gains and losses in the financial statements and their recognition in the tax computation. These are offset if there is a legal enforceable right to offset. Deferred tax assets are recognised only to the extent that it is probable that future taxable profits will be
available against which they can be utilised. These are reviewed at each reporting date and are reduced to the extent that it is no longer probable that the related tax benefits will be realised.
Australian Ethical Investment Limited and its wholly owned entities have formed an income tax consolidated group under the Tax Consolidation System. Australian Ethical Investment Limited is responsible for recognising the current and deferred tax assets and liabilities for the tax consolidated group.
The tax consolidated group has a tax sharing agreement whereby each company in the Group contributes to the income tax payable in proportion to their contribution to the net profit before tax of the tax consolidated group.
Under the tax sharing agreement, Australian Ethical Superannuation Pty Limited agrees to pay its share of the income tax payable to Australian Ethical Investment Limited on the same day that Australian Ethical Investment Limited pays the Australian Taxation Office for group tax liabilities.
94 Annual and Sustainability Report 2016Celebrating 30 years

5 Cash and cash equivalentsConsolidated entity at Parent entity at
2016$’000
2015$’000
2016$’000
2015$’000
Current assets
Cash at bank 128 20 123 15
Deposits at call 8,844 12,207 7,226 8,551
Term deposits 5,100 – 5,000 –
14,072 12,227 12,349 8,566
Recognition and measurementCash and cash equivalents includes cash on hand, deposits held at call with financial institutions, other short-term, highly liquid investments with original maturities of three months or less that are readily convertible to known amounts of cash and which are subject to an insignificant risk of changes in value.
6 Trade and other receivablesConsolidated entity at Parent entity at
2016$’000
2015$’000
2016$’000
2015$’000
Trade receivables 495 1,780 149 1,757
Information relating to transactions with related parties is set out in Note 18.
Recognition and measurementTrade and other receivables are recognised initially at fair value, which approximates their carrying value. Subsequent measurement is recorded at amortised cost using the effective interest method, less provision for impairment. Trade and other receivables are generally due for settlement within 30 days. They are presented as current assets unless collection is not expected for more than 12 months after the reporting date.
Collectability of trade and other receivables is reviewed on an ongoing basis. Debts which are known to be uncollectible are written off by reducing the carrying amount directly.
There are currently no past due receivables as at 30 June 2016 (2015: nil).
95Annual and Sustainability Report 2016 Celebrating 30 years
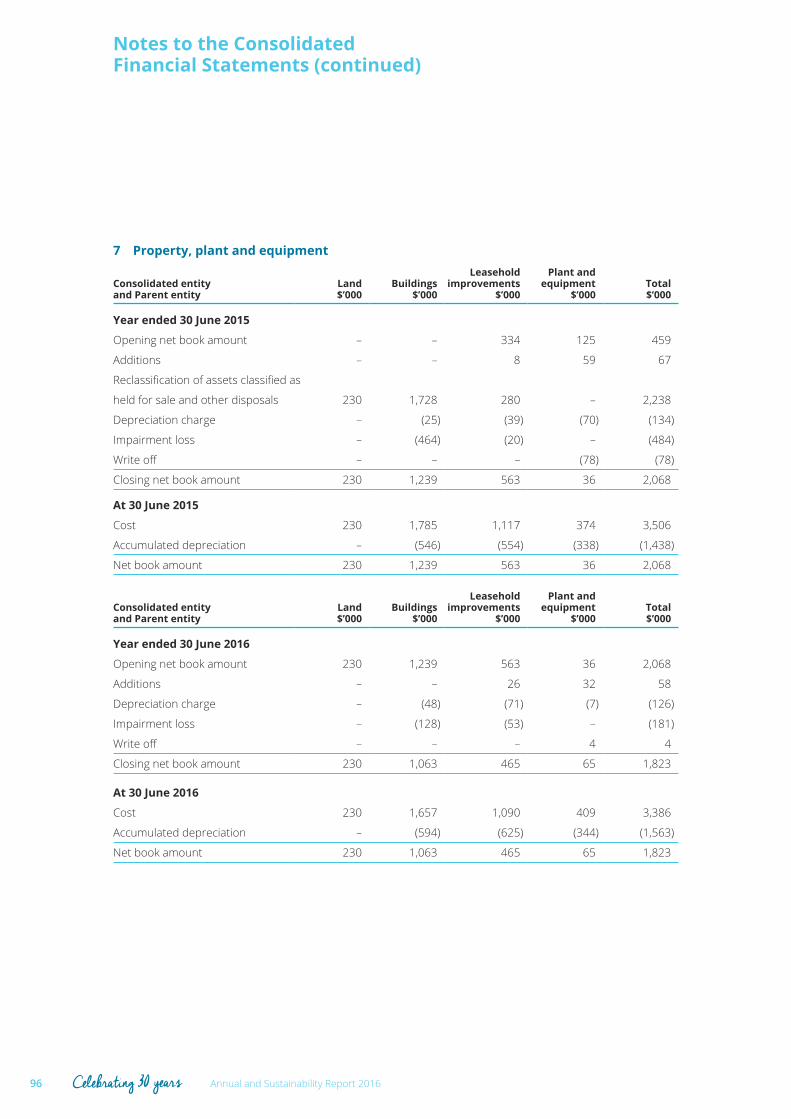
Notes to the Consolidated Financial Statements (continued)
7 Property, plant and equipment
Consolidated entity and Parent entity
Land$’000
Buildings$’000
Leasehold improvements
$’000
Plant andequipment
$’000Total$’000
Year ended 30 June 2015
Opening net book amount – – 334 125 459
Additions – – 8 59 67
Reclassification of assets classified as
held for sale and other disposals 230 1,728 280 – 2,238
Depreciation charge – (25) (39) (70) (134)
Impairment loss – (464) (20) – (484)
Write off – – – (78) (78)
Closing net book amount 230 1,239 563 36 2,068
At 30 June 2015
Cost 230 1,785 1,117 374 3,506
Accumulated depreciation – (546) (554) (338) (1,438)
Net book amount 230 1,239 563 36 2,068
Consolidated entity and Parent entity
Land$’000
Buildings$’000
Leasehold improvements
$’000
Plant andequipment
$’000Total$’000
Year ended 30 June 2016
Opening net book amount 230 1,239 563 36 2,068
Additions – – 26 32 58
Depreciation charge – (48) (71) (7) (126)
Impairment loss – (128) (53) – (181)
Write off – – – 4 4
Closing net book amount 230 1,063 465 65 1,823
At 30 June 2016
Cost 230 1,657 1,090 409 3,386
Accumulated depreciation – (594) (625) (344) (1,563)
Net book amount 230 1,063 465 65 1,823
96 Annual and Sustainability Report 2016Celebrating 30 years

Recognition and measurementProperty, plant and equipment are measured at cost less accumulated depreciation and impairment losses. The carrying amount of property, plant and equipment is reviewed annually to ensure that it is not in excess of the recoverable amount from these assets. Historical cost includes expenditure that is directly attributable to the acquisition of the items. Purchased software that is integral to the functionality of the related equipment is capitalised as part of that equipment.
Where parts of an item of property, plant and equipment have different useful lives, they are accounted for as separate items of property, plant and equipment.
Gains and losses on disposals are determined by comparing proceeds with carrying amount. These are included in profit or loss. When revalued assets are sold, it is Group policy to transfer any amounts included in other reserves in respect of those assets to retained earnings.
Subsequent costs are included in the asset’s carrying amount or recognised as a separate asset, as appropriate, only when it is probable that future economic benefits associated with the item will flow to the Group and the cost of the item can be measured reliably. The carrying amount of any component accounted for as a separate asset is derecognised when replaced. All other repairs and maintenance are charged to profit or loss during the reporting period in which they are incurred.
Depreciation methods and useful livesThe depreciable amount of all fixed assets including buildings, is depreciated over their estimated useful lives on a straight-line basis to the consolidated entity commencing from the time the asset is held ready for use.
Leasehold improvements are depreciated over the period of the lease or estimated useful life, whichever is the shorter, using the straight line method.
The estimated useful lives for current and comparative periods are as follows:
Class of fixed asset Estimated useful life
Buildings 5 – 40 years
Plant & Equipment 2.6 – 10 years
The assets’ residual values and useful lives are reviewed, and adjusted if appropriate, at the end of each reporting period.
ImpairmentAt the end of each reporting period, the Group reviews the carrying amounts of its tangible assets to determine whether there is any indication that those assets have suffered an impairment loss. If any such indication exists, the recoverable amount of the asset is estimated in order to determine the extent of the impairment loss (if any).
The recoverable amount is the higher of fair value less costs to sell and value in use. In assessing value in use, the estimated future cash flows are discounted to their present value using a pre-tax discount rate that reflects the current market assessments of the time value of money and the risks specific to the asset for which the estimates of future cash flows have not been adjusted.
If the recoverable amount of an asset is estimated to be less than its carrying amount, the carrying amount of the asset is reduced to its recoverable amount. An impairment loss is recognised immediately in profit or loss.
When an impairment loss subsequently reverses, the carrying amount of the asset is increased to the revised estimate of its recoverable amount, but so that the increased carrying amount does not exceed the carrying amount that would have been determined had no impairment loss been recognised for the asset in prior years. A reversal of an impairment loss is recognised immediately in profit or loss.
97Annual and Sustainability Report 2016 Celebrating 30 years
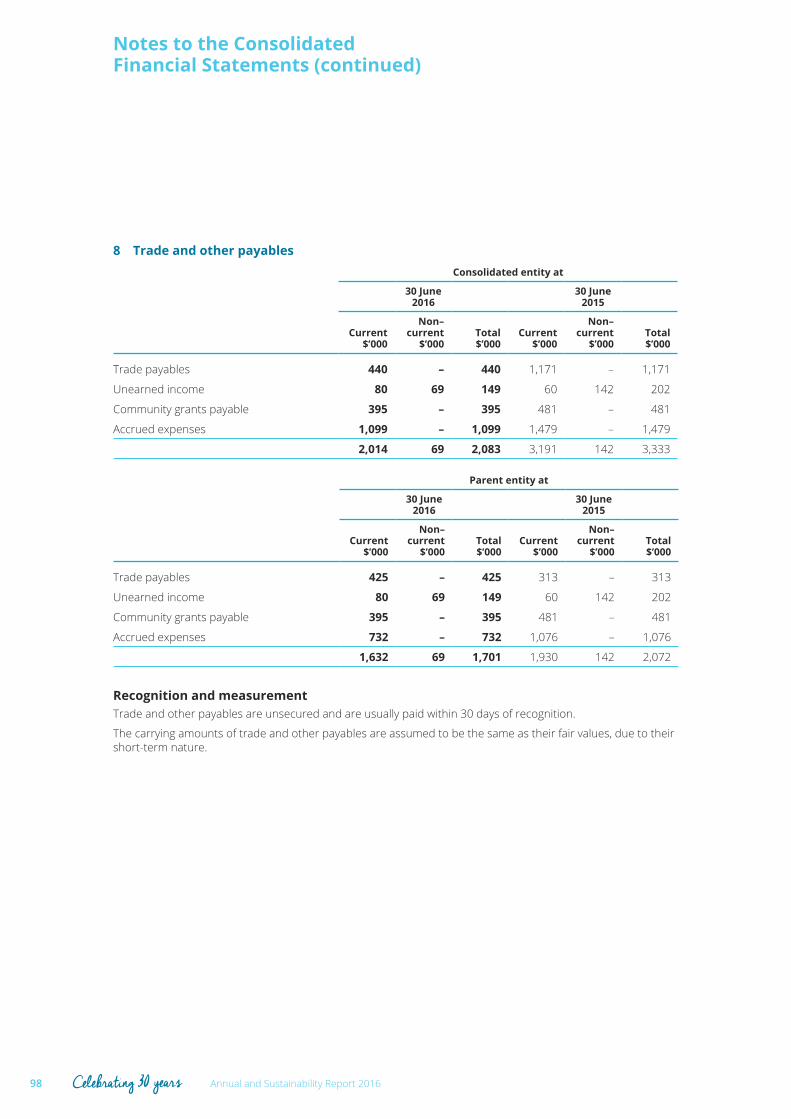
Notes to the Consolidated Financial Statements (continued)
8 Trade and other payablesConsolidated entity at
30 June2016
30 June2015
Current$’000
Non–current
$’000Total$’000
Current$’000
Non–current
$’000Total$’000
Trade payables 440 – 440 1,171 – 1,171
Unearned income 80 69 149 60 142 202
Community grants payable 395 – 395 481 – 481
Accrued expenses 1,099 – 1,099 1,479 – 1,479
2,014 69 2,083 3,191 142 3,333
Parent entity at
30 June2016
30 June2015
Current$’000
Non–current
$’000Total$’000
Current$’000
Non–current
$’000Total$’000
Trade payables 425 – 425 313 – 313
Unearned income 80 69 149 60 142 202
Community grants payable 395 – 395 481 – 481
Accrued expenses 732 – 732 1,076 – 1,076
1,632 69 1,701 1,930 142 2,072
Recognition and measurementTrade and other payables are unsecured and are usually paid within 30 days of recognition.
The carrying amounts of trade and other payables are assumed to be the same as their fair values, due to their short-term nature.
98 Annual and Sustainability Report 2016Celebrating 30 years
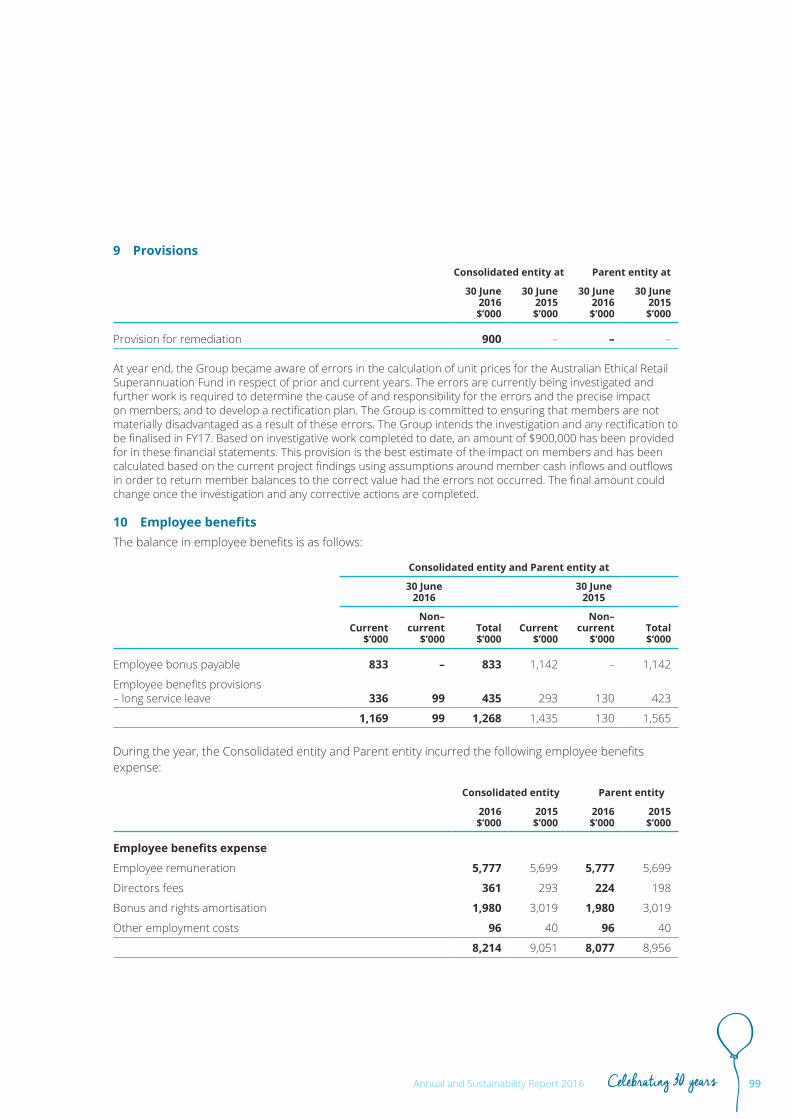
9 ProvisionsConsolidated entity at Parent entity at
30 June2016$’000
30 June2015$’000
30 June2016$’000
30 June2015$’000
Provision for remediation 900 – – –
At year end, the Group became aware of errors in the calculation of unit prices for the Australian Ethical Retail Superannuation Fund in respect of prior and current years. The errors are currently being investigated and further work is required to determine the cause of and responsibility for the errors and the precise impact on members, and to develop a rectification plan. The Group is committed to ensuring that members are not materially disadvantaged as a result of these errors. The Group intends the investigation and any rectification to be finalised in FY17. Based on investigative work completed to date, an amount of $900,000 has been provided for in these financial statements. This provision is the best estimate of the impact on members and has been calculated based on the current project findings using assumptions around member cash inflows and outflows in order to return member balances to the correct value had the errors not occurred. The final amount could change once the investigation and any corrective actions are completed.
10 Employee benefitsThe balance in employee benefits is as follows:
Consolidated entity and Parent entity at
30 June2016
30 June2015
Current$’000
Non–current
$’000Total$’000
Current$’000
Non–current
$’000Total$’000
Employee bonus payable 833 – 833 1,142 – 1,142
Employee benefits provisions – long service leave 336 99 435 293 130 423
1,169 99 1,268 1,435 130 1,565
During the year, the Consolidated entity and Parent entity incurred the following employee benefits expense:
Consolidated entity Parent entity
2016$’000
2015$’000
2016$’000
2015$’000
Employee benefits expense
Employee remuneration 5,777 5,699 5,777 5,699
Directors fees 361 293 224 198
Bonus and rights amortisation 1,980 3,019 1,980 3,019
Other employment costs 96 40 96 40
8,214 9,051 8,077 8,956
99Annual and Sustainability Report 2016 Celebrating 30 years

Notes to the Consolidated Financial Statements (continued)
10 Employee benefits (continued)
Recognition and measurement
Employee benefits provisionsEmployee benefits provisions are recognised when the Group has a present legal or constructive obligation as a result of past events, it is probable that an outflow of resources will be required to settle the obligation and the amount can be reliably estimated.
Short-term obligationsLiabilities for wages and salaries and annual leave that are expected to be settled within 12 months after the end of the period in which the employees render the related service are recognised in respect of employees’ services up to the end of the reporting period and are measured at the amounts expected to be paid when the liabilities are settled. The liabilities are presented as current employee benefit obligations in the Consolidated Statements of Financial Position and include related on-costs, such as workers compensation insurance and payroll tax.
Non-accumulating benefits, such as sick leave, are not provided for but are expensed as the benefits are taken by the employees.
A provision is recognised for the amount expected to be paid under short-term bonus or profit-sharing plans if the Consolidated entity has a present legal or constructive obligation to pay this amount as a result of past service provided by the employee.
Other long-term employee benefit obligationsThe liability for long service leave is recognised in the provision for employee benefits and expected future payments are discounted based on period of service.
Share-based paymentsThe grant-date fair value of share-based payment awards granted to employees is recognised as an employee expense, with a corresponding increase in equity, over the period that the employees become unconditionally entitled to the awards.
The amount recognised as an expense is adjusted to reflect the number of awards for which the related service conditions are expected to be met and the prevailing share price. The objective is that the amount ultimately recognised as an expense is based on the number of awards that meet the related service conditions at the vesting date.
Further details on employee benefits expense are included in the Remuneration Report.
Employee share trustLong term incentives for employees are held as shares in an employee share trust with various vesting conditions.
100 Annual and Sustainability Report 2016Celebrating 30 years

11 Share-based paymentsThe following share-based payment arrangements existed as at 30 June 2016.
(a) Performance rights (equity-settled)Under the Company’s employee share incentive scheme (ESIS) that existed until August 2014, participants were granted performance rights to ordinary shares, subject to meeting specified performance criteria over the performance period. The number of shares that the participant will ultimately receive will depend on the extent to which the performance criteria are met by the Group and the individual employee. These rights were issued for nil consideration with these rights holding no voting or dividend rights.
Performance rights summaryRights Class
Performance Period
Grant Date
Vesting Date
No. Granted
No. Forfeited
No. Vested
No. Expired Balance
AEFAC FY 2013-15 30/06/2013 30/06/2015 23,357 (6,523) (16,834) – –
AEFAE FY 2014-16 30/06/2014 30/06/2016 17,955 (3,143) (14,812) – –
AEFAG FY 2015 30/06/2015 30/06/2015 11,899 – (11,899) – –
(i) Fair value of rights grantedAll rights were calculated at grant date based on the underlying share prices minus estimated net present value of future dividends that the holders of rights are not entitled to.
Included under employee benefits expense in the consolidated statements of comprehensive income is $868,000 (2015: $1,472,000) relating to rights issued under the ESIS.
(b) Deferred sharesUnder the long term incentive scheme introduced in 2014, participants are granted shares subject to meeting specified performance criteria over the performance period. The number of shares that the participant receives is determined at the time of grant with the shares being held in trust. These shares are issued for nil consideration with the shares having voting rights and employees receive dividends.
Included under employee benefits expense in the consolidated statements of comprehensive income is $320,000 (2015: $176,000) relating to the performance shares granted.
Deferred shares are held in an Employee Share Trust until vesting conditions are met.
Deferred shares (continued) Performance shares summaryPerformance Period
Grant Date
Vesting Date
No. Granted
No. Forfeited
No. Vested
No. Expired Balance
FY 2014-15 31/08/2014 31/08/2017 14,924 (2,530) – – 12,394
FY 2015-16 31/08/2015 31/08/2018 12,190 (1,832) – – 10,358
FY 2016-17* 31/08/2016 31/08/2019 10,663 – – – 10,663
* This tranche of performance shares was issued to the Employee Share Trust on 31 August 2016.
(i) Fair value of deferred shares issuedThe fair value of the shares issued to the Employee Share Trust (10,663) was $864,876 based on the 30 June 2016 price.
101Annual and Sustainability Report 2016 Celebrating 30 years
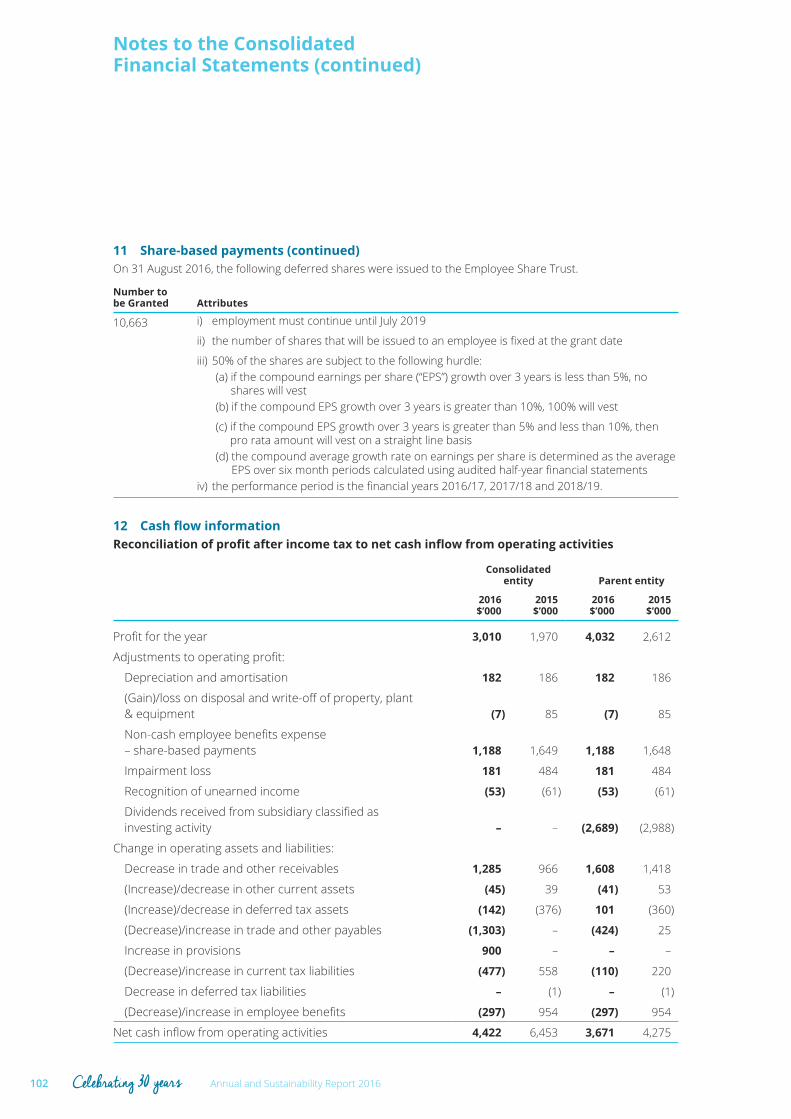
Notes to the Consolidated Financial Statements (continued)
11 Share-based payments (continued) On 31 August 2016, the following deferred shares were issued to the Employee Share Trust.
Number to be Granted Attributes
10,663 i) employment must continue until July 2019
ii) the number of shares that will be issued to an employee is fixed at the grant date
iii) 50% of the shares are subject to the following hurdle:(a) if the compound earnings per share (“EPS”) growth over 3 years is less than 5%, no
shares will vest(b) if the compound EPS growth over 3 years is greater than 10%, 100% will vest
(c) if the compound EPS growth over 3 years is greater than 5% and less than 10%, then pro rata amount will vest on a straight line basis
(d) the compound average growth rate on earnings per share is determined as the average EPS over six month periods calculated using audited half-year financial statements
iv) the performance period is the financial years 2016/17, 2017/18 and 2018/19.
12 Cash flow informationReconciliation of profit after income tax to net cash inflow from operating activities
Consolidated entity Parent entity
2016$’000
2015$’000
2016$’000
2015$’000
Profit for the year 3,010 1,970 4,032 2,612
Adjustments to operating profit:
Depreciation and amortisation 182 186 182 186
(Gain)/loss on disposal and write-off of property, plant & equipment (7) 85 (7) 85
Non-cash employee benefits expense – share-based payments 1,188 1,649 1,188 1,648
Impairment loss 181 484 181 484
Recognition of unearned income (53) (61) (53) (61)
Dividends received from subsidiary classified as investing activity – – (2,689) (2,988)
Change in operating assets and liabilities:
Decrease in trade and other receivables 1,285 966 1,608 1,418
(Increase)/decrease in other current assets (45) 39 (41) 53
(Increase)/decrease in deferred tax assets (142) (376) 101 (360)
(Decrease)/increase in trade and other payables (1,303) – (424) 25
Increase in provisions 900 – – –
(Decrease)/increase in current tax liabilities (477) 558 (110) 220
Decrease in deferred tax liabilities – (1) – (1)
(Decrease)/increase in employee benefits (297) 954 (297) 954
Net cash inflow from operating activities 4,422 6,453 3,671 4,275
102 Annual and Sustainability Report 2016Celebrating 30 years
CapitalThis section of the notes discusses the Group’s capital structure and dividends paid to shareholders.
13 Capital management
14 Issued capital
15 Share-based payments reserves
16 Dividends
103Annual and Sustainability Report 2016 Celebrating 30 years

Notes to the Consolidated Financial Statements (continued)
13 Capital managementThe Group manages its capital structure and related financing costs, including its balance sheet liquidity and access to capital markets. The Group’s objectives when managing capital are to safeguard its ability to continue as a going concern, to continue to provide returns to shareholders and benefits to other stakeholders, and to reduce the cost of capital.
(i) Regulatory capital requirementsIn connection with operating a funds management business in Australia, the Parent entity is required to hold an Australian Financial Services Licence (AFSL). As a holder of an AFSL, the Australian Securities & Investment Commission (ASIC) requires the Company to:
• prepare 12-month cash-flow projections which must be approved at least quarterly by Directors, and reviewed annually by auditors;
• hold at all times minimum Net Tangible Assets (NTA) the greater of:
(a) $150,000
(b) 0.5% of the average value of scheme property (capped at $5 million); or
(c) 10% of the average responsible entity revenue (uncapped).
The Company must hold at least 50% of its minimum NTA requirement as cash or cash equivalents and hold at least $50,000 in Surplus Liquid Funds (SLF).
The Company has complied with these requirements at all times during the year.
(ii) Dividend policyPart of the capital management of the Group is to determine the dividend policy. Dividends paid to shareholders are typically in the range of 80-100 per cent of the Group’s net profit after tax attributable to members of the Company, which is in line with the historical dividend range paid to shareholders. In certain circumstances, the Board may declare a dividend outside that range.
As at year end the Group had no long term debt arrangements.
There were no changes to the Group’s approach to capital management during the year.
104 Annual and Sustainability Report 2016Celebrating 30 years

14 Issued capital
Issues of ordinary shares by Parent entity
DateNo.
Issued PriceAmount
$’000 Comment
Opening balance 1/07/2014 1,023,147 6,432
31/08/2014 10,694 $35.45 380 Vesting of AEFAF Rights
31/08/2014 1,257 $46.00 58 Vesting of AEFAF Rights
31/08/2014 3,795 $35.45 134 Vesting of AEFAA Rights
31/08/2014 14,924 – –Issue of deferred shares to the Employee Share Trust1
Closing balance 30/06/2015 1,053,817 7,004
Opening balance 1/07/2015 1,053,817 7,004
31/08/2015 11,899 $58.80 699 Vesting of AEFAG Rights
31/08/2015 16,834 $58.80 990 Vesting of AEFAC Rights
31/08/2015 11,659 – –Issue of deferred shares to the Employee Share Trust1
Closing balance 30/06/2016 1,094,209 8,693
1 Shares issued to the Employee Share Plan Trust are considered to be Treasury shares as the Trust is defined as an agent of the Company. No value is attributed to these shares.
Ordinary shares are classified as equity. The Company does not have authorised capital or par value in respect of its shares.
Incremental costs directly attributable to the issue of new shares are shown in equity as a deduction, net of tax, from the proceeds.
Ordinary shares entitle the holder to participate in dividends and the proceeds on winding up of the Group in proportion to the number of shares held.
On a show of hands every holder of ordinary shares present at a meeting in person or by proxy, is entitled to one vote, and upon a poll each share is entitled to one vote.
105Annual and Sustainability Report 2016 Celebrating 30 years

Notes to the Consolidated Financial Statements (continued)
15 Share-based payments reservesConsolidated entity Parent entity
2016$’000
2015$’000
2016$’000
2015$’000
Share–based payments reserve
Opening balance 2,022 1,122 2,022 1,122
Employee share plan expense 868 1,472 868 1,472
Issue of shares held by entity to employees (1,689) (572) (1,689) (572)
1,201 2,022 1,201 2,022
Employee share plan reserve
Opening balance 316 – 316 –
Employee share plan - Deferred 412 316 412 316
728 316 728 316
1,929 2,338 1,929 2,338
Share-based payments reserveThis reserve relates to rights granted by the Group to its employees under its previous share-based payment arrangements. Items included in the share-based payment reserve will not be reclassified subsequently to profit or loss. Further information about share-based payments to employees is set out in Note 11.
Employee share plan reserveThis reserve relates to shares granted by the Group to its employees under its current share-based payment arrangement. Further information about the new share-based payments to employees is set out in Note 11.
106 Annual and Sustainability Report 2016Celebrating 30 years

16 Dividends
(a) Dividends declared/paid during the financial yearDividends declared and/or paid fully franked at 30% tax rate in respect of the corresponding financial year.
Cents per share
Total amount
Date of payment
% Franked
30 June 2016
Ordinary shares – 2015 final 120 $1,313,052 30/09/2015 100
Ordinary shares – 2016 interim 120 $1,313,052 24/03/2016 100
Total dividends paid $2,626,104
30 June 2015
Ordinary shares – 2015 interim 80 $843,054 27/03/2015 100
Ordinary shares – 2014 final 120 $1,246,676 03/10/2014 100
Total dividends paid $2,089,730
(b) Dividends declared after the end of the reporting periodConsolidated entity Parent entity
2016$’000
2015$’000
2016$’000
2015$’000
In addition to the above dividends, since year end the Directors have declared a final dividend of 180 cents per fully paid ordinary share (2015: 120 cents), fully franked based on tax paid at 30%. The aggregate amount of the declared dividend expected to be paid on 23 September 2016 out of profits for the year ended at 30 June 2016, but not recognised as a liability at year end, is: 2,009 1,313 2,009 1,313
RecognitionProvision is made for the amount of any dividend declared, being appropriately authorised and no longer at the discretion of the Company, on or before the end of the reporting period but not distributed at the end of the reporting period.
107Annual and Sustainability Report 2016 Celebrating 30 years
Notes to the Consolidated Financial Statements (continued)
Other informationThis section of the notes includes other information that must be disclosed to comply with the accounting standards and other pronouncements, but that is not immediately related to individual line items in the financial statements.
17 Investments in subsidiaries
18 Related party transactions
19 Financial risk management
20 Remuneration of auditors
21 Earnings per share
22 Commitments and contingencies
23 Events occurring after the reporting period
108 Annual and Sustainability Report 2016Celebrating 30 years

17 Investments in subsidiariesDetails of the Group’s subsidiaries at the end of the reporting period are as follows.
Name of the subsidiary Principal activity
Place of incorporation and operation
Proportion of ownership interest and voting power held by the Group
Cost of investment
Australian Ethical Superannuation Pty Limited (AES)
Trustee of the Australian Ethical Retail Superannuation Fund (AERSF)
Australia 100% $316,000
Australian Ethical Investment Limited Employee Share Plan Trust (AESSPT)
Employee deferred share plan trust
Australia 100% $1
(a) Principles of consolidation
(i) SubsidiariesSubsidiaries are all entities (including structured entities) over which the Group has control. The Group controls an entity when the Group is exposed to, or has rights to, variable returns from its involvement with the entity and has the ability to affect those returns through its power to direct the activities of the entity. Subsidiaries are fully consolidated from the date on which control is transferred to the Group. They are deconsolidated from the date that control ceases.
The acquisition method of accounting is used to account for business combinations by the Group.
Intercompany transactions, balances and unrealised gains on transactions between Group companies are eliminated. Unrealised losses are also eliminated unless the transaction provides evidence of the impairment of the asset transferred. Accounting policies of subsidiaries have been changed where necessary to ensure consistency with the policies adopted by the Group.
(ii) Employee Share TrustFor reporting purposes the Australian Ethical Investment Limited Employee Share Plan Trust has been treated as a branch of the Company. The assets and liabilities of the Trust are accounted for as assets and liabilities of the Company on the basis that the Trust is merely acting as an agent of the Company.
109Annual and Sustainability Report 2016 Celebrating 30 years
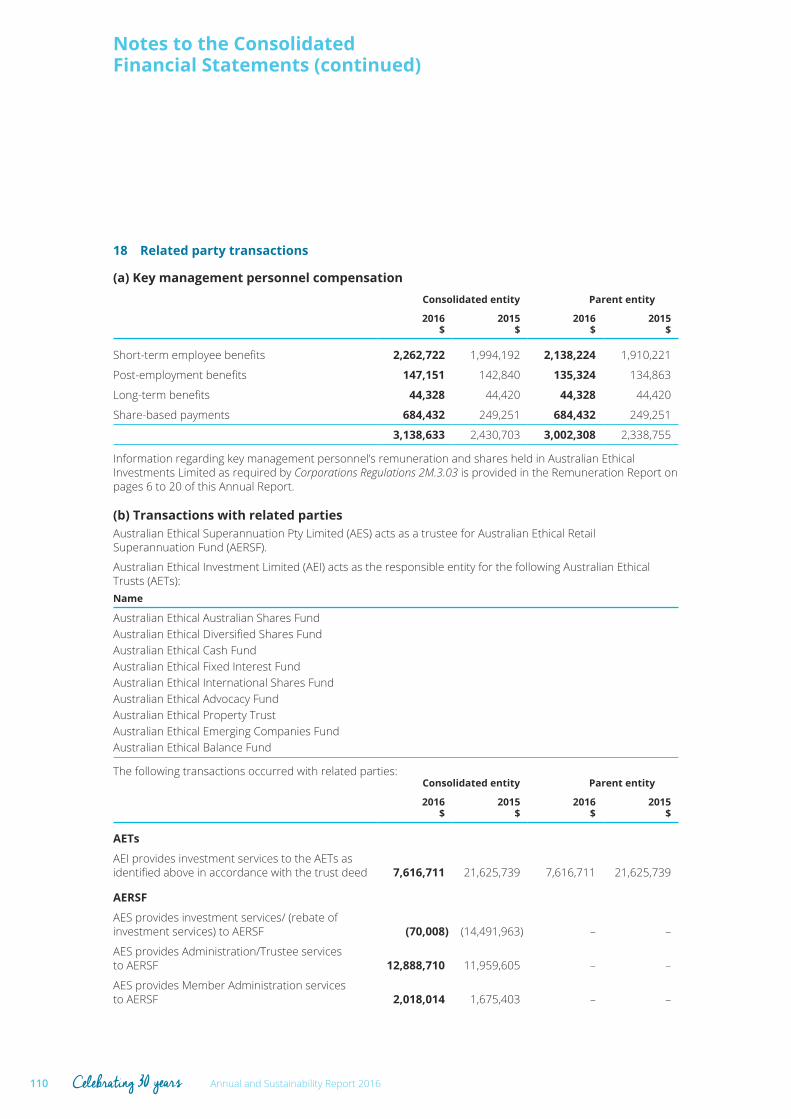
Notes to the Consolidated Financial Statements (continued)
18 Related party transactions
(a) Key management personnel compensationConsolidated entity Parent entity
2016$
2015$
2016$
2015$
Short-term employee benefits 2,262,722 1,994,192 2,138,224 1,910,221
Post-employment benefits 147,151 142,840 135,324 134,863
Long-term benefits 44,328 44,420 44,328 44,420
Share-based payments 684,432 249,251 684,432 249,251
3,138,633 2,430,703 3,002,308 2,338,755
Information regarding key management personnel’s remuneration and shares held in Australian Ethical Investments Limited as required by Corporations Regulations 2M.3.03 is provided in the Remuneration Report on pages 6 to 20 of this Annual Report.
(b) Transactions with related partiesAustralian Ethical Superannuation Pty Limited (AES) acts as a trustee for Australian Ethical Retail Superannuation Fund (AERSF).
Australian Ethical Investment Limited (AEI) acts as the responsible entity for the following Australian Ethical Trusts (AETs):Name
Australian Ethical Australian Shares FundAustralian Ethical Diversified Shares FundAustralian Ethical Cash FundAustralian Ethical Fixed Interest FundAustralian Ethical International Shares FundAustralian Ethical Advocacy FundAustralian Ethical Property TrustAustralian Ethical Emerging Companies FundAustralian Ethical Balance Fund
The following transactions occurred with related parties:Consolidated entity Parent entity
2016$
2015$
2016$
2015$
AETs
AEI provides investment services to the AETs as identified above in accordance with the trust deed 7,616,711 21,625,739 7,616,711 21,625,739
AERSF
AES provides investment services/ (rebate of investment services) to AERSF (70,008) (14,491,963) – –
AES provides Administration/Trustee services to AERSF 12,888,710 11,959,605 – –
AES provides Member Administration services to AERSF 2,018,014 1,675,403 – –
110 Annual and Sustainability Report 2016Celebrating 30 years

18 Related party transactions (continued)
(b) Transactions with related parties (continued)Consolidated entity Parent entity
2016$
2015$
2016$
2015$
AES
Service fee paid to AEI – – 9,006,256 7,954,852
Dividends paid to AEI – – 2,688,557 2,988,213
Director fees paid by AEI – – 136,323 92,836
Transactions between AES and its parent entity AEI under the tax consolidation and related tax sharing agreement referred to in Note 4 – – 714,907 1,004,218
AEFL *
Community grants paid by AEI to AEFL 480,542 – 480,542 –
* Australian Ethical Foundation Limited (AEFL) was created in July 2015 as a vehicle to distribute the community grants the Company makes each year. This will provide greater flexibility in the types of support the Company would be able to provide recipients and in the future will provide an opportunity to invite the shareholders and clients to contribute to AEFL and participate in the support of many worthwhile recipients.
Transactions between related parties are on commercial terms and conditions no more favourable than those available to other parties unless otherwise stated.
(c) Outstanding balancesThe following balances are outstanding at the end of the reporting period in relation to transactions with related parties:
Consolidated entityat
Parent entityat
30 June2016
$
30 June2015
$
30 June2016
$
30 June2015
$
Investment held in AES – – 316,000 316,000
Amounts receivable from the AETs 53,140 1,056,974 53,140 1,056,974
Amounts receivable from AERSF 396,572 720,066 – –
Amounts payable to AERSF (1,675) (853,049) – –
Amounts receivable from AES – – 50,201 697,408
Amounts payable to AEFL (395,314) – (395,314) –
111Annual and Sustainability Report 2016 Celebrating 30 years
Notes to the Consolidated Financial Statements (continued)
19 Financial risk managementThe Group’s activities expose it to a variety of financial risks, including market risk arising from Funds under Management, credit risk and liquidity risk. The Board of the Company has in place a risk management framework to mitigate these risks.
The Group does not have a material exposure to currency, price and interest rate risk.
Risk management frameworkThe Group recognises that risk is part of doing business and that the ongoing management of risk is critical to its success. The approach to managing risk is articulated in the Risk Management Strategy and the Risk Appetite Statement. The Risk & Compliance Manager is responsible for the design and maintenance of the risk and compliance framework, establishing and maintaining group wide risk management policies, and providing regular risk reporting to the Audit, Compliance & Risk Committee (ACRC). The Board regularly monitors the overall risk profile of the Group and sets the risk appetite for the Group, usually in conjunction with the annual planning process.
The Board is responsible for ensuring that management has appropriate processes in place for managing all types of risk. To assist in providing ongoing assurance and comfort to the Board, responsibility for risk management oversight has been delegated to the ACRC. The main functions of the Committee are to identify emerging risks and determine treatment and monitoring emergent and current risks. In addition, the Committee is responsible for seeking assurances from management that the systems and policies in place to assist the Group to meet and monitor its risk management responsibilities certain appropriate, up-to-date content and are being maintained. The Group is complying with its licences, and the regulatory requirements relevant to its roles as responsible entity, trustee and fund manager; and that there is a structure, methodology and timetable in place for monitoring material service providers.
The following discussion relates to financial risks exposure of the consolidated entity in its own right.
(a) Market riskMarket risk is the risk that the fair value or future cash flows of a financial instrument will fluctuate because of changes in market prices.
ExposureThe Group’s revenue is significantly dependent on Funds Under Management (FUM) which is influenced by equity market movements. Management calculates that a 10% movement in FUM changes annualised revenue by approximately $1,718,000 (2015: $1,606,000).
(b) Credit riskCredit risk is the risk of financial loss to the Group if a customer or a counterparty to a financial instruction fails to meet its contractual obligations. The Group is predominantly exposed to credit risk on its deposits with banks and financial institutions. The Group manages this risk by holding cash and cash equivalents at financial institutions with a Standard & Poor’s rating of ‘A’ or higher. The maximum exposure of the Group to credit risk on financial assets which have been recognised on the consolidated statements of financial position is the carrying amount of cash and cash equivalents. For all financial instruments other than those measured at fair value their carrying value approximates fair value.
The trade and other receivables are short term in nature and are not past due or impaired.
(c) Liquidity riskLiquidity risk is the risk that the Group will not be able to meet its financial commitments or will incur significant debt to meet those commitments.
The Group’s approach to managing liquidity is to maintain a level of cash or liquid investments sufficient to meet its ongoing financial obligations. The Group manages liquidity risk by continually monitoring forecast and actual cash flows, and by matching the maturity profiles of financial assets and liabilities. Surplus funds are generally only invested in instruments that are tradeable in highly liquid markets. In addition, a twelve month forecast of liquid assets, cash flows and balance sheet is reviewed by the Board annually as part of the budget process to ensure there is sufficient liquidity within the Group.
112 Annual and Sustainability Report 2016Celebrating 30 years

19 Financial risk management (continued)
Maturities of financial liabilitiesThe tables below analyse the Group’s non-derivative financial liabilities into relevant maturity groupings based on their contractual maturities at year end date.
The amounts disclosed in the table are the contractual undiscounted cash flows. Balances due within 12 months equal their carrying balances as the impact of discounting is not significant.
Trade and other payablesLess than 6 months
$’000
6-12 months
$’000
At 30 June 2016
Consolidated entity 2,332 331
Parent entity 1,949 331
Less than 6 months
$’000
6-12 months
$’000
At 30 June 2015
Consolidated entity 3,964 309
Parent entity 2,703 309
113Annual and Sustainability Report 2016 Celebrating 30 years

Notes to the Consolidated Financial Statements (continued)
20 Remuneration of auditorsDuring the year the following fees were paid or payable for services provided by the auditor of the Company, KPMG Australia and its related practices:
Consolidated entity Parent entity
2016$
2015$
2016$
2015$
Audit services for the consolidated entity and subsidiaries
Audit and review of consolidated and subsidiary financial statements 57,710 32,710 37,450 27,450
Audit services in accordance with regulatory requirements 42,480 40,480 38,050 36,250
Audit and review of Assurance Services in relation to Sustainability Report 19,500 – 19,500 –
119,690 73,190 95,000 63,700
Audit services for non–consolidated trusts and superannuation fund *
Audit and review of managed funds for which the Company acts as Responsible Entity 137,400 109,290 137,400 109,290
Audit and review of superannuation fund for which the subsidiary entity acts as Responsible Superannuation Entity 26,160 21,160 – –
Audit services in accordance with regulatory requirements 48,330 46,030 – –
211,890 176,480 137,400 109,290
Total remuneration for audit services 331,580 249,670 232,400 172,990
Non-audit services
Tax advice 41,850 37,074 34,900 31,233
Other accounting advice 63,775 56,819 41,775 56,819
Total remuneration for non-audit services 105,625 93,893 76,675 88,052
Total remuneration of KPMG Australia 437,205 343,563 309,075 261,042
* These fees are incurred by the Company and are effectively recovered from the funds via management fees.
The Board considered the non-audit services provided by the auditor and is satisfied that the provision of the non-audit services above by the auditor is compatible with, and does not compromise, the auditor independence requirements of the Corporations Act 2001 for the following reasons:
• all non-audit services are subject to the corporate governance procedures adopted by the Company and are reviewed by the Audit, Risk and Compliance Committee to ensure that they do not impact the integrity and objectivity of the auditor, and
• non-audit services provided do not undermine the general principles relating to auditor independence as set out in APES 110 Code of Ethics for Professional Accountants, as they do not involve reviewing or auditing the auditor’s own work, acting in a management or decision-making capacity for the Company, acting as an advocate for the Company or jointly sharing risks and rewards.
114 Annual and Sustainability Report 2016Celebrating 30 years

21 Earnings per share
(a) Basic earnings per share2016
cents 2015
cents
From continuing operations attributable to the ordinary equity holders of the Company 281.97 190.00
Basic earnings per share is calculated by dividing:
• the profit attributable to owners of the Group, excluding any costs of servicing equity other than ordinary shares of $3,010,000 (2015: $1,970,000)
• by the weighted average number of ordinary shares outstanding during the financial year, adjusted for bonus elements in ordinary shares issued during the year and excluding treasury shares.
(b) Diluted earnings per share2016
cents 2015
cents
From continuing operations attributable to the ordinary equity holders of the Company 271.80 180.69
Diluted earnings per share adjusts the figures used in the determination of basic earnings per share to take into account:
• the after income tax effect of interest and other financing costs associated with dilutive potential ordinary shares (nil in 2016 and 2015), and
• the weighted average number of additional ordinary shares that would have been outstanding assuming the conversion of all dilutive potential ordinary shares.
(c) Weighted average number of shares used as denominator2016
number 2015
number
Weighted average number of ordinary shares used as the denominator in calculating basic earnings per share 1,067,549 1,036,821
Adjustments for calculation of diluted earnings per share:
Weighted average number of rights outstanding 39,929 53,418
Weighted average number of ordinary and potential ordinary shares used as the denominator in calculating diluted earnings per share 1,107,478 1,090,239
115Annual and Sustainability Report 2016 Celebrating 30 years

Notes to the Consolidated Financial Statements (continued)
22 Commitments and contingencies
(a) Operating leasesOperating leases relate to leases of office premises for a term of seven years. The Group does not have an option to purchase the premises at the expiry of the lease period.
Consolidated entity Parent entity
2016$’000
2015$’000
2016$’000
2015$’000
Non-cancellable operating lease commitments
Within one year 483 232 483 232
Later than one year but not later than five years 2,134 431 2,134 431
2,617 663 2,617 663
Lease income from operating leases where the Group is a lessor is recognised in income on a straight-line basis over the lease term, except where another systematic basis is more representative of the time pattern in which economic benefits from the leased asset are consumed. Contingent rentals arising under operating leases are recognised as an expense in the period in which they are incurred. The respective leased assets are included in the consolidated financial statements based on their nature.
In the event that lease incentives are received to enter into operating leases, such incentives are recognised as a liability. The aggregate benefit of incentives is recognised as a reduction of rental expense on a straight-line basis, except where another systematic basis is more representative of the time pattern in which economic benefits from the leased asset are consumed.
Effective from 1 July 2016, the Company had taken a new long-term operating lease for its Sydney office for a period of seven years including additional office space.
Consolidated entity Parent entity
2016$’000
2015$’000
2016$’000
2015$’000
Payments recognised as an expense
Minimum lease payments recognised as an expense 224 234 224 234
224 234 224 234
Liabilities recognised in respect of non-cancellable operating leases
Lease incentives
Current 80 60 80 60
Non-current 69 142 69 142
149 202 149 202
(b) GuaranteesThe Group has provided a guarantee for $504,000 over the rental of building premises at 130 Pitt Street.
(c) Other commitmentsThe Group has no other commitments and contingent assets and liabilities as at 30 June 2016.
116 Annual and Sustainability Report 2016Celebrating 30 years
23 Events occurring after the reporting periodThe Group’s fees are primarily based on its funds under management which in turn is impacted by changes in equity markets.
6,832 shares were issued on 31 August 2016 to the Employee Share Trust for employee long term incentives. This amount comprises of 10,663 shares for FY 2016-17 less 3,831 shares forfeited from prior years.
On 31 August 2016, 14,812 LTI employee share rights (AEFAE) were issued to employees following vesting of shares on 30 June 2016.
Other than as outlined in this report, no other matter or circumstance has occurred subsequent to year end that has significantly affected, or may significantly affect, the operations of the Group, the results of those operations or the state of affairs of the Group in subsequent financial years.
117Annual and Sustainability Report 2016 Celebrating 30 years

1 In the opinion of the Directors of Australian Ethical Investment Limited and its controlled entities:
(a) the consolidated financial statements and notes that are set out on pages 64 to 117 and the Remuneration report in sections to in the Directors’ Report, are in accordance with the Corporations Act 2001, including:
(i) giving a true and fair view of the Group’s financial position as at 30 June 2016 and of its performance, for the financial year ended on that date; and
(ii) complying with Australian Accounting Standards and the Corporations Regulations 2001; and
(b) there are reasonable grounds to believe that the Group will be able to pay its debts as and when they become due and payable.
2 The Directors have been given the declarations required by Section 295A of the Corporations Act 2001 from the Chief Executive Office and Chief Financial Officer for the financial year ended 30 June 2016.
3 The Directors draw attention to Note 1(a)(i) to the consolidated financial statements, which includes a statement of compliance with International Financial Reporting Standards.
Signed in accordance with a resolution of the Directors:
Phil VernonManaging Director and Chief Executive Officer
Sydney31 August 2016
Directors’ declaration
118 Annual and Sustainability Report 2016Celebrating 30 years
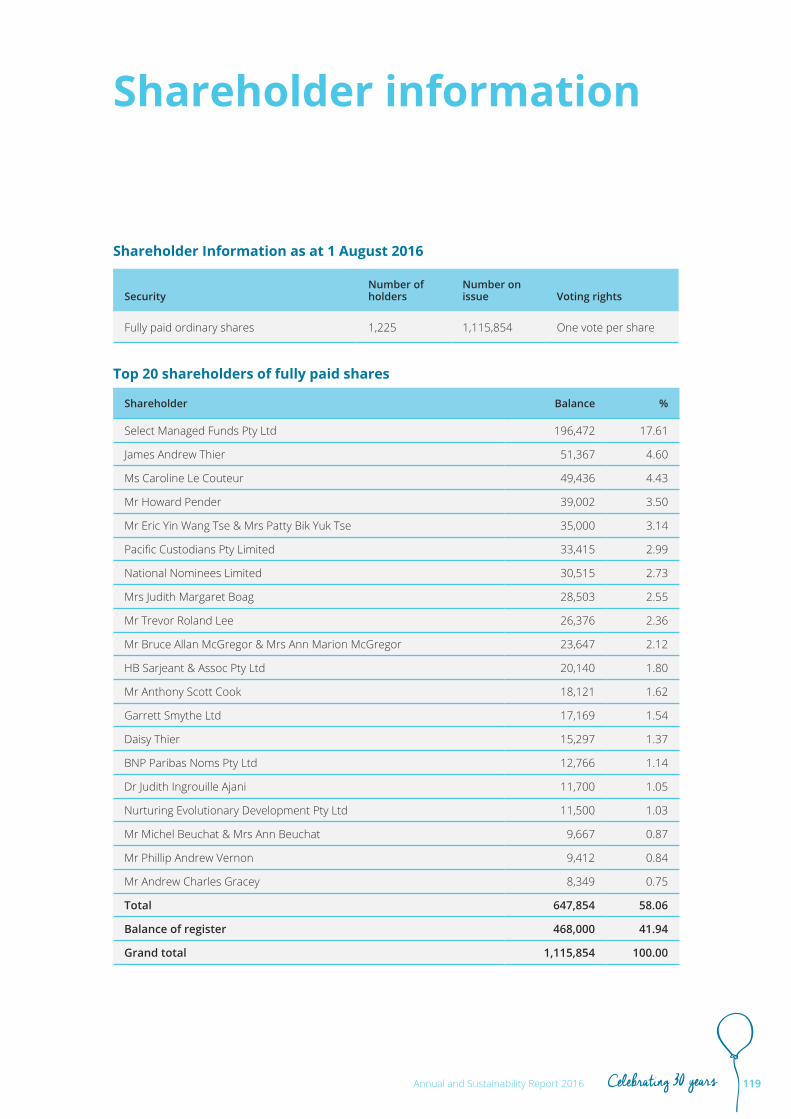
Shareholder information
Shareholder Information as at 1 August 2016
SecurityNumber of holders
Number on issue Voting rights
Fully paid ordinary shares 1,225 1,115,854 One vote per share
Top 20 shareholders of fully paid shares
Shareholder Balance %
Select Managed Funds Pty Ltd 196,472 17.61
James Andrew Thier 51,367 4.60
Ms Caroline Le Couteur 49,436 4.43
Mr Howard Pender 39,002 3.50
Mr Eric Yin Wang Tse & Mrs Patty Bik Yuk Tse 35,000 3.14
Pacific Custodians Pty Limited 33,415 2.99
National Nominees Limited 30,515 2.73
Mrs Judith Margaret Boag 28,503 2.55
Mr Trevor Roland Lee 26,376 2.36
Mr Bruce Allan McGregor & Mrs Ann Marion McGregor 23,647 2.12
HB Sarjeant & Assoc Pty Ltd 20,140 1.80
Mr Anthony Scott Cook 18,121 1.62
Garrett Smythe Ltd 17,169 1.54
Daisy Thier 15,297 1.37
BNP Paribas Noms Pty Ltd 12,766 1.14
Dr Judith Ingrouille Ajani 11,700 1.05
Nurturing Evolutionary Development Pty Ltd 11,500 1.03
Mr Michel Beuchat & Mrs Ann Beuchat 9,667 0.87
Mr Phillip Andrew Vernon 9,412 0.84
Mr Andrew Charles Gracey 8,349 0.75
Total 647,854 58.06
Balance of register 468,000 41.94
Grand total 1,115,854 100.00
119Annual and Sustainability Report 2016 Celebrating 30 years

Distribution of holdings of fully paid shares
Range Holders Total units %
1 to 1,000 1,136 237,765 21.31
1,001 to 5,000 93 193,639 17.35
5,001 to 10,000 9 64,024 5.74
10,001 to 100,000 16 423,954 37.99
100,001 and Over 1 196,472 17.61
Totals 1,255 1,115,854 100.00
On Thursday, 8 September 2016 AEF ordinary shares closed at $85.52. Accordingly, 6 or more shares constitute a marketable parcel. On Friday, 9 Septebmer 2016 the Company had 11 shareholders whose holdings is not a marketable parcel, these 11 shareholders own a total of 27 shares.
Shareholder information (continued)
120 Annual and Sustainability Report 2016Celebrating 30 years
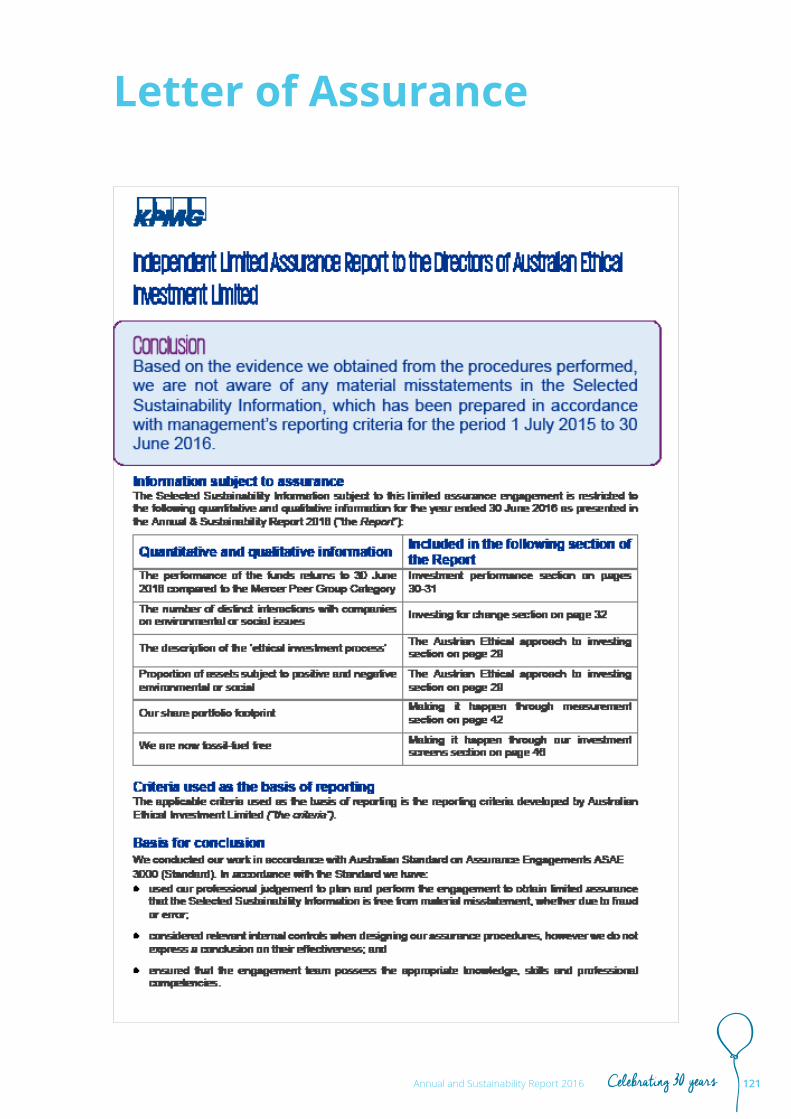
Letter of Assurance
121Annual and Sustainability Report 2016 Celebrating 30 years

Letter of Assurance (continued)
122 Annual and Sustainability Report 2016Celebrating 30 years
AEI Group
Responsible EntityAustralian Ethical Investment LimitedACN 003 188 930; AFSL Number 229949
Registrable Superannuation EntityAustralian Ethical Superannuation Pty LimitedACN 079 259 733; RSEL Number L0001441
Australian Ethical Foundation LimitedACN 607 166 503
Offices
Head OfficeAustralian Ethical Investment LimitedLevel 8, 130 Pitt StreetSydney, NSW 2000
Registered OfficeThe Company’s registered office is now care of:Company Matters Pty LimitedLevel 12, 680 George StreetSydney, NSW 2000Phone +61 8280 7355PO Box 20547World Square NSW 2002
PostGPO Box 8, Sydney 2001
Phone +61 2 8276 6288Fax +61 2 8276 [email protected] www.australianethical.com.au
Share Registry Link Market Services LimitedLocked Bag A14Sydney South, NSW 1235
Phone +61 1300 554 474Fax +61 2 9287 [email protected] www.linkmarketservices.com.au
Security Exchange ListingAustralian Ethical Investment Limited is listed on the Australian Securities Exchange.ASX Code: AEF
DirectorsSteve Gibbs (Chair and Non-Executive Director)Mara Bun (Non-Executive Director)Tony Cole (Non-Executive Director)Kate Greenhill (Non-Executive Director)Phillip Vernon (Managing Director and Chief Executive Officer)
Company SecretaryTom May
Banker and CustodianNational Australia Bank LimitedLevel 3, 255 George StreetSydney NSW 2000
Administrator
For SuperannuationLink Super Pty LtdLocked Bag 5125 Parramatta, NSW 2124
For Managed FundsBoardroom Pty Ltd GPO Box 3993 Sydney, NSW 2001
Auditors and Taxation
KPMG Australia10 Shelley StreetSydney, NSW 2000
Media Inquiries
HonnerBelinda WhiteLevel 5, 8 Spring Street Sydney, NSW 2000
Corporate Governance Statementaustralianethical.com.au/shareholders /corporate-governance/
Company directory
Celebrating 30 yearsAnnual and Sustainability Report 2016

Contact usPhone: 1800 021 227Email: [email protected]: Reply Paid GPO Box 8, Sydney NSW 2000Web: australianethical.com.au
This report is published on 100% recycled paper. The fibre source has been independently certified by the Forestry Stewardship Council (FSC).
Unless otherwise indicated, the photographs and drawings of assets in this report are not real assets connected to the Australian Ethical Managed Investment Schemes (“Managed Funds”) or the Australian Ethical Retail Superannuation Fund (“Super Fund”). Photographs and drawings of public buildings, transport, or panoramic views do not depict Managed Funds or Super Fund assets. Where used, photographs of the assets of the Managed Funds or Super Fund are the most recent available.
The information in this report is general information only, and does not take into account your personal financial situation or needs. You should consider obtaining financial advice that is tailored to suit your personal circumstances. Any views or opinions expressed are the author or quoted person’s own and may not reflect the views or opinions of Australian Ethical.
COPYRIGHT: No part of this publication may be reproduced, stored in a retrieval system or transmitted in any form or any means, electronic, mechanical, photocopying, recording or otherwise without the permission of the publisher.