Embed Size (px)
Citation preview

© 2015 CPM Educational Program. All rights reserved.
1
Making Middle School Math Come Alive with Games and Activities
For more information about the materials you find in this packet, contact:
Chris Mikles 916-719-3077

© 2015 CPM Educational Program. All rights reserved. 2

© 2015 CPM Educational Program. All rights reserved. 3
2-51. SPECIAL PRODUCTS
Your teacher is going to pick five playing cards and record the digits for you to see. Work with your team to use the digits to create a three-digit number and a two-digit number that multiply to give the greatest product. Work with your team to develop a strategy that you can explain to the class.
5.4 Scavenger Hunt Teacher Notes This activity has several materials that need to be carefully prepared in advance:
• Activity 5.4A Resource Pages – Mathematical Situations, one copy each OR Activity 5.4D Resource Page, one per pair or team of students (see Materials Preparation)
• Activity 5.4B Resource Pages – Clue Cards, one card per pair or team of students • Activity 5.4C Resource Pages – Answer Key, one copy for the teacher
Note: It is recommended that students complete the Scavenger Hunt in pairs to increase each student’s engagement in the activity. Materials Preparation: Clue Cards: Assign each team or pair of students one clue card containing 8 clues. The cards are found on the Activity 5.4B Resource Pages. Each card is labeled with a letter from A through H. Cut out the cards and then cut partway along the dotted lines on each card, to allow clues to be torn off quickly during class. (See example at right.)
Situations: The Scavenger Hunt is more fun if your students actually have to travel around the classroom looking for matches. However, if your classroom layout or your class size does not allow you to post the situation cards from the 5.4A Resource Page around the classroom, the 5.4D Resource Page has been provided so that you can copy and distribute the mathematical situations in a reduced version to each pair or team. Each situation should be taped to the wall in the classroom (staggered so that there is enough room to allow a team or pair to stand around each of them). Note that while two situations are placed on a page, these should be cut apart and posted in separate locations. There is no need to post situations in numerical order.
Scavenger Hunt Clues A1. –4
A2.
A3.
A4. 0.75

© 2015 CPM Educational Program. All rights reserved. 4
Suggested Activity:
Have a volunteer read the directions for this activity, given in problem 5-SH. Explain that today they will be matching clues to situations. A clue “matches” a situation if it could represent an answer or relationship for that situation. For example, if the data set 3, 7, 2, 14, 8 were presented as a situation, it could match a clue of 11 because 11 is the range of the data. Each clue matches at least one situation and may match as many as three.
Then carefully explain the process:
• Teams (or pairs) will have only one clue at a time. They will need to find all of the situations that fit the clue by traveling around the room or looking on their copy of the 5.4D Resource Page (up to three matches are possible per clue).
• When they think they have found all of the situations that fit the clue, they should come to you with their solutions.
• If a team does not find all of the situations that match a particular clue, send them back to re-examine the other situations. If they do have all of the solutions, they exchange that clue for a new one.
Be clear about how you would like them to show their work (does each student need his or her own paper, or can the team produce one paper together) and remind students to be prepared to defend their answers.
Assign each team a letter (A through H) and ask teams to write their names at the bottom of their clue card (in case the top gets severed by accident) and to take the first clue. Collect the rest of the clue cards and select a central location where you can give students their next clues. Organize the clue cards so that you can quickly locate a team’s card and tear off the next clue.
Note: It is expected that teams will not complete the Scavenger Hunt in its entirety. Eight clues are provided to ensure that no team will run out of clues to ponder during the activity.
An answer key has been provided on the Activity 5.4C Resource Page for your reference. It lists the number(s) of the situations that the clue fits. Note that some teams may find connections to situations other than those explained on the answer key. If the team can justify its answer to you correctly, accept it and note it for class discussion during closure.
To close this activity, have each team share one situation and clue combination that they found interesting. Encourage teams to share connections they made between situations and clues that were not on the answer key.

© 2015 CPM Educational Program. All rights reserved. 5
5-SH. SCAVENGER HUNT Today your teacher will give you several clues
about mathematical situations. For each clue, work with your team to find all of the situations that match each clue. The situations will be posted around the classroom or provided on a resource page. Remember that more than one situation – up to three – may match each clue. Once you have decided which situation matches (or which situations match) a clue, justify your decision to your teacher and receive the next clue. Be sure to record your matches on paper. Your goal is to find the match(es) for each different clue.
8-1. TAKING A CENSUS Have you ever heard of a census? A
census is a collection of data that describes the people living in a country. The United States government performs a census every ten years. The government uses the data to learn such things as how the population is changing, where people live, what types of families exist, and what languages are spoken. For example, in the year 2000, there were 281,421,906 people surveyed for the census, and about 8,000,000 of them lived in New York, NY.
Today you will take a census of your class to answer the question, “What is the
size of a typical family for the students in your math class?”
Your Task: Obtain one sticky dot for each person in your team. On your sticky dot, write down the number of people in your family. Then place your sticky dot above the appropriate number on the class dot plot. Work with your class to answer the following questions:
• What is the difference between the largest piece and the smallest piece of data in your class? This difference is called the range. It is one way to measure the “spread” or variability of the data.
• What number falls right in the middle of all the class data when the data is sorted in order? This number is called the median.

© 2015 CPM Educational Program. All rights reserved. 6
8-2. Once each day, Erika tracks the depth of the water in her local creek. Her first nine measurements, in inches, are below.
16 15 13 12 17 14 11 9 11
a. What is the median of her data?
b. Erika’s next three measurements, in inches, are 9, 10, and 9. What is the new median?
8-3. WHAT IS AVERAGE? Now obtain one cube (or other manipulative) from your teacher to represent
each person in your family.
a. Work with your classmates to organize yourselves into a human dot plot.
b. If the cubes were redistributed so that everyone in the class had the same number of cubes, how many cubes would each person have? This is called the mean (or the arithmetic average) of the data.
8-4. An outlier is a piece of data that is much larger or much smaller than the rest
of the data. Imagine that a student with a family of 20 people joined your class. How do you think the range and the measures of central tendency (mean and median) of your class’s data would change with this additional piece of data? Which measure would change the most?
8-5. COMPUTING THE MEAN In problem 8-3, you found the mean number of cubes in the class by sharing
cubes evenly among all students. Now you will explore how this method translates into a mathematical strategy.
a. How could you use numbers and symbols to represent what happens when everyone puts all of their cubes together?
b. How could you use numbers and symbols to represent what happens when the big pile is distributed evenly among all of the people?
c. As you have discovered, one way to calculate the mean for a set of data is to add all of the data together (like combining all of the cubes) and then divide by the number of pieces of data (like distributing the cubes evenly among all of the people). Calculate the mean for the typical family size of students in your math class. How does your answer compare to the one that you got in problem 8-3? Be sure to record your work carefully.

© 2015 CPM Educational Program. All rights reserved. 7
1-7. COLOR-RAMA
Your teacher will challenge your class to a game of Color-Rama! To play, a marker will be placed on the orange space on the board below. Your class will need to select one color for your class and a different color for your teacher. Then a volunteer will flip a coin three times. The coin has a “+” one side and a “–” on the other side. If the coin lands with the “+” showing, the marker will move one space to the right. If the “–” is showing, then the marker will move one space to the left. If the marker is on your class’s color after three flips, your class wins. If it lands on a color no one picked, then no one wins. Which color do you think you should choose? Do you think that there is a way to predict which color the marker will land on after three moves?
Before you play, discuss the questions below with your team. When talking about strategies, be sure to describe your ideas and explain your reasoning. When your class has considered these questions, move on to problem 1-8.
Does it matter which color is chosen? Are all the colors equally likely to win? How can you decide?
Yellow Green Purple Orange Purple Green Yellow
← – + →

© 2015 CPM Educational Program. All rights reserved. 8
1-8. LEARNING MORE ABOUT THE GAME Do you think one color is a better choice than
the others if you want to win? Is there a color that you should not pick? One way to answer these questions is to play the game and keep track of what happens.
Your teacher will give you and a partner a Lesson 1.1.2A Resource Page and a coin with a “+” on one side and a “–” on the other side. You will need a small object such as an eraser or paper clip to use as a marker. Once you have all of your supplies, follow the directions below.
a. Play the game several times and be sure to select a different color each time. Keep track of which colors win and lose each time, not just which partner wins. What do you notice?
b. After you and your partner have played the game at least five times, join with another pair of students to form a team and discuss the following questions:
• Does the color you choose seem to affect your chances of winning?
• Is each color choice equally likely to result in a win? Explain why or why not in as many ways as you can.
c. Play the game a few more times. Do your results agree with your answers from part (b) above? Why do your results make sense?
1-9. PLAYING THE GAME Now you get to play the game! As a class, choose two colors (one for your
class, one for your teacher) that you think will improve the class’s chance of winning.
a. Is there any color you could choose that would guarantee your winning the game every time you play? Explain why or why not.
b. Is there a color that would guarantee that you would not win? Explain why or why not.

© 2015 CPM Educational Program. All rights reserved. 9
1-10. In general, what makes a game fair? Discuss this question with your partner. Then think about whether there is a way to change the rules of Color-Rama to make it a fair game. Decide on any changes to the rules that you would recommend.
a. Play the game a few times with your new rules. Be prepared to describe the changes you made and explain your reasons for making the changes.
b. Is your new game fair? If not, could you make it fair? Work with your team to find a way to explain how you know your game is fair or why you cannot make it fair.
2-57. WIN-A-ROW
Obtain a Lesson 2.2.3B Resource Page from your teacher. Read the directions for scoring in the game below and play Win-A-Row against a partner.
Scoring: When all the boxes in the table have been filled in, calculate the sum of each row and the sum of each column. Every positive sum means one point for Player 1. Every negative sum means one point for Player 2.
How to Play the Game: 1. Play one round of rock-paper-scissors to determine who plays first. 2. Player 1 places one of the numbers 1, 2, 3, 4, 5, 6, 7, or 8 in the square he or she
chooses and then crosses that number from the list. 3. Player 2 places one of the numbers –1, –2, –3, – 4, –5, –6, –7, or –8 in another
square and then crosses that number from the list. 4. Alternate play until all squares are full and all of the numbers have been crossed
off the list. 5. Add the numbers in each row and write each row’s sum on the appropriate
blank in the “Sum” column. Give the winner of each row one point. 6. Add the numbers in each column and write each column’s sum on the
appropriate blank in the “Sum” row. Give the winner of each column one point. 7. If the two players tie after adding the rows and columns, find the sum of the
diagonal (from top to bottom and left to right) to decide the final winner. 8. If the two players’ sums are still tied, find the sum of the other diagonal (from
bottom to top and left to right) to decide the final winner. 9. If the game is still tied at this point, both players win!
Ending the Game: The game ends when all squares are full and all sums have been found.

© 2015 CPM Educational Program. All rights reserved. 10
3-78. TUG-O-WAR Obtain a Lesson 3.2.5 Resource Page from your
teacher and play Tug-o-War against your partner. Keep track of any strategies that you use or discover as you are playing. Play until your teacher calls time. The rules are printed below.
–2 1
–4 –3
0 1 3
2
–1
–2
How to Play
1. Place your marker at zero. 2. Spin both spinners. You may choose to add, subtract, multiply, or
divide the two numbers. The result of your calculation determines how many steps you will take and in which direction. For example, if you spin a –2 and a –1, and you choose to add them to get –2 + (–1) = –3, you would move three spaces to the left. Note that you always need to land on an integer space (one of the circles), so that may limit your choices.
3. For each move, record on your paper your starting position, the expression and the result for your chosen move, and your ending position.
4. If your move causes your marker to go off the board on any play, you lose your turn.
0 15 –1 –2 –3 –4 –5 –6 –7 –8 ––9 –10 –11 –12 –13 –14 –15 14 13 12 11 10 9 8 7 6 5 4 3 2 1
Winner Winner

© 2015 CPM Educational Program. All rights reserved. 11
3-79. With your team and then as a class, discuss any strategies that you used or discovered as you played the Tug-o-War game. Use the focus questions at the beginning of this lesson to guide your discussion.
3-80. Cynthia, Devin, Gavin, and Mark are playing the Tug-o-War game.
a. Cynthia begins her turn with her marker at 15. She spins a 1 and a –3. She thinks that she might be able to get to the winner space at 11 with this spin. Is she correct? Explain why or why not.
b. Devin takes his turn. His marker is on the 1, and he spins a 4 and a –3. Is it possible for Devin to get to one of the winner spaces (at 11 and –11) with these numbers? Explain your answer.
c. Gavin now has his marker at 12, and he spins a –3 and a –2. Gavin is wondering if he can win on this turn. Can he? Explain your answer.
d. Mark is currently at −14 and spins a −3 and a −1. He sees a way to win. How can he do this? Is there more than one way? Explain your answer.
3-81. Roger went home to play the Tug-o-War game with his older brother, Hank.
Hank looked at the spinners, thought for a bit, and then told Roger that the game is flawed because you cannot get all of the integers from −10 to +10. Roger wondered if Hank was right.
Are there any integers from –10 to +10 that you cannot get using any of the operations with the results of a spin on each spinner? Do you think that this would make the game unfair or flawed? Work with your team to build a convincing argument that demonstrates whether or not Hank’s claim is true.
5-54. TEN O’s
In this game, you will create a strategy to play a board game based on your predictions of likely outcomes. You will place ten O’s on a number line. Then your teacher will roll two number cubes and add the resulting numbers. As your teacher rolls the number cubes and calls out each sum, you will cross out an O over the number called. The goal of the game is to be the first person to cross out all ten of your O’s.
Talk with your team about the possible outcomes of this game. Then draw a
number line like the one below on your own paper. Place a total of ten O’s on your number line. Each O should be placed above a number. You should

© 2015 CPM Educational Program. All rights reserved. 12
distribute them based on what results you think your teacher will get. More than one O can be placed above a number.
Follow your teacher’s instructions to play the game.
5-55. Gerald’s strategy for the Ten O’s game was to place an O on each number from 1 to 10. He was frustrated that his strategy of placing his ten O’s was not working, so he decided to analyze the game.
Gerald began by trying to create a table to list all of the possible combinations of rolls. He made the table at right.
Did he list them all? If so, how can you be sure that they are all there? If not, give examples of a few that he has missed.
5-56. Gerald decided that this method was taking too long,
that it was too confusing, and that he made too many mistakes. Even if he listed all of the combinations correctly, he still had to find the sums and then find the theoretical probabilities for each one. Inspired by multiplication tables, he decided to try to make sense of the problem by organizing the possibilities in a probability table like the one shown at right.
a. How does Gerald’s table represent the two events in this situation? What should go in each of the empty cells? Discuss this with your team and then complete Gerald’s table on your own paper.
b. How many total possible number combinations are there for rolling the two cubes? Is each combination listed equally likely? That is, is the probability of getting two 1’s the same as that of getting two 2’s or a 3 and a 1?
Cube 1 Cube 2 1 1 2 2 3 3 4 4 5 5 6 6 1 2 2 3 3 4 4 5 5 6 1 3 2 4 3 5 4 6 1 4 2 5 3 6 1 5 2 6 1 6
+ 1 2 3 4 5 6 1 2 3 2 3 4 3 4 4 5 6
1 2 3 4 5 6 7 8 9 10 11 12

© 2015 CPM Educational Program. All rights reserved. 13
c. How many ways are there to get each sum? Are there any numbers on the game board that are not possible to achieve?
d. What is the theoretical probability for getting each sum listed on the Ten O’s game board?
e. Now work with your team to determine a better strategy for Gerald to place his ten O’s on the game board that you think will help him to win this game. Explain your strategy and your reasoning.
5-57. Gloria and Jenny each have only one O left on their game board. Gloria’s O is
at 6, and Jenny’s is at 8. Which student is more likely to win on the next roll? Explain.
1-17. ALGEBRA WALK*
The Algebra Walk is an exercise in “human graphing” where people represent points on a graph. Your teacher will give the class instructions for how to form human graphs. Then you will work in study teams to complete the problems below.
For each of the following rules, copy and complete the table. Then neatly graph each point. Use the resource page provided by your teacher.
The x-values in the table are sometimes referred to as input values, since they are the values used with the rule for x. The y-values are the output values, since they are the result of what happens to the input (x) value.
IN (x) –6 –5 –4 –3 –2 –1 0 1 2 3 4 5 6 OUT (y)
a. y = 2x +1 b. y = −2x c. y = x + 4
d. y = −x + 4 e. y = x2
The Silent Board Game The Silent Board Game is used to introduce and practice writing a rule (equation) from a table. Game Overview: Students volunteer to complete one entry in the table by silently raising their hands. When a student is called (by some silent gesture), he or she comes to the board and writes in one of the missing values. If the value is correct, the teacher silently signals the student to pick the next volunteer. If it is incorrect, the teacher simply * Adapted from the MCTP Professional Development package, written by Australian mathematics teachers

© 2015 CPM Educational Program. All rights reserved. 14
erases the value and picks another volunteer. Once all of the numeric values are entered into the table, have the next volunteer write a description of the rule on the board. Basic Rules:
• Students should remain silent during this game. They should raise their hands to be recognized, write an answer on the board and then quietly sit down.
• The teacher should erase (or cross out) an answer if it is incorrect. • At the end of each game, students should come up with a rule using algebraic
notation. For an input of “x,” expect a response such as “ y = x ⋅3+1” or “ y = 3x +1.”
Example: If the pattern is y = 3x +1 , a table like the one below should be constructed on the board display. The particular x-values used are unimportant; however, giving in/out values for x = 0, 1, 10, or 100 will make the pattern easier for students to guess. Note that the entries in the top row of the game board should not be in ascending order. It is important that students find patterns vertically from the input values on top to the output values on the bottom. If the input values are in numerical order, it is too easy to find patterns horizontally and thus miss the purpose of the game, which is to use patterns to discover and write a rule that determines the output for a given input. Suggested Equations: Some rules to use today and in future lessons:
a. y = 3x − 4 b. y = 2x + 6 c. y = 5 − 2x d. y = x2 e. y = −2x − 3 Human Linear Model Students will use the shapes from the Res. Pg. to construct a human linear model. Ask students to line up in the front of the room. Have all students who are holding a quadrilateral raise their hand. Some of the students may need assistance in making the decision or may have raised their hand at the wrong time. If so, you might want to ask, “Who can explain what a quadrilateral is?” enabling students to remember the definition and re-evaluate their shape. As students look around at those who have raised their hand, ask students “What portion of the people have a quadrilateral?” and “What portion do not have a quadrilateral?” Suggest that since it is hard to estimate the portion of students who have quadrilaterals when students are lined up randomly, students should re-sort themselves into these two teams so that all students who have quadrilaterals are at one end of the line. This will
1 5 2 7 – 3 9 0 – 6 x
4 16 – 8
in (x)
out (y)

© 2015 CPM Educational Program. All rights reserved. 15
allow the portion that makes up each team to be more apparent. However, once students are sorted, it still may be hard to see the entire class. This motivates the need to change the representation. Human Circle Graphs Propose that students curve the line to form a circle in the classroom so they can all see everyone’s shapes. It is not necessary to clear the center of the classroom, but students may need to move desks around a bit. You should be in the center of the circle. To visually separate the class into the two portions being discussed, give one of the students on each of the borders of the two teams one end of the yarn to hold while you hold the other end at the center. This is the beginning of the circle graph, as shown in the following diagram (birds-eye view). Once the circle is formed, ask the questions again, “About what portion of the people have a quadrilateral?” and “What portion do not have a quadrilateral?” Expect estimates in both fraction and percent form. If students are not lined up evenly, ask students to consider how many individuals represent parallelograms. Ask whether the size of the section of the circle roughly matches with the portion of students in the class who hold parallelograms, and to adjust their spacing if it does not. Point out how visibly the circle shows each part relative to the whole. Introduce the concept of a central angle, located at the center of a circle, and use this opportunity for students to use basic deduction to estimate the size of central angles. Ask, “If this entire circular angle at the center measures 360°, then what angle should be formed by the strings at the center of the circle? Why?” Due to the inexact nature of this human circle graph, students may need to move slightly to more reasonably reflect the estimated angles. It may also help to ask them questions about whether the angle they are describing should be more or less than 90° based on whether it is more or less than one-fourth of the circle. To continue to make additional sectors of the circle graph ask the students in the quadrilateral team to raise their hand if they are holding a parallelogram. Ask, “What portion (i.e., fraction or percent) of the students in the circle holds parallelograms?” While parallelogram was probably defined in previous courses, expect students with rectangles, squares, and rhombi to have difficulty recognizing that their shape is also a parallelogram. Restate the definition (“A parallelogram is a quadrilateral with two pairs of parallel sides,”) and ask students, “Does your shape have 2 pair of parallel sides?” If students do not know, point out that all rectangles, squares, and rhombi are
Students with quadrilateralsTeacher
Students with non-quadrilaterals

© 2015 CPM Educational Program. All rights reserved. 16
parallelograms because their qualities require their opposite sides to be parallel. Students may recognize the need to rearrange themselves along the circle to group parallelograms together. Again, provide yarn to the students who now separate the parallelograms from the other quadrilaterals. You should now have a human circle graph partitioned into three sections (parallelograms, other quadrilaterals, and non-quadrilaterals). Discuss the measure of the central angles that were created. Ask questions such as, “Are any of these portions 60%? Does that mean this is a 60° angle? Why or why not?” If time allows, provide students the opportunity to suggest other categorizations of the shapes, such as those that are equilateral versus those that are not. For each re-categorization, students will need to re-sort themselves in the circle. 7-1. HUMAN CIRCLE GRAPH Get a shape card from your teacher. Look at your shape and decide if your shape is a
parallelogram, another form of a quadrilateral, a triangle, or some other shape. Follow your teacher’s directions to create a linear model and circle graph. Then answer the questions below.
a. Your class built a circle graph with your bodies. How can this model be drawn on paper? Work with your team to sketch a picture of your class circle graph showing the portion of your class that held parallelograms, other quadrilaterals, triangles, and other polygons. Be sure to label each section with the category of shape it represents and with an estimated percentage or angle measure.
b. Approximately what portion of the class held triangles? Write your answer as a percent. Then estimate the measure of the central angle on the graph for that portion. A central angle is an angle with its vertex at the center of a circle. Its sides are formed by two radii, and its measure is a portion of 360º.
c. Was there a section of the circle that had a central angle of approximately 90º ? If so, what type of figure is represented in that section?

© 2015 CPM Educational Program. All rights reserved. 17
Order of Operations: Circle the terms Mathematicians have agreed on an order of operations for simplifying expressions.
Original expression:
Circle expressions that are grouped within parentheses or by a fraction bar:
Simplify within circled expressions using the order of operations:
• Evaluate exponents.
• Multiply and divide from left to right.
• Combine terms by adding and subtracting from left to right.
Circle the remaining terms:
Simplify within circled terms using the order of operations as above:
6-72. Simplify each expression.
a. 16 − 5(3−1) b. 12 ÷ 3 x 2 + 42 –(3-5)
c. 3.45(22 )− 8.18(1) d. 4 ⋅5− 22 + 3(5− 4)
(10 − 3⋅2) ⋅22 − 13−322 + 6
(10 − 3⋅2) ⋅22 − 13− 32
2+ 6
(10 − 6) ⋅22 − 13− 92
+ 6
4 ⋅22 − 42+ 6
4 ⋅2 ⋅2 − 42+ 6
16 − 2 + 6
(4) ⋅22 − 42+ 6
20
(10 − 3⋅2) ⋅22 − 13− 3⋅32
+ 6
(10 − 3⋅2) ⋅22 − 13−322 + 6

© 2015 CPM Educational Program. All rights reserved. 18
Activity 5.4A Resource Page Page 1 of 4
Situation #1
The following are in a cookie jar:
6 chocolate-chip cookies
1 snickerdoodle
1 oatmeal-raisin cookie
Situation #2
0.5 6.3 5 0.9 –3 0.125 9 0.09 18 3
4 1

© 2015 CPM Educational Program. All rights reserved. 19
Activity 5.4A Resource Page Page 2 of 4
Situation #3
Situation #4
–3 –1 1 4 0
10 cm
4 cm
30 cm
? cm

© 2015 CPM Educational Program. All rights reserved. 20
Activity 5.4A Resource Page Page 3 of 4
Situation #5
Situation #6
100 20
60
5
3 8
4
5
3
© 2015 CPM Educational Program. All rights reserved. 21
Activity 5.4A Resource Page Page 4 of 4
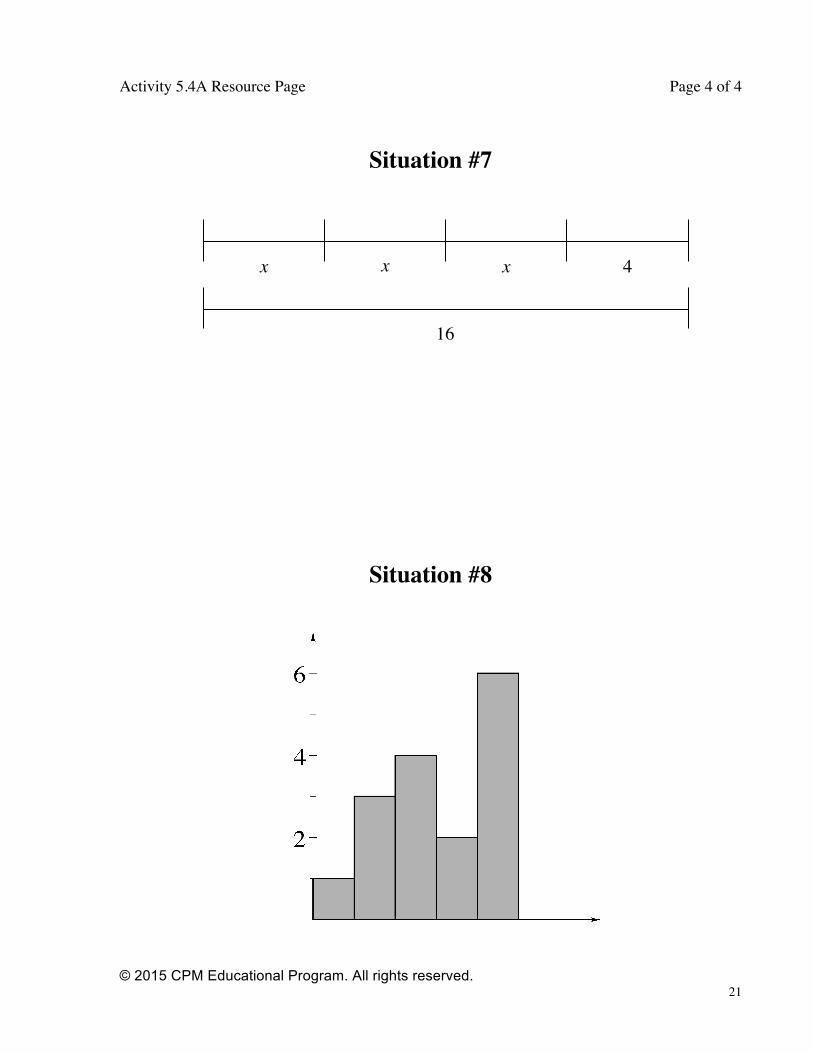
Situation #7
Situation #8
x 4 x x
16

© 2015 CPM Educational Program. All rights reserved. 22
Activity 5.4B Resource Page Page 1 of 2 Clue Cards
A1. – 4
A2.
A3.
A4. 0.75
A5. Less than 0
A6. Putting quantities together
A7. 12
A8. 16
C1. 0.75
C2. – 4
C3. Less than 0
C4. 16
C5. 12
C6.
C7.
C8. Putting quantities together
B1.
B2. Less than 0
B3. 12
B4. – 4
B5. 16
B6.
B7. Putting quantities together
B8. 0.75
D1. 12
D2. Putting quantities together
D3. 16
D4.
D5. 0.75
D6. Less than 0
D7. – 4
D8.
Scavenger Hunt Clues A Scavenger Hunt Clues B
Scavenger Hunt Clues C Scavenger Hunt Clues D

© 2015 CPM Educational Program. All rights reserved. 23
Activity 5.4B Resource Page Page 2 of 2 Clue Cards
E1. 16
E2.
E3. 0.75
E4. 12
E5. Putting quantities together
E6. – 4
E7. Less than 0
E8.
G1. Less than 0
G2. 12
G3. Putting quantities together
G4.
G5.
G6. 16
G7. 0.75
G8. –4
F1.
F2. 0.75
F3. –4
F4. Putting quantities together
F5.
F6. 12
F7. 16
F8. Less than 0
H1. Putting quantities together
H2. 16
H3.
H4. Less than 0
H5. –4
H6. 0.75
H7.
H8. 12
Scavenger Hunt Clues E Scavenger Hunt Clues F
Scavenger Hunt Clues G Scavenger Hunt Clues H

© 2015 CPM Educational Program. All rights reserved. 24
Activity 5.4C Resource Page Page 1 of 2 Clue Cards Answers
Answers are the situation number(s) that fit each clue.
Scavenger Hunt Solutions A
A1. 4
A2. 1, 3, 4
A3. 1, 2, 8
A4. 1, 2, 4
A5. 2, 4
A6. 5, 6, 7
A7. 3, 5, 7
A8. 5, 6, 8
Scavenger Hunt Solutions C
C1. 1, 2, 4
C2. 4
C3. 2, 4
C4. 5, 6, 8
C5. 3, 5, 7
C6. 1, 2, 8
C7. 1, 3, 4
C8. 5, 6, 7
Scavenger Hunt Solutions B
B1. 1, 2, 8
B2. 2, 4
B3. 3, 5, 7
B4. 4
B5. 5, 6, 8
B6. 1, 3, 4
B7. 5, 6, 7
B8. 1, 2, 4
Scavenger Hunt Solutions D
D1. 3, 5, 7
D2. 5, 6, 7
D3. 5, 6, 8
D4. 1, 3, 4
D5. 1, 2, 4
D6. 2, 4
D7. 4
D8. 1, 2, 8

© 2015 CPM Educational Program. All rights reserved. 25
Activity 5.4C Resource Page Page 2 of 2 Clue Card Answers
Answers are the situation number(s) that fit each clue.
Scavenger Hunt Solutions E
E1. 5, 6, 8
E2. 1, 2, 8
E3. 1, 2, 4
E4. 3, 5, 7
E5. 5, 6, 7
E6. 4
E7. 2, 4
E8. 1, 3, 4
Scavenger Hunt Solutions G
G1. 2, 4
G2. 3, 5, 7
G3. 5, 6, 7
G4. 1, 2, 8
G5. 1, 3, 4
G6. 5, 6, 8
G7. 1, 2, 4
G8. 4
Scavenger Hunt Solutions F
F1. 1, 3, 4
F2. 1, 2, 4
F3. 4
F4. 5, 6, 7
F5. 1, 2, 4
F6. 3, 5, 7
F7. 5, 6, 8
F8. 2, 4
Scavenger Hunt Solutions H
H1. 5, 6, 7
H2. 5, 6, 8
H3. 1, 3, 4
H4. 2, 4
H5. 4
H6. 1, 2, 4
H7. 1, 2, 8
H8. 3, 5, 7

© 2015 CPM Educational Program. All rights reserved. 26
Activity 5.4D Resource Page
Situation #1 Situation #2
Situation #3 Situation #4
Situation #5 Situation #6
Situation #7 Situation #8
0.5 6.3 5 0.9
–3 0.125 9
0.09 1
–3 –1 1 4 0
100 20
60
7.5
4.5 8
6
5
3
10 cm 4 cm
30 cm
? cm
The following are in a cookie jar:
6 chocolate-chip cookies
1 snickerdoodle
1 oatmeal-raisin cookie
x x x
16
4

© 2015 CPM Educational Program. All rights reserved. 27
Lesson 1.1.2A Resource Page
Colo
r-Ram
a
Gam
e R
ules
1.
Ea
ch p
laye
r cho
oses
one
of t
he c
olor
s on
the
Colo
r-Ram
a G
ame
boar
d. N
o tw
o pl
ayer
s may
cho
ose
the
sam
e co
lor.
2.
Pl
ace
a m
arke
r on
the
oran
ge sq
uare
. 3.
Th
e pl
ayer
s tak
e tu
rns f
lippi
ng th
e +/
– co
in th
ree
times
to
dete
rmin
e ho
w to
mov
e th
e m
arke
r. E
ach
time
a +
com
es u
p, th
e m
arke
r mov
es o
ne sq
uare
to th
e rig
ht.
Each
tim
e a
– co
mes
up,
th
e m
arke
r mov
es o
ne sq
uare
to th
e le
ft.
4.
If th
e m
arke
r lan
ds o
n yo
ur c
olor
afte
r the
thre
e m
oves
, you
win
.
Y
ello
w
Gre
en
Pur
ple
Ora
nge
P
urpl
e G
reen
Yel
low
← –
+ →

© 2015 CPM Educational Program. All rights reserved. 28
Lesson 2.2.3B Resource Page Page 1 of 2
Win-A-Row A game for two players.
Mathematical Purpose: To practice adding integers. Game Objective: Strategically place your numbers on the game board to win the largest number of rows. Materials: One Win-A-Row game board Scoring: When all the boxes in the table have been filled in, calculate the sum of each row and the
sum of each column. Every positive sum means one point for Player 1. Every negative sum means one point for Player 2.
How to Play the Game: 1. Play one round of rock-paper-scissors to determine who plays first. 2. Player 1 places one of the numbers 1, 2, 3, 4, 5, 6, 7, or 8 in the square he or she chooses and
then crosses that number from the list. 3. Player 2 places one of the numbers –1, –2, –3, – 4, –5, –6, –7, or –8 in another square and
then crosses that number from the list. 4. Alternate play until all squares are full and all of the numbers have been crossed off the list. 5. Add the numbers in each row and write each row’s sum on the appropriate blank in the
“Sum” column. Give the winner of each row one point. 6. Add the numbers in each column and write each column’s sum on the appropriate blank in
the “Sum” row. Give the winner of each column one point. 7. If the two players tie after adding the rows and columns, find the sum of the diagonal (from
top to bottom and left to right) to decide the final winner. 8. If the two players’ sums are still tied, find the sum of the other diagonal (from bottom to top
and left to right) to decide the final winner. 9. If the game is still tied at this point, both players win! Ending the Game: The game ends when all squares are full and all sums have been found.
1 2 3 4 5 6 7 8 –1 –2
–3 –4
–5 –6
–7 –8
sum
sum

© 2015 CPM Educational Program. All rights reserved. 29
Lesson 2.2.3B Resource Page Page 2 of 2
Win-A-Row Game Boards
1 2 3 4 5 6 7 8 –1 –2
–3 –4
–5 –6
–7 –8
sum
sum
1 2 3 4 5 6 7 8 –1 –2
–3 –4
–5 –6
–7 –8
sum
sum

© 2015 CPM Educational Program. All rights reserved. 30
Lesson 3.2.5 Resource Page
–2
1
–3
–4
1 –2
–1
2 3 0
–15
–14
–13
–12 –
11 –1
0 –9
–8
–7 –
6 –5
–4
Win
ner!
–1
0 –3
–2
1
2 3
4 5
6 7
8 9
10
11
12
13 1
4 15
Win
ner!
St
art
Tug-
o-W
ar G
ame

© 2015 CPM Educational Program. All rights reserved. 31
Lesson 1.1.3A Resource Page
RED y = 2x + 1
IN# OUT# Multiply your number by two
and add one.
Describe what you see:
BLUE y = –2x
IN# OUT#
Multiply your number by negative two.
Describe what you see:
YELLOW y = x + 4
IN# OUT#
Add four to your number.
Describe what you see:
GREEN y = –x + 4
IN# OUT#
Change the sign of your number and add four.
Describe what you see:
ORANGE y = x2
IN# OUT# Square your number. That is,
multiply your number by itself.
Describe what you see:
x
y
x
y
x
y
x
y
x
y

© 2015 CPM Educational Program. All rights reserved. 32
Lesson 7.1.1A Resource Page Page 1 of 3
Shape Cards

© 2015 CPM Educational Program. All rights reserved. 33
Lesson 7.1.1A Resource Page Page 2 of 3
Shape Cards

© 2015 CPM Educational Program. All rights reserved. 34
Lesson 7.1.1A Resource Page Page 3 of 3
Shape Cards

© 2015 CPM Educational Program. All rights reserved. 35