Embed Size (px)
Citation preview

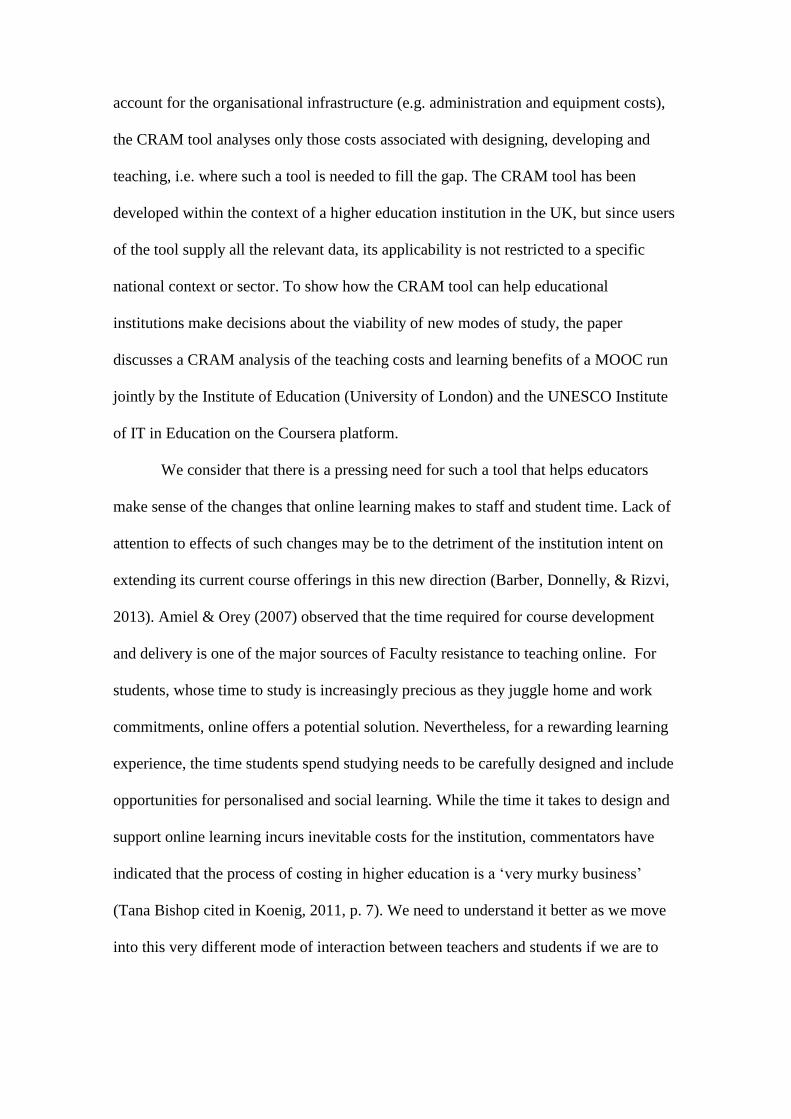
Making meaningful decisions about time, workload and pedagogy in
the digital age: the Course Resource Appraisal Model
Eileen Kennedy, Diana Laurillard, Bernard Horan, Patricia Charlton
London Knowledge Lab, Institute of Education, London, UK
Corresponding author: Eileen Kennedy [email protected], London Knowledge Lab,
Institute of Education, 29 Emerald St, London WC1N 3QS, UK
Making meaningful decisions about time, workload and pedagogy in
the digital age: the Course Resource Appraisal Model
This paper reports on a design based research project to create a modelling tool to
analyse the costs and learning benefits involved in different modes of study. The
Course Resource Appraisal Model (CRAM) provides accurate cost/benefit
information so that institutions are able to make more meaningful decisions about
which kind of courses – online, blended or traditional face-to-face – make sense
for them to provide. The tool calculates the difference between expenses and
income over three iterations of the course, and presents a pedagogical analysis of
the learning experience provided. The paper draws on a CRAM analysis of the
costs and learning benefits of a MOOC to show how the tool can illuminate the
pedagogical and financial viability of a course of this kind.
Keywords: academic workload; cost of distance education; cost-benefit model;
online learning
Introduction
Teachers’ and learners’ time is the most important resource in the education system, and
the move to online learning heralds important changes in the deployment of both. The
time it takes to design, develop and teach an online course is different from the time
spent in traditional face-to-face teaching. Similarly, allocating time for studying online
follows a different pattern than attending face-to-face. When a new online course is
proposed, therefore, it is necessary to take account of the various time costs involved
along with the anticipated benefits that will accrue to learners, and to do this in a
detailed and meaningful way. This paper presents the results of a design based research
(DBR) project to develop a modelling tool, called the Course Resource Appraisal Model
(CRAM), to help analyse the teaching costs and learning benefits entailed in different
modes of study. The tool has the capacity to analyse various modes including fully
online, blended and face-to-face, so that educational institutions can make informed
decisions when planning new course offerings. As costing models already exist to
account for the organisational infrastructure (e.g. administration and equipment costs),
the CRAM tool analyses only those costs associated with designing, developing and
teaching, i.e. where such a tool is needed to fill the gap. The CRAM tool has been
developed within the context of a higher education institution in the UK, but since users
of the tool supply all the relevant data, its applicability is not restricted to a specific
national context or sector. To show how the CRAM tool can help educational
institutions make decisions about the viability of new modes of study, the paper
discusses a CRAM analysis of the teaching costs and learning benefits of a MOOC run
jointly by the Institute of Education (University of London) and the UNESCO Institute
of IT in Education on the Coursera platform.
We consider that there is a pressing need for such a tool that helps educators
make sense of the changes that online learning makes to staff and student time. Lack of
attention to effects of such changes may be to the detriment of the institution intent on
extending its current course offerings in this new direction (Barber, Donnelly, & Rizvi,
2013). Amiel & Orey (2007) observed that the time required for course development
and delivery is one of the major sources of Faculty resistance to teaching online. For
students, whose time to study is increasingly precious as they juggle home and work
commitments, online offers a potential solution. Nevertheless, for a rewarding learning
experience, the time students spend studying needs to be carefully designed and include
opportunities for personalised and social learning. While the time it takes to design and
support online learning incurs inevitable costs for the institution, commentators have
indicated that the process of costing in higher education is a ‘very murky business’
(Tana Bishop cited in Koenig, 2011, p. 7). We need to understand it better as we move
into this very different mode of interaction between teachers and students if we are to
provide the support that both groups need and make the most of the opportunities
provided by the technology.
The costs of online learning
There are many myths and assumptions around the costing of online learning.
There has been a widespread misconception that online must be cheaper than face-to-
face teaching (Koenig, 2011), yet some studies show that digital technologies can cost
more than traditional methods (Bates, 2001; Laurillard, 2006). The costs of online
learning are so poorly understood that some institutions significantly underestimate,
while others significantly over-estimate costs, leading to inaccurate cost-based pricing
(Garrett & MacLean, 2004). As Means, Bakia, & Murphy (2014, p. 4) point out,
“educational policy makers are not waiting for detailed cost analyses before trying
online learning as a strategy for saving money”.
Moreover, the recent phenomenon of massive open online courses (MOOCs) has
nurtured the myth that online learning has no cost attached, since MOOCs are made
available to users for free (Laurillard, 2014). Yet the media-rich resources that are
characteristic of certain types of online courses, including MOOCs, can be extremely
expensive to create, often requiring whole production teams, particularly when
compared to the traditional model of an individual professor, lecturing to hundreds of
students, supported only by a few slides and handouts. Hollands & Tirthali (2014) found
that key variables in the cost of designing and delivering a MOOC were the number of
people involved, and whether the production process was carried out more cheaply in-
house or contracted out. Importantly, the authors considered that it would be necessary
to take account of the educational outcomes of MOOCs to make adequate sense of the
cost of their production. As Bates (2001, p. 85) observed, however, “accounting systems
in most universities and colleges are not set up to provide the necessary information to
compare the costs of different forms of teaching”. Now that the core business of the
University is changing and new models of learning take shape (Bowen, 2013), there is
increasing need for Universities to make sense of the costs and learning outcomes of
technology enhanced education. The desire for transparency, emerging from changing
economic and social conditions on a global scale, has required Universities to provide
stakeholders with “access to accurate, consistent and comprehensive information”
(McCaffrey, 2010, p. 20). This need is compounded by what McCaffrey terms “new
wave competitors” (2010, p. 13) to the traditional University sector, comprising Mega
Universities (e.g. Open University in the UK), For-Profit Universities, Corporate
Universities, Private HE training organisations and ‘sleeping giants’ (e.g. campus-based
training provided by IBM). These businesses are likely to understand their cost
structures very well.
In a review of the existing literature on costing models in Higher Education,
Laurillard (2006) found them to be highly problematic, which has an impact on their
usefulness. There was no consistency across institutions in the way the models
measured the costs of technology enhanced teaching and learning, and compared them
with traditional approaches. The models identified what should be costed, but provided
little assistance in helping staff estimate these costs. Yet, despite these difficulties, there
was a general agreement among the researchers, that the development of a useable
costing model was critical. Twigg (2003, p.28) argued that, unless a rigorous evaluation
of costs was carried out, “technology becomes part of the problem of rising costs rather
than part of the solution”.
What then, are the costs of online learning? According to Laurillard (2006)
equipment costs are unlikely to be significant, since the IT systems that support online
learning have been in place in many institutions for some time. Instead, the more
significant driver of costs is that “teachers, support staff and students spend their time
differently” (Laurillard, 2006, p. 29) from traditional courses. This observation is in line
with other research findings (Means et al., 2014) including those of the US-based Pew
Foundation’s Program on Course Redesign, which sought to explore ways of increasing
efficiency whilst simultaneously improving the learning experience through technology
(Twigg, 2003). Twigg (2004, p. 12) argued that the major cost item in teaching is
personnel, and therefore “reducing the time that faculty members and other personnel
invest in a course and transferring some of these activities to technology-assisted
activities are key strategies”. There are, however, many factors to consider when
calculating teaching costs, particularly for online and blended learning. A sizeable
investment of time may be required to develop materials the first time a course is run,
but thereafter in subsequent iterations of the course, the allocation of tutor time may be
diverted to interacting with students. These two kinds of teaching may require different
levels of experience and therefore be costed at different rates. Similarly, the design of
teaching and learning activities may promote independent learning and peer
communication and support, which have an impact not only on the student experience
but also on teacher workload, as does the amount of individual and whole group tutor
feedback that is available. Scaling up cohort size will also have an effect on the
profitability of courses, since only the work involved in day to day running of the
course changes with the increase in student numbers, not the initial preparation costs.
Central to any meaningful institutional business plan is an understanding of the
relationship between teaching costs and learning outcomes (Bates, 2001; Twigg, 2003).
Without knowing whether an investment in learning technology will produce specific
learning benefits, and at what scale, it is impossible to plan effectively. We propose,
therefore, that an effective costing model should take account of the complex array of
factors that are involved in designing and running a class, as well as the pedagogy that
is being costed. For example, a media-rich course with plentiful tutor-student interaction
will incur high costs, but these may be justified on the basis of the quality of learner
experience, and hence level of learning outcomes. On the other hand, another course
may limit tutor engagement and rely on peer-to-peer interactions in order to reduce the
costs that the institution must pass on to the learner. As Hülsmann (2004) advises, some
costs will be fixed – for example, the cost of producing a video will not change no
matter how many students view it – while the costs of tutor-student interactions – the
support costs –will vary according to student numbers. These are known as the
‘Achilles Heel’ of distance education (Hülsmann, 2004), due to the critical role they
play in the financial success of a course. Yet, the way the course integrates technology
into its learning design can make all the difference. Twigg observed that among the
“most effective cost reduction techniques” were:
online course management systems, automated assessment of homework, quizzes,
and tests, online tutorials, shared resources for course development, utilizing
undergraduate learning assistants instead of graduate students, and using the Web
to reduce class-room space requirements. (Twigg 2004, p. 12)
In other words, by designing in computer- and peer-assessment and making use of
OERs, an online learning experience can be constructed for students that is both rich in
feedback and cost-effective for the institution. Since the principal cost to the institution
is tutor time, and time constraints are the greatest obstacle for tutors moving online, the
kind of costing model that we are proposing becomes a vital tool not just for managers,
but for teachers too. If teachers are to be encouraged to move online, they need to be
able to plan their course to be viable in terms of both quality of pedagogy and tutor
time. A tool that can show this and indicate where adjustments can be made to improve
the balance between learning benefits and teaching costs, is a vital part of the support a
teacher needs for contemporary learning design. As a result, it is essential that the tool
can help not only with estimating costs, but also with planning a good quality learning
experience for the student. The Conversational Framework (Laurillard, 2002, 2012) is
one way of modelling the optimal learning process, which can be used to assist this
course planning process.
Modelling the learning process – the Conversational Framework
The Conversational Framework (CF) provides a theory-based framework for analysing
how well a designed teaching-learning process operates. This can help teachers identify
whether the courses they have designed fulfil the conditions necessary for effective
learning to take place. Laurillard (2012) argued that the ideas in theories of learning
such as instructivism, social constructivism, constructionism and collaboration, combine
to suggest that formal learning takes place in three cycles of communication between
the teacher and the learners: the teacher communication cycle; the teacher practice and
modelling cycle; and the peer communication cycle.
One cycle of communication consists in (i) learning through acquisition, with
the teacher (or book, or video, etc.) explaining concepts to the learner, (ii) learning
through inquiry, where the learner interrogates and explores the teacher’s concepts (in
person, or through books, or online resources, etc.), and (iii) learning through
production, where the learner represents their learning in some form to the teacher (an
essay, test, design, diagram, etc). The practice and modelling cycle consists in learning
through practice, where the teacher provides a real or virtual environment for the learner
to put their understanding into practice and then improve it through receiving feedback
from the teacher, or from the environment itself. The peer communication cycle consists
in (i) learning through discussion, where the learners explain their understanding and
debate and challenge each other, and (ii) learning through collaboration, with learners
sharing their practice and working together to improve it. Here, learners have an
equivalent relationship to each other, providing comments and critiques, asking
questions and providing different perspectives, helping to “motivate the iterative cycles
between concepts and practice, and assist each other’s meta-cognition” (Laurillard,
2012: 91). The teacher can promote the practice cycle through careful design of the
environment, tasks and feedback, and the peer communication cycle by providing
opportunities for peer discussion, collaborative production tasks and peer assessment.
The Conversational Framework therefore represents the combined theories of
learning to propose that any teaching and learning activities, whether conducted face to
face, through tutored online courses or MOOCs, will promote learning most effectively
when they combine these three cycles of teaching-learning activities to promote the six
learning types: acquisition (or Read/Watch/Listen); inquiry; practice; production;
discussion and collaboration.
In this way, the CF provides a way of analysing whether the conditions have
been met for learning to be likely to achieve the intended outcomes. The framework has
been used as the basis for developing a series of computational tools to support the
development and sharing of pedagogically sound learning designs (Charlton, Magoulas,
& Laurillard, 2012; Ljubojevic & Laurillard, 2011). These tools make it possible for
teachers who are planning new courses to use the framework, and the learning design
tools developed from it, to analyse and demonstrate the likely learning benefits that
accrue from the learning and teaching activities proposed, along with the costs of
putting them in place.
Developing a cost modelling tool through design based research
The design requirements
As indicated in the literature review, preparing and supporting teaching and learning
activities have hidden costs when new technologies are introduced. The costs are often
hidden due to the complexity of how a ‘new technology’ works as part of an authentic
learning experience. At present the teaching community lacks a shared vocabulary and
costing methodology to express the hidden costs of teaching and the contrasting
workloads involved in campus and online teaching. At the same time, financial
modelling has continued to operate as if teaching activities have not changed in
financially relevant ways with the advent of new technology.
The approach to design requirements began by establishing a shared
understanding between the different stakeholders, based on the activities involved in
teaching and learning. A costing model based on what they do is immediately accessible
to teachers because it describes the information and data they own and know about. The
initial requirements for the model to work for any HE (or other) context are therefore:
The parameters in the model should be applicable to any type of course delivery
and range of teaching methods
It should elicit information about the course, the design of the learning
experience, and the teaching costs in a way that makes it easy to use
It should be able to represent the resulting learning experience and teaching
costs in a way that is meaningful as feedback to the teacher-designer, and helps
them analyse how to balance the two in an optimal way.
As the purpose of the tool is to clarify the relationship between teaching costs and
learning benefits it is essential to represent the latter in a way that can highlight these in
relation to the teaching-learning activities (TLAs) in the course. The six distinctive
learning types derived from Conversational Framework provide a way of representing
the value of each TLA that can be put under the control of the user. It is also important
to reflect other aspects of a TLA that are proxies for a good learning experience and that
can capture the beneficial affordances of learning technologies:
the extent to which the TLA offers a ‘personalised, social, or standard’ learning
experience, and
the source of the feedback to the learner as ‘tutor, peer, or program’.
The right representation will make explicit to the teachers and other stakeholders how
the collection of TLAs in a course affects the learning experiences, teacher preparation
and support time, and therefore the cost.
The methodology
We adopted a ‘design-based research’ (DBR) research methodology because its
characteristics as defined in the research literature (Anderson & Shattuck, 2012) are
close to what is needed for this kind of intervention. It is not an intervention in the sense
of an innovation that will directly improve student learning, but it is intended to
improve an aspect of how teachers learn about their teaching. The CRAM tool provides
a ‘learning environment’ with actions and feedback for the teacher to use alone or with
colleagues, so it made sense to use DBR as the methodology for developing and testing
this kind of intervention.
Anderson and Shattuck identified seven characteristics of DBR studies, all of
which were built into our approach to developing the tool as follows:
the methodology embedded a ‘design and testing’ process (workshops);
in a ‘real educational context’ (teachers planning new modules);
as part of a ‘collaborative partnership between researchers and practitioners’;
to develop the ‘significant intervention’ (the cost modelling tool);
through ‘multiple iterations’ using ‘mixed methods’ (observation and interview) to
elicit the changes needed.
When used in the context of planning a teaching intervention, such as a course or
module, we then found that the tool enables the ‘evolution of a design principle’,
through the user’s reflection on what its output means for their specific context, and
what change in practice this implies. This is discussed further in the section on redesign.
Early user studies produced a prototype of the costing model in the form of a
spreadsheet, which has been documented elsewhere (Laurillard, 2006). In design-based
research of this kind, practitioners and researchers work together (Barab & Squire,
2004), in an iterative process and include key stakeholders, in this case teachers,
throughout the stages of development. The design and testing process trialled the
prototype with individual users and groups in workshops (Plomp, 2007). The user trials
were observed and recorded as field notes and screen capture, and interviews recorded
their insights. In each case successive refinements to the tool were made in response to
the issues that arose. The key changes at this stage are reported in the following section.
The current version of the tool is the result of this research process. One of the main
outcomes of the initial design-testing process was the user requirement for a more
intuitive interface. The spreadsheet format is unfamiliar to many teachers, and it was
clear that a ‘design-wizard’ approach, which elicits information and data in a clear
sequence, would make it more accessible. The model was re-implemented as a Java
based computer application and is free to download1. CRAM was developed in the
context of higher education, but because it requires the user to input data relating to
student fees, average staff pay rates, duration of courses and the hours of study they
demand, it can be transferred to other sectors. Similarly, the tool that limits its
application to all modes of teaching and learning – the tool can analyse the costs and
learning benefits of face-to-face and blended modes, as well as online modes.
Moreover, the tool’s capacity to cost different modes enables it to illuminate the factors
that would affect the viability of moving teaching from face-to-face to online.
The CRAM tool
The costing model is represented to the user as a sequence of tables of information
about the design of the course or module. As the user supplies this information about
the course details, the teaching-learning activities, and the estimated teacher time to
prepare and support these activities, the model shows representations of the resulting
learning experience and overall costs. In the light of this analytical feedback, the user
can then return to add or edit any of the data and definitions they have entered. Figure 1
shows the iterative nature of these steps.
--------Figure 1. The steps involved in the Course Resource Appraisal Model.----
1 http://web.lkldev.ioe.ac.uk/cram/index.html.
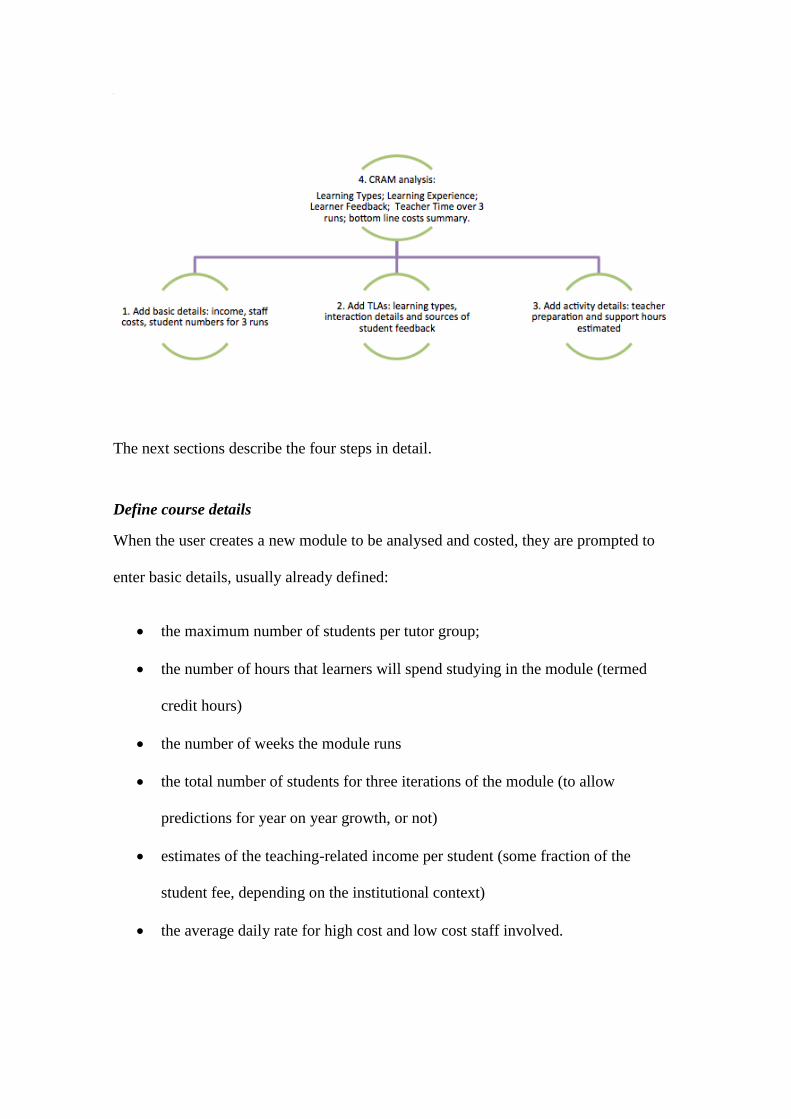
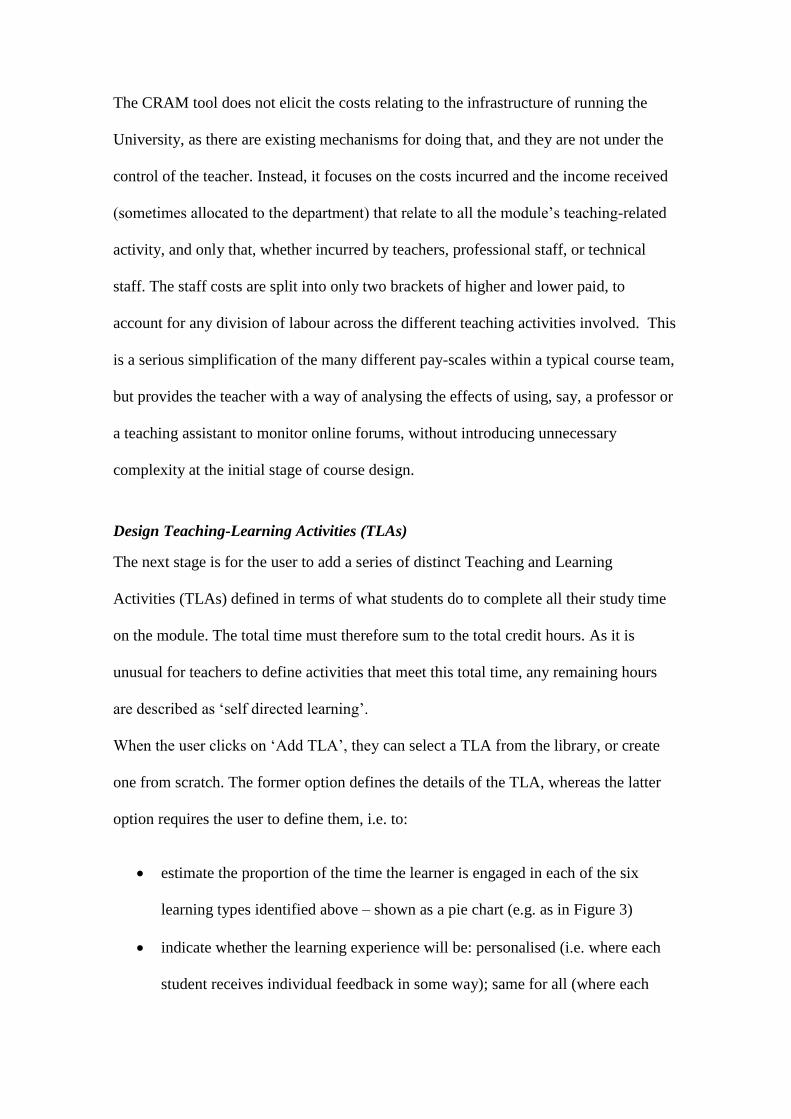
The next sections describe the four steps in detail.
Define course details
When the user creates a new module to be analysed and costed, they are prompted to
enter basic details, usually already defined:
the maximum number of students per tutor group;
the number of hours that learners will spend studying in the module (termed
credit hours)
the number of weeks the module runs
the total number of students for three iterations of the module (to allow
predictions for year on year growth, or not)
estimates of the teaching-related income per student (some fraction of the
student fee, depending on the institutional context)
the average daily rate for high cost and low cost staff involved.
The CRAM tool does not elicit the costs relating to the infrastructure of running the
University, as there are existing mechanisms for doing that, and they are not under the
control of the teacher. Instead, it focuses on the costs incurred and the income received
(sometimes allocated to the department) that relate to all the module’s teaching-related
activity, and only that, whether incurred by teachers, professional staff, or technical
staff. The staff costs are split into only two brackets of higher and lower paid, to
account for any division of labour across the different teaching activities involved. This
is a serious simplification of the many different pay-scales within a typical course team,
but provides the teacher with a way of analysing the effects of using, say, a professor or
a teaching assistant to monitor online forums, without introducing unnecessary
complexity at the initial stage of course design.
Design Teaching-Learning Activities (TLAs)
The next stage is for the user to add a series of distinct Teaching and Learning
Activities (TLAs) defined in terms of what students do to complete all their study time
on the module. The total time must therefore sum to the total credit hours. As it is
unusual for teachers to define activities that meet this total time, any remaining hours
are described as ‘self directed learning’.
When the user clicks on ‘Add TLA’, they can select a TLA from the library, or create
one from scratch. The former option defines the details of the TLA, whereas the latter
option requires the user to define them, i.e. to:
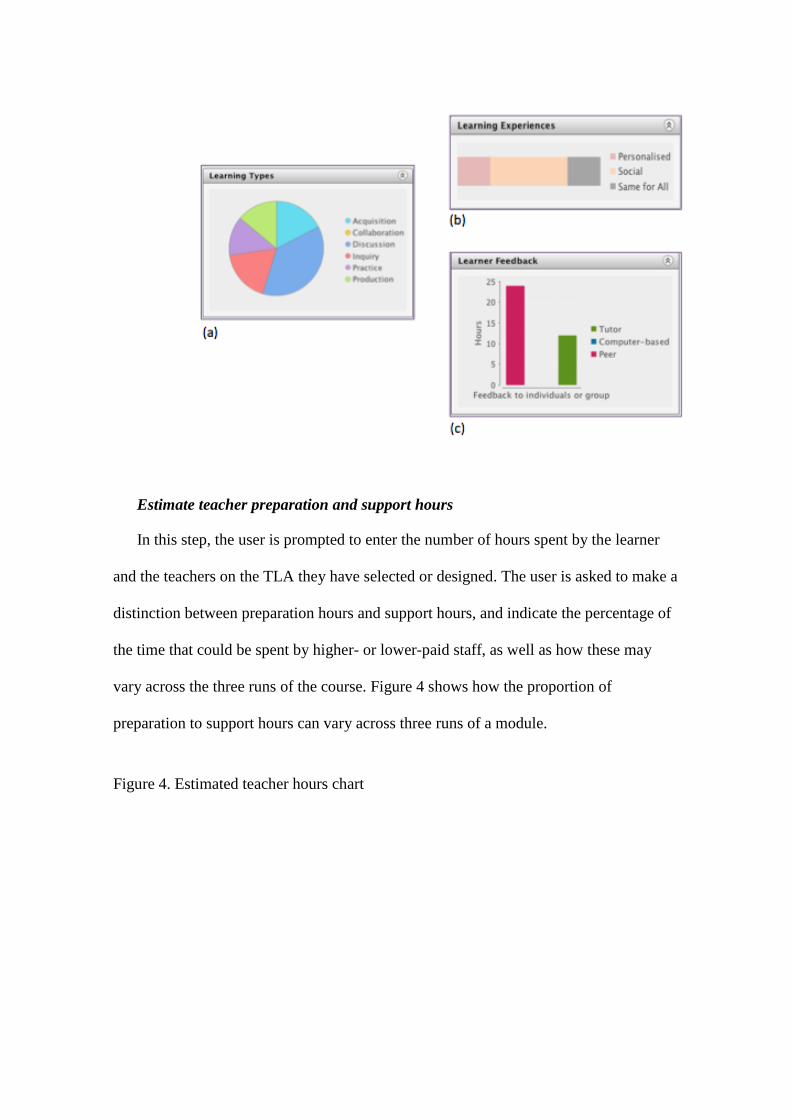
estimate the proportion of the time the learner is engaged in each of the six
learning types identified above – shown as a pie chart (e.g. as in Figure 3)
indicate whether the learning experience will be: personalised (i.e. where each
student receives individual feedback in some way); same for all (where each
student interacts in the same way with a tutor or the materials); or social (where
students work with others in a group)
define the interaction details, indicating with or without the tutor, online or at a
specific time or location, and source of feedback as tutor, peer or program.
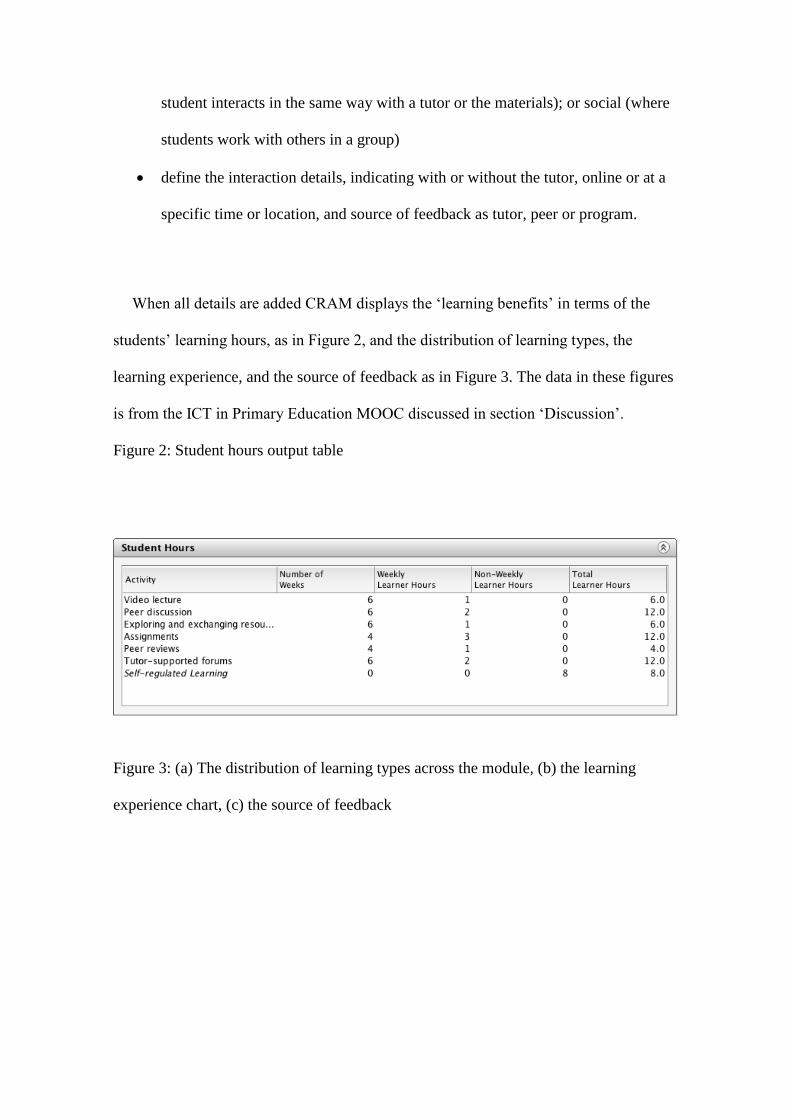
When all details are added CRAM displays the ‘learning benefits’ in terms of the
students’ learning hours, as in Figure 2, and the distribution of learning types, the
learning experience, and the source of feedback as in Figure 3. The data in these figures
is from the ICT in Primary Education MOOC discussed in section ‘Discussion’.
Figure 2: Student hours output table
Figure 3: (a) The distribution of learning types across the module, (b) the learning
experience chart, (c) the source of feedback
Estimate teacher preparation and support hours
In this step, the user is prompted to enter the number of hours spent by the learner
and the teachers on the TLA they have selected or designed. The user is asked to make a
distinction between preparation hours and support hours, and indicate the percentage of
the time that could be spent by higher- or lower-paid staff, as well as how these may
vary across the three runs of the course. Figure 4 shows how the proportion of
preparation to support hours can vary across three runs of a module.
Figure 4. Estimated teacher hours chart
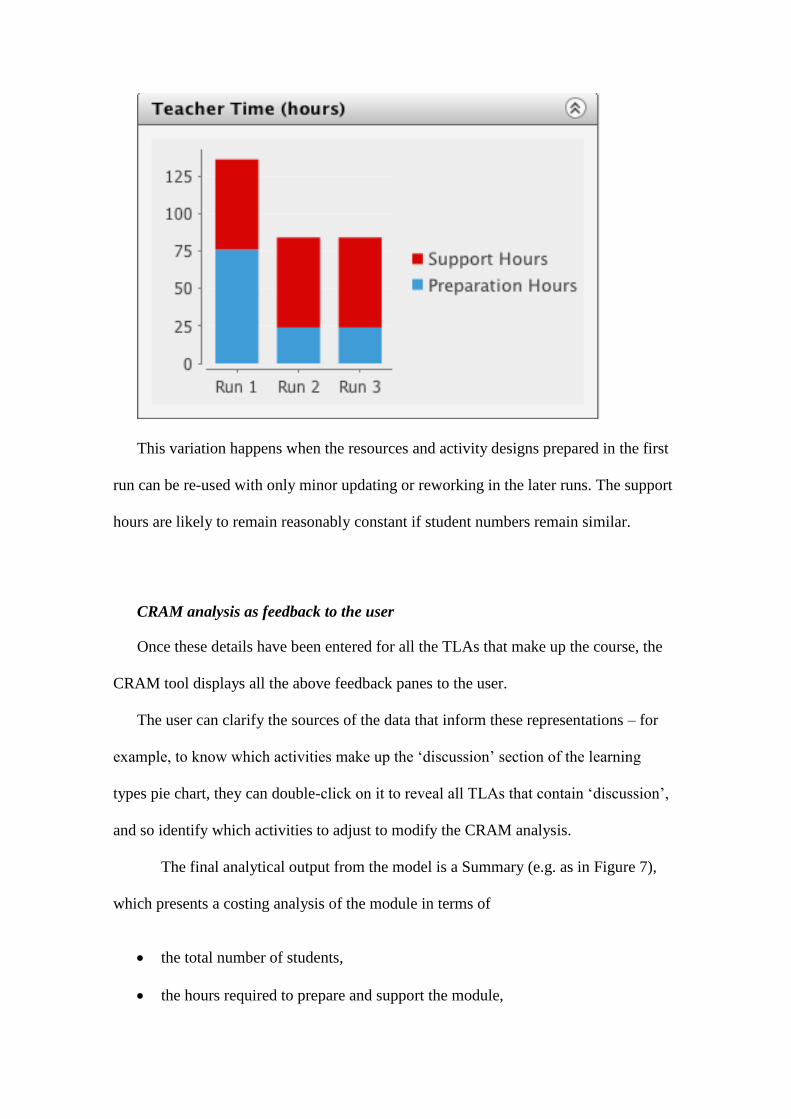
This variation happens when the resources and activity designs prepared in the first
run can be re-used with only minor updating or reworking in the later runs. The support
hours are likely to remain reasonably constant if student numbers remain similar.
CRAM analysis as feedback to the user
Once these details have been entered for all the TLAs that make up the course, the
CRAM tool displays all the above feedback panes to the user.
The user can clarify the sources of the data that inform these representations – for
example, to know which activities make up the ‘discussion’ section of the learning
types pie chart, they can double-click on it to reveal all TLAs that contain ‘discussion’,
and so identify which activities to adjust to modify the CRAM analysis.
The final analytical output from the model is a Summary (e.g. as in Figure 7),
which presents a costing analysis of the module in terms of
the total number of students,
the hours required to prepare and support the module,
the teaching–related income received and
the teaching costs incurred, and
the difference between the income and costs, for each run of the module.
The bottom line indicates whether the course proposed is financially viable over the
three runs in terms of the teaching-related costs, while the remaining feedback panes
represent the learning benefits. A comparison between these two sets of summary data
allows University staff to make an informed decision about the sustainability of a
specific course, thereby shedding light on previously obscure matters of financial
planning, and widening consideration beyond income/expenditure, to include tutor
workload, student hours and learning outcomes.
Redesign of the tool based on user feedback
For each of the design-testing stages, following user observation and feedback, we
made changes to the tool that can broadly be categorised as being as one of five types:
changes to the underlying model, changes to the way in which users entered data into
the tool, changes to terminology, changes to the user interface, and an additional
requirement to provide the output of the CRAM tool as a report. In the paragraphs that
follow, we provide some brief illustrative examples of the ways in which user
evaluation improved the development of the CRAM Tool.
Changes to the model
There were two significant changes to the model in terms of the ways in which costs
were calculated for a module: the division between home and overseas students, and the
allocation of teaching staff to the modules. In the UK, Government subsidies distinguish
between Home/EU and International student fees. In the original spreadsheet model, the
student income for a module was based on a proportion of the mean of home and
overseas fees. However, from testing with users, it was clear that the ratio of home to
overseas students was often > 50% for most modules at their institution. It was therefore
important to extend the model to elicit the number of home and overseas students, along
with their respective per student income for teaching. This change led to a significant
positive impact on the summary costing for those courses that were mainly taken by
overseas students. However, for sectors and national contexts where this division does
not have the same impact on overall costs, only one fee amount need be entered.
The allocation of staff costs were calculated in the original spreadsheet model in
terms of the average daily cost per staff member. However this obscures fact that, as the
observation showed, it was mainly higher-paid members of staff (such as Professors)
who were responsible for preparing modules, whereas lower-paid members of staff
(such as Teaching Assistants) supported students day-to-day. This important distinction
between the costs of preparation and support, especially for those courses with many
students requiring high levels of support, must not be hidden. We therefore changed the
underlying model so that each TLA was described in terms of the estimated relative
distribution of time spent by higher and lower paid members of staff for preparation and
support, across the three runs. This refinement was seen by users to enhance the clarity
of the model, so that they could make better-informed decisions about staff allocation
for each TLA.
Changes to the Data Entry Mechanism
In response to user needs for a simpler interface the redesigned version of the
CRAM tool included a 'TLA Creator Wizard' that took users through the design
decisions (Section 4.2). Early evaluations of this new functionality showed that many
users were entering TLAs that were similar to each other. To save them time it made
sense to use, for example, module validation documents to provide a library of
commonly-used TLAs that users could select as a starting point, as an alternative to
defining their own. In response to further testing, the TLAs that users had created were
saved for them to use as templates, so that over time, users could create a set of their
own commonly-used TLAs, thus streamlining the process of describing the details of a
module.
When describing the learning types that students should expect to encounter in a
TLA, the Wizard provide users with a set of sliders to provide the distribution of
learning experiences for each TLA, i.e. the proportion of time that would be spent in
acquisition, collaboration, discussion, inquiry, practice or production. This gave users
control over the definition of learning value, but in response to user evaluation, we
added a 'Normalise' button to the sliders to ensure that the values totalled 100%. This
seemingly small user interface change made a significant difference to the way in which
users specified the distribution of learning types for a TLA: instead of having to set
precise percentages, most users set the visual distribution of learning types irrespective
of their values, and used the 'normalise' button to ensure that they summed to 100%.
Changes to Terminology
We encountered some confusion from users with some of the terms used in the CRAM
tool, even though they are common in the literature. For example, the term 'Technology-
Enhanced Learning', was not obvious to users as a way of providing student feedback.
Changing the term to 'Computer-based' appeared to remove the confusion.
Most confusion arose over the term 'Support Time', by which we meant the time
teachers spend with students, either face-to-face, online, in forums, reading essay drafts,
marking assignments and so on. However, the teaching community does not appear to
have a term that adequately describes the time taken to perform all these essential
student-related activities. We used the term 'Support Time' as a catch-all but we have to
rely on tooltips (or 'rollovers') to clarify the meaning of this and all other elements of the
user interface.
Changes to the User Interface
The most significant change made to the interface in response to user evaluation was the
introduction of a 'drill-down' feature enabling users to double-click on a segment or bar
of a chart to discover the origin of the data that contributed to its value, as well as the
ability to then go directly to edit that data. Thus the charts acted both as a means of
visualising the data and as a means to trace the source of the visualisation.
Output as a report
The CRAM Tool enables users to share their work by saving the model for each module
as a datafile, which can be sent to others to open within their own installation of the
tool. However, many users requested also an output in the form of a 'report' that could
become part of their institution's course validation process. We therefore added the
option to ‘export’ a description of a module as a structured Microsoft Word document
(see Figure 5).
Figure 5: Extract of an exported report on a Module design
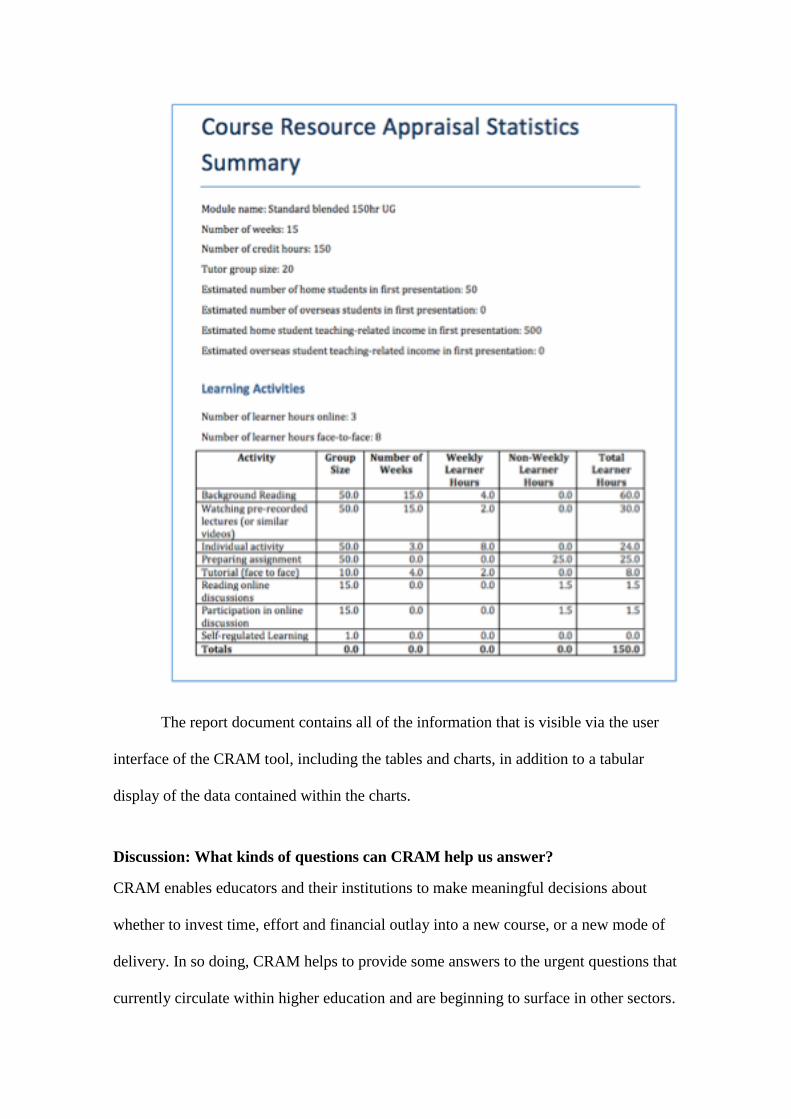
The report document contains all of the information that is visible via the user
interface of the CRAM tool, including the tables and charts, in addition to a tabular
display of the data contained within the charts.
Discussion: What kinds of questions can CRAM help us answer?
CRAM enables educators and their institutions to make meaningful decisions about
whether to invest time, effort and financial outlay into a new course, or a new mode of
delivery. In so doing, CRAM helps to provide some answers to the urgent questions that
currently circulate within higher education and are beginning to surface in other sectors.
The emergence of online learning at scale (in the form of Massively Open Online
Courses or MOOCs) has raised important questions around the limitations and
possibilities of online pedagogy. Equally, the very limited income that reverts to the
Universities running such courses begs the question of whether MOOCs will ever be in
the financial interests of institutions.
In May 2014, the Institute of Education (University of London) in partnership
with the UNESCO Institute for IT in Education ran a six week long MOOC entitled
“ICT in Primary Education: Transforming Children’s Learning Across the Curriculum”.
The aim of the course was to provide quality professional development for the world’s
primary teachers in ICT. UNESCO’s Education For All programme created a target of
universal access to primary education by 2015 (UNESCO, 2000). To achieve this,
UNESCO predicted that 1,600,000 new teachers would be required by 2015, rising to
3,300,000 by 2030 (UNESCO, 2014). The provision of training for this number of
teachers with limited resources is no easy feat. Since the scale of the problem is
massive, a MOOC may be the answer.
One important consideration is whether a MOOC that offers effective
professional development could be financially sustainable? The following discussion
shows how CRAM can help with this analysis, using the ICT in Primary Education
MOOC as an example.
Can quality learning be provided at scale?
The ICT in Primary Education MOOC had limited funding, and took several steps to
keep the preparation costs low:
Used existing books as reading resources, and open video resources
Used low-budget voice-over-slides for videos
Used Team’s own videos of classrooms and students
One professional video (5 mins) for PR
Designers paid @£350 per day for a total 30 hours development
Support staff paid @£150 per day for a total 24 hours technical development and
quality checking
Support costs were kept low because in professional development courses the
participants are themselves highly knowledgeable and are able to provide valuable
insights and guidance to each other from their experience. A high proportion of the
preparation cost was therefore spent on designing orchestrated group activities for peer-
to-peer learning, with structured discussions within the Coursera platform closely tied to
readings or videos, and on activities relating to external collaboration spaces such as
Padlet and Diigo for participants to share additional resources and useful links. This
orchestrated peer learning reduced the need for tutor support during the course.
Similarly, because of the homogeneity of a professional development cohort, peers were
able to review and evaluate each others’ assignments. The overall grade was calculated
in terms of the number of collaborative output contributions, peer reviews, and forum
posts, with 30% calculated from the average scores from peer reviews. In summary, the
steps take to keep support costs low were:
Budgeted for 6 hrs per week each for TA and the lead instructor in Forums
Used peer evaluation of assignments
The grade was based also on the number of contributions, reviews and posts
Orchestrated peer-to-peer study guide to achieve high levels of peer engagement
When teacher-designers plan a course like this, it very often involves a risk.
With student numbers in their thousands, it is no longer possible to rely on the
individual talents of teachers to orchestrate discussions and provide personalised
feedback to all students. Teacher-designers need to be able to assess whether the course
pedagogy might be successful in supporting learners at scale. Using the CRAM tool, it
was possible to assess the extent to which the planned teaching and learning activities
support the Conversational Framework by providing sufficient proportions of learning
experiences and sources of feedback to the learners. The data entered into the teaching
and learning activities showed how learners were engaged in the range of TLAs, with
only 8 of the 60 hours spent in self-regulated learning (see Figure 2). Feedback from the
pie chart showed that: ‘discussion’ was the dominant learning type, as planned, with as
much emphasis on production and practice through sharing outputs, as on acquisition
(see Figure 3a). The predominant learning experience was social (54%), with some
personalised learning from peer feedback (see Figure 3b). Twice as much learning time
had feedback from peers as from their tutors contributing to forums (Figure 3c). The
learning design for the MOOC did not take advantage of feedback that could be
provided by the computerized environment itself (for example, from quizzes), as such
forms of assessment tend to trivialise the complex qualitative issues being debated on
the course.
The CRAM output table for the spread of teaching and support hours that would
be involved in running the MOOC three times showed that the hours devoted to
preparation exceeded those for supporting the MOOC (e.g. facilitating the discussion
forum) in the first run. Thereafter, however, the preparation hours were predicted to
decrease, because the video lectures, forums and activities had already been created, and
would only need checking and updating. As a result, by the second and third run, the
preparation hours dropped, and the support hours became stable (see Figure 4).
Taken together, this analysis shows how the teaching team could use CRAM to
help assess whether they had put in place the conditions for learning to take place at
scale. Certainly the post-course survey of those who completed showed that the
practice, production and discussion activities built into the study guide were highly
valued by the participants, of whom 48% rated the course as ‘excellent’, and 36% as
‘very good’ (Laurillard, 2014).
What do you need to break even on a MOOC?
While feedback from CRAM could show that a social learning pedagogy can provide a
quality learning experience for professional educators at scale, the question still remains
as to whether (and under what circumstances) the provision of such a MOOC would be
a financially sustainable initiative for Universities. Currently, Coursera offers students
an option to pay for a Signature Track verified certificate, which for the ICT in PE
MOOC was $49. Coursera gives a proportion of this fee back to the University that
provided the MOOC. Assuming the split is 50:50, it means that $25 (£16) is the per
student teaching-related income that can be used by the CRAM model to test the
affordability against the overall costs for running the MOOC three times. These
calculations and their results are outlined below.
The data on student numbers, for the purposed of cost modelling, relates to the
number of students who opted to pay for the Signature Track certificate. Despite there
being thousands of students enrolled on the course, only 200 had registered for the
certificate, which is within the normal range. Assuming that interest in the certificate
would grow in future runs, since organisations are beginning to recognise the
professional development value of completing a MOOC like this future runs can be
modelled as attracting 400 students in the second run, and 800 in the third run. The
income from each student would remain constant across home and international
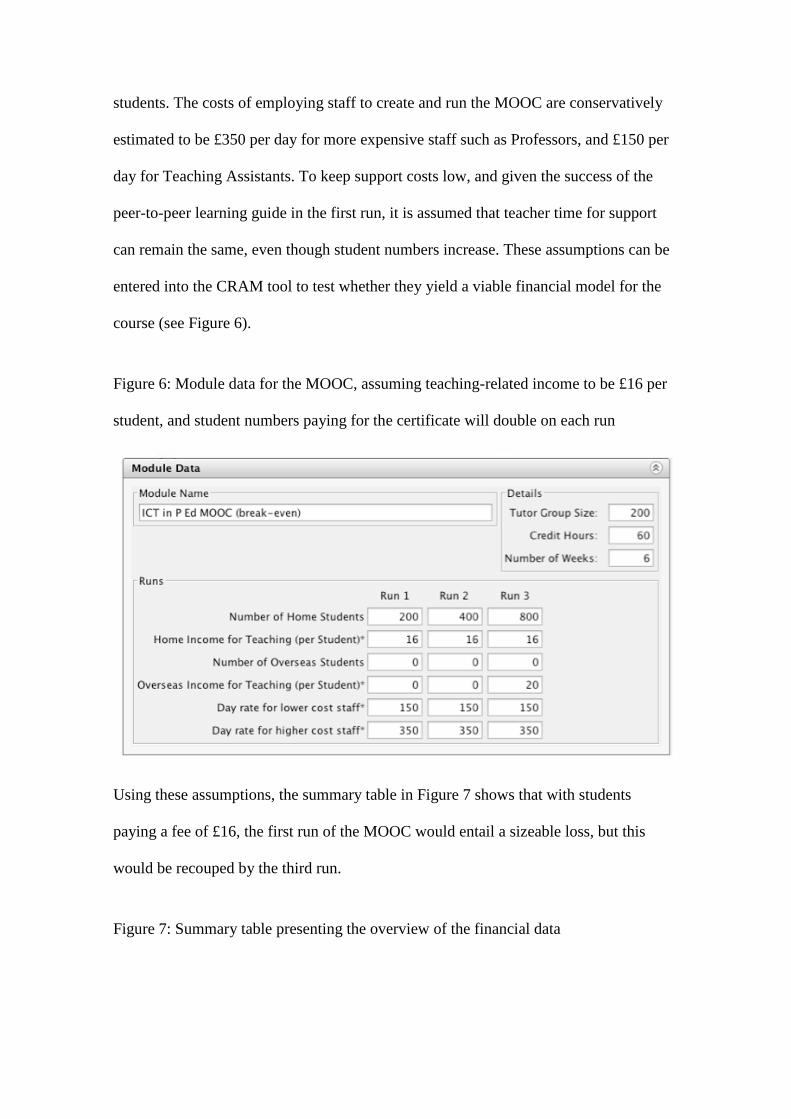
students. The costs of employing staff to create and run the MOOC are conservatively
estimated to be £350 per day for more expensive staff such as Professors, and £150 per
day for Teaching Assistants. To keep support costs low, and given the success of the
peer-to-peer learning guide in the first run, it is assumed that teacher time for support
can remain the same, even though student numbers increase. These assumptions can be
entered into the CRAM tool to test whether they yield a viable financial model for the
course (see Figure 6).
Figure 6: Module data for the MOOC, assuming teaching-related income to be £16 per
student, and student numbers paying for the certificate will double on each run
Using these assumptions, the summary table in Figure 7 shows that with students
paying a fee of £16, the first run of the MOOC would entail a sizeable loss, but this
would be recouped by the third run.
Figure 7: Summary table presenting the overview of the financial data
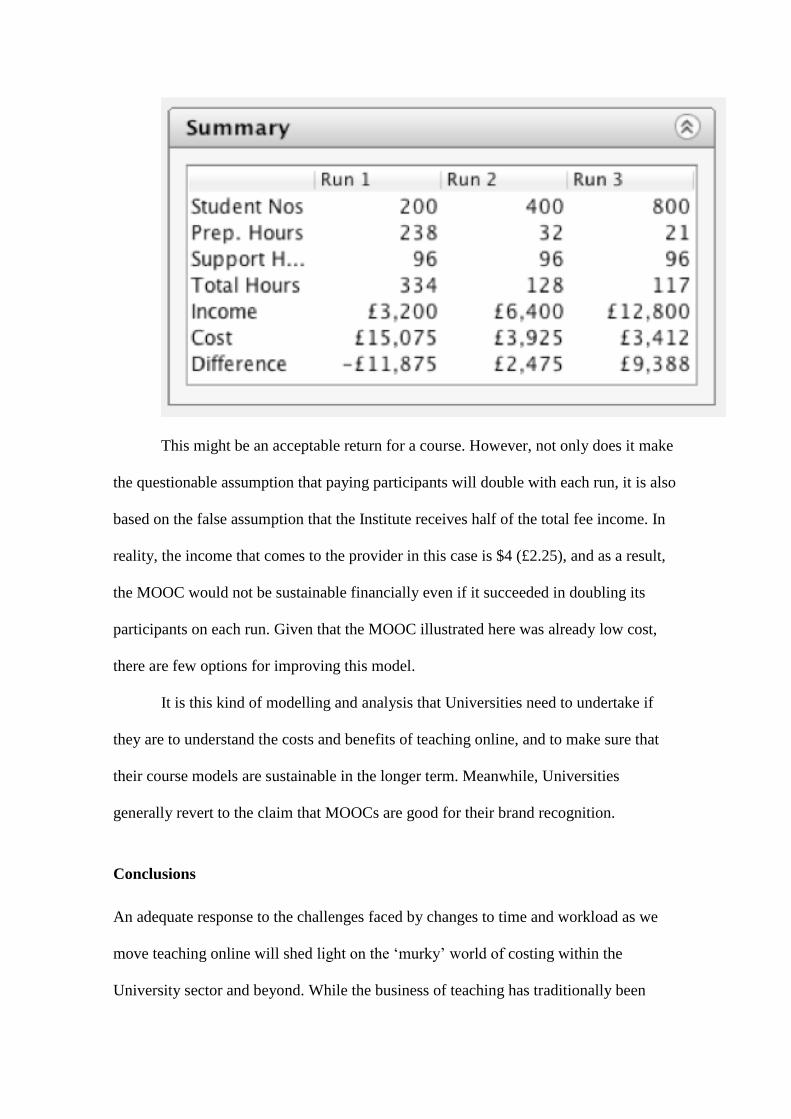
This might be an acceptable return for a course. However, not only does it make
the questionable assumption that paying participants will double with each run, it is also
based on the false assumption that the Institute receives half of the total fee income. In
reality, the income that comes to the provider in this case is $4 (£2.25), and as a result,
the MOOC would not be sustainable financially even if it succeeded in doubling its
participants on each run. Given that the MOOC illustrated here was already low cost,
there are few options for improving this model.
It is this kind of modelling and analysis that Universities need to undertake if
they are to understand the costs and benefits of teaching online, and to make sure that
their course models are sustainable in the longer term. Meanwhile, Universities
generally revert to the claim that MOOCs are good for their brand recognition.
Conclusions
An adequate response to the challenges faced by changes to time and workload as we
move teaching online will shed light on the ‘murky’ world of costing within the
University sector and beyond. While the business of teaching has traditionally been
separate from that of accounting for its costs, it is becoming ever more necessary to
make efforts to bridge this divide. Unless we take into consideration both the teaching
costs of preparing and running a course, and the benefits to the learner as a result, we
will make ill-informed decisions about the future of education that are unlikely to
advantage either teachers or learners.
A design-based research approach was used to develop the CRAM tool. The aim
is to put a powerful tool into the hands of teachers to help them model the extent to
which a course can break even over time, whether it is sustainable, and whether it will
activate the range and distribution of learning types that will help learners achieve the
intended outcomes. Courses which demand too much in valuable teacher time may
never make sense for the institution, and a teacher needs to know where changes can be
made that will preserve the quality of learning experience for the student. The CRAM
tool allows the teacher to do just that by highlighting simultaneously learning and costs,
and allowing teachers to drill down to consider alternative designs and evaluate their
relative costs for preparation and support time. CRAM has the potential to become a
powerful tool for the online educator, and one we hope will change institutions’
approach to planning for the better.
References
Amiel, T. E. L., & Orey, M. (2007). DO YOU HAVE THE TIME ? INVESTIGATING
ONLINE CLASSROOM WORKLOAD. Journal of Educational Technology
Systems, 35(1), 31–43.
Barab, S., & Squire, K. (2004). Design-Based Research : Putting a Stake in the Ground.
Journal of the Learning Sciences, 13(1), 1–14. doi:10.1207/s15327809jls1301
Barber, M., Donnelly, K., & Rizvi, S. (2013). An avalanche is coming: Higher
Education and the revolution ahead (pp. 1–72). London.
Bates, T. (2001). National strategies for e-learning in post-secondary education and
training (pp. 1–129). Paris. Retrieved from http://www.unesco.org/iiep
Bowen, W. G. (2013). Higher education in the digital age. Princeton, NJ: Princeton
University Press.
Charlton, P., Magoulas, G., & Laurillard, D. (2012). Enabling Creative Learning Design
through Semantic Web Technologies. Journal of Technology, Pedagogy and
Education, 21(2), 231–254.
Hollands, F. M., & Tirthali, D. (2014). Resource Requirements and Costs of Developing
and Delivering MOOCs. The International Review of Research in Open and
Distance Learning, 15(5), 113–133.
Hülsmann, T. (2004). The Two-Pronged Attack on Learner Support: Costs and the
Centrifugal Forces of Convergence. In Paper presented at the Third EDEN
Research Workshop: Supporting the Learner in Distance Education and E-
Learning (pp. 1–10). Oldenburg: Bibliotheks-und-Information System der
Universitat Oldenburg. Retrieved from http://www.c3l.uni-
oldenburg.de/cde/support/fa04/Vol. 9 chapters/H%FClsmann.pdf
Koenig, R. J. (2011). A Template For Analyzing Costs Associated With Educational
Delivery Modes. Journal of International Education Research, 7(1), 5–14.
Laurillard, D. (2002). Rethinking University Teaching. London: Routledge.
Laurillard, D. (2006). Modelling benefits-oriented costs for technology enhanced
learning 1. Higher Education, 54, 21–39.
Laurillard, D. (2012). Teaching as a Design Science. New York & Abingdon, Oxon:
Routledge.
Laurillard, D. (2014, January 16). Five myths about Moocs | Opinion | Times Higher
Education. Times Higher Education. London. Retrieved from
http://www.timeshighereducation.co.uk/comment/opinion/five-myths-about-
moocs/2010480.article
Ljubojevic, D., & Laurillard, D. (2011). Theoretical Approach to Distillation of
Pedagogical Patterns from Practice to Enable Transfer and Reuse of Good
Teaching. Teaching English with Technology - Special Issue on LAMS and
Learning Design, 11(1), 48–61.
McCaffrey, P. (2010). The Higher Education Manager’s Handbook. Abingdon:
Routledge.
Means, B., Bakia, M., & Murphy, R. (2014). Learning Online: What Research Tells Us
About Whether, When and How. New York, NY: Routledge.
Plomp, T. (2007). Educational Design Research: an Introduction. In T. Plomp & N.
Nieveen (Eds.), An Introduction to Educational Design Research (pp. 9–35).
Enschede: SLO.
Twigg, C. A. (2003). Improving Learning and Reducing Costs: New Models for Online
Learning. Educause Review, 38(October), 28–38.
Twigg, C. A. (2004, November). Viewpoint A Promising Path for Education :
Technology. University Business, (November), 12.
List of figures
Figure 1. The steps involved in the Course Resource Appraisal Model.
Figure 2: Student hours output table
Figure 3: (a) The distribution of learning types across the module, (b) the learning
experience chart, (c) the source of feedback
Figure 4. Estimated teacher hours chart
Figure 5: Extract of an exported report on a Module design
Figure 6: Module data for the MOOC, assuming teaching-related income to be £16 per
student, and student numbers paying for the certificate will double on each run
Figure 7: Summary table presenting the overview of the financial data