Embed Size (px)
Citation preview
Making Indonesia 4.0 Fokus Pangan dan Energi
Oleh : Achdiat Atmawinata
Anggota Komtek Material Maju DRN
4/20/2018 1 BALITBANGBUN BOGOR 19 April 2018
Making
Indonesia 4.0
Making
Indonesia
Agenda
2
6
Next Steps
5
Economic Benefit and Job Creations
4
10 National Priorities for “Making Indonesia 4.0”
3
Five Focus Sectors for “Making Indonesia 4.0”
2
“Making Indonesia 4.0” Aspirations
1
Background
Making
Indonesia
Making
Indonesia
3
Background
Making
Indonesia
Making
Indonesia
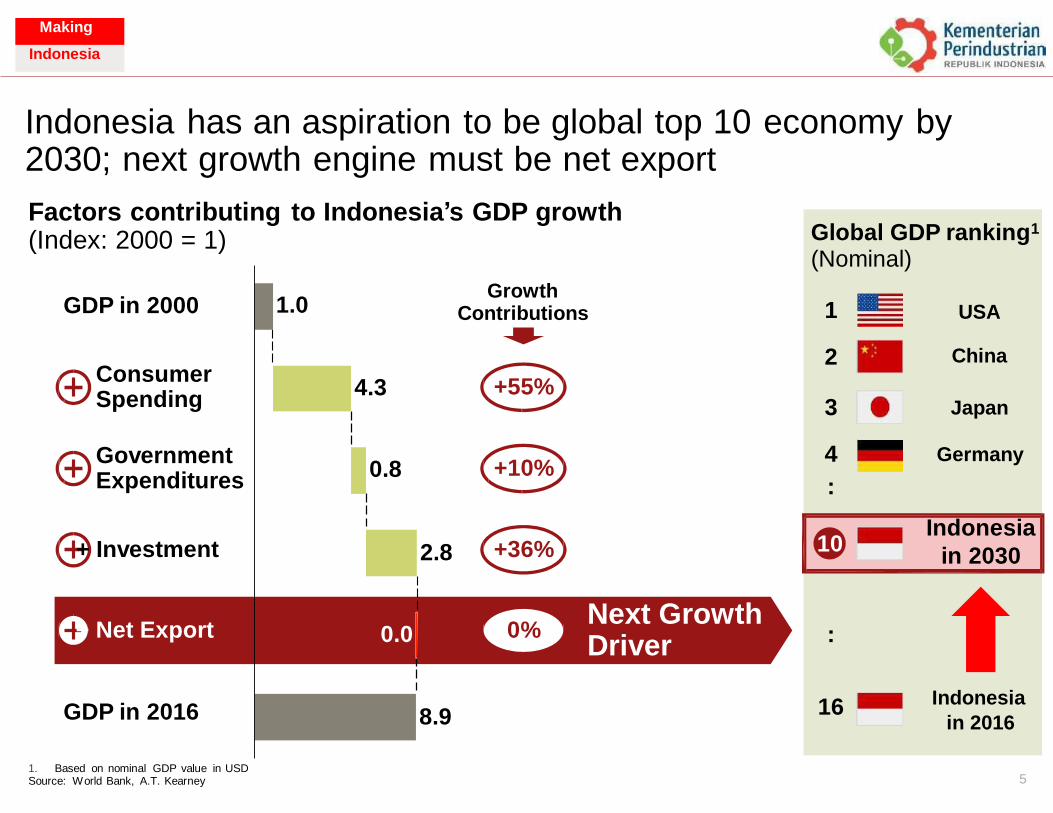
Indonesia has an aspiration to be global top 10 2030; next growth engine must be net export
economy by
Factors contributing (Index: 2000 = 1)
to Indonesia’s GDP growth
Growth Contributions GDP in 2000
Consumer Spending
+55%
Government Expenditures
+10%
+ Investment +36% 2.8
Next Growth + Net Export 0%
Driver
GDP in 2016 8.9 in 2016
1. Based on nominal GDP value in USD 5 Source: World Bank, A.T. Kearney
1.0
4.3
0.8
0.0
Global GDP ranking1 (Nominal)
1 USA
2 China
3 Japan
4 Germany
:
Indonesia 10
in 2030
:
16 Indonesia
Making
Indonesia
Making
Indonesia
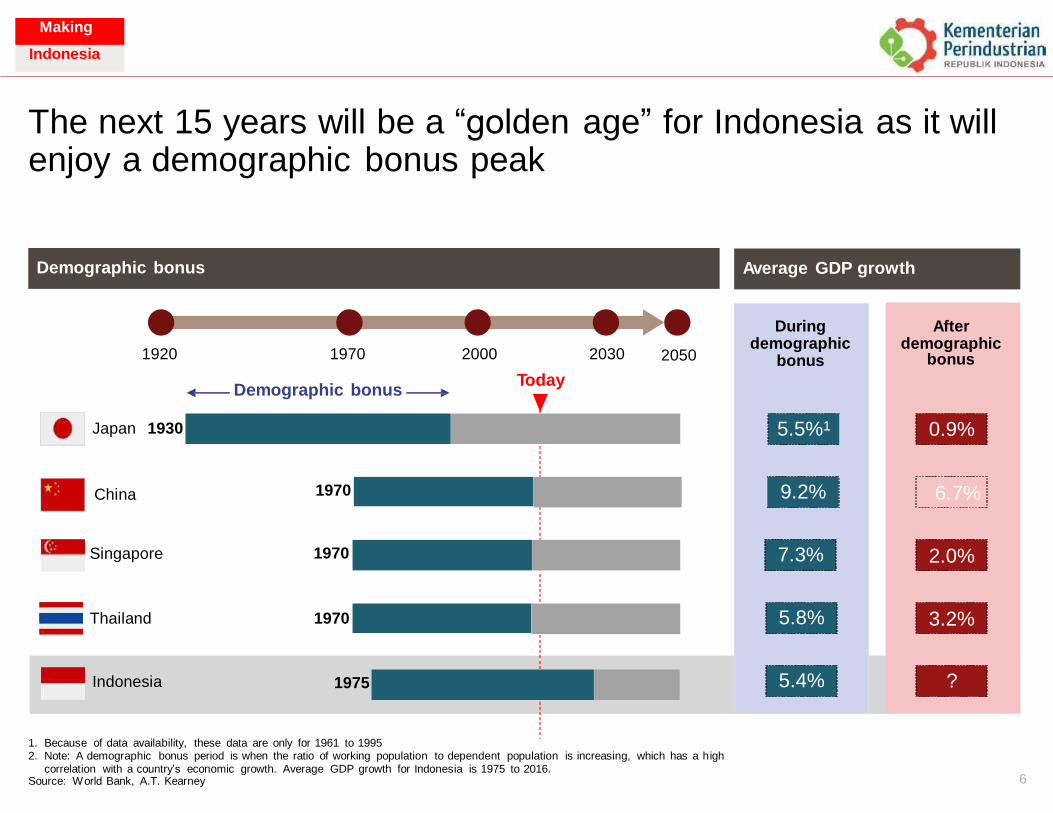
The next 15 years will be a “golden age” for Indonesia as it will enjoy a demographic bonus peak
bonus
1. Because of data availability, these data are only for 1961 to 1995 2. Note: A demographic bonus period is when the ratio of working population to dependent population is increasing, which has a h igh
correlation with a country’s economic growth. Average GDP growth for Indonesia is 1975 to 2016. Source: World Bank, A.T. Kearney 6
1920 1970 2000 2030 2050
Demographic bonus Today
Japan 1930
China 1970
Singapore 1970
Thailand 1970
During demographic
bonus
5.5%1
9.2%
7.3%
5.8%
5.4%
After demographic
0.9%
6.7%
2.0%
3.2%
Indonesia 1975
?
Average GDP growth
Demographic bonus
Making
Indonesia
Making
Indonesia
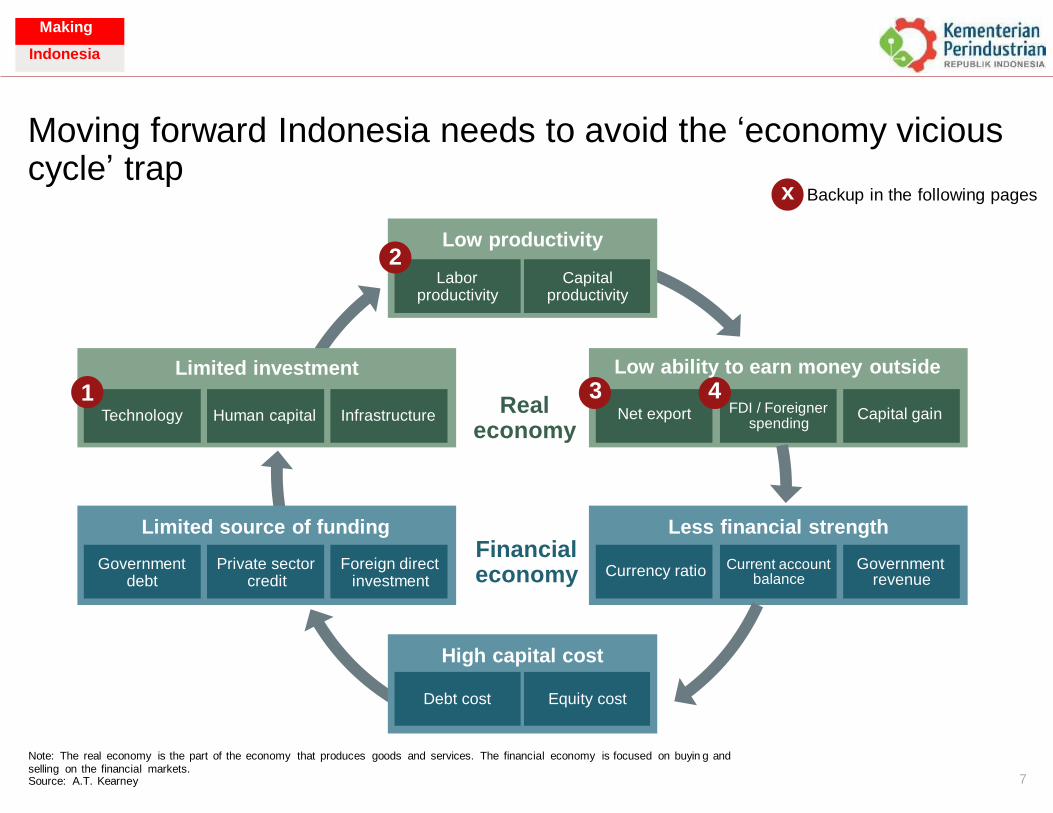
Moving forward Indonesia needs to avoid the ‘economy vicious
x cycle’ trap
Backup in the following pages
2
Real economy
Financial economy
Note: The real economy is the part of the economy that produces goods and services. The financial economy is focused on buyin g and selling on the financial markets. Source: A.T. Kearney 7
High capital cost
Debt cost Equity cost
revenue
balance
Less financial strength
Currency ratio Current account Government
Limited source of funding
Government Private sector Foreign direct debt credit investment
spending
Low ability to earn money outside
3 4 Net export FDI / Foreigner Capital gain
Limited investment
1 Technology Human capital Infrastructure
Low productivity
Labor Capital productivity productivity
Making
Indonesia
Making
Indonesia
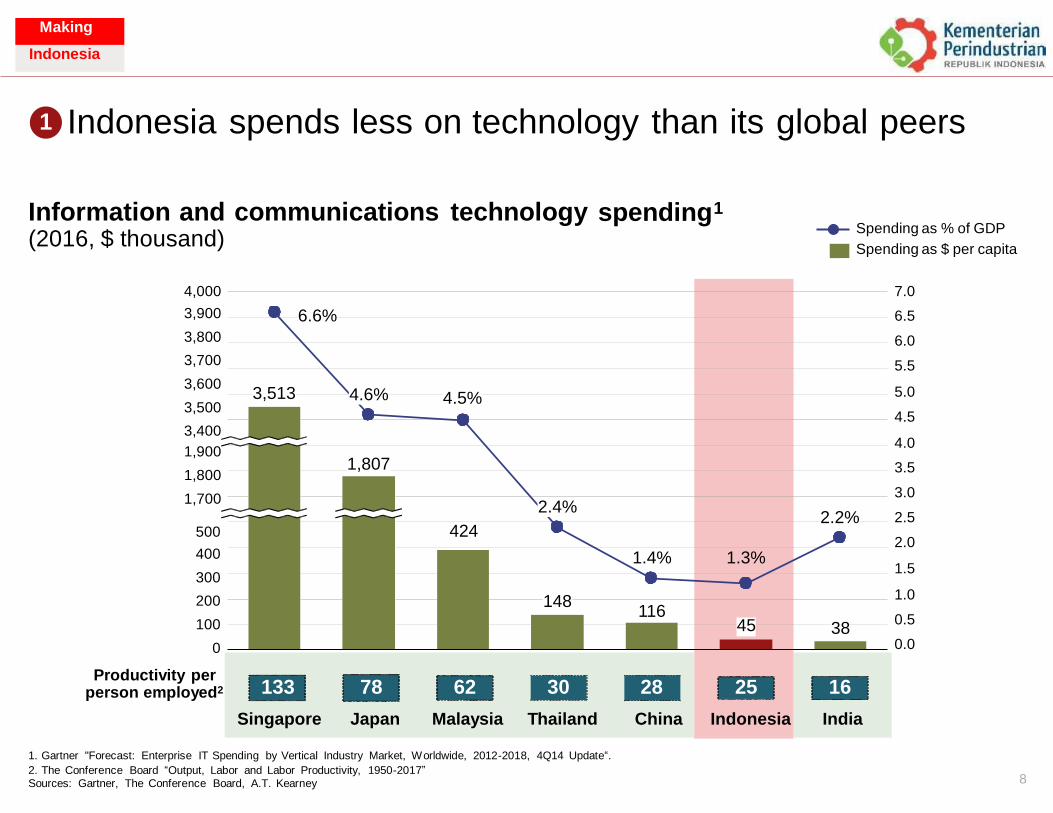
Indonesia spends less on technology than its global peers 1
spending1 Information and (2016, $ thousand)
communications technology Spending as % of GDP
Spending as $ per capita
4,000
3,900
3,800
3,700
3,600
3,500
3,400
1,900
1,800
1,700
7.0
6.5
6.0
5.5
5.0
4.5
4.0
3.5
3.0
2.5
2.0
1.5
1.0
0.5
0.0
500
400
300
200
100
0
Productivity per person employed2
116
1. Gartner "Forecast: Enterprise IT Spending by Vertical Industry Market, Worldwide, 2012-2018, 4Q14 Update“.
2. The Conference Board “Output, Labor and Labor Productivity, 1950-2017”
Sources: Gartner, The Conference Board, A.T. Kearney 8
6.6%
3,513 4.6% 4.5%
1,807
2.4%
2.2% 424
1.4% 1.3%
148
38 45
133 78 62 30 28
Singapore Japan Malaysia Thailand China
25
Indonesia
16
India
Making
Indonesia
Making
Indonesia
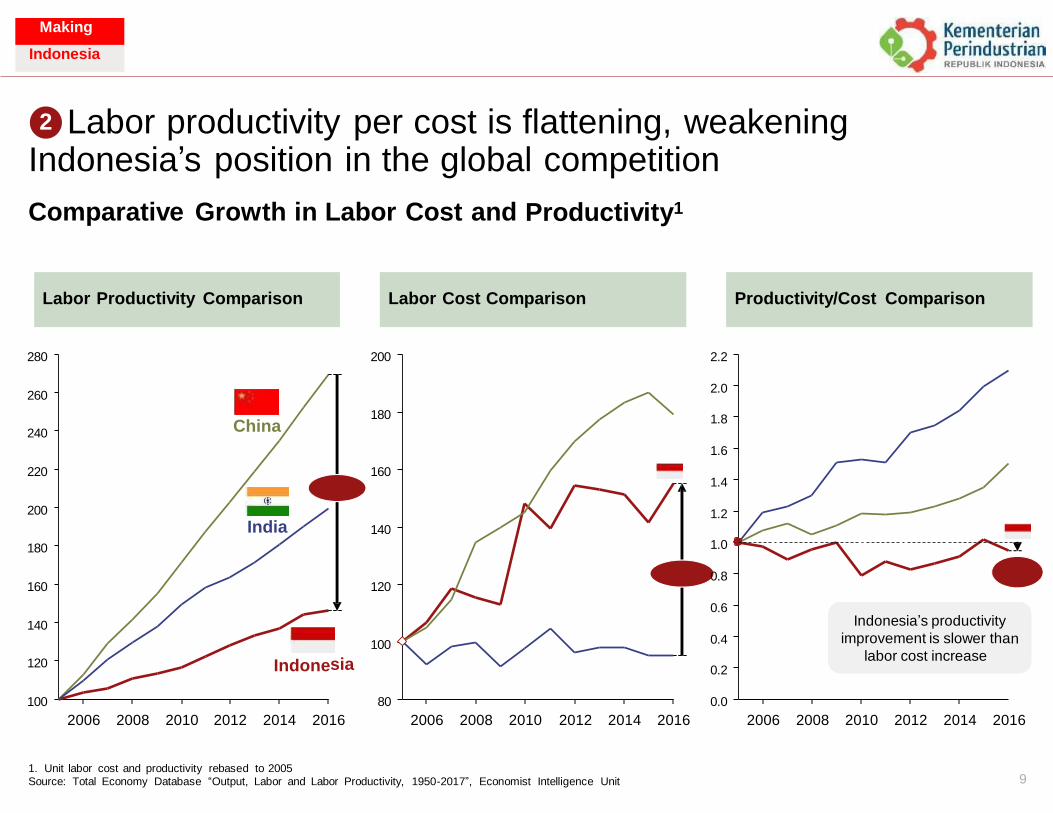
Labor productivity per cost is flattening, weakening 2
Indonesia’s position in the global competition
Productivity1 Comparative Growth in Labor Cost and
280 200 2.2
2.0 260
180 1.8 240
1.6
220 160 1.4
200 1.2
140 1.0 180
0.8 160 120
0.6
140 0.4 100
120 sia 0.2
100 80 0.0
2006 2008 2010 2012 2014 2016 2006 2008 2010 2012 2014 2016 2006 2008 2010 2012 2014 2016
1. Unit labor cost and productivity rebased to 2005
Source: Total Economy Database “Output, Labor and Labor Productivity, 1950-2017”, Economist Intelligence Unit 9
Indonesia’s productivity
improvement is slower tha
labor cost increase
n
China
India
Indone
Productivity/Cost Comparison
Labor Cost Comparison
Labor Productivity Comparison
Making
Indonesia
Making
Indonesia
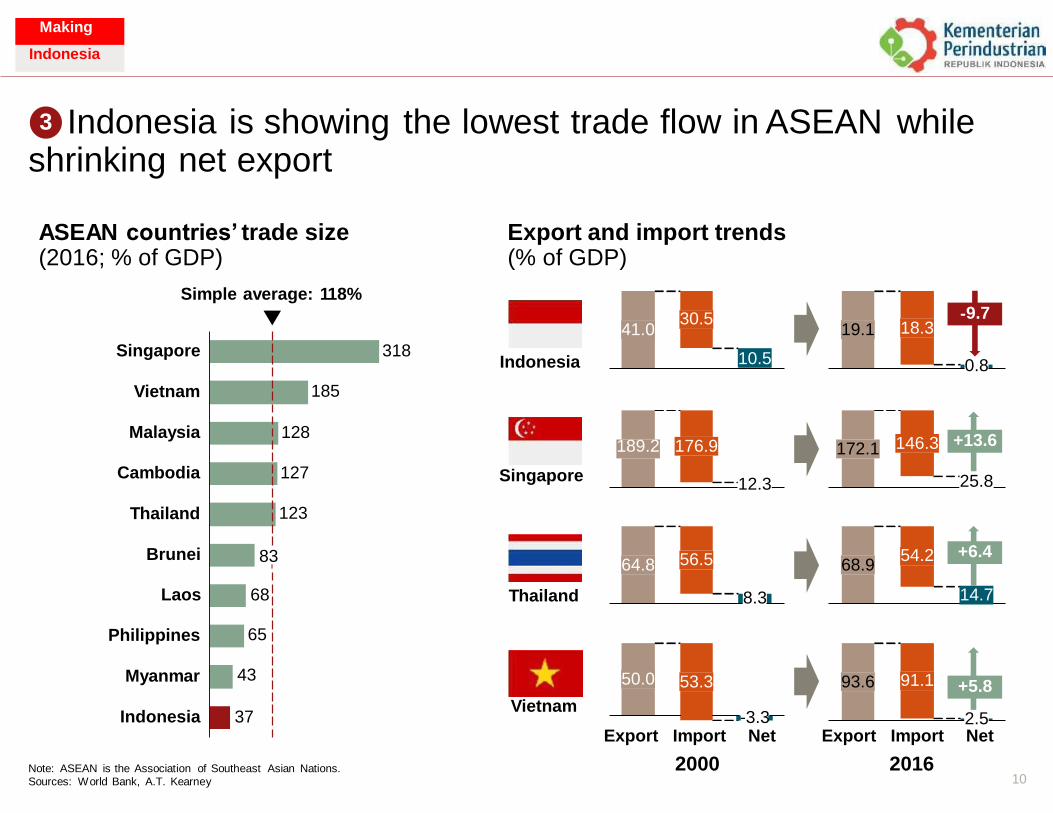
Indonesia is showing the lowest trade flow in ASEAN while 3
shrinking net export
ASEAN countries’ trade size (2016; % of GDP)
Simple average: 118%
Export and import trends (% of GDP)
Singapore 318 Indonesia 0.8
Vietnam
Malaysia
Cambodia Singapore 25.8 12.3
Thailand
Brunei
Laos Thailand 8.3
Philippines
Myanmar
Vietnam Indonesia -3.3 2.5
Export Import Net
2000
Export Import Net
2016 Note: ASEAN is the Association of Southeast Asian Nations.
Sources: World Bank, A.T. Kearney 10
+5.8
93.6
91.1
50.0
53.3
68.9
54.2
+6.4
14.7
64.8
56.5
+13.6 146.3 172.1 189.2 176.9
185
128
127
123
83
68
65
43
37
9.7
19.1
18.3
-
41.0
30.5
10.5
Making
Indonesia
Making
Indonesia
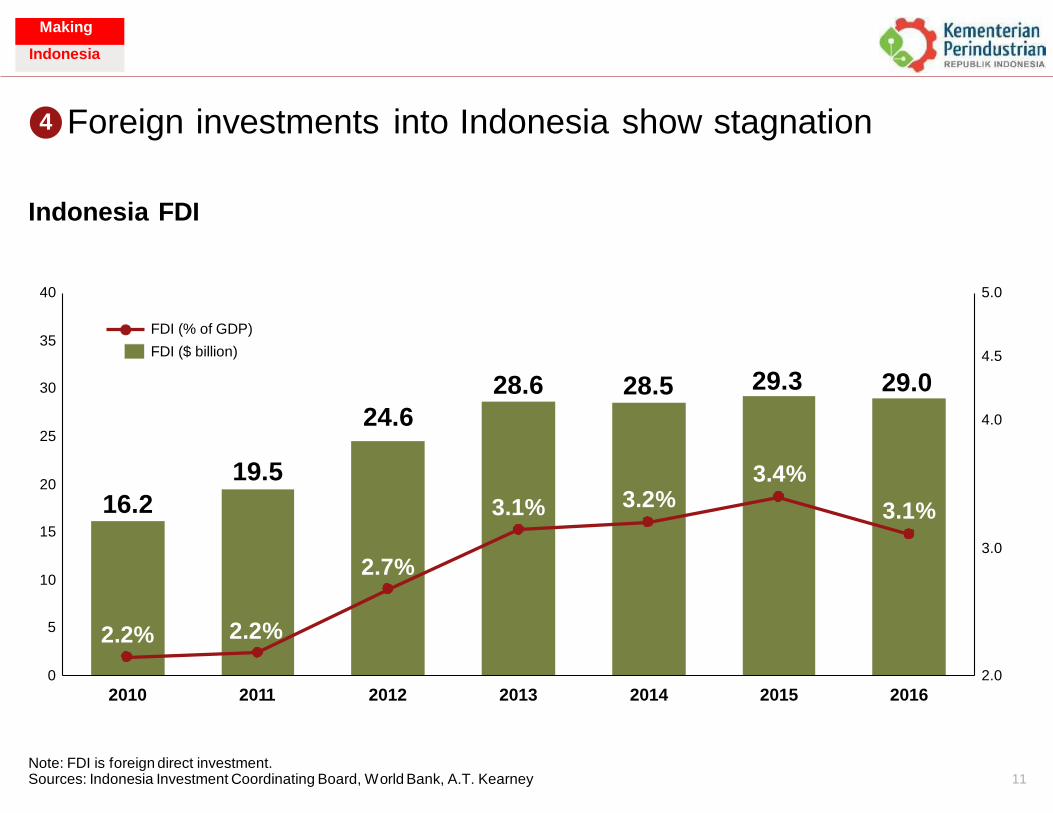
Foreign investments into Indonesia show stagnation 4
Indonesia FDI
40 5.0
35 4.5
30
4.0 25
20
15 3.0
10
5
0 2.0
2010 2011 2012 2013 2014 2015 2016
Note: FDI is foreign direct investment. Sources: Indonesia Investment Coordinating Board, World Bank, A.T. Kearney 11
FDI (% of GDP)
FDI ($ billion)
28.6 28.5 29.3 29.0
3.4%
3.1%
24.6
3.1%
3.2%
19.5
16.2
2.7%
2.2% 2.2%
Making
Indonesia
Making
Indonesia
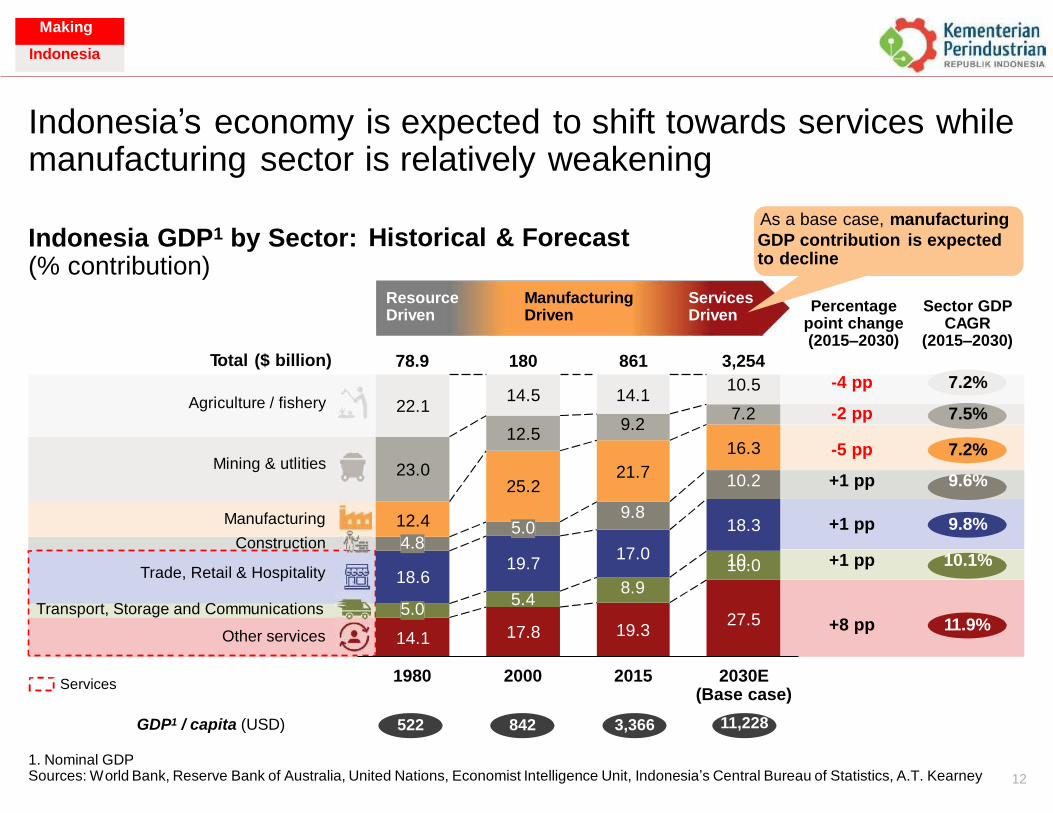
Indonesia’s economy is expected to shift towards services while manufacturing sector is relatively weakening
As a base case, manufacturing
Indonesia GDP1 by Sector: Historical & Forecast GDP contribution is expected to decline (% contribution)
Resource Driven
Manufacturing Driven
Services Driven
Percentage point change (2015–2030)
Sector GDP CAGR
(2015–2030)
Total ($ billion) 78.9 180 861 3,254
10.0
1980 2000 2015 2030E (Base case)
11,228
Services
GDP1 / capita (USD) 522 842 3,366
1. Nominal GDP Sources: World Bank, Reserve Bank of Australia, United Nations, Economist Intelligence Unit, Indonesia’s Central Bureau of Statistics, A.T. Kearney 12
Agriculture / fishery
22.1
14.5
14.1 10.5 -4 pp 7.2%
7.2 -2 pp 7.5%
12.5 9.2
16.3
-5 pp 7.2% Mining & utlities
23.0
21.7
25.2 10.2 +1 pp 9.6%
Manufacturing
12.4 9.8
18.3
+1 pp 9.8% 5.0
17.0 Construction 4.8
19.7
Trade, Retail & Hospitality
18.6 10. +1 pp 10.1%
8.9
27.5
+8 pp 11.9%
5.4 Transport, Storage and Communications 5.0
19.3
17.8
Other services
14.1
Making
Indonesia
Making
Indonesia
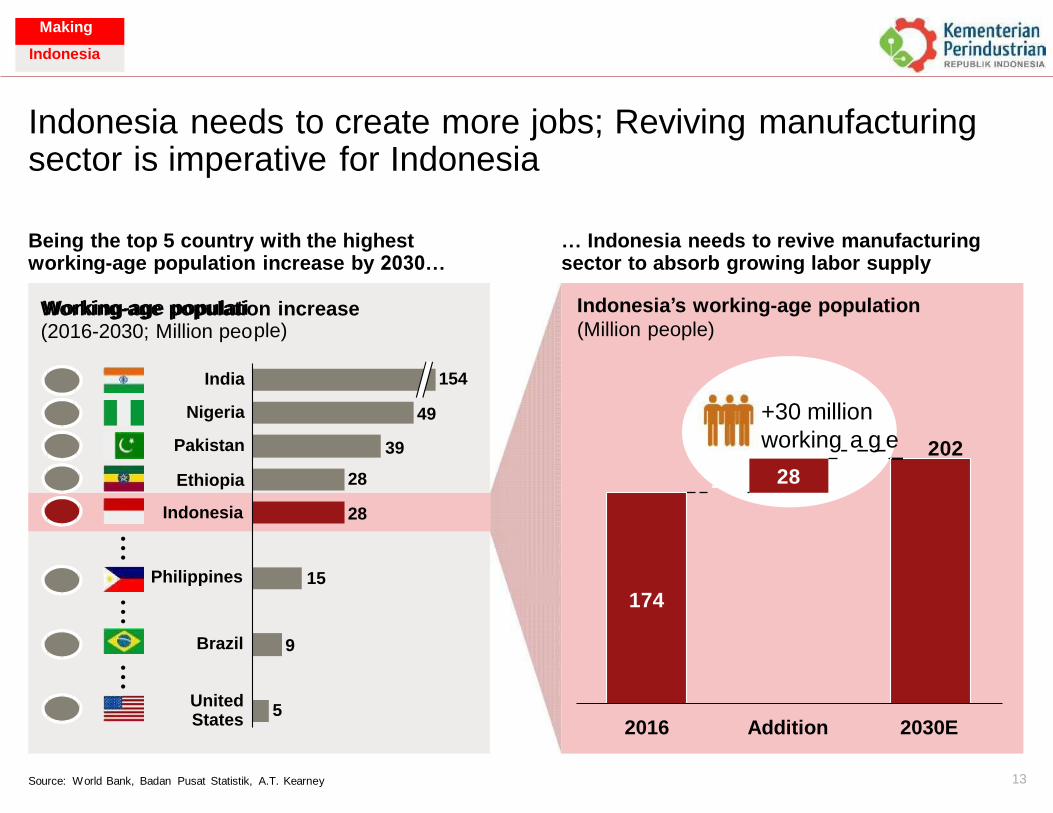
Indonesia needs to create more jobs; Reviving manufacturing sector is imperative for Indonesia
Being the top 5 country with the highest working-age population increase by 2030…
… Indonesia needs to revive manufacturing sector to absorb growing labor supply
Working-age population increase ple)
154
49
39
28
States
13 Source: World Bank, Badan Pusat Statistik, A.T. Kearney
Indonesia’s working-age population
(Million people)
+30 million
working a g e 202 28
174
2016 Addition 2030E
Working-age populati (2016-2030; Million peo
India
Nigeria
Pakistan
Ethiopia 28
Indonesia
Philippines 15
Brazil 9
United 5
Making
Indonesia
Making
Indonesia
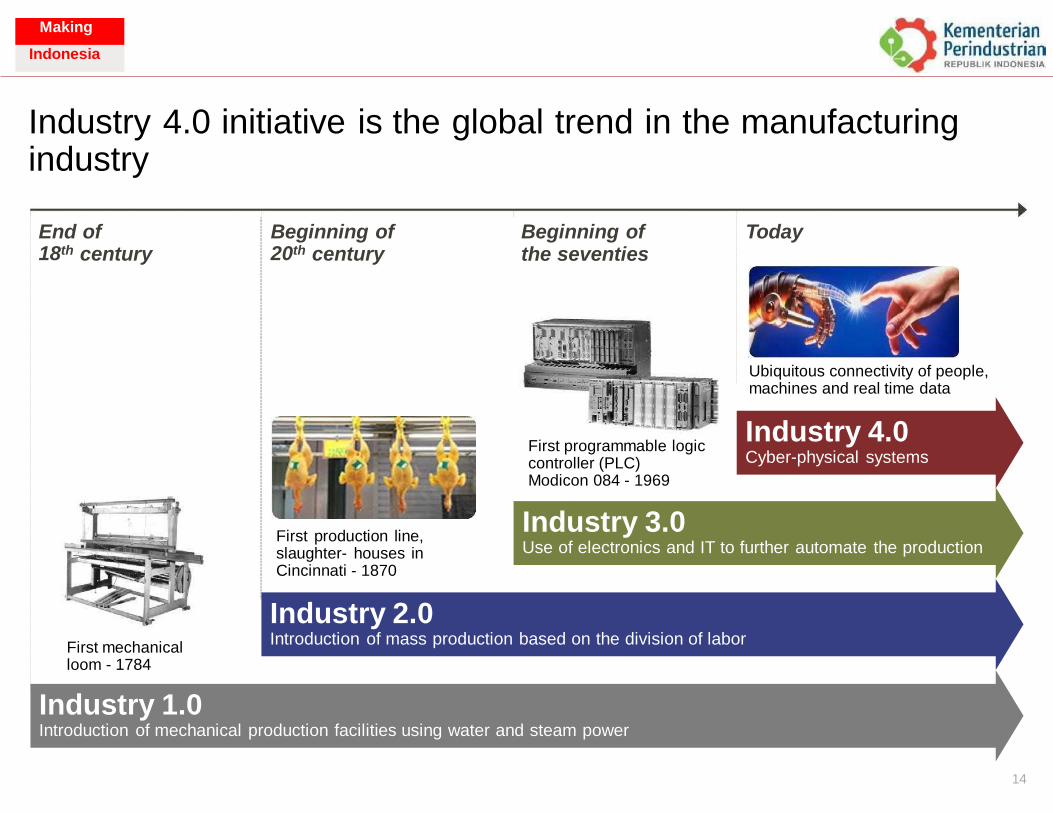
Industry industry
4.0 initiative is the global trend in the manufacturing
End of Beginning of Beginning of the seventies
Today 18th 20th century century
Ubiquitous connectivity of people, machines and real time data
Industry 4.0 Cyber-physical systems
First programmable logic controller (PLC) Modicon 084 - 1969
Industry 3.0 Use of electronics and IT to further automate the production
First production line, slaughter- houses in Cincinnati - 1870
Industry 2.0 Introduction of mass production based on the division of labor
First mechanical loom - 1784
Industry 1.0 Introduction of mechanical production facilities using water and steam power
14
Making
Indonesia
Making
Indonesia
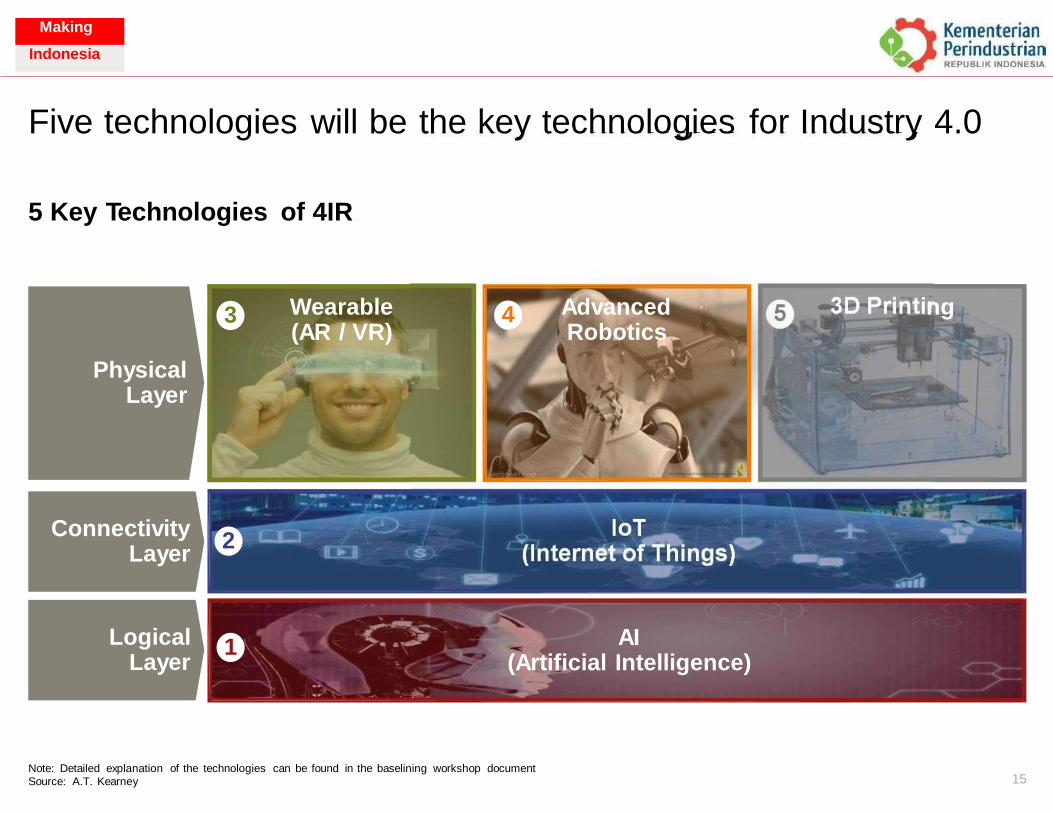
5 3D Printi
IoT (Internet of Things)
Five technologies will be the key technologies for Industry 4.0
5 Key Technologies of 4IR
Wearable Advanced Robotics
ng 3 4 (AR / VR)
Physical Layer
Connectivity Layer
2
Logical Layer
AI (Artificial Intelligence)
1
Note: Detailed explanation of the technologies can be found in the baselining workshop document
Source: A.T. Kearney 15
Making
Indonesia
Making
Indonesia
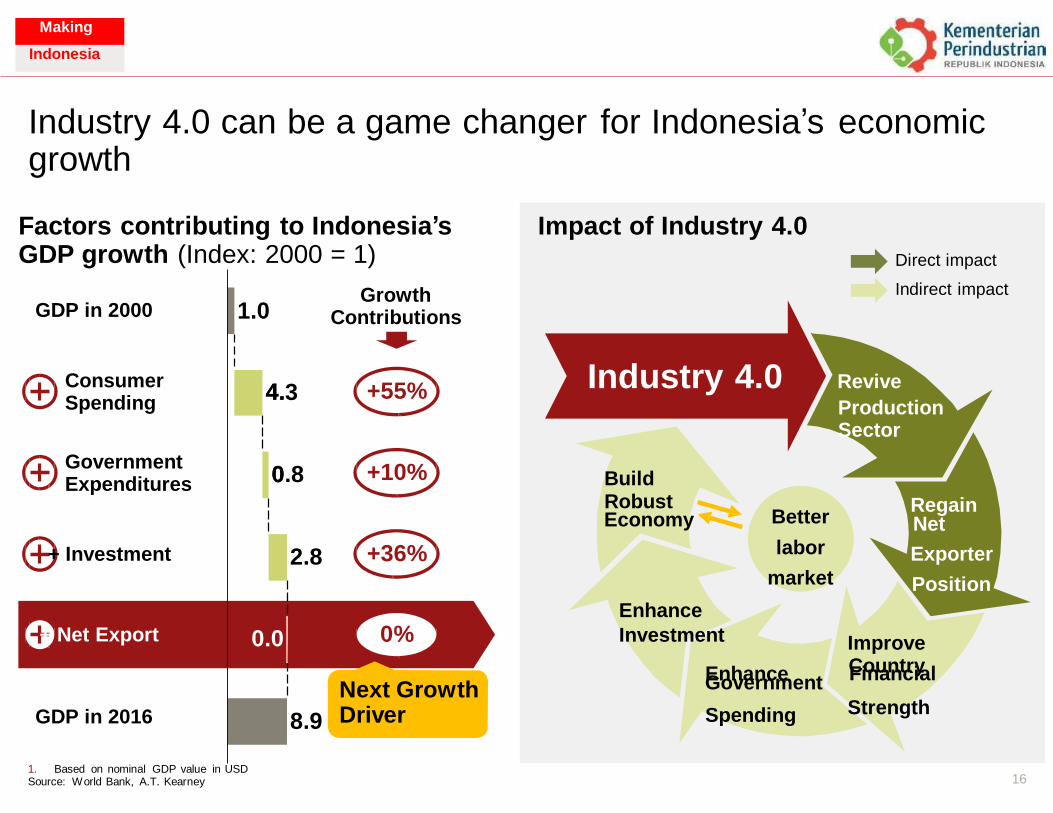
Industry 4.0 can be a game changer growth
for Indonesia’s economic
Factors contributing to Indonesia’s GDP growth (Index: 2000 = 1)
Growth Contributions GDP in 2000
Consumer Spending
+55% 4.3
Government Expenditures
+10% 0.8
Better Economy Net
+36% + Investment 2.8
0% + Net Export
Financial Government Next Growth Driver GDP in 2016 8.9
1. Based on nominal GDP value in USD 16 Source: World Bank, A.T. Kearney
1.0
4.
0
0.0
Impact of Industry 4.0
Direct impact
Indirect impact
Industry 4.0 Revive
Production Sector
Build Robust Regain
labor Exporter
market Position
Enhance
Investment Improve Enhance Country
Spending Strength
Making
Indonesia
Making
Indonesia
17
“Making Indonesia 4.0” Aspirations
Making
Indonesia
Making
Indonesia
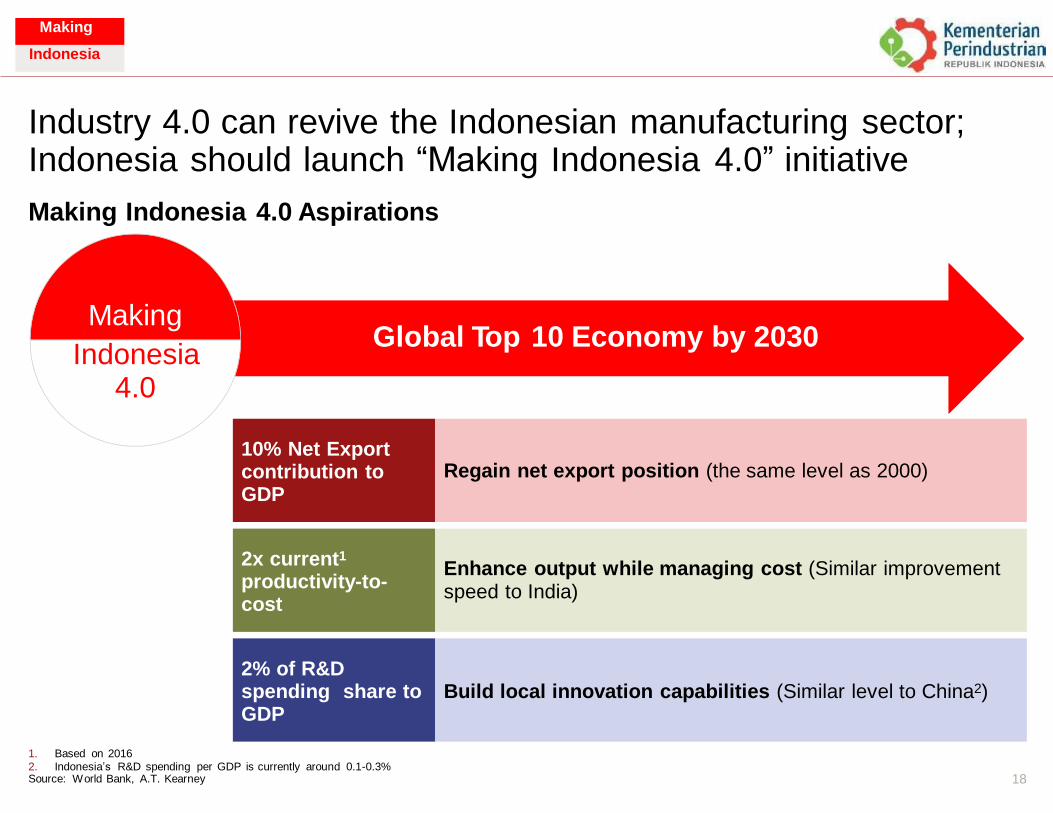
Industry 4.0 can revive the Indonesian manufacturing sector; Indonesia should launch “Making Indonesia 4.0” initiative
Making Indonesia 4.0 Aspirations
Making
Indonesia 4.0
Global Top 10 Economy by 2030
speed to India)
1. 2.
Based on 2016 Indonesia’s R&D spending per GDP is currently around 0.1-0.3%
Source: World Bank, A.T. Kearney 18
2% of R&D spending share to GDP
Build local innovation capabilities (Similar level to China2)
2x current1
productivity-to- cost
Enhance output while managing cost (Similar improvement
10% Net Export contribution to GDP
Regain net export position (the same level as 2000)
Making
Indonesia
Making
Indonesia
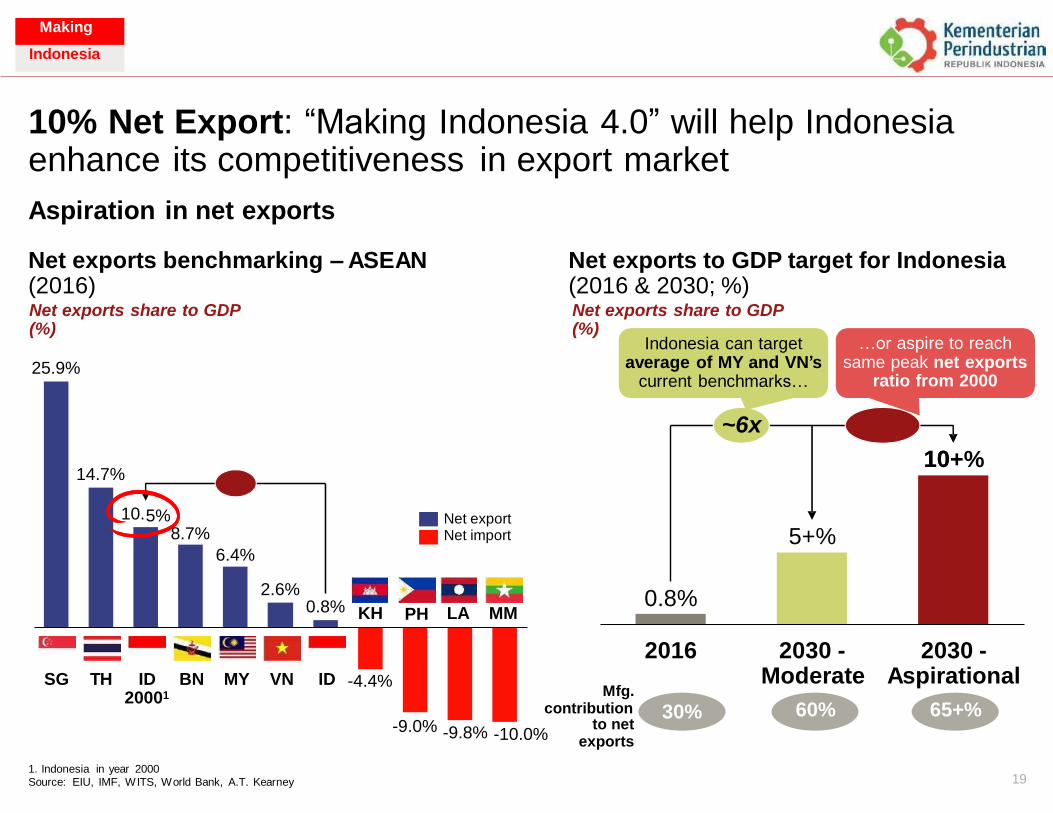
10% Net Export: “Making Indonesia 4.0” will help Indonesia enhance its competitiveness
Aspiration in net exports
in export market
Net exports benchmarking (2016) Net exports share to GDP (%)
– ASEAN Net exports to GDP target for Indonesia (2016 & 2030; %) Net exports share to GDP (%)
Indonesia can target average of MY and VN’s
current benchmarks…
…or aspire to reach same peak net exports
ratio from 2000 25.9%
~6x
10+% 14.7%
10. Net export Net import
2.6% 0.8% KH LA MM PH
2016 2030 - 2030 - Aspirational
65+%
Moderate
60%
SG TH ID 20001
BN MY VN ID -4.4% Mfg.
contribution 30% -9.0% -9.8% -10.0% to net
exports
1. Indonesia in year 2000 Source: EIU, IMF, WITS, World Bank, A.T. Kearney 19
5% 8.7%
6.4%
0.8%
10
5+%
Making
Indonesia
Making
Indonesia
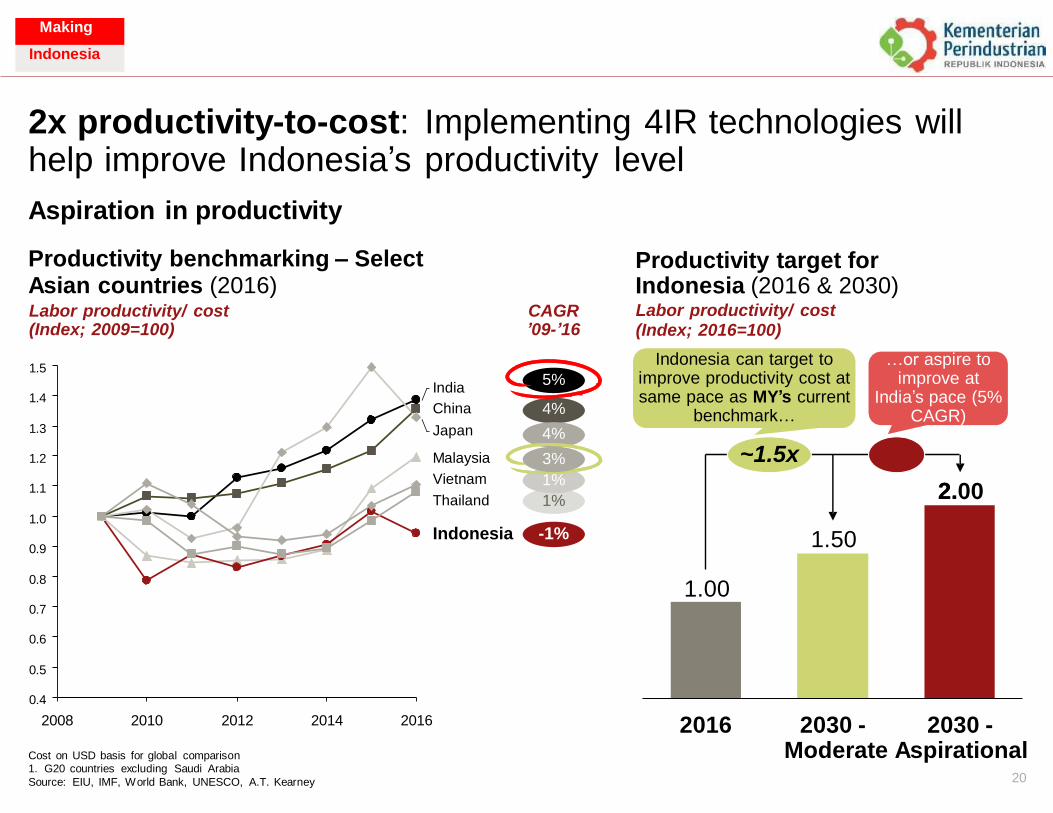
2x productivity-to-cost: Implementing 4IR technologies will help improve Indonesia’s productivity
Aspiration in productivity
Productivity benchmarking – Select Asian countries (2016)
level
Productivity target for Indonesia (2016 & 2030) Labor productivity/ cost (Index; 2016=100)
Labor productivity/ cost (Index; 2009=100)
CAGR ’09-’16
Indonesia can target to improve productivity cost at same pace as MY’s current
benchmark…
…or aspire to improve at
India’s pace (5% CAGR)
1.5 5%
4%
4%
3%
1%
1%
India
China
Japan
Malaysia
Vietnam
Thailand
1.4
1.3
~1.5x 1.2
2.00 1.1
1.0
Indonesia -1% 0.9
0.8
0.7
0.6
0.5
0.4
2008 2010 2012 2014 2016 2016 2030 - 2030 - Moderate Aspirational
20
Cost on USD basis for global comparison 1. G20 countries excluding Saudi Arabia
Source: EIU, IMF, World Bank, UNESCO, A.T. Kearney
1.00
2.
1.50
Making
Indonesia
Making
Indonesia
SG MY TH CH JP
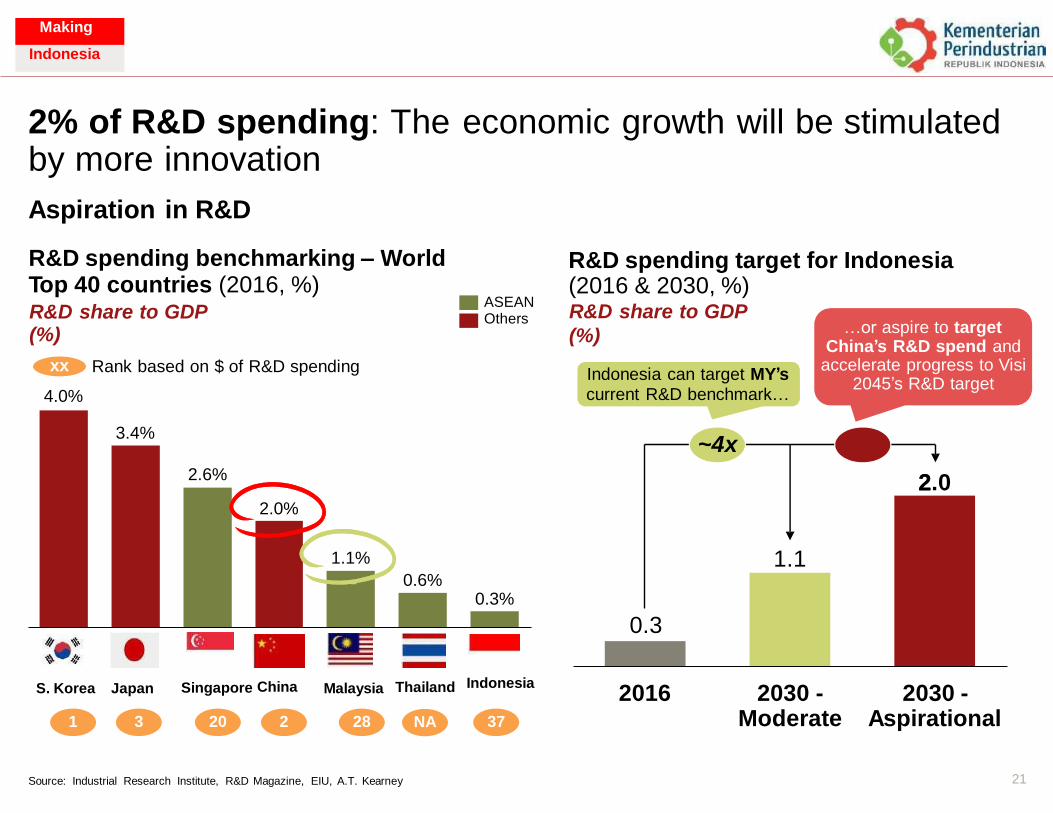
2% of R&D spending: The by more innovation
Aspiration in R&D
R&D spending benchmarking – World Top 40 countries (2016, %) R&D share to GDP (%)
economic growth will be stimulated
R&D spending target for Indonesia (2016 & 2030, %) R&D share to GDP
ASEAN Others
…or aspire to target (%)
Indonesia can target MY’s current R&D benchmark…
China’s R&D spend and accelerate progress to Visi
2045’s R&D target xx
4.0%
Rank based on $ of R&D spending
~4x
2.0
Indonesia Singapore China Thailand S. Korea Japan Malaysia 2016 2030 - 2030 - Aspirational Moderate 1 3 20 2 28 NA 37
21 Source: Industrial Research Institute, R&D Magazine, EIU, A.T. Kearney
0.3
2
1.1
3.4%
2.6%
2.0%
1.1%
0.6% 0.3%
Making
Indonesia
Making
Indonesia
22
Electronics
Food & Beverage
Textile & Beverage
Automotive
Chemical
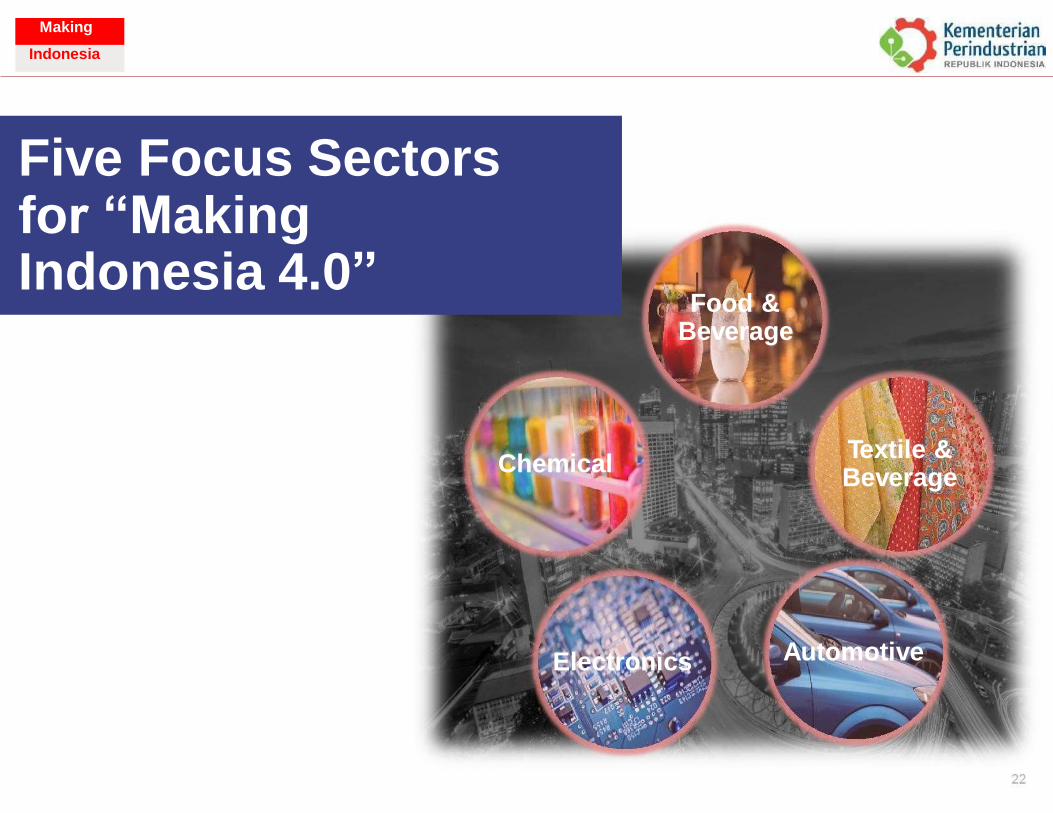
Five Focus Sectors for “Making Indonesia 4.0”
Food & Beverage
Textile & Beverage
Chemical
Automotive Electronics
Making
Indonesia
Making
Indonesia
What are the key industry engines for output and
trade?
What is the readiness level & potential disruption for our
industries?
.
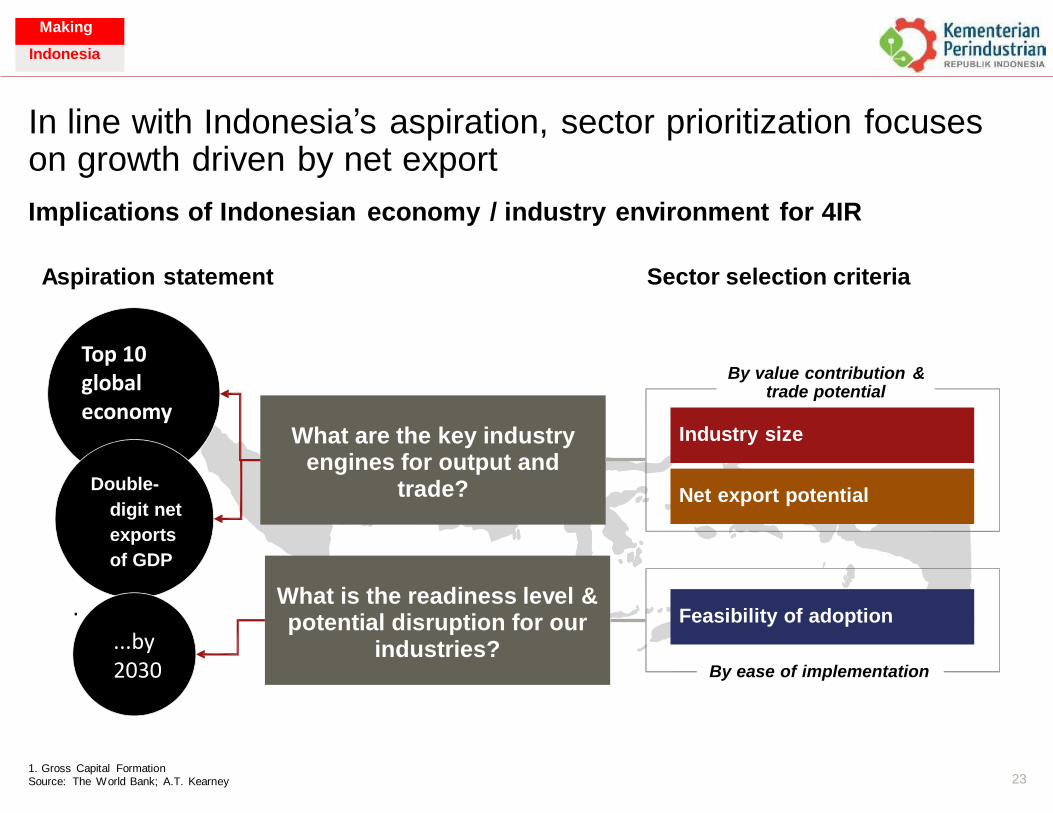
In line with Indonesia’s aspiration, sector prioritization focuses on growth driven by net export
Implications of Indonesian economy / industry environment for 4IR
Aspiration statement Sector selection criteria
By value contribution & trade potential
Double-
digit net
exports
of GDP
By ease of implementation
1. Gross Capital Formation
Source: The World Bank; A.T. Kearney 23
Feasibility of adoption
What is the readiness level & potential disruption for our
industries?
Net export potential
Industry size
What are the key industry engines for output and
trade?
Making
Indonesia
...by 2030
Top 10 global economy
Making
Indonesia
Basic Metal
Chemical
Electronics, Optics & Elect.
Appliances
Transport Equipment –
Auto
Metal Goods
Pharmaceutical and Traditional
Medicines
Tobacco
Processing
Food & Beverage
Non-Metal
Goods
Rubber & Plastic Goods
Wood & Furniture
Industrial Machinery & Equipment
Jewelry & Valuable Goods
Paper-Related
Products
Textile, Apparel & Leather
Goods
Coal, Oil & Gas
Refinery
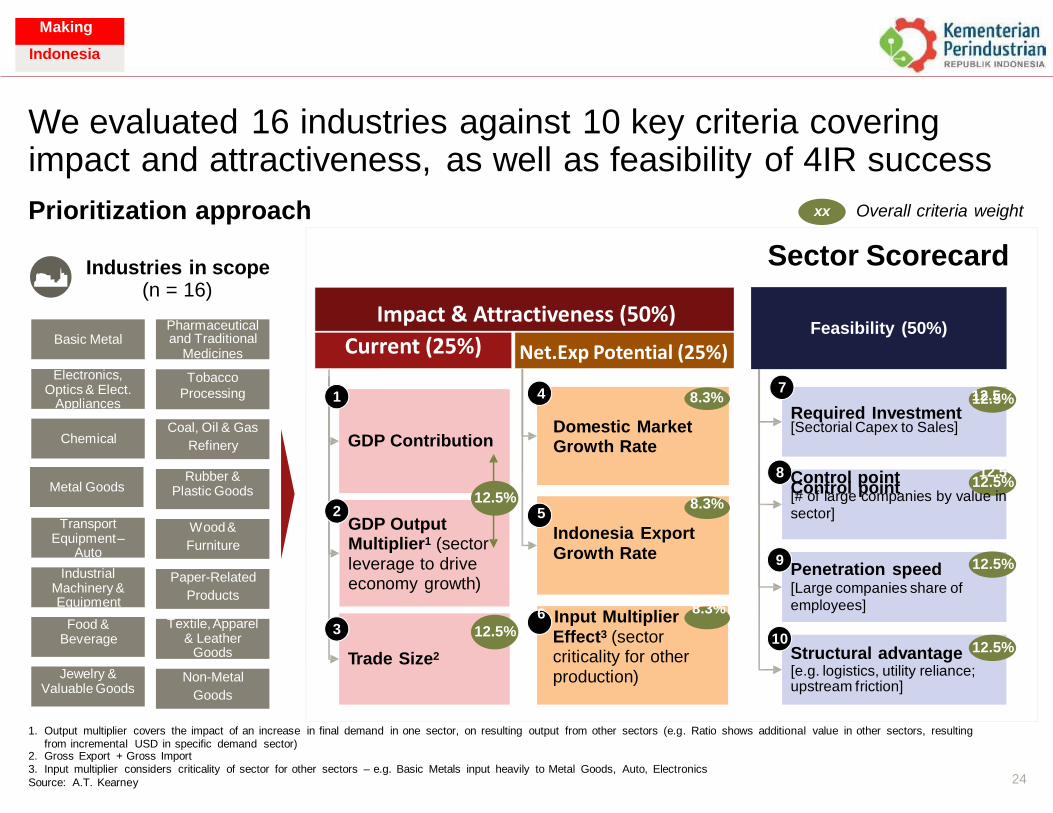
We evaluated 16 industries against 10 key criteria covering impact and attractiveness,
Prioritization approach
as well as feasibility of 4IR success
Overall criteria weight xx
Sector Scorecard Industries in scope (n = 16)
and Traditional
7 1 12.5%
Required Investment
Refinery
8 12.5% Control point
12.5% 2
GDP Output Furniture
9 12.5%
Products
3 12.5% 10
12.5%
[e.g. logistics, utility reliance;
Goods
1. Output multiplier covers the impact of an increase in final demand in one sector, on resulting output from other sectors (e.g. Ratio shows additional value in other sectors, resulting from incremental USD in specific demand sector)
2. Gross Export + Gross Import 3. Input multiplier considers criticality of sector for other sectors – e.g. Basic Metals input heavily to Metal Goods, Auto, Electronics
Source: A.T. Kearney 24
Non-Metal Jewelry & Valuable Goods
Structural advantage
upstream friction]
Textile, Apparel & Leather
Goods
Food & Beverage
Trade Size2
6 Input Multiplier 8.3%
Effect3 (sector criticality for other production)
Paper-Related Industrial Machinery & Equipment
Penetration speed [Large companies share of
employees]
Wood & Transport Equipment –
Auto
Multiplier1 (sector leverage to drive economy growth)
8.3% 5
Indonesia Export Growth Rate
Control point 12.5
[# of large companies by value in
sector]
Rubber & Plastic Goods
Metal Goods
Coal, Oil & Gas
Chemical
12.5
[Sectorial Capex to Sales]
4 8.3%
Domestic Market Growth Rate
GDP Contribution
Tobacco
Processing
Electronics, Optics & Elect.
Appliances
Basic Metal Pharmaceutical
Medicines
Feasibility (50%)
Making
Indonesia
Impact & Attractiveness (50%)
Current (25%) Net.Exp Potential (25%)
Making
Indonesia
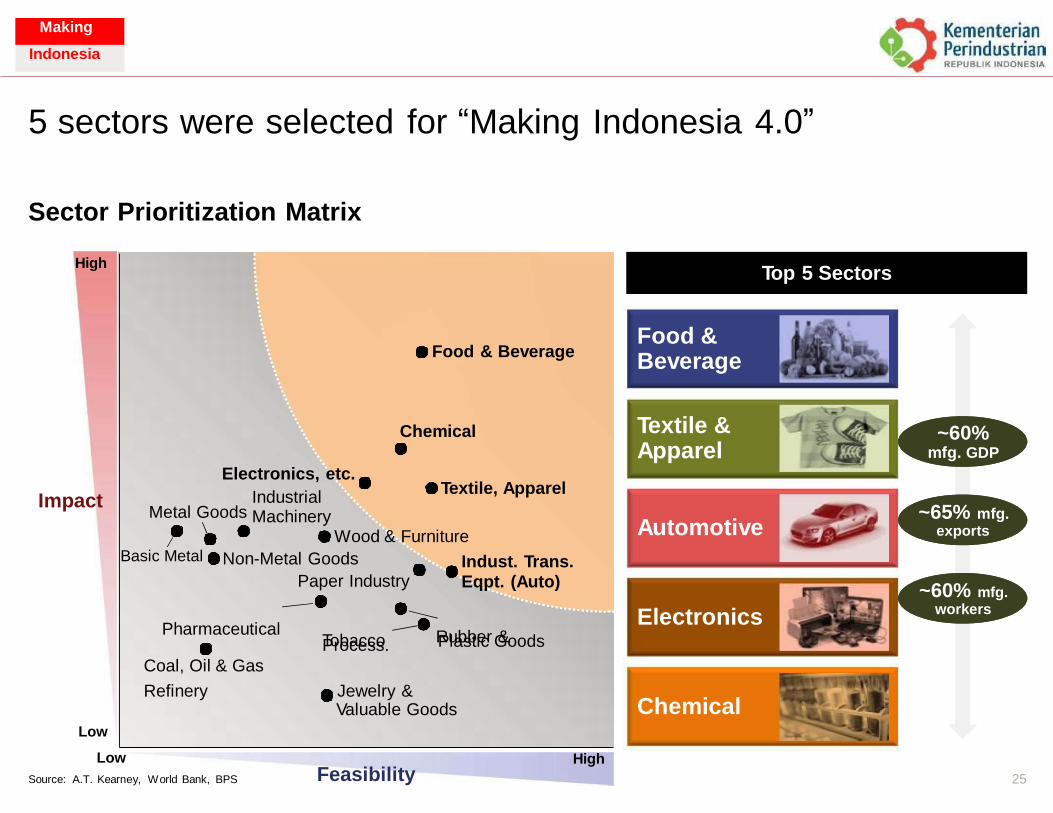
Top 5 Sectors
5 sectors were selected for “Making Indonesia 4.0”
Sector Prioritization Matrix
High
Food & Beverage
Textile & Apparel
~60% mfg. GDP
Impact ~65% mfg.
exports Automotive
~60% mfg. workers Electronics
Plastic Goods Process.
Chemical Low
Low
Source: A.T. Kearney, World Bank, BPS
High
Feasibility 25
Food & Beverage
Chemical
Electronics, etc. Industrial
Textile, Apparel Metal Goods Machinery
Wood & Furniture Basic Metal Non-Metal Goods Indust. Trans.
Paper Industry Eqpt. (Auto)
Pharmaceutical Tobacco Rubber &
Coal, Oil & Gas
Refinery Jewelry & Valuable Goods
Top 5 Sectors
Making
Indonesia
Making
Indonesia
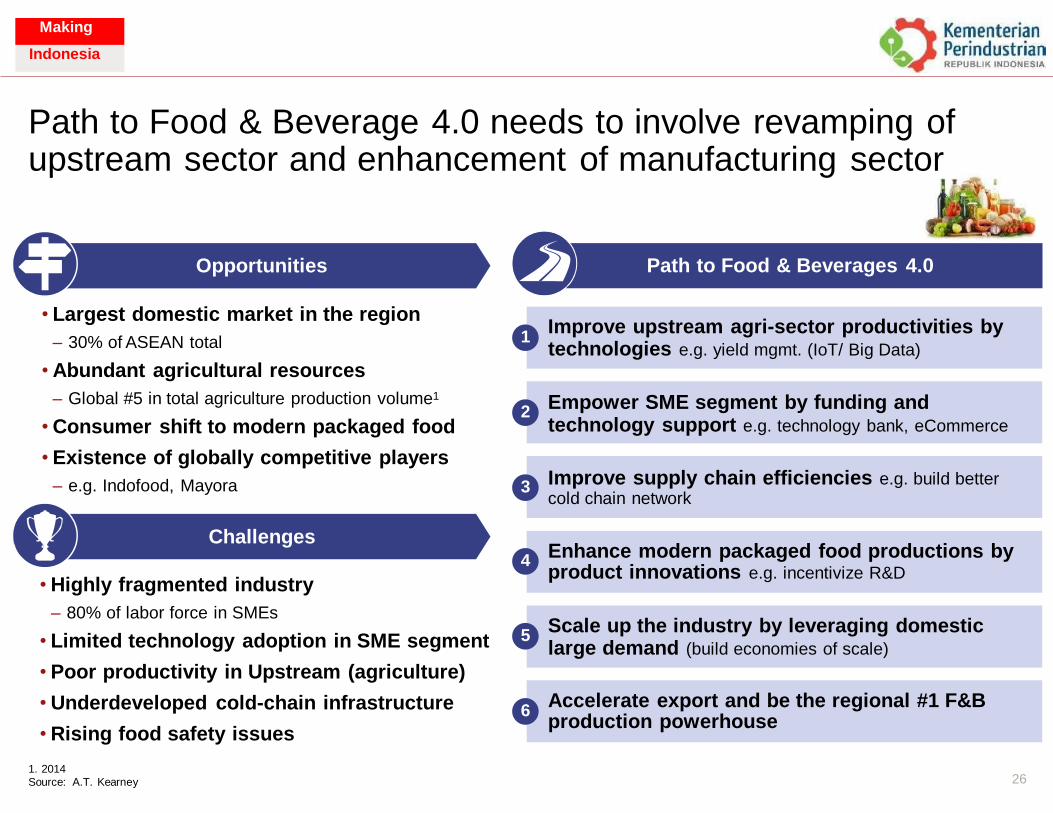
Improve upstream agri-sector productivities by technologies e.g. yield mgmt. (IoT/ Big Data)
Empower SME segment by funding and technology support e.g. technology bank, eCommerce
Improve supply chain efficiencies e.g. build better
cold chain network
Enhance modern packaged food productions by product innovations e.g. incentivize R&D
Scale up the industry by leveraging domestic large demand (build economies of scale)
Accelerate export and be the regional #1 F&B
production powerhouse
Path to Food & Beverage 4.0 needs to involve revamping of upstream sector and enhancement of manufacturing sector
Opportunities
• Largest domestic market in the region
– 30% of ASEAN total
• Abundant agricultural resources
– Global #5 in total agriculture production volume1
• Consumer shift to modern packaged food
• Existence of globally competitive players
– e.g. Indofood, Mayora
1 technologies e.g. yield mgmt. (IoT/ Big Data)
2
Improve supply chain efficiencies e.g. build better 3
Challenges Enhance modern packaged food productions by
4
• Highly fragmented industry
– 80% of labor force in SMEs
• Limited technology adoption in SME segment
• Poor productivity in Upstream (agriculture)
• Underdeveloped cold-chain infrastructure
• Rising food safety issues
1. 2014 Source: A.T. Kearney
5 large demand (build economies of scale)
Accelerate export and be the regional #1 F&B 6
26
production powerhouse
Scale up the industry by leveraging domestic
product innovations e.g. incentivize R&D
cold chain network
Empower SME segment by funding and technology support e.g. technology bank, eCommerce
Improve upstream agri-sector productivities by
Path to Food & Beverages 4.0
Making
Indonesia
Making
Indonesia
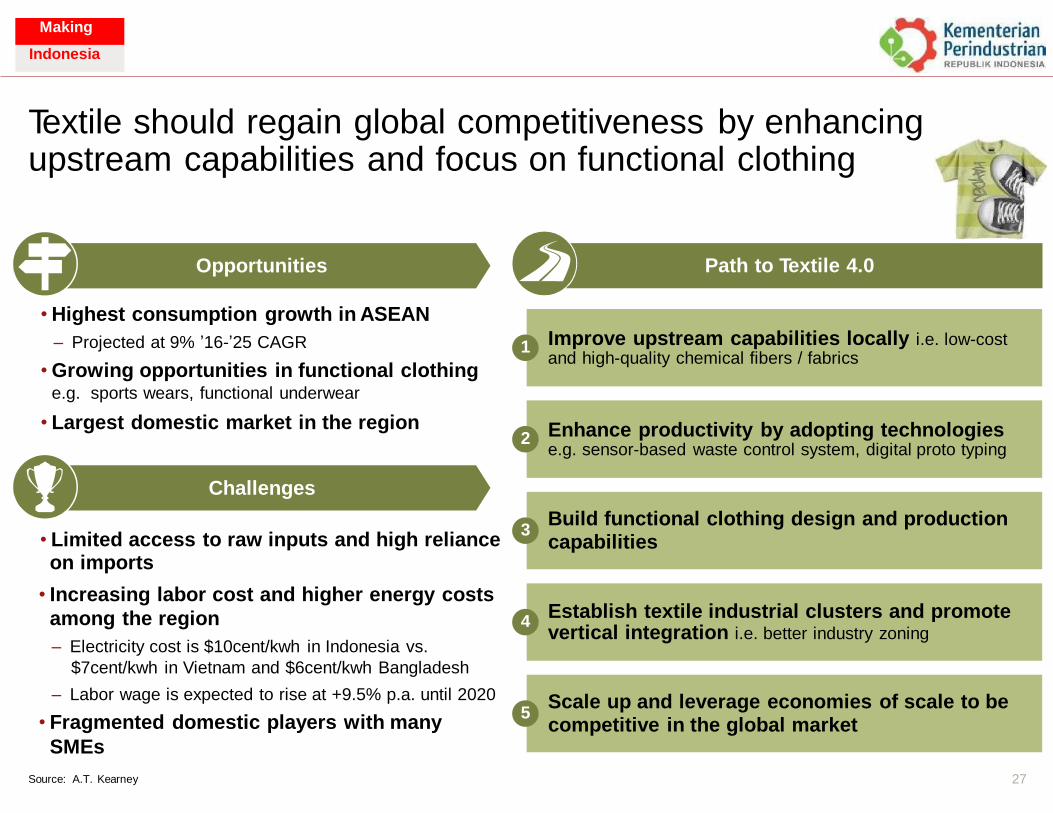
Improve upstream capabilities locally i.e. low-cost
and high-quality chemical fibers / fabrics
Enhance productivity by adopting technologies e.g. sensor-based waste control system, digital proto typing
Build functional clothing design and production capabilities
Scale up and leverage economies of scale to be competitive in the global market
Establish textile industrial clusters and promote vertical integration i.e. better industry zoning
Textile should regain global competitiveness by enhancing upstream capabilities and focus on functional clothing
Opportunities
• Highest consumption growth in ASEAN
– Projected at 9% ’16-’25 CAGR
• Growing opportunities in functional clothing e.g. sports wears, functional underwear
• Largest domestic market in the region
Improve upstream capabilities locally i.e. low-cost 1
Enhance productivity by adopting technologies 2
Challenges
3 • Limited access to raw inputs and high reliance on imports
• Increasing labor cost and higher energy costs
among the region
– Electricity cost is $10cent/kwh in Indonesia vs.
$7cent/kwh in Vietnam and $6cent/kwh Bangladesh
– Labor wage is expected to rise at +9.5% p.a. until 2020
• Fragmented domestic players with many
SMEs
Source: A.T. Kearney
capabilities
Establish textile industrial clusters and promote 4
5 competitive in the global market
27
Scale up and leverage economies of scale to be
vertical integration i.e. better industry zoning
Build functional clothing design and production
e.g. sensor-based waste control system, digital proto typing
and high-quality chemical fibers / fabrics
Path to Textile 4.0
Making
Indonesia
Making
Indonesia
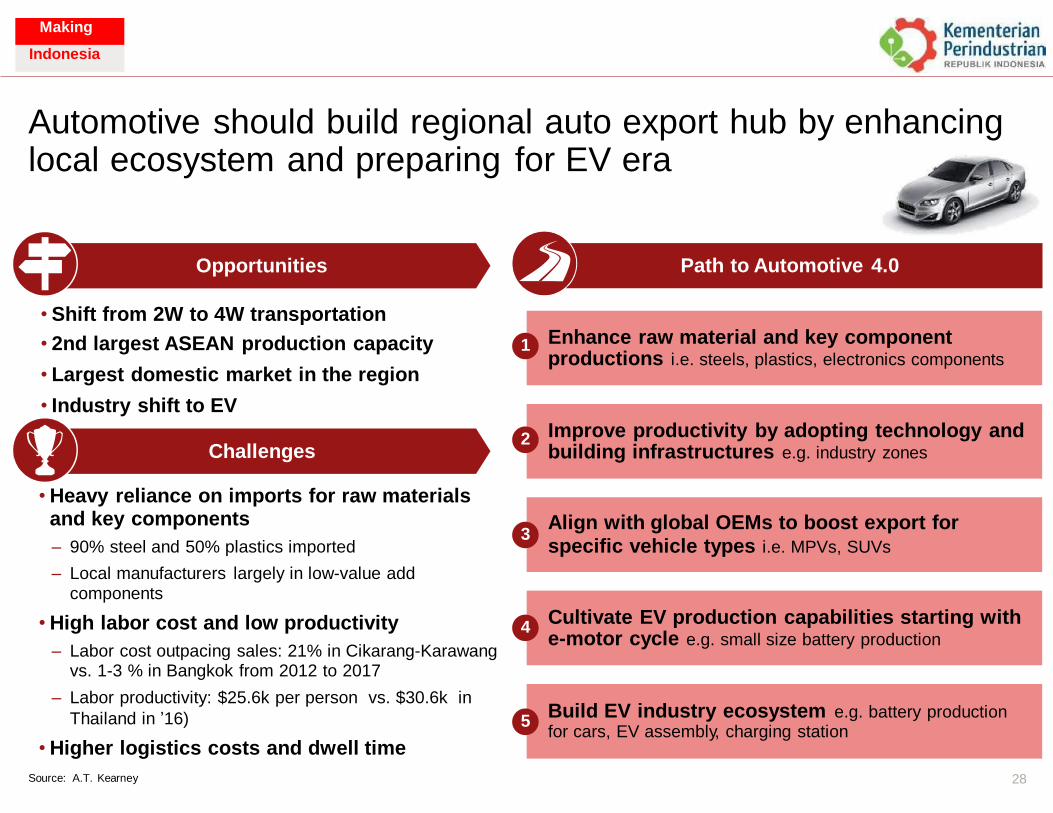
Enhance raw material and key component productions i.e. steels, plastics, electronics components
Improve productivity by adopting technology and building infrastructures e.g. industry zones
Align with global OEMs to boost export for specific vehicle types i.e. MPVs, SUVs
Cultivate EV production capabilities starting with e-motor cycle e.g. small size battery production
Build EV industry ecosystem e.g. battery production
for cars, EV assembly, charging station
Automotive should build regional auto export hub by enhancing local ecosystem and preparing for EV era
Opportunities
• Shift from 2W to 4W transportation
• 2nd largest ASEAN production capacity
• Largest domestic market in the region
• Industry shift to EV
Enhance raw material and key component 1
Improve productivity by adopting technology and 2 Challenges
• Heavy reliance on imports for raw materials and key components
– 90% steel and 50% plastics imported
– Local manufacturers largely in low-value add components
• High labor cost and low productivity
– Labor cost outpacing sales: 21% in Cikarang-Karawang vs. 1-3 % in Bangkok from 2012 to 2017
– Labor productivity: $25.6k per person vs. $30.6k in
Thailand in ’16)
• Higher logistics costs and dwell time
Source: A.T. Kearney
3 specific vehicle types i.e. MPVs, SUVs
Cultivate EV production capabilities starting with 4
5 for cars, EV assembly, charging station
28
Build EV industry ecosystem e.g. battery production
e-motor cycle e.g. small size battery production
Align with global OEMs to boost export for
building infrastructures e.g. industry zones
productions i.e. steels, plastics, electronics components
Path to Automotive 4.0
Making
Indonesia
Making
Indonesia
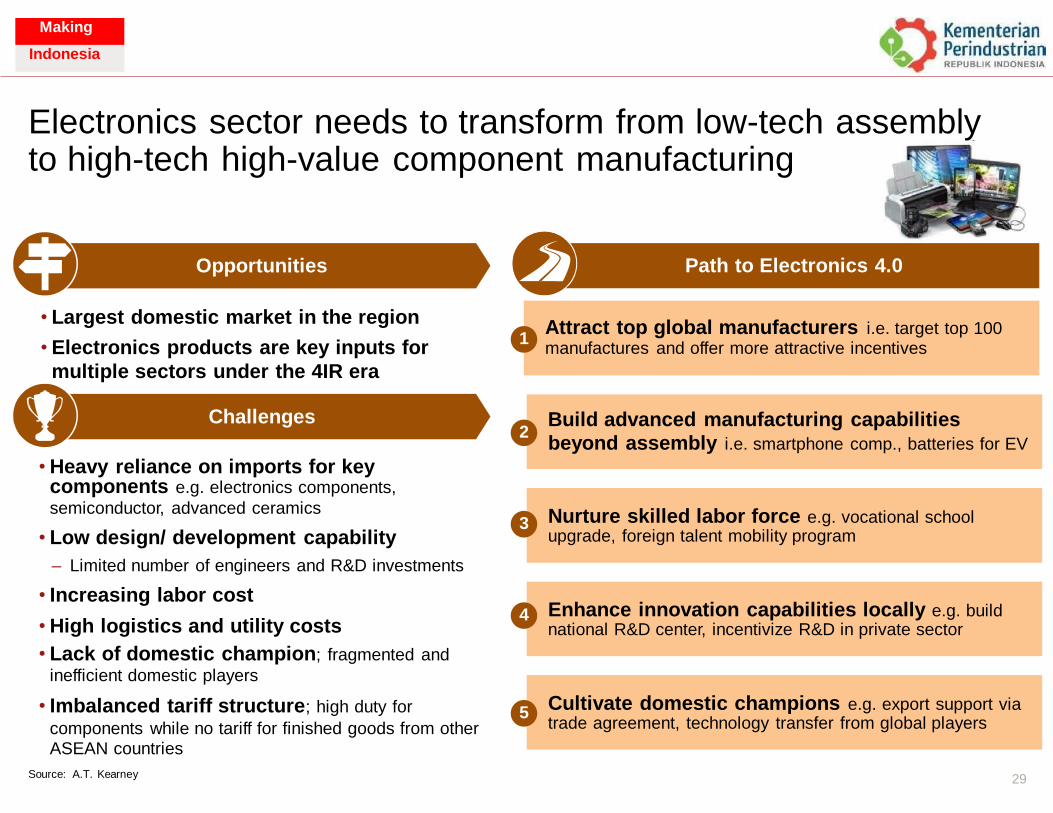
Build advanced manufacturing capabilities beyond assembly i.e. smartphone comp., batteries for EV
Attract top global manufacturers i.e. target top 100
manufactures and offer more attractive incentives
Nurture skilled labor force e.g. vocational school
upgrade, foreign talent mobility program
Cultivate domestic champions e.g. export support via
trade agreement, technology transfer from global players
Enhance innovation capabilities locally e.g. build
national R&D center, incentivize R&D in private sector
Electronics sector needs to transform from low-tech assembly to high-tech high-value component manufacturing
Opportunities
• Largest domestic market in the region
• Electronics products are key inputs for
multiple sectors under the 4IR era
1 manufactures and offer more attractive incentives
Challenges 2
beyond assembly i.e. smartphone comp., batteries for EV
• Heavy reliance on imports for key components e.g. electronics components,
semiconductor, advanced ceramics
• Low design/ development capability
– Limited number of engineers and R&D investments
• Increasing labor cost
• High logistics and utility costs
• Lack of domestic champion; fragmented and
inefficient domestic players
• Imbalanced tariff structure; high duty for
components while no tariff for finished goods from other ASEAN countries
Source: A.T. Kearney
Nurture skilled labor force e.g. vocational school 3
Enhance innovation capabilities locally e.g. build 4
Cultivate domestic champions e.g. export support via 5
29
trade agreement, technology transfer from global players
national R&D center, incentivize R&D in private sector
upgrade, foreign talent mobility program
Build advanced manufacturing capabilities
Attract top global manufacturers i.e. target top 100
Path to Electronics 4.0
Making
Indonesia
Making
Indonesia
Enhance domestic petrochemical capacity and reduce reliance on imports
Optimize industrial zones to leverage domestic natural gas and oil resources
Accelerate R&D activities to establish next- generation biofuel and bioplastic capabilities
Improve productivity by adopting 4IR
technologies e.g. Asset mgmt., Resource mgmt.
Build an export position by leveraging economies of scale
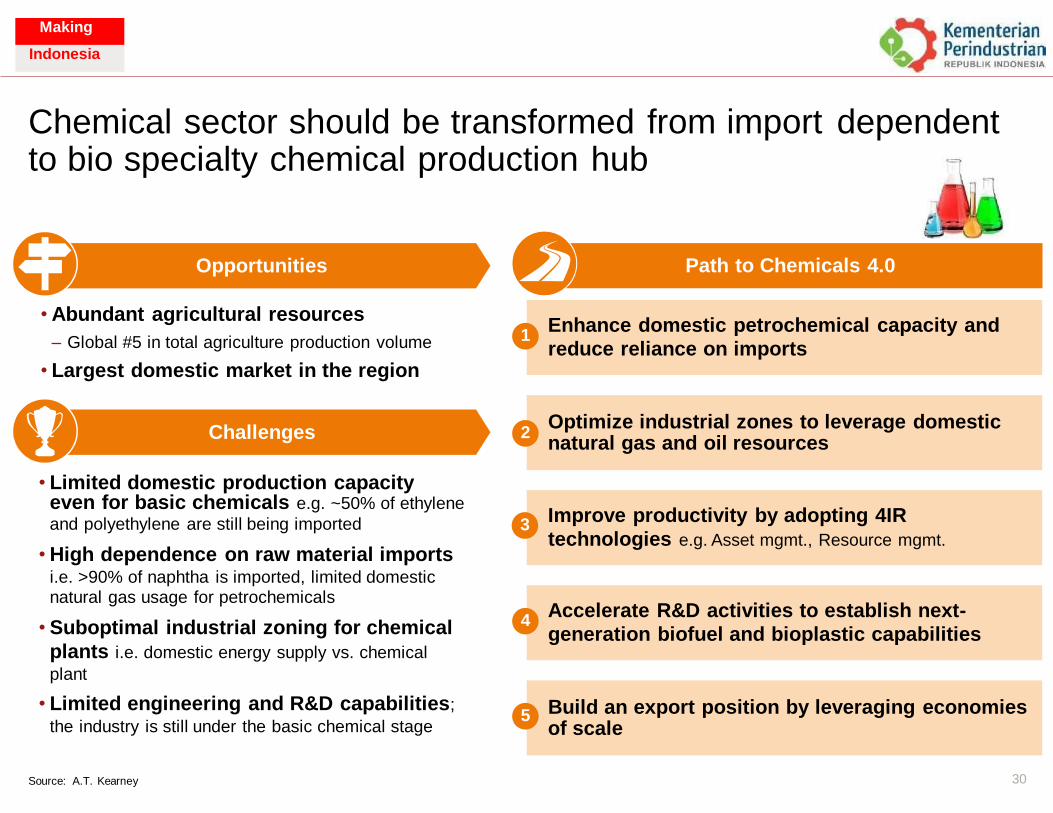
Chemical sector should be transformed from import to bio specialty chemical production hub
dependent
Opportunities
• Abundant agricultural resources
– Global #5 in total agriculture production volume
• Largest domestic market in the region
1 reduce reliance on imports
Optimize industrial zones to leverage domestic Challenges 2
• Limited domestic production capacity even for basic chemicals e.g. ~50% of ethylene
and polyethylene are still being imported
• High dependence on raw material imports i.e. >90% of naphtha is imported, limited domestic natural gas usage for petrochemicals
• Suboptimal industrial zoning for chemical
plants i.e. domestic energy supply vs. chemical
plant
• Limited engineering and R&D capabilities;
the industry is still under the basic chemical stage
3 technologies e.g. Asset mgmt., Resource mgmt.
4 generation biofuel and bioplastic capabilities
Build an export position by leveraging economies 5
30 Source: A.T. Kearney
of scale
Accelerate R&D activities to establish next-
Improve productivity by adopting 4IR
natural gas and oil resources
Enhance domestic petrochemical capacity and
Path to Chemicals 4.0
Making
Indonesia
Making
Indonesia
31
10 NationalPriorities for Indon
Making esia 4.0”
Making
Indonesia
Making
Indonesia
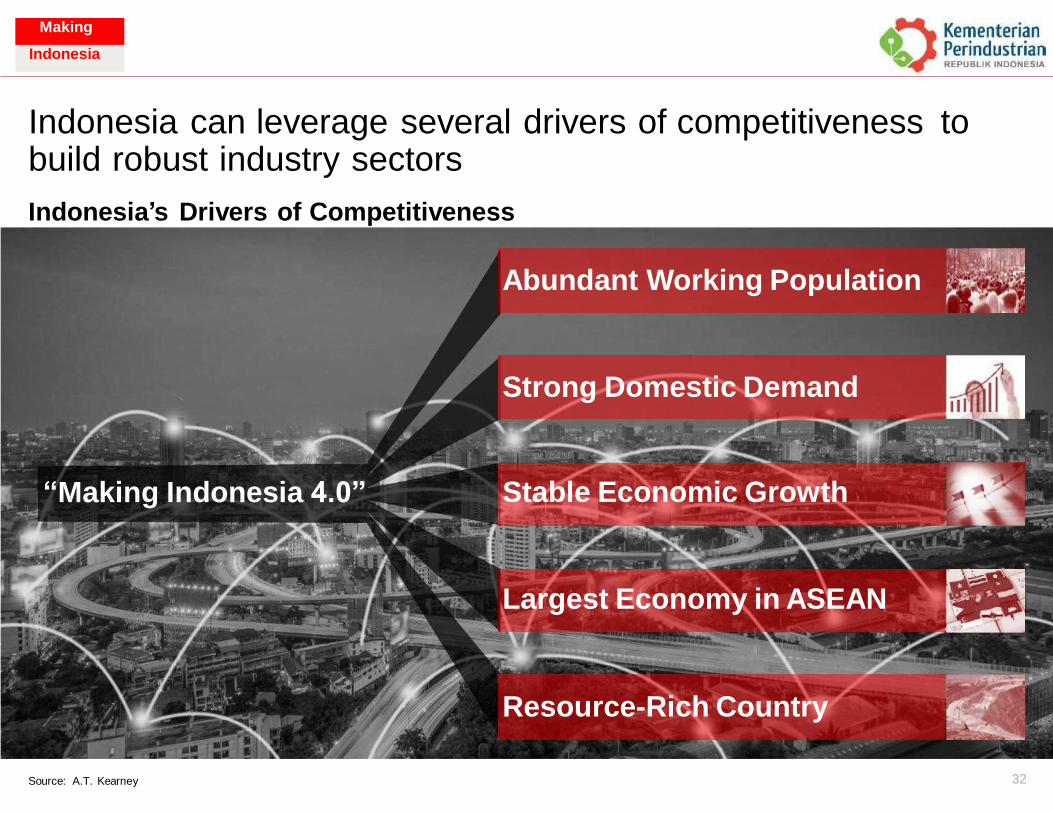
Indonesia can leverage several drivers of competitiveness build robust industry sectors
to
Indonesia’s Drivers of Competitiveness
Abundant Working Population
Strong Domestic Demand
“Making Indonesia 4.0” Stable Economic Growth
Largest Economy in ASEAN
Resource-Rich Country
32 Source: A.T. Kearney
Making
Indonesia
Making
Indonesia
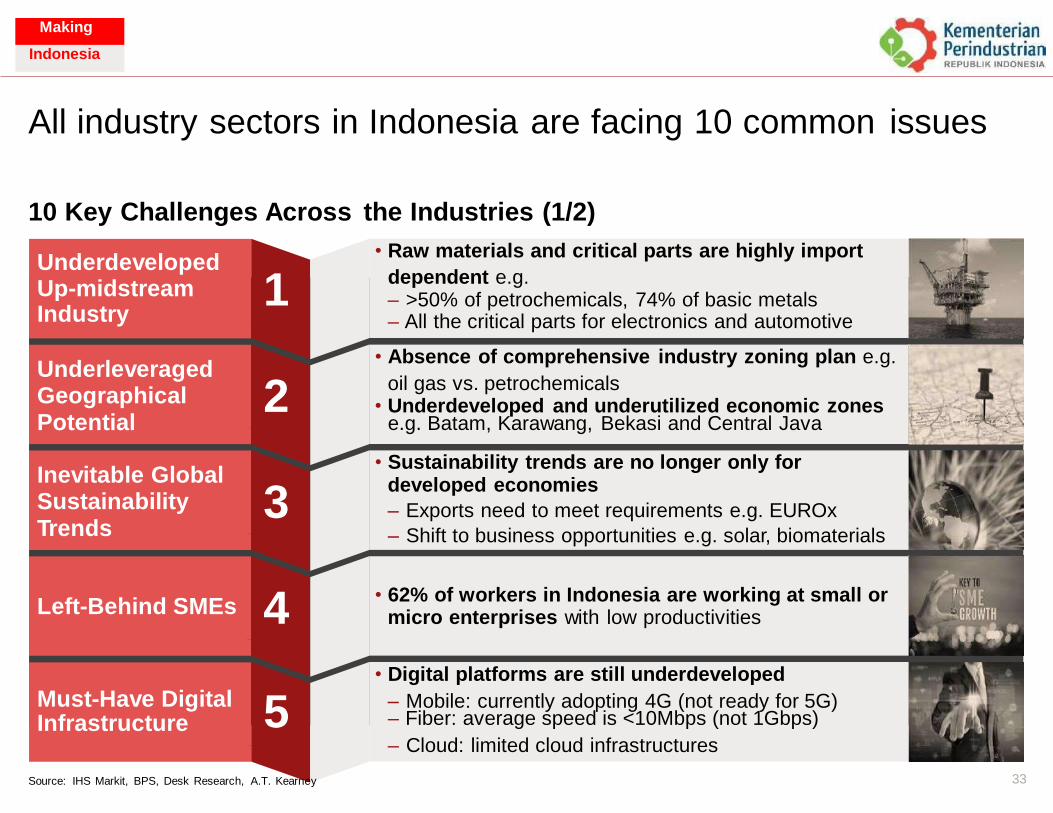
All industry sectors in Indonesia are facing 10 common issues
10 Key Challenges Across the Industries (1/2)
– >50% of petrochemicals, 74% of basic metals
oil gas vs. petrochemicals • Underdeveloped and underutilized economic zones
developed economies
– Exports need to meet requirements e.g. EUROx
micro enterprises with low productivities
– Mobile: currently adopting 4G (not ready for 5G)
33 Source: IHS Markit, BPS, Desk Research, A.T. Kearney
• 62% of workers in Indonesia are working at small or
• Sustainability trends are no longer only for
– Shift to business opportunities e.g. solar, biomaterials
• Absence of comprehensive industry zoning plan e.g.
e.g. Batam, Karawang, Bekasi and Central Java
Underdeveloped • Raw materials and critical parts are highly import
Up-midstream Industry
1 dependent e.g.
– All the critical parts for electronics and automotive
Underleveraged Geographical Potential
2
Inevitable Global Sustainability Trends
3
Left-Behind SMEs
4
Must-Have Digital Infrastructure
5 • Digital platforms are still underdeveloped
– Fiber: average speed is <10Mbps (not 1Gbps)
– Cloud: limited cloud infrastructures
Making
Indonesia
Making
Indonesia
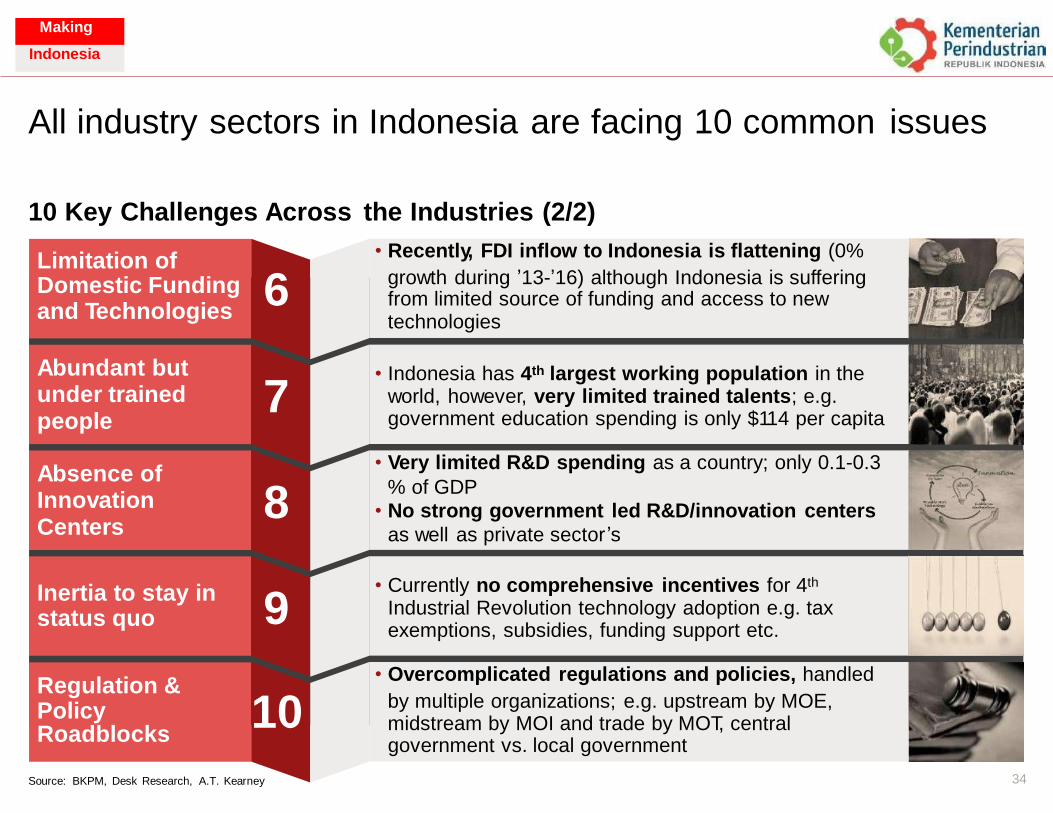
All industry sectors in Indonesia are facing 10 common issues
10 Key Challenges Across the Industries (2/2)
growth during ’13-’16) although Indonesia is suffering
technologies
7
% of GDP
8
9
by multiple organizations; e.g. upstream by MOE, midstream by MOI and trade by MOT, central
34 Source: BKPM, Desk Research, A.T. Kearney
• Currently no comprehensive incentives for 4th
Industrial Revolution technology adoption e.g. tax exemptions, subsidies, funding support etc.
• Very limited R&D spending as a country; only 0.1-0.3
• No strong government led R&D/innovation centers
as well as private sector ’s
• Indonesia has 4th largest working population in the world, however, very limited trained talents; e.g. government education spending is only $114 per capita
Limitation of • Recently, FDI inflow to Indonesia is flattening (0%
Domestic Funding and Technologies
6
from limited source of funding and access to new
Abundant but under trained people
Absence of Innovation Centers
Inertia to stay in status quo
Regulation & Policy
10 • Overcomplicated regulations and policies, handled
Roadblocks
government vs. local government
Making
Indonesia
Making
Indonesia
Reform Material Flow
Redesign Industrial Zones
Embrace sustainability
Empower SMEs
Build Nationwide Digital Infrastructure
Attract Foreign Investments
Upgrade Human Capital
Establish Innovation Ecosystem
Incentivize Technology Investment
Reoptimize Regulations & Policies
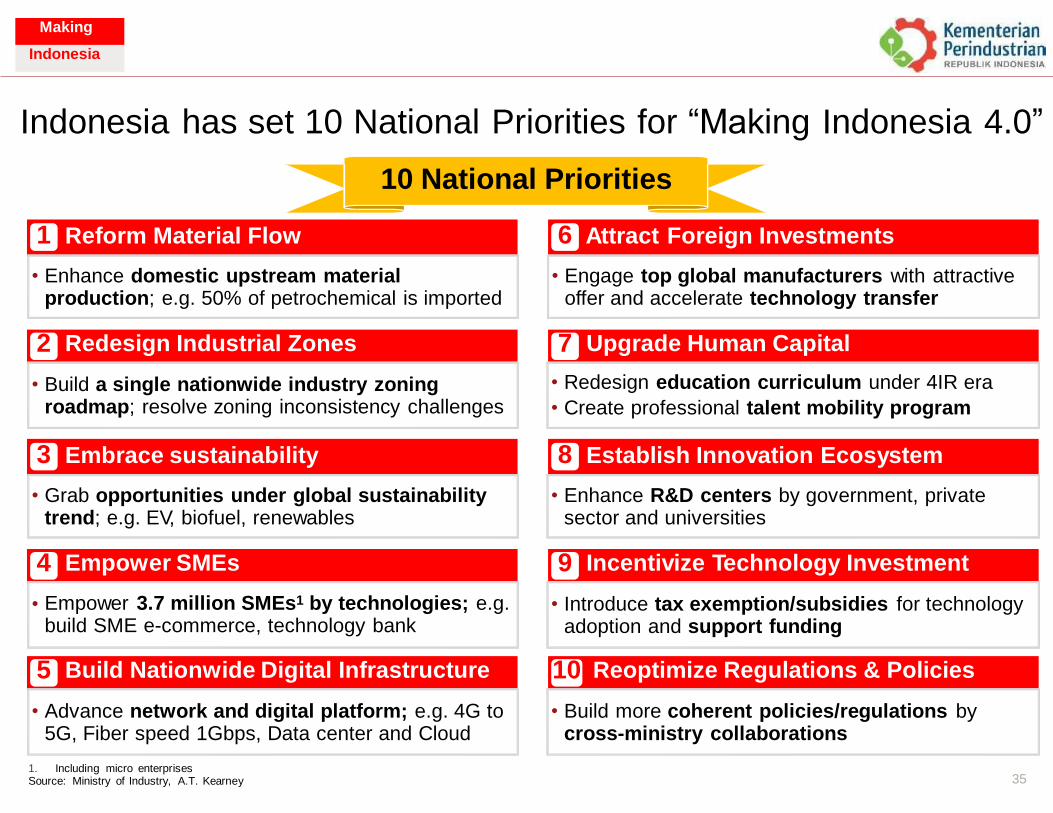
Indonesia has set 10 National Priorities for “Making Indonesia 4.0”
10 National Priorities
• Enhance domestic upstream material production; e.g. 50% of petrochemical is imported
• Engage top global manufacturers with attractive offer and accelerate technology transfer
•
•
Redesign education curriculum under 4IR era
Create professional talent mobility program • Build a single nationwide industry zoning
roadmap; resolve zoning inconsistency challenges
• Grab opportunities under global sustainability trend; e.g. EV, biofuel, renewables
• Enhance R&D centers by government, private sector and universities
Empower 3.7 million SMEs1 by technologies; e.g. build SME e-commerce, technology bank
• • Introduce tax exemption/subsidies for technology adoption and support funding
• Advance network and digital platform; e.g. 4G to 5G, Fiber speed 1Gbps, Data center and Cloud
• Build more coherent policies/regulations by cross-ministry collaborations
1. Including micro enterprises 35 Source: Ministry of Industry, A.T. Kearney
5 Build Nationwide Digital Infrastructure 10 Reoptimize Regulations & Policies
4 Empower SMEs 9 Incentivize Technology Investment
3 Embrace sustainability 8 Establish Innovation Ecosystem
2 Redesign Industrial Zones 7 Upgrade Human Capital
1 Reform Material Flow 6 Attract Foreign Investments
Making
Indonesia
Making
Indonesia
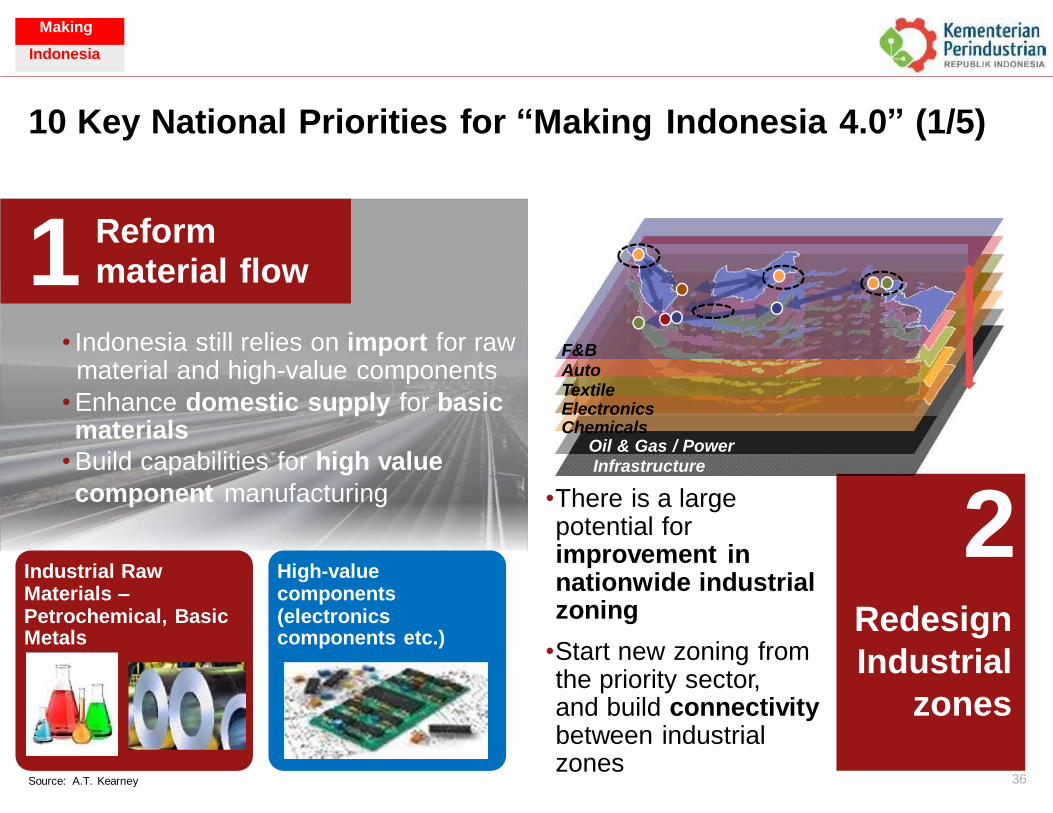
10 Key National Priorities for “Making Indonesia 4.0” (1/5)
1 Reform material flow
• Indonesia still relies on import for raw material and high-value components
• Enhance domestic supply for basic materials
• Build capabilities for high value
F&B Auto Textile Electronics Chemicals
Oil & Gas / Power Infrastructure
•There is a large potential for improvement in nationwide industrial zoning
•Start new zoning from the priority sector, and build connectivity between industrial zones
component manufacturing
Industrial Raw Materials – Petrochemical, Basic Metals
High-value components (electronics components etc.)
36 Source: A.T. Kearney
2 Redesign
Industrial
zones
Making
Indonesia
Making
Indonesia
Low Carbon Emission Vehicle
EV and their components
Electric and fuel cell motorcycles
Biofuel- and gas-powered vehicles
Encourage bioplastic uses
Increase min. biofuel content in gasoline
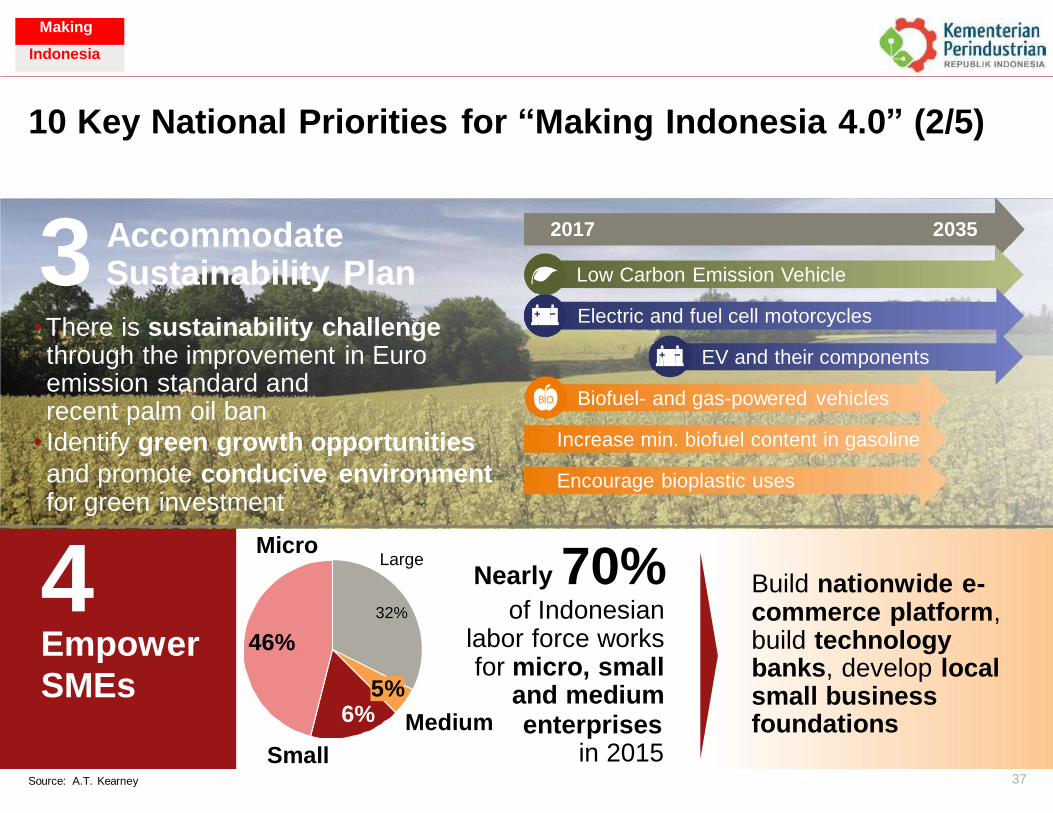
10 Key National Priorities for “Making Indonesia 4.0” (2/5)
3 Accommodate
2017 2035
Sustainability Plan Low Carbon Emission Vehicle
Electric and fuel cell motorcycles • There is sustainability challenge through the improvement in Euro emission standard and recent palm oil ban
• Identify green growth opportunities
EV and their components
Biofuel- and gas-powered vehicles
Increase min. biofuel content in gasoline
and promote conducive environment Encourage bioplastic uses for green investment
Micro
4 Empower SMEs
Nearly 70% of Indonesian
labor force works for micro, small
and medium
Large
Build nationwide e- commerce platform, build technology banks, develop local small business foundations
32%
46%
6% Medium enterprises in 2015 Small
37 Source: A.T. Kearney
5%
Making
Indonesia
Making
Indonesia
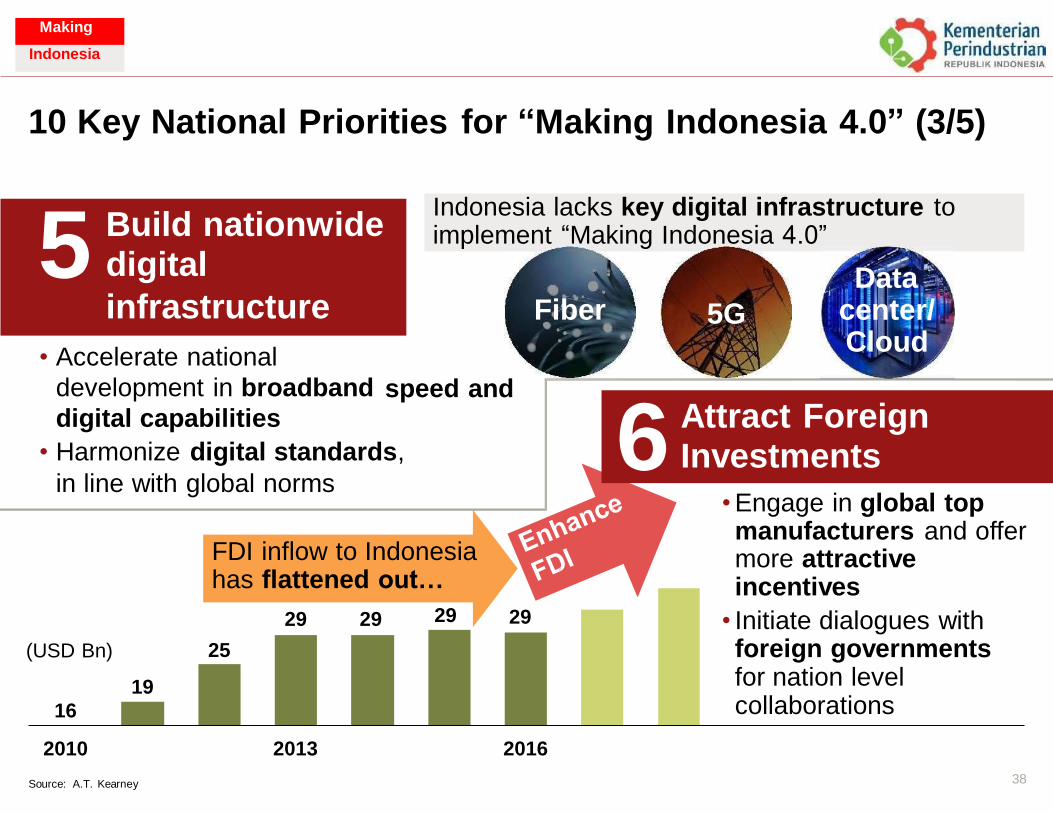
Indonesia lacks key digital infrastructure to implement “Making Indonesia 4.0”
10 Key National Priorities for “Making Indonesia 4.0” (3/5)
5 Build nationwide digital
infrastructure Data
center/ Cloud
Fiber 5G
• Accelerate national
development in broadband
digital capabilities speed and
6 Attract Foreign Investments • Harmonize digital standards,
in line with global norms • Engage in global top manufacturers and offer more attractive incentives
FDI has
inflow to Indonesia flattened out…
(USD Bn) 25
2010
Source: A.T. Kearney
2013 2016
38
• Initiate dialogues with foreign governments for nation level collaborations
29 29 29 29
19
16
Indonesia lacks key digital infrastructure to implement “Making Indonesia 4.0”
Making
Indonesia
Making
Indonesia
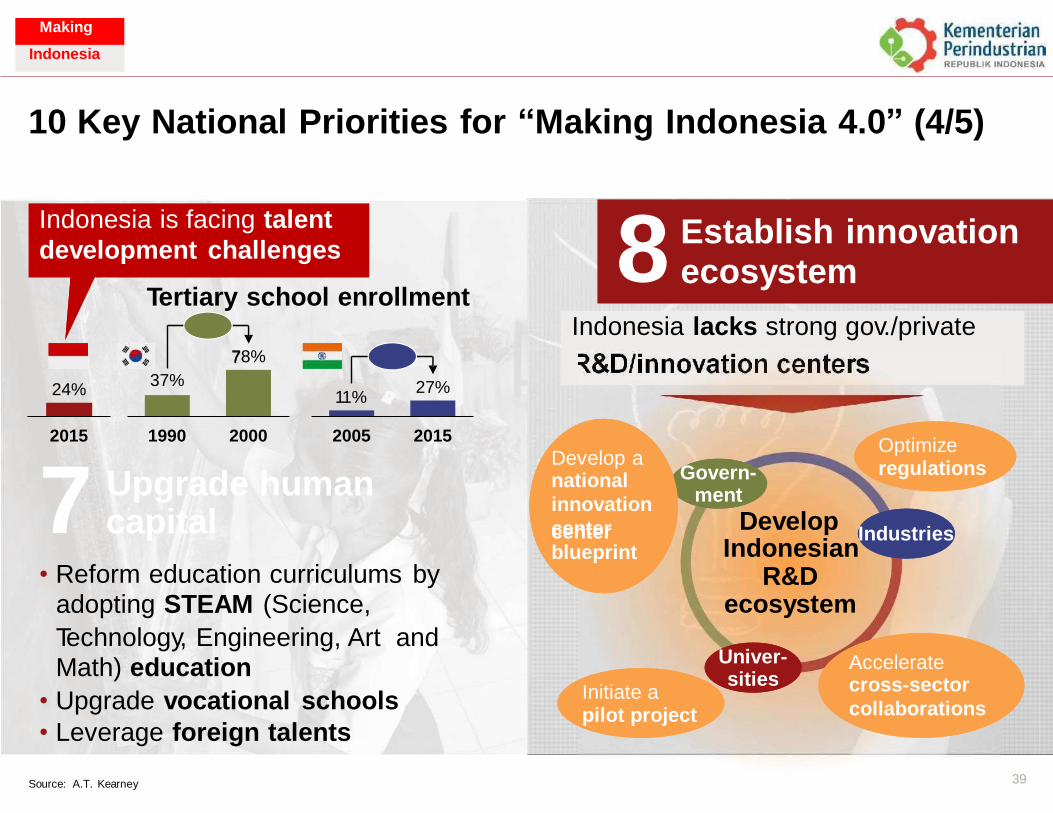
Indonesia is facing talent
development challenges
Indonesia lacks strong gov./private
R&D/innovation centers &D/innovation centers
10 Key National Priorities for “Making Indonesia 4.0” (4/5)
8 Establish innovation ecosystem
Tertiary school enrollment
78%
27% 24% 11%
2015 1990 2000 2005 2015 Optimize regulations
Develop a national
innovation
center
blueprint
7 Upgrade human
Govern- ment
Develop capital center Industries Indonesian
R&D ecosystem
• Reform education curriculums adopting STEAM (Science,
by
Technology, Engineering, Art Math) education
and Univer- sities
Accelerate cross-sector
collaborations Initiate a pilot project
• Upgrade vocational schools
• Leverage foreign talents
39 Source: A.T. Kearney
37%
7
Indonesia lacks strong gov./private
Indonesia is facing talent
development challenges
Making
Indonesia
Making
Indonesia
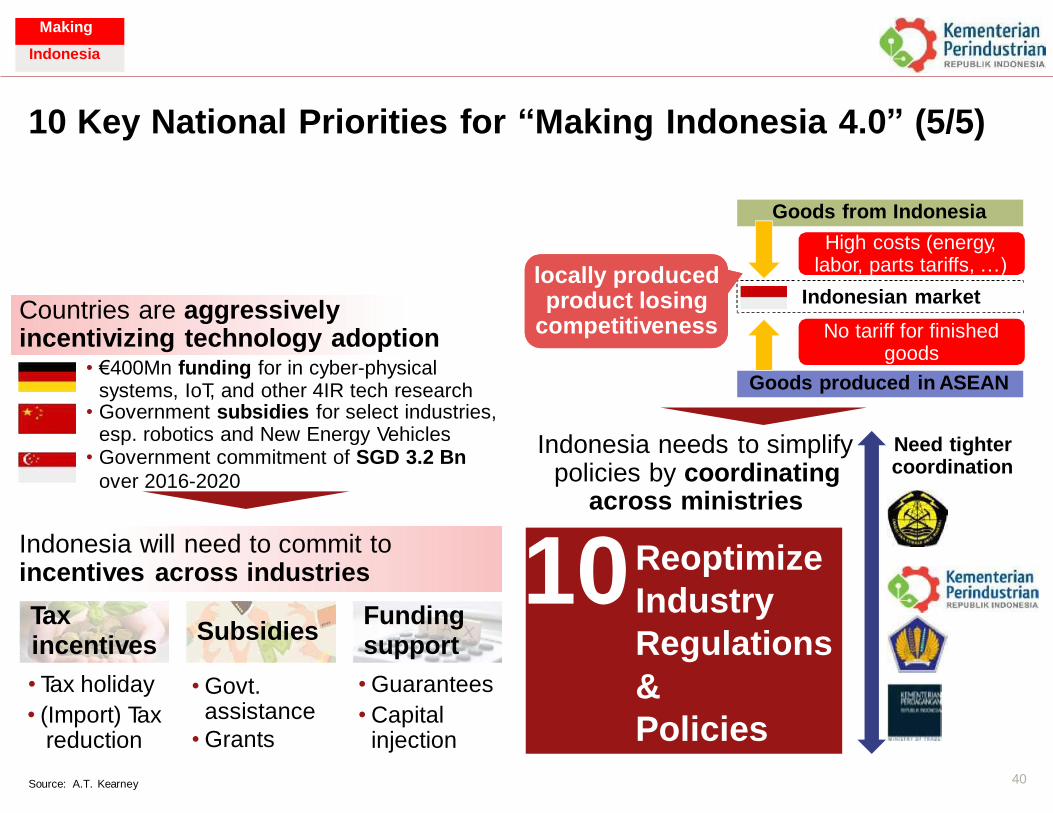
Goods from Indonesia
Goods produced in ASEAN
10 Key National Priorities for “Making Indonesia 4.0” (5/5)
9 innovation Incentivize
High costs (energy, labor, parts tariffs, …)
locally produced product losing
competitiveness
Indonesian market Countries are aggressively incentivizing technology adoption
• €400Mn funding for in cyber-physical systems, IoT, and other 4IR tech research
• Government subsidies for select industries, esp. robotics and New Energy Vehicles
• Government commitment of SGD 3.2 Bn
over 2016-2020
No tariff for finished goods
Indonesia needs to simplify Need tighter coordination policies by coordinating
across ministries
10 Indonesia will need to commit to
Reoptimize incentives
Tax
across industries
Funding Subsidies
incentives
• Tax holiday
• (Import) Tax reduction
support
• Guarantees
• Capital injection
• Govt. assistance
• Grants
40 Source: A.T. Kearney
Industry
Regulations
&
Policies
Goods produced in ASEAN
Goods from Indonesia
Making
Indonesia
Making
Indonesia
ions
41
Economic Benefit and Job Creat
Making
Indonesia
Making
Indonesia
GDP Growth
Job Creation Manufacturing GDP
Contribution
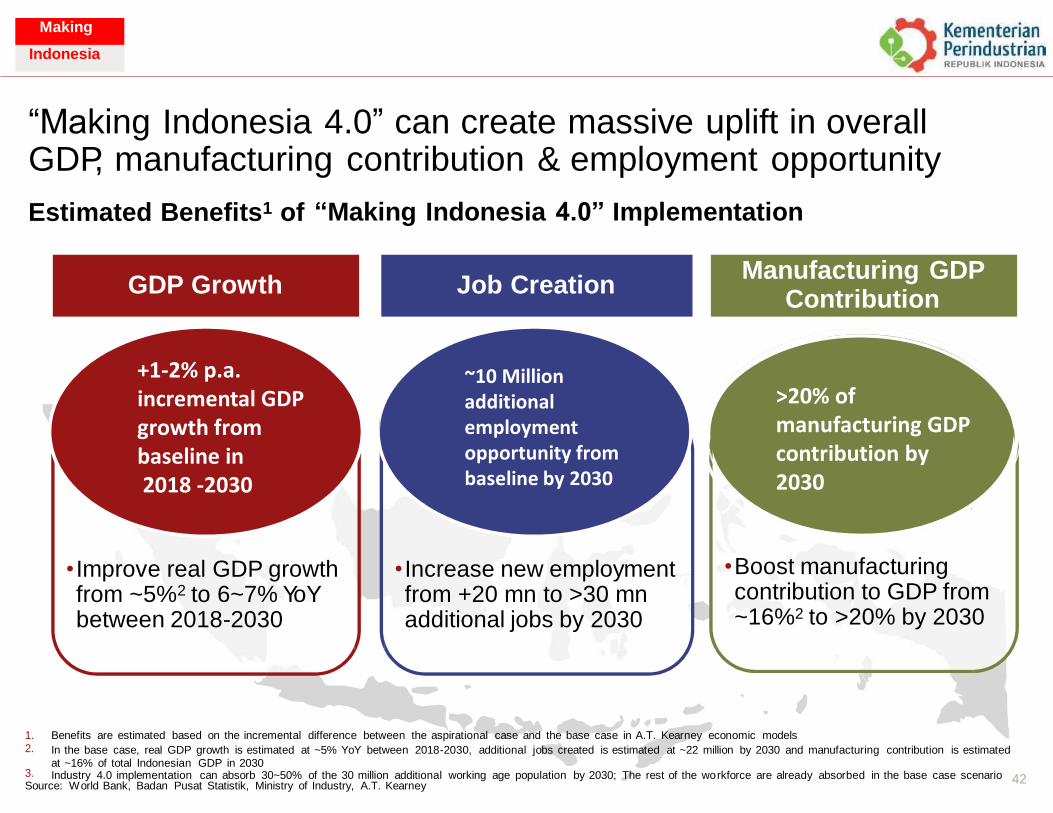
“Making Indonesia 4.0” can create massive uplift in overall GDP, manufacturing contribution & employment opportunity
Estimated Benefits1 of “Making Indonesia 4.0” Implementation
Contribution
• Boost manufacturing contribution to GDP from ~16%2 to >20% by 2030
• Improve real GDP growth from ~5%2 to 6~7% YoY between 2018-2030
• Increase new employment from +20 mn to >30 mn additional jobs by 2030
1. 2.
Benefits are estimated based on the incremental difference between the aspirational case and the base case in A.T. Kearney economic models
In the base case, real GDP growth is estimated at ~5% YoY between 2018-2030, additional jobs created is estimated at ~22 million by 2030 and manufacturing contribution is estimated at ~16% of total Indonesian GDP in 2030 Industry 4.0 implementation can absorb 30~50% of the 30 million additional working age population by 2030; The rest of the wo rkforce are already absorbed in the base case scenario 3.
42 Source: World Bank, Badan Pusat Statistik, Ministry of Industry, A.T. Kearney
GDP Growth
Job Creation Manufacturing GDP
Making
Indonesia
+1-2% p.a. incremental GDP growth from baseline in 2018 -2030
~10 Million additional employment opportunity from baseline by 2030
>20% of manufacturing GDP contribution by 2030
Making
Indonesia
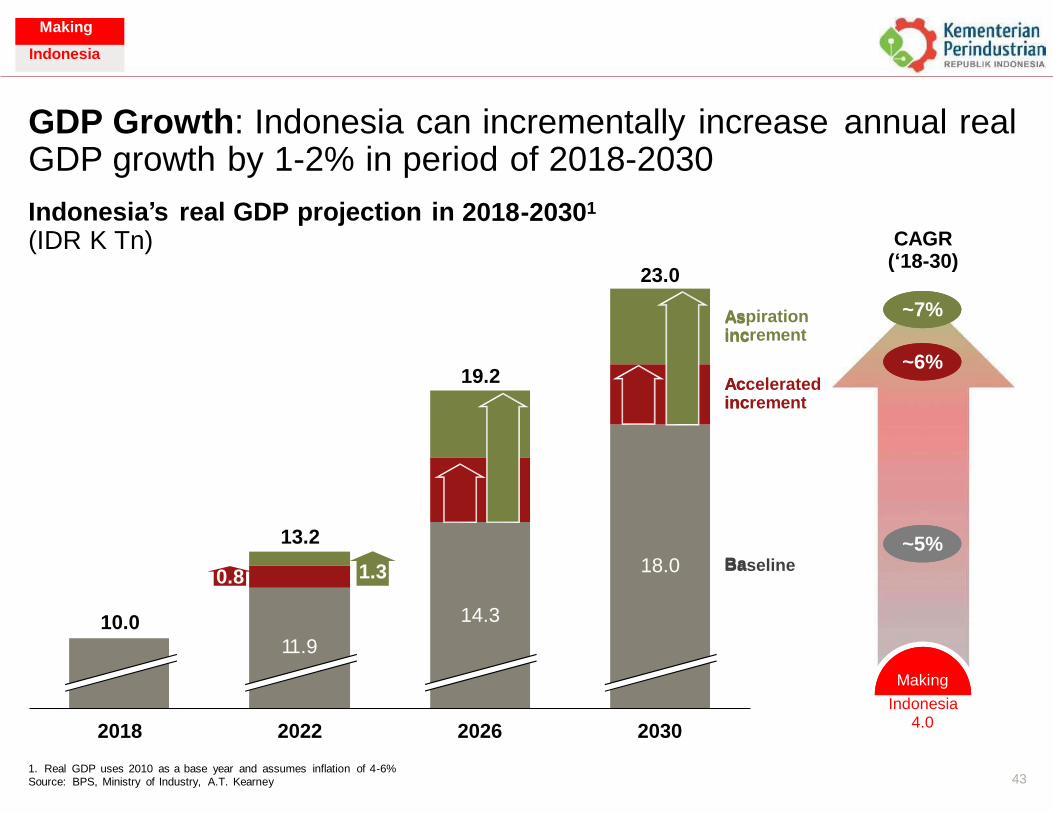
GDP Growth: Indonesia can incrementally increase GDP growth by 1-2% in period of 2018-2030
annual real
2018-20301 Indonesia’s real GDP projection in (IDR K Tn) CAGR
(‘18-30) 23.0
~7% Aspiration increment
~6% Accelerated increment
~5% Baseline
Making
Indonesia 4.0
2018 2022 2026 2030
1. Real GDP uses 2010 as a base year and assumes inflation of 4-6%
Source: BPS, Ministry of Industry, A.T. Kearney 43
19.2
As inc
Ac inc
Ba
13.2
18.0
14.3
0.8
10.0
1.3
11.9
Making
Indonesia
Making
Indonesia
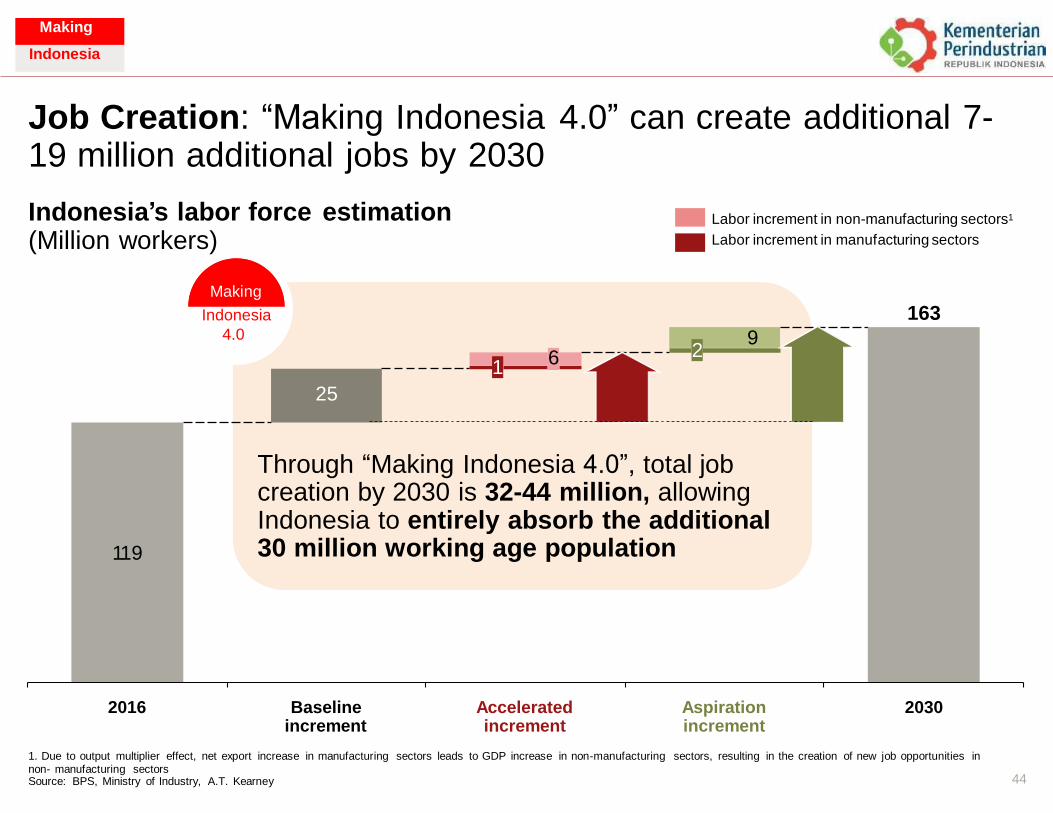
Job Creation: “Making Indonesia 4.0” can create additional 7- 19 million additional jobs by 2030
Indonesia’s labor force estimation Labor increment in non-manufacturing sectors1
Labor increment in manufacturing sectors (Million workers)
Making
Indonesia 163
9 2
1
2016 Baseline increment
Accelerated increment
Aspiration increment
2030
1. Due to output multiplier effect, net export increase in manufacturing sectors leads to GDP increase in non-manufacturing sectors, resulting in the creation of new job opportunities in non- manufacturing sectors Source: BPS, Ministry of Industry, A.T. Kearney 44
4.0
6
25
119
Through “Making Indonesia 4.0”, total job creation by 2030 is 32-44 million, allowing Indonesia to entirely absorb the additional 30 million working age population
Making
Indonesia
Making
Indonesia
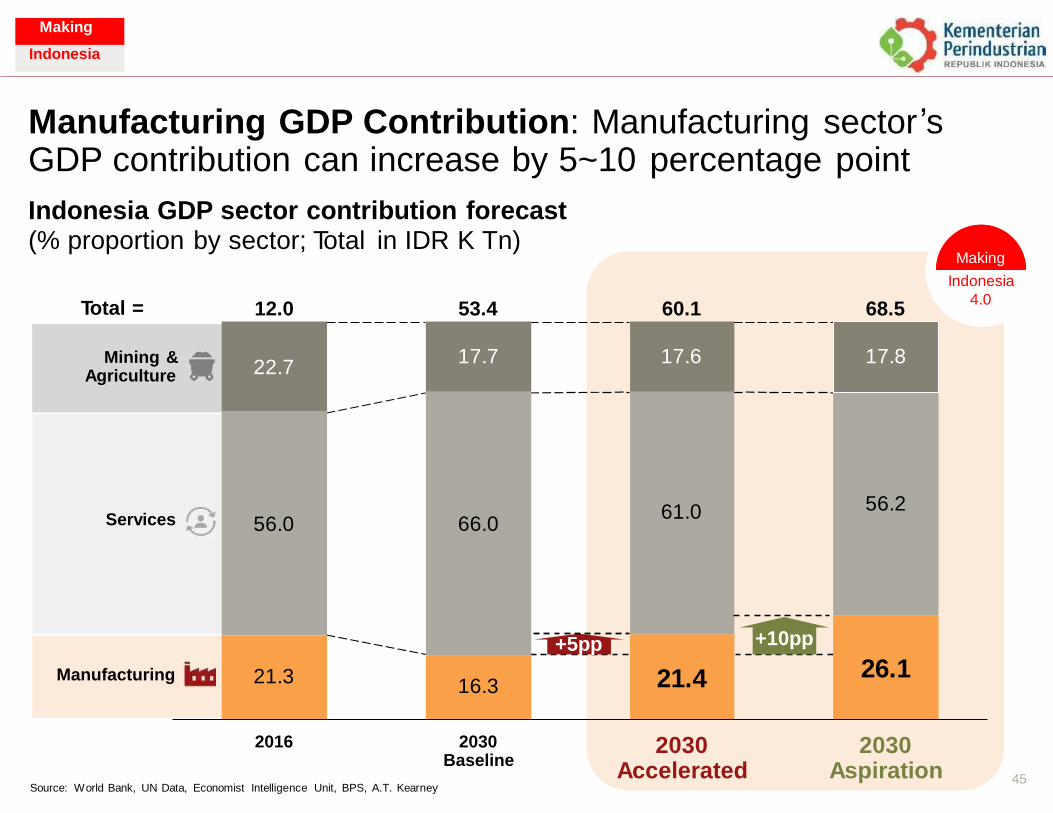
Manufacturing GDP Contribution: Manufacturing sector ’s GDP contribution can increase by 5~10
Indonesia GDP sector contribution forecast
percentage point
(% proportion by sector; Total in IDR K Tn) Making
Indonesia
4.0 Total = 12.0 53.4 60.1 68.5
2016 2030 Baseline
2030 Accelerated
2030 Aspiration 45
Source: World Bank, UN Data, Economist Intelligence Unit, BPS, A.T. Kearney
Mining & Agriculture
22.7
17.7
17.6
17.8
66.0
61.0
56.2
Services
56.0
+10pp
26.1
Manufacturing
21.3
+5pp
21.4
16.3
Making
Indonesia

Making
Indonesia
46
Next Steps
Making
Indonesia
Making
Indonesia
Overall
Vertical initiatives
Horizontal initiatives
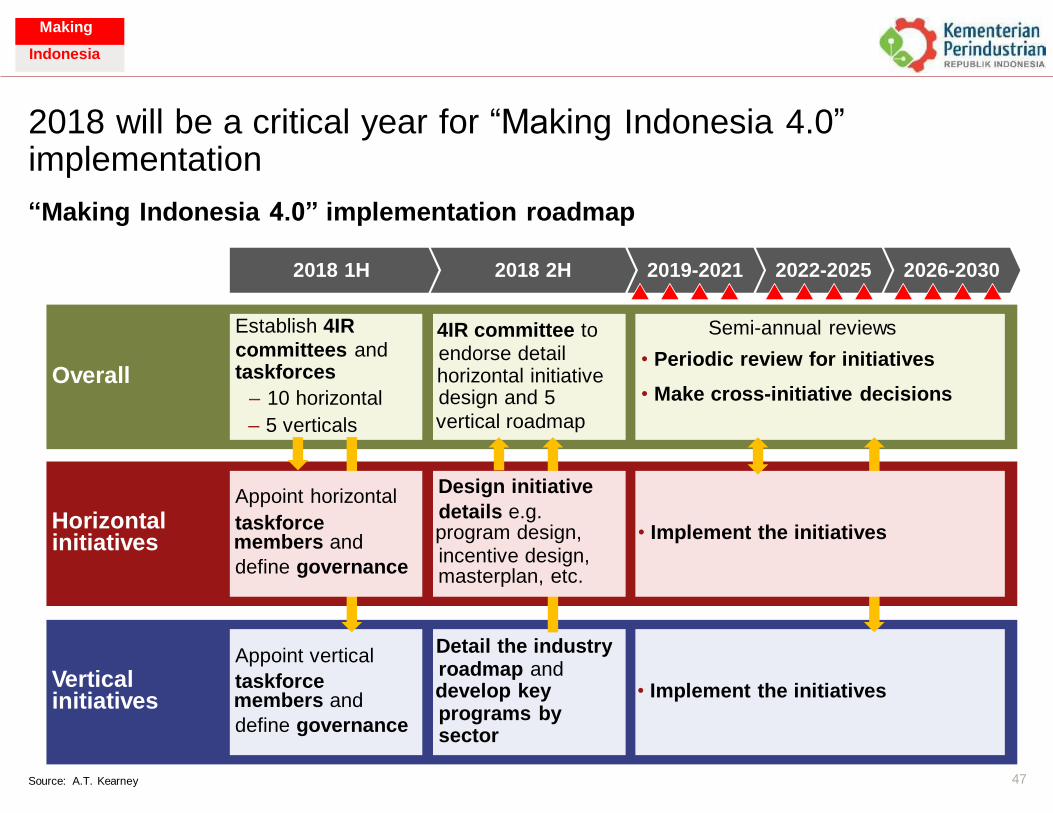
2018 will be a critical year for “Making Indonesia 4.0” implementation
“Making Indonesia 4.0” implementation roadmap
2018 1H 2018 2H 2019-2021 2022-2025 2026-2030
Horizontal
Vertical
47 Source: A.T. Kearney
roadmap and
programs by
taskforce
define governance
Appoint vertical Detail the industry
initiatives members and develop key • Implement the initiatives
sector
details e.g.
incentive design,
taskforce
define governance
Appoint horizontal Design initiative
initiatives members and program design, • Implement the initiatives
masterplan, etc.
• Periodic review for initiatives
• Make cross-initiative decisions
endorse detail
design and 5
committees and
– 10 horizontal
Establish 4IR 4IR committee to Semi-annual reviews
Overall taskforces horizontal initiative
– 5 verticals vertical roadmap
Making
Indonesia
Making
Indonesia
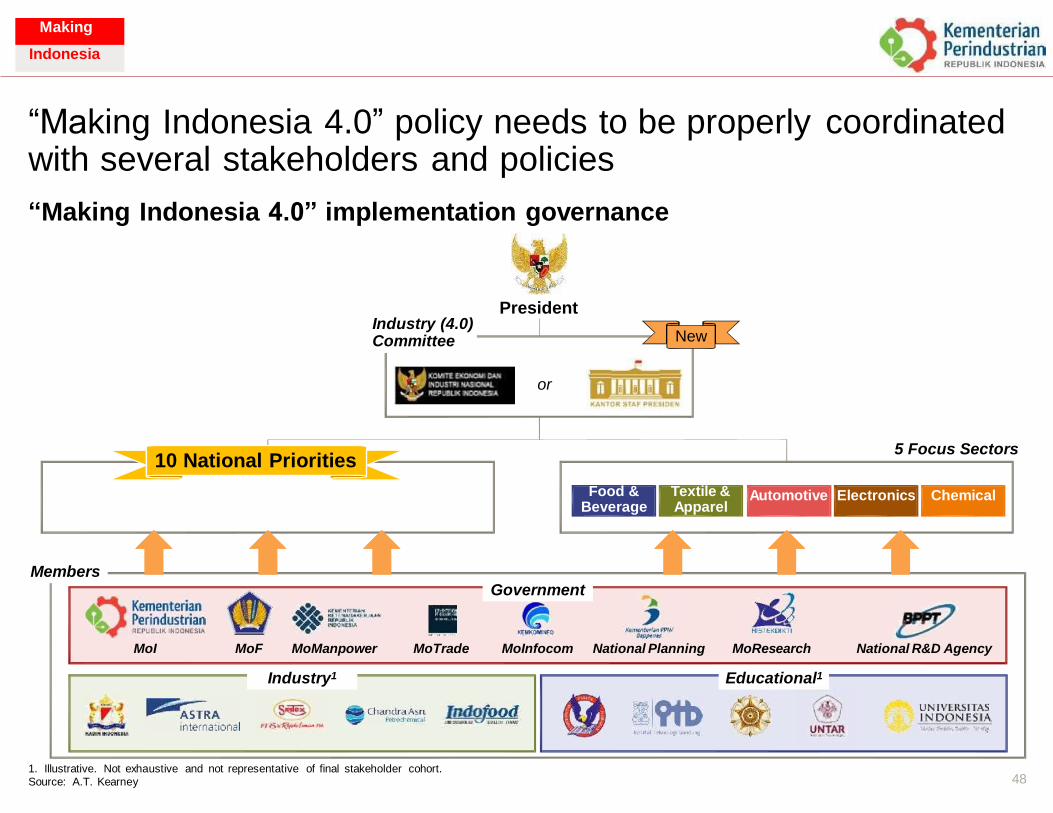
“Making Indonesia 4.0” policy needs to be properly with several stakeholders and policies
coordinated
“Making Indonesia 4.0” implementation governance
President Industry (4.0) Committee New
or
5 Focus Sectors 10 National Priorities
1 2 3 4 5 6 7 8 9 10
Members
1. Illustrative. Not exhaustive and not representative of final stakeholder cohort.
Source: A.T. Kearney 48
Industry1 Educational1
Government
MoI MoF MoManpower MoTrade MoInfocom National Planning MoResearch National R&D Agency
Food & Beverage
Textile & Apparel
Automotive Electronics Chemical
Making
Indonesia
Making
Indonesia
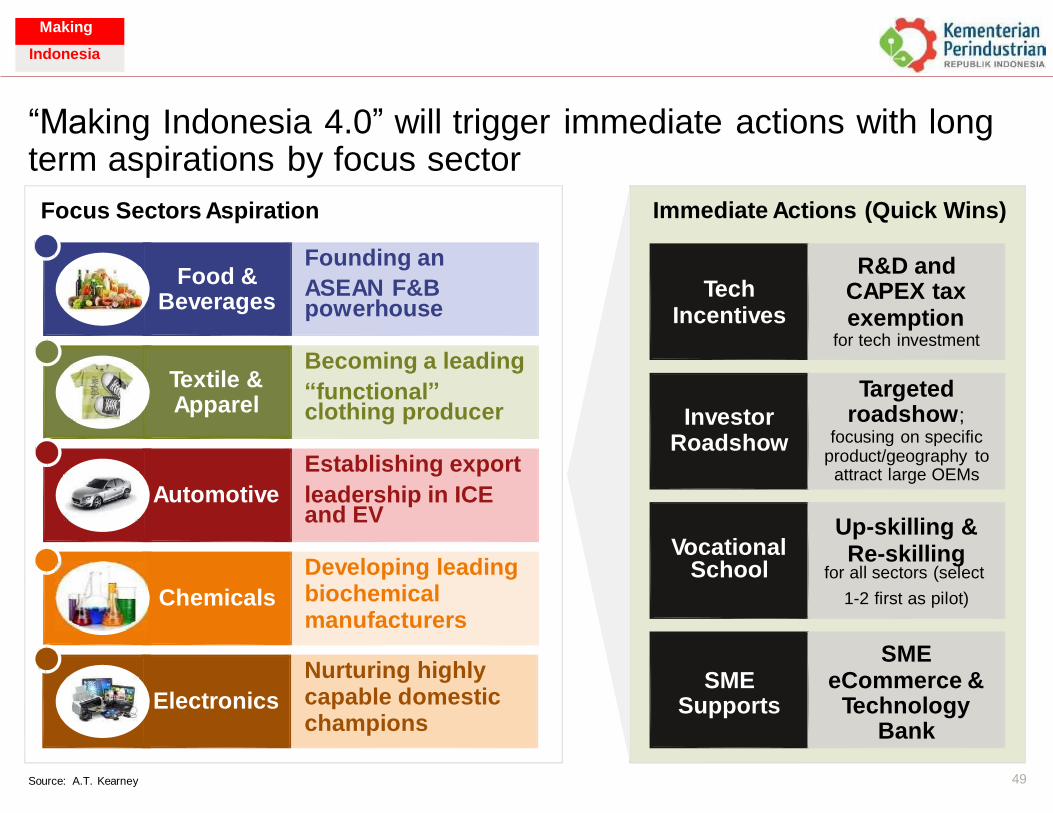
“Making Indonesia 4.0” will trigger term aspirations by focus sector
immediate actions with long
Focus Sectors Aspiration
ASEAN F&B
“functional”
leadership in ICE
49 Source: A.T. Kearney
Electronics
Nurturing highly capable domestic champions
Chemicals
Developing leading biochemical manufacturers
Vocational
Re-skilling
Automotive
Establishing export
and EV
Roadshow
focusing on specific
Textile & Apparel
Becoming a leading
clothing producer
Food & Beverages
Founding an
powerhouse
Immediate Actions (Quick Wins)
R&D and Tech CAPEX tax
Incentives exemption for tech investment
Targeted
Investor roadshow;
product/geography to attract large OEMs
Up-skilling &
School for all sectors (select
1-2 first as pilot)
SME SME eCommerce &
Supports Technology Bank
Making
Indonesia

Making
Indonesia
APPENDIX
50
Making
Indonesia
Making
Indonesia
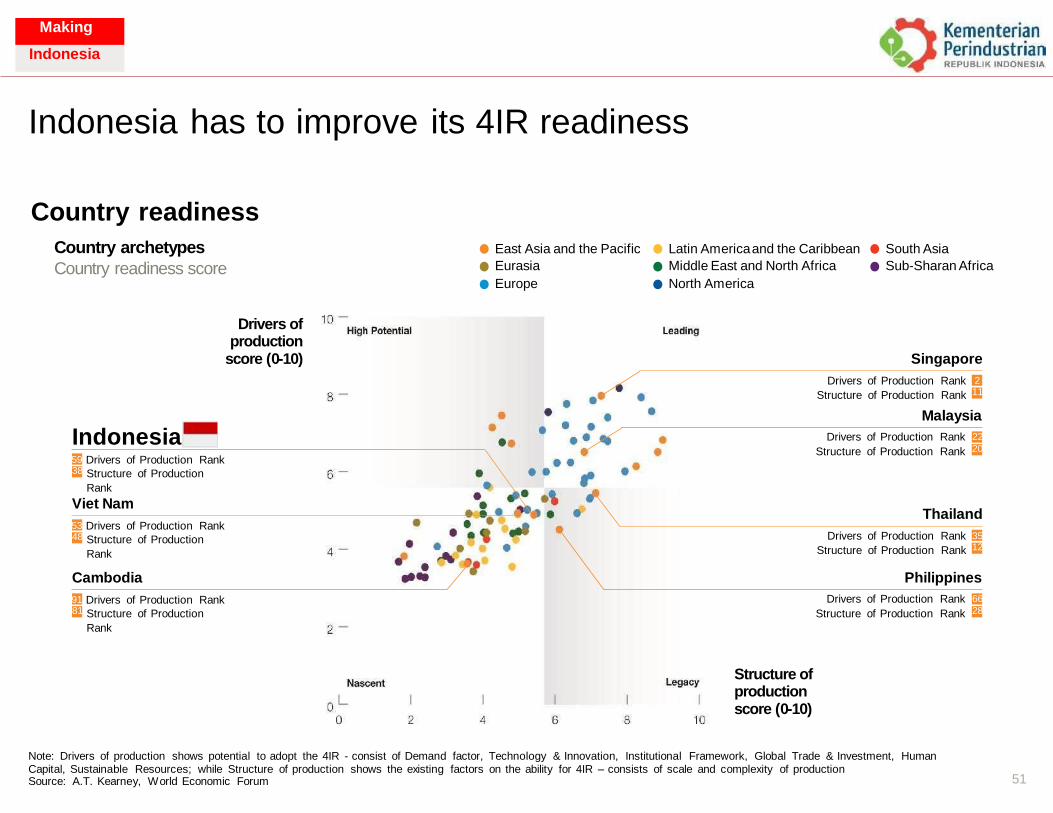
Indonesia has to improve its 4IR readiness
Country readiness
Country archetypes
Country readiness score
East Asia and the Pacific
Eurasia
Europe
Latin America and the Caribbean
Middle East and North Africa
North America
South Asia
Sub-Sharan Africa
Drivers of production
score (0-10) Singapore
Drivers of Production Rank
Structure of Production Rank
2
Malaysia
Indonesia Drivers of Production Rank 22 Structure of Production Rank
59 Drivers of Production Rank
Structure of Production
Rank
Viet Nam Thailand
53 Drivers of Production Rank Drivers of Production Rank
Structure of Production Rank Structure of Production
Rank
Cambodia Philippines
91 Drivers of Production Rank Drivers of Production Rank 66 Structure of Production
Rank
Structure of Production Rank
Structure of production score (0-10)
Note: Drivers of production shows potential to adopt the 4IR - consist of Demand factor, Technology & Innovation, Institutional Framework, Global Trade & Investment, Human Capital, Sustainable Resources; while Structure of production shows the existing factors on the ability for 4IR – consists of scale and complexity of production Source: A.T. Kearney, World Economic Forum 51
28 81
35 12
48
38
20
11
Making
Indonesia
Making
Indonesia
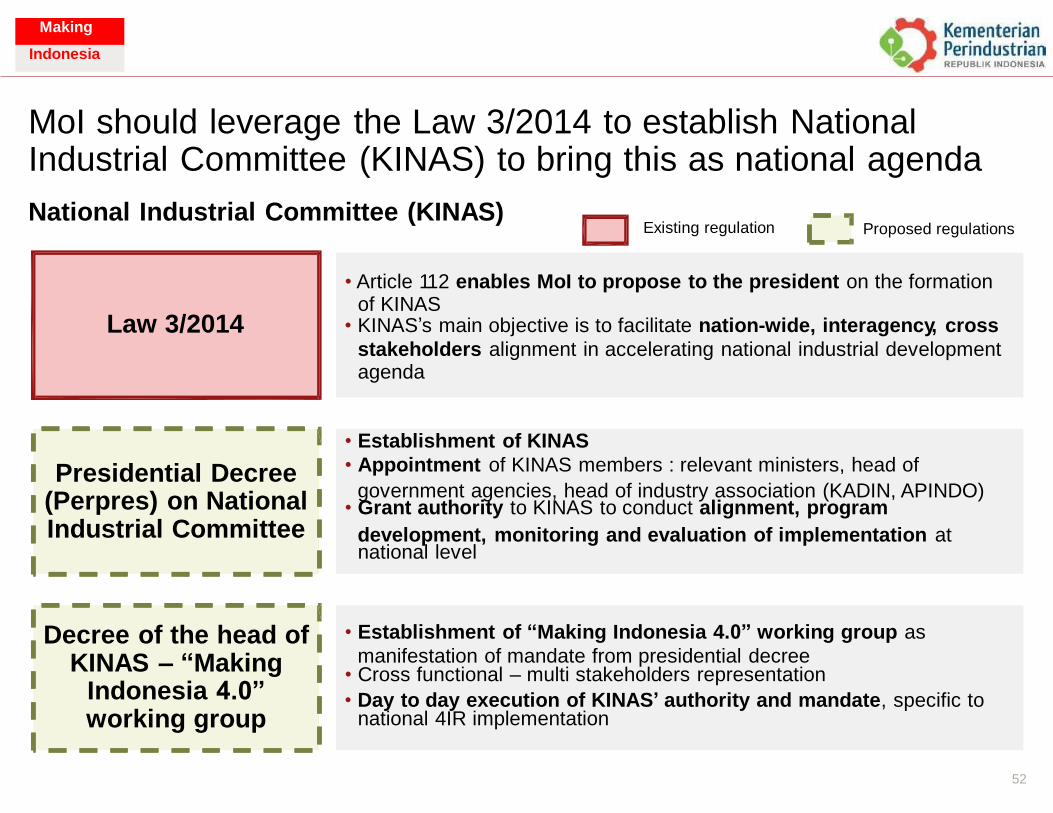
MoI should leverage the Law 3/2014 to establish National Industrial Committee (KINAS) to bring this as national agenda
National Industrial Committee (KINAS) Existing regulation Proposed regulations
• KINAS’s main objective is to facilitate nation-wide, interagency, cross
government agencies, head of industry association (KADIN, APINDO)
development, monitoring and evaluation of implementation at
manifestation of mandate from presidential decree
• Day to day execution of KINAS’ authority and mandate, specific to
52
• Establishment of “Making Indonesia 4.0” working group as
• Cross functional – multi stakeholders representation
national 4IR implementation
Decree of the head of KINAS – “Making
Indonesia 4.0” working group
• Establishment of KINAS
• Appointment of KINAS members : relevant ministers, head of
• Grant authority to KINAS to conduct alignment, program
national level
Presidential Decree (Perpres) on National Industrial Committee
Law 3/2014
• Article 112 enables MoI to propose to the president on the formation of KINAS
stakeholders alignment in accelerating national industrial development agenda
Making
Indonesia
Making
Indonesia
4IR Working Group
4IR Working Group
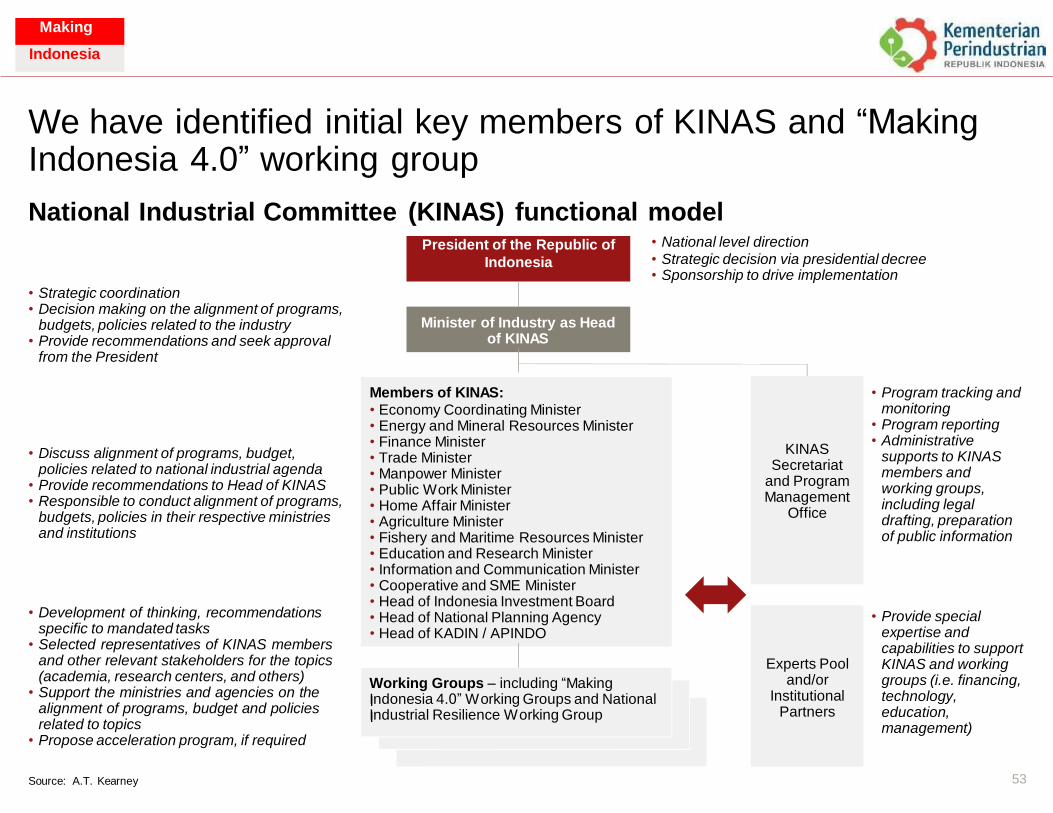
We have identified initial key members of KINAS and “Making Indonesia 4.0” working group
National Industrial Committee (KINAS) functional model • National level direction
• Strategic decision via presidential decree • Sponsorship to drive implementation
• Strategic coordination • Decision making on the alignment of programs,
budgets, policies related to the industry • Provide recommendations and seek approval
from the President
• Program tracking and monitoring
• Program reporting • Administrative
supports to KINAS members and working groups, including legal drafting, preparation of public information
• Discuss alignment of programs, budget, policies related to national industrial agenda
• Provide recommendations to Head of KINAS • Responsible to conduct alignment of programs,
budgets, policies in their respective ministries and institutions
• Development of thinking, recommendations specific to mandated tasks
• Selected representatives of KINAS members and other relevant stakeholders for the topics (academia, research centers, and others)
• Support the ministries and agencies on the alignment of programs, budget and policies related to topics
• Propose acceleration program, if required
• Provide special expertise and capabilities to support KINAS and working groups (i.e. financing, technology, education, management)
Working Groups – including “Making Indonesia 4.0” Working Groups and National Industrial Resilience Working Group
53 Source: A.T. Kearney
Experts Pool and/or
Institutional Partners
KINAS Secretariat
and Program Management
Office
Members of KINAS:
• Economy Coordinating Minister • Energy and Mineral Resources Minister • Finance Minister • Trade Minister • Manpower Minister • Public Work Minister • Home Affair Minister • Agriculture Minister • Fishery and Maritime Resources Minister • Education and Research Minister • Information and Communication Minister • Cooperative and SME Minister • Head of Indonesia Investment Board • Head of National Planning Agency • Head of KADIN / APINDO
I I
President of the Republic of
Indonesia
Minister of Industry as Head of KINAS
Making
Indonesia
Making
Indonesia
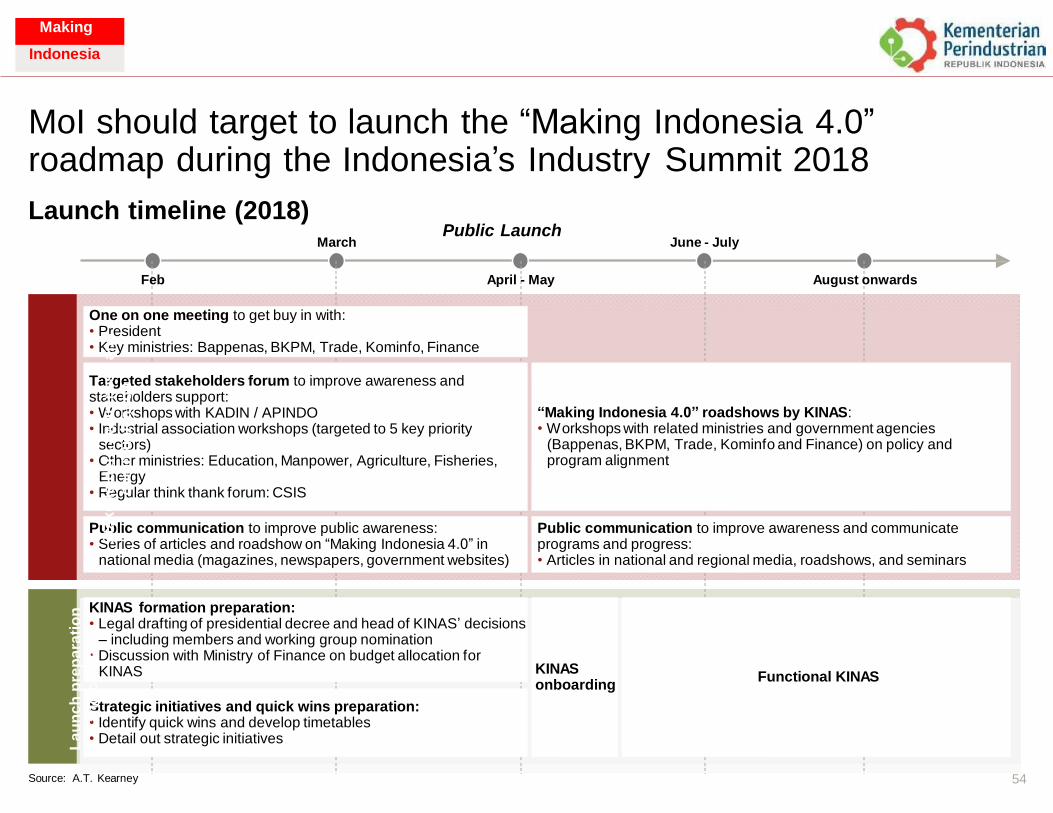
MoI should target to launch the “Making Indonesia 4.0” roadmap during the Indonesia’s Industry
Launch timeline (2018)
Summit 2018
Public Launch March June - July
Feb April - May August onwards
One on one meeting to get buy in with: • President • Key ministries: Bappenas, BKPM, Trade, Kominfo, Finance
Targeted stakeholders forum to improve awareness and stakeholders support: • Workshops with KADIN / APINDO • Industrial association workshops (targeted to 5 key priority
sectors) • Other ministries: Education, Manpower, Agriculture, Fisheries,
Energy • Regular think thank forum: CSIS
“Making Indonesia 4.0” roadshows by KINAS: • Workshops with related ministries and government agencies
(Bappenas, BKPM, Trade, Kominfo and Finance) on policy and program alignment
Public communication to improve public awareness: • Series of articles and roadshow on “Making Indonesia 4.0” in
national media (magazines, newspapers, government websites)
Public communication to improve awareness and communicate programs and progress: • Articles in national and regional media, roadshows, and seminars
KINAS formation preparation: • Legal drafting of presidential decree and head of KINAS’ decisions
– including members and working group nomination • Discussion with Ministry of Finance on budget allocation for
KINAS KINAS onboarding
Functional KINAS
Strategic initiatives and quick wins preparation: • Identify quick wins and develop timetables • Detail out strategic initiatives
Source: A.T. Kearney 54
La
un
ch
pre
pa
rati
on
a
nd
co
nte
nt
Sta
ke
ho
lde
rs a
wa
ren
es
s a
nd
c
om
mu
nic
ati
on
Making
Indonesia
Making
Indonesia
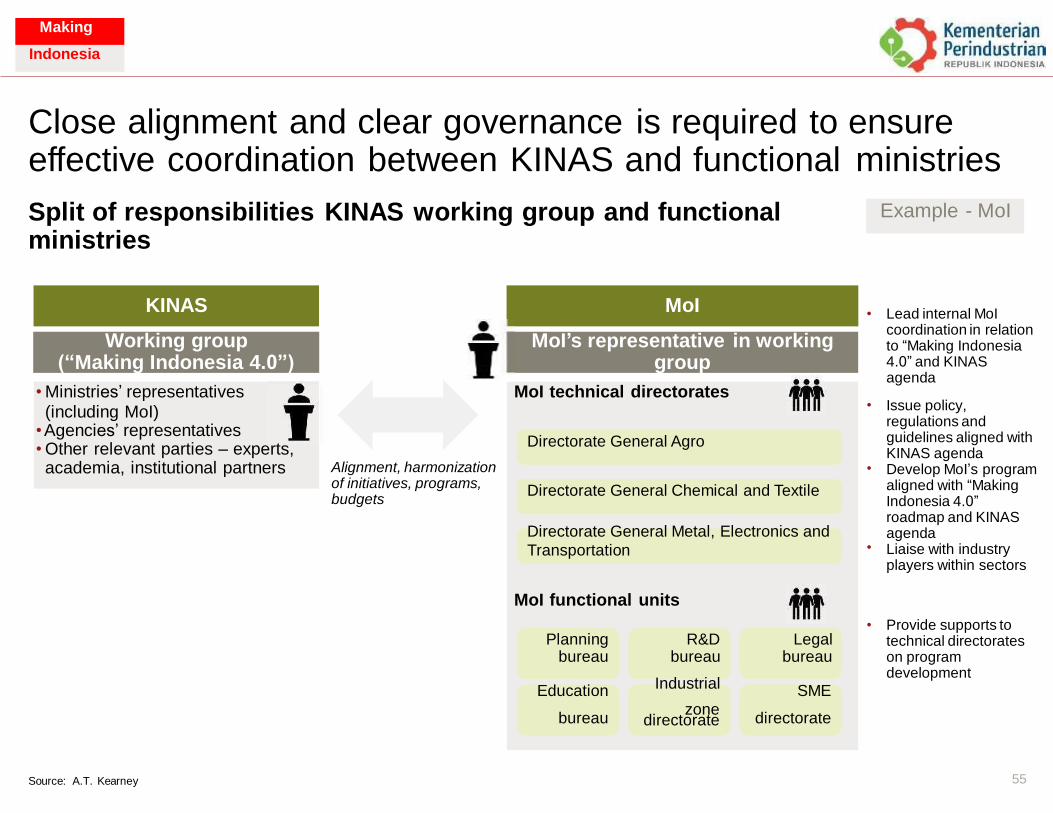
Close alignment and clear governance is required to ensure effective coordination between KINAS and functional ministries
Split of responsibilities ministries
KINAS working group and functional
• Lead internal MoI coordination in relation to “Making Indonesia 4.0” and KINAS agenda
Issue policy, regulations and guidelines aligned with KINAS agenda Develop MoI’s program aligned with “Making Indonesia 4.0” roadmap and KINAS agenda Liaise with industry players within sectors
•
Alignment, harmonization of initiatives, programs, budgets
•
•
• Provide supports to technical directorates on program development
zone bureau directorate
55 Source: A.T. Kearney
MoI technical directorates
Directorate General Agro
Directorate General Chemical and Textile
Directorate General Metal, Electronics and
Transportation
MoI functional units
Planning R&D Legal bureau bureau bureau
Education Industrial SME
directorate
• Ministries’ representatives (including MoI)
• Agencies’ representatives • Other relevant parties – experts, academia, institutional partners
MoI’s representative in working group
Working group (“Making Indonesia 4.0”)
MoI
KINAS
Example - MoI
Making
Indonesia
Lampiran Pangan dan Energi
Sectoral deep dive
Table of Contents
■ Priority Sector Strategies
–
–
–
–
Textile/Apparel
Automotive
Electronics
Chemicals
– Food & Beverages
4/20/2018 57
Sectoral deep dive
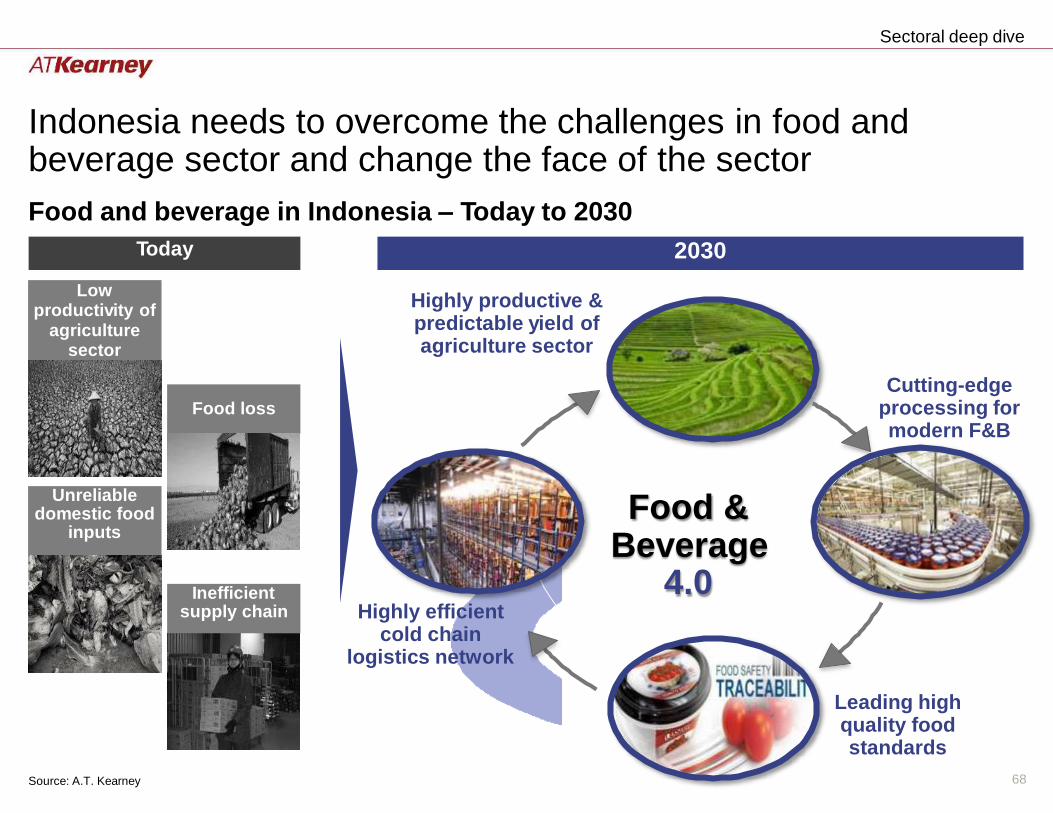
Indonesia needs to overcome the challenges in food and beverage sector and change the face of the sector
Food and beverage in Indonesia – Today to 2030
Highly productive & predictable yield of agriculture sector
Cutting-edge processing for modern F&B
Food & Beverage
4.0 Highly efficient
cold chain logistics network
Leading high quality food standards
68 Source: A.T. Kearney
Inefficient supply chain
Unreliable domestic food
inputs
Food loss
Low productivity of
agriculture sector
2030 Today
Sectoral deep dive
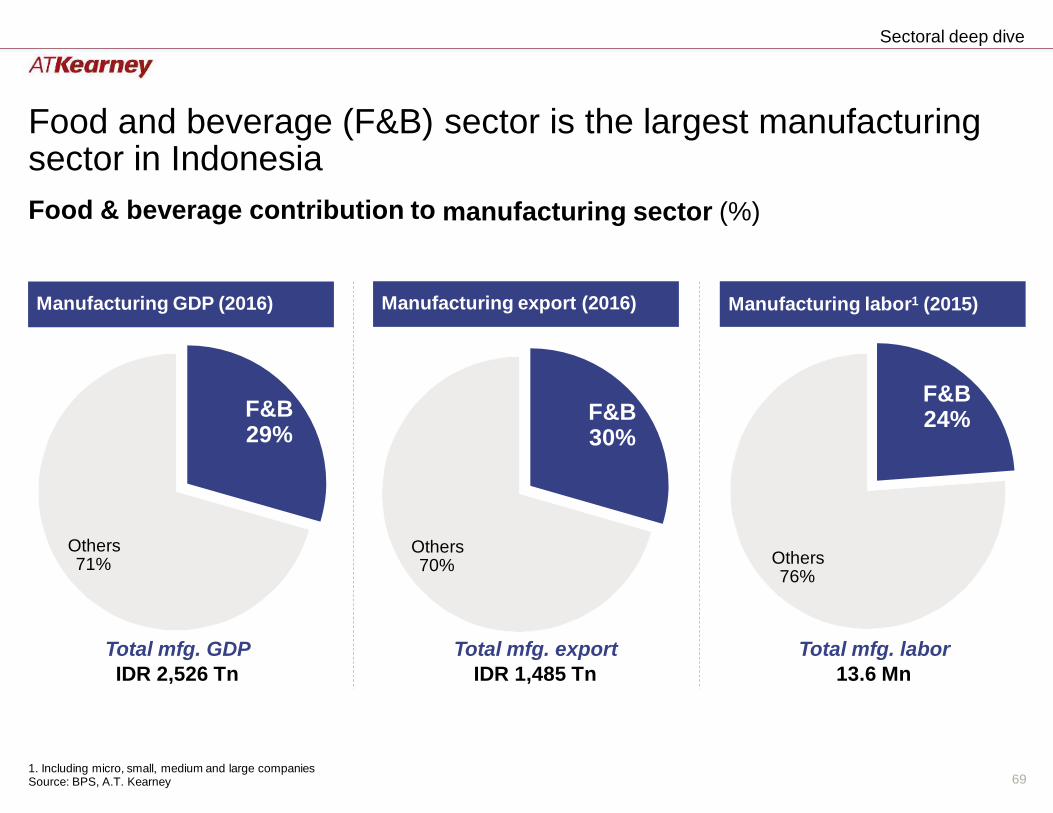
Food and beverage (F&B) sector in Indonesia
Food & beverage contribution to
sector is the largest manufacturing
manufacturing sector (%)
F&B 24% F&B
29% F&B 30%
Others 71%
Others 70% Others
76%
Total mfg. GDP
IDR 2,526 Tn
Total mfg. export
IDR 1,485 Tn
Total mfg. labor
13.6 Mn
1. Including micro, small, medium and large companies Source: BPS, A.T. Kearney 69
Manufacturing labor1 (2015)
Manufacturing export (2016)
Manufacturing GDP (2016)
Sectoral deep dive
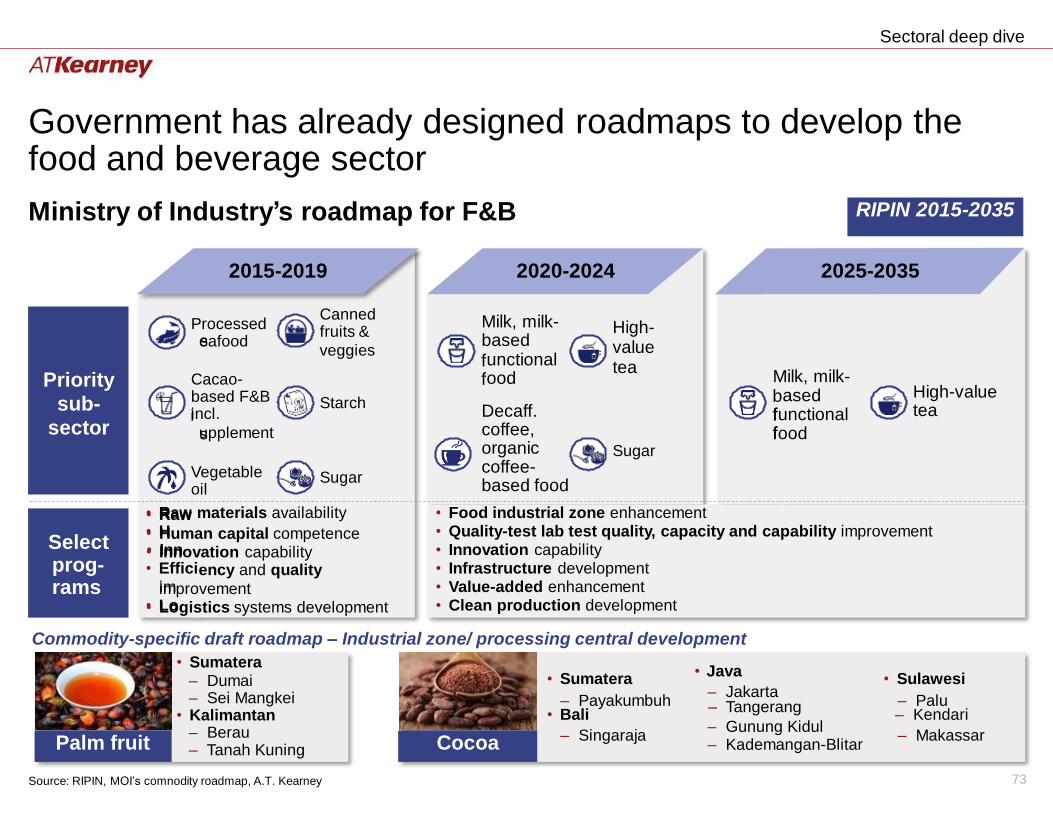
Government has already designed food and beverage sector
roadmaps to develop the
Ministry of Industry’s roadmap for F&B
Canned fruits &
Milk, milk- based
Processed High- value tea
eafood
unctional ood Milk, milk- Cacao-
based F&B incl.
High-value tea
ased Starch Decaff. coffee, organic coffee- based food
functional upplement food
Sugar
Vegetable oil
Sugar
• • •
Raw
Human capital competence Innovation capability
improvement Logistics systems development •
Commodity-specific draft roadmap – Industrial zone/ processing central development
– Jakarta – Payakumbuh – Palu
– Gunung Kidul – Singaraja – Makassar
73 Source: RIPIN, MOI’s comnodity roadmap, A.T. Kearney
• Sumatera • Java
• Sulawesi
• Bali – Tangerang
– Kendari
– Kademangan-Blitar Cocoa
• Sumatera – Dumai – Sei Mangkei
• Kalimantan – Berau – Tanah Kuning Palm fruit
2015-2019
veggies
2020-2024
2025-2035
Priority sub-
sector
s
i s
f f
b f f
Select prog- rams
• Raw • H • Inn • Effici
im • Lo
materials availability
ency and quality
• Food industrial zone enhancement • Quality-test lab test quality, capacity and capability improvement • Innovation capability • Infrastructure development • Value-added enhancement • Clean production development
RIPIN 2015-2035
Sectoral deep dive
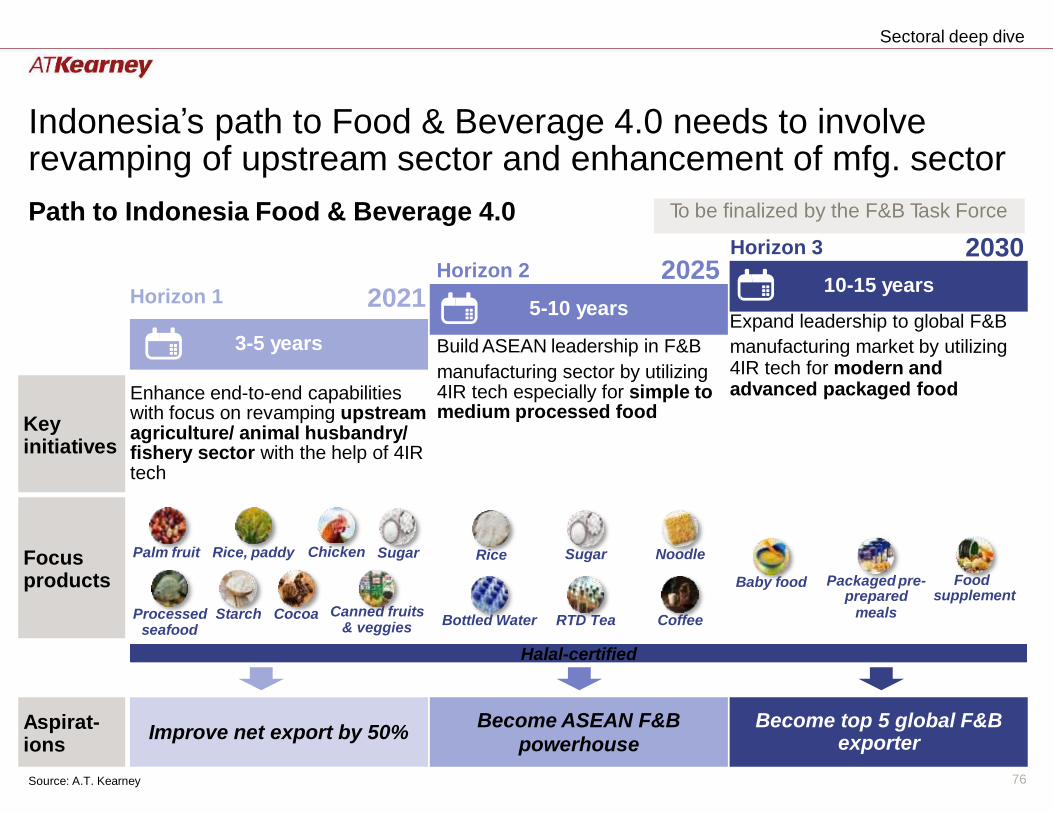
Indonesia’s path to Food & Beverage 4.0 needs to involve revamping of upstream sector and enhancement of mfg. sector
Path to Indonesia Food & Beverage 4.0
2030 Horizon 3
manufacturing market by utilizing 4IR tech for modern and advanced packaged food
manufacturing sector by utilizing 4IR tech especially for simple to medium processed food
Enhance end-to-end capabilities with focus on revamping upstream agriculture/ animal husbandry/ fishery sector with the help of 4IR tech
Palm fruit Rice, paddy Chicken Sugar Sugar Noodle Rice
Packaged pre- Food prepared supplement
meals
Baby food
Canned fruits & veggies
Processed Starch Cocoa seafood
Bottled Water RTD Tea Coffee
Halal-certified
exporter
76 Source: A.T. Kearney
Aspirat- ions
Improve net export by 50%
Become ASEAN F&B powerhouse
Become top 5 global F&B
Focus products
Key initiatives
Horizon 2 2025
10-15 years Horizon 1 2021 5-10 years
Expand leadership to global F&B
3-5 years Build ASEAN leadership in F&B
To be finalized by the F&B Task Force
(
p produced commodit
Market size/ ID’s scale
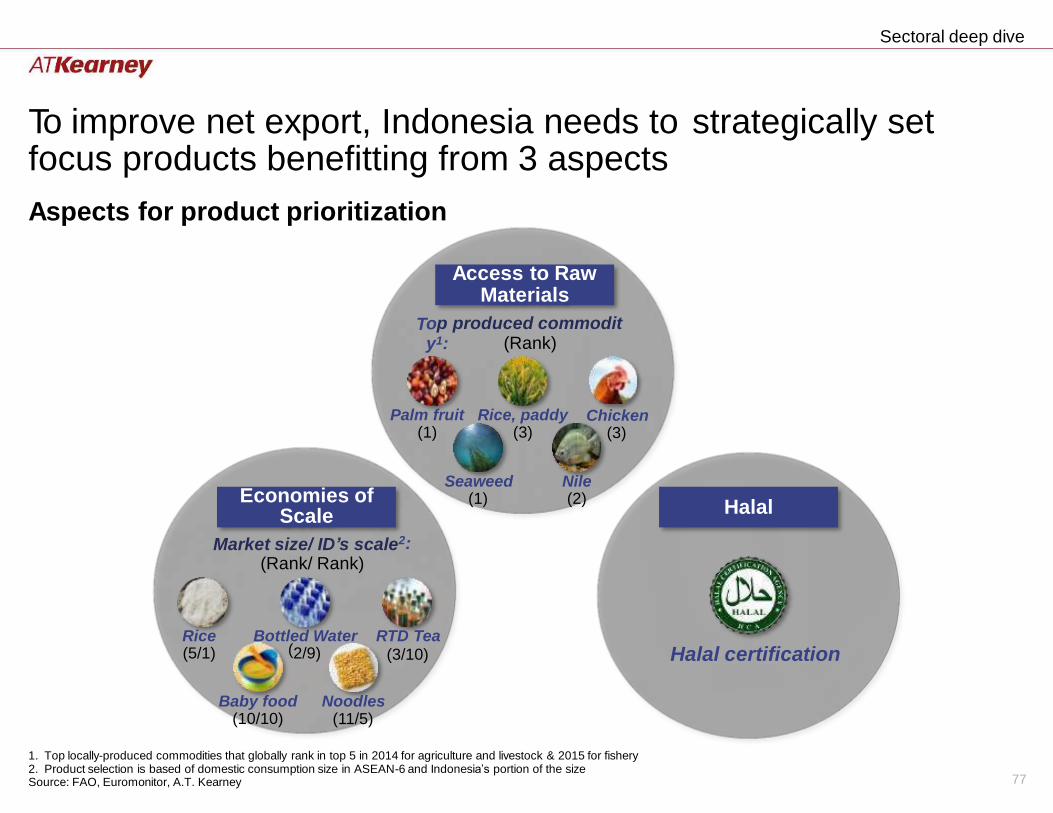
Sectoral deep dive
To improve net export, Indonesia needs to focus products benefitting from 3 aspects
strategically set
Aspects for product prioritization
o y1:
T (Rank)
Palm fruit Rice, paddy Chicken (3) (1) (3)
Seaweed (1)
Nile (2)
2: (Rank/ Rank)
Rice (5/1)
Bottled Water 2/9)
RTD Tea (3/10) Halal certification
Baby food Noodles (10/10) (11/5)
1. Top locally-produced commodities that globally rank in top 5 in 2014 for agriculture and livestock & 2015 for fishery 2. Product selection is based of domestic consumption size in ASEAN-6 and Indonesia’s portion of the size Source: FAO, Euromonitor, A.T. Kearney 77
Halal Economies of
Scale
Access to Raw Materials
Sectoral deep dive
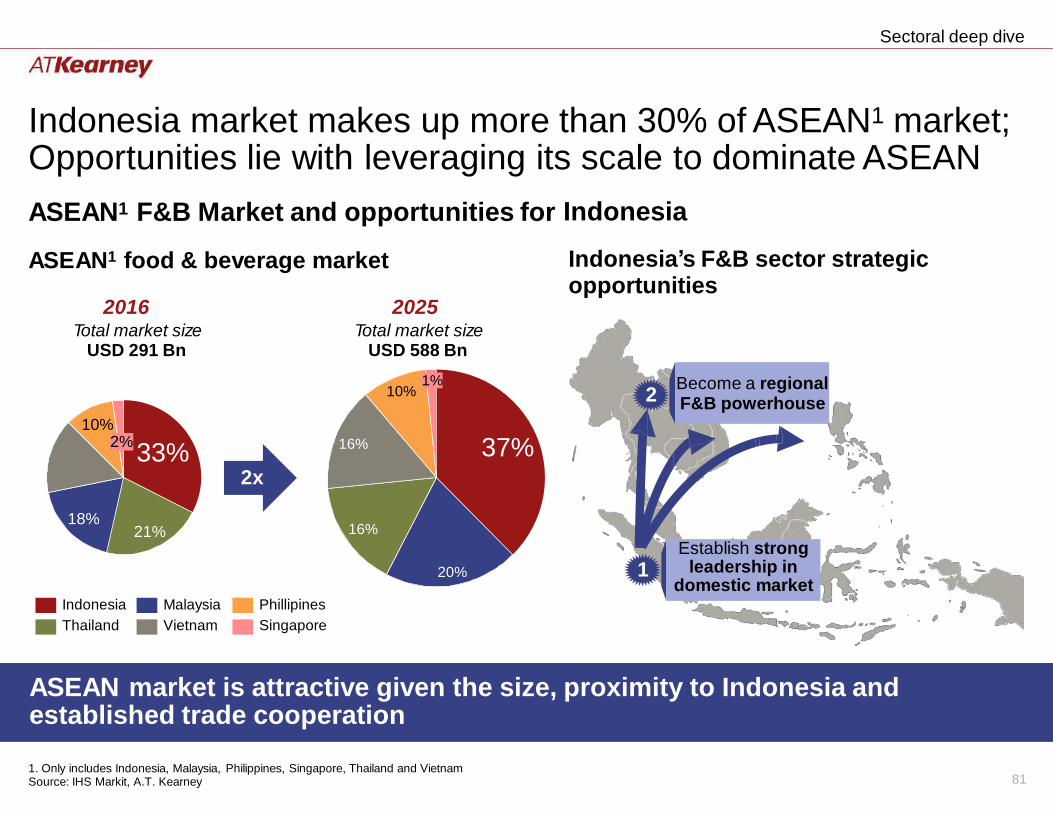
Indonesia market makes up more than 30% of ASEAN1 market; Opportunities lie with leveraging its scale to dominate ASEAN
ASEAN1 F&B Market and opportunities for
ASEAN1 food & beverage market
Indonesia
Indonesia’s F&B sector strategic opportunities
2016 Total market size
USD 291 Bn
2025 Total market size
USD 588 Bn
10% 2
10%
37% 16% 33%
2x
18% 16% 21%
1 20%
Indonesia
Thailand
Malaysia
Vietnam
Phillipines
Singapore
ASEAN market is attractive given the size, established trade cooperation
proximity to Indonesia and
1. Only includes Indonesia, Malaysia, Philippines, Singapore, Thailand and Vietnam Source: IHS Markit, A.T. Kearney 81
Establish strong leadership in
domestic market
2%
1%
Become a regional F&B powerhouse
Sectoral deep dive
Table of Contents
■ Priority Sector Strategies
–
–
–
–
Food & Beverages
Textile/Apparel
Automotive
Electronics
– Chemicals
4/20/2018 64
Sectoral deep dive
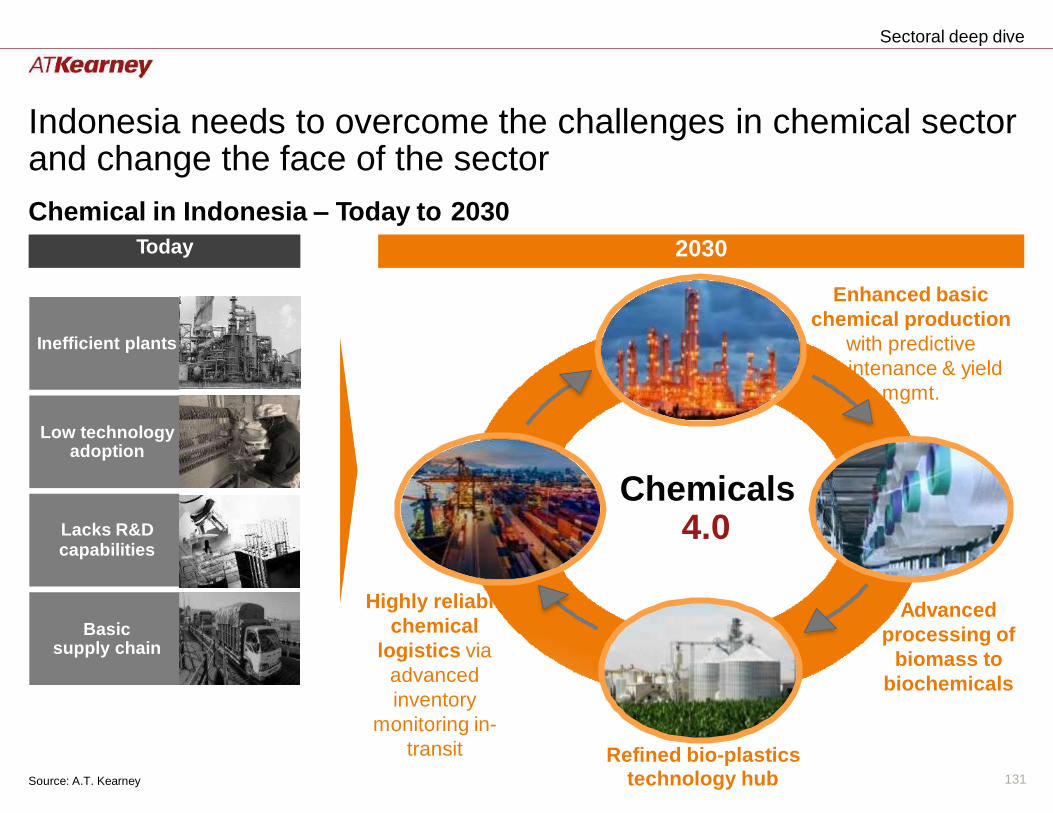
Indonesia needs to overcome the and change the face of the sector
challenges in chemical sector
Chemical in Indonesia – Today to 2030
Enhanced basic
chemical production
with predictive
maintenance & yield
mgmt.
Chemicals 4.0
Highly reliable
chemical
logistics via
advanced
inventory
monitoring in-
transit
Advanced
processing of
biomass to
biochemicals
Refined bio-plastics technology hub 131 Source: A.T. Kearney
Basic supply chain
Lacks R&D capabilities
Low technology adoption
Inefficient plants
2030 Today
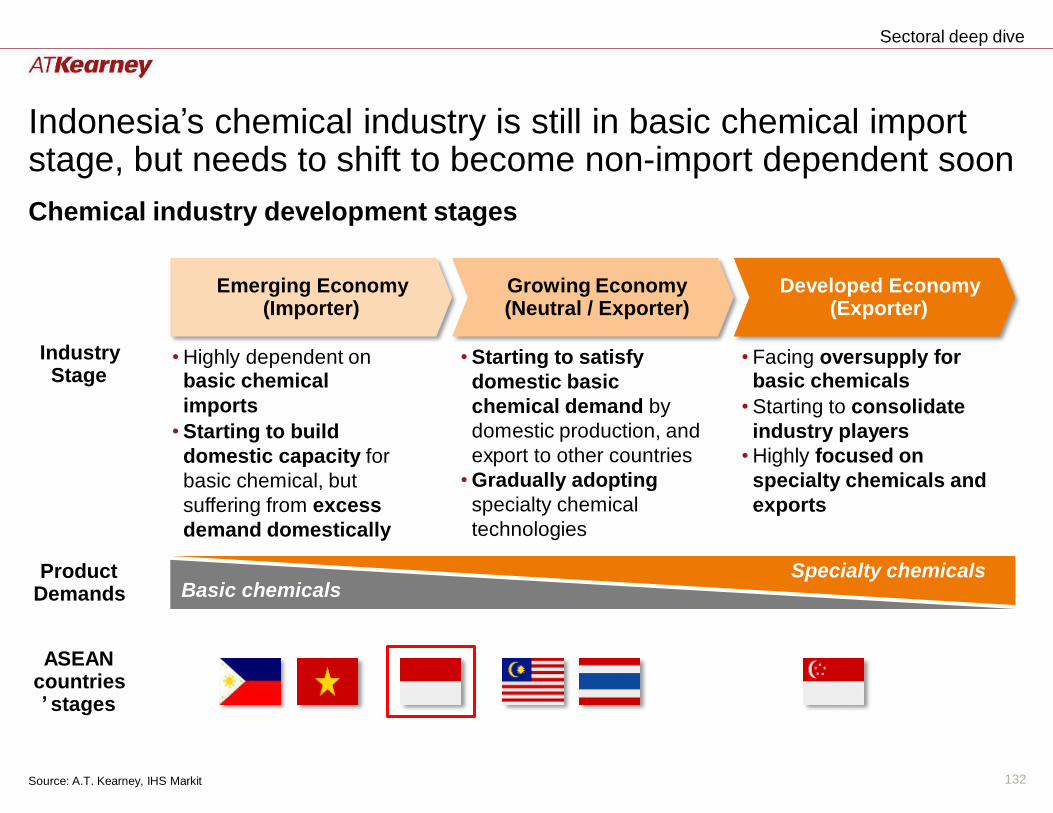
Sectoral deep dive
Indonesia’s chemical industry is still in basic chemical import stage, but needs to shift to become non-import dependent soon
Chemical industry development stages
Emerging Economy (Importer)
Growing Economy (Neutral / Exporter)
Developed Economy (Exporter)
Industry Stage
• Highly dependent on basic chemical
imports
• Starting to build
domestic capacity for
basic chemical, but
suffering from excess
demand domestically
• Starting to satisfy
domestic basic
chemical demand by
domestic production, and
export to other countries
• Gradually adopting
specialty chemical
technologies
• Facing oversupply for basic chemicals
• Starting to consolidate
industry players
• Highly focused on
specialty chemicals and
exports
Specialty chemicals Product Demands Basic chemicals
ASEAN countries ’ stages
132 Source: A.T. Kearney, IHS Markit
Sectoral deep dive
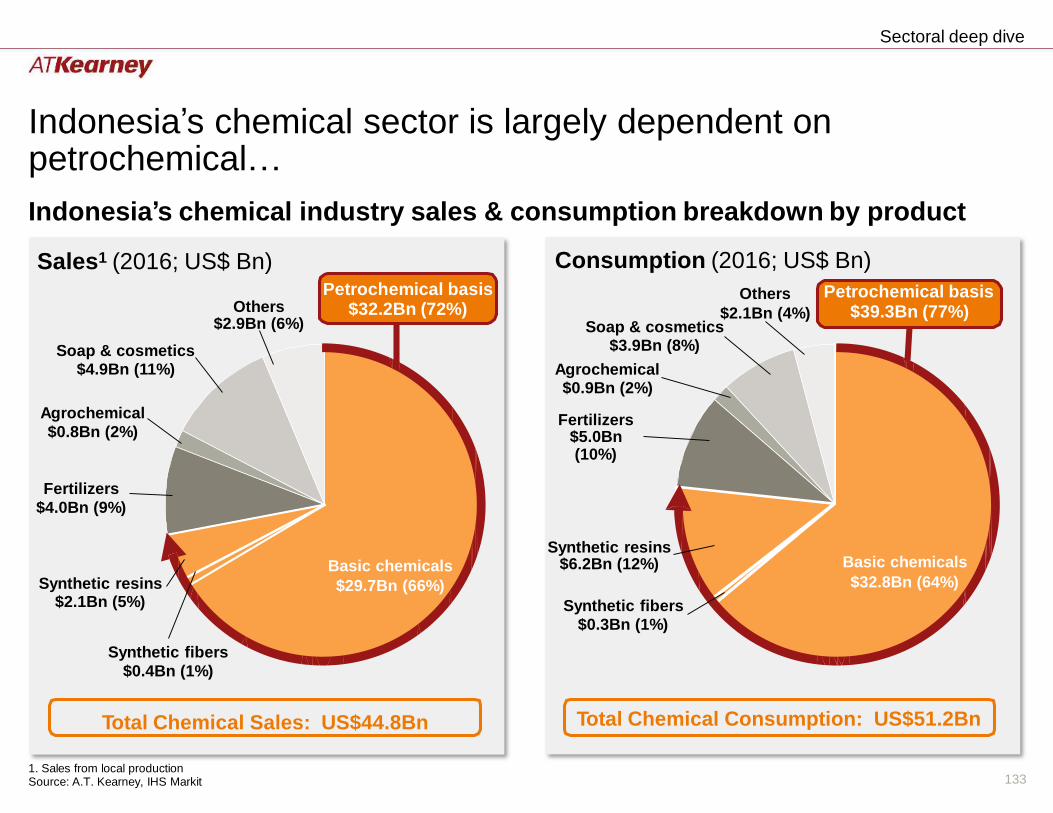
Indonesia’s chemical sector is largely dependent on petrochemical…
Indonesia’s chemical industry sales & consumption breakdown by product
$39.3Bn (77%) $2.1Bn (4%)
$5.0Bn
Basic chemicals $6.2Bn (12%)
Synthetic fibers
1. Sales from local production Source: A.T. Kearney, IHS Markit 133
Consumption (2016; US$ Bn)
Others Petrochemical basis
Soap & cosmetics $3.9Bn (8%)
Agrochemical $0.9Bn (2%)
Fertilizers
(10%)
Synthetic resins
$32.8Bn (64%)
$0.3Bn (1%)
Total Chemical Consumption: US$51.2Bn
Sales1 (2016; US$ Bn) Petrochemical basis
Others $32.2Bn (72%) $2.9Bn (6%)
Soap & cosmetics $4.9Bn (11%)
Agrochemical
$0.8Bn (2%)
Fertilizers
$4.0Bn (9%)
Basic chemicals Synthetic resins $29.7Bn (66%)
$2.1Bn (5%)
Synthetic fibers
$0.4Bn (1%)
Total Chemical Sales: US$44.8Bn
Sectoral deep dive
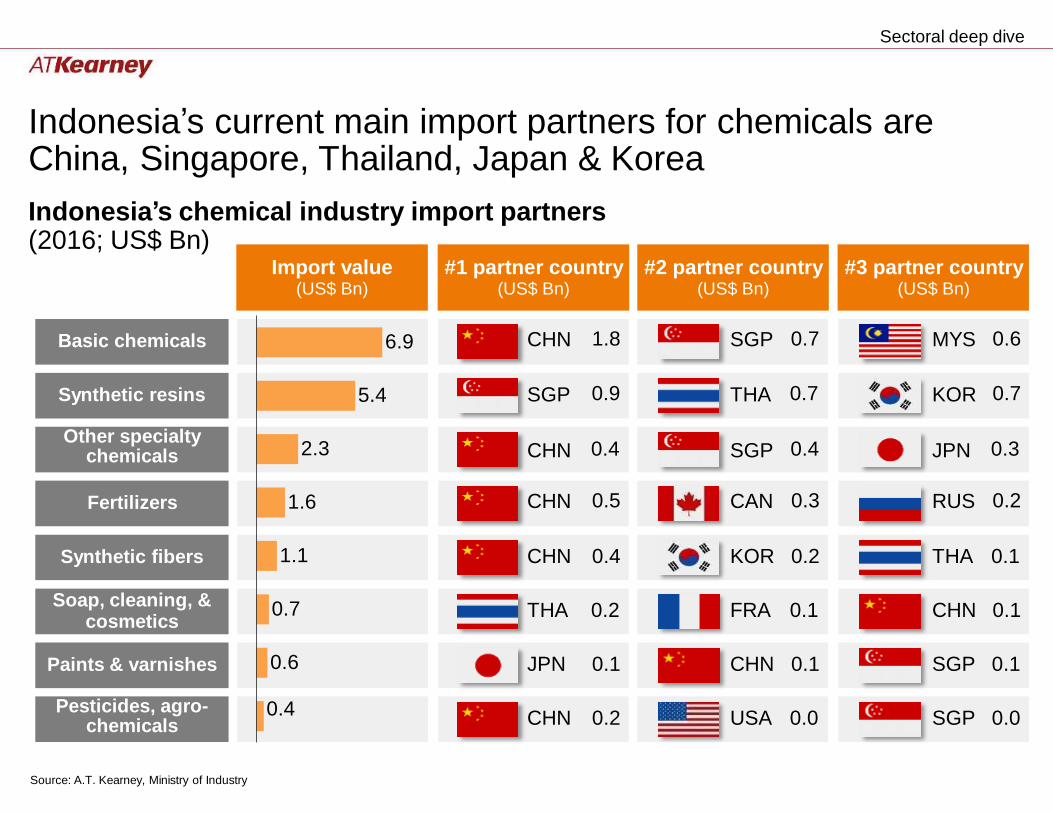
Indonesia’s current main import partners for China, Singapore, Thailand, Japan & Korea
chemicals are
Indonesia’s chemical industry import partners (2016; US$ Bn)
6.9
5.4
2.3
1.6
1.1
0.7
0.6
Source: A.T. Kearney, Ministry of Industry
CHN 0.2
USA 0.0
SGP 0.0 Pesticides, agro-
chemicals
JPN 0.1
CHN 0.1
SGP 0.1
Paints & varnishes
THA 0.2
FRA 0.1
CHN 0.1 Soap, cleaning, &
cosmetics
CHN 0.4
KOR 0.2
THA 0.1
Synthetic fibers
CHN 0.5
CAN 0.3
RUS 0.2
Fertilizers
CHN 0.4
SGP 0.4
JPN 0.3 Other specialty
chemicals
SGP 0.9
THA 0.7
KOR 0.7
Synthetic resins
CHN 1.8
SGP 0.7
MYS 0.6
0.4
Basic chemicals
Import value (US$ Bn)
#1 partner country (US$ Bn)
#2 partner country (US$ Bn)
#3 partner country (US$ Bn)
Sectoral deep dive
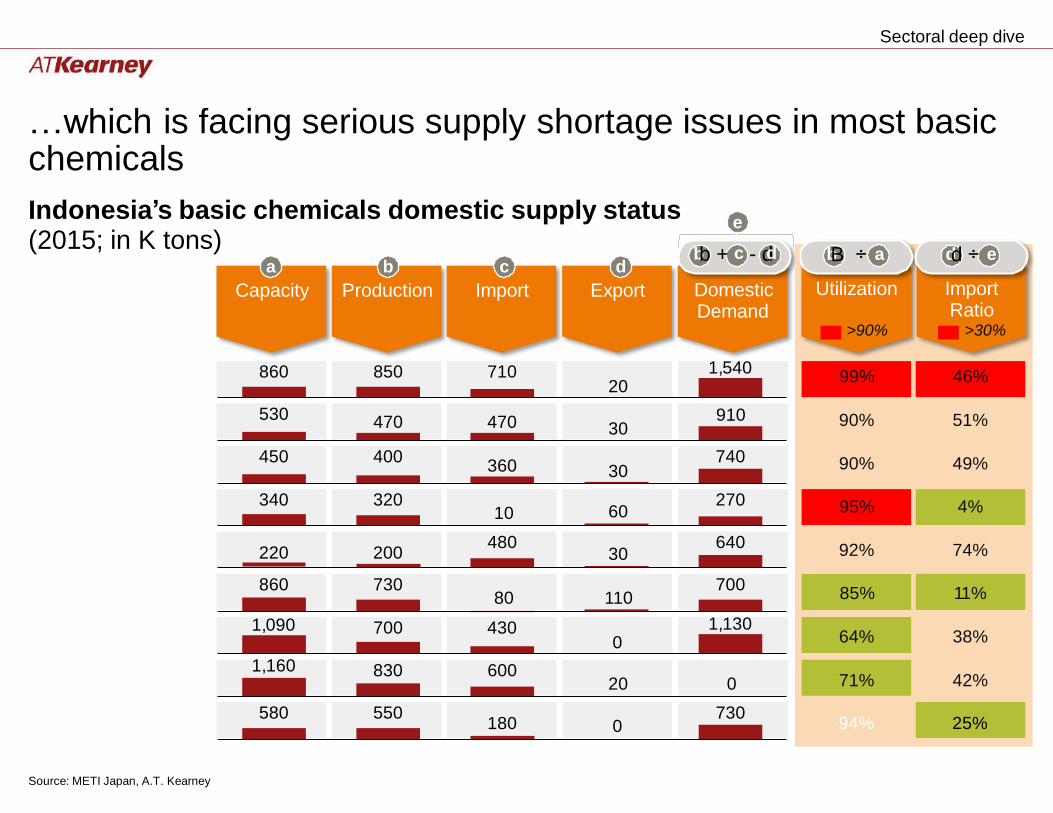
…which is facing serious supply shortage issues chemicals
Indonesia’s basic chemicals domestic supply status
in most basic
e
bb + c - dd
Domestic Demand
(2015; in K tons) a
Capacity
b
Production
c
Import
d
Export
1,540 Ethylene
910 Low Density
High Density
Styrene Monomer
Ethylene Glycol
PVC
1,130 Propylene
Polypropylene
Benzene
Source: METI Japan, A.T. Kearney
580 550
180
0 730
1,160 830 600
20
0
1,090 700 430
0
860 730
80
110 700
220
200 480
30 640
340 320
10
60 270
450 400
360
30 740
530
470
470
30
860 850 710
20
bB ÷ a dd ÷ e
Utilization Import Ratio
>90% >30%
99% 46%
90% 51%
90% 49%
95% 4%
92% 74%
85% 11%
64% 38%
71% 42%
94% 25%
Sectoral deep dive
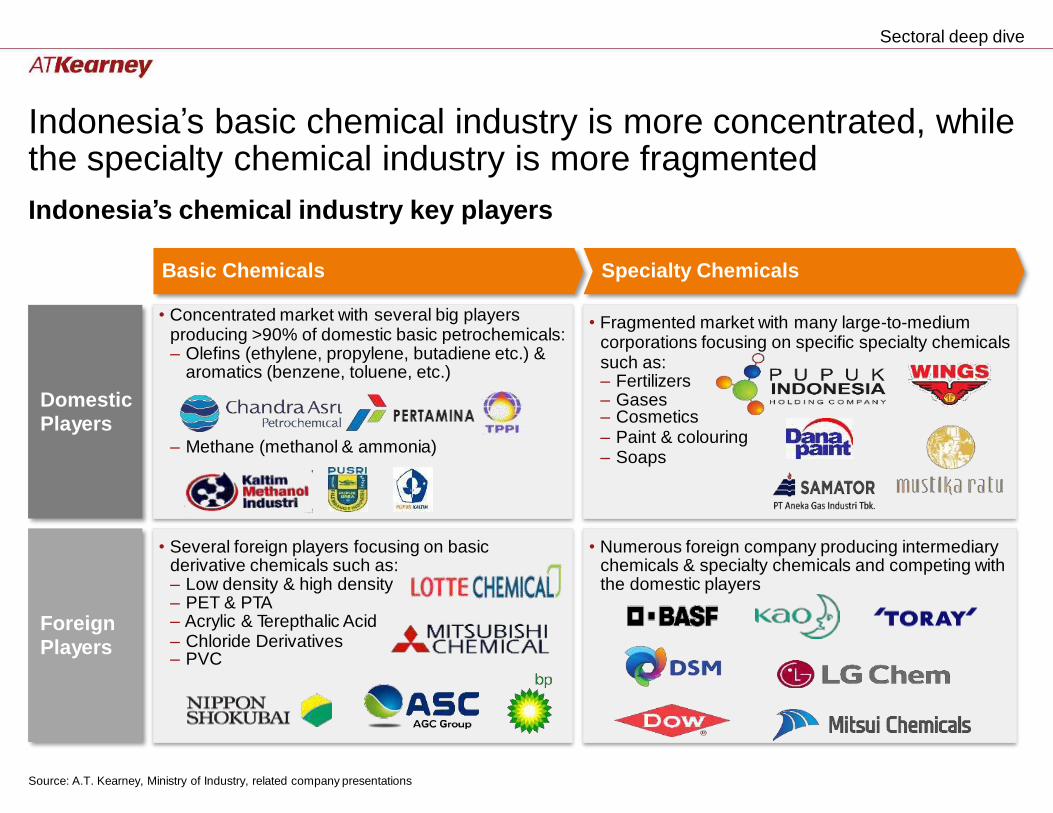
Indonesia’s basic chemical industry is more concentrated, the specialty chemical industry is more fragmented
Indonesia’s chemical industry key players
while
Basic Chemicals Specialty Chemicals
– Cosmetics
– Chloride Derivatives
Source: A.T. Kearney, Ministry of Industry, related company presentations
• Several foreign players focusing on basic derivative chemicals such as: – Low density & high density – PET & PTA – Acrylic & Terepthalic Acid
– PVC
• Numerous foreign company producing intermediary chemicals & specialty chemicals and competing with the domestic players
Foreign Players
• Concentrated market with several big players producing >90% of domestic basic petrochemicals: – Olefins (ethylene, propylene, butadiene etc.) &
aromatics (benzene, toluene, etc.)
– Methane (methanol & ammonia)
• Fragmented market with many large-to-medium corporations focusing on specific specialty chemicals such as: – Fertilizers – Gases
– Paint & colouring – Soaps
Domestic Players
Sectoral deep dive
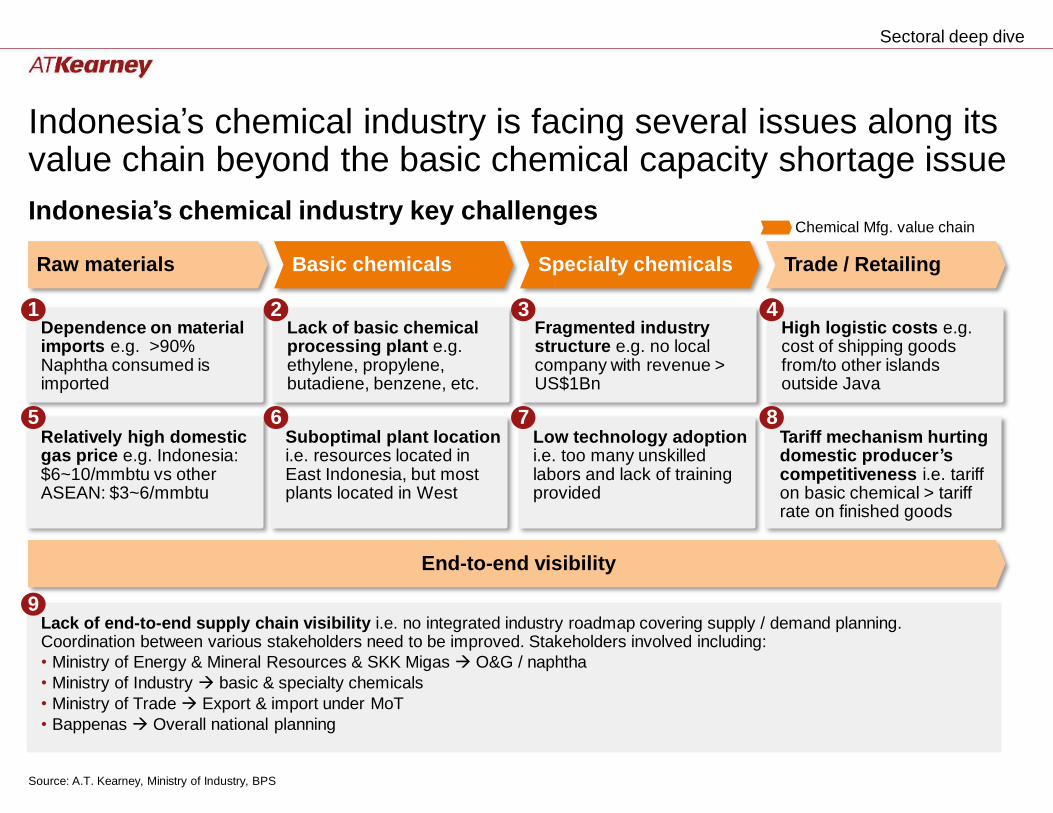
Indonesia’s chemical industry is facing several issues along its value chain beyond the basic chemical capacity
Indonesia’s chemical industry key challenges
shortage issue
Chemical Mfg. value chain
Raw materials Basic chemicals Specialty chemicals Trade / Retailing
1 2 3 4
5 6 7 8
End-to-end visibility
9
Source: A.T. Kearney, Ministry of Industry, BPS
Lack of end-to-end supply chain visibility i.e. no integrated industry roadmap covering supply / demand planning. Coordination between various stakeholders need to be improved. Stakeholders involved including:
• Ministry of Energy & Mineral Resources & SKK Migas O&G / naphtha
• Ministry of Industry basic & specialty chemicals
• Ministry of Trade Export & import under MoT
• Bappenas Overall national planning
Relatively high domestic gas price e.g. Indonesia: $6~10/mmbtu vs other ASEAN: $3~6/mmbtu
Suboptimal plant location i.e. resources located in East Indonesia, but most plants located in West
Low technology adoption i.e. too many unskilled labors and lack of training provided
Tariff mechanism hurting domestic producer’s competitiveness i.e. tariff on basic chemical > tariff rate on finished goods
Dependence on material imports e.g. >90% Naphtha consumed is imported
Lack of basic chemical processing plant e.g. ethylene, propylene, butadiene, benzene, etc.
Fragmented industry structure e.g. no local company with revenue > US$1Bn
High logistic costs e.g. cost of shipping goods from/to other islands outside Java
Sectoral deep dive
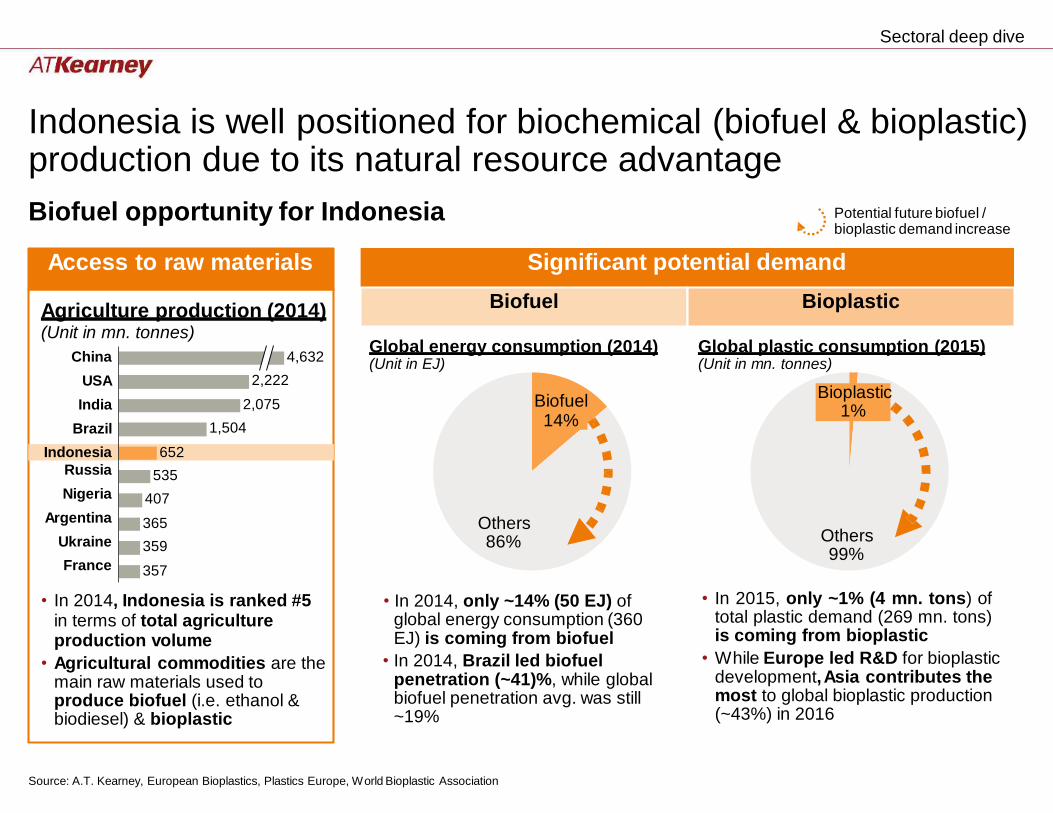
Indonesia is well positioned for biochemical (biofuel & bioplastic) production due to its natural resource advantage
Biofuel opportunity for Indonesia Potential future biofuel / bioplastic demand increase
Global energy consumption (2014) Global plastic consumption (2015) (Unit in EJ) (Unit in mn. tonnes)
14%
Others 86% Others
99%
• In 2015, only ~1% (4 mn. tons) of total plastic demand (269 mn. tons) is coming from bioplastic
• While Europe led R&D for bioplastic development, Asia contributes the most to global bioplastic production (~43%) in 2016
• In 2014, only ~14% (50 EJ) of global energy consumption (360 EJ) is coming from biofuel
• In 2014, Brazil led biofuel penetration (~41)%, while global biofuel penetration avg. was still ~19%
Source: A.T. Kearney, European Bioplastics, Plastics Europe, World Bioplastic Association
Biofuel Bioplastic
1%
Significant potential demand
Biofuel Bioplastic
Access to raw materials
Agriculture production (2014) (Unit in mn. tonnes)
China
USA
India
Brazil
4,632
2,222
2,075
1,504
Indonesia 652
Russia
Nigeria
Argentina
Ukraine
France
535
407
365 359
357
• In 2014, Indonesia is ranked #5 in terms of total agriculture production volume
• Agricultural commodities are the main raw materials used to produce biofuel (i.e. ethanol & biodiesel) & bioplastic
Sectoral deep dive
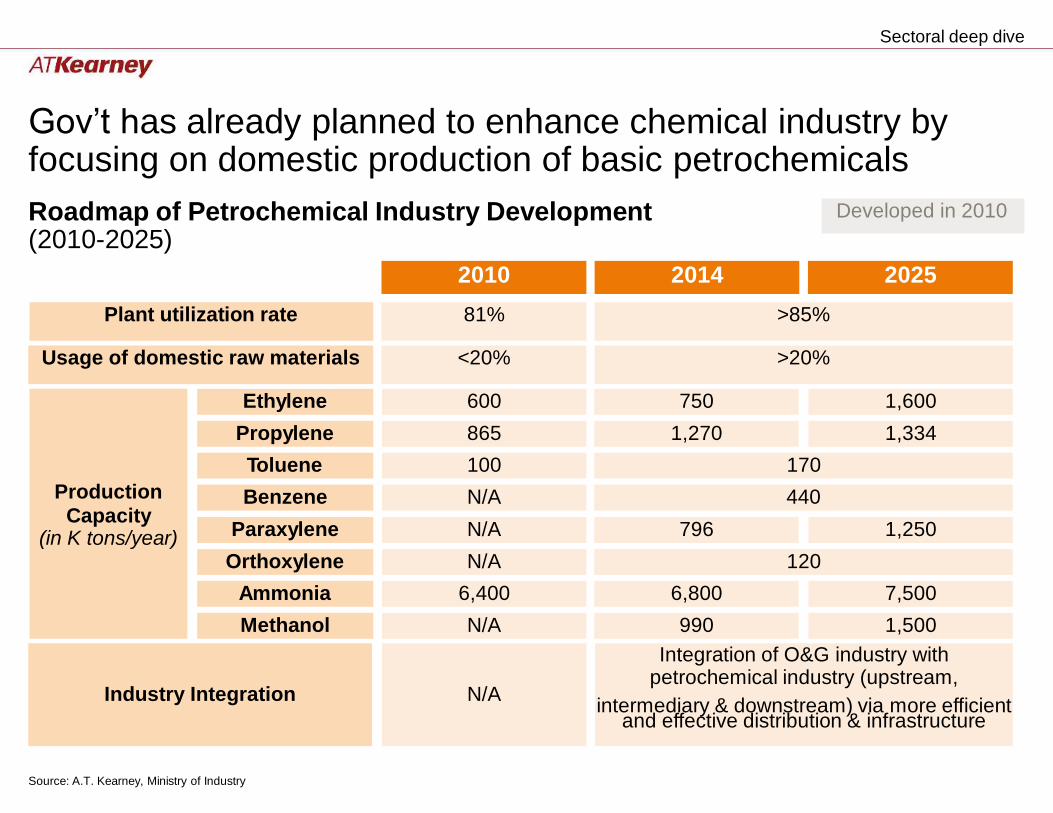
Gov’t has already planned to enhance chemical industry by focusing on domestic production of basic petrochemicals
Roadmap of (2010-2025)
Petrochemical Industry Development
intermediary & downstream) via more efficient
Source: A.T. Kearney, Ministry of Industry
Industry Integration
N/A
Integration of O&G industry with petrochemical industry (upstream,
and effective distribution & infrastructure
Methanol N/A 990 1,500
Ammonia 6,400 6,800 7,500
Orthoxylene N/A 120
Paraxylene N/A 796 1,250
Benzene N/A 440
Toluene 100 170
Propylene 865 1,270 1,334
Ethylene 600 750 1,600
Production
Capacity (in K tons/year)
Usage of domestic raw materials <20% >20%
Plant utilization rate 81% >85%
2010 2014 2025
Developed in 2010
Sectoral deep dive
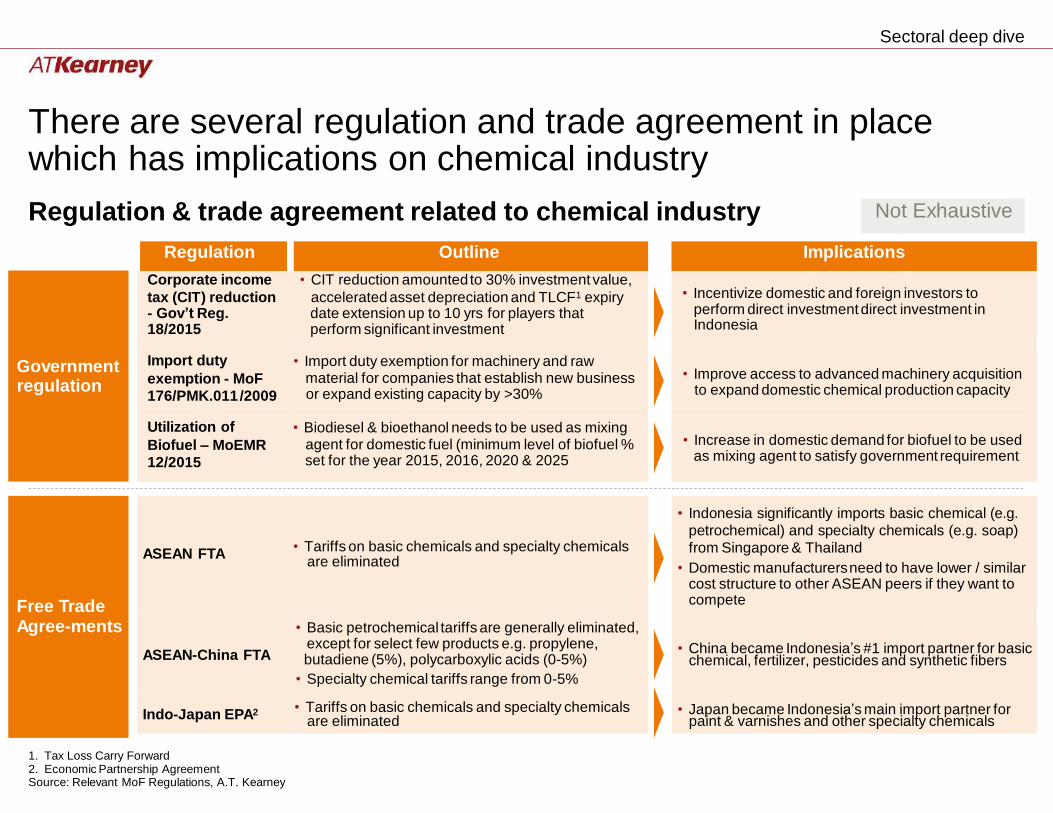
There are several regulation and trade agreement in place which has implications on chemical industry
Regulation & trade agreement related to chemical industry
perform direct investment direct investment in
regulation
as mixing agent to satisfy government requirement
are eliminated
chemical, fertilizer, pesticides and synthetic fibers
are eliminated paint & varnishes and other specialty chemicals
1. Tax Loss Carry Forward 2. Economic Partnership Agreement Source: Relevant MoF Regulations, A.T. Kearney
ASEAN FTA • Tariffs on basic chemicals and specialty chemicals
• Basic petrochemical tariffs are generally eliminated, except for select few products e.g. propylene,
ASEAN-China FTA butadiene (5%), polycarboxylic acids (0-5%)
• Specialty chemical tariffs range from 0-5%
Indo-Japan EPA2 • Tariffs on basic chemicals and specialty chemicals
• Indonesia significantly imports basic chemical (e.g.
petrochemical) and specialty chemicals (e.g. soap)
from Singapore & Thailand
• Domestic manufacturers need to have lower / similar cost structure to other ASEAN peers if they want to compete
• China became Indonesia’s #1 import partner for basic
• Japan became Indonesia’s main import partner for
Free Trade Agree-ments
Government
Implications
• Incentivize domestic and foreign investors to
Indonesia
• Improve access to advanced machinery acquisition to expand domestic chemical production capacity
• Increase in domestic demand for biofuel to be used
Regulation Outline
Corporate income • CIT reduction amounted to 30% investment value,
tax (CIT) reduction accelerated asset depreciation and TLCF1 expiry - Gov’t Reg. date extension up to 10 yrs for players that 18/2015 perform significant investment
Import duty • Import duty exemption for machinery and raw
exemption - MoF material for companies that establish new business 176/PMK.011 /2009 or expand existing capacity by >30%
Utilization of • Biodiesel & bioethanol needs to be used as mixing
Biofuel – MoEMR agent for domestic fuel (minimum level of biofuel % 12/2015 set for the year 2015, 2016, 2020 & 2025
Not Exhaustive
Sectoral deep dive
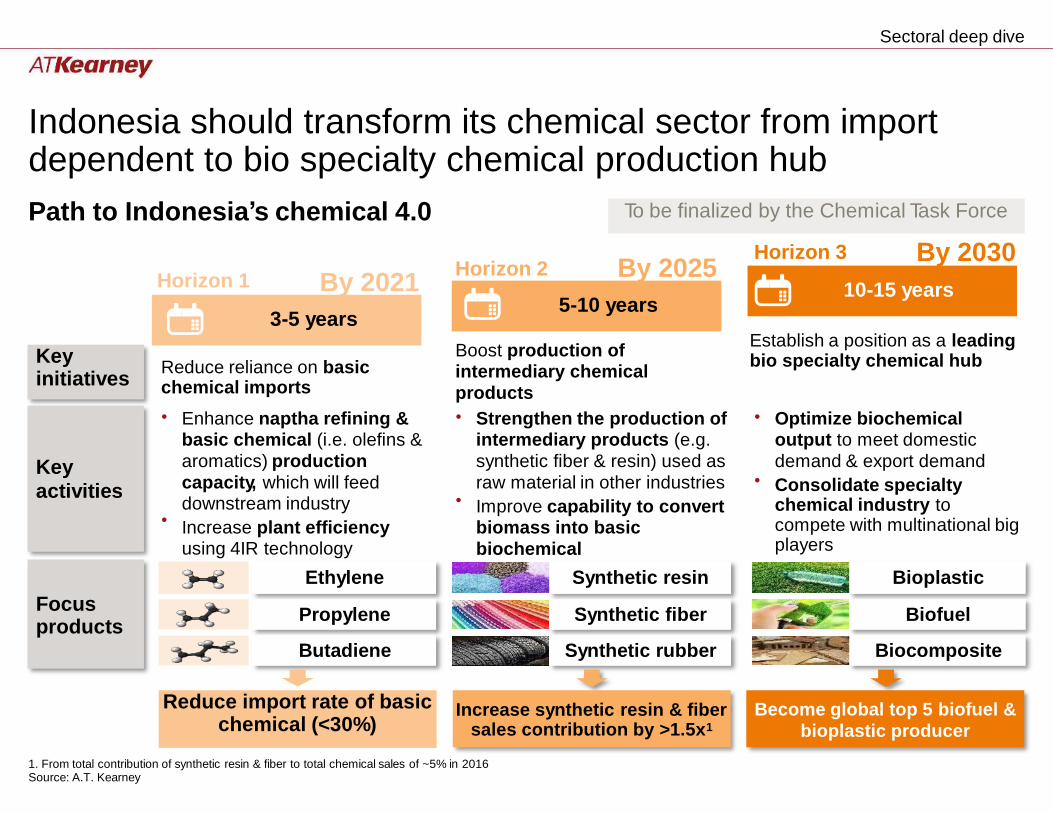
Indonesia should transform its chemical sector from import dependent to bio specialty chemical production hub
Path to Indonesia’s chemical 4.0
By 2030 Horizon 3 By 2025 Horizon 2
Horizon 1 By 2021
Establish a position as a leading bio specialty chemical hub
Boost production of intermediary chemical
products
Reduce reliance on basic chemical imports
• Enhance naptha refining & basic chemical (i.e. olefins &
aromatics) production
capacity, which will feed downstream industry
Increase plant efficiency using 4IR technology
• Strengthen the production of intermediary products (e.g.
synthetic fiber & resin) used as
raw material in other industries
Improve capability to convert biomass into basic
biochemical
• Optimize biochemical output to meet domestic
demand & export demand
Consolidate specialty chemical industry to compete with multinational big players
• •
•
Ethylene Synthetic resin Bioplastic
Propylene Synthetic fiber Biofuel
Butadiene Synthetic rubber Biocomposite
1. From total contribution of synthetic resin & fiber to total chemical sales of ~5% in 2016 Source: A.T. Kearney
Increase synthetic resin & fiber sales contribution by >1.5x1
Become global top 5 biofuel &
bioplastic producer
Reduce import rate of basic chemical (<30%)
Focus products
Key activities
Key initiatives
3-5 years
5-10 years
10-15 years
To be finalized by the Chemical Task Force
Sectoral deep dive
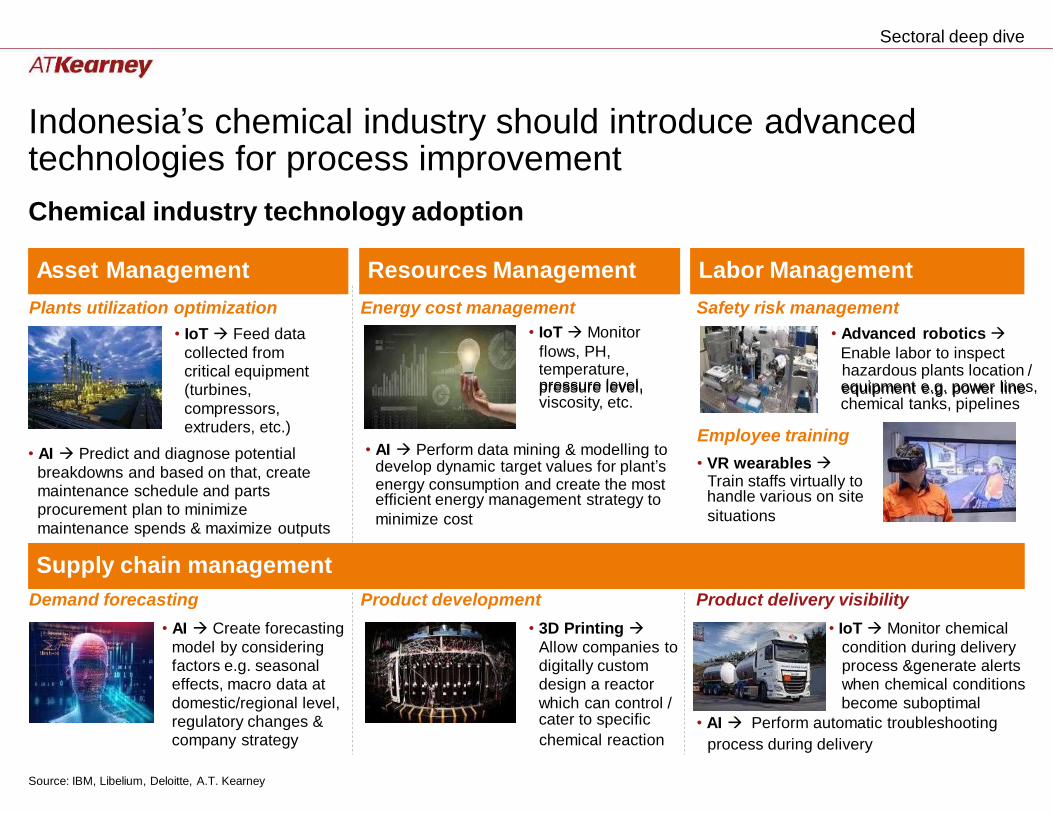
Indonesia’s chemical industry should introduce technologies for process improvement
advanced
Chemical industry technology adoption
flows, PH, Enable labor to inspect /
pressure level, viscosity, etc.
equipment e.g. power lines, chemical tanks, pipelines
• AI Perform data mining & modelling to
Train staffs virtually to energy consumption and create the most
situations minimize cost
chemical reaction process during delivery
Source: IBM, Libelium, Deloitte, A.T. Kearney
Plants utilization optimization
• IoT Feed data
collected from critical equipment (turbines,
compressors, extruders, etc.)
• AI Predict and diagnose potential
breakdowns and based on that, create maintenance schedule and parts procurement plan to minimize
maintenance spends & maximize outputs
Energy cost management Safety risk management
• IoT Monitor • Advanced robotics
temperature, hazardous plants location pressure level, equipment e.g. power line
Employee training
develop dynamic target values for plant’s • VR wearables
efficient energy management strategy to handle various on site
Supply chain management
Demand forecasting
• AI Create forecasting
model by considering factors e.g. seasonal effects, macro data at
domestic/regional level, regulatory changes & company strategy
Product development Product delivery visibility
• 3D Printing • IoT Monitor chemical
Allow companies to condition during delivery digitally custom process &generate alerts design a reactor when chemical conditions
which can control / become suboptimal cater to specific • AI Perform automatic troubleshooting
Asset Management
Resources Management
Labor Management
on
-
on
-
Sectoral deep dive
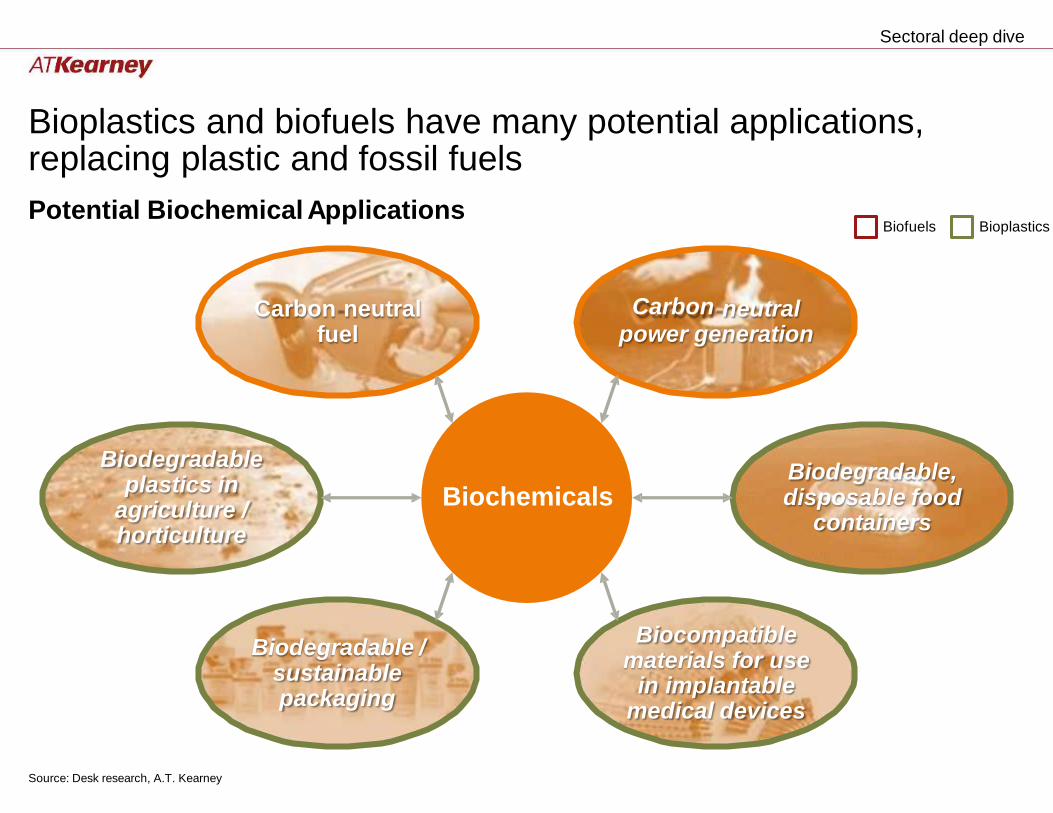
Bioplastics and biofuels have many replacing plastic and fossil fuels
Potential Biochemical Applications
potential applications,
Biofuels Bioplastics
Carbon neutral fuel
Carbon neutral power generation
Biodegradable plastics in
agriculture / horticulture
Biodegradable, disposable food
containers Biochemicals
Biocompatible materials for use
in implantable medical devices
Biodegradable / sustainable packaging
Source: Desk research, A.T. Kearney
Lampiran Energi/Kelistrikan
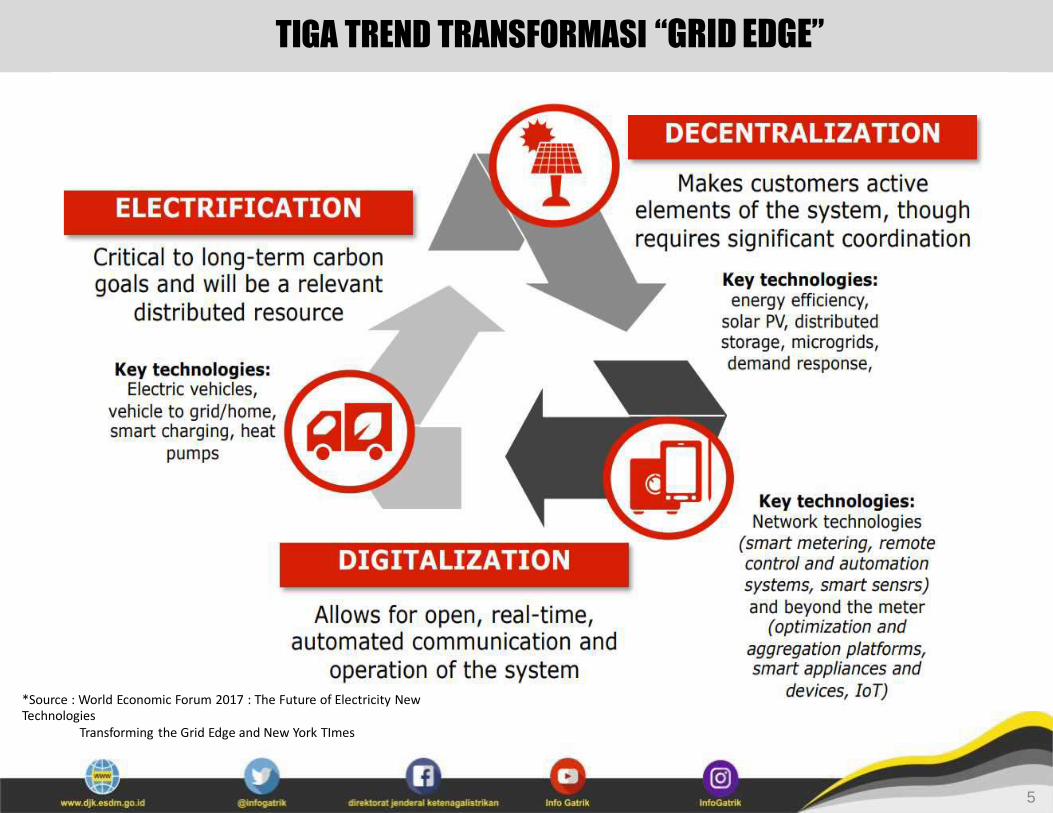
TIGA TREND TRANSFORMASI “GRID EDGE”
*Source : World Economic Forum 2017 : The Future of Electricity New Technologies
Transforming the Grid Edge and New York TImes
5
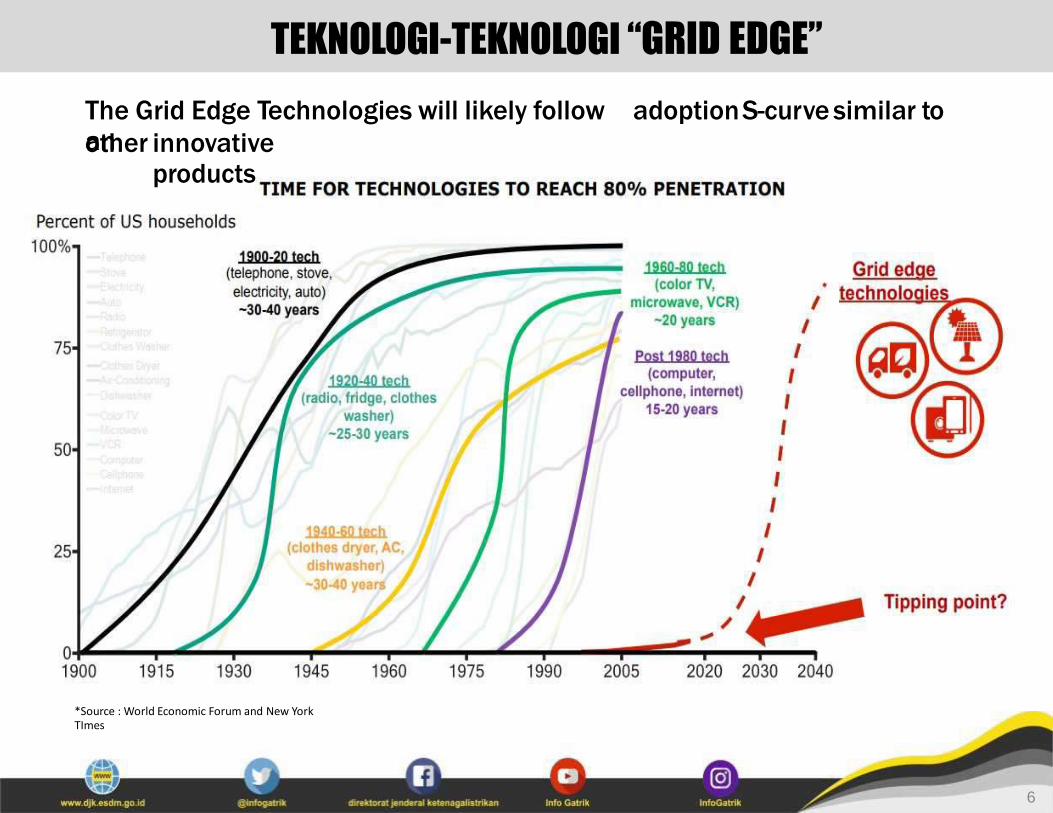
TEKNOLOGI-TEKNOLOGI “GRID EDGE”
The Grid Edge Technologies will likely follow an
adoption S-curve similar to
other innovative products
*Source : World Economic Forum and New York TImes
6
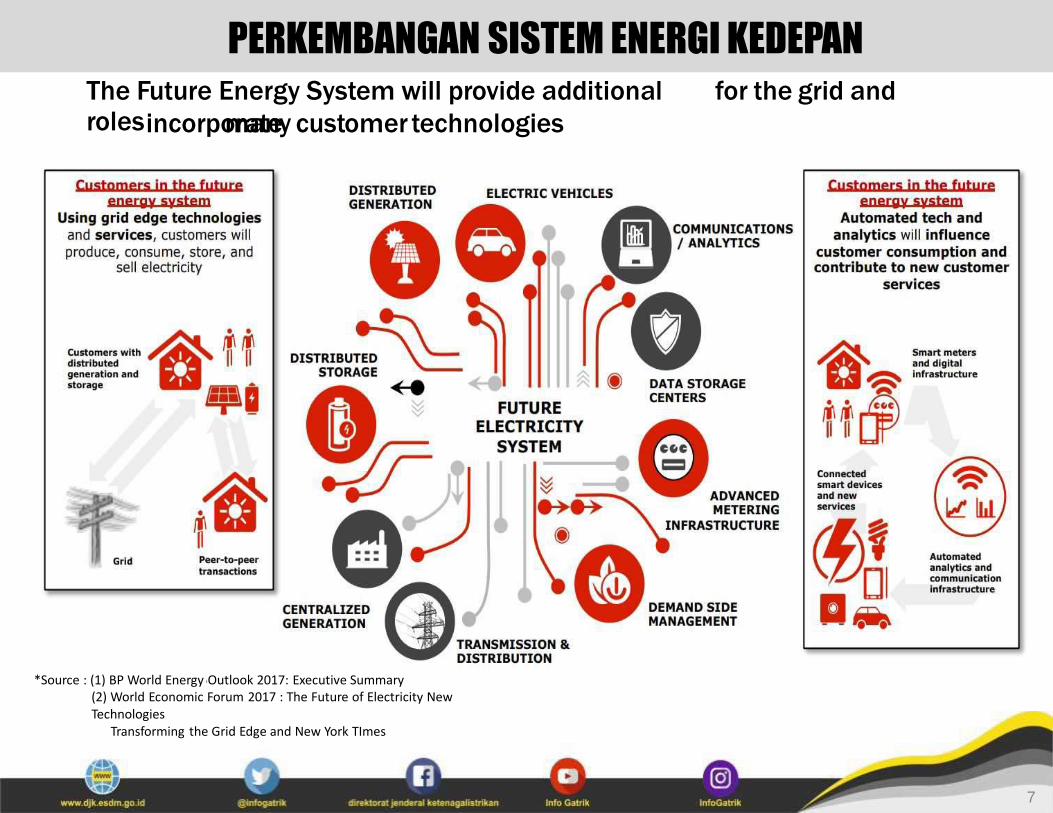
PERKEMBANGAN SISTEM ENERGI KEDEPAN
The Future Energy System will provide additional roles
for the grid and
incorporate many customer technologies
*Source : (1) BP World Energy Outlook 2017: Executive Summary (2) World Economic Forum 2017 : The Future of Electricity New Technologies
Transforming the Grid Edge and New York TImes
7
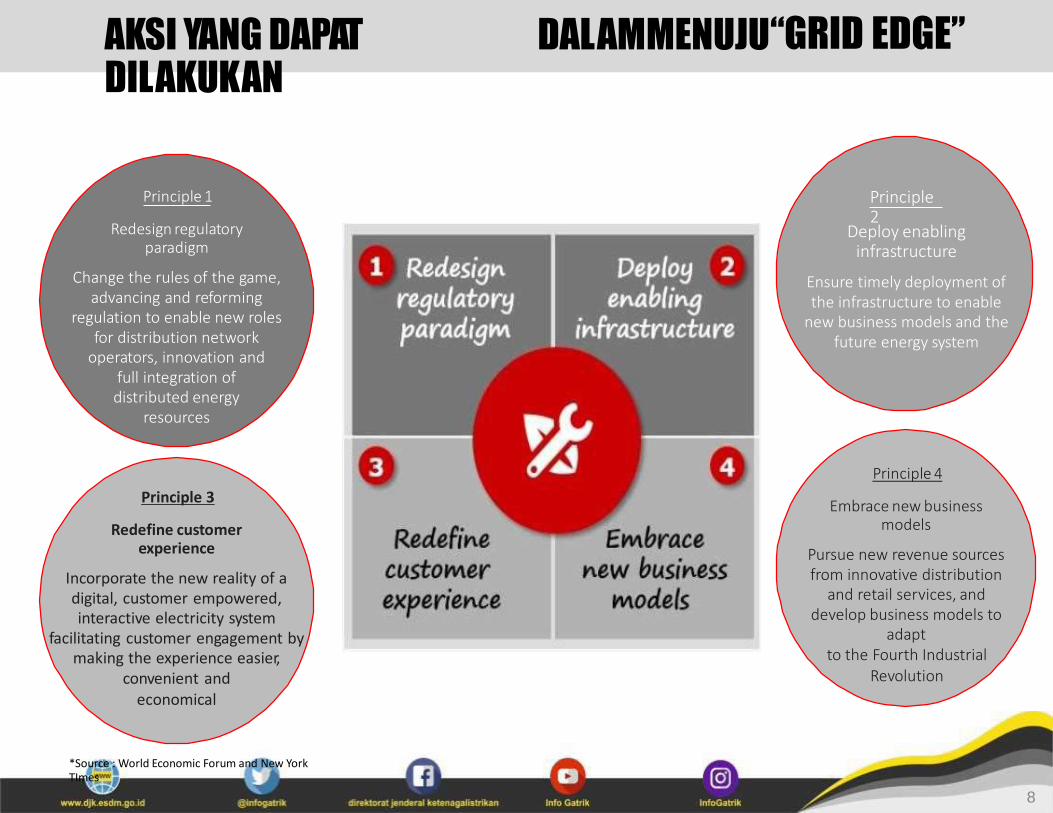
“GRID EDGE” AKSI YANG DAPAT DILAKUKAN
DALAM MENUJU
Principle 1 Principle 2
Redesign regulatory paradigm
Change the rules of the game, advancing and reforming
regulation to enable new roles for distribution network
operators, innovation and full integration of distributed energy
resources
Deploy enabling infrastructure
Ensure timely deployment of the infrastructure to enable
new business models and the future energy system
Principle 4 Principle 3 Embrace new business
models Pursue new revenue sources from innovative distribution
and retail services, and develop business models to
adapt to the Fourth Industrial
Revolution
Redefine customer experience
Incorporate the new reality of a digital, customer empowered, interactive electricity system
facilitating customer engagement by making the experience easier,
convenient and economical
*Source : World Economic Forum and New York TImes
8
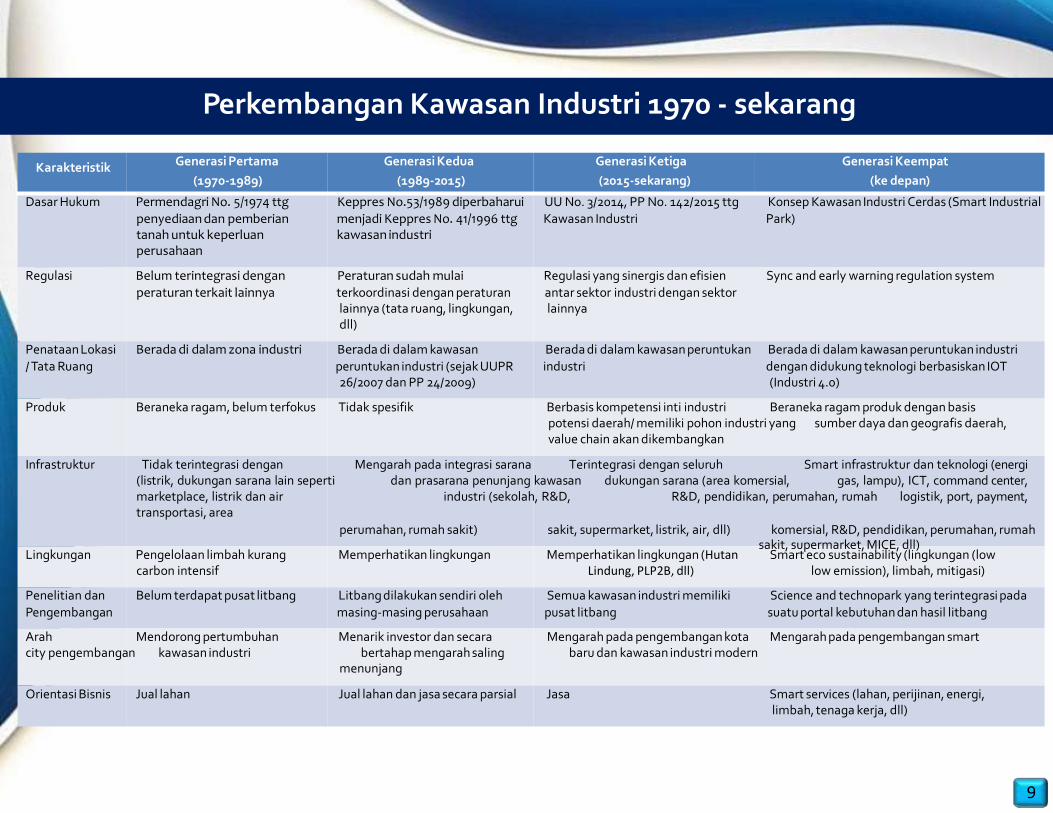
Perkembangan Kawasan Industri 1970 - sekarang
(1970-1989) (1989-2015) (2015-sekarang) (ke depan)
9
Karakteristik Generasi Pertama Generasi Kedua Generasi Ketiga Generasi Keempat
Dasar Hukum Permendagri No. 5/1974 ttg Keppres No.53/1989 diperbaharui UU No. 3/2014, PP No. 142/2015 ttg Konsep Kawasan Industri Cerdas (Smart Industrial
penyediaan dan pemberian menjadi Keppres No. 41/1996 ttg Kawasan Industri Park) tanah untuk keperluan kawasan industri perusahaan
Regulasi Belum terintegrasi dengan Peraturan sudah mulai Regulasi yang sinergis dan efisien Sync and early warning regulation system
peraturan terkait lainnya terkoordinasi dengan peraturan antar sektor industri dengan sektor lainnya (tata ruang, lingkungan, lainnya dll)
Penataan Lokasi Berada di dalam zona industri Berada di dalam kawasan Berada di dalam kawasan peruntukan Berada di dalam kawasan peruntukan industri
/ Tata Ruang peruntukan industri (sejak UUPR industri dengan didukung teknologi berbasiskan IOT 26/2007 dan PP 24/2009) (Industri 4.0)
Produk Beraneka ragam, belum terfokus Tidak spesifik Berbasis kompetensi inti industri Beraneka ragam produk dengan basis potensi daerah/ memiliki pohon industri yang sumber daya dan geografis daerah, value chain akan dikembangkan
Infrastruktur Tidak terintegrasi dengan Mengarah pada integrasi sarana Terintegrasi dengan seluruh Smart infrastruktur dan teknologi (energi (listrik, dukungan sarana lain seperti dan prasarana penunjang kawasan dukungan sarana (area komersial, gas, lampu), ICT, command center, marketplace, listrik dan air industri (sekolah, R&D, R&D, pendidikan, perumahan, rumah logistik, port, payment, transportasi, area
perumahan, rumah sakit) sakit, supermarket, listrik, air, dll) komersial, R&D, pendidikan, perumahan, rumah sakit, supermarket, MICE, dll)
Lingkungan Pengelolaan limbah kurang Memperhatikan lingkungan Memperhatikan lingkungan (Hutan Smart eco sustainability (lingkungan (low carbon intensif Lindung, PLP2B, dll) low emission), limbah, mitigasi)
Penelitian dan Belum terdapat pusat litbang Litbang dilakukan sendiri oleh Semua kawasan industri memiliki Science and technopark yang terintegrasi pada
Pengembangan masing-masing perusahaan pusat litbang suatu portal kebutuhan dan hasil litbang Arah Mendorong pertumbuhan Menarik investor dan secara Mengarah pada pengembangan kota Mengarah pada pengembangan smart city pengembangan kawasan industri bertahap mengarah saling baru dan kawasan industri modern
menunjang
Orientasi Bisnis Jual lahan Jual lahan dan jasa secara parsial Jasa Smart services (lahan, perijinan, energi, limbah, tenaga kerja, dll)
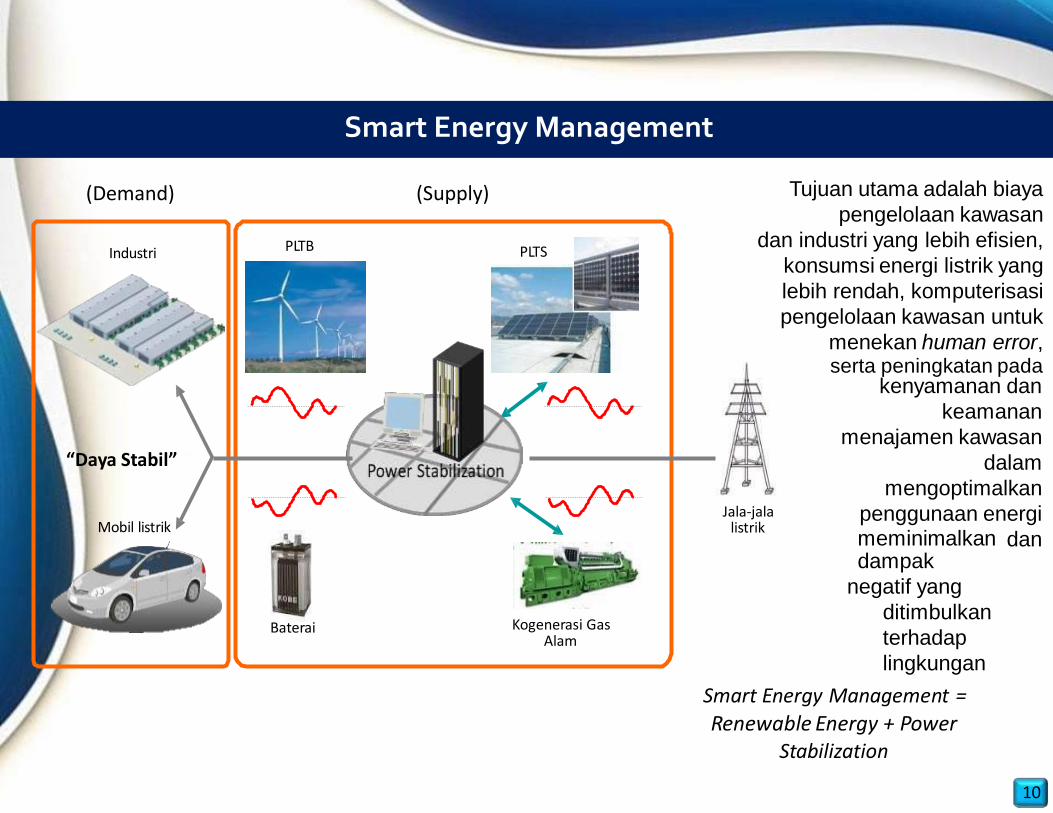
Smart Energy Management Tujuan utama adalah biaya
pengelolaan kawasan
dan industri yang lebih efisien,
konsumsi energi listrik yang
lebih rendah, komputerisasi
pengelolaan kawasan untuk
menekan human error, serta peningkatan pada
kenyamanan dan
keamanan
menajamen kawasan
dalam
mengoptimalkan
penggunaan energi
dan
(Demand) (Supply)
PLTB PLTS Industri
“Daya Stabil”
meminimalkan dampak
negatif yang
ditimbulkan
terhadap
lingkungan
Jala-jala listrik Mobil listrik
Smart Energy Management = Renewable Energy + Power
Stabilization
Kogenerasi Gas Alam
Baterai
10