Embed Size (px)
Citation preview
Making Continuous Quality Improvement Happen:
Beyond the Data Dashboard
November 5, 2018
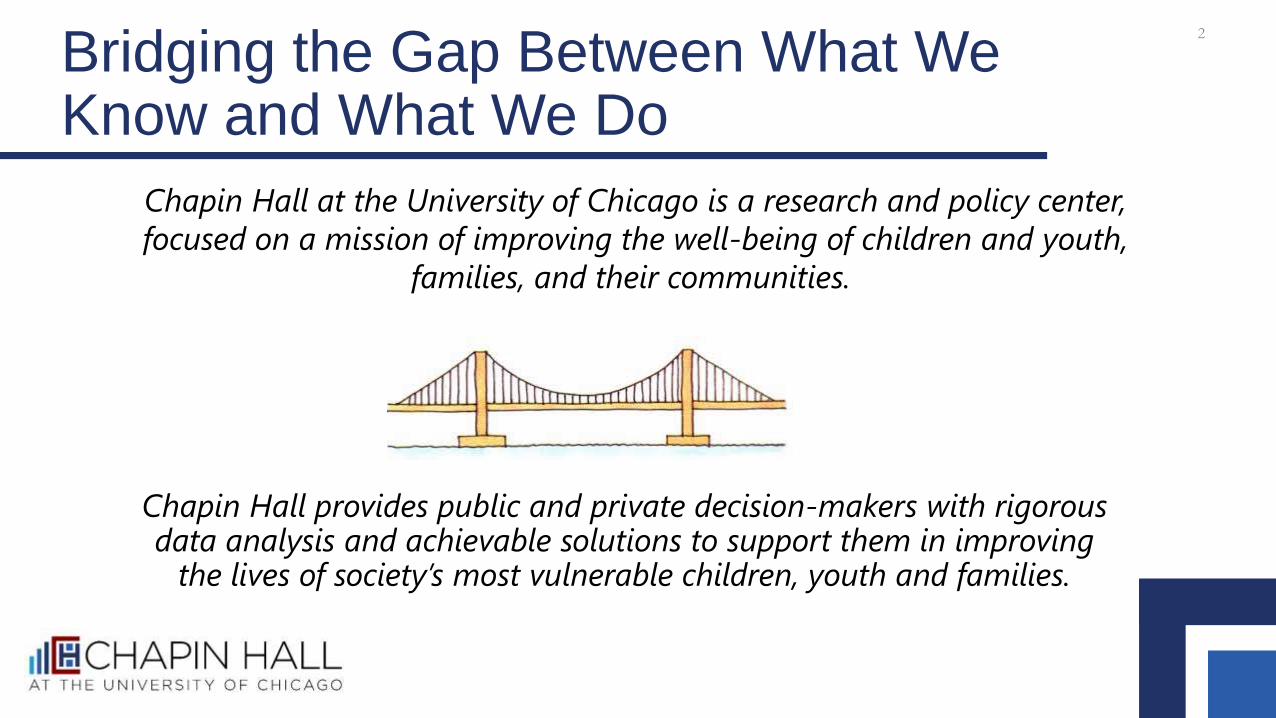
Bridging the Gap Between What We Know and What We Do
Chapin Hall at the University of Chicago is a research and policy center,
focused on a mission of improving the well-being of children and youth,
families, and their communities.
Chapin Hall provides public and private decision-makers with rigorous data analysis and achievable solutions to support them in improving
the lives of society’s most vulnerable children, youth and families.
2
Objectives
Participants will gain a shared understanding of:
• The strategies embraced by one county to bolster their improvement approach and the emerging transformation
• An educational approach to building the capacity of staff to use data to generate evidence
• The core strategies critical to an effective continuous quality improvement process
3
Today’s Presenters
4
Chapin Hall Team:
• Jennifer Haight, Policy Fellow, Chapin Hall at the University of Chicago
• Khush Cooper, Chapin Hall sub-contractor, President & CEO, Khush Cooper and Associates/Implematix
• Yolanda Rogers, Senior Policy Analyst, Chapin Hall at the University of Chicago (facilitator)
Special Guests:
• Michelle Love, Director, Children and Family Services, Alameda County Social Services
• Daniel Webster, Principal Investigator, Child Welfare Indicators Project, Center for Social
Services Research, University of California at Berkeley

The Reasons We Do This Work!

The Alameda County Experience and Partnership with
Chapin Hall at the University of Chicago
The Alameda Experience
• Telling our story
• Ownership of data and program outcomes
• Myth busting, while creating a culture of curiosity
7
The Approach in Alameda
8
Desired Results of the Alameda-Chapin Hall Partnership:
• To create an enhanced dashboard to monitor
performance on a specific set of priority outcomes &
indicators
• To use information from the enhanced dashboard to fuel
a new CQI process
The Approach in Alameda
9
Capacity Building
• Engaged staff and Division Directors to explore strengths and barriers of the existing
dashboard
• Developed a set of recommendations and co-facilitated dashboard revisions and
implementation
• Co-developed a proposal for a new quarterly CQI process using the enhanced dashboard
• Increased the level of engagement and ownership of the data and CQI process by
Program Managers
• Leveraged the existing management meetings to have actionable, real time CQI
presentations
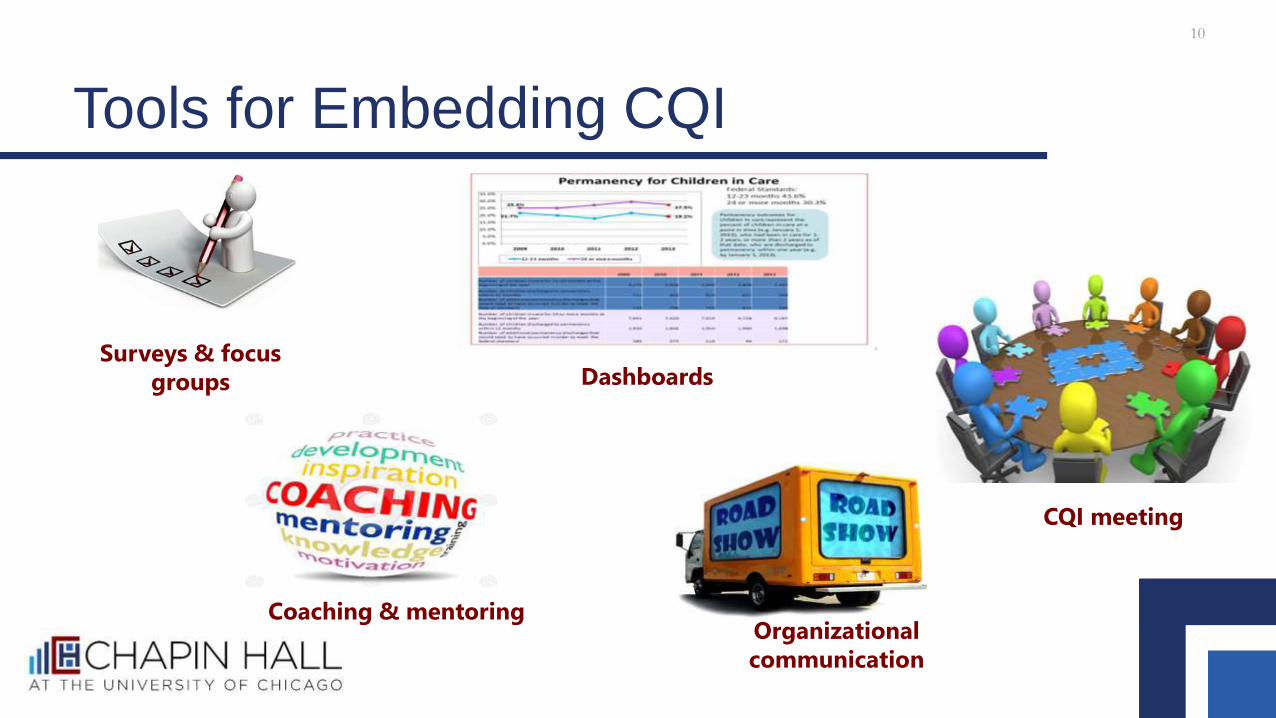
Tools for Embedding CQI
10
Surveys & focus
groups
Organizational
communication
Dashboards
Coaching & mentoring
CQI meeting
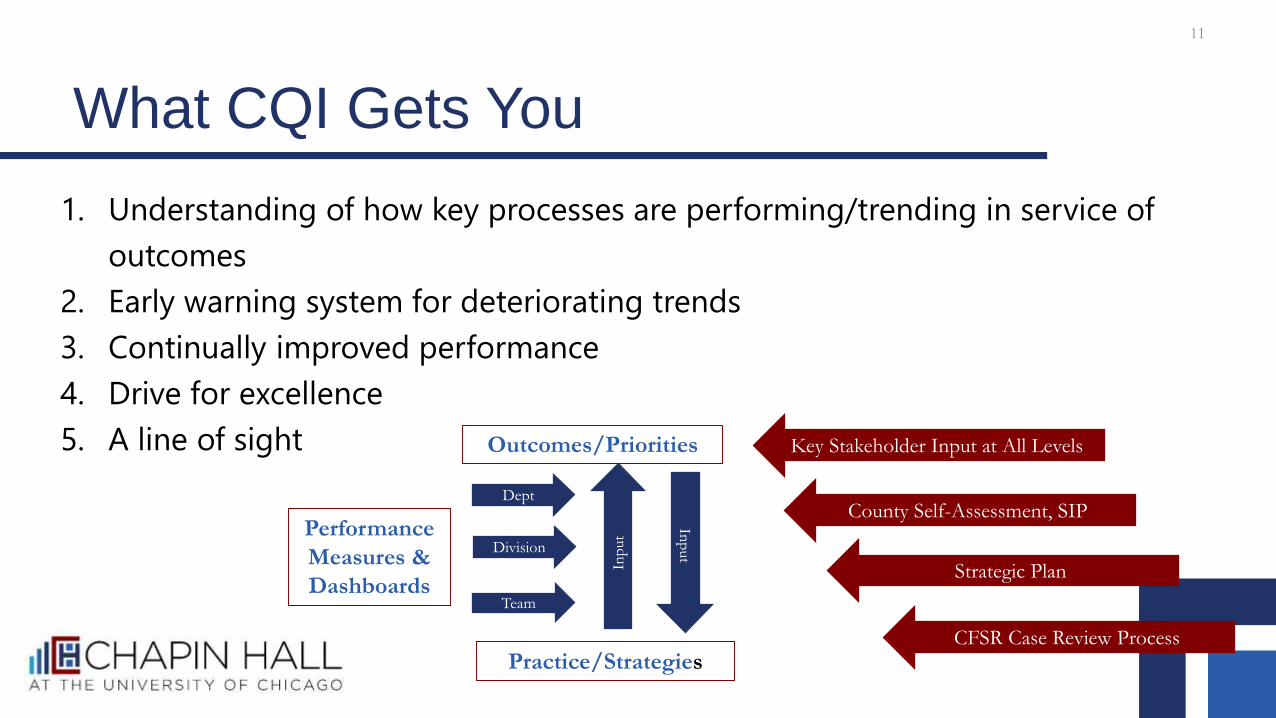
What CQI Gets You
11
1. Understanding of how key processes are performing/trending in service of
outcomes
2. Early warning system for deteriorating trends
3. Continually improved performance
4. Drive for excellence
5. A line of sight Outcomes/Priorities
Practice/Strategies
Performance
Measures &
Dashboards
Dept
Inp
ut
Inp
ut
Division
Team
Key Stakeholder Input at All Levels
County Self-Assessment, SIP
Strategic Plan
CFSR Case Review Process
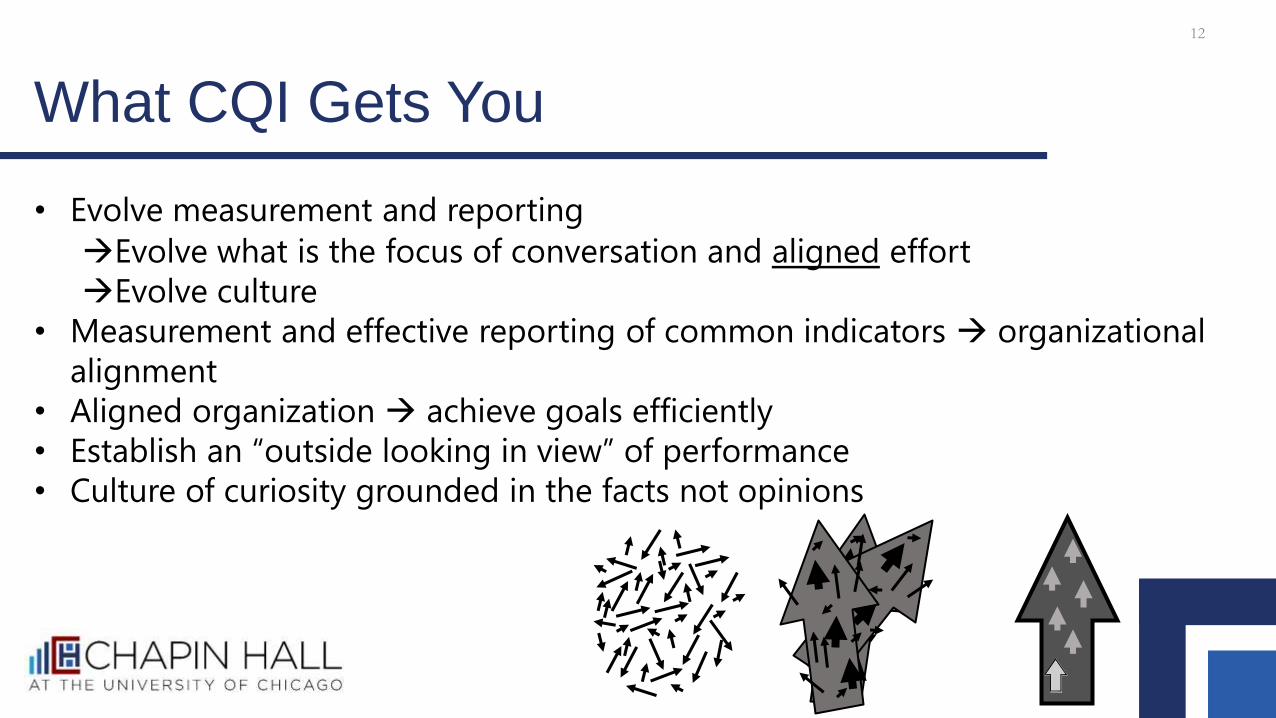
What CQI Gets You
12
• Evolve measurement and reporting
Evolve what is the focus of conversation and aligned effort
Evolve culture
• Measurement and effective reporting of common indicators organizational
alignment
• Aligned organization achieve goals efficiently
• Establish an “outside looking in view” of performance
• Culture of curiosity grounded in the facts not opinions

Generating Sound Evidence to
Fuel CQI
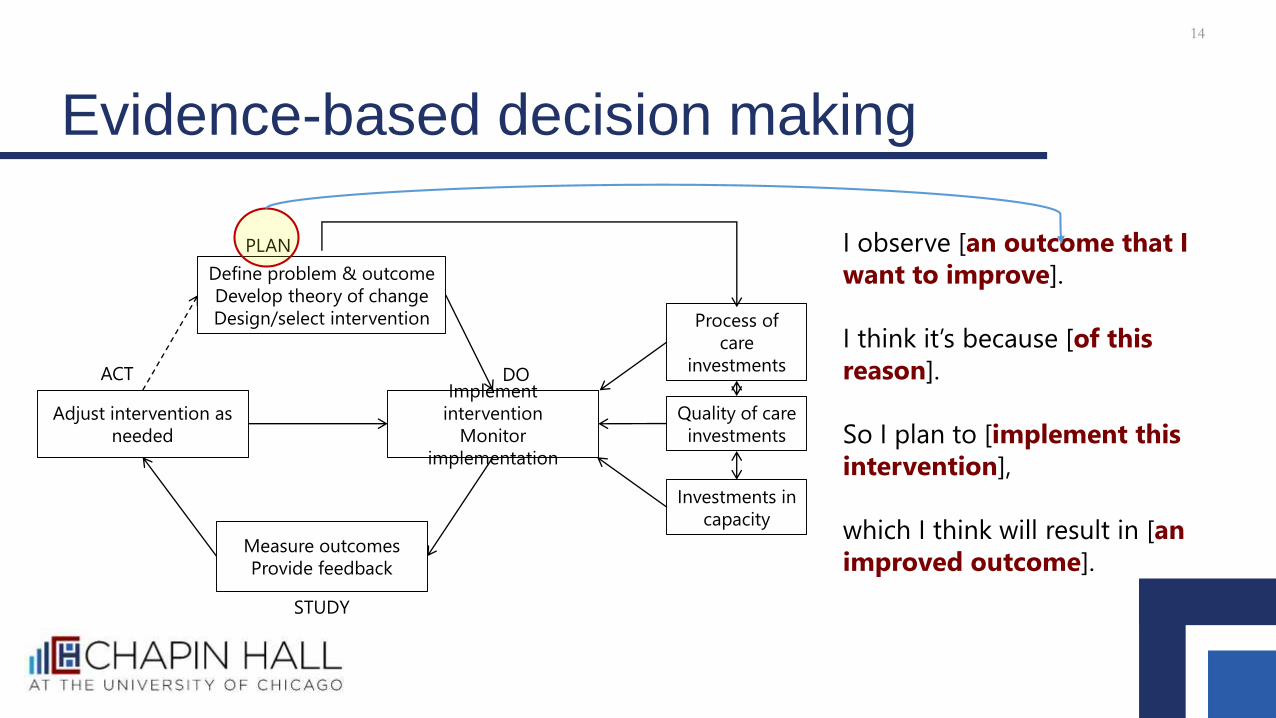
Evidence-based decision making
14
Define problem & outcome
Develop theory of change
Design/select intervention
Measure outcomes
Provide feedback
Adjust intervention as
needed
Process of
care
investments
Quality of care
investments
Investments in
capacity
PLAN
STUDY
ACT DOImplement
intervention
Monitor
implementation
I observe [an outcome that I
want to improve].
I think it’s because [of this
reason].
So I plan to [implement this
intervention],
which I think will result in [an
improved outcome].
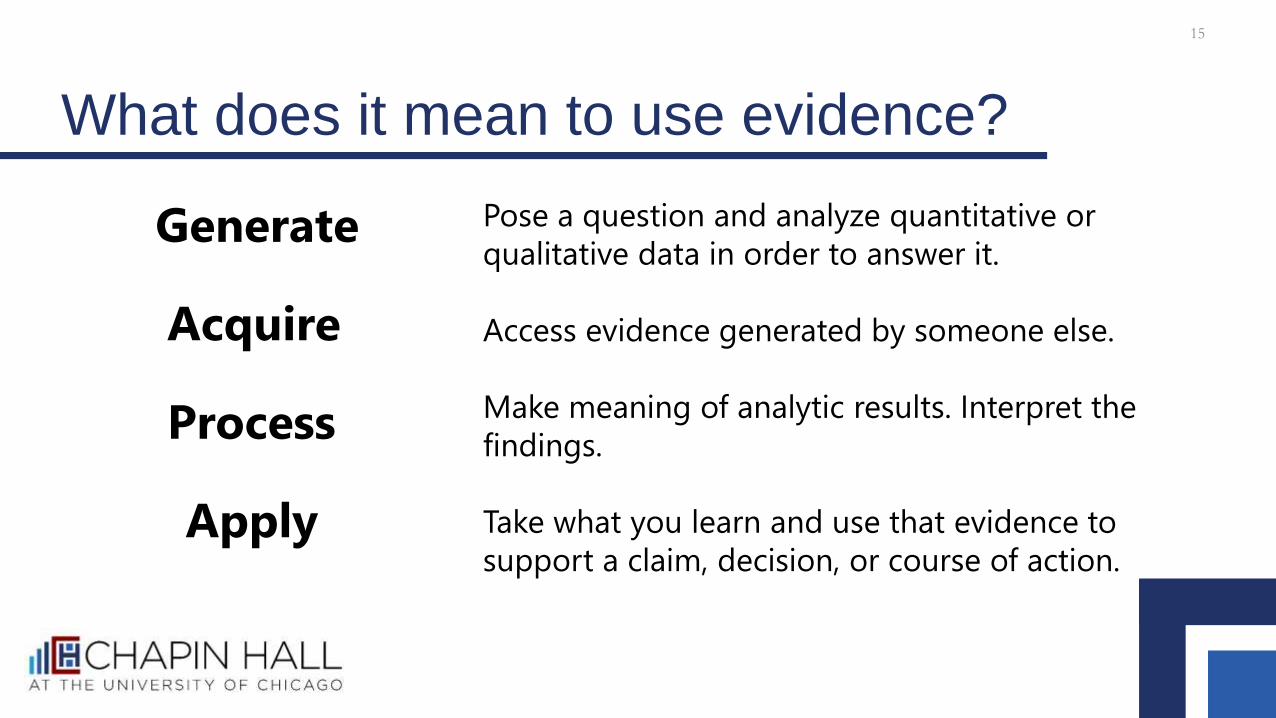
What does it mean to use evidence?
15
Pose a question and analyze quantitative or
qualitative data in order to answer it.
Access evidence generated by someone else.
Make meaning of analytic results. Interpret the
findings.
Take what you learn and use that evidence to
support a claim, decision, or course of action.
Generate
Acquire
Process
Apply
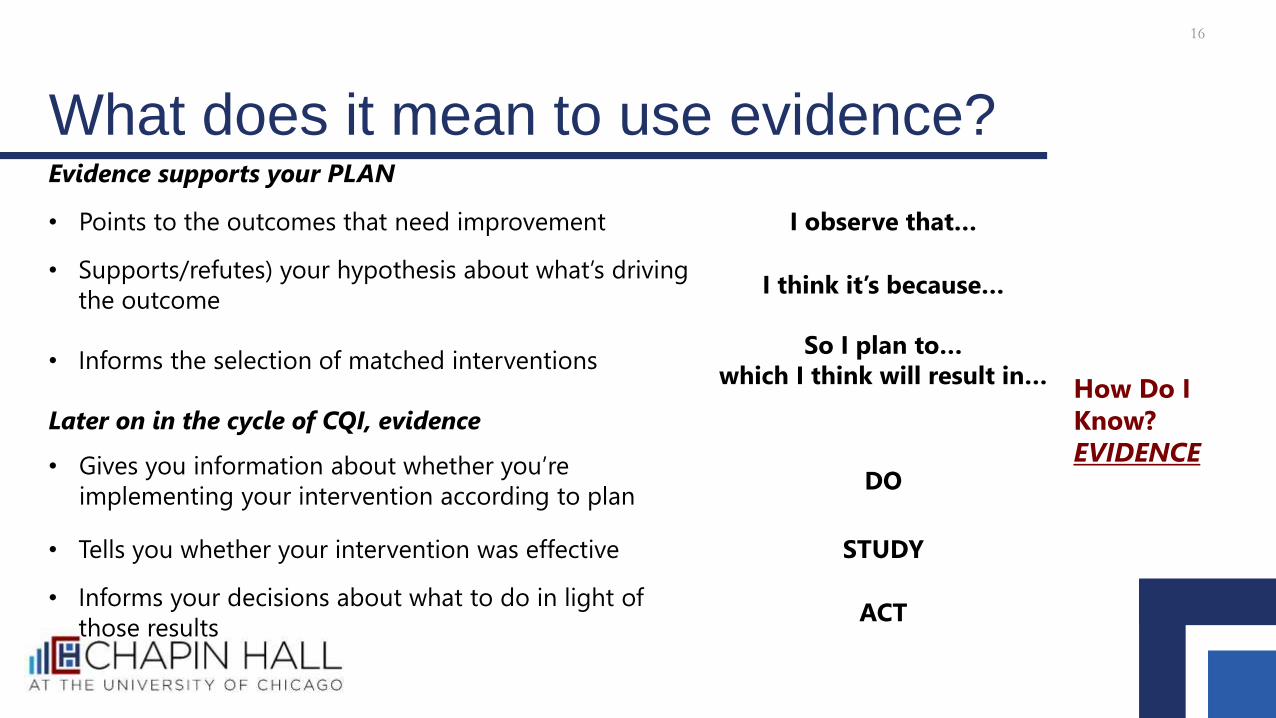
What does it mean to use evidence?
16
Evidence supports your PLAN
• Points to the outcomes that need improvement I observe that…
How Do I
Know?
EVIDENCE
• Supports/refutes) your hypothesis about what’s driving
the outcomeI think it’s because…
• Informs the selection of matched interventionsSo I plan to…
which I think will result in…
Later on in the cycle of CQI, evidence
• Gives you information about whether you’re
implementing your intervention according to planDO
• Tells you whether your intervention was effective STUDY
• Informs your decisions about what to do in light of
those resultsACT
Evidence-Based Decision Making is a Behavior
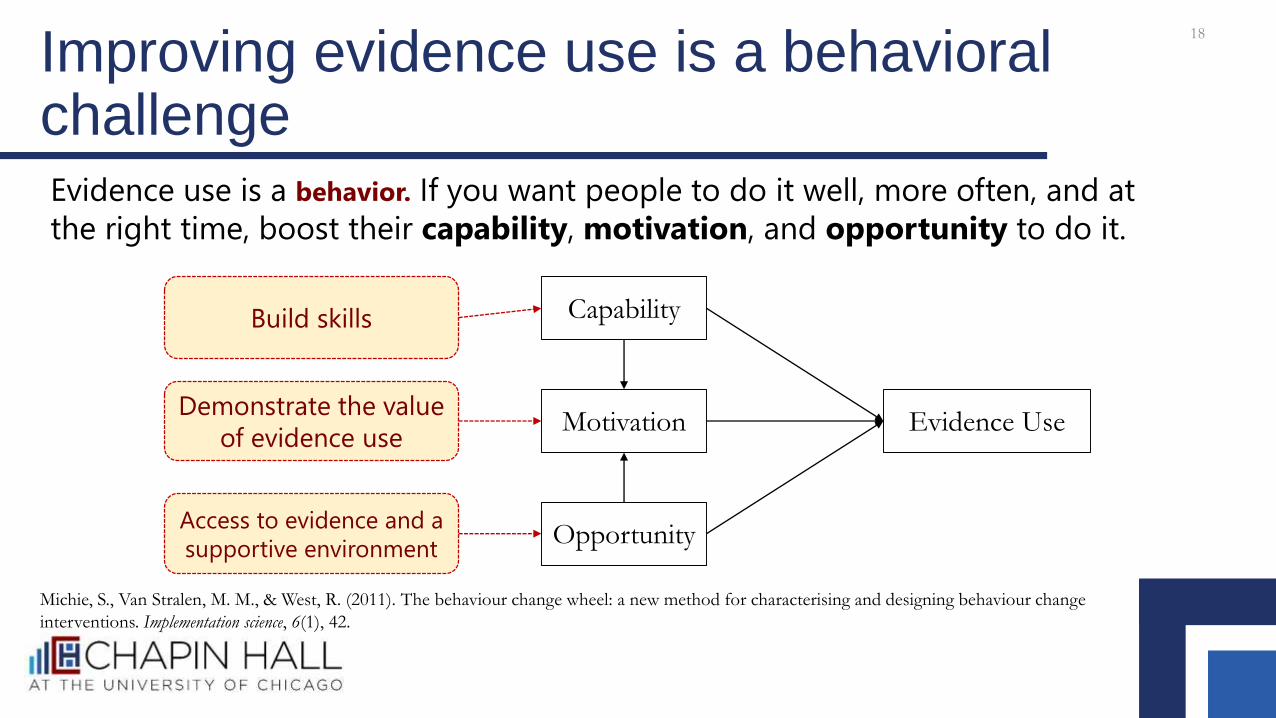
Improving evidence use is a behavioral challenge
18
Evidence use is a behavior. If you want people to do it well, more often, and at
the right time, boost their capability, motivation, and opportunity to do it.
Capability
Motivation
Opportunity
Evidence Use
Build skills
Access to evidence and a
supportive environment
Demonstrate the value
of evidence use
Michie, S., Van Stralen, M. M., & West, R. (2011). The behaviour change wheel: a new method for characterising and designing behaviour change
interventions. Implementation science, 6(1), 42.
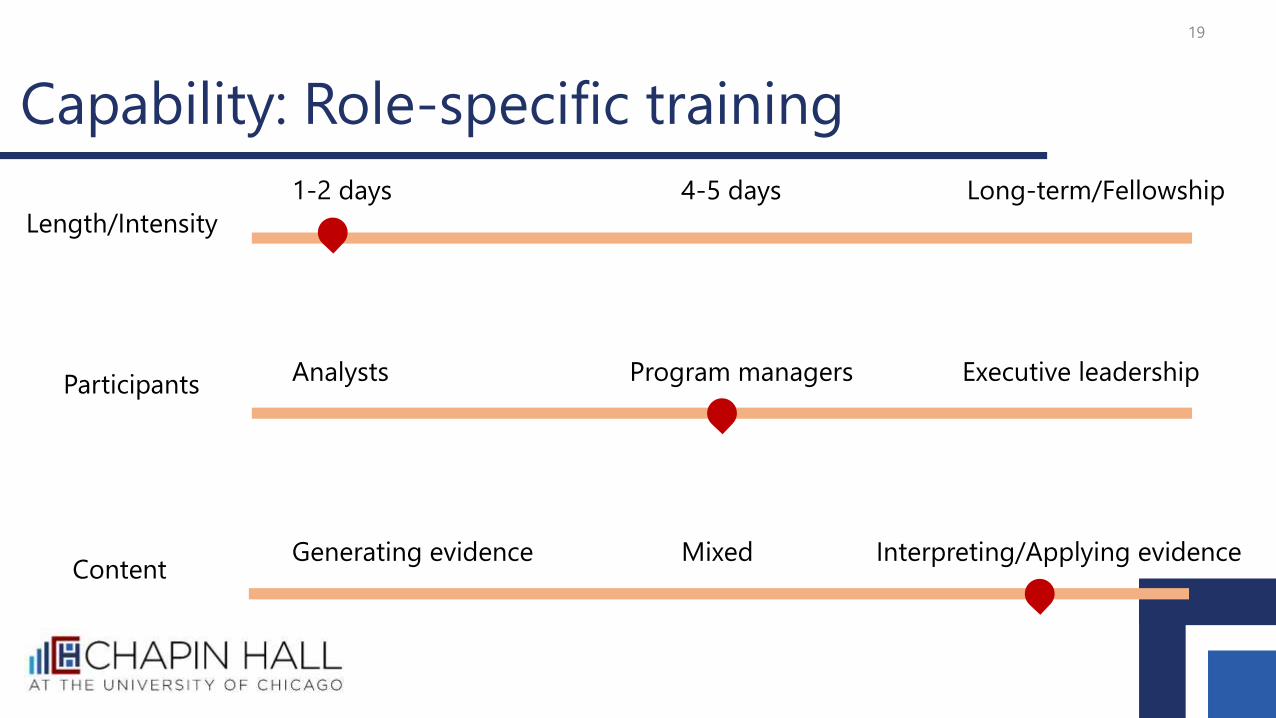
Capability: Role-specific training
19
1-2 days 4-5 days Long-term/Fellowship
Analysts Program managers Executive leadership
Generating evidence Interpreting/Applying evidence
Length/Intensity
Participants
ContentMixed
Capability: Advanced Analytics & the Data Slam
20
• Advanced Analytics: A three-day session that combines lectures, exercises, and
individual, and group work to:
• Expose participants to priority concepts that are fundamental to the principles of
CQI and good measurement;
• Direct them to resources they can access that manifest best practices in evidence
development;
• Encourage them to practice asking and answering questions that relate to the
core outcomes in their systems
• Data Slam: Follows Advanced Analytics; participants review the priority concepts and
then are coached in the development of a brief presentation of a county outcome
about which they have made an observation and developed a hypothesis.
Capability: The Fundamentals
21
Fundamentals in Evidence-based Decision Making is a newer opportunity in CA.
Modeled after EDGE, this program expands on Advanced Analytics and the Data Slam to:
• Support county leaders and analysts in articulating an observation and a
hypothesis about an outcome common to all of them, but for which they have
specific challenges;
• Coach them in the development of research plan to test their specific hypothesis,
which involves the generation of both quantitative and qualitative evidence;
• Advise them in the development of logic model that offers a defensible remedy
to the problem their hypothesis addresses;
• Coach them in the development of a thoughtful implementation plan.
Strategies for Building Organizational
CQI Capacity
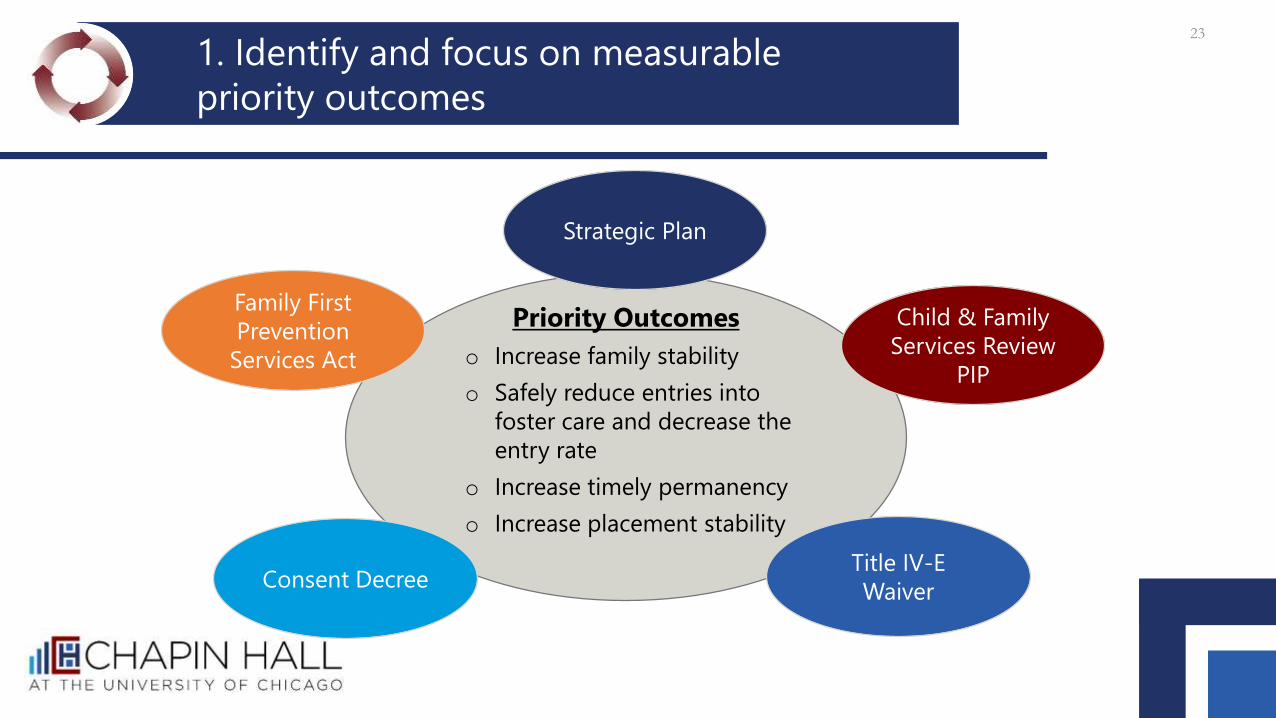
Priority Outcomes
o Increase family stability
o Safely reduce entries into
foster care and decrease the
entry rate
o Increase timely permanency
o Increase placement stability
Consent Decree
Child & Family
Services Review
PIP
Title IV-E
Waiver
Strategic Plan
23
1. Identify and focus on measurable
priority outcomes
Family First
Prevention
Services Act
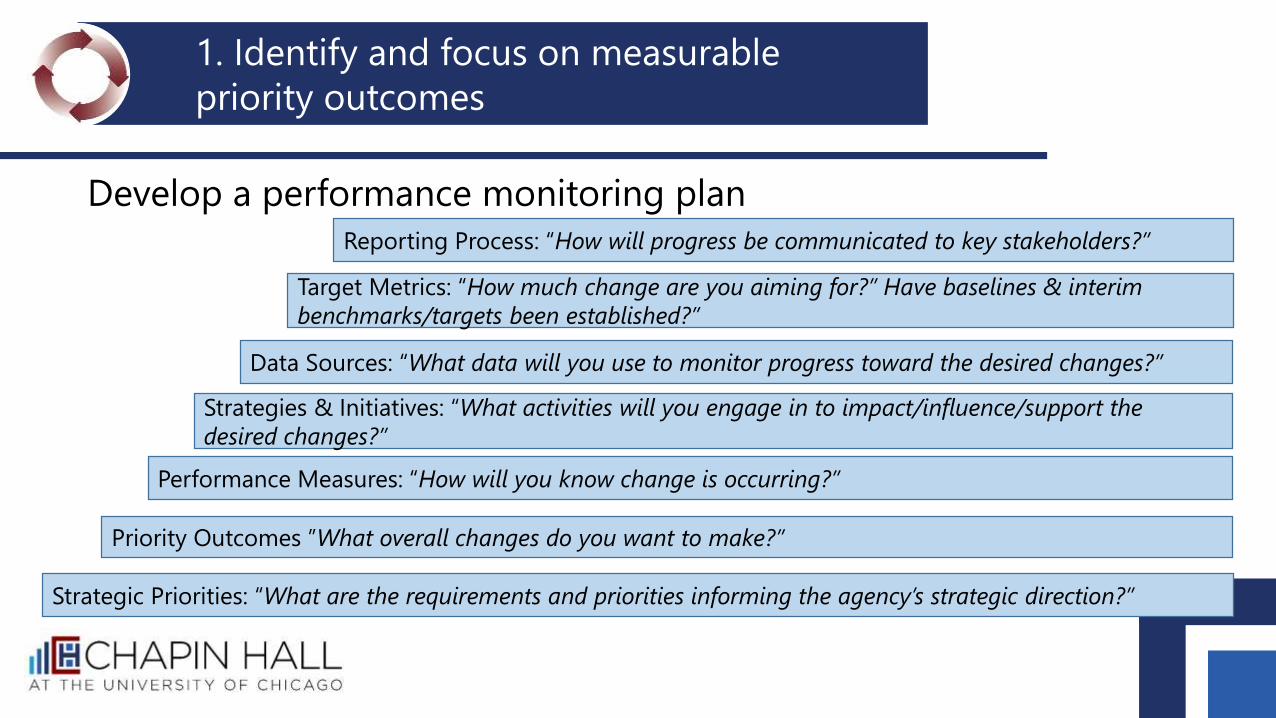
Strategic Priorities: “What are the requirements and priorities informing the agency’s strategic direction?”
Reporting Process: “How will progress be communicated to key stakeholders?”
Target Metrics: “How much change are you aiming for?” Have baselines & interim
benchmarks/targets been established?”
Data Sources: “What data will you use to monitor progress toward the desired changes?”
Strategies & Initiatives: “What activities will you engage in to impact/influence/support the
desired changes?”
Performance Measures: “How will you know change is occurring?”
Priority Outcomes ”What overall changes do you want to make?”
Develop a performance monitoring plan
1. Identify and focus on measurable
priority outcomes
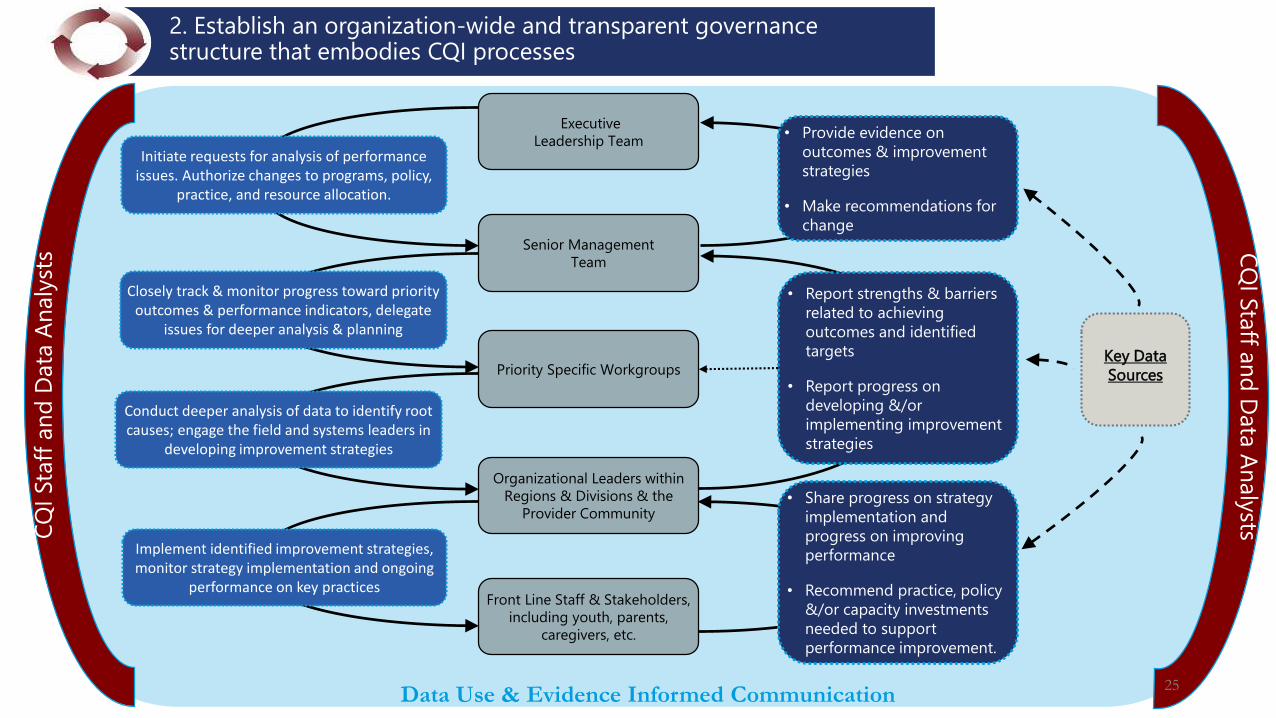
Data Use & Evidence Informed Communication
CQ
I Sta
ff a
nd
Data
An
aly
sts C
QI S
taff a
nd
Data
An
aly
sts
Senior Management
Team
Executive
Leadership Team
Priority Specific Workgroups
Initiate requests for analysis of performance issues. Authorize changes to programs, policy,
practice, and resource allocation.
Closely track & monitor progress toward priority outcomes & performance indicators, delegate
issues for deeper analysis & planning
Key Data
Sources
Front Line Staff & Stakeholders,
including youth, parents,
caregivers, etc.
Conduct deeper analysis of data to identify root causes; engage the field and systems leaders in
developing improvement strategies
Organizational Leaders within
Regions & Divisions & the
Provider Community
Implement identified improvement strategies, monitor strategy implementation and ongoing
performance on key practices
• Share progress on strategy
implementation and
progress on improving
performance
• Recommend practice, policy
&/or capacity investments
needed to support
performance improvement.
• Report strengths & barriers
related to achieving
outcomes and identified
targets
• Report progress on
developing &/or
implementing improvement
strategies
• Provide evidence on
outcomes & improvement
strategies
• Make recommendations for
change
25
2. Establish an organization-wide and transparent governance structure that embodies CQI processes
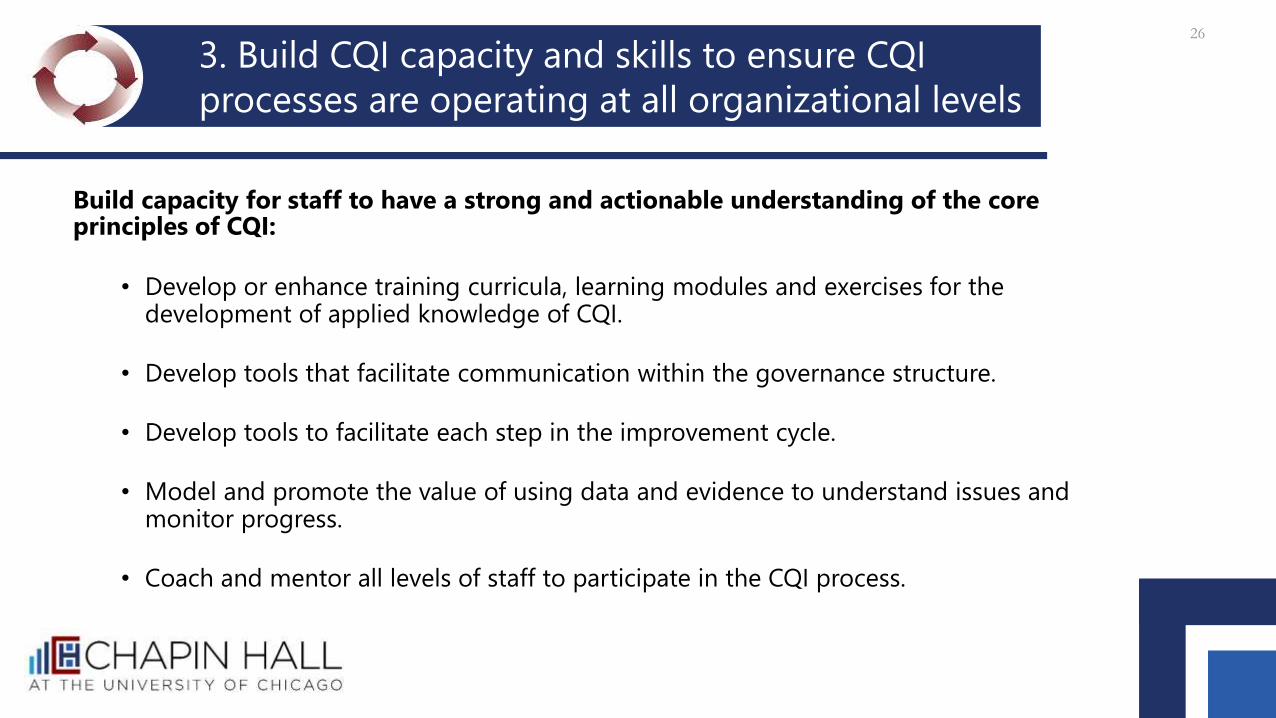
Build capacity for staff to have a strong and actionable understanding of the core principles of CQI:
• Develop or enhance training curricula, learning modules and exercises for the development of applied knowledge of CQI.
• Develop tools that facilitate communication within the governance structure.
• Develop tools to facilitate each step in the improvement cycle.
• Model and promote the value of using data and evidence to understand issues and monitor progress.
• Coach and mentor all levels of staff to participate in the CQI process.
26
3. Build CQI capacity and skills to ensure CQI
processes are operating at all organizational levels
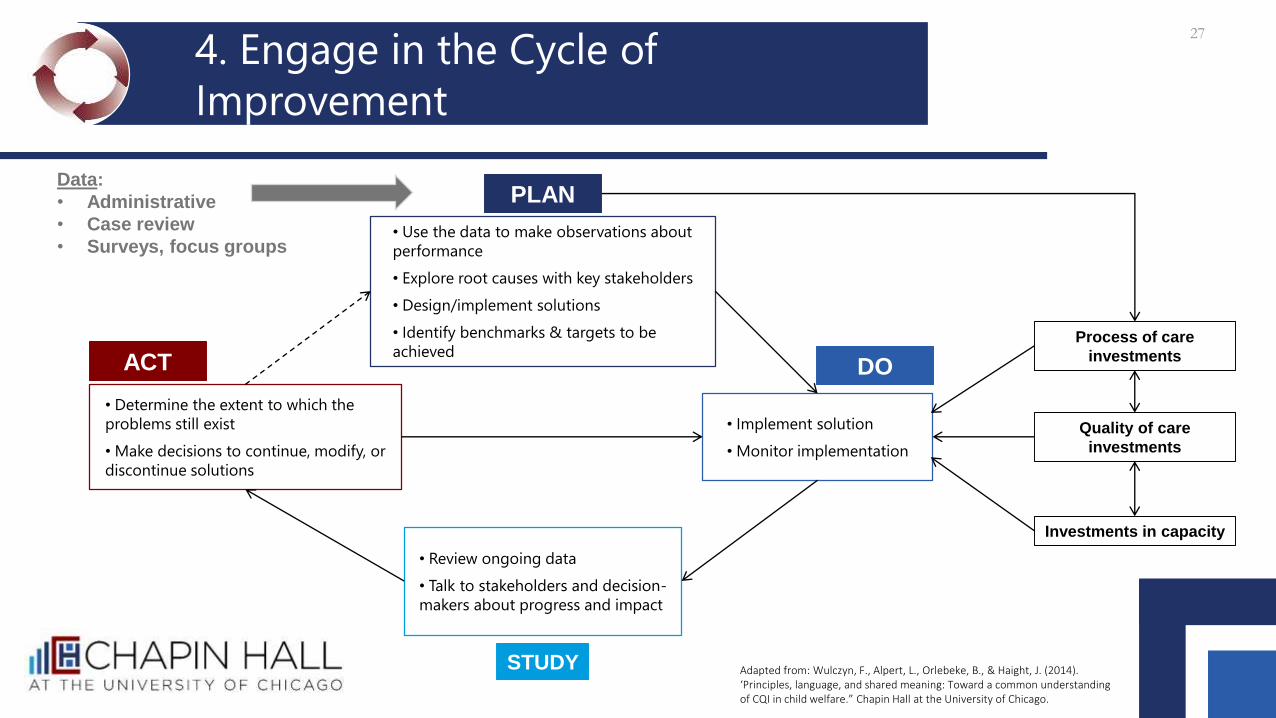
• Use the data to make observations about
performance
• Explore root causes with key stakeholders
• Design/implement solutions
• Identify benchmarks & targets to be
achieved
• Review ongoing data
• Talk to stakeholders and decision-
makers about progress and impact
• Determine the extent to which the
problems still exist
• Make decisions to continue, modify, or
discontinue solutions
Process of care
investments
Quality of care
investments
Investments in capacity
STUDY
ACT DO
• Implement solution
• Monitor implementation
PLAN
Adapted from: Wulczyn, F., Alpert, L., Orlebeke, B., & Haight, J. (2014). ‘Principles, language, and shared meaning: Toward a common understanding of CQI in child welfare.” Chapin Hall at the University of Chicago.
Data:
• Administrative
• Case review
• Surveys, focus groups
27
4. Engage in the Cycle of
Improvement

28
QUESTIONS?
WHAT WILL YOU DO NOW?
THINK ABOUT ONE CQI ACTIVITY YOU WILL TAKE
BACK TO YOUR AGENCY FOR ADDITIONAL
DISCUSSION AND/OR ACTION.
OR
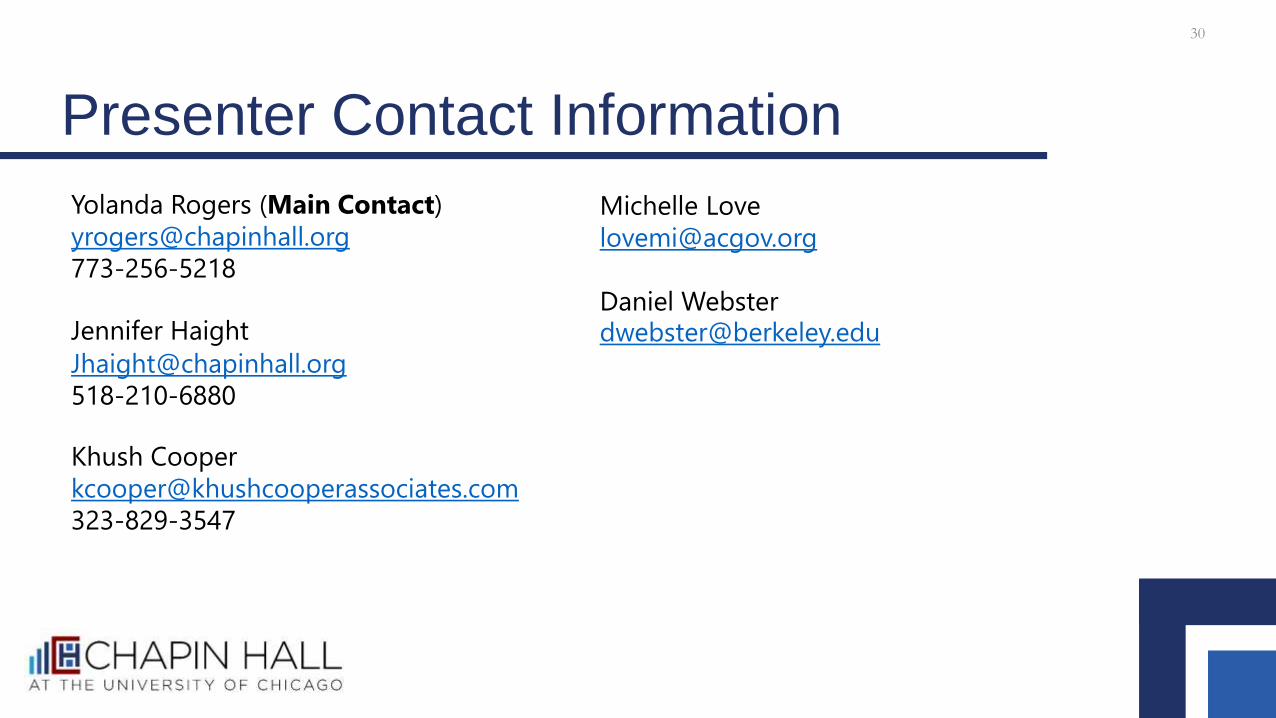
Presenter Contact Information
Yolanda Rogers (Main Contact)
773-256-5218
Khush Cooper
323-829-3547
30
Jennifer Haight
518-210-6880
Michelle Love
Daniel [email protected]
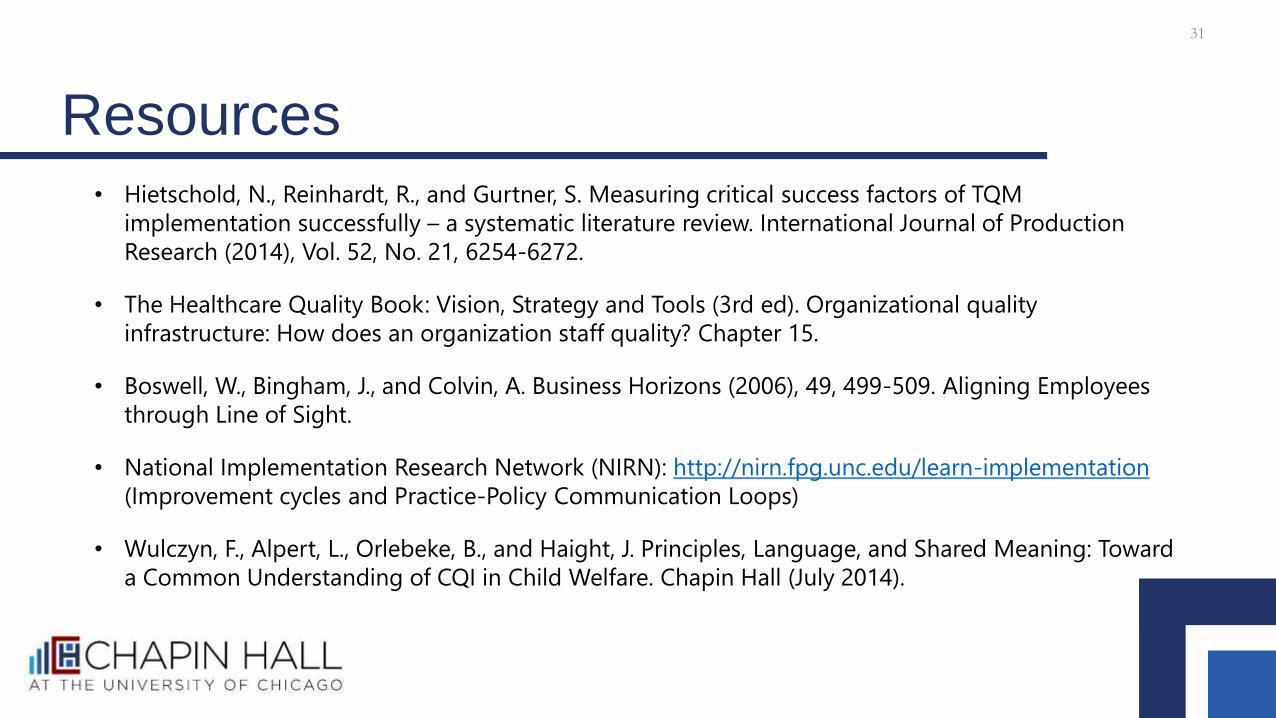
Resources• Hietschold, N., Reinhardt, R., and Gurtner, S. Measuring critical success factors of TQM
implementation successfully – a systematic literature review. International Journal of Production
Research (2014), Vol. 52, No. 21, 6254-6272.
• The Healthcare Quality Book: Vision, Strategy and Tools (3rd ed). Organizational quality
infrastructure: How does an organization staff quality? Chapter 15.
• Boswell, W., Bingham, J., and Colvin, A. Business Horizons (2006), 49, 499-509. Aligning Employees
through Line of Sight.
• National Implementation Research Network (NIRN): http://nirn.fpg.unc.edu/learn-implementation
(Improvement cycles and Practice-Policy Communication Loops)
• Wulczyn, F., Alpert, L., Orlebeke, B., and Haight, J. Principles, Language, and Shared Meaning: Toward
a Common Understanding of CQI in Child Welfare. Chapin Hall (July 2014).
31