Embed Size (px)
Citation preview

© Oakleaf, 2010
Making
Connections to
Learning:
The Library in
the Academy
Megan Oakleaf, MLS, PhD
SOCHE 2010 Conference
www.meganoakleaf.info

© Oakleaf, 2010
Library
Assessment &
Learning
Outcomes:
Foundations,
Premises &
Principles

© Oakleaf, 2010
Topics
• What are we doing here?
– Why am I here?
– What’s in it for you?
• What is your library’s role
in student learning?
• What is your role in
student learning?
• How does that translate
into value to the
academy?
© Oakleaf, 2010
What are you doing here?
What are you
doing with student
learning?
Why are you
doing it?
What are your
goals?
© Oakleaf, 2010
Mission & Vision
• What is your
library’s mission?
Vision?
• What is your
university’s mission?
Vision?
© Oakleaf, 2010
Coin of the Realm
• What’s most
important to your
institution? Your
faculty? Your
students?
• What do you to
contribute to it?
© Oakleaf, 2010
What is the Libraries’ Value?
• Effectiveness?
• Efficiency?
• Utility?
• Benefits ÷ Price or Sacrifices (time, effort)?
…Are you viewing this through perception of the user or the Libraries?
© Oakleaf, 2010
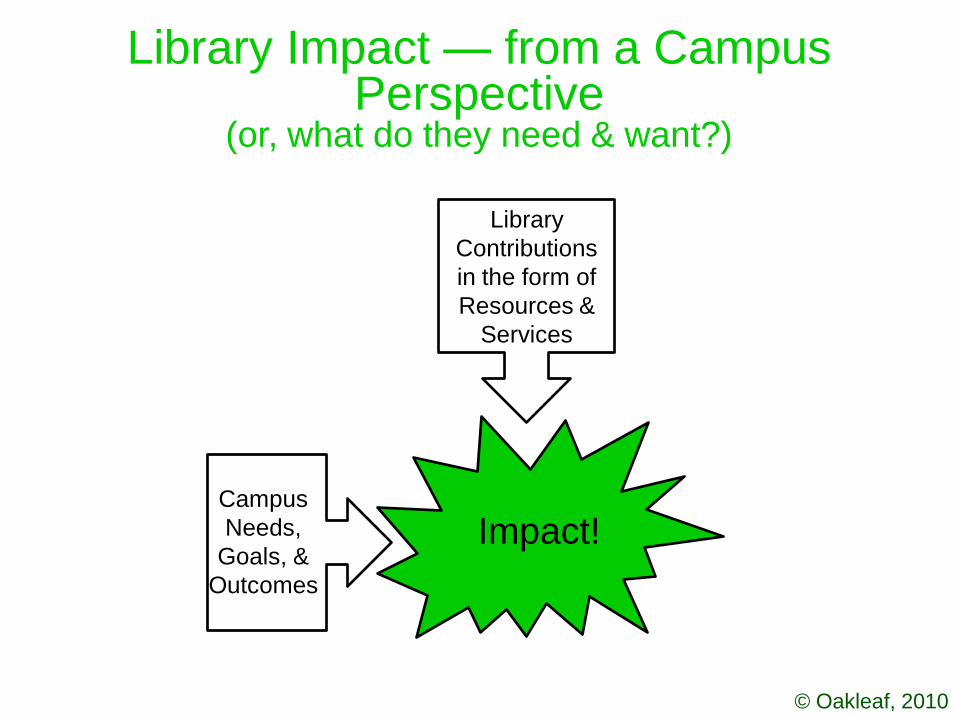
C Impact!
Library
Contributions
in the form of
Resources &
Services
Campus
Needs,
Goals, &
Outcomes
Library Impact — from a CampusPerspective
(or, what do they need & want?)
© Oakleaf, 2010
Changing Perspectives
How does the library contribute to campus needs including student…– Enrollment?
– Learning?
– Experience?
– Achievement?
– Retention?
– Graduation rates?
– Success?
© Oakleaf, 2010
Changing Perspectives
How does the library
contribute to campus
needs including faculty
teaching?

© Oakleaf, 2010
Library Impact Map
Campus Needs,
Goals, &
Outcomes
Ins
tru
cti
on
al
Se
rvic
es
Re
fere
nc
e
Se
rvic
es
Co
lle
cti
on
s
Sp
ec
ial
Co
lle
cti
on
s
ILL
Re
se
rve
s
Ac
qu
isit
ion
s
Ph
ys
ica
l
Sp
ac
e
Oth
er:
Student
Enrollment
Student
Retention
Student
Graduation
Rates
Student
Success
Student
Achievement
Student
Learning
Student
Experience
Faculty
Teaching
© Oakleaf, 2010
How do you
currently
assess
your
impact?

© Oakleaf, 2010
Barriers to Assessment
For Faculty
From the literature: (Bresciani 2009)
• Too little time/resources
• Lack of knowledge or skills
• Lack of process coordination
• Lack of conceptual framework for assessment
• Lack of collaboration with faculty
• Lack of trust
• Difficulties managing expectations

© Oakleaf, 2010
Barriers to Assessment
For LibrariansFrom the survey: (Oakleaf & Hinchliffe 2008)
• Too little time/resources
• Lack of knowledge or skills
• Lack of process coordination
• Lack of conceptual framework for assessment
• Lack of collaboration with faculty
• Difficulties managing expectations– Difficult finding assessment options that
adequately and accurately assess information literacy
© Oakleaf, 2010
So, what can be done to
encourage academic librarians to
assess learning & their
contribution to the academy?
© Oakleaf, 2010
Educate
Train librarians about
– learning assessment in general,
– tools for assessing learning
adequately (and in detail),
– tools for producing data, and
– tools for facilitating the use of
assessment data
Inform library administration about
– the time and
– resources required to assess
learning, as well as produce and
use assessment results
© Oakleaf, 2010
Clarify
Clarify the role of
librarians in assessing
student learning as well
as producing & using
assessment data

© Oakleaf, 2010
Collaborate
Collaborate with
faculty, centralized
campus assessment
support processes and
personnel.
Participate in college-
wide efforts to act on
assessment results.

© Oakleaf, 2010
Coordinate
Coordinate assessment
efforts within the library
by creating structures to
support learning
assessment.

© Oakleaf, 2010
Be Flexible
Re-allocate job
responsibilities of
those tasked with
assessment
duties.

© Oakleaf, 2010
Coin of the Realm
• What’s most important
to your institution? Your
faculty? Your students?
• What do you to
contribute to it?
• What are you doing
that is less important
than contributing to
it?
© Oakleaf, 2010
If you are repeating what you did 2
years ago, is something wrong?
When in doubt…
Do something good
Be of good heart
Fail forwards
Bounce back
Celebrate learning
and Learn MORE.
Adapted from Robert Chambers

© Oakleaf, 2010
Strategies for
Library
Assessment in
the Real World
© Oakleaf, 2010
Before We Begin…
© Oakleaf, 2010
What’s a Rubric?
Rubrics…
• describe library service impact in 2 dimensions
1. parts, indicators, or criteria and
2. levels of performance
• formatted on a grid or table
• employed to judge quality
• used to translate difficult, unwieldy data into a form that can be used for decision-making
© Oakleaf, 2010
Rubric Types
• Checklists
• Likert scales
• Scoring guides
• Full-model rubrics
© Oakleaf, 2010
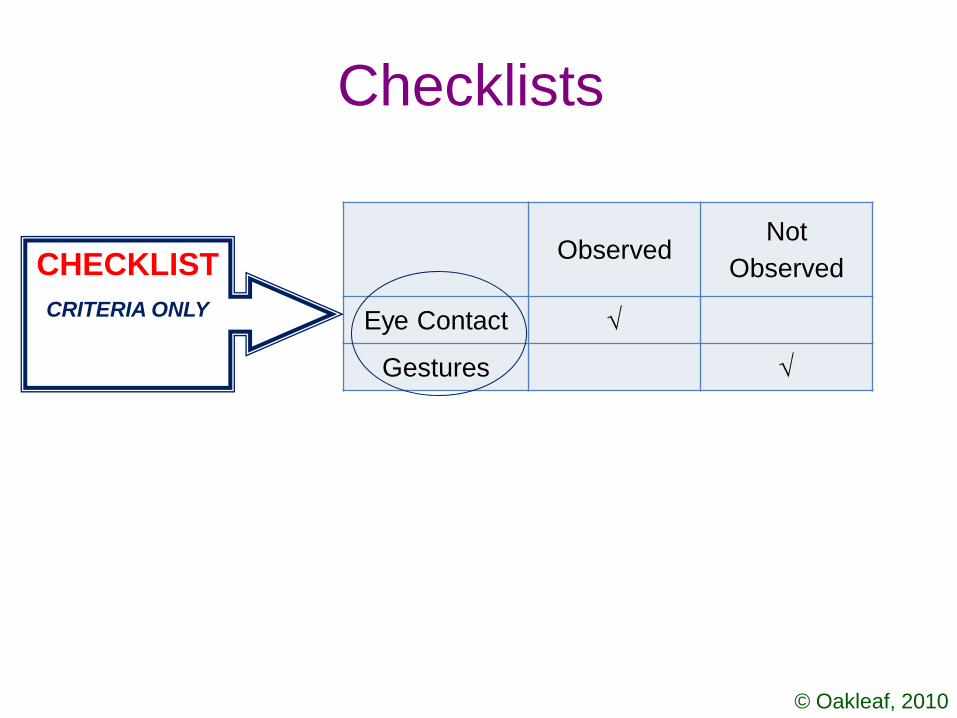
ObservedNot
Observed
Eye Contact
Gestures
Checklists
CHECKLIST
CRITERIA ONLY
© Oakleaf, 2010
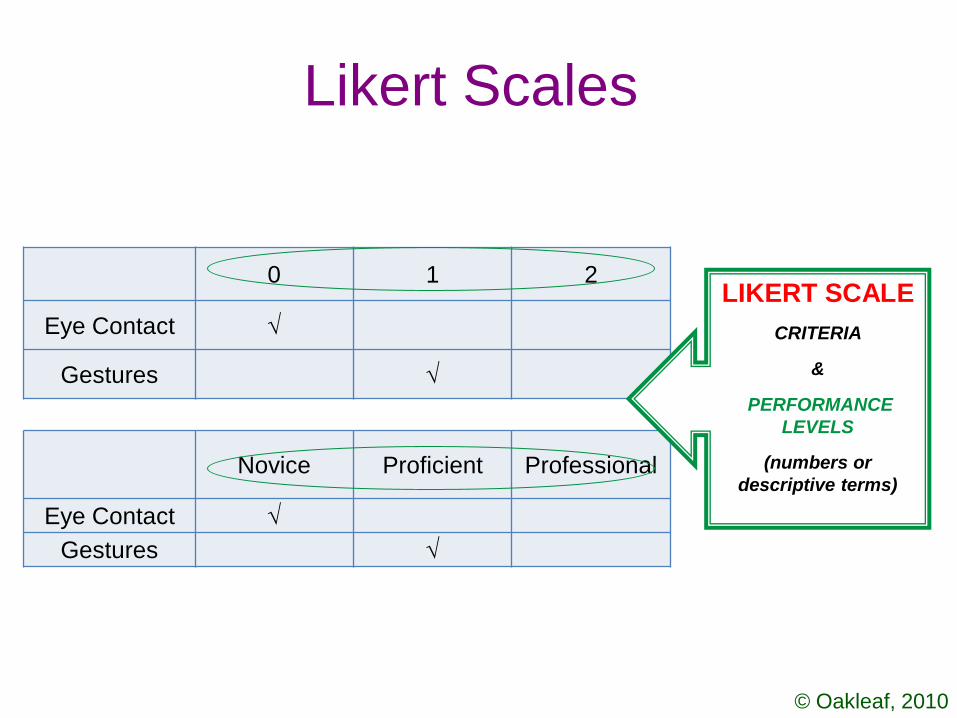
Novice Proficient Professional
Eye Contact
Gestures
0 1 2
Eye Contact
Gestures
Likert Scales
LIKERT SCALE
CRITERIA
&
PERFORMANCE
LEVELS
(numbers or
descriptive terms)

© Oakleaf, 2010
Scoring Guides
Exemplary Comments
Eye Contact
Maintains sustained
eye contact with the
audience.
Gestures
Gestures are used to
emphasize talking
points.
SCORING
GUIDE
CRITERIA,
TOP PERFORMANCE
LEVEL,
&
TOP PERFORMANCE
DESCRIPTION
© Oakleaf, 2010
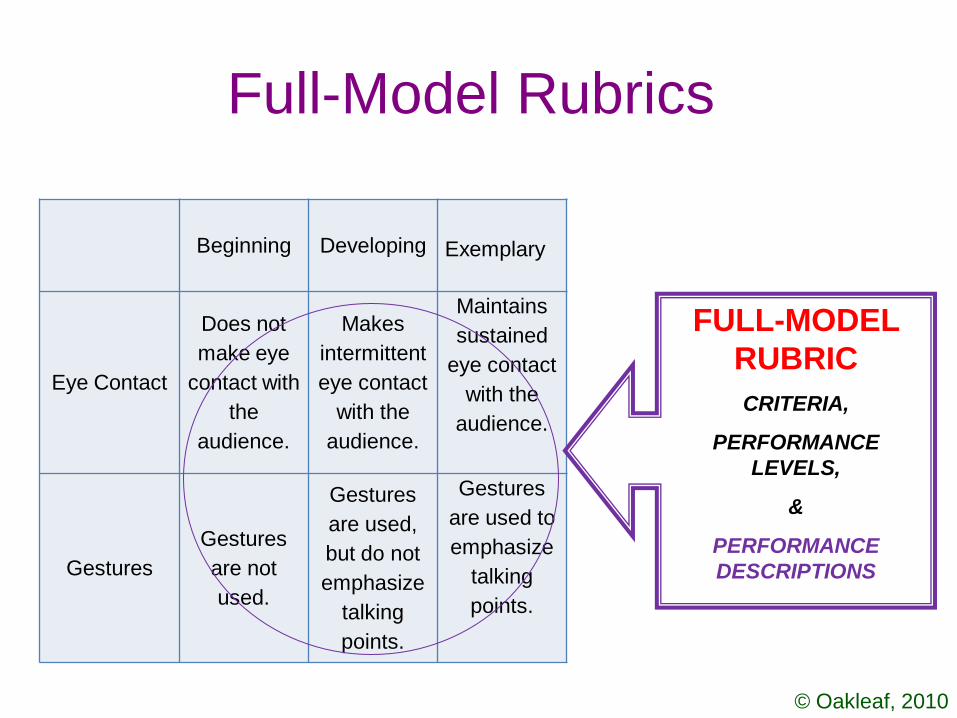
Full-Model Rubrics
Beginning Developing Exemplary
Eye Contact
Does not
make eye
contact with
the
audience.
Makes
intermittent
eye contact
with the
audience.
Maintains
sustained
eye contact
with the
audience.
Gestures
Gestures
are not
used.
Gestures
are used,
but do not
emphasize
talking
points.
Gestures
are used to
emphasize
talking
points.
FULL-MODEL
RUBRIC
CRITERIA,
PERFORMANCE
LEVELS,
&
PERFORMANCE
DESCRIPTIONS

© Oakleaf, 2010
Fiction Writing (Analytic) Rubric
© Oakleaf, 2010
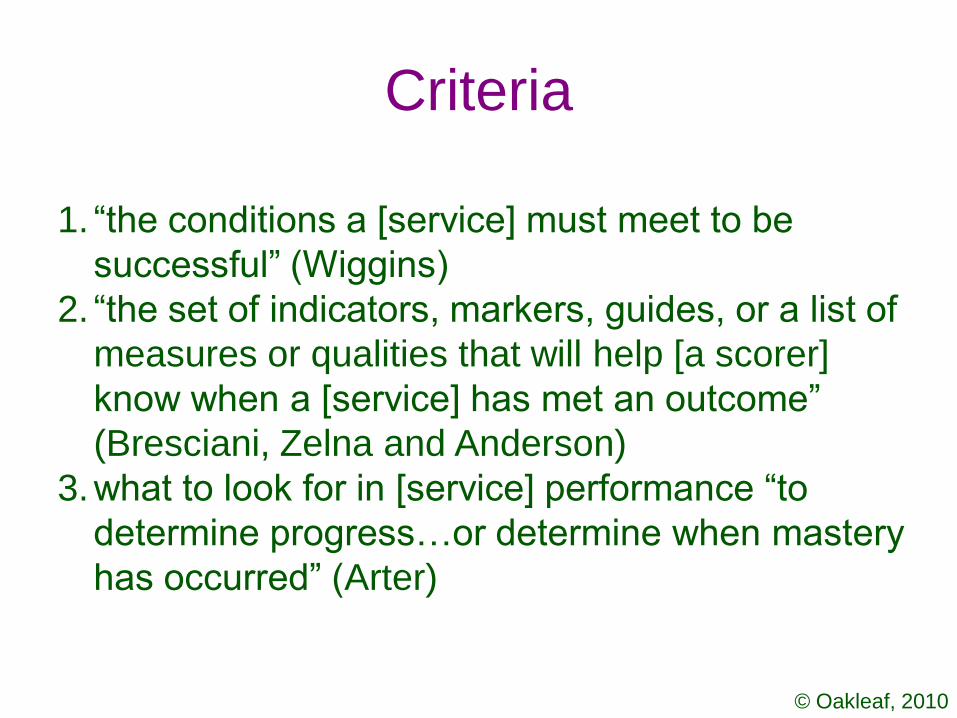
Criteria
1. ―the conditions a [service] must meet to be
successful‖ (Wiggins)
2. ―the set of indicators, markers, guides, or a list of
measures or qualities that will help [a scorer]
know when a [service] has met an outcome‖
(Bresciani, Zelna and Anderson)
3.what to look for in [service] performance ―to
determine progress…or determine when mastery
has occurred‖ (Arter)

© Oakleaf, 2010
Performance Levels
mastery, progressing, emerging,
satisfactory, marginal, proficient,
high, middle, beginning, advanced,
novice, intermediate, sophisticated,
competent, professional,
exemplary, needs work, adequate,
developing, accomplished,
distinguished

© Oakleaf, 2010
Performance Levels
If you want to force evaluative decisions, choose
an even number of levels (usually 4).
If you want to have a middle ground, choose an
odd number of levels (usually 3 or 5).
Choose a number that you can justify based on
developmental service stages.
© Oakleaf, 2010
Rubrics – Benefits, 1 of 2
Service
• Articulate and communicate agreed upon service goals
• Provide direct feedback to service providers
• Facilitate self-evaluation
• Can focus on service standards
Article forthcoming by Megan Oakleaf

© Oakleaf, 2010
Rubrics – Benefits, 2 of 2
Data
• Facilitate consistent, accurate, unbiased scoring
• Deliver data that is easy to understand, defend, and convey
• Offer detailed descriptions necessary for informed decision-making
• Can be used over time or across multiple programs
Other
• Are inexpensive ($) to design and implement
© Oakleaf, 2010
Rubrics – Limitations
• May contain design flaws that impact data
quality
• Require time for development

© Oakleaf, 2010
Example Service Rubrics
Disclaimer: Created by former
students…not necessarily perfect!
© Oakleaf, 2010
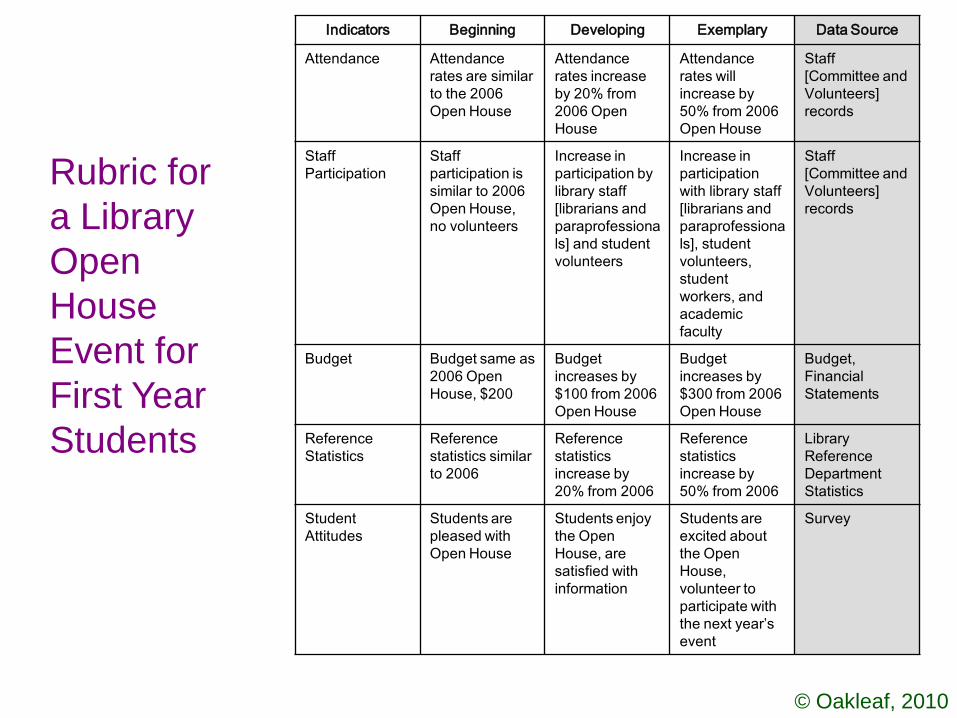
Rubric for
a Library
Open
House
Event for
First Year
Students
Indicators Beginning Developing Exemplary Data Source
Attendance Attendance
rates are similar
to the 2006
Open House
Attendance
rates increase
by 20% from
2006 Open
House
Attendance
rates will
increase by
50% from 2006
Open House
Staff
[Committee and
Volunteers]
records
Staff
Participation
Staff
participation is
similar to 2006
Open House,
no volunteers
Increase in
participation by
library staff
[librarians and
paraprofessiona
ls] and student
volunteers
Increase in
participation
with library staff
[librarians and
paraprofessiona
ls], student
volunteers,
student
workers, and
academic
faculty
Staff
[Committee and
Volunteers]
records
Budget Budget same as
2006 Open
House, $200
Budget
increases by
$100 from 2006
Open House
Budget
increases by
$300 from 2006
Open House
Budget,
Financial
Statements
Reference
Statistics
Reference
statistics similar
to 2006
Reference
statistics
increase by
20% from 2006
Reference
statistics
increase by
50% from 2006
Library
Reference
Department
Statistics
Student
Attitudes
Students are
pleased with
Open House
Students enjoy
the Open
House, are
satisfied with
information
Students are
excited about
the Open
House,
volunteer to
participate with
the next year’s
event
Survey
© Oakleaf, 2010
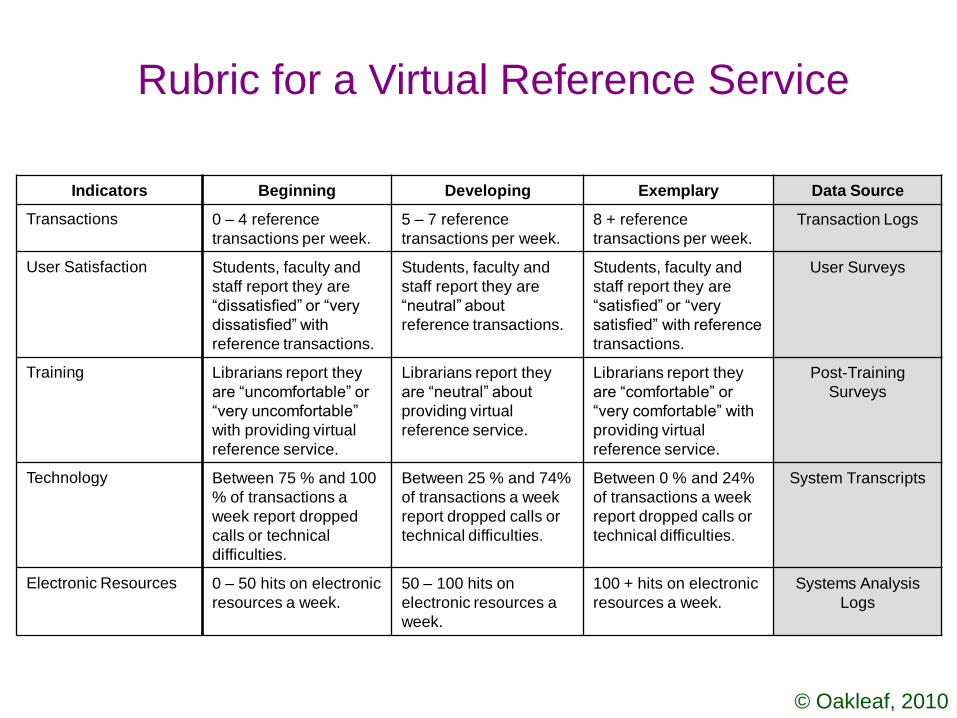
Indicators Beginning Developing Exemplary Data Source
Transactions 0 – 4 reference
transactions per week.
5 – 7 reference
transactions per week.
8 + reference
transactions per week.
Transaction Logs
User Satisfaction Students, faculty and
staff report they are
―dissatisfied‖ or ―very
dissatisfied‖ with
reference transactions.
Students, faculty and
staff report they are
―neutral‖ about
reference transactions.
Students, faculty and
staff report they are
―satisfied‖ or ―very
satisfied‖ with reference
transactions.
User Surveys
Training Librarians report they
are ―uncomfortable‖ or
―very uncomfortable‖
with providing virtual
reference service.
Librarians report they
are ―neutral‖ about
providing virtual
reference service.
Librarians report they
are ―comfortable‖ or
―very comfortable‖ with
providing virtual
reference service.
Post-Training
Surveys
Technology Between 75 % and 100
% of transactions a
week report dropped
calls or technical
difficulties.
Between 25 % and 74%
of transactions a week
report dropped calls or
technical difficulties.
Between 0 % and 24%
of transactions a week
report dropped calls or
technical difficulties.
System Transcripts
Electronic Resources 0 – 50 hits on electronic
resources a week.
50 – 100 hits on
electronic resources a
week.
100 + hits on electronic
resources a week.
Systems Analysis
Logs
Rubric for a Virtual Reference Service
© Oakleaf, 2010
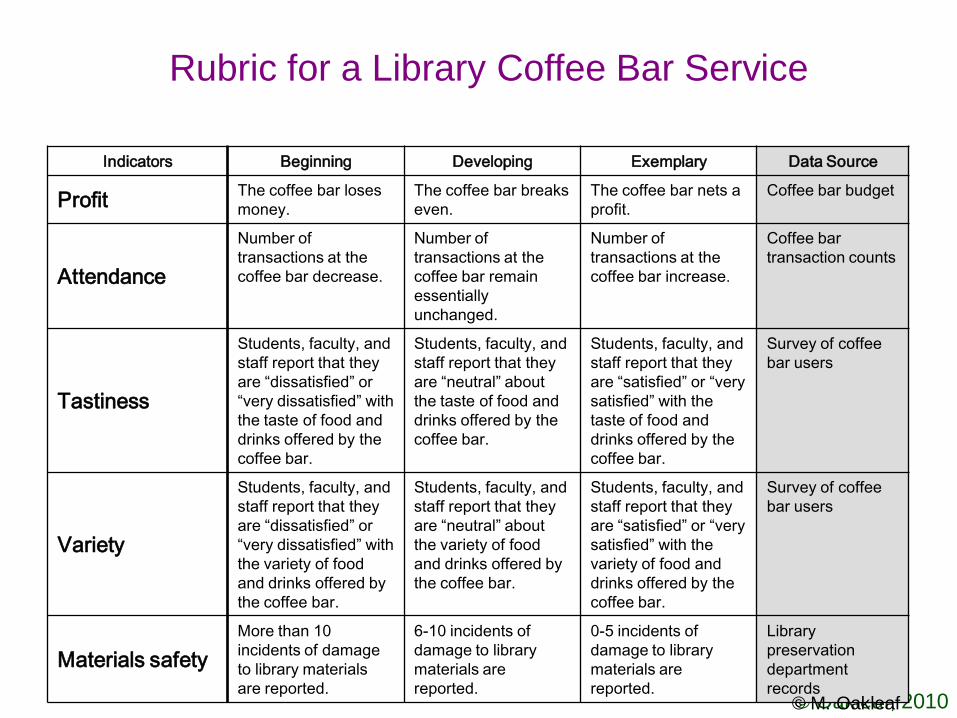
Indicators Beginning Developing Exemplary Data Source
ProfitThe coffee bar loses
money.
The coffee bar breaks
even.
The coffee bar nets a
profit.
Coffee bar budget
Attendance
Number of
transactions at the
coffee bar decrease.
Number of
transactions at the
coffee bar remain
essentially
unchanged.
Number of
transactions at the
coffee bar increase.
Coffee bar
transaction counts
Tastiness
Students, faculty, and
staff report that they
are “dissatisfied” or
“very dissatisfied” with
the taste of food and
drinks offered by the
coffee bar.
Students, faculty, and
staff report that they
are “neutral” about
the taste of food and
drinks offered by the
coffee bar.
Students, faculty, and
staff report that they
are “satisfied” or “very
satisfied” with the
taste of food and
drinks offered by the
coffee bar.
Survey of coffee
bar users
Variety
Students, faculty, and
staff report that they
are “dissatisfied” or
“very dissatisfied” with
the variety of food
and drinks offered by
the coffee bar.
Students, faculty, and
staff report that they
are “neutral” about
the variety of food
and drinks offered by
the coffee bar.
Students, faculty, and
staff report that they
are “satisfied” or “very
satisfied” with the
variety of food and
drinks offered by the
coffee bar.
Survey of coffee
bar users
Materials safety
More than 10
incidents of damage
to library materials
are reported.
6-10 incidents of
damage to library
materials are
reported.
0-5 incidents of
damage to library
materials are
reported.
Library
preservation
department
records
Rubric for a Library Coffee Bar Service
© M. Oakleaf
© Oakleaf, 2010
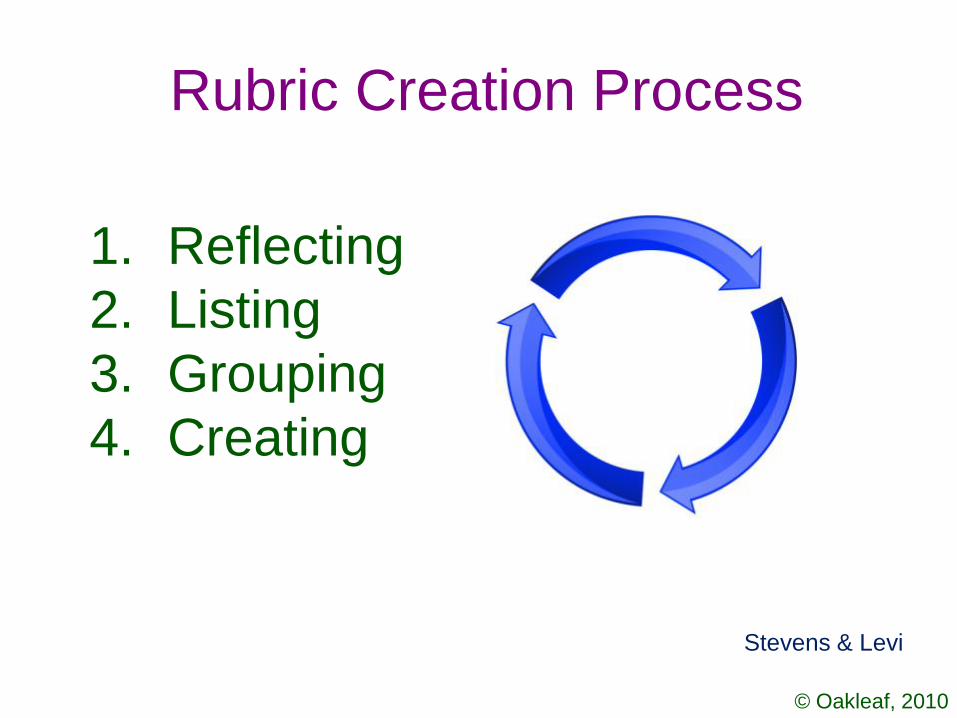
Rubric Creation Process
1. Reflecting
2. Listing
3. Grouping
4. Creating
Stevens & Levi
© Oakleaf, 2010
At Your Table…
Choose a Service!
• Reference
• Virtual Reference
• First Year Orientation
• Online Tutorial
• Special Collections
• Coffee Bar
• Gaming Program

© Oakleaf, 2010
Reflecting
Consider:
1. Why did we create this
service?
2. What happened when other
libraries provided the
service?
3. What is the relationship
between this service and the
rest of the library services?Stevens & Levi

© Oakleaf, 2010
Listing
1. What are our expectations of
the service? What does a
successful service of this type
look like?
2. What specific service outcomes
do we want to see in the
completed service?
3. What evidence can we find that
will demonstrate service
success? Stevens & Levi

© Oakleaf, 2010
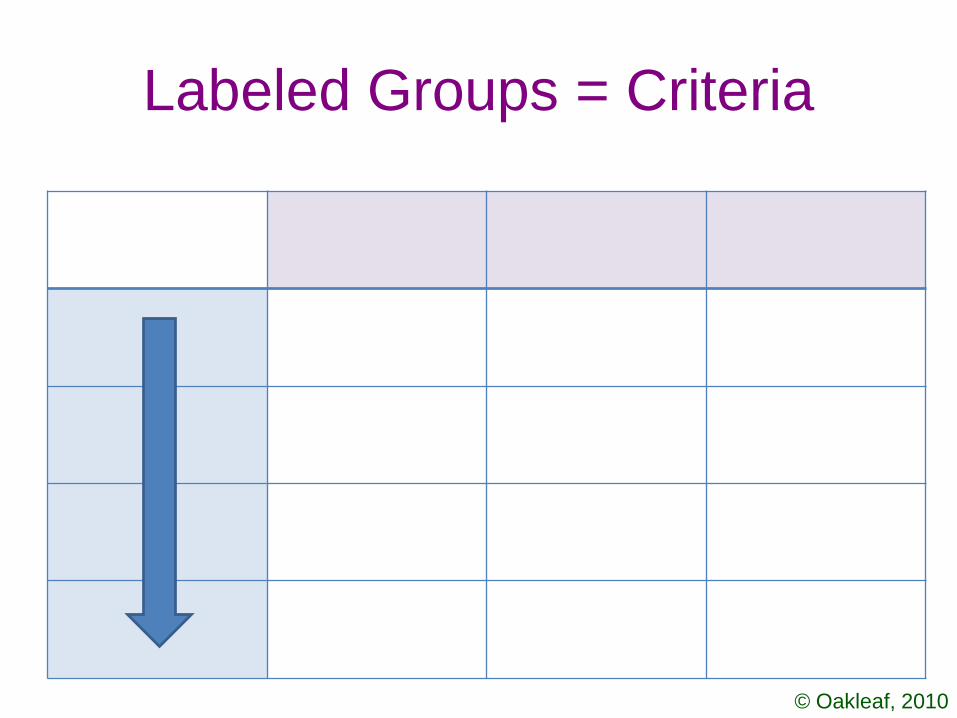
Grouping & Labeling
1. Can we group our brainstorms
into categories?
2. How can we label them?
Stevens & Levi
© Oakleaf, 2010
Labeled Groups = Criteria
© Oakleaf, 2010
Performance Levels
mastery, progressing, emerging,
satisfactory, marginal, proficient,
high, middle, beginning, advanced,
novice, intermediate, sophisticated,
competent, professional,
exemplary, needs work, adequate,
developing, accomplished,
distinguished

© Oakleaf, 2010
Performances =
Performance Levels
© Oakleaf, 2010
Best Possible Performance
1. For each group area (―criteria‖),
what are our highest
expectations of the service?
What is the best possible
performance?

© Oakleaf, 2010
Other Possible Performances
1. For each group area (―criteria‖),
what are our highest
expectations of the service?
What is the best possible
performance?
2. The worst?
3. The other expected levels?
© Oakleaf, 2010
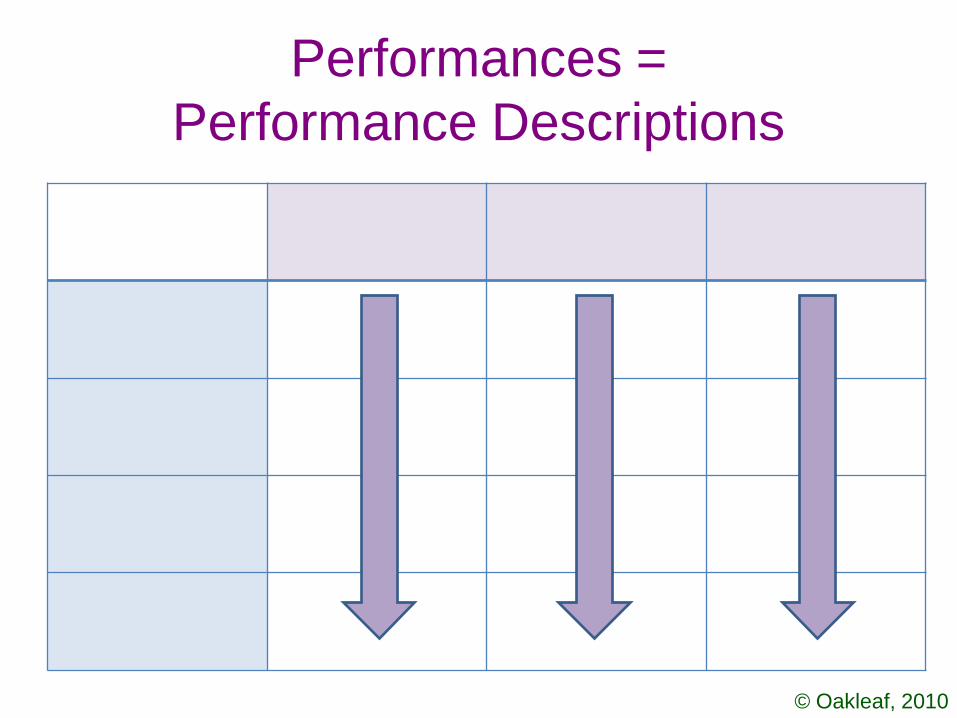
Performances =
Performance Descriptions

© Oakleaf, 2010
Common Design Flaws
• Too long
• Too ―jargony‖
• Too vague
• Inconsistent across performance levels
(using parallel language helps)
• Lack of differentiation across performance levels
• Too negative at lower levels

© Oakleaf, 2010
Rubric Norming Process
1. Think aloud through scoring several examples.
2. Ask raters to independently score a set of examples that reflects the
range of services libraries produce.
3. Bring raters together to review their scores to identify patterns of
consistent and inconsistent scores.
4. Discuss and then reconcile inconsistent scores.
5. Repeat the process of independent scoring on a new set of
examples.
6. Again, bring all raters together to review their scores to identify
patterns of consistent and inconsistent scores.
7. Discuss and then reconcile inconsistent scores. This process is
repeated until raters reach consensus about applying the scoring
rubric. Ordinarily, two to three of these sessions calibrate raters’
responses.
© Oakleaf, 2010
Thinking Aloud
What are appropriate
scores for these
examples?
© Oakleaf, 2010
Independent Scoring
What scores would you
assign to these
examples?

© Oakleaf, 2010
Reconciling Differences
Where do we disagree?
Can we come to
consensus?

© Oakleaf, 2010
Identifying Anchors
Are there great examples
of specific levels
on each criterion?
© Oakleaf, 2010
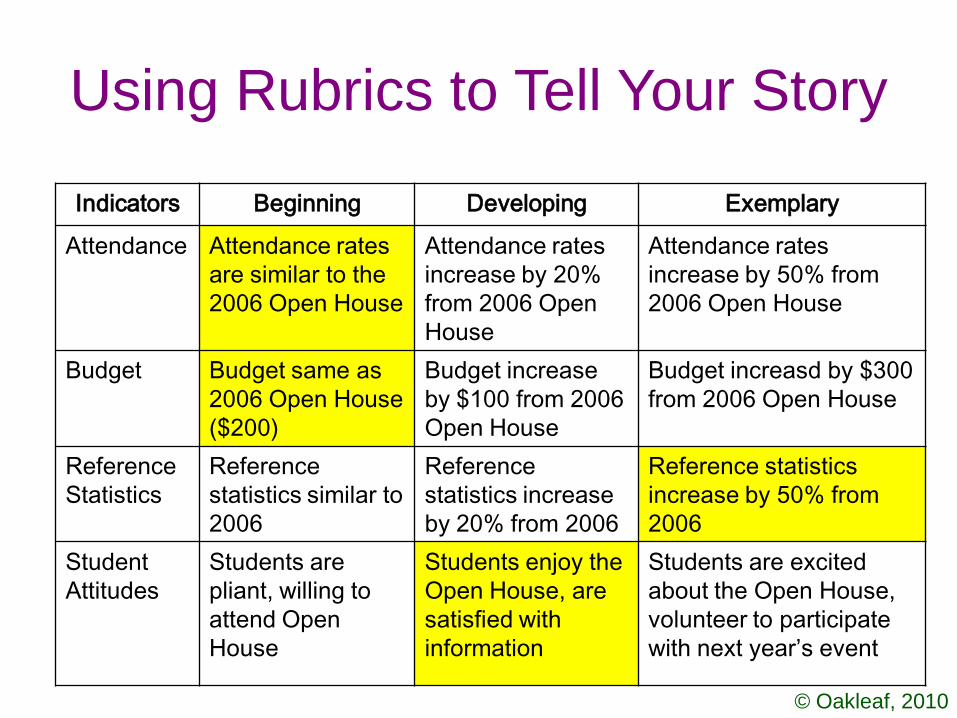
Using Rubrics to Tell Your Story
Indicators Beginning Developing Exemplary
Attendance Attendance rates
are similar to the
2006 Open House
Attendance rates
increase by 20%
from 2006 Open
House
Attendance rates
increase by 50% from
2006 Open House
Budget Budget same as
2006 Open House
($200)
Budget increase
by $100 from 2006
Open House
Budget increasd by $300
from 2006 Open House
Reference
Statistics
Reference
statistics similar to
2006
Reference
statistics increase
by 20% from 2006
Reference statistics
increase by 50% from
2006
Student
Attitudes
Students are
pliant, willing to
attend Open
House
Students enjoy the
Open House, are
satisfied with
information
Students are excited
about the Open House,
volunteer to participate
with next year’s event

© Oakleaf, 2010
Using Rubrics to Tell Your Story
Indicators Beginning Developing Exemplary
Attendance Attendance rates
are similar to the
2006 Open House
Attendance rates
increase by 20%
from 2006 Open
House
Attendance rates
increase by 50% from
2006 Open House
Budget Budget same as
2006 Open House
($200)
Budget increase
by $100 from 2006
Open House
Budget increase by $300
from 2006 Open House
Reference
Statistics
Reference
statistics similar to
2006
Reference
statistics increase
by 20% from 2006
Reference statistics
increase by 50% from
2006
Student
Attitudes
Students are
pliant, willing to
attend Open
House
Students enjoy the
Open House, are
satisfied with
information
Students are excited
about the Open House,
volunteer to participate
with next year’s event

© Oakleaf, 2010
Making
Connections to
Learning:
The Library in
the Academy
Megan Oakleaf, MLS, PhD
SOCHE 2010 Conference
www.meganoakleaf.info
© Oakleaf, 2010
Reflecting on this Session
• What did you find most useful?
• What did you learn?
• What challenged your thinking?
• What will you do in follow up?
– What do you want to learn more about?
– What do need to do to move forward?
– Who do you need to talk to move forward?
– Are there implications for policy changes?