Embed Size (px)
Citation preview
Case Studies of InterconnectionBarriers and their Impact onDistributed Power Projects
MakingMakingConnectionsConnections
NREL/SR-200-28053 Revised July 2000
United States Department Of Energy Distributed Power ProgramOffice of Energy Efficiency and Renewable Energy, Office of Power Technologies
Joseph GaldoDOE Distributed PowerProgram ManagerOffice of Power Technologies, EE-15U.S. Department of EnergyForrestal Building, 5H-0211000 Independence Avenue SWWashington, DC 20585Phone: (202) 586-0518Fax: (202) 586-1640
Richard DeBlasioNREL Distributed Power ProgramManagerNational Renewable EnergyLaboratory1617 Cole Blvd. (MS 3214)Golden, CO 80601Phone: (303) 384-6452Fax: (303) 384-6490
Gary Nakarado*National Renewable EnergyLaboratoryNREL Distributed Power ProgramTechnical Monitor1617 Cole Blvd. (MS 3214)Golden, CO 80601Phone: (303) 384-7468Email: [email protected]
*Contact for questions or commentson this report.
ABOUT THE AUTHORS
R. BRENT ALDERFER
R. Brent Alderfer is a leading national spokesperson on regulatory issues affecting distributed generation and renewableenergy markets. He recently launched Community Energy, Inc., a wind energy marketing company entering thecompetitive electric markets. A former state utility commissioner, he served as Chair of the Energy Resources andEnvironment Committee of the National Association of Regulatory Utility Commissioners, where he launched theassociation�s distributed power regulatory initiatives. He is an electrical engineer and a lawyer, a graduate of GeorgetownUniversity Law School.
THOMAS J. STARRS
Thomas J. Starrs is a principal in the energy and environmental consulting firm of Kelso Starrs & Associates LLC, based onVashon Island, Washington. His consulting practice focuses on the design, analysis and implementation of legal andregulatory incentives for the development of distributed power technologies, with a focus on solar and wind energy. Tomhas spoken before state legislative committees, public utility commissions, and state energy offices in over a dozen states,and has made invited presentations to numerous national organizations about distributed power. He holds a Ph.D. fromU.C. Berkeley�s Energy & Resources Group, and a law degree from U.C. Berkeley�s Boalt Hall School of Law.
M. MONIKA ELDRIDGE, PEMs. Eldridge is a principal with Competitive Utility Strategies, LLC where she is currently developing distributedgeneration and renewable energy projects as well as evaluating the economics and technical feasibility of distributedgeneration. During her 18 year career in the power generation industry, she has assisted utilities in strategic planning ofmajor power plant facilities and worked as a project manager for CMS Energy. She has a BS in mechanical and aerospaceengineering from the University of Delaware and is a registered professional engineer.
Cover photos (top to bottom):
The enpower-APS Automatic Paralleling Switchgear is an example of new equipment available for interconnecting to thegrid. Courtesy of ENCORP, Inc. NREL PIX #09125
At 10-kW, the BWC Excel Wind Turbine is an appropriate size for small distributed power generation projects. Courtesyof Bergey Wind Power Co., Inc. NREL PIX #02102.
PV Systems such as these modules installed near Fresno, California, can be built to whatever size is appropriate for adistributed generation project. Photo by Terry O'Rourke. NREL PIX #00252.
The Capstone Microturbine is an example of new small-scale generating equipment available for distribution powergeneration. Courtesy of Capstone Turbine Corporation. NREL PIX #08130
May 2000 � NREL/SR-200-28053
Making ConnectionsCase Studies of InterconnectionBarriers and their Impact onDistributed Power Projects
R. Brent Alderfer, M. Monika EldridgeCompetitive Utility Strategies, LLCDoylestown, Pennsylvania
Thomas J. StarrsKelso Starrs & Associates, LLCVashon, Washington
NREL Technical Monitor: Gary NakaradoPrepared under Subcontracts No. CXE9-29093-01 and CXE9-29092-01
National Renewable Energy Laboratory1617 Cole BoulevardGolden, Colorado 80401-3393NREL is a U.S. Department of Energy LaboratoryOperated by Midwest Research Institute •••• Battelle •••• Bechtel
Contract No. DE-AC36-99-GO10337
ton
NREL Technical Monitor: Gary NakaradoPrepared under Subcontracts No. CXE9-29093-01 and CXE9-29092-01
National Renewable Energy Laboratory1617 Cole BoulevardGolden, Colorado 80401-3393NREL is a U.S. Department of Energy LaboratoryOperated by Midwest Research Institute •••• Battelle •••• Bechtel
Contract No. DE-AC36-99-GO10337
NOTICE
This report was prepared as an account of work sponsored by an agency of the United Statesgovernment. Neither the United States government nor any agency thereof, nor any of their employees,makes any warranty, express or implied, or assumes any legal liability or responsibility for the accuracy,completeness, or usefulness of any information, apparatus, product, or process disclosed, or representsthat its use would not infringe privately owned rights. Reference herein to any specific commercialproduct, process, or service by trade name, trademark, manufacturer, or otherwise does not necessarilyconstitute or imply its endorsement, recommendation, or favoring by the United States government or anyagency thereof. The views and opinions of authors expressed herein do not necessarily state or reflectthose of the United States government or any agency thereof.
Available electronically at http://www.doe.gov/bridge
Available for a processing fee to U.S. Department of Energyand its contractors, in paper, from:
U.S. Department of EnergyOffice of Scientific and Technical InformationP.O. Box 62Oak Ridge, TN 37831-0062phone: 865.576.8401fax: 865.576.5728email: [email protected]
Available for sale to the public, in paper, from:U.S. Department of CommerceNational Technical Information Service5285 Port Royal RoadSpringfield, VA 22161phone: 800.553.6847fax: 703.605.6900email: [email protected] ordering: http://www.ntis.gov/ordering.htm
Printed on paper containing at least 50% wastepaper, including 20% postconsumer waste

Foreword
oday there is growing interest in distributed electricitygeneration, particularly onsite generation. This interest is
stimulated by the reliability, power quality, and environmentalneeds of business and homeowners, as well as the availabilityof more efficient, environmentally-friendly, modular electricgeneration technologies, such as microturbines, fuel cells,photovoltaics, and small wind turbines.
This report documents the difficulties faced by distributedgeneration projects seeking to connect with the electricity grid.The distributed generation industry has told us that removingthese barriers is their highest priority. The case studies treatedin this report clearly demonstrate that these barriers are real.They are, in part, an artifact of the present electricity industryinstitutional and regulatory structure which was designed for avertically integrated utility industry relying on large centralstation generation.
It is essential that energy and environmental policy reform accompany continued technologicalimprovement in order to bring the many benefits of distributed power systems to our Nation. Thechallenge for us today, as the authors of this report suggest, is to seize the opportunity offered bythe current restructuring of the electricity industry to create a new electricity system that supports,rather than stymies, the distributed generation.
We in the U.S. Department of Energy�s Office of Energy Efficiency and Renewable Energy lookforward to working with you, our customers, in meeting this challenge.
Dan W. ReicherAssistant Secretary of EnergyEnergy Efficiency and Renewable Energy
T

i
Executive Summary
Environmentally-friendly renewable energytechnologies such as wind turbines and photovoltaicsand clean, efficient, fossil-fuel technologies such asgas turbines and fuel cells are among the fleet of newgenerating technologies driving the demand fordistributed generation of electricity. Combined heatand power systems at industrial plants or commercialbuildings can be three times more efficient thanconventional central generating stations. Whenfacilities such as hospitals and businesses withcomputers or other critical electronic technology canget power from either the grid or their owngenerating equipment, energy reliability and securityare greatly improved.
Distributed power is modular electric generation orstorage located close to the point of use. It can alsoinclude controllable load. This study focusesprimarily on distributed generation projects.Distributed generation holds great promise forimproving the electrical generation system for theUnited States in ways that strongly support theprimary energy efficiency and renewable energygoals of the U.S. Department of Energy (DOE).Distributed generation offers customer benefits in theform of increased reliability, uninterruptible service,energy cost savings, and onsite efficiencies. Electricutility operations can also benefit. Smallerdistributed-generation facilities can delay oreliminate the need to build new large centralgenerating plants or transmission and distributionlines. They can also help smooth out peak demandpatterns, reduce transmission losses, and improvequality of service to outlying areas.
However, overlaying a network of small, non-utilityowned (as well as utility-owned) generating facilitieson a grid developed around centralized generationrequires innovative approaches to managing andoperating the utility distribution system, at a timewhen actual or anticipated deregulation has createdgreat uncertainty that sometimes discouragesadoption of new policies and practices.
In December 1998, DOE sponsored a meeting of thestakeholders in distributed generation. The need todocument the nature of the entry barriers fordistributed power technologies became clear.Customers, vendors, and developers of thesetechnologies cited interconnection barriers�
including technical issues, institutional practices, andregulatory policies�as the principal obstaclesseparating them from commercial markets. Industryand regulatory officials are also beginning to examinethe nature and extent of these barriers and to debatethe appropriate responses.
This report reviews the barriers that distributedgenerators of electricity are encountering whenattempting to interconnect to the electrical grid. Theauthors interviewed people who had previouslysought or were currently seeking permission tointerconnect. This study focuses on the perspective ofthe project proponents. No attempt was made toassess the prevalence of the barriers identified.∗
By contacting people known to be developingdistributed generation projects or to be interested inthese projects, and then gathering referrals from thosepeople, the authors were able to identify 90 potentialprojects for this study. Telephone interviews werethen conducted with people involved with those 90projects. For smaller projects, this was usually thecustomer or owner of the project. For larger projects,this was usually a distributed generation projectdeveloper building the facility for the customer. Theauthors obtained sufficient information about 65 ofthe 90 projects to develop full case studies for theseprojects. The sizes of the projects represented by thecase studies range from 26 megawatts to less than akilowatt.
Most of the distributed power case studiesexperienced significant market entry barriers. Of the65 case studies, only 7 cases reported no majorutility-related barriers and were completed andinterconnected on a satisfactory timeline. For theremaining case studies, the project proponentsexpressed some degree of dissatisfaction in dealingwith the utility. They believed that the utilities�policies or practices constituted unnecessary barriers
∗ The purpose and value of the study was simply toconfirm that barriers do exist, to provide illustrativeexamples of current case studies, and to initially identifythe kinds of barriers. The authors made no attempt toobtain a statistically valid or unbiased sample. Also, theuse of referrals to select case studies for identifyingbarriers likely skewed the selection toward cases wherethere were barriers.
ii
Findings
This report focuses on cases where barriers were present and does so from the project proponents�perspective. Nonetheless, the study offers the following findings about current barriers tointerconnection of distributed power generation projects.
• A variety of technical, business practice, and regulatory barriers discourage interconnectionin the US domestic market.
• These barriers sometimes prevent distributed generation projects from being developed.• The barriers exist for all distributed-generation technologies and in all regions of the
country.• Lengthy approval processes, project-specific equipment requirements, or high standard fees
are particularly severe for smaller distributed generation projects.• Many barriers in today�s marketplace occur because utilities have not previously dealt with
small-project or customer-generator interconnection requests.• There is no national consensus on technical standards for connecting equipment, necessary
insurance, reasonable charges for activities related to connection, or agreement onappropriate charges or payments for distributed generation.
• Utilities often have the flexibility to remove or lessen barriers.• Distributed generation project proponents faced with technical requirements, fees, or other
burdensome barriers are often able to get those barriers removed or lessened by protestingto the utility, to the utility�s regulatory agency, or to other public agencies. However, thisusually requires considerable time, effort, and resources.
• Official judicial or regulatory appeals were often seen as too costly for relatively small-scale distributed generation projects.
• Distributed generation project proponents frequently felt that existing rules did not givethem appropriate credit for the contributions they make to meeting power demand, reducingtransmission losses, or improving environmental quality.
to interconnection. As of completion of the report, 29of the case study projects had been completed andinterconnected; 9 were meeting only the customer�sload and were not sending any power to the grid; 2had disconnected from the grid; 7 had been installed,but were still seeking interconnection (and may beoperating independently in the interim); 13 werepending; and 5 projects had been abandoned.
For purposes of this analysis, the barriersencountered in the case studies were classified astechnical, business practice, or regulatory.
Technical barriers consist principally of utilityrequirements to ensure engineering compatibility ofinterconnected generators with the grid and itsoperation. Most significant of the technical barriersare requirements for protective equipment and safetymeasures intended to avoid hazards to utility propertyand personnel, and to the quality of power in thesystem. Proponents of potential distributed
generation systems often stated that the requiredequipment and custom engineering analyses areunnecessarily costly and duplicative. Suchrequirements added $1200 or 15% to the cost of a0.9 kW photovoltaics project, for example, plus anadditional $125 per year for relay calibration. Newergenerating equipment already incorporatestechnology designed specifically to address safety,reliability, and power-quality concerns.
Business-practice barriers arise from contractual andprocedural requirements for interconnection and,often times, from the simple difficulty of findingsomeone within a utility who is familiar with theissues and authorized to act on the utility�s behalf.This lack of utility experience in dealing with suchissues may be one of the most widespread andsignificant barriers to distributed generation,particularly for small projects. Utilities that set upstandard procedures and designate a point of contactfor distributed generation projects considerably
iii
simplify and reduce the cost of the interconnectionprocess both for themselves and for the distributedgeneration project proponents.
Other significant business-practice barriers includedprocedures for approving interconnection, applicationand interconnection fees, insurance requirements, andoperational requirements. Many project proponentscomplained about the length of time required forgetting projects approved. Seventeen projects�morethan 25% of the case studies�experienced delaysgreater than 4 months. Smaller projects often faced alack of uniform standards, procedures, anddesignated utility points of contact for determining aparticular utility�s technical requirements and reviewprocesses. This led to prohibitively long and costlyapprovals. Proponents of larger projects sometimesformed the perception that the utility was deliberatelydragging out negotiations. Application andinterconnection fees were frequently viewed asarbitrary and, particularly for smaller projects,disproportionate. Utility-imposed operationalrequirements sometimes resulted in direct conflictsbetween utility and customer needs. For example,utilities often ask to control the facility so that,among other things, they can shut down the facilityfor safety purposes during power outages. Thisrequirement would preclude the customer using thefacility for emergency backup power�a keyadvantage of distributed generation.
Regulatory barriers were principally posed by thetariff structures applicable to customers who adddistributed generation facilities, but included outrightprohibition of �parallel operation��that is, any useother than emergency backup when disconnectedfrom the grid. The tariff issues included charges andpayments by the utility and how the benefits andcosts of distributed generation should be measuredand allocated. Also, several project proponentsreported being offered substantial discounts on theirelectrical service from the utility as an inducementnot to build their planned distributed generationfacilities.
Backup or standby charges were the most frequentlycited rate-related barrier. Unless distributedgeneration customers want to disconnect completelyfrom the grid and invest in the additional equipmentneeded for emergency backup and peak needs, theywill be depending on the utility to augment theironsite power generation. This is a principal reason for
interconnection, but it can also impose a burden onthe utility because it may be required to maintainotherwise unnecessary capacity to meet thedistributed generation customers� occasional addeddemand. Charges for these services varied widely.Standby charges ranged from $53.34/kW-yr to$200/kW-yr for just the case study projects located inthe state of New York, for example. Projectproponents often felt that the charges were excessiveand that utility concerns could be addressed throughscheduling and other procedures. Other frequentlydisputed charges included transmission anddistribution demand charges and exit fees (charges todisconnecting customers that will no longer besupporting the payoff of the utility�s sunk or�stranded� cost in generation equipment).Furthermore, the charges imposed often do not reflectthe benefits to the grid the distributed generationmight provide.
For small customers, net metering (where the meterruns backwards when power is being contributed tothe grid�prescribed by law in about 30 states)provides credit at the retail rate. For large distributedgeneration facilities, however, the typically much-lower wholesale rate paid (or uplift charge assessedfor using transmission and distribution systems to sellpower to third parties in deregulated states) was oftenseen as unfair, especially if no credit was given foron-peak production. Project proponents felt thatutilities were not giving them credit for theircontribution to helping meet peak demands.
Environmental permitting was not a focus of thisreport, but many project proponents did cite it as aregulatory barrier. Inconsistent requirements fromstate to state and site to site were frequently listed asbarriers. The length of time and cost of testing tocomply with air quality standards was often seen asburdensome and unfair. Proponents also felt thatpermitting processes should give credit for thereplacement of older, more polluting, facilities by thedistributed generation projects (e.g. a gas turbineinstead of a central station coal-fired plant) as well asthe increased efficiencies, for example, of acombined heat and power facility.
The case studies identified a wide range of barriers togrid interconnection of distributed generationprojects. These barriers unnecessarily delay andincrease the cost of what otherwise appear to beviable projects with potential benefits to both the
iv
customer and the utility system. They sometimeseven kill projects. There are, however, severalpromising trends. Uniform technical standards forinterconnection are being developed by the Instituteof Electrical and Electronics Engineers. Individualstate regulatory agencies are adopting rules to addressbarriers to distributed generation. In 1999, the NewYork and Texas public utility commissions adoptedlandmark rules on interconnection, and ambitiousproceedings on distributed generation are nowunderway in California. Individual utilities haveadopted programs to promote distributed generation.These trends indicate the potential for resolution ofbarriers to interconnection of distributed generationprojects.
Much more must be done in order to create aregulatory, policy, and business environment whichdoes not create artificial market barriers to distributedgeneration. The barriers distributed generationprojects face today go beyond the problems oftechnical interconnection standards or process delay,which are more immediately apparent to the market.They grow out of long-standing regulatory policiesand incentives designed to support monopoly supplyand average system costs for all ratepayers.In the present regulatory environment, utilities havelittle or no incentive to encourage distributed power.To the contrary, regulatory incentives drive thedistribution utility to defend the monopoly againstmarket entry by distributed power technologies.Revenues based on throughput and system averagepricing are optimized by keeping maximum loads andhighest revenue customers on the system. But, as inany competitive market, those are the customers thatgain the most by switching to new, more economic,efficient, or customized power alternatives. Inaddition, current tariffs and rate design as a rule donot price distribution services to account for systembenefits that could be provided by distributedgeneration.
Resolution on a state-by-state basis will not addresswhat may be the biggest barrier for distributedgeneration�a patchwork of rules and regulationswhich defeat the economies of mass production thatare natural to these small modular technologies.Although regulatory proceedings and legal challengeseventually would resolve most of the identifiedbarriers, national collaborative efforts among allstakeholders are necessary to accelerate this process
so that near-term emerging markets for the newdistributed generation technologies are not stymied.
Distributed generation promises greater customerchoice, efficiency advantages, improved reliability,and environmental benefits. Removing artificialbarriers to interconnection is a critical step towardallowing distributed generation to fulfill this promise.
A Ten-Point Action Plan ForReducing Barriers to DistributedGeneration
Reduce Technical Barriers
(1) Adopt uniform technical standards forinterconnecting distributed power to the grid.
(2) Adopt testing and certification proceduresfor interconnection equipment.
(3) Accelerate development of distributed powercontrol technology and systems.
Reduce Business Practice Barriers
(4) Adopt standard commercial practices for anyrequired utility review of interconnection.
(5) Establish standard business terms forinterconnection agreements.
(6) Develop tools for utilities to assess the valueand impact of distributed power at any pointon the grid.
Reduce Regulatory Barriers
(7) Develop new regulatory principlescompatible with distributed power choices inboth competitive and utility markets.
(8) Adopt regulatory tariffs and utility incentivesto fit the new distributed power model.
(9) Establish expedited dispute resolutionprocesses for distributed generation projectproposals.
(10) Define the conditions necessary for a right tointerconnect.
v
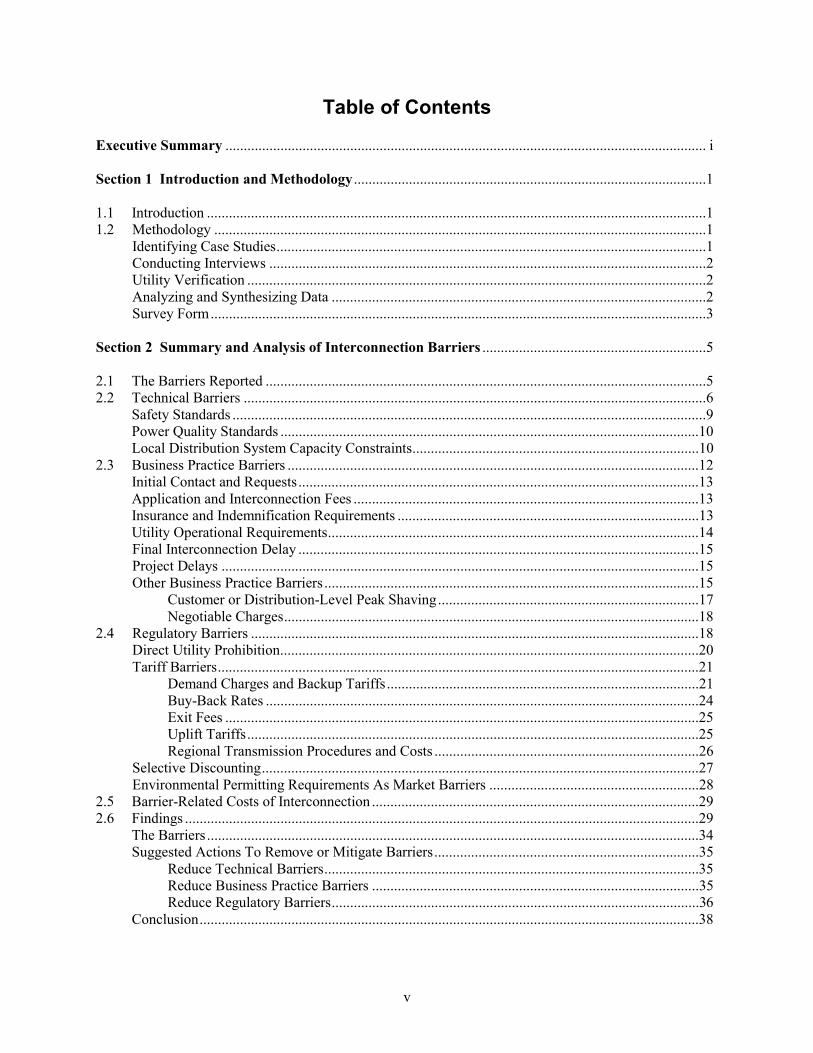
Table of Contents
Executive Summary ................................................................................................................................... i
Section 1 Introduction and Methodology ................................................................................................1
1.1 Introduction ........................................................................................................................................11.2 Methodology ......................................................................................................................................1
Identifying Case Studies.....................................................................................................................1Conducting Interviews .......................................................................................................................2Utility Verification .............................................................................................................................2Analyzing and Synthesizing Data ......................................................................................................2Survey Form.......................................................................................................................................3
Section 2 Summary and Analysis of Interconnection Barriers .............................................................5
2.1 The Barriers Reported ........................................................................................................................52.2 Technical Barriers ..............................................................................................................................6
Safety Standards .................................................................................................................................9Power Quality Standards ..................................................................................................................10Local Distribution System Capacity Constraints..............................................................................10
2.3 Business Practice Barriers ................................................................................................................12Initial Contact and Requests.............................................................................................................13Application and Interconnection Fees ..............................................................................................13Insurance and Indemnification Requirements ..................................................................................13Utility Operational Requirements.....................................................................................................14Final Interconnection Delay .............................................................................................................15Project Delays ..................................................................................................................................15Other Business Practice Barriers ......................................................................................................15
Customer or Distribution-Level Peak Shaving.......................................................................17Negotiable Charges.................................................................................................................18
2.4 Regulatory Barriers ..........................................................................................................................18Direct Utility Prohibition..................................................................................................................20Tariff Barriers...................................................................................................................................21
Demand Charges and Backup Tariffs.....................................................................................21Buy-Back Rates ......................................................................................................................24Exit Fees .................................................................................................................................25Uplift Tariffs...........................................................................................................................25Regional Transmission Procedures and Costs ........................................................................26
Selective Discounting.......................................................................................................................27Environmental Permitting Requirements As Market Barriers .........................................................28
2.5 Barrier-Related Costs of Interconnection .........................................................................................292.6 Findings ............................................................................................................................................29
The Barriers ......................................................................................................................................34Suggested Actions To Remove or Mitigate Barriers........................................................................35
Reduce Technical Barriers......................................................................................................35Reduce Business Practice Barriers .........................................................................................35Reduce Regulatory Barriers....................................................................................................36
Conclusion........................................................................................................................................38
vi
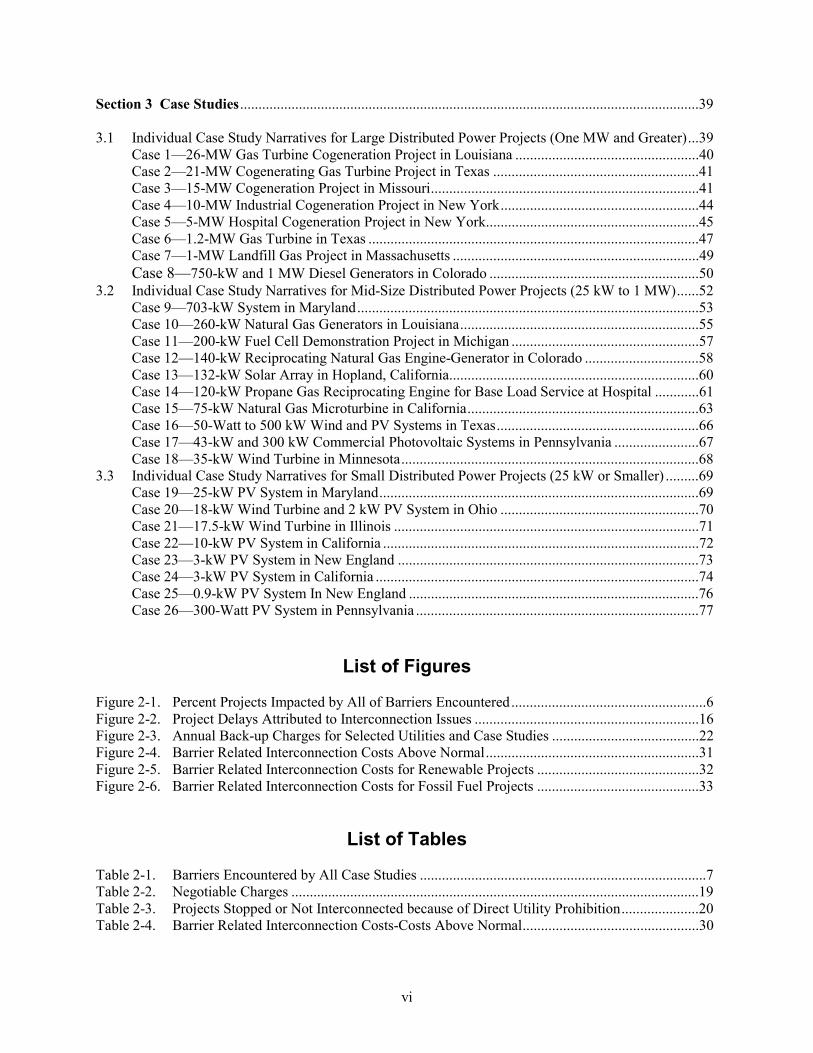
Section 3 Case Studies.............................................................................................................................39
3.1 Individual Case Study Narratives for Large Distributed Power Projects (One MW and Greater)...39Case 1�26-MW Gas Turbine Cogeneration Project in Louisiana ..................................................40Case 2�21-MW Cogenerating Gas Turbine Project in Texas ........................................................41Case 3�15-MW Cogeneration Project in Missouri.........................................................................41Case 4�10-MW Industrial Cogeneration Project in New York......................................................44Case 5�5-MW Hospital Cogeneration Project in New York..........................................................45Case 6�1.2-MW Gas Turbine in Texas ..........................................................................................47Case 7�1-MW Landfill Gas Project in Massachusetts ...................................................................49Case 8�750-kW and 1 MW Diesel Generators in Colorado .........................................................50
3.2 Individual Case Study Narratives for Mid-Size Distributed Power Projects (25 kW to 1 MW)......52Case 9�703-kW System in Maryland.............................................................................................53Case 10�260-kW Natural Gas Generators in Louisiana.................................................................55Case 11�200-kW Fuel Cell Demonstration Project in Michigan ...................................................57Case 12�140-kW Reciprocating Natural Gas Engine-Generator in Colorado ...............................58Case 13�132-kW Solar Array in Hopland, California....................................................................60Case 14�120-kW Propane Gas Reciprocating Engine for Base Load Service at Hospital ............61Case 15�75-kW Natural Gas Microturbine in California...............................................................63Case 16�50-Watt to 500 kW Wind and PV Systems in Texas.......................................................66Case 17�43-kW and 300 kW Commercial Photovoltaic Systems in Pennsylvania .......................67Case 18�35-kW Wind Turbine in Minnesota.................................................................................68
3.3 Individual Case Study Narratives for Small Distributed Power Projects (25 kW or Smaller) .........69Case 19�25-kW PV System in Maryland.......................................................................................69Case 20�18-kW Wind Turbine and 2 kW PV System in Ohio ......................................................70Case 21�17.5-kW Wind Turbine in Illinois ...................................................................................71Case 22�10-kW PV System in California ......................................................................................72Case 23�3-kW PV System in New England ..................................................................................73Case 24�3-kW PV System in California ........................................................................................74Case 25�0.9-kW PV System In New England ...............................................................................76Case 26�300-Watt PV System in Pennsylvania .............................................................................77
List of Figures
Figure 2-1. Percent Projects Impacted by All of Barriers Encountered.....................................................6Figure 2-2. Project Delays Attributed to Interconnection Issues .............................................................16Figure 2-3. Annual Back-up Charges for Selected Utilities and Case Studies ........................................22Figure 2-4. Barrier Related Interconnection Costs Above Normal..........................................................31Figure 2-5. Barrier Related Interconnection Costs for Renewable Projects ............................................32Figure 2-6. Barrier Related Interconnection Costs for Fossil Fuel Projects ............................................33
List of Tables
Table 2-1. Barriers Encountered by All Case Studies ..............................................................................7Table 2-2. Negotiable Charges ...............................................................................................................19Table 2-3. Projects Stopped or Not Interconnected because of Direct Utility Prohibition.....................20Table 2-4. Barrier Related Interconnection Costs-Costs Above Normal................................................30
1
SECTION 1. INTRODUCTION AND METHODOLOGY
1.1 Introduction
Distributed power is modular electric generation orstorage located close to the point of use. It can alsoinclude controllable load. This study focusesprimarily on distributed generation projects. Thesizes of the projects described in this report rangedfrom 26 megawatts to less than a kilowatt.
The convergence of competition in the electricindustry with the arrival of environmentally friendlymicroturbines, fuel cells, photovoltaics, small windturbines, and other advanced distributed powertechnologies has sparked strong interest in distributedpower, particularly in on-site generation. Thisconvergence of policy and technology could radicallytransform the electric power system as we know ittoday. Like the revolution that took us frommainframe computers to PC�s, this transformationcould take us from a power system that reliesprimarily on large central station generation to one inwhich small electric power plants located in ourhomes, office buildings, and factories provide mostof the electricity we use. The resulting majorimprovement in electric power reliability could savebillions of dollars now lost each year because ofpower disruptions. The impressive efficiency andenvironmental gains offered by distributed powertechnologies have the potential to contributesignificantly to mitigation of air pollution and globalclimate change. However, these distributed powertechnologies face an array of market entry barriers,which are the subject of this report.
At a Department of Energy (DOE) meeting ofindustry and public stakeholders in December 1998,the need to document the nature of the entry barriersfor distributed power technologies became clear.Customers, vendors, and developers of thesetechnologies cited interconnection barriers, includingtechnical and related institutional and regulatorypractices, as the principal obstacles separating themfrom commercial markets. As witnessed by thelandmark rules adopted in 1999 by the New York andTexas public utility commissions, and the ambitiousproceedings taking place in California, industry andregulatory officials are beginning to examine the
nature and extent of these barriers, and to debate theappropriate response.
This study serves to document the reality of marketentry barriers across the spectrum of distributedpower technologies by providing case studies ofdistributed power projects that have been impactedby these market barriers. However, the focus is onbarriers to interconnection with utility systems, andother important issues such as environmentalpermitting are not examined in detail in this report.
1.2 Methodology
Identifying Case Studies
The first challenge of the study was to identify grid-connected distributed power projects that wouldserve as subjects for the case studies. Representativesfrom trade associations, equipment manufacturers,distributed power project developers, utilities, utilityregulators, state energy officials, and others in thedistributed power industry were asked to identifyprojects that might be candidate case studies. Casestudy contacts also identified other possible casestudies. Altogether more than 150 individuals werecontacted during the course of this project.
These contacts identified more than 90 possibleprojects covering a broad range of fuel types,technologies, and sizes. For smaller projects, theinformation source was typically the projectowner/electricity customer. For larger projects, it wastypically a project developer. In a few cases, theequipment manufacturer was the source. The projectsvaried from those in the planning stages to those thatwere already in operation. Also included wereprojects that ultimately did not interconnect with theutility�s grid or which were abandoned. Many of theprojects were in the process of negotiation with theutilities for final interconnection. Some of projectswere not included in this report because of a lack ofcomplete or reliable information. Of the 90 projects,sufficient information was collected on 65 to treatthem as case studies. The findings and analyses ofthis report are based on these 65 case studies.
2
NOTE: Given the scope of this project and themanner of locating the distributed power casesdiscussed, no claims are made as to the likelihoodthat the cases represent any particular scale ofproblem, nor that the categories in which we haveplaced individual cases are statistically valid in anyformal sense. Rather, the cases report situationsencountered in the marketplace today and convey,where available, the participant�s suggestions abouthow to correct situations that hindered distributedpower development.
Conducting Interviews
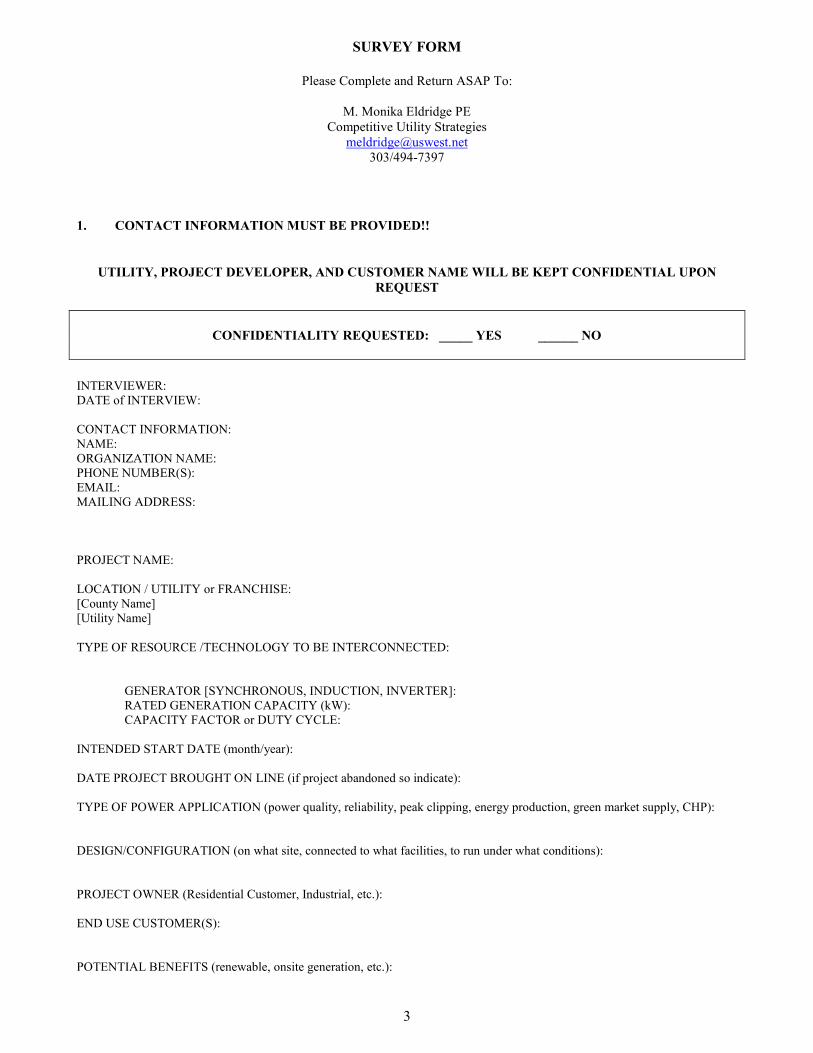
With assistance from the DOE and other distributedresource experts, an interview survey form (insertedon pages 3-4) was designed and used to document the65 case studies that form the basis of this report.1Using this survey form to guide the conversation, weinterviewed project information sources bytelephone. The completed form was then E-mailed orfaxed to the interviewee for verification whenpossible. Of the 65 case studies, we selected 26 asbeing representative of the barriers encountered andhaving sufficient information available to tell anillustrative story. These 26 cases are presented indetail in Section 3 of this report. To respectconfidentiality concerns and to avoid undue emphasison the specifics of any single case study, the namesof distributed power owners, specific facilitylocations, equipment vendors, and interconnectingutilities are excluded from the case study narratives.This report focuses on the nature and scope ofinterconnection barriers in the U.S domestic market,rather than practices of any particular utility orstakeholder.
Utility Verification
For each of the 26 projects detailed in Section 3, theinterconnecting utility was contacted�first to
1 The authors thank Joseph Galdo, Program Manager,Office of Power Technologies, and Richard DeBlasio andGary Nakarado of the National Renewable EnergyLaboratory for their leadership in setting up this study. JoeIannucci of Distributed Utility Associates was the mostnotably included of several experts who played key rolesin the conceptualization, organization, and review of thisstudy. Our biggest thanks, however, go to the manyprojects developers, owners, and utilities who participatedin the survey and follow-up interviews.
validate information provided by the owners ordevelopers, and second to document the utility�sopinions and recommendations. In instances wherethe project developer or owner desired to remainanonymous, the details of these projects were notdiscussed with the utility. Instead, generic questionsregarding the utility�s distributed power practiceswere asked to compare and confirm the utility�sposition as reported by the project owner ordeveloper. In addition, tariff information and copiesof interconnection procedures and applications wererequested. In some cases, there was no response fromthe utility. Thus, these case studies primarilyrepresent the developers� views of the situations theyencountered in seeking to interconnect thesefacilities. Therefore, the cases reported here may notreflect what might be a very different utility positionwith respect to some of the cases. (See additionaldiscussion at introductory discussion of case studies.)
Throughout this document, �the utility� typicallyrefers to the utility responsible for the distributionsystem with which the distributed generationinstallation sought to interconnect. This includesinvestor-owned utilities (IOUs), municipals, andcooperatives. In some cases, it may refer to ageneration and transmission (G&T) utility that placedrestrictions on the distribution utility.
Analyzing and Synthesizing Data
Finally, an attempt was made to summarize thebarriers encountered in the case studies anddemonstrate the real impact these barriers can haveon a distributed power project. Section 2 includes thesummary and analysis of the barriers represented inthe case studies. Section 2.5 is an initial attempt atquantifying the barrier-related costs ofinterconnection. Section 2.6 presents findings andconclusions, including suggested actions for reducingbarriers. Section 3 provides narrative descriptions of26 of the individual case studies.
3
SURVEY FORM
Please Complete and Return ASAP To:
M. Monika Eldridge PECompetitive Utility Strategies
[email protected]/494-7397
1. CONTACT INFORMATION MUST BE PROVIDED!!
UTILITY, PROJECT DEVELOPER, AND CUSTOMER NAME WILL BE KEPT CONFIDENTIAL UPONREQUEST
CONFIDENTIALITY REQUESTED: _____ YES ______ NO
INTERVIEWER:DATE of INTERVIEW:
CONTACT INFORMATION:NAME:ORGANIZATION NAME:PHONE NUMBER(S):EMAIL:MAILING ADDRESS:
PROJECT NAME:
LOCATION / UTILITY or FRANCHISE:[County Name][Utility Name]
TYPE OF RESOURCE /TECHNOLOGY TO BE INTERCONNECTED:
GENERATOR [SYNCHRONOUS, INDUCTION, INVERTER]:RATED GENERATION CAPACITY (kW):CAPACITY FACTOR or DUTY CYCLE:
INTENDED START DATE (month/year):
DATE PROJECT BROUGHT ON LINE (if project abandoned so indicate):
TYPE OF POWER APPLICATION (power quality, reliability, peak clipping, energy production, green market supply, CHP):
DESIGN/CONFIGURATION (on what site, connected to what facilities, to run under what conditions):
PROJECT OWNER (Residential Customer, Industrial, etc.):
END USE CUSTOMER(S):
POTENTIAL BENEFITS (renewable, onsite generation, etc.):
4
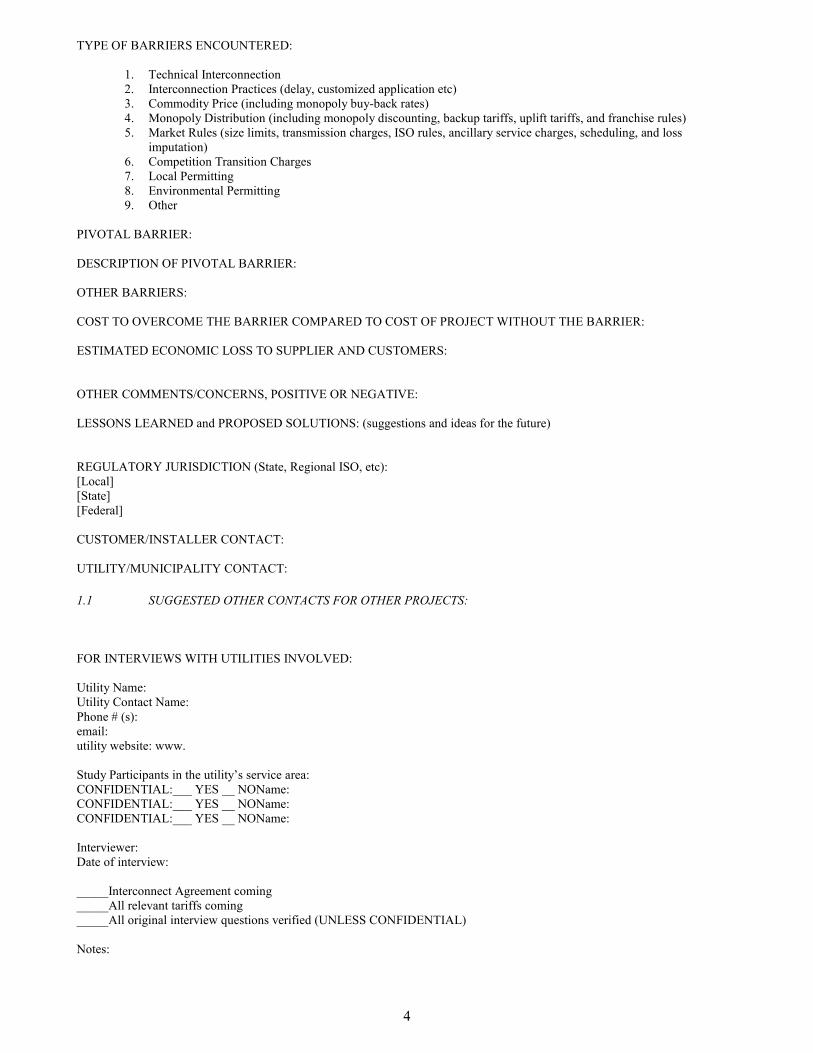
TYPE OF BARRIERS ENCOUNTERED:
1. Technical Interconnection2. Interconnection Practices (delay, customized application etc)3. Commodity Price (including monopoly buy-back rates)4. Monopoly Distribution (including monopoly discounting, backup tariffs, uplift tariffs, and franchise rules)5. Market Rules (size limits, transmission charges, ISO rules, ancillary service charges, scheduling, and loss
imputation)6. Competition Transition Charges7. Local Permitting8. Environmental Permitting9. Other
PIVOTAL BARRIER:
DESCRIPTION OF PIVOTAL BARRIER:
OTHER BARRIERS:
COST TO OVERCOME THE BARRIER COMPARED TO COST OF PROJECT WITHOUT THE BARRIER:
ESTIMATED ECONOMIC LOSS TO SUPPLIER AND CUSTOMERS:
OTHER COMMENTS/CONCERNS, POSITIVE OR NEGATIVE:
LESSONS LEARNED and PROPOSED SOLUTIONS: (suggestions and ideas for the future)
REGULATORY JURISDICTION (State, Regional ISO, etc):[Local][State][Federal]
CUSTOMER/INSTALLER CONTACT:
UTILITY/MUNICIPALITY CONTACT:
1.1 SUGGESTED OTHER CONTACTS FOR OTHER PROJECTS:
FOR INTERVIEWS WITH UTILITIES INVOLVED:
Utility Name:Utility Contact Name:Phone # (s):email:utility website: www.
Study Participants in the utility�s service area:CONFIDENTIAL:___ YES __ NOName:CONFIDENTIAL:___ YES __ NOName:CONFIDENTIAL:___ YES __ NOName:
Interviewer:Date of interview:
_____Interconnect Agreement coming_____All relevant tariffs coming_____All original interview questions verified (UNLESS CONFIDENTIAL)
Notes:
5
SECTION 2 SUMMARY AND ANALYSISOF INTERCONNECTION BARRIERS
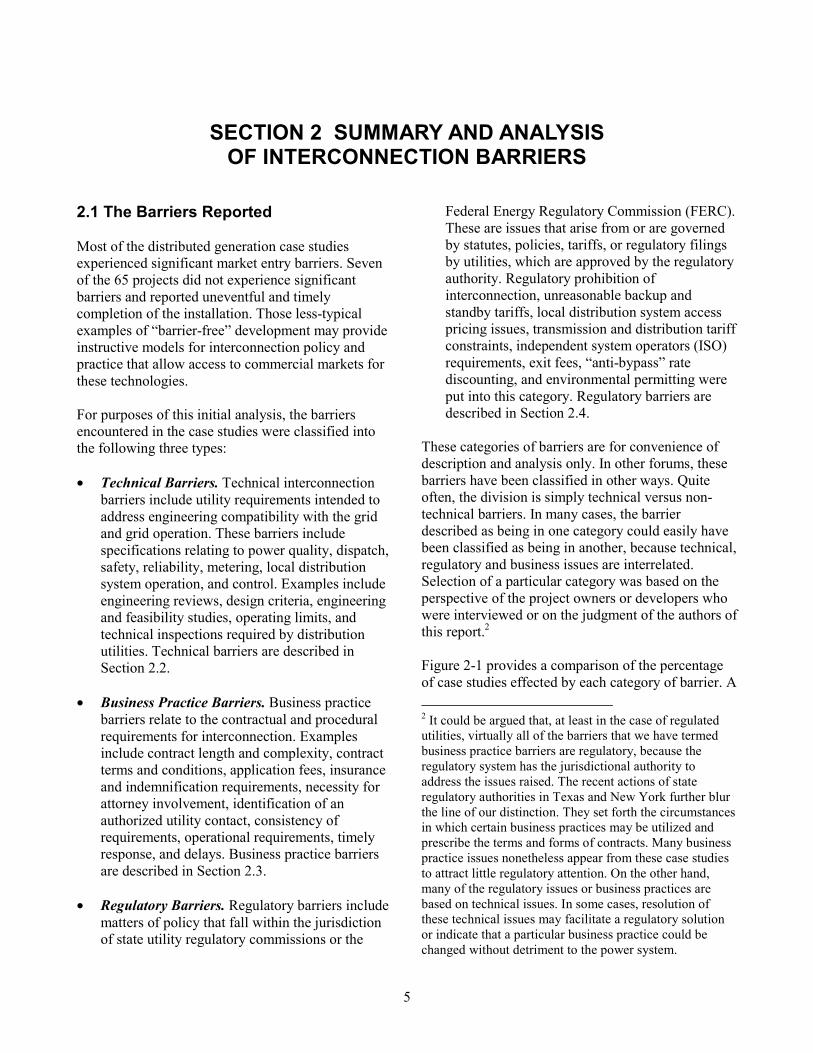
2.1 The Barriers Reported
Most of the distributed generation case studiesexperienced significant market entry barriers. Sevenof the 65 projects did not experience significantbarriers and reported uneventful and timelycompletion of the installation. Those less-typicalexamples of �barrier-free� development may provideinstructive models for interconnection policy andpractice that allow access to commercial markets forthese technologies.
For purposes of this initial analysis, the barriersencountered in the case studies were classified intothe following three types:
• Technical Barriers. Technical interconnectionbarriers include utility requirements intended toaddress engineering compatibility with the gridand grid operation. These barriers includespecifications relating to power quality, dispatch,safety, reliability, metering, local distributionsystem operation, and control. Examples includeengineering reviews, design criteria, engineeringand feasibility studies, operating limits, andtechnical inspections required by distributionutilities. Technical barriers are described inSection 2.2.
• Business Practice Barriers. Business practicebarriers relate to the contractual and proceduralrequirements for interconnection. Examplesinclude contract length and complexity, contractterms and conditions, application fees, insuranceand indemnification requirements, necessity forattorney involvement, identification of anauthorized utility contact, consistency ofrequirements, operational requirements, timelyresponse, and delays. Business practice barriersare described in Section 2.3.
• Regulatory Barriers. Regulatory barriers includematters of policy that fall within the jurisdictionof state utility regulatory commissions or the
Federal Energy Regulatory Commission (FERC).These are issues that arise from or are governedby statutes, policies, tariffs, or regulatory filingsby utilities, which are approved by the regulatoryauthority. Regulatory prohibition ofinterconnection, unreasonable backup andstandby tariffs, local distribution system accesspricing issues, transmission and distribution tariffconstraints, independent system operators (ISO)requirements, exit fees, �anti-bypass� ratediscounting, and environmental permitting wereput into this category. Regulatory barriers aredescribed in Section 2.4.
These categories of barriers are for convenience ofdescription and analysis only. In other forums, thesebarriers have been classified in other ways. Quiteoften, the division is simply technical versus non-technical barriers. In many cases, the barrierdescribed as being in one category could easily havebeen classified as being in another, because technical,regulatory and business issues are interrelated.Selection of a particular category was based on theperspective of the project owners or developers whowere interviewed or on the judgment of the authors ofthis report.2
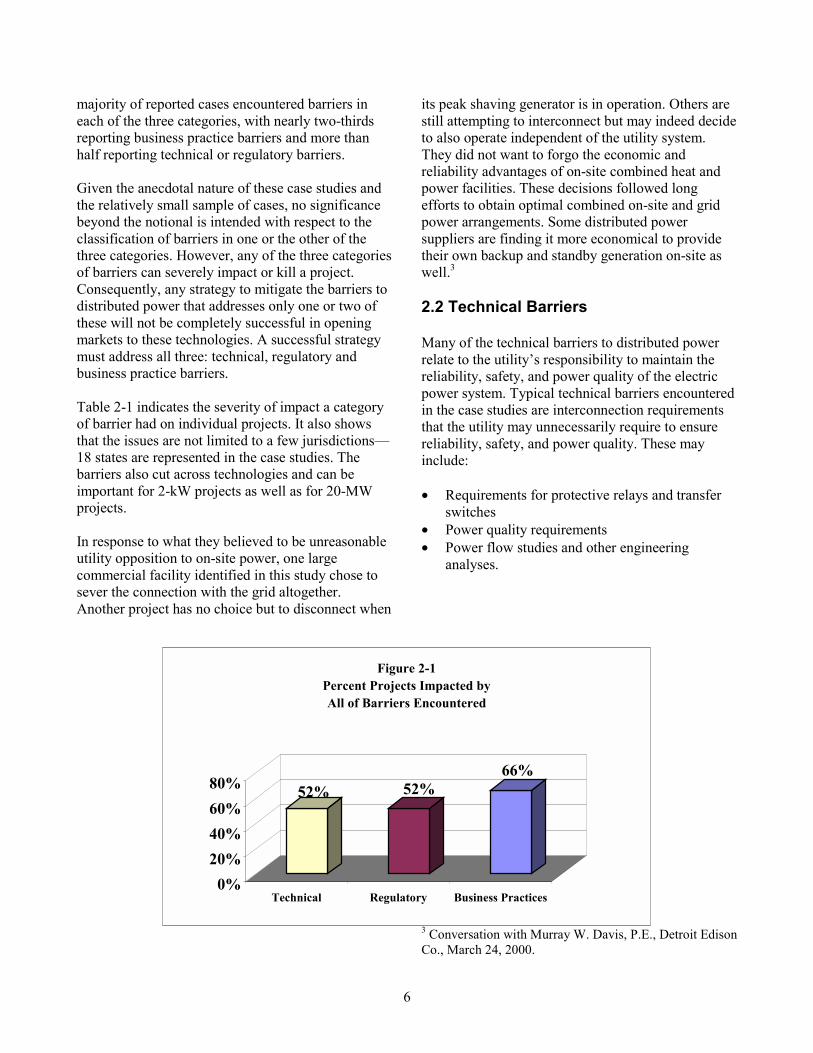
Figure 2-1 provides a comparison of the percentageof case studies effected by each category of barrier. A 2 It could be argued that, at least in the case of regulatedutilities, virtually all of the barriers that we have termedbusiness practice barriers are regulatory, because theregulatory system has the jurisdictional authority toaddress the issues raised. The recent actions of stateregulatory authorities in Texas and New York further blurthe line of our distinction. They set forth the circumstancesin which certain business practices may be utilized andprescribe the terms and forms of contracts. Many businesspractice issues nonetheless appear from these case studiesto attract little regulatory attention. On the other hand,many of the regulatory issues or business practices arebased on technical issues. In some cases, resolution ofthese technical issues may facilitate a regulatory solutionor indicate that a particular business practice could bechanged without detriment to the power system.
6
majority of reported cases encountered barriers ineach of the three categories, with nearly two-thirdsreporting business practice barriers and more thanhalf reporting technical or regulatory barriers.
Given the anecdotal nature of these case studies andthe relatively small sample of cases, no significancebeyond the notional is intended with respect to theclassification of barriers in one or the other of thethree categories. However, any of the three categoriesof barriers can severely impact or kill a project.Consequently, any strategy to mitigate the barriers todistributed power that addresses only one or two ofthese will not be completely successful in openingmarkets to these technologies. A successful strategymust address all three: technical, regulatory andbusiness practice barriers.
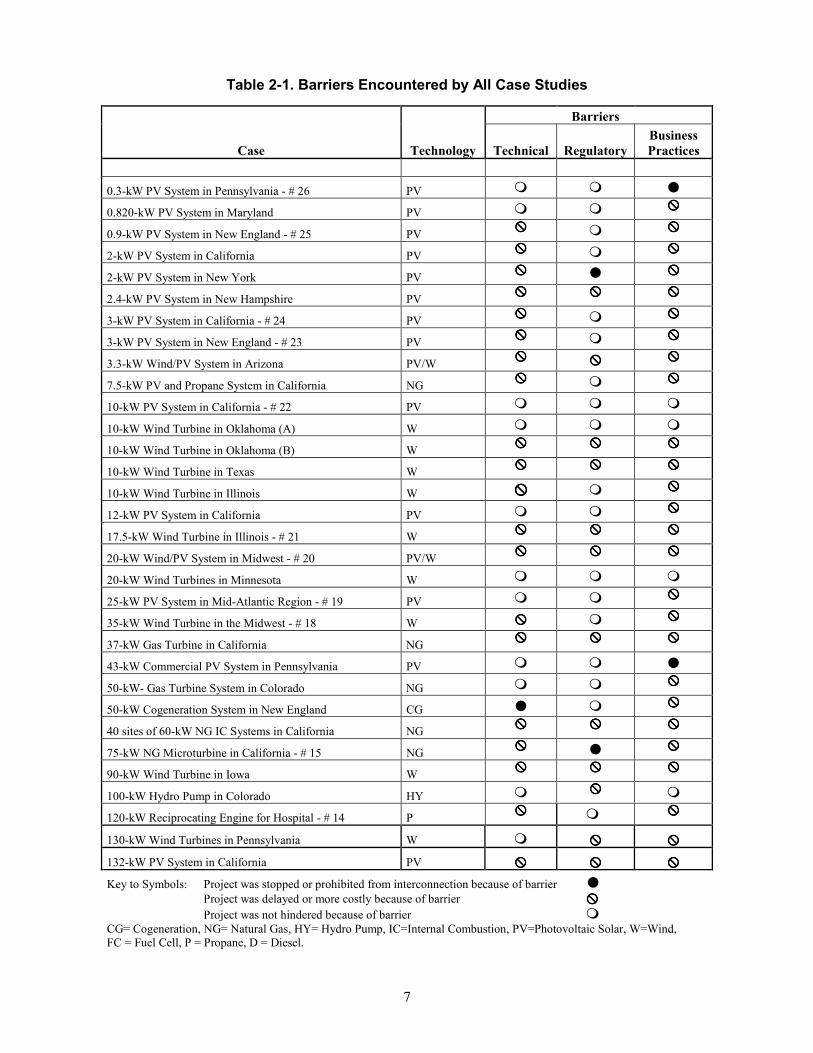
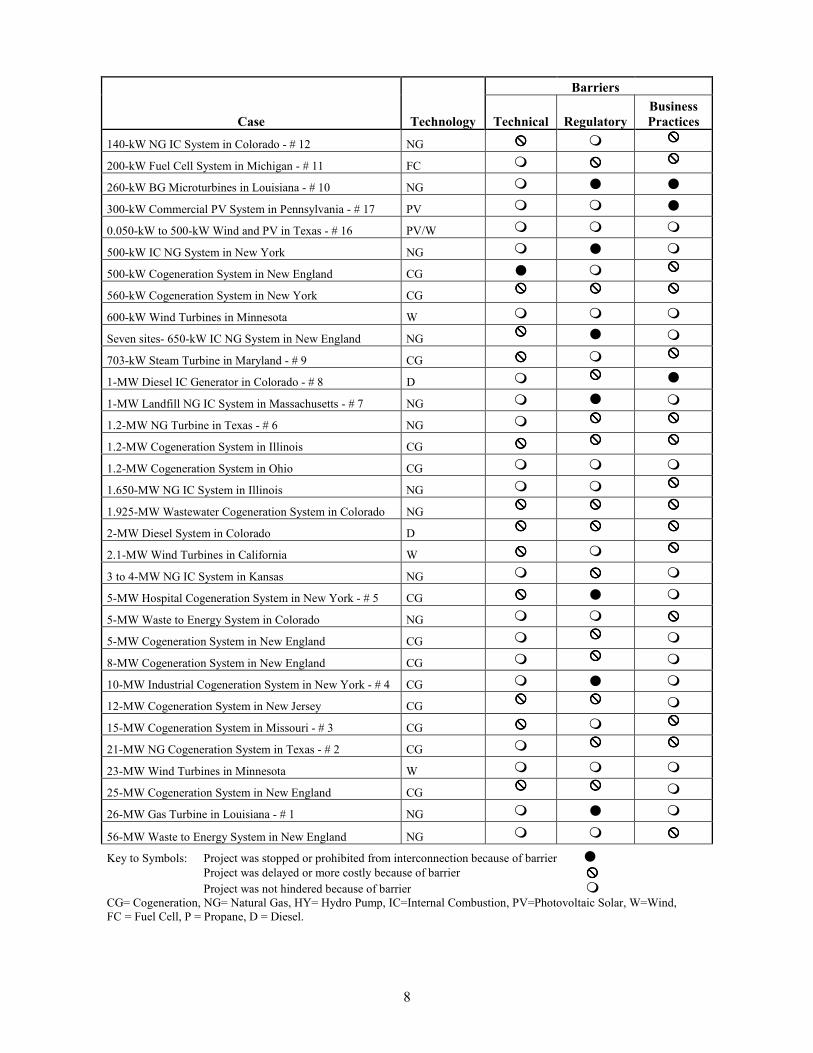
Table 2-1 indicates the severity of impact a categoryof barrier had on individual projects. It also showsthat the issues are not limited to a few jurisdictions�18 states are represented in the case studies. Thebarriers also cut across technologies and can beimportant for 2-kW projects as well as for 20-MWprojects.
In response to what they believed to be unreasonableutility opposition to on-site power, one largecommercial facility identified in this study chose tosever the connection with the grid altogether.Another project has no choice but to disconnect when
its peak shaving generator is in operation. Others arestill attempting to interconnect but may indeed decideto also operate independent of the utility system.They did not want to forgo the economic andreliability advantages of on-site combined heat andpower facilities. These decisions followed longefforts to obtain optimal combined on-site and gridpower arrangements. Some distributed powersuppliers are finding it more economical to providetheir own backup and standby generation on-site aswell.3
2.2 Technical Barriers
Many of the technical barriers to distributed powerrelate to the utility�s responsibility to maintain thereliability, safety, and power quality of the electricpower system. Typical technical barriers encounteredin the case studies are interconnection requirementsthat the utility may unnecessarily require to ensurereliability, safety, and power quality. These mayinclude:
• Requirements for protective relays and transferswitches
• Power quality requirements• Power flow studies and other engineering
analyses.
3 Conversation with Murray W. Davis, P.E., Detroit EdisonCo., March 24, 2000.
52% 52%66%
0%20%40%60%80%
Technical Regulatory Business Practices
Figure 2-1Percent Projects Impacted byAll of Barriers Encountered
7
Table 2-1. Barriers Encountered by All Case Studies
Barriers
Case Technology Technical RegulatoryBusinessPractices
0.3-kW PV System in Pennsylvania - # 26 PV � � �
0.820-kW PV System in Maryland PV � � ����
0.9-kW PV System in New England - # 25 PV ���� � ����
2-kW PV System in California PV ���� � ����
2-kW PV System in New York PV ���� � ����
2.4-kW PV System in New Hampshire PV ���� ���� ����
3-kW PV System in California - # 24 PV ���� � ����
3-kW PV System in New England - # 23 PV ���� � ����
3.3-kW Wind/PV System in Arizona PV/W ���� ���� ����
7.5-kW PV and Propane System in California NG ���� � ����
10-kW PV System in California - # 22 PV � � �
10-kW Wind Turbine in Oklahoma (A) W � � �
10-kW Wind Turbine in Oklahoma (B) W ���� ���� ����
10-kW Wind Turbine in Texas W ���� ���� ����
10-kW Wind Turbine in Illinois W ���� � ����
12-kW PV System in California PV � � ����
17.5-kW Wind Turbine in Illinois - # 21 W ���� ���� ����
20-kW Wind/PV System in Midwest - # 20 PV/W ���� ���� ����
20-kW Wind Turbines in Minnesota W � � �
25-kW PV System in Mid-Atlantic Region - # 19 PV � � ����
35-kW Wind Turbine in the Midwest - # 18 W ���� � ����
37-kW Gas Turbine in California NG ���� ���� ����
43-kW Commercial PV System in Pennsylvania PV � � �
50-kW- Gas Turbine System in Colorado NG � � ����
50-kW Cogeneration System in New England CG � � ����
40 sites of 60-kW NG IC Systems in California NG ���� ���� ����
75-kW NG Microturbine in California - # 15 NG ���� �����
90-kW Wind Turbine in Iowa W ���� ���� ����
100-kW Hydro Pump in Colorado HY � ���� �
120-kW Reciprocating Engine for Hospital - # 14 P ���� ��
����
130-kW Wind Turbines in Pennsylvania W � ���� ����
132-kW PV System in California PV ���� ���� ����
Key to Symbols: Project was stopped or prohibited from interconnection because of barrier �Project was delayed or more costly because of barrier ����
Project was not hindered because of barrier �
CG= Cogeneration, NG= Natural Gas, HY= Hydro Pump, IC=Internal Combustion, PV=Photovoltaic Solar, W=Wind,FC = Fuel Cell, P = Propane, D = Diesel.
8
Barriers
Case Technology Technical RegulatoryBusinessPractices
140-kW NG IC System in Colorado - # 12 NG ���� � ����
200-kW Fuel Cell System in Michigan - # 11 FC � ���� ����
260-kW BG Microturbines in Louisiana - # 10 NG � � �
300-kW Commercial PV System in Pennsylvania - # 17 PV � � �
0.050-kW to 500-kW Wind and PV in Texas - # 16 PV/W � � �
500-kW IC NG System in New York NG � � �
500-kW Cogeneration System in New England CG � � ����
560-kW Cogeneration System in New York CG ���� ���� ����
600-kW Wind Turbines in Minnesota W � � �
Seven sites- 650-kW IC NG System in New England NG ���� � �
703-kW Steam Turbine in Maryland - # 9 CG ���� � ����
1-MW Diesel IC Generator in Colorado - # 8 D � ���� �
1-MW Landfill NG IC System in Massachusetts - # 7 NG � � �
1.2-MW NG Turbine in Texas - # 6 NG � ���� ����
1.2-MW Cogeneration System in Illinois CG ���� ���� ����
1.2-MW Cogeneration System in Ohio CG � � �
1.650-MW NG IC System in Illinois NG � � ����
1.925-MW Wastewater Cogeneration System in Colorado NG ���� ���� ����
2-MW Diesel System in Colorado D ���� ���� ����
2.1-MW Wind Turbines in California W ���� � ����
3 to 4-MW NG IC System in Kansas NG � ���� �
5-MW Hospital Cogeneration System in New York - # 5 CG ���� � �
5-MW Waste to Energy System in Colorado NG � � ����
5-MW Cogeneration System in New England CG � ���� �
8-MW Cogeneration System in New England CG � ���� �
10-MW Industrial Cogeneration System in New York - # 4 CG � � �
12-MW Cogeneration System in New Jersey CG ���� ���� �
15-MW Cogeneration System in Missouri - # 3 CG ���� � ����
21-MW NG Cogeneration System in Texas - # 2 CG � ���� ����
23-MW Wind Turbines in Minnesota W � � �
25-MW Cogeneration System in New England CG ���� ���� �
26-MW Gas Turbine in Louisiana - # 1 NG � � �
56-MW Waste to Energy System in New England NG � � ����
Key to Symbols: Project was stopped or prohibited from interconnection because of barrier �Project was delayed or more costly because of barrier ����
Project was not hindered because of barrier �
CG= Cogeneration, NG= Natural Gas, HY= Hydro Pump, IC=Internal Combustion, PV=Photovoltaic Solar, W=Wind,FC = Fuel Cell, P = Propane, D = Diesel.
9
Safety Standards
The principal safety concern among utilities withrespect to connecting generation equipment to thegrid is protection against �islanding,� the conditionwhere a generating facility continues to supply powerto a portion of the grid when the balance of grid hasbeen de-energized (during a power outage, forexample).4 This condition is of concern in twoscenarios: where the distributed generator is either�feeding a short circuit� thus potentially causing afire, and where a lineman might mistakenly come incontact with what is otherwise thought to be a de-energized line.
Traditionally, utilities protected against islanding byusing mechanical relays and transfer switches thatautomatically isolated generating facilities from thegrid, whether these facilities were utility-owned ornon-utility owned. This equipment is effective andreasonably efficient, but is prohibitively expensivefor small-scale distributed generators.
However, continuing innovations in powerelectronics have resulted in the development ofrelatively inexpensive electronic circuitry thatprovides effective anti-islanding protection. Thetraditional protective relays and other anti-islandingequipment were separately engineered and installedat a substantial cost to the generator. The newerelectronic circuitry can be integrated into invertercomponents of the distributed generating facility atsubstantially lower cost. This circuitry can beprogrammed to shut down when there is no linevoltage detected from the utility. This new equipmenthas been operating for more than a decade(particularly in PV applications) without any reports
4 As distributed power technologies have begun to makecommunity-scale systems technically and economicallyfeasible, the advantages and enhanced reliability ofislanding are beginning to be explored. Keeping acommunity or facility�s lights on, when neighboringcommunities or facilities are out is not only an economicadvantage but a public health and safety advantage as well.Nonetheless, utilities often continue to view the potentialfor energizing an otherwise de-energized line as a safetyrisk to line workers, the public and property. The risk, asstated, is that a person could come into contact with autility line thinking it is de-energized when it is not.
of islanding-related problems.5 Moreover,Underwriters Laboratories (UL) has developed andapproved a functional test for the anti-islandingcircuitry for the inverter technology used in smallphotovoltaic and wind energy applications. The UL isalso expected to develop comparable standards for alldistributed generating technologies in coming years,as part of a parallel effort with the Institute ofElectrical and Electronics Engineers (IEEE) todevelop interconnection standards for the broadercategory of distributed generators. Developers havesuggested that there is a need to develop modelingtools and educational material for utility distributionto engineers so that they can expedite their review ofthese issues.
Nevertheless, a number of the case studies indicatethat utilities remain reluctant to accept the protectioncircuitry built into the distributed generating facilitiesas an alternative to separate protective relays andother anti-islanding equipment. For example, theowner of a 0.9-kW PV system in New Hampshirewas required by the utility to install separateprotective relays even though the PV system�sinverter included over/under voltage and over/underfrequency protection, as well as anti-islandingprotection. According to this distributed generator,the utility�s justification was that it was unfamiliarwith the inverter and preferred to use equipment withwhich it was more comfortable. The installation ofthe relays, however, cost the customer $600(approximately $660/kW) and increased the cost ofthe system by approximately eight percent. Inaddition, the utility required the customer to have therelays calibrated annually, imposing a recurring costof $125 per year that offsets nearly 65 percent of theannual energy output from the PV system.6
Another case involved 140-kW reciprocating-natural-gas-engine-generators installed in Colorado. Theutility required a multi-function solid-state relaypackage that cost the project developer an additional$3,000 for relays, which were redundant to those
5 Personal communication with John J. Bzura, Ph.D., P.E.,Principal Engineer, Retail Engineering Department, NewEngland Power Service Company, on February 10, 2000.Dr. Bzura has managed New England ElectricPhotovoltaic Research and Demonstration Projects since1987.6 Case #25.
10
already included in the multi-functioninterconnection package installed.7
Other case study respondents reported similarproblems with protective relay requirements thatappeared redundant to the distributed powerdevelopers, given the protection functions built intothe generating facilities. For instance, the developersof a 132-kW photovoltaic system in NorthernCalifornia reported that the interconnecting utilityinitially requested a separate package of pre-qualifiedor tested protective relays costing between $25,000and $35,000, even though the inverters installed withthe system incorporated the protective functions thatthe utility wanted. The utility eventually dropped thisrequirement.8
Another aspect of utility safety is a frequentrequirement that a utility perform its own tests onequipment with which it has no experience. Thisseparate utility testing requirement can addsignificant cost and delay to a project, especiallyfrom the vendors viewpoint. Vendors see eachseparate utility performing similar tests as anunnecessary major barrier and would like to seeprequalification or certification proceduresestablished.
Power Quality Standards
Power quality concerns include voltage andfrequency disturbances, voltage flicker, andwaveform distortion. Distributed power facilities, likecentral-station facilities, can have either a detrimentalor a beneficial effect on power quality.
As with the modern electronic approaches that canprovide islanding protection, innovation in powerelectronics is revolutionizing the way that powerquality concerns are addressed. Traditionally, utilitiesrequired the installation of over/under voltage andover/under frequency relays and other, separate,protective devices to ensure that power qualityrequirements were being met. Today, many
7 Case #12.8 Case #13.
distributed generators have built-in functionalitythat meets the most stringent of power qualityrequirements. For example, IEEE Standard 519-1992,entitled �Recommended Practices and Requirementsfor Harmonic Control in Electrical Power Systems,�has become the reference standard with respect topower quality concerns. This is the standard to whichinverter manufacturers generally design theirproducts.
The principal problem facing distributed generatorswith respect to power quality issues is the same aswith anti-islanding protection. Lacking experiencewith the newer technologies or standardized testingprocedures, utilities so far have been reluctant toaccept the power quality protection built intodistributed generating facilities. Instead, they havesought to require the use of traditional, utility-approved equipment instead.
Local Distribution System CapacityConstraints
The general approach among utilities in dealing withlocal distribution system capacity constraints is toconduct pre-interconnection studies beforeinterconnecting distributed generators. These studiesevaluate the potential effects of the distributedgenerating facility on the specific portion of utilitysystem to be affected, and determine whether anyupgrades or other changes are needed toaccommodate the generating facility. The cost ofthese studies usually is passed on to the distributedgenerator. This practice is often blessed by theregulatory bodies under the �user pays� principle.However, equivalent studies for new loads that maybe of equal size and impact on facilities may beaddressed quite differently under long-establishedservice tariffs. 9
9 Distribution system engineering has been referred to asan �art, not a science.� While not all engineers wouldagree, there is agreement that there are many morevariables in distribution engineering than designingtransmission. This complexity can lead to a variety ofsolutions by utilities , thus making standardization ofdistributed utility solutions more difficult.
11
The following case histories identified the cost anddelay of pre-interconnection studies as a significantbarrier to interconnection of their distributedgenerating facilities:
• A 0.9-kW PV system in New Hampshire thatpaid $600 for an interconnection study($667/kW)10
• A 3-kW PV system in New Hampshire where thecustomer refused to pay $1,000 for aninterconnection study ($333/kW)11
• A 703-kW cogeneration facility in Marylandwhere the customer paid $40,000 and lost severalmonths of project time to design engineeringreview standards subsequently abandoned by theutility.12
New York and Texas recently addressed the conflictbetween a utility�s interest in conductinginterconnection studies and a distributed generator�sinterest in limiting the scope and cost of such studies.These two states, however, have taken differentapproaches.
In New York, the Public Service Commissionadopted a rule on December 31, 1999,13 that statesthat interconnection studies shall not be required forfacilities under 10-kW. Also, studies may not berequired for facilities up to 50-kW interconnected ona single-phase line, or up to 150-kW on a three-phaseline. Beyond these limits, an interconnection study isrequired, and the full cost of any study is passedthrough to the distributed generator.
On December 1, 1999,14 the Texas Public UtilityCommission adopted a rule that is more flexible andaccommodating to utilities and distributed generators.The Texas proposal stated that a utility may conduct
10 Case #25.11 Case #23.12 Case #9.13 State of New York Public Service Commission, OpinionNo. 99-13, Case No. 94-E-0952 � In the Matter ofCompetitive Opportunities Regarding Electric Service,filed in C 93-M-0229, Opinion and Order AdoptingStandard Interconnection Requirements for DistributedGeneration Units, Issued and Effective: December 31,1999. http://www.dps.state.ny.us/fileroom/doc7024.pdf.14 See http://www.puc.state.tx.us/rules/rulemake/21220/21220.cfm.
a study before interconnecting any facility. However,Texas prohibits a utility from charging certaindistributed generators for the cost of the study,including the following:
• Distributed power facilities that will not or do notexport power to-the utility system, regardless ofsize
• Individual single-phase distributed power unitsexporting less than 50-kW to the utility systemon a single transformer
• Individual three-phase units exporting not morethan 150-kW to the utility system on a singletransformer
• Pre-certified distributed power units (as definedin the rule) up to 500-kW that export not morethan 15 percent of the minimum total load on asingle radial feeder and also contribute not morethan 25 percent of the maximum potential shortcircuit current on a single radial feeder.
Developers or owners of distributed generatingfacilities not qualifying for one or more of theseexemptions may be charged for the costs to conductan interconnection study.
The Texas rule also establishes certain performance-related standards for a utility in cases where aninterconnection study is required, as follows:
Time Limit. The conduct of such pre-interconnectionstudy shall take no more than four weeks.
Written Findings Required. A utility shall preparewritten reports of the study findings and make themavailable to the customer.
Consideration of Costs and Benefits to SystemRequired. The study shall consider both the costsincurred and the benefits realized as a result of theinterconnection of distributed power to thecompany�s utility system.
Estimate of Study Cost Required. The customer shallreceive an estimate of the study cost before the utilityinitiates the study.
12
2.3 Business Practice Barriers
Business practices for these purposes include thecontractual and procedural requirements imposed bythe utility before it allows interconnection. Althoughall such business practices are, in principle, subject toregulatory authority, there appears to be littleregulatory attention so far to business practices thatare discouraging distributed generators.
Business practices create artificial barriers when theyimpose terms, costs, or delays that are unnecessaryfor purposes of safety and reliability, and areinconsistent with the underlying economics or otherdrivers of the distributed generation project. Many ofthe distributed generation developers that wereinterviewed believe that some utilities useunreasonable terms, excessive costs, andinappropriate delays to either gain utility advantageor impede the market for distributed power. Thepractices that most often create barriers center aroundthe following:
• Initial utility contact and requests forinterconnection
• Application and interconnection fees
• Insurance and indemnification requirements
• Utility operational requirements
• Final interconnection requirements andprocedures.
The case studies reveal utility business practices thatvary from utilities that promote distributed powerunder cooperative arrangements15 to those thatactively oppose the entry of distributed power,including flat prohibition. As with the othercategories of barriers, instances where the businesspractices of the utility resulted in projects whereinterconnection went smoothly provide a usefulcontrast to cases where substantial barriers werepresent. Such utilities value distributed power as aresource, particularly during peak demand periods,or see streamlined interconnection as a potentialfuture market opportunity for them. 15 For a description of a utility that has embraced andencouraged distributed generation see discussion of modelpeak shaving practices of Orange and Rockland onpage 16.
One wind energy customer called the local utilityonly twice, once at the initiation of the project to givenotice of intent to connect and once at the conclusionin order to begin generation. The utility began netbilling without further requirements.16 In California,the requirements for interconnecting small PVsystems under the state�s net metering law have nowbecome standardized to the point where mostcustomers report no interconnection-related conflictswith their utilities.17 One common element associatedwith projects where distributed generation developerswere more satisfied with their business dealings withthe utilities was the designation by the utility of aspecific contact person to review necessaryrequirements and assist in procedures.
Interviews with project owners and developerssuggest, however, that some utilities generallyoppose interconnection of distributed power, withvarying explanations. Some utility representativestold customers that interconnection was not possible.In some cases, utilities knowingly or unknowinglychose not to follow state commission regulations,forcing the customer to pursue legal remedies. In onecase, a municipal utility initially refused to buy backpower from a facility because the city claimed it wasnot regulated by the Federal Energy RegulatoryCommission (FERC) and not subject to the PublicUtility Regulatory Policies Act (PURPA). The stateutility commission eventually held that the city wassubject to PURPA.18 In another case, the utilityinterpreted PURPA as requiring only QualifyingFacilities (QF) distributed generation to be connectedto the distribution system. After long negotiations,the utility stated that it would make an exception toallow interconnection of non-QF generation in thatspecific case.19
In other cases, utilities appeared to suffer more froma lack of experience and an absence of establishedprocedures for addressing interconnection ofdistributed generators than intent to create barriers.In many of the case studies, the utilities did not havea designated department to deal with interconnectionissues and could not provide the necessary guidance.As one project developer stated, �the utility didn�t
16 10-kW Wind Turbine in Oklahoma (A)17 Case #22.18 10-kW Wind Turbine in Oklahoma (B)19 10-kW Wind Turbine in Texas.
13
understand the project benefits, though several peoplethere did support the project. They did not understandhow to build and connect this system, and they wouldnot take the leadership role to coordinate projectfulfillment." (Note that some developers believe thatnot all vendors have provided enough support toutilities and developers in this area.) This developerexperienced significant delays completing theinterconnection process.20 In some smallerinstallations, owners were able to install the projecton the customer side of the meter without notifyingthe utility, so as to avoid the delays and costsassociated with the interconnection process.
Encouragingly, many utilities are demonstratingprogress toward more expedient procedures forhandling interconnection on a routine basis. Mostlythis is in response to clear obligations to connect andmore frequent requests for interconnection as hasoccurred in some states for smaller-scale systemsunder net metering laws.
Initial Contact and Requests
Case studies where interconnection was completed ina commercially reasonable time frame benefited froma consistent point of contact and a prompt responsetime. Judging from the case studies, such �bestpractice� is not the usual procedure among manyutilities. Reaching the appropriate utilityrepresentative and getting a consistent response wasfrequently cited as a significant problem for bothsmall- and mid-sized projects. With large projects,developers usually included these costs as a �part ofdoing business with utilities� and could more easilybear the cost of lengthy contested legal negotiations.Many distributed power facilities could not. Mostoften cited problems included the following:
• Application process delays
• Unproductive time spent by individuals anddevelopers
• Excessive procedural requirements.
Application and Interconnection Fees
Application and interconnection fees are generallyrequired for the approval or permitting of distributed 20 2-MW Diesel System in Colorado.
power facilities. These fees are typically assessedregardless of size of the proposed project. Therefore,they present a significant market barrier for smaller-scale facilities.
In one case, the utility initially requested an�installation fee� of $776.80 for a 3-kW PV systemor $259/kW. The customer contacted the state energyoffice for assistance, after which the utility's responsechanged. Approximately 15 days after payment of thefee, the utility returned the check stating that no"meter installation fee" was required. Contrary to theinitial response, the customer's existing meter was bi-directional and therefore was capable of net meteringthe facility.21
Some of the smallest distributed generators are askedto pay fees or charges equivalent to many months�or even years�worth of anticipated energy savings.For instance, in one case the owner of a 250-Watt�AC Module� photovoltaic system faced up to $400in interconnection fees, which added $1,600/kW tothe project costs and was equivalent to approximatelyten years of energy savings from the system.22
Insurance and IndemnificationRequirements
Insurance requirements are a particularly troublingissue for small distributed power facilities. Smalldistributed generators argue that the risks fromfacilities that use UL listed equipment and areinstalled in accordance with IEEE and otherapplicable standards are minimal, and comparableto electrical appliances and other equipment that areroutinely interconnected without specialrequirements. Moreover, these distributed generatorsargue that in the unlikely event of an accident,existing laws are adequate to allocate liability amongpotentially responsible parties. Utilities argue that as"deep pockets," they are likely to be brought into anyclaim attributed to the operation of a customer-owneddistributed generating facility. They add thatgenerators pose increased risk compared to applianceand electric loads. On these grounds, they demandinsurance and indemnification naming them as payee.
21 Case #24.22 Case #26.
14
Insurance requirements are often high in relation tothe project cost, particularly compared to standardcommercial practice with other products. One utilityrequired $1 million in worker�s compensationinsurance coverage and $5 million in commercialgeneral liability insurance coverage for the parallelinterconnection of any non-utility generating source.
A 12-kW solar photovoltaic demonstration system inFlorida (not a case study) was forced to shut downwhen the utility imposed a $1 million liabilityinsurance requirement. The utility had claimed thatthe cost for required coverage would be in the rangeof $500 to $1,000. The facility owner received quotesfor this coverage of $6,200 per year, however, andshut down the project because of this.
In response to this issue of liability insurancerequirements, at least five states have prohibitedutilities from imposing liability insurancerequirements on small-scale distributed powerfacilities. In at least four other states, utilityregulatory commissions have reduced insurancerequirements from the $500,000 to $2,000,000 rangerequested by utilities to $100,000 to $300,000,depending on the state and the type of facility.23 InNew York, for example, the Public ServiceCommission rejected the utilities� proposed insurancerequirements for small-scale PV systems, afterconcluding that the proposed requirements were�clearly burdensome and overly costly,� and notingthat one utility�s proposed requirements �are
23 The five states that have prohibited additional insurancerequirements are California, Maryland, Nevada, Oregon,and Virginia. In Idaho, a utility-proposed $1 millioninsurance requirement was reduced by the PUC to$100,000. In New York, utility-proposed requirements of$500,000 to $1 million were reduced by the PSC to$100,000. In Vermont, utility-proposed requirements of$500,000 were reduced by the PSB to $100,000 forresidential customers� systems and $300,000 forcommercial customers� systems. Finally, in Washington,utility-proposed requirements of $2 million were reducedby the UTC to $200,000. See Response of the AmericanSolar Energy Society, American Wind EnergyAssociation, Interstate Renewable Energy Council, SolarEnergy Industries Association, and Maryland-DC-VirginiaSolar Energy Industries Association to the Request forInformation from the Virginia Corporation Commission(August 30, 1999), on file with the Virginia CorporationCommission.
practically impossible for residential customers tomeet.�24 The New York Commission instead allowedutilities to require customers to demonstrate that theyare carrying at least $100,000 in liability coveragethrough their existing homeowner�s policies.
Utility Operational Requirements
Operational requirements imposed by utilities alsocan make distributed power applicationsuneconomical. In one case, a distributed generatingfacility operating in a network distribution system25
was required by the utility to shut down if one of thenetwork feeders went down. This operationalrequirement was contrary to the distributedgeneration facility's purpose of optimizing energyproduction and increasing reliability for the customer,and unexpected in light of the technical modificationsand safety equipment the vendor agreed to install tooperate as intended.26
In another case, the utility required the facility toreduce its output to below the customer's loads servedby the distributed power facility. Because the facilitymust limit its generation to ensure that it does notexport energy to the utility, this also prevents anyexport of excess power to other customers. Thedistributed generation developer was told that theutility was concerned with preserving loads for theutility�s own baseload generating plants. This utility-imposed limitation eliminated any access towholesale power markets for the distributed powerfacility. This operating constraint in turn cut off theeconomic and system benefits that might result fromdelivery into those markets during times of peakdemand, or to meet specialized demand, as mightarise for renewable energy, in those markets.27
24 New York Public Service Commission, Order on NetMetering of Residential Photovoltaic Generation (Feb. 11,1998).25 In contrast to a radial-feed distribution system, anetwork distribution system accommodates multiplesources feeding a honeycomb grid with multiple paths andfeeder lines into any one location. The multiple flow pathsfrom any particular source to any particular load can bemore complex on these systems, but the reliability impactof losing any one line can also be less severe.26 Case #9.27 1.2-MW Cogenerating System in Illinois.
15
In some cases, the utility asserted complete controlover operation of equipment for the stated purpose ofshutting down the facility for planned and unplannedoutages28 of the utility system. In other cases, utilitiesimposed control requirements out of safetyconsiderations or for maintaining distribution systemstability. However, as discussed above, vendors claimthat most of today�s distributed power equipment isdesigned to manage these legitimate safety needs. Inmost cases, discontinuing parallel operation duringemergencies and other abnormal operating conditionscan be easily handled through technical andcontractual requirements without turning overcomplete operational control of the distributed powerfacility. Again, although utility operational controlmight have been acceptable for the much-largerPURPA facilities, it is often unacceptable fordistributed power facilities, where customerobjectives include the provision of backup oremergency power or sales into real-time powermarkets.
In one instance where the utility needed thecustomer-owned, on-site, generation to reduce systempeaks to meet the utility�s supply needs, the customerwas nonetheless prohibited from peak shaving toreduce its own bill. The utility required exclusivecontrol of the operation of the equipment, whichallowed it to start the generator to meet utilityrequirements, while preventing the customer fromdoing so. In another case, the customer was allowedto curtail load during peak periods to reduce its bill,but not permitted to operate back up generation tocontinue operation during peak periods. The facilityhad a backup generator that it was willing to operate,but the utility would not allow operation.29
Utilities also have procedural requirementsappropriate for some, but not all, distributed powerfacilities. For example, one utility requires distributedfacilities to maintain an operational log. Manyutilities require a generator to notify the utility beforebringing the facility on line. The utility may requirethe facility to delay synchronizing when the utility isexperiencing line trouble or system disturbances.
28 Planned outages occur for purposes such as maintaininglines; testing relays; rearranging, modifying, orconstructing lines; and maintaining lines or stationequipment.29 Case #8.
Some of these requirements, originally developed(and intended) for larger facilities, are inappropriatefor smaller facilities that are indistinguishable fromnormal load variations during the course of systemoperation. In fact, some utilities do exempt smallerfacilities.
Final Interconnection Delay
Proponents of several projects reported delayscontinuing from the application process through finalapproval. In some cases these delays wereprocedural; in other cases, delays were equipment-related on the utility side. One utility postponedtransmission connection on questions of systemreliability for several months during the early highdemand summer months, then reversed its position asthe summer peak approached and the probabilityarose of capacity shortages.30 In another case, a utilityentered a contract with a project owner allowing forinterconnection if the project met certain criteria.After the project met the requirements and testing ofthe facility was complete, the utility stated that thefacility could not interconnect at the time.31
Project Delays
As reported by project developers and customers, thetotal process from initially contacting the utility toobtaining final approval could be a lengthy one. In 17of the 65 cases, no delay was reported and the projectwas operational as scheduled. Twenty five of the 65projects experienced some delay. In three cases, theprojects did eventually go forward even though thedelay was considerably greater than two years.Figure 2-2 shows the actual reported delay in numberof months beyond planned interconnection. Note thatfor 23 projects interviewers were not able to statedefinitely if a delay occurred or not; so only 42 casesare reported in this figure.
Other Business Practice Barriers
Utilities continue to maintain monopoly control ofthe distribution system to which distributed powerprojects must interconnect. Although theirrelationships with distributed generators are subjectto regulatory scrutiny, as discussed above, utilities 30 Case #3.31 500-kW Cogeneration System in New York.
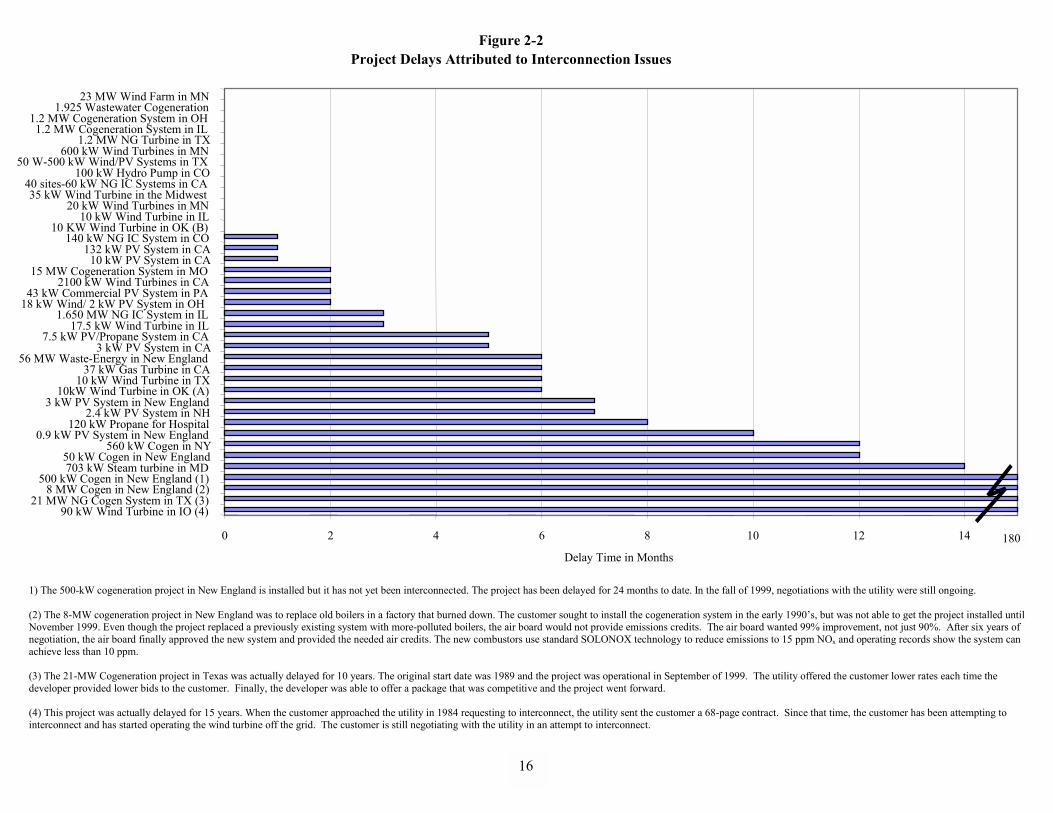
1) The 500-kW cogeneration project in New England is installed but it has not yet been interconnected. The project has been delayed for 24 months to date. In the fall of 1999, negotiations with the utility were still ongoing.
(2) The 8-MW cogeneration project in New England was to replace old boilers in a factory that burned down. The customer sought to install the cogeneration system in the early 1990�s, but was not able to get the project installed untilNovember 1999. Even though the project replaced a previously existing system with more-polluted boilers, the air board would not provide emissions credits. The air board wanted 99% improvement, not just 90%. After six years ofnegotiation, the air board finally approved the new system and provided the needed air credits. The new combustors use standard SOLONOX technology to reduce emissions to 15 ppm NOx and operating records show the system canachieve less than 10 ppm.
(3) The 21-MW Cogeneration project in Texas was actually delayed for 10 years. The original start date was 1989 and the project was operational in September of 1999. The utility offered the customer lower rates each time thedeveloper provided lower bids to the customer. Finally, the developer was able to offer a package that was competitive and the project went forward.
(4) This project was actually delayed for 15 years. When the customer approached the utility in 1984 requesting to interconnect, the utility sent the customer a 68-page contract. Since that time, the customer has been attempting tointerconnect and has started operating the wind turbine off the grid. The customer is still negotiating with the utility in an attempt to interconnect.
Figure 2-2Project Delays Attributed to Interconnection Issues
0 2 4 6 8 10 12 14
90 kW Wind Turbine in IO (4)21 MW NG Cogen System in TX (3)
8 MW Cogen in New England (2)500 kW Cogen in New England (1)
703 kW Steam turbine in MD50 kW Cogen in New England
560 kW Cogen in NY0.9 kW PV System in New England
120 kW Propane for Hospital2.4 kW PV System in NH
3 kW PV System in New England10kW Wind Turbine in OK (A)
10 kW Wind Turbine in TX37 kW Gas Turbine in CA
56 MW Waste-Energy in New England3 kW PV System in CA
7.5 kW PV/Propane System in CA17.5 kW Wind Turbine in IL
1.650 MW NG IC System in IL18 kW Wind/ 2 kW PV System in OH43 kW Commercial PV System in PA
2100 kW Wind Turbines in CA15 MW Cogeneration System in MO
10 kW PV System in CA132 kW PV System in CA
140 kW NG IC System in CO10 KW Wind Turbine in OK (B)
10 kW Wind Turbine in IL20 kW Wind Turbines in MN
35 kW Wind Turbine in the Midwest40 sites-60 kW NG IC Systems in CA
100 kW Hydro Pump in CO50 W-500 kW Wind/PV Systems in TX
600 kW Wind Turbines in MN1.2 MW NG Turbine in TX
1.2 MW Cogeneration System in IL1.2 MW Cogeneration System in OH
1.925 Wastewater Cogeneration23 MW Wind Farm in MN
Delay Time in Months180
16
17
have traditionally been given a great deal ofdiscretion in setting the interconnection frameworkfor distributed power projects. As shown by thePURPA experience, they can use that discretion todiscourage or prevent customers frominterconnecting to �their� grid. Distributed powerprojects have the same vulnerabilities as the muchlarger projects covered by PURPA, but withmarkedly smaller economic margins to overcome thebarriers. One of the most troublesome examples froma public policy point of view�selectivelydiscounting tariffs to undercut prices offered by adistributed power project�is discussed underregulatory barriers in Section 2.4 on page 27.
Customer or Distribution-Level Peak Shaving
Distributed generation can provide capacity to meetenergy needs during peak periods, either for acustomer or for a local utility. This �peak shaving�can reduce demand charges from the supplier, whichrise with peak demand. Particularly when coupledwith on-site benefits like emergency backup, orcombined heat and power, this use of local generationoffers significant economic advantages. Notsurprisingly, there were several cases in which largeutility customers, or local utilities purchasing fromgeneration and transmission (G&T) wholesalesuppliers, sought to employ distributed generation toreduce energy costs and secure other local benefits.
The use of distributed capacity as an alternative toconstrained transmission capacity, by a utility notinvolved in any of our case studies, stands in starkcontrast to utility response in other cases. The Orangeand Rockland Utilities, Inc., now a subsidiary of NewYork's Consolidated Edison, Inc., used a capacitypayment tariff to recognize the value of distributedcapacity in meeting system shortages. Thisspecifically designed tariff established deaveragedcapacity payments payable during summer months atspecified locations to secure additional neededcapacity during peak months. The utility reported thetariff worked effectively for more than ten years tosupply needed capacity in the outlying portion of theservice territory. Over the ten years, capacitypayments ranged from $3/kW-month to $11/kW-month for the four summer months. The highercapacity payments brought on capacity in a
transmission-constrained area for many years. Theease of implementation and effectiveness of theOrange and Rockland capacity tariff reveals thepotential of the untapped distributed power marketand the widespread absence of any regulatoryprinciples governing its emergence. For instance, theUnited Kingdom uses a demand credit to encouragegeneration in areas where transmission congestion isa recurring problem.
Where existing tariff structures have encouraged orallowed customers to use distributed powerinvestments to mitigate peak demand charges, someutilities sought to modify the tariffs to preventcustomers from capturing these savings. Or, a shift tohigh peak demand charges on the standby servicewas used to shift the equivalent revenue recovery tothe backup peak demand. In one case, the utilityshifted peak demand charges from the full servicetariff to the standby tariff to capture additionalrevenues from the distributed generator. Thisstandby-penalty approach was largely responsible forthose cases in which commercial customersdisconnected from the utility system altogether byproviding both regular and standby energy servicefrom distributed power facilities.
These cases with seemingly arbitrary and conflictingtreatment of similar distributed power installationsindicate the absence of coherent, consistent tariffprinciples governing the use of peak demand andbackup demand charges. In many cases, thesecharges defined the market comparison betweendistributed power facilities and distribution utilities.Although multiple case studies provide examples ofutilities using these charges to discourage distributedpower, cases such as the Orange and Rockland utilityusing peak demand charges to encourage distributedpower are rare. We found no record of utilityregulators focusing on the relationship between suchcharges and their effects on the development ofdistributed power. Proceedings in California and NewYork, however, are looking at the underlying costand tariff issues and may begin to address thesepotentially market-defining principles.
18
Several case study respondents also noted the markeddifference between how a utility accustomed to aregulated monopoly approaches its projects and howa competitive business must approach its projects.For example, one utility objected to schedulingovertime or additional contracting expense to meet aninterconnection deadline even when the developeroffered to pay for the costs. Conversely, vendors inseveral instances claimed that the utility was using�gold plating� practices, in which unnecessarily costlymandates were imposed. In one instance, the utilityproposed a three million dollar substation instead ofco-location and interconnection at the existingsubstation.32 In other cases the utility contractuallylimited the project�s ability to sell back to the grid.33
These �cultural� differences between traditionalregulated utility practice and competitive practicewere cited as barriers in several cases.
In the case cited above, the substationinterconnection requested by the developer wouldhave offered direct distribution access to industrialand urban customers in a future restructured market,without additional transmission line reservation andfees. As ultimately configured by the utility, theinterconnection enters at the transmission system andeliminates direct distribution access.34
Negotiable Charges
We define negotiable charges to include instanceswhere the utility initially quoted fees, tariffs,equipment, or testing, but dropped these charges ordemands after negotiation or pursuit of legalremedies. Because the cost of pursuing legalremedies is very high, the cost of challengingproposed charges impose a substantial cost fordistributed generators, even if they prevail in havingthe fees and charges dismissed. More often, thesecharges simply stop projects or force the very smallprojects to proceed as �pirates,� operating withoutnotifying the utility. Case study respondents in allsize categories reported having to confront suchcharges, and in several cases the cost of effectivelychallenging the charges simply led to abandonmentof the project.
32 Case #3.33 1.2-MW Cogeneration System in Illinois34 Case #3.
The assessment of charges that later were abandonedwas particularly prevalent with small customers (60-kW or less). In fact, among the case studies, one-thirdof small customers were presented with charges thatthey ultimately did not pay. Charges initially soughtby the utility were dropped or reduced in at least tencases, as shown in Table 2-2. This high incidence ofrescinded demands for smaller customers may resultfrom such customers being more adamant about notpaying extraordinary fees. Or, such assessments mayhave proven particularly effective in discouraginggrid connection. In any case, the burden of thecharges the utilities originally demanded relative tototal project costs is much higher in residential andsmall commercial cases, which may account for theseowners reporting these charges as extraordinary orunreasonable for the project size. Unfortunately forsmaller sized generation facilities, however, there aregenuine safety concerns even for small projects.
2.4 Regulatory Barriers
Seven projects documented in this study wereabandoned or are still pending with little hope ofcompletion due to regulatory barriers. The barriersincluded outright prohibition; what appeared to thedistributed power developers as arbitrary tariff ratesfor access and backup power; and selective discountpricing designed to discourage customer use ofdistributed power. Case-by-case procedural reviewand legal remedies, where they exist, are not so muchthe solution as just a final barrier where the scale ofthe project can justify no effort beyond a simple andinexpensive way of asserting those rights.
The case studies document the following types ofregulatory barriers:
• Direct utility prohibition• Tariff barriers
− Demand charges and backup tariffs− Buy-back rates− Exit fees− Uplift tariffs− Regional transmission procedures and costs
• Selective discounting• Environmental permitting.
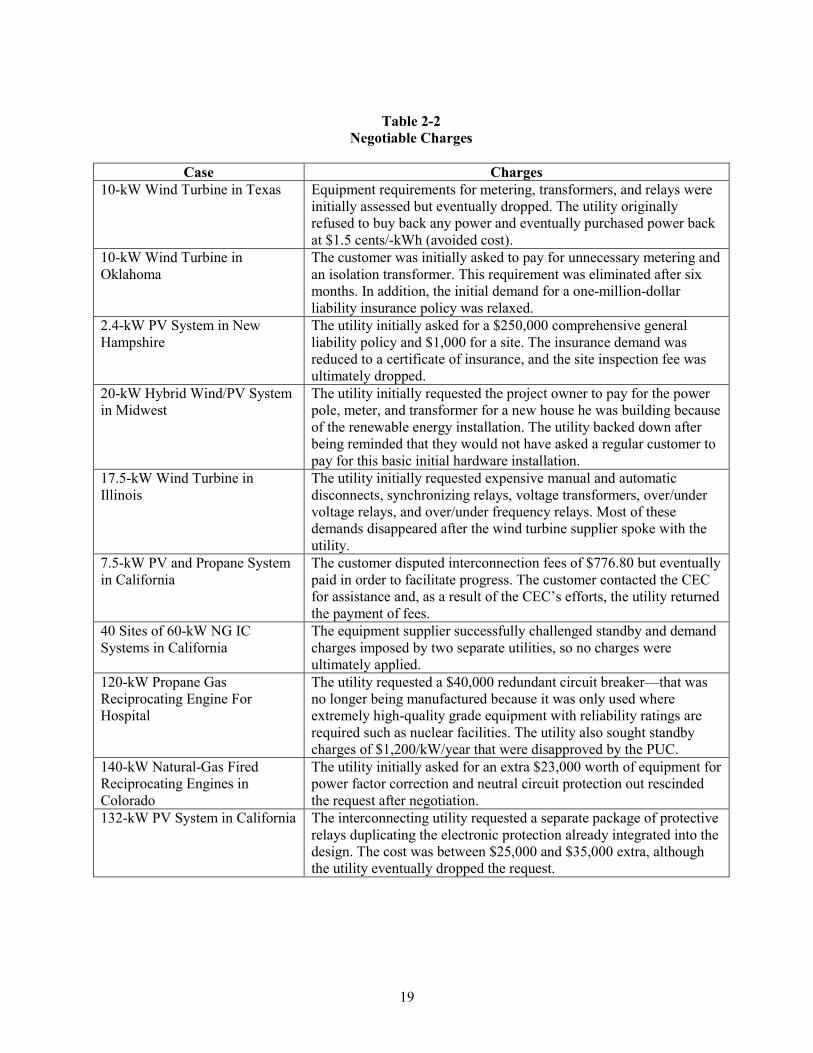
19
Table 2-2Negotiable Charges
Case Charges10-kW Wind Turbine in Texas Equipment requirements for metering, transformers, and relays were
initially assessed but eventually dropped. The utility originallyrefused to buy back any power and eventually purchased power backat $1.5 cents/-kWh (avoided cost).
10-kW Wind Turbine inOklahoma
The customer was initially asked to pay for unnecessary metering andan isolation transformer. This requirement was eliminated after sixmonths. In addition, the initial demand for a one-million-dollarliability insurance policy was relaxed.
2.4-kW PV System in NewHampshire
The utility initially asked for a $250,000 comprehensive generalliability policy and $1,000 for a site. The insurance demand wasreduced to a certificate of insurance, and the site inspection fee wasultimately dropped.
20-kW Hybrid Wind/PV Systemin Midwest
The utility initially requested the project owner to pay for the powerpole, meter, and transformer for a new house he was building becauseof the renewable energy installation. The utility backed down afterbeing reminded that they would not have asked a regular customer topay for this basic initial hardware installation.
17.5-kW Wind Turbine inIllinois
The utility initially requested expensive manual and automaticdisconnects, synchronizing relays, voltage transformers, over/undervoltage relays, and over/under frequency relays. Most of thesedemands disappeared after the wind turbine supplier spoke with theutility.
7.5-kW PV and Propane Systemin California
The customer disputed interconnection fees of $776.80 but eventuallypaid in order to facilitate progress. The customer contacted the CECfor assistance and, as a result of the CEC�s efforts, the utility returnedthe payment of fees.
40 Sites of 60-kW NG ICSystems in California
The equipment supplier successfully challenged standby and demandcharges imposed by two separate utilities, so no charges wereultimately applied.
120-kW Propane GasReciprocating Engine ForHospital
The utility requested a $40,000 redundant circuit breaker�that wasno longer being manufactured because it was only used whereextremely high-quality grade equipment with reliability ratings arerequired such as nuclear facilities. The utility also sought standbycharges of $1,200/kW/year that were disapproved by the PUC.
140-kW Natural-Gas FiredReciprocating Engines inColorado
The utility initially asked for an extra $23,000 worth of equipment forpower factor correction and neutral circuit protection out rescindedthe request after negotiation.
132-kW PV System in California The interconnecting utility requested a separate package of protectiverelays duplicating the electronic protection already integrated into thedesign. The cost was between $25,000 and $35,000 extra, althoughthe utility eventually dropped the request.
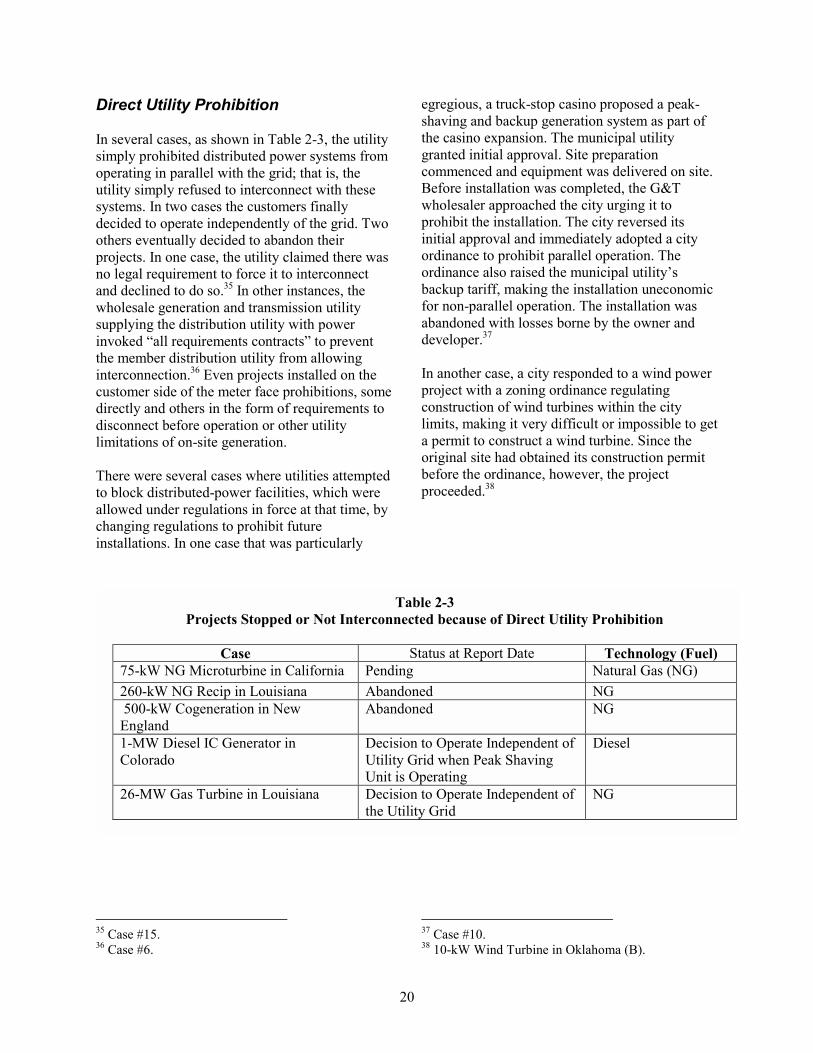
20
Direct Utility Prohibition
In several cases, as shown in Table 2-3, the utilitysimply prohibited distributed power systems fromoperating in parallel with the grid; that is, theutility simply refused to interconnect with thesesystems. In two cases the customers finallydecided to operate independently of the grid. Twoothers eventually decided to abandon theirprojects. In one case, the utility claimed there wasno legal requirement to force it to interconnectand declined to do so.35 In other instances, thewholesale generation and transmission utilitysupplying the distribution utility with powerinvoked �all requirements contracts� to preventthe member distribution utility from allowinginterconnection.36 Even projects installed on thecustomer side of the meter face prohibitions, somedirectly and others in the form of requirements todisconnect before operation or other utilitylimitations of on-site generation.
There were several cases where utilities attemptedto block distributed-power facilities, which wereallowed under regulations in force at that time, bychanging regulations to prohibit futureinstallations. In one case that was particularly
35 Case #15.36 Case #6.
egregious, a truck-stop casino proposed a peak-shaving and backup generation system as part ofthe casino expansion. The municipal utilitygranted initial approval. Site preparationcommenced and equipment was delivered on site.Before installation was completed, the G&Twholesaler approached the city urging it toprohibit the installation. The city reversed itsinitial approval and immediately adopted a cityordinance to prohibit parallel operation. Theordinance also raised the municipal utility�sbackup tariff, making the installation uneconomicfor non-parallel operation. The installation wasabandoned with losses borne by the owner anddeveloper.37
In another case, a city responded to a wind powerproject with a zoning ordinance regulatingconstruction of wind turbines within the citylimits, making it very difficult or impossible to geta permit to construct a wind turbine. Since theoriginal site had obtained its construction permitbefore the ordinance, however, the projectproceeded.38
37 Case #10.38 10-kW Wind Turbine in Oklahoma (B).
Table 2-3Projects Stopped or Not Interconnected because of Direct Utility Prohibition
Case Status at Report Date Technology (Fuel)75-kW NG Microturbine in California Pending Natural Gas (NG)260-kW NG Recip in Louisiana Abandoned NG 500-kW Cogeneration in NewEngland
Abandoned NG
1-MW Diesel IC Generator inColorado
Decision to Operate Independent ofUtility Grid when Peak ShavingUnit is Operating
Diesel
26-MW Gas Turbine in Louisiana Decision to Operate Independent ofthe Utility Grid
NG
21
Tariff Barriers
Among the project owners and developersinterviewed, tariffs were most often seen asdiscouraging distributed power, rather thanencouraging it. These tariffs included thefollowing:
• Demand charges and backup tariffs• Buy-back rates• Exit fees• Uplift tariffs (charges for distribution,
ancillary services, capacity and losses)• Regional transmission procedures and costs.
The distributed-generation projects typicallyoffered benefits to the distribution grid in terms ofpeak shaving, reduced need for distributionsystem upgrades, and capital cost reductions.These benefits have been well documented inother reports. Nonetheless, the tariffs and ratedesigns encountered in this study did not accountfor either the provision of distribution services tothe system or the particular benefits to thecustomer from distributed power.39 These ratedesign issues exist in both vertically integratedand restructured utilities.
In some cases, rapidly adopted increases in feesand charges were used to stop development ofdistributed power projects.
Demand Charges and Backup Tariffs
Supplemental, backup, and standby tariffs�referred to collectively in this report as "backuptariffs" critically impact distributed powermarkets, because they can determine theeconomics of distributed power and grid supplyin combination. Although every distributedpower site could provide its own redundantbackup power, the proposed facilities in this studygenerally sought access to both the grid anddistributed power to optimize the combination. 39 The narrow exceptions that prove the rule areinstances like the regional de-averaged capacitypurchase tariffs implemented by Orange & RocklandUtility in New York State to utilize customer-sitedgeneration in place of new transmission lines for manyyears.
As seen in Figure 2-3, backup charges can pose asignificant barrier for both small and largedistributed generators. High backup charges canvery effectively discourage distributed power byoverriding any system or customer benefits withsubstantial locked-in payments to the utility.Figure 2-3 also shows that standby charges leviedby utilities on distributed generation projects canvary over a considerable range. The case studiesdemonstrate a lack of consistency and the absenceof regulatory oversight of backup tariffs.
In deregulated states, backup supply can beobtained from competitive suppliers in the market,where options are transparent. However,unrealistic demand charges included in thedistribution and transmission tariff to access thecompetitively provided backup supply can be asequally detrimental as excessive backup tariffsand render a project economically unfeasible.
In one case, high demand charges withcontinuing-demand billing ratchets were put inplace on the grounds that the system mustmaintain capacity equal to the annual peak. Forexample, when the 200-kW fuel cell project isdown, the owner is assessed a demand charge of$19.20/kW-month for that time and for the next12 months thereafter. If the unit is down during apeak demand period, the total cost for one outagecould result in an annual demand charge of$46,080. In this case, there was also norecognition given for peak shaving and othersystem benefits of distributed power.40
In another case, a 5-MW cogeneration project wascancelled because the utility assessed the standbycharge at $1 million per year.41 The host facility (ahospital) provided a backup power system, but theutility refused to offer a partial credit for capacityprovided by the backup system.42 In the state ofNew York, the annual standby charges range from$52.34/kW-year to $200/kW-year�a variancefactor of almost four. From the utility/regulatory
40 Case #11.41 Case #5.42 The same backup power system would allow thehospital to run independently from the grid during localutility power outages.
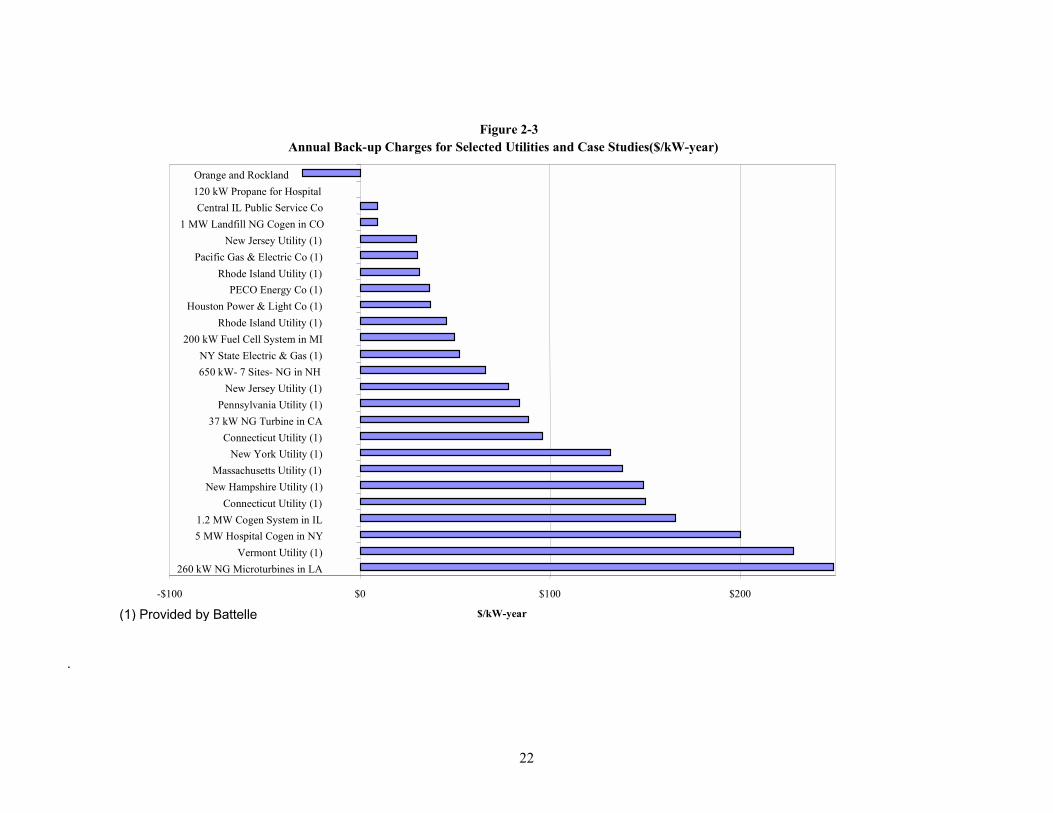
22
.
Figure 2-3Annual Back-up Charges for Selected Utilities and Case Studies($/kW-year)
-$100 $0 $100 $200
260 kW NG Microturbines in LAVermont Utility (1)
5 MW Hospital Cogen in NY1.2 MW Cogen System in IL
Connecticut Utility (1)New Hampshire Utility (1)
Massachusetts Utility (1)New York Utility (1)
Connecticut Utility (1)37 kW NG Turbine in CA
Pennsylvania Utility (1)New Jersey Utility (1)
650 kW- 7 Sites- NG in NHNY State Electric & Gas (1)
200 kW Fuel Cell System in MIRhode Island Utility (1)
Houston Power & Light Co (1)PECO Energy Co (1)
Rhode Island Utility (1)Pacific Gas & Electric Co (1)
New Jersey Utility (1)1 MW Landfill NG Cogen in CO
Central IL Public Service Co120 kW Propane for HospitalOrange and Rockland
$/kW-year(1) Provided by Battelle
23
perspective the type of generation employed toprovide backup power can account for differenttariffs, but nonetheless this variance has a largeeffect on the market.
At their inception, some utilities appear to haveutilized backup charges to discourageinterconnection of self-generation by industrialfirms and other commercial customers. Theconference report of the Public UtilityRegulatory Policies Act of 1978 (PURPA) 43
suggests that some electric utilities purposelypriced backup or standby service at a level thatmade it uneconomical for the customer toimplement an on-site generation project.PURPA made this illegal and required utilities toimplement reasonably priced backup charges.Nonetheless, regulatory policy and utilitypractice continue to use standby charges todiscourage distributed power that would result innon-economic bypass. This is illustrated by a�Standby Service� document that states as itspurpose, "To discourage bypass of theCompany's services and charges where suchbypass44 is not economic from society's
43 Conference Report on H.R. 4018, Public UtilityRegulatory Policies Act of 1978, H. Rep. No. 1750,page 89, 95th Cong., 2d sess. (1978).44 There is a difference in regulatory treatment ofwhat is termed �economic� versus �non-economic�bypass. Economic bypass might occur where a newtechnology serves increased load in the territory at acost less than the marginal cost to the utility ofserving such a load. Non-economic bypass, however,is a concept that essentially admits that a particularcustomer has been asked by the regulatory regime topay more than the utility�s marginal cost to serve it asa result of policy considerations, and that unless thetariff rate is reduced to something below the cost toself generate, but above the marginal cost of service,the customer can save money by self generating eventhough it is paying more than the utility�s marginalcost. The regulatory reasoning is thus that it is betterto have the customer make some contribution to thefixed costs of the utility by paying something overmarginal costs rather than leaving the system, whichcould incur the fixed costs increase for all. Forexample, one statement of the regulatory positionstates: �Non-economic bypass and the inappropriateshifting of the fixed cost of the electrical systembetween or among customers are not fair andefficient competition, are contrary to the public
standpoint and to prevent the shifting of theCompany's Competitive Transition Cost (CTC)to other stakeholders that would occur in suchcircumstances."45
The conditions under which backup tariffs areapplied also vary. For example, some tariffsapply demand charges as well as backup servicerates.46 In one case, the municipal utility createda new standby tariff specifically designed to stopa distributed power project. The city calculated acharge for 25,000-kWh of supplemental powerat $5,400 under the newly adopted tariff, ascompared to the total previous standard bill for80,000-kWh at $6,000. It appears that the utilityestablished the tariff to dissuade the customerfrom proceeding with the distributed-powerfacility, since the new tariff is triggered by theexistence of �installed equipment� independentof the customer�s load profile. A customer withthe same energy usage and load profile withoutsuch equipment on-site would presumablycontinue to receive bills under the morefavorable standard tariff. In short, the purposeappeared to be solely to discourage on-sitepower installations. See the discussion of the260-kW natural gas generation system inLouisiana in the case studies. 47
Another case involved a utility�s attempt toobtain a backup tariff that would have assessed a120-kW facility a $1,200/kW-per-annum charge,or approximately $144,000 annually. Even if thefacility operated constantly (as a baseload plant),it would only generate approximately $100,000worth of electricity annually. The PUC rejectedthe tariff, stating that if the facility was shutdown the utility would not notice.48
interest, and should be avoided. Customers ofcontinuing monopoly service should benefit, or atleast not be harmed, by choices made by customerswith competitive options.� Washington Public UtilityCommission Interim Policy Statement GuidingPrinciples for an Evolving Electricity Industry,August 14, 1995. See http://www.energyonline.com/Restructuring/models/washing1.html.45 2-kW PV System in New York46 40 sites-60-kW NG IC Systems in California47 Case #10.48 Case #14.
24
As part of the trend toward net metering forsmall renewable energy facilities, legislaturesand utility regulatory commissions have severelylimited or flatly prohibited the assessment ofbackup charges for distributed generators withincertain categories of sizes or technologies. Whilesuch fees remain for the bulk of the distributedpower projects not subject to net metering, thelikelihood remains that as legislatures andregulatory commissions gain experience with thecosts and benefits of distributed generation theinstances of perceived abuses will be reduced.One California utility, for example, proposedbackup charges in its tariff to implementCalifornia�s net metering law. It would haverequired customers to pay an additional fixedcharge of $14 per month, plus additionalvariable charges of $2.15/kW of generatingcapacity per month. For a 1-kW photovoltaicsystem, these charges would have offset nearly90 percent of the energy savings the customerexpected to capture from the system. Aftervarious stakeholders objected, the CaliforniaPublic Utilities Commission rejected theproposed charges, and the utility was required torevise its proposed tariff accordingly.
Among the case studies, some larger customerswere able to negotiate specialized electriccontracts using the leverage of leaving the grid ifnecessary. One small project developer ofseveral projects used the threat of leaving thegrid to convince the utility to drop the backupcharge.49 But there is no uniformity or assurancethat smaller projects can successfully negotiatearound these barriers and preliminary evidencethat they often cannot. See Table 2-1. The lackof appropriate regulatory principles or standardsfor business practices thus creates uncertaintythat effectively retards distributed powerprojects by increasing financial risks. As newtechnologies make on-site options available tocommercial and residential customers alreadyconditioned to retail choice, vendor andconsumer demands will increase for uniform andpredictable regulatory treatment that does notunduly burden distributed powerinterconnection.
49 40 sites-60-kW NG IC Systems in California
Buy-Back Rates
In addition to buying power from the grid, manyon-site distributed power projects have excesscapacity (the ability to produce power above thatrequired by the host facility), which can benefitthe grid if made available in times of capacityshortage. This can also benefit the customer ifthe customer is able to sell the excess capacity.50
In vertically integrated monopoly systems, theonly market for this power is the utility. Theutility buy-back rates thus define the onlymarket for this power in these states. 51
In the cases where distributed power economicsrely on the utility purchase of some portion ofthe power, several proposed facilities wereabandoned because the buy-back rate offeredwas too low. Utilities with excess generationcapacity or a strategic interest in maintainingtheir customer base have little business incentiveto facilitate the interconnection of new suppliers.The typical buy-back rate of 1.5 to 2¢/kWh mayreflect the utilities off-peak wholesale rates, butwill not provide the benefits of the higher on-peak wholesale costs of the utility. In a typicalcase, offering buy-back rates in this range, theutility also required the customer to install aseparate meter at the owner�s expense. For thisproposed wind project, the low buy-back rateresulted in installation of a smaller wind turbinethat produced little or no excess energy. Becausewind is an intermittent resource, this meant thatthe project provided much smaller portion of theowner�s electricity needs than originallyplanned. 52
On the other hand, successful distributed powerbuy-back tariffs such as the Orange andRockland distributed power capacity payments,demonstrate an approach that recognizes thevalue of distributed capacity in meeting system
50 This benefit was one of the primary drivers of therecent Texas action adopting its distributedgeneration rules, see Section 2.2 on page 11.51 In competitive supply markets the path to thecompetitive power market is the local distributionsystem access tariff, or �uplift tariff� of thedistribution utility.52 10-kW Wind Turbine in Illinois
25
capacity shortages in a manner that benefits allparties. (See discussion at page 17.)
Exit Fees
As more states adopt stranded cost charges aspart of restructuring, exit fees have emerged as amajor barrier to new distributed-powertechnologies, in some cases a long-term barrier.The potential amount of the charges�up to2¢/kWh or more�is having a significant impacton incentives for customer load management ingeneral.
As with other barriers, the variations in exit feesand related charges and in utility collectionpractices from state to state make thedevelopment of national markets for distributedpower more difficult. For example, New Jerseyexempted customer on-site generation and loadmanagement from exit fees unless and until autility�s combined loads drop to 92.5 percent ofcurrent levels. Neighboring Pennsylvania, whichis within the same ISO region, retains exit feesthrough 2010 for some utilities at rates in excessof 2¢ /kWh. Some California utilities havethreatened collection of exit fees for customersconsidering on-site combined heat-and-poweroptions. Especially in areas of load growth andsupply shortages, the rationale for tying exit feesto historical use with its intentional dampeningeffect on customer-side supply-and-demandoptions needs to be reviewed by regulators andother policymakers. The recent Texas rulesconfirm the system benefits provided bydistributed generation in such instances. TheNew Jersey approach of allowing distributedpower to grow in step with current marketdemand also formally recognizes the benefits ofproviding distributed power access to themarket. Similarly, Connecticut is assessing theapplicability of exit fees to combined heat andpower and other Qualifying Facilities underFERC regulations, as well as consideringwhether there would be enough cogenerationactivity for exit fees to be a significant issue.
Uplift Tariffs
In competitive electricity markets, thedistribution utility does not define the market forpower from distributed facilities. Instead, thenewly opened competitive market for wholesaleand retail supply defines the market. Theutility�s buy-back rate is therefore not the criticalissue in competitive markets that it is when theutility constitutes the sole potential buyer.Rather, the competitive issue shifts to the rate tobe charged by the distribution utility fortransmission of the power to the market. Manyof the metering and technical interconnectionissues are technically the same, but competitivemarkets have given rise to additional charges for�distribution wheeling,� which includesdistribution capacity and ancillary services, up tothe transmission level (uplift tariffs) as well asadditional tariffs, procedures, accounting andscheduling at the regional transmission level.
In the projects studied for this report, utilitiesproposed a variety of uplift tariffs, charges, andpenalties. In several cases the per-kWh chargeswere dropped after lengthy negotiations. Thecases in this study encountering uplift tariffswere renewable energy facilities intending tosupply �green market" power to the regionalgrid system. In one case, the tariff proposed wasbased on peak production at $5 per kW-monthfor the uplift, which amounted to about 0.7¢/kWh for high capacity factor generation units(about 1.5¢ per kWh for lower capacity factorsas occurs with wind generation). This tariffresulted from application of the distributioncompany�s open access (or wholesale) tariffapplicable to large generation�applied in full�despite the fact that the power was to begenerated and used locally, without everreaching the utility�s transmission facilities.53
The absence of any commonly acceptedratemaking principles for these distributioncharges is a significant issue, particularly giventhe potential system and market benefits of
53 Case #7.
26
distributed power. Using common rate-makingprinciples, as distributed power typically reducesloads on the distribution (and transmission)systems, distributed power should under somecircumstances be entitled to a credit rather than acharge.
Regional Transmission Procedures andCosts
In today�s competitive wholesale electricitymarkets, delivery of power into the regionaltransmission market, is governed by rules thathave been designed by and for large-scalegeneration. Like the rates and rules developedfor the central station model at the distributionlevel, these rules are often inappropriate orprohibitively expensive for smaller-scaledistributed power. With the creation ofindependent system operators (ISOs) to manageregional transmission markets, the access issueshave become even more complicated for smallerdistributed generation projects. Regionaltransmission organizations (RTOs) and ISOsfrequently fail to recognize or account forcapacity less than one megawatt, which maythus require aggregation of systems toparticipate at the RTO/ISO level, another barrierto competitive markets.
In one case study, the project developerdetermined that under existing rules inCalifornia, distribution-level generators have noway to wheel power to the ISO responsible forcoordination and dispatch of power under retailcompetition in California. This apparent absenceof any market path was reflected in the originalutility proposal, which specified that the utilitywould not wheel power on behalf of the project.The project developer understood that theCalifornia ISO might itself be looking atsolutions to this problem, but at the time of thisreview the issue remained unresolved.54
In the New England ISO region, application ofthe full regional transmission tariffs, includingancillary service and loss rules were the pivotalbarrier to a proposed 1-MW landfill gas project,which was abandoned as a result. The regional 54 Case #13.
transmission charges were to be assessed eventhough the proposed project would serve onlylocal loads within a single distribution area.Alternative �point-to-point� transmission tariffs,which required interval metering andtelemetering of data to the system operator weremore expensive than local distribution systemservice.55
Another case involved a similar experience withan ISO. The ISO sent a letter that turned thematter over to the local distribution company. Awind developer planning a 130-kW market pilotfacility completed lengthy negotiations withtechnical and legal personnel of the distributionutility over proposed interconnectionengineering fees. These fees were in excess ofthe projected first year gross revenue from theproject. The proposed fees included payment ofthe utility's legal fees to prepare an agreementcovering all items included by other utilities in atariff. As initially presented, the agreementincluded a specific distribution line loss numberto six decimal places (just over 2.5 percent), inaddition to any ISO loss assignments. As thefacility was prohibited from generating morethan one-third of the minimum load on thedistribution system, its actual impact was toreduce supply losses for the utility. Thedistribution loss charge was eventually dropped.After several months of negotiation with thedistribution utility, the ISO informed thedeveloper that a separate interconnection serviceagreement with the ISO would also berequired.56
A standard regional transmission and ISOapproach is to assign losses of five to ninepercent to all retail loads on the assumption thatthey are being served from the pooledtransmission facilities. That approach requiresfive to nine percent more generation deliveredthan load served. One of the core competitiveadvantages of distributed generation is itsintentional placement in close proximity to theloads served, precisely in order to reducetransmission and distribution costs such as linelosses. The application of the same rule-of- 55 Case #7.56 130-kW Wind Turbines in Pennsylvania.
27
thumb line loss charges applied to bulk power isboth illogical and anti-competitive vis-à-visdistributed power. In one of our cases, a landfillfacility intended to serve local loads would not,in fact, have used a transmission path (contractor actual), but nonetheless was charged fortransmission losses. Even where the distributedpower is sold into the transmission grid, in mostcases, by virtue of its location on the distributionsystem, distributed generation has the actualphysical effect of reducing system losses.
Distribution utility responses to requests tomarket �wholesale� distributed power are widelyinconsistent. Certain aspects of the typicalproposal to a distributed generationinterconnection are troublesome from theviewpoint of distributed utility developers. First,there are no provisions for credit or value forreduced losses on the distribution andtransmission system and reduced power importas a result of distributed power. Second, someutilities have attempted to add additional lossadjustments and distribution charges on top ofassigned transmission losses.
There was one proposal for ISO accountingtreatment of small (under 1-MW) distributedpower sources as �negative loads,� whichresulted in a credit at the wholesale transmissionlevel for metered generation plus nine percent.While this latter approach is more consistentwith system benefits produced by distributedpower, this treatment is the exception rather thanthe rule, and is the inadvertent result of ISOaccounting rules. This ISO, however, is reportedto be reconsidering this treatment.57
Selective Discounting
Like the concept of uneconomic bypass,undisclosed selective discounts run counter toefforts to increase transparent competitivemarkets and innovation as supplements toregulation. From this perspective, state-sanctioned price discounting under public utilitycommission-enforced secrecy can be an absolutebarrier to the creation of viable markets for on-site distributed power. Case study respondents 57 Case #7.
reported economic development tariffdiscounting as one of the utilities� mostcommonly used tools to keep large electriccustomers from pursuing more economicdistributed power alternatives. Combined heat-and-power (CHP) projects, gas turbines, andother larger distributed technologies wereoffered multiple rounds of discounted pricing, tothe point where several vendors report utilitydiscounts as the most common customer benefitarising in the market for these innovativetechnologies. 58
In one case, a CHP project was abandoned whenthe utility offered the customer a seven-yearguaranteed price incentive. The utility made 25progressively better proposals to the customerbefore the final offer was made, even though theCHP project would have actually producedpower more efficiently, with lower actualproduction costs and environmental emissions,
58 One of the fundamental principles of monopolytariffs is �the obligation to furnish service and tocharge rates that will avoid undue or unjustdiscrimination among customers,� which results insimilar customers within a rate class paying the samerates [See: Principles of Public Utility Rates, JamesC. Bonbright, Albert L. Danielsen, David RKamerschen, PUR, Inc. Second Edition, 1988, at p.515]. Before the advent of competitive utilityservices and the emergence of advanced distributedpower technologies, utilities and regulatorsdeveloped an exception to this principle thatpermitted special discount rates for those few largecustomers who had a genuine self-generationalternative and threatened to leave the system. Sometimes the customers� choice of on-site generation wasthought by the regulators to be an inappropriateoption in terms of the whole system. This wasbecause the actual cost of the power exceeded theregulated utility's variable cost. Thus if an amountequal to the self-generation cost was paid to theutility the amount would cover variable costs andmake some contribution to fixed costs. The potentialself generation alternative was termed �uneconomicbypass.� To avoid the lost contribution to fixed costsassociated with uneconomic bypass, many statespermitted utilities to reduce rates down to marginalcosts to keep large customers from leaving thesystem.
28
than the traditional generation provided by theutility.59
During the bidding process the customer usedthis leverage to pit the utility and the distributedpower supplier against one another to negotiate adiscounted deal for its power. In the final hoursof contract negotiation between the equipmentsupplier and the customer, the utility presentedthe combined offer it had brokered with theregulatory authority to persuade the customer toabandon the cogeneration project.60
In a case not included in this study, the projectdeveloper reported that the utility successfullynegotiated a deal with the big three automakersto reduce their rates by three percent to fivepercent in exchange for a long term agreementto not install local generation systems.
Obviously, discounted utility power isadvantageous for customers who can get it, atleast for the term of the discount. But access tothese discounted rates is unpredictable. Evenwhere customer discounts are made available,they are often limited in duration. In one casewhere a customer was considering cogeneration,the utility offered the customer a better rate, butdelayed its implementation for almost two years.Some discounted rates only last for a shortperiod such as a year or two then revert toprevious higher levels.61 Finally, therequirements for obtaining the discountsometimes require expenditure of funds to showserious intent to leave the system. Anexpenditure of several thousand dollars forengineering demonstrating a combined heat andpower facility supported a reduction by 11.77percent discount, approved by one state�s PUC.62
59 Case #4.60 The utility further blocked this cogenerationproject by assessing transport rates for natural gas tothe proposed cogeneration facility (through itsdistribution pipes at a cost that was nine times higherthan the rate the utility charged itself). Case #4.61 560-kW Cogeneration System in New York62 Case #14.
Environmental PermittingRequirements As Market Barriers
Environmental permitting requirements can be asignificant barrier in many regions of thecountry, especially for smaller projects. Formany projects covered in this report,environmental testing and emissionsrequirements were as stringent for small projectsas for larger projects. As with customengineering requirements and other similarcosts, smaller projects cannot bear the same costof emissions testing as larger projects andremain feasible. In one case, for a 60-kWinstallation of natural-gas fired power supply,projected initial costs were $2,500 for testingand $200/month for inspections.63
Unfortunately, distributed generators as well aslarger merchant plants are treated as new sourceseven when they displace older, inefficient, andpolluting sources.64 Worse, in the projectsreviewed in this report, cogeneration facilitieswere assessed for environmental permitpurposes based on combustion efficiency andnot overall energy output efficiency and thus arenot given credit for the added thermal energyused.
While beyond the scope of this study,environmental permitting issues will need to beaddressed by the appropriate agencies, as mostcurrent siting processes were designed for largepower plants, thus posing barriers to distributedpower analogous to those more fully discussedin this report.
63 40 sites-60-kW NG IC Systems in California64 One project owner attempted to installcogeneration to replace oil fired boilers; however, thelocal air board would not allow emissions credit. Theair board requested 99 percent improvement, not just90 percent. Similar situations were reported inseveral other cases. 8-MW Cogeneration System inNew England.
29
2.5 Barrier-Related Costs ofInterconnection
To attempt to quantify the various categories ofbarriers to market entry for distributedgenerators, the customer or developer was askedin each case to estimate the �barrier-related"costs arising in each case study. Costs defined as�barrier-related costs of interconnection�included the customer�s or developer�s estimateof the costs of the various barriers discussed inthis report.
These cost estimates do not include extra timespent by project developers or customers, nor dothese cost estimates include lost savings becauseof utility delays, annual fees, or other tariffs(except exit fees). Backup charges were onlyincluded as a one-time charge if they stopped theproject. These estimates are thus strictly �out ofpocket costs� that exceeded the projectdeveloper�s necessarily subjective determinationof appropriate, anticipated, interconnectioncosts.
Table 2-4 provides a summary of the barrier-related costs by project for the 25 cases forwhich costs above normal were reported.Figure 2-4 provides the costs in $/kW.
Figure 2-5 shows the interconnection costsabove normal for renewable projects, whereasFigure 2-6 quantifies the costs for fossil fuelprojects. These lists do not include 16 projectswhere no barrier-related costs were reported.65
In addition, six projects are not included in thesedata because they did not interconnect. Costestimates were not known for another 18 of theprojects.
As can be seen in Figure 2-4, barrier relatedinterconnection costs in one state ranged from$5.81/kW to $1,333/kW. Smaller projects wereaffected more than larger projects.
65 Some of these 16 projects reported �excessive�annual backup charges which were not includedbecause the project interconnected and the backupcharge was an annual charge.
For illustrative purposes, the expected costs tointerconnect a 43-kW commercial PV system inPennsylvania were included even though thisfacility did not attempt to interconnect.Interconnection was prohibited because theproject developer estimated that it would costbetween $30,000 to $40,000 ($698/kW-$930/kW) in consulting and engineering fees.
2.6 Findings
By interviewing proponents of distributedgeneration projects about problems encounteredin seeking utility grid interconnection, this studyidentifies a variety of barriers to theinterconnection of distributed generationprojects. The anecdotal nature of this studypresents the barriers from the perspective of theproponents and does not assess their prevalence.The study does, however, show that the barriersare very real, that they can block what otherwiseappear to be valuable projects, and that they areindependent of technology or location.
More than half of the case studies identifiedbarriers in each of the categories: technical,business practice, and regulatory. Technicalbarriers principally center around equipment ortesting required by utilities for safety, reliability,and power quality. Project proponents often feltthat these requirements were unnecessarilycostly because their generating equipment andrelated facilities already included adequatesafety, reliability, and power quality features.
Many developers indicated that the utilities'interconnection-related business practices wereamong the most significant barriers theyencountered. A common problem is thedifficulty and length of the interconnectionapproval process, often resulting from a simplelack of a designated utility contact person orestablished procedure. Other business practicesseen as unnecessary barriers by projectproponents�particularly for smaller projects�included application and interconnection feesand insurance requirements.
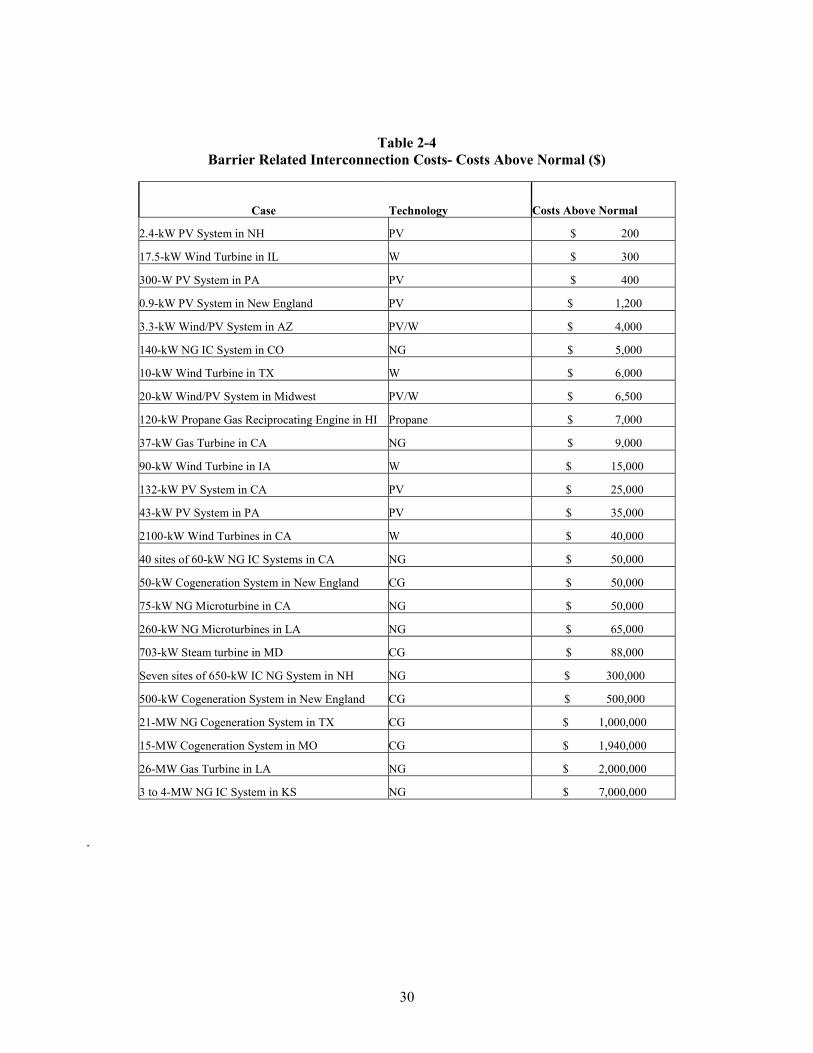
30
Table 2-4Barrier Related Interconnection Costs- Costs Above Normal ($)
Case Technology Costs Above Normal
2.4-kW PV System in NH PV $ 200
17.5-kW Wind Turbine in IL W $ 300
300-W PV System in PA PV $ 400
0.9-kW PV System in New England PV $ 1,200
3.3-kW Wind/PV System in AZ PV/W $ 4,000
140-kW NG IC System in CO NG $ 5,000
10-kW Wind Turbine in TX W $ 6,000
20-kW Wind/PV System in Midwest PV/W $ 6,500
120-kW Propane Gas Reciprocating Engine in HI Propane $ 7,000
37-kW Gas Turbine in CA NG $ 9,000
90-kW Wind Turbine in IA W $ 15,000
132-kW PV System in CA PV $ 25,000
43-kW PV System in PA PV $ 35,000
2100-kW Wind Turbines in CA W $ 40,000
40 sites of 60-kW NG IC Systems in CA NG $ 50,000
50-kW Cogeneration System in New England CG $ 50,000
75-kW NG Microturbine in CA NG $ 50,000
260-kW NG Microturbines in LA NG $ 65,000
703-kW Steam turbine in MD CG $ 88,000
Seven sites of 650-kW IC NG System in NH NG $ 300,000
500-kW Cogeneration System in New England CG $ 500,000
21-MW NG Cogeneration System in TX CG $ 1,000,000
15-MW Cogeneration System in MO CG $ 1,940,000
26-MW Gas Turbine in LA NG $ 2,000,000
3 to 4-MW NG IC System in KS NG $ 7,000,000
.
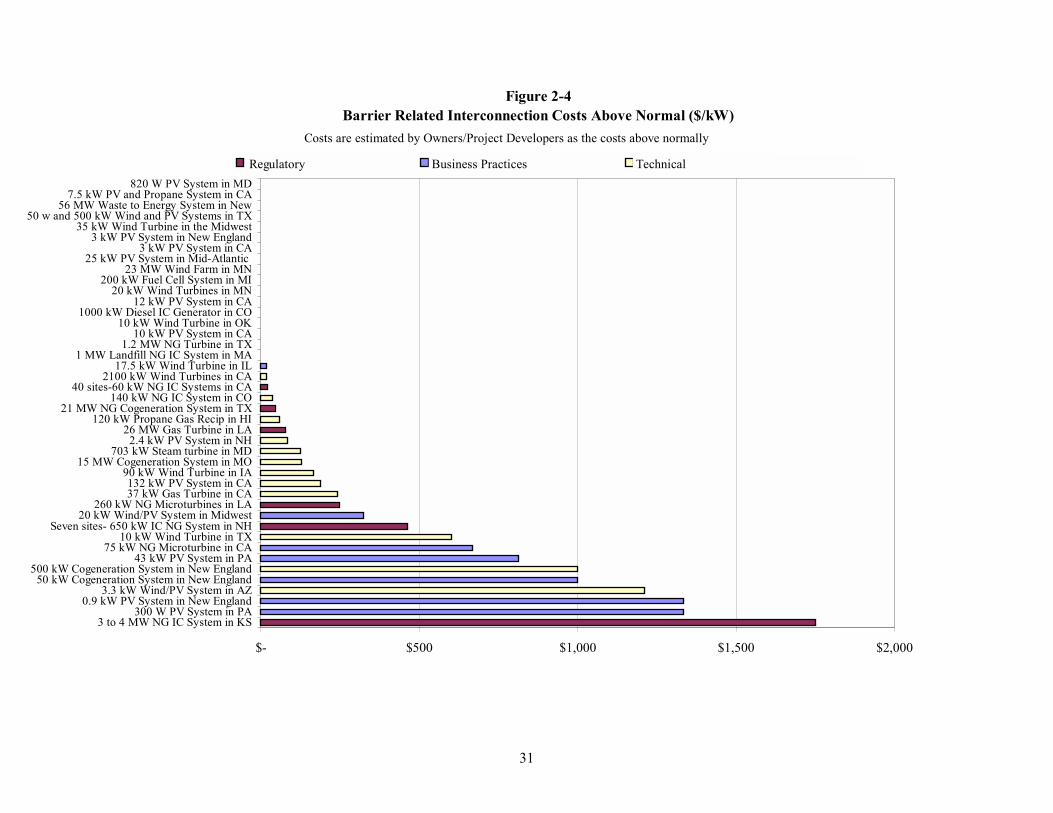
31
Figure 2-4Barrier Related Interconnection Costs Above Normal ($/kW)
$- $500 $1,000 $1,500 $2,000
3 to 4 MW NG IC System in KS300 W PV System in PA
0.9 kW PV System in New England3.3 kW Wind/PV System in AZ
50 kW Cogeneration System in New England500 kW Cogeneration System in New England
43 kW PV System in PA75 kW NG Microturbine in CA
10 kW Wind Turbine in TXSeven sites- 650 kW IC NG System in NH
20 kW Wind/PV System in Midwest260 kW NG Microturbines in LA
37 kW Gas Turbine in CA132 kW PV System in CA
90 kW Wind Turbine in IA15 MW Cogeneration System in MO
703 kW Steam turbine in MD2.4 kW PV System in NH
26 MW Gas Turbine in LA120 kW Propane Gas Recip in HI
21 MW NG Cogeneration System in TX140 kW NG IC System in CO
40 sites-60 kW NG IC Systems in CA2100 kW Wind Turbines in CA
17.5 kW Wind Turbine in IL1 MW Landfill NG IC System in MA
1.2 MW NG Turbine in TX10 kW PV System in CA
10 kW Wind Turbine in OK1000 kW Diesel IC Generator in CO
12 kW PV System in CA20 kW Wind Turbines in MN
200 kW Fuel Cell System in MI23 MW Wind Farm in MN
25 kW PV System in Mid-Atlantic 3 kW PV System in CA
3 kW PV System in New England35 kW Wind Turbine in the Midwest
50 w and 500 kW Wind and PV Systems in TX56 MW Waste to Energy System in New
7.5 kW PV and Propane System in CA820 W PV System in MD
3 to 4 MW NG IC System in KS 20 kW Wind/PV System in Midwest 2.4 kW PV System in NH
Costs are estimated by Owners/Project Developers as the costs above normally
Business PracticesRegulatory Technical
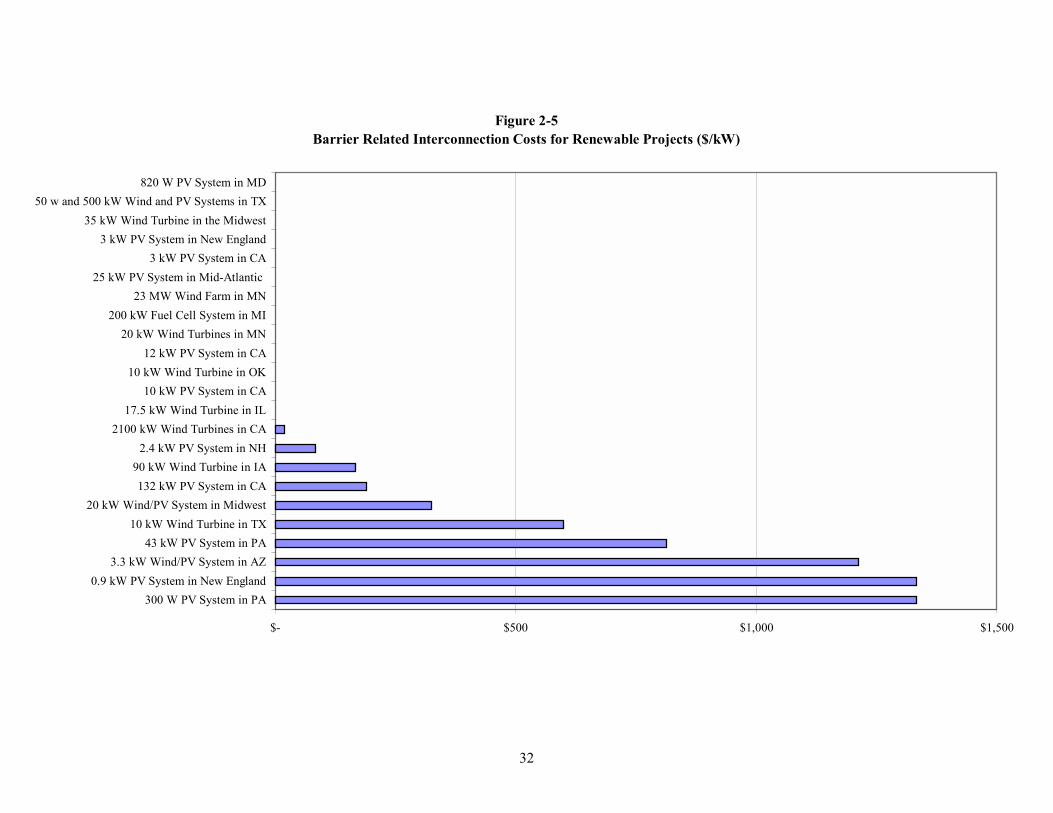
32
Figure 2-5Barrier Related Interconnection Costs for Renewable Projects ($/kW)
$- $500 $1,000 $1,500
300 W PV System in PA0.9 kW PV System in New England
3.3 kW Wind/PV System in AZ43 kW PV System in PA
10 kW Wind Turbine in TX20 kW Wind/PV System in Midwest
132 kW PV System in CA90 kW Wind Turbine in IA
2.4 kW PV System in NH2100 kW Wind Turbines in CA
17.5 kW Wind Turbine in IL10 kW PV System in CA
10 kW Wind Turbine in OK12 kW PV System in CA
20 kW Wind Turbines in MN200 kW Fuel Cell System in MI
23 MW Wind Farm in MN25 kW PV System in Mid-Atlantic
3 kW PV System in CA3 kW PV System in New England
35 kW Wind Turbine in the Midwest50 w and 500 kW Wind and PV Systems in TX
820 W PV System in MD
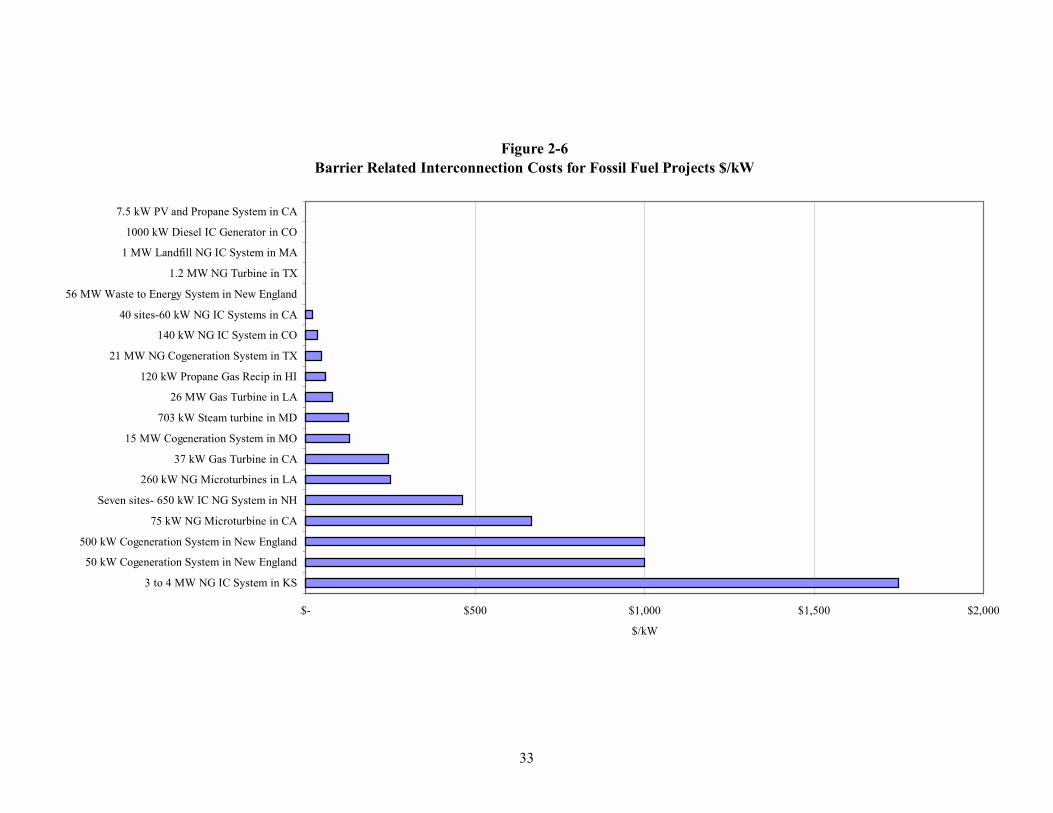
33
Figure 2-6Barrier Related Interconnection Costs for Fossil Fuel Projects $/kW
$- $500 $1,000 $1,500 $2,000
3 to 4 MW NG IC System in KS
50 kW Cogeneration System in New England
500 kW Cogeneration System in New England
75 kW NG Microturbine in CA
Seven sites- 650 kW IC NG System in NH
260 kW NG Microturbines in LA
37 kW Gas Turbine in CA
15 MW Cogeneration System in MO
703 kW Steam turbine in MD
26 MW Gas Turbine in LA
120 kW Propane Gas Recip in HI
21 MW NG Cogeneration System in TX
140 kW NG IC System in CO
40 sites-60 kW NG IC Systems in CA
56 MW Waste to Energy System in New England
1.2 MW NG Turbine in TX
1 MW Landfill NG IC System in MA
1000 kW Diesel IC Generator in CO
7.5 kW PV and Propane System in CA
$/kW
34
The regulatory scheme under which distributionutilities operate presents formidable barriers fordistributed power technologies. These barriers gobeyond the problems of technical interconnectionrequirements or utility delay, which are morereadily apparent to the market. They grow out oflong-standing regulatory policies and incentivesdesigned to support monopoly supply and averagesystem costs for all ratepayers. Today, thecustomer's desire for onsite generation is the driverfor distributed power markets. The regulatoryregime for distribution utilities is least prepared forthis customer-driven market, and significantbarriers arise as a result. In the present regulatoryenvironment, utilities have little or no incentive toencourage distributed power even in cases when itprovides benefits to the distribution system. To thecontrary, regulatory incentives understandably drivethe utility to defend itself against market entry ofdistributed generation. Revenues based onthroughput and system averaged pricing areoptimized by keeping maximum loads and highestrevenue customers on the system.
Among the barriers identified in the case studies assources of contention capable of blocking projectswere excessive charges for supplemental utilitypower, for utility capacity needed in case thecustomer needs replacement utility power (backupcharges), for transmitting the customer-generatedpower to other customers (wheeling charges), andfor leaving the utility system (exit fees because ofstranded costs), as well as rates paid by the utilityfor the customer-generated power which did notfully credit its benefit to the grid. Additionaldistribution and transmission charges for sellingpower from the customer site to either the utility orthe wholesale market are raising new tariff issueswith widely divergent results from one utilityterritory to another, leading to Federal RegulatoryCommission interest in the area. While someutilities, regulatory commissions, and independentsystem operators have implemented tariff structuresspecifically dealing with distributed generation,there is not yet an accepted set of regulatoryprinciples to be applied in an efficient nationalframework to accommodate distributed generation.
The Barriers
Several common patterns emerge from review ofthe 65 case studies in this report (with 26representative examples presented in detail in thenext section).
• There are a variety of technical, businesspractice, and regulatory barriers tointerconnection in the US domestic market.
• These barriers discourage and sometimesprevent distributed generation projects frombeing developed.
• The barriers exist for all distributed-generationtechnologies and in all parts of the country.
• The impacts of lengthy approval processes,project-specific equipment requirements, andhigh standard fees are particularly severe forsmaller distributed generation projects.
• Many barriers being encountered in today'smarketplace appear to derive from or are moresignificant because of the fact that utilities havenot previously dealt with many small-project orcustomer-generator interconnection requests.
• Many barriers also derive from or are moresignificant because there is not yet a nationalconsensus on technical standards for connectingequipment, necessary insurance, reasonablecharges for activities related to connection, oragreement on appropriate charges or paymentsfor distributed generation.
• Utilities often have the flexibility to remove orlessen barriers.
• Distributed generation project proponents facedwith technical requirements, fees, or otherbarriers that they found too burdensome areoften able to get those barriers removed orlessened by informally protesting to the utility,to the utility's regulatory agency, or to otherpublic agencies. But, this usually requiresconsiderable additional time, effort, andresources.
• Official judicial or regulatory appeals, however,were often seen as too costly for relativelysmall-scale distributed generation projects.
35
• Distributed generation project proponentsfrequently felt that existing rules did not givethem appropriate credit for the contributionsthey make to meeting power demand, reducingtransmission losses, or improvingenvironmental quality.
Suggested Actions To Remove orMitigate Barriers
The purpose of this study was to review examplesof the barriers that non-utility generators ofelectricity encounter when attempting tointerconnect to the electrical grid. In the course ofthe study, developers and utilities sometimessuggested solutions to these barriers. From thesesuggestions, the authors compiled a list of actionsthat could begin to eliminate unnecessary marketbarriers.
One of the key action items was the need toencourage collaborative action. Although regulatoryproceedings and legal challenges eventually wouldresolve most of the barriers identified, collaborativeefforts among all stakeholders are likely to resolvebarriers more quickly and efficiently thanpotentially adversarial proceedings.
The other action items were divided into threecategories: reducing technical barriers, reducingbusiness practice barriers, and reducing regulatorybarriers.
Reduce Technical Barriers
Adopt uniform technical standards forinterconnecting distributed power to the grid �Standardized interconnection requirements,sometimes called "plug and play" standards, are keyto opening markets for manufactured distributedpower equipment. This equipment could have thenecessary safety and power quality protection builtin at the factory if national standards were in place.Industry and the U.S. Department of Energy havebeen working through the auspices of the IEEE todevelop standards for the interconnection ofdistributed generation resources to electrical powersystems, to meet safety, power quality, andreliability requirements. Uniform adoption of theresulting standards is necessary to eliminate the
barrier posed by project-specific interconnectionrequirements.
Adopt testing and certification procedures forinterconnection equipment � For the IEEEinterconnection standards to be effectivelyimplemented, testing and certification proceduresmust be in place to assure that generatingequipment and the associated interconnectiondevices which provide the interface with the electricpower grid meet the standards. Equipment that is"pre-certified" can be confidently approved byutilities as meeting their safety and power qualityconcerns without any further review. Equipmentmanufacturers will depend on being able to pre-certify equipment because the economics ofdistributed power requires mass production ofequipment that can be installed and operated withminimal site-specific engineering. Stakeholdersinterested in promoting distributed power shouldexpedite the task of pre-certification throughappropriate testing and certification organizationsand should fully support the adoption and use ofpre-certified equipment.
Accelerate development of distributed powercontrol technology and systems � If the use ofdistributed power is to grow beyond isolatedinstallations, grid operators need access to controland system integration technologies that allowoptimal use and delivery of the power. Thesetechnology needs cover a broad range of systemsoperation research and development issuesaddressing open architecture, real time monitoring,control, command, communications, quality,reliability, and safety.
Reduce Business Practice Barriers
Adopt standard commercial practices for anyrequired utility review of interconnection �Delays and expense arising from the lack ofstandard utility procedures for dealing withdistributed power was one of the most frequentlycited complaints of distributed power projectproponents. Specific complaints included theabsence of any utility contact person to handleinterconnection requests, or unpredictable andopen-ended initial price quotes from the utility forprocessing interconnection requests. Recentregulatory attention in some states, notably Texas
36
and New York, promises to help by setting uniformstatewide procedures. Utilities, vendors, developers,regulators, and their associations can adopt standardbusiness practices for handling interconnectionrequests.
Establish standard business terms forinterconnection agreements � The terms andconditions of utility interconnection agreements(often modeled on agreements applicable to muchlarger facilities) were cited as barriers by manysurveyed distributed power project proponents.Fees, studies, insurance and indemnificationrequirements, and operating limitations appropriatefor large utility generators may not be necessary forsmaller facilities and act as significant impedimentsto distributed power installations. Theserequirements also vary tremendously from utility toutility, which deters commercial scale marketing.Some states have adopted simple "one page"agreements and reasonable insurance limits forresidential- and small commercial-scale systems.Other states have begun to address standard termsand fees for industrial-scale distributed power.Using a collaborative process of the type used inconnection with the Texas regulations, distributedpower stakeholders can develop standard businessterms and provisions for uniform adoption byutilities and regulators.
Develop tools for utilities to assess the value andimpact of distributed power at any point on thegrid � Distributed power can offer significantsystem benefits for utilities and grid customers as awhole. These benefits include reducingtransmission and distribution losses, leveling outdemand profiles, saving higher cost distributioninvestment, and avoiding new central generation ortransmission lines, among others. Transmissionsystem planners are accustomed to monitoringnetworks and their operating instabilities and toanalyzing investment tradeoffs. Prior to the recentgrowth in distributed generation, however, there hasbeen little need for that kind of analysis fordistribution systems. Accordingly, case studyrespondents reported that having the means toquickly assess the impacts and benefits, technicaland economic, of a proposed distributed powerproject at a particular location would assist in moreaccurate utility response and price signals tooptimize deployment of these new distribution
system resources. Utilities, regulators, anddistributed generation proponents need tocollaboratively develop these tools in time tosupport the new markets for distributed power.
Reduce Regulatory Barriers
Develop new regulatory principles compatible withdistributed power choices in both competitive andutility markets � "Anti-bypass" provisions undertraditional regulatory principles allow utilities todiscourage distributed power, particularly largercustomer-sited projects, by offering customersdiscounts to stay with the utility. Other traditionalregulatory requirements create financial incentivesfor utilities to discourage loss of load or to addcharges to distributed power facilities for use of thedistribution system. New principles are needed tobalance the interests of various customer classes,and to address market efficiencies andenvironmental benefits. A national policy dialogueamong traditional utility stakeholders and the newermarket entrants should develop consensus on newprinciples governing the new markets.
Adopt regulatory tariffs and utility incentives to fitthe new distributed power model � For many ofthe case studies, the primary barrier was a utilitytariff rate specifically applied to onsite generation.For example, utilities sometimes assessed backuptariffs near or even exceeding the prices previouslycharged for full electrical service. Also, back-haulor uplift tariffs arise under state and federaljurisdiction. These tariffs can create what were inseveral cases insurmountable barriers to deliveringlocally generated power to wholesale markets. Insome states, customers are charged exit fees fordisconnecting from the grid�forgoing theinterconnection benefits of backup power andaccess to wholesale markets. Tariffs balancingcustomer, utility and market interests need to bedeveloped consistent with appropriate applicableregulatory principles. Likewise, new mechanismsunder which the utilities can earn financial rewards,rather than incur financial penalties, for optimizingthe use of distributed power must be part of the newregulatory approach to these markets.
37
Establish expedited dispute resolution processesfor distributed generation project proposals �Relief delayed in many cases was relief denied fornew distributed power entrants attempting to enterthe market. The case studies in this report showed astrong pattern of reduced interconnection barrierswhen distributed power project proponentscontested them. Official regulatory agencychallenges, however, were typically seen as toodifficult and costly, especially for smaller projects,and many proponents did not or could noteconomically pursue such challenges. Regulatorybodies and distributed generation stakeholdersshould develop expedited dispute resolutionprocesses for distributed generation projects.
Define the conditions necessary for a right tointerconnect � The combination of acceptabletechnical standards, business practices, andregulatory principles implies a right to interconnectto the public network under those definedconditions. But unlike the publictelecommunications network, where the right tointerconnect customer-owned equipment isestablished under similar standards imposed by boththe states and the Federal CommunicationsCommission, there is not now any establishedunderlying right to connect to the electric grid.There were several case-study examples ofdistributed power proponents being deniedinterconnection and parallel operation by eitherinvestor owned or publicly owned utilities. For thepotential benefits of competitive markets anddistributed power to the nation's energy system tobe realized, the conditions under which distributedpower facilities have the right to interconnectshould be explicitly addressed rather than left tocase-by-case determination. For example, newcustomer-sited protective equipment can preventexports of power to the grid and safely disconnectfrom the grid when necessary, allowing customersthe freedom to generate for their own load whileassuring safety for other grid customers. These "noexport" customer-sited options, subject tocertification under approved standards, are onecategory that should universally be allowed tointerconnect. Defining the conditions that support auniversal right to interconnect is key to unlockingthe national market and customer investment inthese promising distributed power technologies.
A Ten-Point Action Plan ForReducing Barriers to DistributedGeneration
Reduce Technical Barriers
(1) Adopt uniform technical standards forinterconnecting distributed power to thegrid.
(2) Adopt testing and certification proceduresfor interconnection equipment.
(3) Accelerate development of distributedpower control technology and systems.
Reduce Business Practice Barriers
(4) Adopt standard commercial practices forany required utility review ofinterconnection.
(5) Establish standard business terms forinterconnection agreements.
(6) Develop tools for utilities to assess thevalue and impact of distributed power atany point on the grid.
Reduce Regulatory Barriers
(7) Develop new regulatory principlescompatible with distributed power choicesin both competitive and utility markets.
(8) Adopt regulatory tariffs and utilityincentives to fit the new distributed powermodel.
(9) Establish expedited dispute resolutionprocesses for distributed generationproject proposals.
(10) Define the conditions necessary for a rightto interconnect.
38
Conclusion
As indicated by the case studies in this report, awide range of barriers affect grid interconnection ofdistributed generation projects. Many of thesebarriers can block what appear to be viable projectswith potential benefits to both the customer and theutility system. On the other hand, the trend towardsdevelopment and adoption of uniform technicalstandards for interconnection, the success ofindividual state regulatory proceedings ondistributed generation, and the exemplary programsof individual utilities to promote distributedgeneration indicate the potential for resolution ofmost of these barriers.
A distribution system optimized for new distributedpower technologies and customer choice willultimately emerge. Regulatory and business modelsare needed to encourage evolution toward andhandle the transition to that future distributionsystem. Significant steps toward this goal have beentaken particularly with the rules promulgated by theNew York and Texas utility commissions, but muchwork remains to be done. This report is intended toidentify the various barriers in the hope ofencouraging stakeholders to tackle the challenge ofresolving the underlying issues. Distributedgeneration promises greater customer choice,efficiency, and environmental benefits. Resolvingbarriers to interconnection is a critical step towardachieving the full potential benefits of distributedgeneration and realizing the market opportunitiesthat distributed generation technologies provide.
38
As indicated by the case studies in this report, awide range of barriers affect grid interconnection ofdistributed generation projects. Many of thesebarriers can block what appear to be viable projectswith potential benefits to both the customer and theutility system. On the other hand, the trend towardsdevelopment and adoption of uniform technicalstandards for interconnection, the success ofindividual state regulatory proceedings ondistributed generation, and the exemplary programsof individual utilities to promote distributedgeneration indicate the potential for resolution ofmost of these barriers.
A distribution system optimized for new distributedpower technologies and customer choice willultimately emerge. Regulatory and business modelsare needed to encourage evolution toward andhandle the transition to that future distributionsystem. Significant steps toward this goal have beentaken particularly with the rules promulgated by theNew York and Texas utility commissions, but muchwork remains to be done. This report is intended toidentify the various barriers in the hope ofencouraging stakeholders to tackle the challenge ofresolving the underlying issues. Distributedgeneration promises greater customer choice,efficiency, and environmental benefits. Resolvingbarriers to interconnection is a critical step towardachieving the full potential benefits of distributedgeneration and realizing the market opportunitiesthat distributed generation technologies provide.
39
SECTION 3 CASE STUDIES
In this section we provide narrative descriptions of 26case studies included in this project. We chose the 26case studies as a representative cross section of the 65cases studied. These case studies were also the onesfor which the most detailed and reliable informationwas available. Our intent was to represent large andsmall projects alike. Initially, we equally representedeach size category; however, the 25-kW to 1-MWsize range had several cases that were worthy ofdetailed representation. Specific case studies couldbe segregated either by technology (i.e., wind, solar,gas turbine) or by size of the facility. Some utilitieswith interconnection procedures evaluate projects bysize. Thus, our report adopts this protocol, and weaddress three size ranges of distributed powerprojects, as follows:
• 1 MW and Greater• 25 kW to 1 MW• Up to 25 kW.
Each case study is organized to report thebackground of the project (with confidentialinformation deleted), benefits of the project, barriersto market entry, costs associated with the barriers,and the utility�s stance when available. In each casestudy, we classify the barriers to market entry asfollows:
• Technical interconnection barriers• Business practice barriers• Regulatory barriers.
The factual information in these case studies isderived principally from interviews with thedevelopers and owners of these distributed powerfacilities. Although we made efforts to confirm keyfacts with other stakeholders, particularly theinterconnecting utilities, these narratives remain ineffect the distributed generators� narratives. Not allthe information provided could be independentlyverified. Thus, these case studies primarily representthe developers� view of the situations theyencountered in seeking to interconnect their facilities.We viewed our task as reporting the barriers theydescribed, not assessing the legitimacy of theirconcerns. Therefore, the case studies reported here
may not reflect what might be a very different utilityposition with respect to some of the cases.
3.1 Individual Case Study Narratives forLarge Distributed Power Projects(One MW and Greater)
This section provides a detailed description of eightlarger distributed power installations. Barriers toentry into the market place changed as the facilitiesinstalled increased in size. Developers and vendorsinstalling larger projects tended to be different thanthose installing smaller projects, as did the customers.Larger distributed power facilities (one MW andlarger) can be installed for a variety of different typesof organizations that might include:
• Large commercial users• Large industrial users• Generation companies• Distribution companies• Municipalities• Cooperatives.
In our study, we interviewed 16 organizations thatinstalled, are planning to install, or attempted toinstall distributed power between one and 10 MW insize. We also interviewed six organizations withgeneration greater than 10 MW.66 Of these projects,13 are for municipalities, city/community facilities,or utilities.
Larger projects tend to serve specific types ofapplications such as CHP67 projects. CHP projects aretypically primarily connected as baseload facilitiesbecause many times the need for heat or steam cannotbe supplied from another source. In those cases, theelectricity is generated independent of system peak.
66 We did not seek out distributed power projects largerthan 100 megawatts because the issues of customer accessor transmission access invoke different technical and otherconsiderations.67 Cogeneration is the production of steam in conjunctionwith electricity. The steam is used for an alternative sourcesuch as hot water heating or processes. This is also referredto as CHP or combined heat and power.
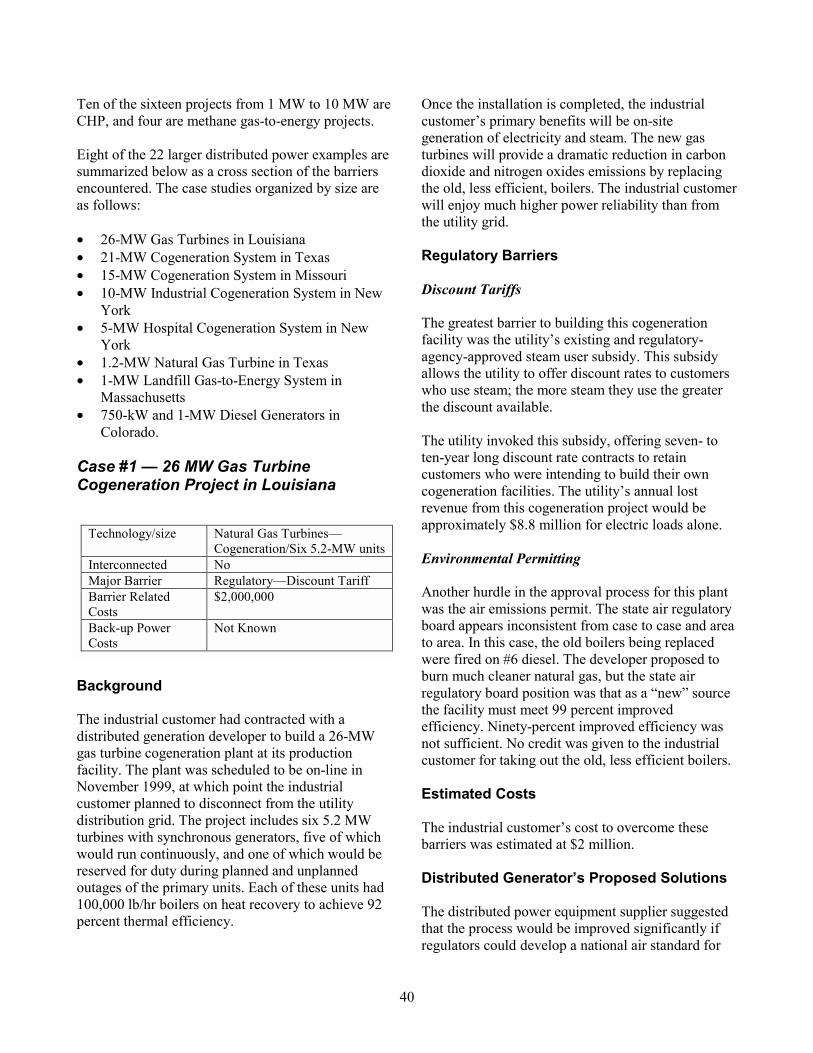
40
Ten of the sixteen projects from 1 MW to 10 MW areCHP, and four are methane gas-to-energy projects.
Eight of the 22 larger distributed power examples aresummarized below as a cross section of the barriersencountered. The case studies organized by size areas follows:
• 26-MW Gas Turbines in Louisiana• 21-MW Cogeneration System in Texas• 15-MW Cogeneration System in Missouri• 10-MW Industrial Cogeneration System in New
York• 5-MW Hospital Cogeneration System in New
York• 1.2-MW Natural Gas Turbine in Texas• 1-MW Landfill Gas-to-Energy System in
Massachusetts• 750-kW and 1-MW Diesel Generators in
Colorado.
Case #1 � 26 MW Gas TurbineCogeneration Project in Louisiana
Background
The industrial customer had contracted with adistributed generation developer to build a 26-MWgas turbine cogeneration plant at its productionfacility. The plant was scheduled to be on-line inNovember 1999, at which point the industrialcustomer planned to disconnect from the utilitydistribution grid. The project includes six 5.2 MWturbines with synchronous generators, five of whichwould run continuously, and one of which would bereserved for duty during planned and unplannedoutages of the primary units. Each of these units had100,000 lb/hr boilers on heat recovery to achieve 92percent thermal efficiency.
Once the installation is completed, the industrialcustomer�s primary benefits will be on-sitegeneration of electricity and steam. The new gasturbines will provide a dramatic reduction in carbondioxide and nitrogen oxides emissions by replacingthe old, less efficient, boilers. The industrial customerwill enjoy much higher power reliability than fromthe utility grid.
Regulatory Barriers
Discount Tariffs
The greatest barrier to building this cogenerationfacility was the utility�s existing and regulatory-agency-approved steam user subsidy. This subsidyallows the utility to offer discount rates to customerswho use steam; the more steam they use the greaterthe discount available.
The utility invoked this subsidy, offering seven- toten-year long discount rate contracts to retaincustomers who were intending to build their owncogeneration facilities. The utility�s annual lostrevenue from this cogeneration project would beapproximately $8.8 million for electric loads alone.
Environmental Permitting
Another hurdle in the approval process for this plantwas the air emissions permit. The state air regulatoryboard appears inconsistent from case to case and areato area. In this case, the old boilers being replacedwere fired on #6 diesel. The developer proposed toburn much cleaner natural gas, but the state airregulatory board position was that as a �new� sourcethe facility must meet 99 percent improvedefficiency. Ninety-percent improved efficiency wasnot sufficient. No credit was given to the industrialcustomer for taking out the old, less efficient boilers.
Estimated Costs
The industrial customer�s cost to overcome thesebarriers was estimated at $2 million.
Distributed Generator�s Proposed Solutions
The distributed power equipment supplier suggestedthat the process would be improved significantly ifregulators could develop a national air standard for
Technology/size Natural Gas Turbines�Cogeneration/Six 5.2-MW units
Interconnected NoMajor Barrier Regulatory�Discount TariffBarrier RelatedCosts
$2,000,000
Back-up PowerCosts
Not Known
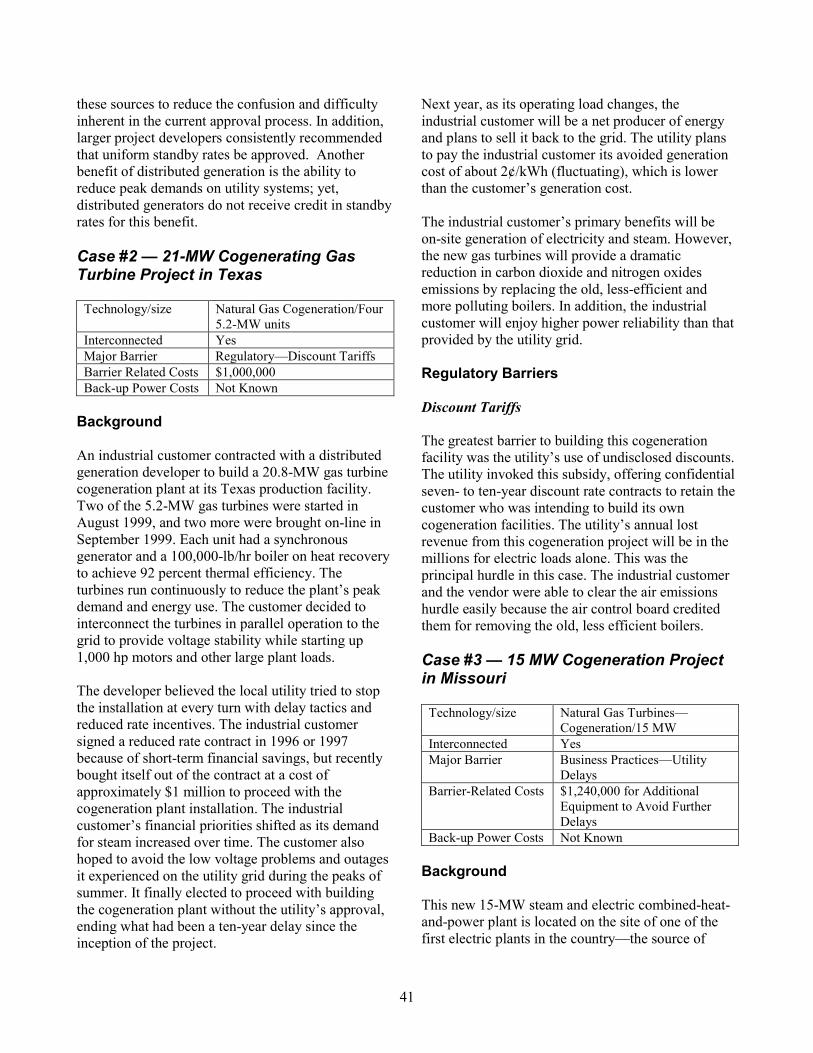
41
these sources to reduce the confusion and difficultyinherent in the current approval process. In addition,larger project developers consistently recommendedthat uniform standby rates be approved. Anotherbenefit of distributed generation is the ability toreduce peak demands on utility systems; yet,distributed generators do not receive credit in standbyrates for this benefit.
Case #2 � 21-MW Cogenerating GasTurbine Project in Texas
Technology/size Natural Gas Cogeneration/Four5.2-MW units
Interconnected YesMajor Barrier Regulatory�Discount TariffsBarrier Related Costs $1,000,000Back-up Power Costs Not Known
Background
An industrial customer contracted with a distributedgeneration developer to build a 20.8-MW gas turbinecogeneration plant at its Texas production facility.Two of the 5.2-MW gas turbines were started inAugust 1999, and two more were brought on-line inSeptember 1999. Each unit had a synchronousgenerator and a 100,000-lb/hr boiler on heat recoveryto achieve 92 percent thermal efficiency. Theturbines run continuously to reduce the plant�s peakdemand and energy use. The customer decided tointerconnect the turbines in parallel operation to thegrid to provide voltage stability while starting up1,000 hp motors and other large plant loads.
The developer believed the local utility tried to stopthe installation at every turn with delay tactics andreduced rate incentives. The industrial customersigned a reduced rate contract in 1996 or 1997because of short-term financial savings, but recentlybought itself out of the contract at a cost ofapproximately $1 million to proceed with thecogeneration plant installation. The industrialcustomer�s financial priorities shifted as its demandfor steam increased over time. The customer alsohoped to avoid the low voltage problems and outagesit experienced on the utility grid during the peaks ofsummer. It finally elected to proceed with buildingthe cogeneration plant without the utility�s approval,ending what had been a ten-year delay since theinception of the project.
Next year, as its operating load changes, theindustrial customer will be a net producer of energyand plans to sell it back to the grid. The utility plansto pay the industrial customer its avoided generationcost of about 2¢/kWh (fluctuating), which is lowerthan the customer�s generation cost.
The industrial customer�s primary benefits will beon-site generation of electricity and steam. However,the new gas turbines will provide a dramaticreduction in carbon dioxide and nitrogen oxidesemissions by replacing the old, less-efficient andmore polluting boilers. In addition, the industrialcustomer will enjoy higher power reliability than thatprovided by the utility grid.
Regulatory Barriers
Discount Tariffs
The greatest barrier to building this cogenerationfacility was the utility�s use of undisclosed discounts.The utility invoked this subsidy, offering confidentialseven- to ten-year discount rate contracts to retain thecustomer who was intending to build its owncogeneration facilities. The utility�s annual lostrevenue from this cogeneration project will be in themillions for electric loads alone. This was theprincipal hurdle in this case. The industrial customerand the vendor were able to clear the air emissionshurdle easily because the air control board creditedthem for removing the old, less efficient boilers.
Case #3 � 15 MW Cogeneration Projectin Missouri
Technology/size Natural Gas Turbines�Cogeneration/15 MW
Interconnected YesMajor Barrier Business Practices�Utility
DelaysBarrier-Related Costs $1,240,000 for Additional
Equipment to Avoid FurtherDelays
Back-up Power Costs Not Known
Background
This new 15-MW steam and electric combined-heat-and-power plant is located on the site of one of thefirst electric plants in the country�the source of
42
power for the first electrified Worlds Fair held in St.Louis in 1904. The plant later added steam recoveryto supply district steam heating to the city.
Through the 1980s the plant operated as a 70-MWpeaking facility before its shutdown and sale by theutility. The current owner bought the site andinstalled two synchronous generators, each poweredby a backpressure steam turbine and a new gasturbine.
The system achieves approximately 70 percentenergy efficiency by combining steam production fordistrict heating with electricity production. The steamturbines recover excess steam pressure from thesteam system to power each generator to about 2.5MW of capacity, and the gas turbines power theremaining 5 MW for a total of 15 MW of generation.In the winter with higher turbine efficiencies andmore steam use the capacity rises to about 17 MW.
The project owner first approached the utility in June1998 with a requested start date for the project ofJune 1, 1999. The utility required the same technicaland operating requirements that it would apply tolarge utility-owned generation facilities 10 to 100times the size, including the right to operate it as partof the utility system. The utility requested systemupgrades the developer believed not appropriate orfeasible for a small merchant plant. Similarly,requests for operating control of the units from theutility control center failed to recognize competitivemarket operation and relative size of the unit.
Although relatively large in terms of distributedpower, the 15-MW combined heat-and-power facilityhere did not rise to the level of the one-percentmetering error of the 2,000-MW coal plant operatedby the utility forty miles away. When repeatedlyconfronted on the inappropriateness of theinterconnection demands, the utility dropped some ofthe requirements to allow the project to proceed.Nonetheless, the technical interconnectionrequirements ultimately imposed added more thanone million dollars to the cost of the project anddelayed approval.
The developer also pointed out its perception of thedifferences between the utility project approach and acompetitive market approach. For example, the utilitywas not amenable to overtime or additional expense
to meet the interconnection deadline � even whenthe developer offered to pay for it. On the other hand,with respect to capital investment the utility manytimes proposed a higher-priced technical approachsuch as building a three-million-dollar substation,rather than looking at more effective lower costoptions such as co-location and interconnection at theexisting substation.
Further, the ability of the utility to recover itsexpenses in developing its interconnection policieswas also felt to be unfair. In this case the nearbyavailable substation requested by the developer forinterconnection would have given any new generatordirect distribution access to industrial and urbancustomers in a restructured market, without resort totransmission line reservation and fees. As ultimatelyconfigured, the interconnection steps the generationup to the transmission system and eliminates directdistribution access to such potential competitors ofthe utility.
Business Practice Barriers
Procedural Requirements for Interconnection
The interconnection approval was punctuated withcumulative procedural delays. For example, it wasreported that the utility volunteered to take minutesof the meetings and then produced none over thecourse of many meetings. The developer eventuallytook over the responsibility for minutes after notingthe delays. Telephone calls to the utility werereportedly met with repeated responses of �call nextweek.� In what we found to be a common experience,midway through the process the utility changedrepresentatives, resulting in weeks of no response,and ultimately direct dealings with operating linepersonnel were required to circumvent the impasse.
The developer also reported that several monthsbefore the June 1999 projected start date, the utilitygave notice that a transmission line poleinterconnection was near its yield point. A new,specific pole was required, which would take sixmonths for delivery. The developer believed that theadditional load of a short slack interconnection linewas minimal compared to multiple spans of heavytransmission cable already on the pole. When askedfor the new pole specifications for justification, theutility allowed interconnection with reinforcement to
43
the existing pole. Similarly, with respect to whatbreakers would be required, the utility did notprovide specifications. When presented with abreaker from another location, the utility claimed thatit could not be used at the proposed site. When thedeveloper presented the manufacturer�s certification,the breaker was allowed.
The utility did not commence work until the lastweek of May 1999, far too late for completion byJune 1, 1999. The utility�s initial position was that notransmission hook-up could occur during the high-demand summer months, and thus interconnectionwould need to wait until fall. However, as capacitylimits appeared as the summer peak approached, theutility agreed to interconnect, which it did by July 14,1999. The utility accepted the power immediately atthe PURPA buyback rate of 1.5¢/kWh, but restrictedsales into the market to other buyers until remotereading meters were in place to allow the utility tomonitor the owner�s generation remotely. Thoseremote signaling meters were installed by July 23,1999, at which time market sales began. The systemhas been in operation since that time.
Contractual Requirements for Interconnection
The developer asked for a draft contract at the start ofthe negotiations in June 1998. The first draft wasprovided in April 1999. Among the utility controlprovisions included in the draft contract was the rightto take over remote operation of the plant whensystem conditions demanded. This and similarprovisions, which had been common under thenatural monopoly regulatory environment, were theprincipal subjects of negotiations, rather than oneincluding the needs of merchant plant operation andmarket response.
The contract provisions required redrafting torecognize the shift away from utility ownership andcontrol to market operation. For example, the utilitycited its need for control of supply grid operationsunder an ISO, overriding competitive interests in thedeveloper in meeting that supply need. The languagethat was ultimately adopted allowed dispatch of theplant in a system emergency, not otherwise defined,with the owner reimbursed for costs. The marketvalue and payment for this generation are nototherwise defined. As indicated above, the utility�srequest for direct digital remote control of the
merchant plant was ultimately negotiated down toremote meter access.
Technical Barriers
The developer believed that the technicalrequirements were also imposed to discourage theinstallation. The developer initially proposed tyinginto the utility substation located three blocks awayfrom the project site. The nearby substation hadexisting duct banks already in place for undergroundinterconnection, operated at the 13.8-kV generationvoltage, and directly served downtown and industrialloads. For two months, the utility attempted to directthe project to a more distant substation through oldfeeder lines operating under a river flood plain notsuitable for reliable access and operation. Moreover,the developer was concerned that the condition of theaging equipment at that substation would entailhigher operation and maintenance costs for the life ofthe project.
When the developer refused the distantinterconnection, the utility estimated a cost of$2.5 million to modify the nearby substation,claiming all breakers would need to be replaced tohandle the capacity. The developer proposed co-location of new transformers at the same site to makeuse of interconnection and 13.8 kV access, but wasrefused. As a consequence, the developer wasrequired to build a new substation with undergroundaccess and transformers to enter at the transmissionlevel.
The utility quoted a cost of $3 million and two yearsto build the substation. The developer chose to buildthe new substation in six months, keeping to the June1999 projected schedule, at a cost of $1.7 million �more than $1 million less than the utility quote and$0.8 million less than the utility estimate for directinterconnection at the nearby substation. However,the required cost was $1 million dollars more than thepreferred nearby 13.8-kV access that the developerbelieved would have been acceptable with newtransformers.
Finally, after completion of the substation, the utilitytied in the three-phase feeder lines with systemprotection relays on each end with costs to be billedto the developer based on a good-faith estimate of$240,000.
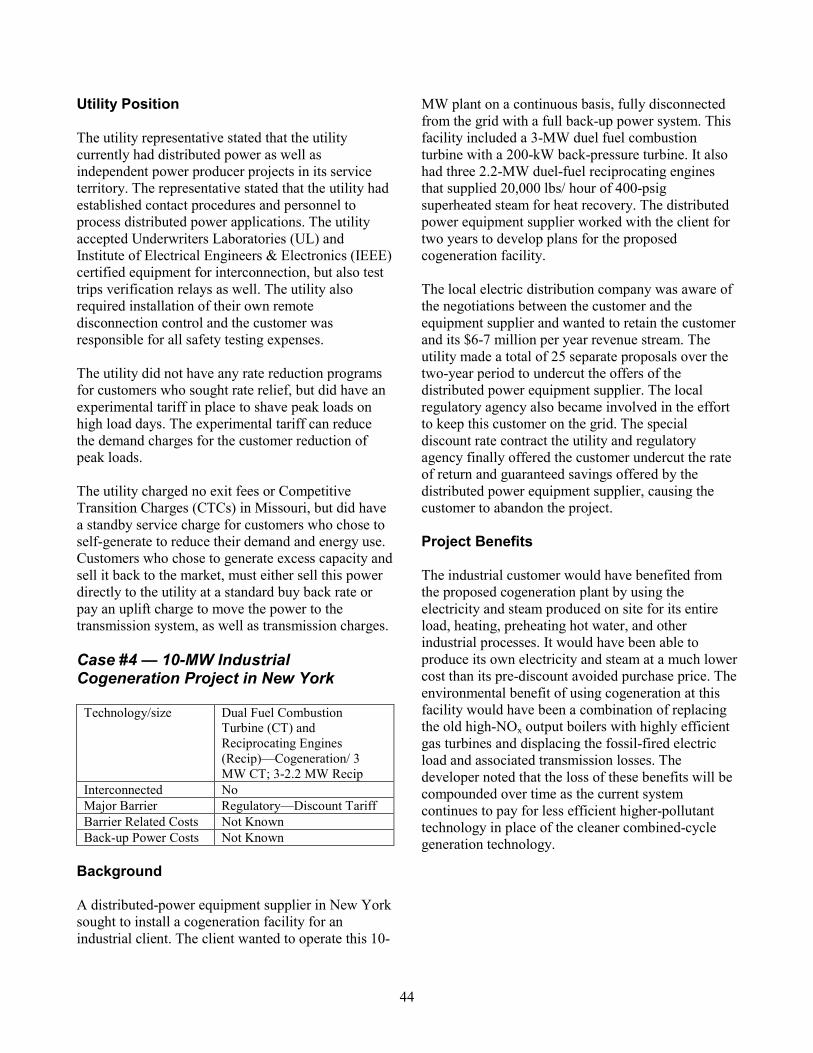
44
Utility Position
The utility representative stated that the utilitycurrently had distributed power as well asindependent power producer projects in its serviceterritory. The representative stated that the utility hadestablished contact procedures and personnel toprocess distributed power applications. The utilityaccepted Underwriters Laboratories (UL) andInstitute of Electrical Engineers & Electronics (IEEE)certified equipment for interconnection, but also testtrips verification relays as well. The utility alsorequired installation of their own remotedisconnection control and the customer wasresponsible for all safety testing expenses.
The utility did not have any rate reduction programsfor customers who sought rate relief, but did have anexperimental tariff in place to shave peak loads onhigh load days. The experimental tariff can reducethe demand charges for the customer reduction ofpeak loads.
The utility charged no exit fees or CompetitiveTransition Charges (CTCs) in Missouri, but did havea standby service charge for customers who chose toself-generate to reduce their demand and energy use.Customers who chose to generate excess capacity andsell it back to the market, must either sell this powerdirectly to the utility at a standard buy back rate orpay an uplift charge to move the power to thetransmission system, as well as transmission charges.
Case #4 � 10-MW IndustrialCogeneration Project in New York
Technology/size Dual Fuel CombustionTurbine (CT) andReciprocating Engines(Recip)�Cogeneration/ 3MW CT; 3-2.2 MW Recip
Interconnected NoMajor Barrier Regulatory�Discount TariffBarrier Related Costs Not KnownBack-up Power Costs Not Known
Background
A distributed-power equipment supplier in New Yorksought to install a cogeneration facility for anindustrial client. The client wanted to operate this 10-
MW plant on a continuous basis, fully disconnectedfrom the grid with a full back-up power system. Thisfacility included a 3-MW duel fuel combustionturbine with a 200-kW back-pressure turbine. It alsohad three 2.2-MW duel-fuel reciprocating enginesthat supplied 20,000 lbs/ hour of 400-psigsuperheated steam for heat recovery. The distributedpower equipment supplier worked with the client fortwo years to develop plans for the proposedcogeneration facility.
The local electric distribution company was aware ofthe negotiations between the customer and theequipment supplier and wanted to retain the customerand its $6-7 million per year revenue stream. Theutility made a total of 25 separate proposals over thetwo-year period to undercut the offers of thedistributed power equipment supplier. The localregulatory agency also became involved in the effortto keep this customer on the grid. The specialdiscount rate contract the utility and regulatoryagency finally offered the customer undercut the rateof return and guaranteed savings offered by thedistributed power equipment supplier, causing thecustomer to abandon the project.
Project Benefits
The industrial customer would have benefited fromthe proposed cogeneration plant by using theelectricity and steam produced on site for its entireload, heating, preheating hot water, and otherindustrial processes. It would have been able toproduce its own electricity and steam at a much lowercost than its pre-discount avoided purchase price. Theenvironmental benefit of using cogeneration at thisfacility would have been a combination of replacingthe old high-NOx output boilers with highly efficientgas turbines and displacing the fossil-fired electricload and associated transmission losses. Thedeveloper noted that the loss of these benefits will becompounded over time as the current systemcontinues to pay for less efficient higher-pollutanttechnology in place of the cleaner combined-cyclegeneration technology.
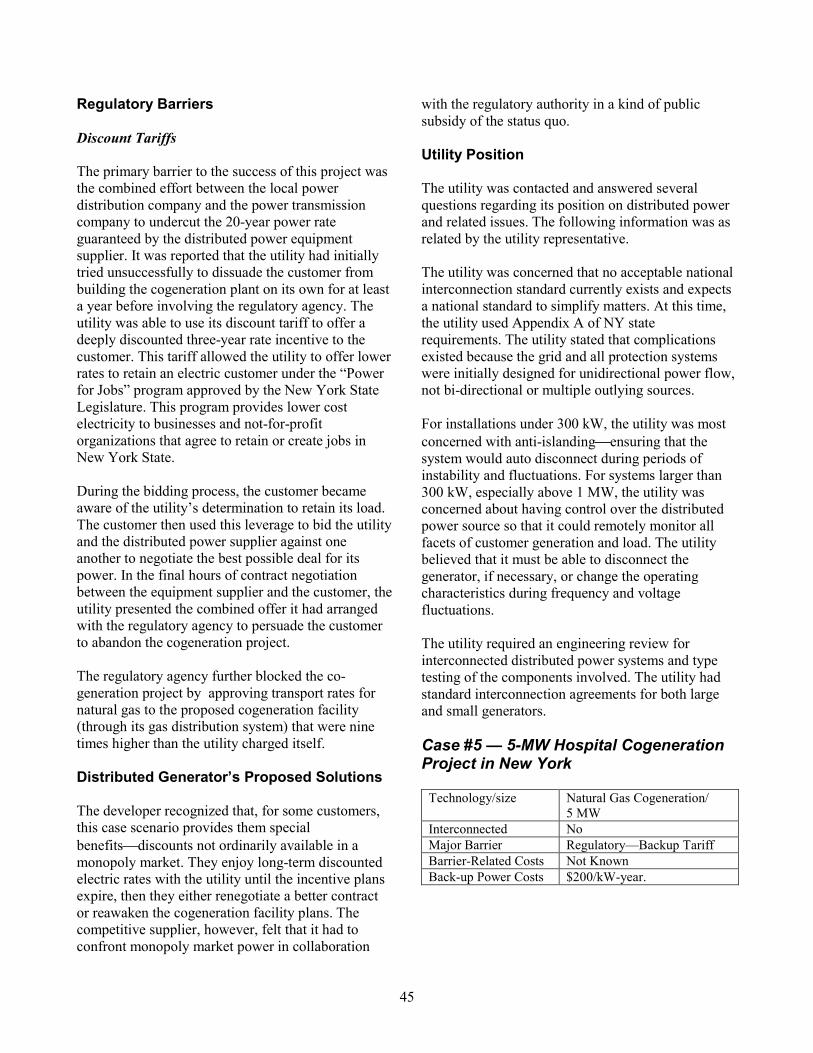
45
Regulatory Barriers
Discount Tariffs
The primary barrier to the success of this project wasthe combined effort between the local powerdistribution company and the power transmissioncompany to undercut the 20-year power rateguaranteed by the distributed power equipmentsupplier. It was reported that the utility had initiallytried unsuccessfully to dissuade the customer frombuilding the cogeneration plant on its own for at leasta year before involving the regulatory agency. Theutility was able to use its discount tariff to offer adeeply discounted three-year rate incentive to thecustomer. This tariff allowed the utility to offer lowerrates to retain an electric customer under the �Powerfor Jobs� program approved by the New York StateLegislature. This program provides lower costelectricity to businesses and not-for-profitorganizations that agree to retain or create jobs inNew York State.
During the bidding process, the customer becameaware of the utility�s determination to retain its load.The customer then used this leverage to bid the utilityand the distributed power supplier against oneanother to negotiate the best possible deal for itspower. In the final hours of contract negotiationbetween the equipment supplier and the customer, theutility presented the combined offer it had arrangedwith the regulatory agency to persuade the customerto abandon the cogeneration project.
The regulatory agency further blocked the co-generation project by approving transport rates fornatural gas to the proposed cogeneration facility(through its gas distribution system) that were ninetimes higher than the utility charged itself.
Distributed Generator�s Proposed Solutions
The developer recognized that, for some customers,this case scenario provides them specialbenefitsdiscounts not ordinarily available in amonopoly market. They enjoy long-term discountedelectric rates with the utility until the incentive plansexpire, then they either renegotiate a better contractor reawaken the cogeneration facility plans. Thecompetitive supplier, however, felt that it had toconfront monopoly market power in collaboration
with the regulatory authority in a kind of publicsubsidy of the status quo.
Utility Position
The utility was contacted and answered severalquestions regarding its position on distributed powerand related issues. The following information was asrelated by the utility representative.
The utility was concerned that no acceptable nationalinterconnection standard currently exists and expectsa national standard to simplify matters. At this time,the utility used Appendix A of NY staterequirements. The utility stated that complicationsexisted because the grid and all protection systemswere initially designed for unidirectional power flow,not bi-directional or multiple outlying sources.
For installations under 300 kW, the utility was mostconcerned with anti-islandingensuring that thesystem would auto disconnect during periods ofinstability and fluctuations. For systems larger than300 kW, especially above 1 MW, the utility wasconcerned about having control over the distributedpower source so that it could remotely monitor allfacets of customer generation and load. The utilitybelieved that it must be able to disconnect thegenerator, if necessary, or change the operatingcharacteristics during frequency and voltagefluctuations.
The utility required an engineering review forinterconnected distributed power systems and typetesting of the components involved. The utility hadstandard interconnection agreements for both largeand small generators.
Case #5 � 5-MW Hospital CogenerationProject in New York
Technology/size Natural Gas Cogeneration/5 MW
Interconnected NoMajor Barrier Regulatory�Backup TariffBarrier-Related Costs Not KnownBack-up Power Costs $200/kW-year.
46
Background
A distributed power equipment supplier in theNortheast sought to install a cogeneration facility fora hospital client. The client wanted to operate this 5-MW plant on a continuous basis to provide base-loadgeneration and cover foreseeable demand peaks. Thefacility was to include a 5-MW dual-fuel combustionturbine. This turbine was to supply a heat-recoverysteam generator producing 70,000 lbs/hour of 200-psig superheated steam. The hospital intended toretire several old boilers by installing the newcogeneration plant, as well as use the low-gradesteam for absorption chilling. The small plant sizeand reliability needs of the hospital required paralleloperation to the grid. Ultimately, the high chargeslevied by the utility for backing up the full plantcapacity caused the hospital to abandon this project.The utility would have lost an estimated $850,000 peryear in revenue from the customer.
This hospital would have benefited from theproposed cogeneration plant by using all theelectricity and steam produced on site for base load,heating, preheating hot water, and driving absorptionchillers. It would have been able to produce its ownelectricity and steam at a much lower cost than itsavoided purchase price had the high standby chargesnot been levied. Finally, there would have been asignificant environmental benefit from the increasedefficiency of using cogeneration at this facility,resulting from a combination of replacing the oldheating boilers with highly efficient gas turbines,using the otherwise wasted low-grade heat, anddisplacing other fossil-fired electric load andassociated transmission losses.
Regulatory Barriers
Back-up Tariff
The primary barrier to the success of this project wasthe back-up tariff imposed by the local utility. Theutility required a reservation of the full 5 to 6 MW ofplant capacity for the entire year at a cost of$1 million, even though the hospital would haveprovided a benefit to the utility system in the form ofback-up capacity for use by the utility. (The powersystem design would have allowed the hospital to runindependently from the grid during local poweroutages or capacity limits.) The utility was unwilling
to offer a partial credit for the back-up power systemin place at the hospital.
Environmental Permitting
The cogeneration plant at this hospital would havebeen classified as a �major source� of environmentalpollutants. The air permitting process for a �minorsource� cogeneration facility can last six to ninemonths, and for a �major source� the process can lastup to two years. Many customers and vendorsseeking to self-generate are not willing to invest thetime and financial resources in the permitting processitself and the resulting regulations for the installationat their facilities.
Estimated Costs
The annual back-up tariff was to be $1 milliondollars, which was expensive for this project andexpensive on a capacity basis (~$16/kW-month). Thecosts of the environmental testing and permittingprocess were also expected to be quite high�although more difficult to estimate because the cost isprimarily the time spent to address the requirements.
Distributed Generator�s Proposed Solutions
The equipment supplier that we interviewed for thiscase study suggested that the industry regulatorsadopt output-based emission standards to recognizethe benefit of cogeneration in combining generationprocess efficiency and utility as well as reducing fuelconsumption and displacing the pollutants ofinefficient boilers. Such an approach would not onlyrecognize the efficient production of electricity fromthe turbine generator, but also the utility of thecombustion waste heat as it is applied and conservedin its facility. Without this evaluation system, thecustomer is evaluated on the basis of total NOxemissions for the year and emissions at short testintervals to the power produced, without crediting forhigh efficiency provided by the steam and heatrecovery processes.
Utility Position
The utility was contacted and answered severalquestions regarding its position on distributed powerand related issues. The following information is asrelated by the utility representative.
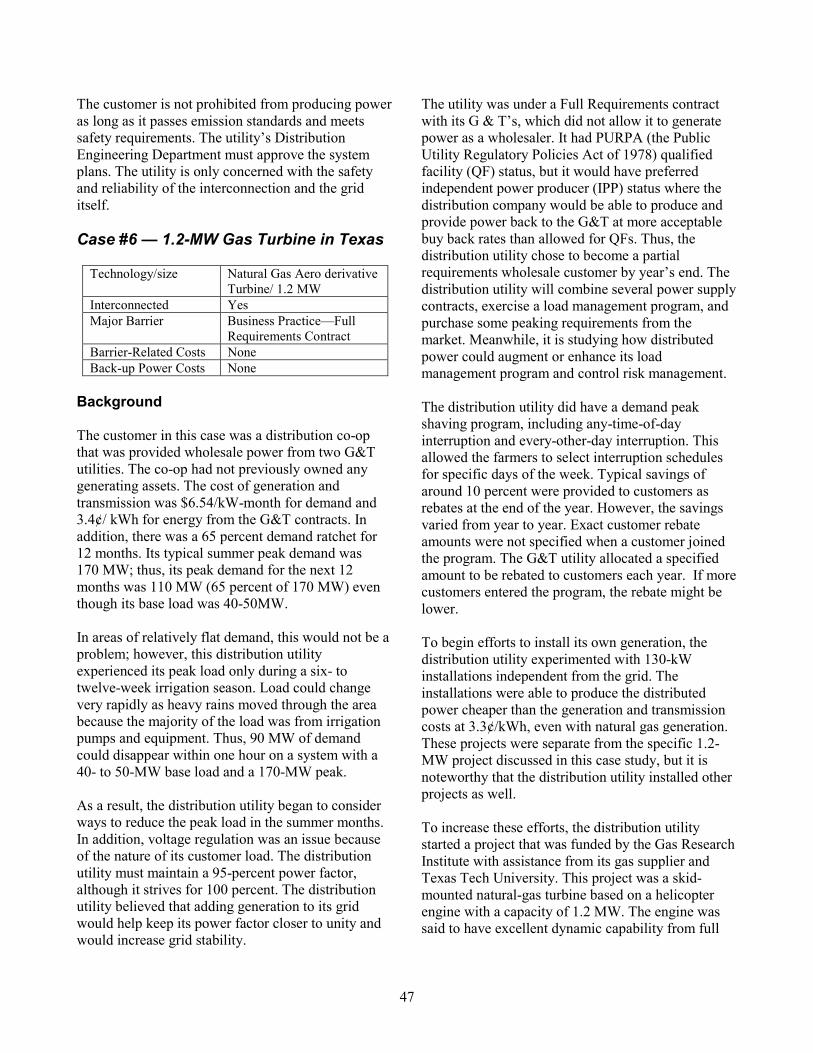
47
The customer is not prohibited from producing poweras long as it passes emission standards and meetssafety requirements. The utility�s DistributionEngineering Department must approve the systemplans. The utility is only concerned with the safetyand reliability of the interconnection and the griditself.
Case #6 � 1.2-MW Gas Turbine in Texas
Technology/size Natural Gas Aero derivativeTurbine/ 1.2 MW
Interconnected YesMajor Barrier Business Practice�Full
Requirements ContractBarrier-Related Costs NoneBack-up Power Costs None
Background
The customer in this case was a distribution co-opthat was provided wholesale power from two G&Tutilities. The co-op had not previously owned anygenerating assets. The cost of generation andtransmission was $6.54/kW-month for demand and3.4¢/ kWh for energy from the G&T contracts. Inaddition, there was a 65 percent demand ratchet for12 months. Its typical summer peak demand was170 MW; thus, its peak demand for the next 12months was 110 MW (65 percent of 170 MW) eventhough its base load was 40-50MW.
In areas of relatively flat demand, this would not be aproblem; however, this distribution utilityexperienced its peak load only during a six- totwelve-week irrigation season. Load could changevery rapidly as heavy rains moved through the areabecause the majority of the load was from irrigationpumps and equipment. Thus, 90 MW of demandcould disappear within one hour on a system with a40- to 50-MW base load and a 170-MW peak.
As a result, the distribution utility began to considerways to reduce the peak load in the summer months.In addition, voltage regulation was an issue becauseof the nature of its customer load. The distributionutility must maintain a 95-percent power factor,although it strives for 100 percent. The distributionutility believed that adding generation to its gridwould help keep its power factor closer to unity andwould increase grid stability.
The utility was under a Full Requirements contractwith its G & T�s, which did not allow it to generatepower as a wholesaler. It had PURPA (the PublicUtility Regulatory Policies Act of 1978) qualifiedfacility (QF) status, but it would have preferredindependent power producer (IPP) status where thedistribution company would be able to produce andprovide power back to the G&T at more acceptablebuy back rates than allowed for QFs. Thus, thedistribution utility chose to become a partialrequirements wholesale customer by year�s end. Thedistribution utility will combine several power supplycontracts, exercise a load management program, andpurchase some peaking requirements from themarket. Meanwhile, it is studying how distributedpower could augment or enhance its loadmanagement program and control risk management.
The distribution utility did have a demand peakshaving program, including any-time-of-dayinterruption and every-other-day interruption. Thisallowed the farmers to select interruption schedulesfor specific days of the week. Typical savings ofaround 10 percent were provided to customers asrebates at the end of the year. However, the savingsvaried from year to year. Exact customer rebateamounts were not specified when a customer joinedthe program. The G&T utility allocated a specifiedamount to be rebated to customers each year. If morecustomers entered the program, the rebate might belower.
To begin efforts to install its own generation, thedistribution utility experimented with 130-kWinstallations independent from the grid. Theinstallations were able to produce the distributedpower cheaper than the generation and transmissioncosts at 3.3¢/kWh, even with natural gas generation.These projects were separate from the specific 1.2-MW project discussed in this case study, but it isnoteworthy that the distribution utility installed otherprojects as well.
To increase these efforts, the distribution utilitystarted a project that was funded by the Gas ResearchInstitute with assistance from its gas supplier andTexas Tech University. This project was a skid-mounted natural-gas turbine based on a helicopterengine with a capacity of 1.2 MW. The engine wassaid to have excellent dynamic capability from full
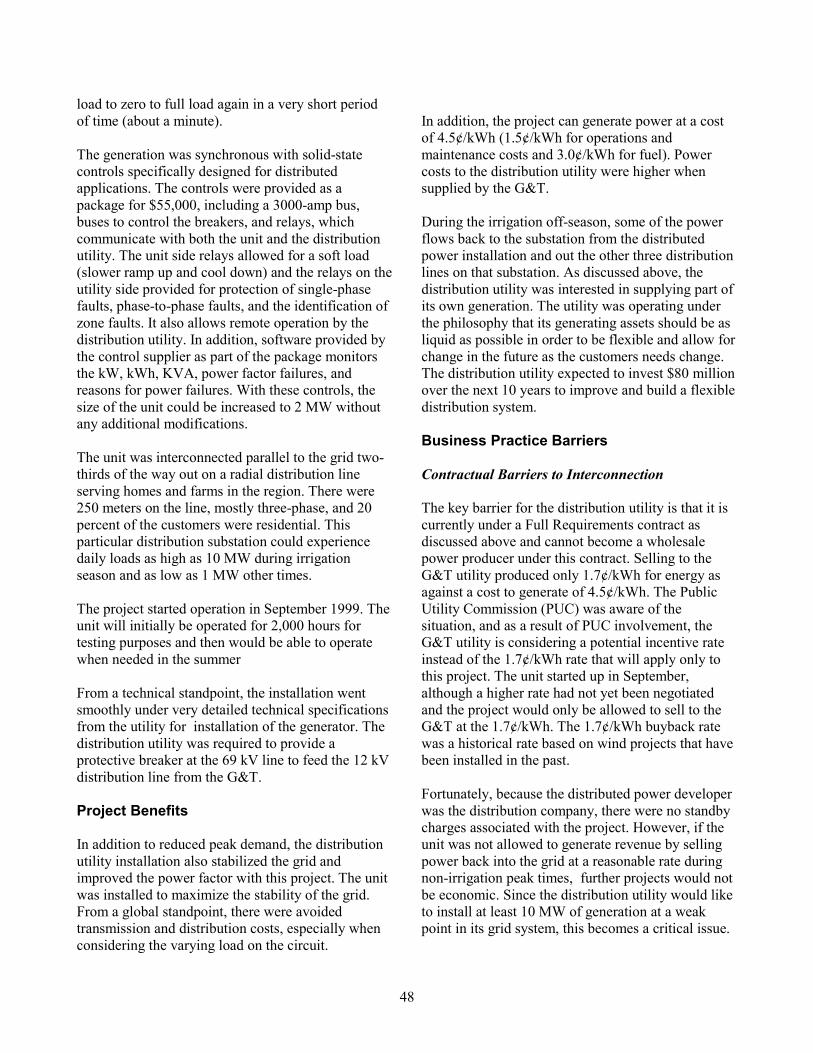
48
load to zero to full load again in a very short periodof time (about a minute).
The generation was synchronous with solid-statecontrols specifically designed for distributedapplications. The controls were provided as apackage for $55,000, including a 3000-amp bus,buses to control the breakers, and relays, whichcommunicate with both the unit and the distributionutility. The unit side relays allowed for a soft load(slower ramp up and cool down) and the relays on theutility side provided for protection of single-phasefaults, phase-to-phase faults, and the identification ofzone faults. It also allows remote operation by thedistribution utility. In addition, software provided bythe control supplier as part of the package monitorsthe kW, kWh, KVA, power factor failures, andreasons for power failures. With these controls, thesize of the unit could be increased to 2 MW withoutany additional modifications.
The unit was interconnected parallel to the grid two-thirds of the way out on a radial distribution lineserving homes and farms in the region. There were250 meters on the line, mostly three-phase, and 20percent of the customers were residential. Thisparticular distribution substation could experiencedaily loads as high as 10 MW during irrigationseason and as low as 1 MW other times.
The project started operation in September 1999. Theunit will initially be operated for 2,000 hours fortesting purposes and then would be able to operatewhen needed in the summer
From a technical standpoint, the installation wentsmoothly under very detailed technical specificationsfrom the utility for installation of the generator. Thedistribution utility was required to provide aprotective breaker at the 69 kV line to feed the 12 kVdistribution line from the G&T.
Project Benefits
In addition to reduced peak demand, the distributionutility installation also stabilized the grid andimproved the power factor with this project. The unitwas installed to maximize the stability of the grid.From a global standpoint, there were avoidedtransmission and distribution costs, especially whenconsidering the varying load on the circuit.
In addition, the project can generate power at a costof 4.5¢/kWh (1.5¢/kWh for operations andmaintenance costs and 3.0¢/kWh for fuel). Powercosts to the distribution utility were higher whensupplied by the G&T.
During the irrigation off-season, some of the powerflows back to the substation from the distributedpower installation and out the other three distributionlines on that substation. As discussed above, thedistribution utility was interested in supplying part ofits own generation. The utility was operating underthe philosophy that its generating assets should be asliquid as possible in order to be flexible and allow forchange in the future as the customers needs change.The distribution utility expected to invest $80 millionover the next 10 years to improve and build a flexibledistribution system.
Business Practice Barriers
Contractual Barriers to Interconnection
The key barrier for the distribution utility is that it iscurrently under a Full Requirements contract asdiscussed above and cannot become a wholesalepower producer under this contract. Selling to theG&T utility produced only 1.7¢/kWh for energy asagainst a cost to generate of 4.5¢/kWh. The PublicUtility Commission (PUC) was aware of thesituation, and as a result of PUC involvement, theG&T utility is considering a potential incentive rateinstead of the 1.7¢/kWh rate that will apply only tothis project. The unit started up in September,although a higher rate had not yet been negotiatedand the project would only be allowed to sell to theG&T at the 1.7¢/kWh. The 1.7¢/kWh buyback ratewas a historical rate based on wind projects that havebeen installed in the past.
Fortunately, because the distributed power developerwas the distribution company, there were no standbycharges associated with the project. However, if theunit was not allowed to generate revenue by sellingpower back into the grid at a reasonable rate duringnon-irrigation peak times, further projects would notbe economic. Since the distribution utility would liketo install at least 10 MW of generation at a weakpoint in its grid system, this becomes a critical issue.
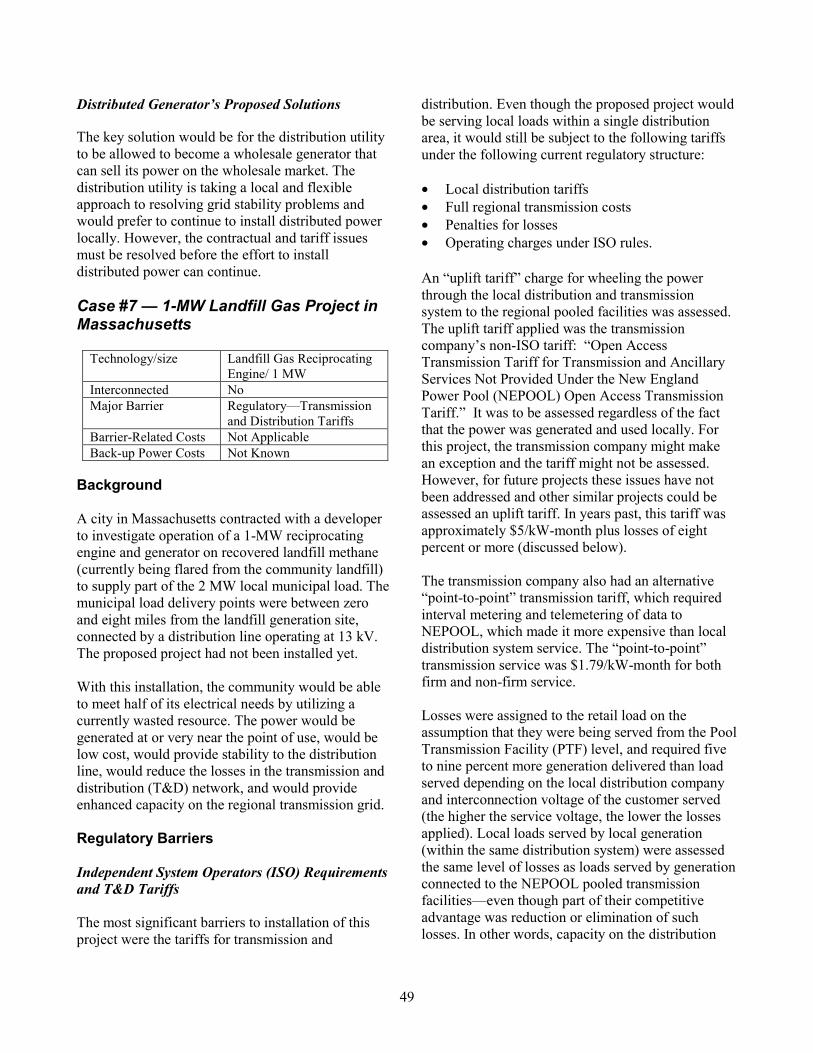
49
Distributed Generator�s Proposed Solutions
The key solution would be for the distribution utilityto be allowed to become a wholesale generator thatcan sell its power on the wholesale market. Thedistribution utility is taking a local and flexibleapproach to resolving grid stability problems andwould prefer to continue to install distributed powerlocally. However, the contractual and tariff issuesmust be resolved before the effort to installdistributed power can continue.
Case #7 � 1-MW Landfill Gas Project inMassachusetts
Technology/size Landfill Gas ReciprocatingEngine/ 1 MW
Interconnected NoMajor Barrier Regulatory�Transmission
and Distribution TariffsBarrier-Related Costs Not ApplicableBack-up Power Costs Not Known
Background
A city in Massachusetts contracted with a developerto investigate operation of a 1-MW reciprocatingengine and generator on recovered landfill methane(currently being flared from the community landfill)to supply part of the 2 MW local municipal load. Themunicipal load delivery points were between zeroand eight miles from the landfill generation site,connected by a distribution line operating at 13 kV.The proposed project had not been installed yet.
With this installation, the community would be ableto meet half of its electrical needs by utilizing acurrently wasted resource. The power would begenerated at or very near the point of use, would below cost, would provide stability to the distributionline, would reduce the losses in the transmission anddistribution (T&D) network, and would provideenhanced capacity on the regional transmission grid.
Regulatory Barriers
Independent System Operators (ISO) Requirementsand T&D Tariffs
The most significant barriers to installation of thisproject were the tariffs for transmission and
distribution. Even though the proposed project wouldbe serving local loads within a single distributionarea, it would still be subject to the following tariffsunder the following current regulatory structure:
• Local distribution tariffs• Full regional transmission costs• Penalties for losses• Operating charges under ISO rules.
An �uplift tariff� charge for wheeling the powerthrough the local distribution and transmissionsystem to the regional pooled facilities was assessed.The uplift tariff applied was the transmissioncompany�s non-ISO tariff: �Open AccessTransmission Tariff for Transmission and AncillaryServices Not Provided Under the New EnglandPower Pool (NEPOOL) Open Access TransmissionTariff.� It was to be assessed regardless of the factthat the power was generated and used locally. Forthis project, the transmission company might makean exception and the tariff might not be assessed.However, for future projects these issues have notbeen addressed and other similar projects could beassessed an uplift tariff. In years past, this tariff wasapproximately $5/kW-month plus losses of eightpercent or more (discussed below).
The transmission company also had an alternative�point-to-point� transmission tariff, which requiredinterval metering and telemetering of data toNEPOOL, which made it more expensive than localdistribution system service. The �point-to-point�transmission service was $1.79/kW-month for bothfirm and non-firm service.
Losses were assigned to the retail load on theassumption that they were being served from the PoolTransmission Facility (PTF) level, and required fiveto nine percent more generation delivered than loadserved depending on the local distribution companyand interconnection voltage of the customer served(the higher the service voltage, the lower the lossesapplied). Local loads served by local generation(within the same distribution system) were assessedthe same level of losses as loads served by generationconnected to the NEPOOL pooled transmissionfacilities�even though part of their competitiveadvantage was reduction or elimination of suchlosses. In other words, capacity on the distribution
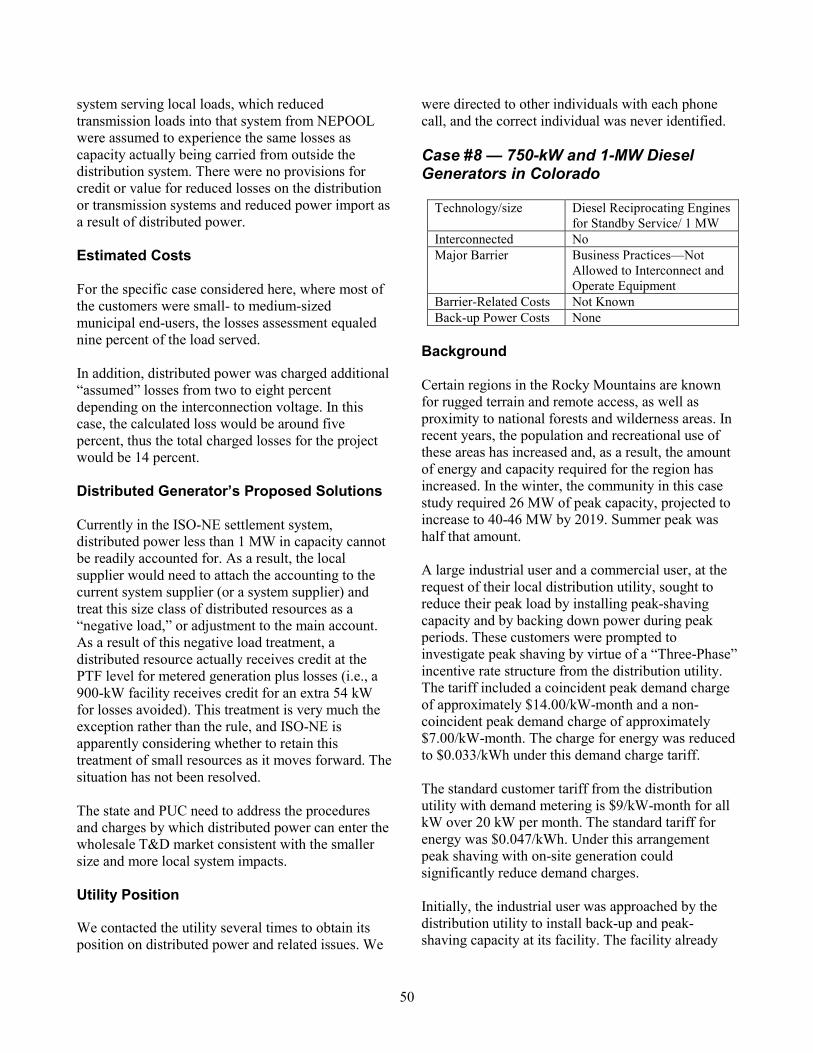
50
system serving local loads, which reducedtransmission loads into that system from NEPOOLwere assumed to experience the same losses ascapacity actually being carried from outside thedistribution system. There were no provisions forcredit or value for reduced losses on the distributionor transmission systems and reduced power import asa result of distributed power.
Estimated Costs
For the specific case considered here, where most ofthe customers were small- to medium-sizedmunicipal end-users, the losses assessment equalednine percent of the load served.
In addition, distributed power was charged additional�assumed� losses from two to eight percentdepending on the interconnection voltage. In thiscase, the calculated loss would be around fivepercent, thus the total charged losses for the projectwould be 14 percent.
Distributed Generator�s Proposed Solutions
Currently in the ISO-NE settlement system,distributed power less than 1 MW in capacity cannotbe readily accounted for. As a result, the localsupplier would need to attach the accounting to thecurrent system supplier (or a system supplier) andtreat this size class of distributed resources as a�negative load,� or adjustment to the main account.As a result of this negative load treatment, adistributed resource actually receives credit at thePTF level for metered generation plus losses (i.e., a900-kW facility receives credit for an extra 54 kWfor losses avoided). This treatment is very much theexception rather than the rule, and ISO-NE isapparently considering whether to retain thistreatment of small resources as it moves forward. Thesituation has not been resolved.
The state and PUC need to address the proceduresand charges by which distributed power can enter thewholesale T&D market consistent with the smallersize and more local system impacts.
Utility Position
We contacted the utility several times to obtain itsposition on distributed power and related issues. We
were directed to other individuals with each phonecall, and the correct individual was never identified.
Case #8 � 750-kW and 1-MW DieselGenerators in Colorado
Technology/size Diesel Reciprocating Enginesfor Standby Service/ 1 MW
Interconnected NoMajor Barrier Business Practices�Not
Allowed to Interconnect andOperate Equipment
Barrier-Related Costs Not KnownBack-up Power Costs None
Background
Certain regions in the Rocky Mountains are knownfor rugged terrain and remote access, as well asproximity to national forests and wilderness areas. Inrecent years, the population and recreational use ofthese areas has increased and, as a result, the amountof energy and capacity required for the region hasincreased. In the winter, the community in this casestudy required 26 MW of peak capacity, projected toincrease to 40-46 MW by 2019. Summer peak washalf that amount.
A large industrial user and a commercial user, at therequest of their local distribution utility, sought toreduce their peak load by installing peak-shavingcapacity and by backing down power during peakperiods. These customers were prompted toinvestigate peak shaving by virtue of a �Three-Phase�incentive rate structure from the distribution utility.The tariff included a coincident peak demand chargeof approximately $14.00/kW-month and a non-coincident peak demand charge of approximately$7.00/kW-month. The charge for energy was reducedto $0.033/kWh under this demand charge tariff.
The standard customer tariff from the distributionutility with demand metering is $9/kW-month for allkW over 20 kW per month. The standard tariff forenergy was $0.047/kWh. Under this arrangementpeak shaving with on-site generation couldsignificantly reduce demand charges.
Initially, the industrial user was approached by thedistribution utility to install back-up and peak-shaving capacity at its facility. The facility already
51
had a small back-up generator. The utility wasinstituting a peak-shaving incentive program thatwould allow it to reduce its overall peak wholesalepurchases under its all requirements contract with theG&T. A letter from the distribution utility to thecustomer outlining the rate tariff for the pilotprogram initially described a rate tariff of $3.50/kW-month for non-coincident peak, $14.62/kW-monthfor coincident peak, and $0.048/kWh for energy.In November 1995, the customer purchased andinstalled a 1-MW diesel generator in accordance withthe distribution utility program.
The utility imposed control requirements. Thegenerator was equipped with an automatic transferswitch, allowing the generator to be started andtransferred from a remote location. The distributionutility notified the plant 15 minutes before each peakshaving event. The utility starts and stops thegenerator remotely via a signal sent directly over thepower lines. The generator was operated a maximumof 10 hours per month, and only during timesrequested by the utility. The transfer switch does notallow parallel operation.
The commercial user was also approached by theutility to enter the incentive program. The incentiveprogram was already in place at the other industrialfacility described above and the rate tariff waspublished. The commercial facility typically had apeak load of 1.2 MW but could reduce that load to700 kW at any given time using load shedding andscheduling techniques (primarily for large chillerunits).
Business Practice Barriers
Procedural Impediments to Interconnection
The agreement between the industrial facility and theutility began as an informal verbal agreement. At thetime, an incentive rate tariff was not actuallypublished by the utility. In exchange for installationof the generator, the utility�s letter offer stated theindustrial facility would be eligible for the $3.50/kW-month incentive rate during non-coincident peakdemand hours. Based on that representation, thecustomer purchased a generator in November 1995 ata cost of $350,000. The customer never entered amore formal contract with the utility. In March 1996,another utility representative approached the
customer with a second proposal and a non-coincident peak rate of $6.72/kW-month. The reasonoffered for the rate change was the settlement of thedistribution utility�s rate case that included lessfavorable rates. Notwithstanding the substantialinvestment based on the lower represented rate, theutility instituted the higher demand charge incentivetariff.
Even so, there was a delay in implementing the lessadvantageous tariff, which took effect in June 1996,six months after the customer�s capital investment.The savings for the first period from June 18 toAugust 6, 1996, was $5,783.
Not Allowed to Operate in Parallel
The industrial customer made an investment in a 1-MW generator on a site with a monthly peak demandtypically between 250 to 350 kW. Even with plannedexpansions, the monthly peak demand of thiscustomer will not exceed 500 kW. The customersought to operate the generator in parallel with theutility system to provide capacity during critical peakperiods. This was not allowed by the utility. Thecommercial customer likewise had a 750-kW back-up generator. It also sought to operate the unit inparallel to the utility system. However, the utility didnot allow for parallel operation and prevented use ofeither generator for peak shaving capability, exceptas controlled to operate by the utility.
Reduced Peak Shaving Under Utility Control
Changes in the program reduced savings severaltimes. The distribution utility uses remote control toshed the customer load when it elects to do so. Thesavings to the customer result only when the loadshedding coincides with the G&T system peak,which the distribution utility does not know untilafter the fact. The utility has control over the decisionto shed peak demand from both the industrial andcommercial customers. It is not obligated to reducethe load; therefore, these customers are billed highercoincident peak demand charges if the utility electsnot to shave the peak. The choice is the utility�s, thusthese customers are not able to maximize theirinvestment return.
Originally, the commercial customer was saving asmuch as $7,000 per month. After several months of
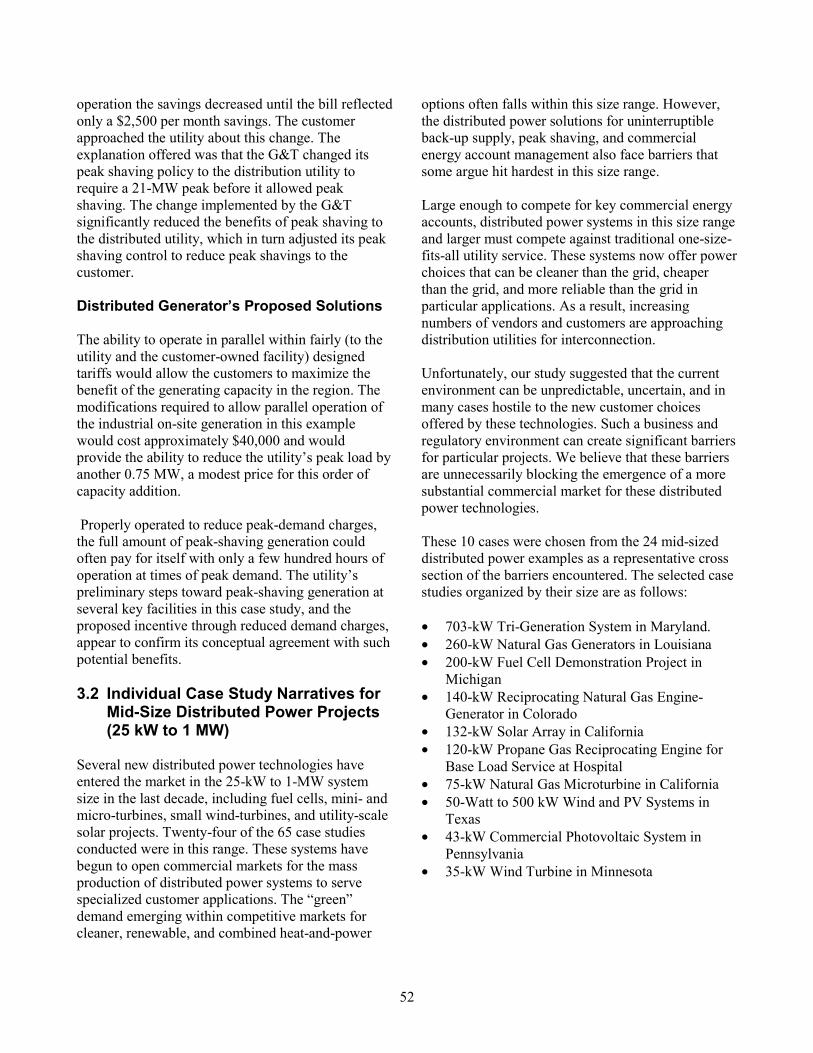
52
operation the savings decreased until the bill reflectedonly a $2,500 per month savings. The customerapproached the utility about this change. Theexplanation offered was that the G&T changed itspeak shaving policy to the distribution utility torequire a 21-MW peak before it allowed peakshaving. The change implemented by the G&Tsignificantly reduced the benefits of peak shaving tothe distributed utility, which in turn adjusted its peakshaving control to reduce peak shavings to thecustomer.
Distributed Generator�s Proposed Solutions
The ability to operate in parallel within fairly (to theutility and the customer-owned facility) designedtariffs would allow the customers to maximize thebenefit of the generating capacity in the region. Themodifications required to allow parallel operation ofthe industrial on-site generation in this examplewould cost approximately $40,000 and wouldprovide the ability to reduce the utility�s peak load byanother 0.75 MW, a modest price for this order ofcapacity addition.
Properly operated to reduce peak-demand charges,the full amount of peak-shaving generation couldoften pay for itself with only a few hundred hours ofoperation at times of peak demand. The utility�spreliminary steps toward peak-shaving generation atseveral key facilities in this case study, and theproposed incentive through reduced demand charges,appear to confirm its conceptual agreement with suchpotential benefits.
3.2 Individual Case Study Narratives forMid-Size Distributed Power Projects(25 kW to 1 MW)
Several new distributed power technologies haveentered the market in the 25-kW to 1-MW systemsize in the last decade, including fuel cells, mini- andmicro-turbines, small wind-turbines, and utility-scalesolar projects. Twenty-four of the 65 case studiesconducted were in this range. These systems havebegun to open commercial markets for the massproduction of distributed power systems to servespecialized customer applications. The �green�demand emerging within competitive markets forcleaner, renewable, and combined heat-and-power
options often falls within this size range. However,the distributed power solutions for uninterruptibleback-up supply, peak shaving, and commercialenergy account management also face barriers thatsome argue hit hardest in this size range.
Large enough to compete for key commercial energyaccounts, distributed power systems in this size rangeand larger must compete against traditional one-size-fits-all utility service. These systems now offer powerchoices that can be cleaner than the grid, cheaperthan the grid, and more reliable than the grid inparticular applications. As a result, increasingnumbers of vendors and customers are approachingdistribution utilities for interconnection.
Unfortunately, our study suggested that the currentenvironment can be unpredictable, uncertain, and inmany cases hostile to the new customer choicesoffered by these technologies. Such a business andregulatory environment can create significant barriersfor particular projects. We believe that these barriersare unnecessarily blocking the emergence of a moresubstantial commercial market for these distributedpower technologies.
These 10 cases were chosen from the 24 mid-sizeddistributed power examples as a representative crosssection of the barriers encountered. The selected casestudies organized by their size are as follows:
• 703-kW Tri-Generation System in Maryland.• 260-kW Natural Gas Generators in Louisiana• 200-kW Fuel Cell Demonstration Project in
Michigan• 140-kW Reciprocating Natural Gas Engine-
Generator in Colorado• 132-kW Solar Array in California• 120-kW Propane Gas Reciprocating Engine for
Base Load Service at Hospital• 75-kW Natural Gas Microturbine in California• 50-Watt to 500 kW Wind and PV Systems in
Texas• 43-kW Commercial Photovoltaic System in
Pennsylvania• 35-kW Wind Turbine in Minnesota
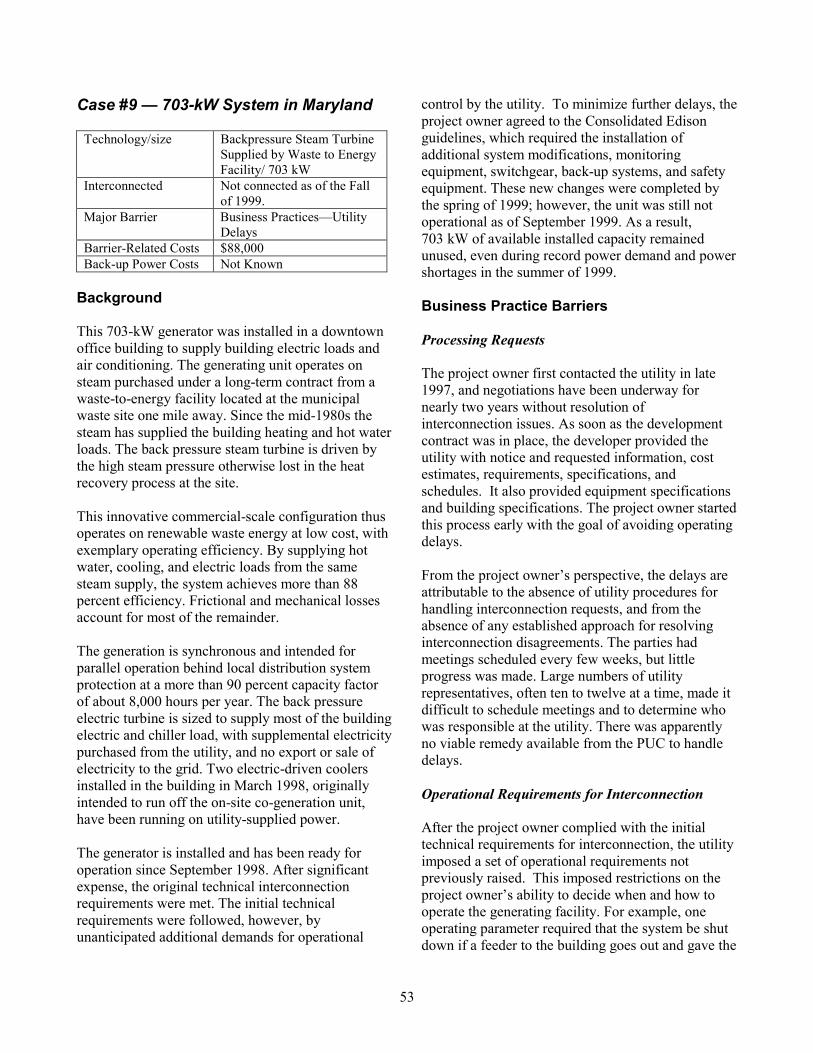
53
Case #9 � 703-kW System in Maryland
Technology/size Backpressure Steam TurbineSupplied by Waste to EnergyFacility/ 703 kW
Interconnected Not connected as of the Fallof 1999.
Major Barrier Business Practices�UtilityDelays
Barrier-Related Costs $88,000Back-up Power Costs Not Known
Background
This 703-kW generator was installed in a downtownoffice building to supply building electric loads andair conditioning. The generating unit operates onsteam purchased under a long-term contract from awaste-to-energy facility located at the municipalwaste site one mile away. Since the mid-1980s thesteam has supplied the building heating and hot waterloads. The back pressure steam turbine is driven bythe high steam pressure otherwise lost in the heatrecovery process at the site.
This innovative commercial-scale configuration thusoperates on renewable waste energy at low cost, withexemplary operating efficiency. By supplying hotwater, cooling, and electric loads from the samesteam supply, the system achieves more than 88percent efficiency. Frictional and mechanical lossesaccount for most of the remainder.
The generation is synchronous and intended forparallel operation behind local distribution systemprotection at a more than 90 percent capacity factorof about 8,000 hours per year. The back pressureelectric turbine is sized to supply most of the buildingelectric and chiller load, with supplemental electricitypurchased from the utility, and no export or sale ofelectricity to the grid. Two electric-driven coolersinstalled in the building in March 1998, originallyintended to run off the on-site co-generation unit,have been running on utility-supplied power.
The generator is installed and has been ready foroperation since September 1998. After significantexpense, the original technical interconnectionrequirements were met. The initial technicalrequirements were followed, however, byunanticipated additional demands for operational
control by the utility. To minimize further delays, theproject owner agreed to the Consolidated Edisonguidelines, which required the installation ofadditional system modifications, monitoringequipment, switchgear, back-up systems, and safetyequipment. These new changes were completed bythe spring of 1999; however, the unit was still notoperational as of September 1999. As a result,703 kW of available installed capacity remainedunused, even during record power demand and powershortages in the summer of 1999.
Business Practice Barriers
Processing Requests
The project owner first contacted the utility in late1997, and negotiations have been underway fornearly two years without resolution ofinterconnection issues. As soon as the developmentcontract was in place, the developer provided theutility with notice and requested information, costestimates, requirements, specifications, andschedules. It also provided equipment specificationsand building specifications. The project owner startedthis process early with the goal of avoiding operatingdelays.
From the project owner�s perspective, the delays areattributable to the absence of utility procedures forhandling interconnection requests, and from theabsence of any established approach for resolvinginterconnection disagreements. The parties hadmeetings scheduled every few weeks, but littleprogress was made. Large numbers of utilityrepresentatives, often ten to twelve at a time, made itdifficult to schedule meetings and to determine whowas responsible at the utility. There was apparentlyno viable remedy available from the PUC to handledelays.
Operational Requirements for Interconnection
After the project owner complied with the initialtechnical requirements for interconnection, the utilityimposed a set of operational requirements notpreviously raised. This imposed restrictions on theproject owner�s ability to decide when and how tooperate the generating facility. For example, oneoperating parameter required that the system be shutdown if a feeder to the building goes out and gave the
54
utility further control over the operation of thesystem. Utility control of this small system wascontrary to the primary purpose of the system tooptimize energy production for the customer location.Shutting the system down when part of the grid is outeliminates the secondary customer value of reliableback-up power. The additional operating demandswere unexpected. The expenditures forinterconnection and safety equipment wereincorporated for the purpose of allowing the buildingsystem to operate independently of the grid whensuch operation was beneficial to the utility. There areat present no standards or references for determiningstandard practice or reasonable operating parameters.The utility requested the right to control how andwhen to run the equipment, as it might for a muchlarger, utility-owned resource.
Technical Barriers
Network Protection Requirements
Electric service to the building is provided by anetwork distribution system, which serves the City ofBaltimore. Rather than a radial feed from a localdistribution substation, the building is served by three13.8-kV distribution feeders. Accordingly, the systemrequires protection for the network rather thanprotection for a single radial feeder.
Perhaps because this was the first distributed-powersystem of its type in Baltimore, the utility appeared tobe unfamiliar with network interconnection issuesand expressed concern that reverse flows within thenetwork could create system outages over a broaderarea. The utility requested a custom engineeringdesign to protect the network from the installation. Ina network distribution system, protective measuresseek to isolate one feeder at a time to allow thenetwork to continue to operate through the remainingfeeders. The project owner paid for $44,000 in feesincurred by consultants for the utility to design therequested network protection. Upon completion, theutility expressed dissatisfaction with the result, andthe effort started anew.
The consultants then suggested that the project adoptexisting guidelines developed by ConsolidatedEdison in New York City, which also uses a networkdistribution system. These guidelines wereburdensome and expensive given the size of the
installation, but were presented by the utilityconsultants as a way to speed up the interconnectionprocess. To minimize further delays, the projectowner agreed to the Consolidated Edison guidelines,which required the installation of additional systemmodifications, monitoring equipment, switchgear,back-up systems, and safety equipment.
Estimated Costs
The direct costs incurred in meeting theinterconnection standards were $88,000. These costsdo not include costs associated with the delays,including the loss of energy savings and return oninvestment.
Utility Position
The utility was contacted and answered severalquestions regarding its position on distributed powerand related issues. The following information is asrelated by the utility representative.
The utility currently has established contacts andstandard procedures in place to deal with distributedpower applications, but wishes to improve on theseprocedures and be proactive rather than reactive onthis issue. The utility anticipates growing interest indistributed power.
The utility recognizes and accepts the UL label, butwill test at the customer�s expense any �custom�packages, which vary from its preferred packages.The utility has engineers who are involved inongoing IEEE activities to develop nationalstandards.
The utility noted that distributed power issues arecurrently being reviewed by the state regulatorycommission, and changes to its program are likely asa result of these discussions. For example anycustomer (with an installation smaller than 80 MW)who has a contract in place by September 1999 canavoid any stranded-cost charges in the future. Futurecustomers will likely be charged for stranded-costrecovery, although the utility does not know at thistime what these stranded costs will be. Legislationmay result in individual contracts with applicablefees or customer specific cases to recover recentequipment upgrades that would no longer berecoverable in the rate base.
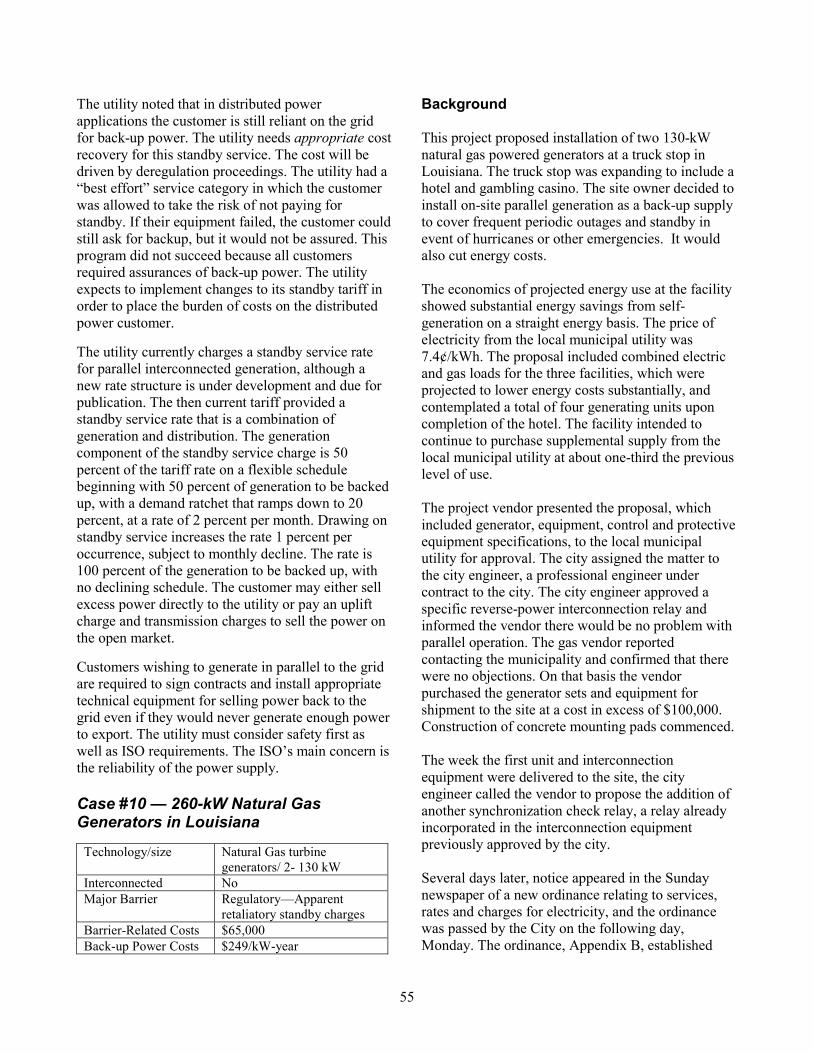
55
The utility noted that in distributed powerapplications the customer is still reliant on the gridfor back-up power. The utility needs appropriate costrecovery for this standby service. The cost will bedriven by deregulation proceedings. The utility had a�best effort� service category in which the customerwas allowed to take the risk of not paying forstandby. If their equipment failed, the customer couldstill ask for backup, but it would not be assured. Thisprogram did not succeed because all customersrequired assurances of back-up power. The utilityexpects to implement changes to its standby tariff inorder to place the burden of costs on the distributedpower customer.
The utility currently charges a standby service ratefor parallel interconnected generation, although anew rate structure is under development and due forpublication. The then current tariff provided astandby service rate that is a combination ofgeneration and distribution. The generationcomponent of the standby service charge is 50percent of the tariff rate on a flexible schedulebeginning with 50 percent of generation to be backedup, with a demand ratchet that ramps down to 20percent, at a rate of 2 percent per month. Drawing onstandby service increases the rate 1 percent peroccurrence, subject to monthly decline. The rate is100 percent of the generation to be backed up, withno declining schedule. The customer may either sellexcess power directly to the utility or pay an upliftcharge and transmission charges to sell the power onthe open market.
Customers wishing to generate in parallel to the gridare required to sign contracts and install appropriatetechnical equipment for selling power back to thegrid even if they would never generate enough powerto export. The utility must consider safety first aswell as ISO requirements. The ISO�s main concern isthe reliability of the power supply.
Case #10 � 260-kW Natural GasGenerators in Louisiana
Technology/size Natural Gas turbinegenerators/ 2- 130 kW
Interconnected NoMajor Barrier Regulatory�Apparent
retaliatory standby chargesBarrier-Related Costs $65,000Back-up Power Costs $249/kW-year
Background
This project proposed installation of two 130-kWnatural gas powered generators at a truck stop inLouisiana. The truck stop was expanding to include ahotel and gambling casino. The site owner decided toinstall on-site parallel generation as a back-up supplyto cover frequent periodic outages and standby inevent of hurricanes or other emergencies. It wouldalso cut energy costs.
The economics of projected energy use at the facilityshowed substantial energy savings from self-generation on a straight energy basis. The price ofelectricity from the local municipal utility was7.4¢/kWh. The proposal included combined electricand gas loads for the three facilities, which wereprojected to lower energy costs substantially, andcontemplated a total of four generating units uponcompletion of the hotel. The facility intended tocontinue to purchase supplemental supply from thelocal municipal utility at about one-third the previouslevel of use.
The project vendor presented the proposal, whichincluded generator, equipment, control and protectiveequipment specifications, to the local municipalutility for approval. The city assigned the matter tothe city engineer, a professional engineer undercontract to the city. The city engineer approved aspecific reverse-power interconnection relay andinformed the vendor there would be no problem withparallel operation. The gas vendor reportedcontacting the municipality and confirmed that therewere no objections. On that basis the vendorpurchased the generator sets and equipment forshipment to the site at a cost in excess of $100,000.Construction of concrete mounting pads commenced.
The week the first unit and interconnectionequipment were delivered to the site, the cityengineer called the vendor to propose the addition ofanother synchronization check relay, a relay alreadyincorporated in the interconnection equipmentpreviously approved by the city.
Several days later, notice appeared in the Sundaynewspaper of a new ordinance relating to services,rates and charges for electricity, and the ordinancewas passed by the City on the following day,Monday. The ordinance, Appendix B, established
56
conditions for �Customers who have installedequipment and self generate their own primaryelectric services.� The ordinance prohibited paralleloperation altogether and established a StandbyService tariff not previously in existence, whichincluded demand and energy charges. The demandcharges equaled $10.00 per kilowatt-month for thefirst 15 kW and $8.00 per kilowatt-month above 15kW with a twelve-month ratchet at 75 percent of thatcharge. The ordinance included a flat monthly fee fortransformers installed, based on the size calculated at$2.00 per KVA. Finally the ordinance includedpower-factor minimums for any customer takingservice and included rate increases for lagging powerfactors within the minimum acceptable range.
When contacted regarding the proposed installation,the city provided an �Example Standby Customer�sMonthly Bill� to illustrate the bill amounts thatwould result to the facility for supplemental andstandby power following installation of the on-sitegeneration. The standby rate resulted in asupplemental bill, for one-third the power previouslyconsumed, roughly equal to the current bill for fulluse. The standby rate applied to full supply during amonth in which the generators were not operated. Itwas about double the current bill and addedcontinuing monthly demand charge for the next 11months.
The new standby service ordinance resulted in theproject being abandoned, with losses borne by thevendors.
Regulatory Barriers
Ordinance Prohibiting Parallel Operation
The developer�s investigation into the origin of thenew ordinance prohibiting parallel connection of self-generation revealed that the city�s wholesale supplierinstructed the city to block the proposed customerself-generation. The wholesale supplier, a local G&TCooperative, reportedly informed the city that self-generation threatens the future of the utility andwould result in higher wholesale rates to the City.The G&T apparently drafted the new standby serviceordinance to block the proposed self-generation, andthe City passed it to stop the project, which it did. Atthe same time, the city�s consulting engineer wasgiven notice that he could no longer serve as the city
engineer if he provided any private consulting to theproject.
Standby Tariff
Using the demand and energy charges contained inthe new Standby Tariff, the city calculated the truckstop�s utility bill for 25,000 kWh of supplementalpower under the newly enacted tariff at $5,400, ascompared to a standard bill for 80,000 kWh of$6,000. The increase resulted from calculation ofdemand and energy charges imposed by the standbyservice tariff. The higher tariff is applied to the loadbased on the existence of �installed equipment,�independent of load profile. A customer withequivalent energy usage and profile without suchequipment on-site would presumably continue toreceive bills under the standard tariff.
The stand-by tariff adopted resulted in a significantaddition to the projected cost of electricity. Thisoffset the energy savings from on-site generation, andthus rendered the project uneconomic.
Estimated Costs
The actions taken by the city after its initial approvalresulted in project losses being borne by the vendors,which included the engine supplier, the gas supplier,the operations control vendor, and the projectcontractor. The time of each, valued at $50 per hour,amounts to losses in excess of $10,000. Also, basedon initial city approval, the project contractor hadpurchased two new engine-generator combinations,one of which was already on site. The contractorexpended more than $100,000 in purchasing theequipment, some portion of which will be recoveredby reassembling the systems for other installations.
In addition, the customer lost the energy savings thatcould have been realized with self-generation. Acomparison of energy costs from on-site generationwith the retail utility price indicates a loss on theorder of $5,000 per month.
Utility Position
The utility was contacted regarding their position ondistributed power and the proposed project. Theutility representative responded that the utility wasnot interested in answering questions.
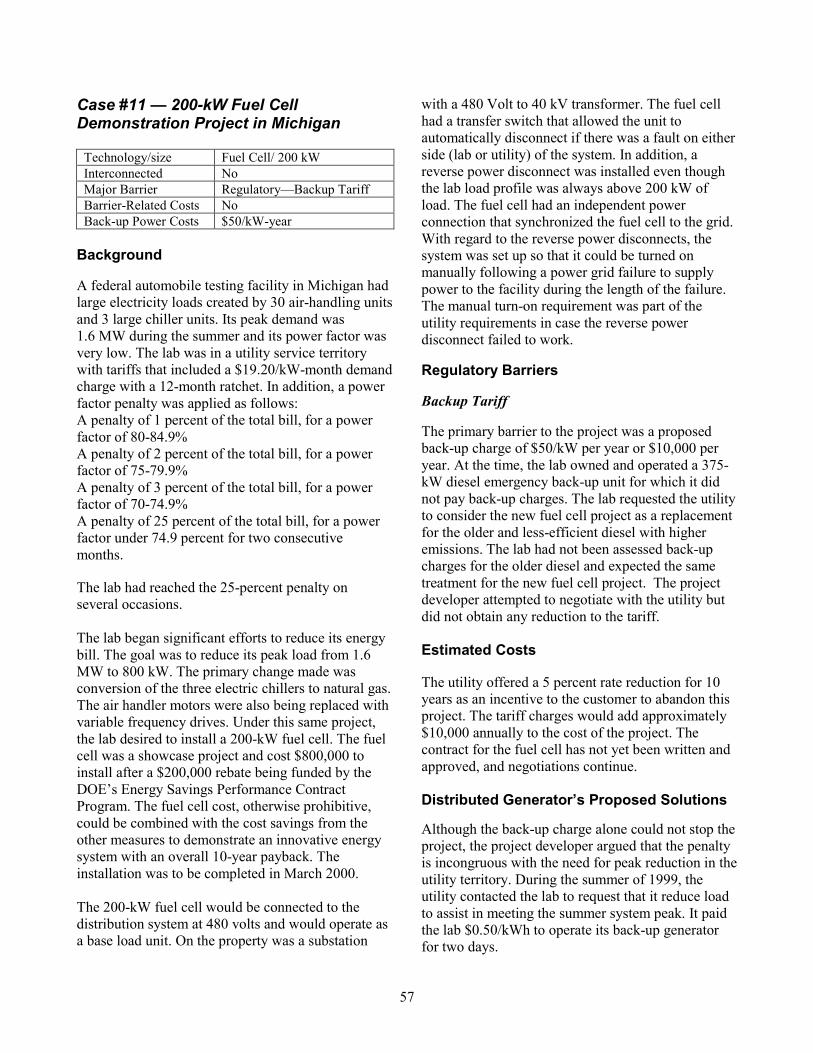
57
Case #11 � 200-kW Fuel CellDemonstration Project in Michigan
Technology/size Fuel Cell/ 200 kWInterconnected NoMajor Barrier Regulatory�Backup TariffBarrier-Related Costs NoBack-up Power Costs $50/kW-year
Background
A federal automobile testing facility in Michigan hadlarge electricity loads created by 30 air-handling unitsand 3 large chiller units. Its peak demand was1.6 MW during the summer and its power factor wasvery low. The lab was in a utility service territorywith tariffs that included a $19.20/kW-month demandcharge with a 12-month ratchet. In addition, a powerfactor penalty was applied as follows:A penalty of 1 percent of the total bill, for a powerfactor of 80-84.9%A penalty of 2 percent of the total bill, for a powerfactor of 75-79.9%A penalty of 3 percent of the total bill, for a powerfactor of 70-74.9%A penalty of 25 percent of the total bill, for a powerfactor under 74.9 percent for two consecutivemonths.
The lab had reached the 25-percent penalty onseveral occasions.
The lab began significant efforts to reduce its energybill. The goal was to reduce its peak load from 1.6MW to 800 kW. The primary change made wasconversion of the three electric chillers to natural gas.The air handler motors were also being replaced withvariable frequency drives. Under this same project,the lab desired to install a 200-kW fuel cell. The fuelcell was a showcase project and cost $800,000 toinstall after a $200,000 rebate being funded by theDOE�s Energy Savings Performance ContractProgram. The fuel cell cost, otherwise prohibitive,could be combined with the cost savings from theother measures to demonstrate an innovative energysystem with an overall 10-year payback. Theinstallation was to be completed in March 2000.
The 200-kW fuel cell would be connected to thedistribution system at 480 volts and would operate asa base load unit. On the property was a substation
with a 480 Volt to 40 kV transformer. The fuel cellhad a transfer switch that allowed the unit toautomatically disconnect if there was a fault on eitherside (lab or utility) of the system. In addition, areverse power disconnect was installed even thoughthe lab load profile was always above 200 kW ofload. The fuel cell had an independent powerconnection that synchronized the fuel cell to the grid.With regard to the reverse power disconnects, thesystem was set up so that it could be turned onmanually following a power grid failure to supplypower to the facility during the length of the failure.The manual turn-on requirement was part of theutility requirements in case the reverse powerdisconnect failed to work.
Regulatory Barriers
Backup Tariff
The primary barrier to the project was a proposedback-up charge of $50/kW per year or $10,000 peryear. At the time, the lab owned and operated a 375-kW diesel emergency back-up unit for which it didnot pay back-up charges. The lab requested the utilityto consider the new fuel cell project as a replacementfor the older and less-efficient diesel with higheremissions. The lab had not been assessed back-upcharges for the older diesel and expected the sametreatment for the new fuel cell project. The projectdeveloper attempted to negotiate with the utility butdid not obtain any reduction to the tariff.
Estimated Costs
The utility offered a 5 percent rate reduction for 10years as an incentive to the customer to abandon thisproject. The tariff charges would add approximately$10,000 annually to the cost of the project. Thecontract for the fuel cell has not yet been written andapproved, and negotiations continue.
Distributed Generator�s Proposed Solutions
Although the back-up charge alone could not stop theproject, the project developer argued that the penaltyis incongruous with the need for peak reduction in theutility territory. During the summer of 1999, theutility contacted the lab to request that it reduce loadto assist in meeting the summer system peak. It paidthe lab $0.50/kWh to operate its back-up generatorfor two days.
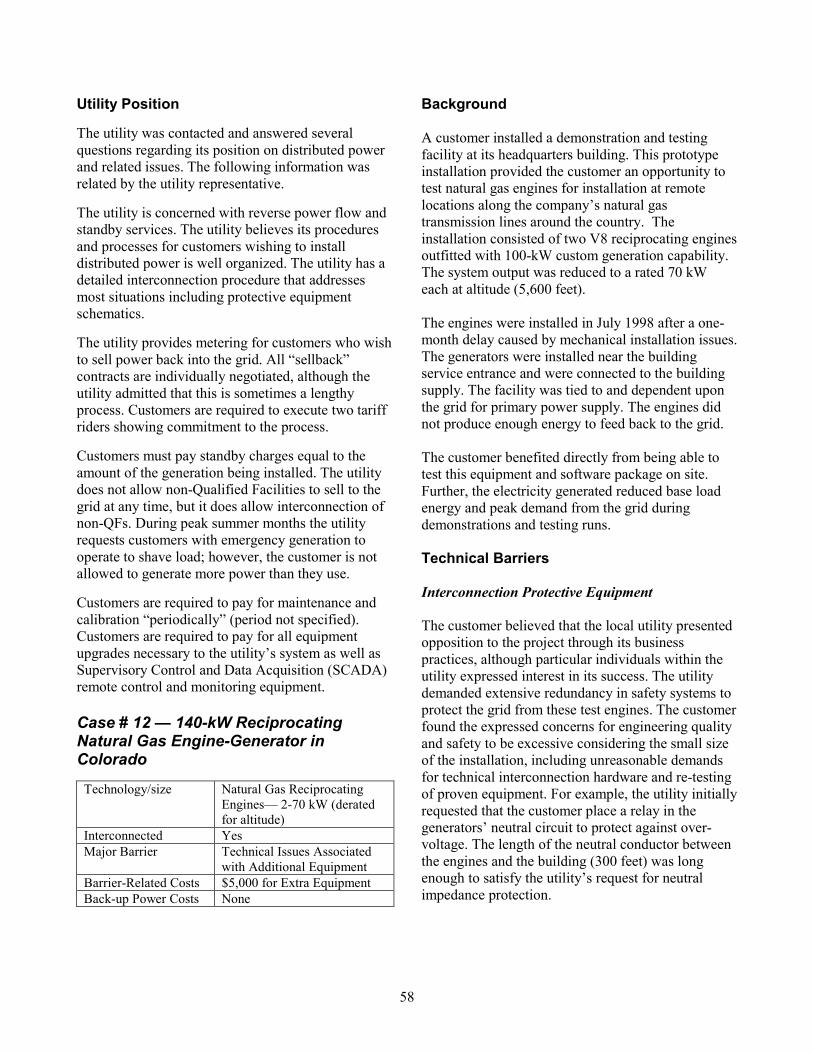
58
Utility Position
The utility was contacted and answered severalquestions regarding its position on distributed powerand related issues. The following information wasrelated by the utility representative.
The utility is concerned with reverse power flow andstandby services. The utility believes its proceduresand processes for customers wishing to installdistributed power is well organized. The utility has adetailed interconnection procedure that addressesmost situations including protective equipmentschematics.
The utility provides metering for customers who wishto sell power back into the grid. All �sellback�contracts are individually negotiated, although theutility admitted that this is sometimes a lengthyprocess. Customers are required to execute two tariffriders showing commitment to the process.
Customers must pay standby charges equal to theamount of the generation being installed. The utilitydoes not allow non-Qualified Facilities to sell to thegrid at any time, but it does allow interconnection ofnon-QFs. During peak summer months the utilityrequests customers with emergency generation tooperate to shave load; however, the customer is notallowed to generate more power than they use.
Customers are required to pay for maintenance andcalibration �periodically� (period not specified).Customers are required to pay for all equipmentupgrades necessary to the utility�s system as well asSupervisory Control and Data Acquisition (SCADA)remote control and monitoring equipment.
Case # 12 � 140-kW ReciprocatingNatural Gas Engine-Generator inColorado
Technology/size Natural Gas ReciprocatingEngines� 2-70 kW (deratedfor altitude)
Interconnected YesMajor Barrier Technical Issues Associated
with Additional EquipmentBarrier-Related Costs $5,000 for Extra EquipmentBack-up Power Costs None
Background
A customer installed a demonstration and testingfacility at its headquarters building. This prototypeinstallation provided the customer an opportunity totest natural gas engines for installation at remotelocations along the company�s natural gastransmission lines around the country. Theinstallation consisted of two V8 reciprocating enginesoutfitted with 100-kW custom generation capability.The system output was reduced to a rated 70 kWeach at altitude (5,600 feet).
The engines were installed in July 1998 after a one-month delay caused by mechanical installation issues.The generators were installed near the buildingservice entrance and were connected to the buildingsupply. The facility was tied to and dependent uponthe grid for primary power supply. The engines didnot produce enough energy to feed back to the grid.
The customer benefited directly from being able totest this equipment and software package on site.Further, the electricity generated reduced base loadenergy and peak demand from the grid duringdemonstrations and testing runs.
Technical Barriers
Interconnection Protective Equipment
The customer believed that the local utility presentedopposition to the project through its businesspractices, although particular individuals within theutility expressed interest in its success. The utilitydemanded extensive redundancy in safety systems toprotect the grid from these test engines. The customerfound the expressed concerns for engineering qualityand safety to be excessive considering the small sizeof the installation, including unreasonable demandsfor technical interconnection hardware and re-testingof proven equipment. For example, the utility initiallyrequested that the customer place a relay in thegenerators� neutral circuit to protect against over-voltage. The length of the neutral conductor betweenthe engines and the building (300 feet) was longenough to satisfy the utility�s request for neutralimpedance protection.
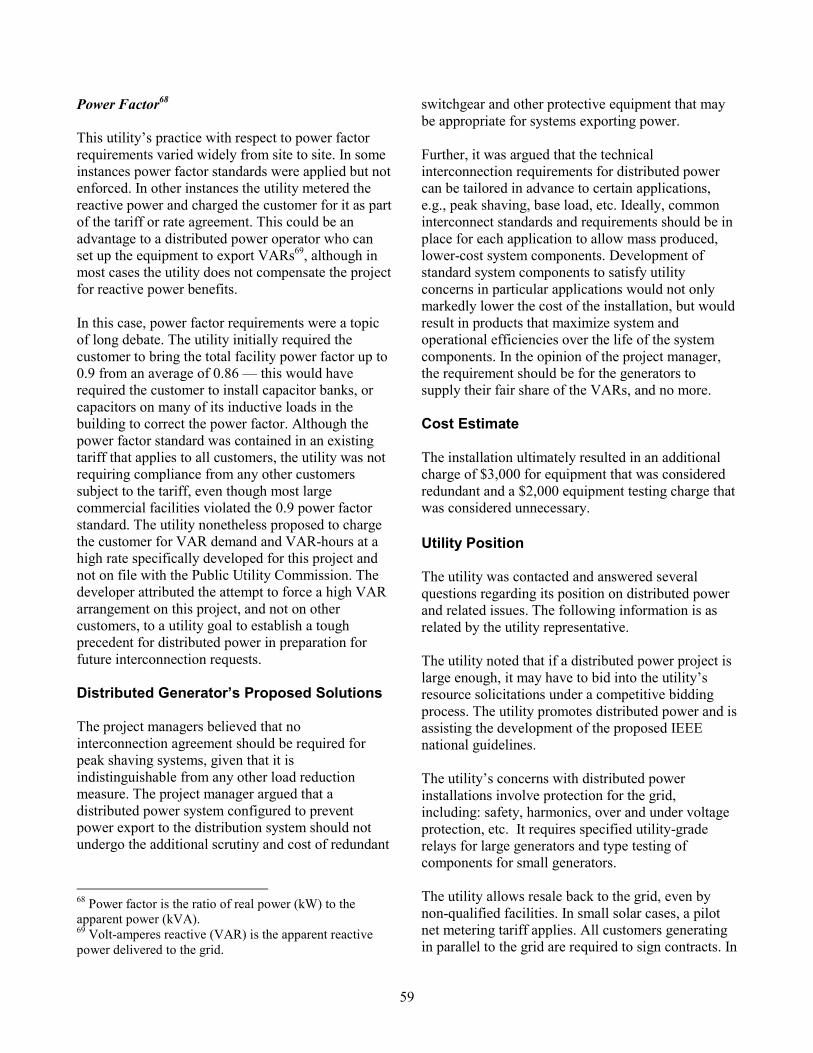
59
Power Factor68
This utility�s practice with respect to power factorrequirements varied widely from site to site. In someinstances power factor standards were applied but notenforced. In other instances the utility metered thereactive power and charged the customer for it as partof the tariff or rate agreement. This could be anadvantage to a distributed power operator who canset up the equipment to export VARs69, although inmost cases the utility does not compensate the projectfor reactive power benefits.
In this case, power factor requirements were a topicof long debate. The utility initially required thecustomer to bring the total facility power factor up to0.9 from an average of 0.86 � this would haverequired the customer to install capacitor banks, orcapacitors on many of its inductive loads in thebuilding to correct the power factor. Although thepower factor standard was contained in an existingtariff that applies to all customers, the utility was notrequiring compliance from any other customerssubject to the tariff, even though most largecommercial facilities violated the 0.9 power factorstandard. The utility nonetheless proposed to chargethe customer for VAR demand and VAR-hours at ahigh rate specifically developed for this project andnot on file with the Public Utility Commission. Thedeveloper attributed the attempt to force a high VARarrangement on this project, and not on othercustomers, to a utility goal to establish a toughprecedent for distributed power in preparation forfuture interconnection requests.
Distributed Generator�s Proposed Solutions
The project managers believed that nointerconnection agreement should be required forpeak shaving systems, given that it isindistinguishable from any other load reductionmeasure. The project manager argued that adistributed power system configured to preventpower export to the distribution system should notundergo the additional scrutiny and cost of redundant
68 Power factor is the ratio of real power (kW) to theapparent power (kVA).69 Volt-amperes reactive (VAR) is the apparent reactivepower delivered to the grid.
switchgear and other protective equipment that maybe appropriate for systems exporting power.
Further, it was argued that the technicalinterconnection requirements for distributed powercan be tailored in advance to certain applications,e.g., peak shaving, base load, etc. Ideally, commoninterconnect standards and requirements should be inplace for each application to allow mass produced,lower-cost system components. Development ofstandard system components to satisfy utilityconcerns in particular applications would not onlymarkedly lower the cost of the installation, but wouldresult in products that maximize system andoperational efficiencies over the life of the systemcomponents. In the opinion of the project manager,the requirement should be for the generators tosupply their fair share of the VARs, and no more.
Cost Estimate
The installation ultimately resulted in an additionalcharge of $3,000 for equipment that was consideredredundant and a $2,000 equipment testing charge thatwas considered unnecessary.
Utility Position
The utility was contacted and answered severalquestions regarding its position on distributed powerand related issues. The following information is asrelated by the utility representative.
The utility noted that if a distributed power project islarge enough, it may have to bid into the utility�sresource solicitations under a competitive biddingprocess. The utility promotes distributed power and isassisting the development of the proposed IEEEnational guidelines.
The utility�s concerns with distributed powerinstallations involve protection for the grid,including: safety, harmonics, over and under voltageprotection, etc. It requires specified utility-graderelays for large generators and type testing ofcomponents for small generators.
The utility allows resale back to the grid, even bynon-qualified facilities. In small solar cases, a pilotnet metering tariff applies. All customers generatingin parallel to the grid are required to sign contracts. In
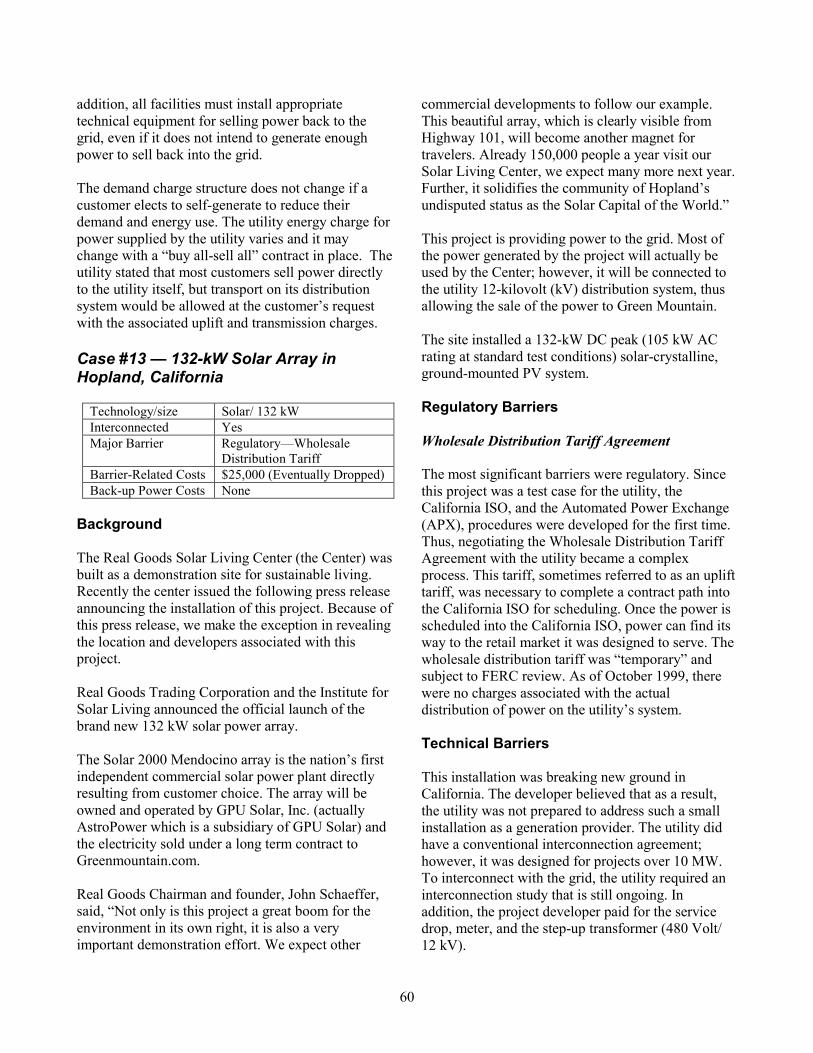
60
addition, all facilities must install appropriatetechnical equipment for selling power back to thegrid, even if it does not intend to generate enoughpower to sell back into the grid.
The demand charge structure does not change if acustomer elects to self-generate to reduce theirdemand and energy use. The utility energy charge forpower supplied by the utility varies and it maychange with a �buy all-sell all� contract in place. Theutility stated that most customers sell power directlyto the utility itself, but transport on its distributionsystem would be allowed at the customer�s requestwith the associated uplift and transmission charges.
Case #13 � 132-kW Solar Array inHopland, California
Technology/size Solar/ 132 kWInterconnected YesMajor Barrier Regulatory�Wholesale
Distribution TariffBarrier-Related Costs $25,000 (Eventually Dropped)Back-up Power Costs None
Background
The Real Goods Solar Living Center (the Center) wasbuilt as a demonstration site for sustainable living.Recently the center issued the following press releaseannouncing the installation of this project. Because ofthis press release, we make the exception in revealingthe location and developers associated with thisproject.
Real Goods Trading Corporation and the Institute forSolar Living announced the official launch of thebrand new 132 kW solar power array.
The Solar 2000 Mendocino array is the nation�s firstindependent commercial solar power plant directlyresulting from customer choice. The array will beowned and operated by GPU Solar, Inc. (actuallyAstroPower which is a subsidiary of GPU Solar) andthe electricity sold under a long term contract toGreenmountain.com.
Real Goods Chairman and founder, John Schaeffer,said, �Not only is this project a great boom for theenvironment in its own right, it is also a veryimportant demonstration effort. We expect other
commercial developments to follow our example.This beautiful array, which is clearly visible fromHighway 101, will become another magnet fortravelers. Already 150,000 people a year visit ourSolar Living Center, we expect many more next year.Further, it solidifies the community of Hopland�sundisputed status as the Solar Capital of the World.�
This project is providing power to the grid. Most ofthe power generated by the project will actually beused by the Center; however, it will be connected tothe utility 12-kilovolt (kV) distribution system, thusallowing the sale of the power to Green Mountain.
The site installed a 132-kW DC peak (105 kW ACrating at standard test conditions) solar-crystalline,ground-mounted PV system.
Regulatory Barriers
Wholesale Distribution Tariff Agreement
The most significant barriers were regulatory. Sincethis project was a test case for the utility, theCalifornia ISO, and the Automated Power Exchange(APX), procedures were developed for the first time.Thus, negotiating the Wholesale Distribution TariffAgreement with the utility became a complexprocess. This tariff, sometimes referred to as an uplifttariff, was necessary to complete a contract path intothe California ISO for scheduling. Once the power isscheduled into the California ISO, power can find itsway to the retail market it was designed to serve. Thewholesale distribution tariff was �temporary� andsubject to FERC review. As of October 1999, therewere no charges associated with the actualdistribution of power on the utility�s system.
Technical Barriers
This installation was breaking new ground inCalifornia. The developer believed that as a result,the utility was not prepared to address such a smallinstallation as a generation provider. The utility didhave a conventional interconnection agreement;however, it was designed for projects over 10 MW.To interconnect with the grid, the utility required aninterconnection study that is still ongoing. Inaddition, the project developer paid for the servicedrop, meter, and the step-up transformer (480 Volt/12 kV).
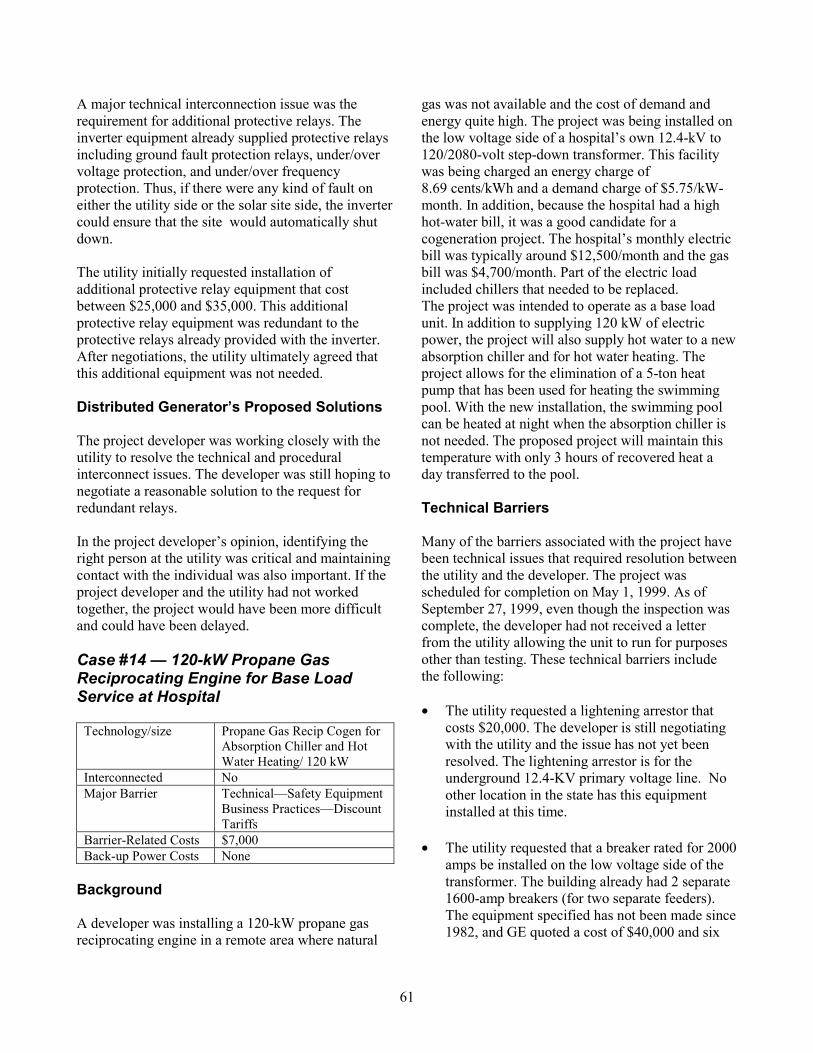
61
A major technical interconnection issue was therequirement for additional protective relays. Theinverter equipment already supplied protective relaysincluding ground fault protection relays, under/overvoltage protection, and under/over frequencyprotection. Thus, if there were any kind of fault oneither the utility side or the solar site side, the invertercould ensure that the site would automatically shutdown.
The utility initially requested installation ofadditional protective relay equipment that costbetween $25,000 and $35,000. This additionalprotective relay equipment was redundant to theprotective relays already provided with the inverter.After negotiations, the utility ultimately agreed thatthis additional equipment was not needed.
Distributed Generator�s Proposed Solutions
The project developer was working closely with theutility to resolve the technical and proceduralinterconnect issues. The developer was still hoping tonegotiate a reasonable solution to the request forredundant relays.
In the project developer�s opinion, identifying theright person at the utility was critical and maintainingcontact with the individual was also important. If theproject developer and the utility had not workedtogether, the project would have been more difficultand could have been delayed.
Case #14 � 120-kW Propane GasReciprocating Engine for Base LoadService at Hospital
Technology/size Propane Gas Recip Cogen forAbsorption Chiller and HotWater Heating/ 120 kW
Interconnected NoMajor Barrier Technical�Safety Equipment
Business Practices�DiscountTariffs
Barrier-Related Costs $7,000Back-up Power Costs None
Background
A developer was installing a 120-kW propane gasreciprocating engine in a remote area where natural
gas was not available and the cost of demand andenergy quite high. The project was being installed onthe low voltage side of a hospital�s own 12.4-kV to120/2080-volt step-down transformer. This facilitywas being charged an energy charge of8.69 cents/kWh and a demand charge of $5.75/kW-month. In addition, because the hospital had a highhot-water bill, it was a good candidate for acogeneration project. The hospital�s monthly electricbill was typically around $12,500/month and the gasbill was $4,700/month. Part of the electric loadincluded chillers that needed to be replaced.The project was intended to operate as a base loadunit. In addition to supplying 120 kW of electricpower, the project will also supply hot water to a newabsorption chiller and for hot water heating. Theproject allows for the elimination of a 5-ton heatpump that has been used for heating the swimmingpool. With the new installation, the swimming poolcan be heated at night when the absorption chiller isnot needed. The proposed project will maintain thistemperature with only 3 hours of recovered heat aday transferred to the pool.
Technical Barriers
Many of the barriers associated with the project havebeen technical issues that required resolution betweenthe utility and the developer. The project wasscheduled for completion on May 1, 1999. As ofSeptember 27, 1999, even though the inspection wascomplete, the developer had not received a letterfrom the utility allowing the unit to run for purposesother than testing. These technical barriers includethe following:
• The utility requested a lightening arrestor thatcosts $20,000. The developer is still negotiatingwith the utility and the issue has not yet beenresolved. The lightening arrestor is for theunderground 12.4-KV primary voltage line. Noother location in the state has this equipmentinstalled at this time.
• The utility requested that a breaker rated for 2000amps be installed on the low voltage side of thetransformer. The building already had 2 separate1600-amp breakers (for two separate feeders).The equipment specified has not been made since1982, and GE quoted a cost of $40,000 and six
62
months lead time. This was pointed out to theutility, and the requirement was dropped.
• The utility stated that the high voltage feed wasnot grounded, and an inspection was required toprove that a high-voltage ground existed.Scheduling the inspection took one month.
The utility requested a reverse power relay, eventhough this installation is an induction generator thatrequires an outside source of voltage to operate. Theoriginal relay specified by the utility was notappropriate for the installation, and General Electric(supplier of the relay) would not warranty it in theapplication. The utility agreed to a different relay asspecified by General Electric; however, this processtook an additional eight weeks. The utility requiredsynchronizing equipment and parallel operationmonitoring for the induction generator that has areverse power relay installed that shuts down theentire cogeneration plant. This cost was over $6,000for equipment that the developer argued wasunneeded.
Regulatory Barriers
Back-up Charges
When the project was proposed, the utility had nostandby charges in their tariff. During the projectdevelopment, the utility requested a $1,200/kW-yearstandby charge from the PUC. However, the requestto the PUC was rejected on the basis that 120 kWcould not affect the grid.
Business Practice Barriers
Discount Tariff and Anti-Cogeneration Campaign
The utility has openly discouraged its customers frominstalling cogeneration facilities and switching tocheaper more-efficient power. In a publication sent toall customers, the utility stated that cogeneration isinefficient and expensive. The publication points out�the heat produced by the cogeneration systemcannot be fully utilized by the facility that it serves.Any wasted thermal energy is a lost opportunity forcogeneration units.� The publication did not point outthat without cogeneration (with the traditionalgenerating station) all the thermal energy is lost.
The utility's publication specifically targeted theaddition of absorption chillers to a cogenerationinstallation. A developer had recently been promotingthis technology and had 20 installations in theutility�s territory. The publication stated, �Theabsorption chiller is being added in an attempt to usemore of the thermal energy available from the fuel toimprove cogeneration system performance. In thepast, absorption chillers have not been used becauseof their very high energy consumption and poorefficiency. For example, a typical absorption chillerrequires 1 Btu of energy to create 1-1.2 Btu ofcooling. In contrast, a high efficiency electric chiller,such as those qualifying for utility rebates, provides 7Btu�s of cooling energy for every Btu of energysupplied to the chiller.� The publication again didnot mention that the absorption chiller uses 1 Btu ofenergy from waste heat that would not be used exceptin the chiller application. On the other hand, the Btu�sused for the electric chiller must be generated by theutility and paid for by the customer.
The utility also stated that the economics ofcogeneration were difficult because of the lack ofavailability of natural gas. Yet, the utility wasoffering discounts to customers that did not installtheir own generation source. The utility hadintroduced a tariff reduction of 11.77 percent forcustomers who seriously considered cogeneration butopted to stay with the utility. The tariff required thecustomer to conduct economic analyses showing thesavings associated with cogeneration. In addition, thecustomer must provide cost estimates from vendorsshowing the cost savings.
At the same time, the utility did have programs tosupport renewable energy. They had a rebateprogram for residential solar hot water heaters and aneducational program to install photovoltaic systems(PV) in schools. These installations were installed onthe customer�s side of the meter; thus, the energygenerated by the PV project would only be availableto the school.
Estimated Costs
The costs associated with this project were primarilyassociated with the additional equipment required.The additional costs included $7,000 for what thedeveloper believed to be unnecessary equipment and
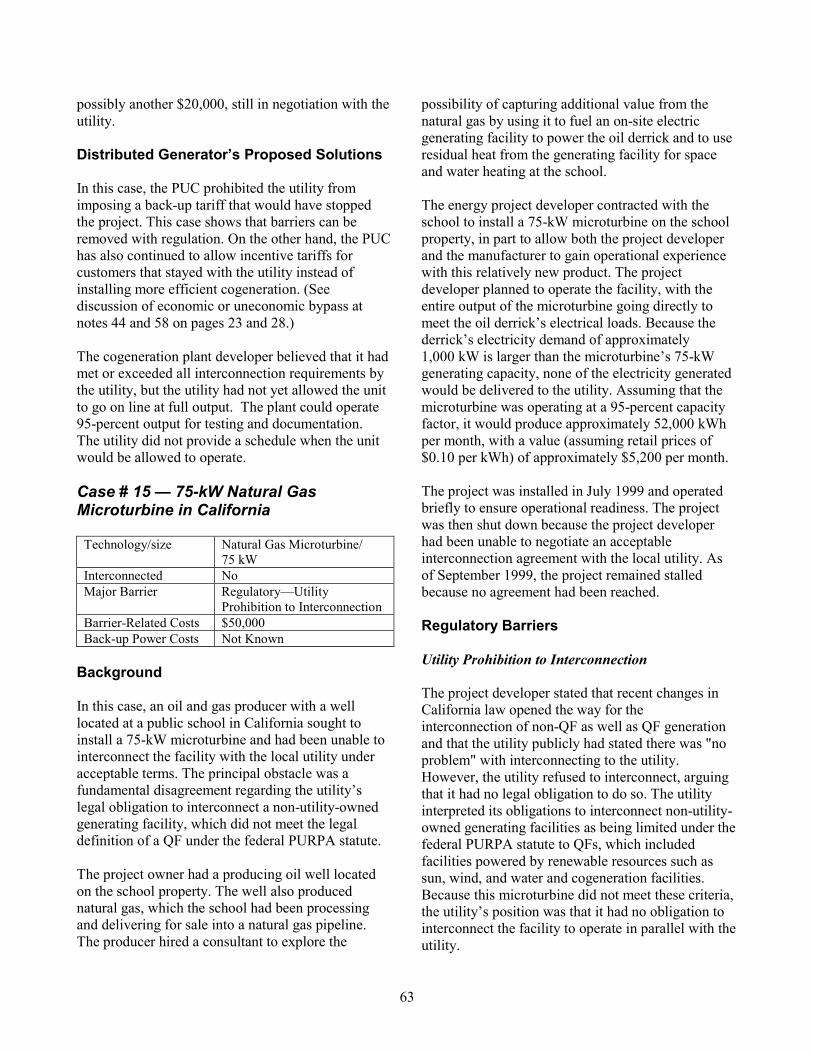
63
possibly another $20,000, still in negotiation with theutility.
Distributed Generator�s Proposed Solutions
In this case, the PUC prohibited the utility fromimposing a back-up tariff that would have stoppedthe project. This case shows that barriers can beremoved with regulation. On the other hand, the PUChas also continued to allow incentive tariffs forcustomers that stayed with the utility instead ofinstalling more efficient cogeneration. (Seediscussion of economic or uneconomic bypass atnotes 44 and 58 on pages 23 and 28.)
The cogeneration plant developer believed that it hadmet or exceeded all interconnection requirements bythe utility, but the utility had not yet allowed the unitto go on line at full output. The plant could operate95-percent output for testing and documentation.The utility did not provide a schedule when the unitwould be allowed to operate.
Case # 15 � 75-kW Natural GasMicroturbine in California
Technology/size Natural Gas Microturbine/75 kW
Interconnected NoMajor Barrier Regulatory�Utility
Prohibition to InterconnectionBarrier-Related Costs $50,000Back-up Power Costs Not Known
Background
In this case, an oil and gas producer with a welllocated at a public school in California sought toinstall a 75-kW microturbine and had been unable tointerconnect the facility with the local utility underacceptable terms. The principal obstacle was afundamental disagreement regarding the utility�slegal obligation to interconnect a non-utility-ownedgenerating facility, which did not meet the legaldefinition of a QF under the federal PURPA statute.
The project owner had a producing oil well locatedon the school property. The well also producednatural gas, which the school had been processingand delivering for sale into a natural gas pipeline.The producer hired a consultant to explore the
possibility of capturing additional value from thenatural gas by using it to fuel an on-site electricgenerating facility to power the oil derrick and to useresidual heat from the generating facility for spaceand water heating at the school.
The energy project developer contracted with theschool to install a 75-kW microturbine on the schoolproperty, in part to allow both the project developerand the manufacturer to gain operational experiencewith this relatively new product. The projectdeveloper planned to operate the facility, with theentire output of the microturbine going directly tomeet the oil derrick�s electrical loads. Because thederrick�s electricity demand of approximately1,000 kW is larger than the microturbine�s 75-kWgenerating capacity, none of the electricity generatedwould be delivered to the utility. Assuming that themicroturbine was operating at a 95-percent capacityfactor, it would produce approximately 52,000 kWhper month, with a value (assuming retail prices of$0.10 per kWh) of approximately $5,200 per month.
The project was installed in July 1999 and operatedbriefly to ensure operational readiness. The projectwas then shut down because the project developerhad been unable to negotiate an acceptableinterconnection agreement with the local utility. Asof September 1999, the project remained stalledbecause no agreement had been reached.
Regulatory Barriers
Utility Prohibition to Interconnection
The project developer stated that recent changes inCalifornia law opened the way for theinterconnection of non-QF as well as QF generationand that the utility publicly had stated there was "noproblem" with interconnecting to the utility.However, the utility refused to interconnect, arguingthat it had no legal obligation to do so. The utilityinterpreted its obligations to interconnect non-utility-owned generating facilities as being limited under thefederal PURPA statute to QFs, which includedfacilities powered by renewable resources such assun, wind, and water and cogeneration facilities.Because this microturbine did not meet these criteria,the utility�s position was that it had no obligation tointerconnect the facility to operate in parallel with theutility.
64
The project developer�s response to the thresholdquestion of an obligation to interconnect was thatPURPA QF requirements apply only to facilities thatare exporting power to the utility and not to facilitiesthat are merely offsetting on-site loads and will neverproduce excess power, for sale or otherwise. Ineffect, the project developer argued that the facilitywas a �load reduction device� that was functionallyindistinguishable from any other variable loads on thecustomer�s property, over which the utility has nocontrol. Having met legitimate safety and powerquality requirements, the customer argued it waslegally entitled to interconnect a generating facility tomanage its load and partially supply its ownelectricity needs.
Following the initial legal dispute on the right toconnect, the utility offered to interconnect the projectunder a new version of its Rule regarding parallelgeneration by non-utility, non-QF facilities. The Rulerequired projects to purchase standby power under aSchedule S. When subsequent review of Schedule Sshowed that it also required the project to be a QF,the utility acknowledged the inconsistency andoffered to approach interconnection through asimplified regulatory proceeding called an �adviceletter filing.�
When the project developer requested the adviceletter, the utility responded that the project wasdetermined to have substantial �revenue impacts.�Management decided not to submit an advice letterfiling until the revenue impacts could be resolved toits satisfaction.
Pressed by the project developer, the utility offered tointerconnect under an �experimental� or �test�interconnection agreement, which allowed theparallel operation, but without compensation forelectricity delivered to the utility. All of theelectricity generated would be delivered to the utilitywithout payment or other compensation, while thefacility purchased all of its electricity from the utilityat standard retail rates. This proposal would result inthe project developer incurring all the capital andoperating costs of operating the facility and none ofthe economic benefit.
Operational Requirements: Independent SystemOperator (ISO) Requirements
The project developer noted that under existing rulesin California, distribution-level generators have noway to wheel power to the ISO responsible forcoordination and dispatch of power under retailcompetition in California. This is reflected in thecontracts that the utility proposed, which specifiedthat the utility would not wheel power on behalf ofthe project. The project developer suggested that theCalifornia ISO may itself be looking at solutions tothis issue, but that at this time there are none.
Business Practice Barriers
Interconnection Studies
During negotiations on interconnection, the utilityalso indicated that it would require the projectdeveloper to pay for a method of service studyrequired for all non-utility generating facilities exceptthose specifically exempt70. The utility did notprovide a fixed price quote for conducting the study,which is to evaluate the impacts and modificationsposed by the proposed interconnection. Theminimum charge for the study is $500. This utilityhas charged as much as $50,000 for such studies inother cases, taking up to six months to complete. Theproject developer anticipated $50,000 as the cost ofthe study for a project of this size, but because theutility did not provide any further estimate, there wasno way to plan for or challenge the cost. The utilityinformed the project developer that the cost of thestudy is non-negotiable, and that the projectdeveloper�s only option, if unwilling to pay for thestudy, would be to abandon the project.
The project developer argued that a study intended todetermine whether the distribution system couldaccommodate power being delivered by thegenerating facility was unnecessary and inappropriatefor a generating facility designed merely to reduce oroffset the customer�s own loads. The system wouldnever export any power to the utility system. Theutility, nonetheless, declined to negotiate.
70 Small solar and wind facilities qualify forinterconnection under the California net metering law,which prohibits the pass-through of such costs.
65
Contractual Requirements for Interconnection
The utility's proposed contract to the projectdeveloper was a 43-page commercial contract that theproject developer characterized as �onerous� andoverly complex for a generating facility of the sizeand scope involved.
Processing Requests for Interconnection
The project developer complained about the utility�sfailure to designate a particular employee or a singleoffice to act as the point of contact for the project.The project developer stated, �Wiggling your waythrough these rules and tariffs is a non-trivial exercisebecause the tariff office, the business office, and thebilling office all have different interpretationsregarding the requirements.�
Technical Barriers
Safety and Power Quality Requirements
The turbine manufacturer provided the utility withwritten documentation of the results from tests of theprotective functions of its microturbine, includingsafety and power quality features. The utilitydeclined to accept the tests and indicated that itwould perform its own tests of the equipment at theproject developer�s expense.
In addition, the utility indicated that it would notaccept its own testing of a single microturbine as a�type test� for prequalification and acceptance ofother microturbines of the same make and modelfrom the manufacturer. Instead, the utility indicatedthat it would require individual testing of each unit.
The project developer characterized the utility asmore accepting of the protective equipment used forsynchronous and inductive generators, because theserequirements were well defined under rules forPURPA QFs. The project developer noted that theutilities were less comfortable with generators (suchas the microturbine in this case) that connect throughan inverter. According to the project developer,inverters have the protective functionality todisconnect in response to abnormal utility conditions.For instance, a short circuit in the distribution systemcan be exacerbated by a synchronous generator, butnot by an inverter-coupled generator that
automatically shuts down under short-circuitconditions. The project developer noted that this�inherent functionality� was not yet generallyaccepted by utilities, except where national standardshave been developed�such as in small PVinstallations. The developer argued that incorporationof the built-in protective functions was part of thecompetitive economics of the facility, and the projectcould not economically justify the cost of additional,redundant protective equipment.
Distributed Generator�s Proposed Solutions
The project developer and microturbine manufacturersuggested several solutions to overcoming thebarriers encountered in this project.
The project developer favored the development ofnational standards to address legitimate safety andpower-quality issues. Once �everyone agrees thatIEEE/UL has the ability to define, test, and approveequipment� the utility could not require additionaltesting of certified models, much less testing ofindividual units.
The project developer favored quick connection forgenerating facilities that do not export power to theutility system. Facilities studies, such as the Methodof Service Study in this case, are not necessary andshould be prohibited as a delaying tactic for systemsthat merely reduce the customer�s demand. Thesesystems can have no adverse effect on distributionsystem capacity.
Moreover, for cases where power is exported and afacilities study may be appropriate, there should besome way to categorize and standardize the approachbased on generation size, voltage level, etc., so as toavoid the expense, time, and inconsistency of customengineering studies. As the project developer noted,�every distribution engineer has a differentperspective and they consider it more of an art than ascience.� The case-by-case approach does not allowfor standardized systems and prevents the emergenceof commercial markets for customer-ownedequipment.
The microturbine manufacturer argued for the need to�take the interconnection decision out of the hands ofthe monopoly utility, who sees this customer as acompetitor.� The manufacturer favored legislation to
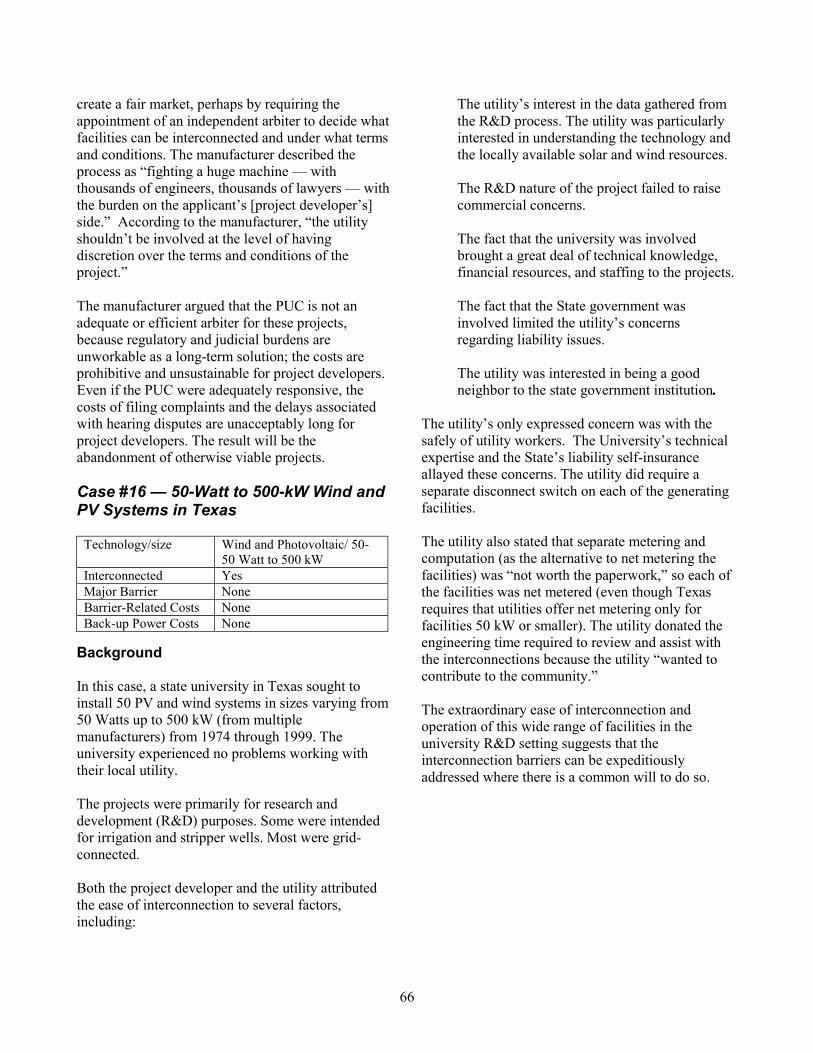
66
create a fair market, perhaps by requiring theappointment of an independent arbiter to decide whatfacilities can be interconnected and under what termsand conditions. The manufacturer described theprocess as �fighting a huge machine � withthousands of engineers, thousands of lawyers � withthe burden on the applicant�s [project developer�s]side.� According to the manufacturer, �the utilityshouldn�t be involved at the level of havingdiscretion over the terms and conditions of theproject.�
The manufacturer argued that the PUC is not anadequate or efficient arbiter for these projects,because regulatory and judicial burdens areunworkable as a long-term solution; the costs areprohibitive and unsustainable for project developers.Even if the PUC were adequately responsive, thecosts of filing complaints and the delays associatedwith hearing disputes are unacceptably long forproject developers. The result will be theabandonment of otherwise viable projects.
Case #16 � 50-Watt to 500-kW Wind andPV Systems in Texas
Technology/size Wind and Photovoltaic/ 50-50 Watt to 500 kW
Interconnected YesMajor Barrier NoneBarrier-Related Costs NoneBack-up Power Costs None
Background
In this case, a state university in Texas sought toinstall 50 PV and wind systems in sizes varying from50 Watts up to 500 kW (from multiplemanufacturers) from 1974 through 1999. Theuniversity experienced no problems working withtheir local utility.
The projects were primarily for research anddevelopment (R&D) purposes. Some were intendedfor irrigation and stripper wells. Most were grid-connected.
Both the project developer and the utility attributedthe ease of interconnection to several factors,including:
The utility�s interest in the data gathered fromthe R&D process. The utility was particularlyinterested in understanding the technology andthe locally available solar and wind resources.
The R&D nature of the project failed to raisecommercial concerns.
The fact that the university was involvedbrought a great deal of technical knowledge,financial resources, and staffing to the projects.
The fact that the State government wasinvolved limited the utility�s concernsregarding liability issues.
The utility was interested in being a goodneighbor to the state government institution.
The utility�s only expressed concern was with thesafely of utility workers. The University�s technicalexpertise and the State�s liability self-insuranceallayed these concerns. The utility did require aseparate disconnect switch on each of the generatingfacilities.
The utility also stated that separate metering andcomputation (as the alternative to net metering thefacilities) was �not worth the paperwork,� so each ofthe facilities was net metered (even though Texasrequires that utilities offer net metering only forfacilities 50 kW or smaller). The utility donated theengineering time required to review and assist withthe interconnections because the utility �wanted tocontribute to the community.�
The extraordinary ease of interconnection andoperation of this wide range of facilities in theuniversity R&D setting suggests that theinterconnection barriers can be expeditiouslyaddressed where there is a common will to do so.
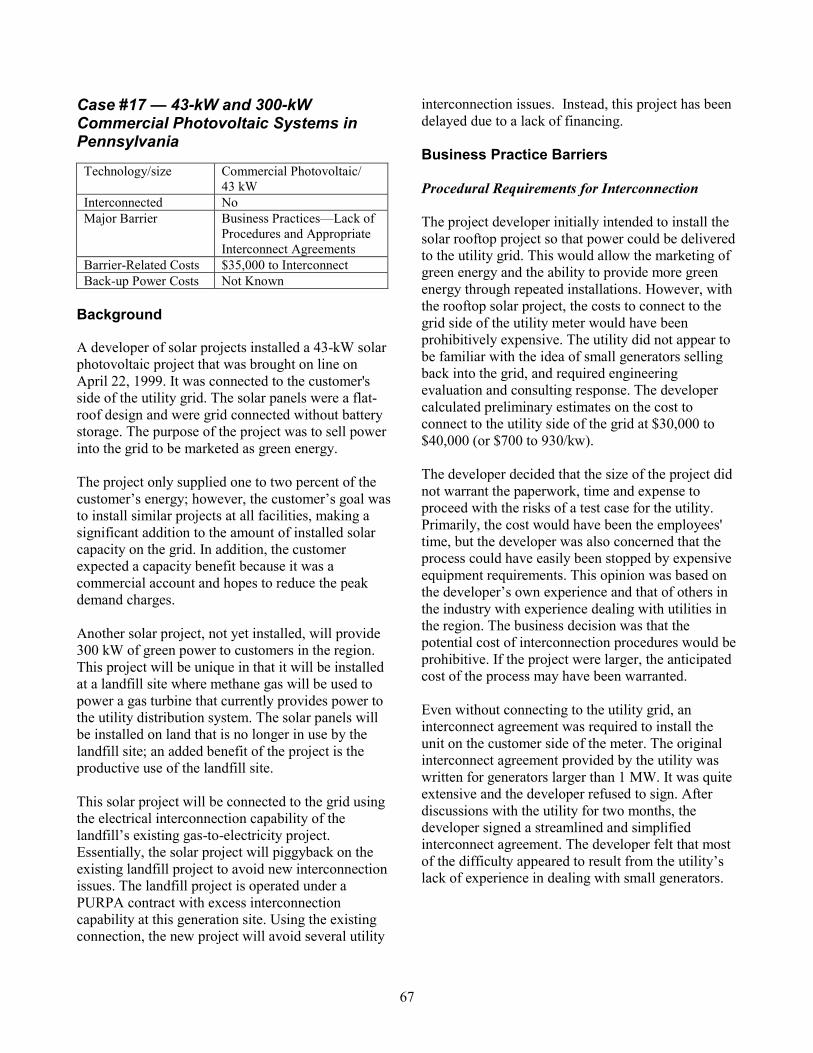
67
Case #17 � 43-kW and 300-kWCommercial Photovoltaic Systems inPennsylvania
Technology/size Commercial Photovoltaic/43 kW
Interconnected NoMajor Barrier Business Practices�Lack of
Procedures and AppropriateInterconnect Agreements
Barrier-Related Costs $35,000 to InterconnectBack-up Power Costs Not Known
Background
A developer of solar projects installed a 43-kW solarphotovoltaic project that was brought on line onApril 22, 1999. It was connected to the customer'sside of the utility grid. The solar panels were a flat-roof design and were grid connected without batterystorage. The purpose of the project was to sell powerinto the grid to be marketed as green energy.
The project only supplied one to two percent of thecustomer�s energy; however, the customer�s goal wasto install similar projects at all facilities, making asignificant addition to the amount of installed solarcapacity on the grid. In addition, the customerexpected a capacity benefit because it was acommercial account and hopes to reduce the peakdemand charges.
Another solar project, not yet installed, will provide300 kW of green power to customers in the region.This project will be unique in that it will be installedat a landfill site where methane gas will be used topower a gas turbine that currently provides power tothe utility distribution system. The solar panels willbe installed on land that is no longer in use by thelandfill site; an added benefit of the project is theproductive use of the landfill site.
This solar project will be connected to the grid usingthe electrical interconnection capability of thelandfill�s existing gas-to-electricity project.Essentially, the solar project will piggyback on theexisting landfill project to avoid new interconnectionissues. The landfill project is operated under aPURPA contract with excess interconnectioncapability at this generation site. Using the existingconnection, the new project will avoid several utility
interconnection issues. Instead, this project has beendelayed due to a lack of financing.
Business Practice Barriers
Procedural Requirements for Interconnection
The project developer initially intended to install thesolar rooftop project so that power could be deliveredto the utility grid. This would allow the marketing ofgreen energy and the ability to provide more greenenergy through repeated installations. However, withthe rooftop solar project, the costs to connect to thegrid side of the utility meter would have beenprohibitively expensive. The utility did not appear tobe familiar with the idea of small generators sellingback into the grid, and required engineeringevaluation and consulting response. The developercalculated preliminary estimates on the cost toconnect to the utility side of the grid at $30,000 to$40,000 (or $700 to 930/kw).
The developer decided that the size of the project didnot warrant the paperwork, time and expense toproceed with the risks of a test case for the utility.Primarily, the cost would have been the employees'time, but the developer was also concerned that theprocess could have easily been stopped by expensiveequipment requirements. This opinion was based onthe developer�s own experience and that of others inthe industry with experience dealing with utilities inthe region. The business decision was that thepotential cost of interconnection procedures would beprohibitive. If the project were larger, the anticipatedcost of the process may have been warranted.
Even without connecting to the utility grid, aninterconnect agreement was required to install theunit on the customer side of the meter. The originalinterconnect agreement provided by the utility waswritten for generators larger than 1 MW. It was quiteextensive and the developer refused to sign. Afterdiscussions with the utility for two months, thedeveloper signed a streamlined and simplifiedinterconnect agreement. The developer felt that mostof the difficulty appeared to result from the utility�slack of experience in dealing with small generators.
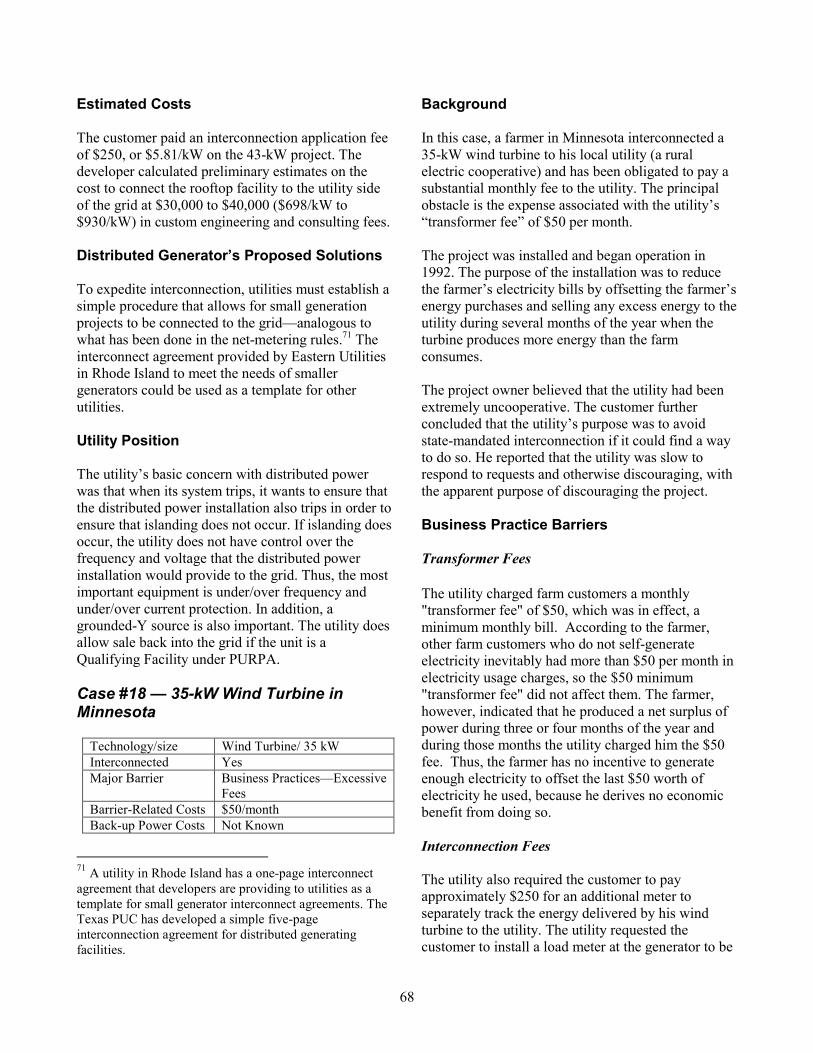
68
Estimated Costs
The customer paid an interconnection application feeof $250, or $5.81/kW on the 43-kW project. Thedeveloper calculated preliminary estimates on thecost to connect the rooftop facility to the utility sideof the grid at $30,000 to $40,000 ($698/kW to$930/kW) in custom engineering and consulting fees.
Distributed Generator�s Proposed Solutions
To expedite interconnection, utilities must establish asimple procedure that allows for small generationprojects to be connected to the grid�analogous towhat has been done in the net-metering rules.71 Theinterconnect agreement provided by Eastern Utilitiesin Rhode Island to meet the needs of smallergenerators could be used as a template for otherutilities.
Utility Position
The utility�s basic concern with distributed powerwas that when its system trips, it wants to ensure thatthe distributed power installation also trips in order toensure that islanding does not occur. If islanding doesoccur, the utility does not have control over thefrequency and voltage that the distributed powerinstallation would provide to the grid. Thus, the mostimportant equipment is under/over frequency andunder/over current protection. In addition, agrounded-Y source is also important. The utility doesallow sale back into the grid if the unit is aQualifying Facility under PURPA.
Case #18 � 35-kW Wind Turbine inMinnesota
Technology/size Wind Turbine/ 35 kWInterconnected YesMajor Barrier Business Practices�Excessive
FeesBarrier-Related Costs $50/monthBack-up Power Costs Not Known
71 A utility in Rhode Island has a one-page interconnectagreement that developers are providing to utilities as atemplate for small generator interconnect agreements. TheTexas PUC has developed a simple five-pageinterconnection agreement for distributed generatingfacilities.
Background
In this case, a farmer in Minnesota interconnected a35-kW wind turbine to his local utility (a ruralelectric cooperative) and has been obligated to pay asubstantial monthly fee to the utility. The principalobstacle is the expense associated with the utility�s�transformer fee� of $50 per month.
The project was installed and began operation in1992. The purpose of the installation was to reducethe farmer�s electricity bills by offsetting the farmer�senergy purchases and selling any excess energy to theutility during several months of the year when theturbine produces more energy than the farmconsumes.
The project owner believed that the utility had beenextremely uncooperative. The customer furtherconcluded that the utility�s purpose was to avoidstate-mandated interconnection if it could find a wayto do so. He reported that the utility was slow torespond to requests and otherwise discouraging, withthe apparent purpose of discouraging the project.
Business Practice Barriers
Transformer Fees
The utility charged farm customers a monthly"transformer fee" of $50, which was in effect, aminimum monthly bill. According to the farmer,other farm customers who do not self-generateelectricity inevitably had more than $50 per month inelectricity usage charges, so the $50 minimum"transformer fee" did not affect them. The farmer,however, indicated that he produced a net surplus ofpower during three or four months of the year andduring those months the utility charged him the $50fee. Thus, the farmer has no incentive to generateenough electricity to offset the last $50 worth ofelectricity he used, because he derives no economicbenefit from doing so.
Interconnection Fees
The utility also required the customer to payapproximately $250 for an additional meter toseparately track the energy delivered by his windturbine to the utility. The utility requested thecustomer to install a load meter at the generator to be
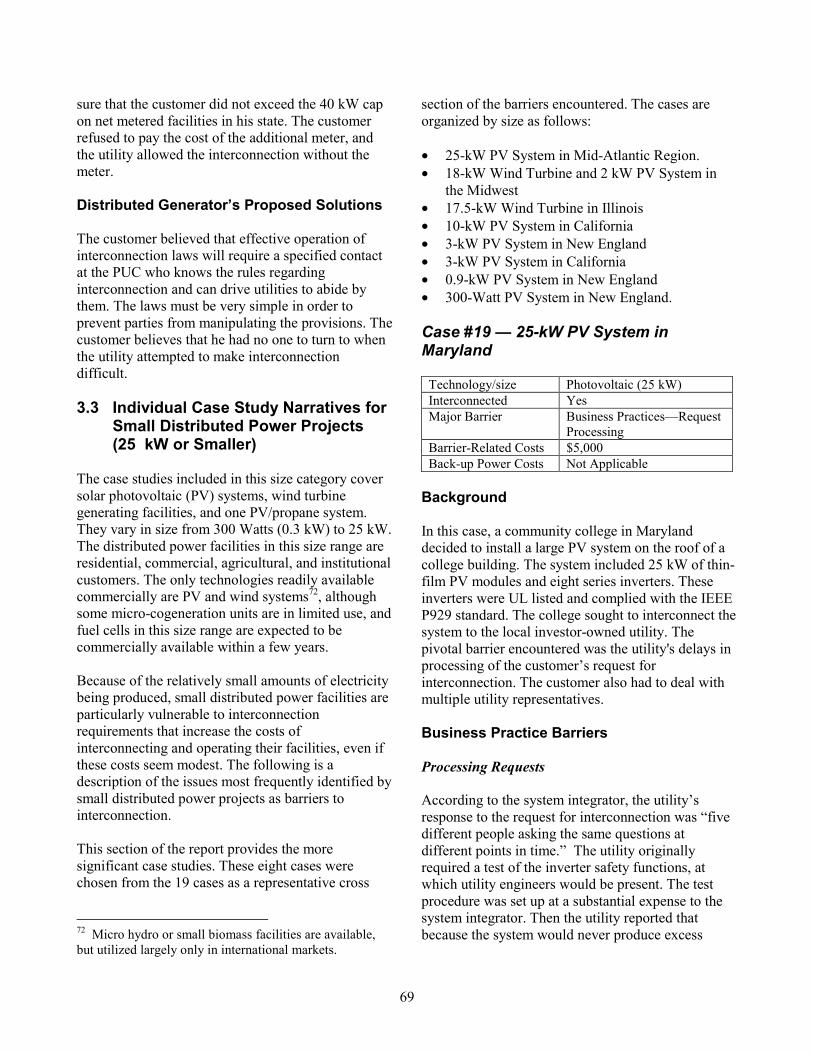
69
sure that the customer did not exceed the 40 kW capon net metered facilities in his state. The customerrefused to pay the cost of the additional meter, andthe utility allowed the interconnection without themeter.
Distributed Generator�s Proposed Solutions
The customer believed that effective operation ofinterconnection laws will require a specified contactat the PUC who knows the rules regardinginterconnection and can drive utilities to abide bythem. The laws must be very simple in order toprevent parties from manipulating the provisions. Thecustomer believes that he had no one to turn to whenthe utility attempted to make interconnectiondifficult.
3.3 Individual Case Study Narratives forSmall Distributed Power Projects(25 kW or Smaller)
The case studies included in this size category coversolar photovoltaic (PV) systems, wind turbinegenerating facilities, and one PV/propane system.They vary in size from 300 Watts (0.3 kW) to 25 kW.The distributed power facilities in this size range areresidential, commercial, agricultural, and institutionalcustomers. The only technologies readily availablecommercially are PV and wind systems72, althoughsome micro-cogeneration units are in limited use, andfuel cells in this size range are expected to becommercially available within a few years.
Because of the relatively small amounts of electricitybeing produced, small distributed power facilities areparticularly vulnerable to interconnectionrequirements that increase the costs ofinterconnecting and operating their facilities, even ifthese costs seem modest. The following is adescription of the issues most frequently identified bysmall distributed power projects as barriers tointerconnection.
This section of the report provides the moresignificant case studies. These eight cases werechosen from the 19 cases as a representative cross
72 Micro hydro or small biomass facilities are available,but utilized largely only in international markets.
section of the barriers encountered. The cases areorganized by size as follows:
• 25-kW PV System in Mid-Atlantic Region.• 18-kW Wind Turbine and 2 kW PV System in
the Midwest• 17.5-kW Wind Turbine in Illinois• 10-kW PV System in California• 3-kW PV System in New England• 3-kW PV System in California• 0.9-kW PV System in New England• 300-Watt PV System in New England.
Case #19 � 25-kW PV System inMaryland
Technology/size Photovoltaic (25 kW)Interconnected YesMajor Barrier Business Practices�Request
ProcessingBarrier-Related Costs $5,000Back-up Power Costs Not Applicable
Background
In this case, a community college in Marylanddecided to install a large PV system on the roof of acollege building. The system included 25 kW of thin-film PV modules and eight series inverters. Theseinverters were UL listed and complied with the IEEEP929 standard. The college sought to interconnect thesystem to the local investor-owned utility. Thepivotal barrier encountered was the utility's delays inprocessing of the customer�s request forinterconnection. The customer also had to deal withmultiple utility representatives.
Business Practice Barriers
Processing Requests
According to the system integrator, the utility�sresponse to the request for interconnection was �fivedifferent people asking the same questions atdifferent points in time.� The utility originallyrequired a test of the inverter safety functions, atwhich utility engineers would be present. The testprocedure was set up at a substantial expense to thesystem integrator. Then the utility reported thatbecause the system would never produce excess
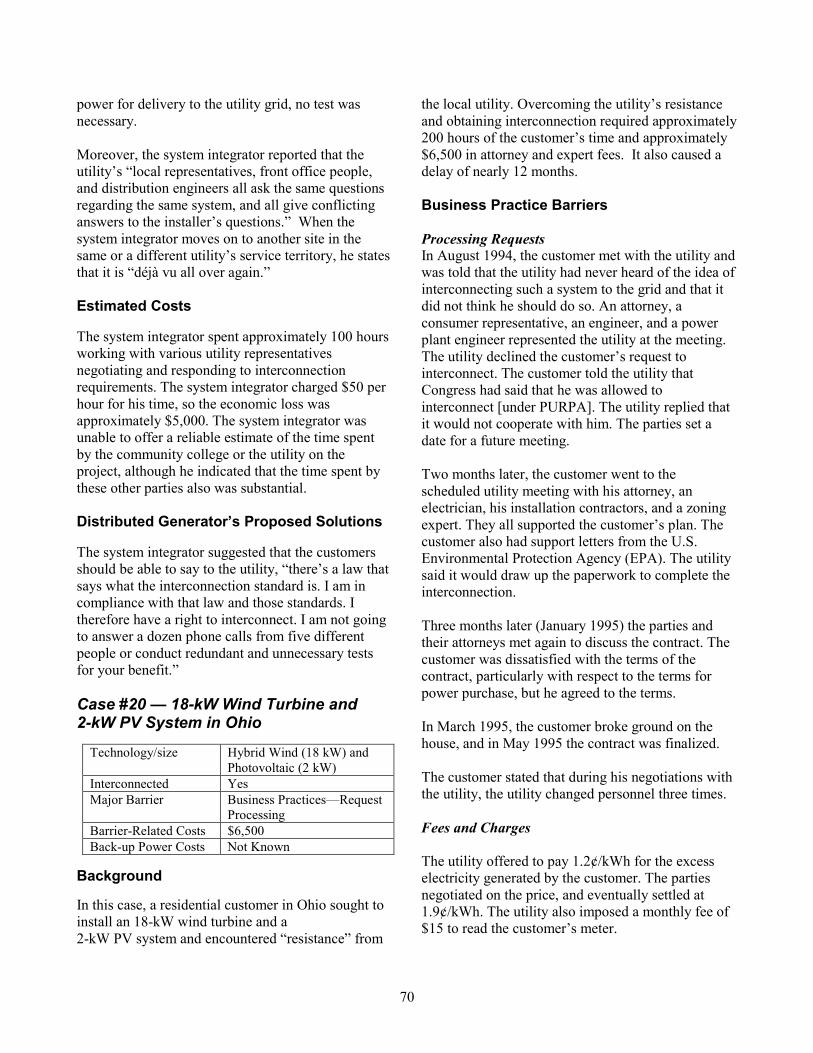
70
power for delivery to the utility grid, no test wasnecessary.
Moreover, the system integrator reported that theutility�s �local representatives, front office people,and distribution engineers all ask the same questionsregarding the same system, and all give conflictinganswers to the installer�s questions.� When thesystem integrator moves on to another site in thesame or a different utility�s service territory, he statesthat it is �déjà vu all over again.�
Estimated Costs
The system integrator spent approximately 100 hoursworking with various utility representativesnegotiating and responding to interconnectionrequirements. The system integrator charged $50 perhour for his time, so the economic loss wasapproximately $5,000. The system integrator wasunable to offer a reliable estimate of the time spentby the community college or the utility on theproject, although he indicated that the time spent bythese other parties also was substantial.
Distributed Generator�s Proposed Solutions
The system integrator suggested that the customersshould be able to say to the utility, �there�s a law thatsays what the interconnection standard is. I am incompliance with that law and those standards. Itherefore have a right to interconnect. I am not goingto answer a dozen phone calls from five differentpeople or conduct redundant and unnecessary testsfor your benefit.�
Case #20 � 18-kW Wind Turbine and2-kW PV System in Ohio
Technology/size Hybrid Wind (18 kW) andPhotovoltaic (2 kW)
Interconnected YesMajor Barrier Business Practices�Request
ProcessingBarrier-Related Costs $6,500Back-up Power Costs Not Known
Background
In this case, a residential customer in Ohio sought toinstall an 18-kW wind turbine and a2-kW PV system and encountered �resistance� from
the local utility. Overcoming the utility�s resistanceand obtaining interconnection required approximately200 hours of the customer�s time and approximately$6,500 in attorney and expert fees. It also caused adelay of nearly 12 months.
Business Practice Barriers
Processing RequestsIn August 1994, the customer met with the utility andwas told that the utility had never heard of the idea ofinterconnecting such a system to the grid and that itdid not think he should do so. An attorney, aconsumer representative, an engineer, and a powerplant engineer represented the utility at the meeting.The utility declined the customer�s request tointerconnect. The customer told the utility thatCongress had said that he was allowed tointerconnect [under PURPA]. The utility replied thatit would not cooperate with him. The parties set adate for a future meeting.
Two months later, the customer went to thescheduled utility meeting with his attorney, anelectrician, his installation contractors, and a zoningexpert. They all supported the customer�s plan. Thecustomer also had support letters from the U.S.Environmental Protection Agency (EPA). The utilitysaid it would draw up the paperwork to complete theinterconnection.
Three months later (January 1995) the parties andtheir attorneys met again to discuss the contract. Thecustomer was dissatisfied with the terms of thecontract, particularly with respect to the terms forpower purchase, but he agreed to the terms.
In March 1995, the customer broke ground on thehouse, and in May 1995 the contract was finalized.
The customer stated that during his negotiations withthe utility, the utility changed personnel three times.
Fees and Charges
The utility offered to pay 1.2¢/kWh for the excesselectricity generated by the customer. The partiesnegotiated on the price, and eventually settled at1.9¢/kWh. The utility also imposed a monthly fee of$15 to read the customer�s meter.
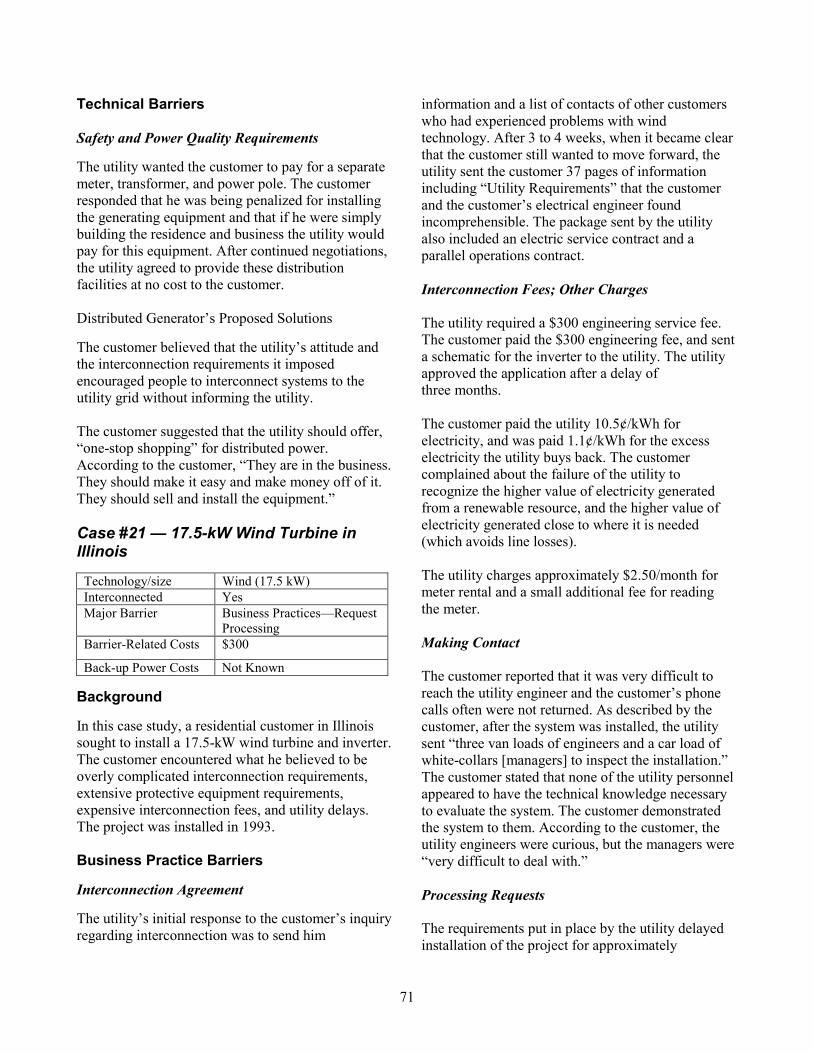
71
Technical Barriers
Safety and Power Quality Requirements
The utility wanted the customer to pay for a separatemeter, transformer, and power pole. The customerresponded that he was being penalized for installingthe generating equipment and that if he were simplybuilding the residence and business the utility wouldpay for this equipment. After continued negotiations,the utility agreed to provide these distributionfacilities at no cost to the customer.
Distributed Generator�s Proposed Solutions
The customer believed that the utility�s attitude andthe interconnection requirements it imposedencouraged people to interconnect systems to theutility grid without informing the utility.
The customer suggested that the utility should offer,�one-stop shopping� for distributed power.According to the customer, �They are in the business.They should make it easy and make money off of it.They should sell and install the equipment.�
Case #21 � 17.5-kW Wind Turbine inIllinois
Technology/size Wind (17.5 kW)Interconnected YesMajor Barrier Business Practices�Request
ProcessingBarrier-Related Costs $300
Back-up Power Costs Not Known
Background
In this case study, a residential customer in Illinoissought to install a 17.5-kW wind turbine and inverter.The customer encountered what he believed to beoverly complicated interconnection requirements,extensive protective equipment requirements,expensive interconnection fees, and utility delays.The project was installed in 1993.
Business Practice Barriers
Interconnection Agreement
The utility�s initial response to the customer�s inquiryregarding interconnection was to send him
information and a list of contacts of other customerswho had experienced problems with windtechnology. After 3 to 4 weeks, when it became clearthat the customer still wanted to move forward, theutility sent the customer 37 pages of informationincluding �Utility Requirements� that the customerand the customer�s electrical engineer foundincomprehensible. The package sent by the utilityalso included an electric service contract and aparallel operations contract.
Interconnection Fees; Other Charges
The utility required a $300 engineering service fee.The customer paid the $300 engineering fee, and senta schematic for the inverter to the utility. The utilityapproved the application after a delay ofthree months.
The customer paid the utility 10.5¢/kWh forelectricity, and was paid 1.1¢/kWh for the excesselectricity the utility buys back. The customercomplained about the failure of the utility torecognize the higher value of electricity generatedfrom a renewable resource, and the higher value ofelectricity generated close to where it is needed(which avoids line losses).
The utility charges approximately $2.50/month formeter rental and a small additional fee for readingthe meter.
Making Contact
The customer reported that it was very difficult toreach the utility engineer and the customer�s phonecalls often were not returned. As described by thecustomer, after the system was installed, the utilitysent �three van loads of engineers and a car load ofwhite-collars [managers] to inspect the installation.�The customer stated that none of the utility personnelappeared to have the technical knowledge necessaryto evaluate the system. The customer demonstratedthe system to them. According to the customer, theutility engineers were curious, but the managers were�very difficult to deal with.�
Processing Requests
The requirements put in place by the utility delayedinstallation of the project for approximately
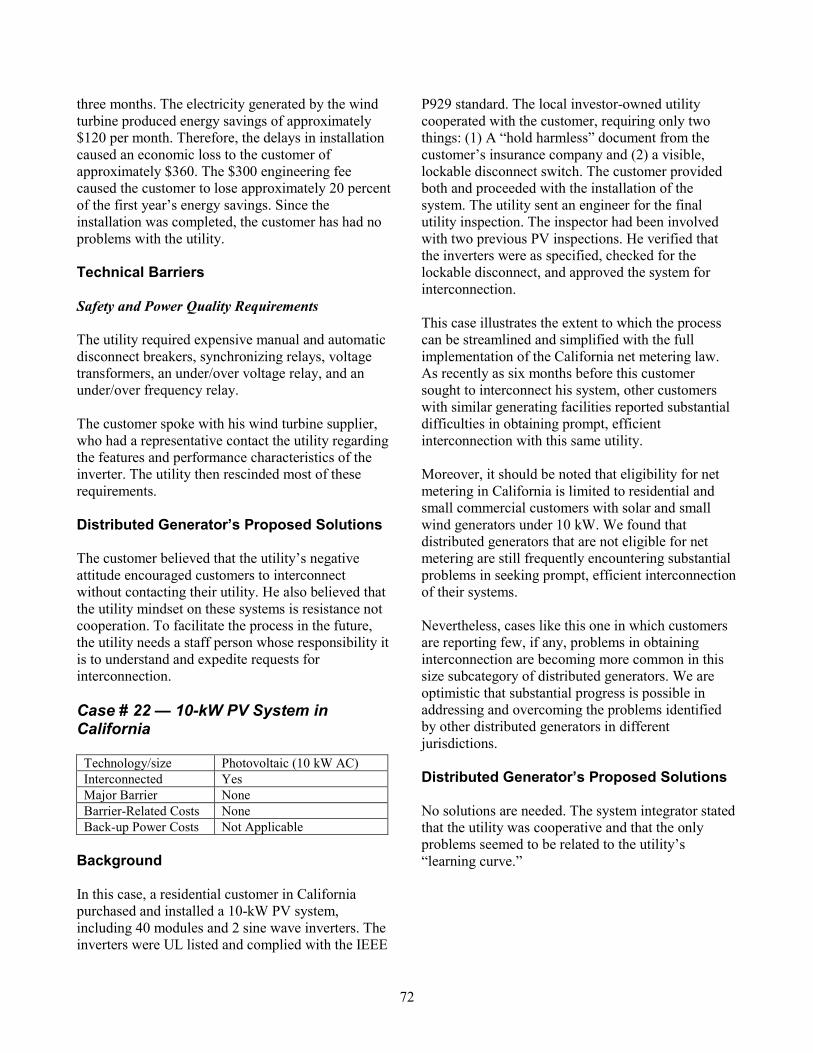
72
three months. The electricity generated by the windturbine produced energy savings of approximately$120 per month. Therefore, the delays in installationcaused an economic loss to the customer ofapproximately $360. The $300 engineering feecaused the customer to lose approximately 20 percentof the first year�s energy savings. Since theinstallation was completed, the customer has had noproblems with the utility.
Technical Barriers
Safety and Power Quality Requirements
The utility required expensive manual and automaticdisconnect breakers, synchronizing relays, voltagetransformers, an under/over voltage relay, and anunder/over frequency relay.
The customer spoke with his wind turbine supplier,who had a representative contact the utility regardingthe features and performance characteristics of theinverter. The utility then rescinded most of theserequirements.
Distributed Generator�s Proposed Solutions
The customer believed that the utility�s negativeattitude encouraged customers to interconnectwithout contacting their utility. He also believed thatthe utility mindset on these systems is resistance notcooperation. To facilitate the process in the future,the utility needs a staff person whose responsibility itis to understand and expedite requests forinterconnection.
Case # 22 � 10-kW PV System inCalifornia
Technology/size Photovoltaic (10 kW AC)Interconnected YesMajor Barrier NoneBarrier-Related Costs NoneBack-up Power Costs Not Applicable
Background
In this case, a residential customer in Californiapurchased and installed a 10-kW PV system,including 40 modules and 2 sine wave inverters. Theinverters were UL listed and complied with the IEEE
P929 standard. The local investor-owned utilitycooperated with the customer, requiring only twothings: (1) A �hold harmless� document from thecustomer�s insurance company and (2) a visible,lockable disconnect switch. The customer providedboth and proceeded with the installation of thesystem. The utility sent an engineer for the finalutility inspection. The inspector had been involvedwith two previous PV inspections. He verified thatthe inverters were as specified, checked for thelockable disconnect, and approved the system forinterconnection.
This case illustrates the extent to which the processcan be streamlined and simplified with the fullimplementation of the California net metering law.As recently as six months before this customersought to interconnect his system, other customerswith similar generating facilities reported substantialdifficulties in obtaining prompt, efficientinterconnection with this same utility.
Moreover, it should be noted that eligibility for netmetering in California is limited to residential andsmall commercial customers with solar and smallwind generators under 10 kW. We found thatdistributed generators that are not eligible for netmetering are still frequently encountering substantialproblems in seeking prompt, efficient interconnectionof their systems.
Nevertheless, cases like this one in which customersare reporting few, if any, problems in obtaininginterconnection are becoming more common in thissize subcategory of distributed generators. We areoptimistic that substantial progress is possible inaddressing and overcoming the problems identifiedby other distributed generators in differentjurisdictions.
Distributed Generator�s Proposed Solutions
No solutions are needed. The system integrator statedthat the utility was cooperative and that the onlyproblems seemed to be related to the utility�s�learning curve.�
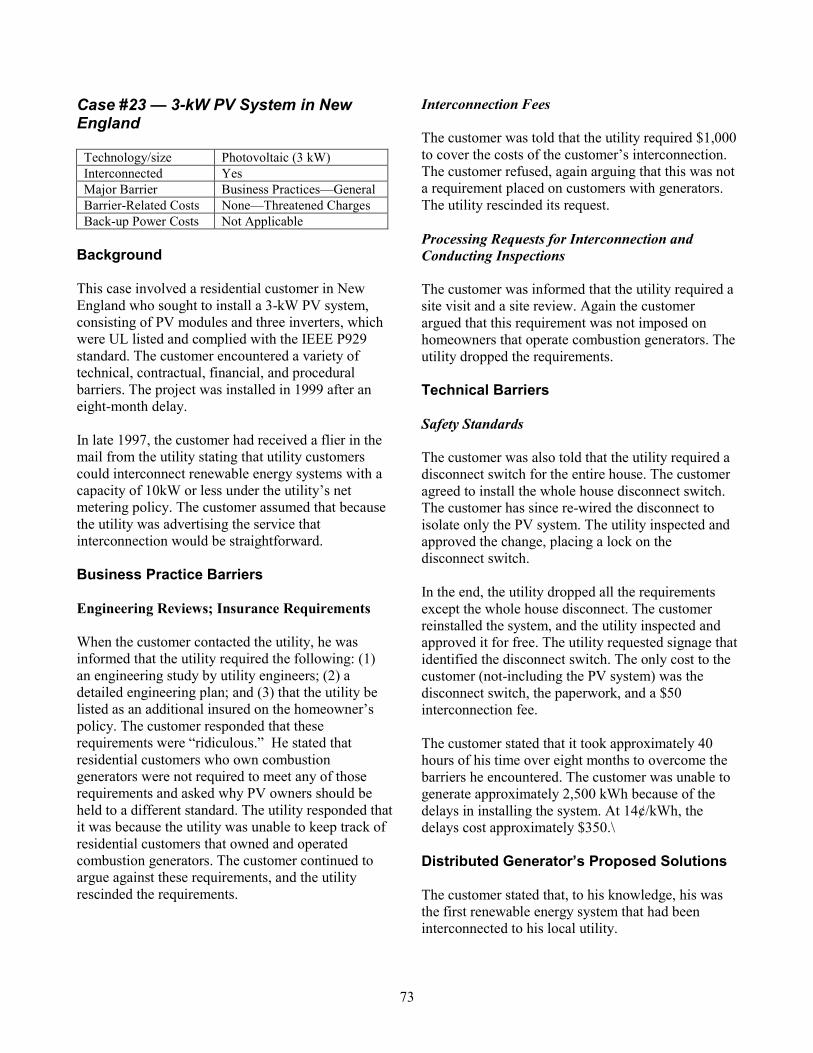
73
Case #23 � 3-kW PV System in NewEngland
Technology/size Photovoltaic (3 kW)Interconnected YesMajor Barrier Business Practices�GeneralBarrier-Related Costs None�Threatened ChargesBack-up Power Costs Not Applicable
Background
This case involved a residential customer in NewEngland who sought to install a 3-kW PV system,consisting of PV modules and three inverters, whichwere UL listed and complied with the IEEE P929standard. The customer encountered a variety oftechnical, contractual, financial, and proceduralbarriers. The project was installed in 1999 after aneight-month delay.
In late 1997, the customer had received a flier in themail from the utility stating that utility customerscould interconnect renewable energy systems with acapacity of 10kW or less under the utility�s netmetering policy. The customer assumed that becausethe utility was advertising the service thatinterconnection would be straightforward.
Business Practice Barriers
Engineering Reviews; Insurance Requirements
When the customer contacted the utility, he wasinformed that the utility required the following: (1)an engineering study by utility engineers; (2) adetailed engineering plan; and (3) that the utility belisted as an additional insured on the homeowner�spolicy. The customer responded that theserequirements were �ridiculous.� He stated thatresidential customers who own combustiongenerators were not required to meet any of thoserequirements and asked why PV owners should beheld to a different standard. The utility responded thatit was because the utility was unable to keep track ofresidential customers that owned and operatedcombustion generators. The customer continued toargue against these requirements, and the utilityrescinded the requirements.
Interconnection Fees
The customer was told that the utility required $1,000to cover the costs of the customer�s interconnection.The customer refused, again arguing that this was nota requirement placed on customers with generators.The utility rescinded its request.
Processing Requests for Interconnection andConducting Inspections
The customer was informed that the utility required asite visit and a site review. Again the customerargued that this requirement was not imposed onhomeowners that operate combustion generators. Theutility dropped the requirements.
Technical Barriers
Safety Standards
The customer was also told that the utility required adisconnect switch for the entire house. The customeragreed to install the whole house disconnect switch.The customer has since re-wired the disconnect toisolate only the PV system. The utility inspected andapproved the change, placing a lock on thedisconnect switch.
In the end, the utility dropped all the requirementsexcept the whole house disconnect. The customerreinstalled the system, and the utility inspected andapproved it for free. The utility requested signage thatidentified the disconnect switch. The only cost to thecustomer (not-including the PV system) was thedisconnect switch, the paperwork, and a $50interconnection fee.
The customer stated that it took approximately 40hours of his time over eight months to overcome thebarriers he encountered. The customer was unable togenerate approximately 2,500 kWh because of thedelays in installing the system. At 14¢/kWh, thedelays cost approximately $350.\
Distributed Generator�s Proposed Solutions
The customer stated that, to his knowledge, his wasthe first renewable energy system that had beeninterconnected to his local utility.
74
The customer believed that the cumbersomeinterconnection procedures required by the utilitywas encouraging customers to install systems withoututility notification or approval. This potentially couldresult in the installation of equipment that does notmeet appropriate safety and power qualityrequirements.
The customer suggested that a superior solutionwould be to use a one-page interconnectionagreement and a $50 fee to recover the utility�s costto review the agreement.
Case #24 � 3-kW PV System in California
Technology/size Photovoltaic (3 kW)Interconnected YesMajor Barrier Business Practices�Request
Processing and FeesBarrier-Related Costs None�Threatened ChargesBack-up Power Costs Not Applicable
Background
In this case, a residential customer in Californiasought to install a 3-kW PV system and encounterednumerous utility barriers. The principal obstacle wasthe utility�s lack of familiarity with thestate-mandated interconnection process establishedunder the state�s net metering law. This lack offamiliarity resulted in the utility imposingrequirements on the customer that it later had torescind. The project was installed in the fall of 1998.
Business Practice Barriers
Making Contact; Processing Requests
The customer had difficulty locating the propercontact person at the utility. Once the customer foundthe correct utility contact person, it seemed that theutility had no experience with interconnection ofsystems eligible under the California net meteringlaw, which had been in place since 1996. Thecustomer also reported the utility to beuncooperative.
Negotiating interconnection with the utilityultimately took approximately 5 months.
Interconnection Fees
The utility initially requested an �installation fee� of$776.80. The customer suggested that the fees wereexcessive and perhaps even punitive (based on howthe customer understood other California utilities tobe handling interconnection of facilities eligible fornet metering). On request, the utility itemized the feeas follows:
Materials $344.96 Bare meter and purchasingand warehouse costs
Labor $ 64.43 Meter installationEquipment $ 13.75 Transportation cost for
service truckAdministrative
$143.87 Local engineering andadministrative costs
Tax@37%
$209.79 The utility cites a tariffthat states, �Any paymentsor contributions offacilities by applicant shallinclude an income taxcomponent of contributionfor state and federalincome tax at the rateprovided��
The customer and utility negotiated these costs forapproximately 10 days. The customer noted that theutility interconnection agreement stated that theutility could install dual meters at its own expensewith the customer�s consent. The customer requestedthat option and provided his consent. The utilitystated that it was able to install a single bi-directionalmeter and that dual metering was not necessary toproperly bill the customer, so the customer would beresponsible for the bi-directional meter costs. Thecustomer, wanting to move the process forward, sentthe utility a check for the $776.80.
The customer contacted the California EnergyCommission (CEC) for assistance. According to thecustomer, the utility�s attitude appeared to changeafter it became clear that a staff person at the CECwas aware of the situation and was advising thecustomer. Approximately 15 days after the customersent the check for the additional meter installation,the utility returned the check stating that the utilitywould not require a �meter installation fee.� It alsostated that the customer�s existing meter was bi-
75
directional and would be adequate for metering thecustomer�s property including the PV system.
Contractual and Procedural Requirements forInterconnection
After the utility agreed that the customer�s existingmeter met the utility�s requirements, the utility sentthe customer an updated interconnection agreementand stated that the customer still needed an�Authorization to Interconnect and Operate inParallel� after an �internal review� by the utility. Theutility also stated that it was waiting to receive a copyof the inspection clearance from a jurisdictionalauthority (the local building inspector). The utilityalso stated that a utility representative must bepresent when the system was connected.
Insurance Requirements
The utility then requested to be named as an�additional insured party� on the customer�shomeowner�s insurance policy and stated that theinterconnection could not take place until thecustomer provided written proof of the requiredinsurance. The customer was then notified by a staffperson at the CEC (who had been kept apprised ofthe negotiations) that the utility did not need to belisted as an additional insured party. Instead, theutility simply needed to be placed on the policy as a�notified party� in the event the policy is renewed orcancelled. The utility accepted this approach.
The customer then scheduled the interconnection,giving the utility the required notice.
Technical Barriers
Redundant Equipment Requirements
Four days later (and four days before the scheduledinstallation), the utility asked the customer to confirma lockable, visible open disconnect switch betweenthe inverter and the meter. The customer had installeda disconnect switch behind a junction box, and theutility did not accept this location. Initially the utilitystated that the customer would need to pay for anadditional disconnect. The customer complained tothe CEC, which intervened on the customer�s behalf.
The utility then offered to pay for the additionaldisconnect, provided that the customer gave theutility three estimates from licensed electricalcontractors before the utility�s approval of payment.The utility also stated that the new disconnect wouldneed to be re-inspected by the county before theutility would approve the interconnect.
The customer responded by stating that he hadinformed the utility weeks earlier that he hadinstalled a visible disconnect switch and that theutility had not responded until the �11th hour�regarding the need for something more than what thecustomer had already installed. The customer alsocomplained that the utility had never before inquiredas to what type of switch the customer had installed.The customer stated that he would accept the offer tohave the utility pay for the special switch, but that hewould not have the system bid by three contractors.He would simply have his existing contractorperform the work at a competitive price. Thecustomer directed his contractor to fax the estimate tothe utility. The customer postponed theinterconnection, and again contacted the CEC forhelp. The utility accepted the contractor�s bid andpaid for the installation.
The customer responded, after discussions with theCEC, that under current law the interconnectionagreement that had already been approved was all thecustomer needed, provided he gave the utility fiveworking days notice prior to interconnection. Thecustomer stated that under advice from the CEC, hewould give the utility the five-day notice and wouldproceed without waiting for the utility�s reviewprocess, or for additional approvals from the utility.The customer also noted that the inspection reportfrom the local building inspector had been sent to theutility five to six weeks earlier.
Conducting Inspections
The customer then rescheduled the interconnectionand notified the utility. The utility did not send arepresentative to attend the interconnection. Three orfour months later, the utility inspected the system andapologized for the difficulties the customer hadexperienced, explaining that he was the first customerto interconnect in this fashion and that the utility wason a steep learning curve.
76
Distributed Generator�s Proposed Solutions
The customer suggested that for the market to expandthere needed to be broader awareness in Californiathat knowledgeable and engaged staff at the CEC areavailable to respond to customer inquiries, provideprompt answers, and give directives to the utilitiesthat are meaningful and timely.
Case # 25 � 0.9-kW PV System In NewEngland
Technology/size Photovoltaic (900 Watts)Interconnected YesMajor Barrier Technical�Engineering
ReviewsBarrier-Related Costs $1,200Back-up Power Costs Not Applicable
Background
This case involved a small-scale farmer in NewEngland who had previously installed a 10-kW windturbine on his property. He later installed a 900-Wattphotovoltaic (PV) system on his residence in theservice territory of an investor-owned utility. Theprincipal obstacle this customer encountered was thetechnical and contractual requirements that the utilityimposed before the customer could interconnect thePV system. Complying with these requirementsultimately cost the customer approximately $1,200,representing a 15-percent increase in the initialinstalled cost of the system; plus a recurring cost of$125 per year, representing a loss of nearly 69percent of the expected annual energy savings.
The PV system was installed in September 1992. Itconsists of eighteen 51-Watt PV modules on anactive tracker. The PV array originally was connectedto an inverter, which was replaced with a differentinverter. The system was interconnected to the mainbreaker panel in the residence, on the customer�s sideof the electric meter.
Technical Barriers
Engineering Reviews
Because the customer also had a wind turbine inoperation on the property, the utility expressedconcern about the operation of two separate inverters
in proximity. It required the customer to pay $600 foran engineering study to determine what safety issuesmight arise from having dual inverters on the samefeeder. In particular, the utility expressed concernabout the potential for the dual facilities to create an�islanding� condition, which theoretically can occurwhen a generating facility is improperly energizing apart of the utility grid while the rest of the utility gridis not functioning, as during a power outage. Theprimary concern is that islanding creates a potentialsafety hazard to utility line workers who mightunknowingly touch a feeder line energized by the�island� of generation.
After conducting the study, the utility concluded thatthe inverters might create a potential island andrequired the installation of separate protective relaysat a price of $600. The customer objected, noting thatboth inverters had appropriate protection againstislanding built into them. According to the customer,the utility acknowledged that the inverterspecifications �said all the right things,� but that theinverter�s protective functions were untested andunverifiable. (IEEE and the UL have begundeveloping technical standards for testing theprotective functions of inverters.) In effect, the utilitysaid that it was unfamiliar with the protectivecircuitry in the inverters and was more familiar �and therefore more comfortable � with the use ofseparate relays. It continued to enforce the separaterelay requirement, and the customer paid for them tobe installed.
Because the relays required by the utility weremechanical relays (rather than the solid-stateprotective circuitry built into the inverter), the utilityrequired annual testing of the relays for possiblerecalibration. The customer was charged $125 by theutility for annual testing of the relays. Because thecustomer�s PV system was small, it was onlyexpected to produce about $180 worth of electricityin any given year. As a result, the relay calibrationfee offsets more than two-thirds (69 percent) of theexpected savings from the PV system on an annualbasis.
77
Business Practice Barriers
Insurance Requirements
The utility also imposed a requirement that thecustomer carry $200,000 in commercial liabilityinsurance to cover potential liabilities from propertydamage or personal injury attributable to the PVsystem. The customer was a commercial farmingoperation that already carried commercial insurancein the required amount, so the utility�s requirementdid not impose any additional burden on thiscustomer. The utility also required that it be listed asan �additional insured� on the customer�s policy,which required the concurrence of the customer�sinsurer. The customer�s insurer agreed to thiscondition.
During the course of the conversation with hisinsurer, however, the customer learned that theinsurer does not provide commercial riders onstandard homeowner policies and that it does not add�additional insured� to homeowner policies.Therefore, the enforcement of these insurancerequirements could be a complete bar to theinstallation of PV systems on residential properties inthis utility�s service territory.
Finally, the customer reported that the utility hadrecently lifted the additional insured requirement forresidential customers with homeowner�s liabilitycoverage. The $200,000 insurance requirement is stillin effect.
Estimated Costs
The customer estimated that meeting utilityinterconnection requirements cost him $1,200 for theengineering study and the protective relays, plus$125 per year for the relay calibration. The customerfurther estimated that he had dedicated a total ofapproximately 200 hours over two separate six-month periods to meeting the utility�s requirementsand addressing the utility�s concerns.
Moreover, the manufacturers of the customer�sequipment were called on to provide wiringdiagrams, engineering schematics, and otherdocumentation to support the customer�s efforts toresolve the utility�s concerns. The customer wasunable to estimate this time and expense.
Distributed Generator�s Proposed Solutions
The customer suggested that inverter manufacturersdesign to a particular standard, with labels to indicatethat the inverter meets that standard, which theutilities would be required to automatically accept.
The customer also suggested that part of the problemwas the utility�s lack of familiarity with small-scale,customer-owned generating facilities. Some of theproblems he encountered would be resolved overtime as utilities gained more experience with thesefacilities.
Case #26 � 300-Watt PV System inPennsylvania
Technology/size Photovoltaic (300 Watt)Interconnected NoMajor Barrier Business PracticesBarrier-Related Costs $400Back-up Power Costs Not Known
Background
This simple case involved a resident of Pennsylvaniawhose PV contractor contacted the local utility aboutinstalling a 300-Watt integrated AC-solar-photovoltaic (PV) system (producing approximately250 Watts AC). The principal barrier encountered bythe customer was interconnection fees proposed bythe utility that would have erased the equivalent of 10years� energy savings from this small PV system.
The integrated AC PV system was one of severaltypes of so-called �AC modules� that represent oneof the most recent innovations in PV technology.Most PV systems consist of an array of multiple PVmodules that are interconnected to the utility gridthrough a single inverter. Until recently, mostinverters were sized to accommodate 2.5 kW to 5 kWof PV modules, roughly equivalent to the powerneeds of a standard residence. The price for completesystems of this size was approximately $25,000 to$40,000. Many potential customers interested in PVtechnology are unwilling or unable to afford theselarger, whole-house systems.
An AC module, by contrast, consists of a single PVmodule with its own micro-inverter. These micro-inverters range in size from 100 Watts to 300 Watts.
78
The attraction of AC modules is that they allowcustomers to invest in PV technology at pricesstarting as low as $900. Although the smallestsystems will typically only offset a small percentageof a typical residential customer�s electricity use(approximately two to four percent), they can beinstalled singly or in multiples to match thecustomer�s budget and desired energy savings.
However, because the amount of electricity generatedby an AC module is relatively modest, the potentialmarket for these self-contained PV systems dependson simplified interconnection at a minimum cost. Inthis case, interconnection charges that would beinsignificant for larger distributed generatingfacilities was prohibitive when imposed on thesesmall-scale systems.
Business Practice Barriers
Interconnection Fees
This customer sought to install an integrated AC PVmodule in the service territory of an investor-ownedutility. In accordance with the utility�s rules, thecustomer was provided with an application form andasked to submit a $100 processing fee. In addition,the utility indicated that it would bill the customer forthe actual costs �of processing the application andinspection of the facilities,� although �in no eventwill the charge exceed $300.�
These costs, which would be inconsequential for alarger generating facility, act as an effective bar to thecommercialization of AC modules in the smallerinstallations for which they were designed. The ACmodule in this case, for example, is expected toproduce approximately 400 kilowatt-hours (kWh) peryear in a moderate solar energy environment, whichrepresents approximately $40 per year in energysavings (assuming a retail price of 10¢/kWh). Thismeans that the $100 application fee and theprocessing/inspection fee of up to $300 equals 2.5years and 7.5 years of energy savings, respectively.
Another way of looking at these figures is that even ifa 250-Watt PV system was given to a customer freeof charge, the customer would have little incentive toinstall the system. The out-of-pocket cost tointerconnect the system would require 10 years worthof electricity generation to break even, or much
longer on a discounted present-value basis. In short,this case study suggests that for these small systemsto become commercially viable interconnection mustbe essentially a �Plug & Play� proposition, whichwill enable these units to be installed, interconnected,and operated at a minimal cost.
Estimated Costs
The cost of the barriers was between $100 and $400,plus time spent by customer and manufacturerworking with the utility on the application processand system inspection.
Distributed Generator�s Proposed Solutions
The manufacturer noted that the integrated ACmodule and other micro-inverters now available onthe market are fully compliant with safety and powerquality standards developed for utilityinterconnection of PV systems, including the IEEEP929 and UL 1741 standards. The manufacturer�sopinion was that compliance with these standardsfully addresses legitimate safety and power qualityconcerns, and that no additional testing or inspectionby the utility is necessary.
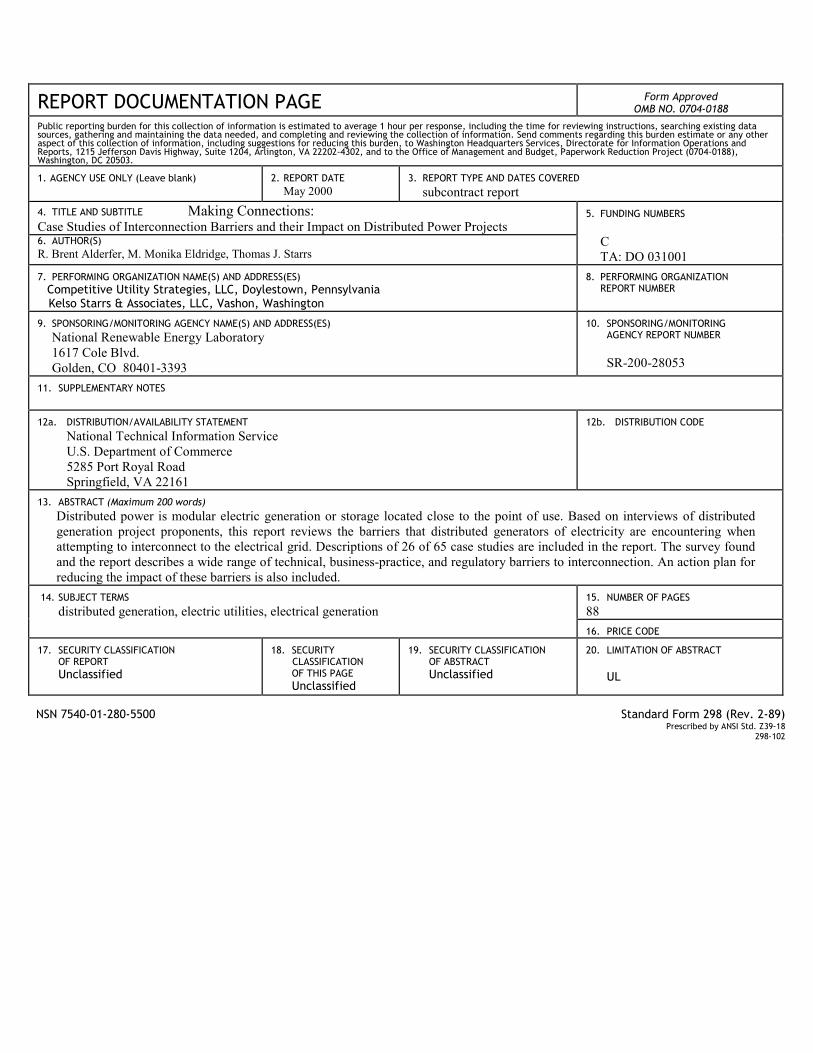
REPORT DOCUMENTATION PAGE Form ApprovedOMB NO. 0704-0188
Public reporting burden for this collection of information is estimated to average 1 hour per response, including the time for reviewing instructions, searching existing datasources, gathering and maintaining the data needed, and completing and reviewing the collection of information. Send comments regarding this burden estimate or any otheraspect of this collection of information, including suggestions for reducing this burden, to Washington Headquarters Services, Directorate for Information Operations andReports, 1215 Jefferson Davis Highway, Suite 1204, Arlington, VA 22202-4302, and to the Office of Management and Budget, Paperwork Reduction Project (0704-0188),Washington, DC 20503.
1. AGENCY USE ONLY (Leave blank) 2. REPORT DATEMay 2000
3. REPORT TYPE AND DATES COVEREDsubcontract report
4. TITLE AND SUBTITLE Making Connections:Case Studies of Interconnection Barriers and their Impact on Distributed Power Projects6. AUTHOR(S)R. Brent Alderfer, M. Monika Eldridge, Thomas J. Starrs
5. FUNDING NUMBERS
CTA: DO 031001
7. PERFORMING ORGANIZATION NAME(S) AND ADDRESS(ES)Competitive Utility Strategies, LLC, Doylestown, Pennsylvania
Kelso Starrs & Associates, LLC, Vashon, Washington
8. PERFORMING ORGANIZATIONREPORT NUMBER
9. SPONSORING/MONITORING AGENCY NAME(S) AND ADDRESS(ES)National Renewable Energy Laboratory1617 Cole Blvd.Golden, CO 80401-3393
10. SPONSORING/MONITORINGAGENCY REPORT NUMBER
SR-200-28053
11. SUPPLEMENTARY NOTES
12a. DISTRIBUTION/AVAILABILITY STATEMENTNational Technical Information ServiceU.S. Department of Commerce5285 Port Royal RoadSpringfield, VA 22161
12b. DISTRIBUTION CODE
13. ABSTRACT (Maximum 200 words)Distributed power is modular electric generation or storage located close to the point of use. Based on interviews of distributedgeneration project proponents, this report reviews the barriers that distributed generators of electricity are encountering whenattempting to interconnect to the electrical grid. Descriptions of 26 of 65 case studies are included in the report. The survey foundand the report describes a wide range of technical, business-practice, and regulatory barriers to interconnection. An action plan forreducing the impact of these barriers is also included.
15. NUMBER OF PAGES88
14. SUBJECT TERMSdistributed generation, electric utilities, electrical generation
16. PRICE CODE
17. SECURITY CLASSIFICATIONOF REPORTUnclassified
18. SECURITYCLASSIFICATIONOF THIS PAGEUnclassified
19. SECURITY CLASSIFICATIONOF ABSTRACTUnclassified
20. LIMITATION OF ABSTRACT
UL
NSN 7540-01-280-5500 Standard Form 298 (Rev. 2-89)Prescribed by ANSI Std. Z39-18
298-102