Embed Size (px)
Citation preview

making budgets attractive - best practices from governments’ financial transparency portalsDANNY LÄMMERHIRT

This report was researched and written by Danny Lämmerhirt on behalf of Open Budgets, a Horizon 2020 rese-arch project executed by Open Knowledge Foundation Deutschland, Fundacion Ciudadana Civio, Fraunhofer IAIS, Open Knowledge Greece, Universität Bonn, Journalism++, Transparency International EU Office, and Vysoka skola ekonomicka v Praze.
OpenBudgets.eu is a Horizon 2020 funded project that aims to provide a generic framework and concrete tools for supporting financial transparency, thus enhancing accountability within public administrations and reducing the possibility of corruption. A key challenge for OpenBudgets.eu is to provide a framework that is scalable, easy-to-use, flexible, and attractive. During the implementation of the project three pilot scenarios will run targeting three different applications related to public spending: journalism, anti-corruption initiatives and private citizenship en-gagement. OpenBudgets.eu involves various stakeholders, including but not limited to public administrations, ci-tizens, NGOs, media organisations and public service companies. Find out more at http://openbudgets.eu/about/.
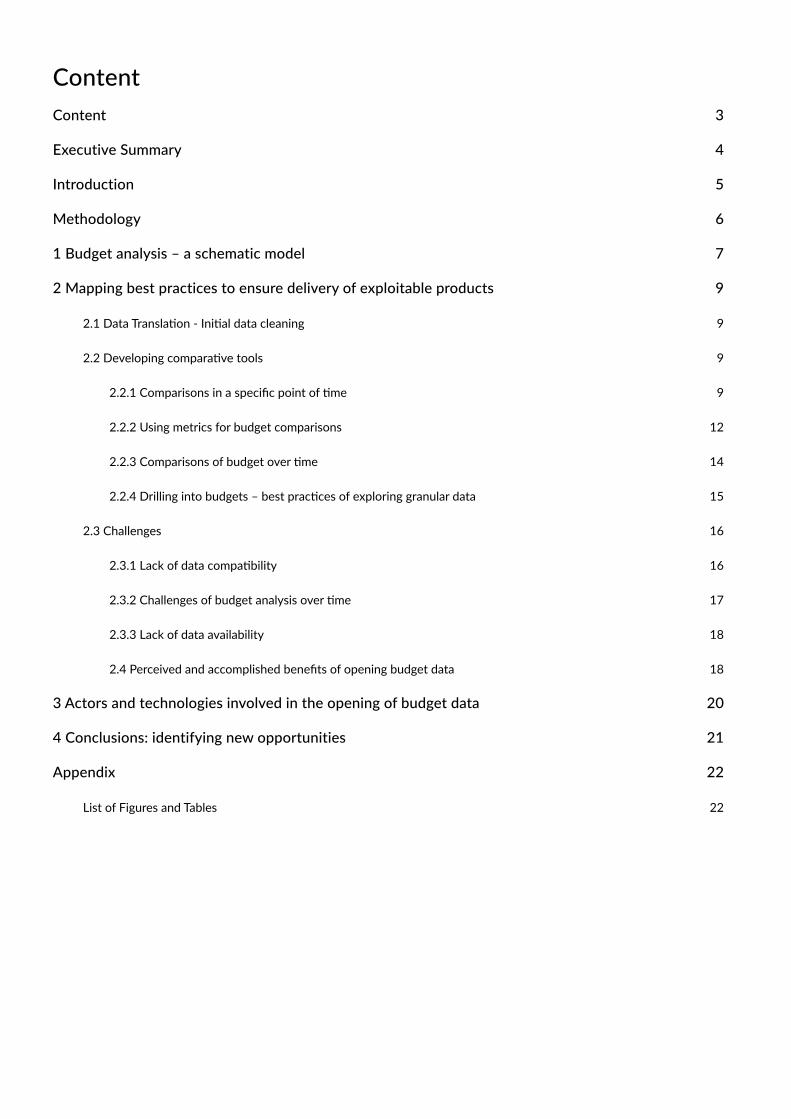
ContentContent 3
Executive Summary 4
Introduction 5
Methodology 6
1 Budget analysis – a schematic model 7
2 Mapping best practices to ensure delivery of exploitable products 9
2.1 Data Translation - Initial data cleaning 9
2.2 Developing comparative tools 9
2.2.1 Comparisons in a specific point of time 9
2.2.2 Using metrics for budget comparisons 12
2.2.3 Comparisons of budget over time 14
2.2.4 Drilling into budgets – best practices of exploring granular data 15
2.3 Challenges 16
2.3.1 Lack of data compatibility 16
2.3.2 Challenges of budget analysis over time 17
2.3.3 Lack of data availability 18
2.4 Perceived and accomplished benefits of opening budget data 18
3 Actors and technologies involved in the opening of budget data 20
4 Conclusions: identifying new opportunities 21
Appendix 22
List of Figures and Tables 22
4
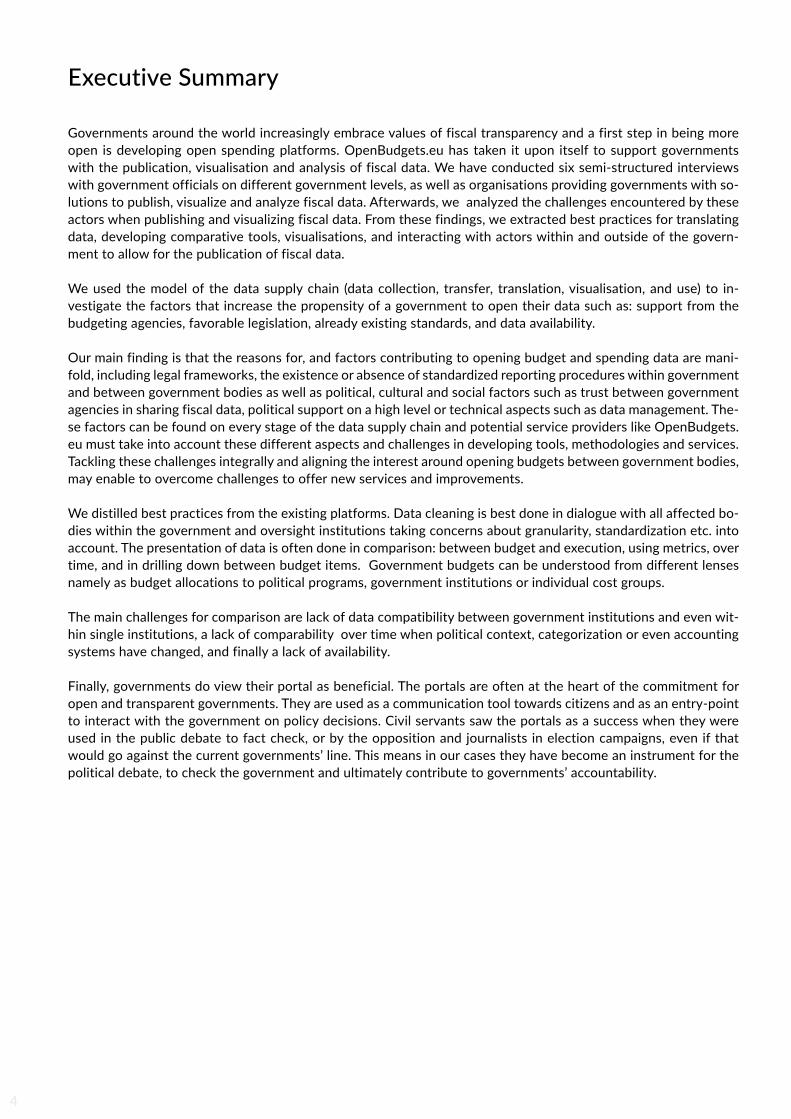
Executive Summary
Governments around the world increasingly embrace values of fiscal transparency and a first step in being more open is developing open spending platforms. OpenBudgets.eu has taken it upon itself to support governments with the publication, visualisation and analysis of fiscal data. We have conducted six semi-structured interviews with government officials on different government levels, as well as organisations providing governments with so-lutions to publish, visualize and analyze fiscal data. Afterwards, we analyzed the challenges encountered by these actors when publishing and visualizing fiscal data. From these findings, we extracted best practices for translating data, developing comparative tools, visualisations, and interacting with actors within and outside of the govern-ment to allow for the publication of fiscal data.
We used the model of the data supply chain (data collection, transfer, translation, visualisation, and use) to in-vestigate the factors that increase the propensity of a government to open their data such as: support from the budgeting agencies, favorable legislation, already existing standards, and data availability.
Our main finding is that the reasons for, and factors contributing to opening budget and spending data are mani-fold, including legal frameworks, the existence or absence of standardized reporting procedures within government and between government bodies as well as political, cultural and social factors such as trust between government agencies in sharing fiscal data, political support on a high level or technical aspects such as data management. The-se factors can be found on every stage of the data supply chain and potential service providers like OpenBudgets.eu must take into account these different aspects and challenges in developing tools, methodologies and services. Tackling these challenges integrally and aligning the interest around opening budgets between government bodies, may enable to overcome challenges to offer new services and improvements.
We distilled best practices from the existing platforms. Data cleaning is best done in dialogue with all affected bo-dies within the government and oversight institutions taking concerns about granularity, standardization etc. into account. The presentation of data is often done in comparison: between budget and execution, using metrics, over time, and in drilling down between budget items. Government budgets can be understood from different lenses namely as budget allocations to political programs, government institutions or individual cost groups.
The main challenges for comparison are lack of data compatibility between government institutions and even wit-hin single institutions, a lack of comparability over time when political context, categorization or even accounting systems have changed, and finally a lack of availability.
Finally, governments do view their portal as beneficial. The portals are often at the heart of the commitment for open and transparent governments. They are used as a communication tool towards citizens and as an entry-point to interact with the government on policy decisions. Civil servants saw the portals as a success when they were used in the public debate to fact check, or by the opposition and journalists in election campaigns, even if that would go against the current governments’ line. This means in our cases they have become an instrument for the political debate, to check the government and ultimately contribute to governments’ accountability.
5
Introduction
OpenBudgets develops a platform for the publication, analysis, visualization and comparison of public budget and spending data. Governments around the world increasingly embrace values of fiscal transparency, be it as part of the Open Government Partnership or as part of individual strategies to enhance fiscal transparency. Some gover-nments support legal mandates by implementing open budget data websites, offering budget data to download in bulk, through an API or by using different tools from visualizations to other explorative tools in order to enhance the public’s capacities of accessing, understanding and using budget data.
In our work, we aim to provide governments with technical solutions to foster their fiscal transparency strategies. This report sheds light on the best practices and needs of governments providing open budget data. The report gives expert insights into the workflows of governmental bodies producing, collecting, visualizing and using open budget data as well as challenges governments are currently facing when doing so. By mapping best practices and challenges, WP 8.6 lays out potential exploitation strategies that will feed into the conceptualization of relevant features.
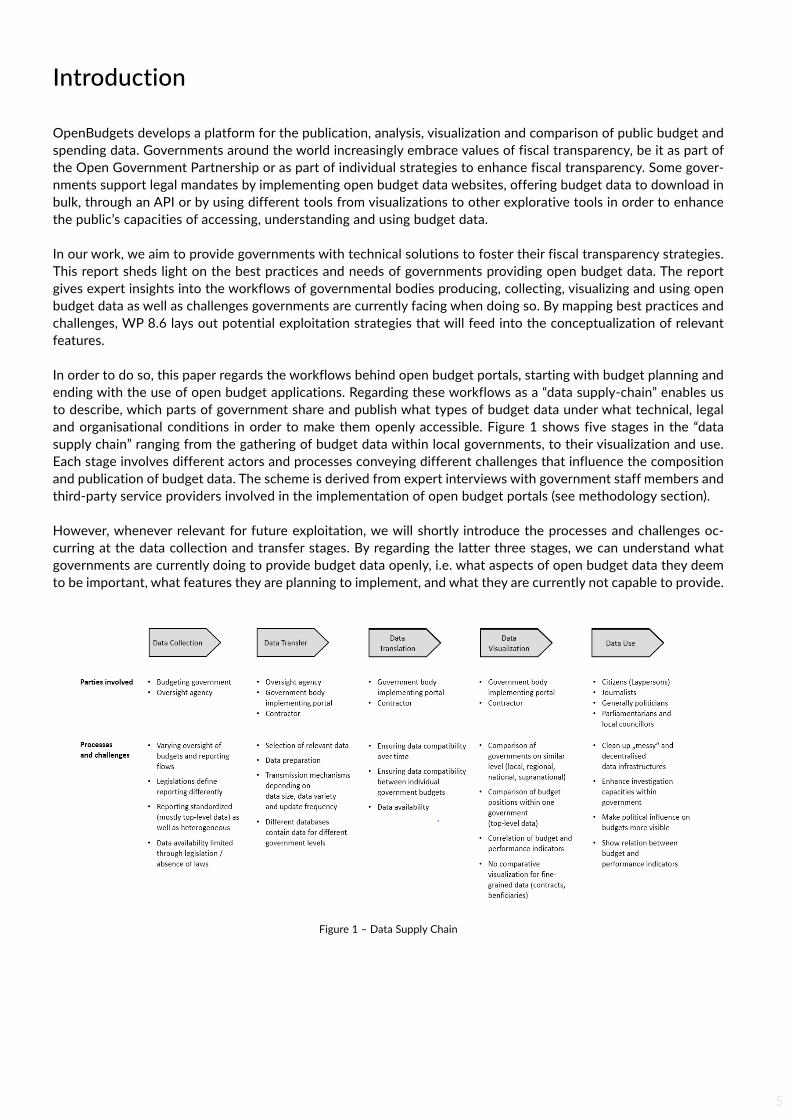
In order to do so, this paper regards the workflows behind open budget portals, starting with budget planning and ending with the use of open budget applications. Regarding these workflows as a “data supply-chain” enables us to describe, which parts of government share and publish what types of budget data under what technical, legal and organisational conditions in order to make them openly accessible. Figure 1 shows five stages in the “data supply chain” ranging from the gathering of budget data within local governments, to their visualization and use. Each stage involves different actors and processes conveying different challenges that influence the composition and publication of budget data. The scheme is derived from expert interviews with government staff members and third-party service providers involved in the implementation of open budget portals (see methodology section). However, whenever relevant for future exploitation, we will shortly introduce the processes and challenges oc-curring at the data collection and transfer stages. By regarding the latter three stages, we can understand what governments are currently doing to provide budget data openly, i.e. what aspects of open budget data they deem to be important, what features they are planning to implement, and what they are currently not capable to provide.
Figure 1 – Data Supply Chain
6
Methodology
This analysis is based on semi-structured, qualitative interviews with government staff members and third-party service providers involved in the technical implementation of open budget websites. Interviews have been con-ducted over a period of two months, starting in March 1, 2016 and ending in April 20, 2016. A semi-structured questionnaire was used to make findings comparable across cases. Additional desk research substantiated findings whenever necessary. The cases were sampled in consultation with existing networks of Open Knowledge Germany as well as the OpenSpending community.
Thereby six cases were gathered, including examples • using budget data from several administrative sources within European institutions or member states, (supra-
national, national, regional, local)• from different European countries and further afield (European Union, Germany, Hungary1, Italy, the Nether-
lands, Spain)• opening various types of data (planned and/or realized revenues and expenditures, performance indicators,
text files contextualising budget decisions - all at different levels of detail)• using different techniques to visualize, compare and analyse data • showing varying degrees of user-interaction (from static “dashboard”-pages to interactive visualizations).
While these cases do not claim to be representative, their diversity offers a rich entry point for an in-depth un-derstanding of the best practices and challenges when opening budget data in different European countries. The following section describes a schematic model for the various analyses applicable to budgets. Chapter 2 will sub-stantiate this model through real use cases of budgetary analysis tools and the challenges governments are facing when implementing them. Taken together, the schematic model, real use cases and current challenges help Open-Budgets to better position its services in the market and to address the needs of governments.
1 - In the case of Hungary, we interviewed a private organisation that is not affiliated with government and does not provide services for Hungarian government. We decided to include the example of Hungary because 1) there is no comparable government service available, and 2) the issues this organisation was facing in translating national Hungarian budgets proved to be relevant for OpenBudgets.eu.
7
1 Budget analysis – a schematic model
We observed a range of practices used by our interviewees to improve the comprehensibility of budgets. Budgets may be regarded for an individual government (figure 2) or across governments (figure 3). The following schematic models describe how budgets within one government as well as across governments may be compared through visualizations and other analytical and explorative tools.
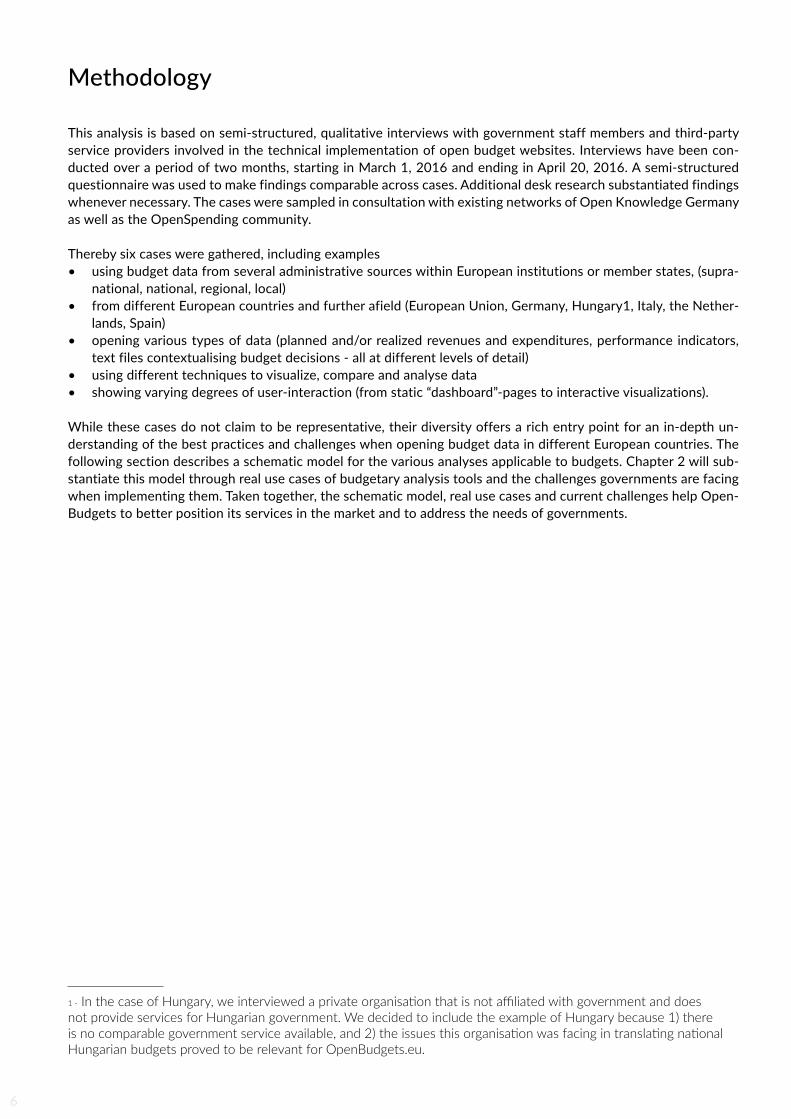
Figure 2 – Expenditure analysis scheme within a government budget
Figure 2 shows multiple ways of representing budgeted expenditures within one government. Expenditures may be grouped according to their goals (‘political area’ view), specific cost types (functional view), as well as institu-tions receiving budgets (institutional view). As our interviews show this distinction is not trivial, given that only one platform included all three perspectives (Presupuestos de Aragón), while others presented either programmatic perspectives, or a mix of two perspectives. A Hungarian interviewee argues that the institutional perspective (budget allocated to specific government bodies) does not necessarily convey relevant information for citizens or journalists. The functional perspective (does the government spend more money on schools, administration or other cost groups and policy areas) is considered to be more intelligible and relevant for these groups.
Every budget position may be disaggregated into smaller groupings increasing data granularity. Section 2.2.4 and 2.3.1 describe problems of limited data granularity some cases are facing. Some of our case studies show that governments may also associate benchmark metrics like indicators or “achievements” to budgets, be it on the top-program or sub-program level. Correlating benchmark metrics to expenditures is a repeatedly occurring issue that will be further discussed in section 2.2.2.
On each level, budget items (e.g. program 1 on level 2) may be analysed according to the budgeted money they receive in a specific point in time as well as over time. This also applies for the analysis and visualization of multiple budget items on a specific level. Temporal comparisons may cause issues of data comparability over time. Section 2.3.2 will shortly discuss different possibilities and issues when comparing budget positions.
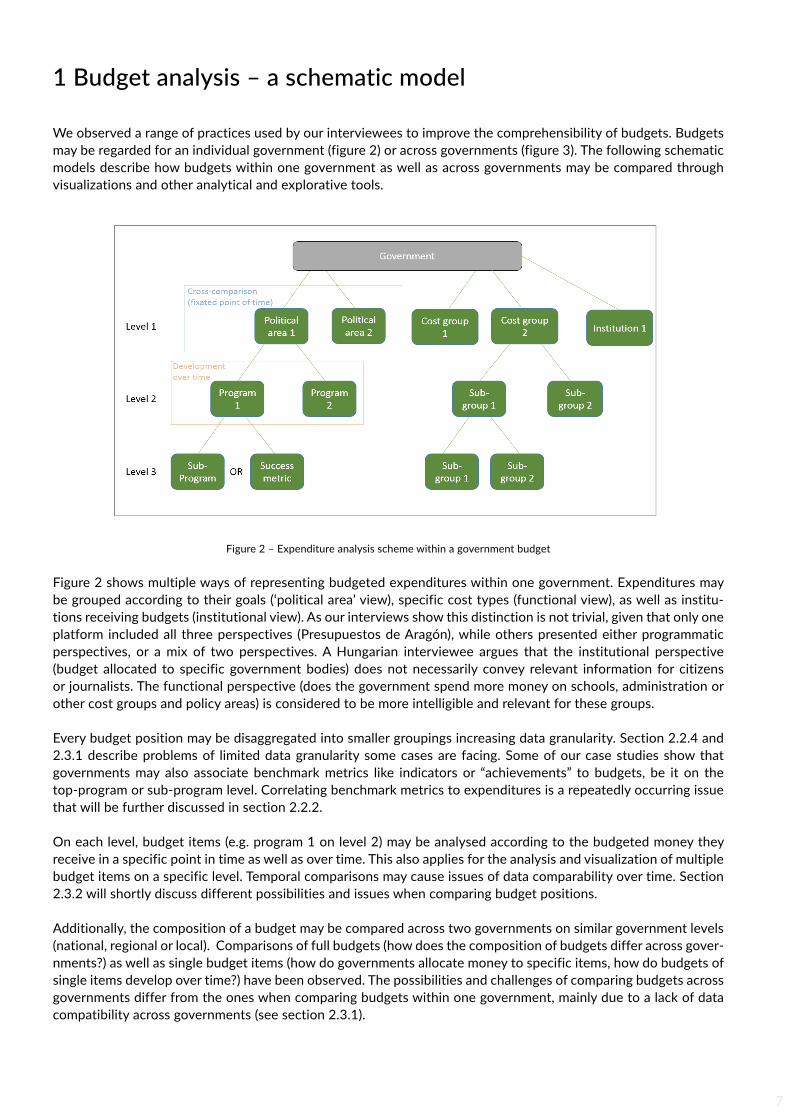
Additionally, the composition of a budget may be compared across two governments on similar government levels (national, regional or local). Comparisons of full budgets (how does the composition of budgets differ across gover-nments?) as well as single budget items (how do governments allocate money to specific items, how do budgets of single items develop over time?) have been observed. The possibilities and challenges of comparing budgets across governments differ from the ones when comparing budgets within one government, mainly due to a lack of data compatibility across governments (see section 2.3.1).
8
Figure 3 – Expenditure analysis scheme across government budgets
Outgoing from this schematic model we can derive a range of practices how users may explore, compare and analyse budget data, namely comparing budget items and drilling down into a specific budget item (exploring lower-level data). The possibilities and challenges enabling and hindering these actions will be presented in the following section.
9
2 Mapping best practices to ensure delivery of exploitable products
This section turns towards the best practices observed in our case studies.
2.1 Data translation - initial Data cleaning
After data are gathered by an oversight agency they are transferred to the department implementing an open bud-get data solution (see “data supply chain”). Some interviewees working with these departments told us that they do a first cleaning of data on a structural level (reorder relevant data to make them searchable), and on a content level (filtering data that are exempt from being published), either for legal reasons or because they are not seen to be comprehensible by the public.
Oversight bodies such as a Ministry of Finance use databases whose structure serves their internal workflows. However those databases may have limited usability for external parties. A Spanish interviewee reports that his team advised the regional treasury department to provide all budget data that is relevant for citizens in a structu-red, user-friendly format. His team selected rows and columns within the database, adapted the structure of data points (placing semicolons to separate values, etc.) and gave each data point a new position in their database to make them findable through queries.
A more content-focused selection of budget data was reported by a Dutch government employee and an Itali-an interviewee. The Dutch interviewee states that the regional Ministry of Finance expressed concerns about opening fine-grained budget data that are not intelligible by the public and was opposing a publication without a former data quality assessment. Currently an assessment is run within the regional government of Zuid Holland in order to understand whether the current budget terminology is either too technical and hardly comprehensible or user-friendly enough to be published. Similarly, the Italian case filters only the main budget information such as a cost position from more detailed information that has bureaucratic use, but is harder to understand for lay persons. Both cases show that government bodies see a need to translate budgeting schemes used by an oversight agency into workable data sets, both on a structural and a content level. Oversight agencies are important collaboration partners that may be engaged in the transfer of budget data and that may have a stake in developing a user-friendly terminology for budget data. For a successful exploitation, OpenBudgets may collaborate with these agencies and offer data cleaning, based on its semantic data model.
2.2 DEVELOPInG COmPArATIVE TOOLS
Our cases show manifold comparative visualizations and other tools conveying highlighting aspects of budgets differently. In the following we show best practices of visualizing data, including tools to compare single budget items and a set of budget items for a specific point in time, over a selected timespan, within one government or across governments.
This section will look at specific solutions developed by governments to demonstrate what is currently deemed to be important features to provide. Additionally, it will discuss current issues when doing so, that demonstrate services OpenBudgets may provide.
2.2.1 Comparisons in a specific point of time
As the schematic budget analysis model shows, budget positions may be compared and analysed for a specific
10
point of time. The benefits are that users may compare which political goals and programs governments emphasize in a specific point of time (political view), how cost positions perform against each other (functional view), or how much money individual government departments receive. Each of these views conveys different meanings and has different relevance for different stakeholders, and government actors have different goals and user groups in mind when designing these tools (see chapter 2.4 on perceived and accomplished benefits of opening budget data).
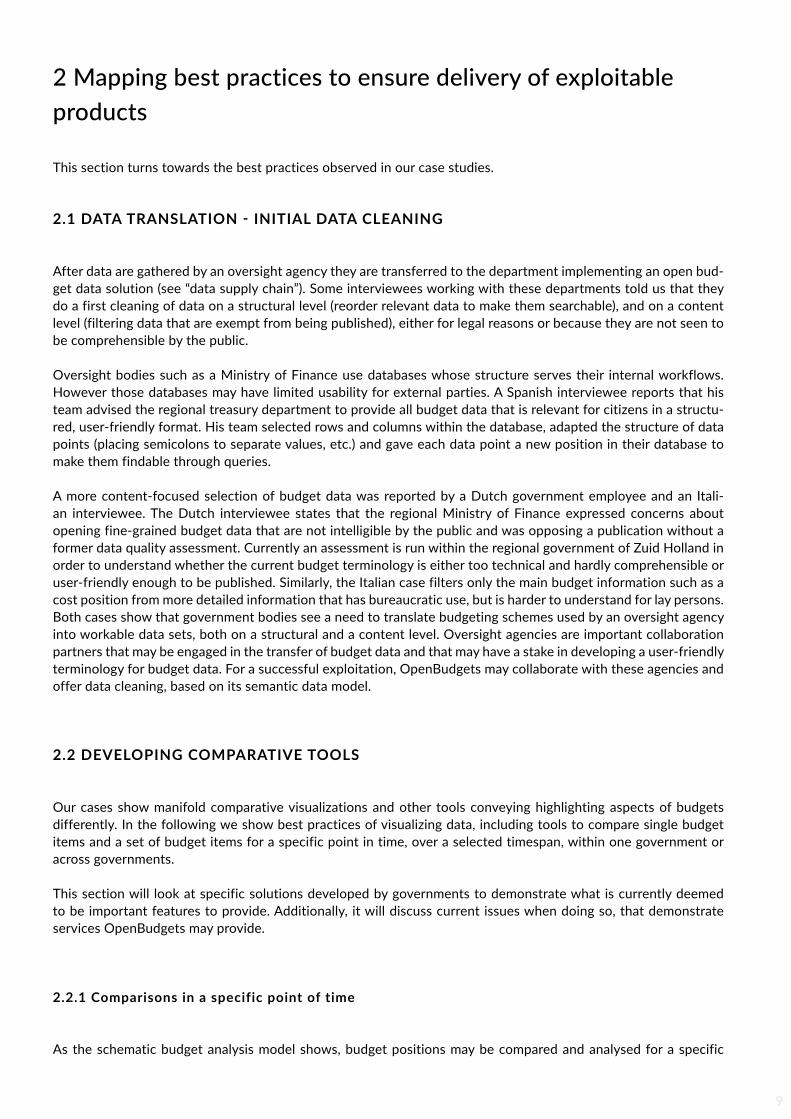
These tools may be static (as in the case of Zuid-Hollands bubble chart) or they can be more interactive, as in the case of Berlins portal “Haushaltspläne von Berlin”). The latter allows not only to distinguish and compare different budget positions expressed as differences in size, but also to modify the treemap by selecting different views, such as revenue or expenditures, government level (regional or local) as well as political, functional or institutional perspective. By clicking on one budget position, another treemap opens, making sub-budget items (distinguished by colour) comparable through their size.
Treemaps have two dimensions: color-coded squares mark an item, specific parameters of an item are compared through differences in size. The position of squares may indicate which budget item is the biggest (positioned left in figure 5), and which one is the smallest (far right in figure 5). Bubble charts may use the position of bubbles to highlight the development of a budget item over time.
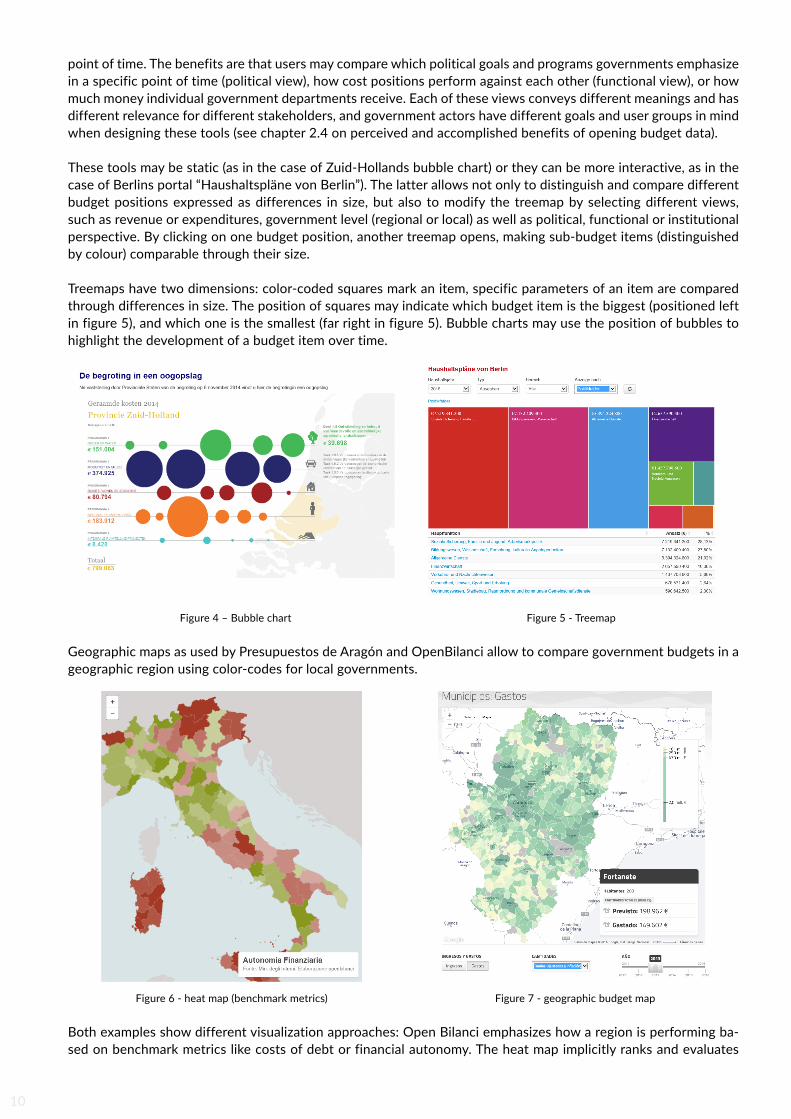
Geographic maps as used by Presupuestos de Aragón and OpenBilanci allow to compare government budgets in a geographic region using color-codes for local governments.
Both examples show different visualization approaches: Open Bilanci emphasizes how a region is performing ba-sed on benchmark metrics like costs of debt or financial autonomy. The heat map implicitly ranks and evaluates
Figure 5 - TreemapFigure 4 – Bubble chart
Figure 6 - heat map (benchmark metrics) Figure 7 - geographic budget map
11
regions according to their performance (green, better performance, red = worse performance). Presupuestos de Aragón offers a different viewpoint. It provides data about budget size per local government. To allow for different comparisons, budgets may be regarded per capita, or as nominal and real value (for different issues of comparabi-lity, see also section 2.2.2.).
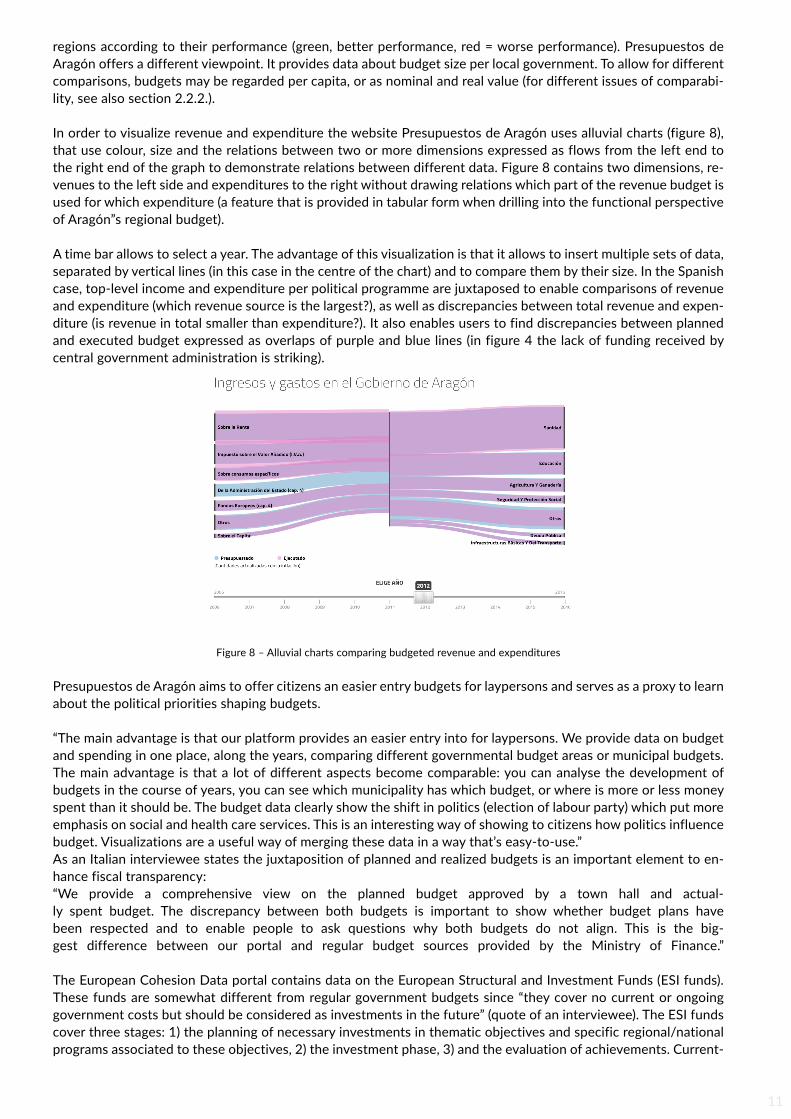
In order to visualize revenue and expenditure the website Presupuestos de Aragón uses alluvial charts (figure 8), that use colour, size and the relations between two or more dimensions expressed as flows from the left end to the right end of the graph to demonstrate relations between different data. Figure 8 contains two dimensions, re-venues to the left side and expenditures to the right without drawing relations which part of the revenue budget is used for which expenditure (a feature that is provided in tabular form when drilling into the functional perspective of Aragón”s regional budget).
A time bar allows to select a year. The advantage of this visualization is that it allows to insert multiple sets of data, separated by vertical lines (in this case in the centre of the chart) and to compare them by their size. In the Spanish case, top-level income and expenditure per political programme are juxtaposed to enable comparisons of revenue and expenditure (which revenue source is the largest?), as well as discrepancies between total revenue and expen-diture (is revenue in total smaller than expenditure?). It also enables users to find discrepancies between planned and executed budget expressed as overlaps of purple and blue lines (in figure 4 the lack of funding received by central government administration is striking).
Figure 8 – Alluvial charts comparing budgeted revenue and expenditures
Presupuestos de Aragón aims to offer citizens an easier entry budgets for laypersons and serves as a proxy to learn about the political priorities shaping budgets.
“The main advantage is that our platform provides an easier entry into for laypersons. We provide data on budget and spending in one place, along the years, comparing different governmental budget areas or municipal budgets. The main advantage is that a lot of different aspects become comparable: you can analyse the development of budgets in the course of years, you can see which municipality has which budget, or where is more or less money spent than it should be. The budget data clearly show the shift in politics (election of labour party) which put more emphasis on social and health care services. This is an interesting way of showing to citizens how politics influence budget. Visualizations are a useful way of merging these data in a way that’s easy-to-use.”As an Italian interviewee states the juxtaposition of planned and realized budgets is an important element to en-hance fiscal transparency: “We provide a comprehensive view on the planned budget approved by a town hall and actual-ly spent budget. The discrepancy between both budgets is important to show whether budget plans have been respected and to enable people to ask questions why both budgets do not align. This is the big-gest difference between our portal and regular budget sources provided by the Ministry of Finance.”
The European Cohesion Data portal contains data on the European Structural and Investment Funds (ESI funds). These funds are somewhat different from regular government budgets since “they cover no current or ongoing government costs but should be considered as investments in the future” (quote of an interviewee). The ESI funds cover three stages: 1) the planning of necessary investments in thematic objectives and specific regional/national programs associated to these objectives, 2) the investment phase, 3) and the evaluation of achievements. Current-
12
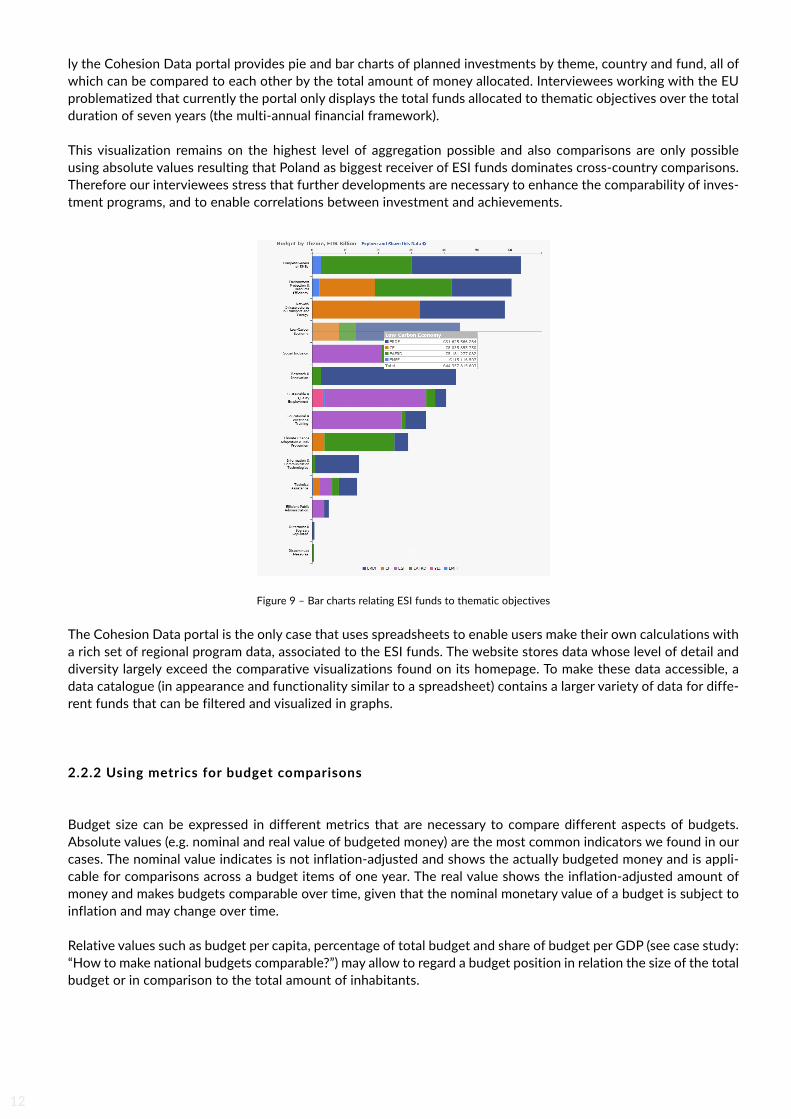
ly the Cohesion Data portal provides pie and bar charts of planned investments by theme, country and fund, all of which can be compared to each other by the total amount of money allocated. Interviewees working with the EU problematized that currently the portal only displays the total funds allocated to thematic objectives over the total duration of seven years (the multi-annual financial framework).
This visualization remains on the highest level of aggregation possible and also comparisons are only possible using absolute values resulting that Poland as biggest receiver of ESI funds dominates cross-country comparisons. Therefore our interviewees stress that further developments are necessary to enhance the comparability of inves-tment programs, and to enable correlations between investment and achievements.
Figure 9 – Bar charts relating ESI funds to thematic objectives
The Cohesion Data portal is the only case that uses spreadsheets to enable users make their own calculations with a rich set of regional program data, associated to the ESI funds. The website stores data whose level of detail and diversity largely exceed the comparative visualizations found on its homepage. To make these data accessible, a data catalogue (in appearance and functionality similar to a spreadsheet) contains a larger variety of data for diffe-rent funds that can be filtered and visualized in graphs.
2.2.2 Using metrics for budget comparisons
Budget size can be expressed in different metrics that are necessary to compare different aspects of budgets. Absolute values (e.g. nominal and real value of budgeted money) are the most common indicators we found in our cases. The nominal value indicates is not inflation-adjusted and shows the actually budgeted money and is appli-cable for comparisons across a budget items of one year. The real value shows the inflation-adjusted amount of money and makes budgets comparable over time, given that the nominal monetary value of a budget is subject to inflation and may change over time.
Relative values such as budget per capita, percentage of total budget and share of budget per GDP (see case study: “How to make national budgets comparable?”) may allow to regard a budget position in relation the size of the total budget or in comparison to the total amount of inhabitants.
13
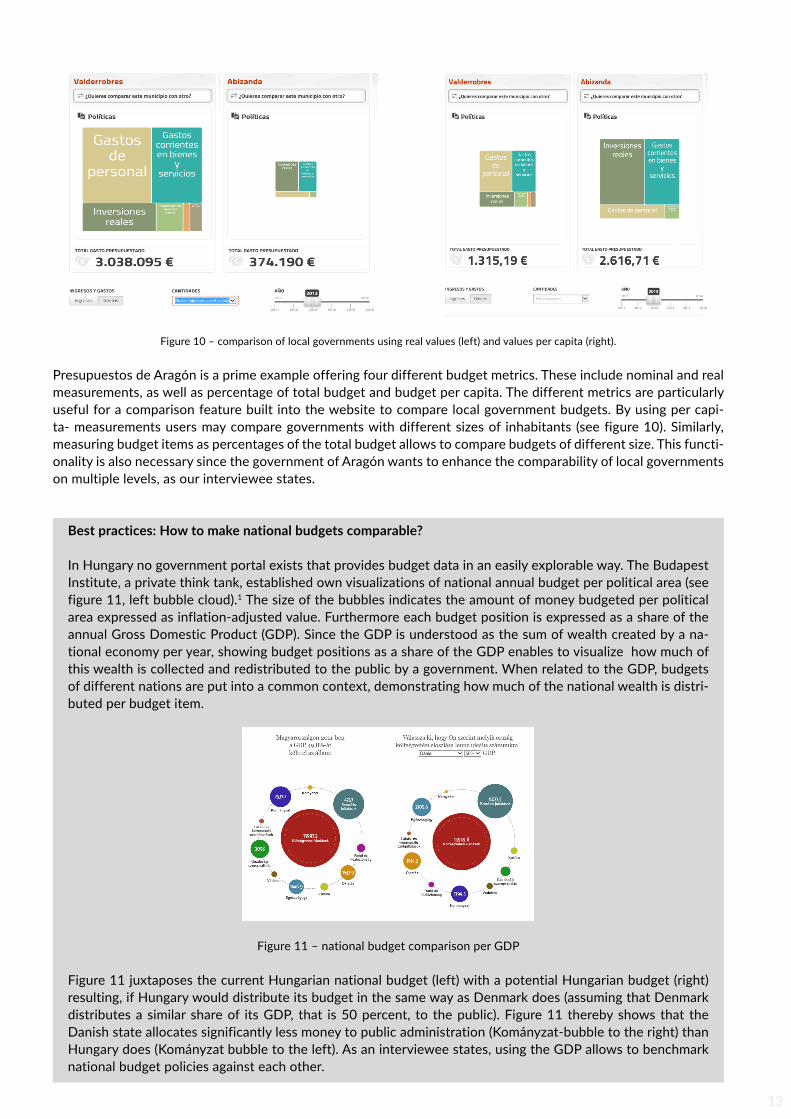
Figure 10 – comparison of local governments using real values (left) and values per capita (right).
Presupuestos de Aragón is a prime example offering four different budget metrics. These include nominal and real measurements, as well as percentage of total budget and budget per capita. The different metrics are particularly useful for a comparison feature built into the website to compare local government budgets. By using per capi-ta- measurements users may compare governments with different sizes of inhabitants (see figure 10). Similarly, measuring budget items as percentages of the total budget allows to compare budgets of different size. This functi-onality is also necessary since the government of Aragón wants to enhance the comparability of local governments on multiple levels, as our interviewee states.
Best practices: How to make national budgets comparable?
In Hungary no government portal exists that provides budget data in an easily explorable way. The Budapest Institute, a private think tank, established own visualizations of national annual budget per political area (see figure 11, left bubble cloud).1 The size of the bubbles indicates the amount of money budgeted per political area expressed as inflation-adjusted value. Furthermore each budget position is expressed as a share of the annual Gross Domestic Product (GDP). Since the GDP is understood as the sum of wealth created by a na-tional economy per year, showing budget positions as a share of the GDP enables to visualize how much of this wealth is collected and redistributed to the public by a government. When related to the GDP, budgets of different nations are put into a common context, demonstrating how much of the national wealth is distri-buted per budget item.
Figure 11 – national budget comparison per GDP
Figure 11 juxtaposes the current Hungarian national budget (left) with a potential Hungarian budget (right) resulting, if Hungary would distribute its budget in the same way as Denmark does (assuming that Denmark distributes a similar share of its GDP, that is 50 percent, to the public). Figure 11 thereby shows that the Danish state allocates significantly less money to public administration (Kományzat-bubble to the right) than Hungary does (Kományzat bubble to the left). As an interviewee states, using the GDP allows to benchmark national budget policies against each other.
14
2.2.3 Comparisons of budget over time
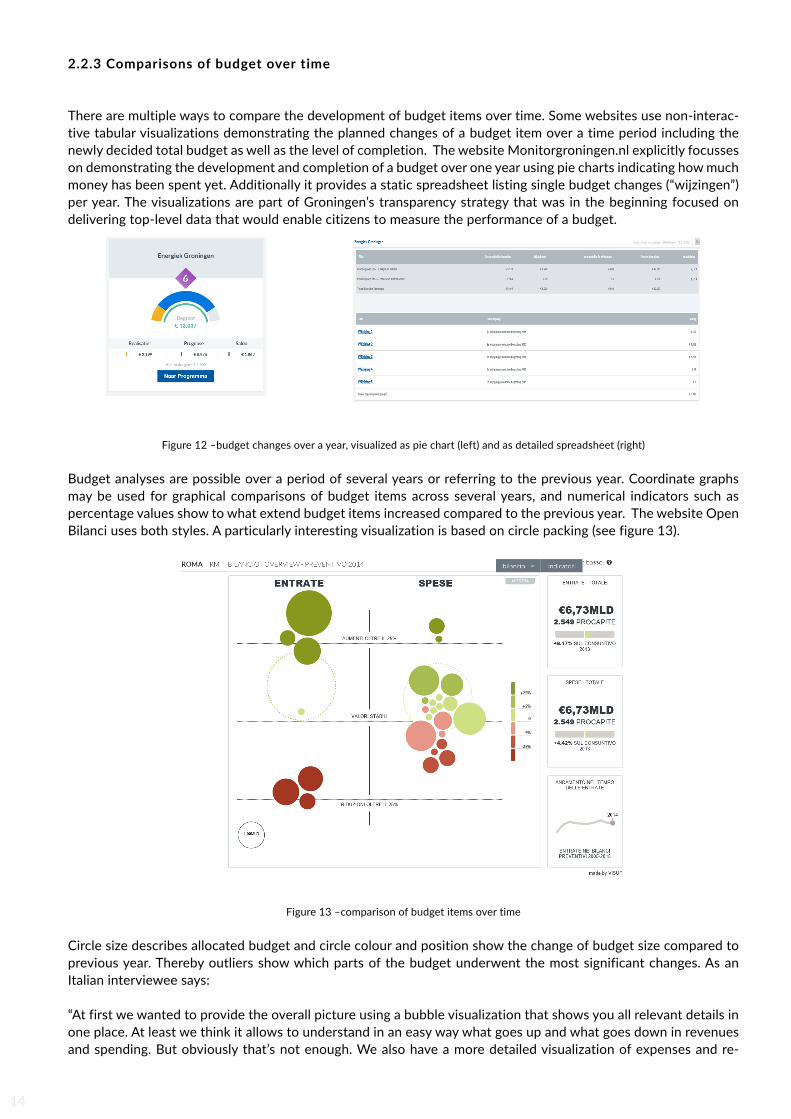
There are multiple ways to compare the development of budget items over time. Some websites use non-interac-tive tabular visualizations demonstrating the planned changes of a budget item over a time period including the newly decided total budget as well as the level of completion. The website Monitorgroningen.nl explicitly focusses on demonstrating the development and completion of a budget over one year using pie charts indicating how much money has been spent yet. Additionally it provides a static spreadsheet listing single budget changes (“wijzingen”) per year. The visualizations are part of Groningen’s transparency strategy that was in the beginning focused on delivering top-level data that would enable citizens to measure the performance of a budget.
Figure 12 –budget changes over a year, visualized as pie chart (left) and as detailed spreadsheet (right)
Budget analyses are possible over a period of several years or referring to the previous year. Coordinate graphs may be used for graphical comparisons of budget items across several years, and numerical indicators such as percentage values show to what extend budget items increased compared to the previous year. The website Open Bilanci uses both styles. A particularly interesting visualization is based on circle packing (see figure 13).
Figure 13 –comparison of budget items over time
Circle size describes allocated budget and circle colour and position show the change of budget size compared to previous year. Thereby outliers show which parts of the budget underwent the most significant changes. As an Italian interviewee says:
“At first we wanted to provide the overall picture using a bubble visualization that shows you all relevant details in one place. At least we think it allows to understand in an easy way what goes up and what goes down in revenues and spending. But obviously that’s not enough. We also have a more detailed visualization of expenses and re-
15
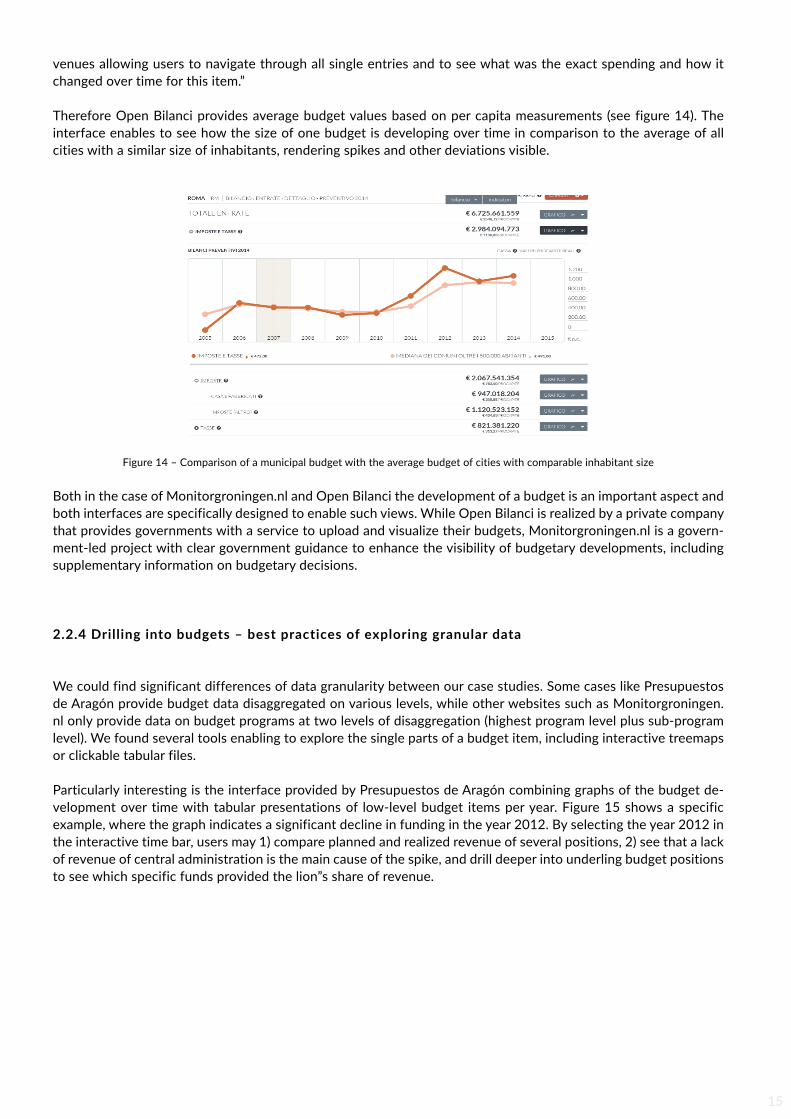
venues allowing users to navigate through all single entries and to see what was the exact spending and how it changed over time for this item.”
Therefore Open Bilanci provides average budget values based on per capita measurements (see figure 14). The interface enables to see how the size of one budget is developing over time in comparison to the average of all cities with a similar size of inhabitants, rendering spikes and other deviations visible.
Figure 14 – Comparison of a municipal budget with the average budget of cities with comparable inhabitant size
Both in the case of Monitorgroningen.nl and Open Bilanci the development of a budget is an important aspect and both interfaces are specifically designed to enable such views. While Open Bilanci is realized by a private company that provides governments with a service to upload and visualize their budgets, Monitorgroningen.nl is a govern-ment-led project with clear government guidance to enhance the visibility of budgetary developments, including supplementary information on budgetary decisions.
2.2.4 Drilling into budgets – best practices of exploring granular data
We could find significant differences of data granularity between our case studies. Some cases like Presupuestos de Aragón provide budget data disaggregated on various levels, while other websites such as Monitorgroningen.nl only provide data on budget programs at two levels of disaggregation (highest program level plus sub-program level). We found several tools enabling to explore the single parts of a budget item, including interactive treemaps or clickable tabular files.
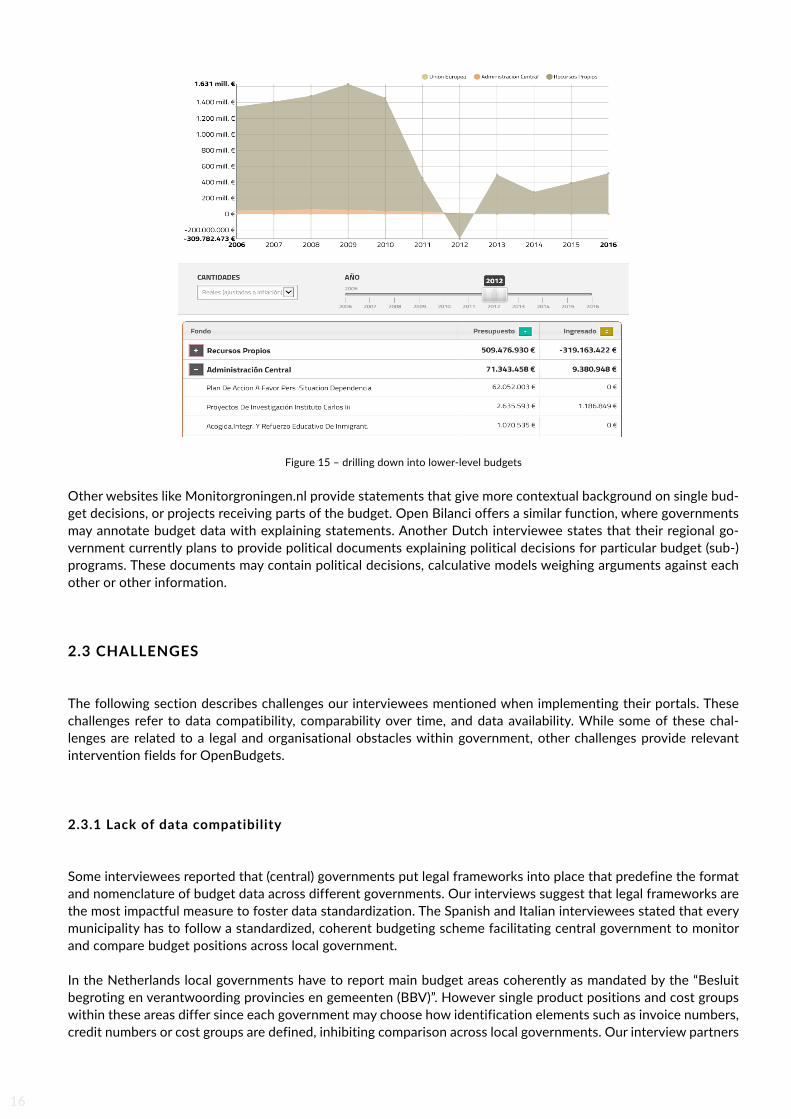
Particularly interesting is the interface provided by Presupuestos de Aragón combining graphs of the budget de-velopment over time with tabular presentations of low-level budget items per year. Figure 15 shows a specific example, where the graph indicates a significant decline in funding in the year 2012. By selecting the year 2012 in the interactive time bar, users may 1) compare planned and realized revenue of several positions, 2) see that a lack of revenue of central administration is the main cause of the spike, and drill deeper into underling budget positions to see which specific funds provided the lion”s share of revenue.
16
Figure 15 – drilling down into lower-level budgets
Other websites like Monitorgroningen.nl provide statements that give more contextual background on single bud-get decisions, or projects receiving parts of the budget. Open Bilanci offers a similar function, where governments may annotate budget data with explaining statements. Another Dutch interviewee states that their regional go-vernment currently plans to provide political documents explaining political decisions for particular budget (sub-)programs. These documents may contain political decisions, calculative models weighing arguments against each other or other information.
2.3 CHALLEnGES
The following section describes challenges our interviewees mentioned when implementing their portals. These challenges refer to data compatibility, comparability over time, and data availability. While some of these chal-lenges are related to a legal and organisational obstacles within government, other challenges provide relevant intervention fields for OpenBudgets.
2.3.1 Lack of data compatibility
Some interviewees reported that (central) governments put legal frameworks into place that predefine the format and nomenclature of budget data across different governments. Our interviews suggest that legal frameworks are the most impactful measure to foster data standardization. The Spanish and Italian interviewees stated that every municipality has to follow a standardized, coherent budgeting scheme facilitating central government to monitor and compare budget positions across local government.
In the Netherlands local governments have to report main budget areas coherently as mandated by the “Besluit begroting en verantwoording provincies en gemeenten (BBV)”. However single product positions and cost groups within these areas differ since each government may choose how identification elements such as invoice numbers, credit numbers or cost groups are defined, inhibiting comparison across local governments. Our interview partners
17
within Dutch regional governments told us that a new legal framework2 will soon be put into place standardizing low-level budget data across governments. While it causes significant organisational efforts for government bu-reaucracy it is seen to facilitate the compatibility of data across governments and will provide government with better oversight mechanisms.
Another caveat was described by an Italian interviewee when mapping spending data, namely that governments privatize public services differently.3 “Even though we expose the money that is being spent on specific areas, it is not necessarily all the money that a city in general will spend, because it might outsource a task to a company that is to 20 percent owned by the mu-nicipality. This will not be included in the municipal budget but would be considered public spending. Unless you do a comprehensive research which processes are outsourced, it is hard to get a complete picture of how much a town hall actually spends. This is also the hardest part to convey to the public: not necessarily all the data you see on our website [Open Bilanci, note by the author] reflect the actual spending, meaning that budgeted expenditures are lower than the actual size of public spending.”
On an EU level the investment cycle of the ESIF is different from the other cases and contains programmes, pro-gress being made and final achievements. At the current stage only the investment programmes and their allocated budgets are visualized. A major problem is that national and regional investment programmes do not only have different nomenclatures, comparable to different naming for cost groups in budgets. Programmes are also different content-wise which is why their progress is hard to compare. Our interviewees working with the EU say that the functionalities on their website are “hard-wired” by European legislation. Legislation prescribes eleven thematic objectives, 123 intervention fields and even more achievements depending on the situation of nations and regions. Therefore an interviewee working with the EU states “The problem is not having the data but how to come up with a tool that allows for easy comparison in an intuitive way. In particular we are asking ourselves how we can visualize different investment per the-matic objective. These investments may differ widely even within one nation. If you compare how re-gions invest in our overall objective “low carbon economy” you might see different priorities. One go-vernment is spending more in renewable energy, another one might invest more in energy efficiency.”
The interviewees confirmed that having a semantic model to integrate the manifold national and regional programs is a relevant solution for this challenge. This applies also to manifold achievements (i.e. outputs per investment pro-gram). Like investment funds, these are currently aggregated and visualized on a top-level (e.g. 55000 SMEs shall be supported by 2020) without specifying achievements per region that may vary in quantity and quality. The EU considers using bar charts in the future instead of lead tables in order to monitor how programmes are progressing. This is due to the fact that programs and achievements are hardly comparable among each other.
Mostly all interviewees saw potential to enhance existing functions of their websites. A commonly shared wish was to publish and visualize fine-grained data like public contracting data or invoices. It is perceived that such measures would greatly benefit accountability, however this wish may collide with current legislation preventing from a co-herent documentation of such information. This suggests that OpenBudgets has to consider the readiness of single countries and their legislations to exploit its services. Some countries might not be in need of standardizing data, others have a much more diverse budget structure, especially on a more granular level.
2.3.2 Challenges of budget analysis over time
Our interview partners reported a caveat when trying to implement data comparisons over a period of time: the shifting definitions of budget items. Data compatibility may be inhibited by political decisions leading to changes of budget composition and nomenclature. Some websites such as monitorgroningen.nl or Open Bilanci specifically focus on the presentation and comparison of budgets over time. In the case of Open Bilanci the shifting nomencla-ture of budget positions in Italian local governments inhibits a direct comparability of individual budget positions over years. In order to allow for their comparability the developers of Open Bilanci built a general data framework
2 - In the Netherlands an upcoming nation-wide legislation called “wet open overheid” will regulate homogeneous categorisations of disaggregated financial data, including how personal data should be treated.
3 - The OECD provided an in-depth study about the linkage between budgeting and public-private partnerships, suggesting that outsourcing practices of governments are heterogeneous and pose a problem to comparability of government budgets, fiscal efficiency and government performance. See also: https://www.oecd.org/gov/budgeting/43410287.pdf
18
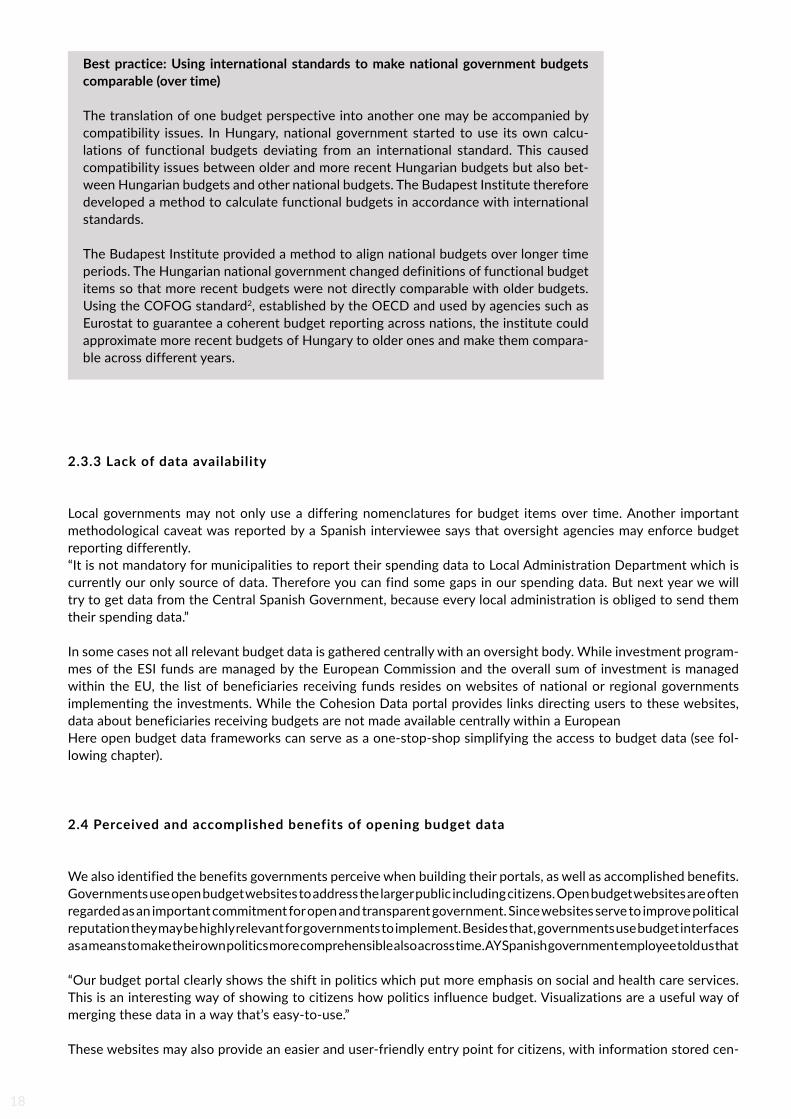
that would allow to incorporate shifting budget terminology. Best practice: Using international standards to make national government budgets comparable (over time)
The translation of one budget perspective into another one may be accompanied by compatibility issues. In Hungary, national government started to use its own calcu-lations of functional budgets deviating from an international standard. This caused compatibility issues between older and more recent Hungarian budgets but also bet-ween Hungarian budgets and other national budgets. The Budapest Institute therefore developed a method to calculate functional budgets in accordance with international standards.
The Budapest Institute provided a method to align national budgets over longer time periods. The Hungarian national government changed definitions of functional budget items so that more recent budgets were not directly comparable with older budgets. Using the COFOG standard2, established by the OECD and used by agencies such as Eurostat to guarantee a coherent budget reporting across nations, the institute could approximate more recent budgets of Hungary to older ones and make them compara-ble across different years.
2.3.3 Lack of data availability
Local governments may not only use a differing nomenclatures for budget items over time. Another important methodological caveat was reported by a Spanish interviewee says that oversight agencies may enforce budget reporting differently. “It is not mandatory for municipalities to report their spending data to Local Administration Department which is currently our only source of data. Therefore you can find some gaps in our spending data. But next year we will try to get data from the Central Spanish Government, because every local administration is obliged to send them their spending data.”
In some cases not all relevant budget data is gathered centrally with an oversight body. While investment program-mes of the ESI funds are managed by the European Commission and the overall sum of investment is managed within the EU, the list of beneficiaries receiving funds resides on websites of national or regional governments implementing the investments. While the Cohesion Data portal provides links directing users to these websites, data about beneficiaries receiving budgets are not made available centrally within a European Here open budget data frameworks can serve as a one-stop-shop simplifying the access to budget data (see fol-lowing chapter).
2.4 Perceived and accomplished benefits of opening budget data
We also identified the benefits governments perceive when building their portals, as well as accomplished benefits. Governments use open budget websites to address the larger public including citizens. Open budget websites are often regarded as an important commitment for open and transparent government. Since websites serve to improve political reputation they may be highly relevant for governments to implement. Besides that, governments use budget interfaces as a means to make their own politics more comprehensible also across time. AY Spanish government employee told us that
“Our budget portal clearly shows the shift in politics which put more emphasis on social and health care services. This is an interesting way of showing to citizens how politics influence budget. Visualizations are a useful way of merging these data in a way that’s easy-to-use.”
These websites may also provide an easier and user-friendly entry point for citizens, with information stored cen-
19
trally in one place (and can be read as an answer to the challenges of data availability mentioned in section 2.3.3) A German interviewee argued that
“Our portal provides a central repository for government budgets and communal budgets in one central place. This allows to get an overview of the budgets with the advantage that citizens do not have to visit single department websites with very different user-experience thereby making it more difficult for citizens to navigate them.”
A Dutch interviewee argued that budget interfaces simplify data management within government at large:
“More broadly I think that open data cleans up messy digital data and simplifies data management. Whether the government receives requests from outside about particular data via FOI request or wants to inform itself about particular data: having all data in one place simplifies accessibility and usability of these data.”
In line with that government employees repeatedly told us that open budget websites serve as a proxy to manage incoming requests for budget data. Some portals already documented that journalists are using their portals for investigations into budgets. In other cases politicians like councillors in local government or parliamentarians used these platforms.
“You can see that having the data ready in a machine-readable format changes the questions parliamentarians ask to the government. Using XLS files for example allows to compare particular cost positions in a much easier way. So I would say that machine-readability definitely enhances local parliament’s capacities to send specific inquiries to government.”- A Dutch interviewee
In Italy mayors quoted the numbers presented in a budget portal during municipal elections to contest the politics of current mayors. As an Italian interviewee puts it “this is a little bit of a success for us, because it shows that our project becomes part of the public opinion.”
This means that budget platforms have manifold benefits, from easier and centralised access to budget informati-on, easier visualizations that make budgets comprehensible to laypersons, to their function as a proxy to decrease direct requests of journalists or enhanced possibilities to scrutinize government.
20
3 Actors and technologies involved in the opening of budget data
In addition, we analysed whether governments partner with external service providers. This included questions which software solutions and codes underlie their interfaces and whether they are proprietary or open source.The results of these questions are mixed. Some cases like the regional governments of Aragón and Zuid Holland provide the web development in-house, while most governments we interviewed collaborate with external part-ners. An interviewee working with the EU argued that timely and cost-efficient delivery of their Cohesion Data portal would rather be met by an external provider, in this case American open data service provider Socrata. Other governments like the two regional Dutch governments we interviewed report that it was the expertise in the field leading them to cooperate with external partners, in this case the Dutch Open State Foundation.
Contrary, our Spanish interviewee argued that “At first we tried to use Open Spending code, but quickly realized that it is too heavy-weight. We decided to collaborate with an external company and develop code adapted to our needs. This was primarily a technical decision, however I think that it also gave our initiative more political weight. Building ‘our code’ showed commitment to open data and is now a flagship for other Spanish regional governments to adapt.”
Most interviewees use open source software with exceptions of Monitorgroningen and the Cohesion Data Portal. Asking our interviewees about the reasons most answered that their government has put open source policies into place. In Spain the code was specifically aimed to be reproduced by other governments. Important and recurring obstacles were constraints of time and workforce within government. While our interview partners reported that their governments would like to implement more functionalities and experiment with alter-native data visualizations, there would be no time or staff available to experiment especially with more complex problems. This problem was articulated by interviewees in the EU, but also in regional governments.
21
4 Conclusions: identifying new opportunitiesThis paper demonstrates that governments use manifold ways to make different aspects of budget data more ac-cessible. We can see that governments have particular viewpoints on a budget they want to emphasize and some parts of government are more supportive in promoting open budgets than others. For an efficient exploitation of financial transparency services, one has to take into account these different standpoints and identify and collabo-rate with government departments that understand the value of opening budget data. Several factors may influ-ence an effective exploitation such as existing legal frameworks aiming to put open budget platforms into place or already existing platforms that could be enhanced through open budgets and open spending services. While financial oversight agencies or statistical departments are the primary source of budget data, they may have legal or organisational considerations not to provide particular data (including granular data). These inconsistencies of data availability across governments cannot directly be influenced by financial transparency projects and may pose limits to its exploitability. In other cases legislations prevent from homogeneous budget data, and their conversion into comparable formats is seen as a costly task. Service providers in the field of financial transparency may there-fore may exploit specific services, such as semantic data models in jurisdictions with heterogeneous budgets that may profit the most from such models.
The benefits and need for services planned by OpenBudgets.eu – including cloud-based semantic data models to integrate, compare and analyse various data – are clearly recognized by governments. Governments document improvements of their services (less direct budget requests, centralized and uniform data infrastructure) and of government transparency and reputation. Governments have different interests and want to highlight different aspects through their open budget tools – including functional, political and institutional perspectives of a budget, comparisons of national budgets, visualizations of the changes in budgets within a timeframe, comparisons of all local governments in a country, or budget visualizations to explain political agendas behind budgets. Our analysis shows that these different viewpoints are not mutually exclusive but are rather linked to a specific design decision governments have to make to provide a coherent user experience. Additionally, complementary features are often seen as interesting solutions, but cannot be provided given internal constraints of time and workforce. Service providers may tap the need to enhance and complement existing functions of websites, but also should take into account the use value of different visualizations and analytics tools, since different political priorities are linked to them.
In addition to existing features there is a set of challenges, sometimes inhibiting more granular analysis (both th-rough the absence of available data and the abundance of heterogeneous granular data), in other cases limiting comparisons (e.g. when budget definitions change over time). Sometimes these challenges correspond to concrete wishes of governments to enhance their budget portals. For instance, interviewees working with the EU argued that semantic models are highly relevant for the Cohesion Data portal to transform the abundance of investment data into more comprehensible visualizations.
22
Appendix
LIST OF FIGUrES AnD TABLES
Figure 1 – Data Supply ChainFigure 2 – Expenditure analysis scheme within a government budgetFigure 3 – Expenditure analysis scheme across government budgetsFigure 4 – Bubble chart Figure 5 - TreemapFigure 6 - Heat map (benchmark metrics) Figure 7 – Geographic budget map Figure 8 – Alluvial charts comparing budgeted revenue and expenditures Figure 9 – Bar charts relating ESI funds to thematic objectivesFigure 10 – Comparison of local governments using real values (left) and values per capita (right).Figure 11 – National budget comparison per GDPFigure 12 –Budget changes over a year, visualized as pie chart (left) and as detailed spreadsheet (right)Figure 13 –Comparison of budget items over timeFigure 14 – Comparison of a municipal budget with the average budget of cities with comparable inhabitant size Figure 15 – Drilling down into lower-level budgets

23