Embed Size (px)
Citation preview
Making a Small Market Thrive: Recommendations for Efficiency Gains in the Latin American Air Cargo Market Tomás Serebrisky, Jordan Schwartz, María Claudia Pachón and Andrés Ricover
TRANSPORT PAPERS TP – 35 MARCH 2011

2
3
M A K I N G A S M A L L M A R K E T T H R I V E : R E C O M M E N D A T I O N S F O R E F F I C I E N C Y G A I N S I N T H E L A T I N A M E R I C A N A I R C A R G O M A R K E T
Tomás Serebrisky, Jordan Schwartz, María Claudia Pachón and Andrés Ricover
4
2011 The International Bank for Reconstruction and Development / The World Bank
1818 H Street NW Washington, DC 20433 Telephone 202-473-1000 Internet: www.worldbank.org
This volume is a product of the staff of The World Bank. The findings, interpretations, and conclusions expressed in this volume do not necessarily reflect the views of the Executive Directors of The World Bank or the governments they represent.
The World Bank does not guarantee the accuracy of the data included in this work. The boundaries, colors, denominations, and other information shown on any map in this work do not imply any judgment on the part of The World Bank concerning the legal status of any territory or the endorsement or acceptance of such boundaries.
Rights and Permissions
The material in this publication is copyrighted. Copying and/or transmitting portions or all of this work without permission may be a violation of applicable law. The International Bank for Reconstruction and Development / The World Bank encourages dissemination of its work and will normally grant permission to reproduce portions of the work promptly.
For permission to photocopy or reprint any part of this work, please send a request with complete information to the Copyright Clearance Center Inc., 222 Rosewood Drive, Danvers, MA 01923, USA; telephone: 978-750-8400; fax: 978-750-4470; Internet: www.copyright.com. All other queries on rights and licenses, including subsidiary rights, should be addressed to the Office of the Publisher, The World Bank, 1818 H Street NW, Washington, DC 20433, USA; fax: 202-522-2422; e-mail: [email protected].
To order additional copies of this publication, please send an e-mail to the Transport Help Desk [email protected]
Transport publications are available on-line at http://www.worldbank.org/transport/
Cover photo: Nina Chantrasmi; http://www.sxc.hu/photo/1072845
5
CONTENTS Acknowledgements ................................................................................................................................................................ 7
Abbreviations and Acronyms ............................................................................................................................................. 9
Executive Summary .............................................................................................................................................................. 11
1. The Air Cargo Market in Latin America .............................................................................................................. 13
2. Regulatory Structure .................................................................................................................................................. 25
2.1. Background................................................................................................................................................................ 25
2.2. A Review of Air Service Agreements in Latin America ............................................................................ 28
2.3. Quantitative Analysis............................................................................................................................................. 32
2.4. Conclusions on the Regulartory Structure ................................................................................................... 35
3. Physical and Soft Barriers to Effective Integration ........................................................................................ 37
3.1. Air cargo Infrastructure ....................................................................................................................................... 37
3.2. Soft Barrier Constraints........................................................................................................................................ 39
4. Recommendations ....................................................................................................................................................... 43
5. References ....................................................................................................................................................................... 45
APPENDIX: Freedoms of the Air ...................................................................................................................................... 46
List of Figures
Figure 1-1: Latin America and the Caribbean, GDP growth and air freight growth (1995-2008) ....... 15 Figure 1-2: Intra-Latin America and Caribbean freight-ton kilometers carried by Alta member airlines ....................................................................................................................................................................................... 16 Figure 1-3: Intra-Regional freight-ton kilometers ................................................................................................... 17 Figure 1-4: Cargo volumes of the largest LAC markets compared with the top 15 airports in the world ................................................................................................................................................................ .......................... 18 Figure 1-5: Worldwide estimates of air cargo growth ........................................................................................... 19 Figure 1-6: Cargo forecast between Latin America and the United States and Europe…………………. 20 Figure 1-7: Cargo traffic share of select Latin American and Caribbean countries………………………...21 Figure 1-8: Miami airport. Latin American trading partners………………………………………………………..22 Figure 3-1: Infrastructure survey results .................................................................................................................... 38 Figure 3-2: Operations survey results .......................................................................................................................... 39
List of Tables
Table 1-1: Miami International Airport (MIA) top commodity trade, 2008 ................................................. 22 Table 1-2: Traffic share of the top 20 cargo routes within Latin America and the Caribbean .............. 23 Table 1-3: Cargo airlines based in the LAC region (2009)………………………………………………24 Table 2-1: Air service agreement models: from restrictive to liberal……………………….. ………26 Table 2-2: Scheduled cargo services, by airline domicile country……………………………. ………33 Table 2-3: Share of authorized capacity currently in use, by airline domicile country …………………………………………………………………………………………………………………………………………………34

6
7
A C K N O W L E D G E M E N T S America and the Caribbean (LAC) Meeting of Ministers of Finance held in Lima, Peru in May, 2010.
This paper benefitted from the comments provided by Augusto de la Torre, Chief Economist of the LAC Region in the World Bank. The authors are also grateful to several airlines in Latin America and in particular to LAN and TACA for the detailed information provided. This paper reflects only the authors’ views, and should be used and cited accordingly. The findings, interpretations, and conclusions are the authors’ own. They should not be attributed to the World Bank, its Board of Directors, its management, or any of its member countries.

8
9
A B B R E V I A T I O N S A N D A C R O N Y M S
ACI Airports Council International
AEA Association of European Airlines
AIP Aeronautical Information Publication
ALTA Asociación Latinoamericana de Transporte Aéreo (Latin American Airline Association)
ASA Air Service Agreement
ATA Air Transport Association
CAN Comunidad Andina (Andean Community)
ECLAC Economic Commission for Latin America and the Caribbean
FTK Freight-ton Kilometer
ICAO International Civil Aviation Organization
IDB Inter-American Development Bank
LAC Latin America
MALIAT Multilateral Agreement on the Liberalization of International Air Transportation
OAG Official Airline Guide
WB The World Bank

10
11
E X E C U T I V E S U M M A R Y
Air cargo origin destination flows in the Latin America and the Caribbean (LAC) region are heavily concentrated in the largest economies of South America and Mexico. With 32.7 percent of the airfreight moved to, from, and within the region, Brazil is the largest cargo market, followed by Colombia and Mexico, with 17.9 percent and 16.0 percent, respectively.
On an intra-regional level, and according to the International Civil Aviation Organization (ICAO), the top 20 routes by tonnage concentrate over 90 percent of the within-the-region cargo traffic. Brazil accounts for 86.9 percent of intra-Latin America and the Caribbean cargo flows. Of those over 50 percent is between Brazil and Colombia.
The size of the air cargo market in LAC is very small and is heavily concentrated in trade with Miami. Miami international airport has become the gateway for trade with the United States and a hub for trade with other regions (Miami controls the north/south cargo flows in the Western Hemisphere, as it handles 82 percent of all air imports and 79 percent of all exports from LAC). Most of the air cargo originating in LAC is made up of: (a) flowers from Colombia and Ecuador, (b) pharmaceuticals from Brazil, (c) asparagus from Peru, (d) salmon from Chile, and (e) berries from Argentina. The southbound traffic (that is, imports from Miami to LAC) includes (a) electronic equipment (computers, cell phones), (b) machinery, and (c) mining equipment. Overall, air cargo trade with Miami is quite imbalanced, since more tons arrive than depart, especially in trade with Brazil.
The relatively small size of the air cargo market in LAC can be explained by: (i) low levels of demand for air cargo services (supply responds adequately to a low demand for air cargo services in/from LAC), or (ii) restrictions to a properly functioning market that impede the air cargo market to reach its full potential. The analysis carried out for the preparation of this paper indicates that the low levels of demand is the most reasonable explanation for the small size of the LAC air cargo market. There is room to improve some regulations which would make the air cargo market work more efficiently and probably at lower costs, but the size and diversity of the market will not significantly change as a result.
Traffic between Latin America and the United States–the most important market for air cargo- is expected to grow 5.8 percent per year between 2010 and 2027.1
1 The source for this growth estimates is Boeing. This company provides estimates by sub-region (South America, Central America, or the Caribbean).
The forecast for South America has marginally higher growth rates of air cargo flows to/from Europe than to the United States (6.0 percent to 5.8 percent), whereas air freight between Central America and Europe is expected to have lower growth rates than to the United States at 5.4 and 5.8 percent respectively. Cargo traffic between the Caribbean and the United States and Europe is forecast to grow at a slower pace than South and Central America. The expected average annual air cargo growth rate between the Caribbean and the United States
12
is 1.5 percent, and 3.4 percent between the Caribbean and Europe. Interestingly, Airbus forecasts that the largest traffic increases in air cargo traffic in the region will be driven by the flows between South America and China.
With only a few exceptions, current authorized capacity defined by bilateral in LAC leaves room for additional air transport supply (flight frequencies). The analysis carried out in this paper shows that designated air carriers are not using all the frequencies allowed by the Air Service Agreements (ASA). Most bilateral agreements grant fifth freedom rights, allowing an airline to schedule a flight with stops in multiple countries (this kind of operation is common in the air cargo business). The most important potential constraint is the fact that ASAs usually set maximum capacity thresholds for both passenger and cargo services potentially restricting capacity for cargo as it is usually the case that passenger frequencies are prioritized over cargo. Furthermore, though the authorized routes might be enough for the number of flights in operation, it can limit competition by leaving little room for new players.
Airport infrastructure quality fairs well overall, although some isolated issues exist in certain airports in LAC. Infrastructure limitations were evaluated through a survey conducted by an association of LAC airlines (ALTA). The results of the survey show that even the worst rated airports received an acceptable score in absolute terms (at least 3.1 on a scale from 1 (worst) to 5 (better)). There are some isolated infrastructure issues at certain airports, although none appear to be critical for an efficient operation. The survey points out that the airlines’ prime concern is related to ground handling costs, which at some airports are high because of lack of competition due to the existence of legal barriers to entry aim at guaranteeing exclusive rights to a single service provider.
Policy recommendations to improve the efficiency of the air cargo market in Latin America and the Caribbean:
A multilateral open skies agreement can improve the efficiency of the market
A multilateral open skies agreement to eliminate those aspects of the bilateral agreements that prevent open and unrestricted market access can improve the regulatory structure of the air cargo market and foster its development and growth. The available evidence is clear: open skies agreements reduce transport costs. In the United States, open skies agreements reduced air transport costs by 9 percent and increased the share of imports arriving by air by 7 percent.2
Infrastructure does not pose a restriction on cargo traffic flows, but an improved regulatory framework for efficient ancillary services is required.
Alternately, bilateral agreements that do not allow unlimited capacity should be modified to at least allocate dedicated frequencies for cargo services. Fifth freedom rights should be more widespread and unrestricted.
Infrastructure for air cargo does not pose a restriction to increasing cargo flows, but the availability of competitively priced ancillary services and airport services access charges do. The authorities must strengthen airports’ regulatory frameworks, ensuring that ancillary services (such as ground handling) are provided under
2 For a detailed study on the impact of open skies on air cargo transport costs see Micco and Serebrisky (2006) “Competition regimes and air transport costs: the effects of open skies agreements” Journal of International Economics 70, 25-51.
13
competitive conditions by a minimum number of providers. In the same line, access charges or royalties that the airport operator is allowed to levy on the service providers should be closely monitored by airport regulators, as they are passed on to the airlines and subsequently to the end customer (exporter/importer).
Soft constraints (that is, IT systems, customs, security) can be improved to lower operating costs.
Policies aimed at reducing operating costs and related to soft constraints should also be implemented: paperless customs procedures, improved security in airport premises and streamlining of custom inspection processes.
Given their regulatory nature, the proposed recommendations do not entail large monetary costs. But they require leadership, commitment and extensive negotiations amongst countries. The process of negotiation and definition of policies and their implementation can take time, but it can result in important improvements to air cargo in the region, thus increasing the potential of this transportation mode.

14
15
T H E A I R C A R G O M A R K E T I N L A T I N A M E R I C A
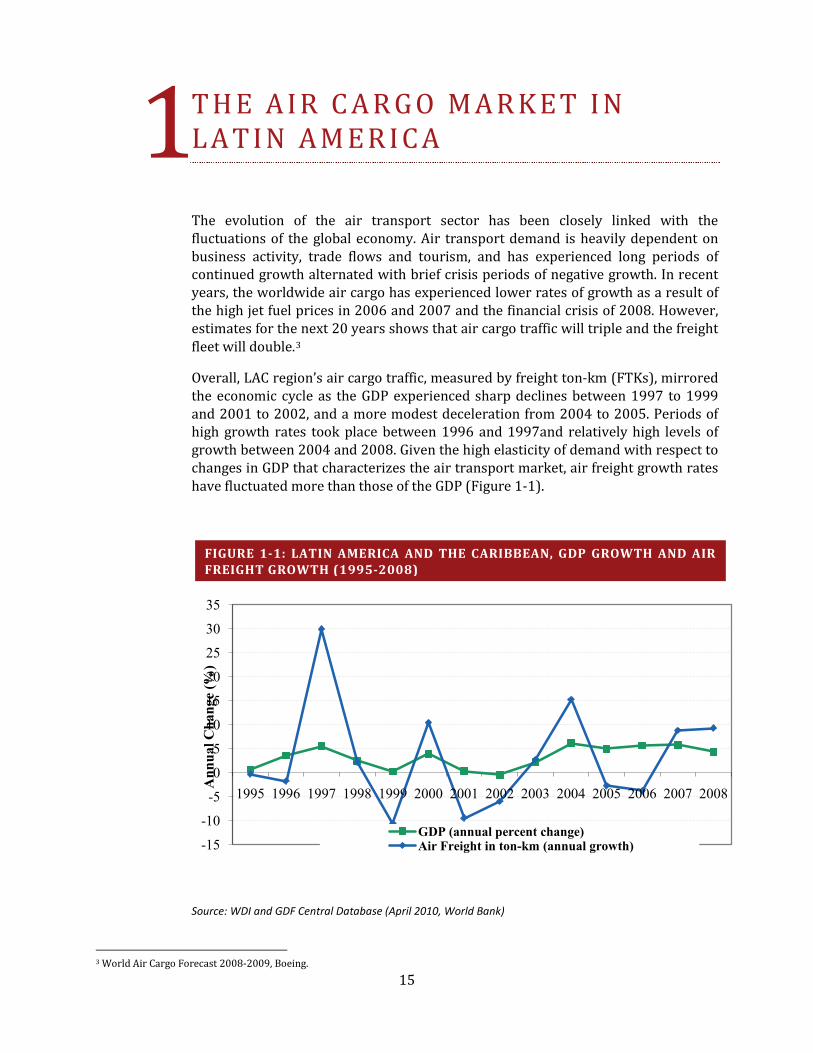
The evolution of the air transport sector has been closely linked with the fluctuations of the global economy. Air transport demand is heavily dependent on business activity, trade flows and tourism, and has experienced long periods of continued growth alternated with brief crisis periods of negative growth. In recent years, the worldwide air cargo has experienced lower rates of growth as a result of the high jet fuel prices in 2006 and 2007 and the financial crisis of 2008. However, estimates for the next 20 years shows that air cargo traffic will triple and the freight fleet will double.3
Overall, LAC region’s air cargo traffic, measured by freight ton-km (FTKs), mirrored the economic cycle as the GDP experienced sharp declines between 1997 to 1999 and 2001 to 2002, and a more modest deceleration from 2004 to 2005. Periods of high growth rates took place between 1996 and 1997and relatively high levels of growth between 2004 and 2008. Given the high elasticity of demand with respect to changes in GDP that characterizes the air transport market, air freight growth rates have fluctuated more than those of the GDP (Figure 1-1).
Source: WDI and GDF Central Database (April 2010, World Bank)
3 World Air Cargo Forecast 2008-2009, Boeing.
-15
-10
-5
0
5
10
15
20
25
30
35
1995 1996 1997 1998 1999 2000 2001 2002 2003 2004 2005 2006 2007 2008
Ann
ual C
hang
e (%
)
GDP (annual percent change)Air Freight in ton-km (annual growth)
1
FIGURE 1-1: LATIN AMERICA AND THE CARIBBEAN, GDP GROWTH AND AIR FREIGHT GROWTH (1995-2008)
16
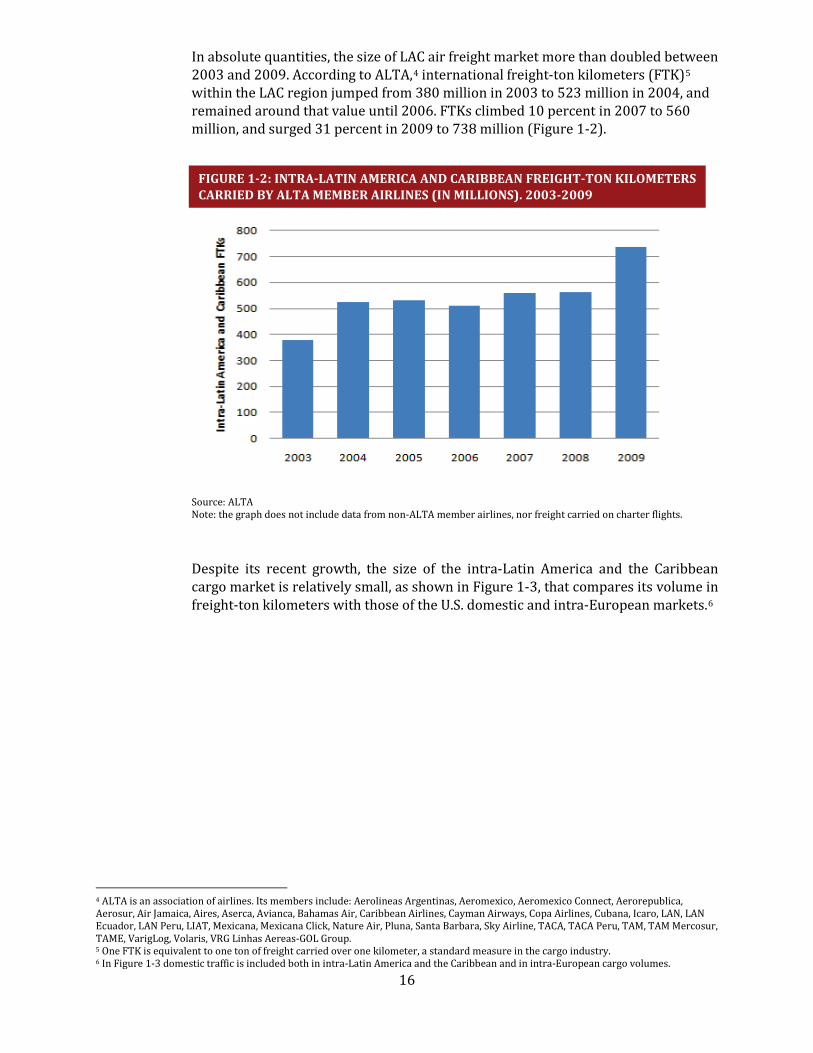
In absolute quantities, the size of LAC air freight market more than doubled between 2003 and 2009. According to ALTA,4 international freight-ton kilometers (FTK)5
within the LAC region jumped from 380 million in 2003 to 523 million in 2004, and remained around that value until 2006. FTKs climbed 10 percent in 2007 to 560 million, and surged 31 percent in 2009 to 738 million (Figure 1-2).
Source: ALTA Note: the graph does not include data from non-ALTA member airlines, nor freight carried on charter flights.
Despite its recent growth, the size of the intra-Latin America and the Caribbean cargo market is relatively small, as shown in Figure 1-3, that compares its volume in freight-ton kilometers with those of the U.S. domestic and intra-European markets.6
4 ALTA is an association of airlines. Its members include: Aerolineas Argentinas, Aeromexico, Aeromexico Connect, Aerorepublica, Aerosur, Air Jamaica, Aires, Aserca, Avianca, Bahamas Air, Caribbean Airlines, Cayman Airways, Copa Airlines, Cubana, Icaro, LAN, LAN Ecuador, LAN Peru, LIAT, Mexicana, Mexicana Click, Nature Air, Pluna, Santa Barbara, Sky Airline, TACA, TACA Peru, TAM, TAM Mercosur, TAME, VarigLog, Volaris, VRG Linhas Aereas-GOL Group. 5 One FTK is equivalent to one ton of freight carried over one kilometer, a standard measure in the cargo industry. 6 In Figure 1-3 domestic traffic is included both in intra-Latin America and the Caribbean and in intra-European cargo volumes.
FIGURE 1-2: INTRA-LATIN AMERICA AND CARIBBEAN FREIGHT-TON KILOMETERS CARRIED BY ALTA MEMBER AIRLINES (IN MILLIONS). 2003-2009
17
Source: ALTA, the Air Transport Association (ATA), and the Association of European Airlines (AEA) Note: The graph only includes data from member airlines of the respective associations.
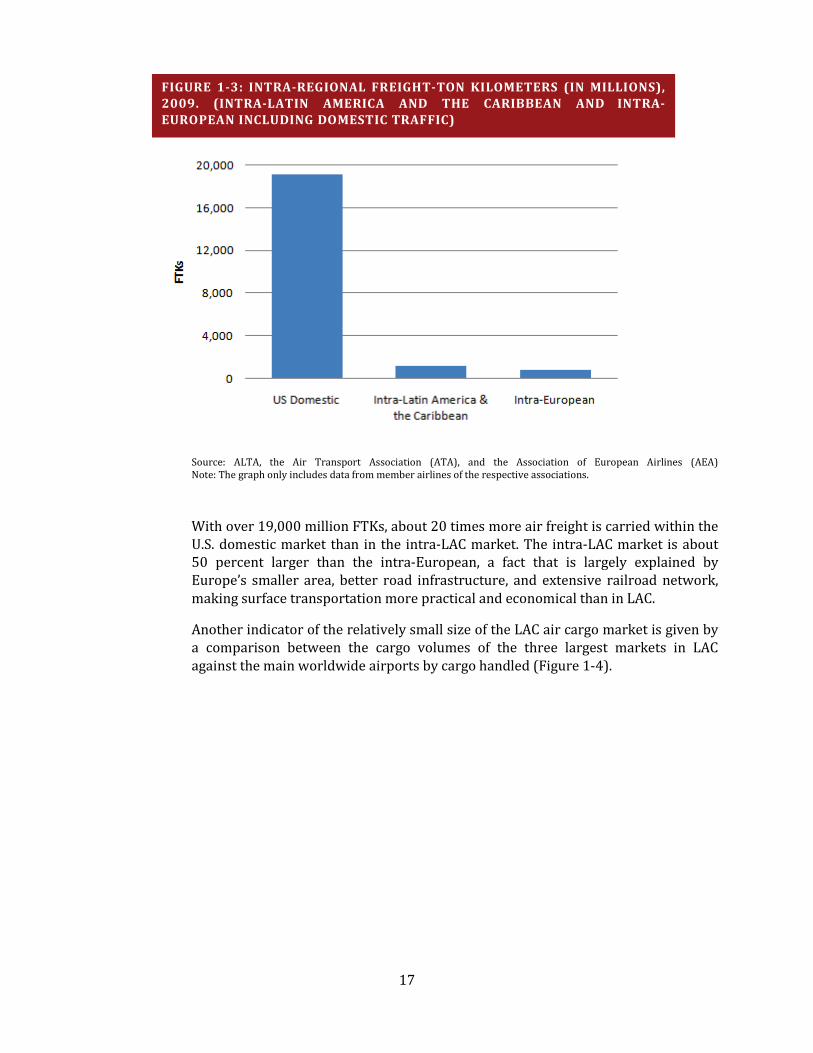
With over 19,000 million FTKs, about 20 times more air freight is carried within the U.S. domestic market than in the intra-LAC market. The intra-LAC market is about 50 percent larger than the intra-European, a fact that is largely explained by Europe’s smaller area, better road infrastructure, and extensive railroad network, making surface transportation more practical and economical than in LAC.
Another indicator of the relatively small size of the LAC air cargo market is given by a comparison between the cargo volumes of the three largest markets in LAC against the main worldwide airports by cargo handled (Figure 1-4).
FIGURE 1-3: INTRA-REGIONAL FREIGHT-TON KILOMETERS (IN MILLIONS), 2009. (INTRA-LATIN AMERICA AND THE CARIBBEAN AND INTRA-EUROPEAN INCLUDING DOMESTIC TRAFFIC)
18
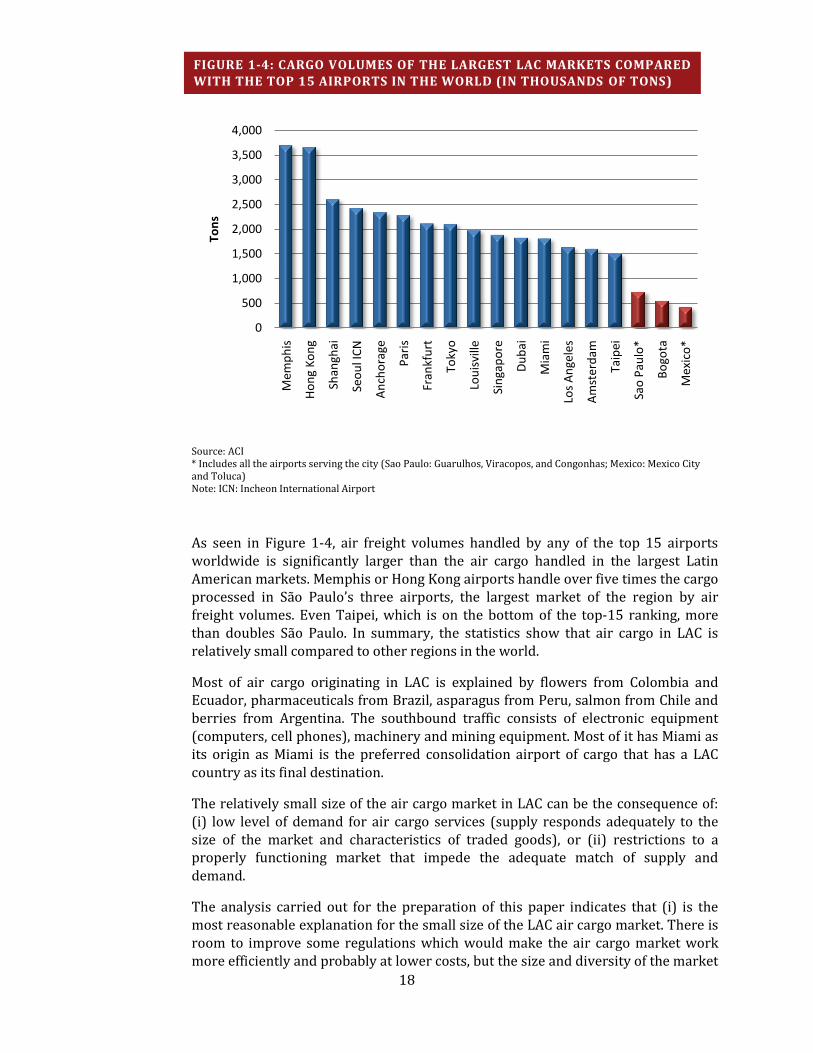
Source: ACI * Includes all the airports serving the city (Sao Paulo: Guarulhos, Viracopos, and Congonhas; Mexico: Mexico City and Toluca) Note: ICN: Incheon International Airport
As seen in Figure 1-4, air freight volumes handled by any of the top 15 airports worldwide is significantly larger than the air cargo handled in the largest Latin American markets. Memphis or Hong Kong airports handle over five times the cargo processed in São Paulo’s three airports, the largest market of the region by air freight volumes. Even Taipei, which is on the bottom of the top-15 ranking, more than doubles São Paulo. In summary, the statistics show that air cargo in LAC is relatively small compared to other regions in the world.
Most of air cargo originating in LAC is explained by flowers from Colombia and Ecuador, pharmaceuticals from Brazil, asparagus from Peru, salmon from Chile and berries from Argentina. The southbound traffic consists of electronic equipment (computers, cell phones), machinery and mining equipment. Most of it has Miami as its origin as Miami is the preferred consolidation airport of cargo that has a LAC country as its final destination.
The relatively small size of the air cargo market in LAC can be the consequence of: (i) low level of demand for air cargo services (supply responds adequately to the size of the market and characteristics of traded goods), or (ii) restrictions to a properly functioning market that impede the adequate match of supply and demand.
The analysis carried out for the preparation of this paper indicates that (i) is the most reasonable explanation for the small size of the LAC air cargo market. There is room to improve some regulations which would make the air cargo market work more efficiently and probably at lower costs, but the size and diversity of the market
0
500
1,000
1,500
2,000
2,500
3,000
3,500
4,000
Mem
phis
Hon
g Ko
ng
Shan
ghai
Seou
l ICN
Anc
hora
ge
Pari
s
Fran
kfur
t
Toky
o
Loui
svill
e
Sing
apor
e
Dub
ai
Mia
mi
Los
Ang
eles
Am
ster
dam
Taip
ei
Sao
Paul
o*
Bogo
ta
Mex
ico*
Tons
FIGURE 1-4: CARGO VOLUMES OF THE LARGEST LAC MARKETS COMPARED WITH THE TOP 15 AIRPORTS IN THE WORLD (IN THOUSANDS OF TONS)
19
will not significantly change (that is, it will not outgrow other transport modes or will not show higher growth rates than other air cargo markets). In addition, as is explained in the paragraphs below, it is likely that technology changes will make competition from sea shipping more intense.
Migration from air shipping to sea shipping has been taking place in the last decade, and is expected to continue depending on a number of factors. This is the result of greater efficiencies at sea ports, coupled with new technologies related to containerized cargo. The concessions of sea ports and the improvements in the management of some ports in LAC implied greater efficiencies in container operations, reducing costs to shippers and a reduction in voyage time, particularly important for perishables. In addition, new technologies in containers, including climate and atmospheric control, allow longer life for perishables (through a slower maturity process). Peru’s exports of asparagus to the United States which have progressively been shifting to sea transport is a good example of these changes.
In summary, sea freight competition will play an ever increasing role in lowering demand for lower value cargo. Passenger airlines with slack capacity will be able to offer lower fares, as long as it does not sacrifice passenger payload. However, for full freighters, success will depend on achieving lower costs in those markets where there is competition from sea freight. For high value goods and time sensitive deliveries, air freight will remain unchallenged.
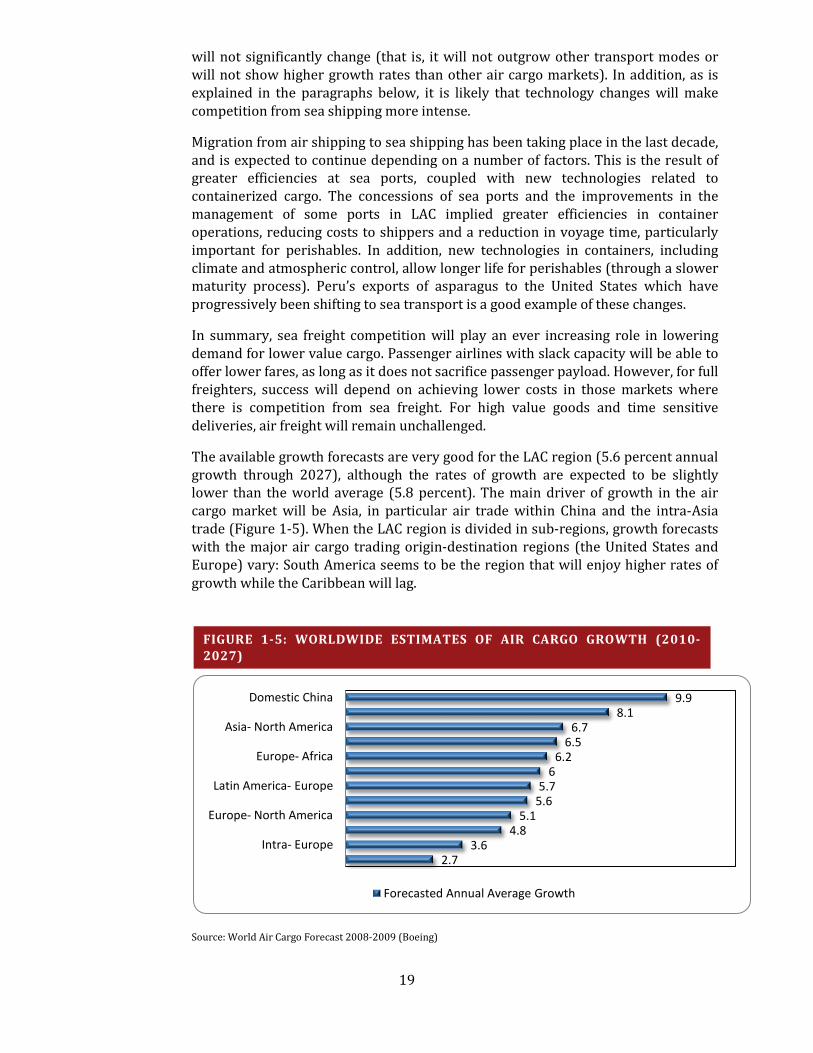
The available growth forecasts are very good for the LAC region (5.6 percent annual growth through 2027), although the rates of growth are expected to be slightly lower than the world average (5.8 percent). The main driver of growth in the air cargo market will be Asia, in particular air trade within China and the intra-Asia trade (Figure 1-5). When the LAC region is divided in sub-regions, growth forecasts with the major air cargo trading origin-destination regions (the United States and Europe) vary: South America seems to be the region that will enjoy higher rates of growth while the Caribbean will lag.
Source: World Air Cargo Forecast 2008-2009 (Boeing)
9.98.1
6.76.5
6.26
5.75.6
5.14.8
3.62.7
Domestic China
Asia- North America
Europe- Africa
Latin America- Europe
Europe- North America
Intra- Europe
Forecasted Annual Average Growth
FIGURE 1-5: WORLDWIDE ESTIMATES OF AIR CARGO GROWTH (2010-2027)
20
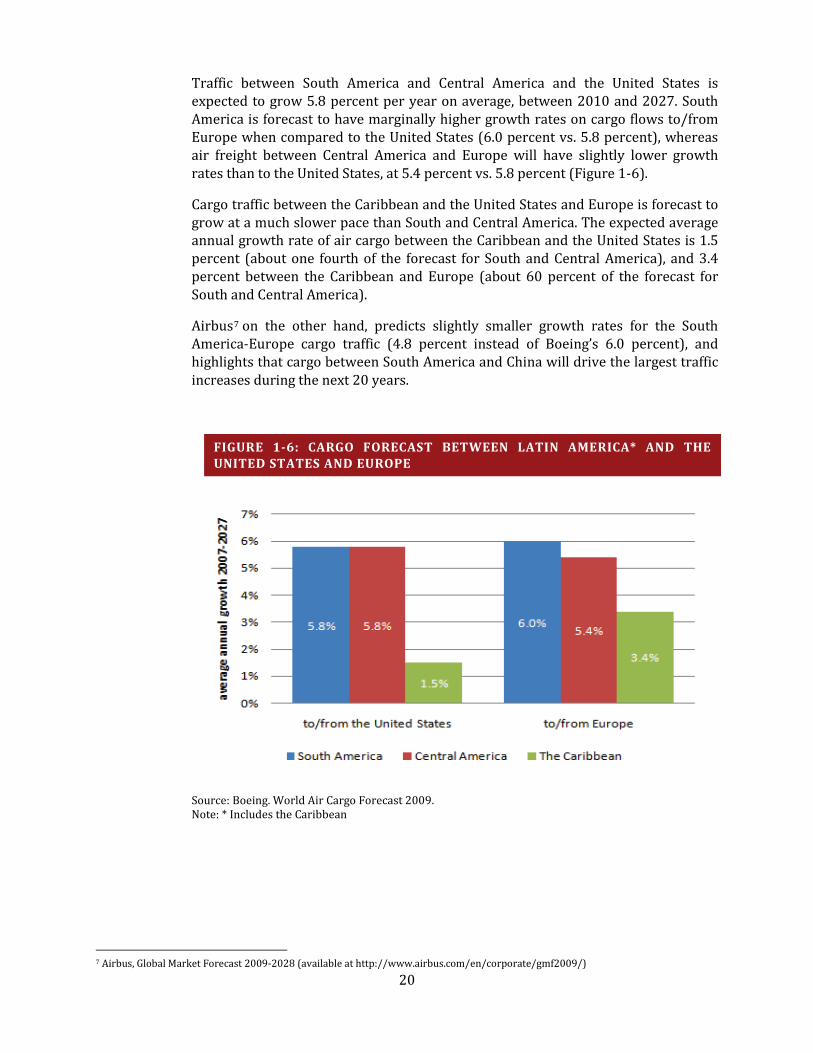
Traffic between South America and Central America and the United States is expected to grow 5.8 percent per year on average, between 2010 and 2027. South America is forecast to have marginally higher growth rates on cargo flows to/from Europe when compared to the United States (6.0 percent vs. 5.8 percent), whereas air freight between Central America and Europe will have slightly lower growth rates than to the United States, at 5.4 percent vs. 5.8 percent (Figure 1-6).
Cargo traffic between the Caribbean and the United States and Europe is forecast to grow at a much slower pace than South and Central America. The expected average annual growth rate of air cargo between the Caribbean and the United States is 1.5 percent (about one fourth of the forecast for South and Central America), and 3.4 percent between the Caribbean and Europe (about 60 percent of the forecast for South and Central America).
Airbus7
on the other hand, predicts slightly smaller growth rates for the South America-Europe cargo traffic (4.8 percent instead of Boeing’s 6.0 percent), and highlights that cargo between South America and China will drive the largest traffic increases during the next 20 years.
Source: Boeing. World Air Cargo Forecast 2009. Note: * Includes the Caribbean
7 Airbus, Global Market Forecast 2009-2028 (available at http://www.airbus.com/en/corporate/gmf2009/)
FIGURE 1-6: CARGO FORECAST BETWEEN LATIN AMERICA* AND THE UNITED STATES AND EUROPE
21
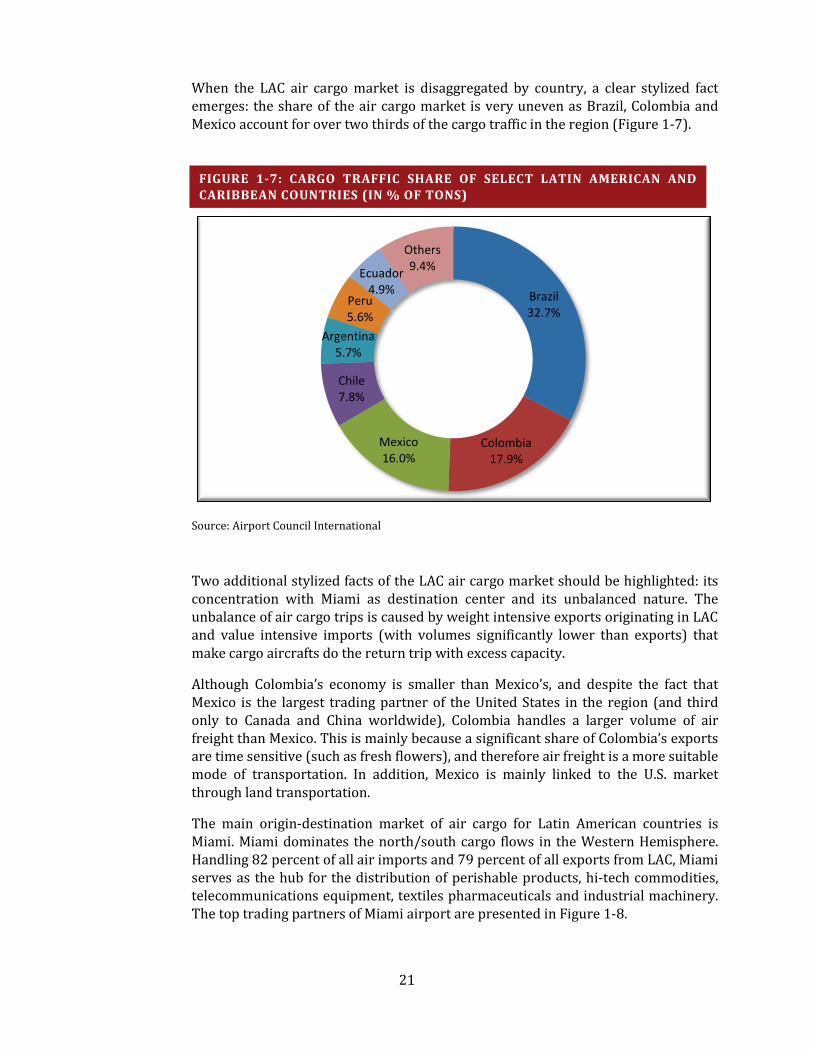
When the LAC air cargo market is disaggregated by country, a clear stylized fact emerges: the share of the air cargo market is very uneven as Brazil, Colombia and Mexico account for over two thirds of the cargo traffic in the region (Figure 1-7).
Source: Airport Council International
Two additional stylized facts of the LAC air cargo market should be highlighted: its concentration with Miami as destination center and its unbalanced nature. The unbalance of air cargo trips is caused by weight intensive exports originating in LAC and value intensive imports (with volumes significantly lower than exports) that make cargo aircrafts do the return trip with excess capacity.
Although Colombia’s economy is smaller than Mexico’s, and despite the fact that Mexico is the largest trading partner of the United States in the region (and third only to Canada and China worldwide), Colombia handles a larger volume of air freight than Mexico. This is mainly because a significant share of Colombia’s exports are time sensitive (such as fresh flowers), and therefore air freight is a more suitable mode of transportation. In addition, Mexico is mainly linked to the U.S. market through land transportation.
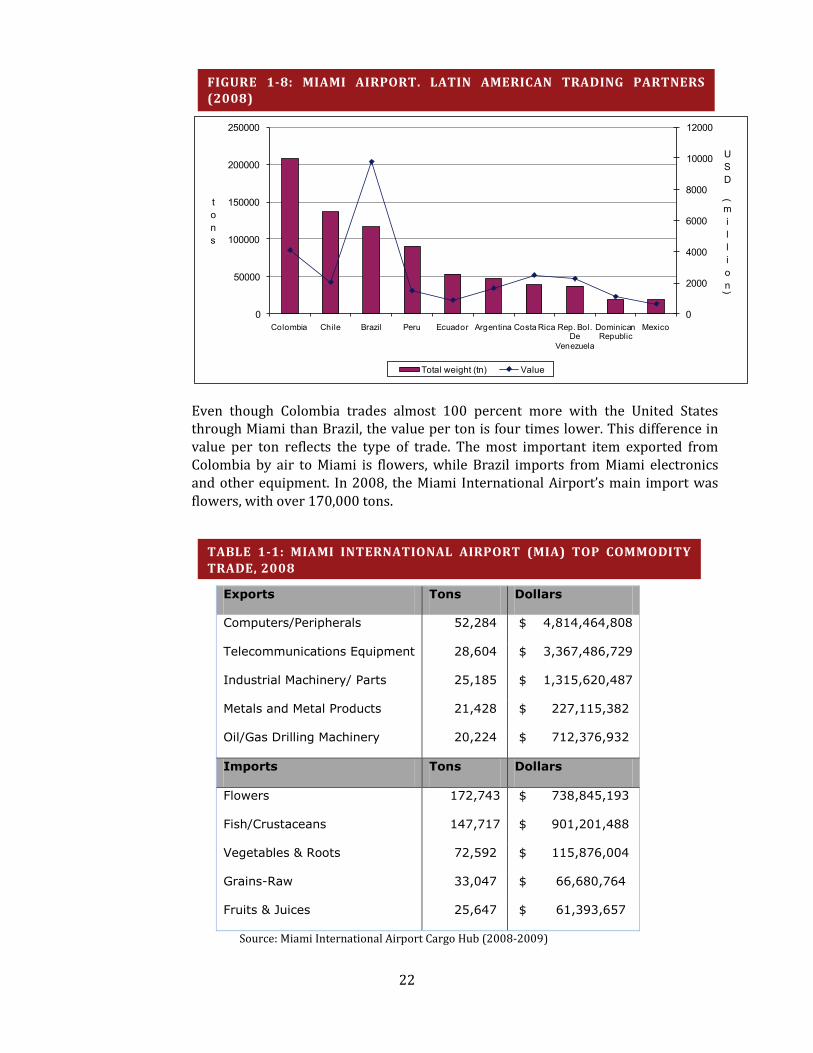
The main origin-destination market of air cargo for Latin American countries is Miami. Miami dominates the north/south cargo flows in the Western Hemisphere. Handling 82 percent of all air imports and 79 percent of all exports from LAC, Miami serves as the hub for the distribution of perishable products, hi-tech commodities, telecommunications equipment, textiles pharmaceuticals and industrial machinery. The top trading partners of Miami airport are presented in Figure 1-8.
Brazil32.7%
Colombia17.9%
Mexico16.0%
Chile7.8%
Argentina5.7%
Peru5.6%
Ecuador4.9%
Others9.4%
FIGURE 1-7: CARGO TRAFFIC SHARE OF SELECT LATIN AMERICAN AND CARIBBEAN COUNTRIES (IN % OF TONS)
22
Even though Colombia trades almost 100 percent more with the United States through Miami than Brazil, the value per ton is four times lower. This difference in value per ton reflects the type of trade. The most important item exported from Colombia by air to Miami is flowers, while Brazil imports from Miami electronics and other equipment. In 2008, the Miami International Airport’s main import was flowers, with over 170,000 tons.
Exports Tons Dollars
Computers/Peripherals 52,284 $ 4,814,464,808
Telecommunications Equipment 28,604 $ 3,367,486,729
Industrial Machinery/ Parts 25,185 $ 1,315,620,487
Metals and Metal Products 21,428 $ 227,115,382
Oil/Gas Drilling Machinery 20,224 $ 712,376,932
Imports Tons Dollars
Flowers 172,743 $ 738,845,193
Fish/Crustaceans 147,717 $ 901,201,488
Vegetables & Roots 72,592 $ 115,876,004
Grains-Raw 33,047 $ 66,680,764
Fruits & Juices 25,647 $ 61,393,657
Source: Miami International Airport Cargo Hub (2008-2009)
0
2000
4000
6000
8000
10000
12000
0
50000
100000
150000
200000
250000
Colombia Chile Brazil Peru Ecuador Argentina Costa Rica Rep. Bol. De
Venezuela
Dominican Republic
Mexico
USD
(
million)
tons
Total weight (tn) Value
FIGURE 1-8: MIAMI AIRPORT. LATIN AMERICAN TRADING PARTNERS (2008)
TABLE 1-1: MIAMI INTERNATIONAL AIRPORT (MIA) TOP COMMODITY TRADE, 2008
23
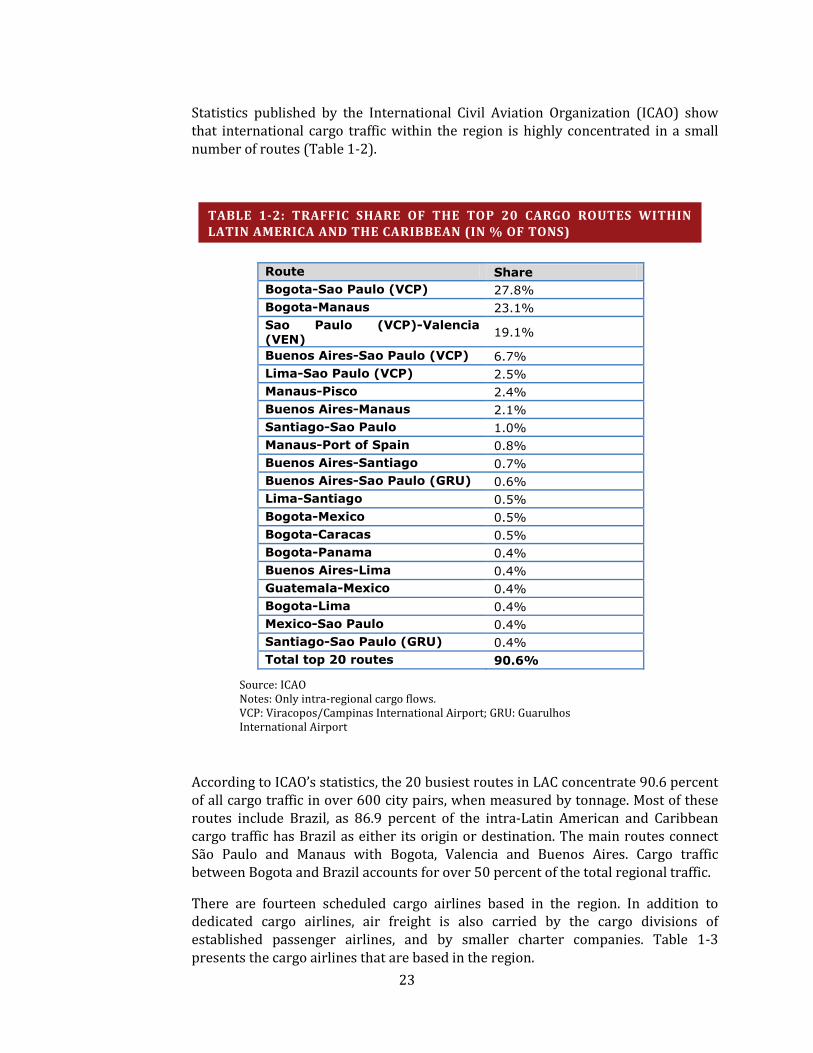
Statistics published by the International Civil Aviation Organization (ICAO) show that international cargo traffic within the region is highly concentrated in a small number of routes (Table 1-2).
Route Share Bogota-Sao Paulo (VCP) 27.8% Bogota-Manaus 23.1% Sao Paulo (VCP)-Valencia (VEN) 19.1%
Buenos Aires-Sao Paulo (VCP) 6.7% Lima-Sao Paulo (VCP) 2.5% Manaus-Pisco 2.4% Buenos Aires-Manaus 2.1% Santiago-Sao Paulo 1.0% Manaus-Port of Spain 0.8% Buenos Aires-Santiago 0.7% Buenos Aires-Sao Paulo (GRU) 0.6% Lima-Santiago 0.5% Bogota-Mexico 0.5% Bogota-Caracas 0.5% Bogota-Panama 0.4% Buenos Aires-Lima 0.4% Guatemala-Mexico 0.4% Bogota-Lima 0.4% Mexico-Sao Paulo 0.4% Santiago-Sao Paulo (GRU) 0.4% Total top 20 routes 90.6%
Source: ICAO Notes: Only intra-regional cargo flows. VCP: Viracopos/Campinas International Airport; GRU: Guarulhos International Airport
According to ICAO’s statistics, the 20 busiest routes in LAC concentrate 90.6 percent of all cargo traffic in over 600 city pairs, when measured by tonnage. Most of these routes include Brazil, as 86.9 percent of the intra-Latin American and Caribbean cargo traffic has Brazil as either its origin or destination. The main routes connect São Paulo and Manaus with Bogota, Valencia and Buenos Aires. Cargo traffic between Bogota and Brazil accounts for over 50 percent of the total regional traffic.
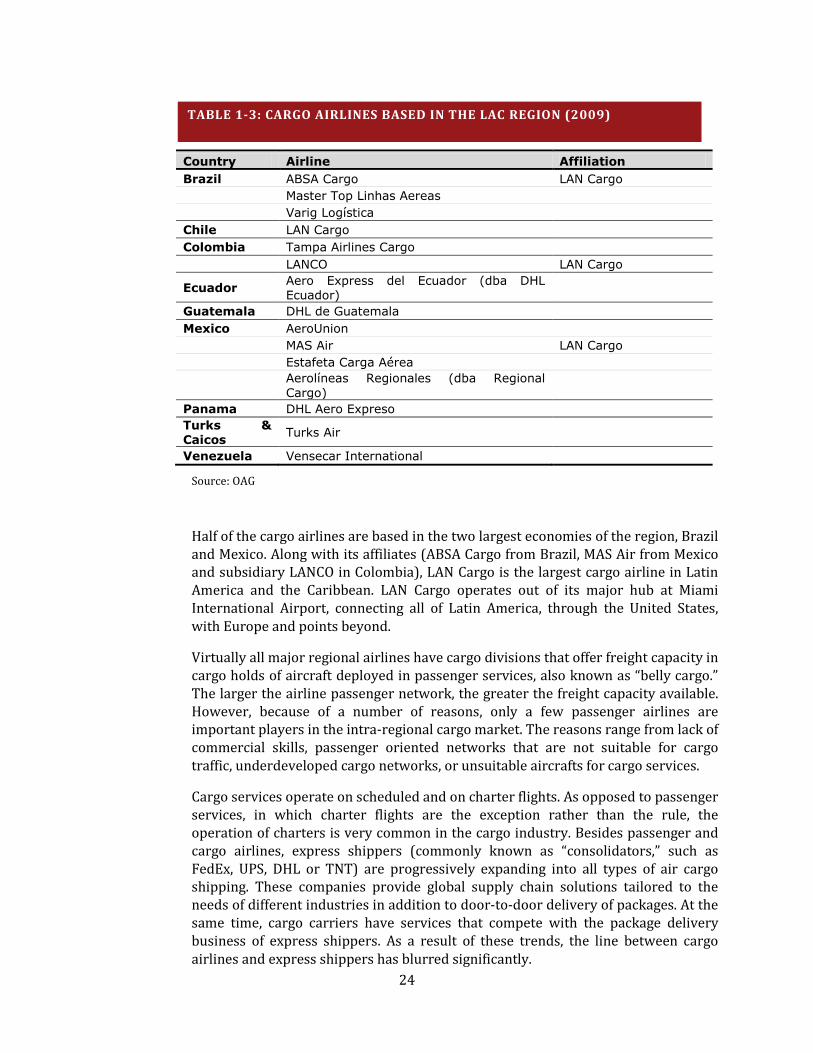
There are fourteen scheduled cargo airlines based in the region. In addition to dedicated cargo airlines, air freight is also carried by the cargo divisions of established passenger airlines, and by smaller charter companies. Table 1-3 presents the cargo airlines that are based in the region.
TABLE 1-2: TRAFFIC SHARE OF THE TOP 20 CARGO ROUTES WITHIN LATIN AMERICA AND THE CARIBBEAN (IN % OF TONS)
24
Country Airline Affiliation Brazil ABSA Cargo LAN Cargo Master Top Linhas Aereas Varig Logística Chile LAN Cargo Colombia Tampa Airlines Cargo LANCO LAN Cargo
Ecuador Aero Express del Ecuador (dba DHL Ecuador)
Guatemala DHL de Guatemala Mexico AeroUnion MAS Air LAN Cargo Estafeta Carga Aérea
Aerolíneas Regionales (dba Regional Cargo)
Panama DHL Aero Expreso Turks & Caicos Turks Air
Venezuela Vensecar International
Source: OAG
Half of the cargo airlines are based in the two largest economies of the region, Brazil and Mexico. Along with its affiliates (ABSA Cargo from Brazil, MAS Air from Mexico and subsidiary LANCO in Colombia), LAN Cargo is the largest cargo airline in Latin America and the Caribbean. LAN Cargo operates out of its major hub at Miami International Airport, connecting all of Latin America, through the United States, with Europe and points beyond.
Virtually all major regional airlines have cargo divisions that offer freight capacity in cargo holds of aircraft deployed in passenger services, also known as “belly cargo.” The larger the airline passenger network, the greater the freight capacity available. However, because of a number of reasons, only a few passenger airlines are important players in the intra-regional cargo market. The reasons range from lack of commercial skills, passenger oriented networks that are not suitable for cargo traffic, underdeveloped cargo networks, or unsuitable aircrafts for cargo services.
Cargo services operate on scheduled and on charter flights. As opposed to passenger services, in which charter flights are the exception rather than the rule, the operation of charters is very common in the cargo industry. Besides passenger and cargo airlines, express shippers (commonly known as “consolidators,” such as FedEx, UPS, DHL or TNT) are progressively expanding into all types of air cargo shipping. These companies provide global supply chain solutions tailored to the needs of different industries in addition to door-to-door delivery of packages. At the same time, cargo carriers have services that compete with the package delivery business of express shippers. As a result of these trends, the line between cargo airlines and express shippers has blurred significantly.
TABLE 1-3: CARGO AIRLINES BASED IN THE LAC REGION (2009)
25
R E G U L A T O R Y S T R U C T U R E
2.1 BACKGROUND International air services, whether they carry passengers, cargo, or both, are regulated by bilateral Air Service Agreements (ASA or bilaterals) signed between countries. ASAs are negotiated on a bilateral basis by countries wishing to exchange rights that allow market access to airlines of both parties. These agreements are periodically updated through the signage of new memorandums of understanding (MOU) at consultative meetings between parties.
ASAs define the level of market access that carriers of both parties can benefit from, and are classified in nine Freedoms of the Air (see Appendix). Freedoms of the air go from the most restrictive, which is the right to overfly the territory of another country (first freedom), to the most advanced in terms of market access, which allows the carrier of one country to operate standalone commercial domestic services8
Basic rights, such as overflying the territory of, or making technical stops in the other country,
in another country (ninth freedom).
9
In addition to defining the extent of market access to carriers of both countries, ASAs might also go to great detail to specify how many and which airlines from each country are allowed to operate (designation), how many frequencies or seats carriers of each country can operate (capacity), to which cities or airports in each country airlines can fly to (traffic rights), and how tariffs are set (tariffs). ASAs range from extremely restrictive to fully liberal.
are automatically granted between over 120 signatory countries of the ICAO Convention on International Civil Aviation of 1944, also known as the Chicago Convention. Other rights, such as the one to carry passengers or cargo from a home country (A) to a second country (B) in commercial services, must be explicitly agreed upon and authorized between the corresponding countries (A and B). The aviation industry is different than most industries in this respect, as market access is closed by default. Unless both parties explicitly exchange rights, airlines are not allowed to perform scheduled commercial services between two countries.
Table describes types of ASAs.
8 Also known as full-cabotage. 9 As long as no passengers or cargo are neither loaded nor unloaded.
2
26
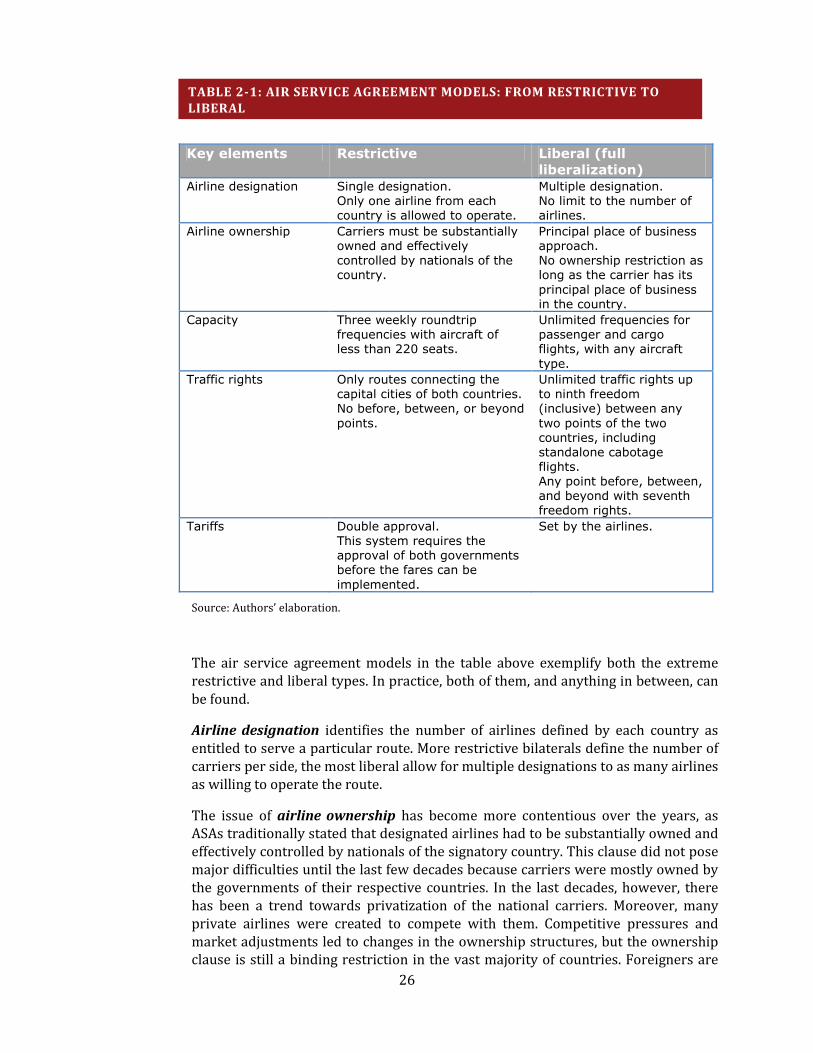
Key elements Restrictive Liberal (full liberalization)
Airline designation Single designation. Only one airline from each country is allowed to operate.
Multiple designation. No limit to the number of airlines.
Airline ownership Carriers must be substantially owned and effectively controlled by nationals of the country.
Principal place of business approach. No ownership restriction as long as the carrier has its principal place of business in the country.
Capacity Three weekly roundtrip frequencies with aircraft of less than 220 seats.
Unlimited frequencies for passenger and cargo flights, with any aircraft type.
Traffic rights Only routes connecting the capital cities of both countries. No before, between, or beyond points.
Unlimited traffic rights up to ninth freedom (inclusive) between any two points of the two countries, including standalone cabotage flights. Any point before, between, and beyond with seventh freedom rights.
Tariffs Double approval. This system requires the approval of both governments before the fares can be implemented.
Set by the airlines.
Source: Authors’ elaboration.
The air service agreement models in the table above exemplify both the extreme restrictive and liberal types. In practice, both of them, and anything in between, can be found.
Airline designation identifies the number of airlines defined by each country as entitled to serve a particular route. More restrictive bilaterals define the number of carriers per side, the most liberal allow for multiple designations to as many airlines as willing to operate the route.
The issue of airline ownership has become more contentious over the years, as ASAs traditionally stated that designated airlines had to be substantially owned and effectively controlled by nationals of the signatory country. This clause did not pose major difficulties until the last few decades because carriers were mostly owned by the governments of their respective countries. In the last decades, however, there has been a trend towards privatization of the national carriers. Moreover, many private airlines were created to compete with them. Competitive pressures and market adjustments led to changes in the ownership structures, but the ownership clause is still a binding restriction in the vast majority of countries. Foreigners are
TABLE 2-1: AIR SERVICE AGREEMENT MODELS: FROM RESTRICTIVE TO LIBERAL
27
restricted to non-controlling stakes, 10
Although some liberal ASAs are moving away from the ownership clause to a “principal place of business” type clause, a majority controlling stake in the hands of country nationals is still a condition for most bilaterals in Latin America.
and property restrictions limits; or, in practice, cross-border investments or mergers between airlines of different countries.
Capacity definitions vary according to the spirit of the ASA. Restrictive bilaterals can assign a low number of roundtrip weekly frequencies for each of the countries,11
When capacity is defined by a number of frequencies (or seats), it always refers to roundtrip weekly frequencies (or seats) available to each country. If a bilateral allows seven frequencies and there is multiple designation, the carriers of each country can operate a combined maximum of seven roundtrip weekly flights.
and might even define or limit the aircraft types that can be used. On more liberal bilaterals capacity is not limited by any means.
One thing to note with respect to capacity is that while some ASAs have explicit allowances for cargo flights that are independent of passenger flights frequencies, most of them do not assign specific frequencies for cargo services. Thus, passenger and cargo flights end up sharing the total available frequencies, and if the former require most of them, frequencies available for cargo are severely restricted.
Traffic rights are related to the freedoms of the air mentioned above. Essentially, they define what kind of market access the respective carriers will enjoy. Restrictive bilaterals might only allow commercial services that originate and terminate in the signatory countries. Restrictions sometimes go even further, in the form of a Route Schedule, detailing points of entry on each country.
Many bilaterals allow an airline from a certain country (Country A) to operate international services between two other countries (Country B and Country C), as long as the flight is a continuation of a service that has origin or destination in Country A. This is called fifth freedom right, and allows an airline from Country A to effectively access the Country B-Country C market, as long as the flights either originates or terminates in Country A.12
Tariff control might range from double-approval, which requires that fares be approved by both governments, to full freedom, where airlines can set fares freely. Double-disapproval is in between (although more closer to full freedom), and allows the airlines to set their own fares, unless the governments on both sides disapprove them.
These routes are particularly convenient for cargo services, increasing the possibility to expand the distribution network through adding stops.
10 The limit for foreign investment varies according to each country’s legislation. 11 In certain cases capacity is defined in terms of number of seats instead of frequencies. 12 Fifth freedom flights cannot be operated on a standalone basis, as those would require seventh freedom rights.
28
2.2 A REVIEW OF AIR SERVICE AGREEMENTS IN LATIN AMERICA This section summarizes the ASA of the most important air cargo markets in Latin America.
Argentina
Argentina holds a mix of very liberal and quite restrictive bilaterals at the same time. Those signed with Chile, Ecuador and Panama can be considered liberal, while those with Colombia, Paraguay, Peru and Venezuela are quite restrictive.
Argentina’s most liberal ASAs allow unlimited capacity with fifth freedom rights on routes within the Americas (with Chile), or anywhere in the world (with Ecuador and Panama). The bilateral with Panama explicitly allows up to seventh freedom traffic rights, allowing an airline to operate standalone international services from the other country.
The situation with Brazil, Argentina’s main trading partner, is somewhat more constrained as cargo capacity is limited to seven scheduled weekly flights. On the other hand, the agreement allows unlimited non-scheduled frequencies.
Brazil
Brazil is one of the few countries in the region whose bilaterals clearly stipulate frequencies for cargo services, in addition to those allowed for passenger services. This model provides more clarity for all stakeholders as it facilitates the planning and scheduling of cargo services.
Except with Bolivia and Costa Rica, where only two cargo weekly frequencies are authorized, the bilaterals between Brazil and other countries allow no less than seven weekly frequencies. With certain countries, such as Chile, Peru and Uruguay, cargo frequencies are unlimited for fifth freedom flights within the region, and no less than 17 per week for fifth freedom flights outside of the region.
All Brazilian-signed ASAs allow multiple designation, and in terms of traffic rights, most of them grant fifth freedom rights without limitations, albeit with a few exceptions. For example, the agreement with Colombia expressly rules out Frankfurt as a beyond point, and Panama only allows Guayaquil, Quito, and Bogota as intermediate points.
Chile
Consistent with Chile’s market-oriented economy, most ASAs are fully liberal with respect to cargo services. This means that capacity and traffic rights are unlimited, up to fifth freedom to countries outside the region. This allows a Chilean airline to perform cargo services between Buenos Aires and Madrid, as long as the flight is scheduled to originate or terminate in Santiago.
29
The fully-liberal bilaterals with Paraguay and Uruguay go even further, allowing carriers from any of the countries to operate standalone international services (that do not need to originate nor terminate in the carrier’s home country) and also standalone domestic services.
The relation with Bolivia is less permissive, as no fifth freedom rights are granted, except for Chilean carriers which are allowed to continue from Bolivia to Mexico City and Los Angeles. This restriction precludes carriers from scheduling multi-stop flights that might be better suited than non-stops for cargo services on relatively thin markets.
As for Mexico and Ecuador, while the ASAs grant unlimited fifth freedom rights, it is unclear how many frequencies are allowed. In the case of Mexico, frequencies are not mentioned whatsoever, while the bilateral with Ecuador states that capacity offered by the airlines will have to be related to demand. Although this could mean that there are no a priori limits to capacity, by not being totally clear about it, it might appear as if the authorities at each state were reserving the right to impose future restrictions.
Colombia
Air transport cargo services between Colombia and Bolivia, Ecuador and Peru are regulated by a multilateral agreement that these countries signed as members of the Andean Community (CAN), a regional trade agreement among them. The agreement allows multiple airline designation and unlimited fifth freedom frequencies within the four countries.
As for non-CAN member countries, capacity for cargo services range from eight or nine weekly frequencies (with Mexico and Brazil respectively) to unlimited with Chile, Uruguay, and Panama. Argentina is the only country with which cargo services are severely restricted, as the bilateral only allows five frequencies per month (on a side note, the ASA between Colombia and Argentina is also fairly restrictive for passenger flights).
Traffic rights for cargo are somewhat more restricted when compared to Brazil, since the majority of the bilaterals do not grant fifth freedom rights to neither intermediate nor beyond points. Chile allows fifth freedom rights only within Latin America. Brazil grants Colombia fifth freedom cargo rights on only six out of the nine weekly frequencies. In the case of Mexico fifth freedom rights for cargo might be allowed but require previous authorization from the regulators. Venezuela is the only country with which unlimited capacity and unrestricted fifth freedom rights are mutually granted.
As for fifth freedom rights with members of the CAN for services beyond the regional boundaries, information could not be obtained. The ASAs published by the member countries only refer to the multilateral agreement (which only talks about fifth freedoms within the four countries), but do not make any reference to further rights negotiated bilaterally.
30
All ASAs contemplate multiple designation. The Colombia-Mexico bilateral allows only four cargo carriers per country, but in practice it is the same as having multiple designation.
Ecuador
As a member of the CAN, with regards to air services, Ecuador’s relations with Bolivia, Colombia, and Peru are regulated by a multilateral agreement among those countries.
The bilaterals with Brazil, Paraguay and Venezuela define capacity for passenger and cargo flights indistinctly. In the case of Brazil it does not seem to be restrictive since 21 weekly frequencies are allowed and not a single one is currently used. But capacity with Paraguay and Venezuela is quite more constrained, with seven and four weekly frequencies for passengers and cargo services respectively. The three countries concede fifth freedom rights, but with certain limitations on intermediate and beyond points as well as frequencies in which they can be used.
The bilateral with Argentina allows unrestricted frequencies with fifth freedom rights and multiple designation, while Chile also grants similar rights.
Mexico
Most of Mexico’s bilaterals are fairly restrictive, both in terms of frequencies and traffic rights. Capacity for cargo flights is limited to at most eight weekly frequencies (Colombia). With some countries, such as Peru, dedicated cargo frequencies are restricted to two per week.
Only third and fourth traffic rights are mutually granted, meaning that airlines flying to Mexico cannot make intermediate stops to pick up cargo in third countries, or vice versa. These rights (fifth freedom rights) are seldom conceded, and are attached to certain constraints such as the need to request previous authorization, or very limited route schedules.
The relation with Panama appears to be the exception, as the Civil Aviation Authority states that both countries have agreed to liberalize air cargo services during the last consultation meeting of March 2009.
Paraguay
ASAs in force between Paraguay and third countries are both liberal and restrictive, depending on the case.
The relationship with Chile and with Panama is fully liberalized.13
13 Seventh freedom rights are granted exclusively for cargo services, and do not apply to passenger flights.
The agreement between Paraguay and Peru allows unlimited frequencies, albeit only with third and fourth freedom rights (this means that airlines are not allowed to make
31
intermediate stops, nor continue the flights to points beyond the other country). The Paraguay-Brazil bilateral allows seven frequencies with fifth freedom rights for cargo services.
The ASAs with Argentina, Ecuador, and Venezuela might pose serious limitations to cargo operations, as they do not allocate specific frequencies for all-cargo services. All frequencies are to be shared between passenger and cargo flights, and given that the number of frequencies is not very high to begin with (14 weekly for Argentina, seven weekly for Ecuador, and four weekly for Venezuela), all of them might end up being used by passenger services.
Peru
Since Peru is also a member of the CAN, the same considerations apply for air services among the member countries (Bolivia, Colombia, Ecuador, and Peru).
Some of the ASAs, such as those with Argentina, Chile, Mexico, and Uruguay, are quite restrictive, since they either permit a low number of frequencies (for example, Mexico only allows two), or do not explicitly assign any frequency for cargo services. Argentina, Chile and Uruguay,allow 28, 21 and seven frequencies respectively, but most of them, if not all, are already taken by passenger flights. Argentina and Uruguay are quite permissive with regards to fifth freedom rights, although it is unlikely that they will ever be used by Peruvian carriers given the location of Peru with respect to the Southern Cone countries and the direction of trade.
The agreements with Panama and Brazil pose practically no limitations whatsoever to cargo traffic. Brazil allows unlimited frequencies with fifth freedom flights within South America, and 17 frequencies with unrestricted fifth freedom rights, to be increased to 22 in 2011 and 26 in 2012.
Venezuela
Venezuela features one of the most restrictive set of ASAs in the region. Many of them only grant third and fourth freedom rights, while others approve fifth freedoms but with severe limitations on the number of intermediate stops or points that can be served, or the number of frequencies in which they can be used.
The main issue is not with traffic rights but with capacity restrictions. Not only very few weekly services are authorized in most cases (two with Argentina and Chile, four with Ecuador, Paraguay and Panama), but also these frequencies are to be used by both passenger and cargo services. Capacity restrictions pose a serious hurdle for the long term planning and scheduling of cargo services connecting the country. Even when some bilaterals state that the authorities of both ends manifested good will to expand capacity upon request, beyond what is agreed on the ASAs, it only provides a temporal and uncertain solution to the problem.
The relation with Brazil is less restrictive, as it permits 14 weekly frequencies and increased traffic rights. Airlines from both countries are allowed to exploit fifth freedom services on any three intermediate points, and beyond to five points in the
32
Americas14
Colombia is the only country with which Venezuela has a fully liberalized agreement, with no restrictions whatsoever to international traffic rights, capacity, or designation (cabotage rights are not granted).
and two in Europe. Services using fifth freedom traffic rights must be operated under a code-share agreement with a carrier from the other country (this requirement does not apply for non-fifth freedom flights).
2.3 QUANTITATIVE ANALYSIS This section carries out a simple quantitative analysis aimed at determining whether the capacity authorized in the ASAs poses a restriction to further development of air cargo services within the LAC region. The methodology employed measures, for those country pairs with scheduled cargo services, the percentage of the authorized capacity that is currently in use by airlines of both countries.
The Official Airline Guide (OAG), which contains the schedules of most airlines worldwide, was used as the source of information for the analysis. A custom query to the database pulled out information from all scheduled cargo flights within the region. The selection included all flights with traffic rights and only under the carrier of operation. This means that flights with traffic restrictions (such as the impossibility to pick-up cargo) and flights published under another code-sharing carrier (for marketing purposes) were not included.
Airlines schedules can vary significantly during the year as a result of seasonal fluctuations in demand. This phenomenon affects passenger as well as cargo services. Instead of selecting an “average” week of the year, which entails the risk of picking a week that either under or over represents the average, yearly traffic and capacity figures were used throughout the analysis. By using annual numbers, seasonality factors are not a concern.
However, even with seasonality effects accounted and taken care of, schedule information does not provide a complete picture about cargo services in the region. The reason is that given the unstable flows of cargo volumes, many cargo flights are operated as non-scheduled services, and as such, their schedules are not published. This is not exclusive to Latin America and can be observed in every other region.
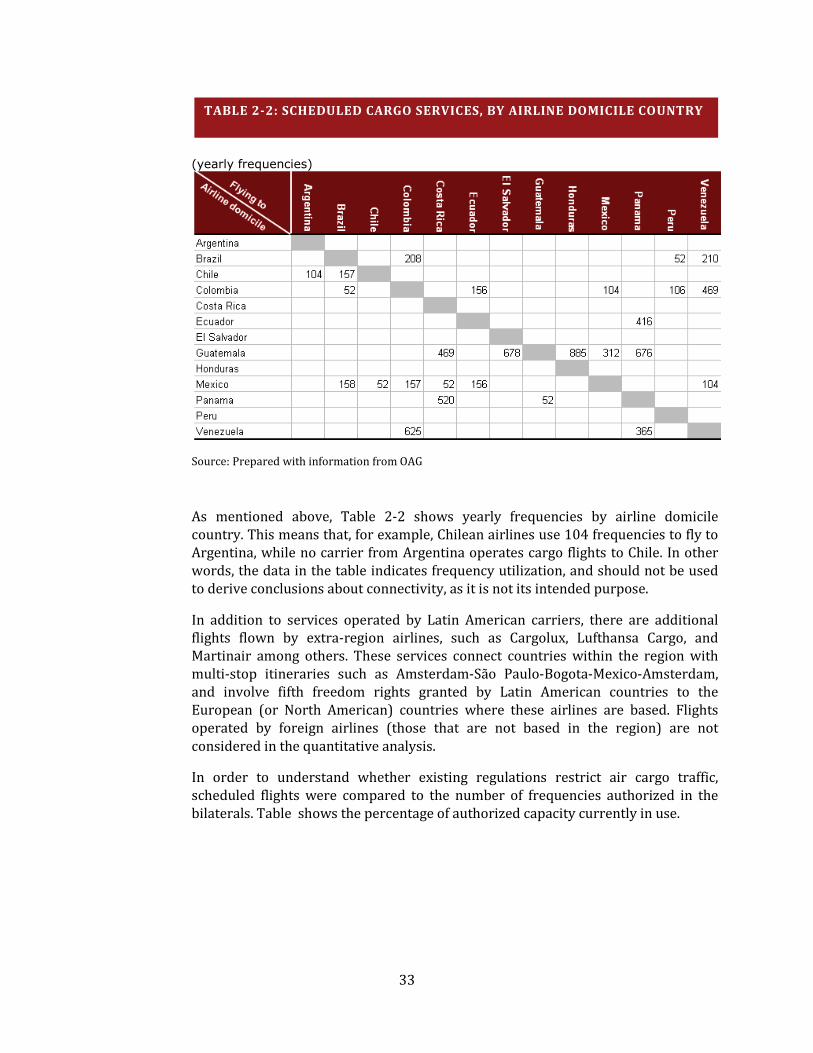
Table 2-2 presents yearly scheduled cargo flights by airline domicile country. The country where the airline is based, rather than the origin/destination of the flight is used, since this is the criterion considered by the bilaterals towards the calculation of frequencies. For example, a Buenos Aires-São Paulo-Bogota flight operated by a Colombian carrier would not be using any frequencies of the Argentina-Brazil bilateral, despite the fact that it connects these countries. Since the airline of the example is based in Colombia, the flight would take one frequency from the bilateral between Colombia and Argentina and another from the one between Colombia and Brazil. Only those flights operated by carriers based within the region are considered.
14 Miami, Cuba, Aruba, Dominican Republic, and Panama for Brazilian carriers; and Buenos Aires, Montevideo, Santiago de Chile, Santa Cruz de la Sierra and Asuncion for Venezuelan airlines.
33
(yearly frequencies)
Source: Prepared with information from OAG
As mentioned above, Table 2-2 shows yearly frequencies by airline domicile country. This means that, for example, Chilean airlines use 104 frequencies to fly to Argentina, while no carrier from Argentina operates cargo flights to Chile. In other words, the data in the table indicates frequency utilization, and should not be used to derive conclusions about connectivity, as it is not its intended purpose.
In addition to services operated by Latin American carriers, there are additional flights flown by extra-region airlines, such as Cargolux, Lufthansa Cargo, and Martinair among others. These services connect countries within the region with multi-stop itineraries such as Amsterdam-São Paulo-Bogota-Mexico-Amsterdam, and involve fifth freedom rights granted by Latin American countries to the European (or North American) countries where these airlines are based. Flights operated by foreign airlines (those that are not based in the region) are not considered in the quantitative analysis.
In order to understand whether existing regulations restrict air cargo traffic, scheduled flights were compared to the number of frequencies authorized in the bilaterals. Table shows the percentage of authorized capacity currently in use.
TABLE 2-2: SCHEDULED CARGO SERVICES, BY AIRLINE DOMICILE COUNTRY
34
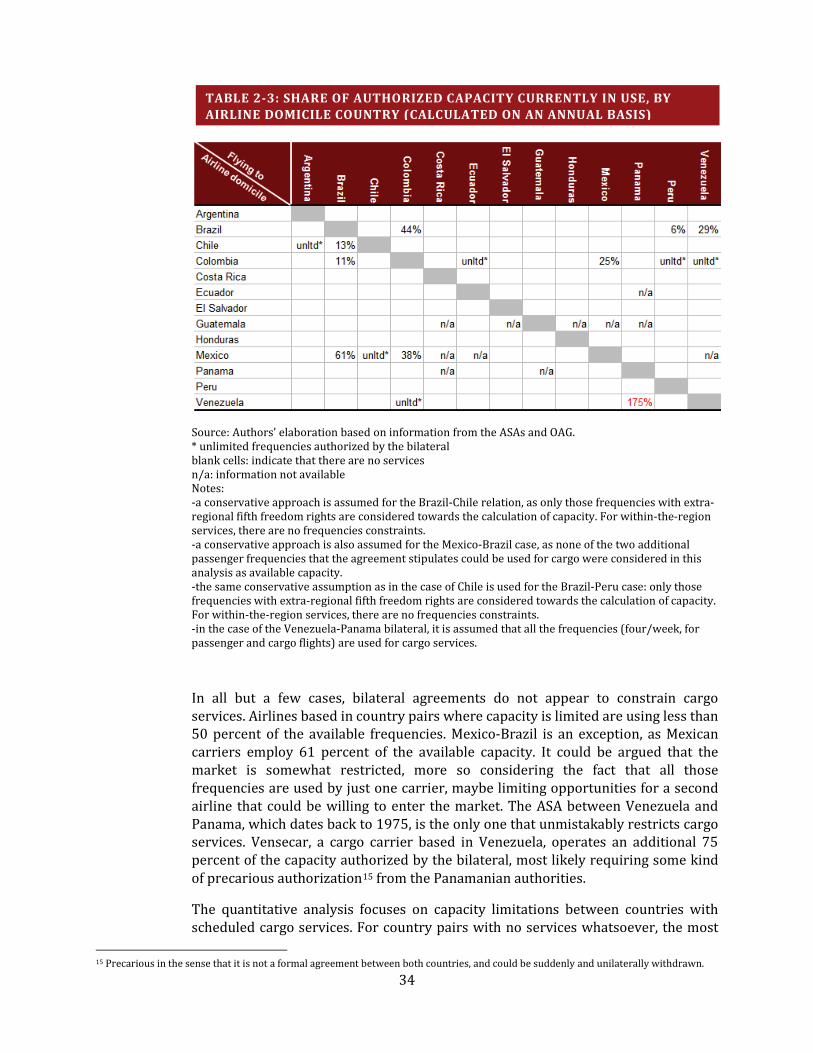
Source: Authors’ elaboration based on information from the ASAs and OAG. * unlimited frequencies authorized by the bilateral blank cells: indicate that there are no services n/a: information not available Notes: -a conservative approach is assumed for the Brazil-Chile relation, as only those frequencies with extra-regional fifth freedom rights are considered towards the calculation of capacity. For within-the-region services, there are no frequencies constraints. -a conservative approach is also assumed for the Mexico-Brazil case, as none of the two additional passenger frequencies that the agreement stipulates could be used for cargo were considered in this analysis as available capacity. -the same conservative assumption as in the case of Chile is used for the Brazil-Peru case: only those frequencies with extra-regional fifth freedom rights are considered towards the calculation of capacity. For within-the-region services, there are no frequencies constraints. -in the case of the Venezuela-Panama bilateral, it is assumed that all the frequencies (four/week, for passenger and cargo flights) are used for cargo services.
In all but a few cases, bilateral agreements do not appear to constrain cargo services. Airlines based in country pairs where capacity is limited are using less than 50 percent of the available frequencies. Mexico-Brazil is an exception, as Mexican carriers employ 61 percent of the available capacity. It could be argued that the market is somewhat restricted, more so considering the fact that all those frequencies are used by just one carrier, maybe limiting opportunities for a second airline that could be willing to enter the market. The ASA between Venezuela and Panama, which dates back to 1975, is the only one that unmistakably restricts cargo services. Vensecar, a cargo carrier based in Venezuela, operates an additional 75 percent of the capacity authorized by the bilateral, most likely requiring some kind of precarious authorization15
The quantitative analysis focuses on capacity limitations between countries with scheduled cargo services. For country pairs with no services whatsoever, the most
from the Panamanian authorities.
15 Precarious in the sense that it is not a formal agreement between both countries, and could be suddenly and unilaterally withdrawn.
TABLE 2-3: SHARE OF AUTHORIZED CAPACITY CURRENTLY IN USE, BY AIRLINE DOMICILE COUNTRY (CALCULATED ON AN ANNUAL BASIS)
35
likely explanation is that restrictions deriving from the air service agreements are not the reason for the lack of services.
2.4 CONCLUSIONS ON THE REGULARTORY STRUCTURE In broad terms, ASAs within countries of the region do not appear to pose serious restrictions to the market for air cargo services. With only a few exceptions, authorized capacity leaves ample room for airlines to schedule additional cargo services (with respect to the number of services that they are currently operating). Many bilaterals go even further and allow unlimited capacity to airlines of signatory countries, at least for flights within the region.16
Traffic rights determine whether or not airlines are allowed to load and/or unload cargo in third countries besides those that sign the ASA. This allows carriers to connect many small markets with a multi-stop flight which might be more efficient than the operation of many non-stop flights. Most bilaterals allow fifth freedom rights, albeit with some restrictions. Some of them limit fifth freedoms to flights operating only within the region. For example, they may allow a Brazilian carrier to operate a São Paulo-Bogota-Mexico-São Paulo flight, but not a São Paulo-Bogota-Madrid-São Paulo flight. Others allow unrestricted fifth freedoms, meaning that there are no limitations with regards to what points can be connected, but only for a certain number of weekly frequencies.
There are practically no restrictions with regards to designation, as most ASAs allow signatory countries to designate multiple airlines. Capacity allowances are on a country basis which means that they are to be shared among all airlines of that country. Exceptions to this are the Mexico-Peru, Panama-Venezuela and Paraguay-Venezuela agreements which only allow one carrier per country.
Although most bilaterals can be considered adequate with regards to the rights that they grant, there are some exceptions. On the one hand, air transport services between certain countries, such as Chile-Uruguay and Chile-Paraguay, are fully liberalized allowing airlines from each country unrestricted market access. Other agreements, such as Argentina-Ecuador, are very liberal with respect to cargo services exclusively. Such agreements grant unlimited capacity and unrestricted fifth freedom rights for multiple airlines, but do not allow carriers to operate standalone international services that depart or arrive from the other country (so called seventh freedom rights). On the other end of the spectrum, there are very restrictive bilateral. Although they constitute the exception rather than the rule, their limitations carry negative effects for an effective development of cargo services within the signatory countries. Some of the bilaterals signed by Venezuela provide a clear example of a restricted ASA, where capacity is set to unreasonably low levels (two weekly flights with Argentina and Chile, four with Ecuador, Paraguay and Panama). In addition, frequencies granted are for all type of traffic, meaning that they must be shared between passenger and cargo flights. They also limit competition by allowing only one carrier per country. In the best case scenario the market will operate as a duopoly, and the expected results of such arrangement are higher prices and lower services levels when compared to a competitive market.
16 Depending on the ASA, these rights might be exercised on flights within South America, Latin America, or even the Americas.

36
37
P H Y S I C A L A N D S O F T B A R R I E R S T O E F F E C T I V E I N T E G R A T I O N
3.1 AIR CARGO INFRASTRUCTURE A survey conducted by ALTA with its member airlines in November 2009 reveals that while there are certain infrastructure issues at some airports, they do not appear to cause critical limitations to the air cargo business.
In addition to several topics which are out of the scope of the present study, the survey enquired about the following topics:
ease of access to the airport,
availability of space for parking, loading, and unloading trucks,
ease of access and functionality of cargo bays,
availability, capacity, location, and opening hours of general purpose and bonded warehouses,
suitability, location, and capacity of the ramp used for cargo operations,
market conditions under which ground handling services are provided,
security of the premises,
cost.
Airlines were asked to value each of the topics for the main airports where they have cargo operations. The survey identified shortcomings in different areas. The assessments were made in absolute terms, meaning that airports were not ranked from best to worst. Each airport was valued on its own merits. Only those airports for which responses from at least three airlines were received were included in the analysis.
Infrastructure and operations topics were answered separately; the results are depicted in the graphs in Figure 3-1 and Figure 3-2.
3
38
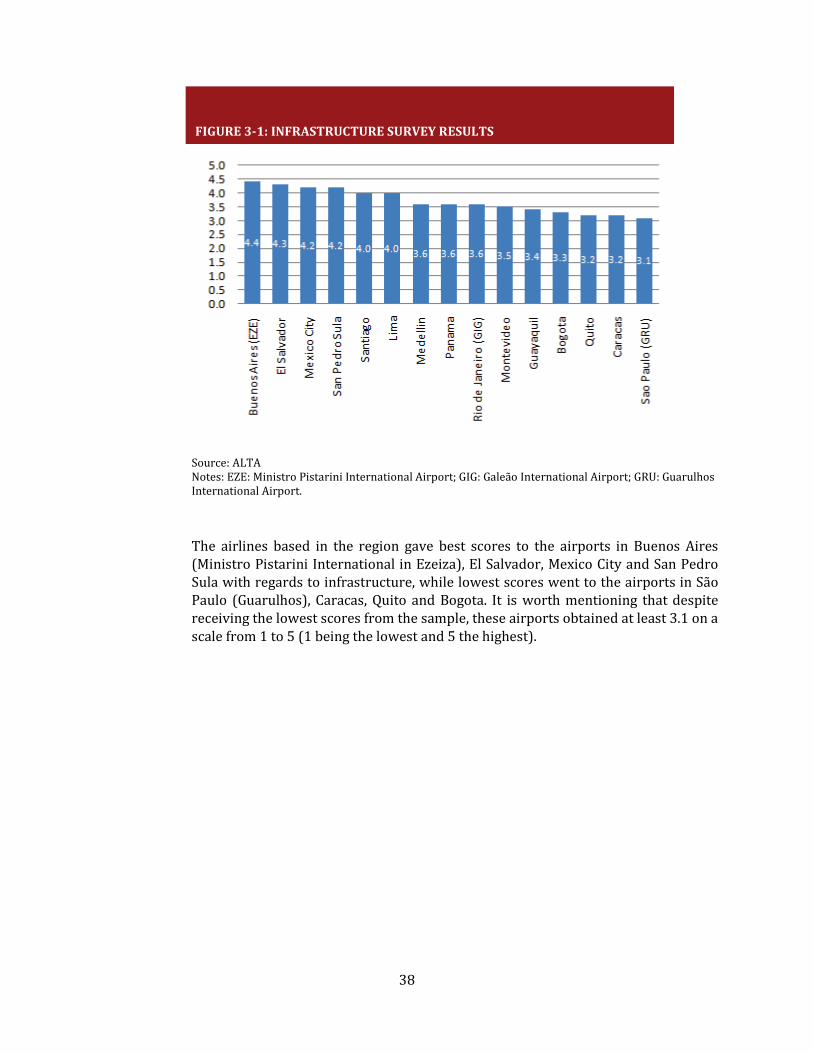
FIGURE 3-1: INFRASTRUCTURE SURVEY RESULTS
Source: ALTA Notes: EZE: Ministro Pistarini International Airport; GIG: Galeão International Airport; GRU: Guarulhos International Airport.
The airlines based in the region gave best scores to the airports in Buenos Aires (Ministro Pistarini International in Ezeiza), El Salvador, Mexico City and San Pedro Sula with regards to infrastructure, while lowest scores went to the airports in São Paulo (Guarulhos), Caracas, Quito and Bogota. It is worth mentioning that despite receiving the lowest scores from the sample, these airports obtained at least 3.1 on a scale from 1 to 5 (1 being the lowest and 5 the highest).
39
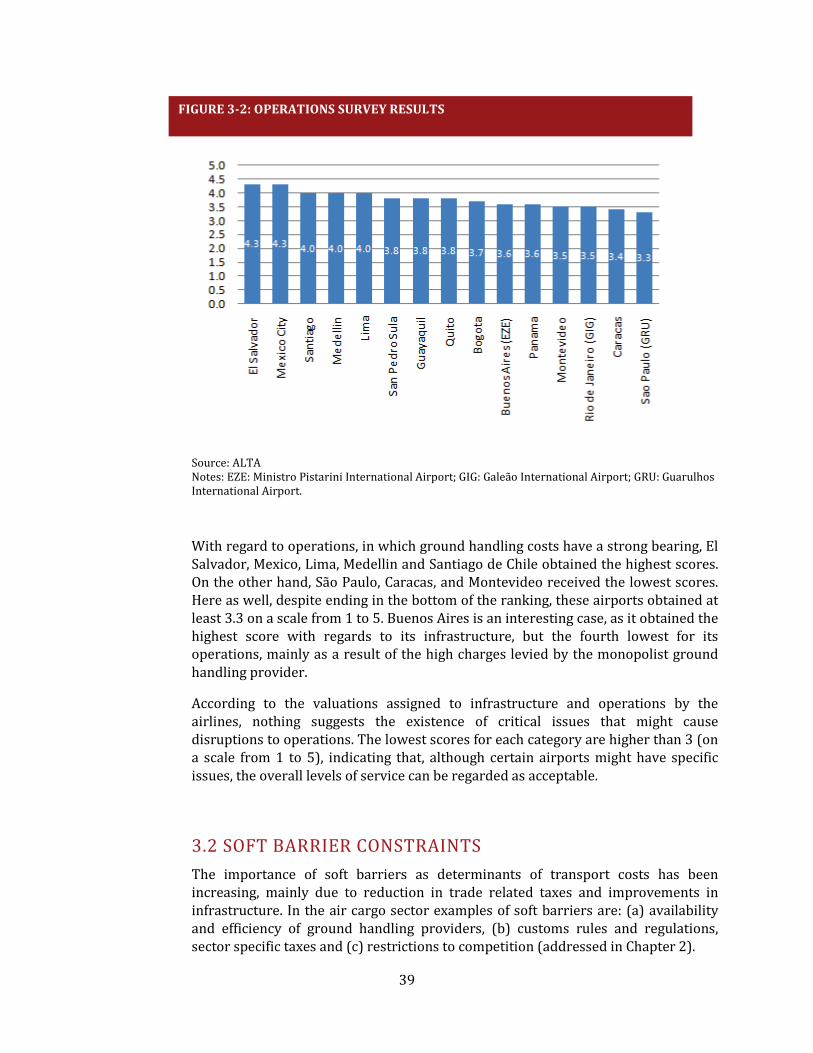
Source: ALTA Notes: EZE: Ministro Pistarini International Airport; GIG: Galeão International Airport; GRU: Guarulhos International Airport.
With regard to operations, in which ground handling costs have a strong bearing, El Salvador, Mexico, Lima, Medellin and Santiago de Chile obtained the highest scores. On the other hand, São Paulo, Caracas, and Montevideo received the lowest scores. Here as well, despite ending in the bottom of the ranking, these airports obtained at least 3.3 on a scale from 1 to 5. Buenos Aires is an interesting case, as it obtained the highest score with regards to its infrastructure, but the fourth lowest for its operations, mainly as a result of the high charges levied by the monopolist ground handling provider.
According to the valuations assigned to infrastructure and operations by the airlines, nothing suggests the existence of critical issues that might cause disruptions to operations. The lowest scores for each category are higher than 3 (on a scale from 1 to 5), indicating that, although certain airports might have specific issues, the overall levels of service can be regarded as acceptable.
3.2 SOFT BARRIER CONSTRAINTS The importance of soft barriers as determinants of transport costs has been increasing, mainly due to reduction in trade related taxes and improvements in infrastructure. In the air cargo sector examples of soft barriers are: (a) availability and efficiency of ground handling providers, (b) customs rules and regulations, sector specific taxes and (c) restrictions to competition (addressed in Chapter 2).
FIGURE 3-2: OPERATIONS SURVEY RESULTS
40
Relying on ALTA’s November 2009 survey, airlines identified ground-handling services (competition in the market and high costs) as a major concern for airports with high overall scores such as El Salvador, Buenos Aires, and San Pedro Sula, and airports with low scores such as Rio de Janeiro, Caracas, and São Paulo. There is a high correlation between allegations of high ground handling charges and airports where the service is provided by only one company in monopoly conditions, suggesting that this is the root cause of the problem.
The hours of attention, long processing times, and advanced information requirements of customs agencies also appear as a widespread concern. Although this issue is common to all modes of transportation, air cargo is particularly vulnerable given the shorter lead times involved when compared to land or sea shipping.
Service providers in the region also have concerns regarding warehouse security in Mexico, physical movements of cargo and general service levels at Caracas, and loading bays and warehouses at São Paulo.
Other issues brought up by the airlines in the survey do not generate the same level of concern as costs. Besides, the nature of these problems is not quite clear, as airlines have assigned contradicting values for some of them: while some companies were very pleased with a certain topic at any given airport, others valued it with a low score. Some examples are security in Buenos Aires, which according to one company is not very reliable while other airlines claim to be satisfied, ramp space availability in Bogota, which is not sufficient according to two airlines but is adequate according to other two, or loading bays in Guayaquil, which were valued with 1 by one airline and with 3 and 4 by two others.
During the preparation of this report, a round of consultation with several airlines, economic regulators and transport ministries in the LAC region was carried out. The consultation allowed checking the consistency between the findings of the ALCA survey (that could be biased as it only reflects the view of airlines), the relatively scarce publicly available information in the sector and the results of in-house research. The main concerns expressed by airlines that complement those presented in previous paragraphs can be summarized as follows:
a) The only way to circumvent restrictive ASAs is to create local affiliates. Set up of a local affiliate implies extra operating costs of between USD 5-10 million per year.17
b) Customs should implement paperless practices. This initiative, led by IATA would reduce operating costs as custom and control processes are simplified.
c) Several countries are increasing custom fees for air cargo. According to the airlines consulted, the objective is to increase fiscal resources. Another complaint was the increasing incidence of fines for paperwork not filled appropriately (or in time) as a revenue collection source.
17 Another action to circumvent restrictive ASAs is to use a figure known as interchange: a plane licensed in country X is flown from country A with pilots licensed in country A. This allows to liberate the property/licensing/operation of aircrafts (allowing more freedom of capital inputs) but restrictions on nationality and licensing of pilots remain. The practice of interchange began in LAC in 2008.
41
d) The cost of doing business with the United States is increasing. This market explains approximately 70 percent of the air cargo market for LAC. Since September 11, 2001 the United States has been increasing cargo inspections which have a direct impact on costs. In addition, the United States still has strong restrictions on foreign ownership of airlines.

42
43
R E C O M M E N D A T I O N S
Most ASAs within the region allow more capacity than is currently operated by the airlines, and still leave room for extensive capacity/frequencies expansions. But although capacity does not appear to be constrained, the modification of certain features of the bilaterals could drive an improvement in both the quantity and quality of cargo services by enabling airlines to compete freely in an open, unrestricted market. Both in the region and outside, there has been a tendency to lift certain restrictions for cargo services, even when those very same limitations still apply for passenger flights.
Instead of assigning specific frequencies for cargo flights, many bilaterals currently in place in LAC define capacity for all services. Thus, capacity allowance must be shared between passenger and cargo services. In those cases where capacity is barely sufficient for passenger flights, this can seriously limit the ability of carriers to schedule cargo services, as there might not be additional capacity available. This issue can be mitigated if those bilaterals that do not allow unlimited capacity contemplated additional frequencies to be used by cargo services exclusively.
Even though the capacity allowed in the ASAs might be adequate for existing demand, it could still be limiting competition. Multiple designation does not warrant competition, since if a certain bilateral allows limited frequencies (suppose that number is seven a week) and a single airline operates most of them (suppose six of the seven allowed), a second airline from the same country willing to compete with the incumbent carrier would not be able to enter the market and become a strong competitor as limited number of frequencies available (in the example only one) will not constitute material competition capable of affecting market conditions (prices, quality of service). Even when capacity might be enough for existing cargo volumes, airlines might be prevented from entering a market, which results in reduced consumer choice. The recommendation for the authorities that do not allow unlimited capacity is to consider the possibility of fostering competition when defining capacity.
Most route charts of bilaterals are driven by passenger markets, rather than cargo ones. But certain bilaterals, mostly those that have not been updated in the last ten or twenty years, still feature route charts that specify points of entry that are not necessarily the best choice for cargo operations.
With regards to traffic rights, granting unrestricted fifth freedoms right could allow airlines to schedule cargo flights in markets that would otherwise not be profitable. Fifth freedoms would enable airlines to operate multi-stop flights connecting markets that might be too small for direct services. For example, demand for air cargo services between Quito and Los Angeles and between Caracas and Los Angeles might not warrant a single flight when considered separately. But if an airline based in either Ecuador or Venezuela was able to operate a Quito-Caracas-
4
44
Los Angeles flight, and load cargo at both Latin American cities, the service could become economically feasible. In addition to new routes, unrestricted fifth freedoms would likely stimulate frequencies in existing ones.
Certain aspects of most bilaterals, such as the lack of widespread seventh freedom rights (which allow carriers to operate standalone international services that do not arrive nor depart from their home countries) or restrictive ownership clauses (which state that designated airlines must be substantially owned and effectively controlled by nationals of the country), prevent carriers from establishing cargo hubs in third countries. A number of workarounds allowed some airlines to establish subsidiaries in other countries, but those require the carrier to partner with a national of the country where the subsidiary is located, and to hold a less than 50 percent stake. In some cases, ownership restrictions—especially those regarding cargo services—have been somewhat relaxed in the last few years thanks to a number of ad-hoc exceptions and permissions. Such is the case of Chile’s LAN cargo subsidiary in Colombia, which is substantially owned by Chilean nationals (90 percent), although the majority of the board members are Colombian citizens. The subject of airline ownership (or for that matter full liberalization of international cargo services) should be considered by the authorities, as a way to increase competition by allowing unrestricted market access to foreign airlines.
Among all options presented in this paper aimed at generating the conditions for more competition within the framework of existing ASAs, the best one would be to reach a multilateral open skies agreement that would lift all restrictions (capacity, frequencies, rates) for air cargo operations. In addition, it would be desirable to lift all foreign property restrictions of airlines.
High ground handling charges are a concern for airlines in the region. This issue is worthy of consideration, since as a general rule, excessive charges are observed at both state-owned and private airports with only one ground handling provider operating as a monopoly. Considering that the ground handling service could be easily provided under competitive conditions, the focus of the authorities should be on the economic regulatory framework for airports, ensuring that there is a minimum number of providers in order to guarantee market forces conditions. In the same direction, access charges levied by the airport to ancillary service providers (such as ground handling) should also be looked at, since excessive royalties, which will be passed on to the airlines, will also result in excessive handling costs.
Policies aimed at reducing operating costs and related to soft constraints should also be implemented: paperless custom procedures, improved security in airport premises, streamlining of custom inspection processes.
Given their regulatory nature, the proposed recommendations do not entail monetary costs. But, although inexpensive, these modifications might take a long time to implement, as they require extensive negotiations among countries.
45
R E F E R E N C E S
Barbero, José A. (2010). “La logística de cargas en América Latina y el Caribe: una agenda para mejorar su desempeño” Notas Técnicas No. IDB -TN-103. Departamento de Infraestructura y Medio Ambiente. Inter-American Development Bank, Washington, D.C.
Blyde, Juan and Moreira, Mauricio Mesquita (2010). “Trade and Productivity: A route with reallocation with a high transport toll,” in Carmen Pages (editor) The Age of Productivity. Transforming Economies from the Bottom up. Inter-American Development Washington, D.C., and Palgrave Macmillan Press.
Boeing: World Air Cargo Forecast. 2008-2009. Available at www.boeing.com
Giordano, Paolo; Guzmán, Julio and Watanuki, Masakazu (2010). “Estimating the Impact of Transport Costs in Latin America’s Trade”. Inter-American Development, Washington, D.C. (forthcoming).
Gordillo, Marcelo Darwin; Stokenberga, Aiga and Schwartz, Jordan (2010). “Central America’s Intra and Extra-Regional Trade Potential: A Gravity Model Approach to Understanding Regional Integration.”Economics Unit, LCSSD, World Bank, Washington, D.C.
Micco, Alejandro and Serebrisky, Tomás (2006). “Competition Regimes and Air Transport Costs: The Effects of Open Skies Agreements.” Journal of International Economics Vol 70.
Moreira, Mauricio Mesquita; Volpe, Christian and Blyde, Juan (2008). Unclogging the Arteries: a Report on the Impact of Transport Costs on Latin American Trade. Inter-American Development Bank, Washington, D.C. and Harvard University Press.
World Bank (2004). Reforming Infrastructure. Privatization, Regulation and Competition. Oxford University Press for World Bank, Washington, D.C.
---. (2009) Air Freight: A Market Study with Implications for Landlocked Countries. Transport Papers. N 26, August.
---. (2010a). Connecting to Compete: Trade Logistics in the Global Economy 2010. Washington, D.C.
5
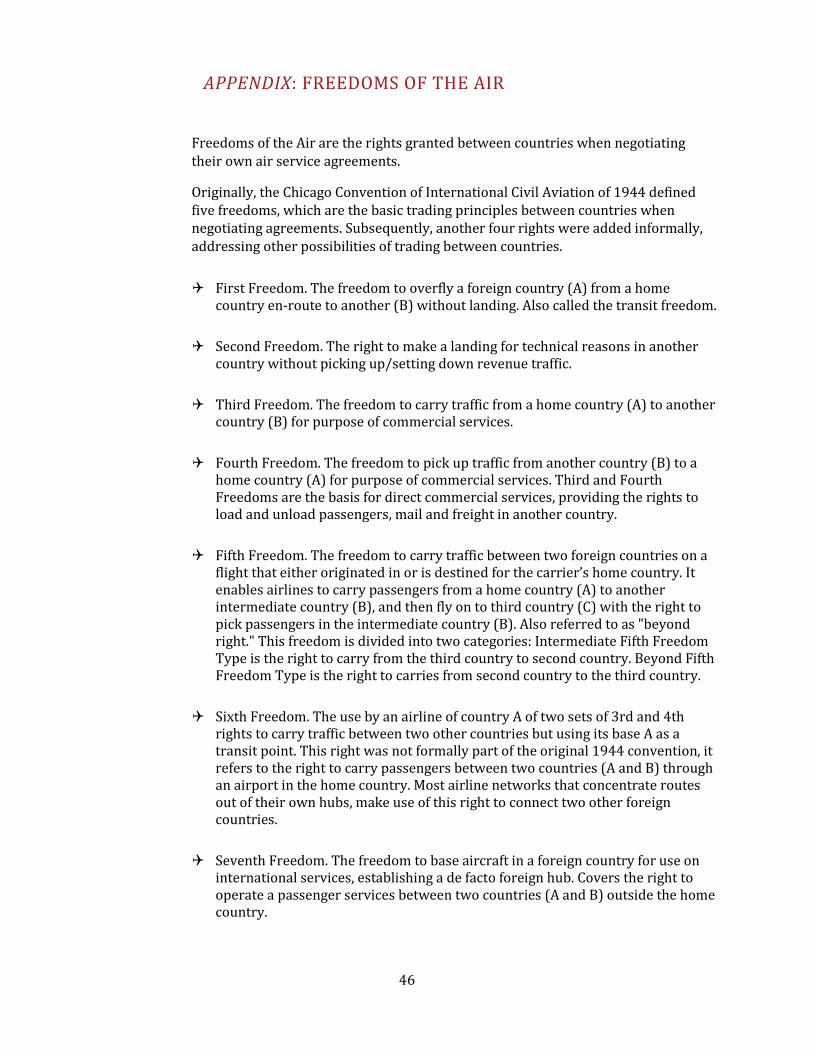
46
APPENDIX: FREEDOMS OF THE AIR
Freedoms of the Air are the rights granted between countries when negotiating their own air service agreements.
Originally, the Chicago Convention of International Civil Aviation of 1944 defined five freedoms, which are the basic trading principles between countries when negotiating agreements. Subsequently, another four rights were added informally, addressing other possibilities of trading between countries.
First Freedom. The freedom to overfly a foreign country (A) from a home country en-route to another (B) without landing. Also called the transit freedom.
Second Freedom. The right to make a landing for technical reasons in another country without picking up/setting down revenue traffic.
Third Freedom. The freedom to carry traffic from a home country (A) to another country (B) for purpose of commercial services.
Fourth Freedom. The freedom to pick up traffic from another country (B) to a home country (A) for purpose of commercial services. Third and Fourth Freedoms are the basis for direct commercial services, providing the rights to load and unload passengers, mail and freight in another country.
Fifth Freedom. The freedom to carry traffic between two foreign countries on a flight that either originated in or is destined for the carrier’s home country. It enables airlines to carry passengers from a home country (A) to another intermediate country (B), and then fly on to third country (C) with the right to pick passengers in the intermediate country (B). Also referred to as "beyond right." This freedom is divided into two categories: Intermediate Fifth Freedom Type is the right to carry from the third country to second country. Beyond Fifth Freedom Type is the right to carries from second country to the third country.
Sixth Freedom. The use by an airline of country A of two sets of 3rd and 4th rights to carry traffic between two other countries but using its base A as a transit point. This right was not formally part of the original 1944 convention, it refers to the right to carry passengers between two countries (A and B) through an airport in the home country. Most airline networks that concentrate routes out of their own hubs, make use of this right to connect two other foreign countries.
Seventh Freedom. The freedom to base aircraft in a foreign country for use on international services, establishing a de facto foreign hub. Covers the right to operate a passenger services between two countries (A and B) outside the home country.

47
Eighth Freedom. The freedom to carry traffic between two domestic points in a foreign country on a flight that either originated in or is destined for the carrier’s home country. Also referred to as "cabotage" privileges. It involves the right to move passengers on a route from a home country to a destination country (A) that uses more than one stop along which passengers may be loaded and unloaded.
Ninth Freedom. The freedom to carry traffic between two domestic points in a foreign country, not necessarily involving a flight to the home country.