Embed Size (px)
Citation preview

MANY HANDSMAKE LIGHTWORK
S eismic data is an extremely powerful tool for investigating and understanding the geological, tectonic and stratigraphic components of basin evolution and defining potential petroleum systems. However, with increasing costs, competition and the move into higher risk areas, it is more critical to identify and mitigate the subsurface risks in order to obtain commercially viable
discoveries. The desire to extract more from seismic data requires innovative working practices that can be achieved with an integrated evaluation process. This article describes a selection of case studies to illustrate how the integration of seismic data with other tools and methodologies greatly enhances the interpretation of all available data, thereby increasing interpretation confidence and reducing subsurface risk.
Gravity gradiometry approach for enhanced velocity model, improving depth‑migrated seismic image, GabonThe South Gabon Basin is a prospective basin in approximately 100 ‑ 3300 m water depth. Along the South Gabon margin the ubiquitous late Aptian evaporites (Ezanga salt) extend from the continental shelf in the east to the oceanic crust in the west creating
Karyna Rodriguez and Dan Negri, Spectrum, Neil Dyer, ARKeX, and Håkon T. Pedersen,
EMGS, examine petroleum system insights provided by multi‑client data integration case studies.

| Oilfield Technology Reprinted from January 2015
an extensive subsalt play. Interpretation of 2D post stack depth‑migrated seismic data highlighted the need to improve the velocity model and seismic resolution below the salt to define the main reservoir objective, the Gamba Formation sandstones. These lie unconformably over the subcropping rift‑fill sequence containing the secondary objectives in Dentale Formation.
A multi‑client geophysical dataset (Figure 1) comprising 9000 km of 2D PreSTM and PreSDM seismic data (2009) and 9000 km2 gravity gradiometry survey (2010) was available. Density and velocity estimates were taken from nearby boreholes.
Gravity and seismic data are natural companions with the subsurface density distribution representing part of the Earth model, derived directly from gravity measurements or through inversion of the seismic data for impedance. The relationship between density and velocity is in most situations good and is exploited, developing a co‑operative interpretation in which the seismic velocity model and the density model derived using gravity observations support each another. The models have the same structure in depth and material properties linked by calibrated relationships supported by borehole data.
The challenge is to improve imaging and therefore understanding of the presalt traps and the Gamba and Dentale Formation reservoirs. The product of gravity gradient modelling and the density model are iteratively integrated into the depth imaging workflow, utilising Paradigm’s GeoDepth™ software. The relationship between velocity and density is applied to create, validate and modify velocity models that feed into and aid the depth imaging workcycle. The depth imaging strategy is initially for a layer‑based, top down approach to update the
velocity field. These updates are then verified at key stages against the density model.
The determination of optimal workflows and best practice are key parts of this study. This workflow has particular relevance to interpreting geological settings that are limited by current imaging techniques.
The initial density model for a dip line of the Gabon survey is shown in Figure 2. Using the workflow described above, these were converted to velocity and used as a starting model for the PSDM work.
The integration of gravity into the development of a velocity model for depth migration is an exciting development, with broadband gravity measurements influencing the velocity model with more certainty. Integration results have improved confidence in the output image and also provided an independent test of the Earth model.
Indications of a working petroleum system from BSR analysis, BrazilAn integrated interpretation of 12 km offset 2D seismic data and reprocessed legacy data has revealed evidence of a working petroleum system in the Pelotas Basin, located in southern Brazil and northern Uruguay.
Rifting initiated in the Pelotas Basin at the time of the separation of the South American and African plates during the breakup of Gondwana. Rifting was followed by passive margin subsidence from mid‑Cretaceous to present day with deposition of up to 7000 m of siliciclastics, including Lower and Upper Cretaceous and Palaeocene source rocks (Figure 3). There are seismic indications of an active petroleum system similar in character to the Niger Delta, offshore Mozambique and Tanzania.
The seismic data show that since the inception of rifting (circa 125 Ma) the palaeo‑tributaries of the Rio de la Plata have moved along the margin several times. The most recent depocentre in southwest Pelotas displays a direct hydrocarbon indicator in the form of bottom simulating reflectors (BSRs) covering 40 000 km2 (Figure 4), indicating that the depocentre or delta prograded over and matured Palaeocene and Cretaceous source rocks as seen on the seismic section.
Gas and condensate migrated through the sedimentary prism via faults and gas chimneys to be trapped by the gas‑water crystal phase change to a solid layer of gas hydrates, creating the BSR. The updip limit of the BSR at approximately 300 m water depth is controlled by the dynamics of the phase change due to temperature and pressure. The outboard/down‑dip limit is controlled by the limit of the extent of the gas and oil generated within the petroleum system. The extent of the BSR is beyond the interpreted gas kitchen in the basin. The outer limits of the hydrocarbons within the BSR are most likely being sourced from the Cretaceous source rocks and from the oil kitchen. The oil kitchen extends throughout the Pelotas Basin proving up an extensive prospective area for oil and gas exploration.
2D seismic and the inversion of 3D controlled source electro magnetic data (CSEM), BrazilFoz do Amazonas (FdA) is the most northerly of the Brazilian equatorial margin basins with an area of 282 909 km2 and water depths ranging from 50 m to greater than 3000 m. In this largely unexplored frontier basin exploration drilling has been confined to the shelf with 95 exploration wells drilled, 10 wells with hydrocarbon shows. For the 11th Licence Round exploration focussed on the potentially large reserves in distal,
Figure 1. Multi‑client geophysical portfolio.
Reprinted from January 2015 Oilfield Technology |
Late Cretaceous/Palaeogene deepwater turbidite plays encouraged by successful wells in French Guiana.
Late Cretaceous/Early Palaeocene Limoeiro Formation and Middle Miocene Orange Formation comprise turbidite sandstones with average porosity of 13%. Aptian shales are a potential hydrocarbon source rock with up to 10% TOC and excellent potential for oil generation. The shales at the base of the Limoeiro Formation are a second hydrocarbon source rock with TOC’s up to 3.5% and good to excellent oil/gas generation potential. The Limoeiro shales provide a regional seal. FdA has considerable exploration potential; ANP 11th Round presentation quoted in place volumes of 14 billion bbls of oil and 40 trillion ft3 of gas.
In 2012 Spectrum acquired 21 369 km of 2D seismic, gravity and magnetics data providing a regional grid and a suite of final products (PreSTM, PreSDM, Gathers, Angle stacks, Velocities) to evaluate the FdA exploration potential (Figure 5).
In 2013 EMGS acquired approximately 4500 km2 of 3D Controlled Source Electro Magnetic (CSEM) data in a 2.5 x 2.5 km receiver grid in water depths ranging from 200 m to 3000 m. The receiver grid filled in the Spectrum 5 x 5 km 2D seismic grid with a minimum of 3 receiver lines deployed at all times providing true broadside data at 2.5, 5 and 7.5 km offset.
The preliminary interpretation identified several large Late Cretaceous/Palaeogene anomalies in the basin. An example of one seismic lead comprising a thick package of Cretaceous turbidites with a corresponding CSEM anomaly is illustrated in Figure 6.
EM anomalies are observed in the deepwater sediments with varying strength. By choosing an average resistivity window that encompasses the expected burial depths of the Lower Tertiary and Upper Cretaceous channel systems, some EM anomalies resemble channel geometries. In strike direction, some of the channels observed on Spectrum seismic are associated with high resistivity while most channels are not.
The combination of modern seismic, gravity, magnetics and CSEM data provides a powerful exploration tool for identifying and de‑risking exploration leads in frontier basins. With potentially large multilevel leads and large areas of open acreage Foz do Amazonas provides an exciting frontier exploration opportunity that will feature in future Brazil licence rounds. The results of the FdA integrated interpretation will be published in a report and available for purchase in 2014.
Integration of sea surface slicks and seismic interpretation to define play concepts in the western MediterraneanThe western Mediterranean Basin is largely unexplored with no wells drilled in the deeper water parts of the basin. Exploration has been limited to the shallow water Mesozoic carbonate trend where two oilfields; Casablanca (Lower Miocene source) and Amposta (Jurassic source) have been developed.
Between 2011 and 2013 Spectrum reprocessed 25 000 km of seismic data; the
largest 2D seismic dataset in the region covering the entire basin (Figure 7).
Analysis of sea surface slicks visible in satellite images was integrated with seismic interpretation to identify the areas where a functioning hydrocarbon source is likely to be active thereby
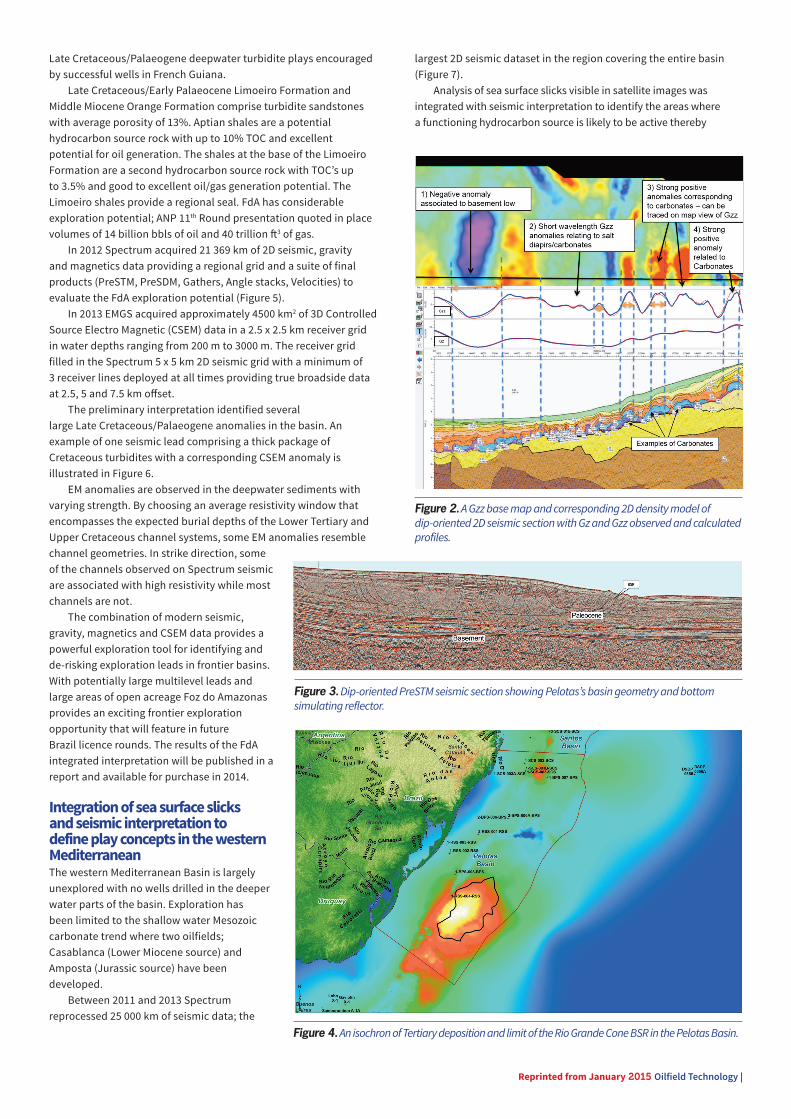
Figure 2. A Gzz base map and corresponding 2D density model of dip‑oriented 2D seismic section with Gz and Gzz observed and calculated profiles.
Figure 3. Dip‑oriented PreSTM seismic section showing Pelotas’s basin geometry and bottom simulating reflector.
Figure 4. An isochron of Tertiary deposition and limit of the Rio Grande Cone BSR in the Pelotas Basin.

| Oilfield Technology Reprinted from January 2015
significantly de‑risking this play component in the basin. The integration is important because differentiation between natural hydrocarbon seeps and anthropogenically sourced slicks is difficult to assess using satellite imagery alone. Correlation with seismic interpretations is key to understanding the results of any slicks study.
Several trends were identified in the sea surface slicks study and correlated with interpreted seismic profiles. The clearest trend (Figure 7, Trend 1) correlated closely with up‑dip thinning and breakup of the regionally extensive Messinian halite. Several slicks (Figures 7, 8) were identified in association with a fault that breached the halite canopy and reached the sea floor.
A second trend (Figure 7, Trend 2) not associated with the halite canopy, is associated with the margins of an eroded anticline onto which potential Mesozoic source rocks onlap. With the Miocene source interval of the Casablanca trend immature here it is proposed that this Jurassic source, analogous of the Amposta field may be viable in the deep water sector of the basin. Other slicks (Figure 7, Trend 3) also support evidence of this play type, suggesting that this Jurassic source is present and mature across the basin.
The integrated seismic‑seep study provides good evidence of a working petroleum system below the Messinian halite seal in the deepwater basin, and in the deeper Mesozoic interval. The results have de‑risked the hydrocarbon charge and suggest that presalt or Mesozoic prospects have the potential to be charged with oil.
Geological and geophysical data integration to determine the hydrocarbon potential offshore CroatiaOffshore Croatia lies in the NE of the Adriatic Sea (Figure 9). Plio‑Pleistocene fields produce commercial biogenic gas from clastic reservoirs in both Italian and Croatian waters while in the Italian southern Adriatic Sea oil is produced from pre‑Miocene carbonates. Whilst the Italian Adriatic has been successful for several reasons the Croatian offshore is relatively unexplored.
Spectrum completed an integrated evaluation of the 2013 2D and legacy seismic, well data, ship borne gravity and magnetic data and seep data. The results were integrated with basin modelling and AVO analysis to identify the hydrocarbon potential of the offshore Croatian basins. Several new plays and leads were identified with considerable yet‑to‑find potential offshore Croatia.
The integration of seismic with gravity and magnetics data resulted in the structural interpretation of the basin. Correlation of observed Permo‑Triassic faults with the ‘gravity edges’ obtained from 2013 gravity data (Figure 9) defined the major structural domains and potential source basins. The interpretation suggests that gravity trends are mainly affected by the Permo‑Triassic syn‑rift structures. Seismic and gravity data highlighted N‑S and E‑W fault trends and a major regional fault system oriented NW‑SE. Gravity edges were used to extend some of the structural trends identified on seismic and to define trends not imaged on the seismic data. Integration of these datasets provided a clearer view of the structural grain and defined the major source rock basins and structural highs.
To understand the distribution and influence of the halite sequence an integrated workflow was adopted and resultant products conflated: Ì Identification of salt diapirs on the 2013 seismic. Ì Derivation of instantaneous frequency attribute and
correlation with the known diapirs to characterise the response. Generation of maximum salt and minimum salt interpretations across the basin.
Figure 5. Location of the integration of the CSEM anomalies with pre and post stack seismic attributes, and pre‑stack depth migrated sections.
Figure 6. Positive resistivity anomalies shown within Late Cretaceous‑Palaeocene clastic deposits, confirming hydrocarbon potential suggested from seismic mapping of several channelised systems.
Figure 7. Distribution of sea surface slicks in the Western Mediterranean (red), identified trends (blue), and the Messinian halite canopy. Inset figure is Spectrum’s seismic coverage over the Western Mediterranean Basin.

Reprinted from January 2015 Oilfield Technology |
Ì Magnetic and gravity maps correlated with characterised salt.
Ì Seismic interpretation and characterisation of salt features.
Gravity modelling undertaken by BridgePorth investigated the sensitivity of the ship borne gravity data to the distribution of salt in the section. A 2D geological model built to complement the gravity model confirmed the salt bodies generally corresponded to low gravity anomalies.
The integration of these techniques has been important in defining the amount and distribution of salt in the basin. Whilst most halite diapirs are readily identified on seismic, the distribution of halite in the section is still the subject of discussion. Understanding the role of salt in the development of the basin is crucial as halokinesis influenced the development of structures and traps in the basin. It also influenced the deposition and distribution of the Late Triassic source rock and the Cretaceous, Jurassic and Eocene platform carbonates in the basin.
The seep study integrated a radar study conducted by Airbus DS along with an optical study undertaken by Spectrum. The presence of seepage slicks implies that an active source is present and that there are migration routes within the basin. In the Adriatic, 16 seep‑seismic correlation points were identified and the results show a strong correlation between slicks nominated as medium confidence or higher and structural features interpreted from seismic. Slicks were located in association with faults, thrusts, salt diapirs and anticlines.
In addition to halite the late Triassic section contains a potential hydrocarbon source rock comprising organic rich mudstones and associated inter‑tidal algal mat sabkha deposits. This was input into a basin modelling study based on the integrate interpretation and completed by Stratochem Ltd. The results produced an estimate of the timing of source rock maturation, assessed the hydrocarbon charge history, predicted migration pathways, drainage areas, and potential hydrocarbon accumulations for the 46 000 km2 of the Adriatic Sea. The model was conditioned by data from 34 wells and four pseudo wells. The results identified key areas of mature Late Triassic oil generation and are summarised in Figure 9.
High amplitude gas leads were analysed for AVO attributes and their response compared with producing biogenic gas discoveries. The gas anomalies distribution plotted as mainly class IV with some class III at shallower depths and class II indicative of oil component in the deeper sections.
The integrated evaluation using several technologies significantly aided the prospectivity evaluation of offshore Croatia. The various methodologies and datasets provided a better understanding of the structural trends, the impact of halokinesis and ultimately defined the hydrocarbon potential of the basin.
In a high cost, high risk operating environment the five case studies described above illustrate the benefits to be gained from integrating
subsurface data and methodologies to improve interpretation confidence and ultimately reduce uncertainty in new ventures exploration.
Acknowledgments The authors would like to thank Spectrum (Chris Benson, Anongporn Intawong, Phillip Hargreaves, Lauren Penn, Anna Marszalek, Paolo Esestime and Richard Wrigley), ARKeX Ltd (Claire Husband), Airbus Defence and Space, EMGS ASA (Raymond Svendsen) and StratoChem Services for their collaboration and contribution towards this article.
Figure 8. NW‑SE dip line SPBAL‑16 (‘A’ correlates with ‘A’ in Figure 7).
Figure 9. Late Triassic maturity map. Green corresponds to peak oil generation, orange wet gas and red dry gas generation.