Embed Size (px)
Citation preview
Major Network Asset Management Plan2015 - 2025
www.alpineenergy.co.nz

Major Network Asset Management Plan 2015–2025
Approved 25 March 2015
Published 27 March 2015
© Copyright: Alpine Energy Limited 2015
Alpine Energy Limited Meadows Road PO Box 530 Timaru 7940 New Zealand Tel: +64 3 687 4300 Fax: +64 3 684 8261 Web: www.alpineenergy.co.nz
Alpine Energy Limited Major Network Asset Management Plan 2015 to 2025
1 | P a g e
Contents
1 Introduction ..................................................................................................................................... 7
1.1 The Grid ................................................................................................................................................. 10
1.2 Condition Assessment ........................................................................................................................... 12
1.3 Security Levels ....................................................................................................................................... 12
1.4 Diagram Key .......................................................................................................................................... 13
1.5 Substation List ....................................................................................................................................... 14
2 Albury Grid Exit Point ..................................................................................................................... 16
2.1 Introduction .......................................................................................................................................... 17
2.1.1 Critical Data ........................................................................................................................................... 17
2.2 Albury GXP Network Information ......................................................................................................... 18
2.2.1 Zone Substation Detail .......................................................................................................................... 19
2.2.2 Albury–Fairlie Sub–transmission ........................................................................................................... 20
2.2.3 Fairlie Zone Substation .......................................................................................................................... 20
2.2.4 Opuha Power Station ............................................................................................................................ 21
2.3 Development of Albury GXP and Substations ....................................................................................... 22
2.3.1 Substation Growth Trend and Supply Security ..................................................................................... 23
2.3.2 Rate and Nature of GXP Growth and Provisions made ......................................................................... 24
2.3.3 Specific Developments .......................................................................................................................... 24
3 Bell’s Pond Grid Exit Point .............................................................................................................. 27
3.1 Introduction .......................................................................................................................................... 27
3.1.1 Critical Data ........................................................................................................................................... 28
3.2 Bell’s Pond GXP Network Information .................................................................................................. 28
3.2.1 Zone Substation Detail .......................................................................................................................... 28
3.3 Development of GXP and Substations .................................................................................................. 31
3.3.1 Substation Growth Trend and Supply Security ..................................................................................... 32
3.3.2 Rate and Nature of GXP Growth and Provisions Made ......................................................................... 33
3.3.3 Specific Developments .......................................................................................................................... 33
3.3.4 Issues Arising from Estimated Demand ................................................................................................ 34
4 Orari Grid Exit Point ....................................................................................................................... 35
4.1 Introduction .......................................................................................................................................... 35
4.2 GXP Description..................................................................................................................................... 35
4.2.1 Critical Data ........................................................................................................................................... 35
4.3 Orari GXP Network Information ............................................................................................................ 36
4.3.1 Zone Substation Detail .......................................................................................................................... 36
4.4 Development of GXP ............................................................................................................................. 37

Alpine Energy Limited Major Network Asset Management Plan 2015 to 2025
2 | P a g e
5 St. Andrews Grid Exit Point ............................................................................................................ 39
5.1 Introduction .......................................................................................................................................... 39
5.2 GXP Description..................................................................................................................................... 39
5.2.1 Critical Data ........................................................................................................................................... 39
5.3 St. Andrews GXP Network Information ................................................................................................. 40
5.3.1 Zone Substation Detail .......................................................................................................................... 40
5.4 Development of GXP ............................................................................................................................. 41
6 Studholme Grid Exit Point .............................................................................................................. 43
6.1 Introduction .......................................................................................................................................... 43
6.2 GXP Description..................................................................................................................................... 43
6.2.1 Critical Data ........................................................................................................................................... 44
6.3 Studholme GXP Network Information .................................................................................................. 44
6.3.1 Zone Substation Detail .......................................................................................................................... 45
6.4 Development of GXP and Substations .................................................................................................. 47
6.4.1 Substation Growth Trend and Supply Security ..................................................................................... 48
6.4.2 Rate and Nature of GXP Growth and Provisions Made ......................................................................... 49
6.4.3 Specific Developments .......................................................................................................................... 49
6.4.4 Issues Arising from Estimated Demand ................................................................................................ 49
7 Tekapo Grid Exit Point .................................................................................................................... 51
7.1 Introduction .......................................................................................................................................... 51
7.2 GXP Description..................................................................................................................................... 51
7.2.1 Critical Data ........................................................................................................................................... 52
7.3 Tekapo A GXP Network Information ..................................................................................................... 52
7.3.1 Zone Substation Detail .......................................................................................................................... 53
7.4 Development of GXP and Substations .................................................................................................. 57
7.4.1 Substation Growth Trend and Supply Security ..................................................................................... 59
7.4.2 Rate and Nature of GXP Growth and Provisions Made ......................................................................... 59
7.4.3 Specific Developments .......................................................................................................................... 59
7.4.4 Issues Arising from Estimated Demand ................................................................................................ 60
8 Temuka Grid Exit Point ................................................................................................................... 61
8.1 Introduction .......................................................................................................................................... 61
8.2 GXP Description..................................................................................................................................... 61
8.2.1 Critical Data ........................................................................................................................................... 62
8.3 Temuka GXP Network Information ....................................................................................................... 62
8.3.1 Zone Substation Detail .......................................................................................................................... 63
8.4 Development of GXP and Substations .................................................................................................. 69
8.4.1 Substation Growth Trend and Supply Security ..................................................................................... 70
8.4.2 Rate and Nature of GXP Growth and Provisions Made ......................................................................... 70
8.4.3 Specific Developments .......................................................................................................................... 71
8.4.4 Issues Arising from Estimated Demand ................................................................................................ 71

Alpine Energy Limited Major Network Asset Management Plan 2015 to 2025
3 | P a g e
9 Timaru Grid Exit Point .................................................................................................................... 73
9.1 Introduction .......................................................................................................................................... 73
9.2 GXP Description..................................................................................................................................... 73
9.2.1 Critical Data ........................................................................................................................................... 74
9.3 Timaru GXP Network Information......................................................................................................... 75
9.3.1 Zone Substation Detail .......................................................................................................................... 75
9.3.2 Timaru (TIM) (Grant’s Hill) Zone Substation Detail ............................................................................... 81
9.3.3 Grasmere (GRM) and Hunt St (HNT) and North St (NST) Zone Switching Station Detail ...................... 82
9.4 Development of GXP and Substations .................................................................................................. 83
9.4.1 Substation Growth Trend and Supply Security ..................................................................................... 84
9.4.2 Rate and Nature of GXP Growth and Provisions Made ......................................................................... 87
9.4.3 Specific Developments .......................................................................................................................... 87
9.4.4 Timaru 11/33 kV Step–Up Substation ................................................................................................... 87
9.4.5 Issues Arising from Estimated Demand ................................................................................................ 88
10 Twizel Grid Exit Point ..................................................................................................................... 89
10.1 Introduction .......................................................................................................................................... 89
10.2 GXP Description..................................................................................................................................... 89
10.2.1 Critical Data ........................................................................................................................................... 90
10.3 Twizel GXP Network Information .......................................................................................................... 90
10.3.1 Zone Substation Detail .......................................................................................................................... 90
10.4 Development of GXP and Substations .................................................................................................. 94
10.4.1 Substation Growth Trend and Supply Security ..................................................................................... 95
10.4.2 Rate and Nature of GXP Growth and Provisions Made ......................................................................... 96
10.4.3 Specific Developments .......................................................................................................................... 96
10.4.4 Issues Arising from Estimated Demand ................................................................................................ 97
11 Waihao Grid Exit Point ................................................................................................................... 99
11.1 Introduction .......................................................................................................................................... 99
11.2 GXP Description..................................................................................................................................... 99
11.2.1 Critical Data ......................................................................................................................................... 100
11.3 Waihao GXP Network Information ..................................................................................................... 100
11.3.1 Waihao Zone Substation Detail ........................................................................................................... 101
11.4 Development of GXP ........................................................................................................................... 102
12 Glossary ....................................................................................................................................... 103

Alpine Energy Limited Major Network Asset Management Plan 2015 to 2025
4 | P a g e
Foreword We have taken a new approach to writing and publishing our 2015–2025 Asset
Management Plan (AMP), than we have taken in the past.
For 2015 we have produced two documents instead of the usual one. The first document,
the 2015 Asset Management Plan (AMP) is similar in layout and content of our 2014 AMP.
Information on major network assets and Transpower GXP’s, has now been placed into the
Major Network Asset Management Plan (MNAMP). The MNAMP provides staff, contractors
and other interested parties with key information on major network assets in the most
accessible form.
Together, the AMP and MNAMP have been published to meet our regulatory requirements
for asset management under the Electricity Distribution Information Disclosure 2012
(consolidated in 2015).
We encourage consumers to comment on both our AMP and MNAMP, as well comment on
the approach taken to maintain a cost effective, safe and reliable supply to South
Canterbury.
The Directors
Alpine Energy Limited
Alpine Energy Limited Major Network Asset Management Plan 2015 to 2025
5 | P a g e
Liability disclaimer The information and statements made in the MNAMP are prepared on the assumptions,
projections, and forecasts made by us, and represent our intentions and opinions at the
date of approval—25 March 2015.
Circumstances will change, assumptions and forecasts may be proved to be wrong, events
may occur that were not predicted, and we may at a later date, decide to take different
actions from those we currently intend to take as expressed in the MNAMP.
We cannot be held liable for any loss, injury or damage arising directly or indirectly as a
result of use or reliance on any information contained within the MNAMP.

Alpine Energy Limited Major Network Asset Management Plan 2015 to 2025
6 | P a g e
Director certification
Certification for Major Network Asset Management Plan 2015 to 2025
We, Stephen Richard Thompson and Alister John France, being directors of Alpine Energy
Limited certify that, having made all reasonable enquiries, to the best of our knowledge:
a) The Major Network Asset Management Plan 2015 to 2025 of Alpine Energy Limited
prepared for the purposes of clause 2.6.1 and sub clauses 2.6.3(4) and 2.6.5(3) of the
Electricity Distribution Information Disclosure Determination 2012 (consolidated in
2015) in all material respects complies with that determination.
b) The prospective financial or non–financial information included in the attached
information has been measured on a basis consistent with regulatory requirements
or recognised industry standards.
Stephen Richard Thompson 25 March 2015
Alister John France 25 March 2015
Alpine Energy Limited Major Network Asset Management Plan 2015 to 2025
7 | P a g e
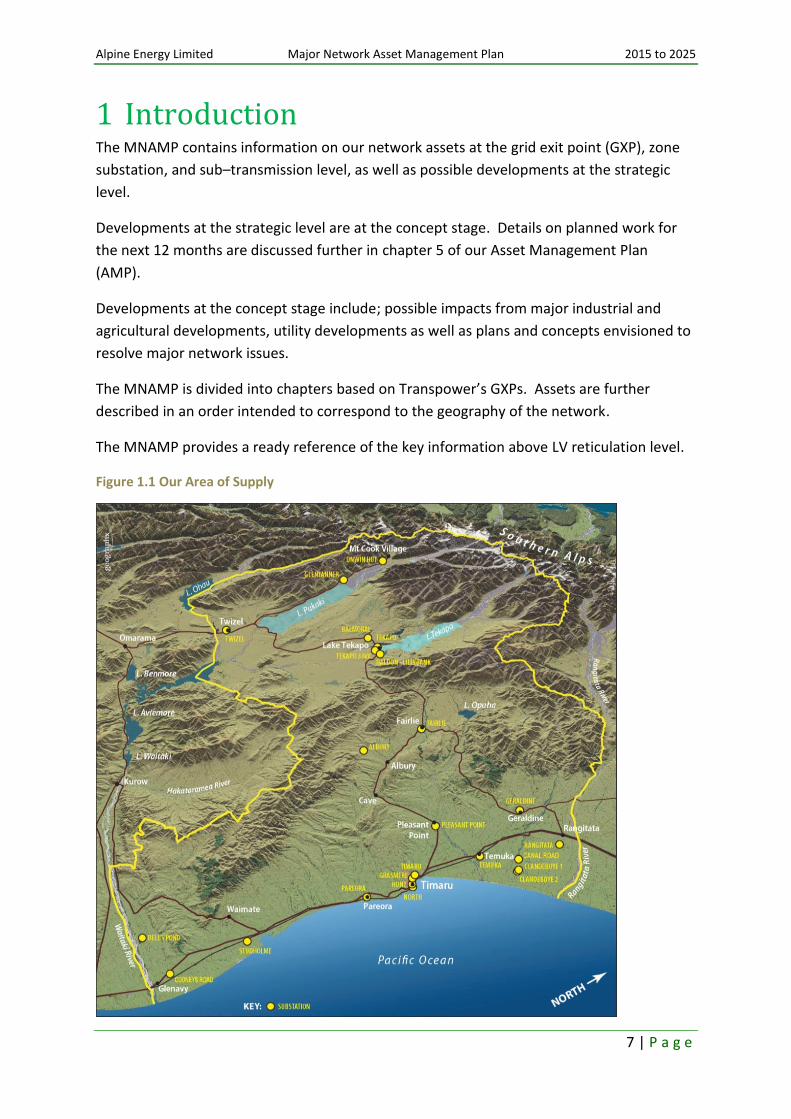
1 Introduction The MNAMP contains information on our network assets at the grid exit point (GXP), zone
substation, and sub–transmission level, as well as possible developments at the strategic
level.
Developments at the strategic level are at the concept stage. Details on planned work for
the next 12 months are discussed further in chapter 5 of our Asset Management Plan
(AMP).
Developments at the concept stage include; possible impacts from major industrial and
agricultural developments, utility developments as well as plans and concepts envisioned to
resolve major network issues.
The MNAMP is divided into chapters based on Transpower’s GXPs. Assets are further
described in an order intended to correspond to the geography of the network.
The MNAMP provides a ready reference of the key information above LV reticulation level.
Figure 1.1 Our Area of Supply

Alpine Energy Limited Major Network Asset Management Plan 2015 to 2025
8 | P a g e
One of our main focuses at present is in the Waimate District. Waimate consists of the area
supplied by the GXPs at Bell’s Pond (BPD), Studholme (STU) and to a lesser extent from
Pareora (PAR) zone substations.
Figure 1.2 Waimate Holistic GXP Load Growth Chart
When the larger irrigation projects and dairy factory expansion have progressed, it is
foreseen that a new GXP will be required at St. Andrews (STA). Work will also need to be
done to gain a new GXP at Waihao (WHO) to feed BPD, STU and Cooneys Road (CNR) from
an alternate source than the present 110 kV Waitaki circuits.
Figure 1.3 Waimate Area Growth Trend shows we will be led into a High Growth Phase
Each of the following chapters refers to an individual GXP. The existing two GXPs (BPD and
STU) in the Waimate district describe present loads, they also describe the expected loads
Waimate Trend STU0111 + BPD1101 y = 0.4615x + 7.08
0
2
4
6
8
10
12
14
16
18
20
01
-Ap
r-9
7
01
-De
c-9
7
01
-Au
g-9
8
01
-Ap
r-9
9
01
-De
c-9
9
01
-Au
g-0
0
01
-Ap
r-0
1
01
-De
c-0
1
01
-Au
g-0
2
01
-Ap
r-0
3
01
-De
c-0
3
01
-Au
g-0
4
01
-Ap
r-0
5
01
-De
c-0
5
01
-Au
g-0
6
01
-Ap
r-0
7
01
-De
c-0
7
01
-Au
g-0
8
01
-Ap
r-0
9
01
-De
c-0
9
01
-Au
g-1
0
01
-Ap
r-1
1
01
-De
c-1
1
01
-Au
g-1
2
01
-Ap
r-1
3
01
-De
c-1
3
Dem
and
(M
W)
Month
Waimate Holistic GXP Growth Chart (STU + BPD)
Waimate Holistic
Linear (Waimate Peaks)
0.0
10.0
20.0
30.0
40.0
50.0
60.0
70.0
80.0
90.0
100.0
Load
(M
W)
Year
Waimate Area Growth Trend
TotalLoadingBells Pond
Cooneys Rd
St. Andrews
Studholme
Alpine Energy Limited Major Network Asset Management Plan 2015 to 2025
9 | P a g e
after further development of two irrigation schemes and increasing dairy factory loads. Two
new chapters have been added for the proposed new GXPs; STA and WHO.
We have been concerned about the burgeoning load growth in the Temuka area, which
compounds on the whole supply chain back through the; Temuka (TMK) 33 kV bus, TMK
110/33 kV transformers, TMK–Timaru (TIM) 110 kV transmission lines, TIM 110 kV bus and
then the TIM 220/110 kV inter–connection transformers.
Transpower have been discussing the bussing of the four 220 kV circuits (i.e. CHH–TWZ
A (2), BEN–ISL A, and ROX–ISL A) near Geraldine at Orari (OAI). We have seized the
opportunity to include a new chapter in this document for OAI where a possible 220 kV GXP
could be built to off–load Clandeboye and Rangitata (RGA) from the above mentioned TMK
chain of supply by some 50 MW.
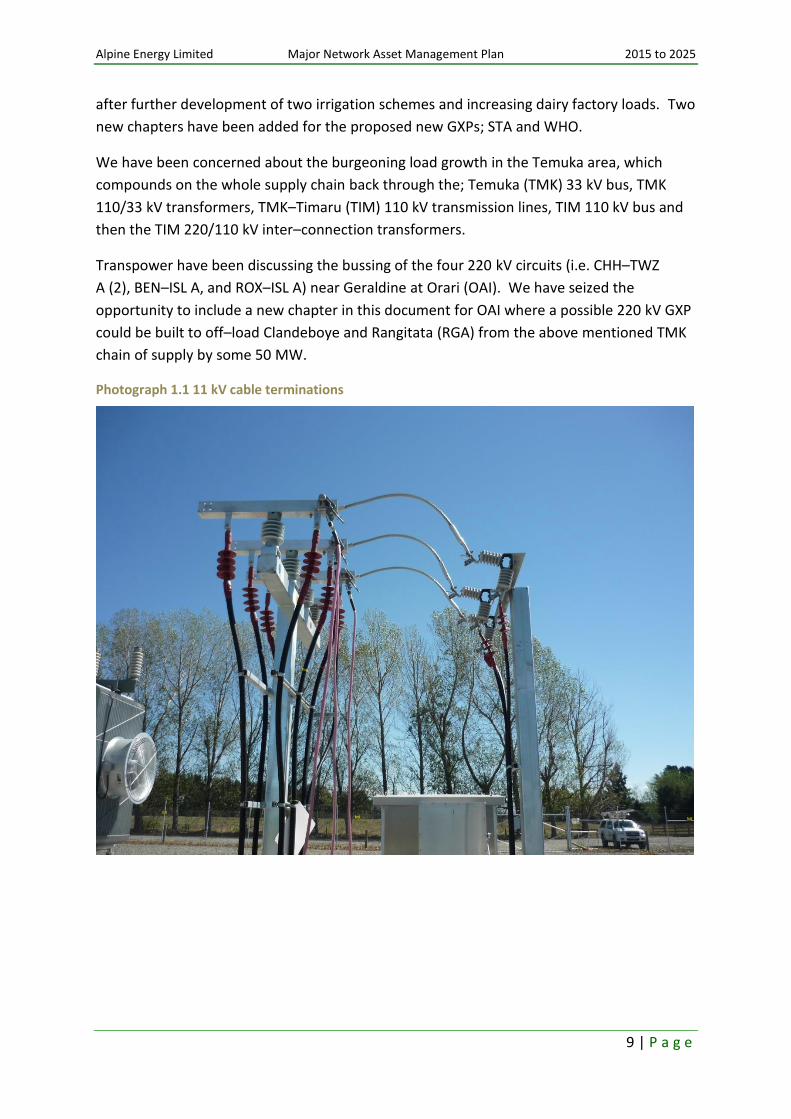
Photograph 1.1 11 kV cable terminations

Alpine Energy Limited Major Network Asset Management Plan 2015 to 2025
10 | P a g e
1.1 The Grid
Figure 1.4 represents the Grid’s present (2015) state:
Figure 1.4 2015’s Grid
Tekapo
A
Timaru 110
kV
Albury Temuka
Studholme
G1
Genesis
Twizel 220
kV
Islington 220 kV
NWL
Oamaru
G1
Blacks Point &
NWL Oamaru
Waitaki 220
kV
Livingston
e
Bell’s Pond
Ashburton
Bromley
TKB

Alpine Energy Limited Major Network Asset Management Plan 2015 to 2025
11 | P a g e
Negotiations are underway with Transpower to make alterations to the grid to allow
increased demand from irrigators and food processors. Our view of how the gird will be
configured at the end of the 10 year planning period is represented by Figure 1.5.
Figure 1.5 Future Grid Foreseen for End of Planning Period (i.e. by 2025)
Tekapo
A
Timaru 110
kV
Albury Temuka
St Andrews
G1
Genesis
Twizel 220
kV
Islington 220 kV
NWL
Oamaru
G1
Opuha
Blacks Point
& NWL
Waitaki 220
kV
Livingston
e
Waihao 110
kV
Waimate
Bell’s Pond
Cooneys Rd
Bell’s Pond 110
kV
Ashburton
Bromley
Orari 220 kV Bus
TKB
Clandeboye
Alpine Energy Limited Major Network Asset Management Plan 2015 to 2025
12 | P a g e
1.2 Condition Assessment
This document includes ratings of network assets under each GXP and the network
connected. A description of ratings is shown below:
Poor—Will need to be replaced in the near future as failure is a possibility
Good—Sufficient for present needs and security requirements
Excellent—Unlikely to fail for the foreseeable and unforeseeable future.
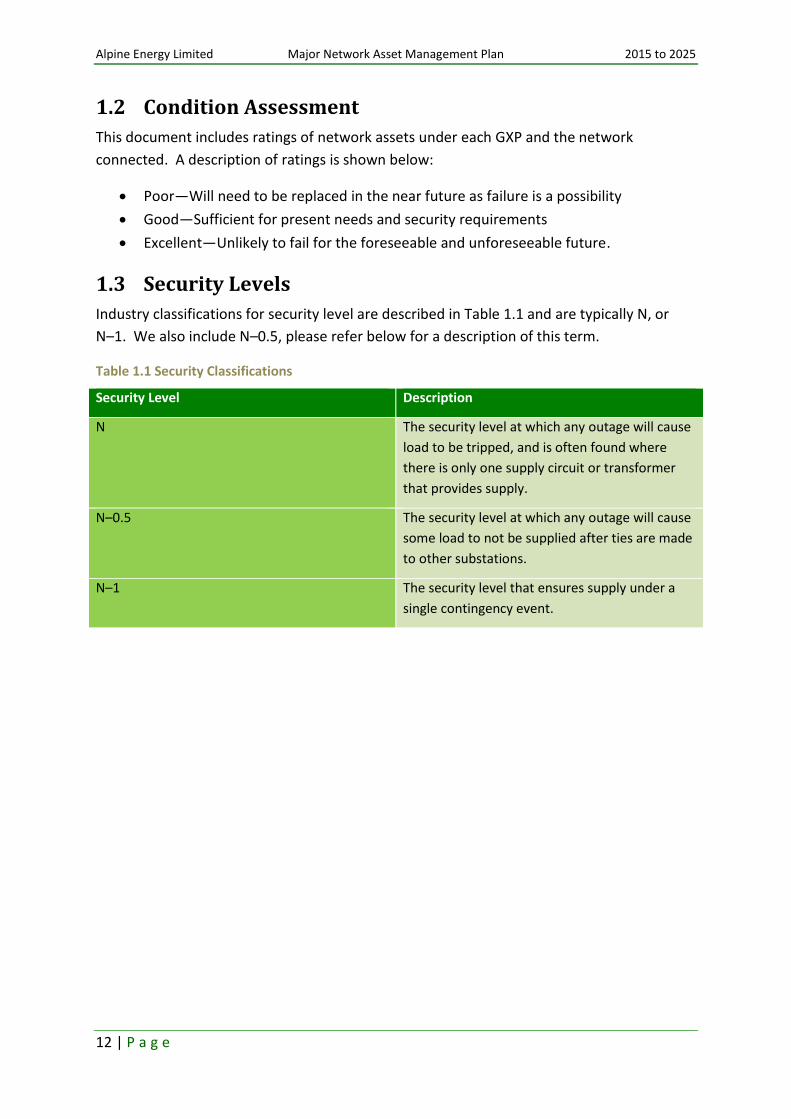
1.3 Security Levels
Industry classifications for security level are described in Table 1.1 and are typically N, or
N–1. We also include N–0.5, please refer below for a description of this term.
Table 1.1 Security Classifications
Security Level Description
N The security level at which any outage will cause
load to be tripped, and is often found where
there is only one supply circuit or transformer
that provides supply.
N–0.5 The security level at which any outage will cause
some load to not be supplied after ties are made
to other substations.
N–1 The security level that ensures supply under a
single contingency event.
Alpine Energy Limited Major Network Asset Management Plan 2015 to 2025
13 | P a g e
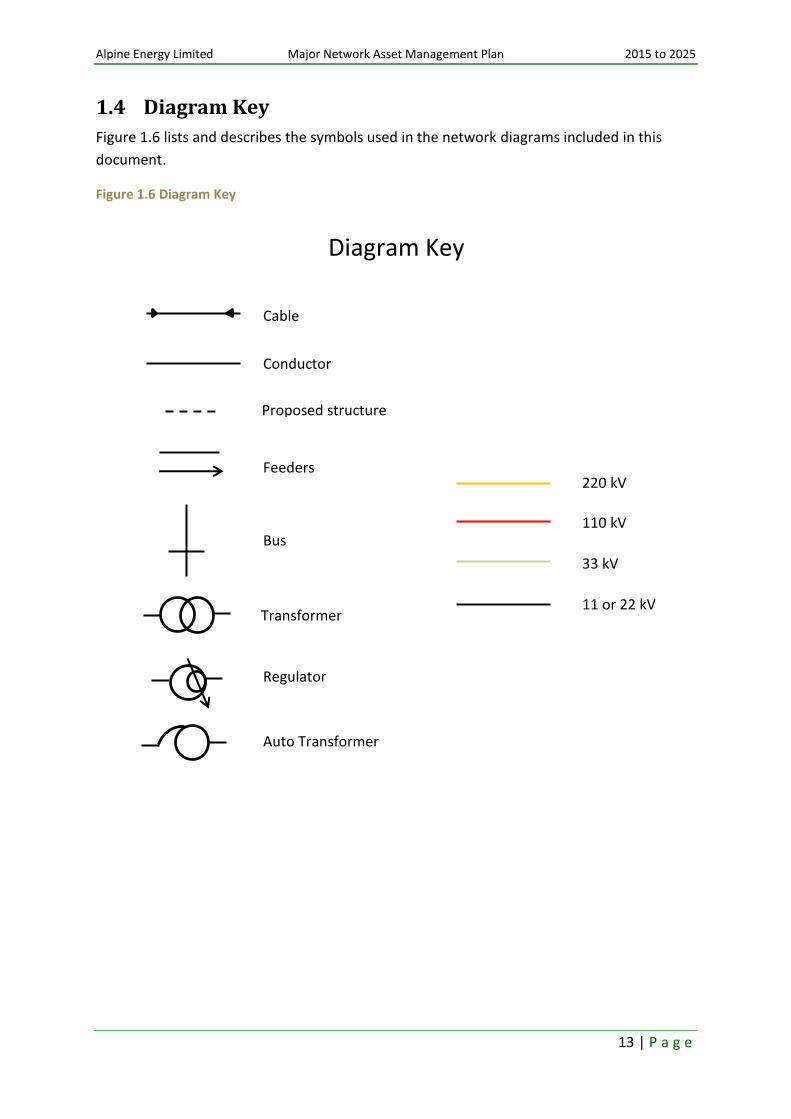
1.4 Diagram Key
Figure 1.6 lists and describes the symbols used in the network diagrams included in this
document.
Figure 1.6 Diagram Key
Transformer
Regulator
Auto Transformer
Bus
Feeders
Proposed structure
Conductor
Cable
Diagram Key
220 kV
110 kV
33 kV
11 or 22 kV

Alpine Energy Limited Major Network Asset Management Plan 2015 to 2025
14 | P a g e
1.5 Substation List
Table 1.2 shows the existing seven Transpower GXPs, as well as the three new proposed
GXPs, and associated zone substations in our network area. The three letter code used by
us has also been included for reference purposes.
Table 1.2 Substation Reference Table
Section Transpower GXP Zone Substation Three Letter Code
2 Albury (11 kV) ABY
2.2 Albury (11/33 kV Step–up) (33 kV) ABY
2.2 Fairlie (33/11 kV) FLE
2.3 Albury (33 kV) (Future) ABY
2.3 Albury (33/11 kV) (future) ABY
2.3 Fairlie (33/11 kV) (future) FLE
3 Bell's Pond (110 kV) BPD
3.2 Bell's Pond (110/33/11 kV) BPD
3.2
Cooneys Road (33/11 kV) (future 110/11 kV) CNR
4 Orari/Clandeboye (220/33 kV) (Future) OAI
4.3
Clandeboye 1 (33/11 kV) (future supply) CD1
4.3
Clandeboye 2 (33/11 kV) future supply CD2
4.3
Rangitata (33/11 kV) (future supply) RGA
5 St Andrews (110 kV) (Future) STA
5.3 St Andrews (110/11 kV) (future) STA
6 Studholme (11 kV) STU
6.3
Studholme (switching station) (11 kV) STU
7 Tekapo A (33 kV) TKA
7.3 Tekapo Village (33/11 kV) TEK
7.3 Balmoral (11/22 kV) BML
7.3 Haldon Lilybank (11/22 kV) HLB
7.3 Glentanner (33/11 kV) GTN
7.3 Unwin Hut (33/11 kV) UHT
8 Temuka (33 kV) TMK
8.3 Temuka (33/11 kV) TMK
8.3 Clandeboye No.1 (33/11 kV) CD1
8.3 Clandeboye No.2 (33/11 kV) CD2
8.3 Geraldine Downs (33/11 kV) GLD
8.3 Rangitata (33/11 kV) RGA
Alpine Energy Limited Major Network Asset Management Plan 2015 to 2025
15 | P a g e
Section Transpower GXP Zone Substation Three Letter Code
9 Timaru (11 kV) TIM
9.3
Grasmere St (switching station–11 kV) GRM
9.3 Hunt St (switching station–11 kV) HNT
9.3 North St (switching station–11 kV) NST
9.3
Timaru (Grant's Hill) (11/33 kV Step–up) (33 kV) TIM
9.3 Pareora (33/11 kV) PAR
9.3 Pleasant Point (33/11 kV) PLP
10 Twizel (33 kV) TWZ
10.3 Twizel Village (33/11 kV) TVS
11 Waihao (110 kV) (Future) WHO
11.3 Bell’s Pond (110/33/11 kV) BPD
11.3 Cooneys Rd (110/11 kV) CNR
11.3 Waimate (110/11 kV) (future) WTE
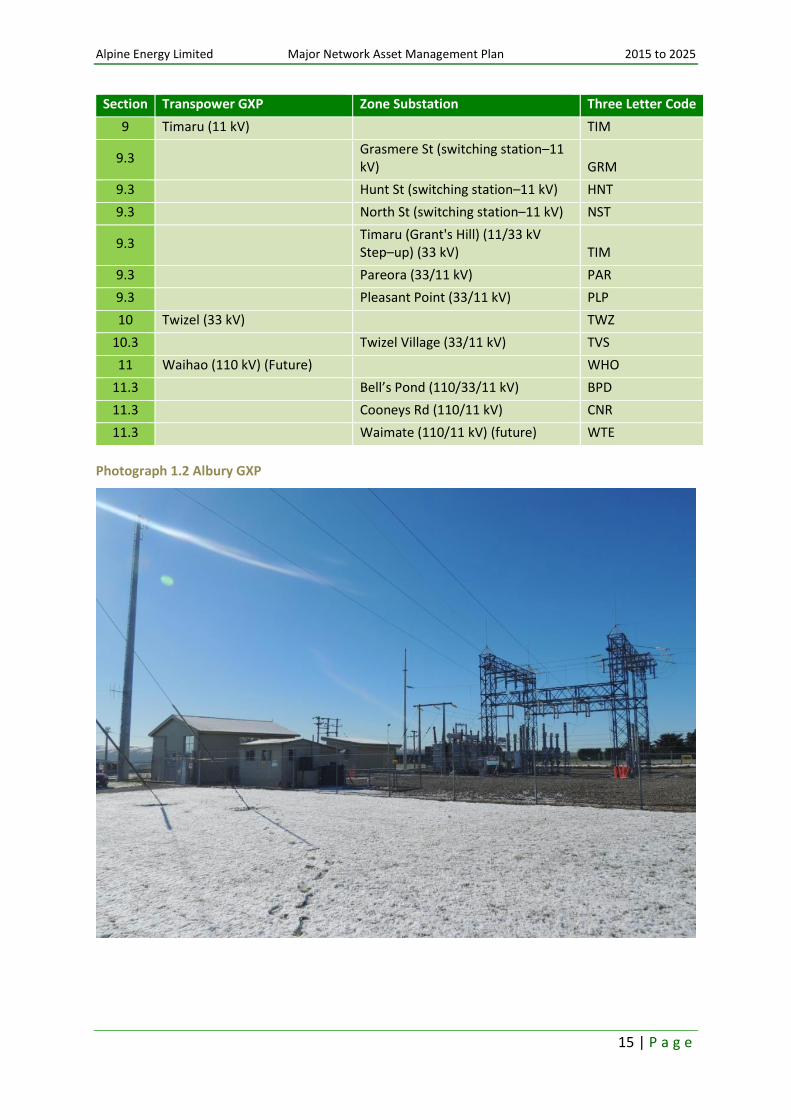
Photograph 1.2 Albury GXP

Alpine Energy Limited Major Network Asset Management Plan 2015 to 2025
16 | P a g e
Notes:

Alpine Energy Limited Major Network Asset Management Plan 2015 to 2025
17 | P a g e
2 Albury Grid Exit Point
2.1 Introduction
Figure 1.4 on page 10, shows the position of Albury (ABY) GXP on the Timaru (TIM) to
Tekapo (TKA) 110 kV transmission line.
ABY is fed off the TIM–TKA 110 kV line and has a single 110/11 kV transformer connected
via one incomer to an 11 kV switchboard, there are three feeder CBs. The GXP transformer
is run on fixed tap, which leads to some 11 kV voltage fluctuation as the 110 kV supply alters
as load varies. With a new AVR being installed by Transpower, a request was made that the
transformer’s load tap changing function be restored, except when there is a reversal of
power, i.e. while Opuha Power Station (OPU) is generating.
ABY’s transformer is suitably rated for today’s load but is fractionally under rated to pass the
embedded generation from OPU back onto the grid. Trustpower have occasionally asked
for generation to back off a small amount if there is less than 1 MW of Fairlie zone
substation (FLE) load to offset the full generation. As irrigation growth occurs in the area
the headroom on this transformer will be eroded.
Within our network the Totara Valley area is becoming difficult to supply off the Pleasant
Point (PLP) zone substation. An option is to build a new zone substation in Totara Valley
area which would be fed from ABY. This may influence accelerating the replacement of the
ABY supply transformer with a larger unit, perhaps with a change from 110/11 kV to
110/33 kV (refer to commentary in Section 2.3).
We have taken ownership of the mid 1980’s 110/33 or 11 kV 20 MVA transformer ex TIM
T4, the cost being equivalent scrap value. This was held in case it can be used at ABY to
replace the existing transformer.
Transpower have invested in a mobile sub with a 110 kV primary connection and one of 11,
22, or 33 kV secondary connection. TKA and ABY have just been equipped and fitted with
the mobile substation to allow maintenance at each zone substation.
2.1.1 Critical Data
The critical GXP data shown in Table 2.1 summarises the key physical attributes of the
substation, the voltages, the capacity, the security, and the power flow.
Table 2.1 Albury GXP Transpower System Data
GXP GXP Transmission Potential
GXP Point Of Supply Potential
Capacity N–1 Capacity
Demand to March 2014
OPU Contribution
ABY 110 kV 11 kV 5/6 MW 0 MVA 4.21 MVA 7 MVA less load

Alpine Energy Limited Major Network Asset Management Plan 2015 to 2025
18 | P a g e
2.2 Albury GXP Network Information
Figure 2.1 shows the key assets in the ABY GXP area. Transpower delivers 11 kV to our
network at the ABY zone substation via its circuit breakers; 2722, 2732, and 2742. Both the
GXP and zone substation site has the three letter code ABY. Circuit breaker 2722 feeds ABY
zone substation to sub–transmit 33 kV to FLE. From FLE zone substation a further length of
33 kV sub–transmission connects the Opuha power station to our network. A zone
substation is proposed in the Totara Valley area if demand necessitates network
investment.
Figure 2.1 Albury–Fairlie Area Network
Photograph 2.1 Albury Step–up Structure 2012 Upgrade in Progress
Tekapo A 110 kV
Timaru 110 kV
Opuha Albury 033
Fairlie 011
Totara Valley
011
Albury 011
Albury
GXP
ABY FLE

Alpine Energy Limited Major Network Asset Management Plan 2015 to 2025
19 | P a g e
2.2.1 Zone Substation Detail
The zone substation and sub–transmission key data shown in Table 2.2 details the major
assets with respect to rating, age, and general condition. The maximum demand at the
various substations is provided. The table also details the substation’s communication
systems and SCADA functions.
Table 2.2 Zone Substation Key Data
Zone Substation Site
Transformer Regulator Switchgear Ripple Plant
ABY 7.5 MVA (1997) 33/11 kV OCTC (2008 refurb) Excellent
1x 33 kV Recloser WVE (1994) Fair
Plessey/MetVic 605/510 Hz Rotary
FLE 3 MVA 33/11 kV OCTC (1964) Fair
2 MVA 1 x 33 kV Recloser (1997) 1 x 11 kV Recloser (1989) Good
Sub–Transmission
Make Up Limit at 6% p.d. (MVA)
Limit of Conductor at 50⁰C (MVA)
Limit of Cable (MVA)
Lowest Limit
ABY–FLE Dog 7.12 12.6 7.12
FLE–OPU Jaguar/Cable 1/300 7.65 23.4 21.3 7.65
Communications VHF UHF Analogue UHF Digital Fibre Optic
ABY VHF for voice traffic ABY–BRC BRC–MEC MEC–WDK
None
FLE VHF for voice traffic VHF for two bit alarms
None None
SCADA Supervision Control Automation Data Acquisition
ABY Current, voltage and CB status at ABY. Security at ABY.
ABY CB control, ripple plant load control.
Auto reclosing CB Load data at ABY
FLE 2 bit alarm Security at FLE
None None None
ABY connects via radio systems. There is a small amount of traffic on the UHF Analogue that
is being decommissioned progressively.
Table 2.3 lists the existing level of security at the substation and justifies any shortfall.

Alpine Energy Limited Major Network Asset Management Plan 2015 to 2025
20 | P a g e
Table 2.3 Security Level
Security Level
Zone Sub/Load Centre
Actual Target Shortfall from Target
ABY Rural N–0.75
N–0.75
Limited fault back up from adjacent feeders from FLE, PLP and TMK. Encourage consumers to be self–sufficient for essentials, as for CD emergencies.
FLE N N Limited fault backup. Possibility of some supply from ABY and GLD or islanding FLE onto OPU, requires negotiation with generation management, careful islanding, no black start available, generator does not have a lot of inertia making speed control a challenge. Encourage consumers to be self–sufficient for their essentials, as for CD emergencies.
The estimated demand listed in Table 2.4 shows the aggregated effect of substation
demand growth for a 10 year horizon incorporating the anticipated step changes detailed in
Table 2.5 at page 22.
Table 2.4 Estimated Demand at Zone Substation Level
Estimated Demand
Zone Sub Site
2015 MW 10 year Rate and Nature of Growth
2025 MW Provision for Growth
ABY 11 kV board
4.20 (Summer)
1.59% historic on ABY Irrigation and dairying activity, residential load, small subdivision development.
5.0 (summer) 8.4 (with Totara Valley)
Transpower asset under its management. Overall load not expected to breach Transpower’s capacity unless Totara Valley Sub built.
FLE 2.37 (Winter)
1.57% historic on ABY Residential load, small subdivision development.
2.9 (winter / shoulder)
Regulator upsizing or transformer with OLTC—expect demand to grow from current demand of 2.3 MW to about 2.9 MW over the planning period.
2.2.2 Albury–Fairlie Sub–transmission
The ABY–FLE line is receiving major maintenance which is due for completion after the
publishing of this document.
2.2.3 Fairlie Zone Substation
FLE supplies the local CBD as well as the rural surrounds.
It has one incomer recloser and then short distances out from the zone substation there are
various other line reclosures to protect the CBD from rural faults.

Alpine Energy Limited Major Network Asset Management Plan 2015 to 2025
21 | P a g e
Back up for FLE used to be made via OPU if a controlled islanding could be made. OPU does
not black start so alternate supply from OPU cannot be guaranteed. See also comment
below under the Opuha Power Station, section 2.2.4, re: rough running.
Limited back up of FLE can be made from the 11 kV distribution from ABY and GLD, this may
be sufficient at low load times to supply the CBD alone.
Photograph 2.2 Fairlie Zone Substation
2.2.4 Opuha Power Station
Opuha Power Station (OPU) is an asset owned by local irrigators and is operated by
Trustpower. The primary purpose of the dam is to break the kinetic energy of outflows from
the lake into the Opuha River. The generation rough runs at part load so its use as back up
to FLE is limited.

Alpine Energy Limited Major Network Asset Management Plan 2015 to 2025
22 | P a g e
2.3 Development of Albury GXP and Substations
The calculated load growth at the ABY GXP is 1.59%. This is mainly due to growth in the
farming and tourism sectors. A new source of irrigation would be required to see step
change growth.
Figure 2.2 Load Growth for Albury GXP
Table 2.5 shows the growth trend to the year 2025. The trend accommodates for a new
zone substation to be built at Totara Valley in 2020.
Table 2.5 Substation Load Growth
GXP Substation (Season Peak)
Growth Trend (Total MW MD)
2015 2016 2017 2018 2019 2020 2021 2022 2023 2024 2025
ABY (Summer) 4.2 4.3 4.4 4.5 4.5 7.6 7.8 8.0 8.2 8.4 8.6
ABY0111 Trend y = 0.0051x + 3.2034
1.000
1.500
2.000
2.500
3.000
3.500
4.000
4.500
5.000
5.500
6.000
01
-Ap
r-9
7
01
-De
c-9
7
01
-Au
g-9
8
01
-Ap
r-9
9
01
-De
c-9
9
01
-Au
g-0
0
01
-Ap
r-0
1
01
-De
c-0
1
01
-Au
g-0
2
01
-Ap
r-0
3
01
-De
c-0
3
01
-Au
g-0
4
01
-Ap
r-0
5
01
-De
c-0
5
01
-Au
g-0
6
01
-Ap
r-0
7
01
-De
c-0
7
01
-Au
g-0
8
01
-Ap
r-0
9
01
-De
c-0
9
01
-Au
g-1
0
01
-Ap
r-1
1
01
-De
c-1
1
01
-Au
g-1
2
01
-Ap
r-1
3
01
-De
c-1
3
Dem
and
(M
W)
Month
Albury GXP Load Growth
ABY0111
Linear (ABY Peaks)N Limit
Alpine Energy Limited Major Network Asset Management Plan 2015 to 2025
23 | P a g e
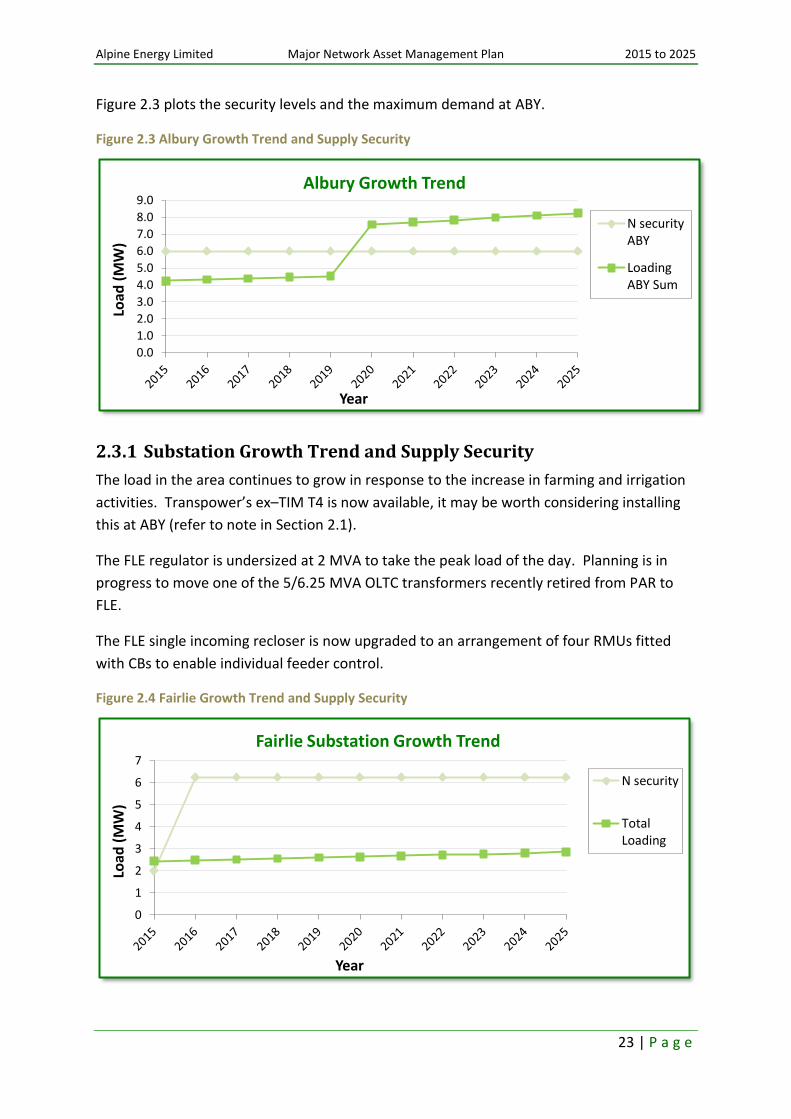
Figure 2.3 plots the security levels and the maximum demand at ABY.
Figure 2.3 Albury Growth Trend and Supply Security
2.3.1 Substation Growth Trend and Supply Security
The load in the area continues to grow in response to the increase in farming and irrigation
activities. Transpower’s ex–TIM T4 is now available, it may be worth considering installing
this at ABY (refer to note in Section 2.1).
The FLE regulator is undersized at 2 MVA to take the peak load of the day. Planning is in
progress to move one of the 5/6.25 MVA OLTC transformers recently retired from PAR to
FLE.
The FLE single incoming recloser is now upgraded to an arrangement of four RMUs fitted
with CBs to enable individual feeder control.
Figure 2.4 Fairlie Growth Trend and Supply Security
0.0
1.0
2.0
3.0
4.0
5.0
6.0
7.0
8.0
9.0
Load
(M
W)
Year
Albury Growth Trend
N securityABY
LoadingABY Sum
0
1
2
3
4
5
6
7
Load
(M
W)
Year
Fairlie Substation Growth Trend
N security
TotalLoading
Alpine Energy Limited Major Network Asset Management Plan 2015 to 2025
24 | P a g e
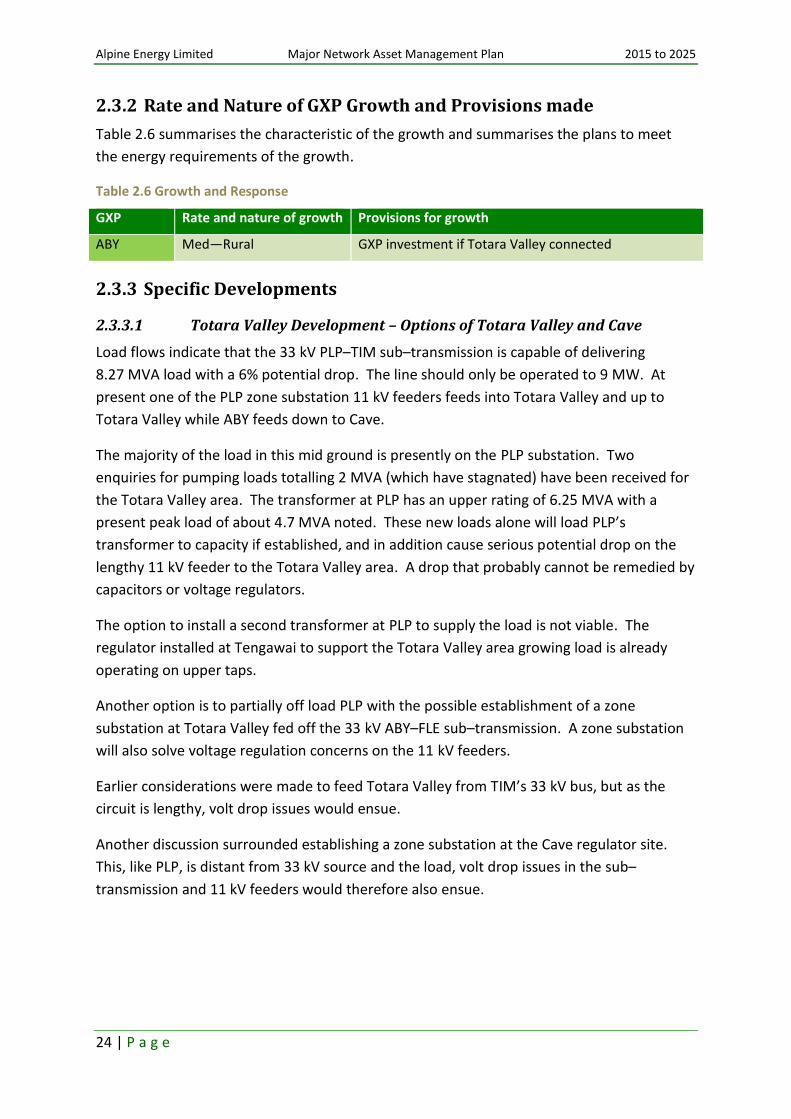
2.3.2 Rate and Nature of GXP Growth and Provisions made
Table 2.6 summarises the characteristic of the growth and summarises the plans to meet
the energy requirements of the growth.
Table 2.6 Growth and Response
GXP Rate and nature of growth Provisions for growth
ABY Med—Rural GXP investment if Totara Valley connected
2.3.3 Specific Developments
2.3.3.1 Totara Valley Development – Options of Totara Valley and Cave
Load flows indicate that the 33 kV PLP–TIM sub–transmission is capable of delivering
8.27 MVA load with a 6% potential drop. The line should only be operated to 9 MW. At
present one of the PLP zone substation 11 kV feeders feeds into Totara Valley and up to
Totara Valley while ABY feeds down to Cave.
The majority of the load in this mid ground is presently on the PLP substation. Two
enquiries for pumping loads totalling 2 MVA (which have stagnated) have been received for
the Totara Valley area. The transformer at PLP has an upper rating of 6.25 MVA with a
present peak load of about 4.7 MVA noted. These new loads alone will load PLP’s
transformer to capacity if established, and in addition cause serious potential drop on the
lengthy 11 kV feeder to the Totara Valley area. A drop that probably cannot be remedied by
capacitors or voltage regulators.
The option to install a second transformer at PLP to supply the load is not viable. The
regulator installed at Tengawai to support the Totara Valley area growing load is already
operating on upper taps.
Another option is to partially off load PLP with the possible establishment of a zone
substation at Totara Valley fed off the 33 kV ABY–FLE sub–transmission. A zone substation
will also solve voltage regulation concerns on the 11 kV feeders.
Earlier considerations were made to feed Totara Valley from TIM’s 33 kV bus, but as the
circuit is lengthy, volt drop issues would ensue.
Another discussion surrounded establishing a zone substation at the Cave regulator site.
This, like PLP, is distant from 33 kV source and the load, volt drop issues in the sub–
transmission and 11 kV feeders would therefore also ensue.

Alpine Energy Limited Major Network Asset Management Plan 2015 to 2025
25 | P a g e
Figure 2.5 Totara Valley Growth Trend and Supply Security
Transpower’s ABY transformer is rated 6 MVA. Presently there is about 4.2 MVA of load
applied when OPU is off, there is limited spare capacity available. Transpower will be
looking to upgrade the transformer at ABY in 2018/19.
For the transformer change out, we may look to request a larger capacity unit with fully
capable OLTC and possibly a 33 kV secondary. This way voltage regulation will be achieved,
and the transformer will supply the greater loaded 33 kV bus. Electrical efficiencies for the
site will improve. Our existing 11/33 kV step–up transformer would be turned to become
33/11 kV and supply the 11 kV bus. Some phase displacement issues will need to be
resolved around tying 11 kV between the ABY, FLE, Totara and GLD areas and the TIM and
PLP areas.
A more detailed study is required to examine the above and other options not yet explored.
A further project is proposed that will replace the existing 33 kV neutral earthing
transformer (NET) at ABY which has internal partial discharge concerns, and replace the
existing earth fault protection relays which are at the end of their life.
2.3.3.2 Ripple Load Control
The ABY ripple plant’s local service supply will be replaced with a modern vacuum switch,
and a new local service transformer located outside the ripple plant building in 2015.
The ripple injection plant is presently a rotating plant. This will also be replaced by a static
convertor in 2015.
0
1
2
3
4
5
6
7
Load
(M
W)
Year
Totara Valley Substation Growth Trend
N security
TotalLoading

Alpine Energy Limited Major Network Asset Management Plan 2015 to 2025
26 | P a g e
Notes:

Alpine Energy Limited Major Network Asset Management Plan 2015 to 2025
27 | P a g e
3 Bell’s Pond Grid Exit Point
3.1 Introduction
Figure 1.4 on page 10, shows the position of Bell’s Pond (BPD) GXP on the 110 kV circuit
from Waitaki to Studholme/Oamaru.
Toward the end of the period BPD might be redeveloped and be fed off a new GXP at
Waihao, see Figure 1.5 on page 11 for further information.
BPD GXP is a single tee off the STU–OAM–WTK 2 110 kV circuit. The GXP is essentially a
110 kV metering point which was made available to us so that a 110/33/11 kV zone
substation could be connected.
BPD GXP was established and commissioned in August 2010 which off loaded just over
6 MW of load from STU. Transpower are reconsidering the opportunity to connect a second
transformer at BPD to the second 110 kV circuit. The second transformer will remove the
present need for STU to back up the BPD load.
A project to allow for a future connection to an alternative 110 kV supply is discussed
further under the Waihao GXP, in chapter 11.
Photograph 3.1 Bell's Pond GXP and Zone Substation

Alpine Energy Limited Major Network Asset Management Plan 2015 to 2025
28 | P a g e
3.1.1 Critical Data
The critical GXP data shown in Table 3.1 below summarises the key physical attributes of the
substation, the voltages, the capacity, the security, and power flow.
Table 3.1 Bell’s Pond Substation Key Data
GXP GXP Transmission Potential
GXP Point Of Supply Potential
Capacity N—1 Capacity from STU
Demand February 2014
BPD 110 kV 110 kV 20 MVA 5 MVA 7.38 MW
3.2 Bell’s Pond GXP Network Information
Figure 3.1 shows the key assets in the area of the BPD GXP. Transpower delivers 110 kV to
our network at BPD substation.
From the BPD 110/33/11 kV transformer’s 33 kV winding, a sub–transmission line (rated for
later use at 110 kV) has been constructed to a new zone substation at Cooneys Road (CNR).
The new line and substation were livened in April 2014 and supply Oceania Dairy Limited
(ODL). The BPD transformer’s 11 kV winding supplies local rural feeders.
Figure 3.1 Bell’s Pond GXP Area Network
3.2.1 Zone Substation Detail
The zone substation and sub–transmission key data for both BPD and CNR Road shown in
Table 3.2 on page 29 details the major assets with respect to rating, age, and general
condition. The maximum demands at the various substations are provided. The table also
details the substation’s communication systems back to Meadows Rd and the SCADA
functions.
Waitaki
110 kV
Oamaru/Studholme
110 kV CNR
BPD
Bell’s Pond
Tee – Off
CB2 * CB3 * CB4 * CB8
CB9
CB11
CB12
* Studholme
alternatives
to BPD and
CNR
*CB35

Alpine Energy Limited Major Network Asset Management Plan 2015 to 2025
29 | P a g e
Table 3.2 Zone Substation Key Data
Zone Substation Site
Transformer Regulator Switchgear Ripple Plant
BPD 20/15/15 MVA 110/33/11 kV (2010) Excellent
1 x 110 kV GL312 Areva (2010) Excellent 1 x 110 kV GL312 Areva (2014) Excellent 5 x 11 kV RPS (2010) Excellent
Abbey Systems RTU Landis and Gyr Ripple Plant (2010 cell/2011 processor) Excellent
CNR 9/15 MVA 33/11 kV (2014) Excellent
1 x 110 kV GL312 CB (SF6) (2013) Excellent 8 x 11 kV RPS (2014) Excellent
Sub–Transmission Make Up Limit at 6% p.d. (MVA)
Limit of Conductor at 50⁰C (MVA)
Limit of Cable (MVA)
Lowest Limit
Notes
BPD–CNR 110 kV double cct bonded, Jaguar, run at 33 kV
2013 build Maintenance Priority 10
Communications VHF UHF Analogue UHF Digital Fibre Optic
BPD VHF for voice traffic
None BPD–MEC MEC–CHC CHC–NST or WDK
None
CNR Voice None CNR–MEC MEC–CHC CHC–NST or WDK
None
SCADA Supervision Control Automation Data Acquisition
BPD Current, voltage, power and CB status at BPD.
BDP area CB, transformer and ripple plant control
CB and transformer control
Load data and power quality at BPD
CNR Current, voltage, power and CB status at CNR. Security monitor.
CNR area CB and transformer control
CB and transformer control
Load data and power quality at CNR
Chorus provide telephone, fax services via Cu connection. Transpower use Chorus for
certain data retrieval. Table 3.2 shows BPD’s SCADA functions. BPD has an SEL 2032 for

Alpine Energy Limited Major Network Asset Management Plan 2015 to 2025
30 | P a g e
most IED connections and an Abbey RTU to control the ripple plant. CNR has dual SEL 3035
for most IED connections.
Table 3.3 lists the existing level of security at the substation and justifies any shortfall.
Table 3.3 Security Level for Bell’s Pond GXP
Security Level
Zone Sub/Load Centre
Actual Target Shortfall from Target
BPD Rural N–0.75
N–0.75
Back up supply from STU. STU can presently take majority of the 11 kV load if both STU transformers are in service (the spare STU capacity will be eroded should Fonterra build a drier at STU). Some irrigation and ODL would have to be disconnected to put BPD on STU. Encourage consumers to be self–sufficient for their essentials, as for CD emergencies. Second transformer being considered, to gain security this would have to connect to OAM–WTK 1 line.
Dairy Processing ODL
N–0.1 N–0.1 N-1 is not presently supplied, as agreed by ODL. Light back up supply from STU is available. Later investment when process proven to increase security.
The estimated demand listed in Table 3.4 shows the aggregated effect of substation
demand growth for a 10 year horizon incorporating the anticipated step changes detailed in
Table 3.5 at page 32.
Table 3.4 Estimated demand at Zone Substation Level
Estimated Demand
Zone Sub Site
2015 MW 10 year Rate and Nature of Growth
2025 MW Provision for Growth
BPD 15.6 (summer) 4.8% per year expected Residential load. Dairy and irrigation development.
BPD 21.4 CNR 14.6 (summer) Sum 36.0
Increase substation assets to offload STU and provide more security and capacity. Work needed to carry load which depends on mooted projects progressing.
CNR 3.6 (summer/winter)
Dairy processing
14.6 (summer/winter)
Assumption is to prepare site for two driers/lactose and UHF products off BPD 33 kV initially with later extensions for two driers forcing the primary potential for the site to 110 kV. We have included for four 3.5 MW driers and other sundry loads in planning.
Alpine Energy Limited Major Network Asset Management Plan 2015 to 2025
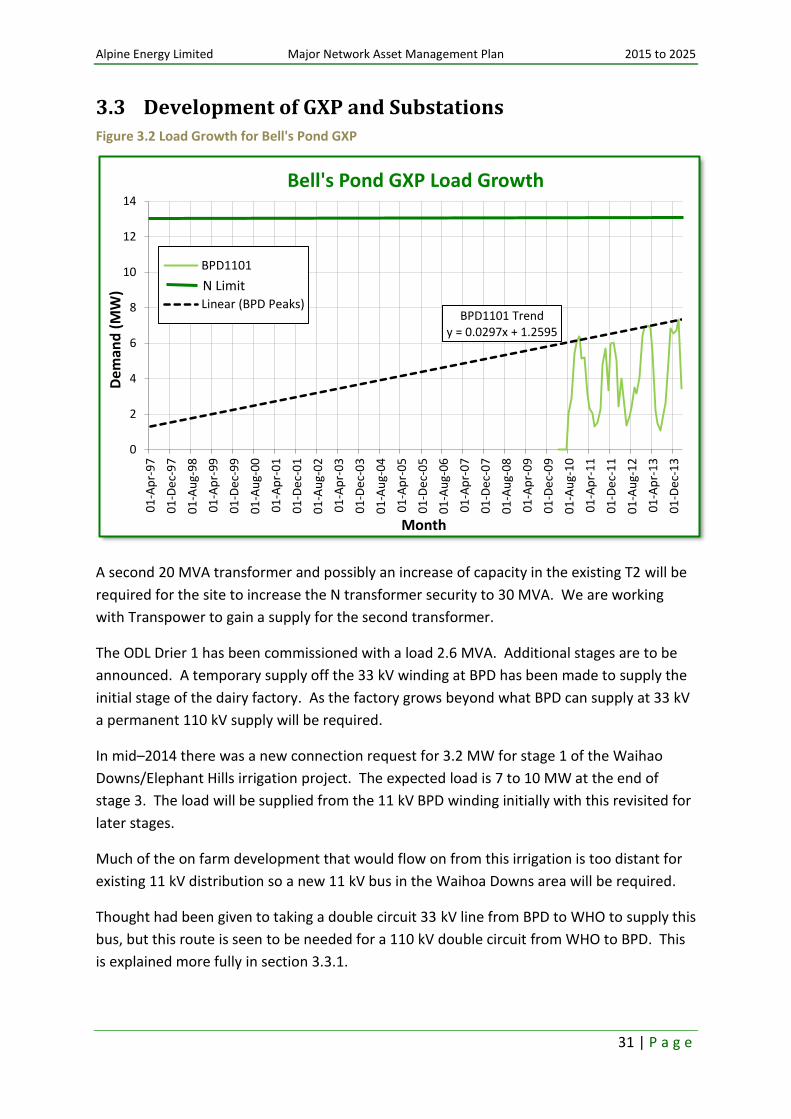
31 | P a g e
3.3 Development of GXP and Substations Figure 3.2 Load Growth for Bell's Pond GXP
A second 20 MVA transformer and possibly an increase of capacity in the existing T2 will be
required for the site to increase the N transformer security to 30 MVA. We are working
with Transpower to gain a supply for the second transformer.
The ODL Drier 1 has been commissioned with a load 2.6 MVA. Additional stages are to be
announced. A temporary supply off the 33 kV winding at BPD has been made to supply the
initial stage of the dairy factory. As the factory grows beyond what BPD can supply at 33 kV
a permanent 110 kV supply will be required.
In mid–2014 there was a new connection request for 3.2 MW for stage 1 of the Waihao
Downs/Elephant Hills irrigation project. The expected load is 7 to 10 MW at the end of
stage 3. The load will be supplied from the 11 kV BPD winding initially with this revisited for
later stages.
Much of the on farm development that would flow on from this irrigation is too distant for
existing 11 kV distribution so a new 11 kV bus in the Waihoa Downs area will be required.
Thought had been given to taking a double circuit 33 kV line from BPD to WHO to supply this
bus, but this route is seen to be needed for a 110 kV double circuit from WHO to BPD. This
is explained more fully in section 3.3.1.
BPD1101 Trend y = 0.0297x + 1.2595
0
2
4
6
8
10
12
14
01
-Ap
r-9
7
01
-De
c-9
7
01
-Au
g-9
8
01
-Ap
r-9
9
01
-De
c-9
9
01
-Au
g-0
0
01
-Ap
r-0
1
01
-De
c-0
1
01
-Au
g-0
2
01
-Ap
r-0
3
01
-De
c-0
3
01
-Au
g-0
4
01
-Ap
r-0
5
01
-De
c-0
5
01
-Au
g-0
6
01
-Ap
r-0
7
01
-De
c-0
7
01
-Au
g-0
8
01
-Ap
r-0
9
01
-De
c-0
9
01
-Au
g-1
0
01
-Ap
r-1
1
01
-De
c-1
1
01
-Au
g-1
2
01
-Ap
r-1
3
01
-De
c-1
3
Dem
and
(M
W)
Month
Bell's Pond GXP Load Growth
BPD1101
Linear (BPD Peaks)
N Limit

Alpine Energy Limited Major Network Asset Management Plan 2015 to 2025
32 | P a g e
Table 3.5 shows the growth trend to the year 2025.
Table 3.5 Substation Load Growth
GXP Substation (Season Peak)
Growth Trend (Total MW MD)
2015 2016 2017 2018 2019 2020 2021 2022 2023 2024 2025
BPD (Summer)
15.6 20.2 26.4 26.4 18.7 19.4 19.8 20.2 20.6 21.0 21.4
Figure 3.3 plots the maximum demand predictions in the BPD GXP area.
Figure 3.3 Bell’s Pond Growth Trend
3.3.1 Substation Growth Trend and Supply Security
The load continues to grow in response to the farming and irrigation activities in the area.
ODL initially adds 2.6 MW to BPD’s load, rising in the future to approximately 14 MW. The
increased load will require the BPD–CNR 33 kV circuit to be re–connected to 110 kV.
A new application has been received for a 3.2 MW set of pumps at the start of the Waihao
Downs irrigation scheme.
0
5
10
15
20
25
30
35
40
45
Load
(M
W)
Year
Bell's Pond Area Growth Trend
N security
N-1 security
Bell's Pond110 kV
Cooneys Rd110 kV
110 kV BPDBus Total

Alpine Energy Limited Major Network Asset Management Plan 2015 to 2025
33 | P a g e
3.3.2 Rate and Nature of GXP Growth and Provisions Made
Table 3.6 summarises the characteristic of the growth and summarises the plans to meet
the energy requirements of the growth.
Table 3.6 Growth and Response
GXP Rate and nature of growth Provisions for growth
BPD High—Rural, Industrial Dairy factory
New investment to secure the energy needed off the grid.
3.3.3 Specific Developments
3.3.3.1 Cooneys Road Development—Options for Capacity Increase for Oceania Dairy Limited’s (ODL) Milk Solids Plant
CNR zone substation has been fitted with 33/11 kV equipment to supply the first drier in
ODL’s dairy factory. The sub–transmission line from BPD to CNR is rated at 110 kV and with
investment in 110/11 kV transformers at CNR the dairy factory will not be capacity
constrained.
Photograph 3.2 Cooneys Road Zone Substation and Oceania Dairy Limited’s Factory
Security is presently reliant on 11 kV feeders from CNR substation with a capacity of
approximately 2 MW in the winter, but the capacity decreases in the summer as this is when
other users also load the lines, primarily for irrigation.

Alpine Energy Limited Major Network Asset Management Plan 2015 to 2025
34 | P a g e
Figure 3.4 plots the maximum demand predictions for Cooneys Road zone substation.
Figure 3.4 Cooneys Road Growth Trend
3.3.4 Issues Arising from Estimated Demand
In December 2013 Transpower communicated that a tripping of the OAM–WTK 110 kV
circuit 1, would result in circuit 2, with BPD, OAM and STU connected, becoming overloaded
at peak periods. Transpower communicated that the best option for resolving the overload
was to ask us to shed BPD. Shedding BPD load will become increasingly difficult as BPD
becomes more loaded from ODL.
We are still in the situation that if BPD GXP or the 110 kV circuit to it fails, essential loads on
the BPD GXP need to be supplied off STU. Until BPD can be made secure by a second
connection, then the ability to supply the load within STU’s N–1 capacity is becoming
reduced.
Photograph 3.3 Bell's Pond 33 kV Terminal for CNRs line
0
5
10
15
20
25
30
35
40
45
Load
(M
W)
Year
Cooneys Road Growth Trend
N security
N-1 security
CooneysRoad

Alpine Energy Limited Major Network Asset Management Plan 2015 to 2025
35 | P a g e
4 Orari Grid Exit Point
4.1 Introduction
Figure 1.5 on page 11, shows how the Orari (OAI) GXP is to be configured on the OAI 220 kV
switching station near Geraldine. This work must follow Transpower’s building of the OAI
GXP that is presently scheduled for 2022.
OAI is proposed to allow the off–loading of the TIM T5 and T8 220/110 kV interconnectors,
the 110 kV lines to TMK, the TMK transformers and TMK 33 kV bus.
More discussion on offloading TMK, see chapter 8 on the TMK GXP.
4.2 GXP Description
OAI is a proposed GXP to allow the connection of the existing Clandeboye and RGA loads.
The exact makeup of the substation is yet to be determined.
4.2.1 Critical Data
The critical GXP data shown in Table 4.1 summarises the potential physical attributes of the
substation, the voltages, the capacity, the security, and the power flow.
Table 4.1 Orari Zone Substation Key Data
GXP GXP Transmission Potential
GXP Point Of Supply Potential
Capacity N–1 Capacity Demand 2015
OAI 220 kV 33 kV Approx. 80 MVA
160 MVA 0 MW

Alpine Energy Limited Major Network Asset Management Plan 2015 to 2025
36 | P a g e
4.3 Orari GXP Network Information
Figure 4.1 below shows the key assets within the OAI GXP’s area. OAI GXP will deliver 33 kV
to Clandeboye’s four 33/11 kV transformers and a double circuit line will supply RGA.
Figure 4.1 Orari GXP Area Network
4.3.1 Zone Substation Detail
The zone substation key data for OAI shown in Table 4.2 details the major assets to be
established. The table also details the substation’s potential communications systems back
to Meadows Rd.
Table 4.2 Zone Substation Key Data
Zone Substation Site
Transformer Regulator Switchgear Ripple Plant
OAI To be established
Zellweger 317 Hz to be established
Communications VHF UHF Analogue
UHF Digital Fibre Optic
OAI VHF for voice traffic None OAI–CHC CHC–NST or WDK
TBA
OAI/Clandeboye SCADA systems would adopt the technology of the time.
Clandeboye
033
Rangitata
Clandeboye
Clandeboye
Orari 220 kV
bus
Alpine Energy Limited Major Network Asset Management Plan 2015 to 2025
37 | P a g e
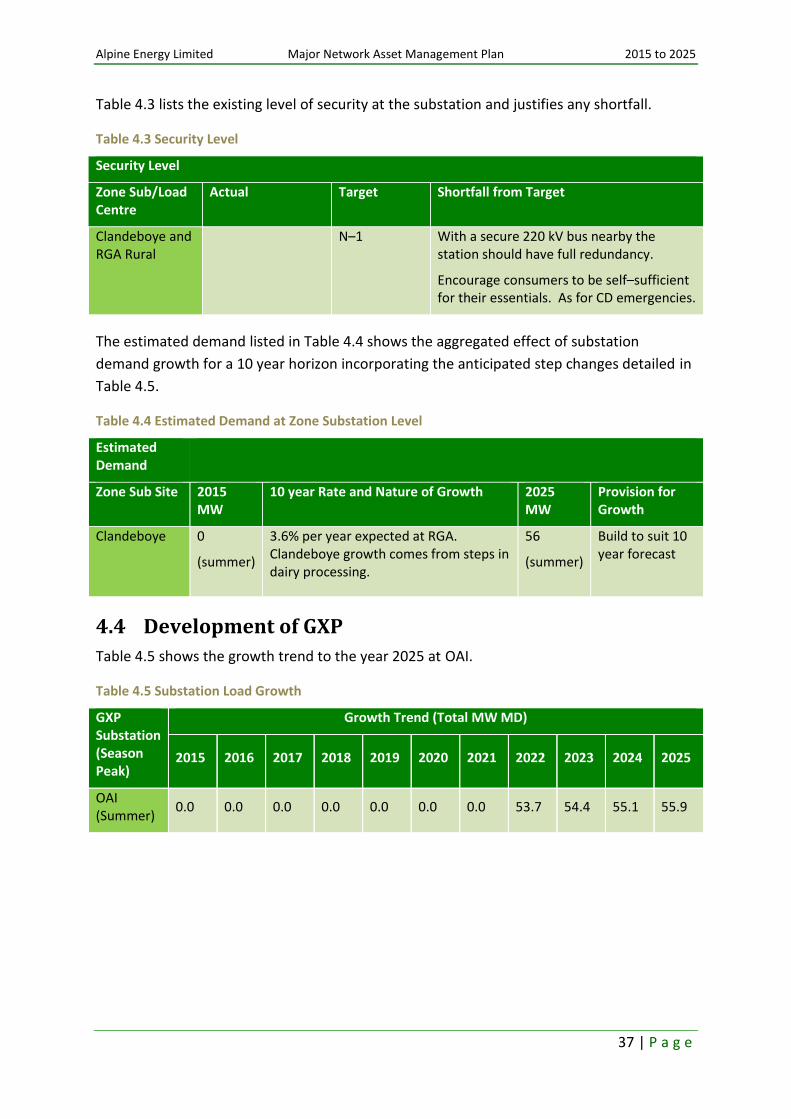
Table 4.3 lists the existing level of security at the substation and justifies any shortfall.
Table 4.3 Security Level
Security Level
Zone Sub/Load Centre
Actual Target Shortfall from Target
Clandeboye and RGA Rural
N–1 With a secure 220 kV bus nearby the station should have full redundancy.
Encourage consumers to be self–sufficient for their essentials. As for CD emergencies.
The estimated demand listed in Table 4.4 shows the aggregated effect of substation
demand growth for a 10 year horizon incorporating the anticipated step changes detailed in
Table 4.5.
Table 4.4 Estimated Demand at Zone Substation Level
Estimated Demand
Zone Sub Site 2015 MW
10 year Rate and Nature of Growth 2025 MW
Provision for Growth
Clandeboye 0
(summer)
3.6% per year expected at RGA. Clandeboye growth comes from steps in dairy processing.
56
(summer)
Build to suit 10 year forecast
4.4 Development of GXP
Table 4.5 shows the growth trend to the year 2025 at OAI.
Table 4.5 Substation Load Growth
GXP Substation (Season Peak)
Growth Trend (Total MW MD)
2015 2016 2017 2018 2019 2020 2021 2022 2023 2024 2025
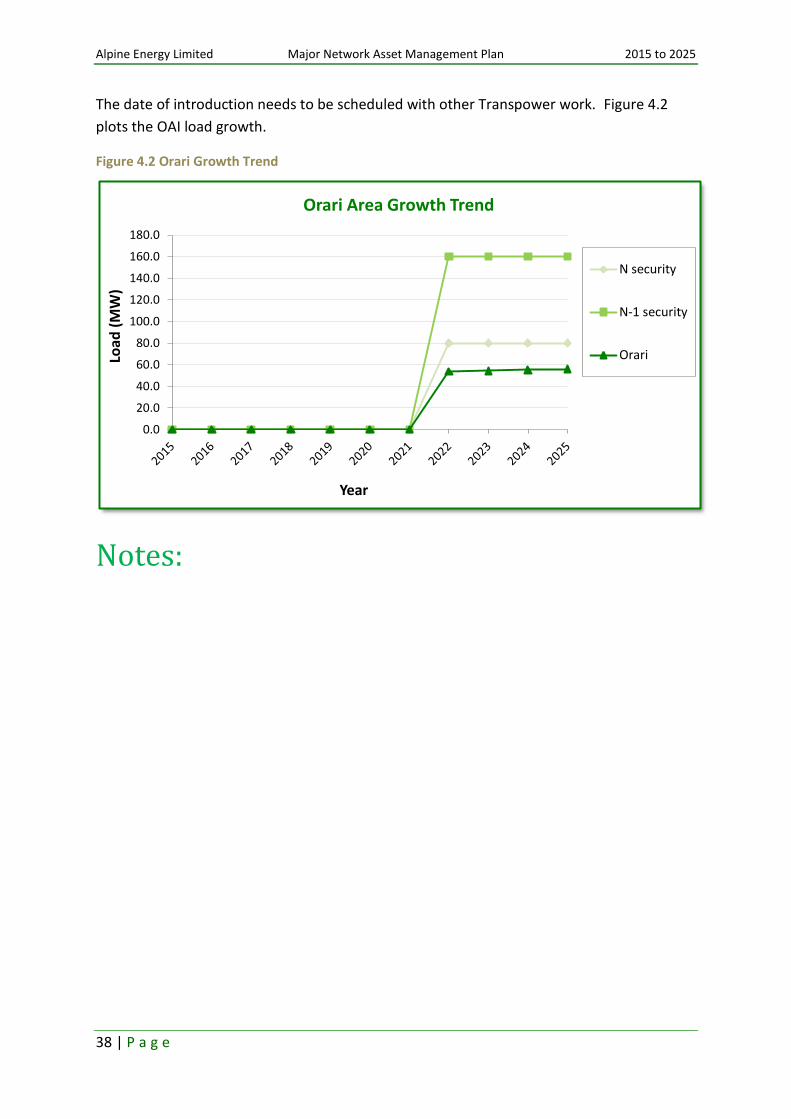
OAI (Summer)
0.0 0.0 0.0 0.0 0.0 0.0 0.0 53.7 54.4 55.1 55.9
Alpine Energy Limited Major Network Asset Management Plan 2015 to 2025
38 | P a g e
The date of introduction needs to be scheduled with other Transpower work. Figure 4.2
plots the OAI load growth.
Figure 4.2 Orari Growth Trend
Notes:
0.0
20.0
40.0
60.0
80.0
100.0
120.0
140.0
160.0
180.0
Load
(M
W)
Year
Orari Area Growth Trend
N security
N-1 security
Orari

Alpine Energy Limited Major Network Asset Management Plan 2015 to 2025
39 | P a g e
5 St. Andrews Grid Exit Point
5.1 Introduction
Figure 1.5 on page 11, shows how St. Andrews GXP (STA) is to be configured between the
110 kV circuit from TIM to the 110 kV Circuit 2 to WTK from about 2019.
5.2 GXP Description
STA is a proposed GXP to allow the connection of the Hunter Downs Irrigation (HDI) project
load in the central region between PAR and STU. The exact makeup of the substation is yet
to be determined.
HDI is seen to load STU with 9.3 MW of high pressure and lateral pumps and load STA with
6.3 MW. On–farm load due to HDI is seen to load STU by an extra 1.8 MW, STA by 8.4 MW
and PAR by 1.8 MW.
We hope to accumulate the present loads taken at BPD and STU. We suggest supplying
these from WHO, and apply for this accumulated load to be connected to the present STU–
TIM 110 kV transmission line, for STA. BPD and STU will sum to about 24 MW this year.
Our view of the project would be to build an in/out deviation off the STU–TIM 110 kV
transmission circuit.
Meridian communicated during the North Bank Tunnel investigation to build an in/out
deviation off the Livingston/Islington 220 kV transmission circuit. Transpower are now
looking at an option for the STA GXP to be built off the 220 kV with a double circuit built to
STU. This initiative does not assist supplying our growing load at BPD and CNR which will
become too large for the old WTK 110 kV circuits whilst we have to share the circuits with
Network Waitaki Limited (NWL). A 220 kV option is required further south.
A 220 kV GXP is likely to be very costly for the sake of 24 MW (seen at the end of the
planning period). We see an 110 kV GXP as being far more cost effective.
5.2.1 Critical Data
The critical GXP data shown in Table 5.1 summarises the potential physical attributes of the
station, the voltages, the capacity, the security, and the power flow.
Table 5.1 St. Andrews Zone Substation Key Data
GXP GXP Transmission Potential
GXP Point Of Supply Potential
Capacity N–1 Capacity Demand 2015
St. Andrews (STA)
110 kV 33 or 11 kV Approx. 40 MVA
80 MVA 0 MW
Alpine Energy Limited Major Network Asset Management Plan 2015 to 2025
40 | P a g e
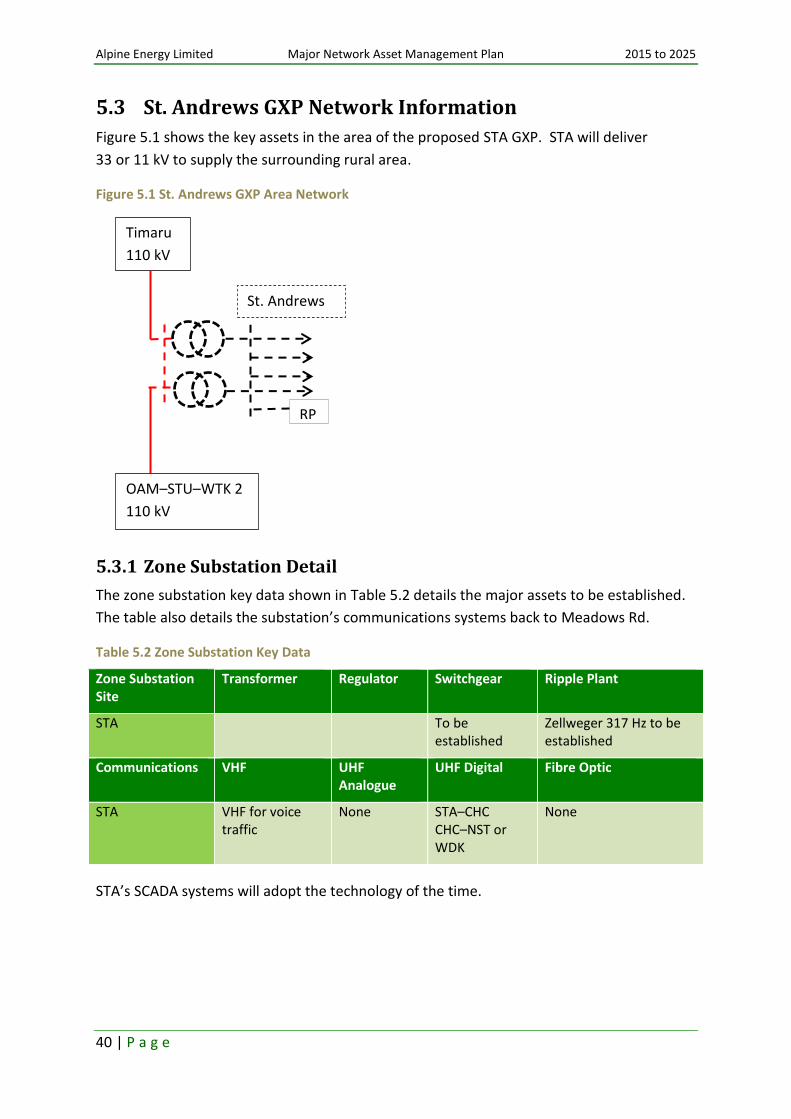
5.3 St. Andrews GXP Network Information
Figure 5.1 shows the key assets in the area of the proposed STA GXP. STA will deliver
33 or 11 kV to supply the surrounding rural area.
Figure 5.1 St. Andrews GXP Area Network
5.3.1 Zone Substation Detail
The zone substation key data shown in Table 5.2 details the major assets to be established.
The table also details the substation’s communications systems back to Meadows Rd.
Table 5.2 Zone Substation Key Data
Zone Substation Site
Transformer Regulator Switchgear Ripple Plant
STA To be established
Zellweger 317 Hz to be established
Communications VHF UHF Analogue
UHF Digital Fibre Optic
STA VHF for voice traffic
None STA–CHC CHC–NST or WDK
None
STA’s SCADA systems will adopt the technology of the time.
Timaru
110 kV
OAM–STU–WTK 2
110 kV
St. Andrews
LV
RP

Alpine Energy Limited Major Network Asset Management Plan 2015 to 2025
41 | P a g e
Table 5.3 lists the existing level of security at the substation and justifies any shortfall.
Table 5.3 Security Level
Security Level
Zone Sub/Load Centre
Actual Target Shortfall from Target
St. Andrews Rural
N–1 With an ‘in/out’ off the 110 kV line the station should have full redundancy. For a total loss, limited fault backup from STU and PAR will be available.
Encourage consumers to be self–sufficient for their essentials. As for CD emergencies.
The estimated demand listed in Table 5.4 shows the aggregated effect of substation demand
growth for a 10 year horizon incorporating the anticipated step changes detailed in Table
5.5.
Table 5.4 Estimated Demand at Zone Substation Level
Estimated Demand
Zone Sub Site
2015 MW
10 year Rate and Nature of Growth 2025 MW
Provision for Growth
STA 0
(summer)
3.6% per year expected as STU Rural development
24.3
(summer)
Build to suit 10 year forecast
5.4 Development of GXP
Table 5.5 shows the growth trend to the year 2025 at STA. The main load growth is a result
of the HDI to be picked up by us.
Table 5.5 Substation Load Growth
GXP Substation (Season Peak)
Growth Trend (Total MW MD)
2015 2016 2017 2018 2019 2020 2021 2022 2023 2024 2025
St. Andrews (Summer)
0.0 0.0 0.0 0.0 20.7 21.5 22.0 22.6 23.1 23.7 24.3
The date of introduction is irrigation load dependant and needs to be scheduled with other
Transpower work.
Figure 5.2 plots the forecasted load growth in the St. Andrews area.

Alpine Energy Limited Major Network Asset Management Plan 2015 to 2025
42 | P a g e
Figure 5.2 St. Andrews Area Growth Trend
Notes:
0.0
10.0
20.0
30.0
40.0
50.0
60.0
70.0
80.0
90.0
Load
(M
W)
Year
St. Andrews Area Growth Trend
N security
N-1 security
St Andrews

Alpine Energy Limited Major Network Asset Management Plan 2015 to 2025
43 | P a g e
6 Studholme Grid Exit Point
6.1 Introduction
Figure 1.4 on page 10, shows how Studholme (STU) is configured between the 110 kV circuit
from TIM to the 110 kV Circuit 2 to Waitaki.
Toward the end of the period STU might be redeveloped to be Waimate (WTE) and be fed
off a new GXP at Waihao, see Figure 1.5 on page 11 for this detail.
6.2 GXP Description
STU provides two 11 kV incoming supplies to our 11 kV switchboard which is co–sited at the
GXP. Six 11 kV feeders provide supply to the Waimate township, Fonterra’s Studholme
dairy factory’s Drier 1, and the surrounding rural areas. The substation demand is summer
peaking from strong growth from the dairy factory, arable/dairy farming and irrigation
demand.
Partial off load of STU occurred at the end of August 2010 with the full commissioning of
BPD substation. The remaining load is still greater than the N security offered from a single
transformer. At times BPD will have to be removed from service, for example, when the
sole 110 kV line that supplies it is released. STU then has to have the firm capacity to uptake
BPD load, or at least as much load as the STU feeders towards BPD can support.
From April 2014 STU has be called on to provide some energy to ODL on CNR to assist their
environmental requirements while the main supply from BPD is released.
Photograph 6.1 Studholme GXP

Alpine Energy Limited Major Network Asset Management Plan 2015 to 2025
44 | P a g e
6.2.1 Critical Data
The critical GXP data shown in Table 6.1 summarises the key physical attributes of the
substation, the voltages, the capacity, the security, and the power flow.
Table 6.1 Studholme Zone Substation Key Data
GXP GXP Transmission Potential
GXP Point Of Supply Potential
Capacity N––1 Capacity
Demand 2014
STU 110 kV 11 kV 11 MVA 22 MVA 11.4 MW
6.3 Studholme GXP Network Information
Figure 6.1 shows the STU GXP area key assets. STU GXP delivers 11 kV to our indoor switch
room. This switch room supplies 11 kV to Fonterra’s Studholme dairy factory’s drier 1 (and
some rural load) via two feeders, and Waimate township and the surrounding rural area via
the remaining four 11 kV feeders.
Figure 6.1 Studholme GXP Area Network
Timaru 110 kV
Studholme–
Oamaru– Waitaki
110 kV
011 kV
Studholme
011 kV
Fonterra
Three STU feeders
can back up BPD
and one CNR
RP
Alpine Energy Limited Major Network Asset Management Plan 2015 to 2025
45 | P a g e
6.3.1 Zone Substation Detail
The zone substation key data shown in Table 6.2 details the major assets with respect to
rating, age, and general condition. The maximum demand at the various substations is also
provided. The table also details the capacity constraints, substation’s communication
systems and SCADA functions.
Table 6.2 Zone Substation Key Data
Zone Substation Site
Transformer Regulator Switchgear Ripple Plant
STU 9x 11 kV VCB
(2005)
Excellent
Zellweger 317 Hz
Area of Network with Constraint
Capacity Constraint
Description Intended Remedy
STU GXP Lack of capacity for Waimate area
Lack of capacity for STU, BPD GXP’s
Work with Transpower to ensure capacity is made available
Communications VHF UHF Analogue UHF Digital Fibre Optic
STU VHF for voice traffic
Analogue for all 11 kV station SCADA and load control functions
None None
SCADA Supervision Control Automation Data Acquisition
STU Current, voltage and CB status at STU
Security at STU
STU area CB and ripple plant control
Auto reclosing CB at STU
Load data and power quality at STU
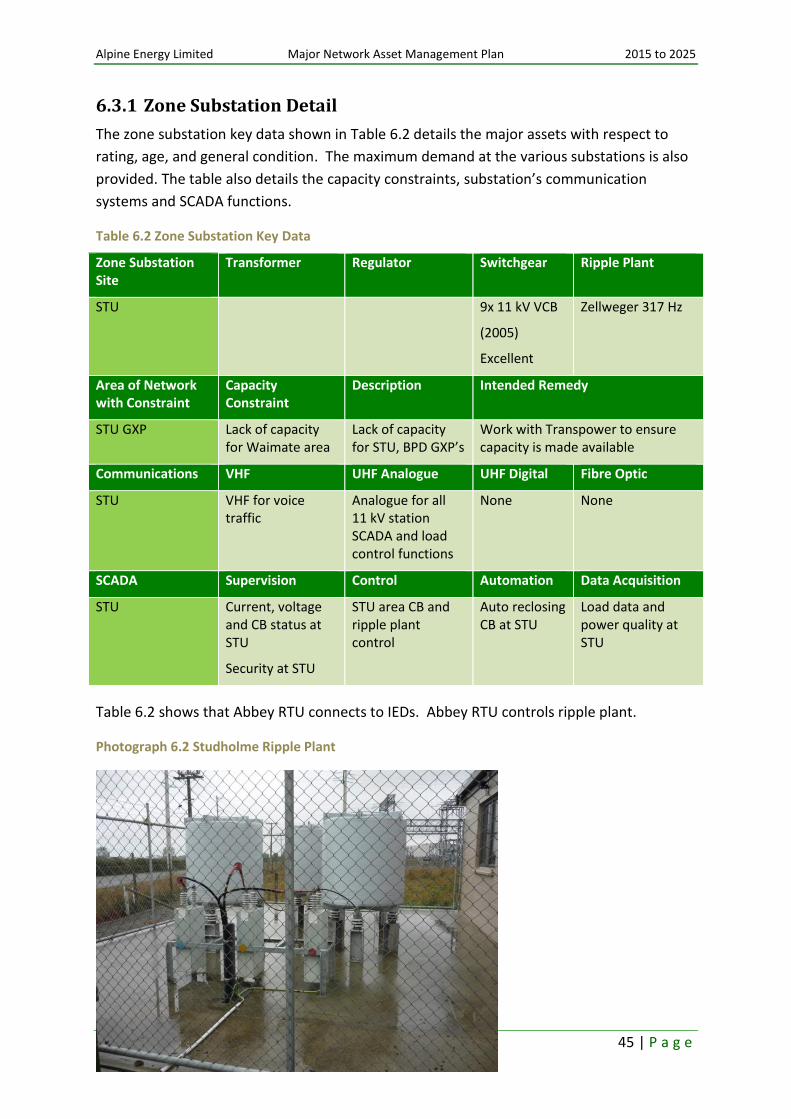
Table 6.2 shows that Abbey RTU connects to IEDs. Abbey RTU controls ripple plant.
Photograph 6.2 Studholme Ripple Plant

Alpine Energy Limited Major Network Asset Management Plan 2015 to 2025
46 | P a g e
Table 6.3 lists the existing level of security at the substation and justifies any shortfall.
Table 6.3 Security Level
Security Level
Zone Sub/Load Centre
Actual Target Shortfall from Target
Waimate Residential
N–1 N–1 Limited 11 kV rings from STU.
Limited fault backup from BPD.
Waimate Rural N–0.5 N–0.5 Limited fault backup from BPD and PAR.
Encourage consumers to be self–sufficient for their essentials. As for CD emergencies.
Fonterra 11 kV N N–1 Load over 3 MVA requires customer investment for dedicated feeders/cables. Present load restricting load growth and increasing voltage problems towards end of feeders.
Limited 11 kV rings.
The estimated demand listed in Table 6.4 shows the aggregated effect of substation
demand growth for a 10 year horizon incorporating the anticipated step changes detailed in
Table 6.5 at page 47.
Table 6.4 Estimated Demand at Zone Substation Level
Estimated Demand
Zone Sub Site
2015 MW
10 year Rate and Nature of Growth
2025 MW
Provision for Growth
STU 11.4
(summer)
3.2% per year expected as TMK residential load.
Dairy and irrigation development (not including step changes).
33.7
(summer)
Transformer upsizing required pending load split for Hunter Downs between STU and STA.
11 kV switchboard upsizing required after 24 MVA.
Alpine Energy Limited Major Network Asset Management Plan 2015 to 2025
47 | P a g e
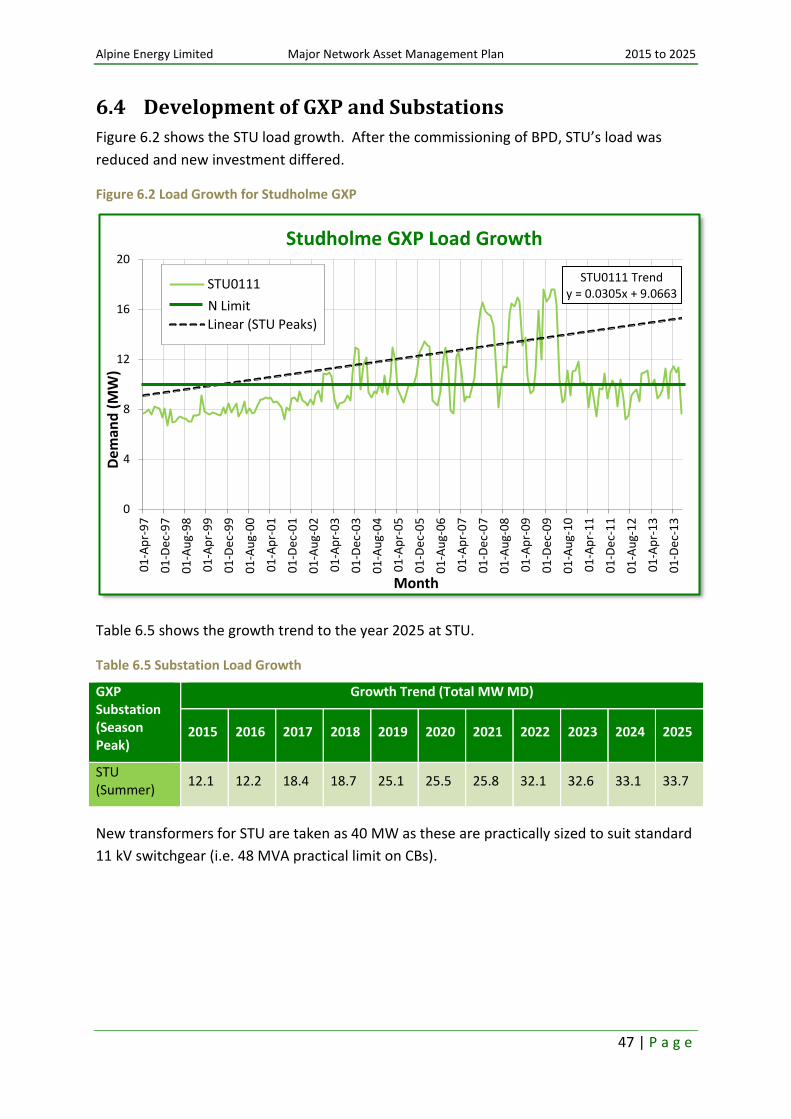
6.4 Development of GXP and Substations
Figure 6.2 shows the STU load growth. After the commissioning of BPD, STU’s load was
reduced and new investment differed.
Figure 6.2 Load Growth for Studholme GXP
Table 6.5 shows the growth trend to the year 2025 at STU.
Table 6.5 Substation Load Growth
GXP Substation (Season Peak)
Growth Trend (Total MW MD)
2015 2016 2017 2018 2019 2020 2021 2022 2023 2024 2025
STU (Summer)
12.1 12.2 18.4 18.7 25.1 25.5 25.8 32.1 32.6 33.1 33.7
New transformers for STU are taken as 40 MW as these are practically sized to suit standard
11 kV switchgear (i.e. 48 MVA practical limit on CBs).
STU0111 Trend y = 0.0305x + 9.0663
0
4
8
12
16
20
01
-Ap
r-9
7
01
-De
c-9
7
01
-Au
g-9
8
01
-Ap
r-9
9
01
-De
c-9
9
01
-Au
g-0
0
01
-Ap
r-0
1
01
-De
c-0
1
01
-Au
g-0
2
01
-Ap
r-0
3
01
-De
c-0
3
01
-Au
g-0
4
01
-Ap
r-0
5
01
-De
c-0
5
01
-Au
g-0
6
01
-Ap
r-0
7
01
-De
c-0
7
01
-Au
g-0
8
01
-Ap
r-0
9
01
-De
c-0
9
01
-Au
g-1
0
01
-Ap
r-1
1
01
-De
c-1
1
01
-Au
g-1
2
01
-Ap
r-1
3
01
-De
c-1
3
Dem
and
(M
W)
Month
Studholme GXP Load Growth
STU0111
Linear (STU Peaks)
N Limit

Alpine Energy Limited Major Network Asset Management Plan 2015 to 2025
48 | P a g e
The date of introduction is load dependant and needs to be scheduled with HDI, dairy
factory load growth and other Transpower work. Figure 6.3 plots the STU load growth after
BPD’s second transformer commissioning and allowing for a new GXP at STA to take some of
the existing Waimate area load.
Figure 6.3 Studholme Growth Trend
6.4.1 Substation Growth Trend and Supply Security
The Waimate district is presently fed off the 110 kV Waitaki circuit 2, this has no spare
capacity. When the irrigation projects and dairy farm and factory projects progress it is
foreseen that a new GXP will be required to feed the existing BPD, CNR and STU loads.
Refer to chapter 11 on Waihao for greater detail.
The feeders to the north of STU and south of PAR will need a new STA GXP to support the
HDI project. These feeders already have the maximum number of voltage regulators and
capacitors applied.
STU GXP presently has two 10 MVA (allowed to run to 11 MVA each) transformers that are
‘bolted’ together giving 22 MVA capacity of N security. If one of the transformers fails
(which has happened in the past), Transpower would ‘unbolt’ the transformers while the
power is off and then liven the healthy transformer and restrict demand to 11 MVA of load.
Present loads indicate that if this occurred some irrigation would have to be turned off until
the faulty transformer had been repaired.
BPD GXP was established and commissioned in August 2010 which off loaded just over
6 MW of load from STU. STU still just breaches the 12 MW N—1 security rating and with the
expected 3.6% load growth in the area by 2015, the security risk at STU is still not resolved.
0
10
20
30
40
50
60
70
80
90
Load
(M
W)
Year
Studholme Area Growth Trend
N security
N-1 security
Studholme
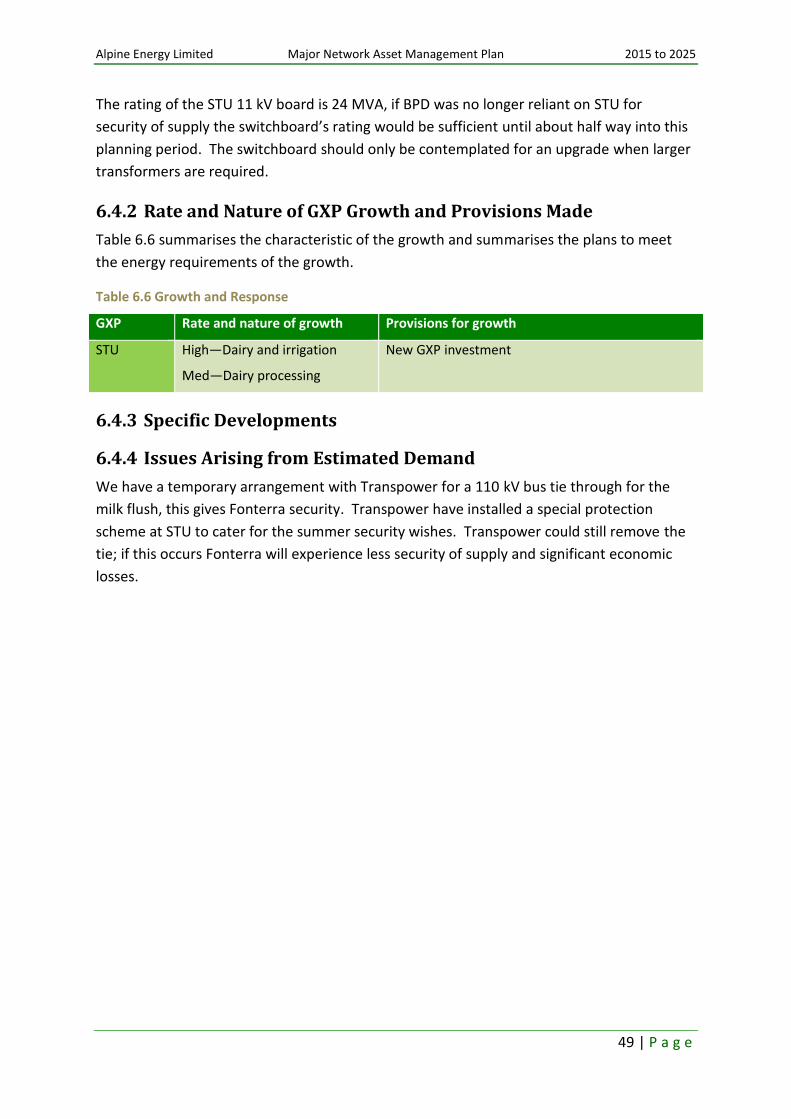
Alpine Energy Limited Major Network Asset Management Plan 2015 to 2025
49 | P a g e
The rating of the STU 11 kV board is 24 MVA, if BPD was no longer reliant on STU for
security of supply the switchboard’s rating would be sufficient until about half way into this
planning period. The switchboard should only be contemplated for an upgrade when larger
transformers are required.
6.4.2 Rate and Nature of GXP Growth and Provisions Made
Table 6.6 summarises the characteristic of the growth and summarises the plans to meet
the energy requirements of the growth.
Table 6.6 Growth and Response
GXP Rate and nature of growth Provisions for growth
STU High—Dairy and irrigation
Med—Dairy processing
New GXP investment
6.4.3 Specific Developments
6.4.4 Issues Arising from Estimated Demand
We have a temporary arrangement with Transpower for a 110 kV bus tie through for the
milk flush, this gives Fonterra security. Transpower have installed a special protection
scheme at STU to cater for the summer security wishes. Transpower could still remove the
tie; if this occurs Fonterra will experience less security of supply and significant economic
losses.

Alpine Energy Limited Major Network Asset Management Plan 2015 to 2025
50 | P a g e
Notes:

Alpine Energy Limited Major Network Asset Management Plan 2015 to 2025
51 | P a g e
7 Tekapo Grid Exit Point
7.1 Introduction
Figure 1.4 on page 10, shows how Tekapo A GXP (TKA) is configured with our network and
Transpower’s transmission network. TKA GXP is supplied by 110 kV circuit from TIM 110 kV
bus via ABY.
7.2 GXP Description
TKA is connected to the grid via a 110/11 kV transformer to the generation bus and then via
an 11/33 kV step up transformer to our 33 kV feeder. Genesis Energy can make its
generator available to supply our TKA load when the ABY–TKA 110 kV circuit is released, and
the ABY and TKA load when the ABY–TIM 110 kV circuit is released.
TKA power station (25 MW) would be used in the case of the loss of 220 kV supply to Timaru
to bolster a weak in–feed (15 MW) from Waitaki to Timaru. Plans are written and held by
the regional operators to enact this.
Transpower invested in a mobile sub with an 110 kV primary connection and an 11, 22 or
33 kV secondary connection. In 2014 TKA had the mobile substation connected between
the ABY 110 kV line and our 33 kV feeder up the hill to maintain supply whilst significant
maintenance was carried out to the GXP and 11 kV generation bus.
Photograph 7.1 Tekapo GXP

Alpine Energy Limited Major Network Asset Management Plan 2015 to 2025
52 | P a g e
7.2.1 Critical Data
The critical GXP data shown in Table 7.1 summarises the key physical attributes of the
station, the voltages, the capacity, the security, and the power flow.
Table 7.1 Tekapo A Substation Key Data
GXP GXP Transmission Potential
GXP Point Of Supply Potential
Capacity N—1 Capacity
Demand 2014
TKA 110 kV 33 kV (via 11 kV bus) 10 MVA
7 MVA PCM limit
0 3.9 MW
7.3 Tekapo A GXP Network Information
Figure 7.1 shows the TKA GXP area network. There are a number of smaller zone
substations to boost voltage to transmit energy to remote sparsely populated areas.
From TKA, we receive 33 kV which is sub–transmitted to the nearby TEK zone substation,
which also hosts the ripple injection plant. From TEK 33 kV is sub–transmitted to
Glentanner (GTN) and Unwin Hut (UHT). TEK zone substation supplies the Tekapo township
and surrounding rural areas. Balmoral (BMR) and Haldon–Lilybank (HLB) are two zone
substations fed off TEK which act as voltage boosters to transmit energy at 22 kV into the
remote Haldon, Lilybank, and Simon’s Pass areas.
Figure 7.1 Tekapo A GXP Area Network
Albury
110 kV
Tekapo A 011 kV with
Genesis Generator
G
Glentanner 011 kV Unwin Hut 011 kV
Haldon- Lilybank 022 kV
Balmoral
022 kV
Tekapo 033 kV
RP
Tekapo 11
kV
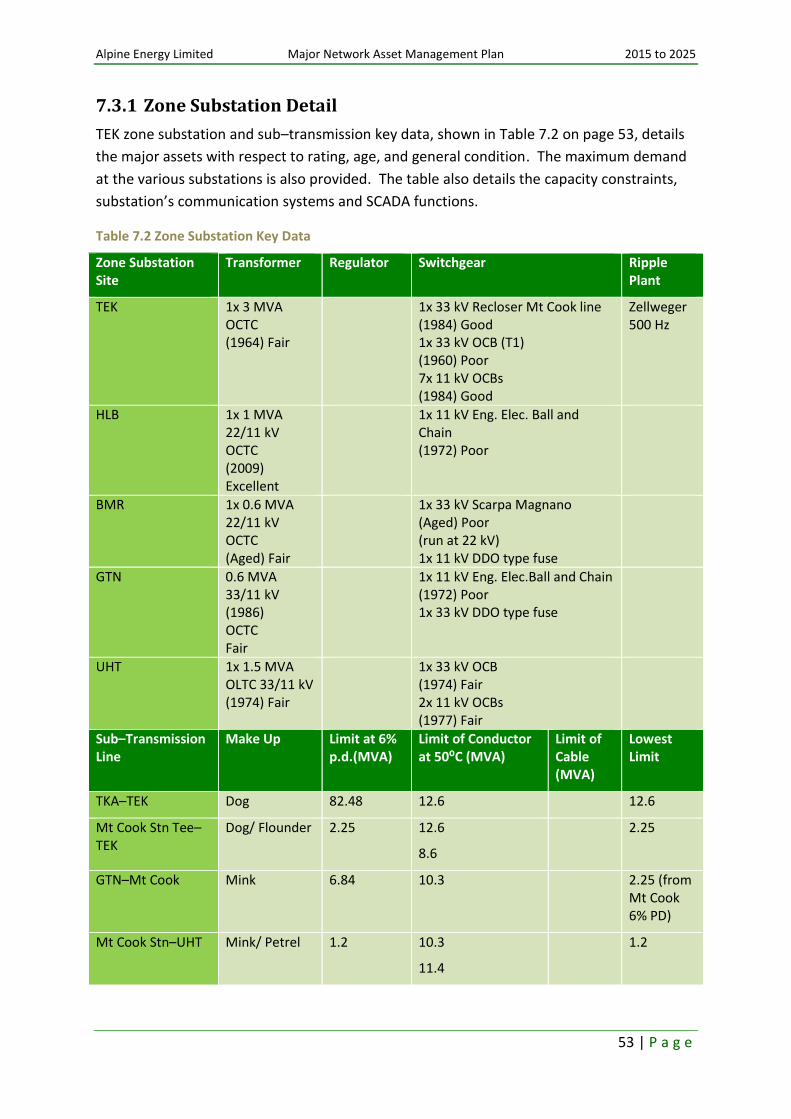
Alpine Energy Limited Major Network Asset Management Plan 2015 to 2025
53 | P a g e
7.3.1 Zone Substation Detail
TEK zone substation and sub–transmission key data, shown in Table 7.2 on page 53, details
the major assets with respect to rating, age, and general condition. The maximum demand
at the various substations is also provided. The table also details the capacity constraints,
substation’s communication systems and SCADA functions.
Table 7.2 Zone Substation Key Data
Zone Substation Site
Transformer Regulator Switchgear Ripple Plant
TEK 1x 3 MVA OCTC (1964) Fair
1x 33 kV Recloser Mt Cook line (1984) Good 1x 33 kV OCB (T1) (1960) Poor 7x 11 kV OCBs (1984) Good
Zellweger 500 Hz
HLB 1x 1 MVA 22/11 kV OCTC (2009) Excellent
1x 11 kV Eng. Elec. Ball and Chain (1972) Poor
BMR 1x 0.6 MVA 22/11 kV OCTC (Aged) Fair
1x 33 kV Scarpa Magnano (Aged) Poor (run at 22 kV) 1x 11 kV DDO type fuse
GTN 0.6 MVA 33/11 kV (1986) OCTC Fair
1x 11 kV Eng. Elec.Ball and Chain (1972) Poor 1x 33 kV DDO type fuse
UHT 1x 1.5 MVA OLTC 33/11 kV (1974) Fair
1x 33 kV OCB (1974) Fair 2x 11 kV OCBs (1977) Fair
Sub–Transmission Line
Make Up Limit at 6% p.d.(MVA)
Limit of Conductor at 50⁰C (MVA)
Limit of Cable (MVA)
Lowest Limit
TKA–TEK Dog 82.48 12.6 12.6
Mt Cook Stn Tee–TEK
Dog/ Flounder 2.25 12.6
8.6
2.25
GTN–Mt Cook Mink 6.84 10.3 2.25 (from Mt Cook 6% PD)
Mt Cook Stn–UHT Mink/ Petrel 1.2 10.3
11.4
1.2

Alpine Energy Limited Major Network Asset Management Plan 2015 to 2025
54 | P a g e
Area of Network with Constraint
Capacity Constraint Description Intended Remedy
TKA GXP None
TEK Transformer at 3 MVA
Transformer identified as becoming too small for the new Tekapo developments.
Install an ex PAR 5/6.25 OLTC transformer. This will allow additional load and provide better voltage control. Expected mid–2015.
Tekapo Rural Lines away Light two phase, large spans
Feed HLB from TWZ.
BMR Lines away Light three phase, large spans
Feed Simon’s Pass from TWZ.
GTN Transformer at 0.6 MVA. Transformer causes additional voltage sag. No OLTC.
Glentanner Park may have additional accommodation built. 0.6 MVA rating will become too small.
Remove the 33/11 kV step down zone substation (GTN) and change out the distribution transformers for 33 kV primary rated units. Some primary insulator changes needed on the lines for new ones built since area was fed at 11 kV.
UHT None
Communications VHF UHF Analogue UHF Digital Fibre Optic
TEK VHF for voice traffic TEK–MRC
MRC–WDK
None
HLB Vehicle radio None None None
BMR Vehicle radio None None None
GTN Vehicle radio None None None
UHT VHF for voice traffic
None None
SCADA Supervision Control Automation Data Acquisition
TEK Current, voltage and CB status at TEK. Security at TEK
TEK CB control. TEK Ripple plant control.
Auto reclosing CB
Load data at TEK
HLB None None None None
BMR None None None None
GTN None None None None
UHT Two bit alarms over VHF
None None None
Note—from Table 7.2 Mt Rollesby (MRC) is not our site, as this is rented space. It is also shown that
TEK’s SCADA has L&N C68 RTU equipment installed.

Alpine Energy Limited Major Network Asset Management Plan 2015 to 2025
55 | P a g e
Table 7.3 lists the existing level of security at the substations and justifies any shortfall.
Table 7.3 Security Level for Tekapo A GXP
Security Level
Zone Sub/Load Centre
Actual Target Shortfall from Target
TEK CBD N–0.5 N–1 No alternate supply to station.
Substation being made mobile substation ready.
Limited 11 kV rings.
Encourage consumers to be self–sufficient for their essentials. As for CD emergencies.
Mt Cook and GTN N N No alternate supply to station.
Substation being made mobile substation ready.
Encourage consumers to be self–sufficient for their essentials. As for CD emergencies.
TEK Rural N N Radial lines, little backup. Generator port on 11 kV at HLB.
Encourage consumers to be self–sufficient for their essentials. As for CD emergencies.
Photograph 7.2 Tekapo Zone Substation

Alpine Energy Limited Major Network Asset Management Plan 2015 to 2025
56 | P a g e
The estimated demand listed in Table 7.4 shows the aggregated effect of substation
demand growth for a 10 year horizon incorporating the anticipated step changes detailed in
Table 7.5 at page 57.
Table 7.4 Estimated Demand at Zone Substation Level
Estimated Demand
Zone Sub Site
2015 MW 10 year Rate and Nature of Growth
2025 MW Provision for Growth
TEK 3.2 (Winter/ shoulder)
3.9% historic on TKA.
Residential load.
Tourism development.
5.4
(Winter /shoulder)
Transformer being changed out in 2015 to 5/6.25 MVA.
HLB 0.2 (Est.) (Winter/ shoulder)
3.9% historic on TKA.
Residential load.
Tourism development.
?
(Winter /shoulder)
Minimal unless lines away rebuilt. If irrigation expands toward Haldon then it is likely their supply will come from TWZ. This sub would be retained for Lilybank.
BML 0.3 (Est.) (Winter/ shoulder)
3.9% historic on TKA.
Residential load.
Tourism development.
?
(Winter /shoulder)
Minimal unless lines away rebuilt. If irrigation expands toward Simon’s Pass then it is likely their supply will come from TWZ. This sub may be decommissioned. Close in loads can be fed at 11 kV.
GTN 0.3 (Est.) (Winter/ shoulder)
3.9% historic on TKA.
Residential load.
Tourism development.
?
(Winter /shoulder)
Consideration given to decommissioning sub and replacing downstream Dist. Transformers with 33 kV. Saves need to install OLTC transformer.
UHT 1.1 (Est.) (Winter/ shoulder)
3.9% historic on TKA.
Residential load.
Tourism development.
1.9
(Winter /shoulder)
Transformer likely to need a change out in planning period.

Alpine Energy Limited Major Network Asset Management Plan 2015 to 2025
57 | P a g e
7.4 Development of GXP and Substations
Figure 7.2 shows the TKA GXP load growth.
Figure 7.2 Load Growth for Tekapo GXP
Table 7.5 shows the growth trend to the year 2025.
Table 7.5 Substation Load Growth
GXP Substation (Season Peak)
Growth Trend (Total MW MD)
2015 2016 2017 2018 2019 2020 2021 2022 2023 2024 2025
TKA Sum (Autumn/ Spring)
5.2 5.8 6.0 6.1 6.3 6.4 6.6 6.7 6.9 7.1 7.3
TEK Village 3.8 4.4 4.5 4.6 4.7 4.8 4.9 5.0 5.1 5.3 5.4
Mt Cook and Glentanner
1.4 1.4 1.5 1.5 1.6 1.6 1.7 1.7 1.8 1.8 1.9
TKA0331 Trend y = 0.0109x + 1.9258
1
2
3
4
5
6
7
01
-Ap
r-9
7
01
-De
c-9
7
01
-Au
g-9
8
01
-Ap
r-9
9
01
-De
c-9
9
01
-Au
g-0
0
01
-Ap
r-0
1
01
-De
c-0
1
01
-Au
g-0
2
01
-Ap
r-0
3
01
-De
c-0
3
01
-Au
g-0
4
01
-Ap
r-0
5
01
-De
c-0
5
01
-Au
g-0
6
01
-Ap
r-0
7
01
-De
c-0
7
01
-Au
g-0
8
01
-Ap
r-0
9
01
-De
c-0
9
01
-Au
g-1
0
01
-Ap
r-1
1
01
-De
c-1
1
01
-Au
g-1
2
01
-Ap
r-1
3
01
-De
c-1
3
Dem
and
(M
W)
Month
Tekapo GXP Load Growth
TKA0331
Linear (TKA Peaks)
N Limit

Alpine Energy Limited Major Network Asset Management Plan 2015 to 2025
58 | P a g e
Figure 7.3–Figure 7.5 shows the predicted maximum demand within the planning period.
Figure 7.3 Tekapo Growth Trend
Figure 7.4 Tekapo Village Substation Growth Trend
Figure 7.5 Unwin Hut (Mt Cook) Substation Growth Trend
0
2
4
6
8
10
12
Load
MW
Year
Tekapo GXP Growth Trend
N security TKA
Loading TKA
0
1
2
3
4
5
6
7
Load
MW
Year
Tekapo Village Substation Growth Trend
N securityTEK
LoadingTEK
00.20.40.60.8
11.21.41.61.8
2
Load
MW
Year
Unwin Hut (Mt Cook) Substation Growth Trend
N security MtCook
Loading MtCook

Alpine Energy Limited Major Network Asset Management Plan 2015 to 2025
59 | P a g e
7.4.1 Substation Growth Trend and Supply Security
The almost 6% load growth anticipated in the tourism sector in 2009 fell back. In 2014 the
plans for expanding the CBD have progressed to construction starting and two major hotels
announced. We are unsure of the speed of the uptake of this.
Our supply is on an N security basis from TKA. An 11 kV bus or 11 kV to 33 kV step up
transformer fault would result in a total supply loss until repairs were undertaken or the
Transpower Mobile Substation was installed. Since the spare transformer is not on–site, a
fault within the transformer would result in a loss of supply for at least a day while a change
out occurred.
We could support some of the TEK load with mobile generation.
7.4.2 Rate and Nature of GXP Growth and Provisions Made
Table 7.6 summarises the characteristic of the growth and summarises the plans to meet
the energy requirements of the growth.
Table 7.6 Growth and Response
GXP Rate and nature of growth Provisions for growth
TKA Medium—Subdivision and tourism business Upgrade zone substation
7.4.3 Specific Developments
7.4.3.1 Tekapo A Transpower 11 kV Switchboard
Transpower carried out a strengthening and arc flash containment project on the
switchboard in early 2014 while its mobile substation was deployed. This extended the life
of the existing switchboard in the same electrical configuration.
7.4.3.2 Haldon–Lilybank Zone Substation Upgrade
Haldon–Lilybank (HLB) is a small step up substation on the edge of Tekapo. It consists of a
ball and chain recloser, an 11/22 kV step up autotransformer and two phase lines away to
Haldon and Lilybank. The neutral of the autotransformer has earth fault protection
installed.
The substation is due for replacement. Options are being examined.
An enquiry has been made from a number of farmers about a stronger supply in the Haldon
area for irrigation. The 22 kV system is not three phase and does not have capacity. The
most economical solution for this is taking a supply from Twizel. In the meantime the
farmers are still developing the proposal, and there is no time frame given for the irrigation
to be commissioned.
Alpine Energy Limited Major Network Asset Management Plan 2015 to 2025
60 | P a g e
7.4.3.3 Balmoral Zone Substation Decommissioning
BMR is a small step up substation on the edge of Tekapo that feeds Simon’s Pass, it consists
of; a primary 11 kV fuse, an 11/22 kV step up auto transformer, a 33 kV 600 A Scarpa
Magnano minimum oil CB and post CTs, and a 22 kV line away. The neutral of the
autotransformer has earth fault protection installed.
There are thoughts that the substation may be disestablished, the 22 kV line operated at
11 kV, and the several existing 22 kV distribution transformers replaced with standard 11 kV
distribution transformers. However, there is a pause in this work until irrigation prospects
in the Simon’s Pass/Pukaki area are fully identified to us.
7.4.3.4 Ripple Plant Upgrade
A 10 year program to replace or decommission the old rotating ripple injection plants was
commenced in 2000 although TEK still has a rotary ripple plant. This was delayed while a
short wave radio load control system was considered.
Smart Meters may provide suitable load control in the future but this is not considered soon
enough to meet our immediate requirements for replacing outdated equipment. Therefore
it has been decided to recommence the original plan to replace the old rotary injection
plants with modern electronic equipment as per the original program.
The ripple replacement will also require the replacement of the RTU and comms as the
existing legacy equipment is passed its economic life. It is likely that this RTU and comms
replacement at TEK would be done in conjunction with a similar replacement at the Twizel
Zone Sub as the latter’s legacy RTU and comms equipment (same vintage as TEK’s) shares a
common SCADA System comms link with TEK back to the Washdyke Control Room.
7.4.4 Issues Arising from Estimated Demand
Transpower have identified the supply transformer becoming too small in 2022, this is
because the 10 MVA transformer is constrained via protection/control/metering (PCM).
Changes will be required to extend the capacity of the transformer.

Alpine Energy Limited Major Network Asset Management Plan 2015 to 2025
61 | P a g e
8 Temuka Grid Exit Point
8.1 Introduction
Figure 1.4 on page 10, shows how the Temuka GXP (TMK) is configured with our network
and Transpower’s transmission network. TMK is supplied by double 110 kV transformer
feeder circuits from the TIM 110 kV bus.
8.2 GXP Description
Figure 8.1 at page 62 shows the TMK GXP area network. The 110/33 kV GXP has eight 33 kV
feeders; four to Fonterra’s Clandeboye Dairy Factory (of which two are direct cables and
two are overhead circuits supported on a single pole line), two 33 kV cables to our 33/11 kV
zone substation (co–sited at the TMK GXP), one 33 kV circuit breaker to supply an overhead
33 kV feeder to GLD and one 33 kV circuit breaker to supply an overhead 33 kV feeder to
RGA. The latter two have a tying arrangement at the end of the CB cable/start of overhead
line to give security for a CB failure. Our 33/11 kV zone substation supplies the Temuka
township and surrounding rural area.
RGA also has a supply from a tee off of the CD2 circuit at CNL.
Peak demand occurs during summer based on the predominant dairy and irrigation load.
Photograph 8.1 Temuka Zone Substation
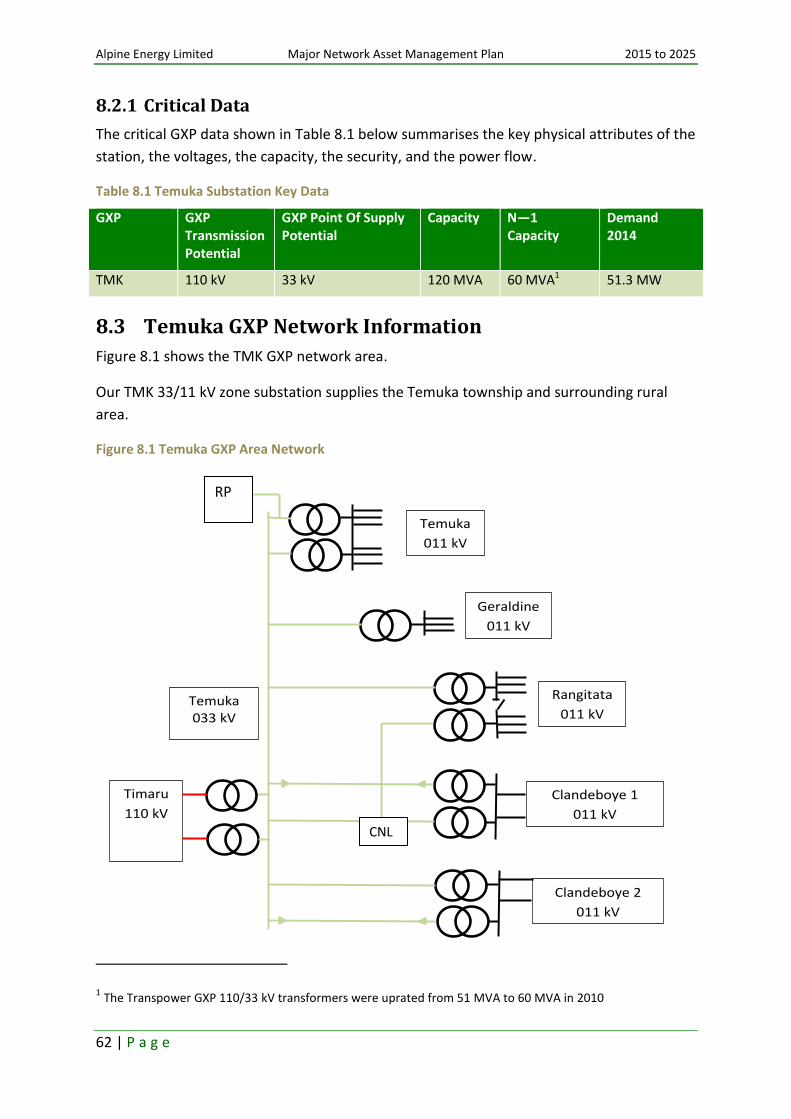
Alpine Energy Limited Major Network Asset Management Plan 2015 to 2025
62 | P a g e
8.2.1 Critical Data
The critical GXP data shown in Table 8.1 below summarises the key physical attributes of the
station, the voltages, the capacity, the security, and the power flow.
Table 8.1 Temuka Substation Key Data
GXP GXP Transmission Potential
GXP Point Of Supply Potential
Capacity N—1 Capacity
Demand 2014
TMK 110 kV 33 kV 120 MVA 60 MVA1 51.3 MW
8.3 Temuka GXP Network Information
Figure 8.1 shows the TMK GXP network area.
Our TMK 33/11 kV zone substation supplies the Temuka township and surrounding rural
area.
Figure 8.1 Temuka GXP Area Network
1 The Transpower GXP 110/33 kV transformers were uprated from 51 MVA to 60 MVA in 2010
Timaru
110 kV
Temuka 033 kV
Temuka
011 kV
Geraldine
011 kV
Rangitata
011 kV
Clandeboye 1
011 kV
Clandeboye 2
011 kV
CNL
RP

Alpine Energy Limited Major Network Asset Management Plan 2015 to 2025
63 | P a g e
8.3.1 Zone Substation Detail
The zone substation, switching station and sub–transmission key data for TMK, Clandeboye,
RGA and GLD is shown in Table 8.2below. It details the major assets with respect to rating,
age, and general condition. The maximum demand at the various substations is also
provided.
Table 8.2 Zone Substation Key Data
Zone Substation Site
Transformer Regulator Switchgear Ripple Plant
TMK 2x 25 MVA OLTC 33/11 kV (2007) Excellent
9x 11 kV VCBs (2006) Excellent
1x Zellweger 317 Hz 33 kV
CD1 16 MW
2x 20 MVA OLTC 33/11 kV (1997) Good
2x 33 kV Reclosers WVE (1997) Good 15x 11 kV VCBs (1997) Excellent
CD2 14 MW
2x 25 MVA OLTC 33/11 kV (2004) Excellent
2x 33 kV Recloser VWVE (2004) Good 12x 11 kV VCBs (2004) Excellent
RGA (9.8 MW)
2x 9/15 MVA OLTC 33/11 kV (2011, 2012) Excellent
2x 33 kV GL107X CB (SF6) (2011, 2012) Excellent 5x 11 kV VCB Tamco (2004) Excellent 5x 11 kV VCB RPS (2011) Excellent
GLD 6.1 MW
1x 5/6.25/9 MVA OLTC 33/11 kV (1980) Good
1x 33 kV Recloser VWVE, T2 (2009) Excellent 1x 11 kV Recloser U Nulec, T2 (2009) Excellent 3x 11 kV Recloser U Nulec, feeders (2007) Excellent
Zone Switching Station Site
Transformer Regulator Switchgear Ripple Plant
CNL 8.5 MW None
1x 33 kV GL107X CB (SF6) (2012) Excellent

Alpine Energy Limited Major Network Asset Management Plan 2015 to 2025
64 | P a g e
Sub–Transmission Line
Make Up Limit at 6% p.d. (MVA)
Limit of Conductor at 50⁰C (MVA)
Limit of Cable (MVA)
Lowest Limit
TMK–CD 1 Cable 1/400 then
1/300 42.3 21.3 21.3
TMK–CD 2 Cable 2x1/300/
Jaguar then 1/300 33 23.4 21.3 21.3
TMK–CD 3 Cable 2x1/300/
Jaguar then 1/400 33 23.4 24.2 23.4
TMK–CD 4 Cable 1/400 42.3 24.2 24.2
RGA 1–TMK Cable 1/400
/Dog/Iodine/Mink
Cable 3/95/Wolf
Core
8.4 10.3 11.5 8.4
RGA 2–TMK via Canal Rd teed off CD2–TMK
10 MVA take agreed with Fonterra
Cable 2x1/300/
Jaguar
21.26 (14.95 towards RGA2)
23.4 32 10
GLD–TMK Cable 1/400 /Dog 8.64 12.6 24.2 8.64
Note that we have an agreed maximum limit of 10 MVA to be taken off the CD1–TMK 33 kV circuit.
Photograph 8.2 Canal Road Switching Station

Alpine Energy Limited Major Network Asset Management Plan 2015 to 2025
65 | P a g e
Table 8.3 details the substation’s communication systems and SCADA functions.
Table 8.3 Communication and SCADA Summary
Communications VHF UHF Analogue UHF Digital Fibre Optic
TMK VHF for voice traffic None TMK–MEC MEC–WDK (main) TMK–WDK (backup)
CD2–TMK (services CD1and2 and CNL)
CD1 and CD2 VHF for voice traffic None CD1–CNL (services CNL)
CD2–TMK (services CD2) CD1–CD2 (services CD1)
CNL VHF for voice traffic None CD1–CNL None
SCADA Supervision Control Automation Data Acquisition
TMK Current, voltage and CB status at TMK Security at TMK
TMK CB and Transformer Control Ripple plant control
Auto Reclosing CB
Load data at TMK
CD1 and CD2 Current, Voltage and CB status at CD1 and CD2 Security at CD1 and CD2
CD1 and CD2 CB and Transformer Control
Control of CBs Load data at CD1 and CD2
CNL Current, voltage and CB status at CNL Security at CNL
CNL CB Control Control of CB Load data at CNL
The SCADA in TMK consists of an Abbey RTU connecting to our 11 kV switchgear and
transformer zone IEDs, it controls the ripple plant, and connects to Transpower’s data
bridge to its RTU in Transpower’s 33 kV switch room.
CD1, CD2, CNL & RGA SEL 3530 substation processors connect the substation equipment.
TMK communications connects via radio systems to WDK via CHC and is a communications
hub for CD1, CD2 and CNL via the CD2–TMK fibre. CD2 is a communications hub for CD1 (via
fibre) and CNL (via radio).

Alpine Energy Limited Major Network Asset Management Plan 2015 to 2025
66 | P a g e
Table 8.4 shows the capacity constraints in the TMK GXP.
Table 8.4 GXP Network Constraints
Area of Network with Constraint
Capacity Constraint
Description Intended Remedy
TMK Temuka Area—Holistic
Lack of capacity for TMK 33 kV GXP load
Work with Transpower on upgrading supply assets.
Possibly establish new GXP off a proposed 220 kV OAI bussing point.
Possibly establish new GXP at TMK off a 220 kV line diversion to TMK.
TMK GXP Supply Security
Load constraint over 60 MVA on transformers.
70 MVA on 110 kV lines.
71 MVA on 33 kV switchboard.
New investment in line and switchboard upgrade—Transpower discussion (timing uncertain).
Possibly establish new GXP off a proposed 220 kV OAI bussing point to offload TMK GXP.
Possibly establish new GXP at TMK off a 220 kV line diversion to TMK.
RGA Rangitata 33 kV sub–trans 1 line regulation
Voltage constraint over 8.4 MVA of load (6% volt drop)
Second 33 kV feeder to RGA took load in 2013.
For a sub–trans tripping, shuffling of load is required, most can be done via remote control so quick response.
Long term sub–trans review required.
GLD Geraldine 33 kV sub–trans 1 line regulation
Voltage constraint over 8.64 MVA of load (6% volt drop)
Watch on GLD loading as RGA load is transferred. Load may be able to go back on RGA depending on the final irrigation scheme load.
Geraldine CBD Voltage constraint at end of feeder
Install capacitor from the 2014/15 plan, review required.

Alpine Energy Limited Major Network Asset Management Plan 2015 to 2025
67 | P a g e
Table 8.5 lists the existing level of security at the substation and justifies any shortfall.
Table 8.5 Security Level
Security Level
Zone Sub/Load Centre
Actual Target Shortfall from Target
TMK Residential N–1 N–1 Capacity headroom eroding due to commercial developments fed via the residential area.
Look to increase size of conductor to limit voltage drop, difficult through residential area due to TDC planning constraints for overhead lines.
TMK Rural N–0.5 N–0.5 Limited fault backup from GLD, RGA, PLP and TIM.
Encourage consumers to be self–sufficient for their essentials. As for CD emergencies.
CD1 and 2 N–2 (Sub–Trans)
N–1 (Zone Sub)
N–2 Fonterra invested with the additional installation of two 33 kV cables to their plant in addition to the two 33 kV overhead circuits that were initially installed.
The source from Transpower to the TMK GXP consists of many components and is an N—1 supply. Discussion with Transpower held to try to reduce the number of components when the OAI bussing project occurs.
RGA
N N Station allows connection to TMK–CD1 cct 2 for supply to RGA.
RGA has security via TMK’s direct circuit.
See RGA for further detail.
N–0.5 N–1 Station runs with split 11 kV bus, 8.4 MVA available at worst after switching.
Balance can be shifted onto 11 kV backup from GLD and TMK.
GLD N–0.5 N–0.5 33 kV investment to be considered.
Watch Transpower’s proposal for an OAI 220 kV bussing point. May free a circuit passing near GLD on the TMK–RGA Cct 1 for use at GLD.

Alpine Energy Limited Major Network Asset Management Plan 2015 to 2025
68 | P a g e
The estimated demand listed in Table 8.6 shows the aggregated effect of substation
demand growth for a 10 year horizon incorporating the anticipated step changes detailed in
Table 8.7 on page 69.
Table 8.6 Estimated Demand at Zone Substation Level
Estimated Demand
Zone Sub Site
2015 MW
10 year Rate and Nature of Growth
2025 MW Provision for Growth
TMK 60.2
(summer)
3.6% historic on TMK.
Residential load.
Dairy and irrigation development.
Dairy processing.
26.8
(summer)
Provided OAI offloads bulk of TMK.
82
If not.
Load growth due to expansion at Clandeboye which is not yet confirmed. More of a focus put on STU at present.
Rangitata South Irrigation being commissioned, possibly 4 MW more to be loaded.
Transmission solutions being discussed with Transpower.
CD1 and CD2
30.4
(summer)
3.6%
Stepped to suit process expansion and any new drier
35
(summer).
43
With new drier.
Substation and sub–transmission capacity available. Additional CB’s at substations and 11 kV cabling to new RMU and Dist Tx’s required—expect demand to grow from current demand of 30 MW to about 43 MW by the end of the planning period. With careful load transfers existing assets can meet this demand and retain N—1 security.
GLD 6.1
(summer)
3.6% historic on TMK.
Residential load.
Dairy and irrigation development.
7.9
(summer)
Local concern may lead to a second 33 kV circuit to provide N—1 security—expect demand to grow from current demand of 6.5 MW to about 7.8 MW by the end of the planning period.
We installed RMU to break rural load off CBD, this will improve reliability and allay some concerns.
RGA 9.8
(summer)
3.6% historic on TMK.
Residential load.
Dairy and irrigation development.
20
(summer)
Second 33 kV circuit installed to provide improved security to essential loads. Expect demand to grow from current demand of 9.8 MW to about 20 MW by the end of the planning period.
Note some of RGA load can be transferred to TMK and GLD as a temporary measure.
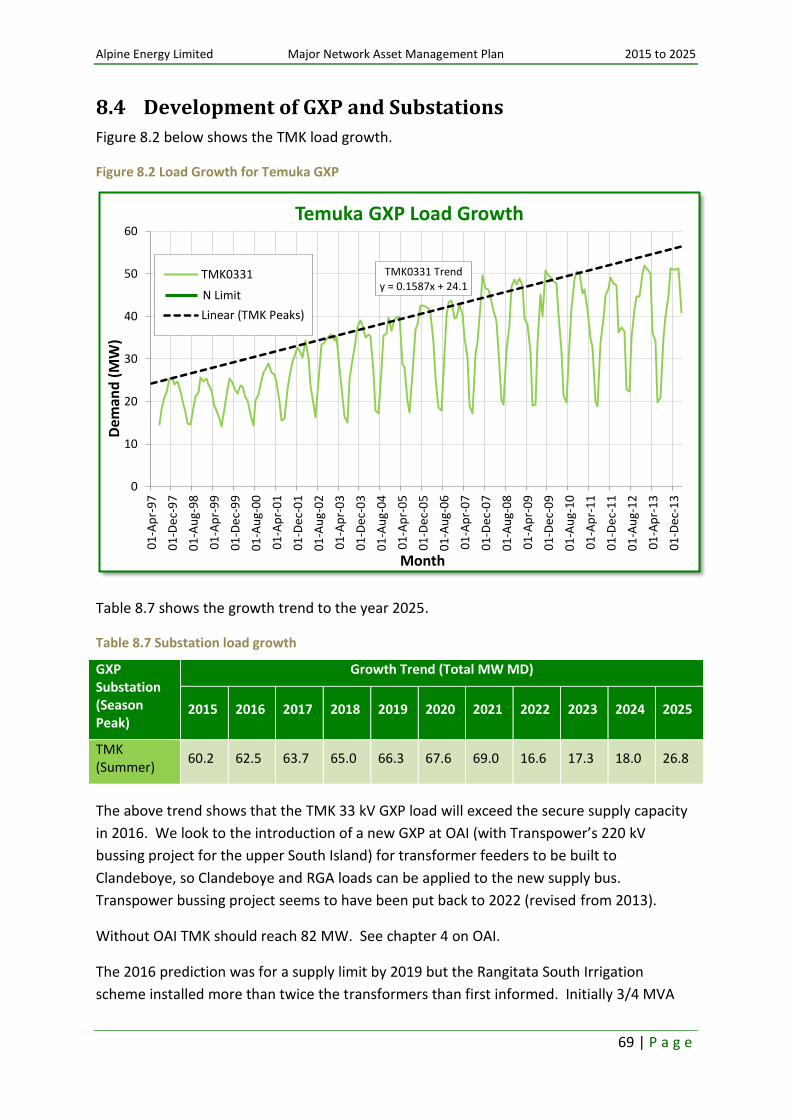
Alpine Energy Limited Major Network Asset Management Plan 2015 to 2025
69 | P a g e
8.4 Development of GXP and Substations
Figure 8.2 below shows the TMK load growth.
Figure 8.2 Load Growth for Temuka GXP
Table 8.7 shows the growth trend to the year 2025.
Table 8.7 Substation load growth
GXP Substation (Season Peak)
Growth Trend (Total MW MD)
2015 2016 2017 2018 2019 2020 2021 2022 2023 2024 2025
TMK (Summer)
60.2 62.5 63.7 65.0 66.3 67.6 69.0 16.6 17.3 18.0 26.8
The above trend shows that the TMK 33 kV GXP load will exceed the secure supply capacity
in 2016. We look to the introduction of a new GXP at OAI (with Transpower’s 220 kV
bussing project for the upper South Island) for transformer feeders to be built to
Clandeboye, so Clandeboye and RGA loads can be applied to the new supply bus.
Transpower bussing project seems to have been put back to 2022 (revised from 2013).
Without OAI TMK should reach 82 MW. See chapter 4 on OAI.
The 2016 prediction was for a supply limit by 2019 but the Rangitata South Irrigation
scheme installed more than twice the transformers than first informed. Initially 3/4 MVA
TMK0331 Trend y = 0.1587x + 24.1
0
10
20
30
40
50
60
01
-Ap
r-9
7
01
-De
c-9
7
01
-Au
g-9
8
01
-Ap
r-9
9
01
-De
c-9
9
01
-Au
g-0
0
01
-Ap
r-0
1
01
-De
c-0
1
01
-Au
g-0
2
01
-Ap
r-0
3
01
-De
c-0
3
01
-Au
g-0
4
01
-Ap
r-0
5
01
-De
c-0
5
01
-Au
g-0
6
01
-Ap
r-0
7
01
-De
c-0
7
01
-Au
g-0
8
01
-Ap
r-0
9
01
-De
c-0
9
01
-Au
g-1
0
01
-Ap
r-1
1
01
-De
c-1
1
01
-Au
g-1
2
01
-Ap
r-1
3
01
-De
c-1
3
Dem
and
(M
W)
Month
Temuka GXP Load Growth
TMK0331
Linear (TMK Peaks)
N Limit
Alpine Energy Limited Major Network Asset Management Plan 2015 to 2025
70 | P a g e
was requested which was then increased to 9 MVA. We are yet to see a full irrigation
season run as the ponds are still filling and water has only been made available from 2014.
2015 should see Rangitata South’s completion.
Options have been brainstormed for the future of TIM/TMK assets; diverting the Livingston
220 kV circuit in/out of TMK, creating a 110 kV GXP under the Livingston 220 kV circuit to
bring 110 kV to site and creating a 110 kV supply at OAI and bringing it to TMK. None of
these options are as beneficial as constructing a 220 kV GXP at OAI to supply a Clandeboye
zone substation. It is also more important for us to use capacity at Waihao than Temuka,
please see chapter 11 for more information.
Fonterra has advised a new cheese plant will be commissioned at Clandeboye in 2015 and
that the new Clandeboye drier (D4) is on hold pending developments at the Studholme
plant. We have however factored in additional drier load around 2025. Studies need to be
carried out to ensure that the load growth that is presently being experienced doesn’t
curtail with the land becoming fully irrigated. All the farms must at some stage be ‘wet’ and
no more dairy sheds able to be built. More research is required. Fonterra can build driers
faster than Transpower can respond to capacity increases.
Any increase in capacity at TMK needs to be offset by an increase in TIM T5 and T8’s inter–
connection transformer ratings.
The 110 kV lines to TMK from TIM are rated 70 MVA, with either some lifting to provide
better ground clearance or re–conductoring they could be re–rated to allow more power
flow. Transpower has also identified the need to upgrade these lines to supply the new
transformer arrangement at TMK.
Transpower has discussed possible upgrades at TMK to install one 120 MVA transformer
and parallel the two existing. This would best be done onto a new two bus–section 33 kV
switchboard as the existing one is only rated to 71 MVA.
Our studies suggest all the above is less effective than the OAI/Clandeboye solution.
8.4.1 Substation Growth Trend and Supply Security
TMK GXP is reaching capacity. Transpower and ourselves will jointly decide on a solution.
8.4.2 Rate and Nature of GXP Growth and Provisions Made
Table 8.8 summarises the characteristic of the growth and summarises the plans to meet
the energy requirements of the growth.
Table 8.8 Growth and Response
GXP Rate and nature of growth Provisions for growth
TMK High—Rural and industrial GXP investment

Alpine Energy Limited Major Network Asset Management Plan 2015 to 2025
71 | P a g e
Figure 8.3 shows the growth trends in the TMK GXP area.
Figure 8.3 Temuka Area Load Growth and Supply Security assuming Orari is Built 2022
8.4.3 Specific Developments
8.4.3.1 Temuka 110/33 kV GXP
TMK has two 110/33 kV transformer feeders from TIM supplying the 33 kV bus. The 110 kV
lines are rated at 70 MVA and the transformers at 60 MVA. We have a peak load of 52 MVA
(Jan 2013). A large number of additional loads will be realised with future dry years and
Rangitata South’s irrigation scheme being run hard.
If there was a loss of one of the 110 kV transformer feeders from TIM the remaining
transformer would be running without spare capacity during peak load periods.
Replacement of the existing transformers in TMK has been delayed.
8.4.4 Issues Arising from Estimated Demand
For now we await decisions on when OAI will be built and if a new 220 kV GXP can be built
from it to Clandeboye; or if a better option presents itself.
In the meantime we will have to firm up load shedding schemes if TMK cannot run on its
N capacity.
0
20
40
60
80
100
120
140
Load
(M
W)
Year
Temuka Area Growth Trend
N Security
N-1SecurityTotalLoading
Alpine Energy Limited Major Network Asset Management Plan 2015 to 2025
72 | P a g e
Notes:

Alpine Energy Limited Major Network Asset Management Plan 2015 to 2025
73 | P a g e
9 Timaru Grid Exit Point
9.1 Introduction
Figure 1.4 on page 10, shows how Timaru GXP (TIM) is configured with our network and
Transpower’s transmission network. TIM GXP is supplied by the Twizel–Islington (via
Ashburton/Bromley) 220 kV double circuit to TIM’s 110 kV bus via T5 and T8 inter–
connection transformers.
9.2 GXP Description
TIM is presently the largest supply point connecting two 220/110 kV interconnectors to
provide a 110 kV bus which acts as a transmission hub for ABY, TKA, TMK and BPD/STU. The
110 kV is stepped down through three transformer banks to supply the TIM GXP 11 kV
switchboard.
The 11 kV switchboard at TIM was replaced in early 2012 as it was at its end of life. The
11 kV is split across three buses with 20 feeder circuit breakers connected (room for four
more).
Two feeders are stepped up to 33 kV by us to supply three single circuit 33 kV lines; two
10 km circuits to Pareora (PAR) zone substation supplying a 4.5 MW meat works and rural
load, and one 12 km circuit supplying a rural community at Pleasant Point (PLP) zone
substation for township and rural consumers.
Six 11 kV sub–transmission cables supply some 35 MW to the CBD area. These include four
cables to Grasmere St (GRM) 11 kV switching substation, which then supplies cables to Hunt
St (HNT) and North St (NST) 11 kV switching stations. Two additional sub–transmission
cables have been recently laid from TIM to the NST 11 kV switching station. Each of these
three switching stations has an indoor switchboard with between eight and 12 cable
feeders. These supply the CBD, PrimePort, Redruth and surrounding residential areas.
TIM also supplies twelve 11 kV feeders to; the western residential areas, the northern
residential and industrial areas of Washdyke, and the 4 MW meat–works at Smithfield.
In addition, there are two 11 kV CBs allocated for connecting a new ripple control plant and
our local service transformer supplies. These are looking to be altered to supply the new
A&P show–grounds shopping centre.
The new Holcim cement handling facility will be partially fed from GRM and NST.
The 110/11 kV transformer banks at TIM were replaced, with final commissioning in
October 2014. The new 40/47 MVA transformers are operated with two in service and one
on hot standby. This lowers the inter–phase fault levels in the surrounding area. Earth fault
levels were lowered in 2012 with the inclusion of neutral earthing resistors (NERs).
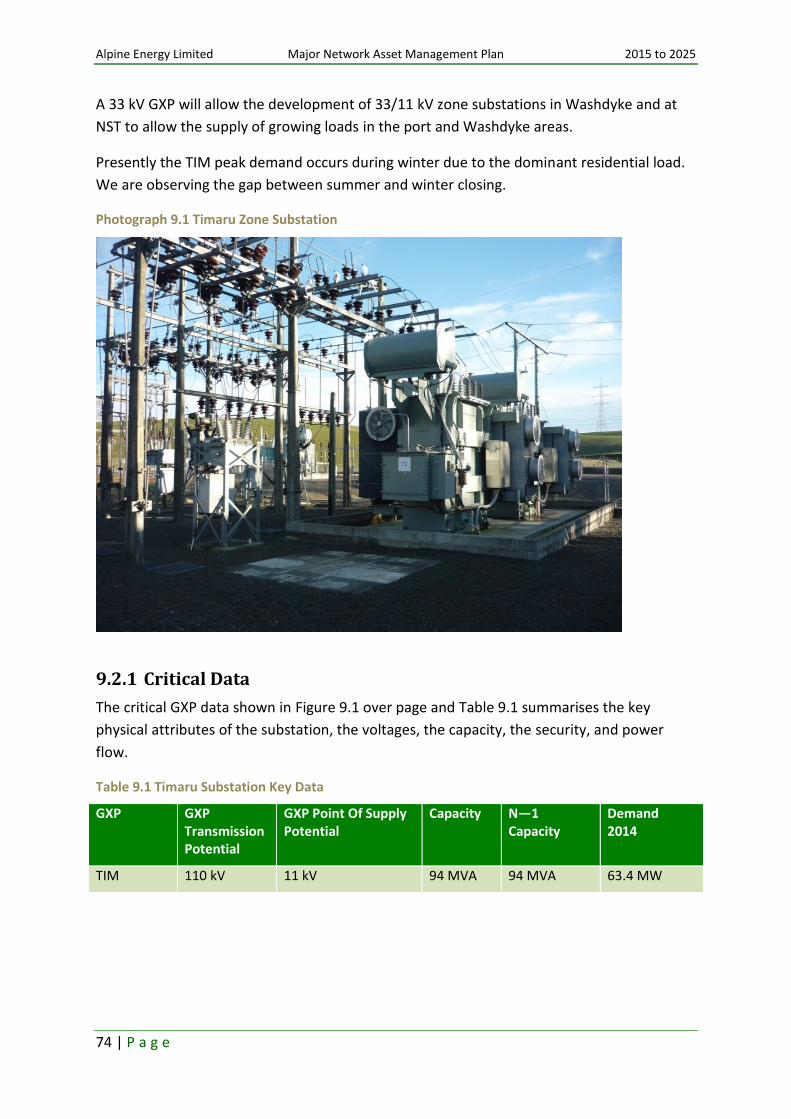
Alpine Energy Limited Major Network Asset Management Plan 2015 to 2025
74 | P a g e
A 33 kV GXP will allow the development of 33/11 kV zone substations in Washdyke and at
NST to allow the supply of growing loads in the port and Washdyke areas.
Presently the TIM peak demand occurs during winter due to the dominant residential load.
We are observing the gap between summer and winter closing.
Photograph 9.1 Timaru Zone Substation
9.2.1 Critical Data
The critical GXP data shown in Figure 9.1 over page and Table 9.1 summarises the key
physical attributes of the substation, the voltages, the capacity, the security, and power
flow.
Table 9.1 Timaru Substation Key Data
GXP GXP Transmission Potential
GXP Point Of Supply Potential
Capacity N—1 Capacity
Demand 2014
TIM 110 kV 11 kV 94 MVA 94 MVA 63.4 MW

Alpine Energy Limited Major Network Asset Management Plan 2015 to 2025
75 | P a g e
9.3 Timaru GXP Network Information
Figure 9.1 shows the Timaru GXP area network.
Figure 9.1 Timaru GXP Area Network
9.3.1 Zone Substation Detail
The zone substation key data shown in Table 9.2 at page 76, details the major assets with
respect to rating, age, and general condition. The maximum demand at the various
substations is also provided. TIM zone substation was historically referred to as Grant’s Hill.
The substation’s purpose is to step up 11 kV to 33 kV to feed the PAR and PLP zone
substations. The site also hosts the ripple plant. Transpower switchgear onsite feeds the
surrounding rural, residential, and Washdyke/Seadown areas.
Timaru
110 kV
Timaru
033 kV
Grasmere
011 kV
Hunt
011 kV
North St
011 kV 10 Other
Feeders
011 kV
Pleasant Point
011 kV
Pareora
011 kV
RP

Alpine Energy Limited Major Network Asset Management Plan 2015 to 2025
76 | P a g e
Table 9.2 Zone Substation Key Data
Zone Substation Site
Transformer Regulator Switchgear Ripple Plant
TIM 2x 25 MVA OLTC 33/11 kV (2006) Excellent
3x 33 kV Reclosers (1986) Fair
1x Zellweger 317 Hz
PAR 8.7 MW
2x 9/15 MVA OLTC 33/11 kV (2011) Excellent
6x 33 kV VCBs SF6 isophases (2011) Excellent 9x 11 kV VCBs(2008) Excellent
PLP 4.7 MW
1x 5/6.25 MVA OLTC 33/11 kV (1980) Good
1x 33 kV Recloser (1980) Good 5x 11 kV VCB (2006) Excellent
Zone Switching Station Site
Transformer Regulator Switchgear Ripple Plant
GRM 13 MW
20x VCBs (2012) Excellent
HNT 11 MW
16x VCBs (1984) Good
NST 11 MW
20x VCBs (2011) Excellent
Sub–Transmission Line
Make Up Limit at 6% p.d. (MVA)
Limit of Conductor at 50⁰C (MVA)
Limit of Cable (MVA)
Lowest Limit
GRM–TIM 4x 11 kV 400 mm2 Cu PILC Cables (1983) Fair
GRM–HNT and GRM–NST and HNT–NST (11 MW)
4x 11 kV 193 mm2 Cu PILC Cables (1962) Fair
NST–TIM (11 MW)
2x 33 kV 1200 mm2 Al XLPE Cables (2011) Excellent
PAR–TIM 1 Mink/Petrel/Rango Cable 1/95/37/0.016
6.8 10.3/11.4 11.5 6.8
PAR–TIM 1 (Rebuild underway)
Iodine/Petrel Cable 1/95
10.3 16.6/11.5 11.5 10.0

Alpine Energy Limited Major Network Asset Management Plan 2015 to 2025
77 | P a g e
Sub–Transmission Line
Make Up Limit at 6% PD (MVA)
Limit of Conductor at 50⁰C (MVA)
Limit of Cable (MVA)
Lowest Limit
PAR–TIM 2 Quail/ Cable 1/95/19/0.014
6.91 10.3 11.5 6.91
PAR–TIM 2 (Rebuild Underway)
Iodine/ Cable 1/95
10.09 16.6 11.5 10.09
PLP–TIM Quail/Dog/Weke/ 19/0.014 Cable 1/95
8.7 10.3/12.6/ 16.6
11.5 8.7
Communications VHF UHF Analogue UHF Digital Fibre Optic
TIM VHF for voice traffic None NST–MEC MEC–WDK (back up to fibre link break)
FO to WDK and back thru GRM/HNT to NST
GRM/HNT/NST VHF for voice traffic None NST–MEC MEC–WDK (back up to fibre link break)
FO to WDK via a ring NST–WDK and NST–HNT–GRM–TIM–WDK
PAR VHF for voice traffic None PAR–MEC MEC–WDK
None
PLP VHF for voice traffic None PLP–BRC BRC–MEC MEC–WDK
None
SCADA Supervision Control Automation Data Acquisition
TIM Current, voltage and CB status at TIM. Security at TIM.
TIM 11 kV CB control, though presently done thru TP. No remote control of 33 kV reclosers. TIM ripple on Abbey RTU to WDK via landline.
CB control
Load data at TIM
GRM/HNT/NST Current, voltage and CB status. Security.
CB control CB control Load data
PAR Current, Voltage and CB status. Security.
CB control and transformer control
CB control Load data
PLP Current, voltage and CB status. Security.
CB Control CB control Load data
Both PAR and PLP have an SEL 3032 to connect to IEDs as detailed in Table 9.2.

Alpine Energy Limited Major Network Asset Management Plan 2015 to 2025
78 | P a g e
The capacity constraints on our network in the Timaru, Pareora and Pleasant Point areas are
shown in Table 9.3.
Table 9.3 Network Constraints
Area of Network with Constraint
Capacity Constraint Description Intended Remedy
Timaru Highfield (TIM2952)
feeder loading
Heavily loaded feeder Long term establish West End zone substation off 33 kV TIM GXP (timing uncertain).
Morgans Rd feeder
(TIM2702) loading
Heavily loaded feeder Long term establish West End substation off 33 kV TIM GXP (timing uncertain).
Levels feeder (TIM2852)
loading
Heavily loaded feeder Long term establish West End zone substation off 33 kV TIM GXP (timing uncertain).
Mountainview feeder
(TIM2712) loading
Heavily loaded feeder Long term establish West End zone substation off 33 kV TIM GXP (timing uncertain).
Timaru sub–transmission to CBD
Heavy cable loadings Establish city 33/11 zone substation off 33 kV TIM GXP (timing uncertain).
Pareora Pareora 1 and 2, 33 kV line regulation
Voltage constraint over 7 MVA of load (6% volt
drop)
Planned releases shift some load to TIM and STU (as required). Fault response depends on load, shift loads as possible, non–supply if situation arises. Rebuild sub–transmission in iodine; currently underway but will take four years (requires new pole positions). Rebuild No. 2 first as it is more aged. Establish new STA GXP for partial load transfer (2018–19).
Pleasant Point
Pleasant Point T1 At present suitable, large connection enquiries in Totara Valley area cannot be met. Any new transformer to be selectable between Dyn11 and Dzn0 to suit TIM 33 kV GXP.
Larger transformer, or second or new substation at Totara Valley for load transfer (timing uncertain).

Alpine Energy Limited Major Network Asset Management Plan 2015 to 2025
79 | P a g e
Table 9.4 lists the existing level of security at the substation and discussion on shortfall from
target security.
Table 9.4 Security Level
Security Level
Zone Sub/Load Centre
Actual Target Shortfall from Target
TIM 33 kV step up zone substation
N–0.7 N–0.75 Two step up transformers that feed a split 33 kV bus arrangement. PAR on each side of bus and have full redundancy available to the lines. PLP is fed off one bus, short duration loss can occur, with a loss to that 33 kV bus, until a tie is made to the remaining 33 kV bus.
Timaru Residential N–1 N–1 One additional feeder to TIM area was gained with TP changing its board. Lead out cables to first tee points were increased in size where possible.
Timaru Rural N–0.5 N–0.5 Limited fault back up from adjacent feeders from TIM and then as second resort PAR, PLP and TMK. Encourage consumers to be self–sufficient for their essentials. As for CD emergencies.
Washdyke/ Seadown
N–1 N–1 Capacity is only sufficient for N—1; as new substantial loads are established, investment in new sub–transmission feeders to SDW will be required. Install 33 kV cables from SDW to TIM to run at 11 kV.
Timaru CBD (GRM, HNT, and NST)
N–1 N–1 None
Redruth N–1 N–1 None
Port N–1 N–1 None
PLP via 11/33 kV step up zone substation at TIM
N–0.5 N on the remainder that cannot be transferred.
N–1 In 2015 up to 1 MW of dairy load will come on from Waitohi area. Majority of new load increase likely in Totara Valley area. The 11 kV feeders from PLP to Totara Valley are too long to support major growth in irrigation. Consider investment of Totara Valley substation. A Totara Valley substation could halve the PLP substation load. Some load can be transferred from PLP to ABY, TMK and TIM in an emergency. Encourage consumers to be self–sufficient for their essentials. As for CD emergencies.
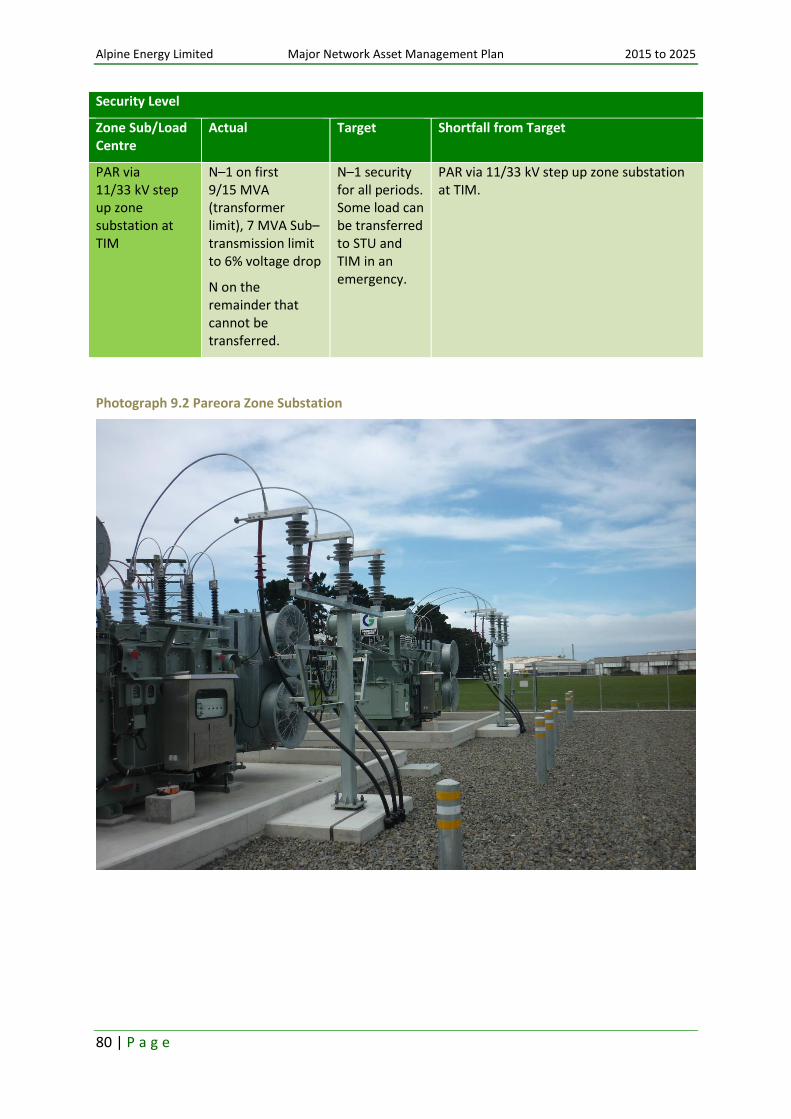
Alpine Energy Limited Major Network Asset Management Plan 2015 to 2025
80 | P a g e
Photograph 9.2 Pareora Zone Substation
Security Level
Zone Sub/Load Centre
Actual Target Shortfall from Target
PAR via 11/33 kV step up zone substation at TIM
N–1 on first 9/15 MVA (transformer limit), 7 MVA Sub–transmission limit to 6% voltage drop
N on the remainder that cannot be transferred.
N–1 security for all periods. Some load can be transferred to STU and TIM in an emergency.
PAR via 11/33 kV step up zone substation at TIM.
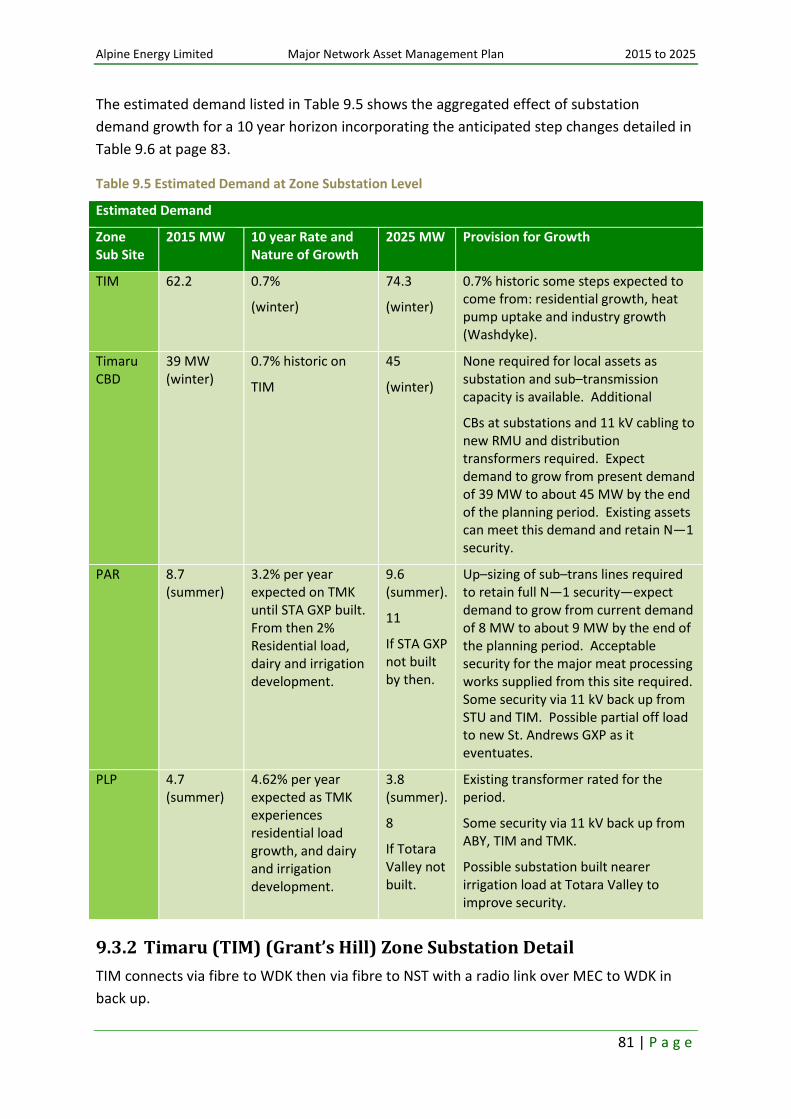
Alpine Energy Limited Major Network Asset Management Plan 2015 to 2025
81 | P a g e
The estimated demand listed in Table 9.5 shows the aggregated effect of substation
demand growth for a 10 year horizon incorporating the anticipated step changes detailed in
Table 9.6 at page 83.
Table 9.5 Estimated Demand at Zone Substation Level
Estimated Demand
Zone Sub Site
2015 MW 10 year Rate and Nature of Growth
2025 MW Provision for Growth
TIM 62.2 0.7%
(winter)
74.3
(winter)
0.7% historic some steps expected to come from: residential growth, heat pump uptake and industry growth (Washdyke).
Timaru CBD
39 MW (winter)
0.7% historic on
TIM
45
(winter)
None required for local assets as substation and sub–transmission capacity is available. Additional
CBs at substations and 11 kV cabling to new RMU and distribution transformers required. Expect demand to grow from present demand of 39 MW to about 45 MW by the end of the planning period. Existing assets can meet this demand and retain N—1 security.
PAR 8.7 (summer)
3.2% per year expected on TMK until STA GXP built. From then 2% Residential load, dairy and irrigation development.
9.6 (summer).
11
If STA GXP not built by then.
Up–sizing of sub–trans lines required to retain full N—1 security—expect demand to grow from current demand of 8 MW to about 9 MW by the end of the planning period. Acceptable security for the major meat processing works supplied from this site required. Some security via 11 kV back up from STU and TIM. Possible partial off load to new St. Andrews GXP as it eventuates.
PLP 4.7 (summer)
4.62% per year expected as TMK experiences residential load growth, and dairy and irrigation development.
3.8 (summer).
8
If Totara Valley not built.
Existing transformer rated for the period.
Some security via 11 kV back up from ABY, TIM and TMK.
Possible substation built nearer irrigation load at Totara Valley to improve security.
9.3.2 Timaru (TIM) (Grant’s Hill) Zone Substation Detail
TIM connects via fibre to WDK then via fibre to NST with a radio link over MEC to WDK in
back up.
Alpine Energy Limited Major Network Asset Management Plan 2015 to 2025
82 | P a g e
There is a small amount of traffic on the Cu twisted pair cable. TIM–WDK, mainly collects
information from the three 33 kV reclosers and operates the ripple plant.
The main SCADA system is three SEL 3530 to connect to IEDs. Abbey RTU is used to control
the ripple plant. There is also a small amount of data from the TP data bridge, mainly for
ripple plant control off RevM.
9.3.3 Grasmere (GRM) and Hunt St (HNT) and North St (NST) Zone Switching Station Detail
Grasmere (GRM), Hunt St (HNT) and North St (NST) are switching stations which mean the
stations perform important switching, protection, and SCADA operations but do not
transform voltages as for zone substations. Whilst NST is presently a switching station there
is space to fit 33/11 kV transformers when the sub–transmission is livened at 33 kV
categorising NST as a zone substation. Please note that these three ‘switching stations’ are
treated as ‘zone substations’ as far as operating and maintenance are concerned
GRM/HNT/NST connects via fibre to WDK then via fibre to NST with a radio link over MEC to
WDK in back up.
NST is serviced with Chorus telephone and fax. A broadband connection is available over
Chorus’ services.
There is a small amount of traffic on the Cu twisted pair cable HNT and Victoria (VIC) to
WDK, it mainly collects information from the HNT 11 kV feeders and VIC building alarms.
Each of GRM/HNT/NST has two SEL 3530 to connect to IEDs.
HNT remote control of feeder CBs is over the Cu twisted pair cable. HNT sub–transmission
is on fibre/3035.

Alpine Energy Limited Major Network Asset Management Plan 2015 to 2025
83 | P a g e
9.4 Development of GXP and Substations
Figure 9.2 below shows the TIM load growth.
Figure 9.2 Load Growth for Timaru GXP
Table 9.6 shows the growth trend to the year 2025.
Table 9.6 Timaru 110 kV Bus Load Growth
GXP
Substation
(Season
Peak)
Growth Trend (Total MW MD)
2015 2016 2017 2018 2019 2020 2021 2022 2023 2024 2025
TIM 110 kV
(Summer) 125.9 130.3 133.1 135.1 134.8 139.9 140.5 89.0 90.6 92.2 101.8
Figure 9.3 on page 84 shows the TIM 110 kV bus growth trend, security level and capacity.
An initial Solution Study Report (SSR) undertaken by Transpower promotes a 220/33 kV GXP
be built to extend the useful life of the T5 and T8 220/110 kV interconnectors. With us
delaying the introduction of the 33 kV GXP, the interconnectors will require further
examination by Transpower.
These inter–connection transformers supply the growing loads of ABY, TKA, TMK, and TIM.
On occasion additional load is required to be supplied south to BPD, STU, and OAM. During
TIM0111 Trend y = 0.0363x + 56.344
40
50
60
70
80
90
100
01
-Ap
r-9
7
01
-De
c-9
7
01
-Au
g-9
8
01
-Ap
r-9
9
01
-De
c-9
9
01
-Au
g-0
0
01
-Ap
r-0
1
01
-De
c-0
1
01
-Au
g-0
2
01
-Ap
r-0
3
01
-De
c-0
3
01
-Au
g-0
4
01
-Ap
r-0
5
01
-De
c-0
5
01
-Au
g-0
6
01
-Ap
r-0
7
01
-De
c-0
7
01
-Au
g-0
8
01
-Ap
r-0
9
01
-De
c-0
9
01
-Au
g-1
0
01
-Ap
r-1
1
01
-De
c-1
1
01
-Au
g-1
2
01
-Ap
r-1
3
01
-De
c-1
3
Dem
and
(M
W)
Month
Timaru GXP Load Growth
TIM0111
Linear (TIM Peaks)
N Limit
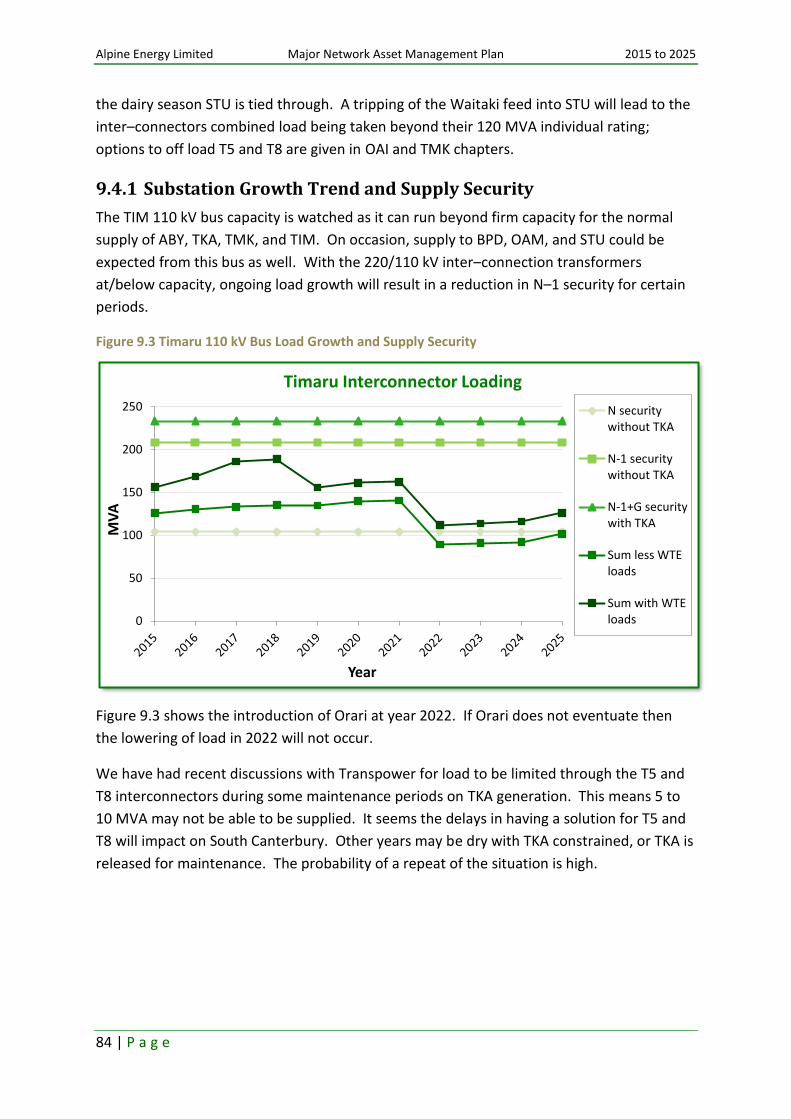
Alpine Energy Limited Major Network Asset Management Plan 2015 to 2025
84 | P a g e
the dairy season STU is tied through. A tripping of the Waitaki feed into STU will lead to the
inter–connectors combined load being taken beyond their 120 MVA individual rating;
options to off load T5 and T8 are given in OAI and TMK chapters.
9.4.1 Substation Growth Trend and Supply Security
The TIM 110 kV bus capacity is watched as it can run beyond firm capacity for the normal
supply of ABY, TKA, TMK, and TIM. On occasion, supply to BPD, OAM, and STU could be
expected from this bus as well. With the 220/110 kV inter–connection transformers
at/below capacity, ongoing load growth will result in a reduction in N–1 security for certain
periods.
Figure 9.3 Timaru 110 kV Bus Load Growth and Supply Security
Figure 9.3 shows the introduction of Orari at year 2022. If Orari does not eventuate then
the lowering of load in 2022 will not occur.
We have had recent discussions with Transpower for load to be limited through the T5 and
T8 interconnectors during some maintenance periods on TKA generation. This means 5 to
10 MVA may not be able to be supplied. It seems the delays in having a solution for T5 and
T8 will impact on South Canterbury. Other years may be dry with TKA constrained, or TKA is
released for maintenance. The probability of a repeat of the situation is high.
0
50
100
150
200
250
MV
A
Year
Timaru Interconnector Loading
N securitywithout TKA
N-1 securitywithout TKA
N-1+G securitywith TKA
Sum less WTEloads
Sum with WTEloads

Alpine Energy Limited Major Network Asset Management Plan 2015 to 2025
85 | P a g e
Table 9.7 shows the growth trend by year for Timaru.
Table 9.7 TIM Substation Load Growth
GXP Substation (Season Peak)
Growth Trend (Total MW MD)
2015 2016 2017 2018 2019 2020 2021 2022 2023 2024 2025
TIM 11 kV (Winter) 70.3 72.2 73.8 74.5 72.1 72.8 71.6 72.2 72.9 73.6 74.3
Transpower have installed three new supply transformers to run off two of these three with
the third on hot standby. The TIM 11 kV GXP has plenty of capacity for the planning period,
even with the known developments.
The 11 kV switch board was replaced in early 2012. The new board has been arranged to
suit our needs for capacity and additional CBs to allow the new 33 kV rated sub transmission
cables for the CBD to be connected and run at 11 kV for a period of some years. That is until
a significant load growth is realised to justify the introduction of a 33 kV GXP.
Figure 9.4 shows the Timaru area growth trend, security level and capacity.
Figure 9.4 Timaru Area Load Growth and Supply Security
Table 9.8 Substation Load Growth
GXP Substation (Season Peak)
Growth Trend (Total MW MD)
2015 2016 2017 2018 2019 2020 2021 2022 2023 2024 2025
PAR 9.04 9.23 9.41 9.60 8.59 8.76 8.94 9.12 9.30 9.48 9.67
PLP 5.9 6.0 6.1 6.2 6.3 6.5 4.6 4.7 4.8 4.9 5.0
0
20
40
60
80
100
120
Load
(M
W)
Year
Timaru Area Growth Trend
N-1security11 kVTimaruTotal

Alpine Energy Limited Major Network Asset Management Plan 2015 to 2025
86 | P a g e
Figure 9.5 and Figure 9.6 show PAR and PLP area’s growth trend, security level and capacity.
PLP assumes the introduction of a zone substation in Totara Valley. See further details on
Totara Valley under ABY GXP in chapter 2.
Figure 9.5 Pareora Substation Load Growth and Supply Security
Figure 9.5 shows the introduction of St. Andrews substation at year 2022. If St. Andrews
does not eventuate then the lowering of load in 2022 will not occur.
Figure 9.6 Pleasant Point Load Growth and Supply Security
Figure 9.6 shows the introduction of Totara Valley substation at year 2022. If Totara Valley
does not eventuate then the lowering of load in 2021 will not occur.
0.00
4.00
8.00
12.00
16.00
20.00
Load
(M
W)
Year
Pareora Substation
N security
N-1Security
TotalLoading
0
1
2
3
4
5
6
7
Load
(M
W)
Year
Pleasant Point Substation
N security
TotalLoading

Alpine Energy Limited Major Network Asset Management Plan 2015 to 2025
87 | P a g e
9.4.2 Rate and Nature of GXP Growth and Provisions Made
Table 9.9 summarises the characteristic of the growth and summarises the plans to meet
the energy requirements of the growth.
Table 9.9 Growth and Response
Zone sub Rate and nature of growth Provisions for growth
TIM High—Industrial/commercial GXP investment
PAR High—Dairy and irrigation Zone substation and sub–transmission investment
PLP High—Dairy and irrigation Zone substation and sub–transmission investment at Totara Valley
9.4.3 Specific Developments
9.4.3.1 Timaru CBD and Residential Areas
The Timaru CBD supply is being monitored. We have postponed the introduction of a 33 kV
GXP as a large load that was expected did not eventuate. Some other smaller projects are
delayed.
In the meantime we have strengthened the 11 kV sub–transmission to the CBD. This was
done with the use of 33 kV cables to the new NST zone substation, which in the meantime
are being operated at 11 kV.
9.4.3.2 Timaru—Hunt Street
HNT was built in 1984 and is in good condition, vacuum circuit breakers (VCBs) are fitted.
All the sub–transmission protection is now microprocessor based while the feeders are still
electronic static type equipment. This type of board has a nominal 40 year life; replacement
should be considered in 2024.
The feeder protection and control equipment is at the end of life being more than 20 years
old. This is planned to be replaced in 2014/15 with SEL 751A + 55IC back up.
9.4.4 Timaru 11/33 kV Step–Up Substation
Limitations within the equipment in the Timaru step–up substation (involving; the existing
33 kV switchgear, Neutral Earthing Transformers (NETs) and protection) were originally
expected to be eliminated with the proposed new 33 kV GXP at TIM. As this proposed 33 kV
GXP has been delayed indefinitely it is now necessary to upgrade the existing Timaru
11/33 kV step–up substation to provide adequate protection and control for the Timaru
19/25 MVA 11/33 kV step–up transformers and the three 33 kV sub–transmission lines
(PAR–TIM 1, PAR–TIM 2, and PLP–TIM).
The downstream PAR and PLP 33/11 kV substations are suitable for the immediate future. A
watch is being held on PLP’s transformer.

Alpine Energy Limited Major Network Asset Management Plan 2015 to 2025
88 | P a g e
Further studies on our Timaru 11/33 kV step–up substation are required.
9.4.4.1 PAR–TIM 33 kV Sub–transmission Lines No.1 and No.2 Upgrade
In 2010, load flows indicate that the existing 33 kV PAR–TIM line conductors were capable
of delivering 6.8 and 6.9 MVA respectively for line 1 and 2 with a 6% voltage regulation,
beyond this there was a marked drop in voltage leading to voltage collapse. The line should
only be operated to just under 7 MVA. A five year re–conductoring exercise is being
undertaken to increase the line rating to beyond 10 MVA. Re–conductoring the 33 kV lines
(presently Quail/Mink) with Iodine will lift the line ratings to 10.7 and 10.1 MVA
respectively.
9.4.5 Issues Arising from Estimated Demand
In December 2013 Transpower raised capacity constraints on TIM’s T5 and T8 main
220/110 kV inter–connection transformers. This was identified during studies for the TKA
generator release for canal repairs, we have been asked to be able to shed load for
contingent events.
Notes:

Alpine Energy Limited Major Network Asset Management Plan 2015 to 2025
89 | P a g e
10 Twizel Grid Exit Point
10.1 Introduction
Figure 1.4 at page 10, shows how Twizel GXP (TWZ) is configured with our network and
Transpower’s transmission network. TWZ is supplied off the 220 kV Twizel bus.
10.2 GXP Description
Similar to Tekapo, TWZ is supplied from a single source Transpower 33 kV CB feeder onto
our short overhead line into its TWZ zone substation. We have an indoor 11 kV switchboard
with two feeders supplying Twizel township and two additional feeders supplying the
surrounding rural area.
Subdivision development is very popular and there is also potential for irrigation scheme
development. However, we have not yet seen a lot of actual load growth from these
initiatives. An embedded network operator is active in also providing supply to new
developments in this area at two network supply points (NSP) at Manuka Terrace and
Mackenzie Park.
Photograph 10.1 Twizel Village Zone Substation Maintenance—Transformer Swap–out Day
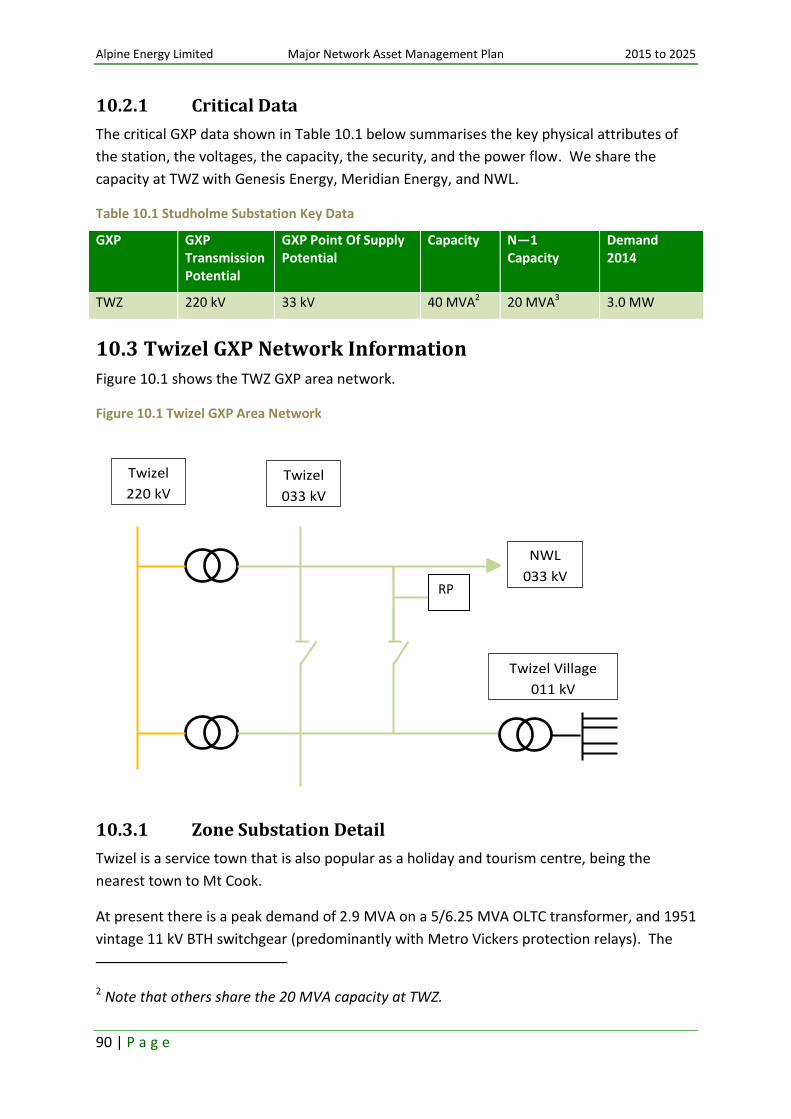
Alpine Energy Limited Major Network Asset Management Plan 2015 to 2025
90 | P a g e
10.2.1 Critical Data
The critical GXP data shown in Table 10.1 below summarises the key physical attributes of
the station, the voltages, the capacity, the security, and the power flow. We share the
capacity at TWZ with Genesis Energy, Meridian Energy, and NWL.
Table 10.1 Studholme Substation Key Data
GXP GXP Transmission Potential
GXP Point Of Supply Potential
Capacity N—1 Capacity
Demand 2014
TWZ 220 kV 33 kV 40 MVA2 20 MVA3 3.0 MW
10.3 Twizel GXP Network Information
Figure 10.1 shows the TWZ GXP area network.
Figure 10.1 Twizel GXP Area Network
10.3.1 Zone Substation Detail
Twizel is a service town that is also popular as a holiday and tourism centre, being the
nearest town to Mt Cook.
At present there is a peak demand of 2.9 MVA on a 5/6.25 MVA OLTC transformer, and 1951
vintage 11 kV BTH switchgear (predominantly with Metro Vickers protection relays). The
2 Note that others share the 20 MVA capacity at TWZ.
Twizel
220 kV
Twizel
033 kV
Twizel Village
011 kV
NWL
033 kV RP
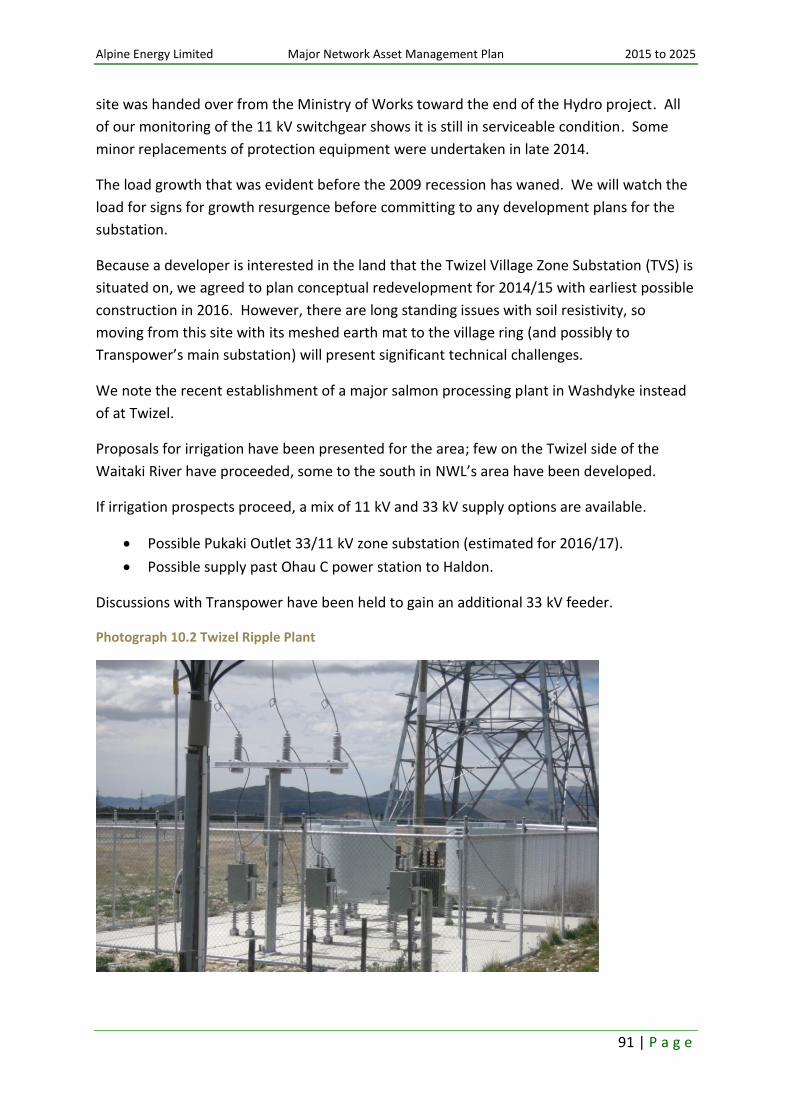
Alpine Energy Limited Major Network Asset Management Plan 2015 to 2025
91 | P a g e
site was handed over from the Ministry of Works toward the end of the Hydro project. All
of our monitoring of the 11 kV switchgear shows it is still in serviceable condition. Some
minor replacements of protection equipment were undertaken in late 2014.
The load growth that was evident before the 2009 recession has waned. We will watch the
load for signs for growth resurgence before committing to any development plans for the
substation.
Because a developer is interested in the land that the Twizel Village Zone Substation (TVS) is
situated on, we agreed to plan conceptual redevelopment for 2014/15 with earliest possible
construction in 2016. However, there are long standing issues with soil resistivity, so
moving from this site with its meshed earth mat to the village ring (and possibly to
Transpower’s main substation) will present significant technical challenges.
We note the recent establishment of a major salmon processing plant in Washdyke instead
of at Twizel.
Proposals for irrigation have been presented for the area; few on the Twizel side of the
Waitaki River have proceeded, some to the south in NWL’s area have been developed.
If irrigation prospects proceed, a mix of 11 kV and 33 kV supply options are available.
Possible Pukaki Outlet 33/11 kV zone substation (estimated for 2016/17).
Possible supply past Ohau C power station to Haldon.
Discussions with Transpower have been held to gain an additional 33 kV feeder.
Photograph 10.2 Twizel Ripple Plant

Alpine Energy Limited Major Network Asset Management Plan 2015 to 2025
92 | P a g e
The zone substation and sub–transmission key data for Twizel shown in Table 10.2 details
the major assets with respect to; rating, age, and general condition. The maximum demand
at the various substations is provided. The table also details capacity constraints, the
substation’s communication systems back to Meadows Rd and the SCADA functions.
Table 10.2 Zone Substation Key Data
Zone Substation Site
Transformer Regulator Switchgear Ripple Plant
TWZ 1x 5/6.25 MVA T1 OLTC (1972)
Good
1x 3 MVA
(1964)
Fair
(off line spare)
1x 33 kV OCB
(1960) Poor
8x 11 kV OCBs
(1951)
Fair
438 Hz Landis and Gyr (shared with NWL, but we have no effective access)
Sub–Transmission Line
Make Up Limit at 6% p.d. (MVA)
Limit of Conductor at 50⁰C (MVA)
Limit of Cable (MVA)
Lowest Limit
TVS–TWZ Dog 82.48 12.6 12.6
Area of Network with Constraint
Capacity Constraint Description Intended Remedy
Twizel GXP None
Twizel Village Sub (TVS)
None
Communications VHF UHF Analogue
UHF Digital Fibre Optic
TVS VHF for voice traffic TVS–MRC
MRC–WDK
None
SCADA Supervision Control Automation Data Acquisition
TVS Current, voltage and CB status at TVS. Security at TVS
TVS CB control. TVS pilot wire control.
Auto reclosing CB Load data at TVS
TVS connects via radio systems detailed under communications in Table 10.2. A radio was
being established at TVS–TWZ for ripple plant control, the project waned when the ripple
plant was found to be unsuitable for both NWL and our use. For TVS SCADA consists of L&N
C68 RTU equipment.

Alpine Energy Limited Major Network Asset Management Plan 2015 to 2025
93 | P a g e
The legacy RTU and analogue UHF radio comms may be replaced in 2015 with more modern
digital equipment when the same type of equipment at TEK is replaced as both TVS, and TEK
substations use the same leased UHF radio link equipment at Mt Rollesby.
Table 10.3 lists the existing level of security at the substation and justifies any shortfall.
Table 10.3 Security Level
Security Level
Zone Sub/Load Centre
Actual Target Shortfall from Target
Twizel CBD N—0.5 N—0.5 No alternate supply to station.
Limited 11 kV rings.
Encourage consumers to be self–sufficient for their essentials. As for CD emergencies.
Twizel Rural N N Limited fault backup
Encourage consumers to be self–sufficient for their essentials. As for CD emergencies.
The estimated demand listed in Table 10.4 shows the aggregated effect of substation
demand growth for a 10 year horizon incorporating the anticipated step changes detailed in
Table 10.5.
Table 10.4 TVS Estimated Demand at Zone Substation Level
Estimated Demand
Zone Sub Site
2015 MW 10 year Rate and Nature of Growth
2025 MW Provision for Growth
TVS 3.3 (shoulder)
2.26% historic on TWZ
Residential load,
large scale subdivision,
dairy and irrigation development.
4.2 (shoulder)
Possibly rebuild substation in conjunction with developer to free land.
Extend 33 kV line to new irrigation development and install smaller dedicated substations.

Alpine Energy Limited Major Network Asset Management Plan 2015 to 2025
94 | P a g e
10.4 Development of GXP and Substations
Figure 10.2 shows the TWZ load growth.
Figure 10.2 Load Growth for Twizel GXP
Table 10.5 shows the growth trend to the year 2025.
Table 10.5 Substation Load Growth
GXP Substation (Season Peak)
Growth Trend (Total MW MD)
2015 2016 2017 2018 2019 2020 2021 2022 2023 2024 2025
TWZ Sum (Autumn/ Spring)
3.2 3.7 8.1 9.5 9.9 10.4 10.8 10.9 10.9 11.0 11.1
TVS Village 3.7 8.1 9.6 10.0 10.5 10.9 11.3 11.4 11.5 11.6 11.7
Irrigation on 33 kV
0.4 4.7 6.1 6.4 6.8 7.1 7.5 7.5 7.5 7.5 7.5
Note—the 20 MVA firm capacity is shared with Meridian Energy and NWL.
TWZ0331 Trend y = 0.0058x + 1.8547
1
1.5
2
2.5
3
3.5
4
4.5
5
5.5
6
01
-Ap
r-9
7
01
-De
c-9
7
01
-Au
g-9
8
01
-Ap
r-9
9
01
-De
c-9
9
01
-Au
g-0
0
01
-Ap
r-0
1
01
-De
c-0
1
01
-Au
g-0
2
01
-Ap
r-0
3
01
-De
c-0
3
01
-Au
g-0
4
01
-Ap
r-0
5
01
-De
c-0
5
01
-Au
g-0
6
01
-Ap
r-0
7
01
-De
c-0
7
01
-Au
g-0
8
01
-Ap
r-0
9
01
-De
c-0
9
01
-Au
g-1
0
01
-Ap
r-1
1
01
-De
c-1
1
01
-Au
g-1
2
01
-Ap
r-1
3
01
-De
c-1
3
Dem
and
(M
W)
Month
Twizel GXP Load Growth
TWZ0331
Linear (TWZ Peaks)
N Limit
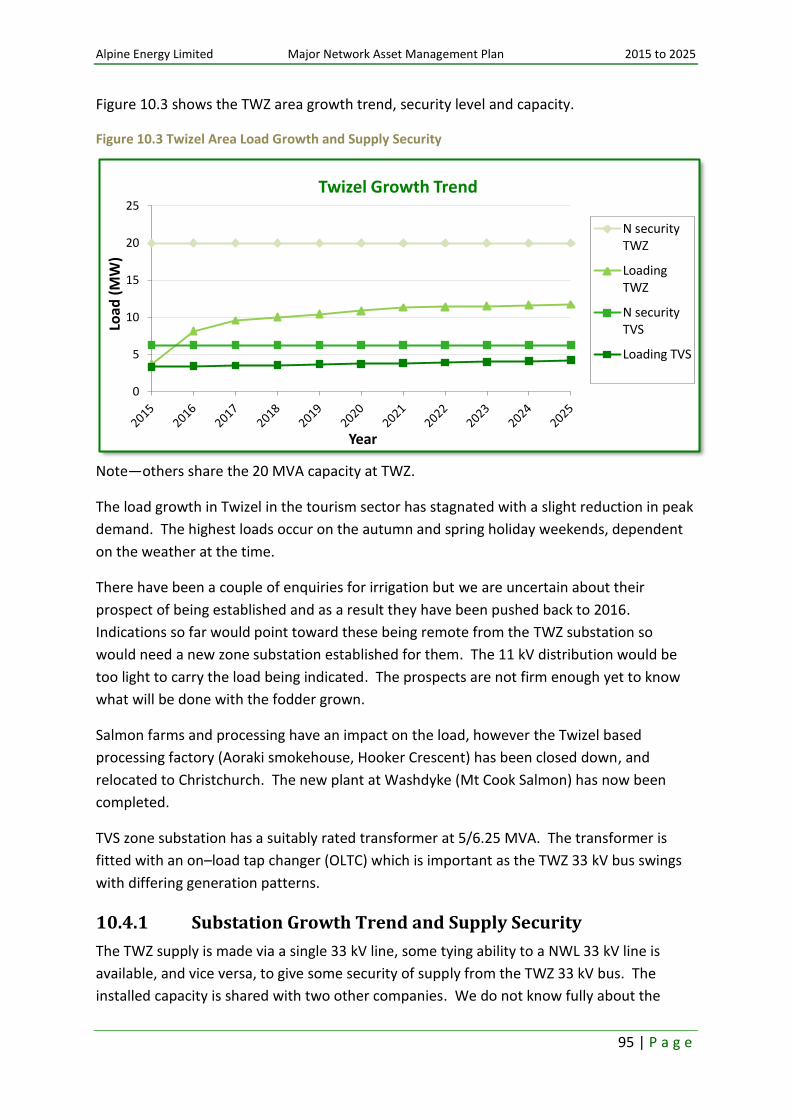
Alpine Energy Limited Major Network Asset Management Plan 2015 to 2025
95 | P a g e
Figure 10.3 shows the TWZ area growth trend, security level and capacity.
Figure 10.3 Twizel Area Load Growth and Supply Security
Note—others share the 20 MVA capacity at TWZ.
The load growth in Twizel in the tourism sector has stagnated with a slight reduction in peak
demand. The highest loads occur on the autumn and spring holiday weekends, dependent
on the weather at the time.
There have been a couple of enquiries for irrigation but we are uncertain about their
prospect of being established and as a result they have been pushed back to 2016.
Indications so far would point toward these being remote from the TWZ substation so
would need a new zone substation established for them. The 11 kV distribution would be
too light to carry the load being indicated. The prospects are not firm enough yet to know
what will be done with the fodder grown.
Salmon farms and processing have an impact on the load, however the Twizel based
processing factory (Aoraki smokehouse, Hooker Crescent) has been closed down, and
relocated to Christchurch. The new plant at Washdyke (Mt Cook Salmon) has now been
completed.
TVS zone substation has a suitably rated transformer at 5/6.25 MVA. The transformer is
fitted with an on–load tap changer (OLTC) which is important as the TWZ 33 kV bus swings
with differing generation patterns.
10.4.1 Substation Growth Trend and Supply Security
The TWZ supply is made via a single 33 kV line, some tying ability to a NWL 33 kV line is
available, and vice versa, to give some security of supply from the TWZ 33 kV bus. The
installed capacity is shared with two other companies. We do not know fully about the
0
5
10
15
20
25
Load
(M
W)
Year
Twizel Growth Trend
N securityTWZ
LoadingTWZ
N securityTVS
Loading TVS

Alpine Energy Limited Major Network Asset Management Plan 2015 to 2025
96 | P a g e
other companies’ intentions and assumes the supply capacity is secure for the planning
period.
10.4.2 Rate and Nature of GXP Growth and Provisions Made
Table 10.6 describes the rate and nature of growth at the GXP level as well as provision for
growth.
Table 10.6 Growth and Response
GXP Rate and nature of growth Provisions for growth
TWZ Med—Rural and subdivision GXP investment
10.4.3 Specific Developments
10.4.3.1 Twizel GXP Development
Transpower’s TWZ 33 kV GXP bus is run split, and is fed from two 20 MVA OCTC 220/33 kV
transformers. The 33 kV bus was originally split as the 33/11 kV construction transformers
for the hydro were not able to withstand the full fault level. Transpower suggests the split
avoids incidences on the 33 kV bus, causing instability on the 220 kV bus. There is no 33 kV
bus coupler or bus bar protection so running the bus tied would be problematic during a
fault.
Our supply is not as secure as a tied bus arrangement, but this has been of little concern as
the outage rate is very low. If a supply transformer is lost or released Transpower can easily
tie the two bus halves to the remaining transformer.
A sole 33 kV feeder is taken from the TWZ switching station to the TVS zone substation on
the edge of Twizel. Preliminary discussions have been held with Transpower regarding the
option of taking a second feeder.
The taking of a second feeder is not straight forward as the Transpower split of the 33 kV
bus will inhibit either:
i) the ability for use to run a solid bus should supply be taken from either side of the
Transpower bus, or
ii) bus tying in the zone substation as we may end up with a slightly less secure supply if
both feeders are connected to the same side of the bus.
Transpower is in agreement that if we fit suitable protection at the far end of the feeders
with back–feed protection then, a tie would be allowed in our zone substation.
More analysis is required to determine the best path forward for Twizel.
Prior to set off, a view on how quickly the loads may be growing will have to be established
from both the residential and irrigation demands. Transpower has programmed to
Alpine Energy Limited Major Network Asset Management Plan 2015 to 2025
97 | P a g e
investigate moving the 33 kV outdoor switchgear indoors. At that time a second 33 kV
feeder to TVS substation would also be evaluated.
Any project at Twizel will be funded via a new investment agreement with Transpower.
10.4.3.2 Twizel Zone Sub Development
Please refer to Zone Substation Detail on page 90.
10.4.3.3 Ripple Plant Upgrade
A shared ripple plant had been established at TWZ with NWL. Its frequency is equal to
NWL’s as it holds the larger population of ripple receivers. With the TWZ 33 kV bus being
run split and NWL being on the ‘other side’ we have not been able to use the plant. This is
because the plant does not have sufficient power to pass signal through T18 and T19.
Future ripple plant development will in time allow time clocks at TWZ to be replaced with
more reliable ripple relays and security for load control in the Waitaki area.
10.4.4 Issues Arising from Estimated Demand
We have an N security supply at TWZ with ability to tie to NWL’s feeder or to provide a
reciprocal connection in case of NWL loss.
Transpower can also tie its 33 kV bus to connect our feeder to the alternate GXP
transformer.
Our attempt to gain a second feeder from Transpower proved uneconomic so will be
reviewed when Transpower replaces the outdoor 33 kV switchgear with indoor.
Alpine Energy Limited Major Network Asset Management Plan 2015 to 2025
98 | P a g e
Notes:
Alpine Energy Limited Major Network Asset Management Plan 2015 to 2025
99 | P a g e
11 Waihao Grid Exit Point
11.1 Introduction
Figure 1.5 page 11, shows how the proposed Waihao (WHO) GXP would be configured on
the ISL–LIV 220 kV Line.
11.2 GXP Description
WHO is proposed to allow supply to the increasing loads in the Waimate district. WHO
would supply BPD, CNR and STU (Waimate). The net capacity off loaded from the grid at
BPD, and STU will be requested to be supplied at STA (for details see chapter 5).
WHO’s transformers will primarily drop 220 to 110 kV. These transformers have a stabilising
winding which will be configured to 11 kV and supply a bus for local 11 kV distribution.
We had been working with NWL, and Transpower on an alternate supply into the Lower
Waitaki Valley area; Transpower have offered a connection to the ISL–LIV 220 kV circuit with
a limit of 50 to 70 MVA. This would not be until the OAI 220 kV bussing project is built, only
then will more capacity be available. The loads that we envisage total more than the initial
limit, so the timing of OAI’s construction is important to enable the completion of certain
projects within South Canterbury.
If we were to have shared the new Livingston GXP with NWL, both would have to agree on
the same bus potential. With us focussing on 110 kV and NWL on 66 kV there is no
commonality.
Another option was explored to establish the new shared GXP at Stone Wall; this became
less attractive to NWL as it moved further from NWL’s load centres. It also did not suit us to
supply the burgeoning STU site due to long line lengths and volt drop issues.
Establishing a GXP in the Waihao area becomes more beneficial to us with it being more
central to BPD, and STU. An initial study of the three options shows this to be the most cost
efficient to us.
NWL have slowed up its need by some years for a new GXP at Livingston, as the WTK GXP is
being reconfigured to offload NWL’s existing asset to some degree.

Alpine Energy Limited Major Network Asset Management Plan 2015 to 2025
100 | P a g e
11.2.1 Critical Data
The critical GXP data shown in Table 11.1 summarises the potential physical attributes of
the station, the voltages, the capacity, the security, and the power flow.
Table 11.1 Orari Zone Substation Key Data
GXP GXP Transmission Potential
GXP Point Of Supply Potential
Capacity N–1 Capacity Demand 2015
WHO 220 kV 110 kV Approx. 80 MVA
100 MVA 0 MW
11.3 Waihao GXP Network Information
Figure 11.1 shows the WHO GXP area key assets. The WHO GXP would deliver 110 kV sub–
transmission and local 11 kV distribution.
Figure 11.1 Waihao GXP Area Network
Waihao
110
Studholme/Waimate
Bell’s Pond
Cooneys Rd

Alpine Energy Limited Major Network Asset Management Plan 2015 to 2025
101 | P a g e
11.3.1 Waihao Zone Substation Detail
The zone substation key data shown in Table 11.2 details the major assets to be established
at WHO. The communication systems are also described.
Table 11.2 Waihao Zone Substation Key Data
Zone Substation Site
Transformer Regulator Switchgear Ripple Plant
WHO To be established Zellweger 317 Hz to be established
Communications VHF UHF Analogue UHF Digital Fibre Optic
WHO VHF for voice traffic None WHO–MEC MEC–CHC CHC–NST or WDK
TBA
WHO SCADA systems would adopt the technology of the time.
Table 11.3 lists the existing level of security at the substation and justifies any shortfall.
Table 11.3 Security Level
Security Level
Zone Sub/Load Centre
Actual Target Shortfall from Target
BPD, CNR & STU N–1 N–1 Encourage consumers to be self–sufficient for their essentials. As for CD emergencies.
The estimated demand listed in Table 11.4 shows the aggregated effect of substation
demand growth for a 10 year horizon incorporating the anticipated step changes detailed in
Table 11.5.
Table 11.4 Estimated Demand at Zone Substation Level
Estimated Demand
Zone Sub Site
2015 MW
10–year Rate and Nature of Growth 2025 MW
Provision for Growth
WHO 0
(summer)
3.6% per year expected at Waihao as per present growth at STU and BPD.
76
(summer)
Build to suit 10 year forecast.

Alpine Energy Limited Major Network Asset Management Plan 2015 to 2025
102 | P a g e
11.4 Development of GXP
Table 11.5 shows the growth trend to the year 2025 at Waihao. The main load growth is as
a result of the Hunter and Waihao Downs Irrigation schemes, and dairy factory load growth
to be picked up by us.
Table 11.5 Substation Load Growth
GXP Substation (Season Peak)
Growth Trend (Total MW MD)
2015 2016 2017 2018 2019 2020 2021 2022 2023 2024 2025
WHO
(Summer) 0.00 0.00 0.00 0.00 59.11 59.93 60.76 70.11 71.13 74.67 75.74
The date of introduction needs to be scheduled with load growth and demand need. Figure
11.2 plots the WHO load growth.
Figure 11.2 Waihao Growth Trend
0.00
50.00
100.00
150.00
200.00
250.00
Load
(M
W)
Year
Waihao Downs Area Growth Trend N security
N-1 security
WaihaoDowns 220kV
WaihaoDowns BPD
WaihaoDowns STU
WaihaoDowns 110kV
WaihaoDowns 11kV

Alpine Energy Limited Major Network Asset Management Plan 2015 to 2025
103 | P a g e
12 Glossary The following acronyms and abbreviations are used throughout the Major Network Asset
Management Plan.
A — Ampere
ABY — Albury grid exit point/zone substation
AMP — Asset Management Plan
AVR — Automatic Voltage Regulator
BML — Balmoral zone substation
BPD — Bell’s Pond grid exit point/zone substation
Bus — Bus Bars
CB — Circuit Breakers
CBD — Central Business District
cct — Circuit
CD — Civil Defence
CD1 — Clandeboye No.1 substation
CD2 — Clandeboye No.2 substation
CNR — Cooneys Road zone substation
CNL — Canal Road
CT — Current Transformer
Consumer — A person that consumes electricity from our network, or acquires electricity lines services
Customer — A body which we have a direct contractual relationship with, in the form of a user of supply agreement
Dyn11 — Transformer Vector Group
FLE — Fairlie zone substation
GLD — Geraldine Downs zone substation
GRM — Grasmere
GTN — Glentanner zone substation
GWh — Giga Watt hours
GXP — Grid Exit Point
HDI — Hunter Downs Irrigation scheme

Alpine Energy Limited Major Network Asset Management Plan 2015 to 2025
104 | P a g e
HLB — Haldon/Lilybank zone substation
HNT — Hunt Street zone substation
Hz — Hertz
IED — Intelligent Electronic Device
ISL–LIV — Islington Livingston
kV — kilo Volt
LOS — Loss of Supply
LV — Low Voltage
MDC — Mackenzie District Council
MVA — Mega Volt Ampere
MW — Mega Watt
NER — Neutral Earthing Resistor
NET — Neutral Earthing Transformer
NSP — Network Supply Points
NST — North Street zone substation
NWL — Network Waitaki Limited
N—1 — Reliability measure, where N systems can lose one element and still function normally
OAI — Orari grid exit point
OAM — Oamaru
OCB — Oil Circuit Breaker
OCTC — Off Current Tap Changer
ODL — Oceania Dairy Limited
OLTC — On Load Tap Changer
OPU — Opuha Power Station
PAR — Pareora zone substation
p.d. — Potential Difference
PD — Partial Discharge
PILC — Paper Insulated Lead Cable
PILCSWA — Paper Insulated Lead Steel Wire Armoured Cable
PLP — Pleasant Point zone substation

Alpine Energy Limited Major Network Asset Management Plan 2015 to 2025
105 | P a g e
POS — Point of Supply
RGA — Rangitata zone substation
RMU — Ring Main Unit
RTU — Remote Terminal Unit
SCADA — Supervisory Control and Data Acquisition
SEL — Schweitzer Engineering Laboratories
SSR — Solution Study Report
STA — St. Andrews grid exit point/zone substation
STU — Studholme grid exit point
TDC — Timaru District Council
TEK — Tekapo Village zone substation
TIM — Timaru grid exit point/step-up zone substation
TKA — Tekapo grid exit point
TMK — Temuka grid exit point/zone substation
TP — Transpower
TVS — Twizel Village zone substation
TWZ — Twizel grid exit point
UHF — Ultra High Frequency
UHT — Unwin Hut zone substation
V — Volts
VCB — Vacuum Circuit Breaker
VHF — Very High Frequency
W — Watts
WDC — Waimate District Council
WHO — Waihao grid exit point
WTE — Waimate zone substation
WTK — Waitaki
XLPE — Cross Linked Polyethylene Cable

Alpine Energy Limited Major Network Asset Management Plan 2015 to 2025
106 | P a g e
Notes:


Alpine Energy Limited Meadows Road PO Box 530, Timaru 7940 New Zealand
Tel: +64 3 687 4300 Fax: +64 3 684 8261 Web: www.alpineenergy.co.nz