Embed Size (px)
Citation preview

ILLINOIS STATE GEOLOGICAL SURVEY
3 3051 00005 3409
URBANA
Digitized by the Internet Archive
in 2012 with funding from
University of Illinois Urbana-Champaign
http://archive.org/details/majorminortracee60frye


60
ENVIRONMENTAL GEOLOGY NOTES
JANUARY 1973 • NUMBER 60
SURVEylidr.a
v yFEB 5 1973
Major, Minor, and Trace Elements in
Sediments of Late Pleistocene
Lake Saline Compared with Those
in Lake Michigan Sediments
John C. Frye and Neil F. Shimp
ILLINOIS STATE GEOLOGICAL SURVEYJOHN C. FRYEt Chief • Uvbana 61801
MAJOR, MINOR, AND TRACE ELEMENTS IN SEDIMENTS OF LATE PLEISTOCENE
LAKE SALINE COMPARED WITH THOSE IN LAKE MICHIGAN SEDIMENTS
John C. Frye and Neil F. Shimp
INTRODUCTION
During the past few years intensive studies have been made of thetrace and major' elements in the "bottom sediments of southern Lake Michigan( Shimp, Leland, and White, 1970; Ruch, Kennedy, and Shimp, 1970; Schleicherand Kuhn, 1970; Shimp et al. , 1971; and Kennedy, Ruch, and Shimp, 1971). Amajor objective of these studies has "been to determine the natural, pre-industrial, background concentrations of trace elements and the increase insuch elements in the uppermost layer of sediments deposited since citiesdeveloped on and near the lake shore.
Because the earth is a dynamically changing system, meaningfulbackground, or "natural," conditions are very difficult to determine. Insouthern Lake Michigan, the age of the glacial till that underlies the la-custrine sediments of the present lake is probably only slightly more than13,000 radiocarbon years before present. In addition, the lacustrine sed-iments analyzed were not sampled to their contact with the underlying till.The oldest chemical record from Lake Michigan sediments, therefore, is some-what less than 13,000 years old. Furthermore, as Lake Michigan sediments areonly slightly compacted and are locally thin, at least a slight possibilityexists that some pollutants have penetrated into the sediments below the sur-face layer, with a resultant distortion of what have been considered back-ground determinations.
One possible approach to obtaining additional data on chemicalbackground extending into Pleistocene time is to study deposits of aglacially fed lake that existed beyond the limit of Wisconsinan glaciersand received sediments during the times that glaciers occupied the basin ofLake Michigan. One such lake, now called Lake Saline, once existed in south-
- 1 -
- 2 -
eastern Illinois during the Wisconsinan Stage, and its history and deposits
have recently been studied (Frye et al., 1972).
The Lake Saline deposits are particularly suitable for extending
the chemical background because (l) the water and sediments of the lake came
from the glacial lobes to the north and northeast, (2) the sediments are pre-dominantly clay and silt and therefore can be studied by the same techniquesused for Lake Michigan bottom sediments, (3) the sediments have been dated byradiocarbon methods and stratigraphic correlation, and (k) the youngest de-posits of Lake Saline have been dated at 13,000 radiocarbon years B.P. (ISGS-
103), which is virtually the same age attributed to the oldest bottom sedimentsin southern Lake Michigan. Because glaciers not only occupied the basin ofLake Michigan but also extended far beyond its limits at the time Lake Salinesediment was accumulating, the source of sediment is not identical for the twolakes. However, the glacially derived sediments that fed Lake Saline camefrom the same general region as those deposited later in Lake Michigan, or
from the region to the northeast.
From the many samples collected and analyzed for clay minerals dur-ing the study of Lake Saline deposits, 22 were selected for chemical analysisof trace and major elements. The samples cover the span of time from 13,000radiocarbon years B.P. to 35»000 or more radiocarbon years B.P. , which is inthe Altonian Substage. Several other samples were selected, some from theyounger deposits formed by weathering of the lake deposits and some from de-posits on the lake plain that were produced by wash from the adjacent slopesand are called overwash deposits. The analytical data not only furnish back-ground information for trace element evaluation in pollution studies but alsoprovide a basis for comparing the Lake Saline deposits with weathered materials.
Chemical analyses were made by the Analytical Chemistry Section ofthe Illinois State Geological Survey; the methods employed were those des-cribed in Shimp, Leland, and White, 1970; Ruch , Kennedy, and Shimp, 1971; andKennedy, Ruch, and Shimp, 1971. Clay mineral analyses were made by H. D.
Glass for Illinois State Geological Survey Circular U71 (Frye et al., 1972).Radiocarbon dates were determined by D. D. Coleman. The stratigraphy of south-ern Lake Michigan bottom sediments and core descriptions were given in Grosset al., 1970 ; Lineback, Ayer , and Gross, 1970; Lineback et al. , 1971; Line-back, Gross, and Meyer, 1972; Gross et al. , 1972; and Lineback and Gross, 1972.
LAKE SALINE
The former Lake Saline existed intermittently during the WisconsinanStage of the Pleistocene Epoch in southeastern Illinois, largely in Gallatinand Saline Counties. As the location, history, and deposits of the lake haverecently been described in detail in Circular 1+71 (Frye et al. , 1972), descrip-tions will not be repeated here. Circular U71 contains a map of the lake;tables giving location, clay mineral analyses, radiocarbon dates, and texturalanalyses of all samples; descriptions of stratigraphic sections; and a list ofthe molluscan fossils found and their paleoecological implications. All sam-ple numbers noted here that are preceded by "P-" are fully described in theCircular.
- 3 -
In the basin of Lake Saline the southern limit of Illinoian glacia-tion was reached, but the sediments with which we are concerned here are ofWisconsinan and Holocene ages. The lake basin is slightly more than 100 milessouth of the southern limit of Wisconsinan glaciers in Illinois and was fed byglacial waters carrying outwash from the north via the Wabash River, and fromthe northeast by way of the Ohio River. The lake was an impoundment in pre-Wisconsinan tributary valleys and occurred back of "dams" of outwash depositsthat partly filled both the Wabash and Ohio River valleys.
When the ice retreated during the Farmdalian Substage, the lakelevel receded, leaving some of the lake deposits exposed to weathering anderosion, but when the extensive glacial advances during the Woodfordian Sub-stage took place, lake levels rose to their highest position and lake sedi-ments spread extensively over the earlier lake plain. All the lake depositsare classified within the Equality Formation (Willman and Frye, 1970), but as
the time sequence is of primary concern here, they will be referred to by thename of the time-stratigraphic unit in which they belong.
CHEMICAL COMPOSITION OF LAKE SALINE DEPOSITS
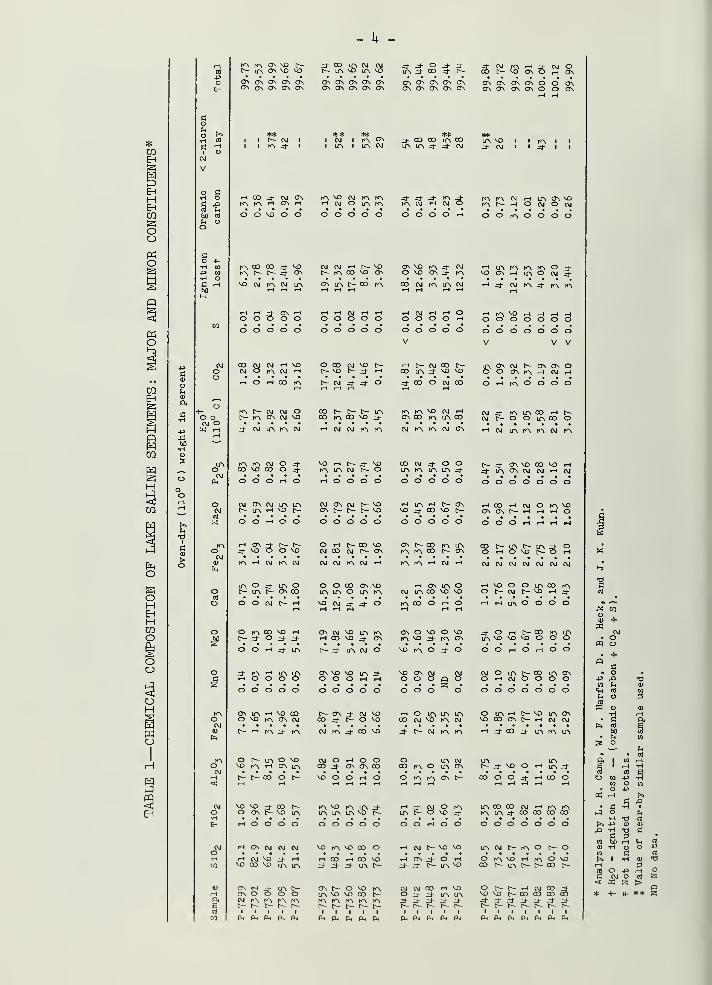
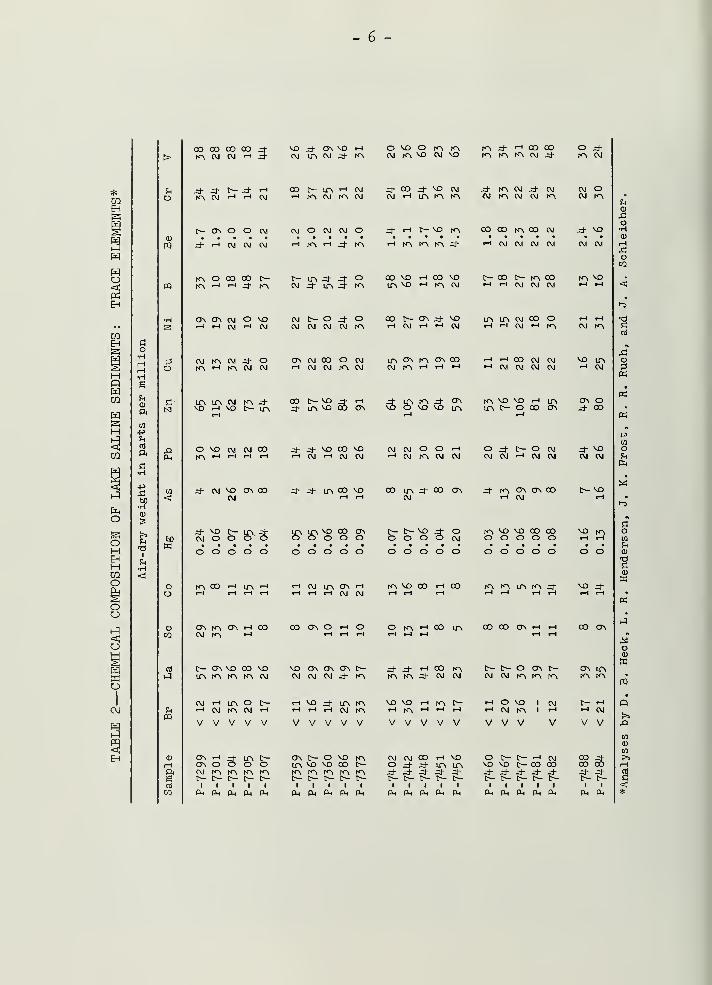
Results of analyses for major and minor constituents of the samplesfrom Lake Saline are given in table 1 and data for trace elements in table 2.
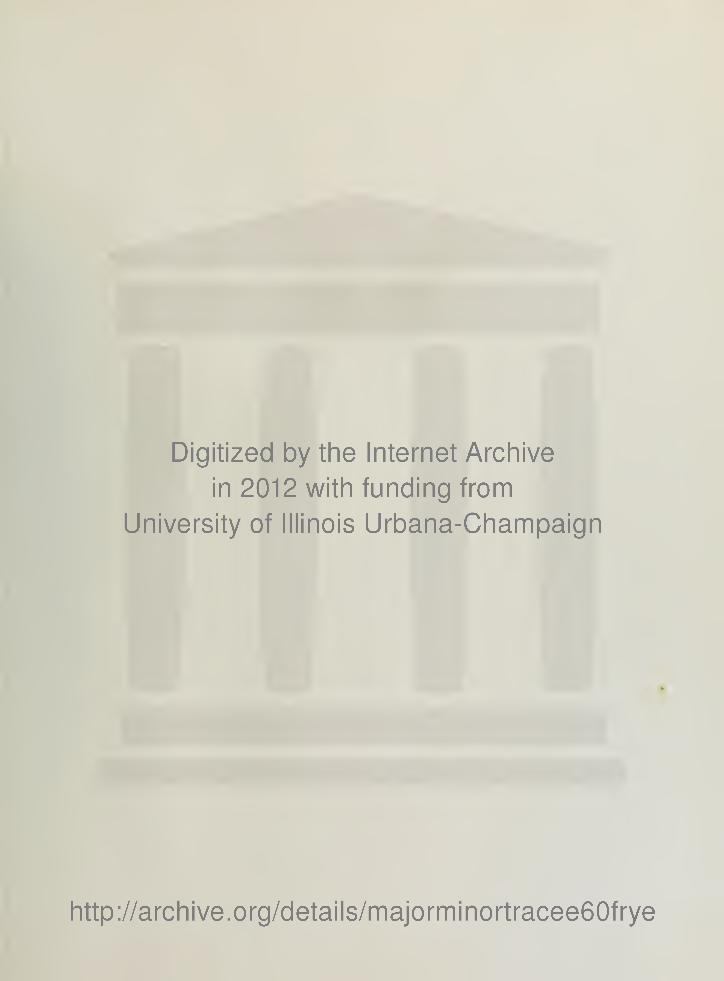
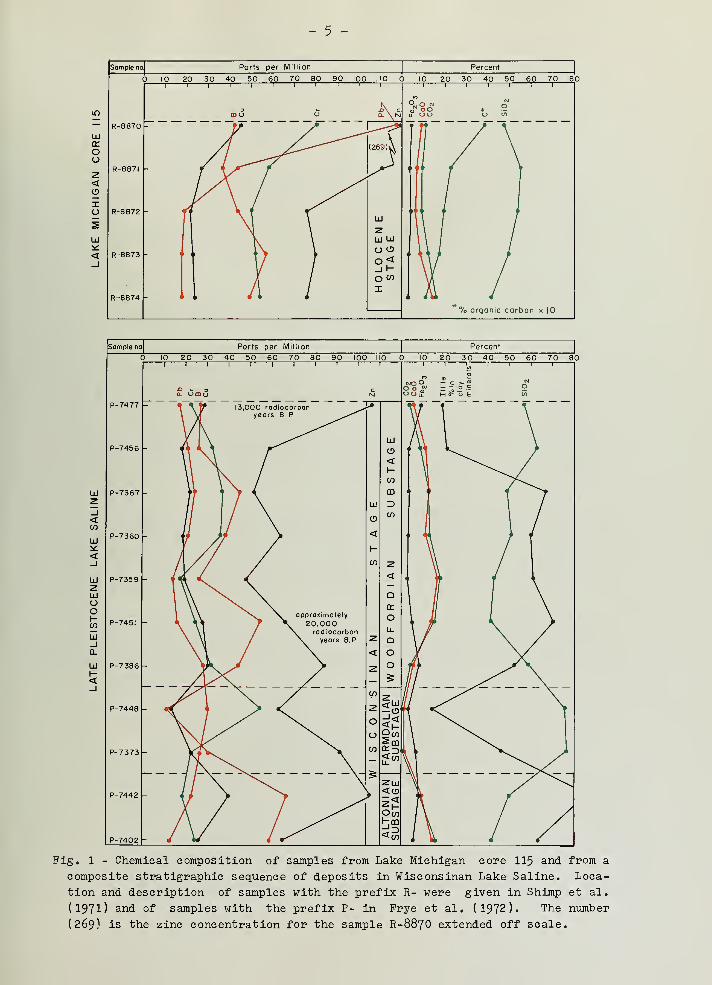
Mean values and concentration ranges for the stratigraphic units are given intable 3. The most significant constituents present in the samples are shownin figures 1 and 2. The graph in figure 1 is plotted to show selected analyt-ical data arranged in stratigraphic sequence; it combines samples from four ad-jacent Lake Saline stratigraphic sections described in Circular 1+71. The bottomsample (P-7^02) is from the Horseshoe Section; the next five samples alternatebetween the Ridgeway West and Equality NE Sections ; the next three samples arefrom the Equality NE Section; and the top two are from the Cypress Ditch AugerSections.
The major elements, expressed as oxides (CaO, C0 2 , MgO) , and loss on
ignition reflect the general stratigraphy in that their percentages are all quitelow in the weathered zone of the Farmdale Soil and are at intermediate levels inthe top sample, which has been somewhat affected by weathering of the Modern Soil.The percentage of illite in the clay minerals shows the same general relation butin exaggerated form. The silica percentage is the reverse of these values becausequartz and the silicates are the least weatherable of the minerals; therefore, thesilica percentage of the total increases as the carbonate minerals are removed.
Of the trace elements, only boron shows a consistent pattern. Theamount roughly, but not perfectly, follows the curve for illite, indicatingthat it largely occurs associated with that clay mineral. The zinc concen-tration fluctuates but has no readily apparent correlation with other chemicalor mineral components or with the stratigraphy. With the exception of arsenic,which is anomalously high in samples P-730U, P-7386 , P-7U1+2, and P-7^7, thetrace elements in the Lake Saline deposits occur in relatively low concentra-tions , have only minor variations , and appear to reflect a natural backgrounddistribution.
- k -
*COEH
EHm&oo«o
o
Pi
•d
•h oa &nJ ?h
bO n)
O
o oCM oX i-l
ON ON ON ON ONON ON ON ON ON
J- J" O ^J- ^1A4- <D d- f-
d- oo co in colo m J- .3- cm
o o no o o o o o o o O O O O rH
w h in o\wrH O (\J O CM
IO O O O O
rH LP, IO to to O J-M) o\ ri ino fti i
VO CV1 1^ W IA ON LO t>- CO to
o o o o o
co cm c\J <h no
o o o o oo o o o o
00 CM to LO CM rH ^- CM to J± to IO
H |f\M) Ho o o o o o oo o o o o o o o o o
V V
tO CM
O i-l CO
O CO CM NO C—C-- \o r— d- in
t-N ^ d- O zt 00 O CM 00 o i-H to o o o o
(D t- t- hCO IO CO NO
H; CM IA K\ C\l
to to CM O ;rj-
00 NO 00 O J-
CM CM to to CM tO tO CM On rH CM m IO to CM to
00 CM d" O OLO tO LO LO J-
t— Jd" ON NO CO NO rHJ- LO ON CM CM rH CM
O O O rH O -H O O O O o o o o o
t-H LO i"1 Is— ON
NO .-J- CO NO C~
o o o o o o o
O O rH O O
rH ONd" NO Sc— c-O NO
CM to CM
o o o o o
O rH r- co nocm co cm t— ON
o o o o o O O O rH rH rH rH
CM CM to CM rH
O O CO ON NOLO LTN O LTN tO
O rH O NO C—
CM CM CM CM CM CM CM
rH ON LO OLTN CO NO NO
rH NO O O LO CO toO t— CM t— NO i-l ^J-
O O CM C— rH
O rO CO NO rHt- ^t O J- J-
NO CM J- d" O
ON CM NO LO tOrH 0O NO J- ON
IO CO O rH O
ON O NO O NOto ^o j- to ON
rH rH LO O O O O
O O rH .-j- LO t-d- ir> w o NO to o J- o
NO ON CMo o o p,
O O rH O rH O O
o o o o o o o o o o
C— ON .-J- CM NOCO d NO VO
rH O LO LO LOCO CM NO ro CM
o o o o o o o
O LO rH t^- NO LO ONNO CO ON N- rH CM CM
t*— ^ to .rj- to CM IO d- CO NO .rj- t— CM to tO n d-co ^ LO to LO
oVO
C— LOtO rH
oON
NOLO
CM00
o rH O OON ON CO
oCO to o in
ITN.
CMON
LO-d- NO O LO
rH LO J*
C- t— 00 Q [— NO o O rH O o to to ON C- 00 o O d- rH 00 o
LO CO CO CM rH fO\ IOtO LO d- CO CO 00 CO
o o o o
ON CM (NJ CM
o o o o o
NO to MD CO O
O O rH O O
rH CM t— NO NO
O O O O O O O
LO CM f- IO O t— OrH CM NO .-} rHNO CO NO LO LO
on o d o oCM to to tO toc— t— c
—
c— c
—
I I I I t
PL, PL, Oh P4 Ph
rH CO rH CO NOJ- d- J- LO t—
ON C— O NO fOLO NO NO CO C-to to to to toc— r— t— c— c—
i i i i
ON PL, PL, PL, CL|
rH ON J- O rHJ" J" t— LO NO
CM CM 00 rH NOO J- H/ LT\ LT\
J- 3- * -d- d-I-- t— t— t— c—
PL, Pm PL, PL, CL,
O tO NO rH tO O NO00 hifiNNCO C—
«) \o t-CO 00 COd- d- J- d- ^J- J- d-N t— I
s- r- r-- C~- t-I I I I I I I
PL, PL, PL, PL, CL, PL, PL,
s +
•p ,Q TJw u at
<H 01 nrl os o
c
i)
i-t
PiIn <d
1rl m
3= Orl
fll
P, 1 in He 1 H •Hcd
If]
cd+3 1
to o V)o P
K HC
i-i
ao
•H 1
rl-H TJ m
>> P <1> 0)
r3 •Hc 3
fi.
CO :*) H <rl (4
fl> •H O PrMH
II 5 1)
cd
ao p rH oCM o nl SS.
-< HI 55 > p* *- •H- + + S
- 5 -
Somple no] Parts per Million Percent
10 20 30 40 50 60 70 80 90 100 IIP 10 20 30 40 50 60 70 80
— R-8870LUtr
oCJ
R-8871z<oXo R-8872
sLU
*:
< R-8873
R-8874 - •
Vo organic corbon x 10
Sample na Parts per Million Percent
lu P-7367H_)<CO
P-7360LlI
^<_l
LlI P-7359ZLUOOr- P-7451
LU_iCL
LU P-73861-<_l
P-7448
P-7402 -
Pig. 1 - Chemical composition of samples from Lake Michigan core 115 and from a
composite stratigraphic sequence of deposits in Wisconsinan Lake Saline. Loca-
tion and description of samples with the prefix R- were given in Shimp et al.
(1971) and of samples with the prefix P- in Prye et al. (1972). The number
(269) is the zinc concentration for the sample R-887O extended off scale.
- 6 -
*COEh
•Hs
Fh
0)
ft
w•pFh
cfl
ft
p•H
PX!
•HCD
>aUO
I
Fh•H
>
FhO
<1)
pq
3o
PM
60
Oo
oCO
ctt
Upq
oo co co co 4-|f\ w w H J-
d- j- t— J- inrri W H H (\|
[-— ON O O CM
VD J- ONVO HOJ IA OJ ^- (A
CO t- IA H N•H |<N CM KN CM
CM O CM CM O
O VO O KN KNCM KN VO CM VO
4- CO d- vo wW H if\ |^ n
i ri t^VO (Ti
(f\d- H co cokn kn kn CM d-
Jd" KN CM ^J- CMN |f\ W N 1^
CO CO |f\CO NJ± "H CM CM CM
KN O CO CO C—m ^ H 4- i^
H IO, H J- K>
[— LPi J- J- OCM zf LPv J- KN
-> kn kn kn J-
CO VO H CO M)LP, VO t-H KN CM
CM CM CM CM
C— CO t— KN COi-i i-H CM CM CM
n CO H ia ri
(J\ 1^ (J\ H COCM KN <-H
f- C\VO CO \oin ia i^ ^ w
CM «H LA o tr—H (\l IA W HV V V V V
H M 1A 0\ HH H H W N
oo on o i-h o
(f\vo co h co
o tr\ ri eo ir\
1^1 (A IPi K\ J-
CO CO CJ\ H H
voCM
ONCM
ONCM
ON r—KN KN KN
t-H ooCM
KNCM CM CM
oKN
rHVOiH t-i
LfNCM
KNKN
VOi-H
VOkn
t—
1
t-HKNiH
t—i-H i-H
OCM
VOKN
V V V V V V V V V V V V V
CD ON t-H
3 ir» t~- ON r— O vo KNrH ON O o O Lf\ VD VO oo c—Pi CM KN KN KN KN KN KN KN KN kne
co
r- C-- r^ C- D— C— t— t- tr- c-
PM PM Pm Pm PM Pm PM Pm Ph Pm
CM CM 00 i-H VOO ^(- jHr LfN LfN
J- JH" J" J" -Xt-
t>- t— C
—
C— C-—I I I
O [— t— «-H CMVO VO C^ 0O 0OH- * 4- H- H-c— c~- tr— C— tr—
I I I I
O h-
KN CM
H/ ^
KN VO
ONiH
ONi-H
CMCM
orH
VOCM
CMCM CM
ocvi CM
oKN
ooi-H CM
ONt-H
VOCM
LfNI-H
LP,i-H
CMCM
oot-H
oKN
i-H
CMi-H
KNT3acd
CMkn
KNi-H
CMKN CM
oCM
ONi-H
CMCM
COCVI
OKN
CMCM
LfNCM
ONKN
KNt-H
ONi-H
ooi-H
i-H
i-H
t-H
CMCOCVI
CMCM
CMCM
VOi-H
LfNCVI
S3o
K
LfNVD
LfNi-H
i-H
CMVO
KNt— LfN
oo IT— VOLfN VO 3 t-H
ON vo c9t-H
KNVO vo
ONLfN
KNLfN
VO VOot-H
I-H
ooLfNON
ON ooo
oI-H
CMt-H
CVIt-H
OOt-H -H CM t-H
coCM
VOCVI
CMi-H
CMCM
oKNoCM
i-H
CMoCM CM i-H
oCM
CMCM CM
VOCM
PcooUPh
d- CM VOCM
ON OO d- j± LfN COt-H
VOt-H
oo LfN
CM.* CO ON J- KN
i-H
ONCM
ON oo [— VOi-H
CM o t-o LfNO s LfNo LfNOVOo
coo ONO o t— VDO O 3 o
CVI
KNOvoo
VOO
ooo coo
VOi-H
KNt-H
oto
CD
aCD
O o o O o o o o o O o O o o o O o o o o O o
vo J-
ON LfNKN KN
i-H CM
V V
0O J=|-
co oo
I I
PM PM PM PM PM PM PM PM PM PM PM PM
f3
- 7 -
Somple no. Parts per Million Percent
10 20 30 40 50 60 70 80 90 100 IIP 10 20 30 40 50 60 70 80
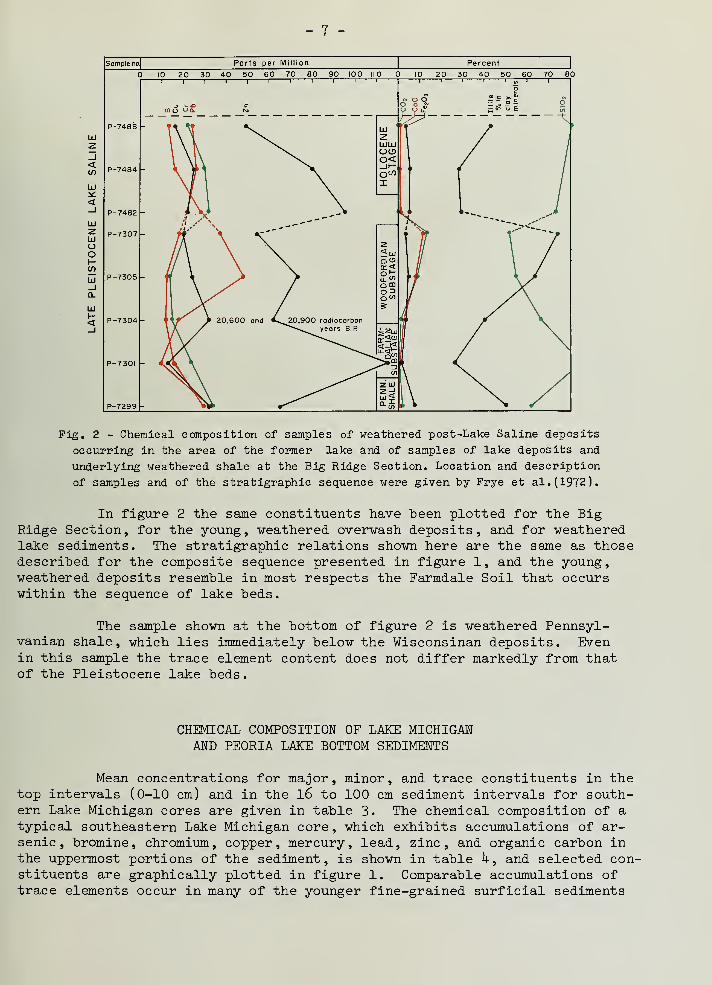
Fig. 2 - Chemical composition of samples of weathered post-Lake Saline deposits
occurring in the area of the former lake and of samples of lake deposits and
underlying weathered shale at the Big Ridge Section. Location and description
of samples and of the stratigraphic sequence were given by Frye et al.(1972).
In figure 2 the same constituents have been plotted for the BigRidge Section, for the young, weathered overwash deposits, and for -weathered
lake sediments. The stratigraphic relations shown here are the same as thosedescribed for the composite sequence presented in figure 1, and the young,weathered deposits resemble in most respects the Farmdale Soil that occurswithin the sequence of lake beds.
The sample shown at the bottom of figure 2 is weathered Pennsyl-vanian shale, which lies immediately below the Wisconsinan deposits. Evenin this sample the trace element content does not differ markedly from thatof the Pleistocene lake beds.
CHEMICAL COMPOSITION OF LAKE MICHIGANAND PEORIA LAKE BOTTOM SEDIMENTS
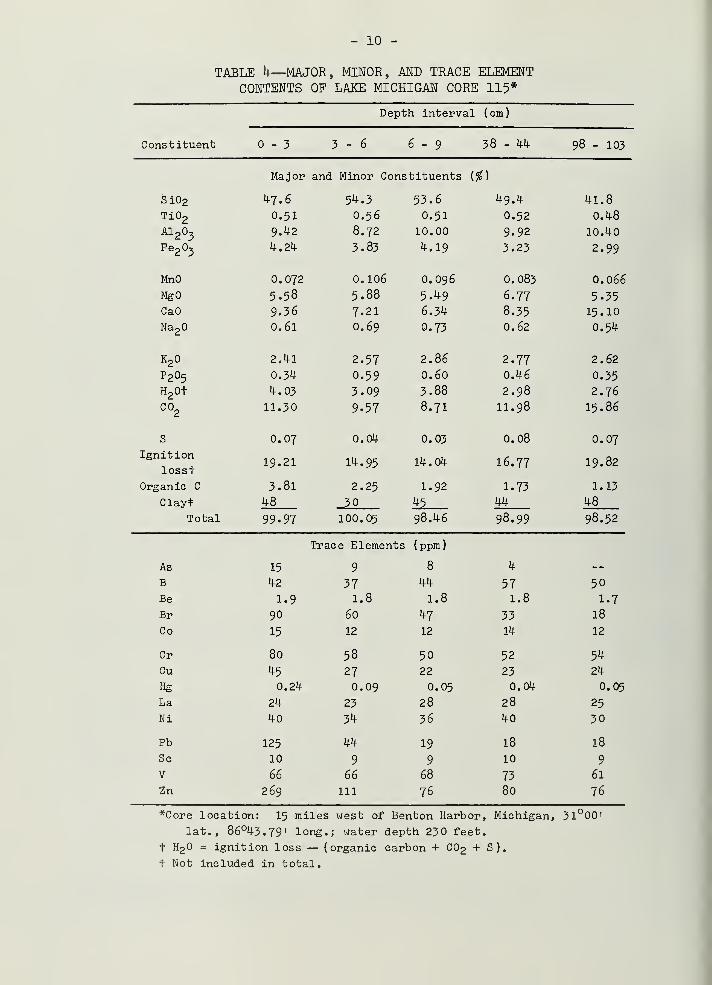
Mean concentrations for major, minor, and trace constituents in thetop intervals (0-10 cm) and in the l6 to 100 cm sediment intervals for south-ern Lake Michigan cores are given in table 3. The chemical composition of atypical southeastern Lake Michigan core, which exhibits accumulations of ar-senic, bromine, chromium, copper, mercury, lead, zinc, and organic carbon inthe uppermost portions of the sediment, is shown in table U, and selected con-
stituents are graphically plotted in figure 1. Comparable accumulations oftrace elements occur in many of the younger fine-grained surficial sediments
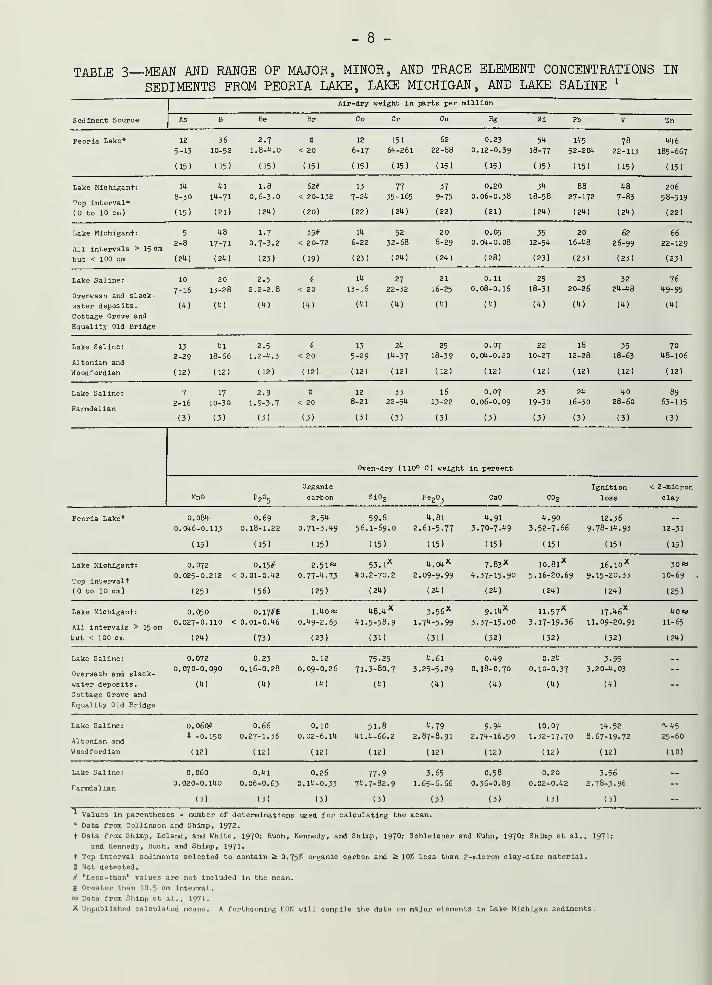
TABLE 3 MEAN AND RANGE OF MAJOR, MINOR, AND TRACE ELEMENT CONCENTRATIONS IN
SEDIMENTS FROM PEORIA LAKE, LAKE MICHIGAN, AND LAKE SALINE 1
Air-dry weight in parts per million
Sediment Source Hg
Peoria Lake* 12 36 2.7 « 12 151 62 0.23 54 145 78 4465-13 10-52 1.8-4.0 < 20 6-17 64-261 22-88 0.12-0.39 18-77 52-204 22-113 185-667
(15) (15) (15) (15) (15) (15) (15) (15) (15) (15) (15) (15)
Lake Miehigant: 14 41 1.8 62# 13 77 37 0.20 34 88 48 206
Top intervalt8-30 14-71 0.6-3.0 < 20-132 7-24 35-165 9-75 O.06-O.38 18-58 27-172 7-83 58-519
( to 10 cm) (15) (21) (24) (20) (22) (24) (22) (21) (24) (24) (24) (22)
Lake Miehigant: 5 t8 1.7 35# 14 52 20 0.05 35 20 62 66
All intervals > 15 cm2-8 17-71 0.7-3.2 < 20-72 6-22 32-68 8-29 0.04-0.08 12-54 16-48 26-99 22-129
but < 100 cm (24) (24) (23) (19) (23) (24) (24) (28) (23) (23) (23) (23)
Lake Saline: 10 20 2.5 t 14 27 21 0.11 25 23 32 76
Overwash and slack-7-16 13-28 2.2-2.8 < 20 13-16 22-32 16-25 0.08-0.16 18-31 20-26 24-48 49-95
water deposits. w (4) (4) (4) (4) (4) (4) (4) (4) (4) (4) (4)
Cottage Grove and
Equality Old Bridge
Lake Saline: 13 41 2.5 * 13 24 25 0.07 22 18 35 70
Altonian and2-29 18-66 1.2-4.3 < 20 5-29 14-37 18-39 0.04-0.20 10-27 12-28 18-63 48-106
Woodford ian (12) (12) (12) ( 12) (12) (12) (12) (12) (12) (12) (12) (12)
Lake Saline: 7 17 2.9 * 12 33 16 0.07 23 24 40 89
Farmdalian2-16 10-30 1.9-3.7 < 20 8-21 22-54 13-22 0.06-0.09 19-30 16-30 28-60 63-115
(3) (3) (3) (3) (3) (3) (3) (3) (3) (3) (3) (3)
Oven-dry (110° C) weight in percent
r 2 v5
Organic
carbon =2 U3
Ignition
loss
< 2 -micron
clay
Peoria Lake* 0.084
0.046-0.113
(15)
O.69
0.18-1.22
2.54
O.71-3.49
(15)
59.856.I-69.O
(15)
4.81
2.61-5.77
(15)
4.91
3.70-7.49
(15)
4.90
3.52-7-66
(15)
12.36
9.78-14.93
(15)
Lake Miehigant:
All intervals > 15 cm
but < 100 cm
0.050 0.17#J 1.40* 48.
4
; 3.56' 9.14' 11.57' 17.46'
Values in parentheses = number of determinations used for calculating the mean.
* Data from Collinson and Shlmp, 1972.
t Data from Shimp, Leland, and White, 1970; Ruoh, Kennedy, and Shimp, 1970; Schleicher and Kuhn, 1970; Shimp et al.,
and Kennedy, Ruch, and Shimp, 1971.
t Top interval sediments selected to contain 2 0.75$ organio carbon and i 1051! less than 2-mioron olay-size material.
4 Not deteoted.
# "LeflB-than" values are not Included In the mean.
$ Greater than 10. 5 om Interval.
a> Data from Shimp et al. , 1971.
X Unpublished oaloulated means. A forthcoming EON will compile the data on major elements in Lake Miohigan sediments
1971s
12-31
(15)
Lake Miehigant: O.072 0.15# 2.51«* 53. lx 4.04 X 7.83* 10.8l
X16.10 X 30RJ
Top interval}0.025-0.212 < 0.01-0.42 0.77-4.73 40.2-70.2 2.09-9.99 4.37.-15.90 5.16-20.69 9.15-20.33 10-69 .
( to 10 cm) (25) (56) (25) (24) (24) (24) (24) (24) (25)
0.027-0.110 < 0.01-0.46 O.49-2.65 41.5-58.9 1.74-5.99 3.37-15.00 3.17-19.36 ll.O9-20.9i 11-65
(24) (73) (23) (3D (31) (32) (32) (32) (24)
Lake Saline: 0.072 0.23 0.12 75.25 4.61 0.49 0.24 3.55 __
Overwash and slack-070-0.090 0.16-0.28 0.09-0.26 71.3-80.7 3.25-5.29 O.18-O.70 0.10-0.37 3.20-4.03 —
water deposit s. (4) (4) (4) (4) (4) (4) (4) (4) --
Cottage Grove and
Equality Old Bridge
Lake Saline: o.o6o# 0.66 0.10 51.8 4.79 9.94 10.07 14.52 -v, 45
Altonian and* -0.150 O.27-I.36 0.02-6.14 41.4-66.2 2.87-8.91 2.74-16.50 1.32-17.70 8.67-19.72 25-60
Woodford ian (12) (12) (12) (12) (12) (12) (12) (12) (10)
Lake Saline: 0.060 0.41 0.26 77-9 3.65 O.58 0.20 3.56 __
Farmdalian020-0.140 0.06-0.63 0.14-0.33 74.7-82.9 1.65-6.66 O.36-O.89 0.02-0.42 2.78-3.96 -
(3) (3) (3) (3) (3) (3) (3) (3) --
of southeastern and south-central Lake Michigan ( Shimp, Leland, and White,
1970 ; Ruch, Kennedy, and Shimp, 1970; Shimp et al. , 1971; and Kennedy, Ruch,and Shimp, 1971) • A close correlation between organic carbon and the afore-mentioned trace elements also was established.
Previous work (Shimp et al. , 1971; Lineback and Gross, 1972) showedthat the youngest , or uppermost , Lake Michigan sediments vary significantlyin both physical and chemical characteristics. To obtain a group of similarLake Michigan sediments, only the arithmetic means of those samples that con-tained at least 0.75 percent organic carbon and 10 percent clay-size materialwere included in table 3. Nevertheless, variations in the trace element con-centrations of this "group of Lake Michigan sediments still persisted, and manyof the trace elements in the top interval samples (table 3) exhibit ratherwide concentration ranges. The samples selected for comparison are differentfrom those used by Lineback and Gross (1972) because the purpose here was to
average data from Lake Michigan samples that possessed textures similar tothose from Lake Saline; Lineback and Gross (1972) wanted to show regional dif-ferences in the uppermost sediments of southern Lake Michigan. Fortunately,for this study the to 10 cm sediment values do not require precise interpreta-
tion and are included primarily to illustrate the general order of magnitude of
trace element accumulation in the younger Lake Michigan sediments. Pollutionstudies will require more exact estimates, made on a local rather than a region-
al basis.
In the underlying 15 to 100 cm interval of southern Lake Michigansediments, trace element ranges tend to be much narrower than in the to 10cm interval. This is especially true of bromine, chromium, copper, mercury,lead , and zinc , which are the elements known to be accumulating in the to10 cm interval of central and southeastern Lake Michigan sediments and forwhich natural background concentrations are of most concern. The "nonaccumu-lating" trace elements, boron, beryllium, cobalt, nickel, and vanadium, showlittle concentration variation throughout the to 100 cm sediment depth in
the Lake Michigan sequence.
In contrast to the trace element concentrations , which decrease withsediment depth, average concentrations of major elements in southeastern LakeMichigan sediments are relatively constant to a sediment depth of about 100 cm(see table 3 and fig. l)
.
The mean chemical composition of 15 Peoria Lake sediment samples isalso included in table 3. Complete descriptions and analyses for these sedi-ment samples were published by Collinson and Shimp (1972). Peoria Lake, whichhas for decades received wastes from municipal and industrial areas along itsbanks , is a 13-mile long impoundment of the slow-moving Illinois River nearPeoria. It has special significance for the ecology, siltation, and pollutionlevels in the Illinois River.
COMPARISONS AND CONCLUSIONS
Shimp et al. (l97l) suggested that a portion of the accumulation oftrace elements in the younger bottom sediments of southern Lake Michigan results
- 10 -
TABLE 4—MAJOR, MINOR, AND TRACE ELEMENTCONTENTS OF LAKE MICHIGAN CORE 115*
Depth interval (cm)
Constituent 0-3 3 - 6 6 - 9 38 - 44 98 - 103
Major and Minor Cons tituents it)
Si02 47.6 54.3 53.6 49.4 41.8
Ti02 0.51 O.56 0.51 0.52 0.48
A12 3
9.42 8.72 10.00 9.92 10.40
Fe2 0j 4.24 3.83 4.19 3.23 2.99
MnO 0.072 0.106 O.O96 0.083 0.066
MgO 5.58 5.88 5.49 6.77 5-35CaO 9.36 7.21 6.34 8.35 15.10
Na2
0.61 O.69 0.73 0.62 0.54
K2 2.41 2.57 2.86 2.77 2.62
p 2o5 0.34 0.59 0.60 0.46 0.35
H20t 4.03 3.09 3.88 2.98 2.76
co2
11.30 9.57 8.71 U.98 15.86
S 0.07 0.04 0.03 0.08 0.07
Ignition19.21 14.95 14.04 16.77 19.82
lossf
Organic C 3.8l 2.25 1.92 1.73 1.13
Clayf 48 30 45 44 48
Total 99.97 IOO.05 98.46 98.99 98.52
Trace Elements (ppm)
As 15 9 8 4 —B 42 37 44 57 50
Be 1.9 1.8 1.8 1.8 1.7
Br 90 60 47 33 18
Co 15 12 12 14 12
Cr 80 58 50 52 54
Cu 45 27 22 23 24
Hg 0.24 0.09 0.05 0.04 0.05
La 24 23 28 28 25
Ni 40 34 36 40 30
Pb 125 44 19 18 18
Sc 10 9 9 10 9
V 66 66 68 73 61
Zn 269 ill 76 80 76
*Core location: 15 miles west of Benton Harbor, Michigan, 31°00'
lat., 86°43.79' long.; water depth 230 feet,
t H2 = ignition loss — (organic carbon + C02 + S).
* Not included in total.
- 11 -
TABLE 5—FIRST APPROXIMATION OF TRACE AND MINOR ELEMENT BASE LINE RANGESFOR SOUTHERN LAKE MICHIGAN BOTTOM SEDIMENTS*
Element Base line Element Base line
(ppm) (ppm)
As <8+ Hg 0.05-0.10
B 30-50 Ni 15-40
Be 1-2 Pb 15-30
Br < 40 V 30-60
Co 10-20 2n 50-100
Cr 20-40 MnO (*) 0.05-0.10
Cu 15-30 p2 o5 [%) < 0.3t
* Fine-grained bottom sediments only.
t Estimated from the 15 to 100 cm Lake Michigan sediment
intervals only.
from pollution caused by man's activities in the surrounding watershed. Pre-viously, no attempt had been made to distinguish between pollutants added tothe sediments by man's activities and those that are contributed by naturalprocesses. We believe that comparison of the chemical data from Lakes Saline,Michigan, and Peoria permits a first approximation to be made of the quantityof trace elements derived from each of these two sources. Data from Shimpet al. (1971) and Lineback and Gross (1972) indicated that trace element ac-
cumulation in southern Lake Michigan bottom sediments seems to be closely re-lated to sediment discharge from southeastern Michigan rivers—the Grand,Kalamazoo, and St. Joseph. However, none of the data permits evaluation ofrelative contributions from air, stream, and runoff sources.
The average concentrations of major elements, organic carbon, andclay-size material (table 3) in Lake Saline (Altonian and Woodfordian) arevery similar to those of Lake Michigan sediments (top and 15 to 100 cm inter-vals). In contrast, the more weathered Lake Saline deposits (overwash) andFarmdale Soil are depleted in carbonates. These chemical data strongly sup-port the original stratigraphic interpretations made by Frye et al. (1972).Despite the excellent relation between major elements and stratigraphic unitsin the Lake Saline sequence, no such correlation is evident for the traceelements. Apparently, weathering of the Pleistocene deposits had little ef-fect upon trace element concentrations. Therefore, trace elements cannot beused as indicators for the Lake Saline sediments in stratigraphic interpreta-tions.
Further examination of table 3 and figure 1 discloses that meantrace element concentrations of all Pleistocene Lake Saline sediments arevery similar to those of Lake Michigan sediments in the 15 to 100 cm inter-val. Such a favorable comparison, especially for the Woodfordian and Altoniandeposits , tends to support the conclusion that trace element base line valuesfor the uppermost layer of Lake Michigan sediments can be estimated from
- 12 -
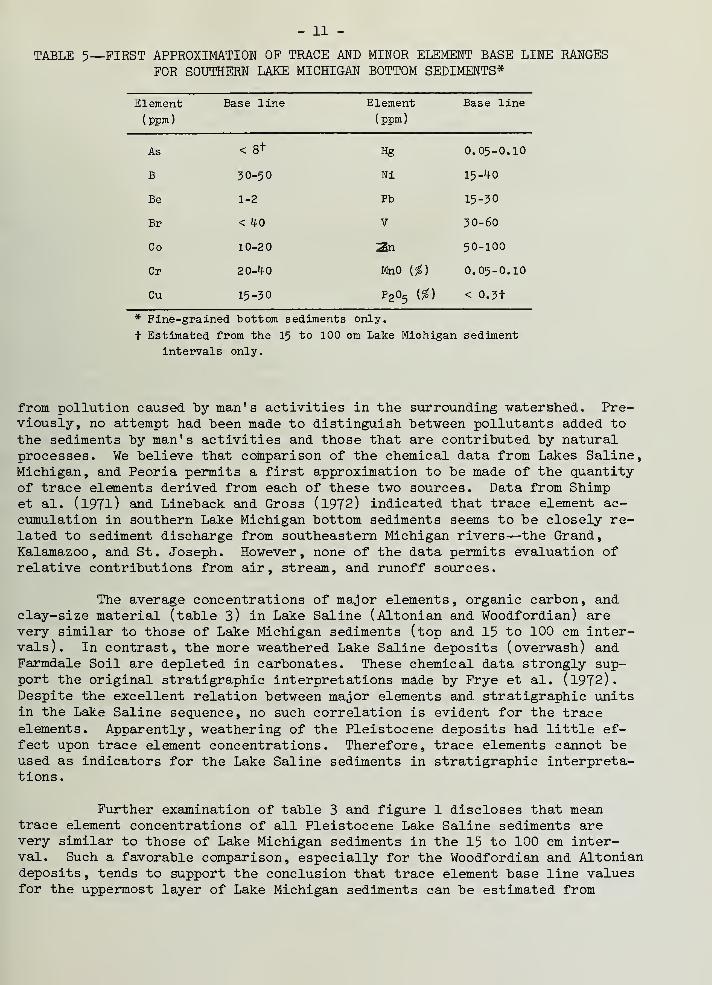
analyses of the underlying lake sediments. A first approximation of "base line
ranges for each trace element has "been made from the mean values given in table
3. These are shown in table 5. The 15 to 100 cm Lake Michigan and Lake Saline
(Woodfordian and Altonian) samples were used to approximate base line concentra-
tion ranges for all trace elements except arsenic and phosphorus. Because the
phosphorus concentrations in Lake Saline deposits are higher than those in the
youngest sediments from southern Lake Michigan and because several of the Lake
Saline samples are anomalously high in arsenic , only the 15 to 100 cm Lake Michi
gan intervals were used for the arsenic and phosphorus base line approximations.
'
The mean trace element concentrations for Peoria Lake sediments given
in table 3 indicate polluted sediments similar in major element and clay com-position to Lake Michigan sediments. In general, trace element concentrationsfor Peoria Lake sediments are comparable to, or somewhat higher than, those found
in the uppermost layer of the fine-grained sediments in southeastern Lake Michi-gan (Collinson and Shimp, 1972).
Although organic carbon concentrations as high as 6 percent were ob-
served in glacial Lake Saline sediments, no consistent correlation of trace ele-
ments with organic carbon similar to that found in the top (0-10 cm) sedimentsof southern Lake Michigan was observed. Therefore, the relation between traceelements and organic carbon in Lake Michigan sediments appears to be a recentphenomenon associated with man's activities.
Two instances of high arsenic concentration (P-730U and P-7^77) inLake Saline sediments may be associated with high organic matter content. How-ever, other Lake Saline sediments (P-7386 and P-7^2 for example), contain anoma-
lously high arsenic concentrations but very low organic carbon levels. Higharsenic values for the deeper portions of several Lake Michigan cores have beenassociated with pyritic inclusions (Ruch, Kennedy, and Shimp, 1970).
In conclusion, comparison of the chemical composition of Lake Salinesediments with that of Lake Michigan sediments demonstrates that base line con-centrations of trace elements for the most recently deposited southern LakeMichigan sediments may be estimated from trace element determinations made on
the older underlying sediments. Furthermore, the analysis of Lake Saline deposit
proves that accumulations of trace elements, similar to those found in the upper-
most layer of many southern Lake Michigan sediments, did not occur in glacialLake Saline deposits.
The theory that significant additions of trace elements are beingmade to southern Lake Michigan bottom sediments as a direct result of man'sactivities in the surrounding watershed is strongly reinforced by this study.
REFERENCES
Collinson, Charles, and N. P. Shimp, 1972, Trace elements in bottom sediments from Upper Peoria
Lake, Middle Illinois River—A pilot project: Illinois Geol. Survey Environmental Geology-
Note 56, 21 p.
Prye, J. C, A. B. Leonard, H. B. Willman, and H. D. Glass, 1972, Geology and paleontology
of late Pleistocene Lake Saline, southeastern Illinois: Illinois Geol. Survey Circ.
f71, 44 p.
Gross, D. L., J. A. Lineback, W. A. White, N. J. Ayer, Charles Collinson, and H. V. Leland,
1970» Preliminary stratigraphy of unconsolidated sediments from the southwestern part of
Lake Michigan: Illinois Geol. Survey Environmental Geology Note 30, 20 p.
Gross, D. L., J. A. Lineback, N. P. Shimp, and W. A. White, 1972, Composition of Pleistocene
sediments in southern Lake Michigan, U.S.A.: 24th Internat. Cong. Proc, Sec. 8, Mon-
treal, p. 215-222.
Kennedy, E. J., R. R. Ruch, and N. F. Shimp, 1971* Distribution of mercury in unconsolidated
sediments from southern Lake Michigan: Illinois Geol. Survey Environmental Geology Note
44, 18 p.
Lineback, J. A., N. J. Ayer, and D. L. Gross, 197°, Stratigraphy of unconsolidated sediments
in the southern part of Lake Michigan: Illinois Geol. Survey Environmental Geology
Note 35, 35 p.
Lineback, J. A., and D. L. Gross, 1972, Depositional patterns, facies, and trace element ac-
cumulation in the Waukegan Member of the late Pleistocene Lake Michigan Formation in
southern Lake Michigan: Illinois Geol. Survey Environmental Geology Note 58, 25 p.
Lineback, J. A., D. L. Gross, and R. P. Meyer, 1972, Geologic cross sections derived from
seismic profiles and sediment cores from, southern Lake Michigan: Illinois Geol. Sur-
vey Environmental Geology Note 54, 43 p.
Lineback, J. A., D. L. Gross, R. P. Meyer, and W. L. Unger, 1971, High-resolution seismic
profiles and gravity cores of sediments in southern Lake Michigan: Illinois Geol.
Survey Environmental Geology Note 47, 41 p.
Ruch, R. R., E. J. Kennedy, and N. F. Shimp, 1970, Distribution of arsenic in unconsolidated
sediments from southern Lake Michigan: Illinois Geol. Survey Environmental Geology
Note 37, 16 p.
Schleicher, J. A., and J. K. Kuhn, 1970, Phosphorus content of unconsolidated sediments from
southern Lake Michigan: Illinois Geol. Survey Environmental Geology Note 39, 15 P-
Shimp, N. P., H. V. Leland, and W. A. White, 1970, Distribution of major, minor, and trace
constituents in unconsolidated sediments from southern Lake Michigan: Illinois Geol.
Survey Environmental Geology Note 32, 19 p.
- 13 -
- 11+ -
Shimp, N. P., J. A. Schleicher, R. R. Ruch, D. B. Heck, and H. V. Leland, 1971* Trace element
and organic carbon accumulation in the most recent sediments of southern Lake Michigan:
Illinois Geol. Survey Environmental Geology Note H-l, 25 p.
Willman, H. B. , and J. C. Frye, 1970, Pleistocene stratigraphy of Illinois: Illinois Geol.
Survey Bull. 9^» 204 p.
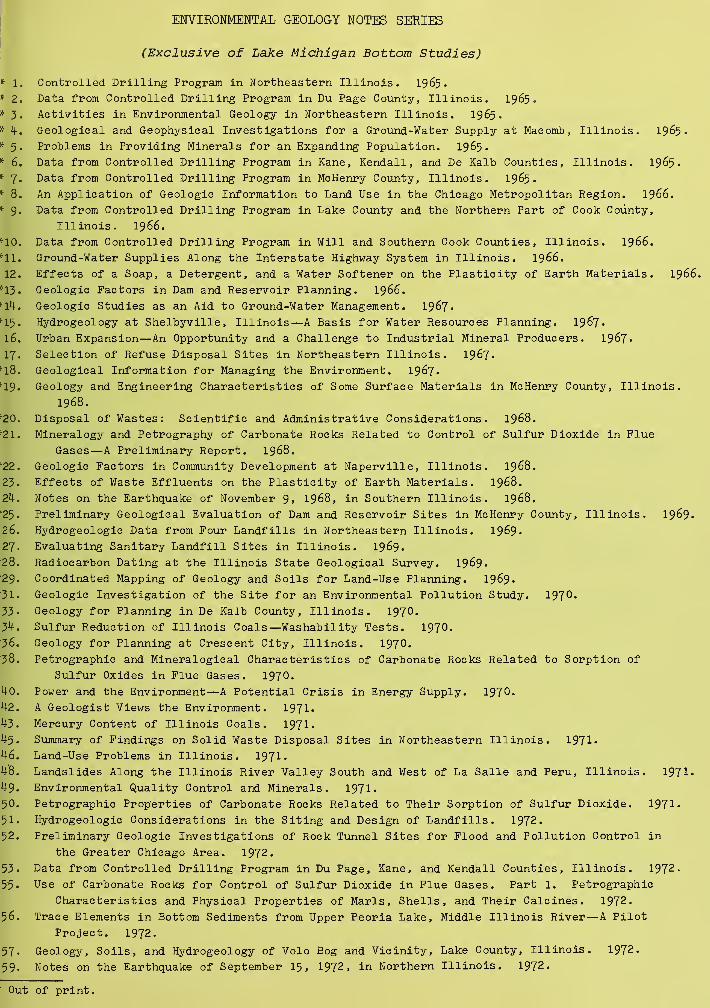
ENVIRONMENTAL GEOLOGY NOTES SERIES
(Exclusive of Lake Michigan Bottom Studies)
Controlled Drilling Program in Northeastern Illinois. 1965.
Data from Controlled Drilling Program in Du Page County, Illinois. 1965.
Activities in Environmental Geology in Northeastern Illinois. 1965*
Geological and Geophysical Investigations for a Ground-Water Supply at Macomb, Illinois. 1965 -
Problems in Providing Minerals for an Expanding Population. 1965*
Data from Controlled Drilling Program in Kane, Kendall, and De Kalb Counties, Illinois. 1965 -
Data from Controlled Drilling Program in McHenry County, Illinois. 1965 -
An Application of Geologic Information to Land Use in the Chicago Metropolitan Region. 1966.
Data from Controlled Drilling Program in Lake County and the Northern Part of Cook County,
Illinois. 1966.
Data from Controlled Drilling Program in Will and Southern Cook Counties, Illinois. 1966.
Ground-Water Supplies Along the Interstate Highway System in Illinois. 1966.
Effects of a Soap, a Detergent, and a Water Softener on the Plasticity of Earth Materials. 1966.
Geologic Factors in Dam and Reservoir Planning. 1966.
Geologic Studies as an Aid to Ground-Water Management. 1967.
Hydrogeology at Shelbyville, Illinois—A Basis for Water Resources Planning. 19&7-
Urban Expansion—An Opportunity and a Challenge to Industrial Mineral Producers. 1967*
Selection of Refuse Disposal Sites in Northeastern Illinois. 1967
-
Geological Information for Managing the Environment. 19&7-
Geology and Engineering Characteristics of Some Surface Materials in McHenry County, Illinois.
1968.
Disposal of Wastes: Scientific and Administrative Considerations. 1968.
Mineralogy and Petrography of Carbonate Rocks Related to Control of Sulfur Dioxide in Flue
Gases—A Preliminary Report. 1968.
Geologic Factors in Community Development at Naperville, Illinois. 1968.
Effects of Waste Effluents on the Plasticity of Earth Materials. 1968.
Notes on the Earthquake of November 9, 1968, in Southern Illinois. 1968.
Preliminary Geological Evaluation of Dam and Reservoir Sites in McHenry County, Illinois. 1969.
Hydrogeologic Data from Four Landfills in Northeastern Illinois. 1969-
Evaluating Sanitary Landfill Sites in Illinois. 1969.
Radiocarbon Dating at the Illinois State Geological Survey. 1969
•
Coordinated Mapping of Geology and Soils for Land-Use Planning. 1969-
Geologic Investigation of the Site for an Environmental Pollution Study. 1970-
Geology for Planning in De Kalb County, Illinois. 1970.
Sulfur Reduction of Illinois Coals—Washability Tests. 1970.
Geology for Planning at Crescent City, Illinois. 1970«
Petrographic and Mineralogical Characteristics of Carbonate Rocks Related to Sorption of
Sulfur Oxides in Flue Gases. 1970.
Power and the Environment—A Potential Crisis in Energy Supply. 197°-
A Geologist Views the Environment. 1971*
Mercury Content of Illinois Coals. 1971.
Summary of Findings on Solid Waste Disposal Sites in Northeastern Illinois. 1971-
Land -Use Problems in Illinois. 1971 -
Landslides Along the Illinois River Valley South and West of La Salle and Peru, Illinois. 1971
.
Environmental Quality Control and Minerals. 1971-
Petrographic Properties of Carbonate Rocks Related to Their Sorption of Sulfur Dioxide. 1971-
Hydrogeologic Considerations in the Siting and Design of Landfills. 1972.
Preliminary Geologic Investigations of Rock Tunnel Sites for Flood and Pollution Control in
the Greater Chicago Area. 1972.
Data from Controlled Drilling Program in Du Page, Kane, and Kendall Counties, Illinois. 1972-
Use of Carbonate Rocks for Control of Sulfur Dioxide in Flue Gases. Part 1. Petrographic
Characteristics and Physical Properties of Marls, Shells, and Their Calcines. 1972.
Trace Elements in Bottom Sediments from Upper Peoria Lake, Middle Illinois River—A Pilot
Project. 1972.
Geology, Soils, and Hydrogeology of Volo Bog and Vicinity, Lake County, Illinois. 1972.
Notes on the Earthquake of September 15 , 1972, in Northern Illinois. 1972.
Out of print,