Embed Size (px)
Citation preview

Major Investment Study (MIS) BRT Evaluation Results

BRT Evaluation Results | DRAFT Wake Transit Plan Major Investment Study
1-ii
Table of Contents Page
1 Introduction .................................................................................................................. 1-1 Adjustments to Evaluation Framework ................................................................................ 1-2
2 Corridor Alternatives ..................................................................................................... 2-1 Capital Corridor (North) ....................................................................................................... 2-2 Wilmington Corridor (South) ................................................................................................ 2-2 New Bern Corridor (East) ..................................................................................................... 2-4 Western Corridor (West) ...................................................................................................... 2-5
3 Results .......................................................................................................................... 3-7 Segment Results ................................................................................................................... 3-7 Corridor Results .................................................................................................................. 3-24 Segment and Corridor Summary ........................................................................................ 3-27
Table of Figures Page
Figure 1 Adjustments to Evaluation Framework Methodology .......................................... 1-3 Figure 2 Potential BRT Corridors and Segments ................................................................. 2-1 Figure 3 Capital Corridor and Segments .............................................................................. 2-2 Figure 4 Wilmington Corridor and Segments ...................................................................... 2-3 Figure 5 New Bern Corridor and Segments ......................................................................... 2-4 Figure 6 East Segment of the Western Corridor ................................................................. 2-5 Figure 7 West Segments of the Western Corridor .............................................................. 2-6 Figure 8 Speed Improvement in Miles per Hour due to Reduction in Signal Delay ............ 3-8 Figure 9 Number of Shared Corridor Routes ..................................................................... 3-10 Figure 10 Number of Shared Corridor Peak Buses .............................................................. 3-11 Figure 11 Number of Connecting High Frequency Transit Routes ...................................... 3-12 Figure 12 Intersections per Square Mile within ½ Mile ...................................................... 3-14 Figure 13 Percent and Number of Legally Binding Affordable Housing Units within ½
Mile ...................................................................................................................... 3-15 Figure 14 Percent and Number of Minority Population within ½ Mile ............................... 3-16 Figure 15 Percent and Number of Zero-Vehicle Households within ½ Mile ....................... 3-17 Figure 16 Total Projected 2045 Population and Jobs within ½ Mile ................................... 3-19 Figure 17 Projected 2045 Population and Jobs per Acre within ½ Mile.............................. 3-20 Figure 18 Suitability Index Score ......................................................................................... 3-21 Figure 19 Corridor Resource Impact Ranking ...................................................................... 3-23 Figure 20 Relative Operating Cost Per Passenger ............................................................... 3-25 Figure 21 Relative Capital Cost Per Passenger .................................................................... 3-27 Figure 22 Segment Rating Matrix ........................................................................................ 3-28

BRT Evaluation Results | DRAFT Wake Transit Plan Major Investment Study
1-1
1 Introduction The Wake Transit Plan Major Investment Study (MIS) conducted an in-depth analysis of the 20 miles of Bus Rapid Transit (BRT) infrastructure defined by the Wake Transit Plan. The Wake Transit Plan identified BRT corridors connecting to downtown Raleigh from the north (via Capital), south (via Wilmington), east (via New Bern), and west (via Western). Using these corridors as a starting point, the MIS identified potential alignment concepts along each of the corridors, described in detail in Chapter 2. The 20 miles of BRT infrastructure were divided into 14 potential segments including all alignment concepts, each of which was evaluated against metrics identified in the MIS BRT Evaluation Framework.1
All potential concept alignments within each of the four corridors were evaluated in order to understand strengths and weaknesses of each of the variants within the four corridors, as well as how the four corridors compare to one another. The evaluation results present a three-tiered relative rating of each segment against each evaluation metric, where “Tier 1” represents higher performance and “Tier 3” represents lower performance. It is important to emphasize that, as these are relative ratings, a Tier 3 rating does not imply that a segment is unfit for BRT infrastructure. The results of the evaluation framework are designed to inform the selection of a preferred alignment within each of the four corridors and also inform the decision about the order of implementation of the segments that make up the 20 miles of BRT infrastructure that will be constructed in Wake County. The MIS evaluation indicated that each of the corridors and alignment options are viable for a successful BRT project.
Key Findings of Evaluation Process: All Four Corridors are Good Candidates for BRT Investments
1 The MIS BRT Evaluation Framework was adopted by the Wake Transit governing boards in June 2018.
Future ridership levels warrant investment
Dedicated bus lanes are possible in all corridors No fatal flaws were found

BRT Evaluation Results | DRAFT Wake Transit Plan Major Investment Study
1-2
ADJUSTMENTS TO EVALUATION FRAMEWORK The project team made several adjustments to methodology laid out in the evaluation framework, and narrowed the total evaluation metrics from nineteen described in the evaluation framework to fifteen final metrics. The majority of these adjustments occurred after gaining a more thorough understanding of the outputs produced by the Triangle Regional Model version 6 (TRMv6), which was used for ridership projection. Figure 1 describes how the methodology used to produce the evaluation results differs from the adopted evaluation framework.

BRT Evaluation Results | DRAFT Wake Transit Plan Major Investment Study
1-3
Figure 1 Evaluation Framework Methodology and Applicable Adjustments
Category Metric Proposed Methodology Adjustment
Speed & Reliability
Speed improvement
Calculate the change in average speed in the corridor by comparing existing bus speeds to anticipated BRT speed. None
Reliability Calculate percent of corridor length in each direction that has transit-only ROW.
Removed. Conceptual corridor design and costing assumptions included 100% transit-only ROW on all segments, thus this metric did not provide any basis for comparison.
Supporting Bus Network Connections
Potential corridor connections
Determine the number of planned bus routes that could use a portion of the infrastructure (qualitative assessment).
None
Potential corridor utilization
Determine the number of planned peak buses per hour that could use a portion of the infrastructure, based on set of routes identified in the measure above.
None
Connectivity
Connections to frequent transit
Determine the number of planned routes that will operate at least every 15 minutes that provide a transfer opportunity with the corridor.
None
Connections to commuter rail
Determine the number of planned commuter rail stations that intersect the corridor.
Removed. Commuter rail station locations have not yet been identified and downtown alignments for BRT in Raleigh and Cary, where the highest potential for connections exist, are being evaluated as part of separate planning efforts..
Ease of access Calculate the intersection density within ½-mile of the corridor, excluding interstates and ramps. None
Equity Affordable housing access
Calculate the ratio of legally binding affordability restricted housing units to all housing units within ½-mile of corridor. None

BRT Evaluation Results | DRAFT Wake Transit Plan Major Investment Study
1-4
Category Metric Proposed Methodology Adjustment
Minority access Calculate the ratio of minority residents to all residents living within ½-mile of corridor. Definition of minority will be consistent with TRM definition.
None
Transit dependent access
Calculate the ratio of zero vehicle households to all households located within ½-mile of corridor None
Transit Supportive Land Use
Total People + Jobs served
Calculate the total number of residents and jobs within ½-mile of corridor. None
Concentration of People + Jobs
Calculate the number of residents and jobs within ½-mile of corridor divided by the ½-mile network buffer around the corridor.
None
Economic development potential
Quantitative assessment based on inputs such as planned developments and community visions for future development, and/or CommunityViz suitability scores
Used CommunityViz suitability scores only.
Sustainability
VMT reduction Calculate the reduction in Vehicle Miles Traveled (VMT) that would result from implementation of a BRT corridor.
Removed. The ridership modeling approach used as part of the MIS did not produce this output.
Environmental impact
Quantitative assessment of potential negative impacts on existing features due to construction of BRT infrastructure. None
Constructability Constructability
Qualitative assessment of elements that may cause construction to be more difficult, including ease of right-of-way acquisition, need for structures, and intersection/interchange operations.
None
Ridership & Cost Effectiveness
New transit trips Calculate the change in corridor ridership by comparing the projected ridership to ridership on segments of existing routes in the corridor.
Removed. The ridership modeling approach used as part of the MIS did not produce this output.
Operating cost per passenger trip
Divide the predicted daily operating cost by the predicted daily ridership (2045) of BRT service and non-branded corridor service.
While all other metrics were produced for individual segments, this was produced for each of the four directional corridors.

BRT Evaluation Results | DRAFT Wake Transit Plan Major Investment Study
1-5
Category Metric Proposed Methodology Adjustment
Capital cost per passenger trip
Divide the predicted total capital cost by the predicted daily ridership (2045) of BRT service and non-branded corridor service.
While all other metrics were produced for individual segments, this was produced for each of the four directional corridors.

BRT Evaluation Results | DRAFT Wake Transit Plan Major Investment Study
2-1
2 Corridor Alternatives The Wake Transit Plan identified four distinct corridors that comprise 20 miles of BRT infrastructure: Capital, Wilmington, New Bern, and Western. As part of the MIS, concept alignments for these four corridors were developed, resulting in a total of 14 segments, shown in Figure 2. Note that segments referred to as Western and New Bern 2 do not have alternative alignment options and are shown in black. All other segments have at least one parallel alternative, displayed with different colors. In addition, the MIS did not analyze segments of BRT infrastructure that will be implemented in downtown Raleigh and downtown Cary. Downtown alignments in each case will be determined by downtown studies that will be completed following the conclusion of the MIS. This section describes each of the segment options analyzed as part of the evaluation framework.
Figure 2 Potential BRT Corridors and Segments

BRT Evaluation Results | DRAFT Wake Transit Plan Major Investment Study
2-2
CAPITAL CORRIDOR (NORTH) The Capital corridor extends from the northern area of downtown Raleigh from Lane Street north to Crabtree Boulevard. The Capital corridor is divided into two segments: West and Capital (shown in Figure 3). These segments are roughly parallel between Lane Street and Wake Forest Road, but would both operate on the same right of way between Wake Forest Road and Crabtree Boulevard.
Figure 3 Capital Corridor and Segments
West The West segment would operate on West Street between Lane Street and Wade Avenue. The segment would also operate on the Capital Boulevard Access Road between Wade Avenue and Wake Forest Road. North of Wake Forest Road, the segment would operate on Capital Boulevard. The West segment is roughly 2.6 miles in length.
Capital The Capital segment would operate entirely on Capital Boulevard between Lane Street and Crabtree Boulevard. This segment is approximately 2.5 miles in length.
WILMINGTON CORRIDOR (SOUTH) The Wilmington Corridor extends from the southern area of downtown Raleigh from South Street to Purser Drive. The Wilmington Corridor is divided into five segments: S Saunders 1, S Saunders 2, Wilmington, Wilmington Ext, and Fayetteville (shown in Figure 4).

BRT Evaluation Results | DRAFT Wake Transit Plan Major Investment Study
2-3
Figure 4 Wilmington Corridor and Segments
S Saunders 1 The S Saunders 1 segment would operate on South Street from West Street to S Saunders Street and continue down S Saunders Street until the interchange with S Wilmington Street. This segment is approximately 2.4 miles in length.
S Saunders 2 The S Saunders 2 segment would operate on a similar alignment as S Saunders 1. The primary difference is S Saunders 2 would operate on McDowell St between south of South Street. The two segments would operate on the same alignment south of the intersection of McDowell Street and S Saunders Street. This segment is approximately 2.4 miles in length.
Wilmington The Wilmington segment would operate roughly parallel with the two S Saunders segments to the east. This segment would operate on Wilmington Street between South Street and the interchange of Wilmington Street and S Saunders Street. This segment is approximately 2.4 miles in length.
Wilmington Ext The Wilmington Extension segment would operate on a roadway that is not currently constructed, but was illustrated in the Southern Gateway Plan. This new roadway alignment would operate as a southern extension of the existing Wilmington Street, adjacent to the west of Fayetteville Street. This segment

BRT Evaluation Results | DRAFT Wake Transit Plan Major Investment Study
2-4
would operate between the interchange of Wilmington Street and Fayetteville Street to Purser Drive. This segment is approximately 1.8 miles in length.
Fayetteville The Fayetteville segment would operate on Fayetteville Road between the interchange of Wilmington Street and Fayetteville Road to Purser Drive. This segment is approximately 1.7 miles in length.
NEW BERN CORRIDOR (EAST) The New Bern Corridor extends east from downtown Raleigh to the Wake Med Campus. This corridor is comprised of three segments: Edenton, New Bern 1, and New Bern 2 (shown in Figure 5).
Figure 5 New Bern Corridor and Segments
Edenton The Edenton segment would operate on Edenton Street between Blount Street and Poole Road. This segment is approximately 1.0 mile in length.
New Bern 1 The New Bern 1 segment would operate roughly parallel to the Edenton segment, along New Bern Avenue from Blount Street to Poole Road. This segment is approximately 1.0 mile in length.

BRT Evaluation Results | DRAFT Wake Transit Plan Major Investment Study
2-5
New Bern 2 The New Bern 2 segment would operate on New Bern Avenue between Poole Road and the Wake Med Campus at Sunnybrook Road. This segment is approximately 2.0 miles in length.
WESTERN CORRIDOR (WEST) The Western Corridor is the longest proposed corridor, connecting downtown Raleigh to downtown Cary. This corridor is comprised of four segments: Western, Cary Towne, Chatham, and Chapel Hill (shown in Figure 6 and Figure 7).
Figure 6 East Segment of the Western Corridor

BRT Evaluation Results | DRAFT Wake Transit Plan Major Investment Study
2-6
Figure 7 West Segments of the Western Corridor
Western The Western segment is the longest segment in this evaluation. It would operate on Western Boulevard between Wilmington Street and Hillsborough Street. This segment is approximately 4.8 miles in length.
Cary Towne The Cary Towne segment would provide access to downtown Cary by operating on Cary Towne Boulevard and Walnut Street between Hillsborough Street and Kildaire Farm Road. A portion of this alignment between Buck Jones Road and Western Boulevard would operate on the Western Boulevard Extension, a roadway that is not currently constructed. This segment is approximately 3.9 miles in length.
Chatham The Chatham segment would operate on Chatham Street between the intersection of Chatham Street and Hillsborough Street and the intersection of Chatham Street and Cedar Street. This segment is approximately 3.1 miles in length.
Chapel Hill The Chapel Hill segment would operate on Chapel Hill Road between the intersection of Western Boulevard and Hillsborough Street and the intersection of Chapel Hill Road and Durham Road. This segment is approximately 4.1 miles in length.

BRT Evaluation Results | DRAFT Wake Transit Plan Major Investment Study
3-7
3 Results SEGMENT RESULTS Thirteen of the fifteen final evaluation metrics were applied to the fourteen potential BRT segments while the final two metrics were applied to each of the four directional corridors. The following section describes each evaluation metric, calculation methodology, rating tiers, and findings.
Speed Improvement Enhanced transit infrastructure including dedicated transit lanes, transit signal priority, and queue jumps allow the BRT system to bypass existing congestion, reduce intersection delay, and results in faster, more reliable travel times. Improving average speeds and reducing delay on transit routes can encourage additional ridership and improve public perceptions of transit.
Metric: Increase in Average Speed (Miles per Hour) Due to Reduction in Signal Delays
This metric measures only intersection delay, not the impacts of stop spacing, off-board fare payment, or any other feature. The speed improvements related to stop spacing, dedicated running way, off-board fare payment, etc. were assumed to be consistent across segments, as stipulated by the BRT Design Standards,2 and thus did not create a useful point of comparison. Intersection delay, and reducing and/or avoiding it, is the only speed factor where segment-specific operating conditions created measurable differences.
This analysis used existing signalized intersection delay at every intersection in each segment to assess the projected reduction in delay as a result of the proposed transit infrastructure improvements. The reductions in intersection delay were combined for each segment to determine total travel time savings related to the improvements. Travel time savings were then used in conjunction with segment length to determine the projected average speed for each segment. Projected speeds were compared to existing speeds to determine the increase in average speeds for each segment. Segments were sorted into tiers with higher average speed increases placed in higher tiers.
Increase in Average Speed Rating
More than 5 MPH
2 to 5 MPH
Less than 2 MPH
2 The BRT Design Standards and Performance Measures were adopted by the TPAC in May 2018
Tier 1
Tier 2
Tier 3

BRT Evaluation Results | DRAFT Wake Transit Plan Major Investment Study
3-8
Findings
The results of the speed improvement analysis are shown in Figure 8. Two segments, Capital and West, have projected average speed increases of over five miles per hour. The speed improvements for the Capital and West segments are significantly higher than other segments because the underlying routes are shifted from a neighborhood arterial (Wake Forest Road) to a limited stop, separated busway. While the other segments receive smaller speed improvements by reducing intersection delay, Capital and West are projected to experience sustained speed improvements throughout the length of the segments.
The results for this analysis are based on existing levels of congestion, informed by 2017 morning and afternoon traffic counts. The S Wilmington Ext and Fayetteville segments have a higher existing level of congestion than the other segments and subsequently have a higher average speed improvement, 2.53 and 2.69 miles per hour respectively. As population and employment in the City of Raleigh and throughout Wake County continue to grow, congestion is expected to worsen, and these average speed improvements are likely to increase further.
The Western segment has a relatively low average speed improvement of 0.83 miles per hour; however, it contains two of the most heavily congested individual intersections in the analysis. During the PM Peak Period, the Westbound intersections of Western & Gorman and Western & Method have existing delays of over four minutes each with delay reductions of 38.8 seconds and 42.7 seconds, respectively. This illustrates that improvements at individual intersections may be more significant than the average speed improvement metric suggests.
Figure 8 Speed Improvement in Miles per Hour due to Reduction in 2017 Signal Delay
18.00
6.00
0.30 0.30 0.34 0.79 0.70 0.39
2.53 2.691.12 0.57 0.34 0.83
0.00
4.00
8.00
12.00
16.00
20.00

BRT Evaluation Results | DRAFT Wake Transit Plan Major Investment Study
3-9
Potential Corridor Connections Infrastructure improvements associated with BRT systems can be extended to existing transit routes operating on the same corridor. If existing routes can be modified to have access to dedicated right-of-way, queue jumps, and/or transit signal priority that is implemented as part of the BRT infrastructure, a wider range of Wake County transit services will benefit from the investment.
Metric: Shared Corridor Routes
This metric indicates the potential for BRT infrastructure to provide enhancements to the larger bus network. For each potential segment, the number of planned routes operating on the same corridor was identified and segments were sorted into tiers. Segments with a higher number of shared corridor routes have a higher potential benefit for these routes and are placed into higher tiers.
Shared Corridor Routes Rating
More than 8
5 to 8
Fewer than 5
Findings
One segment, the Western Segment, has more than eight shared corridor routes, placing it in Tier 1. Developing BRT infrastructure on the Western segment would provide the potential for up to 12 other transit routes to utilize the infrastructure, significantly more than any other segment (Figure 9). Six of the twelve routes on the Western segment are operated by GoRaleigh, while the remaining six are Wolfline routes (shown in red). Eight segments have between five and eight shared corridor routes. The Capital, West, New Bern 1, and Edenton segments would provide potential utilization for up to eight additional transit routes. All segments would provide potential shared usage for at least two additional routes.
Tier 1
Tier 2
Tier 3

BRT Evaluation Results | DRAFT Wake Transit Plan Major Investment Study
3-10
Figure 9 Number of Shared Corridor Routes
Potential Corridor Utilization While existing bus routes have the potential to share BRT infrastructure, these impacts will be more significant for routes with more frequent service. For example, BRT infrastructure that could be utilized by a bus route that provides 15-minute service will have greater benefits than BRT infrastructure that could be utilized by two different hourly bus routes. Assessing the potential corridor utilization for each segment adds additional context to the potential benefits of the BRT infrastructure.
Metric: Shared Corridor Peak Buses
This metric is similar to the previous metric, but focuses on quantifying the number of buses during the peak period (as opposed to the number of routes) that would benefit from access to time-saving infrastructure. For each potential segment, the number of planned peak period buses operating on the same corridor was identified and segments were sorted into tiers. Segments with a higher number of peak period buses operating on shared corridors have a higher potential benefit for these routes and are placed into higher tiers.
Shared Corridor Peak Buses Rating
More than 25
11 to 25
Fewer than 11
8 8 8 8
2
76
4 4 4
6
4 4
6
0
2
4
6
8
10
12
14Wolfline
Tier 1
Tier 2
Tier 3
6

BRT Evaluation Results | DRAFT Wake Transit Plan Major Investment Study
3-11
Findings
The results for potential corridor utilization closely mirror those for potential corridor connections, shown in Figure 10, with only the Western Segment having more than 25 peak period buses. Developing BRT infrastructure on the Western segment would provide the potential for up to 54 peak hour buses to access the time-saving infrastructure, again, the most of any segment. Wolfline routes account for 30 of the peak hour buses on the Western segment (shown in red), while GoRaleigh routes account for 24 peak hour buses. Five segments have between 11 and 25 buses per hour on shared corridor routes. Capital and West are relatively high with 23 buses per hour each, followed by Chapel Hill with 20 buses per hour. S Saunders 1 and 2 have the potential for 18 buses per hour to access the infrastructure. Every segment would provide the potential for at least seven peak hour buses to utilize the shared infrastructure.
Figure 10 Number of Shared Corridor Peak Buses
Connections to Frequent Transit BRT functions best if the investment will create and strengthen connections and access to other transit routes. In particular, connections to frequent routes (defined as those that operate at least every 15 minutes) are important because riders experience minimal wait times when transferring. High connectivity between potential BRT alignments and planned frequent transit routes has the potential to increase the attractiveness of service and provide greater regional accessibility for riders.
Metric: Intersecting Frequent Transit Network Routes
This metric will indicate the degree to which a potential BRT corridor will integrate with the planned Wake County Frequent Transit Network. For each potential segment, the number of planned high-frequency routes operating on the same corridor or an intersecting corridor was identified and segments were sorted into tiers.
23 23
14 14
7
18 18
10 10 10
20
12 12
24
0
10
20
30
40
50
60Wolfline 30

BRT Evaluation Results | DRAFT Wake Transit Plan Major Investment Study
3-12
Intersecting Frequent Transit Network Routes Rating
More than 3
2 to 3
Fewer than 2
Findings
The number of high frequency transit routes intersecting each segment is shown in Figure 11. All segments feature connections to at least one frequent transit route, however, only one segment has more than three intersecting Frequent Transit Network Routes. The Western Corridor segment has connections to 12 different high frequency routes, significantly more than any other segment. Six of the high frequency transit routes connecting to the Western segment are Wolfline routes (shown in red), while six are GoRaleigh routes. Wilmington Extension and Fayetteville each have one connection to a high frequency route, while all other segments have connections to two or three.
Figure 11 Number of Connecting High Frequency Transit Routes
Ease of Access Most transit riders begin and/or end their trip as pedestrians, walking some distance to or from the bus stop. Ridership on BRT is likely to be higher in places that people can easily and conveniently access the station from the surrounding neighborhood. Areas where the street network is made of small blocks are easier for pedestrians and bicyclists to traverse because destinations can be accessed without out-of-
3 32 2 2
3 3
21 1
3 3 3
6
0
2
4
6
8
10
12
14
Wolfline 6
Tier 1
Tier 2
Tier 3

BRT Evaluation Results | DRAFT Wake Transit Plan Major Investment Study
3-13
direction travel. Areas with large blocks and circuitous roadways are less accessible because they often do not provide a direct path to a destination.
Metric: Intersection Density
This metric measures the density of intersections within a ½-mile of each segment to identify the pedestrian accessibility of the area surrounding each segment. The ½-mile buffer is measured using the street network, not straight line distance in order to incorporate natural and built barriers into the analysis.
Intersections per Square Mile Rating
More than 160
95 to 160
Fewer than 95
Findings
Intersection density is a common way to measure the accessibility of the road network surrounding the corridor and therefore the number of potential pedestrian and bicycle connections. For each potential segment, the density of intersections within a ½-mile buffer surrounding the segment was identified and segments were sorted into tiers. Segments with a higher intersection density within a ½-mile buffer of the segment are placed into higher tiers.
The density of intersections within a ½-mile buffer of each segment is shown below in Figure 12. Four segments have an intersection density of 160 intersections per square mile or higher. Eight segments contain between 95-160 intersections per square mile. Edenton and New Bern 1 have the highest intersection density, with over 235 intersections within ½-mile of both segments. The Capital and West segments also have high intersection densities with 189 and 206 intersections, respectively. The Wilmington Ext and Fayetteville segments have the lowest intersection density with fewer than 100 intersections for both segments. All segments have at least 90 intersections per square mile.
Tier 1
Tier 2
Tier 3

BRT Evaluation Results | DRAFT Wake Transit Plan Major Investment Study
3-14
Figure 12 Intersections per Square Mile within ½ Mile
Affordable Housing Access Locating BRT near affordable housing units can have significant long-term benefits for residents, lowering their transportation costs and connecting them to greater regional job accessibility. The FTA Guidelines for Land Use and Economic Development Effects refer to “legally binding affordability restricted housing” as units with a lien, deed of trust, or other legal instrument attached to a property and/or housing structure that restricts the cost of the housing units to be affordable to renters and/or owners with incomes below 60 percent of the area median income for a defined period of time.
Metric: Percent of Legally Binding Affordable Housing
This evaluation assesses the percent and the total number of legally binding affordable housing units located within ½-mile buffer of each segment using TJCOG Affordable Housing Inventory data from the National Housing Preservation Database (Figure 12). The ½-mile buffer is measured using the street network, not straight line distance in order to incorporate natural and built barriers into the analysis. Segments with a higher percentage of affordable housing would provide greater access to these residents and are placed into higher tiers.
Percent of Legally Binding Affordable Housing Rating
More than 6%
2% to 6%
Less than 2%
189206
239 236
139149 147
159
94 90
134
160143 142
0
50
100
150
200
250
Tier 1
Tier 2
Tier 3

BRT Evaluation Results | DRAFT Wake Transit Plan Major Investment Study
3-15
Findings
Five segments have higher than 6% of legally binding affordable housing located within ½-mile buffer of the segment: S Saunders 1, S Saunders 2, New Bern 1, West, and Capital. The Capital and West segments have the highest percentage of affordable housing units and among the highest number of affordable units with both segments containing over 800 units. The Western segment has the highest number of legally binding affordable housing units, but only accounts for 5% of the total housing units along the segment. There are no legally binding affordable housing units within ½-mile of either the Wilmington Ext or the Fayetteville segments.
Figure 13 Percent and Number of Legally Binding Affordable Housing Units within ½ Mile
Minority Access Wake County is committed to investing in a way that ensures regional equity and access to opportunities. Investment in BRT can help historically disadvantaged populations connect with jobs, educational opportunities, and social services throughout the region. Locating BRT infrastructure in neighborhoods with high concentrations of minority populations can have significant long-term benefits for residents, lowering their transportation costs and connecting them to greater regional job accessibility.
Metric: Percent Minority Population
This analysis utilizes 2015 American Community Survey data to assess the percent of the population within ½-mile buffer of each segment that is classified as a Title IV Minority. The ½-mile buffer is measured using the street network, not straight line distance in order to incorporate natural and built barriers into the analysis. Segments with a higher concentration of minority populations are placed into higher tiers.
835
853
511
608
85
533 529
310
0 0
99 137 207
978
0%
2%
4%
6%
8%
10%
12%
Percent of housing units
#
Number of housing units

BRT Evaluation Results | DRAFT Wake Transit Plan Major Investment Study
3-16
Percent Minority Population Rating
More than 70%
50% to 70%
Less than 50%
Findings
Three segments have higher than 70% minority populations: Edenton, New Bern 1, and New Bern 2. The New Bern 2 segment has the highest percentage of minority population with 85% of residents within ½-mile of the segment identifying as a Title IV Minority. Edenton and New Bern 1 also have generally high percentages of minority residents with 71% and 73%, respectively. The Western segment has the highest total number of minority residents with over 8,000 residents identifying as a Title VI Minority. However, this only accounts for 46% of the population.
Figure 14 Percent and Number of Minority Population within ½ Mile3
Transit Dependent Access BRT can particularly benefit households that do not have regular access to a vehicle by providing a reliable and fast connection to the region. Locating BRT in areas with a high transit-dependent population can ensure regional accessibility for vulnerable populations. Zero-vehicle households also often align with
3 Minority population is defined by Title VI classifications
#3,410
3,613
5,224 5,189
4,301
4,2484,220 3,983
1,1681,026
2,718
3,920
4,736 8,376
0%
10%
20%
30%
40%
50%
60%
70%
80%
90% Percent of population
Number of people
Tier 1
Tier 2
Tier 3

BRT Evaluation Results | DRAFT Wake Transit Plan Major Investment Study
3-17
households with low income and are more likely to use transit. The FTA uses the ratio of zero vehicle households in a corridor to evaluate eligibility for potential BRT funding.
Metric: Percent of Zero-Vehicle Households
This analysis uses 2015 American Community Survey data to determine the percent of zero-vehicle households located within a ½-mile buffer of each segment. The ½-mile buffer is measured using the street network, not straight line distance in order to incorporate natural and built barriers into the analysis. Segments with a higher concentration of zero-vehicle households are placed into higher tiers.
Percent of Zero-Vehicle Households Rating
More than 6%
5% to 6%
Less than 5%
Findings
Five segments contain more than 6% of zero-vehicle households: West, New Bern 1, Edenton, New Bern 2, and Capital. The Capital, West, Edenton, New Bern 1, and New Bern 2 segments all have a similarly high percentage of zero-vehicle households at approximately 8%. The West and Capital segments have the highest total number of zero-vehicle households with 819 and 713 households, respectively.
Figure 15 Percent and Number of Zero-Vehicle Households within ½ Mile
#
713 819 700 678 451
390 382389
6442
90144 202
666
0%
2%
4%
6%
8%
10%
12%Percent of households
Number of households
Tier 1
Tier 2
Tier 3

BRT Evaluation Results | DRAFT Wake Transit Plan Major Investment Study
3-18
Total People + Jobs Served The number of people living and working along transit corridors can indicate potential ridership levels and likelihood of sustaining the investment over time. Total population and employment indicates the degree to which transit-supportive land uses are in place.
Metric: Total Combined Population and Jobs
This analysis assesses the total combined population and jobs projected within a ½-mile buffer of each segment for the year 2045. The ½-mile buffer is measured using the street network, not straight line distance in order to incorporate natural and built barriers into the analysis. Segments with a higher number of combined population and jobs are placed into higher tiers.
Total Combined Population and Jobs Rating
More than 100,000
50,000 to 100,000
Fewer than 50,000
Findings
Figure 16 shows the projected 2045 jobs (top bars) and population (bottom bars) within ½-mile of each respective segment. Three segments have a total combined population and jobs over 100,000: Capital, West, and Western. The Western segment has a significantly higher projected 2045 population than any of the other segments with nearly 47,000 projected residents compared to 29,000 projected residents for West, the next highest segment. The Western segment also has a high number of projected employment for 2045 with over 91,000 anticipated jobs. The Western segment ranks third in projected employment behind the Capital and West segments, which have over 93,000 and 96,000 projected jobs, respectively. Similarly, the Western, West, and Capital segments have the three highest total projected 2045 population and employment, with approximately 138,000, 125,000, and 120,000, respectively.
The New Bern 2, Wilmington Ext, and Fayetteville segments all have relatively low total projected 2045 population and employment with a total of fewer than 25,000 combined population and jobs for all three segments.
Tier 1
Tier 2
Tier 3

BRT Evaluation Results | DRAFT Wake Transit Plan Major Investment Study
3-19
Figure 16 Total Projected 2045 Population and Jobs within ½ Mile
Concentration of People + Jobs Served By developing land at higher residential densities and a higher percentage of mixed uses, more origins and destinations are located within walking, bicycle and transit proximity. While the total number of people and jobs is important to understand the scale of impact for a potential BRT corridor, this metric ensures that shorter corridors with dense development are considered positively, even if the total number of people and jobs may not be as high as a longer, less dense corridor.
Metric: Density of Combined Population and Jobs
This analysis assesses the combined density of population and jobs per acre projected within a ½-mile buffer of each segment for the year 2045. The ½-mile buffer is measured using the street network, not straight line distance in order to incorporate natural and built barriers into the analysis. Segments with a higher density of combined population and jobs per acre are placed into higher tiers.
Combined Population and Jobs per Acre Rating
More than 75
30 to 75
Fewer than 30
Pop. 26k 29k17k 16k 10k
19k 19k 18k 8k 7k 14k 15k 17k
47k
Jobs
93k96k
76k70k
13k
62k 61k 59k
8k 8k
28k 27k 21k
92k
0
20,000
40,000
60,000
80,000
100,000
120,000
140,000
160,000
Tier 1
Tier 2
Tier 3
BRT Evaluation Results | DRAFT Wake Transit Plan Major Investment Study
3-20
Findings
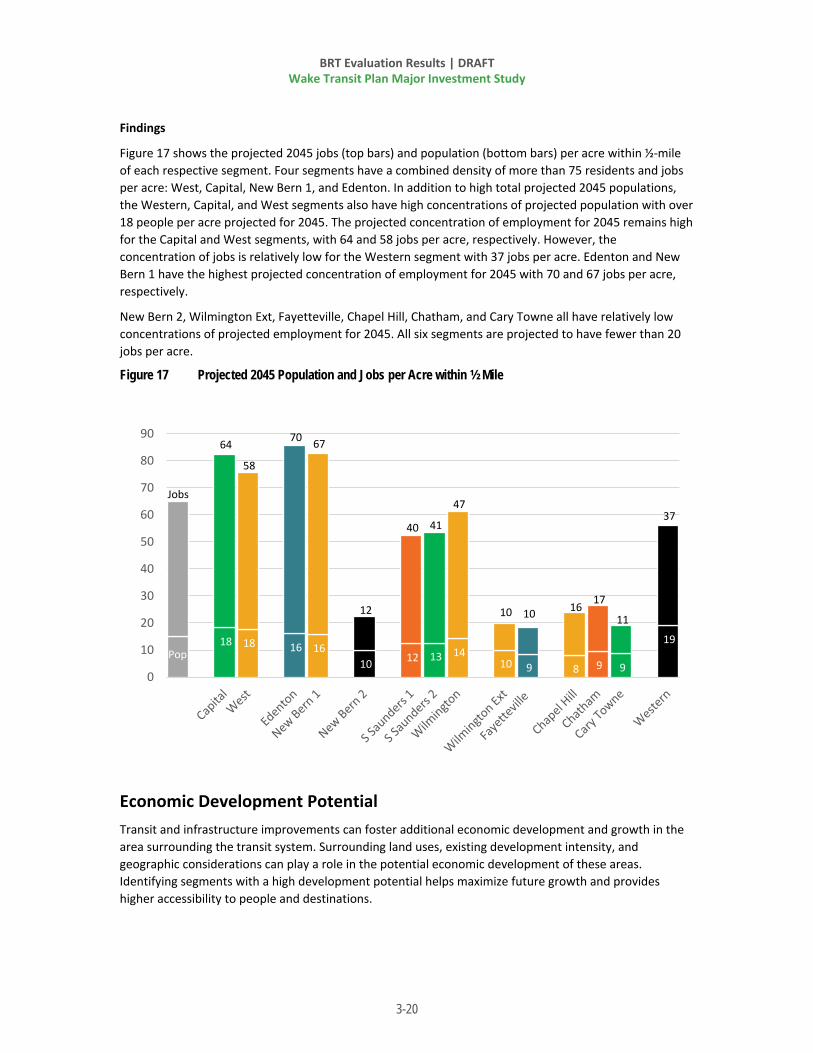
Figure 17 shows the projected 2045 jobs (top bars) and population (bottom bars) per acre within ½-mile of each respective segment. Four segments have a combined density of more than 75 residents and jobs per acre: West, Capital, New Bern 1, and Edenton. In addition to high total projected 2045 populations, the Western, Capital, and West segments also have high concentrations of projected population with over 18 people per acre projected for 2045. The projected concentration of employment for 2045 remains high for the Capital and West segments, with 64 and 58 jobs per acre, respectively. However, the concentration of jobs is relatively low for the Western segment with 37 jobs per acre. Edenton and New Bern 1 have the highest projected concentration of employment for 2045 with 70 and 67 jobs per acre, respectively.
New Bern 2, Wilmington Ext, Fayetteville, Chapel Hill, Chatham, and Cary Towne all have relatively low concentrations of projected employment for 2045. All six segments are projected to have fewer than 20 jobs per acre.
Figure 17 Projected 2045 Population and Jobs per Acre within ½ Mile
Economic Development Potential Transit and infrastructure improvements can foster additional economic development and growth in the area surrounding the transit system. Surrounding land uses, existing development intensity, and geographic considerations can play a role in the potential economic development of these areas. Identifying segments with a high development potential helps maximize future growth and provides higher accessibility to people and destinations.
18 18 16 16 10 12 13 14
10 9 8 9 9
19
64
58
70 67
12
40 41
47
10 10 16 17
11
37
0
10
20
30
40
50
60
70
80
90
Pop.
Jobs

BRT Evaluation Results | DRAFT Wake Transit Plan Major Investment Study
3-21
Metric: Suitability Index Score
A normalized Suitability Index Score was developed to assign a quantitative score related to economic development potential. This score utilizes TJCOG and MPO data to account for current and future roadways and intersections, city and regional activity centers, anchor institutions, high frequency transit corridors and station areas, identified emerging growth areas, and development constraints. Segments with higher Suitability Index Scores are placed into higher tiers.
Suitability Index Score Rating
Higher than 75
50 to 75
Lower than 50
Findings
All fourteen segments scored above 75 in the Suitability Index. Capital, New Bern 1, and Edenton scored particularly high, above 85 (shown in Figure 18). New Bern 2 was the lowest scoring segment with a score of 77.9.
Figure 18 Suitability Index Score
Environmental Impact The proposed BRT corridors traverse areas of Wake County that are home to different environmental resources (both natural and community). Identifying these resources and the potential impacts of each BRT corridor is important for understanding the future project development and permitting process,
85.4 83.9 86.5 86.3
77.983.9 84 82.8
79.5 79.9 81.3 80.6 82.2 82.6
0
10
20
30
40
50
60
70
80
90
100
Tier 1
Tier 2
Tier 3

BRT Evaluation Results | DRAFT Wake Transit Plan Major Investment Study
3-22
defining design constraints, and ensuring that impacts to these resources are minimized to the maximum extent practical. Each corridor alternative was evaluated in its entirety, as a full project with logical termini, to present an accurate comparison between the proposed alternatives.
Metric: Overall Resource Impact Rating
A high-level review of potential impacts to existing environmental resources was conducted based on resources identified through publicly-available sources and the conceptual alignments of each BRT corridor. Once all the impacts were ranked for each segment, a weighted average for each corridor was calculated and placed into a rating tier—Tier 1 (low impact to resources), Tier 2 (medium impacts to resources), and Tier 3 (high impacts to resources).
Overall Resource Impact Rating Rating
Lower than 1.6
1.6 to 1.7
Higher than 1.8
Resources evaluated for potential impacts include (see further detail in the Existing Conditions Report):
Other infrastructure (wastewater treatment plants, transmission pipelines, utilities)
Number of suspected/known hazardous material sites
National register or eligible sites, districts, or other historic properties;
Community facilities (EMS/fire/police stations, hospitals, libraries, churches, schools, cemeteries)
Wetlands
Approximate number of stream/tributary crossings
Floodplains; critical water supply watersheds
Riparian buffer rules
Parks, greenways, open space, game lands, land and water conservation fund properties
Acres of right-of-way (ROW) needed
Findings
Both Capital and West alternatives are rated as Tier 1. The Capital Boulevard corridor alignments do not require a significant amount of ROW and impact a limited number of community resources. New Bern 1, New Bern 2, and Edenton are rated Tier 2, with numerous community and historic resources present along the corridor that could potentially be impacted with the proposed alignment. The Western Boulevard alternatives are rated Tier 3—Western, Chapel Hill, Chatham, and Cary Town. These alignments require more ROW acquisition; some portions of the alignment on new location; potential impacts to several community resources; and potential utility concerns. S Saunders 1, S Saunders 2 and Fayetteville are rated Tier 2, while Wilmington and Wilmington Ext are rated Tier 3 due to the amount of ROW needed. Other variables that support the higher tier rating include existing potential hazardous material sites and community resources.
Tier 1
Tier 2
Tier 3

BRT Evaluation Results | DRAFT Wake Transit Plan Major Investment Study
3-23
Figure 19 Corridor Resource Impact Ranking
Constructability Constructability is a measure to define the ease and efficiency of constructing dedicated running way in each of the four BRT corridors. For the purposes of this assessment, dedicated BRT lanes were assumed for the entire length of each corridor, with some minor exceptions. Assuming full dedicated lanes allows for an assessment about where potential costly treatments might be necessary. The purpose of this metric is to assess which of the corridors would be easier to construct, and thereby implement.
Metric: Constructability
The constructability metric is a qualitative assessment of potential building challenges. Natural and physical barriers, such as bodies of water, railroads and other grade-separated crossings, highway bridges and interchanges, major drainage structures, and the need for roadway widening were all elements that were considered. A bus lane that requires major structure construction or reconstruction, for instance, will be more difficult to implement from both a cost and schedule perspective. In addition, a factor considered for constructability was existing traffic volumes on affected roadways. For example, constructability is likely to be more difficult on a roadway with 70,000 ADT (Average Daily Traffic) than a roadway with 15,000 ADT.
1.3
1.51.6 1.6 1.6 1.6
1.71.8 1.8
1.7
2.0 2.0 2.0 2.0
0.0
0.5
1.0
1.5
2.0
2.5

BRT Evaluation Results | DRAFT Wake Transit Plan Major Investment Study
3-24
Qualitative Rating Rating
Few areas of potential reconstruction or adjustment to existing infrastructure
Potential for minor adjustments to roadway and/or structures
Potential major reconstruction of structures New structures and/or grade-separation required
Findings
The New Bern and S. Wilmington corridors are rated as Tier 1. There are few major structures necessary, and much of these alignments can be built within existing roadway widths. Even where roadways must be widened to accommodate dedicated running way, it is likely that these could be added with minimal challenges. Traffic volumes are relatively low as well.
The Capital, West, S Saunders 1, S. Saunders 2, and Fayetteville segments are rated as Tier 3, which reflects extensive major structural work required and potential water features, as well as high traffic volumes. On Capital and West, adding a bus lane through the interchange with Wake Forest and Atlantic will be challenging given space and traffic volumes. A railroad bridge needs to be widened as well. For the S Saunders segments, bus lanes cannot be constructed through the congested I-40 interchange without major structural changes. Likewise, the Fayetteville segment would require the reconstruction of an existing interchange to add a bus lane.
The remaining alternatives – Western, Chapel Hill, Chatham, and Cary Town all were rated as Tier 2, indicating that they had some structural elements and challenges, but to a lesser extent than those in Tier 3.
CORRIDOR RESULTS The following two metrics were derived from each of the four directional corridors rather than at the segment level.
Operating Cost per Passenger While all four BRT corridors have existing bus service that may predict the size of the potential ridership market, BRT infrastructure and service levels can alter the future ridership market share. BRT requires a significant capital investment, but that investment should be repaid by faster transit, lower operating costs, and ultimately higher ridership. It is important to understand how ridership will respond to both the operating and capital investment. Each corridor alternative was evaluated for its efficiency in ongoing operations to present a comparison between the proposed alternatives.
Metric: Operating Cost per Passenger
Operating cost per passenger is a measure of the on-going efficiency of providing service on a BRT corridor. The operating assumptions for the BRT corridors are consistent with those found in the Bus Plan and assume service every 10 minutes during weekday peaks and 15- to 30-minute service at all other times. CAMPO’s regional travel demand model, the TRMv6, was used to predict the relative ridership potential of each BRT corridor, using the approved 2027 highway and transit network as well as the 2045 socioeconomic data from the MTP scenario. Once all the relative operating costs per passengers were developed, each corridor was placed into a rating tier—Tier 1 (lowest operating cost per passenger), Tier 2 (average operating cost per passenger), and Tier 3 (higher operating costs per passenger).
Tier 1
Tier 2
Tier 3

BRT Evaluation Results | DRAFT Wake Transit Plan Major Investment Study
3-25
Qualitative Operating Cost/Passenger Rating Rating
Lower than average
Average
Higher than average
Findings
The Capital corridor had the highest predicted operating cost per passenger of the four corridors. A contributing factor is that the dedicated BRT route on this corridor extends several miles further north beyond the infrastructure. However, it also reflects the limited ridership potential along Capital Boulevard between Lane Street and Crabtree Boulevard.
The Wilmington and New Bern corridors had comparable operating costs per passenger, while the Western Corridor had the lowest operating costs per passenger. While the Western corridor is the longest, it also includes three major ridership generators (downtown Cary, NCSU, and downtown Raleigh), which cause overall corridor ridership on Western to be significantly higher than any other corridor, and defray the operating cost.
Figure 20 Relative Operating Cost Per Passenger
Capital Corridor(North)
New Bern Corridor(East)
Wilmington Corridor(South)
Western Corridor(West)
Tier 1
Tier 2
Tier 3

BRT Evaluation Results | DRAFT Wake Transit Plan Major Investment Study
3-26
Capital Cost per Passenger With several exceptions, the Western, Capital, New Bern, and Wilmington corridors all assume dedicated running way along the entire corridor length. Some corridors have more challenging features and require a higher level of capital investment to fit in dedicated running way. It is important to understand how the ridership market will respond to the overall level of capital investment. Each of the four corridors was evaluated to understand the relative capital cost per passenger carried, and the comparative differences between each corridor.
Metric: Capital Cost Per Passenger
Capital cost per passenger is a measure of the return on investment of the infrastructure in a BRT corridor. The capital cost assumptions for the BRT corridors are consistent with the BRT Design Standards developed as part of the MIS and include amenities such as off-board fare payment, stations with real-time information, shelters, level boarding platforms, and dedicated running way. CAMPO’s regional travel demand model, the TRMv6, was used to predict the relative ridership potential of each BRT corridor, using the approved 2027 highway and transit network as well as the 2045 socioeconomic data from the MTP scenario. Once all the relative capital costs per passengers were developed, each corridor was placed into a rating tier—Tier 1 (lowest operating cost per passenger), Tier 2 (average operating cost per passenger), and Tier 3 (higher operating costs per passenger). Costs vary within each corridor depending on the combination of segments that are ultimately selected for BRT Infrastructure. For this reason, those corridors with multiple alignment alternatives (all but New Bern) are shown with a range of potential capital cost per passenger.
Qualitative Capital Cost/Passenger Rating Rating
Lower than average
Average
Higher than average
Findings
The New Bern corridor has the lowest predicted capital cost per passenger of the four corridors. The New Bern corridor has the lowest predicted capital costs and has the second highest predicted ridership of the corridors.
The Capital and Wilmington corridors have the highest predicted capital cost per passenger of the four corridors. Both corridors require extensive capital investments, such as new interchanges or reconstructing railroad bridges that cause average costs to be higher than the remaining corridors. The final alignment of both the Capital and Wilmington corridors can have a significant effect on the predicted capital cost per passenger, as shown in Figure 21.
The Western corridor’s predicted capital cost per passenger falls in between the New Bern corridor and the Capital and Wilmington corridors.
Tier 1
Tier 2
Tier 3

BRT Evaluation Results | DRAFT Wake Transit Plan Major Investment Study
3-27
Figure 21 Relative Capital Cost Per Passenger
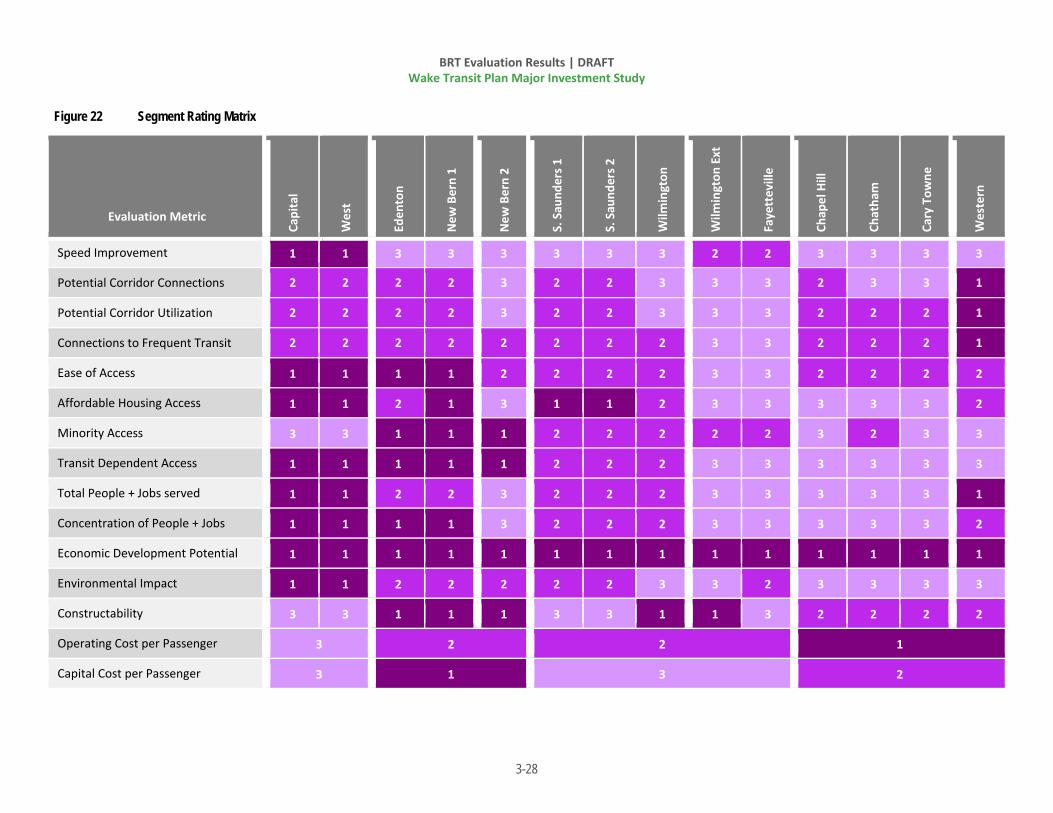
SEGMENT AND CORRIDOR SUMMARY Figure 22 shows a summary of the ratings of all segments against each metric. The results show that differentiation between parallel segment alternatives is less prominent than differentiation between each corridor. Segments that are closer to downtown Raleigh, such as Capital, West, Edenton, and New Bern 1 tend to have more Tier 1 ratings than segments further away, such as Wilmington Ext, Fayetteville, Chapel Hill, Chatham, and Cary Towne. It is important to emphasize that the tier ratings are not intended as a “score” that can be summed up to find the best segment. No weighting was applied to any of the individual metrics. However, some metrics may be more important than others when ultimately making a decision about the preferred alignment option, or the order of implementation of the corridors.
Low
Low
Low
High
High
High
Capital Corridor(North)
New Bern Corridor(East)
Wilmington Corridor(South)
Western Corridor(West)
BRT Evaluation Results | DRAFT Wake Transit Plan Major Investment Study
3-28
Figure 22 Segment Rating Matrix
Evaluation Metric
Capi
tal
Wes
t
Eden
ton
New
Ber
n 1
New
Ber
n 2
S. S
aund
ers 1
S. S
aund
ers 2
Wilm
ingt
on
Wilm
ingt
on E
xt
Faye
ttev
ille
Chap
el H
ill
Chat
ham
Cary
Tow
ne
Wes
tern
Speed Improvement 1 1 3 3 3 3 3 3 2 2 3 3 3 3
Potential Corridor Connections 2 2 2 2 3 2 2 3 3 3 2 3 3 1
Potential Corridor Utilization 2 2 2 2 3 2 2 3 3 3 2 2 2 1
Connections to Frequent Transit 2 2 2 2 2 2 2 2 3 3 2 2 2 1
Ease of Access 1 1 1 1 2 2 2 2 3 3 2 2 2 2
Affordable Housing Access 1 1 2 1 3 1 1 2 3 3 3 3 3 2
Minority Access 3 3 1 1 1 2 2 2 2 2 3 2 3 3
Transit Dependent Access 1 1 1 1 1 2 2 2 3 3 3 3 3 3
Total People + Jobs served 1 1 2 2 3 2 2 2 3 3 3 3 3 1
Concentration of People + Jobs 1 1 1 1 3 2 2 2 3 3 3 3 3 2
Economic Development Potential 1 1 1 1 1 1 1 1 1 1 1 1 1 1
Environmental Impact 1 1 2 2 2 2 2 3 3 2 3 3 3 3
Constructability 3 3 1 1 1 3 3 1 1 3 2 2 2 2
Operating Cost per Passenger 3 2 2 1
Capital Cost per Passenger 3 1 3 2