Embed Size (px)
Citation preview

Post
erRE
PRIN
T
INTRODUCTION
Metabonomics involves the study of time-relatedmetabolic profile changes that can be the result ofexposure to a toxin or drug, to environmental effects orthe onset of disease. These studies are concerned withthe complement of endogenous compounds rather thanwith xenobiotics. The primary goal is to identify andquantitate small molecules in biological systems thatare affected as the direct result of an external stimulus.Knowledge of these compounds, or biomarkers, canthen be used for diagnosis, screening, or to directfurther research. The metabonomics approach is nowbeing widely investigated by large pharmaceuticalcompanies in the area of drug discovery anddevelopment where an early indication of toxicity is ofparamount importance in preventing the late attrition ofa potential drug candidate. 1H NMR has been theprimary method of choice for analysis of changes tothe profiles of complex biofluids, such as urine, as aresult of toxic lesions induced by xenobiotics. We haveinvestigated the use of exact mass LC/MS for thedetermination of potential biomarkers of nephrotoxicity.The gentamicin complex used in this study is anaminoglycoside antibiotic complex and a nephrotoxin.
EXPERIMENTAL
Animal Study
• Male Wistar-derived rats (n=5 per group), approx.140 g in weight acclimatized in metabolism cagesfor 3 days prior to treatment
• Food and water provided ad libitum
• One group dosed with gentamicin at 60 mg/kgtwice daily, subcutaneous
• Urine samples collected daily for 9 days pre- andpost-dose from control and dosed animals andstored at -20 °C prior to analysis
• The excretion pattern of small organic molecules inthe urine was studied using LC/MS
Figure 1. Waters® MS Metabonomics System
HPLC Conditions
HPLC: Waters 2795XC Separations Module
Column: Waters Symmetry® C18,2.1x100 mm, 3.5 µm
Mobile Phase: A: water + 0.1% formic acid
B: acetonitrile + 0.1% formic acid
Flow Rate: 600 µL/min split to 120 µL/min to MS
Column Temp: 40 °C
Injection Volume: 10 µL
Gradient:
MS Conditions
MS Waters Micromass®
Q-Tof micro™
Ionization Mode Positive Ion Electrospray
Capillary 3200 V positive
Sample Cone 30 V
Source Temperature 120 °C
Major, H.1; Castro-Perez, J.1; Wilson, I.2; Lenz, E.2; Davies, D.2
1Waters Corporation, Manchester, UK2Dept. of Drug Metabolism and Pharmacokinetics, AstraZeneca, Mereside, Alderley Park, Macclesfield, Cheshire, SK10 4TG, UK
A METABONOMIC NEPHROTOXICITY STUDYUTILIZING LC/MS
Time (min) %A %B 0 100 0
0.5 100 0 4.0 80 20 8.0 5 95 9.0 5 95 9.1 100 0
Post
erRE
PRIN
T
Desolvation Temperature 250 °C
Cone Gas Flow 50 L/hr
Desolvation Gas Flow 500 L/hr
Argon Collision Gas
MS Acquisition Parameters - LockSpray™ Enabled
Acquisition Range m/z 50-850
Acquisition Rate 0.4 sec
Inter-scan Time 0.1 sec
Mode centroid
Lock mass frequency 5.0 sec
Lock scans averaged 10
Lock Reference Leucine enkephalin
0.5ng/µL in 1:1 acetonitrile: water + 0.1% formic acid
Lock Mass 556.2771
Data Processing
• The analysis of large batches of complexbiological samples such as these can generate awealth of data that require multivariate statisticalanalysis and pattern recognition methods.
• The MarkerLynx™ Application Managerincorporates a peak deconvolution packagewhich allows detection and retention timealignment of the peaks eluting in each chromatogram.
• Data is collected into a single matrix by aligningpeaks with the same mass/retention time alongwith their associated normalized intensities.
• Finally principal component analysis (PCA) is performed.
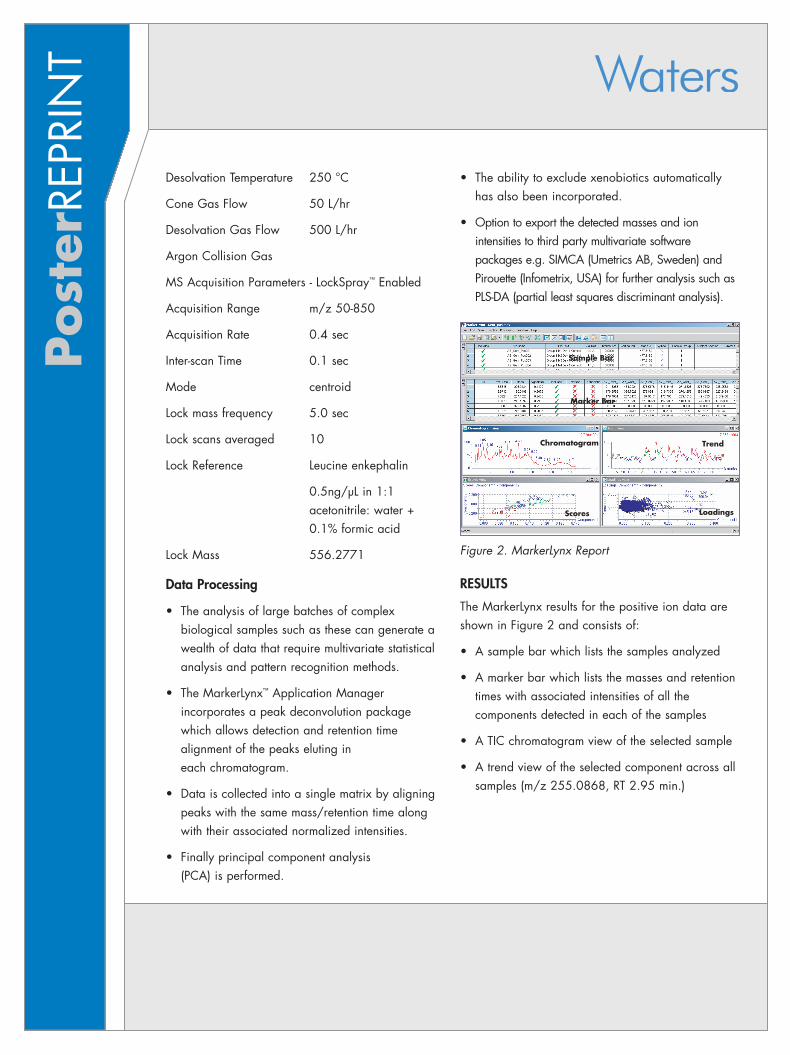
• The ability to exclude xenobiotics automaticallyhas also been incorporated.
• Option to export the detected masses and ionintensities to third party multivariate softwarepackages e.g. SIMCA (Umetrics AB, Sweden) andPirouette (Infometrix, USA) for further analysis such asPLS-DA (partial least squares discriminant analysis).
Figure 2. MarkerLynx Report
RESULTS
The MarkerLynx results for the positive ion data areshown in Figure 2 and consists of:
• A sample bar which lists the samples analyzed
• A marker bar which lists the masses and retentiontimes with associated intensities of all thecomponents detected in each of the samples
• A TIC chromatogram view of the selected sample
• A trend view of the selected component across allsamples (m/z 255.0868, RT 2.95 min.)
Sample Bar
Marker Bar
Chromatogram
Trend
Scores
Loadings
Post
erRE
PRIN
T
• A scores plot showing the separation and/orclustering between samples (annotation turned offfor clearer visualization of the results)
• A loadings plot indicating the m/z and RTvalues of the ions responsible for theclustering/separation i.e. potential biomarkersof nephrotoxicity
Gentamicin is an antibiotic complex produced byfermentation of Micromonospora purpurea or M.echinospora and consists of 3 closely relatedcomponents, gentamicin C1, C2 and C1a as shownin Figure 3.
gentamicin C1 R1=R2=CH3 C21H43N5O7
C2 R1=CH3;R2=H C20H41N5O7
C1a R1=R2=H C19H39N5O7
Figure 3. Structure of gentamicin complex
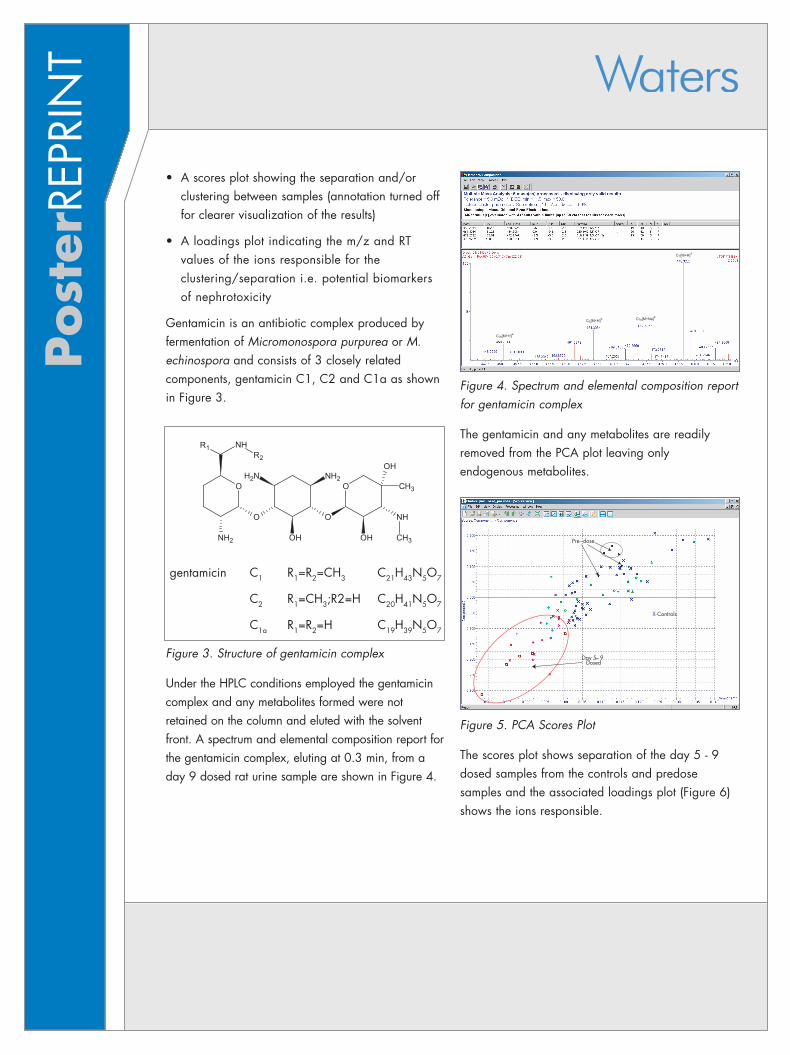
Under the HPLC conditions employed the gentamicincomplex and any metabolites formed were notretained on the column and eluted with the solventfront. A spectrum and elemental composition report forthe gentamicin complex, eluting at 0.3 min, from aday 9 dosed rat urine sample are shown in Figure 4.
Figure 4. Spectrum and elemental composition reportfor gentamicin complex
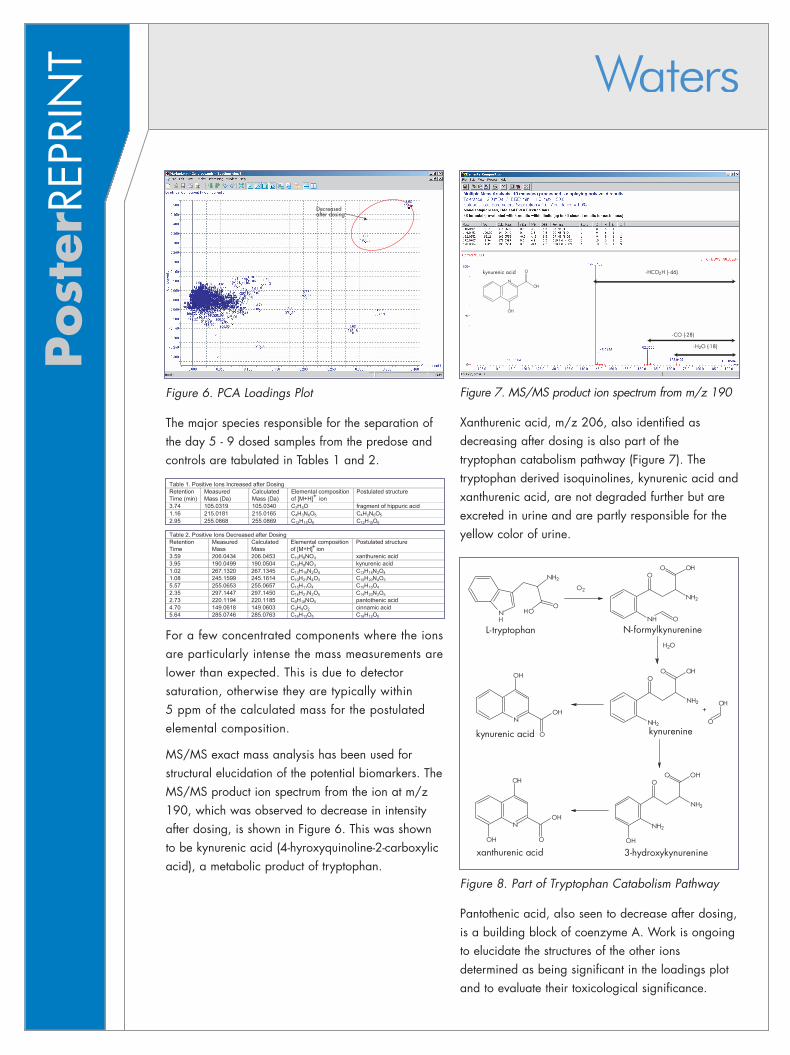
The gentamicin and any metabolites are readilyremoved from the PCA plot leaving only endogenous metabolites.
Figure 5. PCA Scores Plot
The scores plot shows separation of the day 5 - 9dosed samples from the controls and predosesamples and the associated loadings plot (Figure 6)shows the ions responsible.
NH2
O
OH
O
NH2OO
NH
OHNH2
NH
CH3
CH3
OH
R1R2
C1a [M+H]+
C2 [M+H]+
C1 [M+H]+
C1a [M+Na]+
Day 5 – 9 Dosed
Pre - dose
X -Controls
Post
erRE
PRIN
T
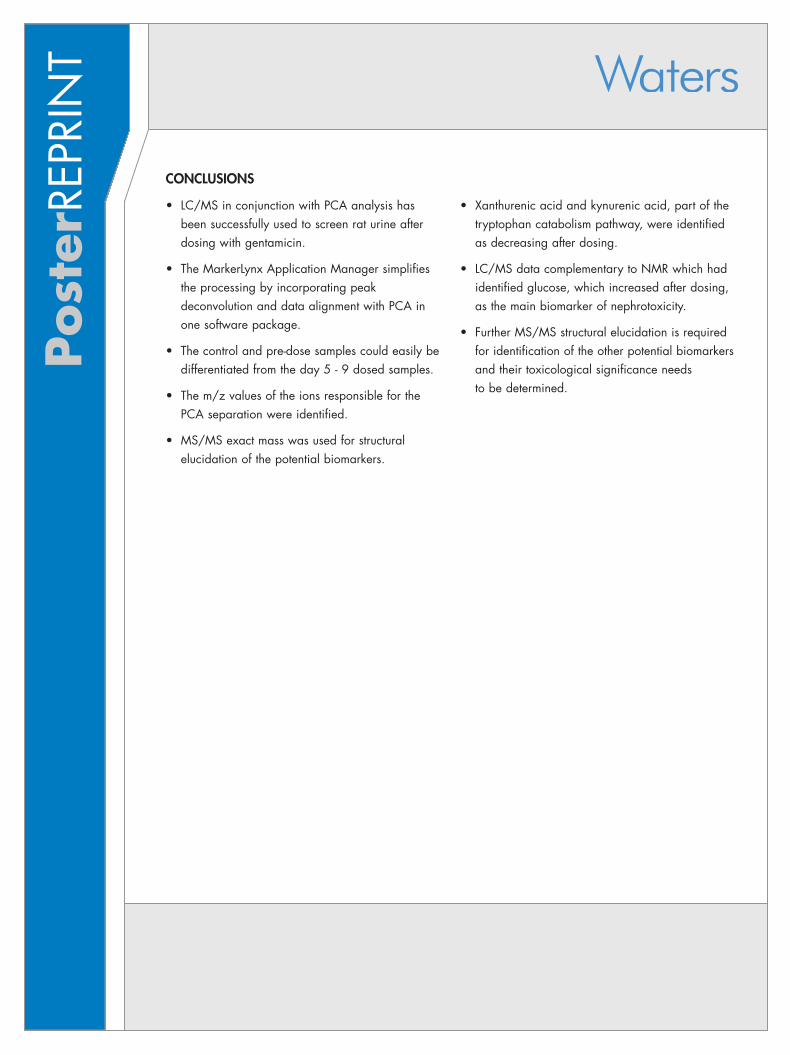
Figure 6. PCA Loadings Plot
The major species responsible for the separation ofthe day 5 - 9 dosed samples from the predose andcontrols are tabulated in Tables 1 and 2.
For a few concentrated components where the ionsare particularly intense the mass measurements arelower than expected. This is due to detectorsaturation, otherwise they are typically within 5 ppm of the calculated mass for the postulatedelemental composition.
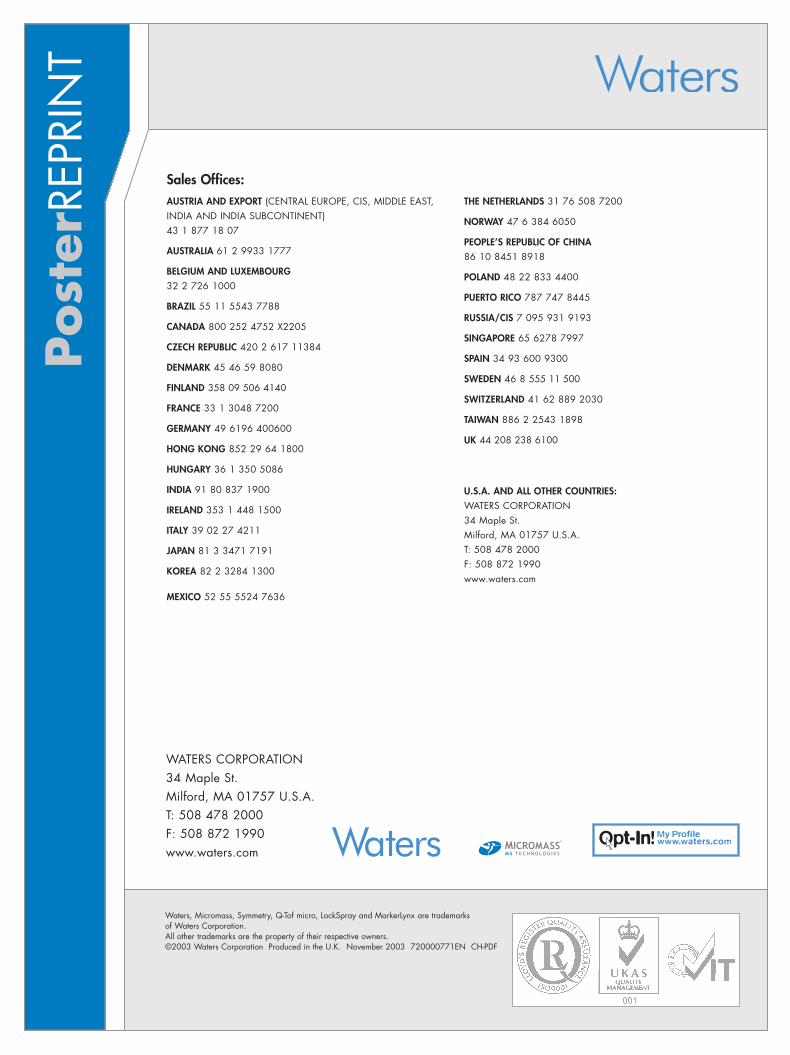
MS/MS exact mass analysis has been used forstructural elucidation of the potential biomarkers. TheMS/MS product ion spectrum from the ion at m/z190, which was observed to decrease in intensityafter dosing, is shown in Figure 6. This was shownto be kynurenic acid (4-hyroxyquinoline-2-carboxylicacid), a metabolic product of tryptophan.
Figure 7. MS/MS product ion spectrum from m/z 190
Xanthurenic acid, m/z 206, also identified asdecreasing after dosing is also part of thetryptophan catabolism pathway (Figure 7). Thetryptophan derived isoquinolines, kynurenic acid andxanthurenic acid, are not degraded further but areexcreted in urine and are partly responsible for theyellow color of urine.
Figure 8. Part of Tryptophan Catabolism Pathway
Pantothenic acid, also seen to decrease after dosing,is a building block of coenzyme A. Work is ongoingto elucidate the structures of the other ionsdetermined as being significant in the loadings plotand to evaluate their toxicological significance.
Decreasedafter dosing
N
O
OH
OH
kynurenic acid
-CO (-28)
-H2O (-18)
-HCO2H (-46)
NH
O
NH2
OH
OO
NH2
OH
NH O
OO
NH2
OH
NH2N
OH
OH
O
L-tryptophan N-formylkynurenine
kynureninekynurenic acid
OO
NH2
OH
NH2
OH
N
OH
OH
OOH
xanthurenic acid
O2
OH
O
OH2
+
3-hydroxykynurenine
Table 1. Positive Ions Increased after Dosing Retention Time (min)
Measured Mass (Da)
Calculated Mass (Da)
Elemental composition of [M+H]+ ion
Postulated structure
3.74 105.0319 105.0340 C7H5O fragment of hippuric acid 1.16 215.0181 215.0165 C4H3N6O5 C4H2N6O5
2.95 255.0868 255.0869 C12H15O6 C12H15O6
Table 2. Positive Ions Decreased after Dosing Retention Time
Measured Mass
Calculated Mass
Elemental composition of [M+H]+ ion
Postulated structure
3.59 206.0434 206.0453 C10H8NO4 xanthurenic acid 3.95 190.0499 190.0504 C10H8NO3 kynurenic acid 1.02 267.1320 267.1345 C13H19N2O4 C13H18N2O4
1.08 245.1599 245.1614 C10H21N4O3 C10H20N4O3
5.57 255.0653 255.0657 C15H11O4 C15H10O4 2.35 297.1447 297.1450 C14H21N2O5 C14H20N2O5
2.73 220.1194 220.1185 C9H18NO5 pantothenic acid 4.70 149.0618 149.0603 C9H9O2 cinnamic acid 5.64 285.0746 285.0763 C16H13O5 C16H12O5
Post
erRE
PRIN
T
CONCLUSIONS
• LC/MS in conjunction with PCA analysis hasbeen successfully used to screen rat urine afterdosing with gentamicin.
• The MarkerLynx Application Manager simplifiesthe processing by incorporating peakdeconvolution and data alignment with PCA inone software package.
• The control and pre-dose samples could easily bedifferentiated from the day 5 - 9 dosed samples.
• The m/z values of the ions responsible for thePCA separation were identified.
• MS/MS exact mass was used for structuralelucidation of the potential biomarkers.
• Xanthurenic acid and kynurenic acid, part of thetryptophan catabolism pathway, were identifiedas decreasing after dosing.
• LC/MS data complementary to NMR which hadidentified glucose, which increased after dosing,as the main biomarker of nephrotoxicity.
• Further MS/MS structural elucidation is requiredfor identification of the other potential biomarkersand their toxicological significance needs to be determined.
Post
erRE
PRIN
T
Sales Offices:AUSTRIA AND EXPORT (CENTRAL EUROPE, CIS, MIDDLE EAST,INDIA AND INDIA SUBCONTINENT) 43 1 877 18 07
AUSTRALIA 61 2 9933 1777
BELGIUM AND LUXEMBOURG 32 2 726 1000
BRAZIL 55 11 5543 7788
CANADA 800 252 4752 X2205
CZECH REPUBLIC 420 2 617 11384
DENMARK 45 46 59 8080
FINLAND 358 09 506 4140
FRANCE 33 1 3048 7200
GERMANY 49 6196 400600
HONG KONG 852 29 64 1800
HUNGARY 36 1 350 5086
INDIA 91 80 837 1900
IRELAND 353 1 448 1500
ITALY 39 02 27 4211
JAPAN 81 3 3471 7191
KOREA 82 2 3284 1300
MEXICO 52 55 5524 7636
THE NETHERLANDS 31 76 508 7200
NORWAY 47 6 384 6050
PEOPLE’S REPUBLIC OF CHINA86 10 8451 8918
POLAND 48 22 833 4400
PUERTO RICO 787 747 8445
RUSSIA/CIS 7 095 931 9193
SINGAPORE 65 6278 7997
SPAIN 34 93 600 9300
SWEDEN 46 8 555 11 500
SWITZERLAND 41 62 889 2030
TAIWAN 886 2 2543 1898
UK 44 208 238 6100
U.S.A. AND ALL OTHER COUNTRIES: WATERS CORPORATION34 Maple St.Milford, MA 01757 U.S.A.T: 508 478 2000F: 508 872 1990www.waters.com
Waters, Micromass, Symmetry, Q-Tof micro, LockSpray and MarkerLynx are trademarksof Waters Corporation.All other trademarks are the property of their respective owners.©2003 Waters Corporation Produced in the U.K. November 2003 720000771EN CH-PDF
WATERS CORPORATION34 Maple St.Milford, MA 01757 U.S.A.T: 508 478 2000F: 508 872 1990www.waters.com